Evaluation of EO1 hyperion data for agricultural applications
12
J. Indian Soc. Remote Sens. (September 2008) 36:255–266 Evaluation of EO-1 Hyperion Data for Agricultural Applications Anshu Miglani . S. S. Ray . R. Pandey . J.S. Parihar Received: 22 February 2006 / Accepted: 31 March 2008 Keywords Hyperion . Hyperspectral . Remote sensing . Atmospheric correction . Radiance . Principal component . Band selection . Band to band correlation A. Miglani 1 . S. S. Ray () . R. Pandey 2 . J.S. Parihar ARG/RESIPA, Space Applications Center, ISRO, Ahmedabad - 380 015, India 1 A-145, GIS Development Pvt. Ltd., Sector 63, Noida - 201 301, India 2 Project Directorate for Cropping Systems Research, ICAR, Modipuram - 250 110, India e-mail: [email protected] Abstract The present study was carried out to evaluate the satellite-based hyperspectral data available from Hyperion onboard EO-1 of NASA for agricultural applications. The study was carried out for Daurala block of Meerut district, using data of March 2005. The preliminary data analysis showed that there are 196 usable bands out of a total of 242 bands. Principal component (PC) analysis showed that about 99% of the information explained in 10 PCs. The atmospherically corrected reflectance, derived from satellite data had good agreement with the ground reflectance, observed using handheld spectroradiometer, with r 2 ranging from 0.85 to 0.98. A set of twenty most usable bands was selected by the criteria of maximum contribution to first five PCs and the band combinations with least inter-band correlations. Introduction Hyperspectral remote sensing data provide spectroscopic information in relatively narrow contiguous spectral bands throughout visible, near- and short-wave infrared regions of the electro- magnetic spectrum (Hong et al., 2002). The high spectral resolution reflectance spectrum in the region from 400–2500nm may be used to identify a large range of surface cover features that cannot be identified with broad band, low spectral resolution imaging system such as Landsat MSS, TM or SPOT (Hong et al., 2002; Goetz et al., 1985; Huete, 2003). Hyperspectral data can be used in discriminating crop varieties (Galvao et al., 2005), disease identi- fication (Apan et al., 2004) and identification of stress within the crop. Photonirvachak 123 RESEARCH ARTICLE
-
Upload
independent -
Category
Documents
-
view
4 -
download
0
Transcript of Evaluation of EO1 hyperion data for agricultural applications
J. Indian Soc. Remote Sens. (September 2008) 36:255–266
Evaluation of EO-1 Hyperion Data for Agricultural Applications
Anshu Miglani . S. S. Ray . R. Pandey . J.S. Parihar
Received: 22 February 2006 / Accepted: 31 March 2008
Keywords Hyperion . Hyperspectral . Remote sensing . Atmospheric correction . Radiance . Principalcomponent . Band selection . Band to band correlation
A. Miglani1 . S. S. Ray (�) . R. Pandey2 . J.S. PariharARG/RESIPA, Space Applications Center,ISRO, Ahmedabad - 380 015, India1A-145, GIS Development Pvt. Ltd., Sector 63,Noida - 201 301, India2Project Directorate for Cropping Systems Research,ICAR, Modipuram - 250 110, India
e-mail: [email protected]
Abstract The present study was carried out toevaluate the satellite-based hyperspectral dataavailable from Hyperion onboard EO-1 of NASA foragricultural applications. The study was carried outfor Daurala block of Meerut district, using data ofMarch 2005. The preliminary data analysis showedthat there are 196 usable bands out of a total of 242bands. Principal component (PC) analysis showedthat about 99% of the information explained in 10PCs. The atmospherically corrected reflectance,derived from satellite data had good agreement withthe ground reflectance, observed using handheldspectroradiometer, with r2 ranging from 0.85 to 0.98.
A set of twenty most usable bands was selected bythe criteria of maximum contribution to first five PCsand the band combinations with least inter-bandcorrelations.
Introduction
Hyperspectral remote sensing data providespectroscopic information in relatively narrowcontiguous spectral bands throughout visible, near-and short-wave infrared regions of the electro-magnetic spectrum (Hong et al., 2002). The highspectral resolution reflectance spectrum in theregion from 400–2500nm may be used to identify alarge range of surface cover features that cannot beidentified with broad band, low spectral resolutionimaging system such as Landsat MSS, TM or SPOT(Hong et al., 2002; Goetz et al., 1985; Huete, 2003).Hyperspectral data can be used in discriminatingcrop varieties (Galvao et al., 2005), disease identi-fication (Apan et al., 2004) and identification ofstress within the crop.
Photonirvachak
123
RESEARCH ARTICLE
256 J. Indian Soc. Remote Sens. (September 2008) 36:255–266
123
In addition, hyperspectral data enablecomputation of narrowband indices using combinedspectral bands related to biophysical parameters likeLAI (Broge and Leblane, 2000; Pu et al., 2003;Meroni et al., 2004) and biochemical variables suchas chlorophyll (Zarco-Tejada et al., 2004; Schaepmanet al., 2005), water (Champagne et al., 2003) andnitrogen (Read et al., 2002). These parameters arerobust indicators of the physiological and stressconditions that could potentially affect crop yieldthus useful for precision agriculture purposes (Zarco-Tejada et al., 2005). Furthermore, they provide anenhanced level of information for atmosphericcorrection (Datt et al., 2003; Galvao et al., 2005). Withthe availability of space-borne sensors havinghyperspectral capabilities, a new era has opened upin quantitative remote sensing for parameter retrieval.
The Hyperion onboard EO-1 satellite is the firstspace-borne hyperspectral sensor, operating acrossthe full solar reflected spectrum with nominal spectralcoverage from 400–2500nm (Green et al., 2003). Itwas launched by National Aeronautics and SpaceAdministration’s New Millennium Program (NMP) onNov. 21, 2000 in a sun synchronous orbit at about705 km altitude (Pearlman et al., 2003). Hyperionacquires information both in visible-near infrared(VNIR 355.589-851.92nm) and short wave infrared(SWIR 1057.36-2577.07nm) regions through twospectrometers and a single telescope (Datt et al.,2003). The Hyperion has 70 bands in the VNIR sensorand 172 bands in the SWIR, providing in all, 242wavebands with ~10nm bandwidth, 30m-groundresolution, 7.7 km swath, 16 days of temporalresolution for nadir viewing and 12 bits quantization(Green et al., 2003).
Since hyperspectral image data have a largenumber of bands and also, is mostly used forquantitative biophysical parameter retrieval, thedigital analysis, including pre-processing, is differentfrom conventional broadband analysis. Also, as thesedata are comparatively new, there is a need tounderstand data quality and utility for agricultural
applications. It is also important to reduce the volumeand dimensionality of the data set and make itfeasible to apply traditional classification methods onfew selected bands that capture most of the pertinentinformation. Considering these, a study was initiatedto evaluate the data quality and carry out pre-processing steps with special reference to crop study.
Study Area
The study was conducted in Rohata block ofMeerut district (Central Co-ordinate: 29°00’ N and77°36’ E, 232m above MSL) of Uttar Pradesh. Climatehere is tropical semi arid, with alluvial soil type. Thearea is highly productive having mostly irrigatedcrops. The major crops during Rabi season includewheat and sugarcane. The minor crops includedpotato, mustard, berseem, sorghum etc.
Data Used
Satellite-based hyperspectral single date data fromHyperion sensor of 146/40 path/row were acquired.The date of pass was March 12, 2005 with overpasstime 15:07 hrs IST.
Field observations were carried out concurrent tothe satellite pass. The field observations includedAerosol Optical Thickness using sun photometerand ground based hyperspectral reflectance usingASD hand-held spectroradiometer. The fieldobservations were taken over twenty-five sites, withGPS locations covering all major crop types.
The spectroradiometer has a range of 512channels with a range of 325nm to 1075nm(FieldSpec®Pro, 2000). Gathering spectra at a givenlocation involves optimizing the integration timeproviding fore-optic information, recording darkcurrent and collecting white reference reflectance.The target reflectance is the ratio of energy reflectedoff the target (crop) to energy incident on the target(measured using BaSO4 white reference). The
257J. Indian Soc. Remote Sens. (September 2008) 36:255–266
123
reflectance measurements were made from one meterabove the crop canopy with the sensor facing thecrop and oriented normal to the plant. The readingswere taken on cloud free days at around solar noonlocal time. While taking the observations, care wastaken not to cast shadows over the area beingscanned by the instrument. The spectra obtained at1nm resolution from the data taken by FieldSpecspectroradiometer were integrated to the 10 nm tomatch with the bandwidth and band centers of theHyperion sensor for later comparison.
Methodology
Hyperion Data Evaluation
The Hyperion data were evaluated by studying theband wise image statistics and the dimensionality ofdata. The mean DN (digital number) values werecomputed and plotted to find out the individualstatistics. Data dimensionality was studied usingprincipal component analysis (PCA). A large amountof interrelated information exists among thehyperspectral bands and not all spectral bandscan be usefully applied for classification orestimation of biophysical-parameters (Pu and Gong,2004). PCA is one of the most common algorithmsfor dimensionality reduction from hyperspectral data.It determines per cent variability explained in eachPCA by its corresponding Eigen values (Pu et al.,2003). The original high dimensional datasets werethus distilled by removing redundant bands andkeeping only those that contained most of theinformation (Thenkabail et al., 2004a). Since thestudy was for agricultural applications, PCA wasperformed on the image under the agriculturemask. The mask was prepared by carrying outunsupervised K-means classification.
Pre-processing of Hyperion Data
The pre-processing of Hyperion data was carried outin (i) digital number to radiance transformation (ii)
atmospheric corrections and reflectance retrieval and(iii) best band selection.
DN to Radiance Conversion
The DN values were rescaled to get the radiancevalues using the calibration coefficients. In the caseof Hyperion, there are two different rescaling factorsused for the VNIR and SWIR bands (Thenkabailet al., 2004b; Shih et al., 2004; USGS, 2004).
Radiance, L (W/m2 /μm/sr) was computed asL=DN/40 for VNIR bands and L = DN / 80 for SWIRbands. Image statistics were studied for the fullimage using radiance values.
Class Statistics
Different classes viz., crop, plantation, soil, waterand habitation were individually studied to analyzethe spectral behaviors in narrow bands in terms ofradiance. Training site was marked for each of theclasses. These classes were chosen on the basis ofthe ground-truth collected during field observations.Statistics were computed for each of these classesin a similar manner. Similarly, spectral profiles ofdifferent crops were also studied, which includedwheat, sugarcane, mustard, sorghum and potato.Various stages of wheat (milking, tillering, grainfilland maturity) were also considered.
Atmospheric Correction and Reflectance Retrieval
The composition of the atmosphere at the time ofdata acquisition can have a significant impact onsome vegetation indices. Absorption (due toatmospheric gases– oxygen, water vapour andozone) and scattering (due to air molecules-Raleighscattering and aerosols-Mie scattering) modify thespectral energy passing through the atmosphere(Broge et al., 2000). Therefore, atmospheric correctionis widely used in hyperspectral imagery to derivesurface reflectance without atmospheric effects.Currently, there are several packages commerciallyavailable for this function such as ATCOR (Leica,2004), ATCOR 4 (Meroni et al., 2004), ACORN 4.1
258 J. Indian Soc. Remote Sens. (September 2008) 36:255–266
123
(Apan et al., 2004), CAM5S (Haboudane et al., 2004),FLASH (Shih et al., 2004), HATCH (Goetz et al.,2003). Most of them work on MODTRAN basedtechnique.
Atmospheric correction was carried out usingATCOR2 available with PCI Geomatica usingalgorithms developed by DLR, German AerospaceResearch Establishment. The easy availability of thesoftware was the major reason for adopting thealgorithm. It calculates correction for flat areasapplying constant or varying atmosphere accountingfor adjacency effect. ATCOR2 was performedspecifying calibration file (which is sensor specific),constant rural and tropical type of atmosphericdefinition, date of pass of the satellite (March 12,2005), solar zenith angle (49.5°), visibility (18 km),average elevation of the target area (232 m), pixel size(30 m), gain factor (1.0) and adjacency (1 km).Visibility and solar zenith angle were derived fromsun photometer measurements.
The reflectance was also derived without carryingout atmospheric correction (apparent reflectance). Itwas computed using the following formula (Richards,1986)
App. Reflectance = (L* π)/ E0 cosθ
where, L is radiance in milli watt/cm2 μm; π = 3.14; E0
is the total solar irradiance (in milli watt/cm2 μm) inabsence of atmosphere and θ is the solar zenith angle(49.5° in this case).
Reflectance, as well as apparent reflectancecomputed for three crops – wheat, sugarcane(ratoon) and potato were compared with the ground-based reflectance, observed using hand-heldspectro-radiometer.
Optimum Band selection
Optimum wavebands are those, which bestdiscriminate crop types and are also best suited forbiophysical parameter retrieval. These weredetermined based on a comprehensive analysis(Thenkabail et al., 2004a) using the methods that
include: principal component analysis (PCA) andleast correlated band selection.
From principal component analysis, the bandscontributing maximum (top 10) to the first fiveprincipal components were selected. Band-to-bandcorrelation was carried out for all band combinations.The band combinations, which were least correlated(less than 10-4) were selected as they assumed tocontain unique information. By combining the resultsof both the analyses, a set of 26 bands was selected.
Results and Discussion
The analysis of Hyperion raw data shows that outof a total of 242 bands, 44 bands have zero values.These bands are bands 1 to 7 (355.589nm to406.47nm), bands 58 to 76 (935.58nm to 902.36nm)and bands 225 to 242 (2405.6nm to 2577.07nm). Someof these bands were intentionally not illuminated andothers, mainly in the overlap region between the twospectrometers, correspond to areas of low sensitivityof the spectrometer materials (Datt et al., 2003).Therefore, these bands were set to zero valuesduring the Level 1B processing. Thus, out of a totalof 242 bands, 198 bands were found to be calibratedand thus useful for further analysis. Among the 198bands, four bands overlapped between the twospectrometers. These were VNIR spectrometer bands56 (915.7nm) and 57 (925.9nm) and SWIRspectrometer bands 77 (912.5nm) and 78 (922.6nm).Bands 77 and 78 were chosen for elimination aftergoing through the study made by Datt et al. (2003),according to which SWIR band has the higher levelof base noise after destriping. Thus we were left witha total of 196 wavebands to be processed. These werebands 8 to 57 (426.82 – 925.41 nm) and 79 to 224(932.64 – 2395.5).
Principal Component Analysis (PCA)
As mentioned earlier, PCA was carried out for thearea under agricultural class. In this data of 196
259J. Indian Soc. Remote Sens. (September 2008) 36:255–266
123
bands, 75 per cent of the data variability wasexplained by first principal component (PC1).Another 23 per cent was covered in next four PCs.First 10 PCs contributed more than 99 per cent ofinformation in the data set (Table 1). It was alsofound that the dimensionality of data was around 4,since each of the first 4 PCs explained more than 1per cent variance in the data. PC1 was mainly loadedby the bands in the wavelength range of 983.08 nm–1084nm. The wavebands were 84-94. It lies inMoisture Sensitive NIR (MSNIR) region in whichplants are sensitive to plant moisture stress asreflectance spectra rapidly rise after moistureabsorption. PC2 was loaded with the bandsbelonging to early NIR (772.78nm – 793.13nm) inaddition to the moisture sensitive NIR region. TheNIR region is more sensitive to LAI and soilbackground effect. Wavelength range of 609.97nm-701.55nm was predominant in PC3, where changesin chlorophyll content play a major role. Wavelengthrange as found in PC2 was extended in PC4 (742.25 –864.35nm) thus covering red-edge and NIR region.Red-edge region is significant as it is sensitive tovegetation stress.
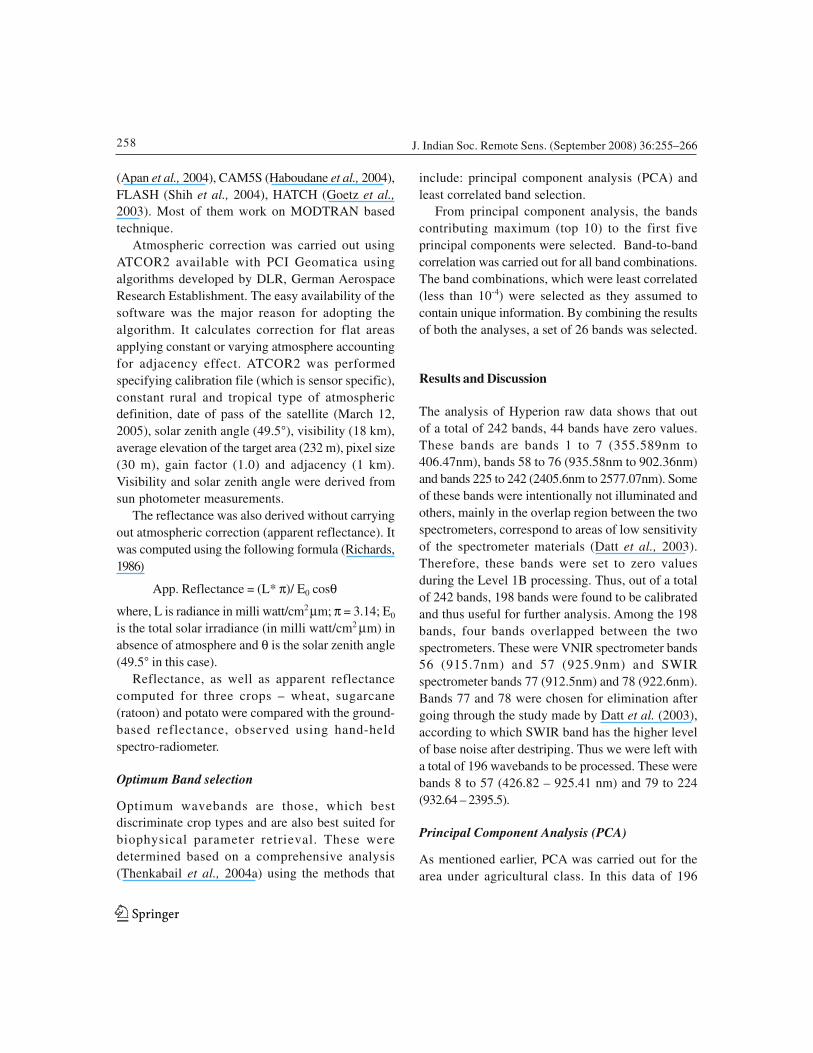
3D image cube gives the perspective view of theHyperion data showing the spectral diversity ofvarious land cover classes in different wavelengthrange (Fig. 1).
Table 1 Result of Principal Component Analysis (PCA)showing the percentage of variability explained bydifferent PCs of Hyperion data
Principal Percentage Cumulativecomponents variability explained percentage
PC 1 74.81 74.81
PC 2 18.48 93.29
PC 3 2.76 96.05
PC 4 1.70 97.75
PC 5 0.48 98.23
PC 6 0.36 98.59
PC 7 0.20 98.79
PC 8 0.17 98.96
PC 9 0.12 99.08
PC 10 0.10 99.18
Fig. 1 Hyperion image 3D cube for the study area.
Image Statistics
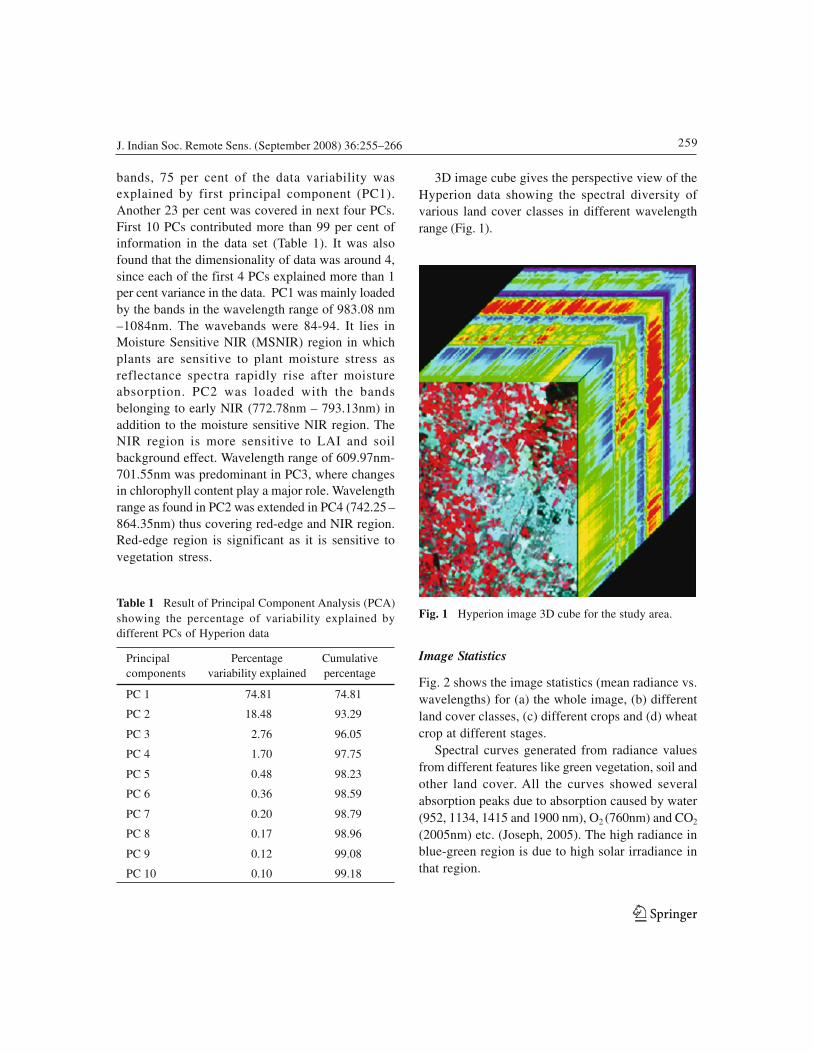
Fig. 2 shows the image statistics (mean radiance vs.wavelengths) for (a) the whole image, (b) differentland cover classes, (c) different crops and (d) wheatcrop at different stages.
Spectral curves generated from radiance valuesfrom different features like green vegetation, soil andother land cover. All the curves showed severalabsorption peaks due to absorption caused by water(952, 1134, 1415 and 1900 nm), O2 (760nm) and CO2
(2005nm) etc. (Joseph, 2005). The high radiance inblue-green region is due to high solar irradiance inthat region.
260 J. Indian Soc. Remote Sens. (September 2008) 36:255–266
123
In the crop spectra, chlorophyll absorption near690nm, a steep slope in the red edge region (700–750nm) and the leaf water absorption near 940nm and1104nm were remarkably evident. The radiance of soilwas high in the visible and the NIR region. Clayabsorption band near 2200nm was also found (Dattet al., 2003). Low absorption pattern (in the blue andgreen region), which gradually decreased in the NIRregion, was found in the spectral curve for water. Theradiance values of crops had higher values than theplantation.
Spectral curve generated for different crops in theRabi season (wheat, sugarcane, mustard, sorghumand potato) showed the diversity in reflectancepattern depending on the crop characteristics andgrowth stage of the crop.
All the stages of wheat were distinctly differentin the NIR (between 780 – 870nm) and SWIR(1000nm–1080nm) region. Wheat at mature stage hadlowest radiance values, while the crop in grainfillstage showed highest values. This showed thatHyperion could offer possibilities for separating cropphenological categories using specific narrowbandsor by analysis of the whole 450–2350nm spectralrange. Such distinct patterns have been generatedin many studies involving discrimination among cropvarieties (Apan et al., 2004; Galavo et al., 2005).
Atmospheric Correction and Reflectance Retrieval
As mentioned in the methodology, apparentreflectance was computed by dividing the targetradiance by the solar radiance, taking zenith angle
Fig. 2 Spectral curves of Hyperion data (a) full image (b) different classes (c) Rabi crops (d) wheat crop at differentstages with radiance.
261J. Indian Soc. Remote Sens. (September 2008) 36:255–266
123
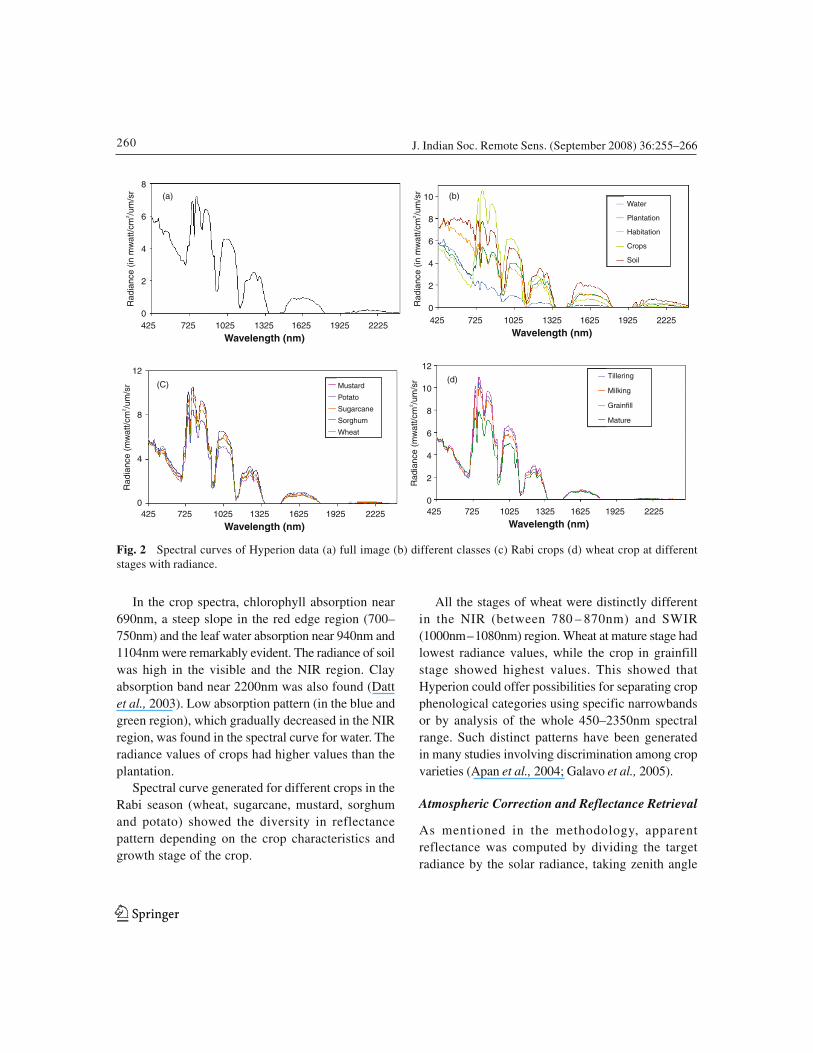
into consideration, while corrected reflectance wascomputed after carrying on atmospheric correctionsusing ATCOR2 software.
Apparent and corrected reflectance values fordifferent classes are presented in Fig. 3. Impact ofcorrection was more visible in the NIR region. Forall land cover classes, the reflectance in the blue andred region were low, whereas in the NIR and SWIRregion, reflectance were found to be high ascompared to the apparent reflectance.
highest value of 0.489 in the same wavelength bandunder the same land cover.
Absorption peaks in the reflectance curve at O2,H2O and CO2 absorption bands were also found asmentioned previously. After the atmosphericcorrections, the reflectance value of the wavebandsaround 121–130 and 166–181 (covering the wave-length range of 1356nm–1447nm and 1810nm–1961nm respectively) were found to be negative,uneven and spiky. Therefore, the values were set tozero. All these belonged to the MIR region. In totalthere were 26 such bands that contained zero values.
Comparison and Validation of the CorrectedReflectance
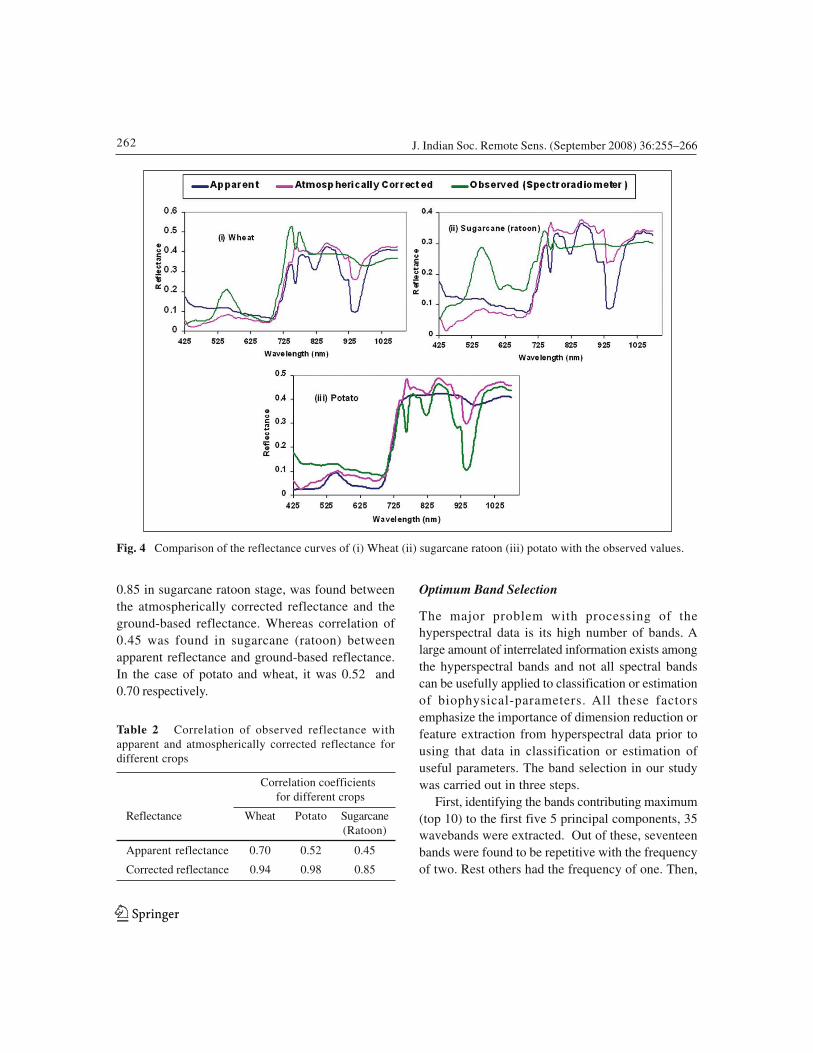
Corrected and apparent reflectance of wheat,sugarcane (in ratoon stage), and potato werecompared with the ground-based reflectancecollected using hand-held spectroradiometer. As thespectroradiometer range was up to 1075 nm thecomparison was carried up to that region (Fig. 4).Reflectance curves derived from the radiance valuesshowed that atmospherically corrected spectrum ismuch smoother and matches better with groundmeasurements. This signified the utility ofatmospheric correction.
In the case of sugarcane there was less matchingof corrected reflectance with ground values,especially in green region where field observationshowed very high reflectance. This might be due tothe fact that, since sugarcane crops were tall, therewere fewer gaps between canopy and spectro-radiometer and thus its field-of-view was narrow. Thedifference between the retrieved surface reflectancespectrum and surface measured one in the shortwavelength around 500nm was also found in thestudy made by Qu et al. (2003) using HATCH model.The correlation coefficients of Hyperion reflectancevalues with the field observation showed a similarpattern (Table 2). It was found that atmsophericcorrection increased the correlation. Very highcorrelation of about 0.98 in potato, 0.94 in wheat and
Fig. 3 Apparent and atmospherically correctedreflectance of different land cover classes derived fromHyperion data.
An increase in the reflectance values wasobserved when the atmospheric correction wasapplied. The highest value of apparent (uncorrected)reflectance (0.465) occurred at 854 nm in the case ofcrops, whereas, the corrected reflectance showed the
262 J. Indian Soc. Remote Sens. (September 2008) 36:255–266
123
0.85 in sugarcane ratoon stage, was found betweenthe atmospherically corrected reflectance and theground-based reflectance. Whereas correlation of0.45 was found in sugarcane (ratoon) betweenapparent reflectance and ground-based reflectance.In the case of potato and wheat, it was 0.52 and0.70 respectively.
Optimum Band Selection
The major problem with processing of thehyperspectral data is its high number of bands. Alarge amount of interrelated information exists amongthe hyperspectral bands and not all spectral bandscan be usefully applied to classification or estimationof biophysical-parameters. All these factorsemphasize the importance of dimension reduction orfeature extraction from hyperspectral data prior tousing that data in classification or estimation ofuseful parameters. The band selection in our studywas carried out in three steps.
First, identifying the bands contributing maximum(top 10) to the first five 5 principal components, 35wavebands were extracted. Out of these, seventeenbands were found to be repetitive with the frequencyof two. Rest others had the frequency of one. Then,
Fig. 4 Comparison of the reflectance curves of (i) Wheat (ii) sugarcane ratoon (iii) potato with the observed values.
Table 2 Correlation of observed reflectance withapparent and atmospherically corrected reflectance fordifferent crops
Correlation coefficients for different crops
Reflectance Wheat Potato Sugarcane(Ratoon)
Apparent reflectance 0.70 0.52 0.45
Corrected reflectance 0.94 0.98 0.85
263J. Indian Soc. Remote Sens. (September 2008) 36:255–266
123
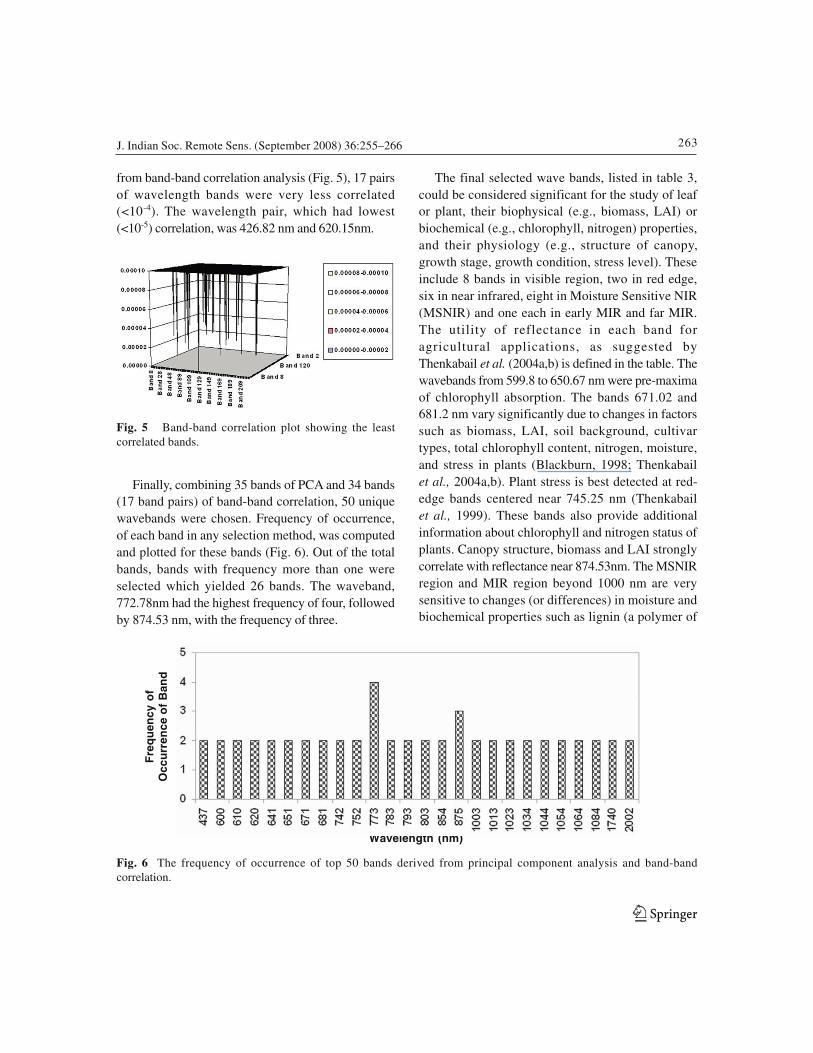
from band-band correlation analysis (Fig. 5), 17 pairsof wavelength bands were very less correlated(<10-4). The wavelength pair, which had lowest(<10-5) correlation, was 426.82 nm and 620.15nm.
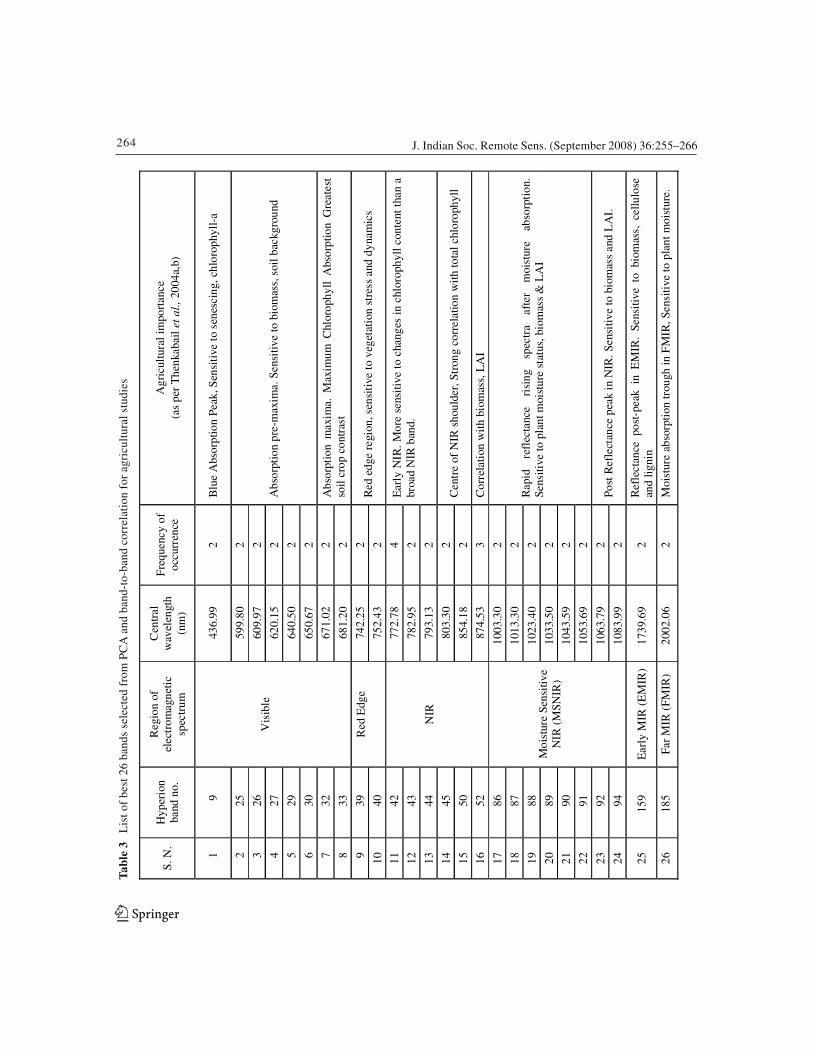
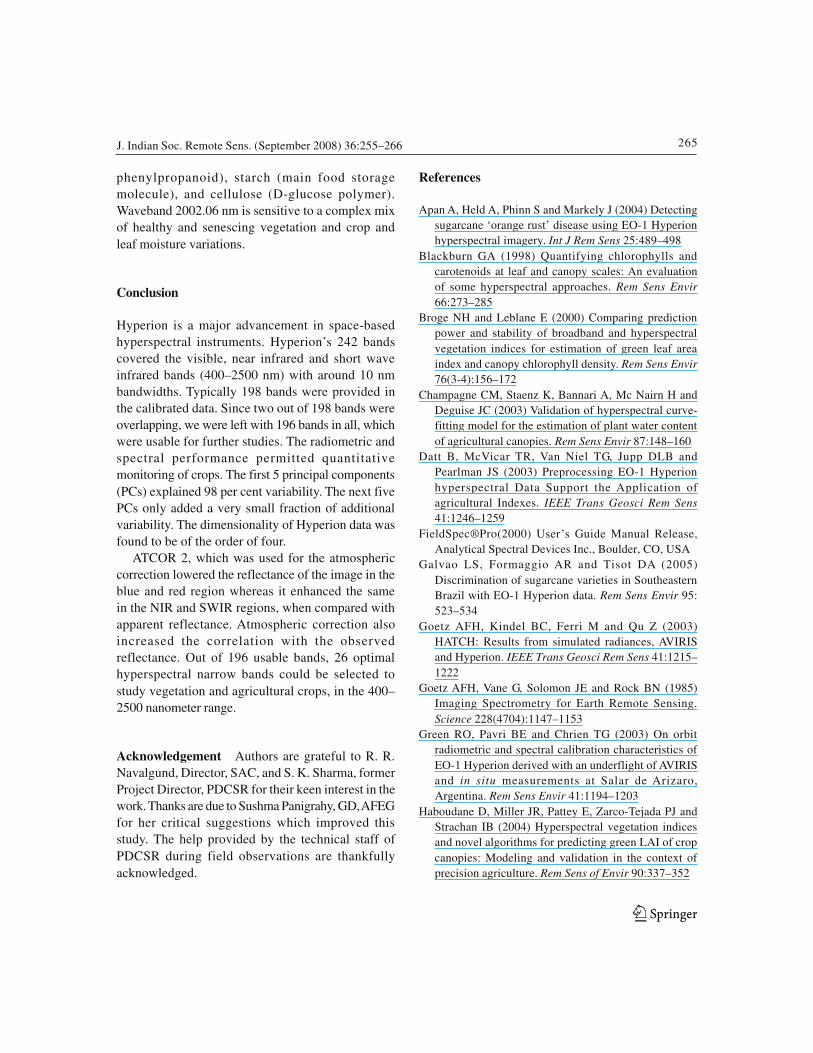
The final selected wave bands, listed in table 3,could be considered significant for the study of leafor plant, their biophysical (e.g., biomass, LAI) orbiochemical (e.g., chlorophyll, nitrogen) properties,and their physiology (e.g., structure of canopy,growth stage, growth condition, stress level). Theseinclude 8 bands in visible region, two in red edge,six in near infrared, eight in Moisture Sensitive NIR(MSNIR) and one each in early MIR and far MIR.The utility of reflectance in each band foragricultural applications, as suggested byThenkabail et al. (2004a,b) is defined in the table. Thewavebands from 599.8 to 650.67 nm were pre-maximaof chlorophyll absorption. The bands 671.02 and681.2 nm vary significantly due to changes in factorssuch as biomass, LAI, soil background, cultivartypes, total chlorophyll content, nitrogen, moisture,and stress in plants (Blackburn, 1998; Thenkabailet al., 2004a,b). Plant stress is best detected at red-edge bands centered near 745.25 nm (Thenkabailet al., 1999). These bands also provide additionalinformation about chlorophyll and nitrogen status ofplants. Canopy structure, biomass and LAI stronglycorrelate with reflectance near 874.53nm. The MSNIRregion and MIR region beyond 1000 nm are verysensitive to changes (or differences) in moisture andbiochemical properties such as lignin (a polymer of
Fig. 5 Band-band correlation plot showing the leastcorrelated bands.
Finally, combining 35 bands of PCA and 34 bands(17 band pairs) of band-band correlation, 50 uniquewavebands were chosen. Frequency of occurrence,of each band in any selection method, was computedand plotted for these bands (Fig. 6). Out of the totalbands, bands with frequency more than one wereselected which yielded 26 bands. The waveband,772.78nm had the highest frequency of four, followedby 874.53 nm, with the frequency of three.
Fig. 6 The frequency of occurrence of top 50 bands derived from principal component analysis and band-bandcorrelation.
Wavelength (nm)
Fre
qu
ency
of
Occ
urr
ence
of
Ban
d
264 J. Indian Soc. Remote Sens. (September 2008) 36:255–266
123
Tab
le 3
L
ist o
f be
st 2
6 ba
nds
sele
cted
fro
m P
CA
and
ban
d-to
-ban
d co
rrel
atio
n fo
r ag
ricu
ltur
al s
tudi
es
S. N
. H
yper
ion
band
no.
Reg
ion
of
elec
trom
agne
tic
spec
trum
Cen
tral
w
avel
engt
h
(nm
)
Fre
quen
cy o
f oc
curr
ence
A
gric
ultu
ral i
mpo
rtan
ce
(as
per
The
nkab
ail e
t al.,
200
4a,b
)
1 9
436.
99
2 B
lue
Abs
orpt
ion
Peak
, Sen
siti
ve to
sen
esci
ng, c
hlor
ophy
ll-a
2 25
59
9.80
2
3 26
60
9.97
2
4 27
62
0.15
2
5 29
64
0.50
2
6 30
65
0.67
2
Abs
orpt
ion
pre-
max
ima.
Sen
sitiv
e to
bio
mas
s, s
oil b
ackg
roun
d
7 32
67
1.02
2
8 33
Vis
ible
681.
20
2 A
bsor
ptio
n m
axim
a. M
axim
um C
hlor
ophy
ll A
bsor
ptio
n G
reat
est
soil
crop
con
tras
t
9 39
74
2.25
2
10
40
Red
Edg
e
752.
43
2 R
ed e
dge
regi
on, s
ensi
tive
to v
eget
atio
n st
ress
and
dyn
amic
s
11
42
772.
78
4
12
43
782.
95
2
13
44
793.
13
2
Ear
ly N
IR. M
ore
sens
itiv
e to
cha
nges
in
chlo
roph
yll c
onte
nt t
han
a br
oad
NIR
ban
d.
14
45
803.
30
2
15
50
854.
18
2 C
entr
e of
NIR
sho
ulde
r, S
tron
g co
rrel
atio
n w
ith
tota
l chl
orop
hyll
16
52
NIR
874.
53
3 C
orre
lati
on w
ith
biom
ass,
LA
I
17
86
1003
.30
2
18
87
1013
.30
2
19
88
1023
.40
2
20
89
1033
.50
2
21
90
1043
.59
2
22
91
1053
.69
2
Rap
id
refl
ecta
nce
risi
ng
spec
tra
afte
r m
oist
ure
abso
rpti
on.
Sens
itive
to p
lant
moi
stur
e st
atus
, bio
mas
s &
LA
I
23
92
1063
.79
2
24
94
Moi
stur
e Se
nsit
ive
NIR
(M
SNIR
)
1083
.99
2 Po
st R
efle
ctan
ce p
eak
in N
IR. S
ensi
tive
to b
iom
ass
and
LA
I.
25
159
Ear
ly M
IR (
EM
IR)
1739
.69
2 R
efle
ctan
ce p
ost-
peak
in
EM
IR.
Sens
itiv
e to
bio
mas
s, c
ellu
lose
an
d lig
nin
26
185
Far
MIR
(FM
IR)
2002
.06
2 M
oist
ure
abso
rpti
on tr
ough
in F
MIR
, Sen
siti
ve to
pla
nt m
oist
ure.
265J. Indian Soc. Remote Sens. (September 2008) 36:255–266
123
phenylpropanoid), starch (main food storagemolecule), and cellulose (D-glucose polymer).Waveband 2002.06 nm is sensitive to a complex mixof healthy and senescing vegetation and crop andleaf moisture variations.
Conclusion
Hyperion is a major advancement in space-basedhyperspectral instruments. Hyperion’s 242 bandscovered the visible, near infrared and short waveinfrared bands (400–2500 nm) with around 10 nmbandwidths. Typically 198 bands were provided inthe calibrated data. Since two out of 198 bands wereoverlapping, we were left with 196 bands in all, whichwere usable for further studies. The radiometric andspectral performance permitted quantitativemonitoring of crops. The first 5 principal components(PCs) explained 98 per cent variability. The next fivePCs only added a very small fraction of additionalvariability. The dimensionality of Hyperion data wasfound to be of the order of four.
ATCOR 2, which was used for the atmosphericcorrection lowered the reflectance of the image in theblue and red region whereas it enhanced the samein the NIR and SWIR regions, when compared withapparent reflectance. Atmospheric correction alsoincreased the correlation with the observedreflectance. Out of 196 usable bands, 26 optimalhyperspectral narrow bands could be selected tostudy vegetation and agricultural crops, in the 400–2500 nanometer range.
Acknowledgement Authors are grateful to R. R.Navalgund, Director, SAC, and S. K. Sharma, formerProject Director, PDCSR for their keen interest in thework. Thanks are due to Sushma Panigrahy, GD, AFEGfor her critical suggestions which improved thisstudy. The help provided by the technical staff ofPDCSR during field observations are thankfullyacknowledged.
References
Apan A, Held A, Phinn S and Markely J (2004) Detectingsugarcane ‘orange rust’ disease using EO-1 Hyperionhyperspectral imagery. Int J Rem Sens 25:489–498
Blackburn GA (1998) Quantifying chlorophylls andcarotenoids at leaf and canopy scales: An evaluationof some hyperspectral approaches. Rem Sens Envir66:273–285
Broge NH and Leblane E (2000) Comparing predictionpower and stability of broadband and hyperspectralvegetation indices for estimation of green leaf areaindex and canopy chlorophyll density. Rem Sens Envir76(3-4):156–172
Champagne CM, Staenz K, Bannari A, Mc Nairn H andDeguise JC (2003) Validation of hyperspectral curve-fitting model for the estimation of plant water contentof agricultural canopies. Rem Sens Envir 87:148–160
Datt B, McVicar TR, Van Niel TG, Jupp DLB andPearlman JS (2003) Preprocessing EO-1 Hyperionhyperspectral Data Support the Application ofagricultural Indexes. IEEE Trans Geosci Rem Sens41:1246–1259
FieldSpec®Pro(2000) User’s Guide Manual Release,Analytical Spectral Devices Inc., Boulder, CO, USA
Galvao LS, Formaggio AR and Tisot DA (2005)Discrimination of sugarcane varieties in SoutheasternBrazil with EO-1 Hyperion data. Rem Sens Envir 95:523–534
Goetz AFH, Kindel BC, Ferri M and Qu Z (2003)HATCH: Results from simulated radiances, AVIRISand Hyperion. IEEE Trans Geosci Rem Sens 41:1215–1222
Goetz AFH, Vane G, Solomon JE and Rock BN (1985)Imaging Spectrometry for Earth Remote Sensing.Science 228(4704):1147–1153
Green RO, Pavri BE and Chrien TG (2003) On orbitradiometric and spectral calibration characteristics ofEO-1 Hyperion derived with an underflight of AVIRISand in situ measurements at Salar de Arizaro,Argentina. Rem Sens Envir 41:1194–1203
Haboudane D, Miller JR, Pattey E, Zarco-Tejada PJ andStrachan IB (2004) Hyperspectral vegetation indicesand novel algorithms for predicting green LAI of cropcanopies: Modeling and validation in the context ofprecision agriculture. Rem Sens of Envir 90:337–352
266 J. Indian Soc. Remote Sens. (September 2008) 36:255–266
123
Hong SY, Sudduth KA, Kitchen NR, Drummond ST, PalmHL and Wiebold WJ (2002) Estimating within fieldvariations in soil properties from airborne hyper-spectral images. ISPRS Commission I/ FIOEOS 2002Conference Proceedings
Huete AR, Miura T and Gao X (2003) Land coverconversion and degradation analysis through coupledsoil-plan biophysical parameters derived fromhyperspectral EO-1 Hyperion. IEEE Trans Geosci RemSens 41:1268–1276
Joseph G (2005) Fundamentals of Remote Sensing.Universities Press. Hyderabad, 500 p
Leica (2004) ATCOR for Imagine, Data sheet, url: http://www.geosystems.de/atcor/index.html
Meroni M, Colombo R and Panigada C (2004) Inversionof a radiative transfer model with hyperspectralobservations for LAI mapping in poplar plantations.Rem Sens Envir 92:195–206
Pearlman JS, Barry PS, Segal CC, Shepanski J, Beiso Dand Carman SL (2003) Hyperion, a Space-basedImaging Spectrometer. Rem Sens Envir 41:1160–1173
Pu R and Gong P (2004) Wavelet transformation appliedto EO-1 hyperspectral data for forest LAI and crownclosure mapping. Rem Sens Envir 91:212–224
Pu R, Gong P, Biging GS and Larrieu MR (2003)Extraction of red edge optical parameters fromHyperion data for estimation of forest leaf area index.IEEE Trans on Geoscience and Rem Sens 41:916–921.Rem Sens Envir 94:523–534
Qu Z, Kindel BC and Goetz AFH (2003) The highaccuracy atmospheric correction for hyperspectral data(HATCH) model. IEEE Trans Geosci Rem Sens41:1223–1231
Read JJ, Tarpley L, Mc Kinion JM and Reddy KR (2002)Narrow waveband reflectance ratios for remoteestimation of nitrogen status in cotton. J Environ Qual31:1442–1452
Richards JA (1986) Remote sensing digital image analysis:An introduction. In: Springer-Verlag, Berlin. 281 p
Schaepman ME, Koetz B, Strub GS and Itten KI (2005)Spectrodirectional remote sensing for the improvedestimation of biophysical and –chemical variables: twocase studies. Int J of Applied Earth Observation andGeoinformation 6:271–282
Shih TY (2004) On the atmospheric correction for aHyperion scene. url: http:www.arc2004.gistda.or.th/data/paper_day/B-2.pdf
Thenkabail PS, Smith RB and De Pauw E (1999)Hyperspectral vegetation indices for determiningagricultural crop characteristics. CEO researchpublication series 1. ISBN: 0-9671303-0-1, Center forEarth Observation, Yale University, USA. 40
Thenkabail PS, Enclona EA, Ashton MS and Meer B VanDer (2004a) Accuracy assessments of hyperspectralwaveband performance for vegetation analysisapplications. Rem Sens Envir 91(3-4):354–376
Thenkabail PS, Enclona EA, Ashton MS, Legg C and DieuMJD (2004b) Hyperion, IKONOS, ALI. And ETM+sensors in the study of African rainforests. Rem SensEnvir 90:23–43
USGS (2004) Earth Observing 1, http://eo1.usgs.gov/userGuide/hyp_prod.html
Zarco-Tejada PJ, Miller JR, Harron J, Hu B, Noland TL,Goel N, Mohammed GH and Sampson P (2004)Needle chlorophyll content estimation through modelinversion using hyperspectral data from boreal forestcanopies. Rem Sens Envir 89:189–199
Zarco-Tejada PJ, Ustin SL and Whiting ML (2005)Temporal and spatial relationship between within fieldyield variability in cotton and high spatial hyper-spectral remote sensing imagery. Agronomy Journal97:641–652.