Evaluation of bulky DNA adduct levels after pesticide use: Comparison between open-field farmers and...
16
AUTHOR QUERIES Journal id: GTEC_A_195113 Corresponding author: VÉRONIQUE ANDRE Title: Evaluation of bulky DNA adduct levels after pesticide use: Comparison between open-field farmers and fruit growers AUTHOR: The following queries have arisen during the editing of your manuscript. Please answer the queries by making the necessary corrections on the CATS online corrections form. Once you have added all your corrections, please press the SUBMIT button. Query number Query 1 Please provide “Received” “Revised” and “in final form” dates 2 Please confirm mn or min 3 Please clarify “glm” mean? 4 Please provide the citation for reference [7] TABLES HAVE BEEN RENUMBERED SO THEY ARE CITED IN SEQUENCE IN THE TEXT. IS IT OKAY
-
Upload
independent -
Category
Documents
-
view
0 -
download
0
Transcript of Evaluation of bulky DNA adduct levels after pesticide use: Comparison between open-field farmers and...
AUTHOR QUERIES Journal id: GTEC_A_195113 Corresponding author: VÉRONIQUE ANDRE Title: Evaluation of bulky DNA adduct levels after pesticide use: Comparison between open-field farmers and fruit growers AUTHOR: The following queries have arisen during the editing of your manuscript. Please answer the queries by making the necessary corrections on the CATS online corrections form. Once you have added all your corrections, please press the SUBMIT button.
Query number Query
1 Please provide “Received” “Revised” and “in final form” dates 2 Please confirm mn or min 3 Please clarify “glm” mean? 4 Please provide the citation for reference [7] TABLES HAVE BEEN RENUMBERED SO THEY ARE CITED IN
SEQUENCE IN THE TEXT. IS IT OKAY

New XML Template (2006) [26.8.2006–5:28pm] [1–15]{TANDF_FPP}Gtec/GTEC_A_195113.3d (GTEC) [First Proof]
Toxicological & Environmental Chemistry, Month?? 2006; ??(?): 1–15
Evaluation of bulky DNA adduct levels after
pesticide use: Comparison between open-field5 farmers and fruit growers
VERONIQUE ANDRE1, JEREMIE LE GOFF1, DIDIER POTTIER1,PIERRE LEBAILLY1, MARCO PELUSO2, ARMELLE MUNNIA2, &PASCAL GAUDUCHON1
1GRECAN (EA1772 – Universite de Caen Basse-Normandie), Centre Francois Baclesse,10 Avenue General Harris, BP 5026, 14076 Caen cedex 05, France and 2CSPO – Scientific
Institute of Tuscany, Cancer Risk Factor Branch, Molecular Biology Laboratory, Via Pico della
Mirandola N. 24, 50131 Firenza, Italia
(Received 22 22 22; revised 22 22 22; in final form 22 22 22)
Abstract15 Genotoxic impact from pesticide use was evaluated and compared between open-field farmers and
fruit growers. Groups of farmers were classified according to the main pesticide sprayed (triazoles orchlorothalonil for open-field farmers n¼ 19; captan for fruit growers n¼ 29). Two blood samples(S1 and S3) were collected on consecutive days for each farmer, and white blood cell bulky DNAadduct levels were evaluated by 32P-postlabelling method. Exposure to pesticides was estimated using
20 a questionnaire. Within each group, no significant variation in the mean relative adduct level (RAL)values was observed between S1 and S3. A quantitative increase was observed at S3 for the subgroupof farmers exposed to chlorothalonil and associated insecticides. Between groups, the mean RALwas significantly higher for open-field farmers, a difference essentially attributable to the triazolesubgroup. Owing to the sampling chronology (farmers exposed to triazoles were sampled first, several
25 weeks before farmers exposed to chlorothalonil and associated insecticides), seasonal variations mayaccount for changes in DNA adduct levels in open-field farmers. Among fruit growers, a significantrelationship was found between RALS3 and two exposure variables generated by questionnaires(statistical general linear model).
Keywords: Pesticides, DNA adducts, occupational exposure, open-field farming, 32P-postlabelling
Correspondence: Veronique Andre, GRECAN (EA1772 – Universite de Caen Basse-Normandie), Centre Francois Baclesse,Avenue General Harris, BP 5026, 14076 Caen cedex 05. France. Tel.: 33-231-45-50-70. Fax: 33-231-45-51-72.E-mail: [email protected]
ISSN 0277-2248 print/ISSN 1029-0486 online/06/000001–15 � 2006 Taylor & FrancisDOI: 10.1080/02772240600952026
proofreader
1
New XML Template (2006) [26.8.2006–5:28pm] [1–15]{TANDF_FPP}Gtec/GTEC_A_195113.3d (GTEC) [First Proof]
30 Introduction
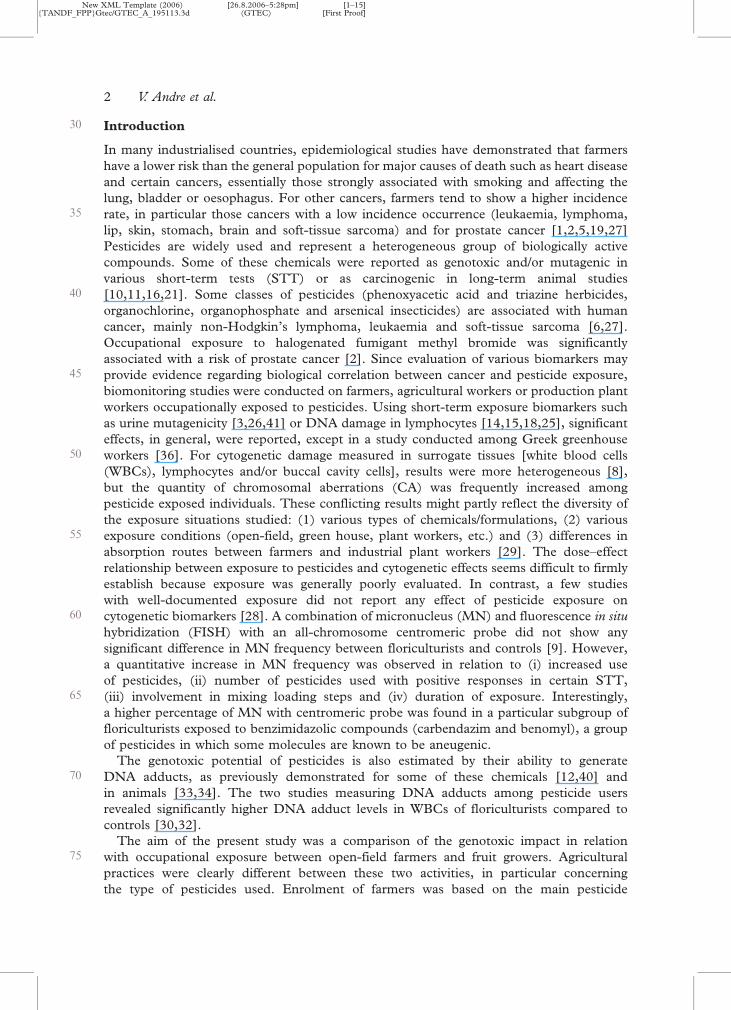
In many industrialised countries, epidemiological studies have demonstrated that farmershave a lower risk than the general population for major causes of death such as heart diseaseand certain cancers, essentially those strongly associated with smoking and affecting thelung, bladder or oesophagus. For other cancers, farmers tend to show a higher incidence
35 rate, in particular those cancers with a low incidence occurrence (leukaemia, lymphoma,lip, skin, stomach, brain and soft-tissue sarcoma) and for prostate cancer [1,2,5,19,27]Pesticides are widely used and represent a heterogeneous group of biologically activecompounds. Some of these chemicals were reported as genotoxic and/or mutagenic invarious short-term tests (STT) or as carcinogenic in long-term animal studies
40 [10,11,16,21]. Some classes of pesticides (phenoxyacetic acid and triazine herbicides,organochlorine, organophosphate and arsenical insecticides) are associated with humancancer, mainly non-Hodgkin’s lymphoma, leukaemia and soft-tissue sarcoma [6,27].Occupational exposure to halogenated fumigant methyl bromide was significantlyassociated with a risk of prostate cancer [2]. Since evaluation of various biomarkers may
45 provide evidence regarding biological correlation between cancer and pesticide exposure,biomonitoring studies were conducted on farmers, agricultural workers or production plantworkers occupationally exposed to pesticides. Using short-term exposure biomarkers suchas urine mutagenicity [3,26,41] or DNA damage in lymphocytes [14,15,18,25], significanteffects, in general, were reported, except in a study conducted among Greek greenhouse
50 workers [36]. For cytogenetic damage measured in surrogate tissues [white blood cells(WBCs), lymphocytes and/or buccal cavity cells], results were more heterogeneous [8],but the quantity of chromosomal aberrations (CA) was frequently increased amongpesticide exposed individuals. These conflicting results might partly reflect the diversity ofthe exposure situations studied: (1) various types of chemicals/formulations, (2) various
55 exposure conditions (open-field, green house, plant workers, etc.) and (3) differences inabsorption routes between farmers and industrial plant workers [29]. The dose–effectrelationship between exposure to pesticides and cytogenetic effects seems difficult to firmlyestablish because exposure was generally poorly evaluated. In contrast, a few studieswith well-documented exposure did not report any effect of pesticide exposure on
60 cytogenetic biomarkers [28]. A combination of micronucleus (MN) and fluorescence in situ
hybridization (FISH) with an all-chromosome centromeric probe did not show anysignificant difference in MN frequency between floriculturists and controls [9]. However,a quantitative increase in MN frequency was observed in relation to (i) increased useof pesticides, (ii) number of pesticides used with positive responses in certain STT,
65 (iii) involvement in mixing loading steps and (iv) duration of exposure. Interestingly,a higher percentage of MN with centromeric probe was found in a particular subgroup offloriculturists exposed to benzimidazolic compounds (carbendazim and benomyl), a groupof pesticides in which some molecules are known to be aneugenic.
The genotoxic potential of pesticides is also estimated by their ability to generate70 DNA adducts, as previously demonstrated for some of these chemicals [12,40] and
in animals [33,34]. The two studies measuring DNA adducts among pesticide usersrevealed significantly higher DNA adduct levels in WBCs of floriculturists compared tocontrols [30,32].
The aim of the present study was a comparison of the genotoxic impact in relation75 with occupational exposure between open-field farmers and fruit growers. Agricultural
practices were clearly different between these two activities, in particular concerningthe type of pesticides used. Enrolment of farmers was based on the main pesticide
2 V. Andre et al.
New XML Template (2006) [26.8.2006–5:28pm] [1–15]{TANDF_FPP}Gtec/GTEC_A_195113.3d (GTEC) [First Proof]
sprayed: chlorothalonil or triazoles for open-field farmers and captan for fruit growers.These three main pesticides were chosen not only because of their extensive use but also
80 because some genotoxic data are available, at least for two of them. Chlorothalonil induceskidney and forestomach tumours in both genders in rats and mice [22]. Even if classicalSTT were negative, including the capacity for the metabolites to form DNA adducts [40]chlorothalonil was shifted by IARC from group 3 to group 2B [22]. Captan was reportedgenotoxic in various STT [39,42] and potentially carcinogenic towards kidney, thyroid
85 and forestomach in rats [20] and in duodenum and other regions of the digestive tractin mice [13]. Captan is classified by IARC in group 3 but belongs to group B2 in the EPAclassification.
The use of pesticide mixtures is the rule for all farmers included in this study, a situationwhich is not studied during evaluation of the chemicals before marketing. Therefore,
90 it should be considered, as proposed by Maroni and Fait [28] that some of these agents‘‘might interact in an additive or synergistic way and therefore modify the pattern of effectsobserved in the case of monoexposure’’. Co-formulants and surfactants may also playa critical role: some solvents (benzene, chloroform, carbon tetrachloride, 1,2-dichlor-oethane, etc.) with evidence of carcinogenicity in humans or animals were found in
95 some pesticide formulations [35]. As an example, DNA adducts were generated in a dose-dependent manner in kidney and liver of mice after i.p. treatment with Roundup�, but notafter administration of isopropylammonium salt of glyphosate, the active ingredient [3].
In the present study, the WBC bulky DNA adduct levels were measured(32P-postlabelling method) the morning before and the morning after pesticide handling
100 during intensive spraying periods (March–June). Detailed questionnaires were completedin person to accurately estimate the exposure to pesticides. DNA adduct levels werecompared between groups, and for fruit growers, results were also discussed in the lightof exposure data.
Materials and methods
105 Reagents
Buffer-saturated phenol, proteinase K, ribonuclease A and T1, micrococcal nuclease,20deoxyadenosine 30monophosphate (dAp), nuclease P1, urea, formic acid and lithiumhydroxide were purchased from Sigma-Aldrich. Carrier-free [�-32P]ATP (3000 Ci mmol�1)was from Amersham. T4 polynucleotide kinase was from Q Biogen; phosphodiesterase
110 type II (calf spleen) was from Calbiochem. PEI-cellulose F plastic plates were obtainedfrom Merck.
Farmer characteristics
All farmers were volunteers, professionally active and free of cancer. They gave theirinformed consent prior to their enrolment in the study. Forty-eight pairs of samples were
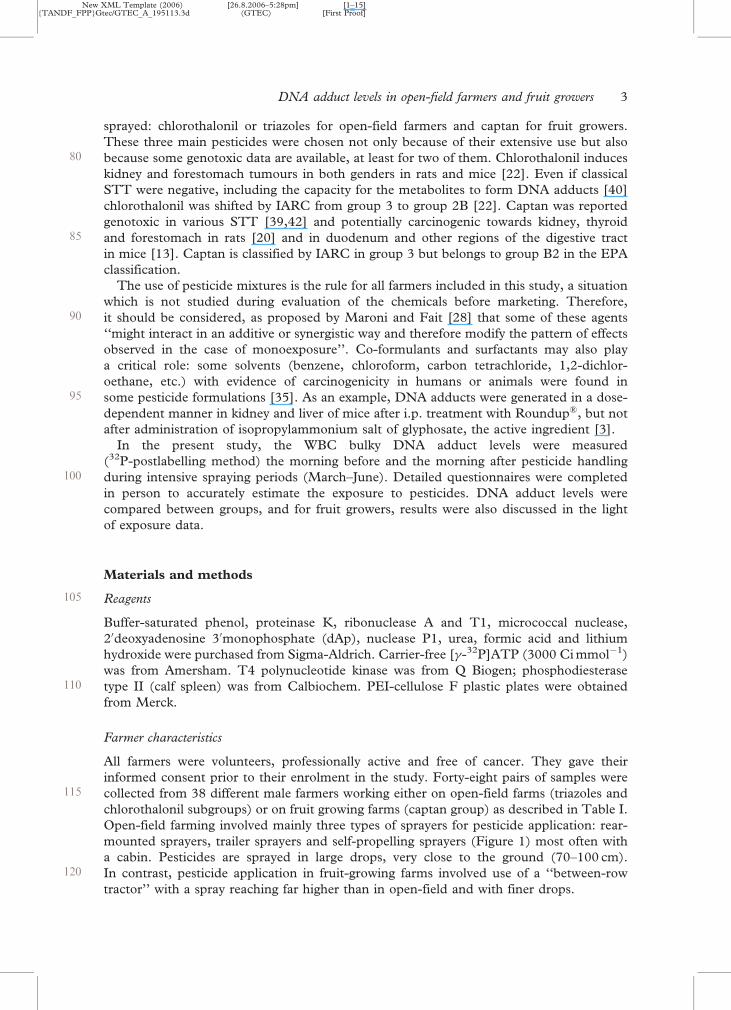
115 collected from 38 different male farmers working either on open-field farms (triazoles andchlorothalonil subgroups) or on fruit growing farms (captan group) as described in Table I.Open-field farming involved mainly three types of sprayers for pesticide application: rear-mounted sprayers, trailer sprayers and self-propelling sprayers (Figure 1) most often witha cabin. Pesticides are sprayed in large drops, very close to the ground (70–100 cm).
120 In contrast, pesticide application in fruit-growing farms involved use of a ‘‘between-rowtractor’’ with a spray reaching far higher than in open-field and with finer drops.
DNA adduct levels in open-field farmers and fruit growers 3
New XML Template (2006) [26.8.2006–5:28pm] [1–15]{TANDF_FPP}Gtec/GTEC_A_195113.3d (GTEC) [First Proof]
Interviews of farmers were performed at home on each day of sampling and using astandardised questionnaire. The questionnaire gathered data on demographic character-istics, pesticides handled in the current spraying season, exposure parameters and potential
125 confounding factors such as smoking and drinking habits (for fruit growers, they were:less than once a day for 42%, once a day for 31% and more for 27%) or medicationhabits (open-field farmers: one farmer taking anti-inflammatory drugs and onefarmer taking anti-histaminic drugs; fruit growers: three farmers taking anti-histaminic,anti-hypertensive or anti-inflammatory drugs).
130 Collection of blood samples
Blood samples were collected on the morning before the beginning of the working day andon the following morning (namely samples S1 and S3) during intensive spraying season
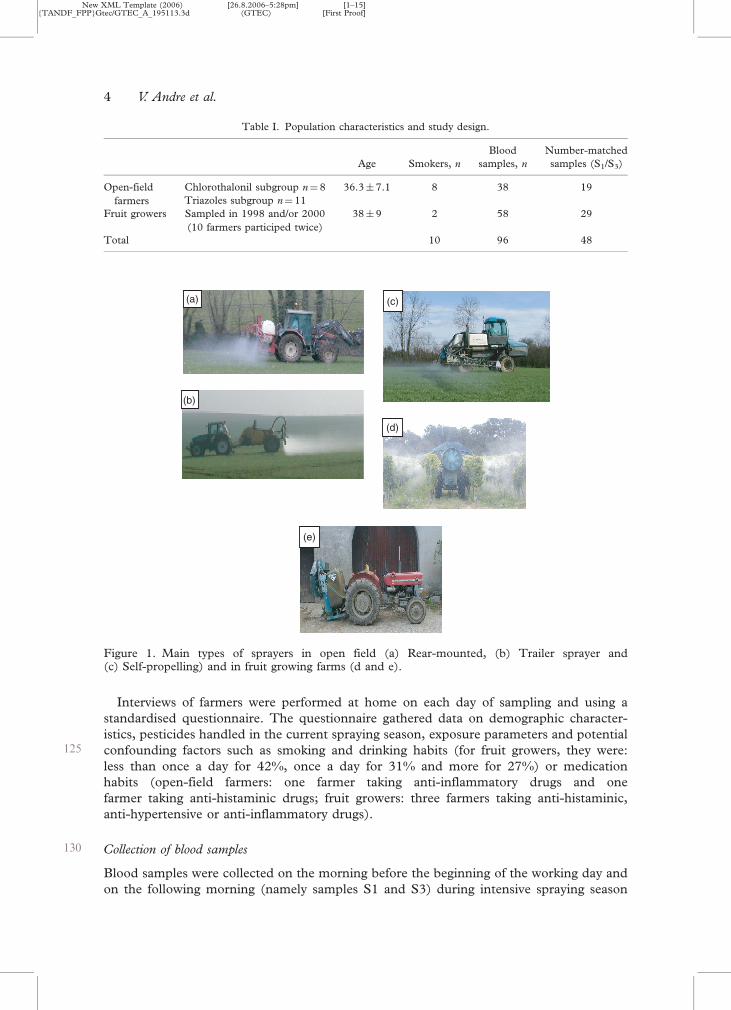
Table I. Population characteristics and study design.
Age Smokers, n
Bloodsamples, n
Number-matchedsamples (S1/S3)
Open-fieldfarmers
Chlorothalonil subgroup n¼ 8 36.3� 7.1 8 38 19Triazoles subgroup n¼ 11
Fruit growers Sampled in 1998 and/or 2000(10 farmers participed twice)
38� 9 2 58 29
Total 10 96 48
(a)
(b)
(e)
(d)
(c)
Figure 1. Main types of sprayers in open field (a) Rear-mounted, (b) Trailer sprayer and(c) Self-propelling) and in fruit growing farms (d and e).
4 V. Andre et al.

New XML Template (2006) [26.8.2006–5:28pm] [1–15]{TANDF_FPP}Gtec/GTEC_A_195113.3d (GTEC) [First Proof]
(March–June) (Figure 2 and Table I). The 96 samples were obtained by venipuncture(8–12 mL) using heparinised vacutainer tubes and were immediately stored at �80�C
135 until use.
DNA extraction
DNA was extracted from WBC using the phenol-chloroform method [4]. Briefly, bloodsamples were centrifuged, and the pellet was repeatedly washed with cold NH4Cl 0.17 Mbuffer (Tris-HCl, EDTA pH 7.4) of 1.2 mL was added to the WBC pellet together with
140 SDS 10%, RNAse T1 and RNAse A followed by proteinase K 30 mn later. Proteins wereeliminated by phenol extraction followed by phenol: SEVAG (chloroform/isoamyl alcohol,24 : 1) and SEVAG. The DNA was precipitated in cold ethanol, washed with ethanol, driedand dissolved in milliQ water. Purity was checked by the determination of UV spectrabetween 228 and 300 nm (expected ratios: 1.8 < A260/A280 < 1.95 and A260/A230 > 2.3).
145 The concentration was calculated from A260. DNA solutions were aliquoted and frozenat �80�C in glass vials.
Postlabelling method
The method was adapted from Reddy and Randerath [37]: 5mg of DNA were digested bymicrococcal nuclease and spleen phosphodiesterase for 3.5 h. The enrichment step was
150 performed by nuclease P1. Each sample was labelled with 1.1 MBq 32P-�ATP using T4polynucleotide kinase. Adducts were separated by bidimensional TLC on 12�12 cm2
PEI-cellulose sheets. Four migration solvents were used successively: D1¼ 1 M sodiumphosphate, pH 6.8; D2¼3 M lithium formate 7 M urea, pH 3.5; D3¼ 0.7 M lithiumchloride, 0.45 M Tris-HCl, 7.7 M urea, pH 8; D4¼ 1.7 M sodium phosphate, pH 5.
0
10
20
30
40
50
60
70
April June
S1 Blood samples S3
Spraying pesticide operations
Day 1 Day 2 (morning) (morning)
(Consecutive days)
Spr
ayed
are
a (H
a)
Figure 2. Sampling design. The top figure shows the frequency of pesticide use for one farmer duringone season in open-field farming. One segment corresponds to one application day. Segment heightreflects the area sprayed. Two blood samples (S1 and S3) were collected for each farmer on twoconsecutive days during the intensive spraying season (April–June). Spaying operations wereperformed on crops or apple trees on the day between the two samples.
DNA adduct levels in open-field farmers and fruit growers 5
proofreader
2

New XML Template (2006) [26.8.2006–5:28pm] [1–15]{TANDF_FPP}Gtec/GTEC_A_195113.3d (GTEC) [First Proof]
155 Autoradiograms were obtained after exposure of Kodak Biomax film to cellulose sheetsfor 72 h at �80�C with intensifying screens.
Ninety-five out of the 96 samples were analysed at least twice. For fruit growers(58 samples), analyses were repeated four times for 41 samples (i.e. in duplicate within agiven experiment for each of two independent experiments) or five times for 16 samples and
160 six times for one sample.For each experiment, two samples with 5 pmol of 20deoxyadenosine 30monophosphate
(dAp) were also labelled and diluted with water to a final volume of 1 mL. From each ofthese two samples, three deposits of 4mL each were performed and separated on TLCsheets. After counting, the dAp mean value served as the estimation of the corresponding
165 labelling for 5mg of dNp (1 mg DNA correspond to 3240 pmol dNp). Results were expressedas the relative adduct levels (RALs) according to the following relation:
RAL ¼ 1:22� 10�6 cpmadducts=cpmdAp
(mean cpm for 0.02 pmol dAp/deposit: 32,520� 7300; range: 21,123-41,443 cpm).
Quantification
170 Areas on plates corresponding to spots on chromatograms were excised. The radioactivitywas quantified using a scintillation counter (Cerenkov mode).
Detection limit
DNA adduct levels were low, most frequently close to the method detection limit. Spotswere detected on 42% of the PEI-cellulose sheets (positive sheets). Each sample was
175 analysed at least four times, and consequently the number of positive sheets could vary from0 to 4 because of the technical fluctuations of the method. The information given by thesepositive sheets was used to affect a differential RAL value to the sheets without adductsin the following manner:
. One quarter of the lowest RAL observed within this group when all the replicates for the180 corresponding sample were without any spot at S1 and S3.
. Half of the lowest RAL when the replicates were without any spot at S1 or S3.
. Three quarters of the lowest RAL if only one of the replicates was free of spots.
Pesticide exposure
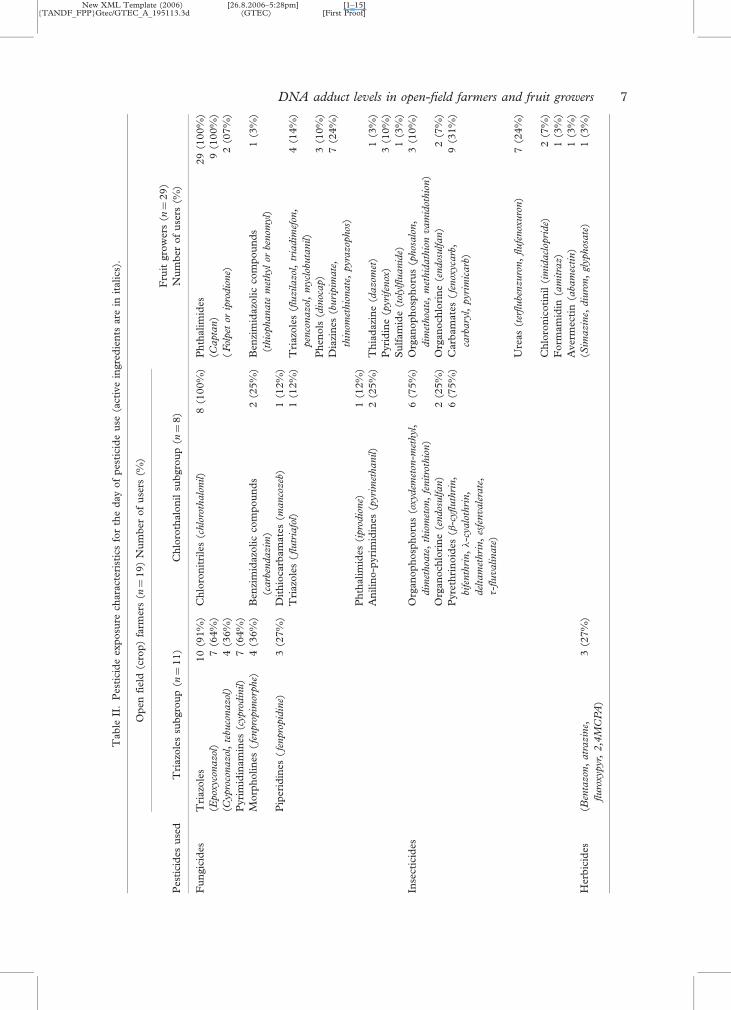
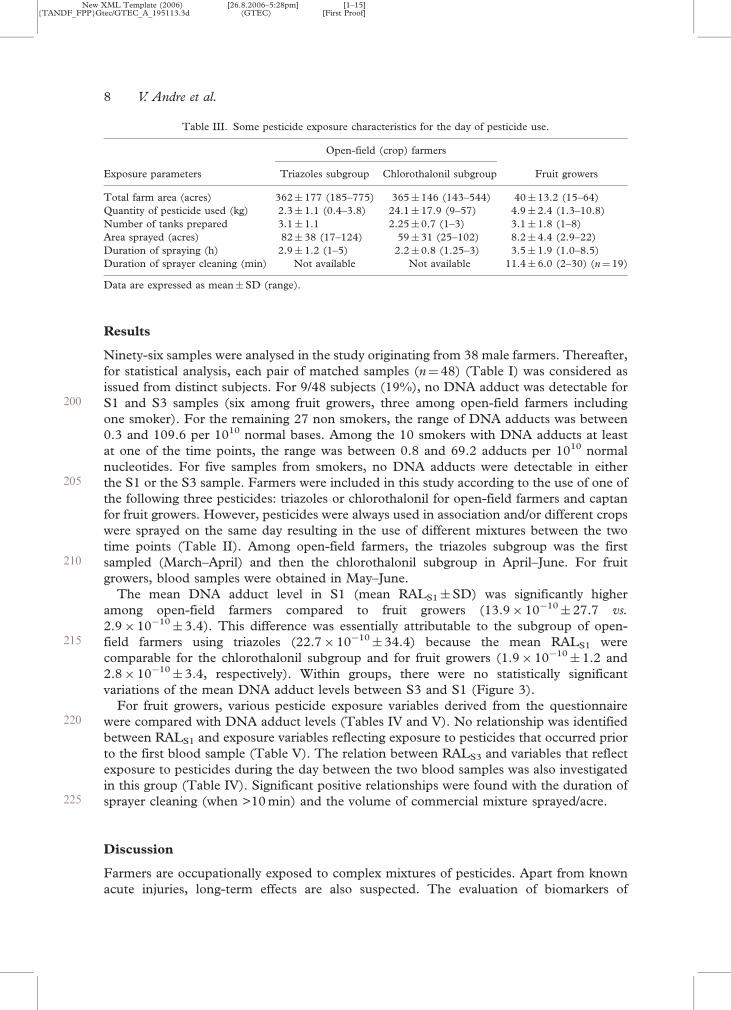
Pesticides used between S1 and S3 are listed in Table II. Certain parameters obtained from185 the questionnaires and may be associated with pesticide exposure are presented in Table III.
Statistical analysis
DNA adduct levels were compared between groups using an ANOVA. In the fruit growergroup, DNA adduct levels measured in S3 (RALS3) were correlated (Bravais–Pearson linearregression coefficient) with the level observed in S1 (RALS1). Consequently, the
190 explanation of RALS3 by exposure variables X were tested using a general linear modelin which RALS1 for each subject were always included: RALS3¼RALS1þ variable X
(Table IV). The variable X was considered as a class variable or a continuous variableas required (glm procedure). Analyses were carried out with SAS system (release 8.2).Farmers included in 1998 and in 2000 were treated as distinct subjects. The criterion for
195 significance was set at p < 0.05.
6 V. Andre et al.
proofreader
3
New XML Template (2006) [26.8.2006–5:28pm] [1–15]{TANDF_FPP}Gtec/GTEC_A_195113.3d (GTEC) [First Proof]
Tab
leII
.P
esti
cid
eex
posu
rech
arac
teri
stic
sfo
rth
ed
ayof
pes
tici
de
use
(act
ive
ingr
edie
nts
are
init
alic
s).
Op
enfi
eld
(cro
p)
farm
ers
(n¼
19)
Nu
mb
erof
use
rs(%
)
Pes
tici
des
use
dT
riaz
ole
ssu
bgr
ou
p(n¼
11)
Ch
loro
thal
on
ilsu
bgr
ou
p(n¼
8)
Fru
itgr
ow
ers
(n¼
29)
Nu
mb
erof
use
rs(%
)
Fu
ngi
cid
esT
riaz
ole
s10
(91%
)C
hlo
ron
itri
les
(chlo
roth
alo
nil)
8(1
00%
)P
hth
alim
ides
29
(100%
)(E
pox
yco
nazol
)7
(64%
)(C
apta
n)
9(1
00%
)(C
ypro
conazol
,te
buco
nazol
)4
(36%
)(F
olpet
orip
rodio
ne)
2(0
7%
)P
yrim
idin
amin
es(c
ypro
din
il)
7(6
4%
)M
orp
holin
es(fe
npro
pim
orphe)
4(3
6%
)B
enzi
mid
azolic
com
pou
nd
s(c
arb
endazim
)2
(25%
)B
enzi
mid
azolic
com
pou
nd
s(t
hio
phanate
met
hyl
orbe
nom
yl)
1(3
%)
Pip
erid
ines
(fe
npro
pid
ine)
3(2
7%
)D
ith
ioca
rbam
ates
(manco
zeb
)1
(12%
)T
riaz
ole
s(flutr
iafo
l)1
(12%
)T
riaz
ole
s(f
luzilazol
,tr
iadim
efon
,
pen
conazol
,m
ycl
obuta
nil)
4(1
4%
)
Ph
enols
(din
ocap)
3(1
0%
)D
iazi
nes
(buri
pim
ate
,
thin
omet
hio
nate
,pyra
zop
hos
)7
(24%
)
Ph
thal
imid
es(i
pro
dio
ne)
1(1
2%
)A
nilin
o-p
yrim
idin
es(p
yri
met
hanil)
2(2
5%
)T
hia
daz
ine
(dazom
et)
1(3
%)
Pyr
idin
e(p
yri
fenox
)3
(10%
)S
ulf
amid
e(t
olylflu
anid
e)1
(3%
)In
sect
icid
esO
rgan
op
hosp
horu
s(o
xydem
eton
-met
hyl,
dim
ethoa
te,
thio
met
on,
fenitro
thio
n)
6(7
5%
)O
rgan
op
hosp
horu
s(p
hos
alo
n,
dim
ethoa
te,
met
hid
ath
ion
vam
idot
hio
n)
3(1
0%
)
Org
anoch
lori
ne
(endos
ulfan)
2(2
5%
)O
rgan
och
lori
ne
(endos
ulfan)
2(7
%)
Pyr
eth
rin
oid
es(�
-cyfluth
rin,
bife
nth
rin,�-c
yalo
thri
n,
del
tam
ethri
n,
esfe
nvale
rate
,�-
fluvalinate
)
6(7
5%
)C
arb
amat
es(fe
nox
yca
rb,
carb
ary
l,pyri
mic
arb
)9
(31%
)
Ure
as(t
erflube
nzuro
n,
flufe
nox
uro
n)
7(2
4%
)
Ch
loro
nic
oti
nil
(im
idacl
opri
de)
2(7
%)
Form
amid
in(a
mitra
z)
1(3
%)
Ave
rmec
tin
(aba
mec
tin)
1(3
%)
Her
bic
ides
(Ben
tazon
,atr
azin
e,fluro
xypyr,
2,4
MC
PA
)3
(27%
)(S
imazin
e,diu
ron,
glyphos
ate
)1
(3%
)
DNA adduct levels in open-field farmers and fruit growers 7
New XML Template (2006) [26.8.2006–5:28pm] [1–15]{TANDF_FPP}Gtec/GTEC_A_195113.3d (GTEC) [First Proof]
Results
Ninety-six samples were analysed in the study originating from 38 male farmers. Thereafter,for statistical analysis, each pair of matched samples (n¼ 48) (Table I) was considered asissued from distinct subjects. For 9/48 subjects (19%), no DNA adduct was detectable for
200 S1 and S3 samples (six among fruit growers, three among open-field farmers includingone smoker). For the remaining 27 non smokers, the range of DNA adducts was between0.3 and 109.6 per 1010 normal bases. Among the 10 smokers with DNA adducts at leastat one of the time points, the range was between 0.8 and 69.2 adducts per 1010 normalnucleotides. For five samples from smokers, no DNA adducts were detectable in either
205 the S1 or the S3 sample. Farmers were included in this study according to the use of one ofthe following three pesticides: triazoles or chlorothalonil for open-field farmers and captanfor fruit growers. However, pesticides were always used in association and/or different cropswere sprayed on the same day resulting in the use of different mixtures between the twotime points (Table II). Among open-field farmers, the triazoles subgroup was the first
210 sampled (March–April) and then the chlorothalonil subgroup in April–June. For fruitgrowers, blood samples were obtained in May–June.
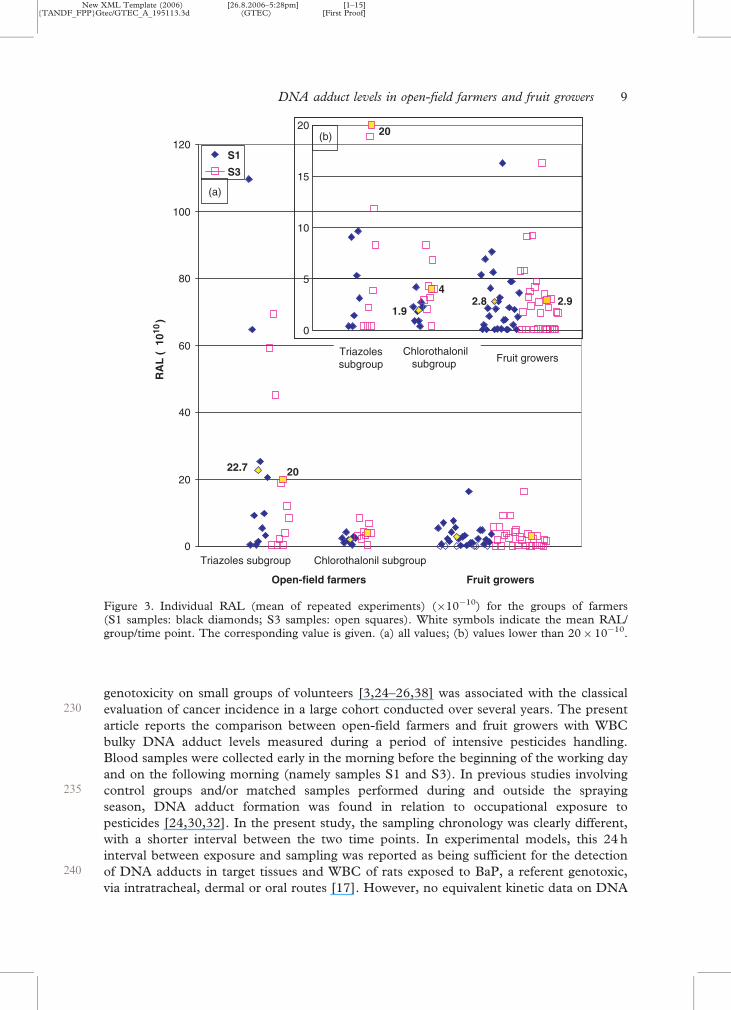
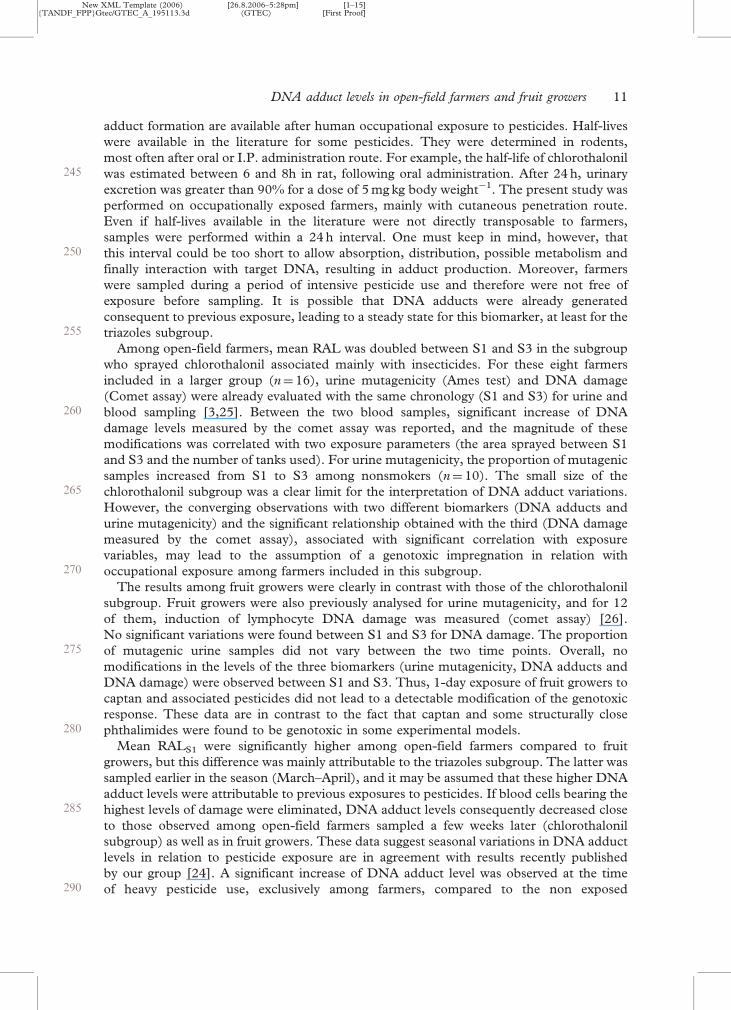
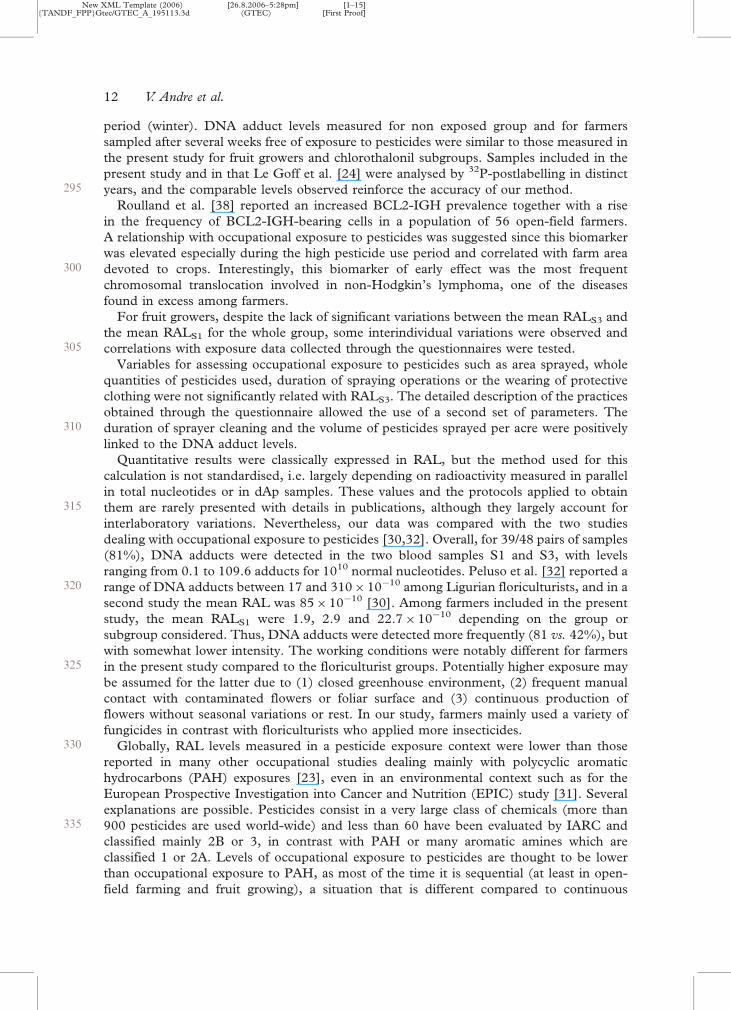
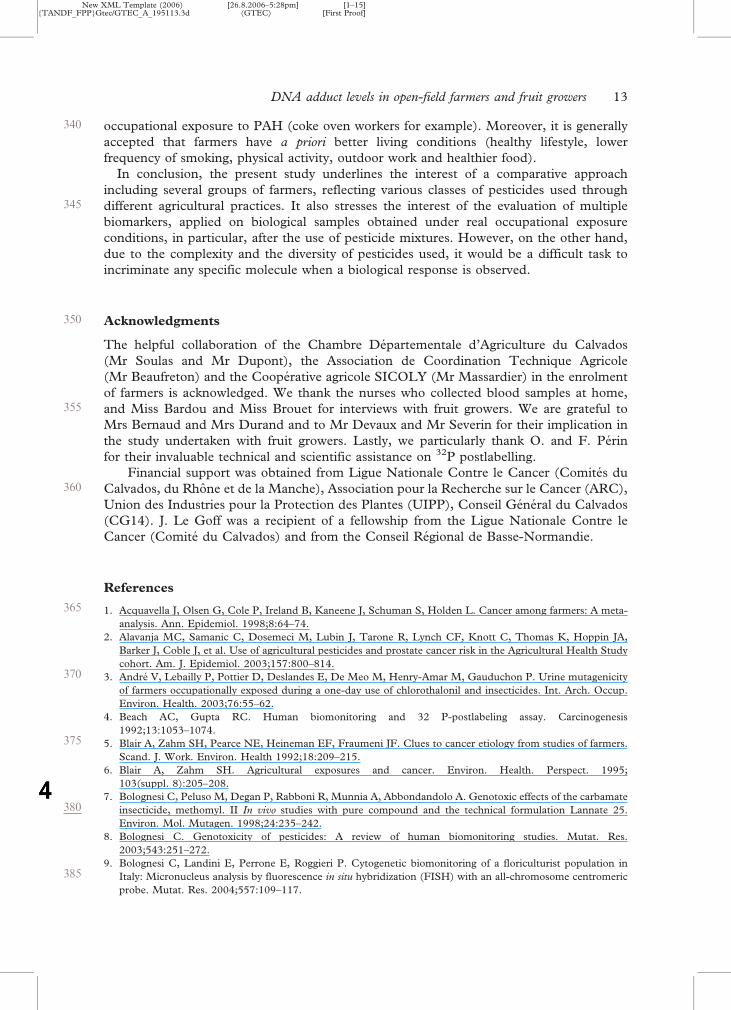
The mean DNA adduct level in S1 (mean RALS1�SD) was significantly higheramong open-field farmers compared to fruit growers (13.9� 10�10
� 27.7 vs.
2.9�10�10�3.4). This difference was essentially attributable to the subgroup of open-
215 field farmers using triazoles (22.7�10�10�34.4) because the mean RALS1 were
comparable for the chlorothalonil subgroup and for fruit growers (1.9� 10�10� 1.2 and
2.8�10�10�3.4, respectively). Within groups, there were no statistically significant
variations of the mean DNA adduct levels between S3 and S1 (Figure 3).For fruit growers, various pesticide exposure variables derived from the questionnaire
220 were compared with DNA adduct levels (Tables IV and V). No relationship was identifiedbetween RALS1 and exposure variables reflecting exposure to pesticides that occurred priorto the first blood sample (Table V). The relation between RALS3 and variables that reflectexposure to pesticides during the day between the two blood samples was also investigatedin this group (Table IV). Significant positive relationships were found with the duration of
225 sprayer cleaning (when >10 min) and the volume of commercial mixture sprayed/acre.
Discussion
Farmers are occupationally exposed to complex mixtures of pesticides. Apart from knownacute injuries, long-term effects are also suspected. The evaluation of biomarkers of
Table III. Some pesticide exposure characteristics for the day of pesticide use.
Open-field (crop) farmers
Exposure parameters Triazoles subgroup Chlorothalonil subgroup Fruit growers
Total farm area (acres) 362� 177 (185–775) 365� 146 (143–544) 40� 13.2 (15–64)Quantity of pesticide used (kg) 2.3� 1.1 (0.4–3.8) 24.1� 17.9 (9–57) 4.9� 2.4 (1.3–10.8)Number of tanks prepared 3.1� 1.1 2.25� 0.7 (1–3) 3.1� 1.8 (1–8)Area sprayed (acres) 82� 38 (17–124) 59� 31 (25–102) 8.2� 4.4 (2.9–22)Duration of spraying (h) 2.9� 1.2 (1–5) 2.2� 0.8 (1.25–3) 3.5� 1.9 (1.0–8.5)Duration of sprayer cleaning (min) Not available Not available 11.4� 6.0 (2–30) (n¼19)
Data are expressed as mean�SD (range).
8 V. Andre et al.
New XML Template (2006) [26.8.2006–5:28pm] [1–15]{TANDF_FPP}Gtec/GTEC_A_195113.3d (GTEC) [First Proof]
genotoxicity on small groups of volunteers [3,24–26,38] was associated with the classical230 evaluation of cancer incidence in a large cohort conducted over several years. The present
article reports the comparison between open-field farmers and fruit growers with WBCbulky DNA adduct levels measured during a period of intensive pesticides handling.Blood samples were collected early in the morning before the beginning of the working dayand on the following morning (namely samples S1 and S3). In previous studies involving
235 control groups and/or matched samples performed during and outside the sprayingseason, DNA adduct formation was found in relation to occupational exposure topesticides [24,30,32]. In the present study, the sampling chronology was clearly different,with a shorter interval between the two time points. In experimental models, this 24 hinterval between exposure and sampling was reported as being sufficient for the detection
240 of DNA adducts in target tissues and WBC of rats exposed to BaP, a referent genotoxic,via intratracheal, dermal or oral routes [17]. However, no equivalent kinetic data on DNA
22.7 20
0
20
40
60
80
100
120S1
S3
1.92.8
42.9
20
0
5
10
15
20
(a)
(b)
Triazoles subgroup Chlorothalonil subgroup
Triazolessubgroup
Chlorothalonilsubgroup Fruit growers
Fruit growersOpen-field farmers
RA
L (
×1010
)
Figure 3. Individual RAL (mean of repeated experiments) (�10�10) for the groups of farmers(S1 samples: black diamonds; S3 samples: open squares). White symbols indicate the mean RAL/group/time point. The corresponding value is given. (a) all values; (b) values lower than 20� 10�10.
DNA adduct levels in open-field farmers and fruit growers 9

New XML Template (2006) [26.8.2006–5:28pm] [1–15]{TANDF_FPP}Gtec/GTEC_A_195113.3d (GTEC) [First Proof]
Table V. Exposure variables (collected through face by face questionnaire forfruit growers) used to assess relationships with DNA adducts levels measured inS1 sample for 27 fruit growers (two smokers excluded).
Variables
Month of the studya
Age of the farmersb
Number of years in farm-owningb
Number of years of herbicide useb
Number of years of insecticide useb
Number of years of fungicide useb
Total farm areab
Farm area devoted to cropsb
Farm area devoted to fruit growingb
Farm area devoted to tree applesb
Number of days since the last pesticide use before the S1 sampleb
Area sprayed with pesticides the day of the last useb
Vegetables consumption the day before the first blood samplea
Fruit consumption the day before the first blood samplea
Fruit juice consumption the day before the first blood samplea
aStudent’s test or ANOVA.bLinear regression.
Table IV. Exposure variables (X, collected through face by face questionnaire)used to assess relationships with DNA adducts levels changes between S1 andS3 samples (RALS3¼RALS1þX) for 27 fruit growers (two smokers excluded).
Variables concerning the day of the study
Formulation of the commercial product of captan (powder, etc.)a
Number of kg of commercial product used during the day of the studyb
Number of kg of captan used by hectareb
Concentration of captan used by hectareb
Volume of preparation sprayed/hectareb*Sprayer calibrated: yes/noa
Presence of cabin in the tractora: yes/noType of nozzles in the sprayera
Number of litres of the spraying tankb
Time duration of mixing-loading tasksb
Number of spraying tank filled (�3 or >3)a
Time duration of applicationb
Area sprayed with captanb
Total area sprayedb
Duration of sprayer cleaning (�9 min or >10 min)a*Wind speed: absence/moderatea
United Kingdom Predictive Operator Exposure Model (UK-POEM)b
Personal protective equipment
Glovesa
Maska
Waterproof coveralla
Hata
aStudent’s test or ANOVA for categorical variables.bLinear regression for continuous variables.*Significant positive relationship (p < 0.05).
10 V. Andre et al.
New XML Template (2006) [26.8.2006–5:28pm] [1–15]{TANDF_FPP}Gtec/GTEC_A_195113.3d (GTEC) [First Proof]
adduct formation are available after human occupational exposure to pesticides. Half-liveswere available in the literature for some pesticides. They were determined in rodents,most often after oral or I.P. administration route. For example, the half-life of chlorothalonil
245 was estimated between 6 and 8h in rat, following oral administration. After 24 h, urinaryexcretion was greater than 90% for a dose of 5 mg kg body weight�1. The present study wasperformed on occupationally exposed farmers, mainly with cutaneous penetration route.Even if half-lives available in the literature were not directly transposable to farmers,samples were performed within a 24 h interval. One must keep in mind, however, that
250 this interval could be too short to allow absorption, distribution, possible metabolism andfinally interaction with target DNA, resulting in adduct production. Moreover, farmerswere sampled during a period of intensive pesticide use and therefore were not free ofexposure before sampling. It is possible that DNA adducts were already generatedconsequent to previous exposure, leading to a steady state for this biomarker, at least for the
255 triazoles subgroup.Among open-field farmers, mean RAL was doubled between S1 and S3 in the subgroup
who sprayed chlorothalonil associated mainly with insecticides. For these eight farmersincluded in a larger group (n¼16), urine mutagenicity (Ames test) and DNA damage(Comet assay) were already evaluated with the same chronology (S1 and S3) for urine and
260 blood sampling [3,25]. Between the two blood samples, significant increase of DNAdamage levels measured by the comet assay was reported, and the magnitude of thesemodifications was correlated with two exposure parameters (the area sprayed between S1and S3 and the number of tanks used). For urine mutagenicity, the proportion of mutagenicsamples increased from S1 to S3 among nonsmokers (n¼ 10). The small size of the
265 chlorothalonil subgroup was a clear limit for the interpretation of DNA adduct variations.However, the converging observations with two different biomarkers (DNA adducts andurine mutagenicity) and the significant relationship obtained with the third (DNA damagemeasured by the comet assay), associated with significant correlation with exposurevariables, may lead to the assumption of a genotoxic impregnation in relation with
270 occupational exposure among farmers included in this subgroup.The results among fruit growers were clearly in contrast with those of the chlorothalonil
subgroup. Fruit growers were also previously analysed for urine mutagenicity, and for 12of them, induction of lymphocyte DNA damage was measured (comet assay) [26].No significant variations were found between S1 and S3 for DNA damage. The proportion
275 of mutagenic urine samples did not vary between the two time points. Overall, nomodifications in the levels of the three biomarkers (urine mutagenicity, DNA adducts andDNA damage) were observed between S1 and S3. Thus, 1-day exposure of fruit growers tocaptan and associated pesticides did not lead to a detectable modification of the genotoxicresponse. These data are in contrast to the fact that captan and some structurally close
280 phthalimides were found to be genotoxic in some experimental models.Mean RALS1 were significantly higher among open-field farmers compared to fruit
growers, but this difference was mainly attributable to the triazoles subgroup. The latter wassampled earlier in the season (March–April), and it may be assumed that these higher DNAadduct levels were attributable to previous exposures to pesticides. If blood cells bearing the
285 highest levels of damage were eliminated, DNA adduct levels consequently decreased closeto those observed among open-field farmers sampled a few weeks later (chlorothalonilsubgroup) as well as in fruit growers. These data suggest seasonal variations in DNA adductlevels in relation to pesticide exposure are in agreement with results recently publishedby our group [24]. A significant increase of DNA adduct level was observed at the time
290 of heavy pesticide use, exclusively among farmers, compared to the non exposed
DNA adduct levels in open-field farmers and fruit growers 11
New XML Template (2006) [26.8.2006–5:28pm] [1–15]{TANDF_FPP}Gtec/GTEC_A_195113.3d (GTEC) [First Proof]
period (winter). DNA adduct levels measured for non exposed group and for farmerssampled after several weeks free of exposure to pesticides were similar to those measured inthe present study for fruit growers and chlorothalonil subgroups. Samples included in thepresent study and in that Le Goff et al. [24] were analysed by 32P-postlabelling in distinct
295 years, and the comparable levels observed reinforce the accuracy of our method.Roulland et al. [38] reported an increased BCL2-IGH prevalence together with a rise
in the frequency of BCL2-IGH-bearing cells in a population of 56 open-field farmers.A relationship with occupational exposure to pesticides was suggested since this biomarkerwas elevated especially during the high pesticide use period and correlated with farm area
300 devoted to crops. Interestingly, this biomarker of early effect was the most frequentchromosomal translocation involved in non-Hodgkin’s lymphoma, one of the diseasesfound in excess among farmers.
For fruit growers, despite the lack of significant variations between the mean RALS3 andthe mean RALS1 for the whole group, some interindividual variations were observed and
305 correlations with exposure data collected through the questionnaires were tested.Variables for assessing occupational exposure to pesticides such as area sprayed, whole
quantities of pesticides used, duration of spraying operations or the wearing of protectiveclothing were not significantly related with RALS3. The detailed description of the practicesobtained through the questionnaire allowed the use of a second set of parameters. The
310 duration of sprayer cleaning and the volume of pesticides sprayed per acre were positivelylinked to the DNA adduct levels.
Quantitative results were classically expressed in RAL, but the method used for thiscalculation is not standardised, i.e. largely depending on radioactivity measured in parallelin total nucleotides or in dAp samples. These values and the protocols applied to obtain
315 them are rarely presented with details in publications, although they largely account forinterlaboratory variations. Nevertheless, our data was compared with the two studiesdealing with occupational exposure to pesticides [30,32]. Overall, for 39/48 pairs of samples(81%), DNA adducts were detected in the two blood samples S1 and S3, with levelsranging from 0.1 to 109.6 adducts for 1010 normal nucleotides. Peluso et al. [32] reported a
320 range of DNA adducts between 17 and 310� 10�10 among Ligurian floriculturists, and in asecond study the mean RAL was 85� 10�10 [30]. Among farmers included in the presentstudy, the mean RALS1 were 1.9, 2.9 and 22.7�10�10 depending on the group orsubgroup considered. Thus, DNA adducts were detected more frequently (81 vs. 42%), butwith somewhat lower intensity. The working conditions were notably different for farmers
325 in the present study compared to the floriculturist groups. Potentially higher exposure maybe assumed for the latter due to (1) closed greenhouse environment, (2) frequent manualcontact with contaminated flowers or foliar surface and (3) continuous production offlowers without seasonal variations or rest. In our study, farmers mainly used a variety offungicides in contrast with floriculturists who applied more insecticides.
330 Globally, RAL levels measured in a pesticide exposure context were lower than thosereported in many other occupational studies dealing mainly with polycyclic aromatichydrocarbons (PAH) exposures [23], even in an environmental context such as for theEuropean Prospective Investigation into Cancer and Nutrition (EPIC) study [31]. Severalexplanations are possible. Pesticides consist in a very large class of chemicals (more than
335 900 pesticides are used world-wide) and less than 60 have been evaluated by IARC andclassified mainly 2B or 3, in contrast with PAH or many aromatic amines which areclassified 1 or 2A. Levels of occupational exposure to pesticides are thought to be lowerthan occupational exposure to PAH, as most of the time it is sequential (at least in open-field farming and fruit growing), a situation that is different compared to continuous
12 V. Andre et al.
New XML Template (2006) [26.8.2006–5:28pm] [1–15]{TANDF_FPP}Gtec/GTEC_A_195113.3d (GTEC) [First Proof]
340 occupational exposure to PAH (coke oven workers for example). Moreover, it is generallyaccepted that farmers have a priori better living conditions (healthy lifestyle, lowerfrequency of smoking, physical activity, outdoor work and healthier food).
In conclusion, the present study underlines the interest of a comparative approachincluding several groups of farmers, reflecting various classes of pesticides used through
345 different agricultural practices. It also stresses the interest of the evaluation of multiplebiomarkers, applied on biological samples obtained under real occupational exposureconditions, in particular, after the use of pesticide mixtures. However, on the other hand,due to the complexity and the diversity of pesticides used, it would be a difficult task toincriminate any specific molecule when a biological response is observed.
350 Acknowledgments
The helpful collaboration of the Chambre Departementale d’Agriculture du Calvados(Mr Soulas and Mr Dupont), the Association de Coordination Technique Agricole(Mr Beaufreton) and the Cooperative agricole SICOLY (Mr Massardier) in the enrolmentof farmers is acknowledged. We thank the nurses who collected blood samples at home,
355 and Miss Bardou and Miss Brouet for interviews with fruit growers. We are grateful toMrs Bernaud and Mrs Durand and to Mr Devaux and Mr Severin for their implication inthe study undertaken with fruit growers. Lastly, we particularly thank O. and F. Perinfor their invaluable technical and scientific assistance on 32P postlabelling.
Financial support was obtained from Ligue Nationale Contre le Cancer (Comites du360 Calvados, du Rhone et de la Manche), Association pour la Recherche sur le Cancer (ARC),
Union des Industries pour la Protection des Plantes (UIPP), Conseil General du Calvados(CG14). J. Le Goff was a recipient of a fellowship from the Ligue Nationale Contre leCancer (Comite du Calvados) and from the Conseil Regional de Basse-Normandie.
References
365 1. Acquavella J, Olsen G, Cole P, Ireland B, Kaneene J, Schuman S, Holden L. Cancer among farmers: A meta-analysis. Ann. Epidemiol. 1998;8:64–74.
2. Alavanja MC, Samanic C, Dosemeci M, Lubin J, Tarone R, Lynch CF, Knott C, Thomas K, Hoppin JA,Barker J, Coble J, et al. Use of agricultural pesticides and prostate cancer risk in the Agricultural Health Studycohort. Am. J. Epidemiol. 2003;157:800–814.
370 3. Andre V, Lebailly P, Pottier D, Deslandes E, De Meo M, Henry-Amar M, Gauduchon P. Urine mutagenicityof farmers occupationally exposed during a one-day use of chlorothalonil and insecticides. Int. Arch. Occup.Environ. Health. 2003;76:55–62.
4. Beach AC, Gupta RC. Human biomonitoring and 32 P-postlabeling assay. Carcinogenesis1992;13:1053–1074.
375 5. Blair A, Zahm SH, Pearce NE, Heineman EF, Fraumeni JF. Clues to cancer etiology from studies of farmers.Scand. J. Work. Environ. Health 1992;18:209–215.
6. Blair A, Zahm SH. Agricultural exposures and cancer. Environ. Health. Perspect. 1995;103(suppl. 8):205–208.
7. Bolognesi C, Peluso M, Degan P, Rabboni R, Munnia A, Abbondandolo A. Genotoxic effects of the carbamate380 insecticide, methomyl. II In vivo studies with pure compound and the technical formulation Lannate 25.
Environ. Mol. Mutagen. 1998;24:235–242.8. Bolognesi C. Genotoxicity of pesticides: A review of human biomonitoring studies. Mutat. Res.
2003;543:251–272.9. Bolognesi C, Landini E, Perrone E, Roggieri P. Cytogenetic biomonitoring of a floriculturist population in
385 Italy: Micronucleus analysis by fluorescence in situ hybridization (FISH) with an all-chromosome centromericprobe. Mutat. Res. 2004;557:109–117.
DNA adduct levels in open-field farmers and fruit growers 13
proofreader
4

New XML Template (2006) [26.8.2006–5:28pm] [1–15]{TANDF_FPP}Gtec/GTEC_A_195113.3d (GTEC) [First Proof]
10. Dearfield KL, Stack HF, Quest JA, Whiting RJ, Waters MD. A survey of EPA/OPP and open literature dataon selected pesticide chemicals tested for mutagenicity. I. Introduction and first ten chemicals. Mutat. Res.1993;297:197–233.
390 11. Dearfield KL, McCarroll NE, Protzel A, Stack HF, Jackson MA, Waters MD. A survey of EPA/OPPand open literature data on selected pesticide chemicals. II. Mutagenicity and carcinogenicity of selectedchloroacetanilides and related compounds. Mutat. Res. 1999;443:183–221.
12. Dubois M, Grosse Y, Thome JP, Kremers P, Pfohl-Leszkowicz A. Metabolic activation and DNA adductsdetection as biomarkers of chlorinated pesticides exposures. Biomarkers 1997;2:17–24.
395 13. Environmental Protection Agency (EPA). Captan special review position, Document 2/3. Washington: USEnvironmental Protection Agency; 1985.
14. Garaj-Vrhovac V, Zeljezic D. Cytogenetic monitoring of Croatian population occupationally exposed to acomplex mixture of pesticides. Toxicology 2001;165:153–162.
15. Garaj-Vrhovac V, Zeljezic D. Assessement of genome damage in a population of Croatian workers employed400 in pesticides production by chromosomal aberration analysis, micronucleus assay and Comet assay. J. Appl.
Toxicol. 2002;22:249–255.16. Garrett NE, Stack HF, Quest JA, Whiting RJ, Waters MD. Evaluation of the genetic activity profiles of
65 pesticides. Mutat. Res. 1986;168:301–325.17. Godschalk R, Moonen E, Schilderman P, Broekmans W, Kleinjans J, Schooten F. Exposure route dependent
405 DNA adduct formation by polycyclic aromatic hydrocarbons. Carcinogenesis 2000;1:87–92.18. Grover P, Danadevi K, Mahboob M, Rozati R, Banu BS, Rahman MF. Evaluation of genetic damage in
workers employed in pesticide production utilizing the Comet assay. Mutagenesis 2003;18:201–205.19. Hardell L, Eriksson M. A case-control study of non-Hodgkin lymphoma and exposure to pesticides.
Cancer 1999;6:1353–1360.410 20. Hasegawa R, Cabral R, Hoshiya T, Hakoi K, Ogiso T, Boonyaphiphat P, Shirai T, Ito N. Carcinogenic
potential of some pesticides in a medium-term multi-organ bioassay in rats. Int. J. Cancer. 1993;54:489–493.21. IARC. Monographs on the evaluation of carcinogenic risks to humans. Occupational exposures in insecticide
application, and some pesticides. Vol. 3. Lyon: IARC Scientific publications, 1991; p. 535.22. IARC. Monographs on the evaluation of carcinogenic risks to humans. Some chemicals that cause tumours of
415 the kidney or urinary bladder in rodents and some other substances. Summary of Data Reported andEvaluation. Vol. 73. Lyon: IARC Scientific publications; 1999. pp 183–193.
23. Kriek E, Rojas M, Alexandrov K, Bartsch H. Polycyclic aromatic hydrocarbon – DNA adducts in humans:Relevance as biomarkers for exposure and cancer risk. Mutat. Res. 1998;400:215–231.
24. Le Goff J, Andre V, Lebailly P, Pottier D, Perin F, Perin O, Gauduchon P. Seasonal variations of DNA-420 adduct patterns in open-field farmers handling pesticides. Mutat. Res. 2005;587:90–102.
25. Lebailly P, Vigreux C, Lechevrel C, Ledemeney D, Godard T, Sichel F, Le Talaer JY, Henry-Amar M,Gauduchon P. DNA damage in mononuclear leukocytes of farmers measured using the alkaline comet assay:Modifications of DNA damage levels after a one-day field spraying period with selected pesticides.Cancer Epidemiol. Biomarkers Prev. 1998;7:929–940.
425 26. Lebailly P, Devaux A, Pottier D, De Meo M, Andre V, Baldi I, Severin F, Bernaud J, Durand B,Henry-Amar M, Gauduchon P. Urine mutagenicity and lymphocyte DNA damage in fruit growersoccupationally exposed to the fungicide captan. Occup. Environ. Med. 2003;60:910–917.
27. Lee WJ, Hoppin JA, Blair A, Lubin JH, Dosemeci M, Sandler DP, Alavanja MC. Cancer incidence amongpesticide applicators exposed to alachlor in the Agricultural Health Study. Am. J. Epidemiol.
430 2004;159:373–380.28. Maroni M, Fait A. Health effects in man from long-term exposure to pesticides. A review of the 1975–1991
literature. Toxicology 1993;78:105–112.29. Maroni M, Colosio C, Ferioli A, Fait A. Biological monitoring of pesticide exposure: A review. Introduction.
Toxicology 2000;143:5–8.435 30. Munnia A, Puntoni R, Merlo F, Parodi S, Peluso M. Exposure to agrochemicals and DNA adducts in western
Liguria, Italy. Environ. Mol. Mutagen. 1999;34:52–56.31. Palli D, Russo A, Masala G, Saieva C, Guarrera S, Carturan S, Munnia A, Matullo G, Peluso M. DNA
adduct levels and DNA repair polymorphisms in traffic-exposed worker and a general population sample.Int. J. Cancer 2001;94:121–127.
440 32. Peluso M, Merlo F, Munnia A, Bolognesi C, Puntoni R, Parodi S. 32P-postlabeling detection of DNAadducts in peripheral white blood cells of greenhouse floriculturists from western Liguria, Italy. CancerEpidemiol. Biomarkers Prev. 1996;5:361–369.
33. Peluso M, Munnia A, Bolognesi C, Parodi S. 32P-postlabeling detection of DNA adducts in mice treated withthe herbicide Roundup. Environ. Mol. Mutagen. 1998;31:55–59.
14 V. Andre et al.
New XML Template (2006) [26.8.2006–5:28pm] [1–15]{TANDF_FPP}Gtec/GTEC_A_195113.3d (GTEC) [First Proof]
445 34. Peluso M, Bolognesi C, Munnia A, Landini E, Parodi S. In vivo studies on genotoxicity of a soil fumigant,Dazomet. Environ. Mol. Mutagen. 1998;32:179–184.
35. Petrelli G, Siepi G, Miligi L, Vineis P. Solvents in pesticides. Scand. J. Work. Environ Health 1993;19:63–65.36. Piperakis SM, Petrakou E, Tsilimigaki S, Sagnou M, Monogiudis E, Haniotakis G, Karkaseli H, Sarikaki E.
Biomonitoring with the Comet assay of Greek greenhouse workers exposed to pesticides. Environ. Mol.450 Mutagen. 2003;41:104–110.
37. Reddy MV, Randerath K. Nuclease P1 mediated enhancement of sensitivity of 32P-postlabeling test forstructurally diverse DNA adducts. Carcinogenesis 1986;7:1543–1551.
38. Roulland S, Lebailly P, Lecluse Y, Briand M, Pottier D, Gauduchon P. Characterization of the t(14;18)BCL2-IGH translocation in farmers occupationally exposed to pesticides. Cancer Res. 2004;64:2264–2269.
455 39. Ruiz MJ, Marzin D. Genotoxicity of six pesticides by Salmonella mutagenicity test and SOS chromotest.Mutat. Res. 1997;390:245–255.
40. Shah RG, Lagueux J, Kapur S, Levallois P, Ayotte P, Tremblay M, Zee J, Poirier G. Determination ofgenotoxicity of the metabolites of the pesticides Guthion, Sencor, Lorox, Reglone, Daconil and Admire by32P-postlabeling. Mol. Cell. Biochem. 1997;169:177–184.
460 41. Shane BS, Scarlett-Kranz JM, Shaw Reid W, Lisk DJ. Mutagenicity of urine from greenhouse workers.J. Toxicol. Environ. Health 1998;24:429–437.
42. Snyder RD. Effects of captan on DNA and DNA metabolic process in human diploid fibroblasts.Environ. Mol. Mutagen. 1992;20:127–133.
DNA adduct levels in open-field farmers and fruit growers 15