
EVALUATING TREATMENT PROCESS OF PRODUCED WATER FROM OIL/GAS PRODUCTION PLATFORM WITH SCALE INHIBITOR
11
International Journal of Chemical and Process Engineering Research, 2014, 1(12): 121-131 *Corresponding Author 121 EVALUATING TREATMENT PROCESS OF PRODUCED WATER FROM OIL/GAS PRODUCTION PLATFORM WITH SCALE INHIBITOR Ujile, Awajiogak A. 1 * --- Dagde, Kenneth, K. 2 1,2 Department of Chemical/ Petrochemical Engineering, Rivers State University of Science and Technology, Port Harcourt, Nigeria ABSTRACT Treatment of produced water from a crude oil production platform with a flow rate of 11,000 to 13,000 barrel per day (API 34 o at 49 o C) was carried out to determine optimum concentration of the injection rate of scale inhibitor before discharge overboard. The physico-chemical properties of the produced water were determined. A GBC Scientific Avanta Programmable A6080 Atomic Absorption Spectrometer (AAS) was used to determine the cations while Analytical Method was adopted to determine the concentration of anions, conductivity, alkalinity, hardness, suspended solids, and the pH of the produced water. Results showed that conductivity, alkalinity, hardness, suspended solids decrease with increase in the concentration of the scale inhibitor. At 0 ppm of scale inhibitor, hardness was 1100 mg (CaC0 3 ) per litre of produced water and at 8.6 ppm hardness reduced to 800 mg (CaC0 3 ) per litre of produced water indicating that increasing the dosage of the scale inhibitor prevents scale formation. However, optimum dosage value is required to minimize the cost of production processes. © 2014 Pak Publishing Group. All Rights Reserved. Keywords: Produced water, Treatment, Scale formation inhibitor, Crude oil production. Contribution/ Originality This work applies the concept of kinetic equilibrium in converting anions and cations encountered in produced water from oil/gas wells which form scales causing corrosion to delineate pipeline problems associated with production platforms. Optimum scale inhibitor dosage was established in the evaluation. This perhaps could affect economic value of the production process. International Journal of Chemical and Process Engineering Research journal homepage: http://pakinsight.com/?ic=journal&journal=65
Transcript of EVALUATING TREATMENT PROCESS OF PRODUCED WATER FROM OIL/GAS PRODUCTION PLATFORM WITH SCALE INHIBITOR
International Journal of Chemical and Process Engineering Research, 2014, 1(12): 121-131
*Corresponding Author
121
EVALUATING TREATMENT PROCESS OF PRODUCED WATER FROM
OIL/GAS PRODUCTION PLATFORM WITH SCALE INHIBITOR
Ujile, Awajiogak A.1* --- Dagde, Kenneth, K.
2
1,2Department of Chemical/ Petrochemical Engineering, Rivers State University of Science and Technology, Port Harcourt,
Nigeria
ABSTRACT
Treatment of produced water from a crude oil production platform with a flow rate of 11,000 to
13,000 barrel per day (API 34o
at 49 o
C) was carried out to determine optimum concentration of
the injection rate of scale inhibitor before discharge overboard. The physico-chemical properties
of the produced water were determined. A GBC Scientific Avanta Programmable A6080 Atomic
Absorption Spectrometer (AAS) was used to determine the cations while Analytical Method was
adopted to determine the concentration of anions, conductivity, alkalinity, hardness, suspended
solids, and the pH of the produced water. Results showed that conductivity, alkalinity, hardness,
suspended solids decrease with increase in the concentration of the scale inhibitor. At 0 ppm of
scale inhibitor, hardness was 1100 mg (CaC03) per litre of produced water and at 8.6 ppm
hardness reduced to 800 mg (CaC03) per litre of produced water indicating that increasing the
dosage of the scale inhibitor prevents scale formation. However, optimum dosage value is required
to minimize the cost of production processes.
© 2014 Pak Publishing Group. All Rights Reserved.
Keywords: Produced water, Treatment, Scale formation inhibitor, Crude oil production.
Contribution/ Originality
This work applies the concept of kinetic equilibrium in converting anions and cations
encountered in produced water from oil/gas wells which form scales causing corrosion to delineate
pipeline problems associated with production platforms. Optimum scale inhibitor dosage was
established in the evaluation. This perhaps could affect economic value of the production process.
International Journal of Chemical and Process
Engineering Research
journal homepage: http://pakinsight.com/?ic=journal&journal=65

International Journal of Chemical and Process Engineering Research, 2014, 1(12): 121-131
122
1. INTRODUCTION
Produced water is a complex mixture of organic and inorganic compounds and the largest
volume of byproduct generated during oil and gas recovery operations, [1]. Globally, produced
water production is estimated at around 250 million barrels per day compared with around 80
million barrels per day of oil. Consequently, produced water to oil ratio is around 3: 1, that is to say
water cut stands at about 70%. Produced water production has risen since decades ago and
continues to rise because of consistent increase in crude oil exploitation in Nigeria. Produced water
is driven up by maturing of oil fields but driven down by better management methods and
introduction of new oil fields [2] [3]. The factors that affect the production volume of produced
water production amongst others are: method of well drilling, location of well within homogeneous
or heterogeneous reservoirs, different types of completion, types of separation techniques, water
injection or water flooding for enhancing recovery, poor mechanical integrity and underground
communication [4], [5], [6]. Some factors such as geological location of the field, its geological
formation, lifetime of the reservoirs, and type of hydrocarbon product being produced affect the
physical and chemical properties of produced water [7], [8]. Produced water characteristics depend
on the nature of the producing| storage formation from which they are withdrawn, the operational
conditions and chemicals used in process facilities. The composition of produced water from
different sources varies by order of magnitude. However, produced water composition is
qualitatively similar to oil / or gas production [9]; [10]; [11]. The major compounds of produced
water include: dissolved and dispersed oil compounds, dissolved formation minerals, production
chemical compounds, production solids ( including formation solids, corrosion and scale products,
bacteria, waxes, asphaltenes), and dissolved gases [12]. Treatment of produced water is an effective
option for produced water management. Treatment of produced water has the potential to be a
harmless and valuable product rather than a waste.
It is important to analyze the constituents of the produced water before beginning a water flood
operation to avoid chemical reactions that may form precipitates. If necessary, treatment chemicals
can minimize undesired reactions. Bacteria, algae, and fungi can be present in produced water or
can be introduced during water handling processes at the surface. These are generally controlled by
adding biocides or by filtration [13].
1.1. Oil/Water Separation
When reservoir fluids (gas/oil/water) are brought to the surface for separation and treatment,
the pressure is reduced and this sometimes results in the formation of insoluble scales. In simple
terms the reduction in pressure allows soluble bicarbonates to be converted to the carbonate ion
with the release of CO2 gas:
2HCO3- CO3
2- + CO2 + H2O (1)
The carbonate ion combines with any calcium ions, for example, to form insoluble carbonate
scales. Not only can this result in reduced flow rates (loss of revenue) but this can have an adverse
effect on system integrity and needs to be addressed. Inhibition of scale formation can be achieved
International Journal of Chemical and Process Engineering Research, 2014, 1(12): 121-131
123
by dosing a scale inhibitor chemical to the reservoir fluids while these are still at high pressure
[14].
It is the aim of this study to ascertain the produced water treatment chemical performance and
evaluate optimal chemical injection rate to reduce cost of chemical consumption and ensure
effective performance of scale inhibitors. This is aimed at preventing scale formation in the
produced water pipeline.
2. MATERIALS AND METHODS
2.1. Sample Collection and Preparation
The produced water was collected in a sterilized one litre sample bottle from the floatation cell
outlet of a production platform in Niger Delta, Nigeria and taken to the laboratory in a cooler
containing ice cubes wrapped in cellophane bag to reduce the temperature of the sample and to
inhibit bacteria growth in the produced water as most bacteria grow best between 200C to 30
0C.
Preservation of the sample was done in accordance with the stipulated standard in the annual book
of ASTM and by American Society Testing and Materials.
2.2. Determination of Physico-Chemical Properties
Materials: Computer, GBC Scientific Avanta Programmable A6600 Atomic Absorption
Spectroscopy (AAS) used for determination of the following cations in solution: Iron (Fe),
Magnesium (Mg), Sodium (Na), Barium (Ba), Calcium (Ca), Lead (Pb), Mercury (Hg), and
Cromium (Cr). Practical analytical methods were used to determine the following anions: Chloride
(Cl-) API-RP45, Sulphate (S04
2-) APHA-427C, Hydrogen Carbonate (HC03
-) API-RP45, Hydrogen
Sulphide (H2S) API-RP45, Carbon Dioxide (C02) API-RP45, Carbonate (C032-
) API-RP45. Other
test conducted include: Conductivity APHA 145, Hardness APHA 122B, Alkalinity APHA 403,
pH API-RP45, Total Suspended Solid APHA 208D.
Procedure: The GBC Scientific Avanta A6080 AAS icon on the computer was double clicked
to launch the page. Sub directory/folder for metals to be analyzed was created. The logged data
were saved in the respective modules where they have been created. The test wavelength, module,
flame, lamp current sensitivity was selected for the test to run. Acetylene/air burner was lit which
produced a flame with temperature range 2100 - 24000C. Produced water sample was introduced
into the AAS nebulizer through an aspirator tube attached to the nozzle at one end and other
submerged in the produced water in beaker at the other end. The flame from the burner heats up the
AAS nebulizer which concerts the sample in it into a mist made of tiny droplets. The nebulizer
sprays the liquid droplets on the hot flame which atomizes it. Then light from a hollow cathode
lamp was aligned to the atomized metal in the spray chamber where the light energy of a given
wavelength was absorbed to promote the electrons of the AAS calibration curve of standard
concentration at equivalent absorbance to obtain the concentration of the metal ion interest.
Deuterium lamp (D2) adjustment and setting were used to prevent interference to the metal
analyzed from the system and for background correction. Part of the precaution of the test was to

International Journal of Chemical and Process Engineering Research, 2014, 1(12): 121-131
124
ensure that the burner head was clean and free from debris. This was done with aid of a burner
cleaning card. The results obtained were printed from the computer attached to the AAS. The
following setting was maintained for the corresponding metals analyzed:
Table-1. AAS settings for metal ion determination
Element Wavelength
(Nm)
Slit
Width
(Nm)
Sensitivity
(µg/Ml)
Lamp
Current
(Ma)
Gas Used
Ca 442.7 0.5 0.02 10 Air +
acetylene
Ba 553.6 0.5 0.18 15.0 Same
Na 589.6 0.5 0.008 5 Same
Mg 202.6 1 0.003 3 Same
Mn 279.5 0.2 0.02 5 Same
Pb 217 1 0.06 5 Same
Fe 248.3 0.2 0.05 7 Same
Cr 357.9 0.2 0.05 6 Same
3. RESULTS AND DISCUSSIONS
Table 2 shows the results obtained from laboratory analysis of treatment of produced water
using scale inhibitor Nalco 6080A chemical. Different injection rate of scale inhibitor ranging from
0ppm to 8.6ppm were used to determine the optimum concentration rate at various produced water
flow rate for test period of 6 days at intervals of 24 hours. The results of the various physico-
chemical parameters are presented in Table 2
Table-2. Results of the various physico-chemical parameters of the analysis.
Components 0ppm 2.1ppm 3.9ppm 5.5ppm 7.2ppm 8.6ppm
24hrs 24hrs 24hrs 24hrs 24hrs 24hrs
Field Test Field Test Field
Test
Field
Test
Field Test Field
Test
13560bwpd 13389bw
pd
13278b
wpd
13580bw
pd
13498bwp
d
13293b
wpd
Na (mg/l) 7870.6 7870.8 7880.6 7887.6 7888.4 7890.5
Ca (mg/l) 28.6 28.9 29.0 29.1 29.5 29.7
Fe (mg/l) 0.155 0.155 0.155 0.155 0.155 0.161
Mg (mg/l) 43.2 43.2 43.2 43.2 43.2 45.6
Pb (mg/l) 0.18 0.182 0.185 0.189 0.189 0.19
Cond (uS/cm) 24000 21750 18000 17560 17120 16350
Hardness
(mg(CaCO3)/l)
11000 10980 10754 9500 970 800
Alkalinity
(mg(CaCO3)/l)
25 23.5 23 23 21 20
pH 7.8 7.6 7.6 7.3 7.3 7.5
Cr (mg/l) 0.05 0.05 0.05 0.05 0.05 0.05
Ba (mg/l) 12.85 12.85 12.88 12.89 12.89 12.9
Hg (mg/l) 0.56 0.56 0.56 0.56 0.57 0.56
Suspended solid 460 456 450 432 423 410
Continue
International Journal of Chemical and Process Engineering Research, 2014, 1(12): 121-131
125
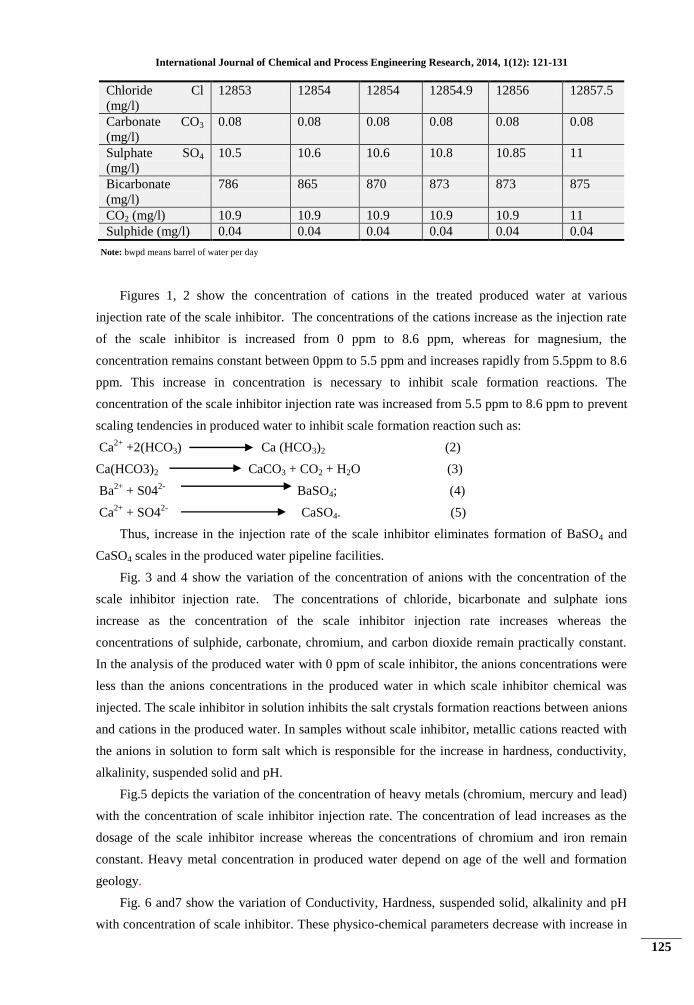
Chloride Cl
(mg/l)
12853 12854 12854 12854.9 12856 12857.5
Carbonate CO3
(mg/l)
0.08 0.08 0.08 0.08 0.08 0.08
Sulphate SO4
(mg/l)
10.5 10.6 10.6 10.8 10.85 11
Bicarbonate
(mg/l)
786 865 870 873 873 875
CO2 (mg/l) 10.9 10.9 10.9 10.9 10.9 11
Sulphide (mg/l) 0.04 0.04 0.04 0.04 0.04 0.04
Note: bwpd means barrel of water per day
Figures 1, 2 show the concentration of cations in the treated produced water at various
injection rate of the scale inhibitor. The concentrations of the cations increase as the injection rate
of the scale inhibitor is increased from 0 ppm to 8.6 ppm, whereas for magnesium, the
concentration remains constant between 0ppm to 5.5 ppm and increases rapidly from 5.5ppm to 8.6
ppm. This increase in concentration is necessary to inhibit scale formation reactions. The
concentration of the scale inhibitor injection rate was increased from 5.5 ppm to 8.6 ppm to prevent
scaling tendencies in produced water to inhibit scale formation reaction such as:
Ca2+
+2(HCO3) Ca (HCO3)2 (2)
Ca(HCO3)2 CaCO3 + CO2 + H2O (3)
Ba2+
+ S042-
BaSO4; (4)
Ca2+
+ SO42-
CaSO4. (5)
Thus, increase in the injection rate of the scale inhibitor eliminates formation of BaSO4 and
CaSO4 scales in the produced water pipeline facilities.
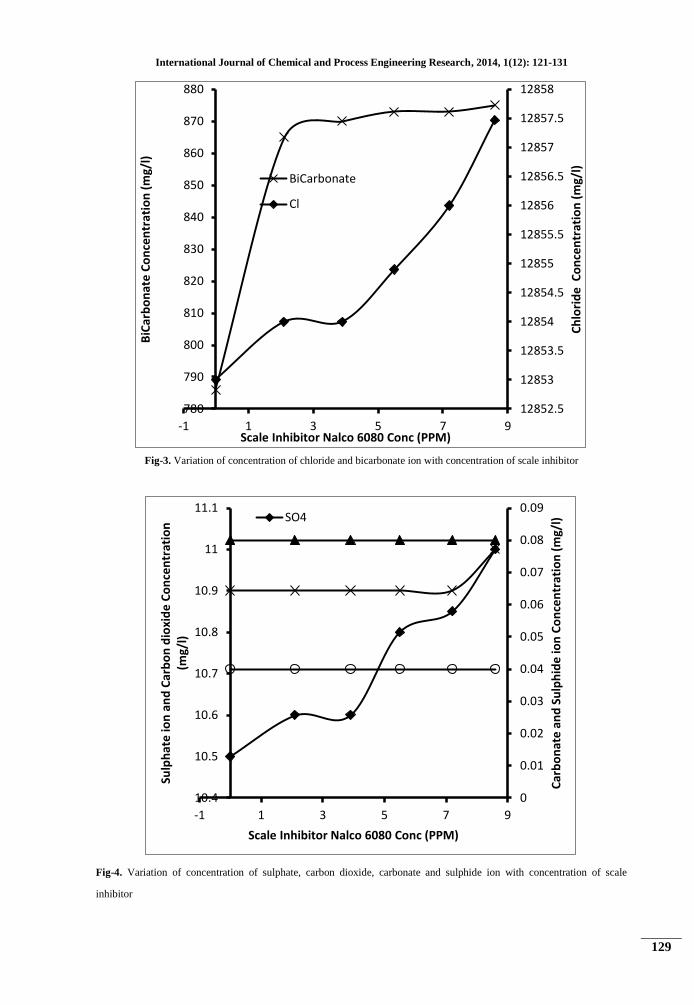
Fig. 3 and 4 show the variation of the concentration of anions with the concentration of the
scale inhibitor injection rate. The concentrations of chloride, bicarbonate and sulphate ions
increase as the concentration of the scale inhibitor injection rate increases whereas the
concentrations of sulphide, carbonate, chromium, and carbon dioxide remain practically constant.
In the analysis of the produced water with 0 ppm of scale inhibitor, the anions concentrations were
less than the anions concentrations in the produced water in which scale inhibitor chemical was
injected. The scale inhibitor in solution inhibits the salt crystals formation reactions between anions
and cations in the produced water. In samples without scale inhibitor, metallic cations reacted with
the anions in solution to form salt which is responsible for the increase in hardness, conductivity,
alkalinity, suspended solid and pH.
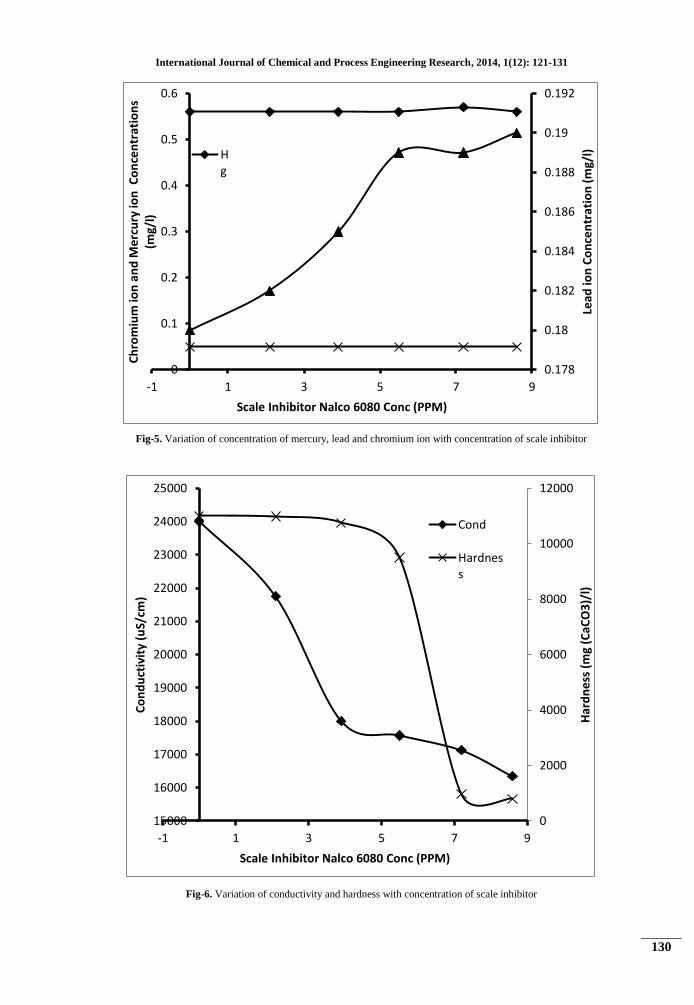
Fig.5 depicts the variation of the concentration of heavy metals (chromium, mercury and lead)
with the concentration of scale inhibitor injection rate. The concentration of lead increases as the
dosage of the scale inhibitor increase whereas the concentrations of chromium and iron remain
constant. Heavy metal concentration in produced water depend on age of the well and formation
geology.
Fig. 6 and7 show the variation of Conductivity, Hardness, suspended solid, alkalinity and pH
with concentration of scale inhibitor. These physico-chemical parameters decrease with increase in
International Journal of Chemical and Process Engineering Research, 2014, 1(12): 121-131
126
the concentration of the scale inhibitor except the pH which remains fairly constant. The initial
increase in the Conductivity, Hardness and suspended solid and alkalinity concentration emanate
from scale formation reactions.
4. CONCLUSION
Treatment of produced water from a crude oil production platform with a flow rate of 11,000
to 13,000 barrel per day was carried out to determine optimum concentration of the injection rate of
scale inhibitor before discharge overboard. The physico-chemical properties of the produced water
were determined. A GBC Scientific Avanta Programmable A6080 Atomic Absorption
Spectrometer (ASS) was used to determine the cations while Analytical Method was used to
determine the concentration of anions, conductivity, alkalinity, hardness, suspended solids, and the
pH of the produced water. Increase in the injection rate of Nalco 6080 from 0ppm to 8.6ppm
resulted in the reduction of the conductivity by 32% (24,000 to 16,350 us/cm), Hardness by 93%
(11,000 to 8000 mg(CaCO3) per litre of produced water, pH by 4% (7.8 to 7.5), Suspended solids
(460 to 410) and Alkalinity (25 to 20 mg(CaCO3)/l). The chloride content of 12,857mg/l is higher
than the recommended value of the Directorate of Petroleum Resources (DPR) a regulatory body in
Nigeria and therefore need further treatments. This work explains the controlling mechanism of
inhibitor application to reduce scale formation on structures transporting produced water. The
benefit is that environmental impact of the produced water, inhibitor is minimized. The results
obtained should be a guide to oil and gas operators to protect not only the environment but also to
reduce hazard of equipment failures.
REFERENCES
[1] E. T. Igunnu and G. Z. Chen, "Produced water treatment technologies," International Journal of
Low-Carbon Tech. Doi: 10.1093/ijlct/cts049, 2013.
[2] O. Lefebvre and R. Moletta, "Treatment of organic pollution in industrial saline wastewater; a
literature review," Water Resources, vol. 40, pp. 3671-3682, 2006.
[3] C. N. C. Ugochukwu and T. G. Leton, "Effluent monitoring of an oil servicing company and its
impact on the environment," AJEAM-RAGEE, vol. 8, pp. 27-30, 2004.
[4] Z. Khatib and P. Verbeek, "Water to value-produced water management for sustainable field
development of mature and green fields," presented at the In SPE International Conference on
Health, Safety and Environment in Oil and Gas Exploration and Production, Kuala Lampur,
Malaysia, 20 – 22 March, 2002.
[5] B. R. Hansen and S. H. Davies, "Review of potential technologies for the removal of dissolved
components from produced water," Chem. Eng. Res. Des., vol. 72, pp. 176-188, 1994.
[6] C. O. Orubu, A. Odusola, and W. Ehwarieme, "The Nigerian oil industry: Environmental
diseconomies, management strategies and the need for community involvement," J. Hum. Ecol.,
vol. 16, pp. 203-214, 2004.

International Journal of Chemical and Process Engineering Research, 2014, 1(12): 121-131
127
[7] B. M. Johnson, J. H. Kanagy, J. Rodgers, and J. W. Castle, "Chemical, physical, and risk
characterization of natural gas storage produced water," Water, Air, Soil Pollution, vol. 191, pp. 33-
54, 2008.
[8] W. Heins and D. Peterson, "Use of evaporation for heavy oil produced water treatment," Journal of
Canadian Petroleum Technology, vol. 44, pp. 26–30, 2005.
[9] S. E. Kakulu and O. Osibanjo, "Pollution studies of the Nigerian rivers. Trace metal levels of surface
water in Niger Delta area," International Journal of Environmental Studies Anal. Chem., vol. 30, pp.
209-217, 1991.
[10] R. O. Onah, "A review of the Nigerian petroleum industry and the associated environmental
problems," The Environmentalist, vol. 21, pp. 11-21, 2001.
[11] G. Onosode, Environmental issues and the challenges of the Niger Delta: Perspectives for the Niger
Delta environmental survey process. Lagos, Nigeria: CIBN Press, 2003.
[12] J. M. Neff, Bioaccumulation in marine organisms: Effect of contaminants from oil well produced
water. The Netherlands: Elsevier, 2002.
[13] J. A. Veil, M. G. Puder, D. Elcock, and R. J. Redweik, "A white paper describing produced water
from production of crude oil, natural gas and coal bed methane," presented at the Prepared for U.S.
Department of Energy, National Energy Technology Laboratory. (Under Contract W-31-109-Eng-
38), 2004.
[14] D. Robinson, "www.journals.elsevier.com/filtrationseparation/most-cited-articles," March 2010,
[Assessed 22 July 2014], vol. 47, pp. 20-22, 2010.

International Journal of Chemical and Process Engineering Research, 2014, 1(12): 121-131
128
Fig-1. Variation of concentration of sodium and magnesium with concentration of scale inhibitor
Fig-2. Variation of concentration of barium and calcium with concentration of scale inhibitor
7865
7870
7875
7880
7885
7890
7895
42.5
43
43.5
44
44.5
45
45.5
46
-1 1 3 5 7 9
Sod
ium
Co
nce
ntr
atio
n (
mg/
l)
Mag
ne
ssiu
m C
on
cen
trat
ion
(m
g/l)
Scale Inhibitor Nalco 6080 Conc (PPM)
MgNa
28.4
28.6
28.8
29
29.2
29.4
29.6
29.8
12.84
12.85
12.86
12.87
12.88
12.89
12.9
12.91
-1 1 3 5 7 9
Cal
ciu
m C
on
cen
trat
ion
(m
g/l)
Bar
ium
Co
nce
ntr
atio
n (
mg/
l)
Scale Inhibitor Nalco 6080 Conc (PPM)
Ba
Ca
International Journal of Chemical and Process Engineering Research, 2014, 1(12): 121-131
129
Fig-3. Variation of concentration of chloride and bicarbonate ion with concentration of scale inhibitor
Fig-4. Variation of concentration of sulphate, carbon dioxide, carbonate and sulphide ion with concentration of scale
inhibitor
12852.5
12853
12853.5
12854
12854.5
12855
12855.5
12856
12856.5
12857
12857.5
12858
780
790
800
810
820
830
840
850
860
870
880
-1 1 3 5 7 9
Ch
lori
de
Co
nce
ntr
atio
n (
mg/
l)
BiC
arb
on
ate
Co
nce
ntr
atio
n (
mg/
l)
Scale Inhibitor Nalco 6080 Conc (PPM)
BiCarbonate
Cl
0
0.01
0.02
0.03
0.04
0.05
0.06
0.07
0.08
0.09
10.4
10.5
10.6
10.7
10.8
10.9
11
11.1
-1 1 3 5 7 9
Car
bo
nat
e a
nd
Su
lph
ide
ion
Co
nce
ntr
atio
n (
mg/
l)
Sulp
hat
e io
n a
nd
Car
bo
n d
ioxi
de
Co
nce
ntr
atio
n
(mg/
l)
Scale Inhibitor Nalco 6080 Conc (PPM)
SO4
International Journal of Chemical and Process Engineering Research, 2014, 1(12): 121-131
130
Fig-5. Variation of concentration of mercury, lead and chromium ion with concentration of scale inhibitor
Fig-6. Variation of conductivity and hardness with concentration of scale inhibitor
0.178
0.18
0.182
0.184
0.186
0.188
0.19
0.192
0
0.1
0.2
0.3
0.4
0.5
0.6
-1 1 3 5 7 9
Lead
ion
Co
nce
ntr
atio
n (
mg/
l)
Ch
rom
ium
ion
an
d M
erc
ury
ion
Co
nce
ntr
atio
ns
(mg/
l)
Scale Inhibitor Nalco 6080 Conc (PPM)
Hg
0
2000
4000
6000
8000
10000
12000
15000
16000
17000
18000
19000
20000
21000
22000
23000
24000
25000
-1 1 3 5 7 9
Har
dn
ess
(m
g (C
aCO
3)/
l)
Co
nd
uct
ivit
y (u
S/cm
)
Scale Inhibitor Nalco 6080 Conc (PPM)
Cond
Hardness

International Journal of Chemical and Process Engineering Research, 2014, 1(12): 121-131
131
Fig-7. Variation of concentration alkalinity, suspended solids and pH with concentration of scale inhibitor
400
410
420
430
440
450
460
470
5
7
9
11
13
15
17
19
21
23
25
-1 1 3 5 7 9
Susp
en
de
d S
olid
s C
on
cen
trat
ion
(m
g/l)
Alk
alin
ity
and
pH
Co
nce
ntr
atio
ns
(mg/
l)
Scale Inhibitor Nalco 6080 Conc (PPM)
AlkalinitypHSS