Evaluating tourism competitiveness of small island developing states: A revealed comparative...
16
Evaluating the Tourism Competitiveness of Small Island Developing States: A Revealed Comparative Advantage Approach (A revised version has been published in Anatolia. Please cite the published version) By Mahalia Jackman Research and Economic Analysis Department, Central Bank of Barbados, St. Michael, Barbados Email: [email protected] Tel: (246) 436-6870 Fax: (246) 427-1431 Troy Lorde Department of Economics, University of the West Indies, Cave Hill Campus, Barbados Email: [email protected] Tel: (246) 417-4279 Shane Lowe Research and Economic Analysis Department, Central Bank of Barbados, St. Michael, Barbados Email: [email protected] Tel (246) 436-6870 Fax: (246) 427-1431 and Antonio Alleyne Research and Planning Unit, Ministry of Economic Affairs, Warrens, St. Michael Email: [email protected] Tel: (246) 310-1300
-
Upload
cavehill-uwi -
Category
Documents
-
view
1 -
download
0
Transcript of Evaluating tourism competitiveness of small island developing states: A revealed comparative...

Evaluating the Tourism Competitiveness of Small Island Developing States:
A Revealed Comparative Advantage Approach
(A revised version has been published in Anatolia. Please cite the published version)
By
Mahalia Jackman
Research and Economic Analysis Department, Central Bank of Barbados, St. Michael, Barbados
Email: [email protected]
Tel: (246) 436-6870
Fax: (246) 427-1431
Troy Lorde
Department of Economics, University of the West Indies, Cave Hill Campus, Barbados
Email: [email protected]
Tel: (246) 417-4279
Shane Lowe
Research and Economic Analysis Department, Central Bank of Barbados, St. Michael, Barbados
Email: [email protected]
Tel (246) 436-6870
Fax: (246) 427-1431
and
Antonio Alleyne
Research and Planning Unit, Ministry of Economic Affairs, Warrens, St. Michael
Email: [email protected]
Tel: (246) 310-1300
1
Evaluating the Tourism Competitiveness of Small Island Developing States:
A Revealed Comparative Advantage Approach
Abstract
This paper analyses the competitiveness of eighteen small island developing states (SIDS) over
the period 2000-2007 employing the technique of revealed comparative advantage. We find that
most SIDS had at the very least a weak comparative advantage on average. Of particular note,
the results indicate that competitiveness in most SIDS increased over the sample period. But, in
spite of their improvements, none of the countries at any point in time displayed a strong
comparative advantage. This would then call for a need for policy makers in SIDS to further
upgrade their tourism products in order to improve competitiveness and sustain tourism.
Keywords: SIDS; tourism competitiveness; revealed comparative advantage

2
1. Introduction
The tourism industry is one of the fastest growing worldwide. Estimates from the World
Tourism Organistation (WTO) suggest that over the last five decades, tourism receipts increased
over 30-fold, from a mere USD $2 billion to an impressive USD $919 billion in 2010.
Underpinning the rising receipts has been an increasing number of travellers; advances in
communication and transportation, improved tourism products, as well as the growing number of
international agreements have resulted in a greater movement of people in an increasingly
globalised world. According to the WTO, the number of tourists grew from about 25 million in
1950 to an estimated 940 million in 2010. The increase registered in small island developing
states (SIDS) has been even more dramatic. Craigwell (2007) notes that tourist arrivals to SIDS
grew by 145% between 1988 and 2004, compared to global growth of 98% over the same period.
The importance of tourism SIDS is widely recognised (see for instance Lorde et al, 2010a;
Craigwell 2007). This importance has partially been the result of SIDS’ limited opportunities for
economies of scale within other manufacturing-related industries (see Koonjul, 2004; UNESCO,
2007). Table 1 shows the contribution of tourism to employment and Gross Domestic Product
for a sample of eighteen SIDS. As shown, tourism accounts for a substantial portion of Gross
Domestic Product (GDP) and is a major generator of employment. In fact, with the exception of
oil-rich Trinidad and Tobago, the World Travel and Tourism Council (WTTC) rates these SIDS
as among the top thirty-five (35) tourism-dependent countries. The industry also represents a
major source of foreign exchange to SIDS, which often lack an abundance of natural resources
with which to competitively develop other industries (see Koonjil, 2004). Many SIDS also rely
on the earnings from tourism to maintain somewhat sustainable current account deficits (see for
instance Lorde et al, 2010b), with tourism receipts accounting for up to 50% of total export
credits in some instances.
Recent international events further underline the importance of tourism to the economic fortunes
of these countries. The terrorist attacks of 2001, as well as other acts of terrorism caused a major
slowdown in global air travel, resulting in trying economic times for tourism-dependant states.
Also, the downturns being experienced in many source markets since the onset of the global
financial crisis have significantly reduced tourist arrivals for many developing countries (see
World Economic Forum, 2009). The effects of the financial crisis have been exacerbated by
rising fuel costs for airlines and cruise ships (see Ringbeck et al, 2009), resulting in a further
decline in global tourism demand and foreign exchange earnings for these micro-states.
Given the importance of tourism to SIDS, increasing (or at the very least, maintaining) the
portion of tourism has been a chief objective of policymakers. But, the emergence of newer
players in the market has raised a threat to SIDS’ status as major tourist destinations. This has
resulted in questions about the competitiveness of SIDS’ tourism products, as they compete
among themselves and larger territories that depend less on tourism for their economic survival.
In fact, during the last decade, competitiveness has become the most common concept employed
to approach and foster the sustainable development of the tourism industry. Against this
backdrop, this note evaluates the tourism competitiveness of eighteen SIDS between 2000 and
2007.

3
It should be noted that measuring and comparing tourism competitiveness is not an easy task,
particularly since “each destination may have different traditions, history, cultural and natural
resources, as well as unique ambitions and means of accomplishing objectives” (Bãlan et al,
2009) As such, several authors have created or adopted different models for measuring tourism
competitiveness. Among the myriad of tools used to analyse competitiveness are Porter’s five
forces model (Claver-Cortes et al, 2007), surveys that capture the consumer’s perceived image of
the destination (Enright and Netwon, 2004) and models based on price competitiveness (Dwyer
et al, 2000; Mangion et al, 2005). Yet, the literature has not arrived at a consensus on the most
appropriate measure of competitiveness.
In an attempt to shed some light on this issue, the World Economic Forum (WEF) developed the
Travel and Tourism Competitiveness Index (TTCI) which aims to measure the factors and
policies that make it attractive to develop the tourism sector in different countries. The index is
based on three broad categories: (1) the travel and tourism regulatory framework index (2) the
travel and tourism business environment and infrastructure index and (3) the travel and tourism
human, cultural and natural resources index. However, the TTCI is not without its pitfalls.
First, while the TTCI would highlight the capacity of the country to incorporate tourism into its
development strategy, we argue that the tourism share is also an important element of tourism
competitiveness. Particularly, the gains or losses of world market shares by individual countries
would also serve as an excellent indicator of how competitiveness of a country has evolved over
time, and thus should also be considered. Second, the data needed for compilation of the index is
not readily available for many developing countries, and so, for many SIDS, a TTCI does not
exist. For instance, of the eighteen SIDS under evaluation in this study, a TTCI index only
exists for four of them (Barbados, Dominican Republic, Jamaica and Trinidad and Tobago).
This limits the extent to which governments of SIDS are able to evaluate their competiveness
and thus calls for an alternative approach to complete this task.
In this paper, the authors adopt a revealed comparative advantage approach, that is, a Balassa
index (see for instance Algieri, 2006; Bobirca and Bucureşti, 2007; Seyoum, 2007) to assess the
competitiveness of SIDS. This approach addresses some of the short comings of the WEF TTCI.
Particularly, the only data needed are tourism receipts, which are readily available for many
SIDS. Thus, policy makers can evaluate the competitiveness of those SIDS that are not included
in the WEF report, thereby improving the effectiveness of tourism planning and policy.
The remainder of this note is as follows. Section 2 explains the methodology and data. Section
3 discusses the empirical findings. We conclude in Section 4.
2. Methodology and Data
The theory of comparative advantage is probably one of the most important concepts in
international trade theory. In modern economic literature, the concept of comparative advantage
is commonly employed to evaluate patterns of trade and export specialization. Currently, there
are two prominent theories of comparative advantage: The Ricardian theory and the Heckscher-

4
Olin (HO) theory. Ricardian theory posits that a comparative advantage exists amongst
countries because of differences in technologies across industries. Instead, HO theory assumes a
country’s advantage is due to differences in factor prices across countries. According to
Heckscher-Olin theory, a country’s comparative advantage is determined by its relative factor
scarcity, that is, its factor endowment ratios relative to the rest of the world or a set of countries.
Since relative prices under autarky are not observable, measuring comparative advantage poses
particular challenges (Balassa, 1989). Against this backdrop, Balassa (1965) developed the most
widely used approach to analysing comparative advantage commonly known as the Balassa
Index or an index of revealed export advantage (RXA). Under this approach, it is not necessary
to include all the factors affecting a county’s comparative advantage i.e. prices or productivity.
Balassa (1965) opined that comparative advantage is “revealed” by observed trade patterns. He
argued that exports could be used to reveal the comparative advantage of a particular country in
the absence of data on factor costs, as the pattern of commodity exports reflects relative costs as
well as differences in non-price factors that can be expected to determine the structure of exports.
In other words, the actual export flows “reveal” the country’s strong sectors. So, in order to
determine whether or not country i holds a strong position in producing and exporting
commodity j, one should compare the share of commodity j exports of country i’s total exports,
with the share of exports of commodity j in a group of reference country’s total exports. The
Balassa index or revealed comparative advantage (RCA) is therefore a normalized export share,
defined as:
𝑅𝐶𝐴𝑖𝑗 = 𝑅𝑋𝐴 =𝑠ℎ𝑎𝑟𝑒 𝑜𝑓 𝑐𝑜𝑚𝑚𝑜𝑑𝑖𝑡𝑦 𝑗 𝑖𝑛 𝑐𝑜𝑢𝑛𝑡𝑟𝑦 𝑖 𝑒𝑥𝑝𝑜𝑟𝑡𝑠
𝑠ℎ𝑎𝑟𝑒 𝑜𝑓 𝑐𝑜𝑚𝑚𝑜𝑑𝑖𝑡𝑦 𝑗 𝑖𝑛 𝑟𝑒𝑓𝑒𝑟𝑒𝑛𝑐𝑒 𝑐𝑜𝑢𝑛𝑡𝑟𝑦 𝑒𝑥𝑝𝑜𝑟𝑡𝑠
=
𝑋𝑖𝑗
∑ 𝑋𝑖𝑗𝐽𝑗=1
⁄
∑ 𝑋𝑛𝑗𝑁𝑛=1
∑ ∑ 𝑋𝑛𝑗𝐽𝑗=1
𝑁𝑛=1
⁄
(1)
where ijX is country i’s export value of commodity j; 1
J
ij
j
X
is the total export value of country
i; 1
N
nj
n
X
is the export value of commodity j for a set of N reference countries; 1 1
N J
nj
n j
X
is the
export value of all commodities for a set of N reference countries; and ijRCA is the revealed
comparative advantage of country i in commodity j. When ijRCA is greater than 1, it indicates
that country i has a comparative advantage in the export of commodity j in the market of a set of
reference countries, since commodity j is more important for country i than for the exports of the
reference countries; while ijRCA less than 1 indicates the country possesses a comparative
disadvantage.
We use the classification system by Hinloopen and Marrewijk (2001) to classify SIDS according
to their degree of comparative advantage. Class a: 0 < ijRCA < 1 are countries without a

5
comparative advantage; Class b: 1 < ijRCA < 2 are countries with a weak comparative advantage;
Class c: 2 < ijRCA < 4 are countries with a medium comparative advantage; and Class d: ijRCA >
4 are countries with a strong comparative advantage.
All observations are sourced from the United Nations online database and run from 2000-2007,
while tourism receipts stand as our proxy of export values.
3. Empirical Findings and Analysis
In the first stage of the analysis, the Balassa index is calculated for each country (see Table 1).
The data reveals that during the 2000-2007 period, all SIDS showed a steady improvement in
their revealed comparative advantage, with each country registering an increase of at least 10%
between 2000 and 2007. Of particular note, the greatest improvement came from Trinidad and
Tobago, a country for which the energy sector has historically been the impetus of growth and
development. This near 60% increase may be a reflection of various policy initiatives by
government to enhance the role of tourism in Trinidad (see for instance Lewis and Brown, 2007).
To further assess the competitiveness, the classification system by Hinloopen and Marrewijk
(2001) is adopted. These results are presented in Table 3. First, we find that none of the SIDS
exhibit a comparative/competitive disadvantage in any time period; i.e. no state has a RCA
whose value is less than one. Rather, most SIDS seems to exhibit a weak to medium
comparative advantage. Taken at face value, this finding is very promising, given the extensive
investment in tourism undertaken by governments of several SIDS. Specifically, of the eighteen
SIDS evaluated, three can be classified as having a weak comparative advantage in tourism (the
Netherlands Antilles, Seychelles and Trinidad and Tobago); all others have a medium revealed
comparative advantage. Unfortunately, despite the importance of tourism to most SIDS, none of
them show a strong comparative advantage in tourism.
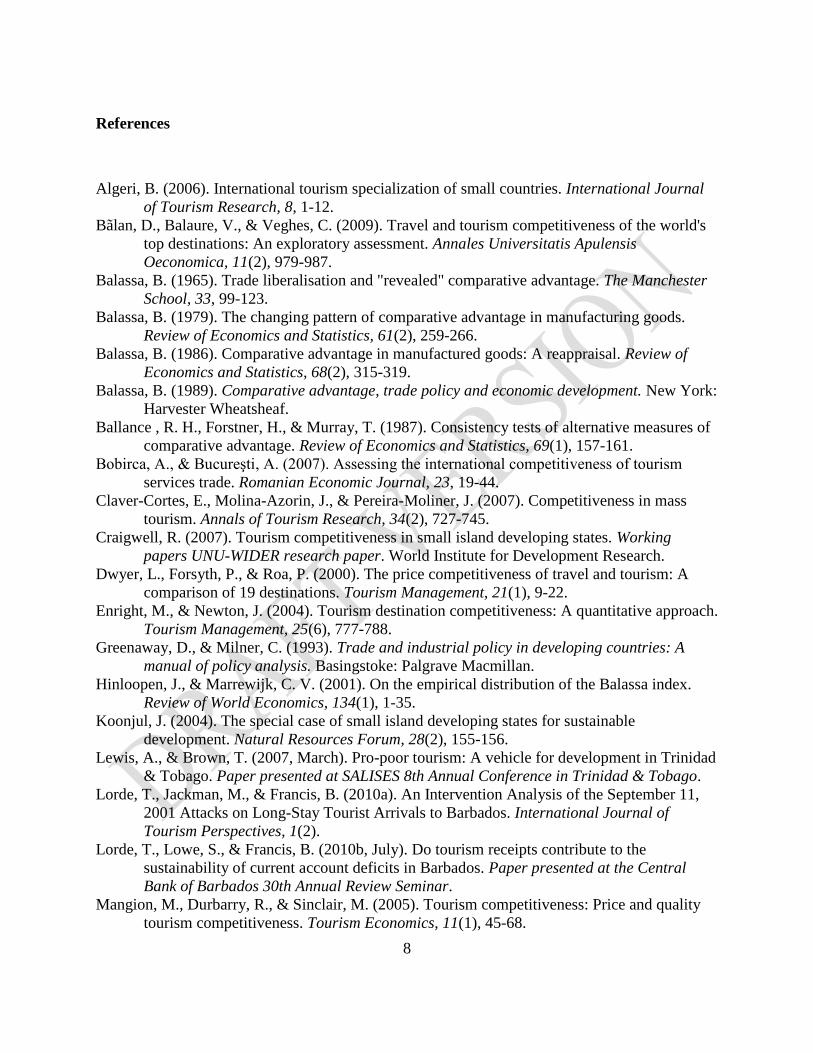
For ease of comparison, the countries are ranked in accordance to their competitiveness (Table
4). In each year, Maldives, the Dominican Republic, Anguilla, St. Lucia and the Bahamas are
ranked as having the highest comparative advantage while the rankings for Montserrat, the
Netherlands Antilles, Seychelles and Trinidad and Tobago are consistently low. One striking
observation is: the countries with the lowest competitiveness are among the countries where the
non-tourism sectors tend to be the mainstay of the economy. For instance, the main drivers of
growth in the Netherlands Antilles are petroleum transhipment, oil refinement and the offshore
financial sector; Seychelles, fishing; Trinidad, energy; and, for Montserrat, economic activity is
concentrated in the government services and construction sectors.
While the above analysis provides some insight into the competitiveness of SIDS, it is not
without its shortcomings. A main issue, as pointed out by Greenaway and Milner (1993) is that
the Balassa index of revealed comparative advantage is biased from the perspective that it fails to
account for imports and, as such, implies possible over or underestimation of any underlying
comparative advantage or disadvantage. As such, an alternative methodology for measuring
revealed comparative advantage which captures the import component of trade flows has been

6
advanced by Vollrath (1991) and is commonly known as the relative trade advantage (RTA).
The RTA can be expressed as the difference between the revealed export advantage (RXA) and
revealed import advantage (RMA):
1 12
1 1 1 1 1 1
/ /
/ /ij
J J
ij ij ij ij
j j
N N J N N J
nj nj nj nj
n n j n n j
X X M M
RCA RTA RXA RMA
X X M M
(2)
where variables are as defined in Equation (1), but M represents imports. It should be noted that
tourism receipts (inflows) are export values and tourism expenditures (outflows) are import
values. Under this approach, positive values indicate a comparative/competitive advantage
whereas negative values indicate comparative/competitive disadvantage. The results are
presented in Table 5.
Looking first at the mean of Vollrath indices over the time period, each state has an average RTA
which is positive. Thus, even when tourism imports are taken into consideration, all SIDS can
be said to have a revealed comparative advantage in tourism on average. However, an analysis
of the individual time periods takes an interesting turn. Similar to the calculated Balassa indices,
tourism competitiveness in each country has improved over the 2000-2007 period. But, the RTA
indices for Trinidad and Tobago are negative – hinting that during this period, the tourism sector
in Trinidad and Tobago was at a competitive disadvantage relative to our reference countries.
That is, the tourism sector was particularly weak in Trinidad and Tobago. This differs from the
results given by the Balassa index, where in each time period, each country exhibited at the very
least, a weak comparative advantage. Of course, it should be noted that of all the countries under
consideration, Trinidad and Tobago has the smallest dependence on tourism but also is the
largest exporter of tourists i.e. outbound tourism is largest for this country, and so, this may
account for the discrepancy.
The different measures of comparative advantage also provide slightly different rankings. For
instance, in Table 6, we compare the rankings of the mean values of both RCA indices. Under
the Balassa index of RCA, the top five countries in terms of tourism competitiveness are
Maldives, Dominican Republic, Anguilla, St. Lucia and the Bahamas. In contrast, the top five
countries by the Vollrath index are the Dominican Republic, Anguilla, The Bahamas, St. Lucia
and Aruba.
Given that varying indices produced slightly different results of revealed comparative advantage,
we follow Ballance et al. (1987) and conduct consistency tests to determine how the computed
indices perform as cardinal (related to the value of the indices) and ordinal measures (related to
how the indices rank the countries). Particularly, we use Pearson pairwise correlation and
Spearman’s rank correlation coefficients to properly gauge the consistency of the indices for the
eighteen countries under evaluation. Pearson pairwise correlation coefficients are calculated to
determine the consistency of these two indices as cardinal measures of comparative advantage.
The observed correlation coefficient is 0.871, and since it is above 0.8, the authors consider this a

7
sufficient condition for accepting that on average, the two indices produce consistent cardinal
results. To evaluate the level of ordinal consistency of the RCA indices, we calculate the
Spearman’s rank correlation coefficient. Results suggest that the RCA indices are slightly less
consistent as ordinal measures, evidenced by a correlation coefficient of 0.852. Nonetheless, the
Spearman correlation is well over 0.8 and thus we can conclude that on average the two indices
also produce consistent ordinal results.
Taken together, our results suggest that both Balassa and Volltrath indices give consistent
results: the competitiveness of each small island developing state has improved over the 2000-
2007 time period and they all have at the very least a revealed comparative advantage in tourism
on average.
4. Concluding Remarks
In striving to foster the sustainable development of the tourism industry, several policy makers in
SIDS have shifted their attention to improving competitiveness. This paper analyses the
competitiveness of eighteen SIDS over the period 2000-2007. Using two alternative measures of
comparative advantage i.e. the Balassa index and the Vollrath index, we find that on average all
SIDS had at the very least a weak comparative advantage over the time period. Of particular
note, both indices indicate that competitiveness in most SIDS increased over the sample period.
But, in spite of their improvements, none of the countries at any point in time displayed a strong
comparative advantage. This would then call for a need for policy makers in SIDS to further
upgrade their tourism products in order to improve competitiveness and sustain tourism.
While this paper has provided some insight into the level of competitiveness of SIDS,
particularly for those for whom a TTCI does not exist, it is not without its limitations.
Specifically, while the index tells about the comparative advantage of the country, it does not
inform on how competitiveness can be further improved, or the area where the country falls
short. The indices calculated in this paper, in conjunction with a TTCI, would allow for a more
ideal analysis of tourism competitiveness in SIDS. Unfortunately, a TTCI only exists for four of
the eighteen SIDS under study. This then points to a need for more data collection on the travel
and tourism services in SIDS. This data deficiency substantially limits the comprehension and
evaluation of the competitiveness of SIDS, and by extension, the ability of policy makers,
business owners and managers to make informed and high quality decisions. Notwithstanding
this, the paper has, at the very least, provided some insight on the performance of SIDS—in
terms of tourism competitiveness—in the last decade.
8
References
Algeri, B. (2006). International tourism specialization of small countries. International Journal
of Tourism Research, 8, 1-12.
Bãlan, D., Balaure, V., & Veghes, C. (2009). Travel and tourism competitiveness of the world's
top destinations: An exploratory assessment. Annales Universitatis Apulensis
Oeconomica, 11(2), 979-987.
Balassa, B. (1965). Trade liberalisation and "revealed" comparative advantage. The Manchester
School, 33, 99-123.
Balassa, B. (1979). The changing pattern of comparative advantage in manufacturing goods.
Review of Economics and Statistics, 61(2), 259-266.
Balassa, B. (1986). Comparative advantage in manufactured goods: A reappraisal. Review of
Economics and Statistics, 68(2), 315-319.
Balassa, B. (1989). Comparative advantage, trade policy and economic development. New York:
Harvester Wheatsheaf.
Ballance , R. H., Forstner, H., & Murray, T. (1987). Consistency tests of alternative measures of
comparative advantage. Review of Economics and Statistics, 69(1), 157-161.
Bobirca, A., & Bucureşti, A. (2007). Assessing the international competitiveness of tourism
services trade. Romanian Economic Journal, 23, 19-44.
Claver-Cortes, E., Molina-Azorin, J., & Pereira-Moliner, J. (2007). Competitiveness in mass
tourism. Annals of Tourism Research, 34(2), 727-745.
Craigwell, R. (2007). Tourism competitiveness in small island developing states. Working
papers UNU-WIDER research paper. World Institute for Development Research.
Dwyer, L., Forsyth, P., & Roa, P. (2000). The price competitiveness of travel and tourism: A
comparison of 19 destinations. Tourism Management, 21(1), 9-22.
Enright, M., & Newton, J. (2004). Tourism destination competitiveness: A quantitative approach.
Tourism Management, 25(6), 777-788.
Greenaway, D., & Milner, C. (1993). Trade and industrial policy in developing countries: A
manual of policy analysis. Basingstoke: Palgrave Macmillan.
Hinloopen, J., & Marrewijk, C. V. (2001). On the empirical distribution of the Balassa index.
Review of World Economics, 134(1), 1-35.
Koonjul, J. (2004). The special case of small island developing states for sustainable
development. Natural Resources Forum, 28(2), 155-156.
Lewis, A., & Brown, T. (2007, March). Pro-poor tourism: A vehicle for development in Trinidad
& Tobago. Paper presented at SALISES 8th Annual Conference in Trinidad & Tobago.
Lorde, T., Jackman, M., & Francis, B. (2010a). An Intervention Analysis of the September 11,
2001 Attacks on Long-Stay Tourist Arrivals to Barbados. International Journal of
Tourism Perspectives, 1(2).
Lorde, T., Lowe, S., & Francis, B. (2010b, July). Do tourism receipts contribute to the
sustainability of current account deficits in Barbados. Paper presented at the Central
Bank of Barbados 30th Annual Review Seminar.
Mangion, M., Durbarry, R., & Sinclair, M. (2005). Tourism competitiveness: Price and quality
tourism competitiveness. Tourism Economics, 11(1), 45-68.

9
Ringbeck, J., Gautam, A., & Pietsch, T. (2009). Endangered growth: How the price of oil
challenges international travel and tourism growth in the travel and tourism
competitiveness report 2009: Managing in a time of turbulence. Geneva, Switzerland:
World Economic Forum.
Seyoum, B. (2007). Revealed comparative advantage and competitiveness in services: A study
with special emphasis on developing countries. Journal of Economic Studies, 34(5), 376-
388.
UNESCO. (2010, July). Major trends affecting Caribbean SIDS and new strategic opportunities.
Presentation at the UNESCO Future Forum. Trinidad and Tobago.
Vollrath, T. (1991). A theoretical evaluation of alternative trade intensity measures of revealed
comparative advantage. Review of World Economics, 127(2), 265-280.
World Economic Forum. (2009). The travel and tourism competitiveness report 2009: Managing
in a time of turbulence. Geneva, Switzerland: World Economic Forum.

10
Table 1: Economic Impact of Tourism in SIDS in 2011 (WTTC Estimates) Country Contribution to Employment Contribution to GDP World Rank
Direct Total Direct Total
Anguilla 22.7 64.4 23.8 65.8 5
Antigua and Barbuda 17.8 74.2 18.0 69.0 2
Aruba 23.2 73.1 26.2 75.5 3
Bahamas, The 21.7 47.4 29.4 55.1 9
Barbados 14.2 47.0 14.6 46.6 10
Dominica 7.5 24.8 6.9 22.9 25
Dominican Republic 5.5 17.7 5.0 16.3 35
Grenada n.a. n.a. n.a. n.a. n.a.
Haiti n.a. n.a. n.a. n.a. n.a.
Jamaica n.a. n.a. n.a. n.a. n.a.
Maldives 27.5 63.3 30.8 70.5 4
Montserrat n.a. n.a. n.a. n.a. n.a.
Netherland Antilles 15.2 44.5 13.0 36.1 16
St. Kitts and Nevis 7.8 28.2 7.7 26.7 19
St. Lucia 15.4 45.8 17.5 45.4 11
St. Vincent and the Grenadines 7.7 26.2 7.1 23.9 23
Seychelles 23.0 27.6 23.9 56.4 7
Trinidad and Tobago 3.8 7.4 5.2 9.7 109
Source: Taken from the WTTC online database
Note: World ranking is out of 181countries and is in terms of relative contribution to national economy

11
Table 2: Revealed Comparative Advantage – Balassa Index
Country 2000 2001 2002 2003 2004 2005 2006 2007 Mean
% ∆
2000-
2007
Anguilla 2.80 2.88 2.92 3.18 3.15 3.19 3.31 3.38 3.10 20.7
Antigua and Barbuda 2.25 2.22 2.34 2.57 2.50 2.45 2.61 2.58 2.44 14.7
Aruba 2.60 2.73 2.80 2.95 3.00 3.08 3.12 3.30 2.95 26.9
Bahamas, The 2.84 3.00 2.87 3.07 2.97 3.04 3.22 3.32 3.04 16.9
Barbados 2.34 2.31 2.31 2.57 2.47 2.49 2.78 2.98 2.53 27.4
Dominica 1.73 1.98 1.93 2.53 2.50 2.50 2.73 2.70 2.33 56.1
Dominican Rep. 2.85 2.95 2.99 3.23 3.18 3.27 3.27 3.35 3.14 17.5
Grenada 1.95 2.05 2.35 2.78 1.91 2.25 2.75 2.84 2.36 45.6
Haiti 2.40 2.48 2.48 2.52 2.17 2.00 2.54 2.67 2.41 11.3
Jamaica 2.12 2.13 2.13 2.27 2.22 2.43 2.69 2.79 2.35 31.6
Maldives 2.97 3.03 3.12 3.33 3.28 3.25 3.54 3.66 3.27 23.2
Montserrat 1.78 1.90 2.09 2.20 2.19 2.22 2.00 2.00 2.05 12.4
Netherlands Antilles 1.55 1.51 1.62 1.81 1.84 1.93 1.95 2.07 1.79 33.5
St. Kitts and Nevis 1.91 2.07 2.13 2.51 2.69 2.72 2.69 2.61 2.42 49.4
St. Lucia 2.79 2.80 2.83 3.18 3.14 3.17 3.25 3.36 3.07 36.6
St. Vincent and the Grenadines 2.08 2.19 2.24 2.48 2.34 2.42 2.54 2.73 2.38 20.4
Seychelles 1.56 1.63 1.76 1.86 1.86 1.90 2.02 2.33 1.87 31.3
Trinidad and Tobago 1.24 1.09 1.28 1.30 1.42 1.85 1.79 1.98 1.49 59.7

12
Table 3: Classification of Revealed Comparative Advantage
Country 2000 2001 2002 2003 2004 2005 2006 2007 Overall
Anguilla c c c c c c c c c
Antigua and Barbuda c c c c c c c c c
Aruba c c c c c c c c c
Bahamas, The c c c c c c c c c
Barbados c c c c c c c c c
Dominica b b b c c c c c c
Dominican Rep. c c c c c c c c c
Grenada b c c c b c c c c
Haiti c c c c c c c c c
Jamaica c c c c c c c c c
Maldives c c c c c c c c c
Montserrat b b c c c c c c c
Netherlands Antilles b b b b b b b c b
St. Kitts and Nevis b c c c c c c c c
St. Lucia c c c c c c c c c
St. Vincent and the Grenadines c c c c c c c c c
Seychelles b b b b b b c c b
Trinidad and Tobago b b b b b b b b c
Note: a = no comparative advantage; b = weak comparative advantage; c = medium comparative advantage; and d =
strong comparative advantage.
“Overall” is based on the mean value presented in Table 2:
13
Table 4: Ranking of Tourism Competitiveness by Balassa Index Country 2000 2001 2002 2003 2004 2005 2006 2007 Overall
Rank
Anguilla 4 4 3 3 3 3 2 2 3
Antigua and Barbuda 9 9 9 8 8 10 12 14 8
Aruba 6 6 6 6 5 5 6 6 6
Bahamas, The 3 2 4 5 6 6 5 5 5
Barbados 8 8 10 8 10 9 7 7 7
Dominica 15 14 15 10 8 8 9 11 14
Dominican Rep. 2 3 2 2 2 1 3 4 2
Grenada 12 13 8 7 15 13 8 8 12
Haiti 7 7 7 11 14 15 13 12 10
Jamaica 10 11 12 14 12 11 10 9 13
Maldives 1 1 1 1 1 2 1 1 1
Montserrat 14 15 14 15 13 14 16 17 15
Netherlands Antilles 17 17 17 17 17 16 17 16 17
St. Kitts and Nevis 13 12 12 12 7 7 10 13 9
St. Lucia 5 5 5 3 4 4 4 3 4
St. Vincent and the Grenadines 11 10 11 13 11 12 13 10 11
Seychelles 16 16 16 16 16 17 15 15 16
Trinidad and Tobago 18 18 18 18 18 18 18 18 18

14
Table 5: Revealed Trade Advantage (Vollrath Index)
Country 2000 2001 2002 2003 2004 2005 2006 2007 Mean
Anguilla 2.06 2.08 2.15 2.44 2.42 2.53 2.60 2.66 2.37
Antigua and Barbuda 1.55 1.48 1.65 1.88 1.77 1.78 2.04 2.07 1.78
Aruba 1.81 1.95 1.86 2.01 1.97 2.18 2.57 2.69 2.13
Bahamas, The 1.94 2.05 2.00 2.01 1.97 2.01 3.22 3.32 2.32
Barbados 1.66 1.59 1.58 1.83 1.74 1.96 2.03 2.33 1.84
Dominica 1.14 1.33 1.32 1.78 1.73 1.73 2.15 2.10 1.66
Dominican Rep. 2.07 2.14 2.19 2.43 2.23 2.37 2.90 3.02 2.42
Grenada 1.65 1.73 2.04 2.41 1.57 1.86 2.22 2.30 1.97
Haiti 2.17 2.23 2.48 2.52 1.39 1.61 1.89 2.05 2.04
Jamaica 1.61 1.65 1.55 1.70 1.60 1.88 1.21 1.25 1.55
Maldives 1.49 1.56 1.65 1.94 1.97 2.01 2.20 2.25 1.88
Montserrat 1.51 1.60 1.69 1.81 1.85 1.84 1.09 0.79 1.52
Netherlands Antilles 0.37 0.34 0.41 0.34 0.40 0.58 1.42 1.55 0.68
St. Kitts and Nevis 1.50 1.69 1.78 2.14 2.24 2.28 1.76 1.65 1.88
St. Lucia 1.92 1.93 1.89 2.29 2.21 2.31 2.23 2.35 2.14
St. Vincent and the Grenadines 1.47 1.48 1.60 1.77 1.61 1.70 1.24 1.12 1.50
Seychelles 1.12 1.26 1.22 1.26 1.28 1.28 1.50 1.79 1.34
Trinidad and Tobago -0.09 -0.37 -0.51 0.26 0.46 0.59 0.45 0.56 0.17

15
Table 6: Comparison of Ranking by Various Revealed Comparative Advantage Indices
Country Rank according to Balassa Index Rank according to Vollrath Index
Anguilla 3 2
Antigua and Barbuda 8 11
Aruba 6 5
Bahamas, The 5 3
Barbados 7 10
Dominica 14 12
Dominican Rep. 2 1
Grenada 12 7
Haiti 10 6
Jamaica 13 13
Maldives 1 8
Montserrat 15 14
Netherlands Antilles 17 17
Seychelles 16 16
St. Kitts and Nevis 9 8
St. Lucia 4 4
St. Vincent and the
Grenadines 11 15
Trinidad and Tobago 18 18