INVESTIGATING THE RELATIONSHIP BETWEEN LABOR PRODUCTIVITY AND WORK-IN-PROCESS BUFFERS: A CASE STUDY
Upload
khangminh22Category
view
0download
0
24
3c h a p t e r
Labor Productivity and ComparativeAdvantage: The Ricardian Model
Countries engage in international trade for two basic reasons, each of whichcontributes to their gains from trade. First, countries trade because they aredifferent from each other. Nations, like individuals, can benefit from their
differences by reaching an arrangement in which each does the things it doesrelatively well. Second, countries trade to achieve economies of scale inproduction. That is, if each country produces only a limited range of goods, it canproduce each of these goods at a larger scale and hence more efficiently than ifit tried to produce everything. In the real world, patterns of international tradereflect the interaction of both these motives. As a first step toward understandingthe causes and effects of trade, however, it is useful to look at simplified modelsin which only one of these motives is present.
The next four chapters develop tools to help us to understand how differencesbetween countries give rise to trade between them and why this trade is mutuallybeneficial. The essential concept in this analysis is that of comparative advantage.
Although comparative advantage is a simple concept, experience shows that itis a surprisingly hard concept for many people to understand (or accept). Indeed,Paul Samuelson—the Nobel laureate economist who did much to develop themodels of international trade discussed in Chapters 4 and 5—has described com-parative advantage as the best example he knows of an economic principle thatis undeniably true yet not obvious to intelligent people.
In this chapter we begin with a general introduction to the concept of compar-ative advantage, then proceed to develop a specific model of how comparativeadvantage determines the pattern of international trade.
LEARNING GOALS
After reading this chapter, you will be able to:
• Explain how the Ricardian model, the most basic model of internationaltrade, works and how it illustrates the principle of comparative advantage.
M03_KRUG6654_09_SE_C03.QXD 9/1/10 8:16 PM Page 24
• Demonstrate gains from trade and refute common fallacies about interna-tional trade.
• Describe the empirical evidence that wages reflect productivity and thattrade patterns reflect relative productivity.
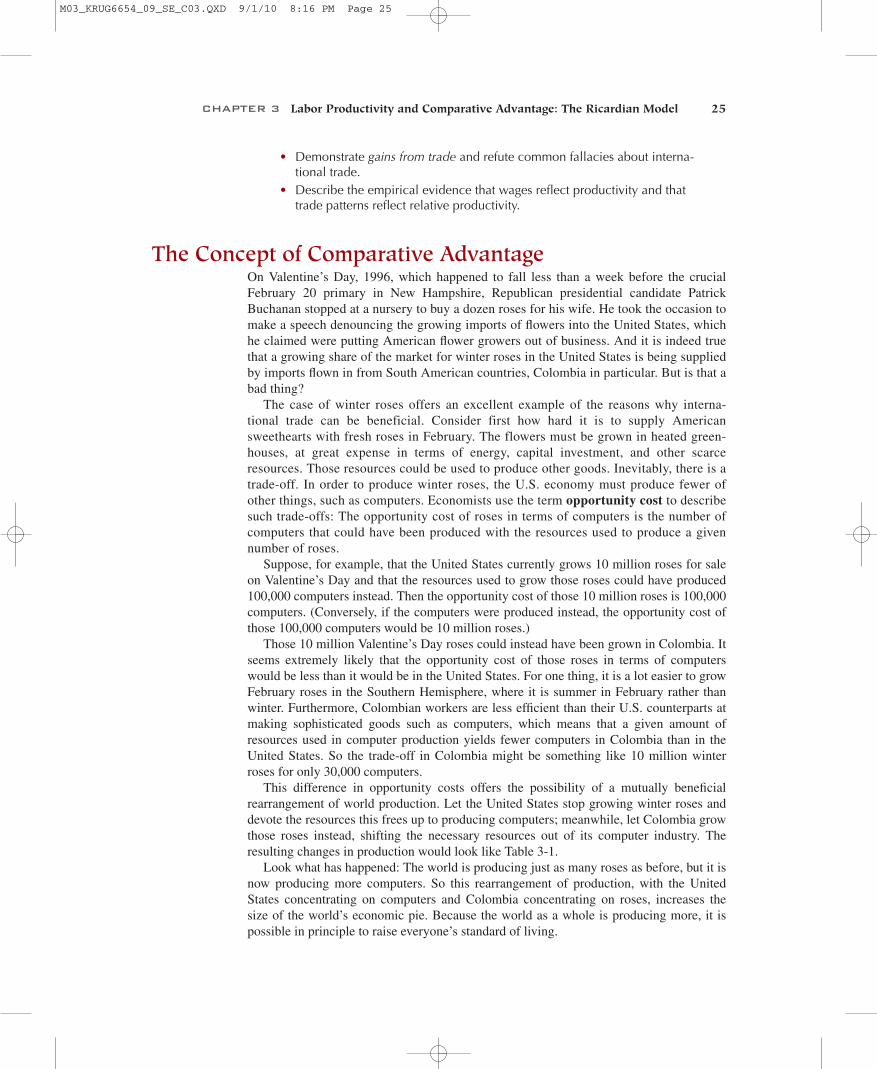
The Concept of Comparative AdvantageOn Valentine’s Day, 1996, which happened to fall less than a week before the crucialFebruary 20 primary in New Hampshire, Republican presidential candidate PatrickBuchanan stopped at a nursery to buy a dozen roses for his wife. He took the occasion tomake a speech denouncing the growing imports of flowers into the United States, whichhe claimed were putting American flower growers out of business. And it is indeed truethat a growing share of the market for winter roses in the United States is being suppliedby imports flown in from South American countries, Colombia in particular. But is that abad thing?
The case of winter roses offers an excellent example of the reasons why interna-tional trade can be beneficial. Consider first how hard it is to supply Americansweethearts with fresh roses in February. The flowers must be grown in heated green-houses, at great expense in terms of energy, capital investment, and other scarceresources. Those resources could be used to produce other goods. Inevitably, there is atrade-off. In order to produce winter roses, the U.S. economy must produce fewer ofother things, such as computers. Economists use the term opportunity cost to describesuch trade-offs: The opportunity cost of roses in terms of computers is the number ofcomputers that could have been produced with the resources used to produce a givennumber of roses.
Suppose, for example, that the United States currently grows 10 million roses for saleon Valentine’s Day and that the resources used to grow those roses could have produced100,000 computers instead. Then the opportunity cost of those 10 million roses is 100,000computers. (Conversely, if the computers were produced instead, the opportunity cost ofthose 100,000 computers would be 10 million roses.)
Those 10 million Valentine’s Day roses could instead have been grown in Colombia. Itseems extremely likely that the opportunity cost of those roses in terms of computerswould be less than it would be in the United States. For one thing, it is a lot easier to growFebruary roses in the Southern Hemisphere, where it is summer in February rather thanwinter. Furthermore, Colombian workers are less efficient than their U.S. counterparts atmaking sophisticated goods such as computers, which means that a given amount ofresources used in computer production yields fewer computers in Colombia than in theUnited States. So the trade-off in Colombia might be something like 10 million winterroses for only 30,000 computers.
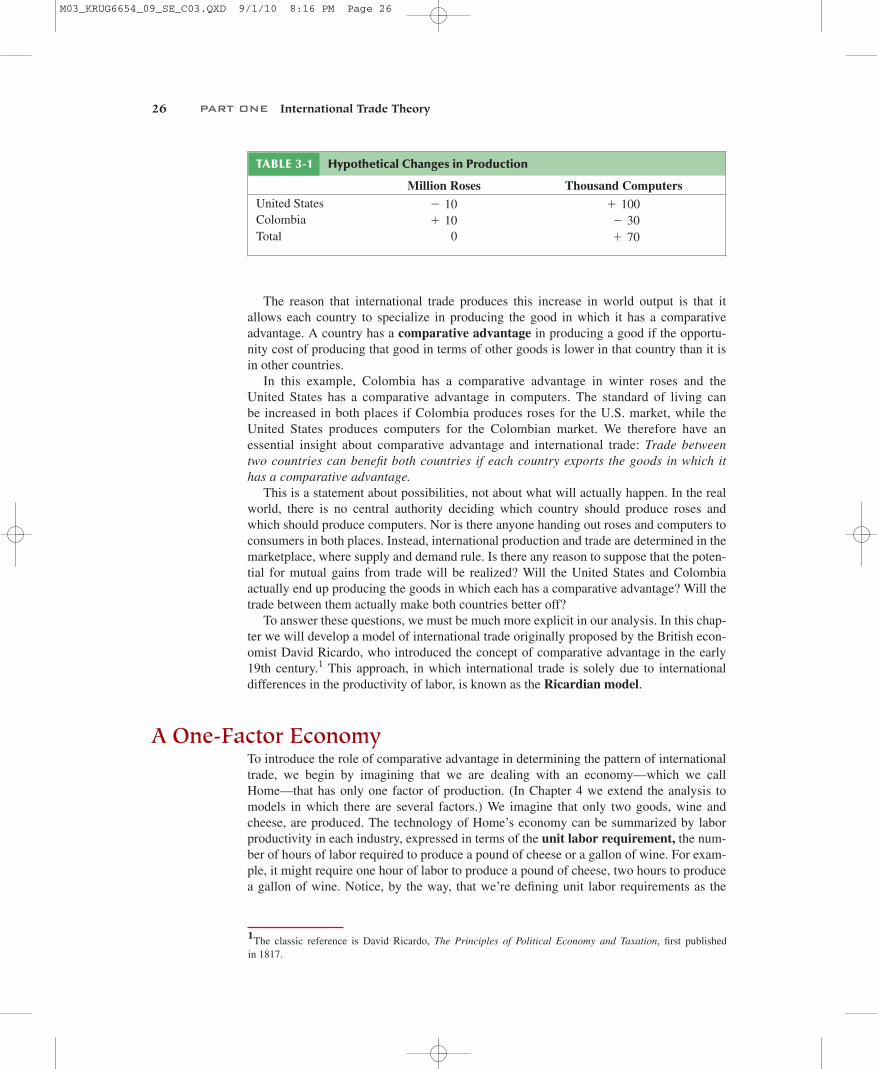
This difference in opportunity costs offers the possibility of a mutually beneficialrearrangement of world production. Let the United States stop growing winter roses anddevote the resources this frees up to producing computers; meanwhile, let Colombia growthose roses instead, shifting the necessary resources out of its computer industry. Theresulting changes in production would look like Table 3-1.
Look what has happened: The world is producing just as many roses as before, but it isnow producing more computers. So this rearrangement of production, with the UnitedStates concentrating on computers and Colombia concentrating on roses, increases thesize of the world’s economic pie. Because the world as a whole is producing more, it ispossible in principle to raise everyone’s standard of living.
CHAPTER 3 Labor Productivity and Comparative Advantage: The Ricardian Model 25
M03_KRUG6654_09_SE_C03.QXD 9/1/10 8:16 PM Page 25
26 PART ONE International Trade Theory
The reason that international trade produces this increase in world output is that itallows each country to specialize in producing the good in which it has a comparativeadvantage. A country has a comparative advantage in producing a good if the opportu-nity cost of producing that good in terms of other goods is lower in that country than it isin other countries.
In this example, Colombia has a comparative advantage in winter roses and theUnited States has a comparative advantage in computers. The standard of living canbe increased in both places if Colombia produces roses for the U.S. market, while theUnited States produces computers for the Colombian market. We therefore have anessential insight about comparative advantage and international trade: Trade betweentwo countries can benefit both countries if each country exports the goods in which ithas a comparative advantage.
This is a statement about possibilities, not about what will actually happen. In the realworld, there is no central authority deciding which country should produce roses andwhich should produce computers. Nor is there anyone handing out roses and computers toconsumers in both places. Instead, international production and trade are determined in themarketplace, where supply and demand rule. Is there any reason to suppose that the poten-tial for mutual gains from trade will be realized? Will the United States and Colombiaactually end up producing the goods in which each has a comparative advantage? Will thetrade between them actually make both countries better off?
To answer these questions, we must be much more explicit in our analysis. In this chap-ter we will develop a model of international trade originally proposed by the British econ-omist David Ricardo, who introduced the concept of comparative advantage in the early19th century.1 This approach, in which international trade is solely due to internationaldifferences in the productivity of labor, is known as the Ricardian model.
A One-Factor EconomyTo introduce the role of comparative advantage in determining the pattern of internationaltrade, we begin by imagining that we are dealing with an economy—which we callHome—that has only one factor of production. (In Chapter 4 we extend the analysis tomodels in which there are several factors.) We imagine that only two goods, wine andcheese, are produced. The technology of Home’s economy can be summarized by laborproductivity in each industry, expressed in terms of the unit labor requirement, the num-ber of hours of labor required to produce a pound of cheese or a gallon of wine. For exam-ple, it might require one hour of labor to produce a pound of cheese, two hours to producea gallon of wine. Notice, by the way, that we’re defining unit labor requirements as the
1The classic reference is David Ricardo, The Principles of Political Economy and Taxation, first publishedin 1817.
TABLE 3-1 Hypothetical Changes in Production
Million Roses Thousand ComputersUnited States - 10 + 100Colombia + 10 - 30Total 0 + 70
M03_KRUG6654_09_SE_C03.QXD 9/1/10 8:16 PM Page 26
CHAPTER 3 Labor Productivity and Comparative Advantage: The Ricardian Model 27
inverse of productivity—the more cheese or wine a worker can produce in an hour, thelower the unit labor requirement. For future reference, we define and as the unitlabor requirements in wine and cheese production, respectively. The economy’s totalresources are defined as L, the total labor supply.
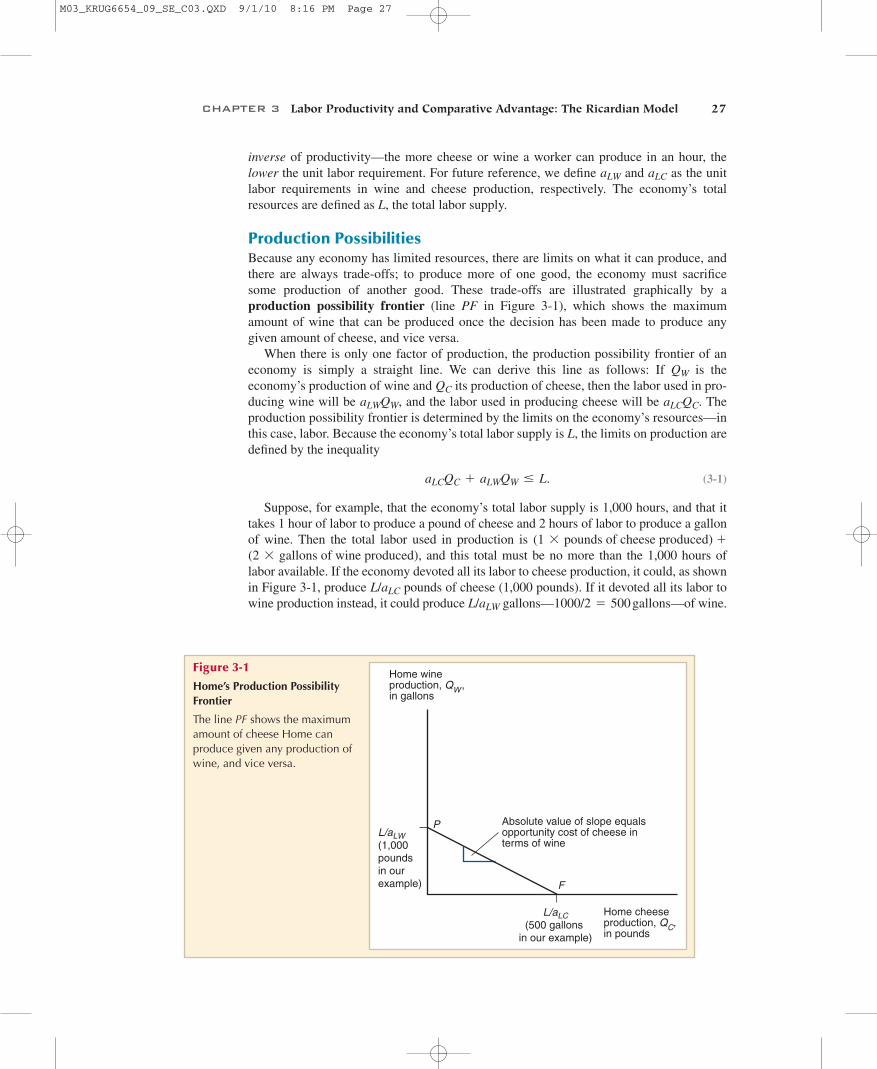
Production PossibilitiesBecause any economy has limited resources, there are limits on what it can produce, andthere are always trade-offs; to produce more of one good, the economy must sacrificesome production of another good. These trade-offs are illustrated graphically by aproduction possibility frontier (line PF in Figure 3-1), which shows the maximumamount of wine that can be produced once the decision has been made to produce anygiven amount of cheese, and vice versa.
When there is only one factor of production, the production possibility frontier of aneconomy is simply a straight line. We can derive this line as follows: If is theeconomy’s production of wine and its production of cheese, then the labor used in pro-ducing wine will be , and the labor used in producing cheese will be . Theproduction possibility frontier is determined by the limits on the economy’s resources—inthis case, labor. Because the economy’s total labor supply is L, the limits on production aredefined by the inequality
(3-1)
Suppose, for example, that the economy’s total labor supply is 1,000 hours, and that ittakes 1 hour of labor to produce a pound of cheese and 2 hours of labor to produce a gallonof wine. Then the total labor used in production is
, and this total must be no more than the 1,000 hours oflabor available. If the economy devoted all its labor to cheese production, it could, as shownin Figure 3-1, produce pounds of cheese (1,000 pounds). If it devoted all its labor towine production instead, it could produce gallons— —of wine.1000/2 = 500 gallonsL/aLW
L/aLC
(2 * gallons of wine produced)(1 * pounds of cheese produced) +
aLCQC + aLWQW … L.
aLCQCaLWQW
QC
QW
aLCaLW
Home wineproduction, QW ,in gallons
L/aLW(1,000poundsin ourexample)
L/aLC(500 gallons
in our example)
Home cheeseproduction, QC,in pounds
F
Absolute value of slope equals opportunity cost of cheese in terms of wine
P
Figure 3-1
Home’s Production PossibilityFrontier
The line PF shows the maximumamount of cheese Home canproduce given any production ofwine, and vice versa.
M03_KRUG6654_09_SE_C03.QXD 9/1/10 8:16 PM Page 27

28 PART ONE International Trade Theory
And it can produce any mix of wine and cheese that lies on the straight line connectingthose two extremes.
When the production possibility frontier is a straight line, the opportunity cost of apound of cheese in terms of wine is constant. As we saw in the previous section, thisopportunity cost is defined as the number of gallons of wine the economy would have togive up in order to produce an extra pound of cheese. In this case, to produce anotherpound would require person-hours. Each of these person-hours could in turn havebeen used to produce gallons of wine. Thus the opportunity cost of cheese in termsof wine is . For example, if it takes one person-hour to make a pound of cheeseand two hours to produce a gallon of wine, the opportunity cost of each pound of cheese ishalf a gallon of wine. As Figure 3-1 shows, this opportunity cost is equal to the absolutevalue of the slope of the production possibility frontier.
Relative Prices and SupplyThe production possibility frontier illustrates the different mixes of goods the economycan produce. To determine what the economy will actually produce, however, we need tolook at prices. Specifically, we need to know the relative price of the economy’s twogoods, that is, the price of one good in terms of the other.
In a competitive economy, supply decisions are determined by the attempts of individu-als to maximize their earnings. In our simplified economy, since labor is the only factor ofproduction, the supply of cheese and wine will be determined by the movement of labor towhichever sector pays the higher wage.
Suppose, once again, that it takes one hour of labor to produce a pound of cheese andtwo hours to produce a gallon of wine. Now suppose further that cheese sells for $4 apound, while wine sells for $7 a gallon. What will workers produce? Well, if they producecheese they can earn $4 an hour. (Bear in mind that since labor is the only input into pro-duction here, there are no profits, so workers receive the full value of their output.) On theother hand, if workers produce wine, they will earn only $3.50 an hour, because a $7 gallonof wine takes two hours to produce. So if cheese sells for $4 a pound while wine sells for $7a gallon, workers will do better by producing cheese—and the economy as a whole willspecialize in cheese production.
But what if cheese prices drop to $3 a pound? In that case workers can earn more byproducing wine, and the economy will specialize in wine production instead.
More generally, let and be the prices of cheese and wine, respectively. It takesperson-hours to produce a pound of cheese; since there are no profits in our one-factor
model, the hourly wage in the cheese sector will equal the value of what a worker can pro-duce in an hour, . Since it takes person-hours to produce a gallon of wine, thehourly wage rate in the wine sector will be . Wages in the cheese sector will behigher if ; wages in the wine sector will be higher if .Because everyone will want to work in whichever industry offers the higher wage, theeconomy will specialize in the production of cheese if . On the otherhand, it will specialize in the production of wine if . Only when is equal to will both goods be produced.
What is the significance of the number ? We saw in the previous section that itis the opportunity cost of cheese in terms of wine. We have therefore just derived a crucialproposition about the relationship between prices and production: The economy will spe-cialize in the production of cheese if the relative price of cheese exceeds its opportunitycost in terms of wine; it will specialize in the production of wine if the relative price ofcheese is less than its opportunity cost in terms of wine.
aLC/aLW
aLC/aLW
PC/PWPC/PW 6 aLC/aLW
PC/PW 7 aLC/aLW
PC/PW 6 aLC/aLWPC/PW 7 aLC/aLW
PW/aLW
aLWPC/aLC
aLC
PWPC
aLC/aLW
1/aLW
aLC
M03_KRUG6654_09_SE_C03.QXD 9/1/10 8:16 PM Page 28

CHAPTER 3 Labor Productivity and Comparative Advantage: The Ricardian Model 29
In the absence of international trade, Home would have to produce both goods foritself. But it will produce both goods only if the relative price of cheese is just equal to itsopportunity cost. Since opportunity cost equals the ratio of unit labor requirements incheese and wine, we can summarize the determination of prices in the absence of interna-tional trade with a simple labor theory of value: In the absence of international trade, therelative prices of goods are equal to their relative unit labor requirements.
Trade in a One-Factor WorldTo describe the pattern and effects of trade between two countries when each country has onlyone factor of production is simple. Yet the implications of this analysis can be surprising.Indeed, to those who have not thought about international trade, many of these implicationsseem to conflict with common sense. Even this simplest of trade models can offer someimportant guidance on real-world issues, such as what constitutes fair international competi-tion and fair international exchange.
Before we get to these issues, however, let us get the model stated. Suppose that thereare two countries. One of them we again call Home and the other we call Foreign. Each ofthese countries has one factor of production (labor) and can produce two goods, wine andcheese. As before, we denote Home’s labor force by L and Home’s unit labor requirementsin wine and cheese production by and respectively. For Foreign we will use aconvenient notation throughout this book: When we refer to some aspect of Foreign, wewill use the same symbol that we use for Home, but with an asterisk. Thus Foreign’s laborforce will be denoted by , Foreign’s unit labor requirements in wine and cheese will bedenoted by and , respectively, and so on.
In general, the unit labor requirements can follow any pattern. For example, Homecould be less productive than Foreign in wine but more productive in cheese, or vice versa.For the moment, we make only one arbitrary assumption: that
(3-2)
or, equivalently, that
(3-3)
In words, we are assuming that the ratio of the labor required to produce a pound ofcheese to that required to produce a gallon of wine is lower in Home than it is in Foreign.More briefly still, we are saying that Home’s relative productivity in cheese is higher thanit is in wine.
But remember that the ratio of unit labor requirements is equal to the opportunity costof cheese in terms of wine; and remember also that we defined comparative advantageprecisely in terms of such opportunity costs. So the assumption about relative productivi-ties embodied in equations (3-2) and (3-3) amounts to saying that Home has a compara-tive advantage in cheese.
One point should be noted immediately: The condition under which Home has thiscomparative advantage involves all four unit labor requirements, not just two. You mightthink that to determine who will produce cheese, all you need to do is compare the twocountries’ unit labor requirements in cheese production, and . If , Homelabor is more efficient than Foreign in producing cheese. When one country can produce aunit of a good with less labor than another country, we say that the first country has anabsolute advantage in producing that good. In our example, Home has an absolute advan-tage in producing cheese.
aLC 6 aLC*aLC
*aLC
aLC/aLC*
6 aLW/aLW* .
aLC/aLW 6 aLC* /aLW
*
aLC*aLW
*L*
aLC ,aLW
M03_KRUG6654_09_SE_C03.QXD 9/1/10 8:16 PM Page 29
30 PART ONE International Trade Theory
What we will see in a moment, however, is that we cannot determine the pattern oftrade from absolute advantage alone. One of the most important sources of error indiscussing international trade is to confuse comparative advantage with absoluteadvantage.
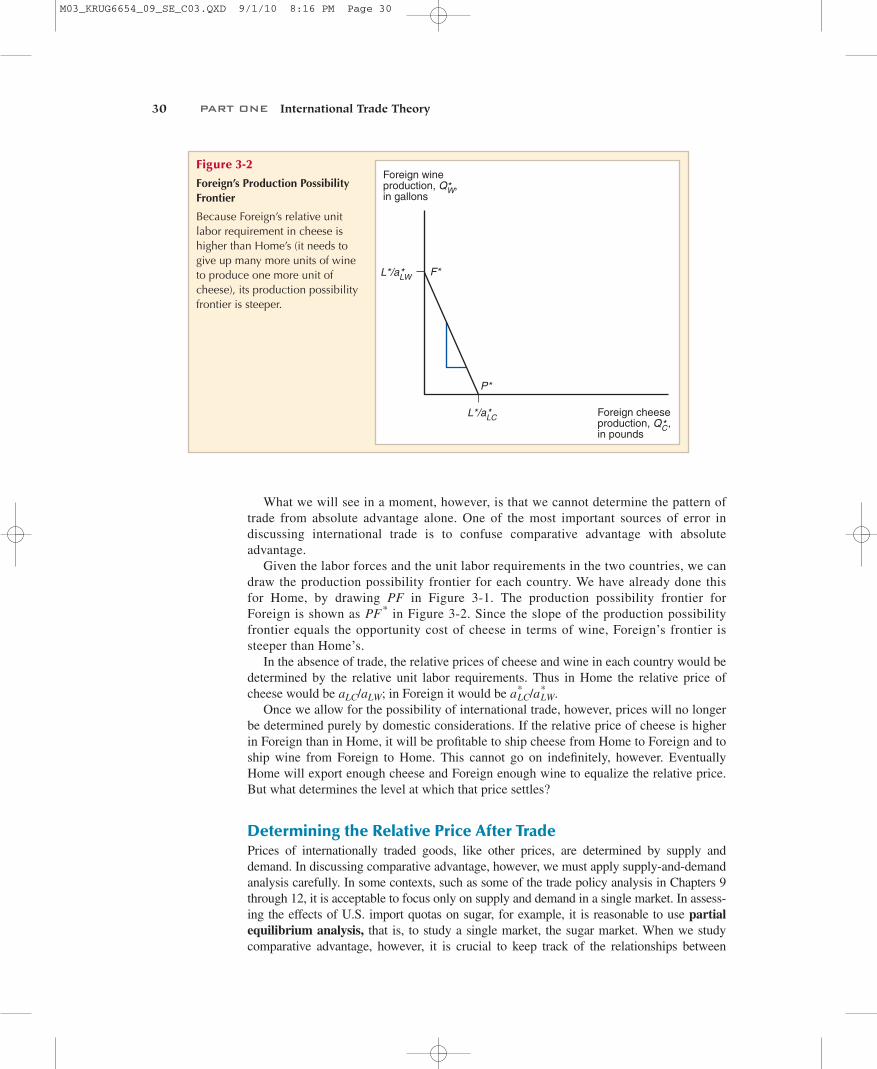
Given the labor forces and the unit labor requirements in the two countries, we candraw the production possibility frontier for each country. We have already done thisfor Home, by drawing PF in Figure 3-1. The production possibility frontier forForeign is shown as in Figure 3-2. Since the slope of the production possibilityfrontier equals the opportunity cost of cheese in terms of wine, Foreign’s frontier issteeper than Home’s.
In the absence of trade, the relative prices of cheese and wine in each country would bedetermined by the relative unit labor requirements. Thus in Home the relative price ofcheese would be ; in Foreign it would be .
Once we allow for the possibility of international trade, however, prices will no longerbe determined purely by domestic considerations. If the relative price of cheese is higherin Foreign than in Home, it will be profitable to ship cheese from Home to Foreign and toship wine from Foreign to Home. This cannot go on indefinitely, however. EventuallyHome will export enough cheese and Foreign enough wine to equalize the relative price.But what determines the level at which that price settles?
Determining the Relative Price After TradePrices of internationally traded goods, like other prices, are determined by supply anddemand. In discussing comparative advantage, however, we must apply supply-and-demandanalysis carefully. In some contexts, such as some of the trade policy analysis in Chapters 9through 12, it is acceptable to focus only on supply and demand in a single market. In assess-ing the effects of U.S. import quotas on sugar, for example, it is reasonable to use partialequilibrium analysis, that is, to study a single market, the sugar market. When we studycomparative advantage, however, it is crucial to keep track of the relationships between
aLC* /aLW
*aLC/aLW
PF*
Foreign wineproduction, QW,in gallons
L*/aLW
L*/aLC Foreign cheeseproduction, QC,in pounds
P*
**
*
* F*
Figure 3-2
Foreign’s Production PossibilityFrontier
Because Foreign’s relative unitlabor requirement in cheese ishigher than Home’s (it needs togive up many more units of wineto produce one more unit ofcheese), its production possibilityfrontier is steeper.
M03_KRUG6654_09_SE_C03.QXD 9/1/10 8:16 PM Page 30
CHAPTER 3 Labor Productivity and Comparative Advantage: The Ricardian Model 31
markets (in our example, the markets for wine and cheese). Since Home exports cheese onlyin return for imports of wine, and Foreign exports wine in return for cheese, it can be mis-leading to look at the cheese and wine markets in isolation. What is needed is generalequilibrium analysis, which takes account of the linkages between the two markets.
One useful way to keep track of two markets at once is to focus not just on the quanti-ties of cheese and wine supplied and demanded but also on the relative supply anddemand, that is, on the number of pounds of cheese supplied or demanded divided by thenumber of gallons of wine supplied or demanded.
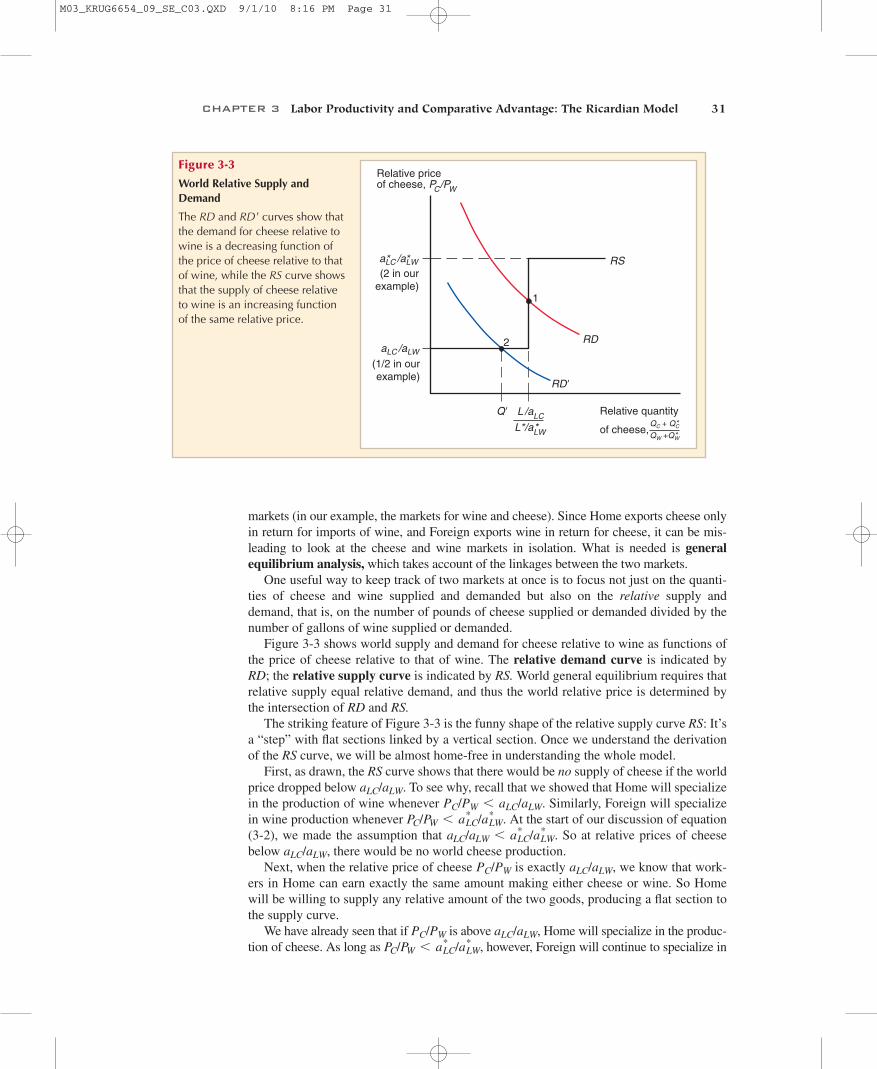
Figure 3-3 shows world supply and demand for cheese relative to wine as functions ofthe price of cheese relative to that of wine. The relative demand curve is indicated byRD; the relative supply curve is indicated by RS. World general equilibrium requires thatrelative supply equal relative demand, and thus the world relative price is determined bythe intersection of RD and RS.
The striking feature of Figure 3-3 is the funny shape of the relative supply curve RS: It’sa “step” with flat sections linked by a vertical section. Once we understand the derivationof the RS curve, we will be almost home-free in understanding the whole model.
First, as drawn, the RS curve shows that there would be no supply of cheese if the worldprice dropped below . To see why, recall that we showed that Home will specializein the production of wine whenever . Similarly, Foreign will specializein wine production whenever . At the start of our discussion of equation(3-2), we made the assumption that . So at relative prices of cheesebelow , there would be no world cheese production.
Next, when the relative price of cheese is exactly , we know that work-ers in Home can earn exactly the same amount making either cheese or wine. So Homewill be willing to supply any relative amount of the two goods, producing a flat section tothe supply curve.
We have already seen that if is above , Home will specialize in the produc-tion of cheese. As long as , however, Foreign will continue to specialize inPC/PW 6 aLC
* /aLW*
aLC/aLWPC/PW
aLC/aLWPC/PW
aLC/aLW
aLC/aLW 6 aLC* /aLW
*PC/PW 6 aLC
* /aLW*
PC/PW 6 aLC/aLW
aLC/aLW
Relative priceof cheese, PC/PW
aLC /aLW
L /aLC Relative quantity
of cheese,
RD
*
RD
L*/aLW*
Q
*
aLC /aLW
QC + QC
QW +QW*
1
2
RS
*
(2 in ourexample)
(1/2 in ourexample)
Figure 3-3
World Relative Supply andDemand
The RD and RD ¿ curves show thatthe demand for cheese relative towine is a decreasing function ofthe price of cheese relative to thatof wine, while the RS curve showsthat the supply of cheese relativeto wine is an increasing functionof the same relative price.
M03_KRUG6654_09_SE_C03.QXD 9/1/10 8:16 PM Page 31
32 PART ONE International Trade Theory
producing wine. When Home specializes in cheese production, it produces pounds.Similarly, when Foreign specializes in wine, it produces gallons. So for any relativeprice of cheese between and , the relative supply of cheese is
(3-4)
At we know that Foreign workers are indifferent between producingcheese and wine. Thus here we again have a flat section of the supply curve.
Finally, for , both Home and Foreign will specialize in cheese pro-duction. There will be no wine production, so that the relative supply of cheese willbecome infinite.
A numerical example may help at this point. Let’s assume, as we did before, that inHome it takes one hour of labor to produce a pound of cheese and two hours to pro-duce a gallon of wine. Meanwhile, let’s assume that in Foreign it takes six hours toproduce a pound of cheese—Foreign workers are much less productive than Homeworkers when it comes to cheesemaking—but only three hours to produce a gallonof wine.
In this case, the opportunity cost of cheese production in terms of wine is 1/2 in Home—that is, the labor used to produce a pound of cheese could have produced half a gallon ofwine. So the lower flat section of RS corresponds to a relative price of 1/2.
Meanwhile, in Foreign the opportunity cost of cheese in terms of wine is 2: The sixhours of labor required to produce a pound of cheese could have produced two gallons ofwine. So the upper flat section of RS corresponds to a relative price of 2.
The relative demand curve RD does not require such exhaustive analysis. The down-ward slope of RD reflects substitution effects. As the relative price of cheese rises,consumers will tend to purchase less cheese and more wine, so the relative demand forcheese falls.
The equilibrium relative price of cheese is determined by the intersection of the rela-tive supply and relative demand curves. Figure 3-3 shows a relative demand curve RDthat intersects the RS curve at point 1, where the relative price of cheese is between thetwo countries’ pretrade prices—say, at a relative price of 1, in between the pretrade prices of 1/2 and 2. In this case, each country specializes in the production of the good in whichit has a comparative advantage: Home produces only cheese, while Foreign producesonly wine.
This is not, however, the only possible outcome. If the relevant RD curve were , forexample, relative supply and relative demand would intersect on one of the horizontal sec-tions of RS. At point 2 the world relative price of cheese after trade is , the same asthe opportunity cost of cheese in terms of wine in Home.
What is the significance of this outcome? If the relative price of cheese is equal toits opportunity cost in Home, the Home economy need not specialize in producingeither cheese or wine. In fact, at point 2 Home must be producing both some wine andsome cheese; we can infer this from the fact that the relative supply of cheese (point on the horizontal axis) is less than it would be if Home were in fact completely special-ized. Since is below the opportunity cost of cheese in terms of wine in Foreign,however, Foreign does specialize completely in producing wine. It therefore remainstrue that if a country does specialize, it will do so in the good in which it has a compar-ative advantage.
For the moment, let’s leave aside the possibility that one of the two countries does notcompletely specialize. Except in this case, the normal result of trade is that the price of a
PC/PW
Qœ
aLC/aLW
RDœ
PC/PW 7 aLC* /aLW
*
PC/PW = aLC* /aLW
* ,
1L/aLC2/1L*/aLW
* 2.
aLC* /aLW
*aLC/aLW
L*/aLW*
L/aLC
M03_KRUG6654_09_SE_C03.QXD 9/1/10 8:16 PM Page 32

CHAPTER 3 Labor Productivity and Comparative Advantage: The Ricardian Model 33
traded good (e.g., cheese) relative to that of another good (wine) ends up somewhere inbetween its pretrade levels in the two countries.
The effect of this convergence in relative prices is that each country specializes in the pro-duction of that good in which it has the relatively lower unit labor requirement. The rise in therelative price of cheese in Home will lead Home to specialize in the production of cheese, pro-ducing at point F in Figure 3-4a. The fall in the relative price of cheese in Foreign will leadForeign to specialize in the production of wine, producing at point in Figure 3-4b.F*
Comparative Advantage in Practice: The Case of Babe Ruth
Everyone knows that Babe Ruth was the greatest slug-ger in the history of baseball. Only true fans of thesport know, however, that Ruth also was one of thegreatest pitchers of all time. Because Ruth stoppedpitching after 1918 and played outfield during all thetime he set his famous batting records, most peopledon’t realize that he even couldpitch. What explains Ruth’s lop-sided reputation as a batter? Theanswer is provided by the principleof comparative advantage.
As a player with the BostonRed Sox early in his career, Ruthcertainly had an absolute advan-tage in pitching. According tohistorian Geoffrey C. Ward andfilmmaker Ken Burns:
In the Red Sox’s greatestyears, he was their greatestplayer, the best left-handedpitcher in the American League,winning 89 games in six seasons. In 1916 hegot his first chance to pitch in the World Seriesand made the most of it. After giving up a runin the first, he drove in the tying run himself,after which he held the Brooklyn Dodgersscoreless for eleven innings until his team-mates could score the winning run. . . . In the1918 series, he would show that he could stillhandle them, stretching his series record to
scoreless innings, a mark that stood forforty-three years.*
The Babe’s World Series pitching record wasbroken by New York Yankee Whitey Ford in thesame year, 1961, that his teammate Roger Maris
shattered Ruth’s 1927 record of60 home runs in a single season.
Although Ruth had an absoluteadvantage in pitching, his skill asa batter relative to his teammates’abilities was even greater: Hiscomparative advantage was at theplate. As a pitcher, however, Ruthhad to rest his arm betweenappearances and therefore couldnot bat in every game. To exploitRuth’s comparative advantage,the Red Sox moved him to centerfield in 1919 so that he could batmore frequently.
The payoff to having Ruthspecialize in batting was huge. In 1919, he hit 29home runs, “more than any player had ever hit in asingle season,” according to Ward and Burns. TheYankees kept Ruth in the outfield (and at the plate)after they acquired him in 1920. They knew a goodthing when they saw it. That year, Ruth hit 54 homeruns, set a slugging record (bases divided by at bats)that remains untouched to this day, and turned theYankees into baseball’s most renowned franchise.
292/3
*See Edward Scahill, “Did Babe Ruth Have a Comparative Advantage as a Pitcher?”, Journal of Economic Education 21(4),Fall 1990, pp. 402–410. Ruth’s career preceded the designated hitter rule, so American League pitchers, like National Leaguepitchers today, took their turns at bat.
M03_KRUG6654_09_SE_C03.QXD 9/1/10 8:16 PM Page 33
34 PART ONE International Trade Theory
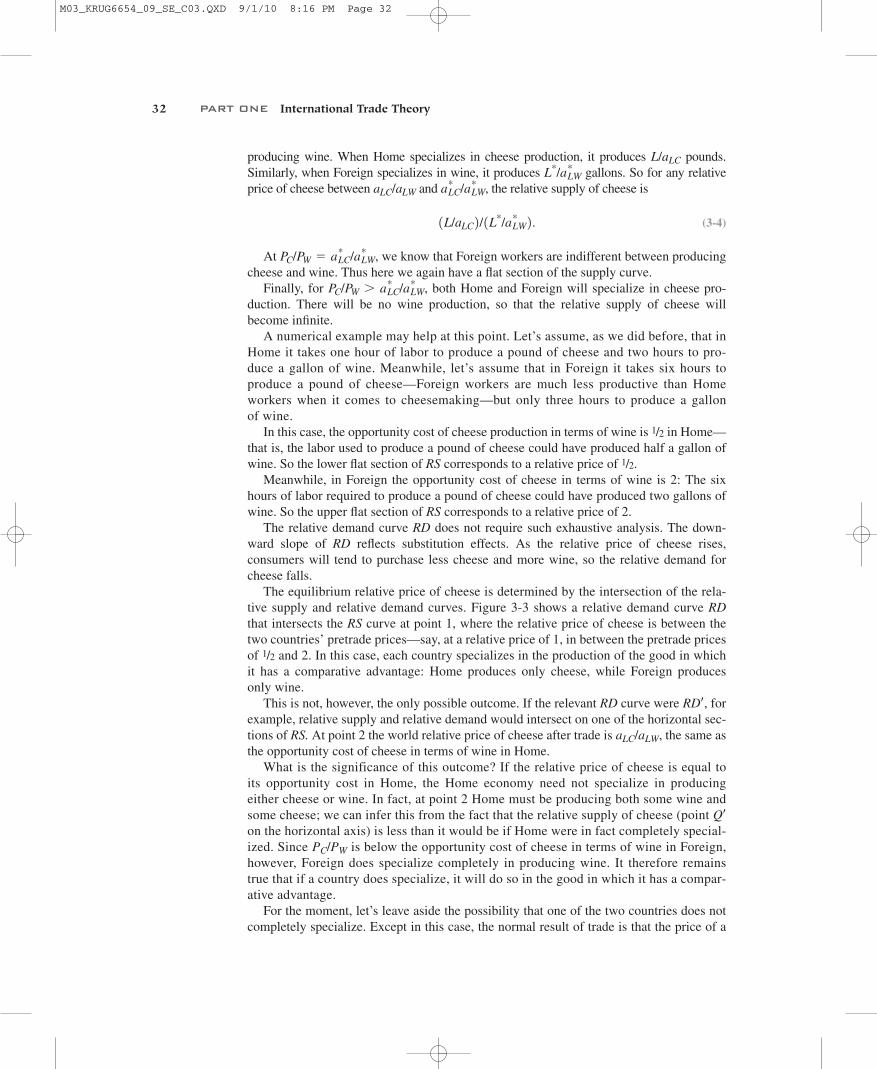
The Gains from TradeWe have now seen that countries whose relative labor productivities differ across indus-tries will specialize in the production of different goods. We next show that both countriesderive gains from trade from this specialization. This mutual gain can be demonstrated intwo alternative ways.
The first way to show that specialization and trade are beneficial is to think of trade asan indirect method of production. Home could produce wine directly, but trade withForeign allows it to “produce” wine by producing cheese and then trading the cheese forwine. This indirect method of “producing” a gallon of wine is a more efficient methodthan direct production.
Consider our numerical example yet again: In Home, we assume that it takes one hourto produce a pound of cheese and two hours to produce a gallon of wine. This means thatthe opportunity cost of cheese in terms of wine is 1/2. But we know that the relative priceof cheese after trade will be higher than this, say 1. So here’s one way to see the gainsfrom trade for Home: Instead of using two hours of labor to produce a gallon of wine, itcan use that labor to produce two pounds of cheese, and trade that cheese for two gallonsof wine.
More generally, consider two alternative ways of using an hour of labor. On one side,Home could use the hour directly to produce gallons of wine. Alternatively, Homecould use the hour to produce pounds of cheese. This cheese could then be tradedfor wine, with each pound trading for gallons, so our original hour of labor yields
gallons of wine. This will be more wine than the hour could haveproduced directly as long as11/aLC21PC/PW2
PC/PW
1/aLC
1/aLW
(b) Foreign(a) Home
Quantityof wine, QW
P*
F*
T*
P
F
T
Quantityof wine, QW*
Quantityof cheese, QC
Quantityof cheese, QC*
Figure 3-4
Trade Expands Consumption PossibilitiesInternational trade allows Home and Foreign to consume anywhere within the colored lines,which lie outside the countries’ production frontiers.
M03_KRUG6654_09_SE_C03.QXD 9/1/10 8:16 PM Page 34
CHAPTER 3 Labor Productivity and Comparative Advantage: The Ricardian Model 35
(3-5)
or
But we just saw that in international equilibrium, if neither country produces both goods,we must have . This shows that Home can “produce” wine more effi-ciently by making cheese and trading it than by producing wine directly for itself.Similarly, Foreign can “produce” cheese more efficiently by making wine and trading it.This is one way of seeing that both countries gain.
Another way to see the mutual gains from trade is to examine how trade affects eachcountry’s possibilities for consumption. In the absence of trade, consumption possibilitiesare the same as production possibilities (the solid lines PF and in Figure 3-4). Oncetrade is allowed, however, each economy can consume a different mix of cheese and winefrom the mix it produces. Home’s consumption possibilities are indicated by the coloredline TF in Figure 3-4a, while Foreign’s consumption possibilities are indicated by inFigure 3-4b. In each case, trade has enlarged the range of choice, and therefore it mustmake residents of each country better off.
A Note on Relative WagesPolitical discussions of international trade often focus on comparisons of wage rates indifferent countries. For example, opponents of trade between the United States andMexico often emphasize the point that workers in Mexico are paid only about $2 per hour,compared with more than $15 per hour for the typical worker in the United States. Ourdiscussion of international trade up to this point has not explicitly compared wages in thetwo countries, but it is possible in the context of our numerical example to determine howthe wage rates in the two countries compare.
In our example, once the countries have specialized, all Home workers are employedproducing cheese. Since it takes one hour of labor to produce one pound of cheese, work-ers in Home earn the value of one pound of cheese per hour of their labor. Similarly,Foreign workers produce only wine; since it takes three hours for them to produce eachgallon, they earn the value of 1/3 of a gallon of wine per hour.
To convert these numbers into dollar figures, we need to know the prices of cheese andwine. Suppose that a pound of cheese and a gallon of wine both sell for $12; then Home work-ers will earn $12 per hour, while Foreign workers will earn $4 per hour. The relative wage of acountry’s workers is the amount they are paid per hour, compared with the amount workers inanother country are paid per hour. The relative wage of Home workers will therefore be 3.
Clearly, this relative wage does not depend on whether the price of a pound of cheese is$12 or $20, as long as a gallon of wine sells for the same price. As long as the relative priceof cheese—the price of a pound of cheese divided by the price of a gallon of wine—is 1, thewage of Home workers will be three times that of Foreign workers.
Notice that this wage rate lies between the ratios of the two countries’ productivities inthe two industries. Home is six times as productive as Foreign in cheese, but only one-and-a-half times as productive in wine, and it ends up with a wage rate three times as high asForeign’s. It is precisely because the relative wage is between the relative productivities thateach country ends up with a cost advantage in one good. Because of its lower wage rate,Foreign has a cost advantage in wine even though it has lower productivity. Home has a costadvantage in cheese, despite its higher wage rate, because the higher wage is more thanoffset by its higher productivity.
T*F*
P*F*
PC/PW 7 aLC/aLW
PC/PW 7 aLC/aLW.
11/aLC21PC/PW2 7 1/aLW,
M03_KRUG6654_09_SE_C03.QXD 9/1/10 8:16 PM Page 35
36 PART ONE International Trade Theory
We have now developed the simplest of all models of international trade. Even thoughthe Ricardian one-factor model is far too simple to be a complete analysis of either thecauses or the effects of international trade, a focus on relative labor productivities can be avery useful tool for thinking about trade issues. In particular, the simple one-factor modelis a good way to deal with several common misconceptions about the meaning of compar-ative advantage and the nature of the gains from free trade. These misconceptions appearso frequently in public debate about international economic policy, and even in statementsby those who regard themselves as experts, that in the next section we take time out to dis-cuss some of the most common misunderstandings about comparative advantage in lightof our model.
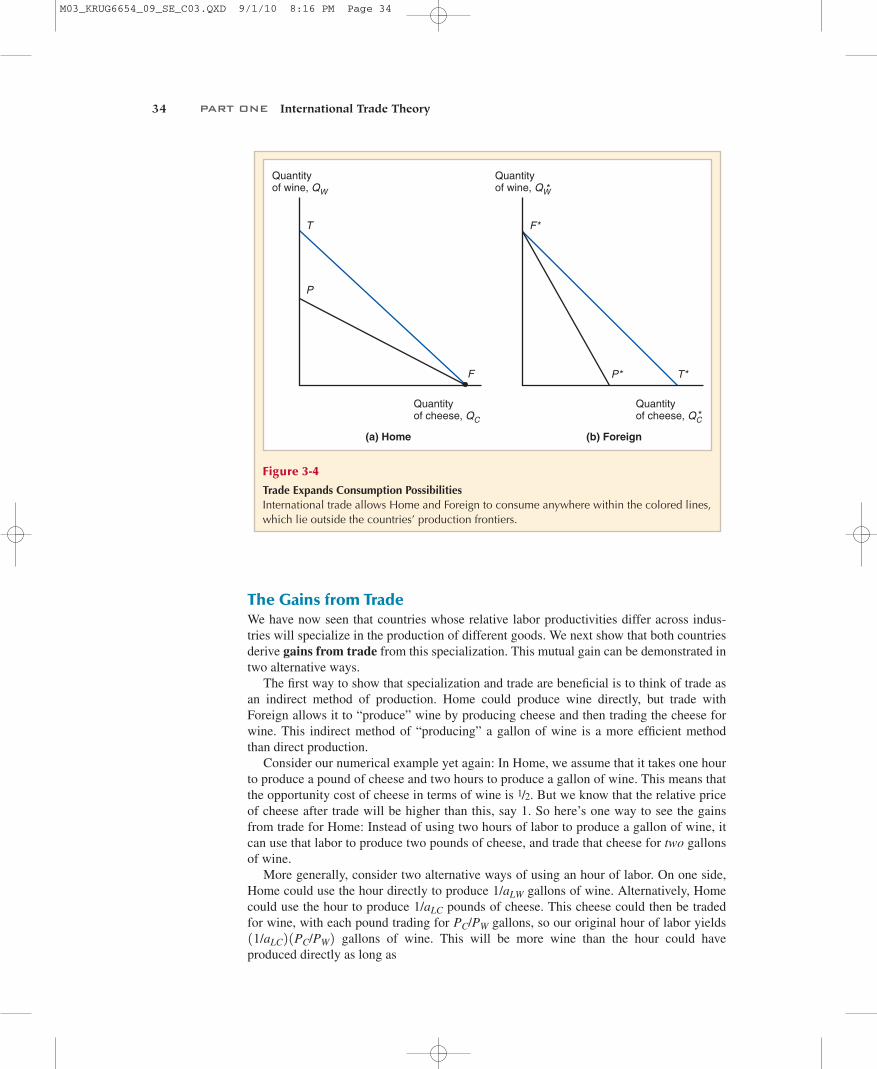
The Losses from Nontrade
Our discussion of the gains from trade was con-sidered a “thought experiment” in which wecompared two situations: one in which countriesdo not trade at all and another in which they havefree trade. It’s a hypothetical case that helps us to understand the principles of internationaleconomics, but it does not have much to do withactual events. After all, countries don’t suddenlygo from no trade to free trade or vice versa. Ordo they?
As economic historianDouglas Irwin* has pointed out,in the early history of the UnitedStates the country actually didcarry out something very close tothe thought experiment of mov-ing from free trade to no trade.The historical context was as fol-lows: In the early 19th centuryBritain and France were engagedin a massive military struggle, the NapoleonicWars. Both countries endeavored to bring economicpressures to bear: France tried to keep Europeancountries from trading with Britain, while Britainimposed a blockade on France. The young UnitedStates was neutral in the conflict but suffered con-siderably. In particular, the British navy oftenseized U.S. merchant ships and, on occasion,forcibly recruited their crews into its service.
In an effort to pressure Britain into ceasing thesepractices, President Thomas Jefferson declared a
complete ban on overseas shipping. This embargowould deprive both the United States and Britain ofthe gains from trade, but Jefferson hoped thatBritain would be hurt more and would agree to stopits depredations.
Irwin presents evidence suggesting that the em-bargo was quite effective: Although some smug-gling took place, trade between the United Statesand the rest of the world was drastically reduced. In
effect, the United States gave upinternational trade for a while.
The costs were substantial.Although quite a lot of guess-work is involved, Irwin suggeststhat real income in the UnitedStates may have fallen by about8 percent as a result of theembargo. When you bear in mindthat in the early 19th century onlya fraction of output could be
traded—transport costs were still too high, forexample, to allow large-scale shipments of com-modities like wheat across the Atlantic—that’s apretty substantial sum.
Unfortunately for Jefferson’s plan, Britain didnot seem to feel equal pain and showed no inclina-tion to give in to U.S. demands. Fourteen monthsafter the embargo was imposed, it was repealed.Britain continued its practices of seizing Americancargoes and sailors; three years later the two coun-tries went to war.
*Douglas Irwin, “The Welfare Cost of Autarky: Evidence from the Jeffersonian Trade Embargo, 1807–1809,” NationalBureau of Economic Research Working Paper No. 8692, December 2001.
M03_KRUG6654_09_SE_C03.QXD 9/1/10 8:16 PM Page 36

CHAPTER 3 Labor Productivity and Comparative Advantage: The Ricardian Model 37
Misconceptions About Comparative AdvantageThere is no shortage of muddled ideas in economics. Politicians, business leaders, and eveneconomists frequently make statements that do not stand up to careful economic analysis.For some reason this seems to be especially true in international economics. Open the busi-ness section of any Sunday newspaper or weekly news magazine and you will probably findat least one article that makes foolish statements about international trade. Three misconcep-tions in particular have proved highly persistent. In this section we will use our simple modelof comparative advantage to see why they are incorrect.
Productivity and CompetitivenessMyth 1: Free trade is beneficial only if your country is strong enough to stand up to for-eign competition. This argument seems extremely plausible to many people. For example,a well-known historian once criticized the case for free trade by asserting that it may fail tohold in reality: “What if there is nothing you can produce more cheaply or efficiently thananywhere else, except by constantly cutting labor costs?” he worried.2
The problem with this commentator’s view is that he failed to understand the essentialpoint of Ricardo’s model—that gains from trade depend on comparative rather thanabsolute advantage. He is concerned that your country may turn out not to have anything itproduces more efficiently than anyone else—that is, that you may not have an absoluteadvantage in anything. Yet why is that such a terrible thing? In our simple numericalexample of trade, Home has lower unit labor requirements and hence higher productivityin both the cheese and wine sectors. Yet, as we saw, both countries gain from trade.
It is always tempting to suppose that the ability to export a good depends on yourcountry having an absolute advantage in productivity. But an absolute productivityadvantage over other countries in producing a good is neither a necessary nor a sufficientcondition for having a comparative advantage in that good. In our one-factor model, thereason that an absolute productivity advantage in an industry is neither necessary nor suf-ficient to yield competitive advantage is clear: The competitive advantage of an industrydepends not only on its productivity relative to the foreign industry, but also on thedomestic wage rate relative to the foreign wage rate. A country’s wage rate, in turn,depends on relative productivity in its other industries. In our numerical example,Foreign is less efficient than Home in the manufacture of wine, but it is at an even greaterrelative productivity disadvantage in cheese. Because of its overall lower productivity,Foreign must pay lower wages than Home, sufficiently lower that it ends up with lowercosts in wine production. Similarly, in the real world, Portugal has low productivity inproducing, say, clothing as compared with the United States, but because Portugal’s pro-ductivity disadvantage is even greater in other industries, it pays low enough wages tohave a comparative advantage in clothing over the United States all the same.
But isn’t a competitive advantage based on low wages somehow unfair? Many peoplethink so; their beliefs are summarized by our second misconception.
The Pauper Labor ArgumentMyth 2: Foreign competition is unfair and hurts other countries when it is based on lowwages. This argument, sometimes referred to as the pauper labor argument, is a par-ticular favorite of labor unions seeking protection from foreign competition. Peoplewho adhere to this belief argue that industries should not have to cope with foreignindustries that are less efficient but pay lower wages. This view is widespread and has
2Paul Kennedy, “The Threat of Modernization,” New Perspectives Quarterly (Winter 1995), pp. 31–33.
M03_KRUG6654_09_SE_C03.QXD 9/1/10 8:16 PM Page 37

38 PART ONE International Trade Theory
acquired considerable political influence. In 1993, Ross Perot, a self-made billionaireand former presidential candidate, warned that free trade between the United States andMexico, with the latter’s much lower wages, would lead to a “giant sucking sound” asU.S. industry moved south. In the same year, another self-made billionaire, Sir JamesGoldsmith, who was an influential member of the European Parliament, offered similarif less picturesquely expressed views in his book The Trap, which became a best sellerin France.
Again, our simple example reveals the fallacy of this argument. In the example, Homeis more productive than Foreign in both industries, and Foreign’s lower cost of wine pro-duction is entirely due to its much lower wage rate. Foreign’s lower wage rate, however, isirrelevant to the question of whether Home gains from trade. Whether the lower cost ofwine produced in Foreign is due to high productivity or low wages does not matter. Allthat matters to Home is that it is cheaper in terms of its own labor for Home to producecheese and trade it for wine than to produce wine for itself.
This is fine for Home, but what about Foreign? Isn’t there something wrong with bas-ing one’s exports on low wages? Certainly it is not an attractive position to be in, but theidea that trade is good only if you receive high wages is our final fallacy.
Do Wages Reflect Productivity?
In the numerical example that we use to puncturecommon misconceptions about comparative advan-tage, we assume that the relative wage of the twocountries reflects their relative productivity—specifi-cally, that the ratio of Home to Foreign wages is in arange that gives each country a cost advantage in oneof the two goods. This is a necessary implication ofour theoretical model. But many people are uncon-vinced by that model. In particular, rapid increases inproductivity in “emerging” economies like Chinahave worried some Western observers, who arguethat these countries will continue to pay low wageseven as their productivity increases—putting high-wage countries at a cost disadvantage—and dismissthe contrary predictions of orthodox economists asunrealistic theoretical speculation. Leaving aside thelogic of this position, what is the evidence?
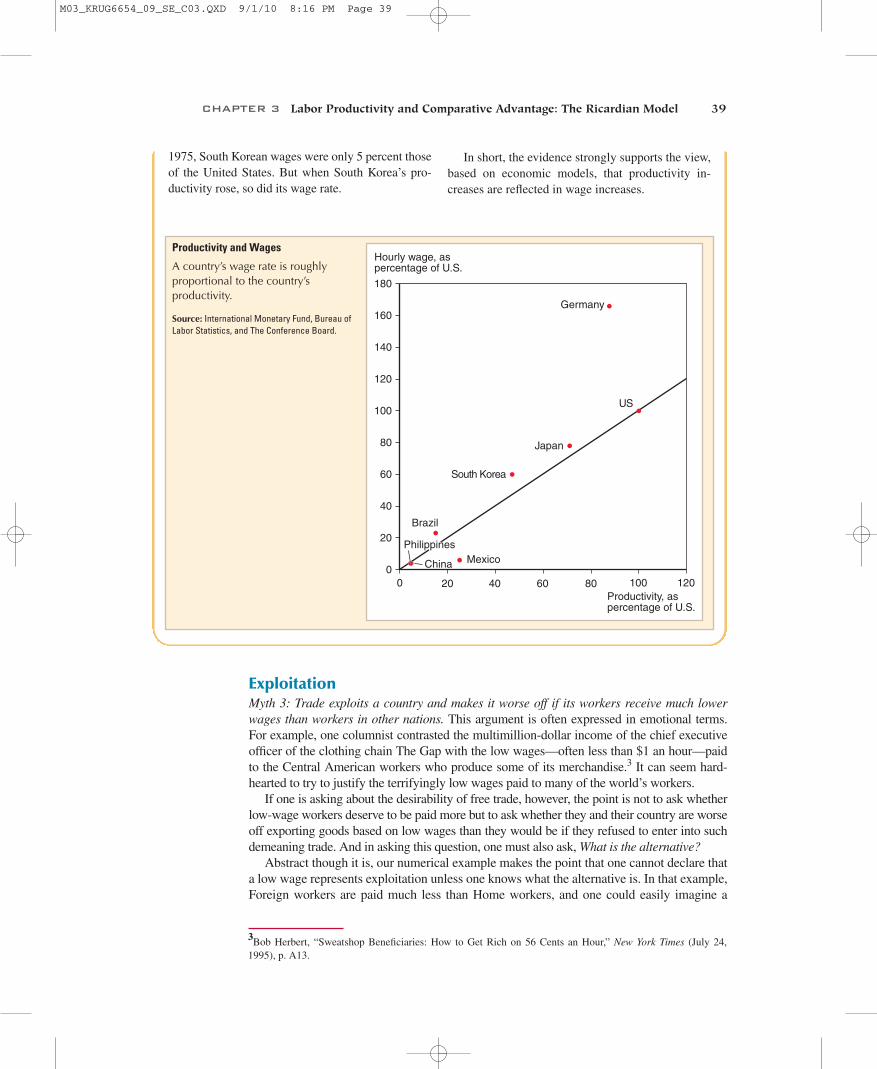
The answer is that in the real world, national wagerates do, in fact, reflect differences in productivity. Theaccompanying figure compares estimates of produc-tivity with estimates of wage rates for a selection ofcountries in 2007. Both measures are expressed as per-centages of U.S. levels. Our estimate of productivity isGDP per worker measured in U.S. dollars. As we’llsee in the second half of this book, that basis shouldindicate productivity in the production of traded goods.Wage rates are measured by wages in manufacturing.
If wages were exactly proportional to productiv-ity, all the points in this chart would lie along the in-dicated 45-degree line. In reality, the fit isn’t bad. Inparticular, low wage rates in China and India reflectlow productivity.
The low estimate of overall Chinese productivitymay seem surprising, given all the stories one hearsabout Americans who find themselves competingwith Chinese exports. The Chinese workers produc-ing those exports don’t seem to have extremely lowproductivity. But remember what the theory of com-parative advantage says: Countries export the goodsin which they have relatively high productivity. Soit’s only to be expected that China’s overall relativeproductivity is far below the level of its exportindustries.
The figure that follows tells us that the orthodoxeconomists’ view that national wage rates reflectnational productivity is, in fact, verified by the dataat a point in time. It’s also true that in the past, risingrelative productivity led to rising wages. Consider,for example, the case of South Korea. In 2007, SouthKorea’s labor productivity was about a half-percentof the U.S. level, and its wage rate was actuallyslightly higher than that. But it wasn’t always thatway: In the not too distant past, South Korea was alow-productivity, low-wage economy. As recently as
M03_KRUG6654_09_SE_C03.QXD 9/1/10 8:16 PM Page 38
CHAPTER 3 Labor Productivity and Comparative Advantage: The Ricardian Model 39
3Bob Herbert, “Sweatshop Beneficiaries: How to Get Rich on 56 Cents an Hour,” New York Times (July 24,1995), p. A13.
Productivity and Wages
A country’s wage rate is roughlyproportional to the country’sproductivity.
Source: International Monetary Fund, Bureau ofLabor Statistics, and The Conference Board.
1975, South Korean wages were only 5 percent thoseof the United States. But when South Korea’s pro-ductivity rose, so did its wage rate.
In short, the evidence strongly supports the view,based on economic models, that productivity in-creases are reflected in wage increases.
ExploitationMyth 3: Trade exploits a country and makes it worse off if its workers receive much lowerwages than workers in other nations. This argument is often expressed in emotional terms.For example, one columnist contrasted the multimillion-dollar income of the chief executiveofficer of the clothing chain The Gap with the low wages—often less than $1 an hour—paidto the Central American workers who produce some of its merchandise.3 It can seem hard-hearted to try to justify the terrifyingly low wages paid to many of the world’s workers.
If one is asking about the desirability of free trade, however, the point is not to ask whetherlow-wage workers deserve to be paid more but to ask whether they and their country are worseoff exporting goods based on low wages than they would be if they refused to enter into suchdemeaning trade. And in asking this question, one must also ask, What is the alternative?
Abstract though it is, our numerical example makes the point that one cannot declare thata low wage represents exploitation unless one knows what the alternative is. In that example,Foreign workers are paid much less than Home workers, and one could easily imagine a
100
20
01000 20 40 60 80 120
80
60
40
120
140
160
180
Hourly wage, aspercentage of U.S.
Productivity, aspercentage of U.S.
China Mexico
Brazil
Germany
Philippines
South Korea
Japan
US
M03_KRUG6654_09_SE_C03.QXD 9/1/10 8:16 PM Page 39
40 PART ONE International Trade Theory
columnist writing angrily about their exploitation. Yet if Foreign refused to let itself be“exploited” by refusing to trade with Home (or by insisting on much higher wages in itsexport sector, which would have the same effect), real wages would be even lower: The pur-chasing power of a worker’s hourly wage would fall from 1/3 to 1/6 pound of cheese.
The columnist who pointed out the contrast in incomes between the executive at TheGap and the workers who make its clothes was angry at the poverty of Central Americanworkers. But to deny them the opportunity to export and trade might well be to condemnthem to even deeper poverty.
Comparative Advantage with Many GoodsIn our discussion so far, we have relied on a model in which only two goods are produced andconsumed. This simplified analysis allows us to capture many essential points about compara-tive advantage and trade and, as we saw in the last section, gives us a surprising amount ofmileage as a tool for discussing policy issues. To move closer to reality, however, it is necessaryto understand how comparative advantage functions in a model with a larger number of goods.
Setting Up the ModelAgain, imagine a world of two countries, Home and Foreign. As before, each country hasonly one factor of production, labor. However, let’s assume that each of these countriesconsumes and is able to produce a large number of goods—say, N different goods alto-gether. We assign each of the goods a number from 1 to N.
The technology of each country can be described by its unit labor requirement for eachgood, that is, the number of hours of labor it takes to produce one unit of each good. Welabel Home’s unit labor requirement for a particular good as where i is the number wehave assigned to that good. If cheese is assigned the number 7, will mean the unit laborrequirement in cheese production. Following our usual rule, we label the correspondingForeign unit labor requirement .
To analyze trade, we next pull one more trick. For any good, we can calculate ,the ratio of Home’s unit labor requirement to Foreign’s. The trick is to relabel the goods sothat the lower the number, the lower this ratio. That is, we reshuffle the order in which wenumber goods in such a way that
(3-6)
Relative Wages and SpecializationWe are now prepared to look at the pattern of trade. This pattern depends on only onething: the ratio of Home to Foreign wages. Once we know this ratio, we can determinewho produces what.
Let w be the wage rate per hour in Home and be the wage rate in Foreign. The ratioof wage rates is then . The rule for allocating world production, then, is simply this:Goods will always be produced where it is cheapest to make them. The cost of makingsome good, say good i, is the unit labor requirement times the wage rate. To produce goodi in Home will cost . To produce the same good in Foreign will cost . It will becheaper to produce the good in Home if
which can be rearranged to yield
aLi* /aLi 7 w/w*.
waLi 6 w*aLi* ,
w*aLi*waLi
w/w*w*
aL1/aL1*
6 aL2/aL2*
6 aL3/aL13*
6 Á 6 aLN/aLN* .
aLi/aLi*
aLi*
aL7
aLi,
M03_KRUG6654_09_SE_C03.QXD 9/1/10 8:16 PM Page 40

CHAPTER 3 Labor Productivity and Comparative Advantage: The Ricardian Model 41
On the other hand, it will be cheaper to produce the good in Foreign if
which can be rearranged to yield
Thus we can restate the allocation rule: Any good for which will be pro-duced in Home, while any good for which will be produced in Foreign.
We have already lined up the goods in increasing order of (equation (3-6)). Thiscriterion for specialization tells us that there is a “cut” in the lineup determined by the ratioof the two countries’ wage rates, . All the goods to the left of that point end up beingproduced in Home; all the goods to the right end up being produced in Foreign. (It is pos-sible, as we will see in a moment, that the ratio of wage rates is exactly equal to the ratio ofunit labor requirements for one good. In that case this borderline good may be produced inboth countries.)
Table 3-2 offers a numerical example in which Home and Foreign both consume andare able to produce five goods: apples, bananas, caviar, dates, and enchiladas.
The first two columns of this table are self-explanatory. The third column is the ratio ofthe Foreign unit labor requirement to the Home unit labor requirement for each good—or,stated differently, the relative Home productivity advantage in each good. We have labeledthe goods in order of Home productivity advantage, with the Home advantage greatest forapples and least for enchiladas.
Which country produces which goods depends on the ratio of Home and Foreign wagerates. Home will have a cost advantage in any good for which its relative productivity ishigher than its relative wage, and Foreign will have the advantage in the others. If, forexample, the Home wage rate is five times that of Foreign (a ratio of Home wage toForeign wage of five to one), apples and bananas will be produced in Home and caviar,dates, and enchiladas in Foreign. If the Home wage rate is only three times that of Foreign,Home will produce apples, bananas, and caviar, while Foreign will produce only dates andenchiladas.
Is such a pattern of specialization beneficial to both countries? We can see that it is byusing the same method we used earlier: comparing the labor cost of producing a gooddirectly in a country with that of indirectly “producing” it by producing another good andtrading for the desired good. If the Home wage rate is three times the Foreign wage (putanother way, Foreign’s wage rate is one-third that of Home), Home will import dates andenchiladas. A unit of dates requires 12 units of Foreign labor to produce, but its cost interms of Home labor, given the three-to-one wage ratio, is only 4 person-hours (12/4 = 3).
w/w*
aLi/aLi*
aLi* /aLi 6 w/w*
aLi* /aLi 7 w/w*
aLi* /aLi 6 w/w*.
waLi 7 w*aLi* ,
TABLE 3-2 Home and Foreign Unit Labor Requirements
GoodHome Unit LaborRequirement aLi
Foreign Unit LaborRequirement ( )aLi
*
Relative Home Productivity
Advantage ( )aLi* /aLi
Apples 1 10 10Bananas 5 40 8Caviar 3 12 4Dates 6 12 2Enchiladas 12 9 0.75
M03_KRUG6654_09_SE_C03.QXD 9/1/10 8:16 PM Page 41
42 PART ONE International Trade Theory
This cost of 4 person-hours is less than the 6 person-hours it would take to produce theunit of dates in Home. For enchiladas, Foreign actually has higher productivity along withlower wages; it will cost Home only 3 person-hours to acquire a unit of enchiladas throughtrade, compared with the 12 person-hours it would take to produce it domestically. A sim-ilar calculation will show that Foreign also gains; for each of the goods Foreign imports, itturns out to be cheaper in terms of domestic labor to trade for the good rather than producethe good domestically. For example, it would take 10 hours of Foreign labor to produce aunit of apples; even with a wage rate only one-third that of Home workers, it will requireonly 3 hours of labor to earn enough to buy that unit of apples from Home.
In making these calculations, however, we have simply assumed that the relative wagerate is 3. How does this relative wage rate actually get determined?
Determining the Relative Wage in the Multigood ModelIn the two-good model, we determined relative wages by first calculating Home wages interms of cheese and Foreign wages in terms of wine. We then used the price of cheese rel-ative to that of wine to deduce the ratio of the two countries’ wage rates. We could do thisbecause we knew that Home would produce cheese and Foreign wine. In the many-goodcase, who produces what can be determined only after we know the relative wage rate, sowe need a new procedure. To determine relative wages in a multigood economy, we mustlook behind the relative demand for goods to the implied relative demand for labor. This isnot a direct demand on the part of consumers; rather, it is a derived demand that resultsfrom the demand for goods produced with each country’s labor.
The relative derived demand for Home labor will fall when the ratio of Home toForeign wages rises, for two reasons. First, as Home labor becomes more expensive rela-tive to Foreign labor, goods produced in Home also become relatively more expensive,and world demand for these goods falls. Second, as Home wages rise, fewer goods will beproduced in Home and more in Foreign, further reducing the demand for Home labor.
We can illustrate these two effects using our numerical example as illustrated in Table 3-2.Suppose we start with the following situation: The Home wage is initially 3.5 times theForeign wage. At that level, Home would produce apples, bananas, and caviar while Foreignwould produce dates and enchiladas. If the relative Home wage were to increase from 3.5 to3.99, the pattern of specialization would not change. However, as the goods produced inHome became relatively more expensive, the relative demand for these goods would declineand the relative demand for Home labor would decline with it.
Suppose now that the relative wage were to increase slightly from 3.99 to 4.01. Thissmall further increase in the relative Home wage would bring about a shift in the patternof specialization. Because it is now cheaper to produce caviar in Foreign than in Home,the production of caviar shifts from Home to Foreign. What does this imply for the rela-tive demand for Home labor? Clearly it implies that as the relative wage rises from a littleless than 4 to a little more than 4, there is an abrupt drop-off in the relative demand, asHome production of caviar falls to zero and Foreign acquires a new industry. If the rela-tive wage continues to rise, relative demand for Home labor will gradually decline, thendrop off abruptly at a relative wage of 8, at which point production of bananas shifts toForeign.
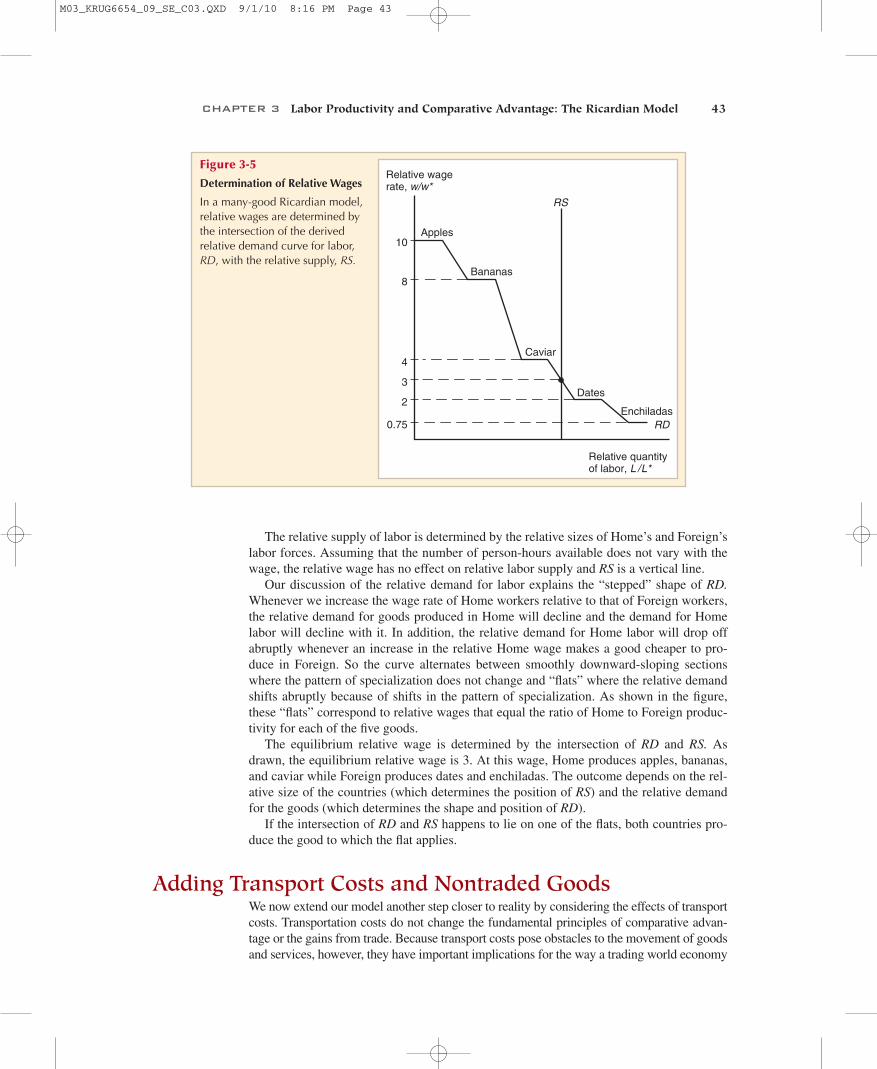
We can illustrate the determination of relative wages with a diagram like Figure 3-5.Unlike Figure 3-3, this diagram does not have relative quantities of goods or relative pricesof goods on its axes. Instead it shows the relative quantity of labor and the relative wagerate. The world demand for Home labor relative to its demand for Foreign labor is shownby the curve RD. The world supply of Home labor relative to Foreign labor is shown bythe line RS.
M03_KRUG6654_09_SE_C03.QXD 9/1/10 8:16 PM Page 42
CHAPTER 3 Labor Productivity and Comparative Advantage: The Ricardian Model 43
The relative supply of labor is determined by the relative sizes of Home’s and Foreign’slabor forces. Assuming that the number of person-hours available does not vary with thewage, the relative wage has no effect on relative labor supply and RS is a vertical line.
Our discussion of the relative demand for labor explains the “stepped” shape of RD.Whenever we increase the wage rate of Home workers relative to that of Foreign workers,the relative demand for goods produced in Home will decline and the demand for Homelabor will decline with it. In addition, the relative demand for Home labor will drop offabruptly whenever an increase in the relative Home wage makes a good cheaper to pro-duce in Foreign. So the curve alternates between smoothly downward-sloping sectionswhere the pattern of specialization does not change and “flats” where the relative demandshifts abruptly because of shifts in the pattern of specialization. As shown in the figure,these “flats” correspond to relative wages that equal the ratio of Home to Foreign produc-tivity for each of the five goods.
The equilibrium relative wage is determined by the intersection of RD and RS. Asdrawn, the equilibrium relative wage is 3. At this wage, Home produces apples, bananas,and caviar while Foreign produces dates and enchiladas. The outcome depends on the rel-ative size of the countries (which determines the position of RS) and the relative demandfor the goods (which determines the shape and position of RD).
If the intersection of RD and RS happens to lie on one of the flats, both countries pro-duce the good to which the flat applies.
Adding Transport Costs and Nontraded GoodsWe now extend our model another step closer to reality by considering the effects of transportcosts. Transportation costs do not change the fundamental principles of comparative advan-tage or the gains from trade. Because transport costs pose obstacles to the movement of goodsand services, however, they have important implications for the way a trading world economy
Relative quantityof labor, L / L*
Relative wagerate, w/w*
10
8
4
3
2
0.75
Apples
Bananas
Caviar
Dates
EnchiladasRD
RS
Figure 3-5
Determination of Relative Wages
In a many-good Ricardian model,relative wages are determined bythe intersection of the derivedrelative demand curve for labor,RD, with the relative supply, RS.
M03_KRUG6654_09_SE_C03.QXD 9/1/10 8:16 PM Page 43

44 PART ONE International Trade Theory
is affected by a variety of factors such as foreign aid, international investment, and balance ofpayments problems. While we will not deal with the effects of these factors yet, the multigoodone-factor model is a good place to introduce the effects of transport costs.
First, notice that the world economy described by the model of the last section is markedby very extreme international specialization. At most there is one good that both countriesproduce; all other goods are produced either in Home or in Foreign, but not in both.
There are three main reasons why specialization in the real international economy isnot this extreme:
1. The existence of more than one factor of production reduces the tendency toward spe-cialization (as we will see in the next two chapters).
2. Countries sometimes protect industries from foreign competition (discussed at lengthin Chapters 9 through 12).
3. It is costly to transport goods and services; in some cases the cost of transportation isenough to lead countries into self-sufficiency in certain sectors.
In the multigood example of the last section, we found that at a relative Home wage of 3, Home could produce apples, bananas, and caviar more cheaply than Foreign, whileForeign could produce dates and enchiladas more cheaply than Home. In the absence oftransport costs, then, Home will export the first three goods and import the last two.
Now suppose there is a cost to transport goods, and that this transport cost is a uniformfraction of production cost, say 100 percent. This transportation cost will discourage trade.Consider dates, for example. One unit of this good requires 6 hours of Home labor or12 hours of Foreign labor to produce. At a relative wage of 3, 12 hours of Foreign laborcosts only as much as 4 hours of Home labor; so in the absence of transport costs, Homeimports dates. With a 100 percent transport cost, however, importing dates would cost theequivalent of 8 hours of Home labor (4 hours of labor plus the equivalent of 4 hours for thetransportation costs), so Home will produce the good for itself instead.
A similar cost comparison shows that Foreign will find it cheaper to produce its owncaviar than to import it. A unit of caviar requires 3 hours of Home labor to produce. Evenat a relative Home wage of 3, which makes this the equivalent of 9 hours of Foreign labor,this is cheaper than the 12 hours Foreign would need to produce caviar for itself. In the ab-sence of transport costs, then, Foreign would find it cheaper to import caviar than to makeit domestically. With a 100 percent cost of transportation, however, imported caviar wouldcost the equivalent of 18 hours of Foreign labor and would therefore be produced locallyinstead.
The result of introducing transport costs in this example, then, is that Home will stillexport apples and bananas and import enchiladas, but caviar and dates will becomenontraded goods, which each country will produce for itself.
In this example we have assumed that transport costs are the same fraction of produc-tion cost in all sectors. In practice there is a wide range of transportation costs. In somecases transportation is virtually impossible: Services such as haircuts and auto repair can-not be traded internationally (except where there is a metropolitan area that straddles aborder, like Detroit, Michigan–Windsor, Ontario). There is also little international trade ingoods with high weight-to-value ratios, like cement. (It is simply not worth the transportcost of importing cement, even if it can be produced much more cheaply abroad.) Manygoods end up being nontraded either because of the absence of strong national cost advan-tages or because of high transportation costs.
The important point is that nations spend a large share of their income on nontradedgoods. This observation is of surprising importance in our later discussion of internationaltransfers of income (Chapter 6) and in international monetary economics.
M03_KRUG6654_09_SE_C03.QXD 9/1/10 8:16 PM Page 44

CHAPTER 3 Labor Productivity and Comparative Advantage: The Ricardian Model 45
Empirical Evidence on the Ricardian ModelThe Ricardian model of international trade is an extremely useful tool for thinking aboutthe reasons why trade may happen and about the effects of international trade on nationalwelfare. But is the model a good fit to the real world? Does the Ricardian model makeaccurate predictions about actual international trade flows?
The answer is a heavily qualified yes. Clearly there are a number of ways in which theRicardian model makes misleading predictions. First, as mentioned in our discussion ofnontraded goods, the simple Ricardian model predicts an extreme degree of specializa-tion that we do not observe in the real world. Second, the Ricardian model assumes awayeffects of international trade on the distribution of income within countries, and thuspredicts that countries as a whole will always gain from trade; in practice, internationaltrade has strong effects on income distribution. Third, the Ricardian model allows no rolefor differences in resources among countries as a cause of trade, thus missing an impor-tant aspect of the trading system (the focus of Chapters 4 and 5). Finally, the Ricardianmodel neglects the possible role of economies of scale as a cause of trade, which leaves it unable to explain the large trade flows between apparently similar nations—an issuediscussed in Chapter 7.
In spite of these failings, however, the basic prediction of the Ricardian model—thatcountries should tend to export those goods in which their productivity is relatively high—has been strongly confirmed by a number of studies over the years.
Several classic tests of the Ricardian model, performed using data from the early post-World War II period, compared British with American productivity and trade.4 This wasan unusually illuminating comparison, because it revealed that British labor productivitywas lower than American productivity in almost every sector. As a result, the UnitedStates had an absolute advantage in everything. Nonetheless, the amount of overall Britishexports was about as large as the amount of American exports at the time. Despite itslower absolute productivity, there must have been some sectors in which Britain had acomparative advantage. The Ricardian model would predict that these would be the sec-tors in which the United States’ productivity advantage was smaller.
Figure 3-6 illustrates the evidence in favor of the Ricardian model, using data presentedin a paper by the Hungarian economist Bela Balassa in 1963. The figure compares theratio of U.S. to British exports in 1951 with the ratio of U.S. to British labor productivityfor 26 manufacturing industries. The productivity ratio is measured on the horizontal axis,the export ratio on the vertical axis. Both axes are given a logarithmic scale, which turnsout to produce a clearer picture.
Ricardian theory would lead us broadly to expect that the higher the relative productiv-ity in the U.S. industry, the more likely U.S. rather than U.K. firms would export in thatindustry. And that is what Figure 3-6 shows. In fact, the scatterplot lies quite close to anupward-sloping line, also shown in the figure. Bearing in mind that the data used for thiscomparison are, like all economic data, subject to substantial measurement errors, the fit isremarkably close.
As expected, the evidence in Figure 3-6 confirms the basic insight that trade depends oncomparative, not absolute advantage. At the time to which the data refer, U.S. industryhad much higher labor productivity than British industry—on average about twice as high.
4The pioneering study by G. D. A. MacDougall is listed in Further Readings at the end of the chapter. A well-known follow-up study, on which we draw here, was Bela Balassa, “An Empirical Demonstration of ClassicalComparative Cost Theory,” Review of Economics and Statistics 45 (August 1963), pp. 231–238; we use Balassa’snumbers as an illustration.
M03_KRUG6654_09_SE_C03.QXD 9/1/10 8:16 PM Page 45

46 PART ONE International Trade Theory
The commonly held misconception that a country can be competitive only if it can matchother countries’ productivity, which we discussed earlier in this chapter, would have ledone to predict a U.S. export advantage across the board. The Ricardian model tells us,however, that having high productivity in an industry compared with that of foreigners isnot enough to ensure that a country will export that industry’s products; the relative pro-ductivity must be high compared with relative productivity in other sectors. As it hap-pened, U.S. productivity exceeded British productivity in all 26 sectors (indicated by dots)shown in Figure 3-6, by margins ranging from 11 to 366 percent. In 12 of the sectors, how-ever, Britain actually had larger exports than the United States. A glance at the figureshows that, in general, U.S. exports were larger than U.K. exports only in industries wherethe U.S. productivity advantage was somewhat more than two to one.
More recent evidence on the Ricardian model has been less clear-cut. In part, this isbecause the growth of world trade and the resulting specialization of national economiesmeans that we do not get a chance to see what countries do badly! In the world economy ofthe 21st century, countries often do not produce goods for which they are at a comparativedisadvantage, so there is no way to measure their productivity in those sectors. For exam-ple, most countries do not produce airplanes, so there are no data on what their unit laborrequirements would be if they did. Nonetheless, several pieces of evidence suggest that dif-ferences in labor productivity continue to play an important role in determining world tradepatterns.
Perhaps the most striking demonstration of the continuing usefulness of the Ricardiantheory of comparative advantage is the way it explains the emergence of China as an exportpowerhouse in some industries. Overall, Chinese labor productivity in manufacturing,although rising, remains very low by American or European standards. In some industries,however, the Chinese productivity disadvantage is not as large as it is on average—and inthese industries, China has become one of the world’s largest producers and exporters.
Table 3-3 illustrates this point with some estimates based on 1995 data. The researcherscompared Chinese output and productivity with that of Germany in a number of industries.On average, they found that Chinese productivity was only 5 percent that of Germany, and
Ratio ofU.S./Britishexports
Ratio ofU.S./Britishproductivity
4
2
1
.5
.25
.125
.5 1 2 4 8
Figure 3-6
Productivity and Exports
A comparative study showed thatU.S. exports were high relative toBritish exports in industries inwhich the United States had highrelative labor productivity. Eachdot represents a different industry.
M03_KRUG6654_09_SE_C03.QXD 9/1/10 8:16 PM Page 46
CHAPTER 3 Labor Productivity and Comparative Advantage: The Ricardian Model 47
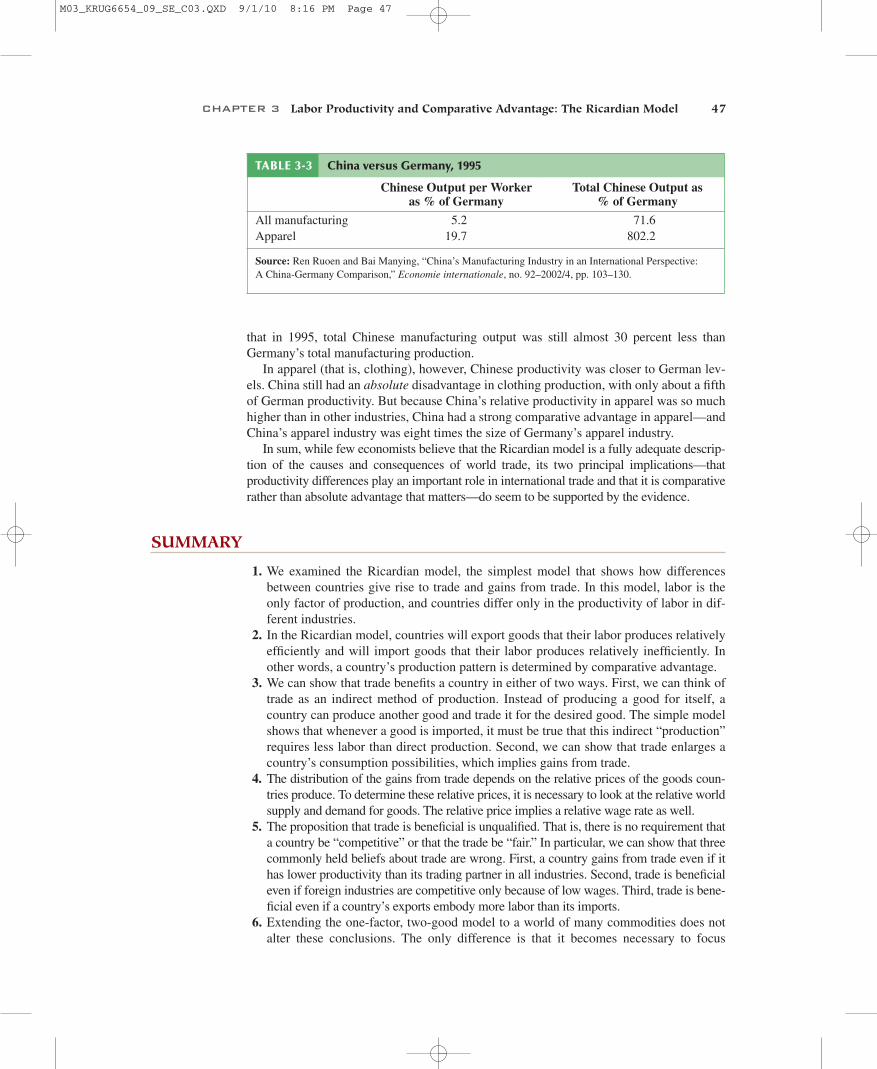
that in 1995, total Chinese manufacturing output was still almost 30 percent less thanGermany’s total manufacturing production.
In apparel (that is, clothing), however, Chinese productivity was closer to German lev-els. China still had an absolute disadvantage in clothing production, with only about a fifthof German productivity. But because China’s relative productivity in apparel was so muchhigher than in other industries, China had a strong comparative advantage in apparel—andChina’s apparel industry was eight times the size of Germany’s apparel industry.
In sum, while few economists believe that the Ricardian model is a fully adequate descrip-tion of the causes and consequences of world trade, its two principal implications—thatproductivity differences play an important role in international trade and that it is comparativerather than absolute advantage that matters—do seem to be supported by the evidence.
SUMMARY
1. We examined the Ricardian model, the simplest model that shows how differencesbetween countries give rise to trade and gains from trade. In this model, labor is theonly factor of production, and countries differ only in the productivity of labor in dif-ferent industries.
2. In the Ricardian model, countries will export goods that their labor produces relativelyefficiently and will import goods that their labor produces relatively inefficiently. Inother words, a country’s production pattern is determined by comparative advantage.
3. We can show that trade benefits a country in either of two ways. First, we can think oftrade as an indirect method of production. Instead of producing a good for itself, acountry can produce another good and trade it for the desired good. The simple modelshows that whenever a good is imported, it must be true that this indirect “production”requires less labor than direct production. Second, we can show that trade enlarges acountry’s consumption possibilities, which implies gains from trade.
4. The distribution of the gains from trade depends on the relative prices of the goods coun-tries produce. To determine these relative prices, it is necessary to look at the relative worldsupply and demand for goods. The relative price implies a relative wage rate as well.
5. The proposition that trade is beneficial is unqualified. That is, there is no requirement thata country be “competitive” or that the trade be “fair.” In particular, we can show that threecommonly held beliefs about trade are wrong. First, a country gains from trade even if ithas lower productivity than its trading partner in all industries. Second, trade is beneficialeven if foreign industries are competitive only because of low wages. Third, trade is bene-ficial even if a country’s exports embody more labor than its imports.
6. Extending the one-factor, two-good model to a world of many commodities does notalter these conclusions. The only difference is that it becomes necessary to focus
TABLE 3-3 China versus Germany, 1995
Chinese Output per Worker as % of Germany
Total Chinese Output as % of Germany
All manufacturing 5.2 71.6Apparel 19.7 802.2
Source: Ren Ruoen and Bai Manying, “China’s Manufacturing Industry in an International Perspective: A China-Germany Comparison,” Economie internationale, no. 92–2002/4, pp. 103–130.
M03_KRUG6654_09_SE_C03.QXD 9/1/10 8:16 PM Page 47
48 PART ONE International Trade Theory
directly on the relative demand for labor to determine relative wages rather than towork via relative demand for goods. Also, a many-commodity model can be used toillustrate the important point that transportation costs can give rise to a situation inwhich some goods are nontraded.
7. While some of the predictions of the Ricardian model are clearly unrealistic, its basicprediction—that countries will tend to export goods in which they have relatively highproductivity—has been confirmed by a number of studies.
KEY TERMS
absolute advantage, p. 29comparative advantage, p. 26derived demand, p. 42gains from trade, p. 34general equilibrium
analysis, p. 31
nontraded goods, p. 44opportunity cost, p. 25partial equilibrium analysis, p. 30pauper labor argument, p. 37production possibility
frontier, p. 27
relative demand curve, p. 31relative supply curve, p. 31relative wage, p. 35Ricardian model, p. 26unit labor requirement, p. 26
PROBLEMS
1. Home has 1,200 units of labor available. It can produce two goods, apples and bananas.The unit labor requirement in apple production is 3, while in banana production it is 2.a. Graph Home’s production possibility frontier.b. What is the opportunity cost of apples in terms of bananas?c. In the absence of trade, what would the price of apples in terms of bananas be?
Why?2. Home is as described in problem 1. There is now also another country, Foreign, with a
labor force of 800. Foreign’s unit labor requirement in apple production is 5, while inbanana production it is 1.a. Graph Foreign’s production possibility frontier.b. Construct the world relative supply curve.
3. Now suppose world relative demand takes the following form: Demand for apples/demandfor bananas = price of bananas/price of apples.a. Graph the relative demand curve along with the relative supply curve.b. What is the equilibrium relative price of apples?c. Describe the pattern of trade.d. Show that both Home and Foreign gain from trade.
4. Suppose that instead of 1,200 workers, Home has 2,400. Find the equilibrium relativeprice. What can you say about the efficiency of world production and the division ofthe gains from trade between Home and Foreign in this case?
5. Suppose that Home has 2,400 workers, but they are only half as productive in bothindustries as we have been assuming. Construct the world relative supply curve anddetermine the equilibrium relative price. How do the gains from trade compare withthose in the case described in problem 4?
6. “Chinese workers earn only $.75 an hour; if we allow China to export as much as itlikes, our workers will be forced down to the same level. You can’t import a $10 shirtwithout importing the $.75 wage that goes with it.” Discuss.
7. Japanese labor productivity is roughly the same as that of the United States in themanufacturing sector (higher in some industries, lower in others), while the UnitedStates is still considerably more productive in the service sector. But most services are
M03_KRUG6654_09_SE_C03.QXD 9/1/10 8:16 PM Page 48

CHAPTER 3 Labor Productivity and Comparative Advantage: The Ricardian Model 49
nontraded. Some analysts have argued that this poses a problem for the United States,because our comparative advantage lies in things we cannot sell on world markets.What is wrong with this argument?
8. Anyone who has visited Japan knows it is an incredibly expensive place; althoughJapanese workers earn about the same as their U.S. counterparts, the purchasingpower of their incomes is about one-third less. Extend your discussion from question7 to explain this observation. (Hint: Think about wages and the implied prices of non-traded goods.)
9. How does the fact that many goods are nontraded affect the extent of possible gainsfrom trade?
10. We have focused on the case of trade involving only two countries. Suppose that thereare many countries capable of producing two goods, and that each country has onlyone factor of production, labor. What could we say about the pattern of productionand trade in this case? (Hint: Try constructing the world relative supply curve.)
FURTHER READINGS
Donald Davis. “Intraindustry Trade: A Heckscher-Ohlin-Ricardo Approach.” Journal of InternationalEconomics 39 (November 1995), pp. 201–226. A recent revival of the Ricardian approach toexplain trade between countries with similar resources.
Rudiger Dornbusch, Stanley Fischer, and Paul Samuelson. “Comparative Advantage, Trade andPayments in a Ricardian Model with a Continuum of Goods.” American Economic Review 67(December 1977), pp. 823–839. More recent theoretical modeling in the Ricardian mode, devel-oping the idea of simplifying the many-good Ricardian model by assuming that the number ofgoods is so large as to form a smooth continuum.
Giovanni Dosi, Keith Pavitt, and Luc Soete. The Economics of Technical Change and InternationalTrade. Brighton: Wheatsheaf, 1988. An empirical examination that suggests that international tradein manufactured goods is largely driven by differences in national technological competencies.
Stephen Golub and Chang-Tai Hsieh. “Classical Ricardian Theory of Comparative AdvantageRevisited.” Review of International Economics 8(2), 2000, pp. 221–234. A modern statisticalanalysis of the relationship between relative productivity and trade patterns, which finds reason-ably strong correlations.
G. D. A. MacDougall. “British and American Exports: A Study Suggested by the Theory ofComparative Costs.” Economic Journal 61 (December 1951), pp. 697–724; 62 (September1952), pp. 487–521. In this famous study, MacDougall used comparative data on U.S. and U.K.productivity to test the predictions of the Ricardian model.
John Stuart Mill. Principles of Political Economy. London: Longmans, Green, 1917. Mill’s 1848treatise extended Ricardo’s work into a full-fledged model of international trade.
David Ricardo. The Principles of Political Economy and Taxation. Homewood, IL: Irwin, 1963. Thebasic source for the Ricardian model is Ricardo himself in this book, first published in 1817.
MYECONLAB CAN HELP YOU GET A BETTER GRADEIf your exam were tomorrow, would you be ready? For each chapter,
MyEconLab Practice Tests and Study Plans pinpoint which sections you havemastered and which ones you need to study. That way, you are more efficientwith your study time, and you are better prepared for your exams.
To see how it works, turn to page X and then go towww.myeconlab.com/krugman
M03_KRUG6654_09_SE_C03.QXD 9/1/10 8:16 PM Page 49
Copyright © 2022 FDOKUMEN