Evaluating the Medical Literature IL Application to Diagnostic ...
68
THE UNIVERSITY OF NEW MEXICO HEALTHSCIENCESCENTER COLLEGEOF PHARMACY ALBUQUERQUE, NEW MEXICO Correspondence Continuing Education Courses for Nuclear Pharmacists and Nuclear Medicine Professionals VOLUME VIII, NUMBERS 2 AND 3 Evaluating the Medical Literature IL Application to Diagnostic Medicine HazelH. Seaba,R.Ph., M.S. Professor(Clinical)and Director Divisionof Drug InformationService Collegeof Pharmacy The Universityof Iowa IowaCity, Iowa 52242-5000 a The University of New Mexico Health Sciences Center College of Pharmacy is approved by the American Council on Pharmaceutical Education as a provider of continuing pharmaceutical @ education. Program No. 039-000-99-002-H04. 5.0 Contact Hours or .50 CEUS.
-
Upload
khangminh22 -
Category
Documents
-
view
1 -
download
0
Transcript of Evaluating the Medical Literature IL Application to Diagnostic ...
THE UNIVERSITY OF NEW MEXICOHEALTHSCIENCESCENTER
COLLEGEOF PHARMACYALBUQUERQUE, NEW MEXICO
Correspondence Continuing Education Coursesfor
Nuclear Pharmacists and Nuclear MedicineProfessionals
VOLUME VIII, NUMBERS 2 AND 3
Evaluating the Medical LiteratureIL Application to Diagnostic Medicine
HazelH. Seaba,R.Ph., M.S.Professor(Clinical)and Director
Divisionof Drug InformationServiceCollegeof Pharmacy
The Universityof IowaIowaCity, Iowa52242-5000
a The University of New Mexico Health Sciences Center College of Pharmacy is approved by theAmerican Council on Pharmaceutical Education as a provider of continuing pharmaceutical
@education. Program No. 039-000-99-002-H04. 5.0 Contact Hours or .50 CEUS.

Coordinating Editor and Director of Pharmacy Continuing EducationWilliam B. Hladik III, MS, RPh
College of PharmacyUniversity of New Mexico Health Sciences Center
Managing Editorjulliwd Newman, ELS
Wellman Publishing, Inc.
Albuquerque, New Mexico
Editorial BoardGeorge H. Hinkle, MS, RPh, BCNP
William H. Hladik III, MS, RPh
Jeffrey P. Norenber~ MS, RPh, BCNPLaura L. Boles Ponto, PhD, RPh
Timothy M. Quinton, PharmD, MS, RPh, BCNP
Guest ReviewerJames A. Ponto, MS, BCNP
Chief Nuclear Pharmacist,University of Iowa Hospitals and Clinics,
andProfessor (Clinical),
University of Iowa College of PharmacyIowa City, Iowa
Whilethe adviceand informationin this publicationare believedto be true and accurateat press time, theauthor(s),editors,or the publishercannotacceptany legal responsibilityfor any errors or omissionsthat
maybe made.The publishermakesno warranty,expressor implied,with respectto the materialcontainedherein.
Copyright2000Universityof NewMexicoHealth SciencesCenter
PharmacyContinuingEducationAlbuquerque,NcwMexico
EVALUATING THE MEDICAL LITERATUREII. APPLICATION TO DIAGNOSTIC MEDICINE
Statement of Objectives:
The purpose of this lesson is to provide nuclear pharmacists whh educational materialsappropriate for a thorough understanding of the technical and diagnostic performance of adiagnostic test. The educational goal is that, upon successful completion of this course,the reader will have obtained the knowledge and skill to use criteria to analyze adiagnostic test study, to synthesize criteria for the evaluation of specific diagnostic testsand to evaluate the quality of published studies investigating diagnostic test performance.
The learning objectives for this continuing education lesson are:
1.
2.
3.
4.
5.
6.7.8.9.
Given the sample values for a diagnostic test’s results in a disease free group,calculate the reference or “normal” range of values.Summarize and explain the relationship between normal, abnormal, diseased anddesirable diagnostic test values.Explain the rationale and limitations of using a ‘gold standard’ test to assess theutility of a new diagnostic test.Given experimental data, calculate sensitivity, specificity, predictive values, andlikelihood ratios of positive and negative test results.Contrast the experimental and clinical utility of the sensitivity, specificity andpredictive values of a diagnostic test.Illustrate the information advantage of likelihood ratios.Contrast “stable” properties of a diagnostic test to the “unstable” properties.Relate the predictive values of a test to prevalence rates of the disease.Given experimental data, construct a ROC curve and explain its purpose inestablishing the cutpoint between reference and disease values. - -
10. Given patient and diagnostic test data, calculate the posterior probability for a disease.11. Identify the methodological features necessary for an appropriate clinical evaluation
of a diagnostic test.12. Evaluate published research reporting on the diagnostic discrimination of a test or
procedure.

COURSE OUTLINE
EVALUATINGTHE MEDICAL LITERATURE
INTRODUCTION
FUNDAMENTALPRINCIPLES OF DIAGNOSTIC TESTING
THE “PEWECT” DIAGNOSTICTEST
ESTABLISHING THE TECHNICAL ANDDIAGNOSTIC PERFORMANCE OF A TEST
T~~DISEASEFREE POPULATION:NORMALOR“REFERENCE”RANGETAMABILITYOFTHEDIAGNOSTICTEST
Reproducibility of the TestAccuracy of the TestValidi@ of the Test
VARIABILITYOF T~ DISEASEDPOPULATIONDefiuing Disease: The Gold Standard
PROCEDURAL STEPS TO DETERMINE DIAGNOSTICPERFORMANCE
TECHNICALPERFOWANCEGOLDSTANDARDCHOJCESELECTIONOFSTUDYSAMPLE
Sample SizePrevalence
MEASUREMENTANDDATACOLLECTIONSelection (Verification, Work- Up) BiasIncorporation BiasDiagnostic Review BiasTest Review Bias
DATA ANALYSISIndeterminate Test Results
MEDICAL DECISION MAKING APPLIED TO DIAGNOSTIC TEST PERFORMANCE
DECISIONMATRIXSensitivi@ and Specl~ci~Predictive ValuesLikelihood Ratio
RECEIVER-OPERATINGCHARACTERISTIC(ROC) CURVEINFORMATIONTHEORYPOST-TEST PROBABILITYOF DISEASE: BAYESTHEOREM
Pretest Probability of DiseaseCalculating Post-test Probability
DIAGNOSTIC TESTS IN PRACTICE
SCREENINGANDCASEFINDINGDIAGNOSIS
Conflrmato~ TestsExclusiona~ TestsDiagnostic Tests in CombinationMets-analysis of Diagnostic Tests
INTERNET EDUCATIONALRESOUCES FOR DIAGNOSTIC TESTS
REFERENCES
●
2
EVALUATING THE MEDICAL LITERATURE
H. APPLICATION TO DIAGNOSTIC MEDICINE
by:
Hazel H. Seaba, R.Ph., M.S.Professor (Clinical) and Director
Division of Drug Information ServiceCollege of Pharmacy
The University of IowaIowa City, Iowa 52242-5000
INTRODUCTIONContained within each patient is the information needed to determine his or her healthstatus. Our ability to access this information — the patient’s internal health database —describes the art and science of diagnosis. Appropriate clinical management of thepatient rests on our ability to mine the patient’s internal health database. Uncovering theinformation we need requires choosing the correct place to look for information, usingthe most appropriate tool and the ability to sift diagnostic pay dirt from slag. In thiscontinuing education lesson we will consider the tool, that is, the diagnostic testprocedure. Information theory provides methods to assess the quality of the informationgained from the diagnostic test procedure. Decision theory provides the mechanism totranslate the results of the diagnostic test into meaningful patient health knowledge.
This lesson builds on an earlier course, “Evaluating The Medical Literature I. BasicPrinciples” (Volume VI, Number 2). To fully benefit from this lesson, the reader maywish to review the earlier material. While much of the material in this lesson applies toonly diagnostic test assessment research, material from the Basic Principles lessonapplies to all clinical research study designs.
FUNDAMENTAL PRINCIPLES OF DIAGNOSTIC TESTINGDiagnostic test procedures add facts to the patient’s health information repository that weare creating. At some point, decisions abouthealth status, disease presence or absenceand choice of treatment options will be madebased on the patient’s accumulated healthinformation. More often than not, thesedecisions will be made with information thatis incomplete or, worse yet, with informationthat is misleading or inaccurate. The
C&. . . diagnosis is not an end in itselfi itis only a mental resting-place forprognostic considerations andtherapeutic decisions, and importantcost-benefit considerations pervade allphases of the diagnostic process.”]
function of the diagnostic testis to improve the quality of medical decision making anddecrease the amount of uncertainty that surrounds each decision. 1 Diagnostic test resultsbuild upon the information gathered from the medical history and physical examination.
A patient’s health outcomes, including economic, clinical and quality of life outcomes,are at least partially dependent upon the strengths of data in that patient’s healthinformation repository. However, linking diagnostic test procedures to the patient’shealth outcomes is tenuous. The framework for this association was first presented byFineberg, et a12and developed further by Begg3 and Mackenzie and Dixon4 in the contextof assessing the effects of diagnostic imaging technology on the outcome of disease. Theeconomic impact of diagnostic procedures on society is also of considerable importanceand has been added to the original model as the sixth level in the framework.5 The sixhierarchical levels in the framework are:
(1) technical performance of the test [reliability],(2) diagnostic performance [accuracy],(3) diagnostic impact [displaces alternative tests, improves diagnostic confidence],(4) therapeutic impact [influence on treatment plans],(5) impact on health [health-related quality of life], and(6) societal efficacy.
Published evaluations of diagnostic procedures most frequently fall into level one or leveltwo of the hierarchy. Assessments at level three through six are more difficult andfraught with design challenges. This lesson will focus on level one and level twoassessments.
The “Perfect” Diagnostic Test
The real world in which we practice does not contain “perfect” tools. Before discussingthe evaluation of diagnostic tests that we know will never achieve perfection, it is usefulto consider the characteristics of an ideal diagnostic test. In their section on testing a test,Riegelman and Hirschh describe the ideal diagnostic test as having the followingattributes:
“(l ) all individuals without the disease under study have one uniform value on thetest,
(2) all individuals with the disease under study have a different but uniform value forthe test,
(3) all test results coincide with the results of the diseased or those of the disease freegroup,”
In the ideal world we would not only be able to perfectly discriminate betweenindividuals with and without the disease, we would never encounter ambiguous testresults. The test would be reliable, irrespective of the testing enviromnent or theoperator, and provide accurate results regardless of the patient subgroups tested.Pragmatically, faced with less than ideal diagnostic tests, we can quantitatively estimate atest’s ability to discriminate between diseased and disease free patients as well asestimate its reliability and accuracy under a variety of conditions.
4
ESTABLISHING THE TECHNICAL AND DIAGNOSTICPERFORMANCE OF A TESTOur evaluation of a diagnostic test involves establishing how close the test comes tomeeting the expectation of identifying those individuals who do have a given disease anddistinguishing them from those who do not have the disease of interest. The threevariables of the evaluation are then: the disease free opulation, the diseased patient
tpopulation and the test itself. Riegelman and Hirsch considered the evaluation of adiagnostic test to be, “largely concerned with describing the variability of these threefactors and thereby quantitating the conclusions that can be reached despite or because ofthis variability.”
The Disease Free Population: Normal or “Reference” Range
If all individuals who were free of the disease had the same blood level of endogenouschemicals and compounds, elicited the same response to external stimuli and lookedexactly alike when viewed with medical imaging techniques, we could use these values todefine the status of being free of the disease. Biological variability assures us that thesepotentially useful diagnostic values will not be the same in all disease free individuals,and in fact, are likely to be widely distributed over a continuum of values. Individualsfree of the disease will generate a range of values for any given diagnostic test. Thisrange of values for disease free individuals is called the reference range. In the past thisrange has been called the range of normal values. “Normal” misrepresents the range inthat individuals with values within the range are not all healthy or free from disease, andsecondly, the distribution of values may not be Gaussian (normal).7
Diagnostic test results represent the identification or measurement of some objectordefinable property. Measurements have four scales: nominal, ordinal, interval, and ratiosValues are interval or ratio measurements when the numerical distance between theindividual values is equal, each interval represents an equal amount of the quantity beingmeasured, and there is a zero in the scale. Many diagnostic test results are interval orratio scale. Less commonly, diagnostic test results are represented on the nominal scale.Nominal scale is named values, such as sex (male or female), hair color (brown, black) orrace (white, native American, Asian). Ordinal measurement scale represents a rtiordering of values, for example, good, better, best. Numbers may be used to quantitate aproperty or ordinal scale, such as a ten point scale for pain intensity. However, statisticalmanipulation of ordinal scale numbers may be limited as the interval between thenumbers may not be equal and does not necessarily represent an equal quantity of whatwas measured, in this example, pain. Diagnostic test result values are also classified asbeing either continuous or dichotomous. Continuow values have the properties of beingat least ordinal or higher scale and fall within some continuous range of values, forexample, values of left ventricular ejection fraction from a gated blood pool procedure.Dichotomous values are categorical, a kind of nominal measurement representing thepresence or absence of something. Diagnostic test results are dichotomous when thepatient either has this property or does not have the property, such as visualization versusnon-visualization of the gallbladder in a hepatobiliary imaging procedure. Continuousscale test results may be reduced to a dichotomous scale, such as disease present ordisease absent.
5
The reference interval is constructed by measuring the diagnostic test values inindividuals who are believed to be free of the disease. The reference sample tested isgenerally a convenient group of individuals (such as students, healthy volunteers, clinicemployees, hospital staffl who are assumed to be free of the disease. Other diagnostictests and examinations may be done on these individuals to establish their disease freestatus. Ideally the reference sample would represent a wide range of disease freeindividuals of both sexes, from all age groups, and with ethnic diversity.
The reference range of values for a diagnostic testis most frequently defined as thecentral 95°/0 of the values of healthy individuals. If a range of values also exists forindividuals known to have the disease, other methods of declaring the reference rangemay be used, including: use of a preset percentile, use of the range of values that carriesno additional risk of morbidity or mortality, use of a culturally desirable range of values,use of a range of values beyond which disease is considered to be present, use of a rangeof values beyond which therapy does more good than harm. 9
A reality of using the central 95% of values of healthy individuals is that 2.5% ofindividuals at each end of the range, known to be healthy, will be identified as outside thereference range. In clinical practice it is important to remember that just because adiagnostic test value falls outside of the reference range, it does not necessarily mean thatthe individual has a disease.
A frequency analysis of the test results from the reference sample will establish whetherthe results have (or can be transformed into) a Gaussian distribution or not. For aGaussian distribution, the central 95V0can be calculated at the mean, plus or minus twostandard deviations. If the results are not Gaussian, a nonparametic analysis can sort thevalues from lowest to highest value and exclude the lowest 2.5% and highest 2.50/0 of thevalues.
If there are significant differences among a population that effect the diagnostic testresults, the reference sample may be restricted to just one group. Age, sex, race, andsmoking status frequently represent legitimate subsets of test values.
Variability of the Diagnostic Test
When we consider the results of a diagnostic test procedure in a specific patient, wewould like to be sure that the test is measuring what we think it is measuring and that anydeviation in the test’s results from the reference range values or from prior values of thistest in this patient, is due only to the disease process or a change in the disease process inthis patient. This is analogous to the evaluation of a new drug in a clinical trial — wewould like to be confident that the outcome we measure in the study subjects is due to thenew drug and not due to any other variable, such as the disease wanes on its own, thesubject’s general health improves, the individual measuring the drug’s response in thepatient is inconsistent, the instrument recording the outcome is failing or any of amultitude of other random and non-random events (biases) that plague clinical research.
6

In the context of experimental designs, Campbell and Stanley10 identified twelve sourcesof variability that threaten the validity of an experimental design. The twelve factors arerelevant to our current discussion on two counts,first, one of the twelve factors is‘instrumentation’ and secondly, when wecompare one diagnostic test to another within aclinical experiment, all twelve of these factorsneed to be controlled to establish the validity ofthe comparison. Instmmentation has two facets:the test (or testing instrument) itself and theoperator. Any change in the test itself, forexample, calibration, may result in incorrect testresults. The person or persons who calibrate thetest, apply or administer the test, observe theresults and record the results have theopportunity at each of these steps to perform thestep incorrectly or inconsistently and thusinvalidate the test results. Analogous toinstrumentation, radiophamaceutical quality(especially radiochemical purity) must becontrolled in order to prevent incorrect testresults from variation in biodistribution.
Factors Jeopardizing Internalund External Validi@: 101, History2. Maturation3. Testing4, Instrumentation5, Statistical regression6. Selection bias7. Experimental mortality8. Selection-maturationinteraction9. Interactive effect of testing10. Interaction of selection biasesand experimental variable11. Reactive effects ofexperimental arrangements12. Multiple-treatmentinterference
Of the twelve sources of invalidity, instrumentation is one of the easier factors to control.Operator training and good laboratory techniques can decrease instrumentation bias.Under experimental conditions, if all other sources of variation are controlled, theintrinsic stability, dependability and value of the test itself will be measurable. Thevariability of the test itself should be small compared to the variability of the range ofnormal values for the test, otherwise, the test will mask differences in values due tobiological factors.
Reproducibility of the Test
Reproducibility is synonymous with reliability. A test’s reliability can be judged bydetermining the ability of a test to produce consistent results when repeated under thesame conditions. Re-testing a diagnostic test requires the laboratory, patient andoperator/observer to remain the same during each test session. Both intra- and inter-observer variability are possible and should be considered. Re-testing must also be donein such a manner that the results of the first test are not known during the re-test.
The precision of the measurements is a reflection of reliability of the data/measurementsthemselves. Precision is the agreement of the measurements with one another and isfrequently described by the range of the results or their standard deviation.
When re-testing is done, it is always possible that some of the agreement betweenmeasurements or individuals is due to chance. Kappa (K) is an index of agreement thatcorrects for chance agreement. Kappa incorporates both the observed proportion ofagreement between two measures/observers and the proportion of agreement expecteddue to chance. ]t If the agreement between two observers is perfect, Kappa’s value is
7
+1.(), disagreement between observers can reach -1.0. If the agreement between
observers is no different than that expected by chance, the value is O. A Kappa value of>0.75 implies excellent reproducibility.
In addition to test/retest reliability, split-half reliability may also be assessed. Split-halfreliability evaluates the internal consistency of one part of the test with other parts of thetest. For example, the questions in a survey instrument maybe compared for redundancyor congruency using split-half reliability. 12
Based on an investigation that corrected for chance agreement in data, Koran identifiedseveral factors that contribute to increased reliability of measurements. 13 These factorsinclude: having a high proportion of ‘normals’ in the evaluation, high observer training,consideration of only a small number of diagnostic categories, abnormal values that aresevere, observations that are dichotomous rather than continuous in scale.
Accuracy of the Test
Accuracy describes the correctness of the test values, that is, the agreement of the testvalue with an independent judgement that is accepted as the true anatomical,physiological or biochemical value. Accuracy requires reliability. However, theconverse is not true, measurements can be reliable without being accurate. In addition tobeing reliable, measurements also need to be free of systematic tendencies to differ fromthe true value in a particular direction. Systematic error is bias. In our discussion ofestablishing the diagnostic performance of a test, we will consider several sources of bias.
Under experimental conditions, the accuracy of a test can be established by comparisonwith an artificial sample (’known’) or a phantom image. This is sometimes referred to asexperimental accuracy. In clinical practice, of course it is very difficult to know thepatient’s absolute diagnostic truth. The quandary of assessing the accuracy of anydiagnostic test (clinical accuracy) is having a true value for comparison.
Validity of the Test
The validity of a diagnostic testis distinct from the reproducibility and the accuracy of atest. Validity asks the question, “Are we measuring what we think we are measuring?’8A valid testis one that is appropriate for the diagnostic question being asked.
Three types of validity are most frequently considered: content validity, criterion-relatedvalidity and construct validity. Content validity is a judgment of whether or not the testis representative of what is supposed to be measured. Criterion-related validity isestablished by determining whether or not the test results agree with the results of one ormore other tests that are thought to measure the same anatomical, physiological orbiochemical phenomena. Construct validity seeks to find out why, theoretically, the testperforms as it does. What is the real biological property being measured that explainswhy the results of the test vary among individuals?
Variability of the Diseased Population
Although we most frequently refer to individuals as either having or not having a givendisease — a dichotomous classification of disease — for almost all diseases, the disease
8
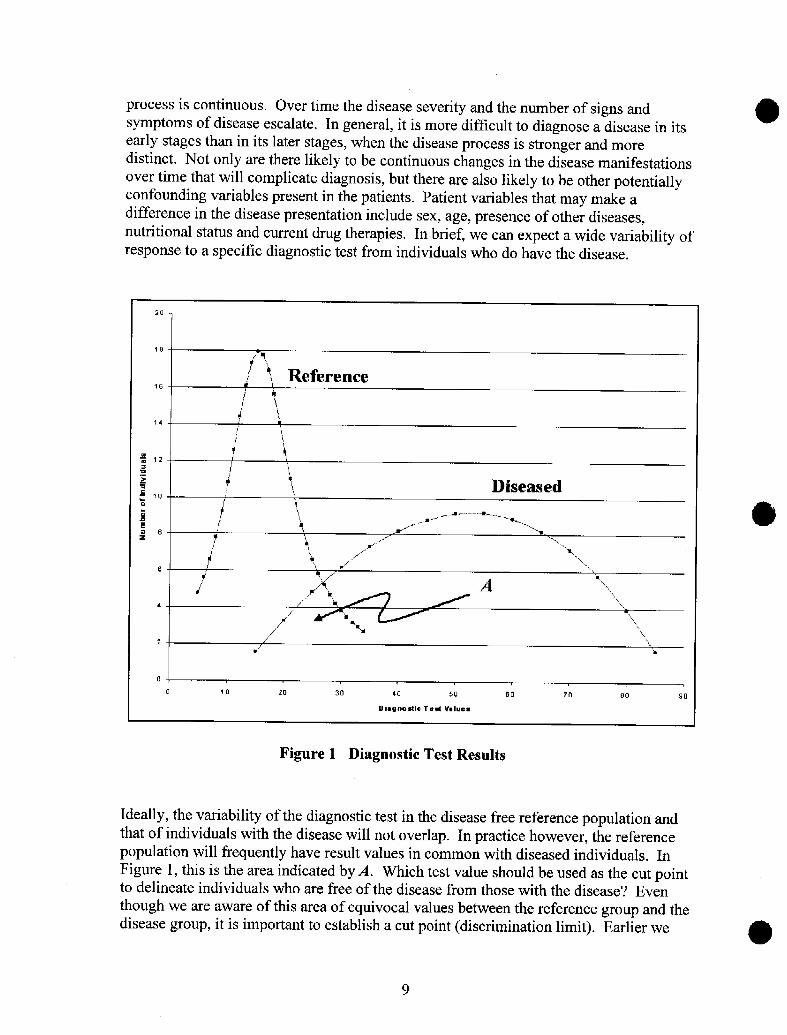
process is continuous. Over time the disease severity and the number of signs andsymptoms of disease escalate. In general, it is more difficult to diagnose a disease in itsearly stages than in its later stages, when the disease process is stronger and moredistinct. Not only are there likely to be continuous changes in the disease manifestationsover time that will complicate diagnosis, but there are also likely to be other potentiallyconfounding variables present in the patients. Patient variables that may make adifference in the disease presentation include sex, age, presence of other diseases,
. . . ,, .-. .-nutritional status and current drag tnerap~es. in brlet, we can expect a wide variability otresponse to a specific diagnostic test from individuals who do have the disease.
20
1
18 I,X
~ “ Reference16 *
1!
6
4
2
/\
I \
/ ,,*’ 8
0 !o 10 20 30 40 50 80 70 80 90
Dlagnodlc roe values
Figure 1 Diagnostic Test Results
Ideally, the variability of the diagnostic test in the disease free reference population andthat of individuals with the disease will not overlap. In practice however, the referencepopulation will frequently have result values in common with diseased individuals. InFigure 1, this is the area indicated by A. Which test value should be used as the cut pointto delineate individuals who are free of the disease from those with the disease? Eventhough we are aware of this area of equivocal values between the reference group and thedisease group, his important to establish a cut point (discrimination limit). Earlier we
9
mentioned that if the range of values for individuals with the disease was known, the cutpoint between the reference group and the diseased group could be established usingcriteria other than assigning the central 95°/0 of reference values to the disease freegroup.y We will consider these other methods in the medical decision making section ofthis lesson.
Defining Disease: The Gold Standard
By definition, the gold standard diagnostic testis that test whose results determine thesubject’s disease status. Any test assigned gold standard status is accepted to be 10O”/Oaccurate. Gold standard status is a clinical judgment. Historically, autopsy 14and biopsyhave been used as gold standards for diagnosis. While an autopsy may provide anunequivocal diagnosis for a research study, pragmatically, it can not be used in clinicalpractice. For a given disease condition, generally, the current best diagnostic testbecomes the gold standard. While the current gold standard test for a disease mayrepresent the best, most practical test we have, it also may be “gold” in name only. Formany disease conditions, truly accurate diagnostic tests do not exist and the choice ofwhich test to assign gold standard status to is not clear. Differences of opinion will exist.
It is against the gold standard that a new diagnostic test will be compared to determine itsaccuracy. However inadequate a gold standard might be, it is necessary to assess a newdiagnostic test procedure against the best current test. It is not sufficient to determinewhether or not the new test is more frequently associated with discovering disease thanchance alone. This is analogous to the evaluation of a new drug. Regardless of whetherthe new drug is compared to a placebo control or to the current drug of choice (activecontrol), it is the objective, unbiased comparison that estimates the drug’s effectivenesseither benchmarked to the placebo or to standard therapy.
Since the gold standard is considered 100V0accurate, the new diagnostic test can notoutperform the standard. The accuracy of the new test will always be less than or equalto the gold standard. In truth, we frequently expect that the new diagnostic test wi 11be anadvancement over the current gold standard test. With clinical use, the new test mayconvince practitioners of its superiority, allowing it to eventually become the goldstandard.
PROCEDURAL STEPS TO DETERMINE DIAGNOSTICPERFORMANCEDiagnostic performance describes the ability of the test to correctly determine whichindividuals have the disease condition and which do not. Clinical studies with the goal ofestablishing the diagnostic performance of a test share some of same design features astherapeutic efficacy controlled clinical trials. The diagnostic performance design shouldensure a study setting that provides a fair, unbiased assessment of the test’s accuracyusing the gold standard benchmark.
I
I
Technical Petiormance
10
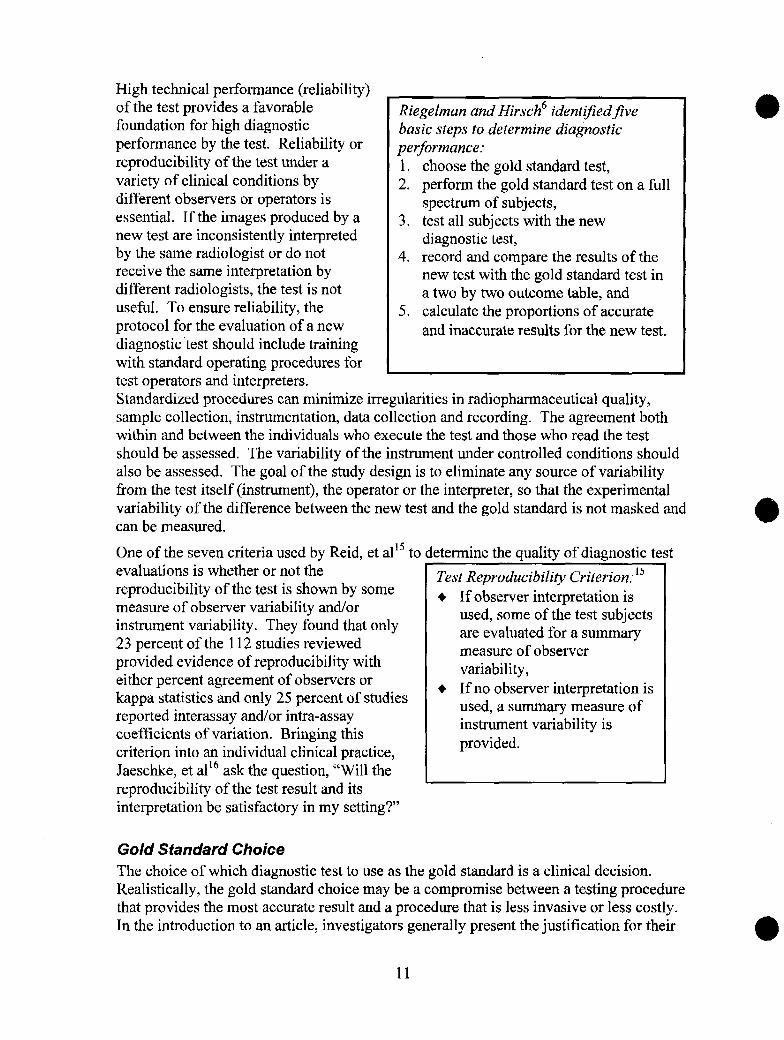
High technical performance (reliability)of the test provides a favorable Riegelman and Hirschh identl~edfivefoundation for high diagnostic basic steps to determine diagnosticperformance by the test. Reliability or Performance.”reproducibility of the test under a 111. <variety of clinical conditions bydifferent observers or operators isessential. If the images produced by anew test are inconsistently interpretedby the same radiologist or do notreceive the same interpretation bydifferent radiologists, the test is notuseful. To ensure reliability, theprotocol for the evaluation of a newdiagnostic test should include trainingwith standard operating procedures for [
2.
3.
4.
5.
choose the gold standard test,perform the gold standard test on a fullspectrum of subjects,test all subjects with the newdiagnostic test,record and compare the results of thenew test with the gold standard test ina two by two outcome table, andcalculate the proportions of accurateand inaccurate results for the new test.
test operators and interpreters.Standardized procedures can minimize irregularities in radiophmaceutical quality,sample collection, instrumentation, data collection and recording. The agreement bothwithin and between the individuals who execute the test and those who read the testshould be assessed. The variability of the instrument under controlled conditions shouldalso be assessed. The goal of the study design is to eliminate any source of variabilityfrom the test itself (instrument), the operator or the interpreter, so that the experimentalvariability of the difference between he new test and th~ gold standard is no~ masked andcan be measured.
One of the seven criteria used by Reid. et a115to determine the aualitv of diagnostic test. . .evaluations is whether or not the Test Reproducibility Criterion:’5reproducibility of the test is shown by some &measure of observer variability and/orinstrument variability. They found that only23 percent of the 112 studies reviewedprovided evidence of reproducibility witheither percent agreement of observers orkappa statistics and only 25 percent of studiesreported interassay and/or intra-assaycoefficients of variation. Bringing thiscriterion into an individual clinical practice,Jaeschke, et al’b ask the question, “Will the
.
+
If observer interpretation isused, some of the test subjectsare evaluated for a summarymeasure of observervariability,If no observer interpretation isused, a summary measure ofinstrument variability isprovided.
reproducibility of the test result and itsL
interpretation be satisfactory in my setting?”
Gold Standard Choice
The choice of which diagnostic test to use as the gold standard is a clinical decision.Realistically, the gold standard choice may be a compromise between a testing procedurethat provides the most accurate result and a procedure that is less invasive or less costly.In the introduction to an article, investigators generally present the justification for their
11
9“
II
I
●
J
choice of reference standard. Ideally the gold standard not only represents .a test thatmakes sense clinically – that is, if the new testis successful, it would replace or providean alternative to the gold standard for this particular disease — but also, the test doesaccurately classify patients as either disease free or diseased. As the new test’s results arecompared to the gold standard’s accuracy, errors in classifying patients by the goldstandard will perpetuate themselves in the assessment of the new test’s accuracy.
What makes a ‘good’ gold standard test? According to Arroll, et al. 17a well-defined goldstandard is either:
+ definitive histopathologic diagnoses (autopsy, biopsy, surgery),+ standard diagnostic classification systems (for example, American Psychiatric
Association Statistical and Diagnostic Manual-for Mental Disorders fordepression), or
+ results of other well-established diagnostic tests, if explicit criteria are given forwhen the target disease is said to be present.
In Arroll, et al’s review of 126 selected clinical journals published in 1985, 88V0 of thediagnostic test articles used a well-defined gold standard.
In the FDA’s 1999 final rule on “Regulations for In Vivo Radiopharmaceuticals Used forDiagnosis and Monitoring,” the phrase ‘gold standard’ is not used; however, anexpression with the same meaning is: “The accuracy and usefulness of the diagnosticinformation is determined by comparison with a reliable assessment of actual clinicalstatus. A reliable assessment of actual clinical status may be provided by a diagnosticstandard or standards of demonstrated accuracy. In the absence of such diagnosticstmdard(s), the actual clinical status must be established in another manner, e.g., patientfollowup.’” 8 The FDA considers a comparator or clinical followup necessary to establishthe accuracy and usefulness of a radiopharmaceutical’s claim for detection or assessmentof a disease or a pathology. As an alternative to a gold standard diagnostic test result,clinical followup for an adequate period of time can be used to establish the patient’s truedisease status. Unfortunately for many diseases the time needed for the disease toprogress to the point where the diagnosis is unequivocal by direct observation maybequite long.
The gold standard test, by definition, is assumed to be perfect with no false positive orfalse negative test results. If this assumption is not true, the false negative rate (1 -sensitivity) and the false positive rate (1-specificity) of the test being evaluated areoverestimated. [Author’s Note: Sensitivity and specificity are defined and discussed indetail in section ‘Medical Decision Making Applied to Diagnostic Test Performance,’page 23, and in Table 1, page 41.] This possibility was investigated by Line, et al. 19These investigators calculated the sensitivity and specificity of antifibrin scintigraphy,99mTc-antifibrin (YgmTc-T2G1s Fab’), in patients with suspected acute deep venousthrombosis (DVT) using two different methods. Two patient groups were studied, onewith low DVT prevalence and one with high DVT prevalence. The first methodcompared antifibrin scintigraphy to contrast venography, the gold standard assued tohave no error. The second method calculated sensitivity and specificity using amaximum likelihood procedure that does not include comparison to a gold standard. Themaximum likelihood procedure uses diagnostic test results from two populations withdifferent disease prevalence. Sensitivity and specificity of antifibrin scintigraphy as
12
estimated by comparison to the venography gold standard were substantially lower thanthose calculated with the maximum likelihood procedure. The authors concluded that agold standard with errors will bias the sensitivity and specificity of the test beingevaluated downward and that this effect was operating in their study. They suggestedthat contrast venography may not be a good gold standard for DVT.
There are techniques available to decrease or minimize the bias introduced into adiagnostic test evaluation by an imperfect gold standard.20 One technique involvesmaking it less likely to diagnose a patient as disease present when the patient is trulydisease positive and making it less likely to diagnose a patient as disease free when thepatient is truly disease negative. Thus the testis more likely to find only true positiveindividuals as positive and trae negative individuals as negative. This can beaccomplished by using a rigorous definition of disease when the test’s sensitivity (abilityto diagnose a positive patient as diseased) is evaluated and likewise using a lax definitionof the disease when the test’s specificity (ability to diagnose a negative patient as diseasefree) is measured. Another technique recognizes that when the gold standardmisclassifies patients, both sensitivity and specificity are influenced by the diseaseprevalence. Prevalence is the proportion of individuals who have the disease at a giventime. If the disease prevalence is high, it is easier to diagnose positive individuals; if thedisease prevalence is low, it is easier to diagnose disease negative individuals correctly.If sensitivity and specificity are assessed in both high and low prevalence envirom-nents,bias may be minimized. It may also be helpful to use a surrogate for a positive andnegative disease diagnosis. For example, instead of diagnosing the presence or absenceof the disease in an individual, it may be possible to use the diagnostic test to determine ifthe patient will respond favorably to drug therapy for that disease or whether the patientwill be a drug therapy failure. Lastly, mathematical corrections can be applied to testresults known to have error.
Selection of Study Sample
At the point a new drag is approved for marketing by the FDA, the clinical experiencewith the drug may be limited to only a few thousand or even a few hundred studysubjects. Frequently what we know about the drug’s safety and efficacy not only changesand increases, but also improves in accuracy as more knowledge of the drug is gainedthrough its use in a broader patient population under a variety of conditions. Similarly,an evaluation of a new diagnostic test is most credible if the study or studies of the test’saccuracy includes a broad selection of individuals both with and without the targeteddisease.
If investigators were able to study the new test in a group of subjects suitably largeenough that the group contained all the conditions under which the disease occurs anddoes not occur, the measurement of the new test’s accuracy would dependably reflect theentire disease state (provided the gold standard was accurate). The investigator rarely, ifever, has the ability to study a census of individuals with a disease. Almost equallyunlikely is the opportunity to randomly sample the population made up of diseasenegative and disease positive individuals. Even if random sampling of the populationwas possible, the number of disease positive individuals in the population would be verysmall compared to the number of disease negative individuals. The sample drawn would
@
9
13
@most likely contain few disease positive individuals. Thus the sensitivity value (fractionof disease positive individuals successfully identified) would have a wide confidenceinterval .2’ To improve the estimate of sensitivity, a non-random, disproportionate sampleis used. It is still important that the disproportionate sample represent as manycharacteristics of individuals with and without the disease as possible. The range ofcharacteristics represented in the sample is called the spectrum. Under circumstances ofwide subject spectrum, the new test will receive a fair challenge of its abilities tocorrectly diagnose a variety of subjects.
Spectrum includes pathologic, clinical and cornorbid components.22 Most diseaseconditions have a wide spectram of pathologic features, such as extent of the disease,location of disease, cell types. If only patients with a given tumor size (pathology) areused in the diagnostic test evaluation, the usefulness of the test in patients with smaller orlarger tumors will not be known. The clinical features of the disease describe thechronicity and severity of symptoms. Either of these features can influence the testresults. Comorbidities of the patient may also affect the results of the diagnostic test.
In patients who are truly disease negative, the goal for the diagnostic testis to minimizefalse positive results. A challenging spectrum of disease negative subjects would includesubjects with different pathologies in the same anatomical area as the target disease,individuals with physiologic disorders that affect the same organ as the target disease orprevent the proper distribution of a test substance or imaging agent, and subjects withother diseases that may interfere with diagnosis. Unfortunately, to achieve better control
@
in the study, the tendency is to choose disease free study subjects that have nocomorbidities with disease symptoms that overlap those of the target disease.
‘~he challenge in patients who are diseased is to diagnose as positive as many as possibleand, at the same time, avoid misdiagnosing disease free individuals (a false positivediagnoses). To ensure that the new test will function properly in all individuals with thetarget disease, patients with a wide spectrum of the disease’s pathologies should beincluded. Individuals who have been ill for long and short periods of time and who havemild and severe symptoms should be chosen. Also individuals who not only have thetarget disease, but other diseases as well should be represented in the study.
The sample spectrum should also include both genders and a variety of subject ages andethnicity. It is possible that a given diagnostic test will perform the same in all subjectswith and all subjects without the target disease.However, the only way to know if this is true is tostudy the diagnostic test in all manner of patients. Ifthe diagnostic test is found to perform differently ondifferent groups of subjects, spectrum bias is said toexist. In addition to choosing a broad spectrum ofstudy subjects, the investigators, in order to assessspectrum bias, must also analyze the study’s results bypatient subgroups. Subgroup analysis can pinpoint agegroups, phases of disease, or other subsets of patientswho will have accuracy estimates, that is sensitivity
@
and specificity, different than the majority of patientswith the target disorder. Spectram bias is illustrated in
Analysis of PertinentSubgroups Criterion: 15+ Results for indexes of
accuracy are cited forany pertinentdemographic or clinicalsubgroup of theinvestigated population(e.g., symptomaticversus asymptomaticpatients).
14
Morise et al.’s23 review of discriminant accuracy of thallium scintigraphy in patientswith possible coronary artery disease. A derivation group received single photonemission computed tomographic (SPECT) and a validation group received SPECT andplanar thallium-201 scintigraphy. They found differences in (1) sensitivity andspecificity for the two separate study samples based on all defects verses reversibledefects, and (2) sensitivity, but not specificity, based on the number of diseased vesselsinvolved. The accuracy of exercise ECG was also found to be lower in women than men.
A broad spectrum of study subjects increases the confidence with which we canextrapolate the results of the diagnostic test to patients in our local practice. A narrowspectrum of study patients does not necessarily decrease the internal validity of the study— it may only affect the external validity of the study, that is, the study’sgeneralizability. If our local patients are so similar to those in the study that they couldmeet the inclusion and exclusion criteria of the study, we are most comfortable using thetest locally. But, regardless of however broad thestudy subject spectrum was, we frequently areconsidering local patients who are sicker than thosein the study, are older or younger, or have acoexisting disease or diseases not included in thestudy. Under these circumstances it may be usefulto ask the questions of not only how different yourpatient is from those in the study, but also howsimilar your patient is to those in the study. If thediagnostic test uses a pharmaceutical agent,knowledge of the agent’s pharmacology is very
Spectrum CompositionCriterion: 15+ age distribution,
+ sex distribution,+ summary of presenting
clinical symptoms and/ordisease stage, and
+ eligibility criteria for studysubjects are given.
helpful to anticipate patient characteristics orpathologies that may interfere with the mechanism Iof action of the testing agent.
Studies executed with a narrow spectrum of subjects are most likely to result in falselyhigh test accuracy .22 The test’s sensitivity and specificity will be over estimated. In theirstudy of the application of methodological standards in diagnostic test evaluations, Reidet all 5 found that only 27°/0 of the studies they reviewed met their criteria for specifyingthe spectrum of patients evaluated.
Sample Size
Researchers, clinically evaluating diagnostic tests, construct a study design where theaccuracy (sensitivity and specificity) of one or more diagnostic tests is calculated insubjects whose positive or negative disease status has been established with a goldstandard diagnostic test. For convenience and precision considerations, the study sampleis frequently selected disproportionately, that is, the proportion of disease positiveindividuals included in the sample is not the same as that in the general population. Inmany studies the subjects are selected from a group of patients whose disease status isknown (patients have already undergone the gold standard diagnostic test). Under thesecircumstances the proportion of disease positive to disease negative subjects is under theinvestigators immediate control. This is usually not true in clinical trials of screening
●
15
diagnostic tests. In a screening study of a large population, subjects with unknowndisease status are consecutively enrolled into the study.
The proportion of disease positive to disease negative individuals included in the studymay be arbitrarily determined by the investigator, ma be determined from a calculation
~, 25326of sample size based on a desired confidence interval , or maybe determined bythe number of subjects selected in a screening investigation, Ideally the sample size forthe study is calculated prior to subject enrollment. The calculation will detemine thenumber and optimum ratio of disease positive to disease negative subjects. Regardless ofthe method used to determine the sample size, it is important to remember that theproportion of disease positive to disease negative individuals in the study maybeartificial and not reflect the disease’s real prevalence in the general population.
The evaluation of a diagnostic test aims to measure Precision qfResults for Testthe accuracy of the test. The outcomes measured are Accuracy Criterioit: ]5sensitivity and specificity of the test derived from + SE or C1, regardless ofcomparison to the subjects’ real (gold standard)disease presence or absence status. Sensitivity and
magnitude, is reported fortest sensitivity and
specificity are point estimates. We would like the specificity or likelihoodsensitivity and specificity values to be precise. The ratios.standard error (SE), or width of the confidenceinterval, measures the precision of these values. A95V0confidence interval is defined as an interval thatcontains the point estimate about 95 times in 100replications of the study .25 Thus in about 5 replications the point estimate would not beincluded in a 95°/0 confidence interval. For lar&e sample sizes (n > 30) the two-tailed95% con~$;;ce interval for sensitivity or specificity ~an be estimated” with the followingequation: -‘
95% CI = point estimate ~ (1.96)x (SE)
The upper and lower values for the confidence interval provide us with an indication ofhow low and how high the real value could be and still be compatible with the data.
Sample size influences precision. The larger the sample size, the more precise are thecalculated sensitivity and specificity estimates, thus the narrower are the confidenceintervals. If the investigator wishes to limit his or her enor to a predefmed level, asample size that will generate a narrow confidence interval can be calculated.24
We are also interested in how accurately the test identifies disease positive and diseasenegative individuals (the sensitivity and specificity of the test). Our ability to correctlymeasure the difference between the new test and the gold standard values is alsodependent upon sample size. The larger the sample size, the less likely are we toincorrectly measure the two proportions (sensitivity and specificity). We know that themeasurements generated by the study data are estimates of the true values and that wealways have a chance of arriving at an incorrect value or conclusion. However, wewould like the study to have enough power (80 to 90°/0) to determine, with a given degreeof contldence, the size of the two proportions. Alternatively, the investigator may beinterested in testing a hypothesis that the new diagnostic test has sensitivity andspecificity values that are no more than some specified distance from the gold standard
16
Itest. The study’s power, 1 – beta (beta is Type II error), is related to the value of alpha(Type I error), variability of the events (i.e., disease presence), delta (the clinicallymeaningful values for sensitivity and specificity) and sample size27. We generally set theprobability of making a Type I error (alpha) at 0.05; this corresponds to a 95%confidence interval (CI). A Type I error results when the investigator concludes that thetwo propotiions (for example, sensitivity of the new test and that of the reference test) arestatistically significantly different when they are not different. Beta values of 0.10 or0.20 are desirable. A Type II error occurs when the investigator concludes that twoproportions are not statistically significantly different when they are different. Clinicallymeaningful values of sensitivity and specificity are determined by the investigators —frequently these values are based on the investigator’s best estimate of the test’ssensitivity and specificity. The variability of events (disease prevalence in the targetpopulation) is chosen by the investigators, generally from the published literature. Asample size is calculated for a given sensitivity value and another calculated for a givenvalue of specificity. The final sample size is the larger of these two values. By choosingthe larger value, the sample size will be adequate to estimate both sensitivity andspecificity with the desired precision.
Linnet2b has pointed out that for continuous scale diagnostic test values, it is important toalso consider the sampling variation of the cutpoint (discrimination limits) betweendisease free and diseased. Sensitivity and specificity depend upon where the cutpoint isdrawn. If the sampling variation of the cutpoint is not considered, the probability ofmaking a Type I error may increase from 0.05 to values of 0.10-0.35.
}1OWdo we know if the study has an adequate sample sire? This is a difficult literatureevaluation question. lf the investigators provide the a priori calculated sample size, we atleast know that they considered the variables necessary to calculate sample size. If onehas mathematical skills, the power of the study can be calculated retrospectively using thesensitivity and specificity values calculated in the study and the best estimate of diseaseprevalence. Tables of sample sizes for given sensitivity and specificity values at 95V0confidence intervals and 90°/0 power are provided by Buderer.27 One could look Up thesensitivity or specificity values reported in an article in the Buderer tables, note therequired sample size for the reported sensitivity or specificity, and then compare theneeded sample size to that actually used in the article. Freedman28 also provides a tableto determine needed sample sizes for various sensitivity and specificity values.Otherwise, we are left with judging the adequacy of the sample size by considering thereasonableness of the number of subjects in the study and the study’s results. Kent andLarson2g recommend a sample size of 35 to several hundred patients for high qualitystudies of diagnostic accuracy.
Prevalence
Prevalence is a probability – it represents the number of people in the population whohave a disease at a given point in time.b’ 30 The ‘point in tih~e’ can be a specific point,such as June 6, 2000 (point prevalence) or a period of time, such as 2000 (periodprevalence). In contrast, incidence is a rate representing the number of new disease casesthat develop in the population over a unit of time. The two are related:
prevalence = incidence rate x duration of the disease
17
I
Prevalence tells us how many patients with a given disease are available to be diagnosedwith the disease. Diseases with either a high incidence and/or a long duration will have ahigh prevalence. Generally we believe it is easier to identify individuals positive for adisease if the disease’s prevalence is high as the proportion of positive individuals in thepopulation is large.20331 Thereby, our chance of encountering a positive patient is high.Diseases with low prevalence seem more difficult to diagnose, as the number of positiveindividuals in the population is small.
How is disease prevalence related to accuracy of diagnosis, that is, sensitivity andspecificity? Sensitivity and specificity are considered by some authors to be independent
zof disease prevalence. ‘20’2]332’33334Stable sensitivity and specificity values underdifferent disease prevalence would be an advantage. Worldwide, disease prevalencevaries from country to country. A test whose accuracy is the same regardless of the localdisease prevalence would allow us to extrapolate sensitivity and specificity values fromthe primary literature to any practice site at any location. Under conditions of stablesensitivity and specificity, the accuracy of one test can be compared with the accuracy ofcompeting diagnostic tests for the same disease.
Unfotiunately, the relationship between sensitivity and specificity and prevalence isprobably not complete independence. Literature as far back as the 1960’s has pointed outexamples of diagnostic test sensitivity and specitlcity for a disease varying by thepopulation under study .35 Sensitivity and specificity can vary with patient demographiccharacteristics, such as age or sex, and also with the clinical features of disease, such asseverity, duration and comorbidities.3315 In these examples, a possible explanation is thatthe prevalence of the disease is truly different for different ages and sexes or for differentstages of the disease, severity of disease or in the presence of other pathologies. If thediagnostic test was evaluated in a wide spectrum of patients, sensitivity and specificityrepresents an “average” accuracy across all these variables. If a very narrow spectrum ofsubjects is tested or if the investigator analyzed the indexes by subgroups, sensitivity andspecificity indexes apply to only those subgroups.
Coughlin andPickle31 point out that part of the agreement between the diagnostic test andthe gold standard may be due to chance and offer a mathematical correction for chanceagreement. Diseases with high prevalence are likely to offer more individuals withpositive disease status in the sample and thus chance agreement maybe a large factor inthe sensitivity value. Likewise, diseases with low prevalence provide more individualswith negative disease status and thus chance agreement may be a large factor in thespecificity value.
In her calculation of sam le sizes adequate to estimate sensitivity and specificity with agiven precision, Buderer E incorporates the prevalence of the disease in the targetpopulation. The number of subjects who are disease positive and negative is dependentupon the disease prevalence. Within the stud y, the total positive subjects (true positivesand false negatives) and total negative subjects (true negatives and false positives) are thedenominators for the standard errors (SE) of sensitivity and specificity. The width of theconfidence interval (CI) is dependent upon SE. The width of CI influences the samplesize. Thus the sensitivity and specificity indexes are influenced by disease prevalence.
18
Brenner and Gefeller3b build on Buderer’s justification by pointing out that prevalence inthe population is determined for most diseases by the diagnostic cutpoint. Regardless ofhow the cutpoint is established, there will be some disease positive individuals labeled asdisease negative and conversely some disease negative individuals labeled as diseasepositive. This same cutpoint determines both,(1) the disease prevalence of thepopulation, that is the number of diseased individuals in the population at a given time,and (2) the magnitude of the diagnostic misclassification of individuals at the timesensitivity and specificity of the test are determined. Thus disease prevalence anddiagnostic misclassification are related. For example, the cutpoint could be adjusted tomaximize sensitivity at the expense of specificity and this would also change thedisease’s prevalence. Most diseases are diagnosed by measuring some continuousvariable patient characteristic and the above reasoning is applicable. However, if thediagnostic test truly measures a dichotomous variable, such as alive or dead, there is nocutpoint and sensitivity and specificity indexes are thought to be independent ofprevalence.
Our concern for the influence of prevalence on sensitivity and specificity can besomewhat mollified if the spectrum of individuals in the diagnostic test study is clearlyidentified and, if the spectrum is broad, subgroup analyses on important disease groupsare done. Other diagnostic indexes, such as predictive values, and other decisionmethods, such as receiver operator characteristic curves, are also available and provide adifferent view of diagnostic test discrimination.
Measurement and Data Collection
Despite the disadvantages of sensitivity and specificity, they are the primarymeasurements of diagnostic test efficacy that appear in the medical literature.Yerushalmy37 first used the terms sensitivity and specificity to quantitate observervariability among radiologists. The terrrs actually have two meanin s: analyticalsensitivity and specificity and diagnostic sensitivity and specificity. ,f A single laboratorytest may have both anal ytical and diagnostic sensitivity and specificity.
A laboratory test that is an assay (measures a substance) has an analytical sensitivity thatis deilned as the assay’s ability to measure low concentrations of the substance or detect achange in concentration. If the target substance is also a surrogate for a diseasecondition, the assay may be used to detect the substance in a population to determinedisease presence or absence. At this point, the test becomes a diagnostic test and thetest’s ability to detect individuals who have the disease (sensitivity) becomes relevant.While the diagnostic test has to be able to measure the target substance at meaningfullevels or concentrations, it is also important that the diagnostic testing process obtains apatient sample that contains the target substance. A diagnostic test with high analyticalsensitivity may have low diagnostic sensitivity if the target substance sampling procedureis inadequate.
Analytical specificity is defined as the ability of the test to exclusively identify a targetsubstance, such as just the ~ (beta) subunit of human chorionic gonadotropin (HCG)rather than both the a (alpha) and ~ (beta) subunits of HCG. HCG (containing both aand ~ subunits) is produced by the placenta and its presence in urine or serum is used to
19
diagnose pregnancy. Other hormones, such as luteinizing hormone, thyroid-stimulatinghormone and follicle-stimulating hormone, also contain an identical a subunit. Newerdiagnostic tests specific for the ~ subunit decrease false positive pregnancy test results.The newer tests, which use monoclinal antibodies specific for the ~ subunit of HCG, alsohave increased analytical sensitivity. Radioimmunoassay (RIA) and enzyme-li&edimmunosorbent assay (ELISA) are able to detect 5 mIU/ml HCG in serum 39contrasted toolder polyclonal methods that could detect concentrations only as low as 100 mlU/ml.
lf a test is analytically nonspecific (it not only measures the target substances but alsoother closely related substances), the test will have low diagnostic specificity (incorrectlyclassifies disease negative individuals). Diagnostic tests with high analytical sensitivityand specificity do not necessarily produce high diagnostic sensitivity and specificity.Intervening variables such as spectrum bias, small sample aliquot and technical reliabilityof the assay can diminish diagnostic sensitivity and specificity.
Selection (Verification, Work-Up) Bias
Selection bias is a potential study design problem related to the way in which subjects arechosen for inclusion into a diagnostic test evaluation study. lt is defined as thepreferential referral of positive or negative test responders either to or not to verificationdiagnosis with a gold standard test.
Earlier in this lesson Riegelman and Hirsch’sh basic steps to determine diagnosticperformance listed step 2 as “perform the gold standard test on a full spectrum ofsubjects” and then step 3 as “test all subjects with the new diagnostic test.” Under theseprocedures, the investigator starts with a group of individuals whose diagnosis has beenverified with the gold standard. The investigator can select x number of verified diseasepositive and y number of verified disease negative subjects. The investigator thusdetermines the prevalence of the disease in the study’s sample. Frequently an equalnumber of disease free and disease positive individuals are chosen as this provides thegreatest statistical power for a given sample size.b
The important aspect of the above design is that all subjects receive the gold standardtest. However, if the gold standard is an expensive test or if it is invasive and carries ahigh risk, another sample selection procedure might be used. Kelly, et a140present theexample of a computed tomography (CT) scan compared to the gold standard of surgicalinspection of the liver to diagnose liver lesions. Individuals who have a positive CT scanare-referred for surgical rese;tion of the liver. Theverification diagnosis of liver pathology is made at Avoidance of Work-up Bias
the time of surgery. Individuals with negative CT Criterion:15
scans are not referred for surgical verification. + All subjects are assigned to
Work-up bias, in this example, will lead to high receive both diagnostic and
sensitivity and no meaningful value for specificity gold standard testing
as there is no control group. verification.
In some studies a partial solution is to refer a smallrandom sample of the negative test subjects to thegold standard test for verification. Sensitivity and specificity calculations are done withmodified equations that hope to correct the distortion caused by selection bias. 4‘ When
20
the gold standard test is particularly risky or unethical to administer in perceived negativesubjects, other mathematical corrections might be ossible using retrospectiveadjustments with data from the source population. ?
Incorporation Bias
This bias occurs when the results of the dia nostic test being evaluated are incorporatedinto the gold standard testing procedure.22’4f Incorporation bias would result if an initialdiagnostic scan was done and then at a later time a second scan (the exact sameprocedure) was done to confirm the results of the first scan. The diagnostic test beingevaluated and the gold standard test should be separate, independent procedures.
Diagnostic Review Bias
Diagnostic review bias occurs when the individual Avoidance of Review Biasinterpreting the results of the gold standard test Criterion: 15know the results of the test being evaluated.22’40 In + Statement aboutthis instance there is probably some subjectivity in independence inthe interpretation of the gold standard test results. interpreting both the testKnowing the results of the diagnostic test can and the gold standardinfluence the care, scrutiny and objectivity of the procedure is included.gold standard test’s interpretation. The solution isblinding the individual who evaluates the secondtest from the results of the first procedure.
For an individual patient, if the results of the test being evaluated are true, then thecarryover effect on the interpretation of the gold standard may not misrepresent thepatient, but the comparison of results will be faulty. However, if the test being evaluatedhas misclassified the patient, carryover may misclassify the same patient in the samedirection – the errors are correlated and the calculated sensitivity and specificity of thetest being evaluated will be falsely high. Sensitivity and specificity are falsely highbecause the test being evaluated is misclassi~ing the same patient as the gold standard.20
Test Review Bias
This is the opposite situation — the old standard test results are known at the time thef22’0 A ain blinding is a powerful control to preventevaluated test results are reviewed. g
bias in the interpretation of the test results.
Data Analysis
The analysis of the comparison of the diagnostic testto the gold standard test requires theindependence of each test. The above biases illustrate violations of independence. If thetest being evaluated and the gold standard test both misclassify the same patient, the testshave a falsely high agreement and sensitivity and specificity will “befalsely high. If thetest being evalwted and the gold standard test independently misclassify the samepatient, sensitivity and specificity will be underestimated.20
21
The diagnostic performance of a test is measured by the test’s sensitivity, specificity,positive predictive value, negative predictive value, accuracy and likelihood ratios. Thenext section, medical decision making, will discuss each of these values. In addition tothese diagnostic performance values, the investigators may also be interested in therelationship between the result values obtained from the diagnostic tests they arecomparing. Methods to analyze the relationship between two variables includeregression analysis and correlation analysis .42 If there are more than two variables,multiple regression analysis is used. If binary outcome variables are involved, multiplelogistic regression and Cox regression methods are available. Regression analysis is amethod of predicting one dependent variable from one or more independent variables;whereas, correlation analysis investigates whether or not there is a relationship betweentwo variables and quantifies the relationship.
Correlation analysis can be useful in quantitating the relationship between the resultvalues of two different diagnostic tests. The measurement scale of the diagnostic testresult and the distribution (normal or not normal) characteristic of the values determineswhich analysis method is appropriate for the data. If both values are continuous scale andnormal, Pearson correlation methods are used; if not normal, then rank correlationmethods are appropriate. Rank correlation methods are also used if the result values areordinal scale. When more than two variables are involved, multiple regression methodsare used for continuous data and multiple logistic regression methods are used for binarydata.
The relationship between the result values of two different diagnostic tests maybeinvestigated even when the study will not support a full assessment of a new diagnostictest’s accuracy. Flamen, et al.43 compared rest and dipyridarnole stress imaging using themyocardial perfusion agents, tetrofosmin and sestamibi. The investigators wereinterested in whether tetrofosrnin might offer any advantage over sestarnibi. Therelationship between the segmental perfusion indices of tetrofosmin and sestarnibi at restand during stress was analyzed with linear correlation. A strong linear correlation wasshown. However, because of the small sample size the investigators “did not attempt tostudy the absolute diagnostic accuracy of tetrofosmin.”
Even when the full diagnostic test performance is assessed, the relationship between thetest result values can be of interest. Inoue, et al.44 compared two commonly used turnor-seeking agents for PET [2-deoxy-2-lsF-fluoro-D-glucose (FDG) ad L-methyl-1 lC-methionine (Met)] in detecting residual or recurrent malignant tumors in the samepatients. The lesions were diagnosed based on pathological findings or clinical follow-up. The results showed similar, but limited sensitivity for FDG and Met (64.5°/0 and6 1.3V0respectively) and significant correlation (r=O.788, p <0.01 ) between FDG andMet standardized uptake values (SUVS). The authors concluded the two PET agentswere equally effective.
Indeterminate Test Results
For a variety of reasons the results of the test being evaluated maybe indeterminate oruninterpretable. Examples from the literature include bowel gas obscuring the result ofultrasound, barium in the gastrointestinal tract obscuring the result of computed
22
tomography, biopsy producing fragments that are insufficient for histologicalidentification, and breast density invalidating marnmography.3
Indeterminate test results should not be ignored. Presentation ofIndeterminateFirst the number of indeterminate test results that Test Results Criterion: lSthe diagnostic test generates is important. Thepatients with uninterpretable results will needfurther work-up. Either the test will have to berepeated or another test done. In either case, thepatient will experience farther expense andpossible risk.
Within the diagnostic test evaluation study, ifuniterpretable test results are counted as positive,sensitivity is falsely increased and specificitydecreased. If the results are counted as negative,
Report all of the appropriatepositive, negative, andindeterminate results, and
Report whetherindeterminate results hadbeen included or excludedwhen indexes of accuracywere calculated.
sensitivity is falsely decreased and specificity Iincreased. ~5 It is recommended that all indeterminate test results be reported as such bythe investigators. Indeterminate results that hap en as random events and with a test that
?is repeatable, can be disregarded in the analysis. If the indeterminate test results arerelated to the disease, it may be best to follow these patients or administer otherdiagnostic tests until their disease status is clear.
MEDICAL DECISION MAKING APPLIED TO DIAGNOSTIC TESTPERFORMANCEWe have just reviewed a litany of problems and biases that can interfere with a diagnostictest’s performance. Important considerations were the kinds of patients included in thestudy and bias control in assessing the test results and the gold standard results,Methodologies to critically evaluate the diagnostic test’s performance include: decisionmatrix, receiver operating characteristic (ROC) curve and information theory .45
Decision Matrix
Whether the diagnostic test results are measured in dichotomous scale or are measured inordinal or continuous scale and converted to dichotomous scale, the results are presentedfor analysis in a two by two (fourfold) table, (see Table 1). The table logically relates theresults of the diagnostic test to those of the gold standard test.
Sensitivity and Specificity
The binary results of the diagnostic test being evaluated are plotted orI the two by twotable, dividing the results between those that agree and those that do not agree with thegold standard test. Four cells are formed and thus four ratios gemrated that compare theresults of the test to the actual presence or absence of disease.
The true positive (T+) ratio is the proportion of test positive (Test+) results among alldisease positive [(D+)=(T+)+(F-)] individuals. This is the probability that patients withthe disease will test positive. It is expressed as a conditional probability,
23
P(Test+ !D+),
the probability that a patient with the disease (D+) will have a positive test (Test+). The
vertical bar is not a division symbol, but indicates the condition that is present orabsent.45 The true positive probability is the test’s sensitivity. It expresses the test’saccuracy in identifying patients with disease as positive.
The true negative (T-) ratio is the proportion of test negative (Test-) results among alldisease negative [(D-)=(F+)+(T-)] individuals. This is the probability that patientswithout the disease will test negative. It is expressed as:
P(Test- [D-),
the probability that a patient without the disease (D-) will have a negative test (Test-).The true negative probability is the test’s specificity. It expresses that test’s accuracy inidentifying patients without the disease as negative
Sensitivity and specificity represent the accuracy of the test itself.characteristics have been called the test’s stable properties as theystable over differing prevalence of the disease.
The overall accuracy of the test is:
(T+)+(T-)
(T+)+(F+)+(F-)+(T-)
Predictive Values
In the past thesewere thought to be
For an individual patient, sensitivity and specificity do not have personal meaning. Atthe time a diagnostic testis used on an individual patient to make decisions abouttreatment, the patients true disease status (gold standard test result) is unknown. Forspecific patients we would like to know how well the diagnostic test predicts their goldstandard status. In other words, for patients testing positive, how likely is it that thepatients are truly disease positive? If patients test negative, how likely is it that they aretruly disease negative?
The horizontal features of the decision matrix provide the test’s predictive values. Thepositive predictive value (PPV) of the test tells us what proportion of the test’s positiveresults are truly positive. If the test is positive, how well does it “rule in” disease? Thenegative predictive value @PV) of the test tells us what proportion of the test’s negativeresults are truly negative. If the test is negative, how well does it “rule out” disease’? Atthis point, please note that predictive values are proportions. Predictive values tell uswhat percentage of the test’s positive (or negative) values are truly positive (or negative).The question we asked in the prior paragraph about how likely an individual patient’s testresult is true, is not really answered by predictive values. Likeliness is slightly differentthan proportionality and is discussed in the next section.
The overall accuracy of the test and the positive and negative predictive values do changewith differing prevalence of the disease and are referred to as unstable. This is animportant consideration for individual patients. The frequency with which diseases
24
present themselves in various practice settings differs. For example, within a primarycare setting we might expect to see a lower percentage of hypertensive patients than in atertiary care setting. The predictive value of a positive or a negative test result will bedifferent depending upon whether the patient was seen in a primary care clinic or atertiary care setting.
Many early diagnostic test studies tend to use an artificial, 50:50, disease prevalence inthe study. The predictive values in the stady are thereby applicable only to populationswhere the disease prevalence is 50V0. Most diseases do not occur that frequently. Theresults of the diagnostic test study can be translated to a local community if the localprevalence (albeit rough) of the disease is known or can be estimated. Using simplemath, a two by two table can be constructed using the test’s sensitivity and specificity andthe local disease prevalence,32 As the prevalence of most diseases is less than that usedin diagnostic test evaluation studies, we would expect the positive predictive value of thetest to decrease and the negative predictive value to rise when the test’s sensitivity andspecificity values are applied to local prevalence. Table 2 illustrates this relationship. Adiagnostic test is determined to have a sensitivity of 85% and a specificity of 90% in aresearch study that used a 50:50 sample prevalence. At 500/0prevalence the predictivevalue of a positive test is 89.5°/0 — a fairly reassuring value, indicating that 89.5°/0 ofpatients with a positive test result are disease positive. The predictive value of a negativetest is 85.7V0. However, if the prevalence of the disease in the local community is only1%, the predictive value of a positive test will be only about 8% — a much lesssatisfactory figure.
Likelihood Ratio
The primary indexes reported for diagnostic tests are sensitivity (true positive ratio) andspecificity (true negative ratio). However, the corresponding false positive ratio and falsenegative ratio also have usefulness.
False positive ratio = P(Test+ ID-) = (F+)/(F+)+(T-)
False negative ratio = P(Test- ID+) = (F-)/(T+)+(F-)
The false positive ratio is the proportion of positive tests in all patients who do not havethe disease. The false negative ratio is the proportion of negative tests in all patients whohave the disease. Ideally the diagnostic test would have high true positive and truenegative ratios and also have low false positive and false negative ratios.
The ability of a diagnostic test to identi~ individuals with disease, without incorrectlyincluding patients without disease, that is, a high true positive and a low false positiveratio, is the likelihood ratio for a positive test result.45
Likelihood Ratio for a Positive Test = true positive ratio/false positive ratio
Tests with high likelihood ratios are desirable. The likelihood ratio for a positive testtells us how good the test will be at “ruling in” a disease. One can compwe thelikelihood ratios for two different diagnostic tests to determine which test does the betterjob of ruling in the target disease.b
25
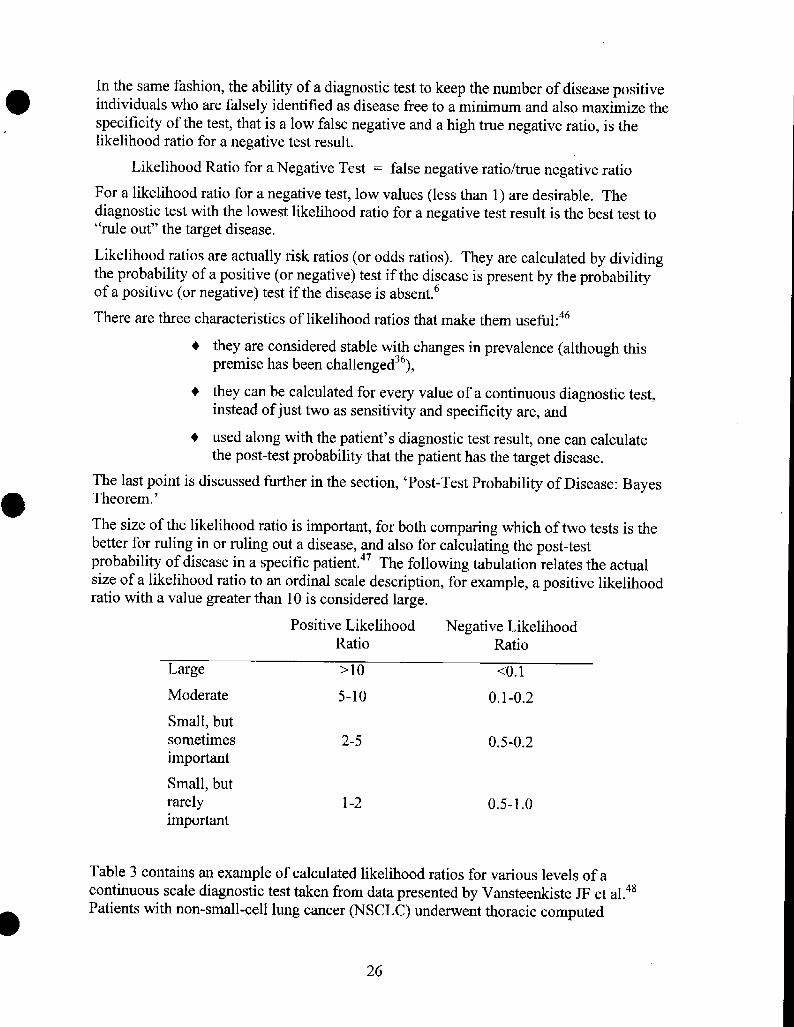
In the same fashion, the ability of a diagnostic test to keep the number of disease positive
● individuals who are falsely identified as disease free to a minimum and also maximize thespecificity of the test, that is a low false negative and a high true negative ratio, is thelikelihood ratio for a negative test result.
Likelihood Ratio for a Negative Test = false negative ratio/true negative ratio
For a likelihood ratio for a negative test, low values (less than 1) are desirable. Thediagnostic test with the lowest likelihood ratio for a negative test result is the best test to“rule out” the target disease.
Likelihood ratios are actually risk ratios (or odds ratios). They are calculated by dividingthe probability of a positive (or negative) test if the disease is present by the probabilityof a positive (or negative) test if the disease is absent.b
There are three characteristics of likelihood ratios that make them useful:4b
+ they are considered stable with changes in prevalence (although thispremise has been challenged3b),
+ they can be calculated for every value of a continuous diagnostic test,instead of just two as sensitivity and specificity are, and
+ used along with the patient’s diagnostic test result, one can calculatethe post-test probability that the patient has the target disease.
The last point is discussed further in the section, ‘Post-Test Probability of Disease: Bayes
o Theorem.’
The size of the likelihood ratio is importmt, for both comparing which of two tests is thebetter for ruling in or ruling out a disease, and also for calculating the post-testprobability of disease in a specific patient.47 The following tabulation relates the actualsize of a likelihood ratio to an ordinal scale description, for example, a positive likelihoodratio with a value greater than 10 is considered large.
Positive Likelihood Negative LikelihoodRatio Ratio
Large >10 <().1
Moderate 5-1o 0.1-0.2
Smallj butsometimes 2-5 0.5-0.2important
Small, butrarely 1-2 0.5-1.0
important
Table 3 contains an example of calculated likelihood ratios for various levels of acontinuous scale diagnostic test taken from data presented by Vansteenkiste JF et al.48Patients with non-small-cell lung cancer (NSCLC) underwent thoracic computed
26
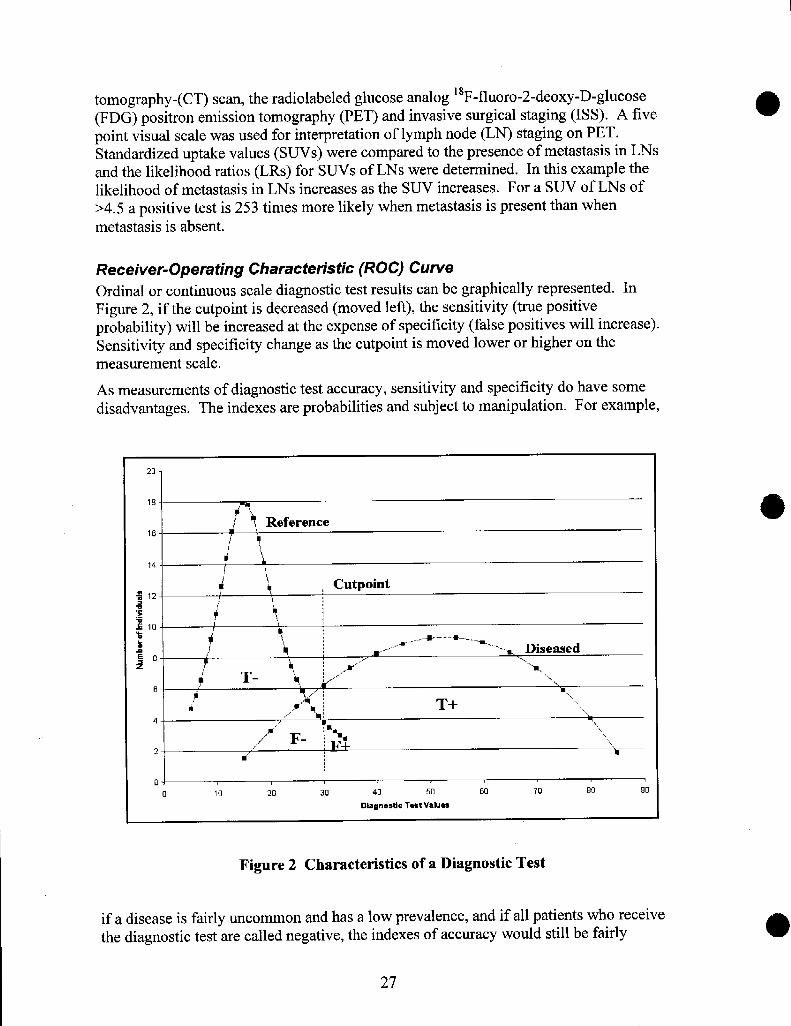
tomography -(CT) scan, the radiolabeled glucose analog lsF-fluoro-2-deoxy-D-glucose(FDG) positron emission tomography (PET) and invasive surgical staging (1SS). A fivepoint visual scale was used for interpretation of lymph node (LN) staging on PET.Standardized uptake values (SUVS) were compared to the presence of metastasis in LNsand the likelihood ratios (LRs) for SUVS of LNs were determined. In this example thelikelihood of metastasis in LNs increases as the SUV increases. For a SUV of LNs of>4.5 a positive test is 253 times more likely when metastasis is present than when
metastasis is absent.
Receiver-Operating Characteristic (ROC) Curve
Ordinal or continuous scale diagnostic test results can be graphically represented. InFigure 2, if the cutpoint is decreased (moved left), the sensitivity (true positiveprobability) will be increased at the expense of specificity (false positives will increase).Sensitivity and specificity change as the cutpoint is moved lower or higher on themeasurement scale.
As measurements of diagnostic test accuracy, sensitivity and specificity do have somedisadvantages. The indexes are probabilities and subject to manipulation. For example,
201
o 10 20 30 40 50 60 70 00 90
Dlagnostlc T=stValue3
Figure 2 Characteristics of a Diagnostic Test
if a disease is fairly uncommon and has a low prevalence, and if all patients who receivethe diagnostic test are called negative, the indexes of accuracy would still be fairly
27
‘accurate’ as indeed most patients are negative. Even if decisions are not arbitrarilymade, there is a certain amount of agreement between the diagnostic test being evaluatedand the gold standard that can be expected by chance alone.
Metz49 points out two major limitations of sensitivity and specificity. First, these indexesvary with disease prevalence. Secondly, using sensitivity and specificity to compare twodifferent diagnostic tests is difficult as, while the percent of accurate results can be thesame for two different tests, they can have different meanings. For example, one of thetests may error with false positive results and the other error with false negative results.Accuracy must always be considered in terms of both sensitivity and specificity. FromFigure 2 we can see that the total number of disease free individuals (100% of referencesample) is made up of true negatives (T-) and false positive (F+) results. As fractions ofthe total then, (T- fraction) + (F+ fraction) = 1. For the diseased sample, the total numberof diseased individuals (100°/0 diseased) is made up of true positive (T+) results and falsenegative (F-) results. Then, as fractions of the total, (T+ fraction) + (F- fraction) = 1.Thus the value of each fraction will fall between Oand 1. Using this terminology, the T+fraction is the sensitivity and the T- fraction is the specificity. Again, from Figure 2, onecan see that if the reference and diseased curves overlap; the decision as to where on thescale of diagnostic test values the cutpoint is assigned is extremely important. Movingthe cutpoint even a few units on the scale will change the number of individualsidentified as falsely free of disease or falsely diseased. Regardless of how the cutpoint isdetermined, it is an arbitrary threshold between disease free and diseased.
Because the cutpoint is arbitrary, investigators often consider the accuracy indexes ofsensitivity and specificity within a framework of several different cutpoints. A decisionmatrix can be constructed for each point on the measurement scale (x axis) that could becalled either positive or negative — the values on the scale where the curves overlap.Each decision matrix will provide two sets of fractions, one the [T+ fraction and F-fraction] which describes the diseased curve and the other the [T- fraction and the F+fraction] which describes the reference curve. Since each set of fractions is equal to 1, ifone of the fractions of a set is known, the other can be calculated. Likewise, if onefraction from each set is known, the characteristics of both sets are represented. Byconvention, the T+ fraction (sensitivity) and the F+ fraction (1-sensitivity) are chosen torepresent the characteristics of accuracy for each cutpoint value that is considered. TheT+ fraction and F+ fraction will increase or decrease between the value range of Oto 1 asthe cutpoint is moved up or down the diagnostic test measurement scale. Therelationship of T+ fraction to F+ fraction over each of the Oto 1 possible values can begraphically represented, Figure 3.
28
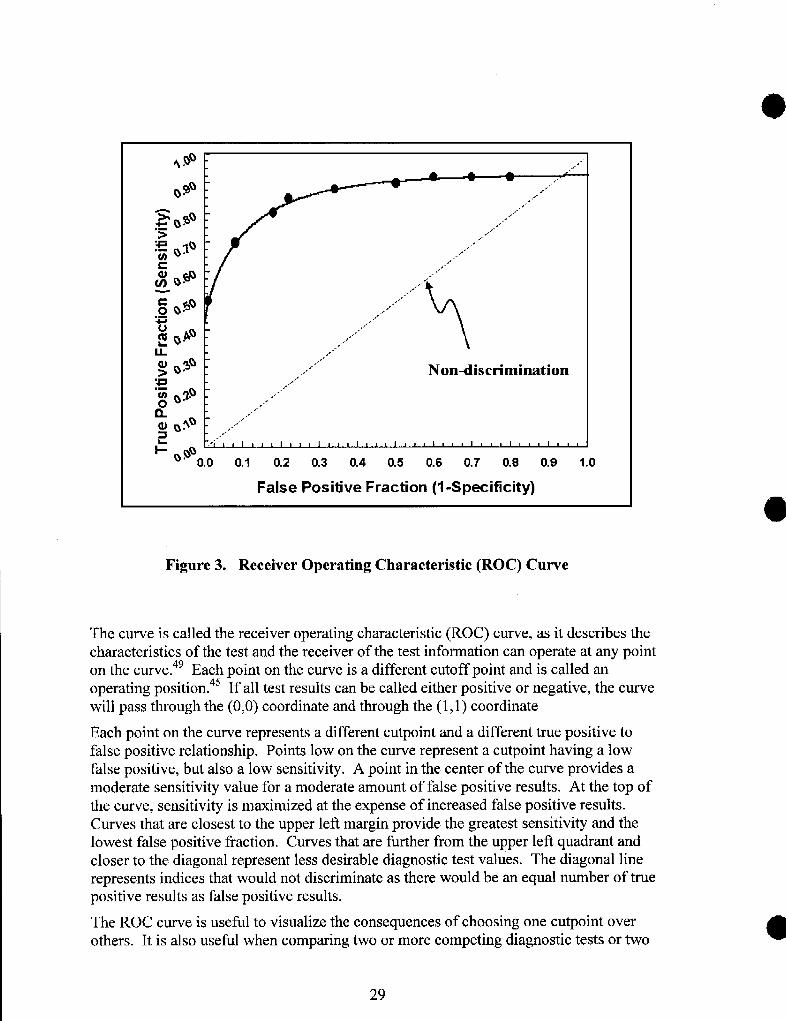
,.
.,“.,,,.,
,.J
,, “,.,-”
,,‘-,.,“
\
..”,.,,.-
,,-..“.,,
,-‘,..,,”
,,.-gJ 3U ,..’> Q* ,, J Non-discrimination:~ ,,.,..~ Q%Q
,. -’
..-’
8# ~>~ : ,..’’’”
, ,-
=@ ““”-
1 I t I 1 1 1 I 1 1 1 1 1 1 I I I I I
‘“ 0.0 0.1 0.2 0.3 0.4 0.5 0.6 0.7 0.8 0.9 1.0
False Positive Fraction (1-Specificity)
Figure 3. Receiver Operating Characteristic (ROC) Curve
‘~hc curve is called the receiver operating characteristic (ROC) curve, as it describes thecharacteristics of the test and the receiver of the test information can operate at any pointon the curve.4g Each point on the curve is a different cutoff point and is called anoperating position .45 If all test results can be called either positive or negative, the curvewill pass through the (0,0) coordinate and through the (1, 1) coordinate
Each point on the curve represents a different cutpoint and a different true positive tofalse positive relationship. Points low on the curve represent a cutpoint having a lowfalse positive, but also a low sensitivity. A point in the center of the curve provides amoderate sensitivity value for a moderate amount of false positive results. At the top ofthe curve, sensitivity is maximized at the expense of increased false positive results.Curves that are closest to the upper left margin provide the greatest sensitivity and thelowest false positive fraction. Curves that are further from the upper left quadrant andcloser to the diagonal represent less desirable diagnostic test values. The diagonal linerepresents indices that would not discriminate as there would be an equal n~ber of truepositive results as false positive results.
The ROC curve is useful to visualize the consequences of choosing one cutpoint overothers. It is also useful when comparing two or more competing diagnostic tests or two
29
@
‘0
or more observers of diagnostic test results. Since true positive fraction and false positivefraction vary in direct relationship to one another, the tme positive fractions (sensitivities)for each test being compared can be made to equal the same value. The false positivefraction for each test being compared would then adjust itself accordingly. The test withthe lowest false positive fraction would be most desirable. Alternatively, the ROC curvefor each test can be charted and the test with the largest area under the curve wouldprovide the best sensitivity for the lowest false positive fraction. Metz49 considered thisthe best method to compare differences in curves as there is not an acceptablemathematical method to test for statistically significant differences between ROC cwves.The lack of an acceptable statistical test to show differences between ROC curves alsomeans that there is no method of calculating a necess~ sample size. From experienceMetz49 suggests a sample of about 100 or more patients is adequate. As with clinicaltrials, more subjects are need to find small differences between diagnostic test ROCcurves than to find large differences.
ROC analysis of diagnostic test results requires the comparison of the test to a goldstandard. However, as mentioned earlier, it is sometimes difficult to achieve a separate,independent gold standard comparison for diagnostic imaging tests as the gold standard issurgery or autopsy or includes using the results of the first imaging test with subsequenttests as the gold standard. There are now several reports in the literature of diagnostictest evaluation being done in the absence of a gold standard test. In the section on GoldStandard Choice we review such a study done by Line, et al. 19 A method to comparemagnetic resonance imaging, computed tomography and radionuclide scintigraphy for thediagnosis of liver metastasis without benefit of a gold standard has been presented byHenkelman, et al.50
According to Peirce and Corne1151the ROC originated in “World War [1, when signaldetection theory was applied to radar to characterize and evaluate how well a radaroperator could receive or “see” a signal against a noisy background.” In medicine,Lusted first applied ROC analysis to radiographic imaging in the late 1960’s. The ROCcurve is now the accepted method of summarizing ordinal and continuous scalediagnostic test accuracy data.
Information Theory
Information theory is concerned with reducing uncertainty. The primary fonction of adiagnostic test is to reduce the uncertainty of the patient’s diagnosis. Stated another way,the diagnostic test should increase the amount of clinical information available to themedical decision-maker.
The decision of which of the contending cutpoints to choose to distinguish disease freefrom disease positive individuals can be addressed with information theo~. The perfectdiagnostic test would have a sensitivity of 100% (T+ fraction= 1) and zero false positiveresults (F+ fraction = O). At the other extreme, a non-discriminating test’s ROC thatoffers a 50:50 chance of being positive or negative, would lie along the diagonal from 0,0to 1,1. Values below the major diagonal occur when positive results are more likely tooccur when the test is negative than when it is positive. The perfect test providesmaximum information content as it perfectly discriminates between disease positive anddisease negative individuals. In practice diagnostic tests will not be perfect, but we hope
30
they provide more information than that provided by a 50:50 chance of being positive or @\
negative. Using the area under the curve model, if the perfect test has an area of 1; thenon-discriminating diagonal has an area of 0.5. The information content of each of thepossible cutpoints on the ROC curve can be calculated.52
The choice of the optimal cutpoint also needs to be framed in the context of diseaseprevalence and values. Disease prevalence tells us how likely it is that any given patientcould have the disease before the diagnostic test is done. If the disease is rare, we couldguess that the patient does not have the disease and we would be correct most of the time.Under these circumstance, we may want to chose a cut point that is in the lower leftportion of the curve where the sensitivity of the testis low, but the number of falsepositive’s will be lower still. If hi ~~r values on the curve are used, many of the positive
findividuals will be false positives. 7 Screening tests frequently fall into this situation.Also, if the consequences of a false positive decision are serious, such as surgery for anindividual who does not have the disease, we will want to minimize false positives. If theprevalence of the disease is higher, that is the disease is common, the best cutpoint willbe in the upper right quadrant, where sensitivity is high along with high false positiveresults, but false negative results are minimized. If lower values on the curve are used,many of the negative results will be false negatives. This is also an appropriate strategywhen it is extremely important to identi~ all individuals who have the disease.
The second consideration has to do with values. What is the value, cost, andconsequence of assigning an individual to the false positive category or to the falsenegative category? Metz4g provides mathematical methods to analyze the cost/benefit of a“each particular cutpoint. False negatives and false positives have both health costs andfinancial costs.
Lacking information about the health costs or financial costs of false positive and falsenegative results, a cutpoint can be chosen that will minimize mistakes .45 This is the pointon the curve where the slope of the curve equals the prior probability of no disease, P(D-), divided by the prior probability of disease, P(D+).
Slope = P(D-)/P(D+)
For example, if the pretest (prior) probability of disease in an individual patient is 15V0,then the prior probability of no disease is 85Y0,and the best operating position on thecurve is the point where the slope equals 0.85/0.15 = 5.7.
Post-Test Probability of Disease: Bayes Theorem
In the usual course of medical care the patient presents to the physician or the health careteam. Using history and physical examination, the suspicion of disease in this patientdevelops into a possibility of disease. At this point a decision is made about whether ornot diagnostic testing will occur. The function of the diagnostic test is to increase theinformation available to make decisions about the patient’s health. If the diagnostic testcan not contribute futiher information to the scenario (the management of that patient isdetemined and will not change), the test probably should not be done. In other words,we expect the diagnostic test to change our initial suspicion of disease in the patient —either the surety of no disease or the surety of disease should increase. In either case,before the diagnostic test is done, there is some suspicion of disease presence. The
●
31
o suspicion of disease presence can be expressed quantitatively as the probability that thepatient has the specified disease. The diagnostic test results will, we hope, change thepatient’s probability of disease. How is the diagnostic test results combined with the pre-test information about the patient to provide a post-test estimate of disease presence?Bayes theorem cm be used to revise the original estimate of disease in the patient byincorporating the information gained from the diagnostic test result. The words Bayestheorem and Bayesian inference are likely to cause our eyes to roll. l+owever, what weare really concerned with is applying simple math to our natural decision making process.We develop a suspicion of disease in a patient and using history, physical examinationand diagnostic tests (generally in series), we change/revise our suspicion as we gain moreconfidence from the new information. We use Bayes theorem to algebraically calculatethe probability of disease after the positive (or negative) diagnostic testis known in lightof the patient’s initial (pretest) disease probability.
Our suspicion of disease after the diagnostic test, post-test probability of disease, isdependent upon the sensitivity and specificity of the diagnostic test and upon the pretestprobability of disease in the patient. For an ideal @erfect) test the pretest probability ofthe disease is not important. If a test has perfect sensitivity, that is 100°/0, there are nofalse negative results (only true negative), therefore if the testis negative, the post-testprobability of disease will be O. If the test has perfect specificity, that is 100Y0, there areno false positives (only true positives), therefore if the test is positive, the post-testprobability of disease will be 1. In this argument the post-test probability of disease is
*the same as the positive and negative predictive values.
Pretest Probability of Disease
Lacking a perfectly sensitive or specific test, the pretest probability of disease doesinfluence the patient’s post-test probability of disease. If the clinician estimates thepatient’s pretest probability of disease as low and the diagnostic test result is negative, thepost-test probability of disease had changed little from the pretest value. However, if thesame patient has a positive test result, the post-test probability of disease is quite differentihan the pretest value. The converse is also true, a high pretest probability of disease ischanged little by a positive test result, but changed dramatically by a negative test result.
How do clinicians arrive at the pretest estimate of disease presence? Personal experienceprobably plays a large role in estimating pretest probabilities. The prevalence of thedisease in the clinicians own practice area, such as the clinic or the hospital is mostrelevant. Other data sources may include community surveys or local databases. Suchfactors as the patient’s age, sex, history and signs and symptoms will modify the localdisease prevalence value. The pretest probability of disease is specific for each patient,so even local prevalence data will need to be personalized.
The published literature also provides estimates of prevalence for various diseases. Thejump from published prevalence to a specific patient’s pretest disease probability is largeand presents problems. Published literature may be more representative of referralcenters or tertiary care settings than the patient’s local setting. Tertiary care setting willtend to have higher disease prevalence than primary care settings.
32
When faced with estimating the patient’s pretest prevalence without good information,one method to somewhat control the uncertainty is to use the highest reasonableprevalence value and the lowest reasonable prevalence value and see if either of thesevalues changes the patient’s post-test probability of disease. Many clinicians intuitivelyassign a patient a pretest probability of disease, such as unlikely, likely, very likely. Thisinference model requires the ordinal estimate to be transformed to an explicit value.
One might ask about the disease prevalence that appears in the published diagnostic testevaluation study. Earlier we mentioned that in order to obtain the best precision inmeasuring all the diagnostic test’s accuracy indices (T+, T-, F+, F-), investigators wouldemoll equal numbers of disease positive and disease negative subjects. While possible, itis not often that the 50% disease prevalence in the published study will match thepatient’s probability of disease. Thereby, the positive and negative predictive valuesfrom the published study will not apply to a specific patient.
There is also another reason to look further than the published study’s positive andnegative predictive values. In the examples presented so far and in Table 1, thslikelihood ratio for a positive test and the likelihood ratio for a negative test werepresented for just one cutpoint. For ordinal and for continuous data, we know that thereis generally overlap between the disease negative and disease positive values. Because ofthis overlap, there is a‘ sliding scale’ of disease positivity. If only a single cutpoint isused to determine disease presence or absence, the information contained in the overlaparea is lost. This information is retained if multiple cutpoints are used. This is donemathematically by using stratum-specific likelihood ratios.51 In Table 3 standardizeduptake values (SUV) in the locoregional lymph nodes (LNs) in patients with and withoutmetastasis are divided into strata. For each stratum, the likelihood ratio is calculated. Foran individual patient, the patient’s diagnostic test result, in this example the SUV of LNs,can be matched to one of the stratum. If the patient’s SUV was 4.0, the 3.5-4.5 stratumapplies and the corresponding likelihood ratio (LR) is 3.157.
Earlier wc discussed ROC curves, a plot of (sensitivity) vs. (1 – specificity); it isinteresting to note that a likelihood ratio for a positive testis (sensitivity)/(l –specificity).
Where do we find likelihood ratios? Despite the apparent sensibleness of likelihoodratios, particularly spectrum-specific likelihood ratios, they have not been overwhelmingadopted into clinical practice. However, their use is increasing and they have beenstrongly promoted by evidence based medicine publications. Likelihood ratios are beingreported in published diagnostic test evaluation studies. List of likelihood ratios havebeen generated by McMaster University4b and also appear in newer textbooks.53
Calculating Post-test Probability
Stratum-specific likelihood ratios are considered a better way of reflecting diagnostic testaccuracy than sensitivity and specificity for a single cutpoint.4A’54 Given this, likelihoodratio is the index used to incorporate the patient’s pretest disease probability into thediagnostic test result to produce the post-test probability. Referring to Table 1 we can seethat the likelihood ratio for a positive (or negative) test result is a ratio of twoprobabilities: the probability of a positive (or negative) test if the disease is present to the
33

probability of a positive (or negative) test if the disease isabsent. Likelihood ratios are actually risk ratios or oddsratios. The fact that the desirable index to use to calculatepost-test probability of disease is an odds ratio isunfortunate. Most health care professionals think in termsof’probabilities, not odds. In fact, we have just spoke of thepretest and post-test probabilities of disease for a specificpatient — not pre- and post-test odds. To combine a
<(
. . . diagnostic testssimply change the oddsin favour or againstdisease; sometimesthey only confuse thediagnosis.”54
likelihood ratio with the pretest probability of disease, we must convert the pretestprobability of disease to odds. The formulais:51’5s
Pretest probability/(1 -pretest probability) = pretest odds
If the probability of disease is 15Y0,then the disease odds is equal to (O.15/(1-O. 15)=(0.15/0.85) = 0.18:1.
The post-test odds of disease is calculated by:
Post-test odds = pretest odds x likelihood ratio
The odds ratio form of Bayes’ theorem requires that the pretest probability of disease beconverted to odds and that the resultant post-test odds of disease be converted back to aprobability.
Post-test probability = post-test odds/(post-test odds + 1)
The McMaster University group4b has published a nomogram, Figure 4, that relieves usof the calculations. The nomogram appears on their web site (see site 2 in the followingInternet Educational Resources section). An interactive nomogram is available from site3 in the Internet Educational Resources listing. The nomogram is used by drawing astraight line from the pretest probability value through the likelihood ratio for thediagnostic test and continuing the line to the post-test probability scale.
34
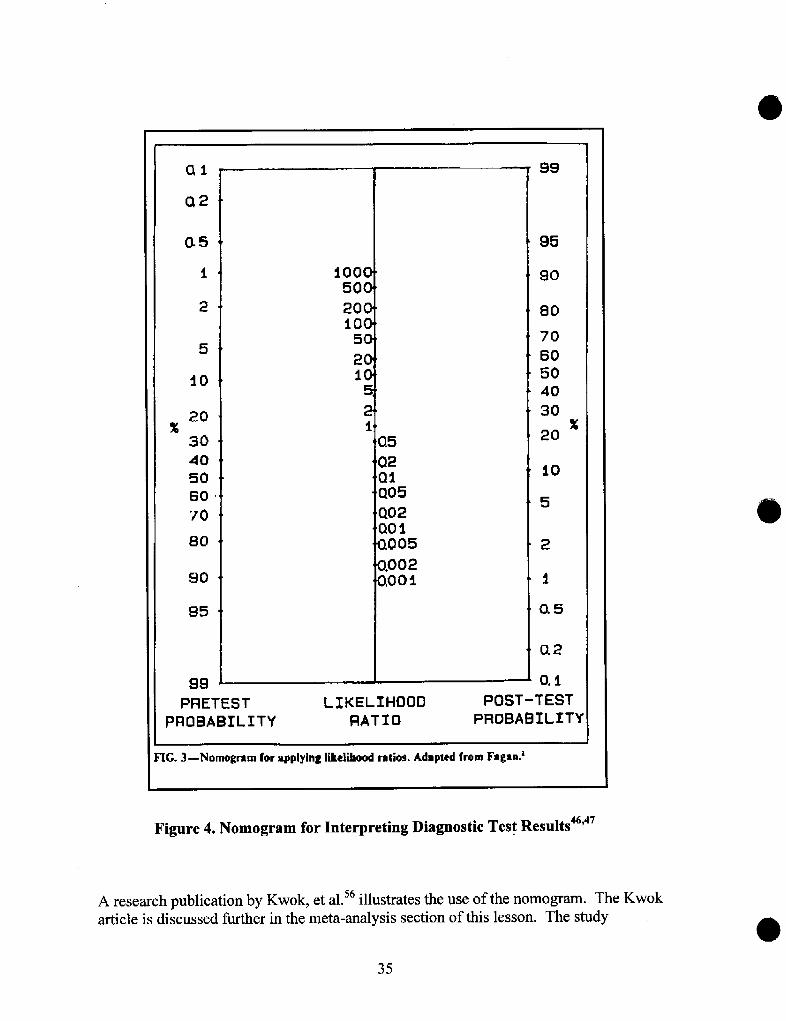
05
i
2
5
io
%20
30405060
70
iooc50(
20(10(
5(
2(1(
~
:5
PRETEST LIKELIHOOD
99
95
90
80
70
60
504030
20
10
5
2
1
0.5
Q2
0.1
%
POST-TEST
PROBABILITY RATIO PROBABILITY
IG.3—Nomo~ramror applying likclib~ ratios. Adapted from Fagan?
Figure 4. Nomogram for Interpreting Diagnostic Test Results4d’47
A resemch publication by Kwok, et al.54 illustrates the. use of the nomogram. The Kwok
article is discussed further in the meta-analysis section of this lesson. The stady o35
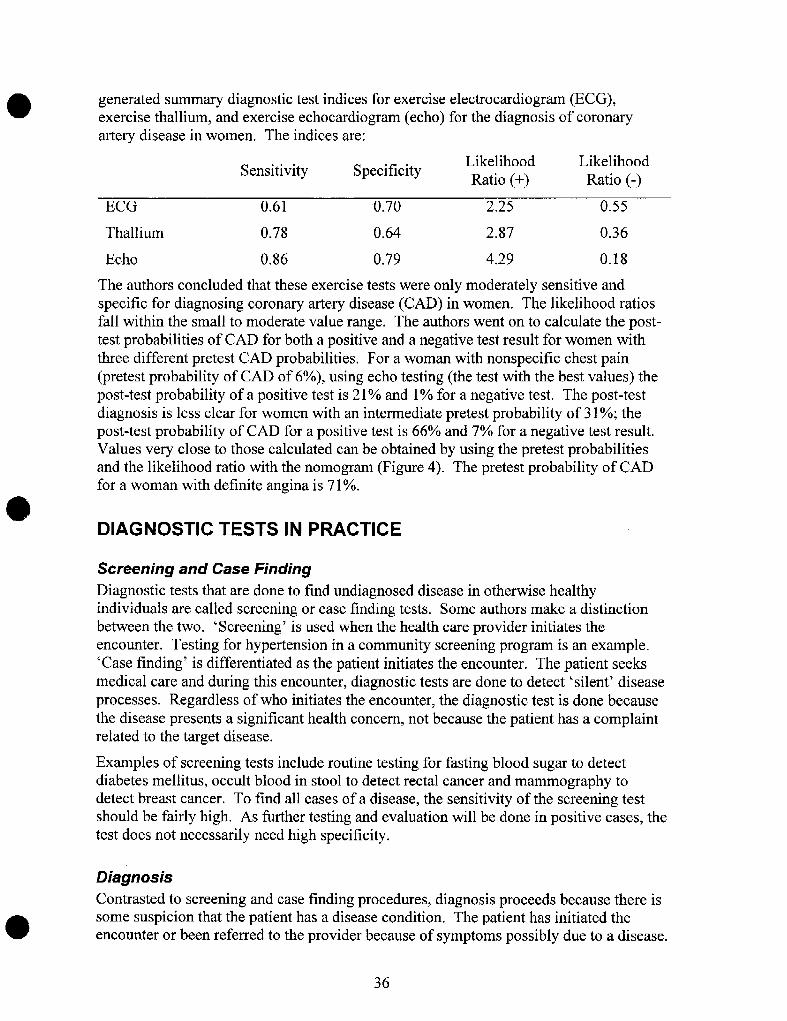
● generated summary diagnostic test indices for exercise electrocardiogram (ECG),exercise thallium, and exercise echocardiograrn (echo) for the diagnosis of coronaryartery disease in women. The indices are:
Sensitivity SpecificityLikelihood LikelihoodRatio (+) Ratio (-)
ECG 0.61 0.70 2.25 0.55
Thallium 0.78 0.64 2.87 0.36
Echo 0.86 0.79 4.29 0.18
The authors concluded that these exercise tests were only moderately sensitive andspecific for diagnosing coronary artery disease (CAD) in women. The likelihood ratiosfall within the small to moderate value range. The authors went on to calculate the post-test probabilities of CAD for both a positive and a negative test result for women withthree different pretest CAD probabilities. For a woman with nonspecific chest pain(pretest probability of CAD of 6%), using echo testing (the test with the best values) thepost-test probability of a positive testis21% and 1% for a negative test. The post-testdiagnosis is less clear for women with an intermediate pretsst probabilityof31 %; thepost-test probability of CAD for a positive testis 66% and 7% for a negative test result.Values very close to those calculated can be obtained by using the pretest probabilitiesand the likelihood ratio with the nomogram (Figure 4). The pretest probability of CADfor a woman with definite angina is 71 VO.
DIAGNOSTIC TESTS IN PRACTICE
Screening and Case Finding
Diagnostic tests that are done to find undiagnosed disease in otherwise healthyindividuals are called screening or case finding tests. Some authors make a distinction
between the two. ‘Screening’ is used when the health care provider initiates the
encounter. Testing for hypertension in a community screening program is an example.
‘Case finding’ is differentiated as the patient initiates the encounter. The patient seeks
medical care and during this encounter, diagnostic tests are done to detect ‘silent’ disease
processes, Regardless of who initiates the encounter, the diagnostic testis done because
the disease presents a significant health concern, not because the patient has a complaint
related to the target disease.
Examples of screening tests include routine testing for fasting blood sugar to detectdiabetes mellitus, occult blood in stool to detect rectal cancer and mammography todetect breast cancer. To find all cases of a disease, the sensitivity of the screening testshould be fairly high, As further testing and evaluation will be done in positive cases, thetest does not necessarily need high specificity.
Diagnosis
Contrasted to screening and case finding procedures, diagnosis proceeds because there is
osome suspicion that the patient has a disease condition, The patient has initiated the
encounter or been referred to the provider because of symptoms possibly due to a disease.
36
The health care provider would like at this point a diagnostic test that will either confirmor exclude the suspected disease.
An individual diagnostic test maybe very good for screening, confirmation or exclusion— some tests can even do two of the three very well. However, very few tests canappropriately be used for screening, confirmation and exclusion. Even if a test couldreasonably do all three, expense and risk to patient may limit the test’s usefulness.
Confirmatory Tests
If there is a strong suspicion of disease, a confirmatory test will be used to verify thediagnosis. For example, if a patient has had a positive fasting blood glucose, a glucosetolerance test might be used to confirm the diagnosis.
To confirm a diagnosis, a diagnostic test that is capable of ruling in the diagnosis isneeded. Contrary to what we might first think, a diagnostic test with a high specificityworks well to rule in a diagnosis. A positive test result from a diagnostic test that has ahigh true negative and low false positive proportion will effectively rule in a diagnosis.The low false positive proportion also gives the test a high positive predictive value.SpPin (high Specificity, Positive result rules in the diagnosis) describes this situation.51
For example, a histologically positive bronchoscopic biopsy will rule in lung cancer, buta negative biopsy does not rule out the disease.
Not all diagnostic tests will have a conveniently high specificity. Since the patient’spost-test probability of having the disease is dependent upon not only the results of thediagnostic test, but also the pretest disease probability, we might also look at the test’slikelihood ratio. Likelihood ratios (LR) of 10 or higher for a positive test result cansignificantly increase the patient’s probability of disease. Even if the patient’s pretestprobability of disease is only 10VO,a LR of 10 can increase the post-test probability ofdisease to about 53V0.
Tests with LR of 5 to less than 10 are intermediate, causing moderate shifts in the pretestprobability of disease. Compared with diagnostic tests having only one reported LR,those with stratum-specific likelihood ratios provide more precise estimates of theindividual patient’s post-test disease probability.
Exclusionary Tests
An exclusionary test provides the evidence necessary to rule out a disease in a patientwho has some suspicion of disease. If the patient has a negative test result from adiagnostic test with a high sensitivity (low false negative proportion and high negativepredictive value), we can be fairly confident the patient does not have the disease. Ahighly sensitive test with a negative result will rule out a disease, SnNout. The skin testfor tuberculosis is an example of a test whose negative results rule out the disease, but apositive test result does not rule in tuberculosis, The testis also a good screening test.
A likelihood ratio for a negative test result of less than 0.1 (low false negatives) cansignificantly change the patient’s pretest disease probability away from a positivediagnosis. LRs of 0.2 to 0.1 will have a moderate influence on the patient’s pretestdisease probability.
37
Diagnostic Tests in Combination
Diagnostic tests are of value when the suspicion of disease is high enough to stimulatesome action, but not yet high enough to be a foregone conclusion with no further need fordiagnostic procedures. A single diagnostic testis unlikely to screen, confirm and excludepatients for a given disease. At the point of initial suspicion the clinician has to decide ifa single test will be done first (with the option to then move on to other tests — seriesapproach) or if several tests will be done in parallel. In either strategy, a single diagnostictest is rarely sufficient. Each test that is done should bring incremental value to thediagnosis.
In the series strategy, since only the positive patients will receive the second test, the firsttest should be a screening test with high sensitivity (SnNout). The screening test willfilter out the true negative patients (and, hopefully only a small number of falsenegatives). The remaining positive test result patients include both true and false positiveindividuals. These patients will require a second confirmatory test or group of tests thatwill definitively verify the presence of disease. The series strategy will not work if thedisease is likely to change quickly, before the second test or set of tests is performed.There should not be any carryover or influence of the first test on the performance of thesecond test(s).
The parallel testing strategy may work well if there is no single test with high sensitivity
or high specificity. For example, there may be two tests with only modest or low
sensitivity or specificity, but each test picks up on a different type of disease, such as one
detects early disease and the other one detects later symptoms. Using the two tests in
combination will identify four groups: both tests are positive (disease present), both tests
are negative (disease absent) and one test is positive and the other negative and the
converse (further testing required).
When multiple diagnostic tests are used, a new source of bias enters the arena. Forcontinuous scale diagnostic test results we know that there is generally overlap betweenthe true negative and the true positive test values. Commonly a central percentage, suchas 95°/0, of the negative values are called negative and the balance, such as 5°/0,are called‘abnormal.’ If only a single diagnostic test is done, the percentage of misdiagnosedindividuals will be 5°/0. If multiple diagnostic tests are performed this percentage ofmisdiagnosed individuals increases.7 For two tests, the central percentage of diseasenegative changes from 95°/0 to (.95)2 = 90°/0, the balance, 10°/0will be misdiagnosed. Fora twenty test chemistry refile, the central disease negative proportion drops from 95°/0
$for a single test to (.95) 0 = 36%; the probability of a false positive diagnosis with one ofthe chemistries is now 64V0. Multiple diagnostic tests present the same problem asmultiple statistical significance testing, each statistical test done increases the probabilityof a false positive result. Clinicians may want to consider wider boundaries for thedisease negative values to reduce the chance of false positive results.
Mets-analysis of Diagnostic Tests
Meta-analysis is not the combining of different diagnostic tests in the same patient, butthe combining, mathematically, of the results of different research studies evaluating thesame diagnostic test. The purpose of meta-analysis is to achieve a stronger point estimate
38

of the target outcome measured by combining like studies. It is a useful technique when
several studies have reported equivocal results or when all the studies have relatively osmall sample sizes. Mets-analysis is a separate study design and we will not review the
design in this lesson. However, meta-analyses of diagnostic tests are becoming more
common. Kwok, et a156reviewed published studies that evaluated the accuracy of
exercise electrocardiogram (ECG), exercise thallium, and exercise echocardiogram
(echo) for the diagnosis of coronary artery disease in women. Using standard meta-
analysis methods, the quality of each study was judged by (1) the inclusion of an
adequate description of the persons selected for the study, (2) the absence of verification
bias, and (3) absence of review bias if the results were read blindly. The authors
constructed a decision matrix and R(.)C curve for each study. A summary ROC curve for
the studies weighted by sample size was then plotted. By using summary data for each
test, the authors were able to draw conclusions on the value of all three tests for the
diagnosis of coronary artery disease in women.
INTERNET EDUCATIONAL RESOUCES FOR DIAGNOSTIC TESTSThe reader might be interested in looking at the following World Wide Web evidencebased medicine sites that have sections on the evaluation of diagnostic tests.
1, Evidence Based Medicine Tool Kit, University of Alberta, Canada:Users’ Guides to the Medical LiteratureURL: httP://www.med. ualbertti.ca/ebrn/artdia~.htm Accessed 1999 Dec11.“How to use an Article about a Diagnostic Test”
2. Centres for Health Evidence.Net, University of Alberta, Edmonton, Alberta,Canada
Users’ Guides to Evidence-Based PracticeIJRL: httP://www.cche. net/PrinciPles/content all.asp Accessed 1999 Dec11.Contains a section entitled, “HOWto Use an Article About a DiagnosticTest.”
3. NHS Research and Development Centre for Evidence Based MedicineURL:httP://cebm. ir2.ox.ac.uH, Accessed 1999 Dec 20.The EBM ‘roolbox: has a 2x2 table calculator and an interactivenomogram to determine post-test probabilities
4. Division of General Internal Medicine, Medical College of WisconsinURL: httP://~.intmcd. mcw.cdu/clincalc/baves. html Accessed 1999Dec 11.Contains a Bayesian calculator that calculates test sensitivity, specificity,predictive values, and likelihood ratios
39
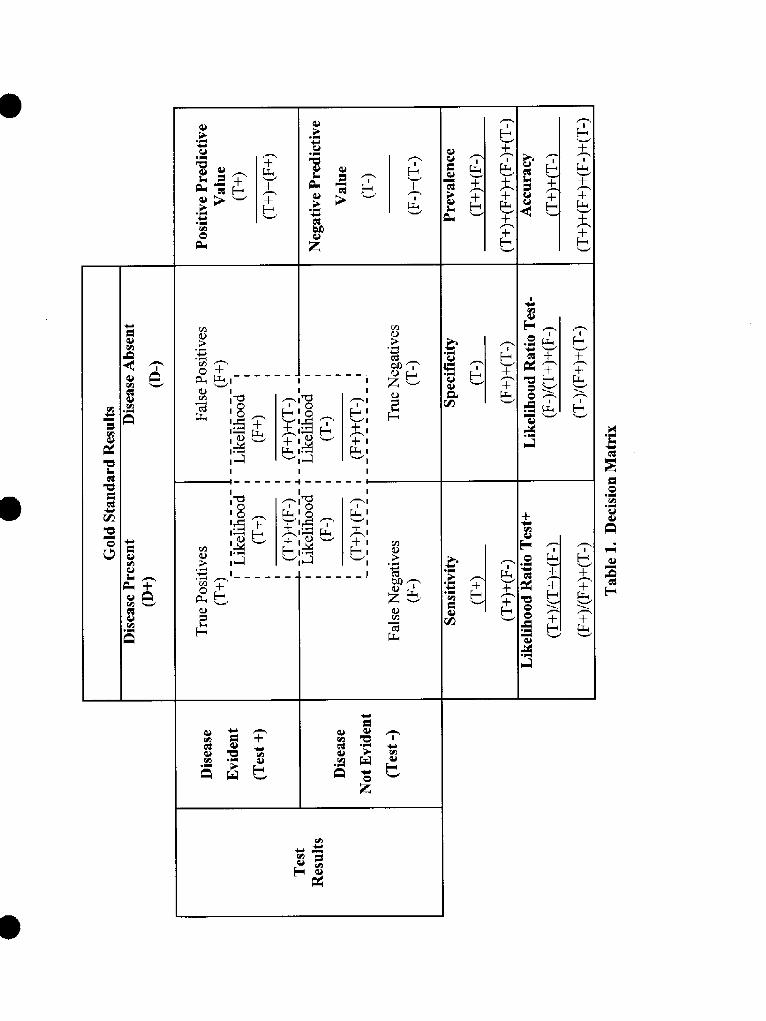
---- --,I
I I-+ ------~
d
●


I I
(d cd

,0
REFERENCES
1 Wulff HA. Rational diagnosis and treatment. Oxford: Blackwell Scientific Publications, 1976:78.
2 Fineberg IIV, Bauman R, Sosman M. Computerized cranial tomography, effect on diagnostic andtherapeutic plans. JAMA 1977;238:244-7.
~ Begg CB. Biases in the assessment of diagnostic tests, Stat Med 1987;6:41 1-23
d Mackenzie R, Dixon AK, Measuring the effects of imaging: an evaluative framework. Clin Radiol1995; 50:513-8.
5 Thornbury JR. Clinical efficacy of diagnostic imaging: love it or leave it. AJR 1994; 162:1-8.
h Riegelman RK and Hirsch RP. Studying a study and testing a test, how to read the health scienceliterature. 3rd ed. Boston: Little, Brown and Company; 1996,
7 Earl RA. Establishing and using clinical laboratory reference ranges, Appl Clin Trials 1997; 6:24-30.
* Kerlinger FN. Foundations of’behavioral research, 3nd ed. New York: Holt, Rinehart and Winston, Inc.,1986.
g Anon. How to read clinical journals: II. To learn about a diagnostic test. CMA Journal 1981; 124:703-10.
10 Campbell DT and Stanley JC. Experimental and quasi-experimental designs for research. Chicago: RandMcNally College Publishing Company; 1963.
‘‘ Rosncr B. Fundamental of biostatistics, 3rd edition. Boston: PWS-Kent Publishing Company, 1990.
12 Birnbaum D, Sheps SB. Validation of new tests. Infect Control Hosp Epidemiol 1991; 12:622-4.
13 Koran L. The reliability of clinical methods, data and judgments. N Engl J Med 1975;293 :695-701.
14 Anderson RE, Hill RB, Key CR. The sensitivity and specificity of clinical diagnostics during fivedecades, toward an understanding of necessary fallibility. JAMA. 1989; 261:1610-7.
1s Reid MC, Laths MS, Feinstein AR. Use of methodological standards in diagnostic test research, gettingbetter but still not good. JAMA. 1995; 274:645-51,
‘~ Jaeschke R, Guyatt G, Sackott DL: Users’ guides to the medical literature 111.how to use an article abouta diagnostic test, A. are the results of the study valid? JAMA. 1994; 271:389-91.
17 Arroll B, Schechtcr MT, Sheps SB. The assessment of diagnostic tests: a comparison of medicalliterature in 1982 and 1985. J Gen Intern Med. 1988; 3:443-7.
1* Hubbard WK. Regulations for in vivo radiopharmaceuticals used for diagnosis and monitoring, FederalRegister 1999(May 17);64:26657-70.
‘g Line BR, Peters ‘rL, Keenan J. Diagnostic test comparisons in patients with deep venous thrombosis. JNucl Med 1997;38:89-92.
o
20 Valenstein PN. Evaluating diagnostic tests with imperfect standards. Am J Clin Pathol. 1990; 93:252-8.
21 Dewey ME. Designs for studies evaluating tests. Internatl J Geriatric Psychiatry. 1997; 12:492-4.
22 Ransohoff DF, Feinstein AR. Problems of spectrum and bias in evaluating the efficacy of diagnostictests. N Engl J Med. 1978; 299:926-30,
2J Morise AP, Diamond GA, Detrano R, Bobbio M. Incremental value of exercise electrocardiography andthallium-20 1 testing in men and women for the presence and extent of coronary artery disease. Am Heart J.1995; 130:267-76.
24 Arkin CF, Wachtel MS. How many patients are necessary to assess test performance? JAMA 1990;263:275-8.
25 Simel DL, Samsa GP, Matchar DB. Likelihood ratios with confidence, sample size estimation fordiagnostic test studies. J Clin Epidemiol 1991; 44(8):763-70.
2G Linnet K. Comparison of quantitative diagnostic tests, type I error, power, and sample size. Statistics inMedicine 1987;6:147-58.
27 Buderer NMF, Statistical methodology, 1. incorporating the prevalence of disease into the sample sizecalculation for sensitivity and specificity. Acad Emerg Med 1996;3 :895-900.
2s Freedman LS. Evaluating and comparing imaging techniques, a review and classification of studydesigns. Br J Radiology 1987;60: 1071-81.
29 Kent DL, Larson EB, Health policy in radiology, disease, level of impact, and quality of researchmethods, three dimensions of clinical efficacy assessment applied to magnetic resonance imaging.Investigative Radiology 1992; 27:245-54.
‘n Morton RF, Hebel JR, McCarter RJ. A study guide to epidemiology and biostatisics, 3rd ed.Gaithersburg, MD: Aspen Publishers, Inc.; 1989.
~1 Coughlin SS, Pickle LW. Sensitivity and specificity-like measures of the validity of a diagnostic test thatare corrected for chance agreement, Epidemiology 1992;3: 178-81.
72 Anon. How to read clinical journals: II. to learn about a diagnostic test. Can Med Assoc J 1981 ;124:703-10.
~~ Greenhalgh T. How to read a paper, papers that report diagnostic or screening tests. BMJ 1997;3 15:540-3.
34 Leisenring W, Pepe MS, Longton G. A marginal regression modelling framework for evaluating medicaldiagnostic tests. Stat in Med 1997; 16:1263-81.
35 Vecchio TJ. Predictive value of a single diagnostic test in unselected populations. N Engl J Med 1966;274:1171-3.
‘b Brenner H, Gefeller O. Variation of sensitivity, specificity, likelihood ratios and predictive values withdisease prevalence. Stat in Med 1997; 16:981-91.
37 Yerushalmy J. Statistical problems in assessing methods of medical diagnosis, with special reference toX-ray techniques. Public Health Reports 1947;62: 1432-49.
‘s Saab AJ, Hoover DR. Lingua medics, “sensitivity” and “specificity” reconsidered, the meaning of theseterms in analytical and diagnostic settings. Ann Intern Med 1997; 126:91-4.

‘g McCombs J, Cramer MK. In: Pharmacotherapy, a pathopysiologic approach. 4* ed, DePiro JT, Talbert
● RL, Yee GC, et al., eds. Stamford, Connecticut: Appleton and Lange: 1999:1298.
4(’ Kelly S, Berry E, Roderick P, Harris KM, Cullingworth J, Gathercole L, Hutton J, Smith MA. Theidentification of bias in studies of the diagnostic performance of imaging modalities. Br j Radiology 1997;70:1028-35.
4’ Choi BCK. Sensitivity and specificity of a single diagnostic test in the presence of work-up bias. J ClinEpidemiol 1992;45:581-6.
42 Rosner B. Fundamentals of biostatistics, 3’d ed. Boston: PWS-Kent publishing Company; 1990.
43 Flamen P, Bossuyt A, Franken PR. Technetium-99 m-tetrofosmin in dipyridamole-stress myocardialSPECT imaging, intraindividual comparison with technetium-99rn-sestamibi. J Nucl Med 1995;36:2009-15.
44 Inoue T, Kim EE, Wong FCL, et al. Comparison of fluorine- 18-fluorodeoxyglucose and carbon-11-methionine PET in detection of malignant tumors. J Nuc Med 1996;37: 1472-6,
45 McNeil BJ, Keeler E, Adelstein SJ. Primer on certain elements of medical decision making. N Engl JMed 1975:293:211-5.
46 Anon, Interpretation of diagnostic data, 5. How to do it with simple math. Can Med Assoc J 1983;129:947-54.
47Jaeschke R, Guyatt GH, Sackett DL. How to use an article about a diagnostic test. [resource on WorldWide Web], URL: llttp://hiru/h irunet.mcmastcr. ca/cbm/uscr~uid/3 dx.htm. Accessed 1999 Mar 28. This
@
information is also available as:Jaeschke R, Guyatt GH, Sackett DL. Users’ guides to the medical literature, 111.How to use an article abouta diagnostic test, B. what are the results and will they help me in caring for my patients? JAMA1994;271:703-707.
4s Vansteenkiste JF, Stroobants SC, DeLeyn PR, et al, Lymph node staging in non-small-cell lung cancerwith FDG-PET scan, a prospective study on 690 lymph node stations from 68 patients. J Clin Oncol1998; 16:2142-9.
4~)Metz CE. Basic principles of ROC analysis. Seminars in Nuclear Medicine 1978 ;8(4):283-98.
~“ Henkelman RM, Kay 1, Bronskill MJ. Receiver operator characteristic (ROC) analysis without truth.Med Decis Making 1990; 10:24-9.
51 Peirce JC and Cornell RG. Integrating stratum-specific likelihood ratios with the analysis of ROCcurves. Med Decis Making 1993; 13:141-51.
52 Metz CE, Goodenough DJ, Rossmann K. Evaluation of receiver operating characteristic curve data interms of information theory, with applications in radiography. Radiology 1973; 109:297-303.
53 Sloane PD, Slatt LM, Curtis P, Ebel, eds. Essentials of family medicine, 3rd ed. Baltimore: Williams mdWilkins; 1998.
54 Sackett DL, Straus S. On some clinically useful measures of the accuracy of diagnostic tests. ACPJournal Club 1998:129 :A-17.
55 Simel DL. Playing the odds. Lancet 1985(Feb 9); 1:329.
5GKwok Y, Kim C, Grady D, Segal M, Redberg R. Mets-analysis of exercise testing to detect coronaryartery disease in women. Am J Cardiol 1999;83 :660-6.

IMPORTANT TEST INFORMATION
Please note that this article (Volume 8,Lessons 2 and 3) has been awarded 5.0contact hours or .50 CEUS. As such, youmust complete all 50 questions in order toreceive credit for lessons 2 and 3. No partialcredit can be awarded for this article.
Please be sure to complete ~ separate answerssheets for this lesson. Please fill in theanswers for questions 1-25 on the first answersheet, indicating that it is Volume 8, Lesson 2.Fill in the answers for questions 26-50 on thesecond answer sheet, indicating that it isVolume 8, Lesson 3.
Incomplete or incorrectly completed answersheets cannot be graded and will be returnedto you*
Thank you for your attention to thisimportant matter.
EVALUATING THE MEDICAL LITERATUREII. APPLICATION TO DIAGNOSTIC MEDICINE
Questions
Read the following abstract and construct a 2 by 2 table for scintimammography compared to thegold standard, biopsy:
Title: Mammography and 99mtc-mibi scintimammography in suspected breast cancerAuthor(s): Prats E; Aisa F; Abos M D; Villavieja L; Et AlSource: J Nucl Meal, vol 40, iss 2, p 296-301, yr 1999Article Abstract: The aim of this work has been to evaluate whether a diagnostic protocol
based on the joint use of mammography and 99mTc-methoxyisobutyl isonitrile (MIBI)scintimammography is capable of reducing the number of biopsies required in patients withsuspected breast cancer. Methods: We performed prone scintimmmography in 90 patientswith suspected breast cancer, involving 97 lesions. In all patients, the diagnosis wasestablished by way of biopsy. On mammography, we evaluated the degree of suspicion ofmalignancy and the size of the lesion (smaller or larger than 1 cm in diameter). Results:The results of only41 of the biopsies indicated malignancy. On mammography, 20 lesions
e
(of which 1 was breast cancer) were considered to be of low suspicion of malignancy, 31(of which 4 were breast cancer) as indeterminate and 46 (of which 36 were breast cancer) ashigh. Fourteen lesions (2 low probability, 2 indeterminate and 10 high) were smaller than 1cm, whereas 83 (18 low probability, 29 indeterminate and 36 high) were larger.Scintimammography results were positive in 35 cases of breast cancer.Scintimamrnography was positive in all cases of breast cancer that initially had a low orindeterminate suspicion of malignancy according to mammography, as well as in 30 casesof breast cancer that initially were highly suspicious. Six false-negativescintimammography studies were obtained. In the benign lesions, scintimammographyresults were positive in 12 cases and normal in 44. Conclusion: We propose a diagnosticprotocol with a biopsy performed on lesions that have a high suspicion of malignancy aswell as those with low or indeterminate suspicion that are smaller than 1 cm or with positivescintimammography results. This would have reduced the total number of biopsiesperformed by 340A. More importantly, there would have been a 65% reduction in number ofbiopsies performed in the low and indeterminate mammographic suspicion groups. All 41cases of breast cancer would have been detected.
Sensitivity = proportion of those with the disease who are correctly identified by the test[True Positive Ratio (TPR)]
Specificity = proportion of those without the disease who are correctly identified by thetest [True Negative Ratio (TNR)]
Predictive value of a positive test= proportion of those with a positive test who have thedisease
Predictive value of a negative test= proportion of those with a negative test who do nothave the disease
1. Compute the sensitivity (TPR) of scintimammography to detect malignant lesions:a. 6°/0b. 15V0C, 36%d. 79%e. 85%
2. Compute the specificity (TNR) scintimammography to detect malignant lesions:a. 6°/0b, 12%c. 14%d. 79%e. 85%
3. Compute the predictive value of a positive scintimammography:a. 12V0b. 25%c. 74%
d. 88%e. 96%
4. Compute the predictive value of a negative scintimammography:a. 6°/0b. 12%c. 45%d. 52%e. 88°/0
5. Compute the overall accuracy of scintimammography:a. 36%b. 45%C. 52%d. 81%e. 100VO
6. Within this study, what is the prevalence of malignmt breast lesions?
a. 6°/0b. 36%
e
7.
8.
*
9.
C. 42%d. 73%e. 85%
The sensitivity and specificity of a diagnostic test provide the clinical data to suppoti which ofthe following hierarchical levels used to associate a diagnostic test procedure with a patient’shealth outcome?a. technical performance of the test [reliability]b. diagnostic performance [accuracy]c. diagnostic impact [displaces alternative tests]d. therapeutic impact [influence on treatment plans]e. impact on health [quality of life]
Your screening facility can process 1,000 people per week. Assume you are attempting theearly detection of a disease with a prevalence of 2°/0, and that your test has a sensitivity of 95°/0and a specificity of 90°/0. How many of the people screened in a week will TEST positive?a. 883b. 117c. 98d. 20e. 19
Individuals who are healthy and truly do not have the disease condition under considerationbelong to the group of ind~viduals who are best described as:a.b.c.d.e.
control groupintervention grouptrue negative groupnormal groupreference group
10. As a Dart of a routine physical examination, uric acid was measured for a 35-year-old male andfoun~ to be 7.8 mg/dl~ ~he “normal range” for uric acid for that laboratory is 3.4 to 7.5 mg/dl.If this individual does not display symptoms or signs of gout, a possible explanation is:a. he is among the small proportion of healthy individuals who yield high serum uric acid
readings on a given test.b. his level is within 2 standard deviations of the mean for healthy individuals.c. his test results represent a false negative.d. the departure of his level from the normal range is statistically significant.e. this individual is a good candidate for early treatment.
11.
12.
13
A pulmonary angiogram is a highly sensitive test (considered the gold standard) for pulmonary
embolus. For a patient who has several general symptoms (shortness of breath, vague chest
pain) consistent with pulmonary embolus, a negative test result:a. implies that the disease is less prevalent in this patient’s population.b. indicates that the patient has only a mild embolus.c. will require the patient’s close blood relatives to be tested.d. will rule in the disease.e. will rule out the disease.
A 35 year-old female complains of a mild burning pain orI urination and some lower abdominalpain. She has had, at separate times in the past, both urinary tract infections (UTI) and vaginalyeast infections. You estimate her current probability of having a UTI to be 65%. Asubsequent antibody-coated bacteria assay is positive for UTI. A positive test has a 3.6likelihood ratio. What is this patient’s post-test probability of a UTI? Use Figure 4 “Nomogramfor Interpreting Diagnostic Test Results” within the lesson text, determine the post-testprobability.a. about 5°/0b. about 40%c. about 65°/0d. about 85%e. 1000/0
Title: Using gadoliniurn-enhanced three-dimensional MR angiography to assess arterial inflowstenosis after kidney transplantationAuthor(s): Ferreiros J; Mendez R; Jorquera M; Gallego J; Et AlSource: AJR, VOI172, iss3,p751-757, yr 1999Article Abstract: Subjects And Methods. Twenty-eight consecutive patients receiving kidneytransplants with suspected arterial inflow stenosis were examined with two MR angiographysequences: gadolinium-enhanced 3D fast spoiled gradient-recalled (SPGR) imaging and 3Dphase-contrast imaging. Twenty-four of these patients then were examined using the goldstandards: either digital subtraction angiography (DSA) (n= 23) or surgery (n= 1). MRangiography and DSA studies were independently and prospectively analyzed for the presenceof arterial stenoses (mild [<500/0], severe [50-900/0], or critical [>90°/0]) in the iliac, anastomotic,and renal artery segments. Also two independent observers retrospectively evaluated the MRangiography sequences for ability to detect or exclude significant (> or = 50°/0) arterial stenoses.
In this study it is important to evaluate the concordance between observers. If the data arecontinuous, the correlation coefficient can be used for concordance and if categorical, the kappastatistic is used. Which measure of concordance is appropriate for the above data?a. correlation coefficientb. kappa statistic
14. In the above study, arterial stenoses was described as mild [<50%], severe [50-90%] or critical
15,
16.
17.
18.
[>90%]. To which Of the fo]lowi~g ~easurement scales does this description belong?
a. nominalb. ordinalc. intervald. ratio
Also in the above study, MR angiography was compared to the gold standard of either digitalsubtraction angiography (DSA) or surgery. The methods section of this article reports, “Twoangiographers who were unaware of the MR angiography findings analyzed the DSA imagesusing the same protocol as the MR angiography.” The investigators were trying to controlwhich kind of bias with this method?a.
b.
c.
d.
e.
incorporation biasdiagnostic review biastest review biasselection biasstatistical regression bias
As part of the quality control procedures for a diagnostic laboratory, great care is usuallyinvested to ensure that those individuals who calibrate the equipment, execute the test andrecord the data all follow the same procedures for each step of the diagnostic test. Thelaboratory is seeking to avoid which one of the following factors that can jeopardize the validityof the test?a. historyb. maturationc. testingd. instrumentatione. statistical regression
Which of the following statements about bias is FALSE?a. good laboratory procedures can eliminate some biasb. bias is systematic errorc. the presence of bias decreases the internal validity of a diagnostic test studyd. the presence of bias decreases the external validity of a diagnostic test studye. bias is random error
A study, that compares one diagnostic test to a second diagnostic test that is thought to be thegold standard for diagnosis of the disease under consideration, is seeking to establish which ofthe following kinds of validity for the first test?a.b.c.
content validitycriterion-related validityconstruct validity
19. The technical performance of a new diagnostic testis established by the test’s:a. incremental costb. complexity of executionc. reliabilityd. content validitye. manufacturer
20. In a trial investigating risk factors for breast cancer, women received yearly mammograms.The trial was multicentered and over the years, one center had reported significantly fewerpositive mammograms. An investigation pointed to a lack of experience and training on thepafi of those investigators reading mammograms at that site. This problem is one ofa. selection biasb. fuzzy trial hypothesisc. generalizabilityd. validitye. reliability
21. To achieve the status of being the gold standard for diagnosis of a given disease conditions, adiagnostic test must fit which of the following?a. be generally accepted as the best available diagnostic testb. accurately diagnose the disease status of every patientc. be capable of being executed (used) in both ambulatory and inpatient settings“d. have the best ROC curvee. be the least invasive diagnostic test
22. In order to achieve better control in a diagnostic test study investigators may choose disease-free and diseased subjects who do not have comorbidities that overlap the target disease.Studies with a narrow spectrum of subjects may not accurately measure the sensitivity andspecificity of the diagnostic tests. Which of the following is true?a. sensitivity and specificity will be essentially unaffected because sensitivity is increased and
specificity is decreasedb. test will be sensitive, but will lose specificityc. test will be specific, but will lose sensitivityd. sensitivity and specificity will be falsely decreasede. sensitivity and specificity will be falsely increased
23. In practice, the presence or absence of disease in an individual patient is generally accepted ifthe diagnosis was established using any of the following methods, EXCEPT:a. the test with the smallest false negative fractionb. definitive histopathologic diagnosisc. standard diagnostic classification system

III
I
e
REMINDER:IMPORTANT TEST INFORMATION
Please note that this article (Volume 8,Lessons 2 and 3) has been awarded 5.0contact hours or .50 CEUS. As such, youmust complete all 50 questions in order toreceive credit for lessons 2 and 3. No partialcredit can be awarded for this articIe.
Please be sure to complete ~ separate answerssheets for this lesson. Please fill in theanswers for questions 1-25 on the first answersheet, indicating that it is Volume 8, Lesson 2.Fill in the answers for questions 26-50 on thesecond answer sheet, indicating that it isVolume 8, Lesson 3.
Incomplete or incorrectly completed answersheets cannot be graded and will be returnedto you*
Thank you for your attention to thisimportant matter.
d. well-established diagnostic testse. patient follow-up
24. Blood glucose values are on a continuous scale and by changing the cut point for being positiveor negative for diabetes, one can change the sensitivity and specificity of the test. If sensitivityand specificity for several cut points on the scale were calculated, then a receiver-operating-characteristic (ROC) curve could be drawn. Which one of the following is FALSEa.
b.c.
d.
e.
the ROC curve could be used to choose the best cutoff point to define an abnormal bloodglucose level depending upon emphasis placed on health costs, financial costs orinformation content of the testan ROC curve strategy would work particularly well for a binary response diagnostic testto construct a ROC curve sensitivity (TPR) and 1-specificity ( FNR) constitute the verticaland horizontal axis of the ROC graph respectivelya diagonal line from 0,0 to 1,1 represents indices that do not discriminate between truepositive results and false positive results.a lax threshold for a positive diagnosis can be described as highly sensitive, but having poorspecificity
25. Title: The diagnostic accuracy of bedside and laboratory coagulation, procedures used tomonitor the anticoagulation status of patients treated with heparinArticle Abstract: We evaluated the diagnostic accuracy of three bedside coagulationprocedures, the Hemochron, activated whole-blood clotting time (ACT), the CoaguChek Plus,activated partial thromboplastin time (APTT) and the TAS, APTT, in patients who receivedheparin therapy. As part of the patients’ care, pharmacists performed bedside coagulation tests.Blood from heparinized patients was analyzed with each of the three tests and a gold standardlaboratory test. Receiver operator characteristic (ROC) curves were plotted for each test.Analysis of the ROC curve was used to rank the performance of the methods. Areas under theROC curves +/- SE for the CoaguChek Plus APTT, Hemochron ACT, and TAS APTT were0.872 +/- 0.044,0.797 +/- 0.039, and 0.795 +/- 0.048, respectively.
The laboratory test that demonstrated the highest diagnostic accuracy (maximizes the truepositives and minimizes the false positives) for predicting who is and who is not anticoagulatedby heparin is which of these three tests?a. CoaguCheck Plusb. Hernochronc. TASd. They are all equivalently accurate.e. None of the three have AUC’S less than .45, thus none of them have diagnostic
discrimination.
26. The following graph, ROC curve of lymph node standardized uptake values (SUVS), is takenfrom Vansteenkiste et al. (reference 45). The lesson discussed data from this paper in sections
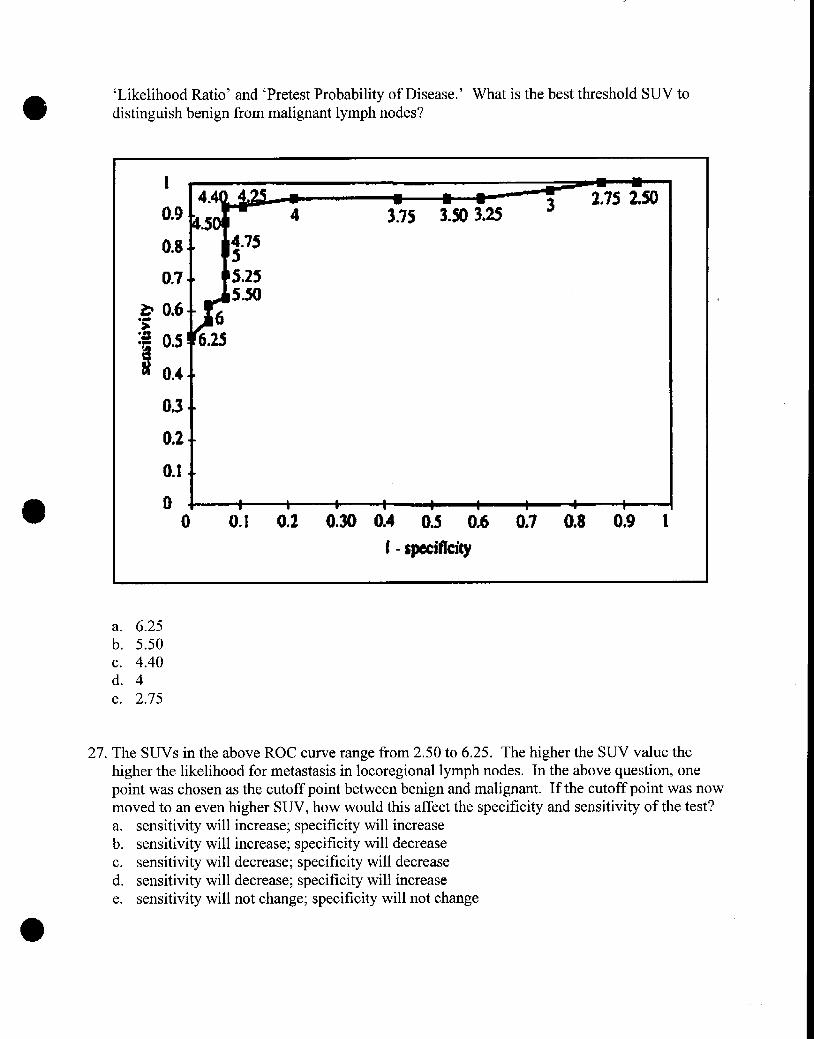
o ‘Likelihood Ratio’ and ‘Pretest Probability of Disease.’ What is the best threshold SUV todistinguish benign from malignant lymph nodes?
14.4
0.9 ~&b5
0.8. ●
0.7-m
.s
03. ●
O*2-.
0.1.~
o a*V m m w I w 1— 7 I
0 0.1 0,2 0.30 0.4 0.5 0,6 0.7 0.8 O*9 1
1- sp#ificity
k
a. 6.25b. 5.50c. 4.40d. 4e. 2.75
27. The SUVS in the above ROC cuwe range from 2.50 to 6.25. The higher the SUV value thehigher the likelihood for metastasis in locoregional lymph nodes. In the above question, onepoint was chosen as the cutoff point between benign and malignant. If the cuto~f point was nowmoved to an even higher SUV, how would this affect the specificity and sensitivity of the test?a. sensitivity will increase; specificity will increaseb. sensitivity will increase; specificity will decreasec. sensitivity will decrease; specificity will decreased. sensitivity will decrease; specificity will increasee. sensitivity will not change; specificity will not change

28.
29.
30.
31.
32.
The ability of a diagnostic test study to accurately determine the sensitivity and specificity ofthe diagnostic test is dependent upon how many individuals participate in the study (samplesize). The equation to calculate sample size contains each of the following elements EXCEPT:a. alpha level (Type I error)b. beta level (Type 11error)c. number of investigatorsd. variability of eventse. delta (clinically meaningful values for sensitivity and specificity
Power is a statistical term used to define the probability of detecting a meaningful differencebetween two treatments when there is one. “Meaningful difference” is determined by:
a.b.c.d.e.
p values of~ 0.05values falling outside 2 standard deviations from the meanthe investigator’s judgementstandards established in the clinical guidelines for each disease conditionType 11error rate.
Investigators faced with inadequate subject accrual into a clinical trial may decide to continuethe study with a smaller sample size. The consequence of this action on the study’s validity isto:a. alter the subjects’ maturation characteristicsb. increase costc. decrease the study’s powerd. jeopardize voluntary consente. unbalance baseline characteristics.
The disease prevalence within the diagnostic study’s subjects that will achieve the greateststatistical power for the study is:a. 25°/0b. 50%c. 75%d. 96%e. 100V0
Subiects within a diagnostic test study that should receive the gold st~dard diagnostic test–3--.– .
include:a. all subjectsb. 50V0of the male and 50V0of the female subjectsc. subjects whose test results fall into the true positive range of valuesd. all subjects who finish the studye. subjects whose test results are equivocal
33. Within your clinic you have data indicating that you generally see about 9 new patients eachyear among the patients you monitor who have developed the target condition of interest due toan injury. This target disease has a duration of about three (3) years. Within your clinic what isthe prevalence of this target disease?a. 3 casesb. 9 casesc. 12 casesd. 27 casese. 81 cases
34. Whether or not sensitivity and specificity are independent of disease prevalence has beencontroversial. However, for diagnostic situations that are strongly dichotomous, sensitivity andspecificity are considered independent of prevalence. Which of the following conditionsprovides dichotomous test results?a. asthmab. coronary artery diseasec. hypertensiond. Parkinson’s diseasee. pregnancy
o35. Within this lesson data from Kwok, et al (reference 53) was used to illustrate the use of
likelihood ratios. Kwok et al found that echo testing provided the best sensitivity andspecificity for women with suspected coronary artery disease (CAD). For echo, the likelihoodratio for a positive test was 4.29 and 0.18 for a negative test result. For a women with definiteangina, the pretest probability of CAD was found to be 710/O.Using Figwe 4 “Nomogram forInterpreting Diagnostic Test Results” within the lesson text, determine the post-test probabilityof CAD for a woman with a pretest probability of 7 10/0who has a positive echo result.a. about 30°/0b. about 50%c. about 60°/0d. about 90%e. about 97°/0
I
@
\
36. Using the same Kwok et al data in the above question, determine the post-test probability ofCAD for a woman with a pretest probability of 71 % who has a negative echo result.a. about 10°/0b. about 20%c. about 30°/0d. about 50%e. about 70°/0
37.
38.
39.
40,
41
Diagnostic tests frequently not only diagnose the presence or absence of disease, but alsomeasure an endogenous substance in the patient’s body. Diagnostic tests that have relativelypoor analytic specificity will also have:a. poor diagnostic specificityb. good diagnostic specificityc. usage only in analytical applicationsd. poor diagnostic sensitivitye. usage in diagnostic applications
Diagnostic review bias tends to produce falsely high sensitivity and specificity values. Thedesign method used to avoid this bias is:
:.
c.d.
e.
randomly select study subjectsrandomly allocate study subjects to new the new test and the gold standard testblind the individual who interprets the results of the new test and the gold standard testuse confidence intervalscalculate the study’s power
Instead of, and sometimes in addition to, the standard analysis of a new diagnostic test’ssensitivity and specificity compared to a gold standard test, investigators may determinewhether or not there is a relationship between the two tests. The statistical analysis appropriateto determine the relationship md quantitate it is:
:.
c.d.e.
t testchi squareodds ratioregression analysiscorrelation analysis
Mets-analysis is a useful technique to combine the results of different studies that investigatedthe same diagnostic test procedure. Which of the following statements does NOT describe asituation where meta-analysis could be used?a. study data m’ein disagreement as to the magnitude of the accuracy indicesb. studies all used the same independent variables, i.e., the diagnostic test procedurec. sample sizes in individual studies are too small to reliably detect diagnostic accuracyd. large (sample size) trials are not feasiblee. only data from case series reports are available
Clin Nucl Meal, vol 20, iss 9, p 821-829, yr 1995 “Tc-99m sestamibi demonstrates considerablerenal uptake followed by net urina~ clearance similar to that of creatinine. The authors havepreviously shown that renograms could be obtained in cardiac patients by imaging during therest injection of the perfusion agent. The present study shows correlating Tc-99m sestamibi andTc-99m DTPA studies in hypertensive patients with a spectram of findings, including aortic
@
aneurysms, asymmetry due to renovascular disease, cysts, bilateral renal dysfunction, andhorseshoe kidney.”
Which of the following statements is TRUE?a. spectrum bias can be decreased by using hypertensive patients with a spectrum of renal
disordersb spectrum bias decreases the study’s internal validityc. excluding patients with comorbidities will control spectrum biasd. studies with a narrow spectrum of subjects tend to underestimate the test’s accuracye. spectrum bias has only been shown to operate on sex and race demographic variables.
42. The predictive value of a positive lung imaging diagnostic test will vary depending uponwhether or not the patient comes from the general ambulatory care population or from a tertiarycare veterans institution population.a. this statement is trueb. this statement is false
43. The predictive value of a negative diagnostic testis highest when:a. the patient has no other diseasesb. there is no accepted gold standard for the disease
o
c. the disease prevalence is very lowd. the testis performed at a large medical centere. the test agrees with the physician’s opinion
44. If a patient is suspected of having the disease in question, to confirm the diagnosis one wouldchallenge the patient with a diagnostic test that:a. has a low negative likelihood ratiob. has a low positive likelihood ratioc. has a high sensitivityd. has a high positive likelihood ratioe. has a high cost
I
I
I
10
45. Which of the following statements about likelihood ratios is FALSE?a. the size of the likelihood ratio is not importantb. the values are considered to be stable across various disease prevalencec. they can be calculated for every value of a diagnostic testd. they can be used to calculate a post-test probability, taking advantage of pretest datae. they can be used to compare which of two tests does a better job of ruling-in or ruling-out a
disease
46. Radiology, vol 202, iss 3, p 793-797, yr 1997 Purpose: To evaluate single photon emissioncomputed tomographic (SPECT) imaging of regional cerebral blood flow in the diagnosis ofAlzheimer disease (AD) and the differential diagnosis of the dementias. Results: SPECTdiagnoses were true-positive in 37, true-negative in eight, false-positive in three, and false-negative in six patients. Sensitivity was 86% (37 of 43; 95V0confidence limits= .72, .95);specificity, 73°A (eight of 11; confidence limits = .39, .94); positive predictive value, 92°A (37of 40; confidence limits = .80, ,98); and negative predictive value, 57°/0 (eight of 14; confidencelimits = .29, .82).
Considering the results of the evaluation of SPECT diagnosis, the index that would offer themost value to an individual patient would be:a. sensitivityb. specificityc. positive predictive valued. negative predictive valuee. overall accuracy
47. Indeterminate test results are problematical for investigators. Which of the followingprocedures is NOT a recommended solution?
:.
c.d.
e.
report the results as indeterminaterepeat the test if results are a rmdom eventfollow patient till the patient’s disease status is knownreport the results as indeterminate and then report the results with indeterminate resultscounted as positive and then counted as negativerandomly assign either positive or negative statas to each indeterminate result for the finalanalysis
48. The best source of data to use for the pretest probability of a disease is:a. textbooksb. published current literaturec. the World Wide Webd. tertiary care center datae. local community data
49. Exclusionary tests are used to rule out the target disease in a patient who has some suspicion ofdisease. An exclusionary test should have:a. high sensitivityb. high specificityc. low sensitivityd. low specificitye. moderate accuracy

I
@
50. The primary function of a diagnostic test is:
a. generate a positive cash flOWfor the departmentb. corroborate the opinion of the physicianc. satisfy the patientd. reduce uncertaintye. establish a patient database

o

o
0

o
9
●


![[Chordoma: diagnostic considerations and review of the literature]](https://static.fdokumen.com/doc/165x107/6334e3f93e69168eaf071817/chordoma-diagnostic-considerations-and-review-of-the-literature.jpg)