Evaluating the effects of forest management on rockfall protection and timber production at slope...
13
RESEARCH ARTICLE Evaluating the effects of forest management on rockfall protection and timber production at slope scale Werner Rammer a* , Michael Brauner b , Herwig Ruprecht a and Manfred Josef Lexer a a Department of Forest and Soil Sciences, Institute of Silviculture, University of Natural Resources and Life Sciences, Peter Jordanstraße 82, 1190 Vienna, Austria; b Department of Civil Engineering and Natural Hazards, Institute of Mountain Risk Engineering, University of Natural Resources and Applied Life Sciences, Peter Jordanstraße 82, 1190 Vienna, Austria (Received 4 July 2014; accepted 25 April 2015) We used the coupled forest and rockfall model PICUS Rock’n’Roll, linking a hybrid forest patch model and a 3D rockfall model, to assess the effects of four management scenarios (BAU: business as usual age class shelterwood approach; PFM1 and PFM2: rockfall protection management scenarios with slit-shaped gaps; NOM: no management scenario without any active silvicultural intervention) on rockfall protection and timber production on a 38 ha slope over 100 years. Compared to PFM1 and PFM2, we found slightly more harvested timber for the BAU scenario (BAU: 6.7 m³ha −1 yr −1 , PFM: 5.7–5.9 m³ha −1 yr −1 ), but lower contribution margins (BAU: 55 €ha −1 yr −1 , PFM: 113– 115 €ha −1 yr −1 ). Overall, depending on rock size and forest state, 30–70% of the simulated rocks that would otherwise hit the road at the foot of the slope were stopped by the forest. While the PFM scenarios maintained a high rockfall protection level over 100 years (PE between 45–64%) the BAU showed periods of reduced protection (PE between 26– 65%). The NOM scenario maintained favorable conditions in the beginning, but declining protection efficiency in the last decades of the century (PE 49–63%). We conclude that rockfall protection management can outperform BAU with regard to both timber production and rockfall protection. Keywords: rockfall; mountain forests; simulation modeling; PICUS Introduction In the Alps, many forests play an important role in protecting infrastructure like roads or buildings against rockfall. Major factors influencing the protective effect are tree density and size structure of the tree population, tree species composition, but also how these attributes vary along a slope (Dorren et al. 2005). Since forest structure evolves dynamically and is strongly influenced by forest management, the knowledge about long-term effects of management decisions on rockfall protection is highly relevant. The importance is amplified by high management costs in mountain forests due to difficult terrain conditions and by competing goals in multi- functional mountain forest management (e.g. timber production vs rockfall protection). Available indicator-based schemes for rockfall pro- tection management define forest states that are desirable with regard to the protective effect. Typical indicators are gap size, tree density, and mean tree dimensions (Ott et al. 1997; Frehner et al. 2005). They, however, are implicitly static and focus exclusively on the protective function, neglecting other ecosystem service demands. In addition, such schemes apply at stand level and include the spatial dimension with regard to scale and resolution only implicitly, e.g. by considering maximum gap sizes. The relevant spatial scale for rockfall processes and related protective effect of forest vegetation, however, typically reaches beyond the stand level. Therefore, a tool for projecting mid- to long-term rockfall protection efficiency (PE) in unmanaged and managed forests needs to extend the analysis by incorporating future stand development and by considering both spatial resolution (i.e. addressing rockfall processes at the level of individual trees) and scale explicitly (i.e. expanding the spatial scale from stand to slope level). Simulation modeling has been used extensively for projecting forest development (Pretzsch et al. 2008) and also for the assessment of rockfall processes (Volkwein et al. 2011). Forest models addressing the slope scale are rare: typical stand level forest simulation models are often unable to simulate multiple hectares explicitly, while models aiming at larger scales usually lack the required resolu- tion for dealing with structurally diverse mountain forests. Moreover, only few models are able to cope with mountain forest management practices like spatially explicit gap creation along cable yarding tracks and similar small scale harvesting interventions (Maroschek et al. 2014). *Corresponding author. Email: [email protected] Scandinavian Journal of Forest Research, 2015 http://dx.doi.org/10.1080/02827581.2015.1046911 © 2015 Taylor & Francis Downloaded by [UB Bodenkultur Wien] at 01:36 03 August 2015
Transcript of Evaluating the effects of forest management on rockfall protection and timber production at slope...
RESEARCH ARTICLE
Evaluating the effects of forest management on rockfall protection and timber productionat slope scale
Werner Rammera*, Michael Braunerb, Herwig Ruprechta and Manfred Josef Lexera
aDepartment of Forest and Soil Sciences, Institute of Silviculture, University of Natural Resources and Life Sciences, PeterJordanstraße 82, 1190 Vienna, Austria; bDepartment of Civil Engineering and Natural Hazards, Institute of Mountain RiskEngineering, University of Natural Resources and Applied Life Sciences, Peter Jordanstraße 82, 1190 Vienna, Austria
(Received 4 July 2014; accepted 25 April 2015)
We used the coupled forest and rockfall model PICUS Rock’n’Roll, linking a hybrid forest patch model and a 3Drockfall model, to assess the effects of four management scenarios (BAU: business as usual age class shelterwoodapproach; PFM1 and PFM2: rockfall protection management scenarios with slit-shaped gaps; NOM: no managementscenario without any active silvicultural intervention) on rockfall protection and timber production on a 38 ha slope over100 years. Compared to PFM1 and PFM2, we found slightly more harvested timber for the BAU scenario (BAU:6.7 m³ha−1yr−1, PFM: 5.7–5.9 m³ha−1yr−1), but lower contribution margins (BAU: 55 €ha−1yr−1, PFM: 113–115 €ha−1yr−1). Overall, depending on rock size and forest state, 30–70% of the simulated rocks that would otherwisehit the road at the foot of the slope were stopped by the forest. While the PFM scenarios maintained a high rockfallprotection level over 100 years (PE between 45–64%) the BAU showed periods of reduced protection (PE between 26–65%). The NOM scenario maintained favorable conditions in the beginning, but declining protection efficiency in thelast decades of the century (PE 49–63%). We conclude that rockfall protection management can outperform BAU withregard to both timber production and rockfall protection.
Keywords: rockfall; mountain forests; simulation modeling; PICUS
Introduction
In the Alps, many forests play an important role inprotecting infrastructure like roads or buildings againstrockfall. Major factors influencing the protective effectare tree density and size structure of the tree population,tree species composition, but also how these attributesvary along a slope (Dorren et al. 2005). Since foreststructure evolves dynamically and is strongly influencedby forest management, the knowledge about long-termeffects of management decisions on rockfall protection ishighly relevant. The importance is amplified by highmanagement costs in mountain forests due to difficultterrain conditions and by competing goals in multi-functional mountain forest management (e.g. timberproduction vs rockfall protection).
Available indicator-based schemes for rockfall pro-tection management define forest states that are desirablewith regard to the protective effect. Typical indicators aregap size, tree density, and mean tree dimensions (Ottet al. 1997; Frehner et al. 2005). They, however, areimplicitly static and focus exclusively on the protectivefunction, neglecting other ecosystem service demands. Inaddition, such schemes apply at stand level and includethe spatial dimension with regard to scale and resolution
only implicitly, e.g. by considering maximum gap sizes.The relevant spatial scale for rockfall processes andrelated protective effect of forest vegetation, however,typically reaches beyond the stand level. Therefore, atool for projecting mid- to long-term rockfall protectionefficiency (PE) in unmanaged and managed forestsneeds to extend the analysis by incorporating futurestand development and by considering both spatialresolution (i.e. addressing rockfall processes at the levelof individual trees) and scale explicitly (i.e. expandingthe spatial scale from stand to slope level). Simulationmodeling has been used extensively for projecting forestdevelopment (Pretzsch et al. 2008) and also for theassessment of rockfall processes (Volkwein et al. 2011).Forest models addressing the slope scale are rare: typicalstand level forest simulation models are often unable tosimulate multiple hectares explicitly, while modelsaiming at larger scales usually lack the required resolu-tion for dealing with structurally diverse mountainforests. Moreover, only few models are able to copewith mountain forest management practices like spatiallyexplicit gap creation along cable yarding tracks andsimilar small scale harvesting interventions (Maroscheket al. 2014).
*Corresponding author. Email: [email protected]
Scandinavian Journal of Forest Research, 2015http://dx.doi.org/10.1080/02827581.2015.1046911
© 2015 Taylor & Francis
Dow
nloa
ded
by [
UB
Bod
enku
ltur
Wie
n] a
t 01:
36 0
3 A
ugus
t 201
5

Various tools for assessing rockfall processes, on theother hand, are available, reaching from landscape leveltools to models that simulate detailed trajectories ofsingle rocks (see Volkwein et al. 2011). Recent devel-opments increasingly focus on three-dimensional (3D)models allowing for the simulation of single rocktrajectories on a high-resolution 3D slope (Agliardi &Crosta 2003; Dorren et al. 2006; Rammer et al. 2010).
Acknowledging the importance of forests for rockfallprotection (Dorren et al. 2005), several attempts weremade to combine forest and rockfall simulation. Some ofthe studies concentrated on applying trajectory models toeither current forest states as reported by stand invent-ories or yield table based extrapolations (Stoffel et al.2006; Wehrli et al. 2006; Bigot et al. 2009). Othersfocused on projecting future forest development andassessed rockfall protection with simplified indicator-based approaches (Wehrli et al. 2006; Cordonnieret al. 2008).
A step toward a full dynamic integration of forestand rockfall modeling is the coupling of the process-oriented forest patch model PICUS (Lexer & Hönninger2001) with the spatially explicit 3D rockfall simulationmodel Rock’n’Roll (Woltjer et al. 2008). Rammer et al.(2010) performed a thorough validation of the rockfallmodule using data from real-size rockfall experimentsand empirical rockfall trajectories across the Alps. Theyconclude that combining the rockfall module with thewell-tested forest model (e.g. Seidl et al. 2005, 2010)provides a well-suited tool for assessing the long-termimplications of forest management on rockfall protectionand the interdependencies with other ecosystem services.Highly efficient silvicultural systems for timber produc-tion often feature shelterwood approaches and stripwiseclearcuts, which may compromise the protective effect.Finding a suitable balance with regard to grain andextent of cutting pattern has attracted substantial interestby forest managers. Another frequent approach inmountain forest management is refraining from activemanagement at all, either due to low productivity or lackof road infrastructure, accepting the potential negativelong-term effects on rockfall protection (Woltjeret al. 2008).
In this paper, the integrated model PICUS Rock’n’-Roll (hereafter called in short PICUS) is applied toanalyze effects of different silvicultural systems onrockfall protection and timber production for a casestudy slope in the Austrian Alps. The slope covers about40 hectares and is characterized by small scale owner-ship structure. Specific objectives of the study are (1) toquantify the effects of different silvicultural strategies onmanagement objectives and (2) to assess the trade-offrelationship between rockfall protection and timberproduction at slope scale.
Materials and methods
Simulation models
The forest model Picus 1.41
The forest model used in this study is the hybrid forestpatch model PICUS v1.41 (Seidl et al. 2005), whichincorporates elements of a classical patch model (PICUSv1.2, Lexer & Hönninger 2001) as well as a stand levelproduction model based on physiological principles(3-PG, Landsberg & Waring 1997). A detailed descrip-tion of the model is provided in Seidl et al. (2005). Here,just a brief overview on the core model concept is given.
PICUS simulates individual trees on a regular grid of10 × 10 m² patches. The leaf biomass of trees is arrangedin crown cells with a vertical resolution of 5 m. A 3Dlight model, allowing for the explicit consideration ofdirect and diffuse radiation within the canopy, is used tomodel inter and intra tree species competition. Standlevel productivity is estimated by means of a simplifiedmodel of radiation interception and light use efficiency(Landsberg & Waring 1997), which depends on temper-ature, precipitation, radiation, vapor pressure deficit, soilwater, and nutrient supply. Redistribution of assimilatesto individual trees, assuming fixed respiration rates(Landsberg & Waring 1997), is accomplished accordingto the relative competitive success of the individualswithin the patch model environment (see Lexer &Hönninger 2001). The tree regeneration layer dynamicsare modeled within five height classes (Woltjer et al.2008). PICUS contains a flexible management modulebased on a scripting language allowing for spatiallyexplicit harvesting interventions as well as plantingoperations at the level of the 100 m2 patches. The basictime-step of the simulation is monthly with annualintegration of the tree population dynamics processes.The model requires information about the soil waterstorage capacity, the pH value of the mineral soil as wellas plant-available nitrogen as a proxy for nutrient supplyand is driven by monthly values of temperature, precip-itation, solar radiation, and vapor pressure deficit of theatmosphere. PICUS is initialized with stand level treelists or aggregated species-specific DBH distributionswhere trees are drawn from the distribution and assignedto the simulated patches. When PICUS is run incombination with the rockfall module, trees are addi-tionally assigned specific coordinates within their patchusing minimum distances between neighboring trees.
PICUS has been tested extensively (Seidl et al. 2005).Recent applications of the model to study mountain forestmanagement include Seidl et al. (2011a, 2011b), Lexerand Seidl (2009), and Maroschek et al. (2014).
The rockfall model Rock’n’RollPICUS Rock’n’Roll is a rockfall model that simulatesindividual spatially explicit rockfall trajectories on a3D slope (Rammer et al. 2010; Woltjer et al. 2008).
2 W. Rammer et al.
Dow
nloa
ded
by [
UB
Bod
enku
ltur
Wie
n] a
t 01:
36 0
3 A
ugus
t 201
5
The trajectory of a spherical rock with variable sizeconsists of a series of rolling and/or jumping motions.The model uses a lumped mass approach for simulatingfree fall and ground impacts and a rigid body approachfor the simulation of rolling motions and tree impacts.Kinetic energy of a falling rock is dissipated by (1) rollingfriction for rolling motions, (2) ground impacts forjumping motions, and (3) tree impacts during rollingand jumping motions. In a simulation rock trajectoriesstart with a predefined initial velocity either frompredefined or from randomly selected positions withinthe simulated area. A rock stops, when its kinetic energyfalls to zero.
The slope surface is characterized by coefficients ofrestitution for jumping mode (i.e. rebound parameters)and by rolling friction coefficients for rolling mode.Coefficients of restitution describe the ratio of thenormal (or tangential) velocity component of the centerof mass before and after an impact (e.g. Kharaz et al.2001). Parameter values for various surface types havebeen retrieved from the literature (Azzoni et al. 1995;Schweigl et al. 2003; Heidenreich 2004).
Within PICUS Rock’n’Roll, trees are specified bylocation, species, diameter at breast height, and treeheight and act as spatially explicit obstacles for rocks.The tree hit algorithm closely follows the modeldescribed by Dorren et al. (2005) and Dorren and Berger
(2006). If a tree is hit by a rock, kinetic energy isdissipated up to a maximum dissipation potential, whichdepends on tree species and diameter. If the total kineticenergy of the rock is consumed by the impact, the rockstops. Otherwise the direction of the rock may bedeviated and the rock trajectory is continued. Tree leveloutput of individually simulated forest stands (i.e. treeposition, species, and dimensions) is used to populate thestand polygons on the slope that is then subsequentlyused in the assessment of rockfall protection.
The rockfall model was evaluated successfully withdata from real-world rockfall experiments in France andwith two ex-post 2D trajectories from single rockfallevents in Switzerland and Austria (Rammer et al. 2010).The model was able to predict key rockfall character-istics like run out distances and rock velocities well,being parameterized with standard values for coefficientsof restitution from the literature.
Study area
The study area is located in the valley of the Ziller, atributary to the river Inn in the province of Tyrol inAustria (lon: 47.16°/ lat: 11.16°). The forest used fordemonstration in this study has an area of 38 ha and islocated on a south-facing slope, which extends from
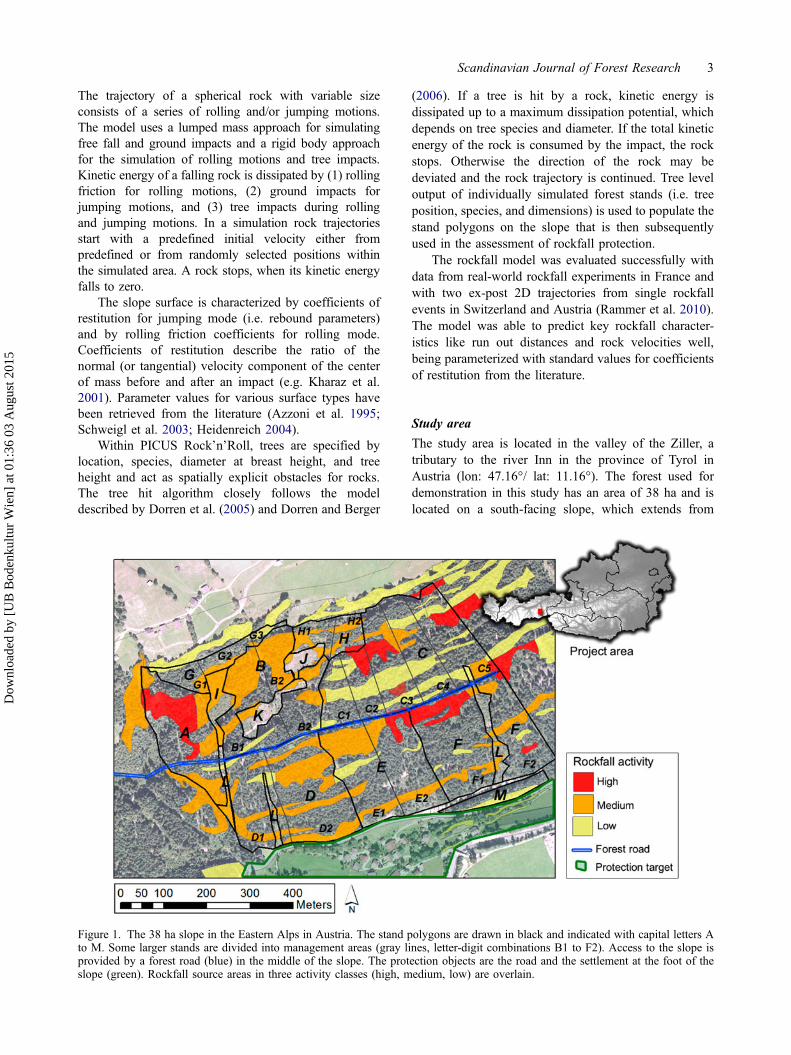
Figure 1. The 38 ha slope in the Eastern Alps in Austria. The stand polygons are drawn in black and indicated with capital letters Ato M. Some larger stands are divided into management areas (gray lines, letter-digit combinations B1 to F2). Access to the slope isprovided by a forest road (blue) in the middle of the slope. The protection objects are the road and the settlement at the foot of theslope (green). Rockfall source areas in three activity classes (high, medium, low) are overlain.
Scandinavian Journal of Forest Research 3
Dow
nloa
ded
by [
UB
Bod
enku
ltur
Wie
n] a
t 01:
36 0
3 A
ugus
t 201
5
650 m to 1100 m a.s.l and has length of approximately500 m (projected) (Figure 1).
The bedrock layers consist mainly of schist and showtypical inclinations between 35° and 40°. Large parts ofthe slope are covered by scree and bigger blocks. Severalsteep and heavily weathered cliffs cut horizontallythrough the slope serving as the primary sources ofrockfall. Access to the forest area is provided by a roadat midslope position and another road at the foot of theslope. Due to the steep and rocky terrain, timberextraction relies on skyline-based cable yarding systems.
The natural vegetation type is Norway spruce (Piceaabies (L.) H Karst.) with Larch (Larix decidua MILL)and some admixed Silver fir (Abies alba MILL). Thecurrent forest vegetation consists of mainly maturetimber stands dominated by spruce (98.68% of thestanding volume) with small shares of Silver fir(0.95%), Larch (0.27%), and other species (0.01%).
The forest under study is managed by an agriculturalcommunity and considered by the owners as a source fortimber and income generation. The rockfall activityalong the slope sets the regional road and a settlementsituated below the forest at the valley bottom at risk(Figure 1). Thus, priority of public interest is on theprotective effect of the forest.
Climate data
For the simulation of forest development, a 100-yeartime series of monthly mean temperature, precipitation,global radiation, and vapor pressure deficit was con-structed from a de-trended observed weather record from1961–2003, which had been interpolated to the studyarea from nearby weather stations. Within the study areaan altitudinal temperature gradient of −0.6°C/100 m wasassumed in preparing adjusted climate data-sets for eachforest stand. The mean annual temperature at 900 m is6.6°C with moderately cold winters (−3°C average
temperature for January) and the mean annual precipita-tion is 1040 mm.
Forest and soil data
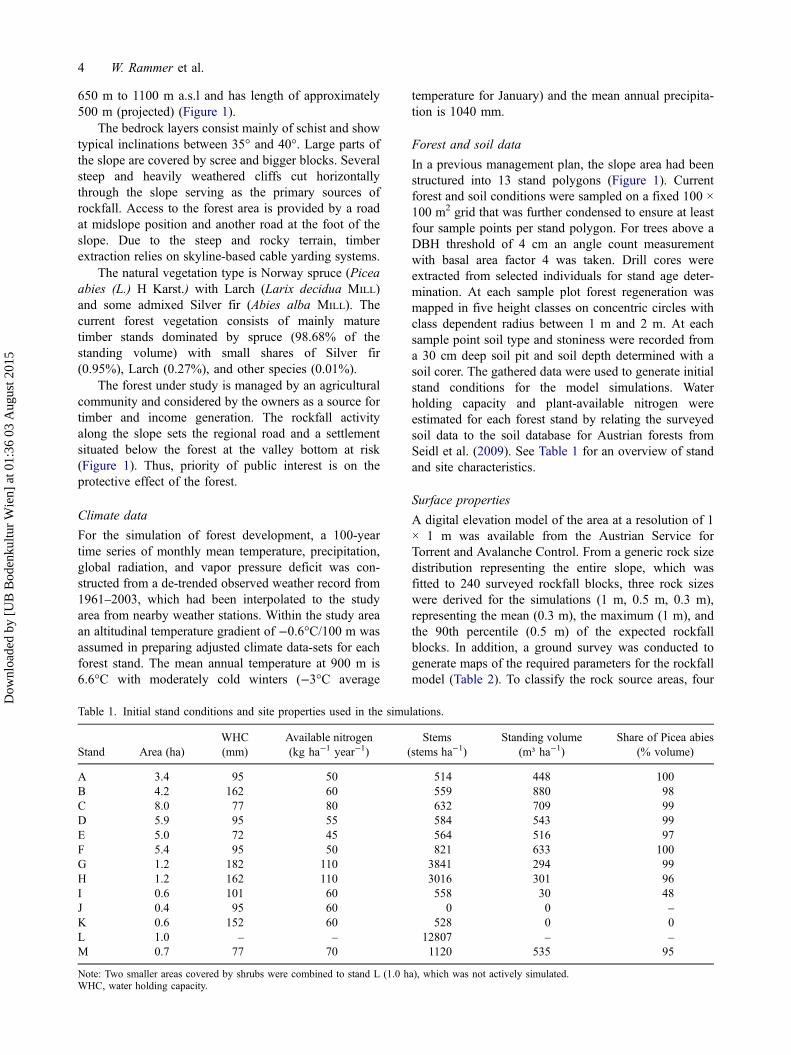
In a previous management plan, the slope area had beenstructured into 13 stand polygons (Figure 1). Currentforest and soil conditions were sampled on a fixed 100 ×100 m2 grid that was further condensed to ensure at leastfour sample points per stand polygon. For trees above aDBH threshold of 4 cm an angle count measurementwith basal area factor 4 was taken. Drill cores wereextracted from selected individuals for stand age deter-mination. At each sample plot forest regeneration wasmapped in five height classes on concentric circles withclass dependent radius between 1 m and 2 m. At eachsample point soil type and stoniness were recorded froma 30 cm deep soil pit and soil depth determined with asoil corer. The gathered data were used to generate initialstand conditions for the model simulations. Waterholding capacity and plant-available nitrogen wereestimated for each forest stand by relating the surveyedsoil data to the soil database for Austrian forests fromSeidl et al. (2009). See Table 1 for an overview of standand site characteristics.
Surface properties
A digital elevation model of the area at a resolution of 1× 1 m was available from the Austrian Service forTorrent and Avalanche Control. From a generic rock sizedistribution representing the entire slope, which wasfitted to 240 surveyed rockfall blocks, three rock sizeswere derived for the simulations (1 m, 0.5 m, 0.3 m),representing the mean (0.3 m), the maximum (1 m), andthe 90th percentile (0.5 m) of the expected rockfallblocks. In addition, a ground survey was conducted togenerate maps of the required parameters for the rockfallmodel (Table 2). To classify the rock source areas, four
Table 1. Initial stand conditions and site properties used in the simulations.
Stand Area (ha)WHC(mm)
Available nitrogen(kg ha−1 year−1)
Stems(stems ha−1)
Standing volume(m³ ha−1)
Share of Picea abies(% volume)
A 3.4 95 50 514 448 100B 4.2 162 60 559 880 98C 8.0 77 80 632 709 99D 5.9 95 55 584 543 99E 5.0 72 45 564 516 97F 5.4 95 50 821 633 100G 1.2 182 110 3841 294 99H 1.2 162 110 3016 301 96I 0.6 101 60 558 30 48J 0.4 95 60 0 0 –K 0.6 152 60 528 0 0L 1.0 – – 12807 – –M 0.7 77 70 1120 535 95
Note: Two smaller areas covered by shrubs were combined to stand L (1.0 ha), which was not actively simulated.WHC, water holding capacity.
4 W. Rammer et al.
Dow
nloa
ded
by [
UB
Bod
enku
ltur
Wie
n] a
t 01:
36 0
3 A
ugus
t 201
5

rock release activity classes were mapped in the field.Likewise, six surface types were used to assign reboundparameters from the literature (Azzoni & de Freitas1995; Azzoni et al. 1995; Chau et al. 2002, see Table 3).The input to infer one of 20 obstacle types consisted ofscree cover percentage and an estimate of the largestblock size. Assuming that this block represented the 90thpercentile of the underlying rock size distribution, thesurface characteristics for each obstacle type weregenerated from the generic rock size distribution andthe cover percentage. The obstacle types are linked to astopping probability algorithm for falling blocks (seeRammer et al. 2010).
Experimental design
Silvicultural alternatives
The focus of the study was to compare current manage-ment with alternative silvicultural concepts. The spatiallyexplicit structure of PICUS allowed a realistic design offine grained mountain forest silviculture (Ott et al. 1997;Dorren et al. 2004). The management scenarios includedthe “business-as-usual” scenario (BAU), two rockfallprotection management regimes (PFM1 and PFM2), anda “no-management” scenario (NOM). Any timber har-vesting operation in the project relied on skyline cableyarding systems operated downslope in the upper partof the slope and upslope in the lower part (compareFigure 1). In rockfall terrain skyline tracks are positioneddiagonally across the slope to prevent rockfall along theskyline track. The skyline corridor in which removals
can take place is defined via the maximum lateralyarding distance that in cut-to-length systems is 25–30 m (Stampfer et al. 2006).
The BAU management resembles a shelterwoodapproach aiming at natural regeneration after a seedingcut and a subsequent removal of the overstorey after20 years. In the pole stage phase two thinnings reducestem numbers and improve stand stability. This approachis applied in zones of 1–3 skyline corridors at a time andrepresents a frequent approach in Austrian mountainforestry with emphasis on efficient timber harvests.
PFM1 is based on Frehner et al. (2005) and Ott et al.(1997) and aims at sustainable protection efficiency andstand stability. Overall silvicultural goal is the trans-formation of current stands to an uneven-aged foreststructure that is initiated by transversal slit cuts of 20–30 m length and 6–10 m width. About three of such slitsper 100 m skyline length are initiated (10–15% of standarea in a corridor) and enlarged either along the contourline or downslope as regeneration in the initial slits hasbeen established. Additionally, individual trees are alsoremoved between the slits, particularly in later phases.Structural thinnings increase vertical stand heterogeneityin young pole stands.
PFM2 follows a similar approach and was derivedfrom a “trial marking” in the field with local foresters.Compared to PFM1, the slits extend across the entireskyline corridor along the contour lines; slit width is 7–10 m. Every 20 years the slits are enlarged in downslopedirection. No trees outside the slits are harvested. Only
Table 2. Attributes used to map areas with homogeneous surface properties and related model input parameter for the simulations.
Surveyed attributes Description Model input parameter
Surface type Solid rock, scree, shallow soils with fine debris, forest soils, pasture, road Rebound parametersRn, Rt
Scree coverpercentage
Percentage of the area covered with scree (0%, 25%, 50%, 75%, and 100%) Stopping probabilities
Block size Block size (height) of the block representing the 90th percentile of depositedblocks
Stopping probabilities
Table 3. Numerical values for coefficients of restitution in normal (Rn) and tangential (Rt) direction as used for different surface types(see Table 2) in the rockfall simulation.
Surface type Rn Rt Description
Solid rock 0.4 0.9 Rock face, outcrops, large individual blocksScree 0.35 0.7 Area fully covered by screeShallow soils with fine debris 0.3 0.75 Fine scree and debris, partly with soilForest soils 0.2 0.75 Soils with humus layer, ground vegetationPasture 0.35 0.8 Pastures, agricultural useRoads, compacted soil 0.25 0.9 Roads and forest roads
Scandinavian Journal of Forest Research 5
Dow
nloa
ded
by [
UB
Bod
enku
ltur
Wie
n] a
t 01:
36 0
3 A
ugus
t 201
5
after three entries with a total regenerated area of about60% the residual canopy is sequentially removed.
For all scenarios it was assumed that seed supply isdetermined by current species composition and thatregeneration success is not limited by browsing.
Harvesting costs were calculated based on Stampferet al. (2006) and included fixed and variable costcomponents depending on skyline length, logging direc-tion (up-slope, down-slope), mean harvested tree vol-ume, and total logged volume. Timber revenues werebased on regional prices for an average assortment mix.
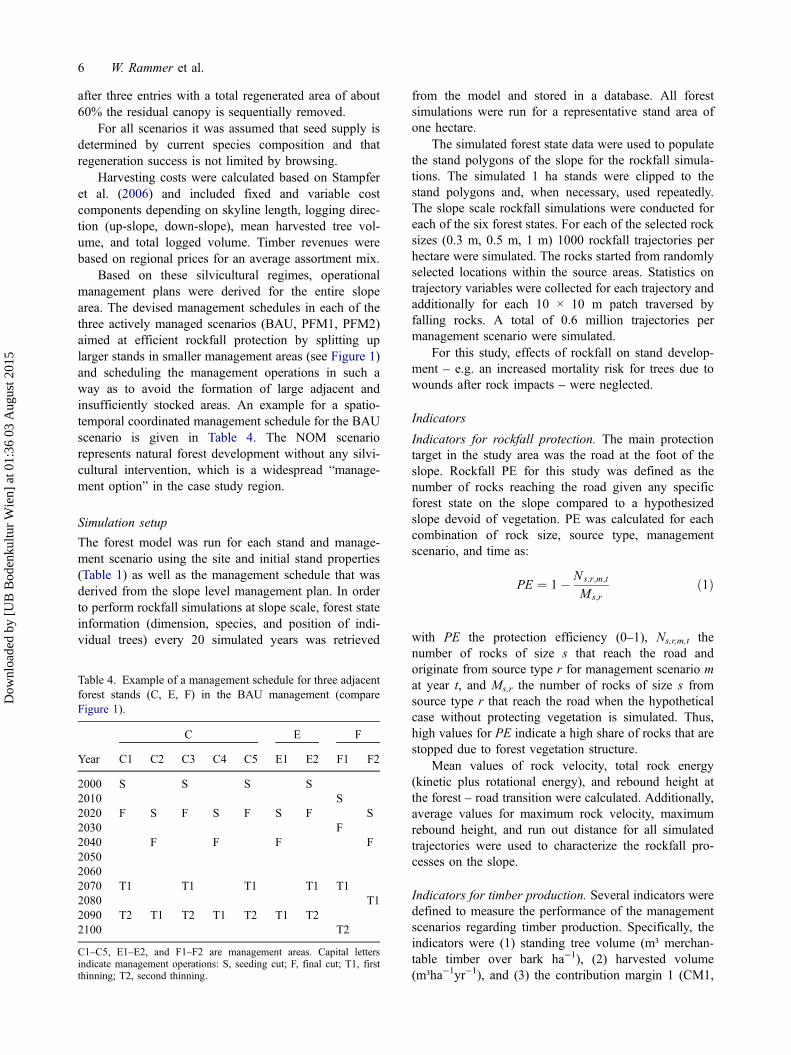
Based on these silvicultural regimes, operationalmanagement plans were derived for the entire slopearea. The devised management schedules in each of thethree actively managed scenarios (BAU, PFM1, PFM2)aimed at efficient rockfall protection by splitting uplarger stands in smaller management areas (see Figure 1)and scheduling the management operations in such away as to avoid the formation of large adjacent andinsufficiently stocked areas. An example for a spatio-temporal coordinated management schedule for the BAUscenario is given in Table 4. The NOM scenariorepresents natural forest development without any silvi-cultural intervention, which is a widespread “manage-ment option” in the case study region.
Simulation setup
The forest model was run for each stand and manage-ment scenario using the site and initial stand properties(Table 1) as well as the management schedule that wasderived from the slope level management plan. In orderto perform rockfall simulations at slope scale, forest stateinformation (dimension, species, and position of indi-vidual trees) every 20 simulated years was retrieved
from the model and stored in a database. All forestsimulations were run for a representative stand area ofone hectare.
The simulated forest state data were used to populatethe stand polygons of the slope for the rockfall simula-tions. The simulated 1 ha stands were clipped to thestand polygons and, when necessary, used repeatedly.The slope scale rockfall simulations were conducted foreach of the six forest states. For each of the selected rocksizes (0.3 m, 0.5 m, 1 m) 1000 rockfall trajectories perhectare were simulated. The rocks started from randomlyselected locations within the source areas. Statistics ontrajectory variables were collected for each trajectory andadditionally for each 10 × 10 m patch traversed byfalling rocks. A total of 0.6 million trajectories permanagement scenario were simulated.
For this study, effects of rockfall on stand develop-ment – e.g. an increased mortality risk for trees due towounds after rock impacts – were neglected.
Indicators
Indicators for rockfall protection. The main protectiontarget in the study area was the road at the foot of theslope. Rockfall PE for this study was defined as thenumber of rocks reaching the road given any specificforest state on the slope compared to a hypothesizedslope devoid of vegetation. PE was calculated for eachcombination of rock size, source type, managementscenario, and time as:
PE ¼ 1� Ns;r;m;t
Ms;rð1Þ
with PE the protection efficiency (0–1), Ns,r,m,t thenumber of rocks of size s that reach the road andoriginate from source type r for management scenario mat year t, and Ms,r the number of rocks of size s fromsource type r that reach the road when the hypotheticalcase without protecting vegetation is simulated. Thus,high values for PE indicate a high share of rocks that arestopped due to forest vegetation structure.
Mean values of rock velocity, total rock energy(kinetic plus rotational energy), and rebound height atthe forest – road transition were calculated. Additionally,average values for maximum rock velocity, maximumrebound height, and run out distance for all simulatedtrajectories were used to characterize the rockfall pro-cesses on the slope.
Indicators for timber production. Several indicators weredefined to measure the performance of the managementscenarios regarding timber production. Specifically, theindicators were (1) standing tree volume (m³ merchan-table timber over bark ha−1), (2) harvested volume(m³ha−1yr−1), and (3) the contribution margin 1 (CM1,
Table 4. Example of a management schedule for three adjacentforest stands (C, E, F) in the BAU management (compareFigure 1).
C E F
Year C1 C2 C3 C4 C5 E1 E2 F1 F2
2000 S S S S2010 S2020 F S F S F S F S2030 F2040 F F F F205020602070 T1 T1 T1 T1 T12080 T12090 T2 T1 T2 T1 T2 T1 T22100 T2
C1–C5, E1–E2, and F1–F2 are management areas. Capital lettersindicate management operations: S, seeding cut; F, final cut; T1, firstthinning; T2, second thinning.
6 W. Rammer et al.
Dow
nloa
ded
by [
UB
Bod
enku
ltur
Wie
n] a
t 01:
36 0
3 A
ugus
t 201
5

€ha−1). CM1 was calculated by subtracting harvestingcosts from revenues per harvested m3 of timber.
Results
Timber production
Figure 2 shows the average stem density and standingvolume for the entire project area. The actively managedscenarios showed an increase in stem numbers due to theon-set of regeneration after initial harvests. NOM lackedregeneration, but showed the highest standing volumeover the simulation period.
The economic performance of the three evaluatedactive management regimes is presented in Table 5.While the contribution margin (CM1) is a key indicatorfor profitability of timber harvests, the mean periodicremovals indicate the flow of timber over time. Thenegative contribution margins during the second half ofthe simulation period under BAU management resultedfrom cost-intensive tending of the mostly juvenile standsand low revenues due to small timber dimensions. Onthe other hand, the protection management scenariosPFM1 and PFM2 were able to achieve positive CM1values over the entire 100 year period by avoiding thecreation of larger-scale young stand development phasesand the resulting need for costly stand tending measures.The mean harvested timber was highest for BAU with6.7 m³ha−1yr−1 and lower for PFM1 (5.7 m³ha−1yr−1)and PFM2 (5.9 m³ha−1yr−1). The higher productivity ofBAU is due to the quick transformation of the overlymature initial stands, which are way beyond theculmination of periodic increment, into productiveyoung stands.
Rockfall protection efficiency
The upper panel of Figure 3 compares PE for differentrock sizes over time. Under BAU management PEdecreases for all rock sizes during regeneration stages,with low density of mature trees in several stands or nosuch trees at all after removal of the residual shelter. ThePFM scenarios performed comparably well; however,the higher density of smaller trees in PFM2 corre-sponded with higher protection efficiency for smallerrocks and slightly reduced protective effect against largerrocks from 2020–2040. The NOM alternative showed adeclining tendency in PE for all rock sizes, but inrelative terms performed better for larger rock sizes.
Simulated rock velocities and run out distances(Figure 3) showed a similar pattern. The mean maximumvelocity of all trajectories was highest for periods withhigh share of stands in the regeneration stage with lowstanding volume (BAU) but also under PFM2 as long asregeneration has not been established in the created gaps.
●
●
●
●●
●
2000 2020 2040 2060 2080 2100
050
015
0025
00
Years
stem
s( h
a−1)
a)
●
●
●
●●
●
2000 2020 2040 2060 2080 2100
020
040
060
080
0
Years
volu
me
(m3
ha−1
)
b)
● BAU PFM1 PFM2 NOM
Figure 2. Mean tree density (stems >1.3m height) (a) and standing volume (b) on the study slope over time. BAU = business as usualshelterwood management, PFM1 and PFM2 = protection forest management, NOM = no management.
Table 5. Mean harvested volume [m³ ha−1 yr−1] and contribu-tion margin CM1 [€ ha−1 yr−1] in five 20-year periods and forthe full simulation period.
BAU PFM1 PFM2
Period Harvest CM1 Harvest CM1 Harvest CM1
2000–2019 12.6 209 6.5 136 8.0 1682020–2039 11.4 94 6.7 147 6.4 1212040–2059 1.1 −9 6.3 122 4.9 1012060–2079 3.6 −25 3.3 68 5.3 1052080–2099 5.0 −2 5.9 108 4.9 752000–2099 6.7 53 5.7 116 5.9 114
BAU, business as usual shelterwood system; PFM1 and PFM2, rockfallprotection management.
Scandinavian Journal of Forest Research 7
Dow
nloa
ded
by [
UB
Bod
enku
ltur
Wie
n] a
t 01:
36 0
3 A
ugus
t 201
5
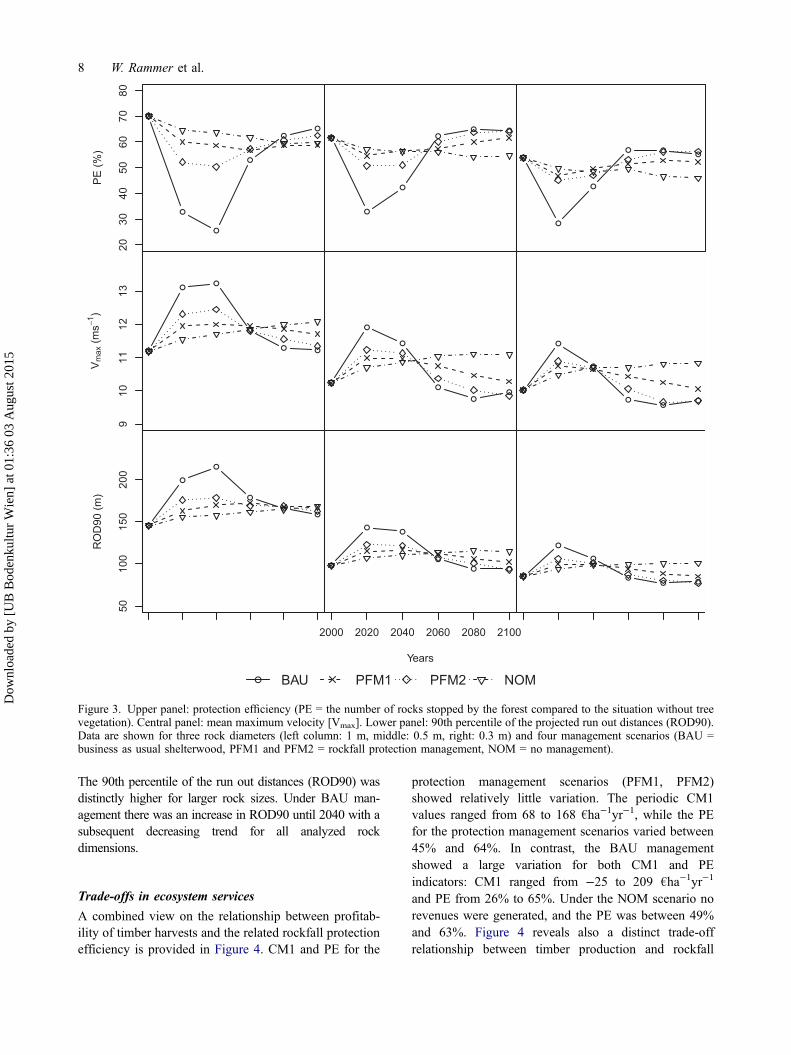
The 90th percentile of the run out distances (ROD90) wasdistinctly higher for larger rock sizes. Under BAU man-agement there was an increase in ROD90 until 2040 with asubsequent decreasing trend for all analyzed rockdimensions.
Trade-offs in ecosystem services
A combined view on the relationship between profitab-ility of timber harvests and the related rockfall protectionefficiency is provided in Figure 4. CM1 and PE for the
protection management scenarios (PFM1, PFM2)showed relatively little variation. The periodic CM1values ranged from 68 to 168 €ha−1yr−1, while the PEfor the protection management scenarios varied between45% and 64%. In contrast, the BAU managementshowed a large variation for both CM1 and PEindicators: CM1 ranged from −25 to 209 €ha−1yr−1
and PE from 26% to 65%. Under the NOM scenario norevenues were generated, and the PE was between 49%and 63%. Figure 4 reveals also a distinct trade-offrelationship between timber production and rockfall
●
●
●
●
●●
2030
4050
6070
80
PE
(%)
●
●
●
●● ●
●
●
●
● ●●
●
●●
●
● ●
Vm
ax (m
s−1)
910
1112
13
●
●
●
●
●● ●
●
●
●●
●
●
●
●
●
●●
RO
D90
(m)
5010
015
020
0
●
●●
●
● ●
2000 2020 2040 2060 2080 2100
Years
●
●
●
●● ●
● BAU PFM1 PFM2 NOM
Figure 3. Upper panel: protection efficiency (PE = the number of rocks stopped by the forest compared to the situation without treevegetation). Central panel: mean maximum velocity [Vmax]. Lower panel: 90th percentile of the projected run out distances (ROD90).Data are shown for three rock diameters (left column: 1 m, middle: 0.5 m, right: 0.3 m) and four management scenarios (BAU =business as usual shelterwood, PFM1 and PFM2 = rockfall protection management, NOM = no management).
8 W. Rammer et al.
Dow
nloa
ded
by [
UB
Bod
enku
ltur
Wie
n] a
t 01:
36 0
3 A
ugus
t 201
5
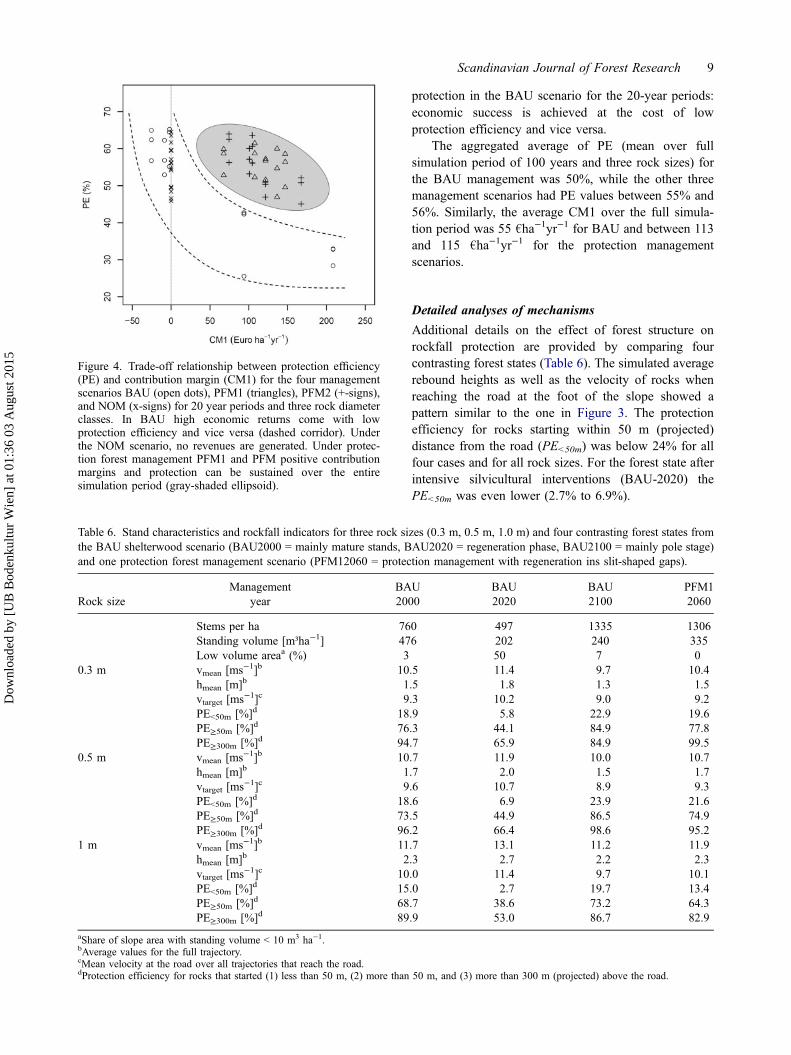
protection in the BAU scenario for the 20-year periods:economic success is achieved at the cost of lowprotection efficiency and vice versa.
The aggregated average of PE (mean over fullsimulation period of 100 years and three rock sizes) forthe BAU management was 50%, while the other threemanagement scenarios had PE values between 55% and56%. Similarly, the average CM1 over the full simula-tion period was 55 €ha−1yr−1 for BAU and between 113and 115 €ha−1yr−1 for the protection managementscenarios.
Detailed analyses of mechanisms
Additional details on the effect of forest structure onrockfall protection are provided by comparing fourcontrasting forest states (Table 6). The simulated averagerebound heights as well as the velocity of rocks whenreaching the road at the foot of the slope showed apattern similar to the one in Figure 3. The protectionefficiency for rocks starting within 50 m (projected)distance from the road (PE<50m) was below 24% for allfour cases and for all rock sizes. For the forest state afterintensive silvicultural interventions (BAU-2020) thePE<50m was even lower (2.7% to 6.9%).
Figure 4. Trade-off relationship between protection efficiency(PE) and contribution margin (CM1) for the four managementscenarios BAU (open dots), PFM1 (triangles), PFM2 (+-signs),and NOM (x-signs) for 20 year periods and three rock diameterclasses. In BAU high economic returns come with lowprotection efficiency and vice versa (dashed corridor). Underthe NOM scenario, no revenues are generated. Under protec-tion forest management PFM1 and PFM positive contributionmargins and protection can be sustained over the entiresimulation period (gray-shaded ellipsoid).
Table 6. Stand characteristics and rockfall indicators for three rock sizes (0.3 m, 0.5 m, 1.0 m) and four contrasting forest states fromthe BAU shelterwood scenario (BAU2000 = mainly mature stands, BAU2020 = regeneration phase, BAU2100 = mainly pole stage)and one protection forest management scenario (PFM12060 = protection management with regeneration ins slit-shaped gaps).
Rock sizeManagement
yearBAU2000
BAU2020
BAU2100
PFM12060
Stems per ha 760 497 1335 1306Standing volume [m³ha−1] 476 202 240 335Low volume areaa (%) 3 50 7 0
0.3 m vmean [ms−1]b 10.5 11.4 9.7 10.4hmean [m]b 1.5 1.8 1.3 1.5vtarget [ms−1]c 9.3 10.2 9.0 9.2PE<50m [%]d 18.9 5.8 22.9 19.6PE≥50m [%]d 76.3 44.1 84.9 77.8PE≥300m [%]d 94.7 65.9 84.9 99.5
0.5 m vmean [ms−1]b 10.7 11.9 10.0 10.7hmean [m]b 1.7 2.0 1.5 1.7vtarget [ms−1]c 9.6 10.7 8.9 9.3PE<50m [%]d 18.6 6.9 23.9 21.6PE≥50m [%]d 73.5 44.9 86.5 74.9PE≥300m [%]d 96.2 66.4 98.6 95.2
1 m vmean [ms−1]b 11.7 13.1 11.2 11.9hmean [m]b 2.3 2.7 2.2 2.3vtarget [ms−1]c 10.0 11.4 9.7 10.1PE<50m [%]d 15.0 2.7 19.7 13.4PE≥50m [%]d 68.7 38.6 73.2 64.3PE≥300m [%]d 89.9 53.0 86.7 82.9
aShare of slope area with standing volume < 10 m3 ha−1.bAverage values for the full trajectory.cMean velocity at the road over all trajectories that reach the road.dProtection efficiency for rocks that started (1) less than 50 m, (2) more than 50 m, and (3) more than 300 m (projected) above the road.
Scandinavian Journal of Forest Research 9
Dow
nloa
ded
by [
UB
Bod
enku
ltur
Wie
n] a
t 01:
36 0
3 A
ugus
t 201
5
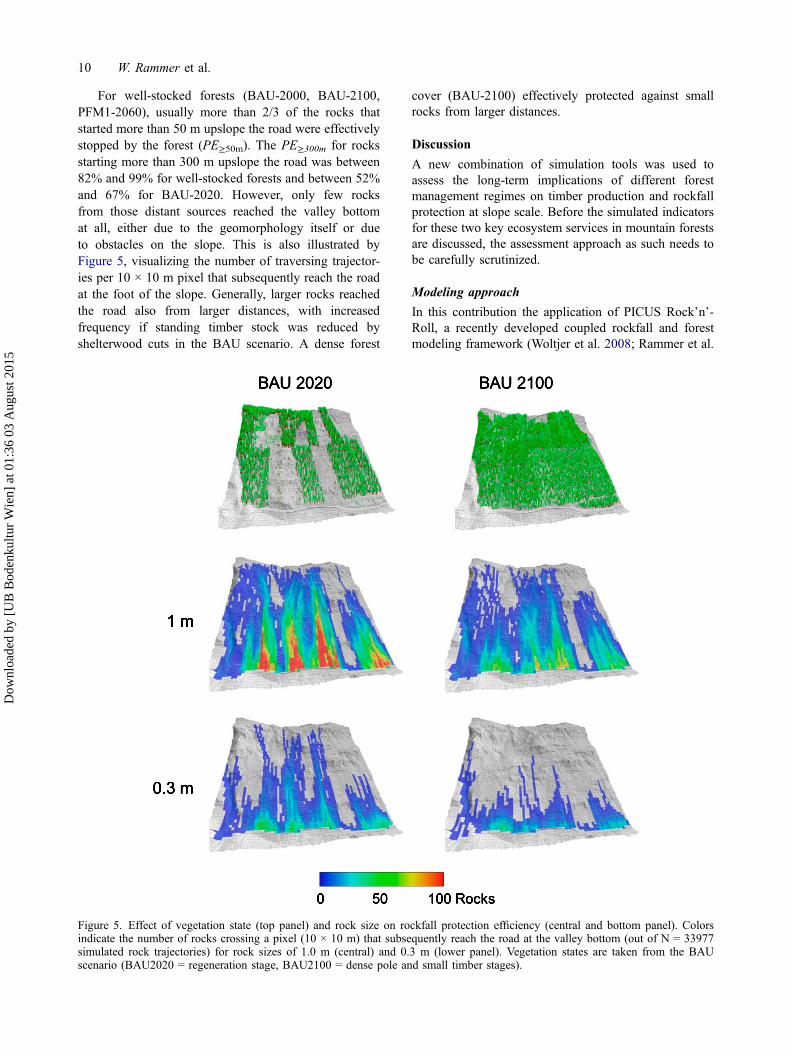
For well-stocked forests (BAU-2000, BAU-2100,PFM1-2060), usually more than 2/3 of the rocks thatstarted more than 50 m upslope the road were effectivelystopped by the forest (PE≥50m). The PE≥300m for rocksstarting more than 300 m upslope the road was between82% and 99% for well-stocked forests and between 52%and 67% for BAU-2020. However, only few rocksfrom those distant sources reached the valley bottomat all, either due to the geomorphology itself or dueto obstacles on the slope. This is also illustrated byFigure 5, visualizing the number of traversing trajector-ies per 10 × 10 m pixel that subsequently reach the roadat the foot of the slope. Generally, larger rocks reachedthe road also from larger distances, with increasedfrequency if standing timber stock was reduced byshelterwood cuts in the BAU scenario. A dense forest
cover (BAU-2100) effectively protected against smallrocks from larger distances.
Discussion
A new combination of simulation tools was used toassess the long-term implications of different forestmanagement regimes on timber production and rockfallprotection at slope scale. Before the simulated indicatorsfor these two key ecosystem services in mountain forestsare discussed, the assessment approach as such needs tobe carefully scrutinized.
Modeling approach
In this contribution the application of PICUS Rock’n’-Roll, a recently developed coupled rockfall and forestmodeling framework (Woltjer et al. 2008; Rammer et al.
Figure 5. Effect of vegetation state (top panel) and rock size on rockfall protection efficiency (central and bottom panel). Colorsindicate the number of rocks crossing a pixel (10 × 10 m) that subsequently reach the road at the valley bottom (out of N = 33977simulated rock trajectories) for rock sizes of 1.0 m (central) and 0.3 m (lower panel). Vegetation states are taken from the BAUscenario (BAU2020 = regeneration stage, BAU2100 = dense pole and small timber stages).
10 W. Rammer et al.
Dow
nloa
ded
by [
UB
Bod
enku
ltur
Wie
n] a
t 01:
36 0
3 A
ugus
t 201
5

2010) to a case study in the Austrian Alps, has beendemonstrated. The coupled model approach extended theutility of the individual models for scenario analysis inseveral ways. First, the spatial scale of the combinedassessment was extended beyond the stand scale that isused by the forest model. Second, the rockfall assess-ment was run repeatedly against changing forest vegeta-tion over time, thus allowing to extend the assessment ofrockfall protection efficiency from a single point in timeto a full rotation period. And third, the implementationof different spatially explicit management regimesenabled to study the effects of silvicultural regimes onthe trade-off relationship of rockfall protection andtimber production.
The model coupling approach has, however, also anumber of limitations. Forest simulations were stillbased on individual forest stands that are simulatedsequentially and thus do not permit interactions betweenstands. The approach can therefore only be applied aslong as landscape processes such as species migration ordisturbance regimes operating at larger scales can beneglected. Furthermore, a dynamic feedback from therockfall model to the forest model has not beenconsidered. This limitation may hamper the applicabilityin areas with high rockfall frequencies and thus fre-quently damaged trees. However, as long as no robustestimations of real rockfall frequencies in a study areaare available, generalized rockfall analyses as performedin the current study are justified.
Data requirements and alternative analysis approaches
Applying coupled rockfall and forest simulation on slopescale requires detailed input data for both the rockfalland the forest model. For this study, a high-resolutiondigital elevation model as derived from airborne laserscanning data and a field survey were employed to maprockfall source areas and surface properties, which inturn were then used to infer rockfall parameters from theliterature. In addition, standwise forest inventory anddetailed slope-scale management planning was necessaryto provide the input data for the forest model. Theapplicability of the simulation approach may therefore behampered in practice by high efforts for data collection,especially when the spatial extent of the project area islarge. This problem could be tackled in different ways:one option is to include a first, large-scale “scanning”phase to select areas with high rockfall intensity orrelevant protection objects and concentrate subsequentlyon those slope sections for further data collection andanalysis. Such areas could be determined by simulationsbased on digital elevation models without consideringforest vegetation. This approach could reduce the effortsand costs of fieldwork considerably.
A second option is to utilize approaches that relymore on (increasingly available) remote sensing data and
less on (expensive) field-based data collection. Remotesensing data could be used to (partially) substitute andenhance terrestrial forest inventories (Van Leeuwen &Nieuwenhuis 2010), e.g. to generate spatially explicitrealistic forest structures for large areas. If the technicalknow-how or the data requirements regarding rockfallprocesses limit the application of the proposed simula-tion approach, indicator-based protection forest assess-ment schemes (Frehner et al. 2005) are a possible fall-back option. However, such approaches miss the explicitspatial dimension in assessing the protection effect offorests and are thus of limited value at scales beyond thestand level.
Assessment results
The results of the current study demonstrated thatsilvicultural regimes, specifically designed for protectionforest management, can outperform the business as usualstrategy with regard to both timber production androckfall protection when also mid- to long-term implica-tions are considered. The protection forest managementregimes succeeded in maintaining a high level of rockfallprotection over the full simulation period of 100 yearswhile enhancing the resilience of the forest by initiatinga continuous regeneration process. By concentrating thetimber removals in slit-shaped gaps, efficient logging ispossible and harvesting costs are kept at acceptablelevels. In contrast, BAU showed phases with signifi-cantly reduced rockfall protection efficiency and negat-ive contribution margins. This aligns well with resultsfrom Cordonnier et al. (2008) who found that manage-ment regimes that aim at creating a shifting mosaic ofsmall patches of different development stages providelong-term stand stability, resilience, and sufficient rock-fall protection. However, the BAU approach performedbetter than PFM1 and PFM2 with regard to overalltimber production (on average 17% and 14% morevolume (m³ha−1yr−1) than PFM1 and PFM2, respect-ively) mainly due to an earlier transformation to youngerand more productive stands, but also due to a decreasedstanding stock. However, BAU performed poorer eco-nomically, because tending operations in earlier standdevelopment stages – which are required to increase andmaintain tree and stand stability – yielded very small oreven negative contribution margins. Thus, moving fromage class shelterwood systems to small scale interven-tions in steep terrain can be economically viable, even ifinstallation times of cable yarding systems are a signi-ficant cost factor in mountain forest management(Stampfer et al. 2006).
The studied forest consists of mostly mature tooverly mature forest stands, which is a widespreadsituation in Alpine protection forests due to a lack offorest road infrastructure and low productivity. In BAUthis imbalance resulted in parallel stand regeneration cuts
Scandinavian Journal of Forest Research 11
Dow
nloa
ded
by [
UB
Bod
enku
ltur
Wie
n] a
t 01:
36 0
3 A
ugus
t 201
5
at relatively large shares of the study area. Given thatmanagement can be coordinated among owners, thespatiotemporal pattern of stand regeneration cuts couldbe further optimized. The benefits of coordinatingmanagement interventions in small scale ownershipstructures is also supported by the finding that for areasonable high probability to stop a falling rock aforested slope of up to 300 m may be required (compareTable 6). Also, the mix of management strategies haspotential to improve protection efficiency and costeffectiveness. However, in small scale ownership struc-tures this requires benefit sharing approaches.
Given the initial age structure and stand conditions,the NOM scenario maintained reasonable protectionefficiency for several decades. However, the long-termconsequences of missing targeted management interven-tions are decreasing rockfall protection efficiency andthe build-up of a “regeneration debt,” which negativelyaffects the functional resilience of the system.
It should also be noted that the simulations did notconsider browsing by ungulates or disturbances such asbark beetle infestations. Given the high browsing pres-sure at present, regeneration success might be over-estimated in all scenarios (compare Didion et al. 2009).Considering bark beetle related mortality would likelylower the rockfall protection efficiency, particularly forthe NOM scenario. While current disturbance intensity isrelatively low this may change under warmer conditionsof climate change (Seidl et al. 2011a, 2014; Pasztoret al. 2014).
The study provides also more general insights intothe effects of forest structure on rockfall protection.Specifically, we found a strong effect of forest manage-ment on the simulated run out distances and conse-quently on the amount of rocks that reached theprotection objects. Effects on rock velocities, reboundheights, and accumulated energies were consistent butless pronounced, as the geomorphology of the slopeallowed rocks to regain high speeds quickly. We werealso able to confirm the effect of rock size on rockfallprotection efficiency: smaller rocks are more effectivelystopped by dense forests while trees with high biomassare more effective in stopping large rocks (Figure 3, seealso Dorren et al. 2007). Generally, rockfall protectionmanagement regimes that avoid large gaps and maintaina sufficiently large number of stable trees per ha (sensuFrehner et al. 2005) were successful in regenerating theforest while continuously providing a high degree ofrockfall protection.
From the operational perspective it is important tonote that concentrating the removals of trees within slit-shaped gaps reduces damages to residual trees andadvance regeneration and positively affects the produc-tivity of harvesting operations compared to more dis-persed removal pattern. Management measures to
increase the roughness of the slope, e.g. to leave cuttree trunks or high stumps on site (Dorren et al. 2005;Frehner et al 2005) were not implemented in this study,but can temporally further improve the protective effect.
While it is important to note that care must be takenin directly transferring the results as initial foreststructures affect the timing of silvicultural interventionsand related protective effects, the study revealed valuableinsights to the interdependencies of management inter-ventions, timber production, and rockfall protection inmountain forests.
AcknowledgmentsWe thank Arthur Perle for details on local managementpractices, as well as one reviewer for helpful comments on anearlier version of the manuscript.
Disclosure statement
No potential conflict of interest was reported by the authors.
FundingThis work was supported by “die.wildbach”, the Austriantorrent and avalanche control authorities.
ReferencesAgliardi F, Crosta GB. 2003. High resolution three-dimen-
sional numerical modelling of rockfalls. Int J Rock MechMin. 40:455–471.
Azzoni A, de Freitas MH. 1995. Experimentally gainedparameters, decisive for rock fall analysis. Rock MechRock Eng. 28:111–124.
Azzoni A, La Barbera G., Zaninetti A. 1995. Analysis andprediction of rockfalls using a mathematical model. Int JRock Mech Min. 32:709–724.
Bigot C, Dorren LKA, Berger F. 2009. Quantifying theprotective function of a forest against rockfall for past,present and future scenarios using two modellingapproaches. Nat Hazards. 49:99–111.
Chau KT, Wong RHC, Wu JJ. 2002. Coefficient of restitutionand rotational motions of rockfall impacts. Int J RockMech Min. 39:69–77.
Cordonnier T, Courbaud B, Berger F, Franc A. 2008. Perman-ence of resilience and protection efficiency in mountainNorway spruce forest stands: A simulation study. For EcolManag. 256:347–354.
Didion M, Kupferschmid A, Bugmann H. 2009. Long-termeffects of ungulate browsing on forest composition andstructure. For Ecol Manag. 258:S44–S55.
Dorren LKA, Berger F, Jonsson M, Krautblatter M, Mölk M,Stoffel M, Wehrli A. 2007. State of the art in rockfall –forest interactions. Schweiz Z Forstwes. 158:128–141.
Dorren LKA, Berger F. 2006. Stem breakage of trees andenergy dissipation during rockfall impacts. Tree Physiol.26:63–71.
Dorren LKA, Berger F, Imeson AC, Maier B, Rey F. 2004.Integrity, stability and management of protection forests inthe European Alps. For Ecol Manag. 195:165–176.
Dorren LKA, Berger F, Le Hir C, Mermin E, Tardif P. 2005.Mechanisms, effects and management implications ofrockfall in forests. For Ecol Manag. 215:183–195.
12 W. Rammer et al.
Dow
nloa
ded
by [
UB
Bod
enku
ltur
Wie
n] a
t 01:
36 0
3 A
ugus
t 201
5
Dorren LKA, Berger F, Putters US. 2006. Real-size experi-ments and 3-D simulation of rockfall on forested and non-forested slopes. Nat Hazard Earth Sys. 6:145–153.
Frehner M, Wasser B, Schwitter R. 2005. Nachhaltigkeit undErfolgskontrolle im Schutzwald. Wegleitung für Pflege-massnahmen in Wäldern mit Schutzfunktion [Sustainabil-ity and monitoring in protection forests. A guideline formanagement measures in protection forests]. Bern: Bunde-samt für Umwelt, Wald und Landschaft.
Heidenreich B. 2004. Small- and half-scale experimentalstudies of rockfall impacts on sandy slopes [Thèse NO3059]. École Polytechnique Fédérale De Lausanne.
Kharaz AH, Gorham DA, Salman AD. 2001. An experimentalstudy of the elastic rebound of spheres. Powder Technol.120:281–291.
Landsberg JJ, Waring RH. 1997. A generalised model of forestproductivity using simplified concepts of radiation-useefficiency, carbon balance and partitioning. For EcolManag. 95:209–228.
Lexer MJ, Hönninger K. 2001. A modified 3D-patch model forspatially explicit simulation of vegetation composition inheterogeneous landscapes. For Ecol Manag.144:43–65.
Lexer MJ, Seidl R. 2009. Addressing biodiversity in astakeholder-driven climate change vulnerability assessmentof forest management. For Ecol Manag. 258:S158–S167.
Maroschek M, Rammer W, Lexer MJ. 2014. Using a novelassessment framework to evaluate protective functions andtimber production in an Austrian mountain landscapeunder climate change. Reg Environ Change. doi:10.1007/s10113-014-0691-z
Ott E, Frehner M, Frey H, Lüscher P. 1997. Gebirgsnadel-wälder: Ein Praxisorientierter Leitfanden für eine Standort-gerechte Waldbehandlung [A practice-oriented guidelinefor site-specific forest treatment]. Bern: Paul Haupt Verlag.
Pasztor F, Matulla C, Rammer W, Lexer MJ. 2014. Drivers ofthe bark beetle disturbance regime in Alpine forests inAustria. For Ecol Manag. 318:349–358.
Pretzsch H, Grote R, Reineking B, Rötzer T, Seifert S. 2008.Models for forest ecosystem management: a Europeanperspective. Ann Botany. 101:1065–1087.
Rammer W, Brauner M, Dorren LKA, Berger F, Lexer MJ.2010. Evaluation of a 3-D rockfall module within a forestpatch model. Nat Hazard Earth Sys. 10:699–711.
Seidl R, Lexer MJ, Jäger D, Hönninger K. 2005. Evaluating theaccuracy and generality of a hybrid patch model. TreePhysiol. 25:939–951.
Seidl R, Rammer W, Lexer MJ. 2009. Schätzung vonBodenmerkmalen und Modellparametern für die Waldöko-systemsimulation auf Basis von Großrauminventuren[Estimating soil properties and parameters for forestecosystem simulation based on large scale forest inventor-ies]. Allg Forst Jagdztg. 180:35–44.
Seidl R, Rammer W, Lexer MJ. 2011a. Climate changevulnerability of sustainable forest management in theEastern Alps. Climatic Change. 106:225–254.
Seidl R, Rammer W, Lexer MJ. 2011b. Adaptation options toreduce climate change vulnerability of sustainable forestmanagement in the Austrian Alps. Can J For Res.41:694–706.
Seidl R, Rammer W, Panagiotis B, Hochbichler E, Lexer MJ.2010. Testing generalized allometries in allocation model-ing within an individual-based simulation framework.Trees. 24:139–150.
Seidl R, Schelhaas M, Rammer W, Verkerk PJ. 2014. Increas-ing forest disturbances in Europe and their impact oncarbon storage. Nat Clim Chang. 4:806–810.
Schweigl J, Ferretti C, Noessing L. 2003. Geotechnicalcharacterization and rockfall simulation of a slope: apractical case study from South Tyrol (Italy). Eng Geol.67:281–296.
Stampfer K, Visser R, Kanzian C. 2006. Cable corridor installa-tion times for European yarders. Int J For Eng. 17:71–77.
Stoffel M, Wehrli A, Kühne R, Dorren LKA, Perret S,Kienholz H. 2006. Assessing the protective effect ofmountain forests against rockfall using a 3D simulationmodel. For Ecol Manag. 225:113–122.
Van Leeuwen M, Nieuwenhuis M. 2010. Retrieval of foreststructural parameters using LiDAR remote sensing. Eur JFor Res. 129:749–770.
Volkwein A, Schellenberg K, Labiouse V, Agliardi F, Berger F,Bourrier F, Dorren LKA, Gerber W, Jaboyedoff M. 2011.Rockfall characterisation and structural protection – areview. Nat Hazard Earth Sys. 11:2617–2651.
Wehrli A, Dorren LKA, Berger F, Zingg A, Schönberger W,Brang P. 2006. Modelling long-term effects of forestdynamics on the protective effect against rockfall. ForSnow Landsc Res. 80:57–76.
Woltjer M, Rammer W, Brauner M, Seidl R, Mohren GMJ,Lexer MJ. 2008. Coupling a 3D patch model and a rockfallmodule to assess rockfall protection in mountain forests.Environ Manage. 87:373–388.
Scandinavian Journal of Forest Research 13
Dow
nloa
ded
by [
UB
Bod
enku
ltur
Wie
n] a
t 01:
36 0
3 A
ugus
t 201
5