Development Document for the Timber Products Processing ...
525
-
Upload
khangminh22 -
Category
Documents
-
view
0 -
download
0
Transcript of Development Document for the Timber Products Processing ...

DEVELOPMENT DOCUMENT
for
EFFLUENT LIMITATIONS GUIDELINES NEW SOURCE PERFORMANCE STANDARDS
and
PRETREATMENT STANDARDS
for the
TIMBER PRODUCTS PROCESSING POINT SOURCE CATEGORY
Douglas M. Costle Administrator
Jeffery D. Denit Acting Director, Effluent Guidelines Division
Ri chard E. Williams Project Officer
January, 1981
Effluent Guidelines Division Office of Water and Waste Management U. S. Env i ronmental Protect i on Agency
Washington, D.C. 20460


ABSTRACT
-
This document presents the findings of a study of the_ wood preserving, insulation board, and wet process hardboard segments o( the Timber Products Processing point source category for the purpose of developing effluent limitations and guidelines for existing point sources and standards of performance and pretreatment standards for new and existing point sources to implement Sections.301, 304, 306, 307, 308, and 501 of the Clean Water Act (the Federal Water Pollution Control Act Amendments of 1972, 33 USC 1251 et. seq., as amended by the Clean Water Act of 1977, · P.L. 95-217) (the "Act"). This document was .also prepared in response to the Settlement Agreement in Natural Resources Defense ~ouncil, Inc. v. Train, 8 ERC 2120 (D.D.C. 1976), modified March 9, 19.79.
The information presented in this document supports regulations promulgated in January 1981 for the Timber Products Processing Point Source Category. Information is presented to support new source performance standards (NSPS) and pretreatment standards for new and existing sources (PSNS and PSES) for two subcategories in the w~9d preserving segment. Information is presented to support best practicable control technology (BPT), best conventional pollutant control technology (BCT), new source performance standards (NSP-S), and pretreatment standards for new and existing sources (PSNS and PSES) for the two parts of the wet process hardboard subcategory and the insulation board subcategory. Best available technology (BAT) and BCT limitations are not proposed for the wood preserving segment because only one direct discharger of process wastewater has been identified. BAT limitations are not proposed for the hardboard subcategory and the insulation board subcategory because of the low level of toxic pollutants present in raw wastewaters generated by these subcategories. The guidelines and standards promulgated by the Agency and presented in this document are based on the performance of technology currently being practiced in the industry segments for which regulations are promulgated. Descriptions of the treatment technologies appropriate for achieving the limitations contained herein, as well as supporting data, cost estimates, and rationale for the development of the proposed effluent limitations, guidelines, and standards of performance are contained in this report.
iii


TABLE OF CONTENTS
SECTION PAGE
I. EXECUTIVE SUMMARY l
A. Summary and Conclusions l 1. Coverage l 2. Wood Preserving l 3. Insulation Board/Wet Process Hardboard 2
B. Effluent Standards 4 1. Wood Preserving 4 2. Insulation Board/Wet Process Hardboard 5
II. INTRODUCTION 9
A. Purpose and Au~hority 9 B. Prior EPA Regulations 11
l. Best Practicable Control Technology Currently Available 11
2. Best Available Technology Economically Achievable 12
3. New Source Performance Standards 14 4. Pretreatment Standards, New and Existing 14
c. Overview of the Industry 16 1. Standard Industrial Classifications 16 2. Wood Preserving 17 3. Insulation Board 17 4. Wet Process Hardboard 27
D. Summary of Methodology and Data Gathering Efforts 30
III. DESCRIPTION OF THE INDUSTRY 35
A. Wood Preserving 35 l . Scope of Study 35 2. Background 35 3. Data Collection Portfolio Development 35 4. Response to the DCP 36 s. Characterization of Non Responders 36 6. Comparison with Independent Surveys 38 7. Summary 38 8. Methods of Wastewater Disposal According
to the DCP 39 9. Units of Expression 39
l O. Process Description 39 B. Insulation Board 49 .
. 1. . Scope of Study 49 2. Scope of Coverage for Data Base 50 3. Units of Expression 50 4. Process Description 50
c. Wet Process Hardboard 57
V

SECTION PAGE
1. Scope of Study 57 2. Scope of Coverage for Data Base 57 3. Units of Expression 57 4. Process Description 58
IV. INDUSTRIAL SUBCATEGORIZATION 67
A. General 67 B. Wood Preserving 67
1. Review of Existing Subcategorization 67 2. Plant Characteristics and Raw Materials 68 3 • Wastewater Characteristics 70 4. . Manufacturing Processes 72 5. Methods of Wastewater.Treatment and Disposal 72 6. Nonwater Quality Impacts 73 7. Subcategory Description and Selection
Rationale 73 c. Insulation E3oard 74 1. Review of Existing Subcategorization 74 2. Raw materials 75 3. Manufacturing Process 76 4. Products Produced 76 5. Plant Size and Age 77 6. Nonwater Quality Impacts 77
. 7. Subcategory Description and Selection Rationale 77
D. Wet Process·Hardboard 78 1. Review of Existing Subcategorization 78 2. Raw Materials 78 3. Manufacturing Processes 79 4. Products Produced 79 5. Size and Age of Plants 80 6. Nonwater Quality Impacts 80 7. Sub~ategory Description and Selection
Rationale 80
v. WASTEWATER CHARACTERISTICS ' ,~• 81 t ':
A. General .; .. :~
81 B. Wood Preserving 81
1. General Characteristics 81 2. Wastewater Quantity 82 3. Steam Conditioning and Vapor Drying 83 4. Boulton Conditioning 84 5. Historical Data 85 6. Plant and Wastewater Characteristics 90 7. Design for Model Plant 109 c. Insulation Board 109 1. Chip Wash Water 111 2. Fiber Preparation l l l 3. Forming l 1 l
vi

SECTION
D.
4. Miscellaneous Operations 5. Wastewater Char.acteristics 6. Raw Waste .Loads 7. Toxic Pollutant Raw.Waste Loads Wet .Process Hardboard l. Chip Wash, Water 2. Fiber Preparation 3. Forming 4. Pressing , 5,. Miscellaneous Operations 6. Wastewater Ch.aracteristics 7. Raw Waste . Loads· .. 8.. Toxic Pollutant Raw Waste Loads
VI. SELJECTION OF POLLUTANT PARAMETERS.·
A .. Toxic Pollutants 1. Wood Preserving Segment 2. Wet Process Hardboard/Insulation
Board Segment B. Toxic Organic Compound~,
1 .. Pentachlorophenol 2. Phenol 3. 2-Chlorophenol 4. Trichlorophenol. 5. 2,4-Dimethylp,henol
. 6. 2,4,6-Trichlorophenol 7. Benzene · 8. Toluene 9. Benzo (a> pyrene
10. Chrysene. 11 .. Naphthalene . . 12. Polynuclear Aromatics (PNAs) 13. Ethylbenzene .14. Copper160. 15. Chromium . 16. Arsenic 17. Lead - . 18. Zinc 19.. Nickel
C. Conventional Pollutants 1. Biochemical Oxygen Demand (BOD) 2. Oil and Grease - · 3. Total Suspended Sol ids ( TSS) . 4. pH .
D. Nonconventional Pollutants, 1. ~hemical Oxygen Demand (COD)
VII. CONTROL AND TREATMENT TECHNOLOGY
A. General
vii
PAGE
112 113 114 123 127 127 128 128 129 129 130 134 137
145
145 145
147 147 147 148 15.0 151 153 154 155 156 156 157 158, 158 159
160 161 162 163 164 165 165 166 167 167 168. 168
171
171

SECTION PAGE
B. Wood Preserving 172 1. In-Plant Control Measures 172 2. End-of-l?ipe Treatment 176 3. In-Place Technology 193 4. Treated Effluent Characteristics 200 5. Wood Preserving Candidate Treatment
Technologies 239 C. Insulation Bc,ard anc;i Wet Process Hardboard 261
1. In-Plant Control Measures 261 2. End-of-Pipe Treatment 266 3. In-Place Techno4ogy and Treated Effluent
Data, Insulation Board 269 4. In-Place Technology and Treated Effluent
Data, Hardboard 276 5. Insulation Board Candidate treatment
Technologies 288 6. Wet Process Hardboard Candidate Treatment
Technologies 292 7. Pretreatment Technology 298
VIII. BEST PRACTICABLl~ CONTROL TECHNOLOGY .CURRENTLY AVAILABLE 299
A. General 299 B. Manufacturing Processes 299 C. Age and Size of Equip~ent and Facilities 300 D. Status of BPT Regulations 300
1. Wood Preserving Segment 300 2. Insulation Board/Wet Process Hardboard
Segment 301 E. Best Practicable Control Technology (BPT)
1. Wood Preserving Segment 2. Wet Process Hardboard/Insulation Board Segment
F. Regulated Pollutants 302 G. Methodology C>f BPT Development 302
1. Wood Preserving Segment 302 2. Insulati.on Board/Wet Process Hardboard Segment 302
H. BPT Limitations 309 1. Wood Preserving Segment 309 2. Insulation Board/Wet Process Hardboard
Segment , 310 I. Engineering J~spects of Control Technology
Application · 312 J. Treatment Variability Estimates 312 K. Cost and Effluent Reduction Benefits~-
Insulation Board/Wet Process Hardboard 314 L. Non-Water Quality Environmental Impact 314 M. Guidance to NPDES Permitting Personnel 315
Viii

SECTION
IX. BEST CONVENTIONAL POLLUTANT CONTROL TECHNOLOGY
x.
XI.
XII.
XIII.
XIV.
A. General B. Wood Preserving Segment C. Insulaton Board/Wet Process-Hardboard Segment D. Best Conventional Control Technology
1. Wood Preserving Segment 2. Insulation Board/Wet Process Hardboard
Segment · E. BCT Limitations F. Engineering Aspects of--Control. Technology
Application 1 ·
G. Treatment Variability Estimates ·H .. Cost and Effluent Reduction - Insulation
Board/Wet Process Hardboard I. Non-Water Quality Environmental Impact J. Guidanc~ to NPDES Permitting Personnel
BE:ST AVAILABLE TECHNOLOGY ECONOMICALLY ACHIEVABLE_
A. General 1. _ _wood Preserving Segment 2. Insulation Board/Wet Process Hardboard Segment 3. Barking Subcategory 4. Veneer Subcategory 5. Log Washing Subcategory
NE:W SOURCE PERFORMANCE STANDARDS
A. General 1. Wood Preserving - Boulton Subcategory 2. Wood Preserving-~ Steam Subcategory· 3. Insulation Board and Hardboard
Subcatego~ies
PRE:TREATMENT STANDARDS.
A. B.
C.
General Wood Preserving 1. Pretreatment Standards for Existing
Se>urces, PSES 2. Pretreatment Standards for New Sources,
PSNS Wet Process Hardboard/Insulation Board 1. Pretreatment Standards for New and E~isting
Sources
ACKNOWLEDGEMENTS
BIElLIOGRAPHY
ix
PAGE -_317.
317 317 318 318 318
319 320
321 322·
324 324 325
327
327 328. 330 330 33l 332
333
333. 333
·333
334
33·5
335 335
335
338 339
339
341
343.
$ECTI0N
xv. GLOSSARY OF TERMS AND ABBREVIATIONS ~
357
APPENDIX A Costs of Treatment and Control Systems 369
APPENDIX B-1 Toxic or Potentially Toxic Substances Named in Consent Decree · 391
APPENDIX B-2 List of Specific Toxic Pollutants 393
APPENDIX C Analytical Methods and Experimental Procedure 397
APPENDIX D Conversion Table 413
APPENDIX E Literature Discussion of Biologic,al Treatment,, 415
APPENDIX F Discussion of Potentially Applicable Technologies 431
APPENDIX G Statistical Methodology for Determining Performance Variability of Treatment Systems: 441
APPENDIX H 308 Survey 481
X

Section II
II-1
II-2
II-3
II-4
II-5
Section III
III-1
III-2
III-3
III-4
III-5
III-6
III-7
Section IV
IV-1
LIST.OF TABLES
W1:u::>d Preserving Plants in the United States by State and Type, 1978
Cionsumption of Principal Preservatives and Fire Retardants of Reporting Plants in the United States, 1978
Materials Treated in the United States by Product
Inventory of Insulation Board Plants Using Wood as a Raw Material
Inventory of Wet Process Hardboard Plants
Comparison of DCP Coverage with AWPA 387 Plant Population
Method of Ultimate Wastewater Disposal by Wood Preserving-Bou1ton Plants Responding to Data Collection Portfolio - -
Method of Ultimate Wastewater Disposal by Wood Preserving-Steaming Plants Responding to Data Collection Portfolio
Method of Ultimate Wastewater Disposal by Wood Preserving-Inorganic Salt Plants Responding to Data Collection Portfolio
Method of Ultimate Wastewater Disposal by Wood Preserving-Nonpressure Plants Responding to Data Collection Portfolio
Meithod of Ultimate Waste Disposal by Insulation Board Plants Responding to Data Collection Portfolio·
Met:hod of Ul ti_mafe. Waste Disposal by we·t Process Harpboard Plants
Size Distribution of Wood Preserving Plants by Subcategory
x,i
18
21
22
24
30
37
40
40
41
41
52
57

Section
V-1
V-2
V-3
V-4
V-5
V-6
V-7
V-8
V-9
v-10
V-11
v-12
V-13
V-14
V-15
V-16
V
Wastewater Volume Data for 14 Boulton Plants
Wastewater Volume Data for Eight Closed Steaming Plants
Wastewater Volume Data for 11 Plants Which Treat Significant Amounts of Dry Stock
Wastewater Volume Data for l 4 Open' Steaming Plants
Characteristics of Wood-Preserving Steaming Plants from which Wastewater Samples were Collected During 1975 Pretreatment Study, 1977 Verification Sampling Study, and 1978 Verification Sampling Study
Characteristics of Wood-Preserving Boulton Plants from which Wastewater Samples were Collected During 1975 Pretreatment Study, 1977 Verification Sampling Study, and 1978 Verification Sampling Study
Wood Preserving Traditional Parameter Data--Steam
Wood Preserving Traditional Parameter Data--Boulton
Wood Preserving VOA Data
Substances Analyzed for but Not Found in Volatile Organic Fractions During 1978 Verification Sampling
Wood Preserving Base Neutrals Data
Wood Preserving Base Neutrals Data
Substances Not Found in Base Neutral Fractions During 1977 and 1978 Verification Sampling
Wood Preserving Toxic Pollutant Ph~nols Data
Phenols Analyzed for but Not Found During 1978 Verification Sampling
Wood Preserving Metals Data--Plants Which Treat with Organic Preservatives Only
xi'f
86
87
88
89
92
94
95
96
97
9.9
99
100
l 01
102
103
104

V-17
V--18
V-19
V-20
V-21
V-22
V-23
V-24
V-25
V-26
V-27
V-28
V-29
V-30
V-31
V-32
V-33
Wood Preserving Metals Data--Plants Which Treat with Organic .Preservatives.Qnly
Wood Preserving Metals Data--Plants Which Treat with Both Organic and Inorganic Preservatives
Wood Preserving Metals Data--Plants Which Treat wi_th Both Organic and Inorganic Preservatives
Range of Pollutant Concentrations in Wastewater from a Plan.t Treating with CCA- _and FCAP""'.TypePreservatives and a Fire Retardant
Raw Waste Characteristics of Wood Preserving Model Plants
Insulation Board Mechanical Refining Raw Waste Characteristics (Annual Averages)
Insulation Board Thermo-Mechanical Refining and/or Hardboard ·Raw Waste Characteristics' (Annual Averages) _ ·
Insulation Board, Mechanical Refining Subcategory--Design Criteria
' ' - -
Insulation Board Thermo-Mechanical Subcategory--Design Criteria
Raw Waste' Conc"eritrations and Loadings for Insulation Board Plants--Total Phenols
-Raw Waste Concentrations and Loadings for Insulation.Board--Metals
Insulation Board, Raw Wastewater Toxic Pollutant Data, Organics
SlS Hardb~ard Raw Waste Characteristics (Annual -Averages)
S2S Hardboard Raw Waste Characteristics (Annual Averages)
Sl S Hardboard Subcategory--Design Cri ter·ia
S2S Hardboard Subcategory--Design Criteria
Raw Waste Concentrations and Loads for Hardboard Plants--Total Phenols
·xiii
105
106
107
108
110.
117
118
122
122
124
125
126
132
133
136
137
139

V-34
V-35
V-36
V-37
Section VI
VI-1
Section VII
VII-1
VII-2
VII-3
VII-4
VII-5
VII-6
VII-7
VII-8
VII-9
VII-10
Raw Waste Concentrations and Loadings for Hardboard Plants--Metals
Average Raw Waste Concentration and Loadings for Hardboard Plants--Metals
S1S Hardboard Subcategory, Raw Wastewater Toxic Pollutant Data, Organics
S2S Hardboard Subcategory, Raw Wastewater Toxic Pollutant Data, Organics
Toxic Chemical Information
Progressive Changes in Selected Characteristics of Water Recycled in Closed Steaming Operations
Annual Cost of Primary Oil-Water Separation System
Results of Laboratory Tests of Soil Irrigation Method of Wastewater Treatment
Reduction of COD and Phenol Content in Wastewater Treated by Soil Irrigation
Current Level of In-Place Technology, Boulton, No Dischargers
Current Level of In-Place Technology, Wood Preserving, Boulton, Indirect Dischargers
Current Level of In-Place Technology, Steam, No Dischargers
Current Level of In-Place Technology, Steam, Direct Discharger
Current Level of In-Place Technology, Wood-Preserving-Steam, Indirect Dischargers
Wood Preserving Treated Effluent Traditional Parameters Data for Plants with Less than the Equivalent of BPT Technology In-Place
xiv
140
142
143
143
146
175
179
191
192
194
195
196
198
199
202

VII-11 Wpod Pres_e,rving Treated Effluent Traditional J?arame.ters Data.· for Plants with Current Pretreatment Technology· In-Place 203
VII-12 AWPI Wood Preserving Treated Effluent Pentachlorophenol (PCP),Data for Plants With Current Pretreatment Technology In-Place. 204
VII-13 ·-wood Preserving Treated Effluent Traditional Parameter Data for Plants with Current BPT Technology In-Place · · · 205
VII-14 Sybst:ances Analyzed for but Not Found in Volatile Organic Analysis During 1978 Verification Sampling 206
VII-15 Wood Preserving Treated Effluent Volatile Organics Data for Plants with Cµrrent Pretreatment Technology ·In-Place 207
VII-16 Wood Preserving Treated -Effluent Volc1tile Organics Data for Plants with Current BPT Technology In-Place 208
VII-17 Substances Analyzed for but Not Found in Base Neutral Fractions During 1977 and 1978 Verification Sampling 209
VII-18 Wood Preserving Treated Effluent Base Neutrals Concentrations.for Plants with Current Pretreatment-Technology In-Place 210
VII-19 Wood Preserving ,Treated Effluent Base .Neutra .. ls -wasteloads for Plants with Current Pretreatment Tecpnology In-Place 211
VII-20 Wood Preserving Treated Effluent Base Neutrals Concentrations for Plaints with Current BPT
_Technology In-Place · 212
VII-21 Wood Preserving Treated Effluent Base Neutrals .. Waste Loads for Plants with Current BPT Technology In-Place 213
VII-22 Toxic Pollutant Phenols Analyzed for but Not Found · During 1978 Verification Sampling 214
VII-23 Wood Preserving Treated Effluent Toxi.c Pollutant · Phenols Data for Plants with Current Pretreatment
Technology In-Place 215
xv

VII-24
VII-25
VII-26
VII-27
VII-28
VII-29
VII-30
VII-31
VII-32
VII-33
VII-34
VII-35
VII-36
Wood Preserving Treated Effluent Toxic Pollutant Phenols Data f1:>r Plants with Current BP:r Technology In-Place
Wood Preserving Metals Data Organic Preservatives Only Treated Effluent for Plants wit~ Current Pretreatment Technology In-Place
Wood Preserving Metals Data Organic Preservatives Only Treated Effluent for Plants with Current Pretreatment Technology In-Place
Wood Preserving Metals Data Organic Preservatives Only Treated Effluent for Plants with Current BPT Technology In-Place
Wood Preserving Metals Data., Organic Preservatives Only Treated Effluent for Plants with Current BPT Technology In-Place
Wood Preserv.ing Metals Data, Organic and Inorganic Preservatives, Treated Effluent for Plants with Less than the l~qui valent of BPT Technology Treatment In-Place
Wood Preserving Metals Data, Organic and Inorganic Preservatives, Treated Effluent for Plants with the Equivalent of BPT Technology Treatment In-Place
Wood Preserving Metals Data Organic and Inorganic Preservatives Treated Effluent for Plants with Current Pretreatment Technology In-Place
Wood Preserving Metals Data, Organic and Inorganic Preservatives, Treated Effluent for Plants with Current Pretreatment Technology In-Place
Wood Preserving Metals Data, Organic and Inorganic Preservatives, Treated Effluent for Plants with Current BPT Technology In-Place
Wood Preserving Metals Data Organic, and Inorganic Preservatives Treated Effluent for ,Plants with Current BPT Technology In-Place
Wood Preserving Traditional Data Averages for Plants with Less than the Equivalent of BPT Technology In-Place
Wood Preserving Steam Traditional Data Averages for Plants with Current Pretreatment Technology In-Place
xvi
216
217
218
219
220
221
222
223
224
225
226
227
228

\
VII-37 ·wood Preserving Data for Plants with Current BPT Technology In~Place
VII-38 Wood Preserving Volatile Organic Analysis Data for Plapts with BPT Technology In-Place
VII-39
VII-40
VII-41.
VII-42
VII-43
VII-44
VII-45
VII-46
VII-47
VII-48
VII-49
VII-50
Wood.Preserving Base Neutrals Data Averages for Plants with·Current Pretreatment Technology in-Place "
Wood Preserving Base Neutrals Data Averages for Plants with Current BPT Technology In-Place
.wood Preserving Toxic Pollutant Phenols Data For Plants with Pretreatment Technoloy In-Place
Wood Preserving Toxic Pollutant Phenols Data for Plants with·BPT Technology In-Place
,... -,-.
Wood Preserving Metals Data, Organic Preservatives Only, Averages for Plants with Current Pretreatment Technology In-Place
Wood Preserving Metals Data, Organic Preservatives Only, Averages for Plants with Current BPT Technology In-Place
Wood Preserving Metals Data Organic and Inorganic Perservatives, Averages for Plants with Less than the Current BPT Technology In-Place
Wood Preserving Metals Data Organic and Inorganic Preservatives, Averages for Plants with Current Pretreatment Technology In-Place
·Wood Preserving Metals Data Organic and Inorganic Pi;eservatives, Averages for Plants with Current BPT Technology '.In-Place
Treated Effluent Loads in lb/1, 000 ·ft3 for Candid~t~ .Treatment Technologies {Direct Dischargers) ·
Treated Effluent Loads in lb/1,000 ft3 for Candidate Treatment Technologies-Wood Preserving, (Indirect Dischargers)
Insulation Board Mechanical Refining Treated E~fl~ent Character~stics (Annual Ayerage)
xvii
228
229
230
~31
232
233
234
235
236
237
238
249
257
270

VII-51
VII-52
VII-53
VII-54
VII-55
VII-56
VII-57
VII-58
VII-59
VII-60
VII-61
VII-62
Section VtII
VIII-.1
Section IX
Insulation Board Thermo-Mechanical Refining Treated Effluent Chatdcteristics,
Raw and Treated Effluent Loads and Percent Reduction for Total Phenols--Insulation Board
Raw and Treated Effluent Loadings and Percent Reduction for Insulation Bo~rd Metals
Insulation Board, Toxic Pollutant Data, Organics
SlS Hardboard Treated Effluent Characteristics (Annual Average}
S2S Hardboard Treated Effluent Characteristics (Annual Average}
Raw and Treated Effluent Loads and Percent Reduction for Total Phenols--Hard
Raw and Treated Effluent Loadings and Percent Reduction for Hardboard Metals
SlS Hardboard Subcategory, Toxic Pollutant Data, Organics
S2S Hardboard Subcategory, Toxic Pollutant Data, Organics
Treated Effluent Waste Loads for Candidate Treatment Technologies~-Insulation Board
Treated Effluent Waste Loads for Candidate Treatment Technologies--Hard
BPT Numerical Limitations
IX-1 BCT Numerical Limitationi
Section XII
272
274
275
276
278
281
284
285
286
287
292
298
313
323
XII-1 Summary of Available Data - Pentachlorophenol in POTW's 337
APPENDIX A
A-1 Cost Assumptions 370
xviii

A-2
A-3
A-4
. A-5
A-6
A-7
A-9
A-10
A-11
A-12
A-13
A-14
A-15
A-16
Wood Preserving--Boulton Sµbcategory Cost Summary for Model Plant N-1
Wo1:>d Preserving--Boul ton. Subcategory Cost Summary for Model Plant N-2
Wood Preserving--Steamihg Subcategory Cost Summary for Model Plant N-3
Wo1od Preserving--Steaming Subcategory · Cost Summary for Model ·Plant N-4
Insulation Board Mechanical Refining Subcategory Cost Summary for Modei Plant C-1
Insulation Board Mechanical Refining Subcategory Cost Summary for Model Plant C-2
Insulation Board Thermo-Mechanical Refining Subcategory Cost Summary for Model Plant C-1
Insulation Board Thermo-Mechanical Refining Subcategory Cost,Summary ·for Model Plant C-2
Wet.Process Hardboard SlS Subcategory Cost Summary for Model Pla.nt C-1
Wet Process Hardboard SlS Subcategory Cost Summary for Moqel Plant C-2
Wet Process Hardboard.S2S Subcategory Cost Summary for Model Plant C
Wood Preserving--Steam Subcategory Costs of .. Compliance for Individual Plants Direct Dischargers
Wood Preserving--Steam Subcategory Costs of Compliance for Individual Plants Indirect Dischargers
Wood Preserving--Boulton Subcategory Costs of Compliance for Individual Plants Indirect Dischargers
-Wet Process Hardboard-S1S Subcategory
Costs of Compliance for Individual Plants Dtrect Dischargers
xix
373
374
376
377
378
379
380
381
382
383
384
385
386
389 ,. '

A-17 Wet Process Hardboard-S2S Subcategory Costs of Compliance for .
APPENDIX C
c-1
C-2
C-3
C-4
c-s C-6
C-7
C-8
APPENDIX E
E-1
E-2
E-3
E-4
E-5
E-6
APPENDIX F
F-1
Individual Plants Direct Dischargers
Purgeable Vol~tile Toxic Pollutants
Parameters for Volatile Organic Analysis
Base Neutral Extractables
Acidic Extractables
Parameters fo1: Base Neutral Analysis
Parameters for Phenolic Analysis
GC/ECD Parameters for Pesticide and PCB Analysis
Pesticides and PCB's
Substrate Removal at Steady-State Conditions in Activated Sludge Containing Creosote Wastewater
Reduction in Pentachlorophenol and COD in Wastewater Treated in Activated Sludge Units
BOD, COD and Total Phenol Loading and Removal Rates for Pilot Trickling Filter Processing a Creosote Wastewater
Relationship Between BOD Loading and Treatability for Pilot Trickfing Filter Processing a Creosote Wastewater
Sizing of Trickling Filter for a Wood Preserving Plant
Average Monthly Total Phenol and BOD Concentrations in Effluent from Oxidation Pond
Summary of Arsenic Treatment Methods and Removals Achieved
xx
390
401
402
404
404
408
408
411
411
421
424
425
426
427
429
440

APPENDIX G
G-1
G-2
G-3
G-4
G-5
G-6
G-7
G-8
G-9
G-10
Number of Observations in Data Set, as Presented in 1979 Development Document
Non-Pa:r.cimetric Daily Variability Factors for Insulation Board and Hardboard Plants as Presented in 1979 Development document
Non-Parametric 30-Day Variability Factors for Insulation Board .and Hardboard Plants, as Presented in 1979 Development Document
'"' ... , Descriptive Statistics of Extended Data Base
Autocorrelattons
Daily 99th Percentile Estimates ind s·tandard Errors
Daily Variability Factors
99th Percentile Estimates for 30-Day Average Based on Arithmetic Mean
Thirty Day Variabi.lity Factors
Estimates of the Variances for the Random Effects Mod~l ..
xxi
464
465
466
467
468
469
470
471
472
473

LIST OF FIGURES
Section II Page
II-1 Geographical Distribution of Wood Preserving
II-2
II-3
II-4
II-5
Section
III-1
III-2
III-3
III-4
I!I-5
III-6
III-7
III-8
III-9
III
Section V
V-1
Section VII
VII-1
Plants in the United States
Geographical Distribution of Insulation Board Manufacturing Facilities in the United States
Total Board Production Figures: Insulation Board
Geographical Distributio.n of Hardboard Manufacturing Facilities in the United States
Total board Production Figures: Hardboard
Typical Treating Cycles Used for Treating Lumber, Poles, and Piles
Open Steaming Process Wood Treating Plant
Closed Steaming Process Wood Treating Plant
Modified Steaming Process Wood Treating Plant
Boulton Wood Treating Plant
Vapor Conditioning Process Wood T.reating Plant
Diagram of a Typical Insulation Board Process
Flow Diagram of a Typical Wet Process Hardboard Mill S1S Hardboard Production Line
Flow Diagram of a Typical Wet Process Hardboard Mill S2S Hardboard Produciton Line
Variation of BOD with Pre-Heating Pressure
Variation in Oil Content of Effluent with Time Before and Aftc~r Initiating·c1osed Steaming
xxif
20
25
26
28
29
42
43
45
46
47
48
53
64
65
116
173

VII-2
VII-3
VII-4
VII-5
VII-6
VII-7
VII-8
VII-9
VII-10
VII-11
VII-12
VII-13
VII-14
Variation in COD of Effluent with Time Befo~e and After·c1osed ,Steaming
Reiationship Between Weight of Activated Carbon Added and Removal :Of COD and Total Phenols from a Creosote Wastewater
Miechanical Draft Cooling .Tower Evaporation System.
Wi::,od Pres~rving-Steam,. (pirect Dischargers)--Model Plant A
Wood Preserving-Steam, .( Direct Dischargers)~-Model Plant B
Woocf Preserving~steam, (Direct Dischargers)--Model Plant C
Wood Preserving-Steam, (Direct Dischargers)--Model Plant D
Wood Preserving-Steam, (Direct Dischargers~Oily Wastewater with, .Fugitive Metals)--Model Plant E
Wood Preserving-Steam, (Direct Disclnargers-Oily Wastewater with Fugitive Metals)--Model Plant F ·
Wood Preserving-Steam, (Direct Dischargers-Oily Wastewater with Fugitive Metals)--Model Plant G
Wood Preserving-Steam, (Direct Dischargers-Oily Wastewater with Fugitive Metals )--Model Pl,cmt H
Wood Preserving-Steam, Boulton ( Indirect. Dischargers)--Model Plant I
Wqpd Preserving-Steam, Bqulton (Indirect Discha_t"gers)--Model Plant J
xxiii
174
. 189
241
242
243
244
245
246
248
252
253

VII-15
VII-16
VII-17
VII-18
VII-19
VII-20
VII-21
VII-22
VII-23
VII-24
VII-25
VII-26
VII-27
APPENDIX C
Wood Preserving-Steam, Boulton (Indirect Dischargers-Oily Wastewater with Fugitive Metals)--Model Plant K
Wood Preserving-Steam, Boulton (Indirect Dischargers-Oily Wastewater with Fugitive Metals)--Model Plant L
Wood Preserving-Steam, Boulton (Self Contained) (Indirect Dischargers - Oily Wastewater with Fugitive Metals)--Model Plant M
Wood Preserving-Boulton (Self Contained)-Model Plant N
Wood Preserving-Steam (Self Contained}-Model Plant N
Plant 929-Flow Vs. Effluent BOD
Insulation Board (Mechanical and ThermoMechanical Refining} (Direct Dicharge}-Model Plant A
Insulation Board (Mechanical and ThermoMechanical Refining} (Direct Discharge}-Model Plant B
Insulation Board (Mechanical and ThermoMechanical Refining} (Self Contained)-Model Plant C
Hardboard (SlS and S2S} (Direct Discharge}-Model Plant A
Hardboard (SlS} (Direct Discharge}-Model P;I.ant B
Hardboard (S2S} (Self Contained) --Model Plant C
Hardboard (SlS and S2S) (Self Contained} --Model Plant D
C-1 Reconstructed Total Ion Current Chromatogram for Purgeable Volatile Organics Standard
xxiv
254
255
256
259
260
262
289
290
291
294
295
296
297
403

C-2 " Reccmstructed Total Ion Current Chromatogram for BasE, Neutrals
C-3 Reccinstructed Total Ion Current Chromatogram for Pher1cilic Standard
C-4
c-s Flow Chart for Pesticides and PCB's
Pesticide Mixed Standard
APPENDIX E~
E-1 ·Determination of Reaction Rate Constant for a Crec,sote Wastewater
E-2 COP Removal from a Creosote Wastewater by Aera.ted Return Without Sludge Lagoon
E-3 Tota.I Phenols Content In Oxidation Pond Effluent Before and After Installation in June 1966 of Aerator
APPENDIX q
G-1 (BOD) Daily Effect Autocorrelation: Plant
G-2 (TSS) Daily Effect Autocorrelation: Plant
G-3 (~O.D1) I;)aily Effect Autocorrelation: Plant
G-4 (TSS} Daily Effect Autocorrelation: Plant
G-5 (BOD1 } Daily Effect Au tocorre.l.at ion.: Plant
G-6 (TSS) Daily Effect Autocorrelation: Plant
APPENDIX.H
H-1 308 Survey
XXV
537
537
93-1
931
980
980
406
407
409
412
422
423
428
474
475
476
477
478
479
481


SUMMARY AND CONCLUSIONS
Coverage
·sECTION I·
EXECUTIVE SUMMARY
The technical study of the timber products processing industry, the findings of which are presented in this document, is limited to the wood preserving, insulation board, and wet process hardboard portions of the industry.· New· regulations are promulgated for these portions. In.· addition, previously promulgated regulations for the hydraulic barking portion of the barking subcategory, the veneer subcategory, and the log washing subcategory were reconsidered. · ·
Wood Prese,rvinq
There are· more than 415 wood.preserving plants operated.by more than . 300 companies ,. in the United States.. . The plants are concentrated in two areasi the -Southeast from east Texas to Maryland and along the Northern Pacific coast. These areas correspond to the natural r~nges of the southern pine and Douglas· fir - western red ced~r, respectiyely.
Toxic pollutants in wast~waters from . plants that treat with organic preservatives are principally·.volatile 9rganic solvents such as· benzene and toluene, and the polynuclear aromatic components (PNAs} of creosote, including anthracene, pyrene and phenanthrem1e, that are contained· in the entrained oils: Both phenol and phenol derivatives have been identified in these wastewaters; pentachlorophenol (J?CP) is predominant when it is used as a .preservative. Heavy metals are· also found. The conventior!al pollutants found in the wastewaters include TSS, Oil and Greas;ei, and pH. COD is the only nonconventional pollutant that has been identified.
. -
The followi.ngtoxic pollutants were found in treated effluents at· two or more plants above the nominal· detection limit of ten micrograms; per 1 i ter, organics, and less . than 2 micrograms per liter, metals.
fluorantherae 3, 4-benzof: luoranthene benzo(k}fluoranthene pyrene benzo(a)pyrene indeno ( l , :;i ,. 3-cd) pyrene benzo(ghi}perylene naphthalene. acenaphthylene fluorene
1.
chrysene bis(2-ethylhexyl}phthalate
· phenol · ·pentachlorophenol arsenic copper chromium
. nickel zinc

The Agency is retaining the previously promulgated subcategorization scheme for the wood preserving segment except for the title of the Wood Preserving subcategory, which has been changed for descriptive purposes.
The Agency is withdrawing the existing best available technology economically achievable (BAT) regulation for the Wood Preserving-Steam subcategory because there is only one known direct discharging plant in the subcategory. The Agency does not believe it is necessary to develop national effluent limitations for this one plant.
The Agency is promulgating new source performance standards (NSPS) and pretreatment standards for new sources (PSNS) which prohibit discharge of process wastewater pollutants. Over eighty percent of all existing wood preserving plants have dem()nstrated that no discharge of process wastewater pollutants can be attained.
The Agency is not promulgating the proposed pretreatment standard for existing sources (PSES) that would have ~equired no discharge of pentachlorophenol (PCP). The no discharge PCP limitation was based on the application of evaporative technology. Instead, the Agency has decided to retain the existing PSES for the Wood Preserving-Boulton and-Steam subcategories that were promulgated in December 1976. This existing standard, based on gravity oil-water separation technology, requires a limitation of 100 mg/1 on Oil and G~ease, as well as limitations of 5 mg/1 for copper, 4 mg/1 for chromium, and 4 mg/1 for arsenic. This is being done out of economic and other considerations.
The Agency's decision tc> retain existing PSES for the .wood Preserving-Steam and -E3oulton subcategories will result in no pollution control costs above and beyond those imposed by the existing standard.
Insulation Board/Wet~~ Hardboard
There are 26 plants in the insulation board/wet process hardboard segment. Ten plants produce only _insulation board, 11 plants produce only wet process hardboard, and five plants produce both insulation board and wet process hardboard. Nine plants are located in the South, seven in the Midwest, six in the Pacific Northwest, three in the Mid-Atlantic region, and one in the Northeast.
The pollutants present in the process wastewater are mainly water soluble wood constituents high in BOD and TSS, the result of the leaching of wood constituents into the process water. Additives also contribute to the waste load. These may include wax emulsion, paraffin, starch, polyelectrolytes, aluminum sulfate, vegetable oils, ferric sulfate, and thermoplastic and thermosetting resins. Wastewater flows from discharging plants range from o.os to 4 MGD. Data obtained ~rom the sampling and
2

analysis program .conducted during·the BA'!' review ~tudy show that the only toxic pollutants present in raw or treated wastewaters from this segment are very low concentrations of heavy metals,. and the organics-benzene, toluene, and phenol. There. is no treatment . te!chnology, except perhaps a no discharge technology, currently available to further reduce the low cpncentrations of these pollutants; and none· of these pollutants are present at levels high enough to interfere .with.the operation of a POTw.·
The following toxic pollutants were found in treated effluents at two or more plants above the. nominal detection limit but below the limit of additional treitabiiity.
benzene! toluene! copper zinc.
phenol beryllium nickel
The Agency is. tjividing the existintj wet -process· hardboard subcategory of the industry into two parts, smooth-one-side and smooth-two-sd.des, SlS and S2S, respectively. Raw waste lo~ds generated by plants producing S2S hardboard were found to be significantly higher than those generated by SlS plants. Therefore, application of comparable treatment to these wastewaters will result in a different treated effluent level.
The Agency is promulgating for this subcategory best practicable control technology (BPT), and best conventional pollutant control technology (BCT) limits for BOD, TSS and pH. It is also promulgating new source performance standards (NSPS) which require no discharge of process· wastewater pollutants and pretreatment ·standards for new sources (PSNS), and pretreatment standards f:c>r existing sources ( PSES) which require that dischargers· meet the general pretreatment standar.ds of .40 CFR Part 4.03. . BAT · l imitations . are not being promulgated because toxic pollutants were identified at only trace levels in effluents from. this industry and.treatment of these pollutants is not economic,llly or technologically feasible.
- . The Agency is merging the insulation board subcategories into one subcategory~ BPT, BCT, NSPS, PSNS and PSES effluent limitation guidelines and standards are being promulgated for this· subcategory .. BAT limitations are not being promulgated. because toxic pollutants are present in only trace amounts in wastewaters generated by this industry and treatment of these pollutants is not economically or technologically feasible. The BPT- and BCT numerical limitations are differerit than those for wet process· hardboard bE~c:ause insulation board raw wastewaters are of lower strength and are more easily· treated-than wet process hardboard wastewaters. The Agency is promulgating PSNS and PS~S which reqtiire that dischargers meet the general pretreatment standards of 40 CFR Part 403 because the pollutants present in· insulation board wastewaters are compatible. with POTW. The Agency is promulgatin9 a NSPS which requires no discharge of pr-ocess
3

wastewater, based on the demonstrated feasibility of land application technology.
The cost of compliance for the hardboard subcategory to achieve the BPT level of control is estimated to be $9,556,000 capital, and $3,679,000 annual operating costs. A total of three plants might incur costs to achieve this level of.control.
For the BCT level of control, seven plants could incur a total of $20,345,000 capital and $6,296,000 operating costs.
No plants in the insulation board subcategory will incur costs to achieve the promulgated BPT and BCT limitations.
EFFLUENT STANDARDS
Wood Preserving
The Agency is not changing the best practicable control technology currently available (BPT) limitations previously promulgated for the wood preserving segment in 40 CFR Part 429, {subparts F, G, and H)* (39 FR 13942, April 18, 1974). That rulemaking established a no discharge of process wastewater pollutants limitation for subparts F and H, and established numerical limits on the discharge of COD, total phenols (as measured by Standard Methods), Oil and Grease, and pH for subpart G. -
The Agency is also retaining the previously promulgated best available technology economically achievable (BAT) limitations for subparts F and H, which established a no discharge of pro~ess wastewater pollutants l:imi tation. BAT for subpart G is being withdrawn because there is only one plant in this subcategory that is known to be discharging process wastewater.
The Agency is promulgating new source performance standards (NSPS) that require no discharge of process wastewater pollutants. The rationale for this decision is that more than 80 percent of existing wood preserving plants are achieving no discharge of prQcess wastewater ppllutants and that new sources can achieve this status without severe economic consequences.
The Agency proposed a PSES standard requiring no discharge of PCP in order to eliminate PCP from passing through POTW. The Agency
*Subpart F - Wood Preserving
Subpart G - Wood Preserving-Steam
Subpart H - Wood Preser,ring-Boul ton
4

decided not, to promulgate this proposed ·nu discharge of PCP standard because the cost of attaining this level of control was too high and for other ·reasons.
Instead, · it has decided · .to retain the previously promulgated pretreatment standards for existing sources (PSES) for subparts G and H~ which require a 100,mg/l limitation on Oil and Grease, a 5 mg/1 limitation on copper, and a ,1 mg/1 limitation on chromium and arsenic (41 FR 53930, Dec. 9, 1976). Control of Oil and Grease will controlpolynuclear aromatics and pentachlorophenol (PCP) to levels which insure minimal pass through of these· toxics through POTW.
The Agency is. retaining. PSES for subpartF which requir~.no discharge of process wastewater pollutants (40 CFR Part 429.164) ( 41.. FR 53935). It . is common practice for plants in this subcategory to recycle and reuse all process wastewater. The Agency is promulgating pretreatment . standards for new sour.ces (PSNS) that require no discharge . of process wastewater pollutants. This standard will pre.vent PCP, heavy metals and PNAs from ·passing through POTW. New source indirect.dischargers, unlike some of the existing sources,· are fully capable of meeting this no discharge requir.ement without,. severe economic consequences. ·· No · hindrance to the addition of new capacity. is expected.
Section 304(e) of the Act directs the Administrator· "to control · plant site runoff, spillage or. leaks, sludge or waste disposal
and drainage from raw material storage . . ." The technical/economic studies upon.which these regulations are based did not include a detailed studyof these.factors .. The Agency is
· conducting a. separate study of these aspects. (Best Management Practices, BMP) of pollution control to· be· ·addtesfsed · in future rulemaking.
Insulation Board/Wet Process Hardboard
BPT, BAT, NSPS and,PSNS ·for the wet prbcess hardboard subcategory were promulgated April 18, 1974 .. (39 FJf\1.3942). These regulations established numerical limits on BOD,, 'l'SS, and pH. PSES .for. the
· subcategory were promu 1 gated December . 9,. l 9 7 6 ( 4 l FR 5 3 9 3 O ) and required compliance with general.pret'reatment standards. BPT,
·BAT and NSPS for the wet process hardboard subcategory we1;e withdrawn by the Agency on September 27, 1977, because further information obtained indicated the need to revise the regulation.
BPT, BAT, NSPS and PSNS for the insulation board subcategory were proposed August 26, 1974 (39 FR 30892) but were never promulgated. Numerical limits on BOD,.TSS and pH were proposed and the PSNS required compliance with .general pretreatment standards. The PSES for the subcategory was promulgated on December 9, 1976, and requires compliance with· the general pretreatment standards.
5

The Agency has changed the subcategorization scheme in the present round of rulemaking. In the insulation board subcategory, although the waste loads from the two pulp preparation processes ar,e slightly different, there is only one "mechanical refining" plant which is a direct discharger, and this plant has a raw waste load equivalent to the .average thermomechanical refining plant. Therefore, these two subcategories have been combined into one, "Insulation Board." Secondly, the Agency found that plants which produce S2S hardboard exhibit significantly greater raw waste lo~ds than do S1S hardboard plants because S2S hardboard manufacture requires more cooking and refining of the wood chips. For thi.s reason, the Agency divided the w,et process hardboard subcategory into two parts~ SlS Hardboard and S2S Hardboard.
Because BPT had been withdrawn in the wet process hardboard subcategory and never promulgated in the insulation board subcategory, it was necessary to designate a BPT treatment level in this round of rulemaking, as a minimum level of control applicable to all direct dischargers. BPT is also used as a baseline against which to compare the costs of achieving the BCT level of control.
The wet process hardboard subcategory has two parts, smooth-one-side (S1S) ~nd smooth-two-sides (S2S). For the S1S part, BPT is based on the performance of a plant producing only S1S hardboard. In the S2S part, EPA has promulgated a limit which can be achieved if the treatment used at the S1S BPT plant is applied to the higher raw waste load at the S2S plant. This approach was elected because the sole plant producing only S2S hardboard demonstrates a performance well above that usually associated with BPT in terms of percent removal of BOD and TSS. Therefore, it is deemed an appropriate plant for BCT, but not BPT. In the absence of· an appropriate model plant for BPT, this approach is the most rational; furthermore 7 out of 14 direct dischargers are already meeting the limit.
In the insulation BPT numerical limits on the performance producing insulation
board subcategory the Agency has promulgated on '.BOD, TSS and pH. These 1 imi ts are based of one of the two direct discharging plants
board only.
To set BCT limits for the S1S and S2S parts of the wet process hardboard subcategory, the Agency identified only one.treatment and control option technically and economically feasible for providing pollutant removal beyond that required by BPT limitations. This option is to provide additional detention time, aeration and settling capacity. The characteristics of the upgraded biological systems are based on docum.ented performance of existing systems treating S1S hardboard wastewaters and S2S hardboard wastewaters. Although there are five plants producing hardboard that are currently achieving no discharge of process wastewater, the Agency did not select a no discharge of process
6

wastewater option for BCT because this level. of control would· fail the "cost reasonableness" test.
-,
BCT for the insulation board subcategory was proposed as the same limits as .. BPT because no existir:ig plant demonstrated an intermediate:; upgraded treatment level. The next step for: this subcategory would be no discharge of all process wastewater, and this require·ment would not pass the "cost-reasonableness" test.
·-The promulgated effluent limitations contain several. changes from the proposed BPT and BCT limits for both the wet process hardboard and insulation board subcategories. In developing the final rule, the Agency collected a year's worth or more. of additional data on treatment system performance, and revised its statistical methodology in order to account for both seasonality and autocorrelation of· the data. The Agency re-analyzed,all the data using the improved methodology, with the result that the daily limits became slightly more restrictive, and the 30-day limits became slightly more lenient .
... The Agency did not propose BAT limits. for the insulation board/wet process hardboard segment because review of the. information availal;>le to the Agency indicated that such toxic pollutants as do occur in the segment are present in such low, concentration levels that they cannot be effectively reduced. by any of the technologies known to EPA, except a no discharge technology which is not considered to be technologically or economically fea.sible for many existing plants.
New source performance standards for both wet process hardboard and insulation board were proposed as no discharge of process wastewater pollutants. Five of the existing twenty7"six plants in the two subcategori~s are achieving no discharge of process wastewater. The Agency believes that new sources,. which have more flexibility to plan as necessary to achieve no discharge, are capable of meeting the standard. A no discharge limitation can be achieved by a number of methods, including recycle and reuse of treated wastewater, spray irrigation of treated· process wastewater and in-plant controls designed to minimize the wastewater generated.
In establishing pretreatment ·. standards for both new and existing facilities, the Agency recognized that process wastewaters generated by the insulation board/wet process hardbQard segment of the industry do not contain toxic pollutants at treatable levels. Conventional pollutants present in these wastewaters, primarily BOD and TSS, are treatable by a POTW .. Because of these facts, the Agency is promulgating pretreatment standards for new and existing sources in the insulation. board/wet process hardboard segment that do not establish numerical limitations on the introduction of process wastewater to a POTW.
Section 304(e) of the Act directs the Administrator "to control plant site runoff, spillage or leaks, sludge or waste disposal
7

and drainage from raw material storage . . " The technical/economic study upon which these regulations are based did not include a detailed study of these factors. The Agency is conducting a separate study of these aspects. {Best Management Practices, BMP) of pollution control to be addressed in fµture rulemaking.
8

PURPOSE· AND •}1UTHQRITY
SECTION JI
INTRODUCTION
The regulatie>ns described in this notice are promulgated under authority c•f sections 301, 304, 306, 307, and 501 of the Clean Water Act (the Federal Water Pollution Control Act Amendments of 1972, 33 USC 1251 et seq., .as amended by the Clean Water Act of 1977, P. L. 95-217) ( the "Act") . These regulations · are also . promulgated in response to·the Settlement Agreement in Natural Resources Defense Council, Inc. v. Train, 8 ERC 2120 (D.D.C. 1976), modified March 9, 1979.
The Federal Water Pollution. Control Act Am·endmen'ts of 1972. established a comprehensive program to "restore and maintain the chemical, physical,. and biological integrity of the Nation's waters." (section lOl(a))·~· By July 1, 1977, existing industrial dischargers were required to achieve "effluent limitations requiring the application of· the best practicable control technology currently available" ( ''BPT") ·. (section 30lfb) ( l) (A)); and by July 1; 1983, these dischargers were required to achieve "effluent limitations requiring the application of the best available tE!Chnology economically achievable (BAT)· which will result in rE!atsonable further progress . toward the national goal of eliminating• the discharge of all pollutants" (section 30l(b)(2)(A)). New industrial direct discharges were required to comply with section 306, new source performance standards ("NSPS"), based on best avaiJ..able demonstrated technology (BADT}; and new and existing dischargers to publicly owned treatment works("POTW") were subject to pretreatment standards under sections 307(b) and (c) of. the Act .. While the requirements for direct ·dischargers were to be incorporated into National Pollutant· Discharge Elimination System (NPDES) permits·issued under sectio1n 402 of the Act, pretreatment standards were to be enforceable directly against dischargers to POTW (indirect dischargers).
Al though section 402 ( a) ( l ) of the 1972 Act~ aµtllorized t.b.e. selting . of requirements for direct dischargers on a case-by-case basis, Congress int.ended. that, for the most part, control requirements would be based on regulations promulgated by the Administrator of EPA~ Sectio1n 304 ( b) of the Act required the · Administrator to · promulgate regulations providing guidelines for effluent limitations setting forth the degree of effluent reduction attainable through the application of BPT and BAT. Moreover, sections 304(c) and 306 of the Act requireq promulgationof NSPS, and sections. 304(f), 307(b), and 307(c) requ'is_ed promulgation of· pretreatment standards. In addition to these regulations for designated industry categories, section 307(a) of the Act required the Administrator. to promulgate effluent standards applicable·to all dischargers of toxic pollutants. Finally, section SOl(a) of the AGt au.thorized the Administrator to
9

prescribe any additional regulations "necessary to carry out his functions" under the Act.
The EPA was unable to promulgate many of· these guidelines and standards by the 'dates contained in the Act. In 1976, EPA was sued by several environmental groups and in settlement of this lawsuit, EPA and the ,plaintiffs executed a "Settlement Agreement,"· which was approved by the Court. This Agreement required EPA to develop a program and adhere to a schedule for promulgation for 21 major industries BAT effluent limitations guidelines, pretreatm~nt standards and new. source performance standards for 65 "toxic" pollutants and classes of pollutants. See Natural Resources Def™ Council, Inc. v. Train, 8 ERC 2120 (D.D.C. 1976), modified March 9, 1979.
On December 27, 1977, the President signed into law the Clean ·Water Act of 1977. Although this law makes several important changes in the Federal water pollution control program, its most significant feature is its incorporation of many of the basic elements of the Settlement Agreement program.for toxic pollutant control. Sections 30l{b){2){A) and 30l{b){2){C) of the Act now require the achievement by July 1, 1984, of effluent limitations requiring application of BAT for toxic pollutants, including the 65 "toxic" pollutants and classes of pollutants which Congress declared "toxic" under section 307{a) of the Act. Likewise, EPA's programs for new ·source performance standards and pretreatment standards are now aimed principally at toxic pollutant control. Moreover, to strengthen the toxics control program, section 304{e) of the Act authorizes the Administrator to prescribe "best management practices" {"BMPs") to prevent the release of toxic and hazardous pollutants from plant site runoff, spillage or leaks, sludge or waste disposal, and drainage from raw material storage associated with, or ancillary. to, the manufacturing or treatment process.
In keeping with its emphasis on toxic pollutants, the Clean Water Act of 1977 also revises the control program for nontoxic pollutants. Instead of BAT for "conventional" pollutants identified under Section 304{a){4), {including biochemical oxygen demand, suspended solids, fecal coliform, Oil and Grease and pH), the new Section 30l{b){2}{E) requires achievement by July 1, 1984 of 11 effluent limitations requiring the application of the best conventional pollutant control technology" {"BCT"). The factors considered in assessing BCT for an industry include the costs and benefits of attaining a reduction in effluents, compared to the costs and effluent reduction benefits from the discharge of a publicly owned treatment .works {Section 304{b)(4){B)). For nontoxic, nonconventional pollutants, sections 30l{b}(2)(A) and 301(b)(2)(F} require achievement of BAT effluent limitations within three years after their establishment, or July 1, 1984, whichever is later, but not later than July 1, 1987.
10

PRIOR EPA REGULATIONS
~ Practicable Control .Technology ·currently_Available , , _..., I a,. , 1- 1.,• , 'it'• ~ , ',1 ' · ' '. '. ,,.,• . -'," •. - .~ ..., .'. ... _.,. . t
~ Preservil!,!l Segment -- EPA has divided the wood preserving segment of the timber industry into three groups of plants; plants that treat wood· with wat~~l:)orne . preservatives, or inorganic salts, plants that use steam conditioning to prepare wood for preservative impregnation, and.· plants· that. use· the Boulton process to prepare wood. for.preservative impregnation. Those portion~ 9f th.e .. tndµ~~ry preserving. with inorganics, and using the Boulton .pro.cess are required to meet a BAT limitation of ·no discharge of process-wastewater. pollutants· promulgated .in 1974. . .,
The following BPT effluent limitations·were promulgated on April 18, .1974 for the w9oc.i preserving segment of the timber products industry: · · ·
Wood Preserving-Waterborne. or Nonpressure Subcategory (formerly Wood Preserving· Subcategory) . No discharge of process wastewater pollutants.
Wood Preserving-Steam Subcategory
Effluent Characte.ri'stic::
COD Total Phenols Oil and Grease pH
COD Total.Phenols Oil and Grease pH
Wood Preserving-Boulton wastewater pollutants.
BPT Effluent Limitations ·Maximum for any l day
Average of.daily values· for.JO consecutive days shall not exceed
.t-t~titc units (kilograms per 1,000 m3
of product)
1, l 00 . 2.18
24.0 Within tbe range 6.0 to
550. 0.65
12 .·o 9.0
English units (pounds per 1,000 ft 3
of product)·
68.5· 0.14
· ·wi thh; 5 the
Subcategory
11
34.5 . o. 04 0.75
range .6.0 to 9.0
No discharge of process

Insulation Board -- On August 26, 1974, effluent guidelines and standards were proposed for the direct discharging portion of the insulation board manufacturing subcategory. These proposed regulations were never promulgated. Promulgation was delayed because review of the proposed regulation indicated that additional information was needed.
Wet Process promulgated subcategory.
Hardboard On April 18,· 1974, the Agency BPT limitations for the wet process hardboard
Following promulgation of wet process hardboard regulations on April 18, 1974, the industry and the Agency held a series of meetings to review the information in the Record supporting these regulations. This review convinced the Agency that the existing regulations should be withdrawn. On September 28, 1977, a notice was published in the Federal Register announcing the withdrawal of 40 CFR Part 429 Subpart E-Hardboard Wet Process, best practicable control technology limitations (BPT), best available technology limitations (BAT), and new source performance standards (NSPS).
Best Available Technology Economically Achievable
Wood Preserving Segment The following BAT effluent limitations were promulgated on April 18, 1974 for the wood preserving segment of the timber products industry:
Wood Preserving-Waterborne or Nonpressure ,.Subcategory No discharge of process wastewater pollutants.
12

Wood Preserving-Steam S~bcategory
Effluent Characteristi.c
COD Total Phenols Oil and Grease pH
COD Total Phenols Oil and Grease pH
BAT Effluent Limitations Maximum for any· 1 aay
Aver~ge of daily values for 30 consecutive days shall not exceed
~etric units (kilograms per 1,000 m3
of product}
220 0.21 6.9
. Within the
1 1 0 0.064 3.4
range 6~o to 9.0
Englis~ unfts (pounds per 1,00b fti .. of product)
13 •. 7 0.014 0.42 .
Within the range 6.0 to 9.0
6.9 0.004. 0 ~ 21 ·
Wood Preserving-,Boulton Subcategory -- No discharge of process wastewater pollutants.
Insulation Board/Wet Process Hardboard Segment Following promulgation of wet process hardboard.regulations .on April 18, 1974, the industry and the Agency held a series of meetings to review the infc:>rmatic>n in the . Record supporting these regulations·. This review convinced the Agency. that. the existing regulations should be withdrawn. On September 28, 1977, a notice was published in the Federal Register announcing the withdrawal of 40 CFR Part 429 Subpart E-Hardboard Wet Process, best practicable control technology limitations {BPT), best available technology limitations (BAT), and new source performance standards (NSPS).
Barking -- Effluent guidelines and. standards fQr the Barking subcategory were promulgated in 1974 (39 ffi 13942 April 18,· 1974). The 1974 rulemaking,divided.the Barking subcategory into two parts: mechanical barking, a basically dry operation using physical me·thods, such as bl~des or. abrasive discs, to remove the bark as one technique of bark removal; the second· technique is identified as hydraulic barking, i.e., using water applied to the wood-under high pressure to separate the bark from the wood.
The 1974 BAT regulations required mechanical barking operations. and hydraulic barking operations to meet an effluent limitation requiring nc• discharge of process wastewater pollutants by 1983. ·.

Veneer BPT regulations for this subcategory promulgated in 1974, required no discharge of process wastewater pollutants for all veneer manufacturing plants, except those plants that use direct steam for conditioning of veneer logs. This exception was designed to give plants using direct steam conditioning time to modify their operations before being required tic meet the 1983 BAT limitation, requiring no discharge of process wastewater pollutants.
Log Washing -- BPT for this subcategory allows the discharge·of process wastewater pollutants. BAT regulations published in 1974 for this subcategory requires no discharge of process wastewater pollutants.
New Source Performance ~tandards
The following NSPS were promulgated on April 18, 1974.
Wood Preserving Segmen~ -- Wood Preserving Subcategory (now Wood Preserving-Waterborne or Nonpressure) -- No discharge of process wastewater pollutants.
Wood Preserving Steam Subcategory
Effluent Characteristic
COD Total Phenols Oil and Grease pH
COD Total Phenols Oil and Grease pH
NSPS Effluent Limitations Maximum for any l day
Average of daily values for 30 consecutive days shall not exceed
Metric units (kilograms per 1,000 m3
of product)
220 0.21 6.9
Within the
110 0.064 3.4
range 6.0 to 9.0
English units (pounds per 1,000 ft 3
of product) ·
13.7 0,014 0.42
Within the range 6.0 to 9.0
6.9 0.004 0. 21 ·
Wood Preserving-Boulton Subcategory -- No discharge of process wastewater pollutants.
Pretreatment Standards,~ and Existing
The following pretreatment standards for new sources were promulgated April 18, 1974.
14

Wood Preser~ing Subcategory Wastewater may 'be discharged, subject to general pre~reatment .requirements.
~ Pres~rving _ Steam Subcategory Wastewater may be discharged, subject to general pretreatment requirements.
Wood Prese!;:ving-Boulton Subcategory Wastewater may be dis·charged, subject to general pretreatment requirements.
Hardboard-Wet Process (PSNS) Wastewater may be discharged, subject to general pretreatment requriements.
The following pretreatment standards were existing sources December 9, 1976.
promulgated for
Wood Preserying Subcategory·-- No discharge· of process wastewater pollutants.
15

~ Preserving-Boulton ~nd Steam Subcategories
Pretreatment Standard
Pollutant or Pollutant Property.
Oil and Grease Copper Chromium Arsenic
Maximum for any one day (milligrams per liter)
100 5 4 4
Maximum for any one day (grams per cubic meter production)
20.5 0.62 0.41 0.41
Hardboard-Wet Process -- Wastewater may be discharged subject to general pretreatment requirements.
OVERVIEW OF THE INDUSTRY
Standard Industrial Classifications
The Standard Industrial Classification list was developed .by the United States Department of Commerce and is oriented toward the collection of economic data related to gross production, sales, and unit costs. The list is useful in that it divides American industry into discrete product-related segments.
The SIC codes investigated during the study of the Timber Products Processing industry (timber industry) are:
SIC SIC SIC SIC SIC SIC SIC SIC SIC SIC SIC
SIC
2411 2421 2426 2429 2431 2434 2435 2436 2439 2491 2499
2661
Logging Camps and Logging.Contractors Sawmills and Planing Mills Hardwood Dimension and Flooring Mills Special Product Sawmills Millwork Wood Kitchen Cabinets Hardwood Veneer and Plywood Softwood Veneer and P~ywood Structural Wood Members Wood Preserving Timber Products not eh;ewhere classified
(Hardboard) Building Paper and Building Board Mills
(Insulation Board)
The industry segments addressed. in this document· are wood preserving (SIC 2491), insulation board production (SIC 2661), and wet process hardboard production (SIC 2499).
16

~ Preservj119.
The American Wood Preserver's Association has. iden'tif ied approximately 476 wood preserving.plants in the United. States , (AWPA, 1978). AWPA sent quest-ionnaires to. these plants and responses were received from 326· plants. According to the response, there are 243 companies. which manage these 326 plants .. Approximately 70 percent . of the. plants . are.. concentrated;. in·. two. distinct regions. One area extends from east Texas to Maryland. and correspcinds ro1,1ghly to the natural range of the . So.uthern
. pines, the., major species utilize.d. The· second,. smaller area is located alorng the Pacific Coast, where Douglas fir and western red cedar are the. pre.dominant.. species. . The. distribution of .. · plants by type and locati·on is given in· Table 11--1, · arid/ depicted · in Figure II~l. ·
The major · types of. preservatives used in wood pres.erving are creosote, pentachlorophenol (PCP), and . various formulations of water-soluble inorganic chemicals, the most common of which are th~ salts of. copper, chromium,. and arsenic. Fire retardants. are formulations of salts, the· principal ones be.ing borates, phosphates, and ammonium compounds. Eighty percent of the piants ·in the Uni te,d States use at least · two of the three types of preservatives. _. · ·
Consumption· data for the principal preservatives for the year. 1978 are given.in Table II-2. Creosote· and· creosote.· solutions were used to treat approximately 56 per.cent. of the total industry production .. in ___ J 978. _ PCP was . the . preservative · used·. for approximately 25 percent ·of the 1978 production. About 19 percerit of the 1978 production was treated with waterborne· inorganic sal:t.s .... · Table JI-3 presents a summary. of.·.the materials treated, by product, for all preservatives ·during the· two-year period of 1977 and 1978. ·
Insulation ~gard
Insulation board is a. form of fiberboard, which· is. a broad generic term applied to sheet materials constructed from ligno-cellulosic fibe~s. Insulati.on board is a "noncompressed" fiberboard, which is differentiated from "compressed" .. fiberboards, such as hardboard, on the basis of density. Densities of insulation board range from about 0.15 to .a maximum· 0.50 g/cu cm (9.5 to 31 lb/cu ft).
,. ·-The principa.l types of insulation board are:
1. Building board--A general purpose product.for interior construction. •
2. In~ulating roof deck--A three-in-one component which provides. roof deck-, insulat·ion,, and finished . inside ceiling.· (Insulation.board sheets are laminated together with waterproof adhesi v.es, with a vapor. barrier in between .the sheets. ) ~
· ·17

Table II-1. Wood Preserving Plants in the United States by State and Type, 1978.
Pressure Non- and Non- Total Number
Pref?sure Pressure Pressure Plants
Northeast
Delaware 0 0 0 0 Maine 0 0 0 0 Maryland 4 0 1 5 Massachusetts ·2 0 0 2 New Hampshire 0 0 1 1 New Jersey 3 0 0 3 New York 5 0 0 5 Pennsylvania 7 0 2 9 Rhode Island 0 0 0 0 West Virginia 3 0 0 3
Total 24 0 4 28
North Central
Illinois 7 1 0 8 Indiana 5 0 0 5 Iowa 0 0 0 0 Kentucky 5 0 0 5 Michigan 4 0 0 4 Minnesota 5 0 2 7 Missouri 8 0 i 9 Nebraska 1 o· 0 1 North Dakota 0 0 Q 0 Ohio 7 0 0 7 Wisconsin 9 1 2 12
Total 51 2 5 58
Southeast
Florida 16 1 4 21 Georgia Q6 0 1 27 North Carolina 10 0 4 14 South Carolina 8 0 2 10 Virginia 15 0 1 16 Puerto Rico 1 0 0 1
Total 76 1 12 89
r
18

Table II-1. Wood Preserving Plants in the United State.a,. by State and Typ.e, 1978 .. (C.ontinued~~, Page 2 of 2)
- -~· ... ' ,,- ,- .. _Pressure Non- and Non..;. Total Number
·-
Pre_ssure,· Pressure Pressure Plants
South Central
Alabama 18: · - 0 3 21 Arkansas 10 · o· : 1 11: Louisiana 15. 1 1 17. MississipJP:l 16 _o . 1 17 Oklahoma 3 0 1 4 Tennessee ·2 1 0 3 Texas 20: 0 2 2_2
Total 84 2 9 95
Rocky Mountain
· Arizona 0 1 0 1 Colorado 3 0 () 3 Idaho 4 1 2 7 Montana. 3 1 2 6-New Mexico -i 0 0 1 South Dakota, 1 0 0 1 Utah 1 1 0 2 Wyoming 3 0 0 3
Total 16 4 4 24
Pacific
California 6 0 2 8 Hawaii 2 0 0 2 Oregon 7 0 2 9· Washington 9 2 2 13
Total 24 •.. 2 6 32-
United States Total 275 11 ' 40 326
Source: AWPA, 1978~
19
:_':.. ! •
-..

N 0
I"
GEOGRAPHICAL DISTRIBUTION OF WOOD PRES,ERVING PLANTS. IN THE UNITED STATES
MONT I •
• ·~ WYO
5 -,. • .. - -
CAI Ir'- I ·~,, - I
COLO
•
• N MEX.
WOOD PRESERVING PLANTS IN THE UNITED STATES 1971
I lilf()IITH(AST A[(i,IOlf
i "()R1'N (['tf .. ALA(Gl<»f
l SOUTH,[ASJ R(GION
4 SOl,JH CU1TRAL R[Gt()Jr(
~· IIO{'n IIOU"TAdf ltlGIO'f
6 N(1F1Cll(GIOII
1 YP[ or PLA~T
8 Pfl[SSUII[
A lrfOk• ,11cSSUJI[
• Plt[SSUlt[ AkO HOfril•Plt[SSUlt[
I
•
I •
• NOAK \ •
Ml~N
I • .. S. OAK
NEBR .
I MO KANS.
I i ... .. • • • -
l OKLA.
• •
TEX.
Figure 11-1

Table II·:--:?. Consumption of Principal Preservatives and Fire Retardants · of Reporting Plants in the United States, 1978
Material.
Creosote
Creosote-Coal Tar
Creosote-· Petroleum
Total· Creosote
Total Petroleum
Total Coal Tar
Pentachlorophenol
Chromated Zinc Chloride
CCA
ACC
FCAP
Fire Retardants
Other Preservative Solids
(Units)
Miil:ion Liters
Million Liters
Million· Liters
Mill ion Liters
Million Liters
Million
Mill ion Kilograms .
Million Kilograms
Million Kilograms.
Million. Kilograms
Million Kilograms
Million Kilograms
Million Kilograms
NOTE: Data based on information supplied by 326 plants.
SOURCE: AWPA," 197 8. ,.
21
Year 1978
129
251
114
340
225
13. 2
0.2
11. 3
0.3
0.1
7.9
0.9

Table II-3. Materials Treated in the United StatesJ3,y Product
Material
Cross-ties
Switch-ties
Piling
Poles
Cross-arms
Lumber & timbers
Fence posts
Other
Total
NOTE: Components may not add due to rounding.
SOURCE: AWPA, 1978.
-,··
•
22
Thousand Cubic Meters Year
1977 1978
2,648 2,656
196 177
321 276
1,503 1, 759
38.1 31.9
1,748 2,432
304 315
329 3~1
7,087 8,027

3. Rg,of· 'insulat°ton--Insulatio~ ·board designed for flat roof decks.·
4 . Ce i 1 ing ti 1 e-- I nsu1 a,t ior1,,, board . embossed and decorated for interior use. :t:J., is· -~Jso useful for acoustical qu.alittes ~ . . •', a • ' •
. 5. L~y-tn·panels--A ceiling tile ui:;ed for suspended cieil ings·.
6. S1'.!_eathing·--1nsulation board. used extensively. in construction because of its insulative, bracing strength and noise control qualities. · ·
7. Sc2_und-deadening insulation board--A special product di:!:signed explicitly for use in buildings to control noise level. · ·
The American Society for Testing and Materials (ASTM) sets standard spi:!cif ications for the types of insulation board. Decorative type board products, such as ceiling tiles,. lay_-inpanels, etc:.,, receive a higher degree of finishing than do structural type boards such as .sheathing and builditig board. Consequently, stricter control during fiber preparation and ,,. formation if; required in production of decorative-type board to insure .that. the product can be ironed, edge fabricated, sanded,
· ·.'._q.,oated, and painted, resulting. in a smooth, beveled, finished .sP;facef:, .DE~corati ve board products cannot contain. high amounts of 'dissolved solids in the production process for this reason. This factc>r will· be significant in later discussions of wastewater rE~cycle.
There are 15 insulation board producing plants in the United States usin9 wood as the predominant raw material with a combined: production capacity of. over. 330· million square meters (3,600 million square feet) on a 13--mm (one-half· inch) basis.·· All of the plants use wood as a raw material for some or all of their production. Four plants use mineral wool, a nonwood based product, as, a raw material for part of their insulation. board production~ Production of mineral wool board is. classified under SIC 3296 and is not within the scope of th.is rulemaking. Five plants produce hardboard products as well as insulation board at the same facility. A list' of the 15 plants which produce insulation boa~d.using wood as raw material is presented in Table 11-4. The geographical distribution of these plants is depicted in Figure 11~2. ·,
Production o,f insulation board in the U.S. between 1 968 and . '1978 rs presented in Figure lI-3.
23

Table II-4. Raw Material
Inventory of Insulation Board Plants Using Wood as
Armstrong Cork Company Macon, Georgia
Boise Cascade Corporation International Falls, Minnesota
The Celotex Corporation Dubuque, Iowa
The Celotex Corporation L'anse, Michigan
The Celotex Corporation Sunbury, Pennsylvania
Owens Corning Meridian, Mississippi
Huebert Fiberboard, Inc Boonville, Missouri
Weyerhaeuser Company Graig, Oklahoma
Owens Corning st. Helens, Oregon
National Gypsum Company Mobile, Alabama
Georgia-Pacific Jarratt, Virginia
.. Temple+-Eastex Diboll~ Texas.
Unite~ States Gypsum Company Lisbon Falls,. Maine
United States Gypsum Company Greenville, Mississippi
United States Gypsum Company Pilot Rock, Oregon
Source: 1980 Directory of the Forest Products Industry.
24

N ~ (J1 I
GEOGRAPHICAL DISTRIBUTION OF INSULATION BOARD MANUFACTURING FACILITIES IN THE UNITED STATES
MONT.
WYO.
---r--t__
COLO.
N.MEX.
LEGEND
0 Mechanical Pulping
e Thermo-mechanical Pulping
A Thermo-mechanical Pulping and/or Hardboard
I ··--\ MINN.
S.DAK.
I
I NEBR.
KANS.
'OKLA. ARK.
Flnum·11.~

10
• 9 • (\I .._ .,..
fa: 8
z 7 0 -...
..J l.i5 6
! i 5
z 4 0 s 3 ::,
I 2
1
TOTAL BOARD PROIDUCTION· FIGURES: INSULAllON BOARD
• •
1968 69 70 71 72 73 74 75 . 76 77 78
TIME (YEARS)
26 Figure 11·3

!.!i Process ~ardboard
· Hardboard is a !'compressed" 'fiberboard·, with . ~ density greater than O. 50 g/cu cm ( greater than 31 lb/cu ft)·. The thickn.ess of hardboar.d proc;lucts ranges· between 2 to ,13 mm . ( nominal 1 /1 2 to 7/16 in).
Production. ·of·· .. ·hardboard - by the wet Pt:ocess method is usually accomplished .. by thermc::,mechanii::~l fiberization · 9f .the ... ,wood raw material-. Dilu.tlon,. of . .the'..:.,wood· 'fiber with ·water-· ls followed by forming _of ~ we_t _mat· of a desired thickness ·on. a forming· machine. This wet m~1:_: is then pressed either wet or. dried · and . pressed. Chemical adciitiv:es .help. the overall ·strength.and uniformity of the . product. . The - use · of hardboards ... ar~. 1J1any and varied,·· requiring ci:ifferent processes and control measures.. The quality. and type of board is important·· in,.' the .end: _µse of th_e product.. . . .
~ -- - ~ ' -- .: • • '~ ·,1, 'I "'"''" - • • ' ' . -- ;, ' '>
... The following are some of the uses of ·hardboard:
Interior Wall Paneling Exterior Siding Displa~, Cabinets Base c>f Painted Tile Panels. Concrete Forms. Noncomiuctor Material for Electrical Equipment Door Slcins (panels) TV.Cabinets and Furniture
The Americari-Soci.ety for Tes-ting and Materials.sets standards for. the various types of hardboard produced.
Hardboard which is pressed wet i•edi•tely following. forming of thewet-lap·is called wet-wet or smooth-one-side (S1S) hardboard; that .which .is pressed after the wet lap has been dried is called wet-:dry ·or,,. smooth-two-side (S2S) har~board.. . · ·
,·,., ,i.
There are 1 E> .plants produci_ng wet pl;'oeess hardboard in .the Uni 1:ed States, representing···. an .. :, annual pr.oductioh · :-in excess·. of . 1. 5 · million meta:~ic tons per year. Seven of the plants produce only S1S hardboard. Of the nine plants produc·ing S2S hardboard,· thr-e. plan,:s produr,e both S2S and S1S; five plants .· produce· .. S2S · and insulation board, and one plant produces S2S: only. Table II-S 1 ists the wet pr~cess hai:-~board pl-ants in the U.S.·
The geographi.c distribution of these plants is depicted in. Fig~re ll-4. Tl:i.e.tot.al_.a.nnµal J,J~S ... proauct.iori of ._ha,rdb.o.ai:-d· from- J964· throµgh 1978 .· ~i~ shown .. · ~n , figu~e II-S. This total ppoductiori includes. dry process hardboard as "ell •~ wet proc:ess hardboard.:
_.Although . the relative amouilts.·of production· betw.een dry and wet: process hardboard vary .. from .. year- to year, a generalized rule of . thumb is that 75 percent of the total production is .wet process hardboard. · ·- ·
27·
.. ... ,·1
- - ··--·

'N CX>
. GEOGRAPHICAL DISTRIBUTION OF HARDBOARD
MANUFACTURING FACILITIES IN THE UNITED STATES
MONT.
WYO.
COLO.
N.M1EX.
LEGEND
e Wet-Wet Process (S1S)
(9 Wet•Dry Process (S2S)
() Wet-Dry/Insulation
N.DAK.
S.DAK.
NEBR.
KANS,
OKLA.
Figure 11-4

1:~ " . I . • . 8 .. ' '
CD . ...... ...... . ::a:. . 7
··IL-, z
,'0. 6 . --- .... · . ..a
- .f.C. C-m -s ,.· ,Q._
N,. IE ·l,O· ·, . -:c' . . ·. ·"·' 4 . . . W· • . ·m
Q a: 3 C . :c
.2
1
TOTAL BOARD PRODUCTIONS FIGURES: HAaDBOARD
1~ ~ ~ ~-- ,~ ro ~ ~ n ~ n ff n n n TIME (YEARS)
Flgure.11-s

Table II-5. Inventory of Wet Process Hardboard Plants
---------------------------------------:.:' Evans Products Corvallis, Oregon
Champion Building Products Dee (Hood River), Oregon
Masonite Corporation Laurel, Mississippi
Abitibi Corporation Roaring River, North Carolina
Superior Fibre Superior, Wisconsin
Temple-Eastex Diboll, Texas
Weyerhaeuser Company Craig, Oklahoma
Forest Fibre Stimpson Lumber Company Forest Grove, Oregon
Masonite Corporation Ukiah,. California
Superwood Corporation Duluth, Minneso~a
Superwood Corporation North Little Rock, Arkansas
U.S. Gypsum Company Danville, Virginia
Abitibi Corporation Alpena, Michigan
Boise Cascade International Falls, Minnesota
U.S. Gypsum Company Pilot Rock, Oregon
·u.s. Gypsum Company Greenville, Mississippi
Source: 1977 Directory of the Forest Products Industrt.
SUMMARY OF METHODOLOGY AND DATA GATHERING EFFORTS
The first step in the guidelines ~nd standards· development process was to assemble and evaluate all existing sources of information on the wastewater management practices and production processes of the Timber industry.
Sources of information reviewed included:
1. Current literature, EPA demonstration project reports, EPA technology transfer reports.
2. Draft Development Document for Effluent Limitations Guidelines and New Source Performance Standards, Timber Products Processing Industry, includi'ng supplemental information. ·
3. Draft Development Document for Pretreatment Standards, Wood Preserving Segment, Timber Products Processing Industry, including supplemental information.
4. Summary Report on the Re-evaluation of the Effluent Guidelines for the Wet Process Hardboard Segment of the Timber Products Processing Industry, including supple-
30

mental information. 5 .. Information obtained from regional EPA and ·st.ate regu
latory agencies on timber industry plants within their jurisdiction. · ·
6 ... Data submitted _by individuals, plants and industry trade - 'associations in response to publication of .EPA
reg~lationi. ·
A complete bibliography of all literature reviewed during .this project is presented in ·section XIV.of this document.
An analysis of· the above sources indicated that additional information. would be requir~d, particularly concerning. the source, use, treatment and discharge of, toxic pollutants. Updated infc:>rmation was also needed on production-related. process raw waste lc:>ads (RWL}, potential in-process waste· control tech.niques, and. the identity and effectiveness of .end-of-:-pipe· treatment E,ystems. ·
In recognition of the fact that· th~ b~sf source of existing information was the individual pl.ants, a data collecti.on portfolio (DCP) was prepared and sent directly to manufacturing plants of .. the wood preserving and insulation board/wet process hardboard E,E~gments of the industry. This DCP was the major source of information· used to develop 'the profile of each industry whllch is presented in Section III of.this document. The DCP was deE;igned to update the existing . data base concerning production processes, wastewater characterization, raw waste loads based on historical production andwastewater data, .method of· ultimate wastewater disposal,. in~pr6cess waste control techniques, and the effectiveness of in-place external ti::-eatment technology. Oat~ concerning description of production processes are presented later in this section. Data concerning raw wastewater characteristics are presented. in Section.V. Section VII. contaj_ns a .compilation· of the data concerning treated effluent characterist'its as well as end-of-pipe and in-process. treatment and control technologies. The DC:I? also requested information concerning the extent of use. of materials which could contribute toxic pollutants to wastewater and any data for toxic pollutants in wastewater di$charges. Thes~ data are presented i~ Section VI. c>f this documen,t. Responses to the DCP served as. the source of updated, long-term, historical information for the traditional parameters such. as BOD, COD, solids, pH, total phenols, and metals.
The. long-tE~rm daily production and treated effluent data included in the DCP responses from plants in the insulat.ion. b.oard/wet process hardboard.· segment provided a on~ to two year data base. A statistical analysis of this data base was conducted to develop the numerical limitations for BPT and BCT for the insulation board/wet ,process hardboard segment. These· limitations were presented in the "Development Document for Proposed Effluent Limitations Guidelines New Sourc:~ Performance Standards. and Pretreatment Standards for the Timber Products Processing Point
31

Source Category" (October 1979). Based on several comments received by the Agency during the public comment period for this document, the Agency decided to evaluate an extended data ·base in the development of the BPT and BCT numerical limitations. Consequently, additional production and treated effluent data were obtained from the insulation board/wet process hardboard plants to form an extended data base covering a period of two to four years. A statistical analysis of this extended data base, as described in Appendix G, was conducted to develop the insulation board/ wet process hardboard segment BPT and BCT numerical limitations as pr~sented. in Sections VIII and IX, respectively.
Additional sources of information provided information obtained production facilities.
information included NPDES permits, by industry trade associations, and
from direct interviews and visits to
Survey teams composed of, project engineers and scientists conducted plant visits. Information on the identity and performance of wastewater treatment systems was obtained through interviews with plant water pollution control or engineering personnel, examination of treatment plant design and historical operating data, and sampling of treatment plant influents and effluents. Nine wood preserving plants, six insulation board plants, and eight wet process hardboard plants were visited from November 1976 through May 1978, with several plants receiving more than one visit.
Only in rare instances did plants report any knowledge of the presence of toxic pollutants in waste discharges. Therefore, toxic pollutant data in waste discharges of the industry were obtained by a thorough engineering review of raw matel::'ials and production processes us~~d in each industry a'nd by a screening · sampling and analysis program for- toxic pollutants at selected plants. Every effort was made to choose facilities where meaningful information on both treatment facilities and manufacturing operations could be obtained. · ·
The screening sampling and analysis program was conducted during November and December of 1976. .Seventeen plants in eleven subcategories of the Timber Products Processing .point source category were visited and sampled. Among these plants were three wood preserving plants, three. insulation board plants, and one wet process hardboard plant. A single 24-hour composite sample was obtained from the raw and treated wastewater streams at each plant and analyzed for the 124 toxic pollutants listed in Appendix B-2 of this dc,cument. Sampling procedures followed the Sampling Protocol for Measurement of Toxics, U.S. EPA, October 1976. Analytical methods followed the first draft Protocol for ~ Measurement of I2icic Substances, U.S. EPA Environmental Monitoring and Support Laboratory, Cincinnati, October 1976.
32

The purpose of the screening program was· to determine toxic pollutants ,presence in wastewaters:from eac;h industrial. segment sampled, and to determine the order of magnitude of,. the contam.ination. Screening analyses were not used to quantify the levels.of contamination in theraw·or treated effluents. ·
The results of th~ screeni~g ~nalyses were evaluated=along .~itb the process :engineering review for each subcategory. The toxic pollutants ·. which were found , to be present in levels above the detection limits for the analyses, or those which were suspected to be present as a result of· thei.r ·use. as raw· materials, byproducts, final products, etc., were selected for verification.
The verification sampling and analysis program, conducted over a· 14-month period, was designed to obtain as much quantitative data as possible for each subcategory on those toxic pollutants identified.during the screening program.·. The plants for sampling were chosen to r·epresent the fu11 range of in-place technology for each subcategory. Seven wood preserving plants were sampled during verification (three.were sampled twice). Five· insulation· board plants and seven wetprocess.hardb'oard plants were also s.ampled during the verification· program ( three wet . process hardboard and three insulation board plants were sampled twice).
Three consecutive 24-hour composite samples of the raw wastewater, fin~l_treated effluent, and, in appropriate ca§les, effluent. from intermediate treatment steps were obtained at each
. plant·. A .single grab sample of· incoming· fresh process water was also obtained at each plant~
Sampling and analyses were.· conducted according to Sampling !!!9, Analysis Procedures for Screening of Industrial Effluents for Toxic Pollutants U.S. EPA, Cincinnati; March 1977 (revis~d April 1977), and Analytical Methods for the Verification Phase of the BAT Review, U.S. EPA Effluent Guidelines Division, Washington·; D.C., June. 1~77. ~ ·
A detailed .discussion of an·alyticaf methods, procedures and techniques used during ·the study .is presented in Appendix C of this document.
The review of. available literature and of previous studies; analysis of the data collection portfolios; information obtained from EPA regions, state and· local regulatory agencies, and industry and trade associations; information obtained.during plant visits; and the results of analyses from the screening and verification sampling programs comprised the technical data base which served as the basis for review of subcategorization of the industry and for identification of the full range of in-process and treatment t~chnology options availabl~ within each subcategory. Among other factors, the subcategorization review took into consideration the raw materials used, products manufactured, production processes employed, wastewa.ters generated, and plant characteristics such as size and age.
33

The raw waste characteristics for each subcategory were then identified. This included an analysis of: (1) the source and volume of water used, the process employed and the ·sources of wastes and wastewater in the plant; and (2) the constituents of all wastewaters, including conventional, nonconventional and toxic pollutants.
The full range of control and treatment technologies applicable to each candidate subcategory were identified, including bot.h inplant and end-of-pipe technologies which are in use or capable of being used by the pla11ts in each subcategory. EPA , also identified the effluent level resulting from the application of each of these treatment and control technologies, in terms of the amount of constituents.present and of the chemical, physical, and biological characteristics of pollutants, including toxic pollutants.
The costs and energy ·requirements of each of the candidate technologies identified were then estimated, both for a typical, or model plant or plants within the subcategory and on a plantby-plant basis, taking into consideration in-place technology.
The problems, limitationsr and reliability of each treatment and control technology, as well as the required implementation time, were identified. In order to derive variabil~ty factors based on existing treatment plant performance, statistical analyses were performed on those treatment systems for which sufficient historical data were available~
Nonwater quality environmental impacts, such as the effects of the application of such technologies on other pollution problems, were also addressed.
Upon consideration of these factors, EPA identified various control and treatment technologies as BPT, BCT, NSPS, PSES and PSNS. The Agency then formulated effluent limitations guidelines and standards which requtred the attainment of the effluent reduction achieved by the proper operation of these or equivalent technologies.
34

WOOD PRESERVING
Scope of St:,!l~Y
SE(;T.I ON I I I
DESCRIPTION OF THE:INDUST~Y
· The wood preserving industry .applies Chemical treatment to round or sawn woc>ci products for the purpose of imparting insecticidal, fungicidal, or.· fire resistant properties to the· wood. The scope of this study includes all wood preserving plant$ (SIC 2491) regardless of the types of· raw materials used, method of preconditicming stock, types of ·:products produced, or means of ultimate wa.i;te disposal ..
Background
EPA conducted an extensive ~tudy of the vood ~~eiervin~ industry iri. 1973-1974. The infor:mation -developed during that study provided the technical basis for·. the effluent guidelines and standards fc:>r the industry promulgated in April. 1974 ( 40 CFR Par.t 429, Subparts F, G,.and. H}. · Another study was conducted in 1976; res11l ting :ilr1 the promulgcition of .pretreatment standards · for the indirect· discharging· porti.on of. the wood preserving industry. These tech11ical studies . included the use of· · data collection portfolios to obtain information· regarding plant operations, waste loads generated, treatment systems in place,·and historical treatment :system efficiencies. Plant visits were also conducted in conjunction with the above studies, as was the sampling.and analysis of raw and treated wastewaters.
EPA determined that the exist_ing information base should be updated and.expanded.
~ Colle1£tion Portfolio Development
· The. prim.ary source of survey· · information · regarding wood . preserving plants in.the U.S. is Wood Preservation Statistics, published , annually by the American Wood Pres.ervers' . Association (AWPA}.· This survey was underwritten, .in addition to the AWPA, by the American· Wood Preservers' Institute, .the Railway Tie Association, the Society of American Wood. J?resi~r:vers, ·.Inc., . and the Southern Pressure Treaters-Association~. The 1975 AWPA survey was the .. most current source of profile information when the DCP was . developed/ . This survey,. published in the 1975 AWPA Proceedings, identified .387, out of an estimated 415 wood treating plants, of which 352 are pressure treating plants.
Using the AWPA .information; a·_· list ·of. plants was developed for the DCP. Because the AWPA statistics did not-include mailing
_addresses or the appropriate contact person for eac:h plant,
35

additional resources were required to obtain this information. The 1976 Directory ·of the ·Forest Products· Industry, Miller Freeman Publications, contained addresses and contacts for many of the plants.
Dr. Warrens. Thompson, lDirector, Forest· Products Utilization Laboratory, Mississippi State University, was the Agency's consultant for this study and all previous wood preserving effluent guidelines development studies. He has also been involved in studies of wood preserving processes and wastewater treatment, and possesses a unique knowledge and familiarity with the industry. Dr. Thompspn reviewed the list and provided addresses and contacts for a number of plants.
The Agency identified the~ complete mailing addresses and contact persons for 284 plants. Previous EPA experience with the industry indicated that the 284·recipients of the DCP included all previously identified dischargers, both direct and indirect, and included a representative cross section of plants in all size categories and geographical locations. ·The OCP recipients included plants which represented the full range of i,n-process and end-of-pipe control_ arid treatment technologies.
Response to the Q£f
Two hundred sixteen plants responded to the DCP--a 76 percent response rate. One hundred ninety three of the responses were from pressure treating plants and 23 responses were .from nonpressure plants.
Table III-1 compares the response to the'technical DCP with the plants listed in the AWPA statistics. The table illustrates that the DCP response includE~d 56 percent of the total population of the 1975 AWPA listings.
Characterization of Nonresponders
Thirteen of the 68 plants that did not respond .to the PCP are operated by the industry's largest single company. This company received 27 DCPs. The company requested and received permission to respond for 14 of their ~lants. The request was approved. in order to alleviate the paperwork burden placed on the company's technical staff. The approval was contingent, however, on the company providing responses for all plants discharging process wastewater and for a cross section of processes and wastewater treatment systems characteristic of the company's operations.
Using AWPA statistics information, 21 of the nonresponders were identified as plants that treat either with only inorganic salts or use nonpressure processes exclusively. These plants were already subject to a no discharge of process wastewater limitation. Of the remaining 34 nonresponders, 12 are one cylinder pressure plants and 16 are two cylinder pressure plants.
36

.Table· III-L · C~paris.on· o.f DCP Coverage with NtlPA 3ll7Plant Pop11lation
Type Plant Nu!!De r of Plants Plants Receivin; DCP Plants Reseonding to DCP and Numer ·According to NAPA Percent NAPA Percent AWPA of Cylinders· Statistics Muser · ·Population Number . '. Population
-Pressure Retorts*
1 143 83 58.0 62 43.4
2 113 91 80.5 63 55.8<
~. 3 53 44 83.0 39 73.6
' ..... '
4 20 . 19 95 •. 0 13 65.0,
5 ,or more 23 21 91.3 16 69.6
, Subtotal 352 258 73. 3 193 54.8
Non-Pressure . Retorts Only .35 ;.26 74.3 · 23 65.·7
TOTAL 387** 284 73.4 216. 55.8'
* These plants may also use non-pressure retorts as wel 1 as pressure retorts.
** 1975 NAPA survey identified 387 P.lants out of an estimated 415 plants. ' " . , . . '
,·"·
·~ '"
-:1:
ii,~: : : ~' !
~,, '"" ·"

Data presented -in Sections V · and VII . of thi.s document will document that plants of this size generate very low volumes of process wastewater, and these plants generally do not discharge either directly or indirectly. ·
Comparison with Independent Surveys
Following the distribution of the technical DGP, EPA's Office of Analysis and Evaluation (OAE) conducted an information colleGtion activity designed to proyide information relating to the financial viability of the wood preserving industry, i.e., to determine the economic impact of pollution control costs that might result from these regulations. The mailing li~t for this economic DCP was developed from 1976 Dun's Marketing Statistics, published by Dun and Bradstreet, Inc. The OAE survey was sent to· a total of 574 addressees. Eighty-six responded that they were not involved in wood preserving operations, and one-hundred~fifty did not respond. The remaining three hundred thirty-eight recipients indicated that they were engaged in wood preserving operations. The OAE survey included responses from 94 pressure treating plants that were not included in the technical DCP response.
Information from these 94 plants was collected by the technical contractor through a telephone survey. Eight of the 94 plants were determined to be indirect dischargers. There were no direct dischargers of ·process wastewater identified by the economic survey. Information concerning the eight indirect discharging plants was incorporated into the technical information base and is presented in this document.
In late 1979, the United States Department of Agriculture (USDA) compiled a list of wood preserving plants as part of a rebuttable presumption against registration activity (RPAR) of all commercial wood preservatives (pentachlorophenol, creosote, and inorganic salts). According to this list, 60S ~ood preserving plants operated by about 520 companies exist in the United Stat~s. This tabulation of plants has not been verified nor has it been officially released by US.DA.
Summary
The OAE information survey mailing list was developed (rom a business/ financially oriented publication (Dun and Bradstreet) rather than a production oriepted publication (AWPA). Although the OAE survey identified many pressure treating plants not identified by the DCP, it also clearly demonstrated that the objectives of the technical collection activity were achieved and that the response· to the technical DCP. included information sufficient to address all process variations, wastewater treatment systems in.,·place, and the treatment systems' effectiveness. ·
38

Based on the Agency's the results obtained technical data base, expected to ~esult in
extensive experience wfth the industry through comparison of the OAE survey .:to the USDA list, once verified, is
significant.new information.
Methods of ,~2stewater Disposal According to the DCP
and the not
Tables III-2 through· III-5 present a summary of the methods of wastewater disposal practiced by plants in the various subcategor:i:es of. the wood preserving industry.
Units of _Exp~ession
Units of production in the wood preserving industry are shown- in cubic meters (cum). In-plant liquid flows are shown in liters per day (1/day). The industry is not yet metricized and uses English units to express production, cubic feet (cu ft); and inplant flow, gallons (gal) per day. Conversion factors from English units: to metric units are presented in Appendix D.
Process Desc:.ription
The wood preis;erving process consists of two basic steps: ( 1) conditionin9 the wood to.reduce fts natural moisture content and increase the permeability, and. (2) impregnating the wood with the preservative!, Figure III-1 shows common treatment sequences.
The conditicming step may be performed by one of several methods including (1) seasoning or drying .wood in yards, at ambient temperatures; (2) kiln drying; (3) steaming the wood at elevated pressure in a retort followed by application of a vacuum; (4) heating the stock in a preservative bath under reduced pressure. in a retort (Boulton process); or (5) vapor drying, heating of the unseasonE:!d wc:>od in a solvent to prepare it for preservatt ve treatment. All of these conditioning methods have as their objective thE:! reduction of moisture content of the unseasoned· stock to a p<:>int where the required amount of preservative can be retained in the wood.
Conventional steam conditioning (open steaming) is a process in which unseaf;c:med or partially seasoned stock is subjected to. direct steam impingement at an elevated pressure in a retort. The maximum permissible temperature is set by AWPA standards at 11s0 c and the duration of the steaming cycle is limited by-these standards tc::, no more than 20 hours. Steam condensate that forms in the reb::>rt exits through traps and is conc;lucted to oil-water separators fi::>r removal of free oils. Removal of· emulsified oils requires further treatment. Figure III-2 is a schematic diagram -of a typical open steaming wood pJ:'.eserving plant ..
39

Table III-2. Method of Ultimate Wastewater Disposal by Wood Preserving-Boulton Plants Responding to Data Collection Portfolio
Ultimate Disposal Method
Direct Discharge
Di~charge to POTW
Self-Contained (No-Discharge} -Containment and Evaporation -Cooling Tower Evaporation -Soil Irrigation, Treated Effluent
Recycle, etc.
TOTAL Plants
Number of Plants
0
10
25 17
4
4
35
Table III-3. Method of Ultimate Wastewater Disposal by Wood Preserving-Steam Plants Responding to ~ata Collection Portfolio
Ultimate Disposal Method
Direct Discharge
Discharge to POTW
Self-Contained (No-Discharge} -Containm'ent and Evaporation -Soil Irrigation
TOTAL Plants
4.0
Number of Plants
29
66 56 10
96

-· _·_.
·· Table· .I.I.1~4.\ Metho~. o( .... Ultim~~:e· ... Wastewater··. D~sposal ·_;by··. Wood Preservirig-Inc,fganic Salt -· Pl:ants .. · ]8~spondlng to .Data Collection Portfolio · · · " ·· · · ·· ·.-
-------------·-·---~---.---~-------·---------------~--------~----:------------Ultimate Disposal Metbod·
...... Number of Plants ----------------~--------------.;..~~·~·--...,;.~---·-~-~---~---ii,i,i:-------~:.,;------------
. Direct Dis~har9e*
Discharge to POTW*
Self.-Contain~d (No-Discharge) -Generate No Wastewater or Recycle All Wastewater as Makeup Dilution Water -Containment and.Evaporation
. - ' .....
Total Plants
. .
,. ] .
s
56
52 4
62 . ------------~-----~----------------.----------------------.---.... -----~---* Note: Cm::-rent regulations prohibit discharge of process wastewater pc,llutants from plants in this subcategory,--either to navigibl~ wat4ers or to a POTW. ·
Table III-5. Method of Preserving-Nc,1ipressure Portfolio.
Ultimate Wastewater Disposal by Wood P~ants_.Responding · to Data Collection
~---------------~~-~-~~---~-~---~-------~-...;:---------~--;._-------~------, Ultimate. Dispi~sa! _t-tethod Number of Plants --------~---c~_,-~~~~;;.---~---~~~~-~-~~-~-..;-----~~------~-~~----~-------:--No Discharge
TOTAL Plants
·23
23 ----------------~-~--------------------------------------~--------
-· "- "· -l:;;- _'; ·•
41

•
® 150
.. 100 a: "' a: :, ti w 50 a: .. I
0
iE 10 :I :,
i:l 20 < > 30
0
® 150
;:i 100 a: w "' :, ::I so w a: ..
TREATING PROCESSES AND EQUIPMENT
D
E
F
2 3 4
TIME, HOURS
, K
L
A. PRELIMINARY VACUUM B. ·FILLING CYLINDER WITH PRESERVATIVE C PRESSURE RISING TO MAXIMUM D. MAXIMUM l>RESSURE MAINTAINED E. PRESSURE RELEASED F. PRESERVATIVE WITHDRAWN G. FINAL VACUUM H .. VACUUM RELEASED
A. B. C. D. E F. G. H I,
PRE·STEAM VACUUM STEAM INTRODUCED STEAM MAINTAINED STEAM RELEASED POST-STEAM VACUUM VACUUM RELEASED CONDENSATE DRAINED PRELIMINARY, VACUUM PERIOD
-+--F=.·~~---_,..,___,_ ______ _..M.. J. K. L M,
FILLING CYLINDER WITH PRESERVATIVE PRESSURE RISING TO MAXIMUM MAXIMUM PRESSURE MAINTAINED PRESSURE RELEASED I
© 150
;;j• 100 a: w
I so f
0 ~ :!: 10 :I ;;,
"' u 20 < >
30
0 1 .. • • 12 13 14 15 11 17 11 19 , 20 21 22 23 , 24
rlME, HOURS
D
E
A
F
0 2 3 4 5 TIME, HOURS
PRESERVATIVE WITHDRAWN
A •. PRELIMINARY AIR PRESSURE APPLIED B. FiLLING CYLINDER WITH PRESERVATIVE C. PRESSURE RISING TO MAXIMUM D. MAXIMUM PRESSURE MAINTAINED E. PRESSURE RELEASED . F. PRESERVATIVE WITHDRAWN G. FINAL VACUUM H. VACUUM RELEASED,
SOURCE: Koppers Company
TYPICAL TREATING CYCLES USED FOR TREA.TING LUMBER, POLES, AND PILES. A. FULL-CELL TREATING CYCLE USED FOR DRY SOUTHERN PINE LUMBER B. FULL-CELL TREATING CYCLE USED FOR GREEN SOUTHERN PINE PILES C. EMPTY ·CELL TREAtn•G CYCLE USED FOR DRY SOUTHERN PINE POLES
42 · · Figure 111·1

'1: ~ w-,
WOOD IN ~ WOOD OUT
PRESERVATIVES TO WORK JANK
WORK TANK
I
VAPORS
TREATING CYLINDER l
CYLINDER WATER
STEAM
CYLINDER DRIPPINGS PRESERVATIVES ! AND RAIN WATER' 1
TO CYLINDER •
I + RECOVERED OILS I OIL. WATER I ,. - SEPARATOR
WASTEWATER
. l ~no1 ':er rnMnS:M..,.,..A ' -- -ING \, ""'' .. ...,_ •• ;:,c •• r 1--------WATER '
CONDENSATE
VACUUM ·PUMP
ACCUMULATOR
,1\">·
OPEN STEAMING PROCESS WOOD TREATMENT PLANT
AIR AND VAPORS
COOLING WATER -
Figure 111-2

In closed steaming, a widely used variation of conventional steam conditioning, the steam needed for conditioning is generated in situ by covering the coils in the retort with water from a reservoir and heating the water by passing process steam through the, coils. The water is returned to the reservoir after oil separation and reused during the next steaming cycle. There is a slight increase in volume of water in.the storage tank after each cycle because of the water removed from the wood. A small blowdown from the storage tank is necessary to remove this excess water and also to control the level of wood sugars in the water. Figure III-3 is a schematic .diagram of a typical closed steaming wood preserving plant.
Modified ·closed steaming is a variation of the steam conditioning process in which steam condensate is allowed to accumulate in the retort during the steaming operation unti1 it covers the heating coils. At that point, direct steaming is discontinued and the remaining steam required for the cycle is generated within the retort by utilizing the heating coils. Upon completing the steaming cycle, the water in the cylinder is discarded after recovery of oils. Figure III-4 is a schematic diagram of a typical modified steaming wood preserving plant.
Preconditioning is accomplished in the Boulton process by heating the stock in a preservative bath under reduced pressure in the retort. The preservative serves as a heat transfer medium. After the cylinder level has been raised to operating temperature, a vacuum is drawn and water removed from the wood passes through a condenser in vapor form to an oil-water separator where low-boiling fractions of the preservativ.e are removed. The Boulton cycle may have a duration of 48 hours or longer for large poles and piling, a fact that accounts for the lower production per retort day as compared to plants that steam condition. Figure III-5 is a schematic diagram of the Boulton process.
The vapor drying process, illustrated in Figure III-6, consists essentially of exposing wood in a closed vessel to vapors from any one of many organic chemicals that are immiscible with water and have a narrow boiling range. Selected derivatives of petroleum and coal tar, such as high-flash naphtha, and Stoddard solvent, are preferred; but numerous chemicals, including blends, can be and have been employed as drying agents in the process. Chemicals with initial boiling points from 212°F to 400F0 (100°c to 204°C) may be used.
Vapors for drying are generated by boiling the chemical in an evaporator. The vapors are conducted to the retort containing the wood, where they condense on the wood, give up their latent heat of vaporization, and cause the water in the wood to vaporize. The water vapor thus produced, along with excess organic vapor, is conducted from the vessel to a condenser and then to a gravity-type separator. The water layer is discharged
44

..i:,. U1
WOOD IN
WOOD OUi
PRESERVATIVES TO WORK TANK
-WORK TANK
VAPORS
I ~r TREATING CYLINDER
- r ' l~ I L .I( ~-
,--
., CONDENSATE
CYLINDER WATER ~ I
STORAG[ j __ J
STEAM CYLINDER DRIPPINGS PRESERVATIVES AND RAIN WATER
TO CYLINDER -
I t RECOVERED OILS I OIL - WATER I ~ SEPARATOR r----
WASTE WATER
t ":OOLING..( CONDENSER )r------WATER I I I
CONDENSATE
1J ~ VACUUM
PUMP
ACCUMULATOR
CLOSED STEAMING PROCESS WOOD TREATING PLANT
AIR AND : VAPORS
COOLING WATER
Figure·m .. 3

~
°'
WOOD IN
WOOD OUT
PRESERVATIVES TO WORK TANK
WORK TANK
,
,---
VAPORS
I TREATING CYLINDER ~--
I
J
CYLINDER WATER
CONDENSATE
STEAM
CYLINDER DRIPPINGS PRESERVATIVES I AND RAIN WATER +
TO CYLINDER
I .j. RECOVERED OILS I OIL. WATER 1 • SEPARATOR r-
WASTEWATER
i COOLING+( CONDENSER ),----WATER I I
CONDENSATE
J L:::::::'.> VACUUM
PUMP
ACCUMULATOR
MODIFIED STEAMING PROCESS WOOD TREATING PLANT
AIR AN,D VAPORS
COOLING WATER
Figure 111·4

.g:.,
.......
WOOD IN
WOOD OUT
PRESERVATIVES TO WORK TANK
· WORK TANK
VAPORS
TREATING CYLINDER
· CYLINDER DRIPPINGS PRESERVATIVES I AND RAIN WATER
TO CYLINDER
I + RECOVERED OILS I OIL. WATER I I SEPARATOR
WASTEWATER
COOLING WATER
CONDENSATE
COOLING
CONDENSER ) · WATER
VACUUM PUMP
ACCUMULATOR
. BOULTON WOOD TREATING PLANT
•
AIR AND · VAPORS
I ti~-,
ri
F;gure m~s

~ 00
woo,D1N
WOOD OUT
PRESERVATIVES TO WORK TANK
WORK TANK
VAPO,RS
TREATING CYLINDER COOLING WATER
,,, 1
COOLING CONDENSER ) WATER
CONDENSED VAPORS
STEAM SOLVENT VAPORIZER
STEAM'f
CYUNDER DRIPPINGS PRESERVATIVES I .. AND RAIN WATER
TOCYUNDER
----ISOLVENT ~
WATER
VACUUM PUMP
ACCUMULATOR
J. 1 REcovERED o;=j OIL • WATER. I ! l l . . ~ S1:PARATOR 4 CONDENSATE
WASTEWATER
VAPOR CONDITIONING PROCESS WOOD TREATING PLANT
AIR AND VAPORS
Figure 111·6 .

from the separator and the organic chemical is returned to the evaporator for reuse.
At the end of the heating period; the flow of organic vapors to the vessel is stopped and a 30-minute to 2-hour vacuum is impos~d to remove the excess preservative.along with the additional water that is removed from the wood during the vacuum cycle. Since the drying vessel is usually the retort used for preservative. treatment, the wood can be treated immediately using any one of the standard preservative processes. ·
Following any of the above condi tiori1ng·:·:steps, the treatm.ent step may be accomplished by ei~her pressure or nonpressure processes.
Nonpressure (thermaf)-prcic~sses utilize open tanks which contain the preservative chemicals. Stock to be treated is immersed in the treating che11Jicals, which may be at ambient temperature,. heated, or a combination thereof. Stock treated in nonpressure processes is no~rnally conditioned by air seasoning or kiln drying.
Treatment methods employing pressure processes consist of three basic types, independent \of the preconditioning method .. Two of the pressure methods, referred to in the industry ·as "empty cel1 11
processes, are based on the principle that part· of. the preservative forced into .the wood is expelled by entrapped air upon the release of pressute at the conclusion of the treating. cycle, thus leaving the cel1 walls coated with preservative. The pressure cycle is followed by a vacuum to remove additional preservative. The retention of· preservatives attained i:s controlled in part by the Jnitial air pressure employed at the beginning of the cycle.
The third method, which is known as the "full cell" process, differs from the other two in that. the treating cycle is begun by evacuating the retort and brea~ing the vacuum with the preservative. The preservative is then forced into the wood under pressure, as in. the other processes. Most of the preservative remains in the wood when.the pressure is released. Retentions of preservatives achieved in this process are substantially higher than those achieved in the empty cell processes.
... .. \ Stock treated by any of the three, methods may be given ·a short steam treatment to "clean" the sµrface of poles and pilings and . to reduce exudation of oil .after the products are placed in service.
INSULATION BOARD
Scope of Stud~.
The coverage of this document is limited to those. insulation board plants in SIC 2661 (Building Paper ·and Building Board
... 49

Mills) which produce insulation board using wood as the basic raw material.
Scope of Coverage for Data Base
The DCP was sent to all the insulation board plants which use. wood as a raw material. All of the plants responded to the survey. Table III-6 presents the method of ultimate waste disposal utilized by the plants responding to the survey. Six of these plants were selected for visits and sampling.
Units g!, Expression
Units of production in the insulation board industry are reported in square meters (sq m) on a 13 mm (1/2 in) thick basis. Density figures obtained from the surveyed plants are used to convert this production to metric tons. The insulation board industry is_ not yet metr:cized and uses English units to express production, i.e., square feet (sq ft) on a one-half inch (in) basis. Liquid flows from the industry are reported in million gallons per day (MGD) and kiloliters per day (kl/day). Conversion factors from English units to metric units are shown in Appendix D.
Process Description
Insulation board can be formed from a variety of raw materials including both softwoods and hardwoods, mineral fiber, waste paper, bagasse, and other fibrous materials. In this study, only those processes employing wood as raw material are considered. Plants utilizing wood may receive it as roundwood, fractionated wood, and/or whole tree chips. Fractionated wood can be in the form of chips, sawdust, or planer shavings. Figure III-7 provides an illustration of a representative insulation board process.
When roundwood is used as a raw material, it is usually shipped to the plant by rail or truck and stored in a dry deck before use. The roundwood is usually debarked by drum or ring barkers before use, although in some operations a percentage of bark is allowable in the board. The barked wood then may be chipped, in which case the unit processes are the same as those plants using chips exclusively as raw materials. Those plants utilizing roundwood normally cut the logs into 1.2- to 1.5-meter (4- to 5-foot) sections either before or after debarking.
Groundwood, as used by two insulation board plants in the U.S. is usually produced in conventional pulpwood grinders equipped with coarse burred artificial stones of 16- to 25-grit with various patterns. The operation of the machine consists primarily of hydraulically forcing a piece of wood against a rotating stone,mounted horizontally. The wood held against the abrasive surface of the revolving stone is reduced to fiber bundles. Water is spray,ec:i on the stone not only to carry ·away the fibers into the system, but also to keep the stone cool and
50

clean and lub1ricate its surface. The water spray onto the . stone also reduces the possibility of fires occurring from the friction of the stone ,igainst the wood.
51

Table III-6. Method of Ultimate Waste Disposal by Insulation Board Plants Responding to Data Collection Portfolio
Ultimate Disposal Method
Direct Discharge
Discharge to POTW
Self-Contained Dischargers Spray Irrigation
No-Discharge (Plants generating no wastewater or recycling all wastewater}
Number of Plants
5
6
3*
* One plant uses spray irrigation as a treatment method; however, the irrigation tail water is eventually ·discharged from the field to a nearby river.
Source: Data collection portfolios.
52

u, w ....
LOG
STORAGE
l REFINING
DIAGRAM OF A TYPICAL INSULATION BOARD PROCESS
- DEBARKER
l ~
STOCK CHEST
LEGEND
WATER IN
r i--. CHIPPER
i-. DECKER
WHITE WATER t RECYCLE OR DISCHARGE
WATER OUT - - - ___ ..,
1--e CHIP
STORAGE
l - STOCK
CHEST
__,. CHIP SILOS
FORMING MACHINE
WHITE WATERt RECYCLE OR DISCHARGE
u " 1 ""IGESTE- 1
~ I i
Rt 1ly)
EVAPORATION& I
i---4IO DRIER i--..
' -
11
!
FINISHING
Figure 111-7

While most fractionated wood is purchased from other timber products operations, in some cases it is produced on site. Currently, little chipping occurs in the forest; however, in the future this is expected to become a major source of chips. Chips are usually transported to the plants in large trucks or railcars. They are stored in piles which may be covered but are more commonly exposed. The chips may pass through a device used to remove grit, dirt, and other trash which could harm equipment and possibly cause plate damage in the refiners. This may be done wet or dry. Pulp preparation is usually accomplished by mechanical or thermomechanical refining.
Refining Operations--Mechanical refiners basically consist of two discs between which the chips or wood residues are passed. In a single disc refiner, one disc rotates while the other is stationary. The feed material passes between the plates and is discharged at the bottom of the case. The two discs in double disc refiners rotate in opposite directions, but the product flows are similar to a single disc refiner. Disc refiners produce fibers that may pass through a 30- or 40-mesh screen, although 60 percent of the fibers will not pass through a 65-mesh screen. The disc plates generally rotate at 1,200 or 1,800 rpm or a relative speed of 2,400 or 3,600 rpm for a double disc mill. Plate separations are generally less than 1.0 cm (0,40 in). A variety of the disc patterns are available, and the particular pattern used depends on the feed characteristics and type of fiber desired.
A thermomechanical refiner is basically the same as a disc refiner except that the feed material is subjected to a steam pressure of 4 to 15 atm (40 to 200 psi) for a period of time from 1 to 45 minutes before it enters the refiner. In some cases, the pressure continues through the actual refining process •
• Presteaming softens the feed material and thus makes refining easier and provides savings on energy requirements; however, yield may ,be reduced up to 10 percent. The longer the presteaming and the higher the pressure, the softer the wood becomes. The heat plasticizes portions of the hemicellulose and lignin components of wood which bind the fibers together and results jn a longer and stronger fiber produced.
Subsequent to the refining of the wood, the fibers produced are dispersed in water to achieve consistencies amenable to screening. For most screening operations, consistencies of approximately one percent fiber are required. Screening is done primarily to remove coarse fiber bundles, 'knots, and slivers. The coarse material may be recycled and passed through secondary refiners which further reduce the rejects into usable fibers for return to the process. After screening, the fibers produced by any method may be sent to a decker or washer.
54

Decker Opera!,ions--Deckers are essentially.rotating wire covered cylinders, usually· with an internal vacuum, into wh.ich the suspension of fibers in water is passed. The fibers are separated and the_,water isµsu~lly r.~circulated into the system. There are a number of reasons for ~ecket'ing or washing, the two primary ones being to clean the·pulp, and consistency control. Control of dissolved solids is also a factot" in some cases. While being variable on a plant-to,-plant basis, the consistency of the pulp upon reaching the forming machine in any insulation board process is extremely.critical. By dewatering the pulp from the water suspension at this point, it can be mixed with greater accuracy to the desired consistency. Washing of the .. pulp is sometimes desirable in order to remove dissolved solids·and soluble organics which may result in surface flaws in the board~ The high concentration.of thesesubstances tends to stay in the board and during ·th~:drying stages migrates to the surface.· This results in stains when a finish is applied to the board.
After the washing or deckering operation, the pulp is. reslurried in stages. The initial . dilution· . to approximately 5 percent consistency is usually followed-by dilutions to 3 percent and finally, jus.t. prior to mat formation, a dilution to approximately 1.5 percent. This procedure is followed primarily for two reasons: (1) it allows for accurate consistency controls and more efficient dispersion of additives; and (2) it reduces the required pump and storage capacities for the pulp. During the various stages of dilution, additives are usually added to .the pulp .suspension. These range from 5 to ,20 percent of the weight of the boa.rd, depending on the product used. Additives may include wa.x emulsion, para.ff in, asphalt, starch, polyelectrol~·tes, and aluminum sulfate.. The purpose of additives is to give· the board desired properties such- as strength, dimensional stability, and water absorption resistance. ·
After passing through the series ~f storage ~nd C()nsistency controls,, the pulp may pass through a pump-through refiner, directly ahead of the forming machine. The purpose of the pumpthrough refiner is to disperse agglomerated fiber clumps and to shorten the fiber bundles.. The fibrous. slurry, at approximately 1.5 percent consistency,. is then pumped into a forming machine ~-rhich removes water fr()m the r-ulp suspension and forms a mat.
Forming .Oper~tions--While there ·are various types of forming machines used to make insulation board, the two most common are the fourdrin,ier and the cylinder machines. The fourdrinier machine used in the manufacture of insulation board is similar in nature to those used-. in the manufacture of hardboard or paper. The stock is pumped into the head box and onto a table with an endless traveling screen running over it. The stock"is·spread evenly across the screen by special control devices and an interlaced ffbrous blanket, referred to as a mat, is formed by allowing the dewatering of the stock through the screen by gravity assisted · by vacuum box.es. The partially formed mat
55

travelling on the wire screen then passes through press rollers, some with a vacuum imposed, for further dewatering.
Cylinder machines are basically large rotating .drum vacuum filters with screens. Stock is pumped through a head box to a vat where again a mat is formed onto the screen. In this case, the mat is formed by use of a vacuum imposed on the interior of the rotating drum. A portion of the rotating drum is immersed into the stock solution. As water is forced through a screen, a mat is formed when the portion of the cylinder rotates beyond the water level in the tank and required amount of fiber is deposited on the screen. The mat is further dewatered by the vacuum in the interior of the r.-otating drum and is then transferred off the cylinder onto a screen conveyor, or felt, where it then passes through roller presses similar to those utilized in fourdrinier operations.
Both the fourdrinier and the cylinder machines produce a mat that leaves the roller press with a moisture content of about 40 to 45 percent and the ability to support its own weight · over short spans. At this point, the mat leaves the forming screen and continues its travel over a conveyor. The wet mat is then trimmed to width and cut to length by a traveling saw which moves across the mat on a bias, making a square cut without the necessity of stopping the continuous wetlap sheet.
! I
After being cut to desired lengths, the mats are dried to a moisture content of 5 percent or less. Most dryers now in use are gas- or oil-fired tunnel dryers. Mats are conveyed on rollers through the tunnel with hot air being circulated throughout. Most dryers have 8 or 10 decks and various zones of heat to control the rate of drying and to reduce the danger of fire. These heat zones allow for higher temperatures when the board is "wet" (where the mat first enters) and lower temperatures whe~ the mat is almost dry.
The dried board then goes through various finishing operations such as painting, asphalt coating, and embossing. Those operations which manufacture decorative products will usually have finishing operations which use water-base paints containing such chemicals as various inorganic pigments, i.e., clays,' ·:-talc, carbonates, and certain amounts of binders such as starch, protein, PVA, PVAC, acrylics, urea formaldehyde resin, and melamine formaldehyde resins. These are applied in stages by rollers, sprayers, or brushes. The decorative ti'le then may be embossed, beveled, or cut to size depending on the product desired.
Sheathing in some operations receives additional molten asphalt applications to both sides and the edges. It is then sprayed with water and stacked to allow humidification to a uniform moisture content.
56

Various sanding and sawing operations. give insulation board products the correct dimensions. Generally, the dust, trim, and reject mateirials created in finishing operations are recycled into the. prc,c:ess.
WET PROCESS HARDBOARD
Scope of Stul§_y
The scope of ·this document includes plants (SIC 2499) in· the U.S. material.
Scope of Cov~rage for Data Base
all wet process hardboard using wood as the primary raw
Data collection portfolios were sent to 15 of the 16,wet· process hardboard plants. The· remaining plant did not receive a data collection portfoJio, but did provide historical monitoring and production data, as well· as complete process and wastewater treatment information requested. All 15 plants responded to the survey. Ei9ht plants were:visited during this study,' and seven were sampled. In addition, the full record compiled by the E.C. Jordan Company during· their 1975-1976 study of the wet process hardboard industry was reviewed during the course of this_ study. All 16 plants were visited by E.C. Jordan personnel at that time. Table III-7 presents the method of ultimate disposal utilized by each of the .16 wet process hardboard plants.
Table III-7. Method of Ultimate Waste Disposal by Wet Process Hardboard Plants
------------------ --------------------- ----- ------------------Ultimate Disposal Method Nu~ber of Plants· ----- ---------- -----------------L---.---------~ ---------------Direct Discharge
Discharge tc> POTW
*Self-Contained Dischargers Spray Irrigation ( 1 plant). Total Recycle of Treated Effluent (1 plant)
12
. ·.2
---------------------~-------------------------------------~-----* Two othE~r plants use spray. irrigation· to dispose of part. of their wastewater. One plant spray irrigates a portion of its sludge. Source: Data collection portfolios.
Uni ts of EXE~~ession
Uni ts of production · in the hardboard industry are reported· in-•· square meters (sq m) on a 3.2-mm (1/B~in) thick basis, as well as
57

in thousand kilograms per day (Kkg/day). Most plants provided production data directly on a weight basis. The hardboard industry is not yet metricized and uses English units to express production, square feet (sq ft) on a one-eighth inch basis or in tons per day (TPD). Liquid flows from the industry are reported in kiloliters per day (kl/day) and million gallons per day (MGD). Conversion factors from English units to metric units are shown in Appendix D.
Process Description
~ Material Usage--The basic raw material used in the manufacture of hardboard is wood. The wood species in-elude both hardwoods (oak, gum, aspen, cottonwood, willow, sycamore, ash, elm, maple, cherry, birch, and beech) and softwoods (pine, Douglas fir, and redwood).
Wood receipts may vary in form from unbarked long and short logs to chips. Chip receipts may be from whole 'tree chipping, forest residue (which includes limbs, bark, and stumps), sawmill waste, plywood trim, and sawdust. The deliveries may be of one species, a mixture of hardwoods, or a mixture of softwoods. The geographic location of each mill determines the species of wood used to produce the hardboard. The species and mixture at a given plant may change according to availability.
Moisture content of the wood receipts varies from 10 percent in plywood trim to 60 percent in green (fresh) wood.
Chemicals used as raw material in the hardboard process consist of vegetable oils, primarily linseed or tung, tall oil, ferric sulfate, wax, sulphuric acid, thermoplastic and/or thermosetting resin, aluminum sulfate, petrolatum, defoamer, and paint. No one mill uses all these chemicals in its process, nor is the degree of chemical use the same for all mills. Some of the functions of these• chemicals are for binding, sizing, pH control, retention, weather proofing, and foam reduction. The chemical usage ranges from 0.5 to 11.0 percent of the total production.
Wood Storage and Chipping_--Most of the mills surveyed stored the wood raw material as chips in segregated storage piles. In mos.t cases a paved base is provided for the storage piles. Rough logs received are stockpiled prior to debarking and chipping.
Of those mills receiving rough logs, four out of. eight remove the bark by mechanical means and either burn it or dispose of it in landfills. The other four mills chip the logs with the bark attached. Seven mills receive wood in chip form only, which in most cases includes the bark from the log. Only six mills screen chips before processing. Some of the mills using chips containing bark can tolerate only a minimal amount of bark in the final product and have auxiliary equipment (i.e., centricleaners) to clean the stock. One mill reported that bark in the stock improves the cleanliness of the caul plates in the press and
58

presents no problems in production. Only seven of the sixteen mills surveyed washed the chips before processing.
For production cont~ol and consistency, the majority of the mills maintain-a chip inventory of 60 to 90 days. Although the. yield is lower and the chips are.more contaminated (bark, dirt, etc.), the use of waste material. and forest residue is. increasing each year. in the production of h~rdboard. As the availability of quality chips decreases and the.costs increase, the greater use of lower quality fiber requires additional equipment to clean the chips before processing.
Fiber Preparation--Before refining or defibering; the chips are pretreated with steam in a pressure vessel or digester. The steaming of the chips under pressure softens the lignin material that binds the individual fibers together and reduces the power consumption, required for mechanical defibering. The degree of softening ,when the chips are raised to a certain temperature varies with different wood species. Steaming -of the c-hips also. increases the bondJng between fibers when the board is pressed.
Cooking conditions are determined by the wood species involved and the pulp quality required for the grade of hardboard being produced. A major difference exists in the cooking conditions used in the manufacturing of Sl S .. ( s.mooth-one-side) and S2S ( smooth-two~sid~s) hardboai;-~d. The .. cooking cycles for S1 S hardboard have ranges of 2 to 5 minutes at 5.4 to 10.2 atm (80 to 150 psi) for softwood and_ 49. seconds to 15 minu_tes at 9. 5 to 12. 2 atm (140 to 1po psi} for hardwood. S2S hardboard, which requires stronger and finer fibers, is produced with-cooking times of 1.5 to 14 minutes at 10.2 to 13.6 atm (150 to 200 psi).
Most SlS hardboard is usually manufactured with. the same pulp throughout the board, but occasionally it is produced wi'th a thick mat of coarsely refined fiber and an· overlay of a thin layer of highly refined fiber. The overlay produces a high quality, shive-fi~e, smooth surface .. The bulk of the board can contain coarse fiber, which allows proper drainage during the. pressing operation. Refining requires less energy. and the cooking conditi,ons are less stringent.
S2S hardboard requires. more. highly refined fiber and more thorough softening than SlS. This requires higher preheating pressures and longer retention time and, therefore,.more refining equipment and horsepower. The severity of the cook significantly affects the raw waste loading of the mill effluent. Most S2S hardboard is manufactured using an overlay system of fine fiber.
To contend ~ith frozen chips; some mills in col~ climates add preheating .for thawing prior to the cooking cycle.
The predominant method used for fiber preparation consists of a combination of thermal and mechanical pulping. This· involves a preliminary treatment of .. tJ1e_raw cn}ps with steam and pressure
59

prior to mechanical pu_lping of the softened chips. The thermomechanical process may take place with a digester-refiner as one unit (e.g., Asplund system}, or in separate units.
Primary, secondary, and tickler refiners may be found in the process depending on the type of pulp required. The pulp becomes stronger with more refining, but its drainage characteristics are reduced.
Some mills use raw chips which bypass the digester and are refined in a raffinator or refiner. These chips are usually, of a species that breaks down easily and has a tendency to overcook in the digester. The raw chips, which produce a weaker pulp and are a small percentage of the total chips used, are blended, after refining, with the cooked chips.
Some mills employ a method of fiber preparation called the explosion or gun process. The chips are cooked 1n a small pressure vessel and released--suddenly and at a high pressure-through a quick-opening valve to a cyclone. The sudden release of pressure explodes the chips into a mass of fiber. The steam condenses in the cyclone and fibers fall into a stock chest where they are mixed with water. Fiber yield is lower than the thermomechanical process because of the hydrolysis of the hemicelluloses under high pressure, and the raw waste loading is considerably higher.
ro restore moisture to chips containing a low moisture content (e.g., plywood trim}, one mill injects water with the chips as they are being ~ooked in the digester.
Refining or def ibering ~~guipment is of the disc type, in which one disc or both may rotate; the unit may be. pressurized or a gravity type. A combination of pressure- and ·gravity-type refiners is usually used in the process. Botn types of refiners have adjustable clearances between the rotating or fixed discs, depending on the type of stock desired. The maintenance and life of the refiner discs are dependent on the cleanliness of incoming chips.
Small tickler or tertiary pump-through ref.iners are used to provide a highly refined, shive-free stock for the overlay system required by some mills. Small refiners are also used for rejects from the stock cleaning systems.
Primary and most secondary refiners use large amounts of fresh water for noncontact cooling which may b~ reused in the process water system. Fresh or process white water is injected directly into the refiner to facilitate refining.
Stock Washing and Deckers--·A. washer is used to remove soluble materials. A decker, which is a screen used to separate fibers from the main body of water, also removes some solubles from the fiber bundles.
.60

After prima1r:y refining and dilution with white water, the majority of the mills wash the stock to remove.dissolved solids. The most widiely used washing equipment is of the drum-type, which may operate under a gravity or vacuum mode. The washer is equipped with showers.that wash the stock as it is picked up by the drum. Two mills used .counter-current washers which consist of two or thr,ee drum washers, in series. The. extracted s·o1 ids are used in a byproduct system. Qn.e _mill use$ a.· two:-rpll press for washing. As the water is squeezed from the stock passing through the nip of the press, it carries away dissolved solids.
The effluent from a stock washer has a high concentration of soluble organics which are usually mixed into the white water system and are either discharged for treatment or are recycled within the washing system.. The amount of dissolved solids that are readily wash~d frc,m the.stock is dependent'on the species of wood and the amount .of cooking.
Of the sixteen hardboard mills survey~d, four of seven S1S mills and seven of. nine _S2S mills wash their stock before mat formation.
Stock washers .are usually located after the primary refiners. Some· mills screen the washed stock and send the-slivers and oversize back.through the primary -refiner. Five mills, one without a stock washer, used centricleaners in the system to remove non-fiber material (bark, dirt, etc.} from the stock.
Consistency of the stock as it travels th~ugh the process is controlled. by instruments using recycled· white water for dilution. One mill, based on experience,, checks the consistency by "feel." The pH may be controlled by the addition of fresh water or chemicals. Other chemicals are, added· at various locations as required.
Forming--Most wet process 'mills form their product on a fourdrinier-type machine similar to that used in producing paper. Diluted stock is pumped to the headbox where the consistency is controll~d (usually with white wat~r) to an average of 1!5 to 1.7 percent while the stock is being fed to the traveling wire of the fourdrinier. As the stock travels with the wire, water is drained away. At first the water drains by gravi~y, but as the stock and wire continue, a series of suction boxes remove additional water. As the.water is being-removed, the stock·iS felted together into a continuous fibrous-· sheet called· a "wet mat." At the end of the forming machine the wet mat leaves :the traveling wire and is picked up by another moving screen that carries the mat through one or more·roll presses. This step not only removes more water but also compacts and solidifies the mat to a level at which it can support its own weight over short spans. As the wet mat leaves the prepress section, it is cut, on the fly, into lengths as required for the board. being produced. In the productiori of SlS hardboa~d the mat, still with.a moisture content of 50 to 65 percent, is carried to the hydraulic press
61

section. conveyed state.
In the manufacture first through the
of S2S hardboard, the mat is dryer and then is pressed in a dry
The water drained from the mat as it travels across the forming machine is collected in a pit under the machine or in a chest. This "white water" contains a certain amount of wood fibers (suspended solids), wood chemicals (dissolved solids), and dissolved additive chemicals depending on the size of the machine wire, the amount and number of suction bo~es, the freeness or drainage of the stocJc, and the physical properties of the product.
The water draining by gravity from the first section of the former contains the larger amount (rich) of fiber and is usually recycled to the fan pumps that supply the stock to the forming machine. The lean white water collected under vacuum in some plants is collected and recycled as dilution water throughout the process.
The amount of white water that can be r;ecycled is sometimes limited by board quality demands. Recycleq white water causes an increase in the sugar content (dissolved ·solids) of the process water and therefore in the board. If the sugar content is allowed to accumulate beyond a certain point, problems such as boards sticking in the press, bleedouts from the finished products, objectionable board color, and decreased paintability may be encountered. Some board products can tolerate a degree of such problems, and in some cases, some of the problems can be overcome by operational changes.
The wet trim from the mat on the forming machine is sent to a repulper, diluted, usually screened, and recycled into the process system ahead of the forming machine.
Pressing--After forming to the desired thickness, the fibers in the mat are welded together into a grainless board by the hardboard press. The hydraulically-operated press is capable of simultaneously pressing 8 to 26 boards. .Press plates may be heated with steam or with a heat transfer medium up to 230°C. Unit pressures on the board up to 68 atm (1,000 psi) ar.e achieved in the press. In S1S hardboard manufacturing the wet mat is fed into the press as it comes from the forming machine. Screens are used on the back side of S1S mats in the press. In this state the S1S requires 4 to 10 minutes in the press. In S2S hardboard manufacturing, the press may be fitted with caul plates or the board may be pressed directly between the press platens. Caul plates may be smooth or embossed for a special surface effect on the board. The press may be hand or automatically loaded and unloaded.
The squeezing of the water from the wet mat removes some of the dissolved solids. The water from the press squeeze-out on S1S hardboard has a high organic content and is usually drained away
62

for treatment. To assist the bond of the fibers in the press, resins are added to the stock befor~ it reaches the forming machine. From the press the SlS .hardboard maybe conveyed to a dryer, kilni or humidifier ..
As the S2S hardboard lea~es the forming machine, it may enter a pre-drying o,ven which evaporates 95 percent of the moisture in the board. When a pre-dryer is used, the hqt board is delivered directly to the press. After dfying, the board may be pressed or sent to storage and pressed when required.· The strength of the S2S hardboard has .to be sufficient. to withstand th~ many handling situations that occur while the board.is in the unpressed state.
As stated before, the S2S hardboard requires a harder cook and more refining than SlS hardboard. These finer fibers allow the consolidating chemic~! reaction to .take place when pressing the dry board. Thermosetting phenolic resins cannot be used- as a binder in S2S hardboard mat because it precures in the mat dryer. Higher temperatures, higher pressures, and shorter pressing time (1 to 5 minutes} are required in pressing the.dry S2S hardboard.
- '
Oil Tempering_ and Baking--After pressing, both SlS and S2S hardboard may _receive a special treatment called tempering. This consists of treating the sheets with various drying oils (usually vegetable oils} either by pan dripping or roll coaters. In some. cases the hardboard is passed through a series of pressure rolls which increase the absorption of the oils and remove any excess. The oil i's stabilized by baking the.sheet from l to 4 hours at temperatures of _1so 0 c to 177°c. Tempering increases the hardness, strength, and water resistance of the board.
Humidification--As the sheets of hardboard discharge from the press or thetempering baking oven they are hot and dry. To stabilize the board so as to prevent warping and dimensional changes, it is subjected to a humidification chamber in which the sheets are retained until the proper moisture. content, usually 4.5 to 5 percent, i_s_ reached. In the _case of siding products where exposure to the elements is expected, humidification to 7 percent is common. · ·
Figures III-8 and III-9 dep~ct diagrams of typical SlS and S2S production processes, respectively.
63

O'I ~
FLOW DIAGRAM OF A TYP'ICAL WET PROCESS HARDBOARD MILL
LOG STORAGE
LEGBI>
WATER IN
S1S HARDBOARD PRODUCTION LIN1E
CH1PPING CHIP CHIP ---+ DEBARKING ...- _.. _,.
STORAGE SILOS
STEAM -STOCK FORMING OVEN ._ 1--;i,a 1-oi PRESS ~ OR CHEST MACHINE KILN
WHITE WATER RECYCLE -- - - - - - - - - - J PRESS ..., ___ .1 t t EVAPORATION AND OR DISCHARGE SQUEEZE OUT EVAPORATION
TO DISCHARGE
WATER OUT -----..
STEAM .,-
- DIGESTER
STEAM •
~ HUMIDIFY
FRESH WATER
•
I--+ REFINER ...
!---!I FINSHING
Figure 111•8

O"I 01
FLOW DIAGRAM OF A TYPICAL WET -PROCESS HARDBOARD MILL
S2S HARDBOARD PRODUCT ION LINE FRESH WATl!R STEAM
l 1
I •o~ l"UIP LUU DEBARKING CHIPPING
~nu- v1111r i-... DIGESTER ~ 1-----t, --+ ~ i---
STORAGE STORAGE • WASHER "HIP "Hl 0 i
FRESH WATER WHITE WATER EVAPORATION
FRESH WATER WHITE WATER t I ~ ' +
PRIMARY FIBER SECONDARY STOCK FORMING PRE DRYER L-..t, f--t, WASH I--+ f--+ 1----t ~ ~
REFINER REFINER CHEST MACHINE
ENRICHED WHITE WATER FOR: I
WHITE WATER RECYCLE I
BY PROD~f!_ us~ R!_CYC~ J .,._AND OR DISCHARGE_ j OR DISCHARGE STEAM STEAM
• ~
OVEN FINISHING I+- HUMIDIFY ~ OR ~ PRESS lie-
KILN
I t EVAPORATION t EVAPORATION
LEGEND .
WATER IN
WATER OUT ----+-
'--
'
Figure 111·9


GENERAL
SECTION IV
INDUSTRIAL SUBCATEGORIZATION·
In the review of existing industrial subcategorization for the wood presenring, insulation board, and . wet process hardboard subcategorie~s· of the timber industry, it was necessary to determine whether significant differences exist within each segment to support the previous subcategorization scheme, or whether modifications are required. Subcategorization is based upon emphasized differences and similarities in such factors as: (1) plant characteristics (size, age, and products produced} and raw materials; (2) wastewater characteristics, including toxic pollutant characteristics; (3) manufacturing processes; (4) applicable mE~thods of wastewater treatment and disposal and.· ( 5) nonwater qu-~ll i ty impacts and energy.
The entire technical data base, described in Section II, was used in the review of subcategorization.
WOOD PRESERVING
Review of E:~_isting Subcategorization
In developing the previously published effluent limitation guidelines and pretreatment standards. for the wood preserving segment of the timber products industry, it was determined that plants comp1~ising this segment exhibited signif leant differences which sufficiently justified subcategorization. The definitions of the threi~ previously published subcategories ( 197 4) · are as follows:
Wood Prese1[11ing--All pressure processes which employ waterborne salts and in. which· steaming, the Boulton process, or vapor drying is not the predominant method of conditioning. All nonpressure. processes.· ·
Wood Prese;:ving-Steam-All wood preserving processes that use direct-steam impingement on wood as the predominant conditioning method, processes that use vapor drying as the predominant conditioning method·, fluor-chromium-arsenate-phenol ( FCAP) processes, processes where the same retort is used to treat.with both salt- and oil-type preservatives, .and processes which stet .. ' condition and which apply both salt- and oil-type preservativei;i; to the same stock.
Wood Preserving-Boulton-All wood preserving processes which use the Boulton process as t:he predominant method of conditioning stock.
67

The rationale for selecting these subcategories was anchored to differences within the industry in the volume of process wastewater generated and the applicable wastewater technology existing when the subcategories were developed in 1974. Plants in the Wood Preserving subcategory were required to meet a no discharge of process wastewater limitations and standards because a widely used technology existed to achieve no discharge by recycling the small volumes of process wastewater. Likewise, in 1974 plants employing the Boulton method of conditioning had achieved no discharge of process wastewater by means of forced evaporation using waste heat, and this was the basis for separate subcategorization of Boulton plants. Plants that used steaming as the predominant method of conditioning were permitted a discharge because of the relatively large volume of wastewater generated by the open steaming method used by most of the plants at that time, and because steaming plants did not have sufficient waste heat available to achieve no discharge through forced evaporation.
Factors considered in the subcategorization review included the following:
Plant Characteristics and Raw Materials Wastewater Characteristics Manufacturing Processes Methods of Wastewater Treatment and Disposal Nonwater Quality Impacts
Plant Characteristics anq ~ Materials
B.fil! Materials and Conditioning Processes--Most plants employing the Boulton process as the predominant method of conditioning are located in the Douglas fir region of the western states; those that use steam conditioning are concentrated, in the Sout-hern pine areas of the South and East. However, many plants that treat unseasoned Douglas fir also employ steaming for special purposes such as thawing frozen stock before treatment or flash cleaning of the surfaces of stock following treatment. Likewise, since current AWPA standards permit steam condi ti.oning of certain western species .such as Ponderosa pine, some plants that use the Boulton process as the predominant method of conditioning also use steam conditioning occasionally. Similarly, some eastern plants that steam condition most of their stock may use the Boulton process to condition green oak piling or cross tie$. The Boulton process is the predominant conditioning method at a few of the plants in the South and East that specialize in cross tie production.
Because the wood species being treated .plays a role in determining the method used to condition the raw material, and because the conditioning process used may affect the volume of wastewater generated; conditioning process used played a major role in establishing the subcategorization of the wood preserving segment.
68

Age--With the exception of method of conditioning the wood, Boulton and steaming .plants have very similar characteristics. Average is more than 45 years for both Boulton and steaming plants.
Plant age in and of itself is not a significant factor in determining the efficiency of a plant; nor does it necessarily influence either the volume or the quality.~ process wastewater .. Regardless of age, all plants employ t.1e same basic treating processes, us~~ the same type of equipment, and treat with the same preservat:ives. The average age·of wood pre~erving plants is high .. because the industry developed rapidly in the 1920' s and 1930' s in coni;ort with the demand for treated wood products by the railroads and utilities~ Most of the old plants have been modified seve1::-al times since they were first constructed. In most cases, the waste management programs at these plants are as advanced as those at plants constructed more recently.
Size--Table IV·-1 shows the size distribution of wood preserving plants within each subcategory. It can be readily observed. from this table that plants which treat only with · inorganic preservatives have a much gr.eater percentage (79 percent) of oneand two-cylind,er plants than -do- the Boulton (57 percent} or steam (53 percent) subcategories. Boulton plants have a greater percentage of large plants with.over four retorts (21 percent} as compared to steaming plants (8 percent) or inorganic preservative plants (2 percent).
Production capacity is perhaps a better indicator of plant size than number of retorts. For plants with the same number of retorts that treat only stump-green stock, the production of the steaming plant would exceed that of the Boulton plant by a factor of two or more because of the longer treating cycle time required for the Boulton process.· This inherent production advantage of. steaming plants is mitigated in part by the fact that the.Boulton subcategory of the industry has a higher percentage of four- Jnd five-cylinder plants than the Steam subcategory. Plant size and. production capacity are insignificant factors in subcategorization of the wood preserving segment.
Products Tre!ted--Boulton and steaming plants produce range of treated products .. Overall, the Boulton plants be more diversified than the remainder of the industry. not a significant factor in subcategorization.
the same tend to This is
Preservatives Used--The types of organic preservatives used by a plant are · ~ important consideration in determining the · pollutants co,ntained in the , proce.ss wastewater and, to some degree, the quality of the wastewater. Boulton plants use the same range of preservatives as the industry as a whole. However, more Boulton plants use creosote and salt-type preservatives than the remainder of the indµstry.
69

Table IV-1. Size Distribution of Wood Preserving Plants by Subcategory
Inorganic Boulton Steam Perservatives
Number of Number of Number of Number of Retorts Plants Percent Plants Percent Plants Percent
1 8 24 l l 13 30
2 l l 33 34 40 l 3
3 3 9 24 28 l l
4 4 12 9 l l 0
>4 7 21 7 8 l
Components may not add to 100 percent due to rounding.
Source: Data Collection Portfolios, 1977," and AWPA, 1975.
Wastewater Characteristics
Wastewater Volume--Data collected in 1973-1974 in preparation of the Development Document for the Wood Preserving Segment of the Timber Industry revealed significant differences between the volume of wastewater generated by plants in the Wood Preserving subcategory which use nonpressure processes or which treat with inorganic salts, and plants in the Steam and Boulton subcategories which use pressure processes and treat with oily preservatives. Non-pressure plants generate no process wastewater. Inorganic salts plants generate much lower volumes of wastewater than do plants treating with oily preservatives, and this wastewater can be reclaimed by recycling as dilution water for future patches of waterborne preservatives. Steaming plants generate a larger volume of wastewater than Boulton plants of similar size. However, this difference has narrowed considerably during the period 1974-1978 as a result of aggressive pollution control efforts among steaming 0 plants in the East. Factors that have contributed to this change include the following:
1. Adoption of closed steaming as a replacement for open steaming by some plants.
2. Replacement of barometric-type with surface-type condensers.
3. Recycling of barometric cooling water. 4. Predrying of a higher percentage of production, thus
70
55
24
20
0
2

reiducing total steaming time and excess wood water'.. 5. Se!gregation of contaminated and uncontaminated waste
st.reams. 6. Inauguration of effective plant maintenance and sanita
ti.cm programs. 7. Recycle of coil condensate.
Improvements; have also been made in the waste management programs at Boulton plants. However, the· changes that produced the greatest result with the smallest investment were made at.these·
_plants prior to 1973 in response to local arid state pollution control regulations~
Data presented in Section V of this document demonstrate that while differences in wastewater volumes between steaming plants and Boul tor1 plants still exist, the differences are less than those which existed in 1973 and 1974. The average steaming plant generates. approximately 30 percent more wastewater · on . a gallon per cubic foot basis than does the average Boulton plant. Steaming plants which treat a large portion of dry stock and closed steaming plants generate 12 and 56 percent l~ss wastewater, respectively, than do Boulton plants._ In 1973· and 1974, 75 percent of all steaming plants surveyed by EPA indicated .. that they E:?:i the_r then practiced or were planning to adopt closed steaming technology. Current information indicate_s that fewer than 50 pE:?rcent of all steaming plants have adopted closed steaming. Many plants reporteq that-high product color and low aesthetic quality of poles and lumber treated by closed steaming techniques were instrumental in their decision. to discontinue or not to adopt closed steaming.
The. previou:sly promulgated retained because the methods of process wastewater differ -Boulton subcategories.
subcategorization scheme is being commonly in use to treat and dispose significantly between the -S'team and
Wastewater ;parameters--einorganic salts plants generate a wastewater containing water soluble heavy metals, which can be recycled using commonly practiced reuse technology. Boulton and steaming plants treat with ·the same types of oily preservatives. Consequently, the wastewater generated by the- two types of plants contains similar preservative contaminants. This is verified by data presented in Section V.
Differences between Boulton and steaming wastewater in COD and pentachlorophenol concentrations are largely due to differences in oil and grease content. Oil-water-emulsions are more common in steaming plant wastewaters, a fact that accounts for the correspondingly. higher average oil content. It is probable that wood eitractives, principally resins and carbohydrates, act as. emulsifiers. Because the water removed from wood during the · Boulton process leaves the retort in vapor form and thus free of wood extractives, emulsions occur ·with considerably less frequency in Boulton wastewater. The higher oil content of the
71
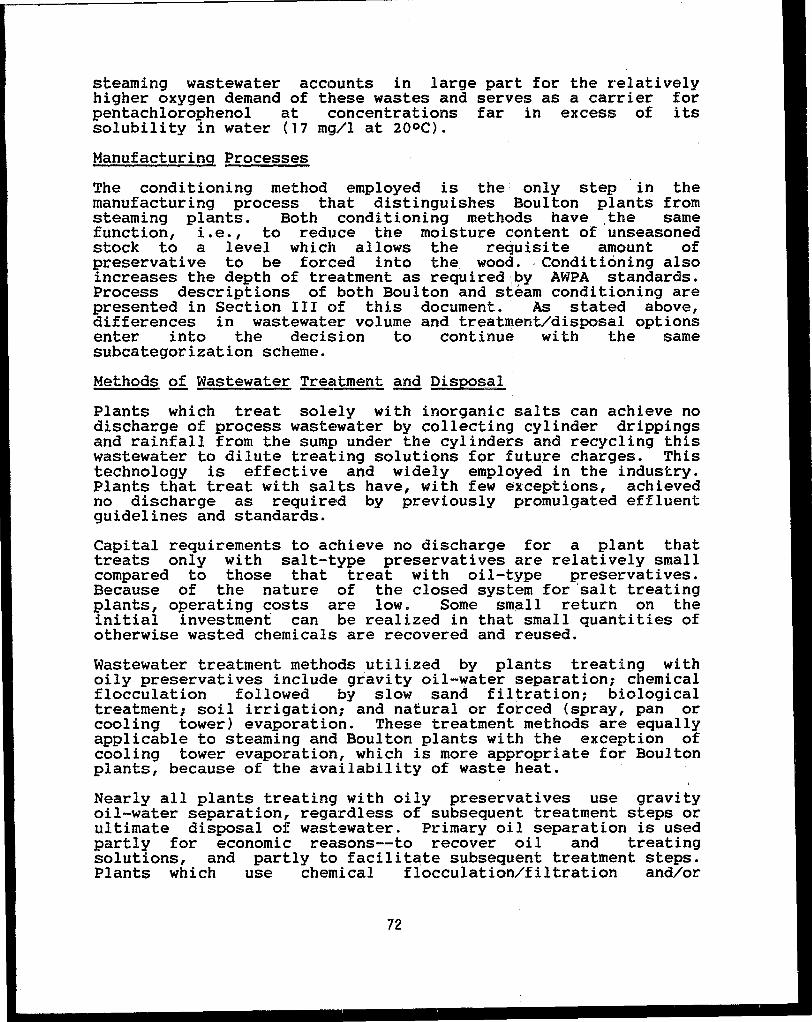
steaming wastewater accounts in large part for the relatively higher oxygen demand of these wastes and serves as a carrier for pentachlorophenol at concentrations far in excess of its solubility in water (17 mg/1 at 20°c}.
Manufacturing Processes
The conditioning method employed is the only step in the manufacturing process that distinguishes Boulton plants from steaming plants. Both conditioning methods have the same function, i.e., to reduce the moisture content of unseasoned stock to a level which allows the requisite amount of preservative to be forced into the. wood. ,Conditioning also increases the depth of treatment as required,by AWPA standards. Process descriptions of both Boulton and steam conditioning are presented in Section III of this document. As stated above, differences in wastewater volume and treatment/disposal options enter into the decision to continue with the same subcategorization scheme.
Methods of Wastewater Treatment and Disposal
Plants which treat solely with inorganic salts can achieve no discharge of process wastewater by collecting cylinder drippings and rainfall from the sump under the cylinders and recycling this wastewater to dilute treating solutions for future charges. This technology is effective and widely employed in the industry. Plants that treat with salts have, with few exceptions, achieved no discharge as required by previously promulgated effluent guidelines and standards. ·
Capital requirements to achieve no discharge for a plant that treats only with salt-type preservatives are relatively small compared to those that treat with oil-type preservatives. Because of the nature of the closed system for ·salt treating plants, operating costs are low. Some small return on the initial investment can be realized in that small quantities of otherwise wasted chemicals are recovered and reused.
Wastewater treatment methods utilized by plants treating with oily preservatives include gravity oil-water separation; chemical flocculation followed by slow sand filtration; biological treatment; soil irrigation; and natural or forced (spray, pan or cooling tower) evaporation. These treatment methods are equally applicable to steaming and Boulton plants with the exception of cooling tower evaporation, which is more appropriate for Boulton plants, because of the availability of waste heat.
Nearly all plants treating with oily preservatives use gravity oil-water separation, regardless of subsequent treatment steps or ultimate disposal of wastewater. Primary oil separation is used partly for economic reasons--to recover oil and treating solutions, and partly to facilitate subsequent treatment steps. Plants which use chemical flocculation/filtration and/or
72

biological treatment technology do so to pretreat the wastewater prior to di$charge, additional treatment, or disposal.
Plants treating with oily preservatives have generally chosen to meet previously published effluent limitations, by discharging pretreated wastewater to a POTW or by achieving no discharge status through either soil irrigation or evaporation. Soil irrigation and spray evaporation, equally applicable to steaming and Boulton wastewaters, require the availability of land.. The amount of land required depends on the size of the plant, amount of. wastewater generated, and local soil and. atmospheric conditions.
Boulton plants have a significant source of waste heat available. in the vaporized wood water and light oils sent to the condenser during the long vacuum phase of the treating cycle. This waste heat can be used to evaporate all or most of the process, wastewater by recirculation through a·. mechanical draft cooling. tower.. This method of forced evaporation, while occasionally requiring an external beat sour~e to evaporate exc~ss rainwater or other process water,· is cuiiently used by many Boulton plants to achieve no discharge. This technology requires very little land, generally less than o~e-tenth of an acre.
''
The vacuum cycle of steaming plants. is too snort to effectively utilize the waste heat of the vaporized wood water, and reliance must be made on the more land~intensive technologies of soil irrigation or spray evaporation to achieve no discharge.
Nonwater Q!!Elityimpacts
For the purposes of subcategorization, EPA is not aware of ·any nonwater quality environmental impacts that would justify a change to the pr,eviouslypublished subcategorization scheme.
Subcategory. Description and Selection Rationale -·
A careful, consideration of the plant. characteristics~ raw materials, _ wastewater volume produced, wastewater characteristics, manufacturing processes, available methods of wastewater treatment and disposal; and nonwater quality impacts as currently exist in the industry today suggests that the existing subcategorization of the wood preserving industry should be retained, with minor wbrding changes to clarify the· applicabili.ty of the regulation. ·
EPA· is, ·however, shifting- plants treating with fluoro-chrc,mium-arsenic-phenol (FCAP) · solution . from the Wood Preserving-·Steam to the Wood Preserving-Waterborne or Nonpressure subcategor}'. These plants were previously included in the Wood Preserving--Steam subcategory because 0
- plants. that use the FCAP preservativE~ often steam condition wood. The recent update of information, however, indicates that FCAP, which is a waterborne solution, 1.i:~ -more . properly included in. the Wood Preserving-·
73

Waterborne or Nonpressure subcategory (previously the Wood Preserving subcategory). FCAP may be applied to air or kiln dried wood, and its low volumes of wastewater may be recycled in the same manner as other waterborne salt solutions. Furthermore, the technical data base did not identify any direct or indirect discharging plants treating with FCAP.
Although there are similarities among all plants which treat with oily preservatives in terms of plant characteristics, raw materials, wastewater volume and characteristics, and manufacturing processes, the ability of the plants in the Boulton subcategory to use available waste heat to evaporate most, if not all, process wastewater indicates that current subcategorization, with the minor, recommended changes, is still valid.
The widespread use and low cost of technology resulting in no discharge for plants which are currently in the Wood Preserving-Water Borne or Nonpressure subcategory is the primary reason for retaining this subcategory.
The definitions of the wood preserving subcategories as finally promulgated are:
~ Preserving nonpressure wood wood preserving inorganic salts.
Waterborne g_r, Nonpressure Includes all preserving treatment processes, and all pressure
treatment processes employing waterborne
Wood Preserving-Steam Includes all wood preserving processes that use direct steam impingement on wood as the predominant conditioning method; processes that use the vapor drying process as the predominant conditioning method; direct steam conditioning processes which use the same retort to treat with both salt and oil-type preservatives; and steam conditioning processes which apply both ~alt-type and oil-type preservatives to the same stock.
Wood Preserving-Boulton Includes those wood preserving processes which use the Boulton process as the predominant method of conditioning stock.
INSULATION BOARD
Review of Existing Subcategorization
Effluent limitations guidelines have never been promulgated for the Insulation Board segment of the timber industry. The August 1974 Development Document for the Timber Products Processing Industry proposed two subcategories, based on differences in raw wastewater volume and strength between plants which steam precondition the wood raw material (thermomechanical refining) or which produce hardooard at the same facility, and plants which do not (mechanical refining). The Agency reviewed the proposed subcategorization with respect to the updated technical data
74

base, and decided that a single subcategory for all insulation board plants was appropriate.
During the review of the Insulation Board segment, with a focus on wastewater related to:
proposed subcategorization for the the industry was reviewed and s~rveyed characteristics and t;eatability as
Raw.Materials Manufacturing Processes Products Produced Plant Size and Age Nonwater Quality Impacts
Raw Material§_
The primary raw material used :in the manufacture of wood fiber insulation board is wood. This material is responsible fbr the major porti,on of the BOD and suspended sol ids in the raw waste. Other additives, such as wax emulsions, asphalt, paraffin, starch, and aluminum sulfate, comprise less than 20 percent of. the board weight and add very little to the raw waste load. Information , submitted by several mills has indicated .that wood species, season of wood harvesting, and the presence of bark
·and/or whole. tree chips in wood furnish affect the raw waste load of insulation board. plants. ·However,· due to a lack of sufficiently detailed plant dat?to quantify the effects _of these variables upon raw waste load, there was no sound basis for· subcategorization. strictly on the basis of raw material used to produce the board. ·
Four insulati6n board pl~nts produce insulation board u$ing mineral wool as a raw· material. Two of ~hese plants produce large· quantities of mineral wool··· insulation board on separate forming lines within the same facility·or in facilities s~par.a.te from the. wood fiber insulation board plant. One plant produces approximately SO percent of its total production as mineral wool insulation board on the. same.forming machine that it uses to produce wood fiber insulation board. Wood fiber and mineral ~ool wastewater from these. th~ee plants completely comingle.'.pr:Jor:: to monitoring. These plants were not used to determine raw\:,waste loads for wood f.iber insulation board. One plant produc;:es less than 10 percent of its total production as mineral:· wool insulation board, using thesatrie forming equipment as is used for wood fiber insulation board. Raw waste load data from this plant were used to develop raw waste loads for wood fiber insulation board as the contribution from the min·eral wood · production was considered to have no significant effect on the overall raw waste load .. All other plants analyzed for raw waste load .used only wood. as the primary material. ·
Four plants indicated in tlleir response to the DCP that wastepaper was used for a minor portion of their raw material in wood. fiber insulat.Jo~ board production. The small amounts of
- 75

wastepaper furnish used by these plants are not likely to appreciably affect their raw waste loads.
Manufacturing Process
Although a plant may have various auxiliary components in its operation, the maJor factor which affects raw waste loads is whether steam, under pressure, is used to precondition the chips prior to refining, or whether preconditioning is accomplished mechanically. Plants which do not steam their furnish under pre~sure, i.e., mechanical refining plants, demonstrate lower raw waste loads than plants which precondition chips using steam under pressure, i.e., thermomechanical refining plants. This was the primary reason for proposing separate subcategorization of this industry segment. The steam cook softens the wood chips and results in the release of more soluble organics. Data presented in Section V, WASTEWATER CHARACTERISTICS, support the general validity of subcategorization based on whether or not a plant preconditions its furnish using steam under pressure.
Products Produced
The ability of an insulation board plant to recycle process wastewater is highly dependent upon the type of product produced. Insulation board plants which produce primarily structural type board products such as sheathing, shinglebacker, etc., demonstrate lower raw waste loads primarily because of the increased opportunity of process water recycle at these plants. Two insulation board plants that do not steam condition their wood furnish have reduced their flow per un~t of production to less than 3,000 liters/metric ton (750 gallons/ton). These plants produc~ primarily structural type board products. Two insulation board plants that steam condition their wood furnish achieved complete recycle .of process whitewater, resulting in no discharge of process wastewater. Both of these plants produce solely structural type products.
Structural type products do not require the uniform color surface finish of decorative products and can contain a greater amount of wood sugars and other dissolved material from the process whitewater system.
Consideration was given to subcategorization on the basis of type of board product produced, i.e., structural versus decorative. However, the equipment at most plants is readily adaptable to the production of both types of board, and most plants rotate the type of board produced based on product demand, which is highly variable. Subcategorization according to board type would severely limit the ability of these plants to respond to competitive pressures, and would make the issuance of permits by enforcement agencies a difficult task. Therefore, subcategorization solely on the basis of product type is not considered feasible.
76

Plant Size. and Age
There is ~ substaritial difference in the age and size of the plants in the insulation board industry. However, older plants have been upgraded, modernized, and expanded to· the point that age, in terms of process, is meaningless. Because of this, the differences in wastewater characteristics related-to the age of the plant are not discernible, nor is the prorated raw waste. load, due to plant size. Raw waste load data presented ip Section V SUJ;>port this conclus_ion. ·· ·
Nonwater Quality Impacts ·
·For the purposes of subcategorization, EPA is not aware of any nonwater quality environmental. impacts ·that would· justify· a change to :.the previously published subcategorization scheme.
- . - ·~ . " - ~ ' . ~ . ;..
Subcategor~~ Description and Selection Rationale
The -Agency has decided to combine all insulation board plants into a sinigle subcategory. This decision is based on the practical reason that there are only two direct dis·charging plants which produce solely insulation board, and· that these plant~ have similar raw waste characteristics even th9ugh one plant practices thermomechanical refining and one plant practi.ces mechanical refining. Although data presented 'in ·section V support thte fact that·the.rmomechancial refining generally results in higher strength wastewaters, the single direct·discharging mechanical refining plant is an exception since it uses . 100 percent whole tree· chips as its primary raw materi_al, resulting in a higher raw waste load .. than . that of a typical mechanical
·refining plant. Based on treatment' system performance data presented for this sole direct discharging mechanical refining plant in Section VII, CONTROL AND TREATMENT TECHNOLOGY; it is expected t.hat this plant will be able to comply·. with proposed effluent limitations for all insulation board plantsj ·
Because t.he raw waste loads of BOD and TSS for thermomechanical insulation board plants are· similar t;.o .the. raw.. waste loads exhibited by S1S hardboard plants, the Agency considered combining the insulation board plants and S1 S hardboar'd pl'ants into one subcategory. Significant differences were found to . exist, howeiver, in the unit flow of wastewater generated by insulation board and SlS hardboard plants due.to the greater amount of i.nternal recycle possible for the insulation board plants. These differences in unit. flow, combined with differences in the treatability of insulation b6ard. and. SlS hardboard wastes due to additive diff~i:ences, · led.the:Agency to decide agai.nst ·combining. insulation board and S1S hardboard plants int.c> one subcategory.
As finally promulgated, the Insulation·•. Board 'subcategory compri,ses plants which produce insulation boa.rd using wood as. the raw materi.al. Specifically excluded from this subpar:t is the
77

manufacture of insulation board from the primary raw material bagasse.
WET PROCESS HARDBOARD
Review of Existing Subcategorization
Effluent limitations guidelines for wet process hardboard plants promulgated previously (1974) included all wet process hardboard plants in a single subcategory defined as plants engaged in the manufacture of hardboard using the wet matting process for forming the board mat.
After these regulations were promulgated, industry representatives presented data which they believed supported separate limitations and subcategorization for wet-wet (SlS) hardboard and wet-dry (S2S) hardboard.
In November 1975, the EPA retained a contractor to evaluate and review the regulations and the existing subcategorization of the industry. The Summary Report on the Re-Evaluation of the Effluent Guidelines for the Wet Process Hardboard Segment of the Timber Products Processing Point Source Category, completed in July 1976, recommended that the wet process hardboard industry be divided into two parts wet-wet hardboard and wet-dry hardboard. This recommendation was based on significant differences in the raw waste load characteristics of plants which produce hardboard by the two different processes.
In order to determine the validity of the resubcategorization and to determine whether changes within the industry since the Summary Evaluation Report was completed in 1976 occurred, the industry was reviewed and surveyed with a.focus on wastewater characteristics and treatability as related to:
Raw Materials Manufacturing Processes Products Produced Plant Size and Age Nonwater Quality Impacts
Raw Materials
·: ...,_; ·, ~
" t : . ' ;•, ,;~
The primary raw material used in the manufacture of hardboard is wood, and this material is responsible for the major portion of the BOD and suspended solids in the raw waste. Other additives, such as vegetable oils, tall oil, ferric sulfate, thermoplastic and/or thermosetting resins, and aluminum sulfate, comprise less than 15 percent of the board weight and add very little to the raw waste load. Information submitted by several plants has indicated that wood species, season of wood harvesting, and the
,presence of bark in wood furnish affect the raw waste load of hardboard plants. Because of a lack of sufficiently detailed plant data to quantify the effects of these variables upon raw
78

waste load, there was no sound basis for subcategorization strictly on the basis of.raw. material used to produce the board.
Manufacturin~ Processes
A plant may have various auxiliary components in its operation; however, the basic processes in the production of.either S1S or S2S hardboard are similar except for the pressing.operation. S1S board is pressed wet immediately after forming. S2S board is dried prior to being ·pressed. ·
SlS hardboard is produced wifh coarse fiber bundles cooked a relatively short time and at low pressure--40 seconds to 5 minutes at pressures of 80 to 180 psi. S2S·hardboard, which requires finer fibers, is produced with cooking times of· 1.5 td 14 ~inutes at pressures of 150 to 200 psi. The longer time and higher pressure cooks release more soluble organics from the raw material (wood), thus affecting the effluent raw wiste loading.
The S2S board also requires more effective ~iber washing to reduce the soluble solids that affect the product in the pressing and finishing operations. These operations result in more raw waste discharge to the effluent; less soluble solids.are retained in the finished board. After analyzing the available information. and observing the obvious differences between the processes.for wet-wet (S1S) and wet-dry (S2S) hardboard, it· appears justifiable .. to allow.for differences between wet-wet (S1S) and wet-dry (S2S) hardboard.
Products Proguced
A hardboard plant may produce SlS or S2S board, or both, but the end products at each plant cov~r a wide range of applications, surface designs, and thickness.
In conjunction ~ith hardboard, s~me ~lants produce other products such·. as insulation board; . batteJ:"y separators, and mineral insulation. Insulation board is produced either on its own forming line or on the same line used for S2S hardboard.· The various effluents for each line.are com~ngled upon discharge for treatment with little or no monitoring of flow and/or wastewater characteristics of the separate wastewater streams. The effluent 1 imitations promulgated are applicable only to the hardboar.d manufacturing operations.
Three plants produce a marketable animal feed byproduct by the evaporation of the highly concentrated wastewater. Several .other mills are investigating this process, which not only yields a salable product but also reduces the raw waste load that would require treatment.· Because this process is plant specific, it is not addressed in the subcategorization.
79

Size and Age of Plants
There are considerable differences in age and size of hardboard plants. Older plants have been upgraded, modernized, and expanded to the point that age in terms of manufacturing process is insignificant. Because of this, the differences in wastewater characteristics related to age of the plant are not discernible nor is the prorated raw waste flow due to the plant size. Raw waste load data presented in Section V support this conclusion.
Nonwater Quality Impact~
For the purposes of. subcategorization, EPA is not aware of any nonwater quality environmental impacts ~hat would justify a change to the previously published subcategorization scheme.
Subcategory Description and Selection Rationale
Analysis of the above factors, supported by data presented in Section V of this document, WASTEWATER CHARACTERISTICS, affirms the validity of separate subcategorization for wet-wet (S1S) hardboard and wet-dry (S2S) hardboard.
The Agency decided, therefore, to divide the Wet Process Hardboard subcategory into two parts. Part (a) establishes limits for plants producing wet-wet hardboard (SlS), part (b) establishes limits for plants producing wet-dry hardboard (S2S).
As finally promulgated, the Wet Process Hardboard subcategory is defined to include any plant which produces hardboard products using the wet matting process for forming the board mat.
80

GENERAL
SECTION V
WASTEWATER CHARACTERISTICS
The purpose of this section.is to define ·the wastewater quantity and quality for plants in those subcategories identified in Section IV. Raw waste concentration and load data are presented for conventibnal pollutants, nonconventional pollutants, and· toxic pollutants in each subcategory.
The term !'raw waste lqadll (RWL}, as utilized in this document, is defined as .the quantity of a pollutant in wastewater prior to an end-of-pipe treatment process. Where treatment processes. are designed primarily to recover raw materials from the wastewater stream, raw waste loads .. are ol;:>taineq following .. these processes. Examples are gravity oil-:-water separators in wood preserving, or · fine screens used. for fiber recovery in insulation· · board . and hardbo.ard , plants~ The· raw waste load is normally expressed in· terms of mass (weight} units per day or per production uriiL
For the purpose of cost analysis only, representative raw waste characteristics have· been defined for. each subcategory in order··
. to establish design.parameters for model plants. ·
Th~ data presented, in this document_~ are based on the most · current, re,presentative information available. from each plant contacted. Verification sampling data are used to supp1ement historical data. obtained from the- plants forthetraditional poll·utants, and in most cases verificati_on sampling data are. the sole source of quantitative information for toxic pollutant raw waste loads.,
WOOD .PRESERVING
General Char~cteristics
Wastewater characteristics vary with the particular preservative. used, the volume of stock that is conditioned prior to treatment, the conditioning method used, and the extent to which wastewaters.· from the retprts are diluted with water.from ot~er sources.
Wastewaters frpltt , creosote and ·pentachlorophenol treatments often have high phenolic, COD, and oil concentrations and a turbid appearance that results from emulsified oils. They are always acid in reaction, the pH values usually falling within the r;ange of 4. 1 to 6. O. The high .COD contents of such· wastes are caused · by entrained oils and wood extractives, principally simple sugars, that are removed. from wood during steam conditioning .. These wastewaters may also contai.n traces . of copper, chromium, arsenic, zinc, and boron at plants that use the same retort for-· both waterborne salts ·and oil-type preservatives, or that apply
81

dual treatments to the same stock; i.e., treat with two preservatives, one of which is a -salt formulation. Organic toxic pollutants in wastewaters from plants which treat with pentachlorophenol and creosote preservatives only are principally volatile organic solvents such as benzene and toluene, and polynuclear aromatic compc>nents of creosote which are contained in the entrained oils. Specific phenolic compounds identified in these wastewaters include phenol, chloro-phenols, and the nitrophenols.
Preservatives and basic treating practices and, therefore, the qualitative nature of wastewaters vary little from plant to plant. Quantitatively, however, wastewaters differ widely among plants and vary with time at the same plant.
Among the factors influencing both the concentration of pollutants and volume of effluent, the m~isture content of the wood prior to conditioning, whether by steaming or the Boulton process, is the most important. Water removed from the wood during conditioning accounts for most of the loading of pollutants in a plant's effluent and influences wastewater flow rate. The moisture content of the wood before conditioning determines the length of the conditioning cycle; the wetter the wood, the longer the conditioning cycle.
Rainwater that falls on or in the immediate vicinity of the retorts and work tank area--an area of from about one-quarter to one-half of an acre for the average plant--~becomes contaminated and can present a treatment and disposal problem at any plant, but especially at plants in areas of high rainfall. For example, a plant located in an area that receives 152 cm (60 in) of rain annually must be equipped to process an addi'tional 1.5 to 3.0 million liters (400,000 to 800,000 gallons) per year of contaminated water.
Another factor which influences the concentration of pollutants, particularly organic pollutants, is the type of solution or solvent used as a carrier for the preservative (coal tar, oil, etc.).
Wastewaters resulting from treatments with inorganic salt formulations are low in organic content, but contain varying concentrations of heavy metals used in the preservatives and fire retardants employed. The nature and concentration of a specific ion in wastewater from such treatments depend on the formulation employed and the extent to which the waste is diluted by washwater and stormwater.
Wastewater Quantity
The quantity of wastewater generated by a wood preserving plant is a function of the method of conditioning used, the moisture content of wood to be treated, the amount of rainwater draining toward the treating cylinder, and the quantity of other
82

wastewater streams (such as boiler blowdown, cooling water, sanitary wastewater, water softening regen~rjnt, etc.). Ignoring the amount of dilution from other wastewater streams, the sources and approximate ranges of wastewater generated per unit of production fc>r Boulton and steaming plants ( including vapor drying plants;) are discussed below. It should· be noted that most wood preserving plants treat stock having a wide range.of moisture cont~nts, and often air- or kiln-dry stock. Although most plants will predominantly use one of the major conditioning methods, many plants will use a combination of several conditioning methods. For this reason,· the actual quantity of. wastewater gEmerated by a specific piant may vary considerably.
Steam Condi ti~,n~rig a~~ '\7ctpor- D:t:'y_~ng
Primary sourcE~s of ·wastewater from steam conditioning include steam condensate in cylinders, wood water, and precipitation. In open steaming, steam. is injected directly into the retort and allowed to ccmdense on the wood and cylinder walls. The amount of water produced is dependent upon the length of conditioning time and the·amount of insulati~n, if any, around the cylinder. Steam condem;ate in the cylinder may range between 240 to .1, 2.00 kg/cum (15 lb/cu ft to 75 lb/cu ft). In modified closed steaming, stE~am is added to the cylinder until the steam coils are just covered with condensate. Then the steam is no longer injected directly into the cylinder but passed through coils to boil the condEmsate.. Water added is about· 112 kg/cu m ( 1 ·· lb/cu ft), dependi.r1g upon· the diameter of the. retort and the height of the steaming .coils.
, ·~ . r
In closed stE~aming, wate_r is drawn from a storage tank and put into the cy]linder until the steam coils are covered. Steam is turned on, passed through the coils, the· steam· condensate returned to the boiler, and the ... ater in the cylinder is boiled to. condition.the wood. After steaming, the water in the cylinder is returned to the storage tank; There is a slight inctease in volume of water in the stora~e tank with sach conditioning cycle due to wood water exuding when green ~ood is conditioned. There is a smal 1 blowdown from the storage tanJc to prevent the wood sugar concentration.in the water from becoming too high.
In tne vapor drying process, the primary sources of wastewater are wood wetter and precipitation. As in any wood preserving process, smal]l amounts of condensate may result from a short exposure to live steam applied following preservative application to clean thE~ surface of the stock. The. vapor ·drying process consists essEmtially of exposing wood in a_ closed. vessel to vapors from ~my one of many organic chemicals that are immiscible with· water arid that have a narrow boiling range. Chemicals with initial boili.ng points of from 100°c to 2040c (212°F to 400.°F) may be. used. Vapors for drying are generated by boiling the· chemical in ah evaporator. The vapors are conducted to the retort contcti.ning the wood, where they condense on the wood, giving up thEd.r latent heat of vaporization and causing. the water
83

in the wood to vaporize. The water vapor thus produced, along with excess organic vapor, is conducted from the vessel to a condenser and then to~ gravity-type separator. The water layer is discharged from the separator, and the organic chemical is returned to the evaporator for reuse. ·
After the treating cylinder has been drained, a vacuum is pulled from one to three hours to remove water from the wood. The quantity of water removed depends upon the initial moisture concentration of the wood, the strength of the vacuum pulled, and the temperature in the cylinder. Common vacuums are 55 cm (22 in) to 70 cm (28 in), and common temperatures are from 1100c (2200F) to 1400C (245°F). The maximum temperature allowable is 1400c (245°F), above which wood strength deterioration is experienced. The vapors are condensed and collected in an accumulator. The amount of water removed from the wood is generally between 64 and 128 kg/cum (4 and 8 lb/cu ft).
Cylinder drippings and rain water are often added to the flow from the cylinder and fed to· the oil-water. separator. In some plants they are fed to a separate oil-water separator to prevent cross contamination of preservatives. Rain water can vary between O kg/cu m (0 lb/cu ft) when no rain is falling, to 181 kg/cum (11.3 lb/cu ft) during a 5-cm (2-in) rainfall in 24 hours, depending on the area drained toward the treating cylinder. The minimum area in which rain water is collected includes the immediate cylinder area, the area where the wood removed from the cylinder drips extra preservatives, and the preservative work tank area. ·
Boulton Conditioning
Primary sources of wastewater from Boulton conditioning include wood water and precipitation. Steam condensate inside the cylinders is not a primary source of wastewater as it is in steam conditioning. Small amounts of condensate, however, may result from a short exposure to live steam applied following preservative application to clean the surface of the sto.ck.
Conditioning is accomplished in the Boulton process by heating the stock in a preservative bath under reduced pressure in the retort. The preservative serves as a heat transfer medium. Water removed in vapor form from the wood during the Boulton process passes through a condenser to an oil-water separator where low boiling fractions of the preservative are removed. The Boulton cycle may have a duration of 48 hours or longer for large poles and piling, a fact that accounts for: the lower production per retort day as compared to plants that ste.am condition.
After the oil has been heated a vacuum is drawn on the cylinder for 10 to 48 hours for Douglas fir and 6 to 12 hours for oak, depending upon the initial moisture content of the wood. The oil transfers heat to"the wood and vaporizes the wood water. Between 64 and 192 kg/cum (4 and 12 lb/cu ft) of water is removed.
84

Cylinder drippings and rain water are often added to the flow in the same manner as steam conditioning ..
Historical Qata
Historical data on wastewater generation relating to production were requested as part of the DCP~ during plant visits, and in conjunction with telephone follow-up requests for information. These data are presented. in Tables V-1 through V-4. Data appearing in these tables represent historical information on the average wastewater flow and production of treated wood (oily preservatives only) for a one-year period, 1976.
Where the information .available was sufficiently detailed, other wastewater sources such as boiler blowdown, noncontact cooling water, sanitary water, and rainfall. runoff from treated material storage yards were subtracted from the total wastewater flow reported by the plant in .. order to obtain information on the generation of process wastewater only. Rainfall falling directly on or draining into the cylinder or work tank area was included in the wastewater flows reported in Tables V-1 through V-4.
It is apparent from these data that closed steaming plants and plants which treat.predominantly dry· stock generate the least amount of wastewater per unit of production, followed by Boulton plant.s and ,open steaming plants, respectively.· As shown in Tables V-2 and V-3, the average volume of wastewater generated per unit of production for plants which treat significant amounts of dry stock is greater than that for the closed steaming plants. This is most likely because of the fact that some of the plants which treat significant amounts of dry stock, condition the remaining stock by open steaming and/or post steam the treated stock to clean it. As a result, the net wastewater production
.exceeds that for plants which practice closed steaming.
The long-term histqrical wastewater information for some plants, as presented in Tables V-1 to V-4, may differ somewhat with the sampling data presented later in this section. The sampling data is based on the production·and wastewater generation during a one or three-day composite sampling period; the. historical data is for a one year period and was used to· determine overall differences in wastewater volumes among .wood preserving Boulton and Steam subcategory plants as input to industrial subcategorization determinatiqns ~iscussed in Section IV.
85

Table V-1. Wastewater Volume Data for 14 Boulton Plants
PRODUCTION VOLUME Plant (ft3/day) (m3/day) (gal/day) (l(day) (gal/ft3) ( 1 /m3)
587* 17,950 508 7,000 26,500 0.39 52. 1
1028* 2,040 57.7 1,000 3,790 0.49 65.5
583* 7,370 209 7,000 26,500 0.95 127
1078++ 8,475 240 5,000 18,900 0.59 78.9
67* 1,765 49.9 2,010 7,600 1. 14 152
759+* l, 665 47. 1 5,040 19,100 3.03 405
1114+* 2,175 61.6 l, 500 5,680 0.69 92,3
176+* 4,400 125 2,510 9,500 0.57 76.2
577++ 8,430 239 15,000 56,800 1.78 238
534* 1,365 38.6 900 3,410 0.66 88.2
61* 7,140 202 5,500 20,800 0.77 103
552* 6,085 172 4,320 16,400 0.71 94.9
555++ 5,310 150 17,300 65,500 3.26 436
111 O++ 1,700 48.l 4,320 16,400 2.54 340
AVERAGE 5,420 153 5,600 21,210 1.03 139
* Achieving no discharge.
+ Data from 1975 Pretreatment Study.
** Includes boiler blowdown, uncontaminated steam condensate.
++ Discharges to a POTW
86

Table V-2 .. Wastewater Volume Data for Eight Closed Steaming Plants
PRODUCTION VOLUME Plant (ft3/day}"""(m3/day) (gal/day} ( 1/day.) (gal/ft3)
40* 4,920 139. 3,000 11,400 0.61--·
237* 3,300 93.4 800 3,030 0.24
355* 6,100 173 3,300 12,500 0.54
335++ 2,620 7 4. 1 2~-500 9,460 0.95
750* 1,785 50.5 300 1, 140 0. '17
656* 830 23.5 500 1,890 0.60
43* 360 10.2 350 1,320 0.97
226+* 4,600 130 230 870 o.os AVERAGE 3,065 86.7 1,370 5,200 o. 45
:-
* Achieving no.discharge.
+ Data from 1975 Pretreatment study.
++ Discharges to a POTW
87
( 1/m3)
81 . 6
32.4
72.3
128
22.6
80.4
130
6.68
60.0

Table V-3. Wastewater Volume Data for 11 Plants Which Treat Significant Amounts of Dry Stock
PRODUCTION VOLUME Plant (ft3/day) (m3/day) (gal/day} (1/day} (gal/ft3)
596++ 1,200 34.0 2,500 9,460 2.08
591* 19,000 538 12,500 47,300 0.66
620++ 1,370 38.8 7,200+ 27,300 5.26
688* 360 10.2 400. 1,510 l. 11
1105* 800 22.6 750 2,840 0.94
1071* 4,660 132 4,000 1:s, 1 oo 1.03
631* 2,040 57.7 876 3,320 0.43
350* 985 27.9 1,500 5,680 1.52
665* 3,330 94.2 400 :1,510 0.15
267++ 5,000 141 5,000 18,920 1. 18
140* 4,500 17,000
AVERAGE 3,870 110 3,510 f3,300 0.91
* Achieving no discharge.
+ Includes 5,400 gal/day ~oiler blowdown an:a non contact water; process wastewater per cubic foot production= l . 31 .
++ Discharges to a POTW
NOTE: Plant 140 not included in average since no production data are available.
88
,( l /m3}
278
87.9
703
148
126
138
57.5
203
20. l
158
121

Table V-4. Waf;tewater Volume Data for 14 Open Steaming Plants
PRODUCTION VOLUME Plant (ft3/dcly} (m3/day) (gal/day) ( 1/day} (gal/ft3) ( 1/m3)
847* 80() 22.6 1,780 6,740 2.22· 298
895* ·- 4,_ 16() 118 7,200+ 27,300 1. 73 231
897* 10,30() 291 33·, 000 12,500 3.20 428
900* 8,17() 231 _1§, SQQ ~2.,_590 2.02 270
901++ 4, 22!> 120 3,000 11,400 0. 7.1 94.9 ,-H"
- 18' 900 894++ 6,58() 186 5,000 o. 76 - 102
899++ 1,11() 31.4 10,000 37,800 9.01 1200
898++ 5,00() 142 2,750 10,400 0.55 73.5
701* 6,27!> - 178 15,000 56,IBOO 2.39 - 320
548* 10,000 238 - 14,000 53,000 1.40 107·
693++ 1, 44!) 40.9 2,500 9,460 1. 73 231
1076++ 3,865 109 5,750 21,800 2.07 277
910++ 1,040 29.4 3,000 11,400 2.88 395-
547++ __ 6,150 174 10,000 37,800 3.25 435.
AVERAGE 4,940 137 9,250 32,300 1.87 236
* Achieving no discharge.
+ Includes stormwater from treating -
area •.
++ Discharges tt::> a POTW
-,,: ..
89

Plant and Wastewater Characteristics
Very little histprical data on toxic pollutants in wastewater effluent were available from individual wood preserving plants. The source of the toxic pollutant data presented in this section is analytical results from verification sampling programs conducted by the Agency. Characteristics of wood preserving plants which were visited and sampled during the 1975 Pretreatment Study and during the BAT review study are presented in Table V-5 for steam conditioning plants and in Table V-6 for Boulton plants.
Data from three sampling and analytical programs comprise the verification data base and are presented iri Tables V-7 through V-20. Data for plants sampled during the 1975 Pretreatment Study represent the average of two or more grab samples collected at each plant. Data for plants sampled during the 1977 and 1978 verification sampling programs represent the average of three 24-hour composite samples collected at each plant. Unless otherwise noted, the raw wastewater sampling point at each plant was immediately following gravity oi 1-water separation-.
Pollutant concentrations and raw waste loads for individual plants are shown in Tables V-7 ¼hrough V-19. Variations in pollutant concentrations from plant to plant can be attributed to the degree of emulsification of oils in the wastewater, the type of oily preservatives or carrier solution used, i.e., creosote in coal tar, creosote in oil, pentachlorophenol in oil, etc., and the amount of nonprocess wastewater added to the process wastewater stream, i.e., boiler blowdown, rainfall, steam condensate, etc.
Metals data are presented separately in Tables V-16 and V-17 tor plants which treat with oily preservatives only, and in Tables v-18 and V-19 for plants which also treat with inorganic preservatives at the same facility. Increased concentrations and waste loads for heavy metals, particularly copper, chromium, and arsenic, are apparent for plants which treat with both types of preservatives. Although the inorganic treating operations at these plants are for the most part self contained and produce little or no wastewater, the process wastewater from the organic treating operations contains heavy metals. · This "fugitive metal" phenomenon is the result of cross contamination between the inorganic and organic treating operations. Personnel, vehicles, and soil which come in contact with heavy metals from the inorganic treating operations can transport the metals into the organic treating area where rainfall washes them into collection sumps. Some plants may also alternate organic and inorganic charges in the same retort, causing cross contamination.
Plants which treat with inorganic salts only are not allowed to discharge process wastewater under previously published regulations either to a navigable waterway or to a POTW. All but
90
a few of theise plants recycle all their process water as dilution water for future batches bf treating solution.
No plants treating with inorganic salts only were sampled during the verification sampling program. One such plant, however., was sampled once~ a week for one year in conjunction with the Pretreatment Study. The concentration range of COD, total phenols1 heavy metals, fluoride, and nutrients found in·the recycled wastewater .at this. plant are presented in Table v-20~
91

Table V-5. Characteristics of Wood-Preserving Steaa Plants fran 'Which WastE!W'ater Samples were Collected during 1975 Pretreatment Study, 1977 Verification Sanpling Study, and 1978 Verification Sampling Study
Plant Conditioning Treatment or Raw Flow Pro1uction Number Process Preservatives1 Pretreatment2 (1/day) (a /day)
173-a Steaming C,P,CCA pH Adjustment, Flocrulation, Chlorination, Sand Fil~ration
11>400 110
237-a Steaning C,P,CCA pH Adjustment 7,570 14;2
267-a Steaming C,P Flocculation 22,700 18 7
267-b Steaming C,P Flocculation 28,800 164
267-c Steaoing C,P Flocculation, Sand Filtration 34,500 280
335-a Steaming C,CCA Flocculation, pH Adjustment, 6,430 96 Chlorination
ID N 499-a Steaning P,CCA pH Adjustment <950 55
547-a Steaning C,P Oxidation Pond 94,600 226
548-b Steaming C Aerated Lagoon, Oxidation Pond, Spray Evaporation
j1,ooo 248*
548-c Steaming C,P Aerated L_agoon, Oxidation.Pond, 122,500 439 Spray Evaporation
582-a Steaming C,P,CCA,FR Flocculation 52,040 212
591-b Steaming C,P Activated Sludge, Oxidation Ponds, 35,400 320 Spra-t Irrigation
591-c Steaming C Activated Sludge, Oxidation Ponds, 13,200 224 Spray Irrigation

1.0 (.,-)
Table V-5. Characteristics of Wood-Preserving Stean Plants fran which Wastewater Sanples were Collected during 1975 Pretreatment Study, 1977 Verification Sampling Study, and 1978 Verification Sampling Study (Continued, page 2 of 2)
Plant Conditioning Number Process Preservatives!
593-a Steaming C,P
693-a Steaming C,P
765-a Steaming C
897-c Steaming, C,CCA Vapor Drying
898-a Steaming C,P
1076-a Steaming C,P ·,
1100-b Steaming C,P
1111-a Vapor Drying C
Treatment or Pretreatment2
Flocculation, Oxidation Pond, Lagoon, Sand Filtration for PCP Effluent
Oxidat.ion Pond, pH Adjustment
Flocculation
Aeration Ponds, Spray Irrigation, Sand Filtr_ation
Oxidation Pond, Spray Evaporation
Flocculation
Secondary Oil Separation, Oxidation Pond, Spray Irrigation, Aerated Racetrack
Flocculation, Sand Filtration, pH Adjustment, Aerated Lagoon, Oxidation. Pond
Raw Flow (1/day)
34,100
20,800
18,900
160,500t
7,570
45,360
236,600
94,600
Production (m3/day)
348
85
76
515
85
156
461
198
1 Creosote (C), pentachlorophenol (P), salt-type preservatives (CCA, ACA, CZC), fire retardants (FR). 2 Al 1 plants process wastewater through gravity-type separators. * Information obtained from historical data supplied by plant. t Figure includes rainfall runoff fran large area, a Data collected during· 1975 Pretreatment Study. b Data collected during 1977 Verification Sampling Study, c Data collected during 1978 Verification Sampling Study.

1,0 .;..
Table V-6. Characteristics of Wood Preserving Boulton Plants from which Wastewater Samples were Collected during 1975 Pretreatment Study, 1977 Verification Sampling Study, and 1978 Verification Sampling Study
Plant Conditioning Treatment or Raw Flow Production Number Process Preservatives 1 Pretreatment2 (I/day) (m3/day)
65-a Boulton C,P,CZC,FR Flocculation 18,900 142
65-c Boulton P,CZC,FR Inline Flocculation, Secondary 8,330 78 Oil Separation, Gravel Filtration
67-b Boulton p Evaporation Tower 28,400 62
1078-a Boulton C,P,ACA,FR Secondary Oil Separation, 26,500 283 Oil Adsorbing Media
1078-b Boulton C,P,ACA,FR Secondary Oil Separation, 57,900 308 Oil Adsor'bing Media
1 Creosote (C), pentachlorophenol (P), salt-type preservatives (CCA, ACA, CZC), fire retardants (FR). 2 All plants process wastewater through gravity-type separators, a Data collected during 1975 Pretreatment Study. b Data collected during 1977 Verification Sampling Study, c Data collected during 1978 Verification Sampling Study,

Table V-7. Wood Preserving Traditional Parameter Data'
STEAM --Plant Data Flow Prod. Raw Concentrations (mg/1) Raw Wasteloads (lb/1,000 ft3) Number Source (gal/day) (ft3iday) Total Phenols PCP n.1..r . COD . Total Phenols PCP O+G COD v•v
173tt PS '75 3000 3880 10.8 306.0 1755 10460 0.0697 1.97 11.3 67 .4 237 PS '75 2000 5000 302.4 49.0 979.2 3593 1.01 0 .163 3.27 12.0 267tt PS '75 6000 6600 69.2 34.5 718.5 6377 ·o.525 0.262 5.45 48.3 267ft ESE '77 7600 5800 40.0 6.29 · 1902 8979 0.437 0.0687 20.8 98.1 267* ESE '78 9120 9890 14.9 16.0 143 14600 267t ESE '78 9120 9890 8.17 25.0 68.0 14300 335tt PS '75 1700 3400 334.4 -- 32.2 2457 1. 39 <o . ooo 1 0 .134 10.2 547** PS '75 25000 8000 62.1 35.4 518 .o 7079 1.62 0.923 13;5 184.5 548*** ESE '77 8200 8760 . 45.0 158.0 927.0 3706 0.351 1.23 '7. 24 28.9
c.o 548*** ESE '78 32260 15500 0.640 · 9~49 351.3 '2806 0.011 0 .165 6 .10 4.8. 7 u,
582tt PS '75 13750 7500 101.3 26.7 1785 15273 1.55 0.408 27.3 233.5 591*** ESE '77 9350 11300 237.5 22.3 474.0 3010 1.64• 0 .154 3. 27 20.8 591*** ESE '78 3500 7920 22.0 1. 20 17 3200 0.08ll 0.0044 0.0627 11.8 593** PS '75 9000 12300 335.3 47 .9 1365 8880 2.05 0.292 8.33 54.2 693 PS '75 5500 3000 32.3 18.0 536.3 3079 0.494 0. 275 8.20 47.1 765tt PS '75 5000 2700 501.J .• -- 732.8 15694 7,74·<0.0001 11. 3 242 897*** ESE '78 42400 18200 49.0 2.70 460 1900 ,0. 952 0.0525 8.94 36.9 898** PS '75 2000 3000 292.4 50.3 773.0 7ll6 1.63 0 .280 4.30 39.6
1100 ESE '77 62500 16300 34.3 57.J 950.2 8844 1.10 1.83 30;4 283 1111*** PS '75 25000 7000 383.3' -- 11.0 1356 11.4 <0.0001 0.328 40.4
Average Wasteloads 1.89 0 .539 9.46 83.7 NA: Not Analyzed ..
Hyphen denotes that parameter was analyzed for but was below detection limit. * Data from creosote separator (wasteloads cannot be calculated since flow measurements for the individual separators
. were unobtainable). Not included in averages. t Data from PCP separator (wasteloads cannot be calculated since flow measurements for the individual separators were
unobtainable). Not included in averages. ** . Plants used to calculate raw averages in Table VII-35. tt Plants used to calculate raw averages in Table VII-36. *** Plants used to calculate raw averages in Table VII-37.

Table V-8. W:xxl PreseIVi~ Tra:litional Paraneter Data
BClJ.L'lOO
Raw Concentratiom (mg/1) R8N Wasteloa:ls (lb/1,000 ft3) Plant Data Flow Prod. Total Total Nmber Cource (gal/day) (ft3 /day) phenols PCP OfG <DD TSS phenols PCP OfG <DD TSS
65* PS 175 5000 5000 184.0 5.70 '34.7 1711 NA 1.53 0.0475 0.289 14.3 NA 65* ESE 178 2200 2770 0.910 27.0 164 520 81 0.0060 0.179 1.09 3.44 0.537 67 ESE '77 7500 2200 - - 1357 7316 NA <o .0001 <o .0001 38.6 208.0 NA
1078* PS '75 7000 10000 508.6 0.01 12.3 3704 NA 2.97 0.0001 0.0718 21.6 NA 1.0 1078* ESE '77 15300 10900 1272 - 39.4 5797 NA 14.9 <0.0001 0.461 67.9 NA O'I
<3.88 <0.0454 8.10 63.0 0.537
NA: N::>t Analyz.ed. * Plants used to calrulate rcJN avercges in Table VII-36.
- Hyphen denotes that paraneter was analyz.ed for but- was belav detection limit.

-,\0 ......
Table V-9. Wood Preserving VOA Data
Plant Data Number Source
267* ESE '78
267t ~SE '78
548ft ESE '78
591ft ESE '78
895ft ESE '78
Flow (gal/day)
9120
9120
32360
3500
42400
Wa'steload Averages
154** ESE '78 2200
P3od. (ft /day) mecT
9890 0.006
9890
15500 0.702
7920 0 .280
18200 0.077
2770 2.60
STEAM
Raw Concentrations (mg/1) trclme
0.020
0.009
benzene et benzene
0.003
0.013
1.05
2.80
>l.62
0.037
0.170
0.867
2.10
0.380
BOULTON
toluene
0.027
0.170
2.84
3.20
0.500
Raw Wasteloads (lb/1000 ft 3) mecl trclme benzene etbenzene toluene
0.0122 <0.0001 0.0183
0 . 0010 0.0001 0.0103
0.0015 <0.0001 >0.0315
0.0049 <0.0001 >0.0200
0 .0172 <O .0001 <O .0001
0.0151 0.0495,
0.0077 0.0118'
0.0074 0.0097
0.0101 0.0237
<0.0001 <0.0001
* Data from creosote separator (wasteloads cannot be calculated since flow measurements for the individual separators were tinobt ainab le). Not included in averages.
t Data from _PCP separator (waste loads cannot be calculated since flow measurements for the individual separators were. unobtainable). Not. included in averages. ·
** Plant. uses methylene chlor_ide as a carrier solvent in a proprietary treatment process. Not included in averages. tt Plants used to calculate raw· averages in Table VII-38. ·
Hyphen denotes that parameter was analyzed for but was below detection limit.-

Table V-10. Substances Analyzed for but Not Found in Volatile Organic Fractions During 1978 Verification Sampling
vinyl chloride chloroethane chloromethane bromomethane tribromomethane bromodichloromethane dibromochloromethane carbon tetrachloride dichlorodifluoromethane trichlorofluoromethane 1,2-dichloroethane 1,1-dichloroethane 1,1,1-trichloroethane
1,1,2-trichloroethane tetrachloroethane 1,1-dichloroethylene trans 1,2~dichloroethylene tetrachloroethylene trichloroethylene 1,2-dichloropropane 1,3-dichloropropylene Bis-chloromethylether Bis-chloroethylether 2-chloroethylvinylether acrolein acrylonitrile
The average detection limit for these compounds is 10 ug/1.
98

.1.0 1.0
Tab le V-11. Wood Preserving Base Neutrals Data
Plant Data Flow Psod. Number Source, (gal/day) (ft /day)
267 ESF. '77
267* ESE '78
267** E,SF, ''78
7600
9120
9120
!
0.087
1i
0.8l6
22.0
3.40
STEAM
5 Raw Waste Concentrations (mg/1)
6 7 8 9 10
0.043, 0.130
0.111
7.10
2.40
IT
0.378,
45.Q
17.0
548 ESE ')7 8200
5800
9890
9890
8760
15500
1.27
35.0
4.80
0.6,J,3
6.43
0.870
17 .o 1.60
0.636
0.027
1.68
0.027 0. 360 0.007
1.35
6. 72
14.0
18.0
2.52
11.5
1.95
39.0
6.50
2.96
0.067 -- 2.20
548 ESE '78 , 32360 ,
59i : ESE 1 77 9350
591 ESE 1 78 3500
ESE '78 42400
11300
7920
18200 897
llOO ESE '77 62500. ,, 16300
65*** ESE '78
67***ESE '77
1078 ESE '77
2200
6550
15300
2770
2200
10900
1.68 {,.85
0.017 0.644
3.90 13.0
0.350 0.350 1.10
0.502
0.282 0.194
2. 70
0.420
rt,._,
0.490
5. 50
0.006
0.315
0;006
0.006
BOULTON
0.920
1.51
1.33 -- 31.0
0.157 -- 0.970
7 .40 ,Q.430 . 34. 7
)3.47
0.094 0.464
0.034 3.14
* Data from creosote separator (wasteloads cannot be calculated since flow measurements for the individual separators were unobtainable. Not included in averages.
** Data from PCP separator (wasteloads cannot be calculated since flow measurements for the individual separators were unobtainable. Not included in averages. ' *** These plants were treating solely· )lith PCP 'and not creosote formulations duri(ll the sampling period.
-- Hyphen denotes that paraneter was analyzed for ''but was below detect ion limit.
~ey to Base Neutral Data Tables
I. Fluoranthene 2. Benzo (B) Fluoranthene 3. Benzo (k) Fluoranthene 4. Pyrene
: 5. Benzo (A) Pyrene 6. Indero (I, 2, 3-CD) Pyrene 7. Benzo (ghi) Perylene . 8. Phenanthrene and/or Anthracene
9. Benzo (a) Anthracene 10. Dibenzo (a, h) Anthracene I I. Naphthalene · 12. Acenaphthene 13. Acenaphthylene 14. Fluorene 15. Chrysene 16. Bis-2-ethyl-hexyl phthalate
I!
i.30
55.0
10.0
1.06
4.36
1.46
15.0
I 1.70'
Lil
2.83
fJ
• n, 1..uJ.
1.20
1.21
0.526
0.933
1.10·
0.006
0. 725
2.06
fli
2._J l
48.0
8.40
0.82
3.59
1.01
11.0
1.50
1.11
'0.824
f5
0.065
4. 70
0.073
1.43
0.246
0.930
0.098
0.0'18
I"6
0.126
0.1,37,
0.'087
0.201
0.433
1.46
. I

Td>le v-12. lobcl Prseivirg 8a,e lbJ,tnh Data
!!!!!. Plant ll!ita Flow !;§al, lluibftr Source (gal/clay) (f /day) I :z l 4 5
Riw Waste loafs (11\fl 1000 ft:3) Ii , B 9 m II I:Z IJ I4 I5 15
2671 ESE '77 7600 5000 0.0133 (0.0001 <0.0001 0,0009 (0.0001 <0.0001 <0.0001 0,0734 0,0012 <0.000l 0.0041 0,0142 0,0110 0,0252 0.0007 0.0014
5li8 ESE '77 8ZOO 8760 0,0l){B 0.0002 0.0002 o.ooai O.OOOl <O.ooot <0,000,. 0.0197 0,0005 (O.OOOI. 0.0172 O,O<m O.OOJ4 0.0064 0.0006 0.0034
548** ESE '78 32360 15500 0.112 0,0213 0.0213 0.0!¼4 0.0235 0.0005 0.0,055 0.200 0,0232 <0.0001 0.540 0,079.l 0.0002 0,0611 0.02'6 <0.0001
' 591** KSE 1 77 9350 11300 0.0060 (0,0001 0.0001 0,0044 <0.0001 <O.OOOI. <0,000i 0.0135 O.OOJ.l <o.0001 0.0067 0,0101 0.0064 0.0070 0.0017 0.0006
591 ** ESE 1 78 3500 7910 0.0627 (0,0001 0.0144 0.0479 0.0100 0.0203 (0,000\ 0,144 0.0273 0.0016 O.llB 0,0553 0.0041 0,0405 <0.0001 <0.0001
897'1* ESE 1 78 42400 18200 0.0311 0.0068 0.0068 0.0214 0.0002 0.0001 0.0001· O.lli <0.0001 <0.0001 >0.0674 0.0330 · 0,0001 0.0211 0.0181 (0.0001
1100 ESE 177 62500 16300 0.0203 <0.0001 <0.0001 0.0161 <0.0001 (0.0001 <0.000!.; 0.<9'*7 0.0030 <0.0001 0.0148 0,0355 0.0232 0,0355 0.0031 0.0064
Was tel.oal Aver,ges 0.0358 (0,0052 (0.0073 e 0.0266 (0.0060 (0.0042 (0,000) (0.0959 (0.0001 <0,0003 >O.lll 0.0332 0.0001 0,02)2 o. 0070 (0. 0017
llClJLTOO
65*t ESE '78 2200 2770 (0.0001 <0.0001 <0.0001 (0.0001 (0.0001 <0.0001 <0.0001 0.00& (0.0001 <0.0001 (0.0001 <0.0001 <0.0001 <0.0001 (0.0001 (0.0001 ..... 0.0108 0 67* E-SE '77 6550 2200 <0.0001 --<0.0001 <0.0001 - <0,0001 <0.0001 <0.0001 <0;0001 <o.0001 <0.0001 <o.0001 <0.0001 <0.0001 <0.0001 <0.0001 <o.0001
0 1078t ESE '77 15300 10000 0.0033 (0.0001 (0.0001 - 0.0023 (0.0001 (0.0001 <0.000! 0.0177 0.0004 (0.0001 0.0368 0,0331 0.0241 0.0006 0.0002 0.0171
Was teloal Aver~es . -· . (0.0012 <0.0001 <0.0001 (0.0000 -<0.0001 (0.0001 (0.0001 (0.0000 <0.0002 (0.0001 <0.0123 (0.0111 <0.0001 · (0,0033 - <0.0001- (0.0003
* These plants were treatirg -solely with P<P an! nct: crea1ote funnulatiom durirg the s....,lirg period. t Plants used to calculate ra.- aver,ges in Tmle VII---:39.
** Plants used to calculate ra.- aver,ges in Tmle VII-40.
Key to Base Neutral Data Tables
I. Fluoranthme 9. Bemo (a) AntlTacene 2. Bemo (B) Fluoranthene 10. Di.heme (a, h) AntlTac:ene 3. Bemo (k) Fluoranthene 11. ~hthalene 4. Pyrene 5. Bemo (A) Pyrene
12. Acemphtlene 13. ken'l'ht~lene
6. Jnclero (I, 2, 3-<:D) Pyrene 14. liluorene 7. Bemo Cwii) Perylene 15. Ch:ysene 8. FhenantlTene anl/or AntlTa:ene 16. Bis-2-etlyl-hexyl phthalate
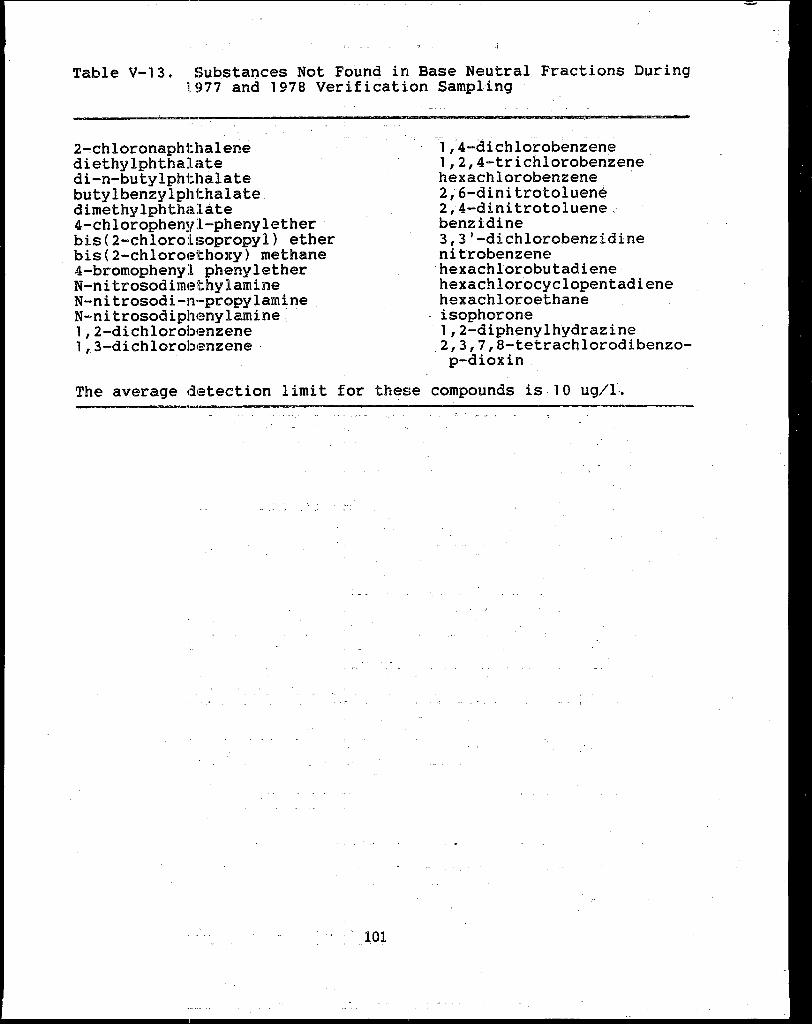
Table V-13. Substances Not Found in Base Neutral Fractions During 1977 and 1978 Verification Sampling
2-chloronaphthalene diethylphthalate di-n-butylphthalate butylbenzylphthalate dimethylphthal,te 4-chlorophenyl-phenylether bis(2-chloroisopropyl} ether bis(2-chloroethoxy} methane 4-bromophenyl phenylether N-ni trosodimi~thylamine N-ni trosodi.-n·-propylamine N-ni trosodiplumylamine 1,2-dichlorobenzene 1,3-dichlorobenzene
-, ,·4..:aichlorobenzene 1,2,4-trichlorobenzene hexachlorobenzene · 2,6-dinitrotoluene 2,4-dinitrotoluene_ benzidine 3,3'-dichlorobenzidine nitrobenzene hexachlorobutadiene hexachlorocyclopentadiene hexachloroethane isophorone 1,2-diphenylhydrazine 2,3,7,8-tetrachlorodibenzo-p-dioxin
The average detection limit for these compounds is l O ug/L
.101

Trole V-14. lobcxl Preseivirg Toxic Pollutant l:henols Data
S'lF.AM
Plant Ra,, Concentratiom tf-1) Rao7 Wasteloa:ls (lb/lzOOO ft:3)
Data Flow Proo. 2-- 2,4- 2, , - 2-- 2,4- 2,4, 6-Nlllber Source (gal/day) (ft3/day) phen clphen dineph triclph PCP phen clphen dineph tric Jph PCP
173** PS '75 3000 3880 N\ N\ N\ N\ 306.0 N\ N\ N\ N\ 1.97 237 PS 1 75 2000 5000 N\ N\ N\ N\ 49.0 N\ N\ N\ N\ 0.163 2671<* PS '75 6000 6600 N\ N\ N\ N\ 34.5 N\ N\. N\ N\ 0.262 267** ESE 1 77 7600 5800 N\ N\ N\ N\ 6.3 N\ N\ N\ N\ 0.0688 267* ESE '78 9120 9850 9.20 - -- -- 16.0 267t ESE '78 9120 9850 1.40 - -- - 25.0 547 PS '75 25000 8000 N\ N\ N\ N\ 24.3 N\ N\ N\ N\ 0.633 548tt ESE 177 8200 8760 N\ N\ N\ N\ 158.0 N'I. N\ N\ N\ 1.23 548tt ESE '78 32360 15500 24.4 0.042 0.130 0.252 9.41 0.425 0.0007 0.0023 0.0044 0.164 582** PS 1 75 13750 7500 N\ N\ m N\ 26.7 N\ N\ N\ N\ 0.400 59ltt ESE '77 9350 11300 N\ N\ N\ N\ 22.3 N\ N\ N\ N\ 0.154 59ltt ESE '78 3500 7920 87.0 - 6.60 - 1.20 0.321 <0.0001 0.0243 <0.0001 0.0044 593 PS '75 9000 12300 N\ N\ N\ N\ 47.8 N\ N\ N\ N\ 0.292
~ 693 PS 1 75 5500 3000 N\ N\ N\ N\ 17.9 N\ N\ N\ N\ 0.274 0 897tt ESE 1 78 42400 18200 16.0 0.015 5.50 0.533 2:10 0.311 0.0003 0.107 0.0104 0.0525
I')
898 PS '75 2000 3000 N\ N\ N\ N\ 50.3 N\ N\ N\ N\ 0.769 1100 ESE 1 77 62500 16300 N\ N\ N\ N\ 57.1 N\ N\ N\ N\ 1.83
Was teloal Aver~es 0.352 <0.0004 0.0445 (0.0050 0.552
BaJL'IOO -65** ·PS '75· - 5000 -~5000 --m- - ·m m--~- m:·· 5.70 N\ N\ N\ N\ 0.0475 65** ESE '78 2200 2770 0.071 - -- - 27.0 0.0066 (0.0001 <0.0001 <0.0001 0.179
1078** PS '75 7000 10000 N\ N\ N\ N\ 0.09 N\ N\ N\ N\ 0.0005
Was teloal Aver~es 0.0066 <0.0001 <0.0001 -<0.0001 0.0757
-- Hyphen dmct:es that p:1raneter was analy2Ed for l:ut was below detection limit. * Data fran crecsote separator (wasteloa:ls cannct: be calrulatai since flow neastranents fur the itrlividual separatom
were unoltainmle). Jlbt inch.ided in avenges. t Data fran PCP separator (wasteloa:ls cannct: be calrulatai since flow neastrenents fur the itrlividual separators were
unolt aind> le). Jlbt inc lured in avenges. ** Plants used in calculat:irg aver~es in Ta, le VII-41. tt Plants used in calculatirg avenges in Tcble VII-42.

Table V-15. Toxic Pollutant Phenols Analyzed for But Not Found During·1978 Verification Sampling
2-nitrophenol 4-nitrophenol 2,4-dichlorophenol 2,4-dinitrophenol para-chloro-meta-cresol 4,6-dinitro-ortho-cresol
The average detection limit for these.compounds is 25 ug/1.
103

Table V-16. Wood Preserving Metals Data-Plants Which Treat With Organic Preservatives Only
Flow Prod. RAW CONCENTRATIONS (m~/1) Plant Source (GPD) (ft3/day) Arsenic Antimony Beryllium Cadm1u11 Copper Chromium. Lead Mercury Nickel Selenium- Silver Thallium. Zinc
67 ESE '77 7500 2200 0.007 0.003 - -- 1.60 0.009 0.005 0.0037 0.210 0.003 0.001 0.002 0.843
267 ESE '78* 9120 9890 0.093 -- 0.012 0,010 0.850 0.064 0.052 -- 0.028 - 0.006 0.010 0.370
I-" 267 ESE '78** 9120 9'890 0.033 0.003 0.019 0.008 0.610 0.098 0.071 -- 0.150 -- 0.005 -- 0.820 0
267 &SE '77 7600 5800 0.003 - -- -- 0.125 0.001 0.007 - 0.005 -0.001 - 0.001 0.309 -I=>
548 ESE '78 32260 15500 14.2 0.047 0.001 0.041 0.023 0.091 O_.OO!l 0.015 0.001 -- -- O.ll9
548 ESE 'H 8200 8760 0.009 0.002 -~ -- 0.008 0.001 0.009 -- 0.006 0.001 - 0.001 0.177
591 ESE '78 3500 7920 0.086 0.007 -- 0.003 0.031 0.007 0.011 0.0011 0.016 0.007 - - 0.180
591 ESE '77 9350 11300 0.003 0.001 - -- 0.150 0.001 0.001 - 0.003 0.001 -- 0.001 0.350
1100 ESE '77 62500 16300 0.006 - -- 0.001 0.180 0.023 0.014 -- 0.135 0.002 -- 0.004 0.627
* From Creosote Separator.
** From PCP Separator.
-- Hyphell. denotes that parameter wa.s analyzed for but was below detection limit.

Table V-17. Wood Preserving Metals Data--Plants Which Treat With Organic Preservatives Only
Flow Prod. RAW WASTELOI.DS (lb/!,000 ft3) Plant .Source (GPD) ( ft3 jday) Arsenic Antimony Berylli~m Cadmium Copper. Chromium Lead Mercury Nickel Selenium Silver Thallium Zinc
67 ESE '77 7500 2200 0.0002 0.00009 <0.00001 <0.00001 0.0465 0.0003 0.0001 0.00011 0.00597 0.00009 0.00003 0.00006 0,0240
267* ESE 1 77 7600 5800 0.00003 (0.00001 <0.00001 <0.00001 0.00137 0.00001 0.00008 <0.00001 0.00005 0.00001 <0.00001 0.00001 0.00338
548t ESE 1 78 32260 15,500 0.246** 0.00082 <0.()0001 0.00002 0.00071 0.00040 0.0016 0.00002 0.00026 0.00002 (0.00001 <0.00001 0.00207
548t ESE '77 8200 8760 0.00007 0.00002 <0.00001 (0.00001 0.00006 0.00005 0.00007 <0.00001 0.00005 0.00001 <0.00001 0.00001 0 .• 00138
59lt ESE '78 3500 7920 0,00032 0,00003 <0.00001 <0.00001 0.00011 0,00003 0.00004 <0.00001 0.00006 0.00003 <0.00001 <0.00001 0.00066
59lt ESE '77 9350 11300 0.00002 0.00001 <0.00001 <0.00001 0,00104 0.00001 0,00001 <0.00001 0.00002 0.00001 <0.00001 0.00001 0.00242
1100 ESE '77 62500 16300 0.0002 <0.00001 <0.00001 0.00003· 0.00576 0.00074 0.00045 <0.00001 ·0.00432 0.00006 (0.,00001 0.00013 0.0201
...,. Average Wasteloads 0
0.0353 0.00014 <0.00001 (0.00001 0.00794 0.0002 0.00034 <0.00001 0.00153 0.00003 <0.00001 <0,00003 0.00772
u, ~ Plant used in calculating raw averages in Table VII-43.
Plants used in calculating raw averages in Table VI!-44,
** Not used in calculating raw averages due to the high background levels of arsenic in the raw water intake,
·:1"1

Table V-18. Wood Preserving Metals D.ata-Plents ~ich Tre:t With l!otb 0:-g:nic =id !norg:nic Prc:erv.;tiva•
Rav Concentration. (mg/1) Flov Prod.
Plant Source (GPD) (ft3/day) Ar1enic Antimony llerylli1111 Cadmium Copper Chromium Lead Mercury Nickel Selenium Silver Thallium Zinc
.... 0 65 ESE 1 78 2200 2770 0.014 0.013 0.002 0.005 O'I 0.110 3.90 0.014- 0.0002 0,020 0.053 0.001 - 26.0
65 PS '75 5000 5000 -- HA HA HA 0.060 13.9 HA HA HA HA !IA NA 78.2
237 PS '75 2000 5000 0,050 HA HA HA 0.700 0,440 HA HA HA HA HA HA NA
335 PS '75 1700 3400 0.250 HA HA HA 2.30 0.780 HA HA KA KA HA HA KA
499 PS '75 (100 1950 1.00 HA NA HA 3,91 1.23 HA HA HA HA HA HA HA,
582 PS '75 13750 7500 0.040 HA HA HA 0.600 HA HA HA HA HA HA HA HA
897 ES& '78 42400 18,200 0,lJO - - 0,,00,l -- 0.019- 0,,02-3 0,016-· - 0,0013 0-.100 ~ -- -- 0:120·
1078 ESE '77 15300 10,900 0.0-03 - -- -- 0,080 0,004 0.001 0.0002 0.094 0.002 0.002 0.001 0.321
1078 PS ;75 7000 10,000 - HA NA HA 0,430 - HA HA HA HA HA HA 0.780
NA Not analyzed for.
- Hyphen denotes that parameter was analyzed for but was below detection limit.

Teb!e V-!9. WO!!d Preserving. Hetah Data--Plants MIiich Treat With lloth Or!l"nic and Inorganic Preservatives
Flow P§od. Raw Waoteloads (lb/1,000 ft3)
Plant Source (GPD) (ft /day) Arsenic Antimony Berylli11111 Cadmiu• Copper Chroaiium Lead Mercury Nickel Selenium Silver Thallium Zinc
65t ESE '78 2200 2770 0.00009 0.00009 0.00001 0.00003 0.00073 0.0258 0.00009 (0.00001 0.00013 0.00035 0.00001 <0.00001 0.172*
65t PS 1 75 5000 5000 (0.00001 NA NA NA 0.00050 0.116* NA NA NA NA NA NA 0.652*
237 PS '75 2000 5000 0.00017 NA NA NA 0.00234 0.00147 NA NA NA NA !IA NA NA
335t PS '75 1700 3400 0.00104 NA NA NA 0.0095.9 0.00325 NA NA NA NA NA NA NA
499tt PS '75 (100 1950 0.00043 NA NA 11A 0.00167 0.00053 NA NA NA [IA NA NA NA
582f I PS 1 75 13750 7500 0.00061 NA NA NA 0.00917 NA NA NA NA NA NA NA NA
.... 897** ESE '78 42400 18200 0.00253 (0.00001 <0.00001 0.00002 0.0015 0.00045 0.00031 0.00003 .0.00194 (0.00001 (0.00001 (0.00001 0.00233
0 ...., 1078t ESE 1 77 15300 10900 0.00004 <0.00001 (0.00001 (0.00001 0.00094 0.00005 0.00001 (0.00001 0 .• 0011 0.00002 0.00002 0.00001 0.00376
1078t , PS '75 7000 10000 (0.00001 NA NA 11A 0.00251 (0.00001 NA NA NA NA NA NA 0.00455
Average Wasteloads <0.00055 <0.00004 (0.00001 <0.00002 0.0032 (0.00451 0.00014 (0.00002 0 .0011 (0.00013 (0.00001 (0.00001 0.0457
NA Not analyzed for. * Not used in calculation of averal'<es because the process involves direct metals contamination of wastewater. t Plants used in calculatinit raw averages in Table Vll-46 • ** Plants used in calculatinP< raw avera11es in Table VU-47. tt Plant~ used in calculating raw averages in Table .Vll-45.
..

Table V-20. Range of Pollutant Concentrations in Wastewater from a Plant Treating with CCA- and FCAP-Type Preservatives and a Fire Retardar1t
-------------------------·-----------------------------------------Parameter
Concentration Range (mg/liter)
------------------------------------------------------------------COD 10-50
As 13-50
Total Phenols 0.005-0.16
Cu .05-1.1
Cr+6 0.23-1.5
Cr+3 0-0.8
F 4-20
P04 15-150
NH3 -N .so-200
pH 5.0-6.8 ---------------------------------------------------~-------------Source of Data: Pretreatment Document
108

Design for Mgdel Plant
Table v~21 pr~se~ts the design crlterii for· the wood preserving model plants. ·. These cri teri~ _ wE:?re. ~f?~Q i:l.s i:l .~a~i~ __ gf estimating capital, operating, and energy costs for the model plants which are presented. in Appendix A of this document. ·
The flow characteristics of these model plan~s are based on average. historical unit flows for Boulton and closed steaming plants as presented in Tabl.es V-1 and V-2. Pollutant concentratic•ns are based on average data presented in Table V-7.
Model plant · wastewater charac_teristics for plants which use solely inorganic preservatives are not presented in this document because, under existing BPT, BAT, NSPS, PSNS, PSES regulations, this subcategory is subject to no discharge of process wastewater limitations and standards. The technology to achieve· no discharge is; available for comp1ete recycling of effluents · from these plants and was costed previously.
INSULATION BOARD
Insulation board plants responding to the data collection portfolio rE~ported fresh water usage rates ranging from 95,000 to 5,700,000 liters per day for process water (0.025 to 1.5 MGD}. One insulatic>n board plant, 108, which also produces hardboard in approximately equal amounts, uses over 15 million liters per day (4 MGD} of fresh water for process water.
Water becomE:?S contaminated during the. production of insulation board primarily through contact with the wood during fiber preparation and forming operations, and the vast m~jority of pollutants are fine wood ·_fibers and soluble wood sugars and extractives.
The process·whitewater used to process and transport the wood from the :Eiber preparation stage through mat formation accounts for over 95 percent of a plant's total wastewater discharge (excluding cooling water). The water produced by the dewatering of stock at .any st.age of the proces$ is usually recycled to. be used as sti:>ck dilution water. However, as a result of the build up of suspended sol ids and dissolved organic material, which can :cause unde:sirable effects in the board, there may be a need to bleed off a quantity of exc.ess process whitewater. Various additives u:e;ed,,, ... :t.o .. improve the characteristics of the board also enter the process whitewater and contribute to the waste load.
' ,, ,, '. " . . "~ . - .
Specifically, potential sources of wastewater in an insulation joard plant include:
Chip wash water Process whitewater generated during fiber preparation
(refining and washing}
109

Tm1e V-21. &w Waste Chara::teristics of Wool Presexvitg Moool Plants
Area oc Process ~limem & Amual Process ~:ign Oil & Total Production Ihit Flw Wastewater lrbtk Tade Raiocall Coocaminata:I Wastewater ©D Q:ease Phenols Plant (cu ft) (gal/cu ft) Flw (gpd) (sq ft) (in) Rmc:ff (gpd) Fla,, (gpd} 6ng/l) 6ng/I) Gndl)
Boulton Modal Plant 3,200
l 1.03 3,300 6,000 45 460 4,000 4,000 300 500
Brulton Merel Plant 8,000
2 1.03 8,240 20,000 45 1,540 10,000 4,000 300 500
.... Stean .... Medel Plant 6,000 0.45 2,700 6,000 50 510 3,250 6,000 800 175
0
3
Stean Merel Plant 15,000 0.45 6,750 20,000 50 1,710 8,500 6,000 800 175 4

Process whitewater generated during forming Wastewater generated during miscellaneous.operati0ns
(dryer washing, finishing, housekeeping, etc.)
Chip Wash Wat.§'£
Water used for chip washing is capable of being recycled to a large extent.. A minimal makeup of approximately 400 1 i ters per metric ton (95 gallons per ton) is required in a closed system because of water leaving with the chips and with sludge re~oved from settling tanks. Water used for makeup in the chip washer may be fresh water, cooling water, vacuum seal water _from in~ plant equipment, or, recycl~d process water. Chip wash water, when not fully recycled, contributes to the raw waste load of an insulation board plant. Insulation board plants 108, 537, 979, 943, 977, and 1035 indicated in the response to the data collection portfolio that chip washing is done. Plants. 943 and 1035 fully recycle chip wa$h water.
Fiber PreparaL!,ion
. The fiber prE!paration or refiner whitewater. system is considered to be the water used in the refining of stock up to and including. the dewatering of •totk by a decker or washer. As previously discussed, there are three major types .of fiber preparation in the insulation board industry: (1) stone groundwood; (2) mechanical disc refining (refiner groundwood); and (3) thermomechanical disc refining. The. water volume required by each of the three methods is essentially the same. In the general case, the wood enters the refining machine· at approximately 50 percent moisture content. During· the refining operation, the fi~er bundles are<diluted with either fresh water. or recycled whitewater to· a consistency of approximately 1 percent solids prior to dewatering to about 15 percent solids at the decker or washer. The.water which results from the stock washing or ·deckering' operation is rich in organic solids dissolved from the wood during refining and. is referred to as refiner whitewater. This water may be combin~d with whitewater produced duri.ng forming, the machine whitewater (for further use in the systE!m), or it may be discharged from . the plant as wastewater.
Forming
After the dewatered stock leaves the decker at approximately 15 percent consistency, it must again be diluted to a consistency of approximately 1.5 percent to be suitable for machine forming. This requires a relatively large quantity of r~cycled process whitewater en~ fresh . water~ The redilution. of stock is· usually accomplished in a series of steps to allow consistency controls and .. · more ef:f:icient dispersion· of additives, and to reduce ,the required stoc:k pump and storage capacities. The stock usually receives an initial dilution. to· approximately 5 percent
111 ·

consistency, then to 3 percent, and finally, just prior to mat formation, to approximately 1.5 percent.
During the ma.t formation stage of the insulation board process, the diluted stock is dewatered at the forming machine to a consistency of approximately 40 to 45 perc.ent. The water drained from the stock during formation is .referred to as machine whitewater. Water from the machine whitewater system, may be recycled for use as stock dilution water or for use in the refining operations. Excess machine whitewater may be discharged as wastewater.
Miscellaneous Operations
While the majority of wastewater board production Qccurs during formation operations, various other the overall raw waste load.
generated during insulation fiber preparation and mat
operations may contribute to
Drying--The boards leaving the forming machine with a consistency of approximately 40 percent are dried to a consistency of greater than 97 percent in the dryers. This water is evaporated to the atmosphere. It is occasionally necessary to remove wood dust from the dryers to reduce fire danger and to maintain proper energy utilization. This produces a minor wastewater stream in most operations.
Finishing--After the board leaves the dryer, it is usually sanded and trimmed to size. The dust from the sanding and trim saws is often controlled by dust collectors of a wet-scrubber type, and the water supplied to the scrubbers is sometimes excess process water; however, fresh water is occasionally used. This water is usually returned to the process with the dust.
Plants that produce coated products such as ceiling tile usually paint the board. after it is sanded and trimmed. Paint composition will vary with both plant and product; however, most plants utilize a wa.ter-based paint. The resulting washup contributes to the wastewater stream or is metered to the process whitewater system. In addition, there are sometimes imperfect batches of paint mixed which are discharged to the wastewater stream or metered to the process whitewater system.
Broke System--Reject boards and trim are reclaimed as fiber and recycled by placing the waste board and trim into a hydropulper arid producing a reusable fiber slurry. While there is need for a large quantity of water in the hydropulping operation, it is normally recycled process water. There is normally no water discharged from this operation.
Other Sources--Other potential sources of wastewater in an insulation board plant include water used for screen washing, fire control, and general housekeeping. The water used for washing screens in the forming and decker areas usually enters
112

the process whitewat~r system .. Hotisekeeping·water varies widely from plant to plant depe,nding on plant- operation and many other factors. While wastewater can result from water used to extinguish dryer fires, it is an infrequent and intet"mittent source of wastewater.
Wastewater ~:haracteristics
The major portio~ of insulation -boa.rd· wastewater pollutants results from leachable. materials from the wood and materials added during the production process. If a chip washer is used, a portion of the solubles is leached into the chip wash water~ A small fracti.e>n of the. ra,w waste load results.· from cleanup and finishing c,perations; however, these operations appear to have little influence 6n the overall raw w~ste load~. The finishjng wastewater. i.n some plants is metered back into the process water with no reported adverse,effects.
Process whitewateri accounting for over 95 percent of load and flow from a typical . insulation board characterized by high. quantities of BOD (900 to 7,500 suspended sc,lids (SOOto 4,000 mg/1).
the waste . plant, is mg/1} · and
The four ma:jor factors affecting process wastewater quality· are: ( 1) the extent .of steam pretreatment; ( 2} the: :types of products produced;. (3) raw material species; and ( 4} the extent of whole tree chips,· forest residue, and bark in the raw material.
·,·• .. . ,· . , .
The major sc>Urce of dissolved organic material· is the wood· raw material. t~rorn 1 to 8 percent ( on a. dry· weight basis} of wood if:> composed of water--soluble sugars stored- as residual sap and, regardless c>j: the type of refining or pretreatment utilized, these sugars form . a major source of . BOD and .· CQD .• · . Steam conditioning of the furnish during thermomechanical refining greatly. increases the amount of wood sugars and hemicellulose decompositicm products entering the process whitewater. The . use of steam under pressure du:r;ing thermomechanical .refining is·the predominant factor ·in the increased.raw waste loads of plants which employ.this refining method.
Bac.k and Larsson ( 1972} observe that, basically, two phenomena occur durin9 heating of the wood raw material under· pressure:- the physically reversible · thermal softening of · the lignin and hemicellulose; and time· dependent chemical reactions "in which hemicellulose undergoes hydrolysis and produces oli.gosaccharides (short chained, water soluble wood sugars; including disaccharidE~s}. In addition, hydrolysis of the acetyl · groups forms acetic: acid.. The resulting lowered pH causes an increase in the rate of hydrolysis. Thus, the reactions can be said to be autocatalyt:lc:::. For this reason, .the reaction rates are difficult to calculatE~. Rough estimations indicate that the reaction. rates double when an inc,:ease in temperature of a0 c:to 1ooc· llas been made.

Figure V-1 demonstrates the increased BOO loading which results from increasingly severe cooking conditions.
Dallons (1976) has noted that the amount of BOD increases because of cooking conditions which varies with wood species. Hardwoods contain a greater percentage of potentially soluble material than do softwoods. The effect of species variations on raw waste load is less important than the degree of. steaming to which the furnish is subjected.
Two insulation board plants, 108 and 1035, presented limited information concerning the effects of whole tree chips, forest residue, and bark in wood furnish on raw waste load. Plant 36, which has the highest raw waste loads of all the mechanical refining insulation board data collection portfolio respondents, uses whole tree chips (pine) for the majority of the wood furnish. While the use of whole tree chips, residue, and bark results in some increase in raw waste loadings, information currently available is nQt sufficient to justify a subcategorization scheme based on raw material.
While the larger portion of the BOD in the process wastewater is a result of organics leaching from the wood, a significant portion results from additives. Additives vary in both type and quantity according to the type of product being produced.
The three basic types of board products sheathing, finished tile (ceiling tile, etc.), and hardboard (including medium density siding) receive various amounts of additives. Sheathing contains up to 25 percent additives which include asphalt, alum, starch, and size (either wax or rosin). Finished tile contains up to 10 percent additives which are the same as those used in sheathing, with the exception of asphalt. Hardboard contains up to 11 percent additives including organic resins, as well as emulsions and tempering agents such as tall oil. Therefore, the process wastewater will contain not only leachates from the wood and fibers, but also the portion of the additives not retained in the product.
Maximum retention of additives in the product is advantageous from both production cost and wastewater standpoints. Several retention aids are marketed--the most common of which are alum, ferric salts, and synthetic polyelectrolytes.
Raw Waste Loads
Tables V-22 and V-23 summarize the raw wastewater characteristics of those insulation board plants which provided raw waste monitoring data in response to the data collection portfolio. Data presented in Tables V-22 through V-23 are daily averages over a 12-month period, unless otherwise specified. The average daily raw waste loads were calculated in the following manner:
114

l. All ·data from each plant directly from the data according to waste stream.
were coded for keypunching sheets provided by the plant
2. Coricentration and flow data for each day were converted by the computer program to a corresponding waste load in pounds per day (lbs/day) ..
3. Each plant's annual average dai"ly production was calculated in tons per day for each plant by dividing the.total year's production by the number of actual operat{ng days. This value was then used with · applicable conversion factors to determine waste loadings on~ pounds-per-ton basis.
4. The reiiiltinij waste loads were aver~ged over the oneyear period to determine the average annual daily raw wastE~ loads.
Eight of the fifteen insulation board plants provided raw waste. historical data for the 12-month period from January through December 1976 and four plants also provided raw waste historical data for the 12-mont.b period from. January through December 1977.
, The raw waste loads of the plants which employ thermomechanical refining methods or which also produce hardboard products are demonstrably higher than the raw waste loads of the plants which only employ mechanical refining and which produce no hardboard products. Plant 36, the only direct discharging plant among the mechanical refining plants, is an exception to this trend as discussed below.
Of the five plants which use mechanical refining only~ and which produce no hardboard, three of the plants ( 360, 978, and 88.9) provided sufficient 1976 historical raw waste data for analysis. Plant 36 provided raw. waste data.~or 1976 and 1977 for analysis~ Data from the!:.i: plants were. for raw · waste pr·ior to primary treatment, with the exception of Plant 360 which provided_ information for wastewater foll<;>wJng. polymer-assisted primary clarification (flocculation-clarification). Verification sampling was pi:rformed at Plant 360 and samples were collected before and after the primary floe-clarifier. Analysis of verification data showed that a BOD reduction of 24 percent and a TSS reduction of 79 percent were achieved in the primary flocclarifier.
Plant 360 uses primarily Southern pine for furnish with·some mixed hardwoods. Plant 537 uses primarily Douglas fir with other mixed softwoodis. Plant 978 employs stone grinders to refine a pine furnish. Plant 36 uses a mixture of predominantly Southern pine, in the form of whole tree chips, and mixed hardwoods. Plant 889 uses a furnish of Southern pine. mixed with some hardwood.
115

60
40
20
0
0
TOTAL BOD, IN kg 02 /TON DRY CHIPS
< I j -,- I
4 6 r 8
I 10
I 12
PRE-HE~~TING PRESSURE (atm.g.)
Figure V-1. Variation of BOD with pre-heating pressure
116
·-

Table V-22. Insulation. Board Mechanical Refi.r).ing Raw Waste Characteristi.cs (Annual Averages)*
Plant Nurber
360t
978
36
889
Production klcg/day
201 189 195
106
606 600 603
246
(TPD)
(220) (208) (215)
(117)
(668) (661) (665)
(270)
kl/kkg
3.13 4.51 3.80
21.6
10.4 8.84 9.60
1.02
Flow (kgal/ton)
(0.750) (1.08) (0.912)
(~.21)
(2.49). (2.12) (2.30)
(0.24)
kg/kkg
4.46 4.81 4.61
5.95
20.8 20.9 20.9
1.27
BOD (lbs/ton)
(8.91) (9 .• 62) (9.22)
(11.9)
(41.6)t (41.8)t (41.S)t
(2.54)
kg/kkg
0.735 1.04 0.880
4.67
45.2 31.4 38.4
0.46
TSS (lbs/ton)
(1.47) (2.07) (1.76)
(9.33)
(90.5) (63.0) (76.8)
(0.923)·
* First rcM of data represents 1976 average annual daily dat.:;; .; ...... or.·:: row represents 1977 average annual daily data; third I."CM represents averag~ annual daily data for two-year period of 1976 and· 1977; except as noted. ·
t In 1976, 0.075 kg/kkg (0.15 lb/ton) of BCD is recycled. In 1977, 0.095 kg/kkg (0.19 lb/ton) of .Ba) is recycled. For the two-year period of 1976-1977, 0.085 kg/klcg (0.17 lb/ton) of EOO is recycled.
117

I-' I-' CX>
Table V-23. Insulation Board ThemoJ11echanical Refining and/or Hardboard Raw Waste Characteristics (Anooal Averages)*
-Plant Production Flow BOD TSS Number kkg/day (TPD) kt/kkg (kga 17 ton) kg/kkg (His /ton) kg/kkg (lbs /ton)
183 193 (212) 8.11 (1.95) 33.6 (67.1) 17.3 (34.5) 144 (159) 5.05 (1.21) 35.5 (71.0) 13. 3 (26.6) 169 (186) 6.84 (1.64) 34.5 (69.0) 15.6 (31.2)
537t 139 (153) 13.5 (3.23) 17.0 (34.1)** 42.8 (85.7) 145 (160) 12.8 (3.08) 23.5 (47.0)** 38.6 (77.3)
-- -- -- -- --108 605 (665)tt 74.0 (17 .8) 29.8 (59.5) 28.6 (57.1)
26.3 (52.6)*** 6.25 (12. 5)*** 570 (628)t t 23.9 (5.73)ttt 22.8 (45.6)ttt 6.80 (13.6)t t t
1035 359 (395)ti 11.1 (2.68) 43.2 (86.3)
* First row of data represents 1976 average anmal daily data; second row represents 1977 average annual daily data; third row represents average anrual daily data for two-year period of 19 76 and 19 77; except as noted .
t Raw flow and wasteload data presented in first row obtained during 1977 verification sampling. Raw flow and wasteload data presented in second row obtained during 1978 verification sampling.
** In 1976, 12.5 kg/kkg (25.0 lbs/ton) of BOD is recycled. In 1977, 12.2 kg/kkg (24.5 lbs/ton) of BOD is recycled.
tt Includes production of both insulation board and hardboard.
*** Raw waste loads based on 1977 estimated primary effluent data provided by plant, and on 1976 average daily product ion.
Ht Data represent period of 9/21/79 thrrugh 4/30/80.

Plant 36. dEm1onstrated raw waste · loads for . BOD and TSS significantly higher than any · other plant in. the mechanical. refinir:ig subc=ategot:y. This is most likely attributable to the use of wood :furnish consisting of predominantly whole tree chips. In 1976, the plant recycled all of its waste activated sludge, in addition to all"of the primary sludge, back into the process. In 1977, the plant discontinued recycling of the waste activated sludge and n~duced the primary sludge recycling by 1 O percent because of bc>ard quality problems. Ninety percent of the primary sludge was still recycled to·the process~ while the remaining 10 percerit of the pilmary sludge· and all of the waste activated sludge were dewatered and disposed of in a landfill. The build up in the prc>cess whitewater system of suspended · solids due to the sludge recycling is the most probable reasori for the high 1976 average TSS waste loads.
Plant 725 doE~s not monitor the raw wastewater from its wood fiber insulation.board plant. Effluent from this plant, following primary treatment, is used as process whitewater in the plant's mineral wool insulation board facility. Although the plant provided 1976 historical data for raw wastew~ter effluent from the mineral wc:,ol facility, these data could not be used to characterize raw wastewater from the wood fiber plant; and thus, Plant 725 was not included in Table v-22~
The annual average daily unit flow, and waste load data for insulation board, mechanical refining Plant 36, presented in TableV-22, were. used to develop the design ·criteria presented in Table V-24 and used as a basis for cost estimates presented in Appendix A of this document. ·
-;,:·t C •,, ,o'
The average, unit flow for Plant 36, which is 8.3 kl/Kkg (2.0 kgal/ton), is considered to be representative of an insulation board, mechanical refining plant which produces a full line of insulation bc:,ard products and which practices internal· recycling to the extc~nt practicable. Plant 978 has a }:ligh unit flow of 21.6 kl/Kkg 1(5.21 kgal/ton), due to the fact that this plant uses process water on a once through basis, with no internal recycle. Plants 360 iind 889 achieve a · much higher degree of internal recycle which is due to their particular product and raw material mix. Therefc:>1re, their unit flows are not considered to be applicable tc:> the ind1.1stry as a whole. The raw waste load of TSS produced by Plant 36 is somewhat higher than the other plants in the insulation board-mechanical refining group because the plarit uses a furn:i:sh whfch predominantly consists of whole tree chips. The contribution of TSS to overall treatment system costs is negligible cc:>inpared to the BOD contribution.
- - t: ,~
Of the 10 plants which produce insulation board using thermomechanical refining and/or which produce hardboard at .the same facility, only three plants· (183, 108, and 1035) provided suff ici.ent 1976 historical data for calculation of raw waste loads. Plant 183 also provided sufficient 1977 historical data for raw wasbe analysis.
119

Plant 108 has upgrad~d its wastewater treatment system and provided an estimate of the raw waste loads (primary effluent}. The estimated waste loads are 16,000 kg/day (35,000 lbs/day} of BOD and 3,800 kg/day (8,300 lbs/day} of TSS. The raw waste loads presented in the second row for Plant 108 in Table V-23 are based on these estimated data and on 1976 average annual daily production data.
Plant 537 does not monitor raw wastewater quality and provided no historical raw wastewater quality data .. Verification sampling was performed at this plant in 1977 and 1978, and raw wastewater data were obtained. Verification data were used to calculate the raw waste load using historical average daily production and average daily flow data provided by the plant in response to the data collection portfolio.
Of the four plants which provided historical raw waste data, only Plants 183 and 537 produce solely insulation board. Plant 183 steam conditions all of its furnish, which consists primarily of hardwood chips. Plant 537 steam conditions all of its furnish which consists of softwood chips, primarily of Douglas fir. Some sawdust is also used as furnish at this plant.
Plant 108 steam conditions approximately 10 percent of its furnish, which consists primarily of aspen with some whole tree chips. Although this plant differs considerably from the other plants in the subcategory in the proportion of furnish· that is preconditioned by steam, the raw waste loads from this plant fall well within the range of other plants in the insulation boardthermomechanical refining or hardboard production group, as demonstrated in Table V-23.
Plant 1035 uses thermomechanical pulping to prepare all of its furnish, which consists primarily of pine with some hardwood and panel trim. This plant produces approximately 70 percent insulation board and 30 percent hardboard.
Plant 943 produces approximately 60 percent insulation board and 40 percent hardboard using a pine furnish for hardboard, and pine and hardwood mix for insulation board. This plant steam conditions all of its £urnish. Since it does not moriitor its raw waste effluent, the raw waste load coul'd not be determined.
Plant 979 produces approximately 60 percent insulation board and 40 percent hardboard using a pine furnish which is totally steam conditioned. Since this plant does not monitor its raw waste effluent, the raw waste load could not be determined.
Plant 186 steam conditions all of its hardwood furnish. Since this plant does not monitor its raw waste effluent, the raw waste load could not be determined.
Plant 977 steam conditions all of its mixed hardwood furnish. This plant produces approximately 50 percent insulation board and
120

50 percent hardboard. Raw waste effluent·from the wood fiber plant. at this facility is combined with raw waste effluent from a mineral wool facility at. the same location prior· to monitoring. Therefore, the actual wood fiber raw waste load could not be determined.
Plant 502 stE~am produces onJly monitor its raw plant could nc>t
conditions all of insulation board. waste effluent, the be determined. · ·
its hardwood furnish and Since this plant does not raw waste load from this
Plants 184 and 2 have achieved no discharge of process.wastewater through compJlete close up of process whitewater systems, howe·ver, Plant 2 has dliscontinued operations." B6thplants steam condition all furnish and produce solely. structural insulation boar;:'d. Plant 184 usE~f; a hardwood furnish, and ·p1ant 2 used low moisture plywood and furniture trim furnish. · ·
Raw waste Jlc>ad data provided by Plants 183, 53 7, and 10.35 were averaged ·to dE~velop the design criteria presented in Table V-25 as the basi!; for cost estimates presented in Appendix A of this document. ThE~se plants are c.onsidered representative of plants producing im;ulation board thermomechanically and hardboard. Data from Plant 108 were not used for two reasons: (1) the· raw waste data provided by this plant were. following· primary treatment, and (2) the plant in 1976 practiced only a minimal amount of internal. recycle which resulted in an unrepresentative· unit flow of ·11. 1 , kl/Kkg ( 17. 8. ~ gal/ton).
A unit flow of 10. O kl/Kkg ( 2. 4 'kgal/ton) is considered to be representative of an insulation board, thermomechanical refining plant which pi:oduces a full line of insulation·board products and which practices internal recycle to the extent practicable.
121

Table V-24. Insulation Board, Mechanical Refining--Design Criteria
Unit Wasteqater Flow= 8.3 kl/Kkg (2.0 kgal/ton)
Design Criteria 1 2
Production, Kkg/day (TPD)
Wastewater Flow, Kkl/day (MGD)
Influent BOD Concentrations, mg/1
Influent TSS Concentrations, mg/1
230 (250)
1.9 (0.5)
2,200
3,900
Table V-25. Insulation Board Thennomechanical Refining-Design Criteria
Unit Wastewater Flow= 10.0 kl/Kkg (2.4 kgal/ton)
540 (600)
4.5 (1.2)
2,200
3,900
Design Criteria
Production, Kkg/day (TPD)
Wastewater Flow, Kkl/day (MGD)
Influent BOD Concentrations, mg/1
Influent TSS Concentrations, mg/1
122
1 2
180 (200)
1.8 (0.48)
3,600
1,600 ;
360 (400)
3.6 (0.96)
3,600
1,600

Toxic Pollutant Raw Waste Loads
Raw waste conci:?ntrations and raw waste loads for total phenols are shown for four. insulation board plants in Table V-26. Dafa presented in this table were obtained during the 1977 and 1978 verification sampling programs. These data represent the aver~ge of three 24-hour composite samples collected during each verification program. Annual average daily production and annual average daily waste flow provided by the plants in the data collection pc:>Jctfolio were used to calculate the raw waste loads. None of the insulation board plants presented historical data on raw wastewatier total phenols concentrations in their raw wastewater effluen~!·
-'=.
Raw waste concentrations of 13 heavy metals are presented for four insulation board plants in Table V-27. Data presented in this table were obtained during the 1977 verification sampling program. Annual·· average daily production and annual average daily waste f l1ow for i 976 provided by the plants in. the data collection .portfolio were used to calculate the raw waste loads.
None of the insulation board plants presented historical data for wastewater heavy metals concentrations.
No significant differences in heavy metals. concentration~ between the two types of insulation board,plants were found. The source of heavy metals in the wastewater from insulation board plants is: ( l ) small, amounts of metals presen·t in the wood raw material; and (2) byproducts of the corrosion·of metal equipment· in contact with the process whitewater. ·
The average concentrations and the average raw wastewater loadings of each heavy metal are also presented in Table V-27.
' .
Table V-28 presents the raw wastewater concentrations of organic toxic pollutants for insulation board plants that were sampled during the 1978 verification sampling program. None of the insulation board plants presented organic toxic pollutants historical data. '
No organic toxic pollutants were found in the raw waste for Plant 537, a thermomechanical refining plant. Extremely low concentrations of chloroform, benzene, and toluene were found in the· raw wastewater for Plant 183, also a thermo,nechanical refining plant. All of these pollutants probably originated in common industrial solvents.
Extremely low concentrations of benzene, toluene, and phenol were found in the raw wastewater f9r Plant 36, a mechanical r~fining plant, but benzene and toluene were also found in the plant intake water. Phenol is an expected byproduct of hydrolysis reactions that occur as the wood furnish is.refined.
123 ..

Table V-26. Raw Waste Concentrations and Loadings for Insulation Board Plants~-Total Phenols
Plant
36
183
360
537
Raw Waste Concentrations (mg/1)*
1977
0.09
0.29
0. 14
o. 11
1978
0.796
1.8
NS**
0.42
Average+ Raw Waste Loads
kg/Kkg
, 0. 0040
0.0055
0.00040
0.0075
(lbs/ton)
(0.0080)
(0.011)
(0.00079}
(0.015)
* Data obtained during 1977 and 1978 verification sampling programs.
+ Average of the 1977 and 1978 raw waste loads. Average daily waste flow and production data supplied by plants in response to the data collection portfolio were used to calculate the 1977 and 1978 waste loads.
**NS ... Plant 360 was 11ot sampled during the 1978 verification program.
124

Table V-27. Raw Waste Concentrations and Loadings for Insulation Board-Metals
Raw Waste Concentrations (~/1) Raw Waste l.Dadinss (kg/Kkg)/(lb/ton) Plant.Number Average Plant Nunber Average
360 183 537 36 Value 360 183 537 36 Value
Beryllium .0005 .00083 .0005 · .0005 .0006 .0000042 .000007 .00001 .0000055 .0000067 (.0000083) (.000014) (.00002) (.000011) .0000133
Cadmium .00083 .(X)l .0005 .0005 .0007 .0000028 .000008 .00001 .0000055 .0000065 · ( • 0000056) .( • 000016) (.00002) (.000011) .0000132
Copper .450 ·.280 .20 .340 .320 .0019 .0023 .000041 .0036 .0019 (.0037) ( .0046)
..
(. ()()()002) (. 0072) .0039
Lead .0013 .021 .0013 .0053 .0072, .0000)6 .00011 .000027 .000055 .000063 (.000011) . (.00034) (.cxxx553) (.00011) .000126
Nickel .240 .105 .012 .0088 .0920 .0008 .00085 .00025 .00009 .0005 .. ( .0016) (.0017) (.00049) (.00018) .0010
Zinc .720 .517 .250 .550 .510 .003 .0042 .005 .006 .0046 (.0059) (.0084) (.01) (.012) .0091
Anti.IOOny .00083 .003 .00067 .0021 .0016 .0000021 .000025 .000014 .000022 .000015 · (.0000042) (.000049) (.00027) (.000044) .000037
Arsenic .002 .0033 .003 .0016 .0025 .000013 .oo:JJ27 .00006 .000017 .000029 (.000025) (.000054) (.00012) (.000034) .000058
Selenium .005 .0043 .0047 .0033 .0043 .000014 .000035 .00007 .000035 .000038 ( • 00002 7 ) (.00007) . (.000014) (.00007) .000076
Silver .0005 .0006 .0005 .0005 .0005 · .0000021 .0000049 .00001 .0000055 .0000056 (.0000042) (.0000098) (.00002) (.000011) .0000112
Thallium .00083 oco·· . ) .0008 .0006 .0007 .C(X)0028 .0000041 .000017 .0000065. .0000076 (.0000056) (.0000082) (.000033) (.000013) .0000152
Chromium .0013 .0075 .0023 .011 .0055 .0000055 .00006 .00047 .00012 .00016 ( .000011) ( ,00)12) (.00084) (. 00023 ) .00033
Mercury .0066 .005 .001 .0075 .005 .000028 .000041 .000021 .00008 .000042 (.000042) (.000082) (.000041) (.00016) .000085
125

Table V-28. Insulation Board, Raw Wastewater Toxic Pollutant Data,'Organics
Parameter
Chloroform
Benzene
Toluene
Phenol
Average Concentration (ug/1)
Raw Wastewater Plant 183 Plant 36
20
70
60
--* 40**
40**
40
Plant 537
* One sample of raw wastewater contained 20 ug/1 of chloroform. Plant intake water contained 10 ug/1 of chloroform.
** Plant intake water contained 50 ug/1 and 30 ug/1 of benzene and toluene, respectively.
-- Hyphen denotes that the parameter was not detected above the detection limit for the compound.
126

WET PROCESS HARDBOARD
Production of hardboard by wet process requires significant amounts of water. Plants responding to the dat.a collection portfolio reported fresh water usage rates for process water ranging from approximately 190 thousand to 19 million liters per day (0.05 to 5 MGD). One plant, 108, which produces both hardboard and insulation board in approximately equal amounts, reported fresh water use ()f over 15million liters per day (4 MGD).
Water becomes contaminated during the production of ·hardboard primarily through contact with the wood raw material during the fiber preparation, forming, and--in the case of S1S. hardboard-~ pressing operations. The vast majority of pollutants consist of fine wood fibers, soluble wood sug~rs, and extractives. Additives not retained in the board also add to the pollutant load.·
The water used to process and transport the wood from .the fiber preparation stage through mat formation is referred to as process whitewater. Process whitewater produced by the dewatering of stock at any stage of the process is usually recycled to be used as stock dilution water. However, because of the build-up of suspended solids and dissolved organic material which can cause undesirable effects in the board, there may be a need to bleedoff a quantity of excess process whitewater.
Potential wastewater sources in the production of· wet process har~board include:
Chip wash water Procesf, whitewater generated during fiber preparation
(refining and washing) Process whitewater generated during forming Hot press sq~eezeout water Wastewater generated during miscellaneous operations
(dryer washing, finishing, housekeeping, etc.)
Chip Wash Water
Water used for chip washing is capable of being recycled to a large extent. A minimum makeup of approximately 400 liters .Per metric ton (95 gallons per ton) is required in a closed system because of water leaving with the .chips and with sludge removed from settling tanks. Water used for makeup in the chip washer may be fresh water, cooling water, vacuum seal water from. inplant equipment, or recycled process water. Chip wash water, when not fully recycled, contributes to the raw waste load of a hardboard plant. Hardboard Plants 980, 979, 977, 943, 108, 1035, and 3 indicated in responses to the data collection portfolio that chip washing is done. Plants 943 and 1035 recycle chip wash water.
127

Fiber Preparation
The fiber preparation or refiner whitewater system is considered to be the water used in the refining of stock up to and including the dewatering of stock by a decker or washer. There are two major types of fiber preparation in the wet process hardboard industry: thermomechanical pulping and refining, and the explosion or gun process. Steam, under pressure, is used to soften and prepare the chips in.both processes.
Fiber yield is lower in the explosion process than in the thermomechanical process due to the hydrolysis of the hemicellulose under the high pressures required in the gun digesters. The resulting raw waste loading is also higher.
The wood furnish enters the refiner at a moisture content of about 50 percent. Subsequent to refining, the fiber bundles are diluted with fresh or recycled process whitewater to a consistency of approximately l percent solids prior to dewatering at the decker or stock washer to about 15 percent solids. The water which results from the stock washing or deckering operation is rich in organic solids dissolved from the wood during refining and is referred to as "refiner whitewater." This water may be combined with the machine whitewater, which is produced during forming, for further use in the system; or it may be discharged from the plant as wastewater.
Three plants, 678, 673, and 943 make use of the high dissolved organic solids in this stream by collecting and evaporating the fiber preparation whitewater to produce a concentrated wood molasses byproduct which is used for animal feed.
Forming
After the dewatered stock leaves the washer decker at approximately 15 percent consistency, it must again be diluted to a consistency of approximately 1.5 percent to be suitable for machine forming. This requires a relatively large amount of recycled process whitewater or fresh water. The redilution of stock is usually accomplished in a series of steps to allow accurate consistency contrqls and more effi~ient dispersion of additives and to reduce the required stock pump and storage capacities. The stock usually receives an initial dilution. down to approximately 5 percent consistency, then to 3 per.cent, and finally, just prior to mat formation, tp approximately 1.5 percent.
' ,
During the mat formation stage of the hardboard process, the diluted stock is dewatered 1n the forming machine to a consistency of approximately 40 to 45 percent. The water drained from the stock during formation is referred to as machine whitewater. Water from the machine whitewater system may be recycled for use as stock dilution water. Excess machine
128

whitewater may be combin~d with other process wh.i tewater and discharged as wastewate~.
Pressing
In the production of SlS hardboard, the mat which leaves the forming machine at 40 to 45 percent solids consistency is loided into "hot" hydraulic presses to be pressed into hardboard·.
. . . .
The board leaves the press at about 5 percent moisture or less. Although, much.of the water in the board is evaporated in the press, a considerable ,. amount of wastewater is generated during pressing. ·This wastewater is generally collE!cted in a pit below the press and discharged as wcistey,a_ter from the plant, although two plants, 929 and 673, return· the press water to the process whitewater system. Wastewater . resulting· from ·· the pressing operation is more· concentrated in dissolved .solids than the machine whitewater due to the large amount of water which is evaporated from the board during pressing.
Miscellaneous Operations
While the majority "·of wastewater generated during the production of hardboard occurs during the fiber preparation, forming and pressing operations; various other operations may contribute to the overall raw waste load ..
Drying--It is occasionally necessary to. clean the dryers in a hardboard plant to reduce fire danger and to maintain proper energy utilization. This produces a minor wastewater stream in most operations.
Finishing--After the board l~aves the press or humidifier, it is. usually sanded and trimmed to size. The dust from the sanding and trim saws is often controlled by dust collectors of· a wet scrubber type and the· water supplied to the scrubbers is som~times excess process water; however, fresh water is occasionally used. This water m.ay be returned· to the process with the dust, or it may be discharged as wastewater.
Many plants .paint or stain the board after. it is sanded and trimmed. Paint composition will va~y with both plant and product; however, most plants utilize a water-based. paint. The resulting washup contributes to the wastewater stream or to the· process whi tE~water system. .rn addition, there · are sometimes imperfect batches of paint which are discharged to the. wastewater stream or mE~tered to the process whitewater system.
Caul or Press Plate--Another wastewater source is caul and press plate wash w-ater. After a period of use, cauls and press plates acquire a surface &uild~up of resin and organics which results in. sticking in the presses and blemishes on the hardboard surface. The cleaning operation consists of submerging the plates in a caustic cleaning solution for a period of time to loosen the
129

organic matter. Press plates are also cleaned in-place with a caustic solution. The cauls are removed, rinsed with fresh water, then put back in use. The tanks used for soaking the cauls are emptied as needed, normally only a few times each year. Rinse water volume varies with frequency of washing of cauls or plates.
Other Sources--Other potential sources of wastewater in a hardboard plant include water used for screen washing, fire control, and general housekeeping.
' The water used for washing screens in the forming and decker areas usually enters the process whitewater system. Housekeeping water can vary widely from plant to plant depending-on plant practices and many other factors. Wastewater can result from water used to extinguish dryer fires. This is an infrequent and intermittent source of wastewater.
Wastewater Characteristics
The major portion of hardboard wastewater pollutants results from leachable materials from the wood and mat~rials added during the production process. If a chip washer is used, a portion of the solubles is leached into the chip wash water. A small fraction of the raw waste load results from cleanup and finishing operations; however, these operations appear to have little influence on the overall raw waste load.
The major factors which affect process wastewater quality include: "(l) the severity of cook to which the wood is subjected, (2} the types of products produced and additives used, (3) raw material species, and (4) the extent of whole tree chips, forest residue, and bark in the raw material.
The effect of steaming on raw waste load was discussed in this section for insulation board. The severity of cook to which wood furnish is subjected in S2S hardboard production generally exceeds that used in SlS hardboard production because of the requirement for more highly refined fiber bundles in the S2S product. It would be expected, therefore, that the raw waste load of S2S plants would be higher than that of SlS plants. Inspection of the raw waste characteristics for both types of plants presented in Tables V-29 and V-30 supports this conclusion.
A thorough review of the literature and information presented by industry sources pertaining to factors influencing variation 1n raw wastewater characteristics was performed by an EPA contractor. in 1976. The conclusions reached were published in Section V of the Summary Report on the Re-Evaluation of the Effluent Guidelines for the Wet Process Hardboard-Segment of the Timber Products Processing Point Source Category. An attempt was made in the 1976 study to quantify the effects of wood species, seasonal variations in raw materials, and the use of whole tree
130

chips and/or forest residue on raw waste characteristics. The conclusion ri~ached in the 1976 study was as follows:
It is easily apparent, fromthe sources dfscussed, that large variabil i tii~i; in raw waste characte.ristics. exist from plant to plant in tllle hardboard industry. It is also apparent that the factors identified as causing the variability are probably valid. However, it. is equally apparent that none of the sources investigated thus far has been able to supply the type of data necessary ti:., determine how the refei;-ence information relates to quaritificatkm of the factors Influencing .variations in raw waste. · ·· · .. During the course of the present study, the material available to the 1976 contractor was reviewed in detail, as well as current literature· and material presented by the plants in the data collection pi::>rtfol ios.. No substantial new material was presented to allow quantification of the eff~cts of wood species, whole tree chips and/or forest residue, or seasonal variations in raw material.
While a larige portion of th~ BOD in the process wastewater is a res.ult of organics leaching from the wood, a significant (although lesser) portion results from additives not retained in the product. Additives vary in both type and quantity according to the typ,e of product being produced. Chemicals used as additives in the production of hardboard include vegetable oils, ferric sulfate, aluminum sulfate, petrolatum, thermoplastic and/or th,ermosetting resins, defoamers, and paints. Thermosetting resins are not used in S2S production sine~ the board is dried prior to pressing. The differences in the type and quantity of additives used from plant to plant did not appea~ to significantly affect raw.waste loads.
Maximum.retention of these additives is ad,.;.antageous from both a production cost as well as a wastewater standpoint;· Several retention aids·are marketed for use in board products to increase the retenti,on of fiber and additives in ·the mat, the most common of which arj alum ~nd ferric salts. Some plants use synthetic polyelectrolytes as retention aids.
As previously discussed, the primary effect of product type on raw waste loads occurs with the production of S2S hardboard. S2S· hardboard production exhibits a marked effect on raw waste loads as shown by data presented in Tables V-29 and V-30. The effee:t of product type on raw waste loads within the Sl S and S2S parts .. of the wet proc~ss hardboard subcategory is generally not discernible, with the exception that Plant 929 has succeeded in significantly reducing its raw waste load by achieving nearly complete close up of its process whitewater system. This plant produces primarily industrial grade board.
131,

Table V--29. SIS lhrdboard Raw Waste Characteristics (Annual Averages)*
Plant Production Flow BOD 1SS lbnber ~clay (TID) kl/Ekg (kgal7ton) kg/Kkg . (lbs7ton) kg/Kkg (lbslton)
88. 7 (97.5) 32. 7 (6S.4)t 6.90 (t3.8)t
~
933 297 (326) 10. 6 (2. 511) 37. ,, (711. 7) 9. 15 (18.3)
3 194 (213) 7.E8 (1.84) 29.3 (513.6) 12.4 (24.8) 194 (213) 6. 17 (1.48) 25.4 (.50. 7) 12.8 (25. 7) 194 (213) 7.05 (1. 69 26.0 (52.0) 12. 6 (25.2)
931 117 (129) 8.82 (2.12) 35. 6 (71.2) 22. 5 (44. 9) 115 (127) 8. 14 (1.95) 33.8 (67. 7) 13.0 (25. 9) 113 (125)** 8.14 (1. 95)** 37.0 (74.1)** 13.8 (27. 6)**
919tt 91.9 (101) · 14.o (3.36) E8.5 (137) 16.8 (33. 5)
207 83.2 (91. 7) 30. 1 (f:Q.2) 10.2 (20. 3) 79.7 (87.8) 33.8 (67.8) 5.20 (10.4) 81.5 (89.8) 32.2 (64.3) 7. 70 (15.4)
673 343 (377) 13. 6 (3.26) 1.89 (3. 77) 0.56 (1.15) -678ttt 1446 (15139) 12.3 (2. 96) 21.9 (43.8) S.85 (11.7)
* First row of data rep:re.sent:s 1976 average annual daily data; second row represents 1977 average annual daily data; third rrM represents average annual daily data for two-year period of 1976 an:l 1977; except as roted.
t After prim9.ry settling, mrdboa.rd and p:1per W:1Stewater streams are can:ing.led. 'Irk ~ta xepresent parlocl of 10/1/76 thl:ough 12/31/77 when upgraded system was in normtl operation. tt All of treated effluent is recycled to plant process.
*kit Raw W9.Ste loads ~ are for o:xnbined weak and strong wastewater streans. ttt Raw W9.Ste load data taken after primary clarlfkation, pl adjustnEI1t, and rutrient addition.
132

_ .... W' w
Table V-30. S2S Hardboard Ra, Waste Characteristics CAnrual Aver~es)*
Plant Production Flow BOO TSS tbmer kkg/day (1PD) kl/kkg (kgal/ton) kg/kkg (lbs/ton) lq?/kkg (lbs/ton)
980 210 (231) 24.7 (5.93) 66.5 (133) 216 (238) 24.9 (5.97) 61.5 (123) 15.2 (30.4) · 213 (235)t 24.9 (5.96)t 645 (129)t 218 (240)** 24.5 (5.88)** - - 11.7 .. (23.4)** ·
1035 359 (JJ5)tt 11.1 (2.68) 43.2 (86.3)
1 311 (343) 25.8 (6.18) 116 (232) 20.0 .. (40.0)
* First row of data represents 1976 aver~ anrual daily data; secord rcw represents 1977 aver~ anrual daily data; third row represents aver~ anmal daily data for ~ar period of 1976 and 1977; except as noted.
t Data represents period of 1/1/76 thrwgh 4/30/78. ** Data represents period of 6/16/77 thrwgf:l 4/30/78 men standard TSS analyses were perfoured. tt Includes prod.tction of both insulation board aud hardboard.

Raw Waste Loads
Tables V-29 and V-30 summarize the raw waste characteristics of those hardboard plants which provided' historical raw waste monitoring data in response to the data collection portfolio. Nine of the sixteen hardboard plants provided raw waste historical data for the 12-month period from January through December 1976. Plant 673 provided data fro~ May 1976 to April 1977. Three plants also provided raw waste historical data for the 12-month period from Japuary through December 1977. Plant 980 provided data from January 1, 1976 through April 1978. The average annual daily raw waste loads presented in Tables V-29 and V-30 were calculated in the same manner as described for the insulation board subcategory earlier in this section4·
Plants 943 and 979 do not monitor raw waste effluents, and Plant 977 combines the raw waste effluent from its hardboard/insulation board facility with the raw waste effluent from an adjacent mineral wool fiber plant prior to monitoring. The data provided by Plant 977 could not be used to characterize raw waste loads for hardboard production.
Plant 929 provided data from January 1976 through February 1977 for its treated effluent only. These data were not used to calculate a raw waste load.
Of the nine predominantly S1S hardboard plants, eight plants (348, 933, 3, 931, 919, 207, 673, and 678) provided sufficient historical raw waste data for analysis.
Approximately 90 percent of the total production of Plant 348 is SlS hardboard produced with a plywood trim furnish. The other 10 percent of the plant's production consists of battery separators-a paper product. Although the plant indicates that 80 to 90 percent of the raw waste load results from hardboard production, monitoring by the plant is performed after the raw waste streams are combined. The plant did not monitor the flow rates of the separate wastewater streams during 1976. No flow data were reported by Plant 348. BOD and TSS raw waste loads were reported directly in lb/ton. The raw waste load for this plant is included in Table V-29, but is not included in the development of the SlS part design criteria.
Plant 919 produces all SlS hardboard using Douglas fir for furnish. The raw BOD waste load discharged from this plant is 68.7 kg/Kkg (137.4 lb/ton); however, some of this waste load entered the process through recycle of treated effluent. Since the waste load contribution resulting from recycle of treated effluent is unknown, the raw waste loads for this plant were not used to develop the SlS part design criteria.
Plant 3 produces all S1S hardboard using a furnish which is 55 percent mixed hardwoods and 45 percent mixed softwoods. Thirty
134

percent of thi~ plant's furnish is in the form of unbarked roundwood.
,,,,,
Plant 933 produces all S1S hardboard using an aspen· furfiish,. approximately half of which is unbarked roundwood and half is received as whole .tree chips.
Plant 931 produces all SlS hardboard using 75 percent oak and 25 percent mixed hardwoods.
Plant 207 produces all S1S hardboard using all Douglas fir in the form of chips, sawdust, shavings, and plywood trim. The raw waste load data presented for 1976 were not used to develop the S1S part design criteria because a major in-plant refitting program which significantly reduced the raw waste flow was completed during the latter half of 19.76'.
- -- .
Plant 673, which produces approximately equal amounts of S1S and S2S hardboard using redwood and Douglas fir; evaporates most of its process wastewater to produce a cattle feed byproduct .. Data for this plant are shown in Table V-29, but were ·not included in the development of the S1S part desigri criteria.
Plant 678 produces approximately 10 percent S2S and 90 percent S1S .hardboard using about 80 percent mixed hardwoods (40 percent of which is oak)· and. 20 percent Southern pine. This plant. evaporates a large amount of process water to produce a cattle· feed byproduct. Raw waste data reported in Table V-29 ,for this plant were obtained following primary clarification, pH adjustment, and nutrient addition. Plant 678 is·not included in the development of the SlS part design criteria; however, data for the plant are shown in Table V-29.
The average annual daily flows·and raw waste loads for· th~ SlS hardboard plants presented in Table V-29 (excluding the data for Plants· .. 348, 919, 673, and 678) were used to determine the design criteria ~sed for the S1S part of the wet process hardboard subcategory cost estimates presented in · Appendix A of· this document. The $1S part design. criteria are presented in Table v-31.
135

Table V-31. S1S Hardboard--Design Criteria
------------------------------------------------------------------Unit Wastewater Flow= 12 kl/Kkg (2.8 kgal/ton}
Design Criteria 1 2
Production, Kkg/day (TPD}
Wastewater Flow, Kkl/day (MGD}
Influent BOD Concentrations, mg/1
Influent TSS Concentrations, mg/1
91 (100}
1'.l (0.28}
3,300
1,300
270 (300}
3.2 (0.84}
3,300
l, 300 ---------------------------------------------: ---------------------Of the seven plants which produce predominantly S2S hardboard, three provided sufficient 1976 historical raw waste data for analysis and one plant provided 1975 historical raw waste data. One of the four plants also provided sufficient 1977 historical raw waste data for analysis.
Plant 108 uses thermomechanica.l pulping to prepare approximately 10 percent of its furnish, which consists primarily of aspen with· some whole tree chips. This plant produces approximately 50 percent insulation board and 50 percent hardbpard.
Plant 1035 uses thermomectianical pulping to prepare furnish, which consists primarily of pine with some panel trim. This plant produces approximately insulation board and 30 percent hardboard.
all of its hardwood and 70 percent
The raw waste effluents from insulation board and hardboard production of Plants 108 and 1035 are combined prior to raw waste monitoring. Therefore, the individual raw waste load generated by hardboard production could not be calculated, and values for these plants are not included in the development of the design criteria for the S2S part of the wet process hardboard subcategory.
Plant 980 used a nonstandard method for the raw waste TSS concentration analysis during 1976, and therefore the raw waste load was not used in developing the design criteria for the S2S part. As of June 16, 1977 the plant has changed its method of TSS analysis to the standard method. The data presented for 1977 are for the period from June 16, 1977 through April 1978.
Plant 1 produces about 80 percent S2S hardboard and 20 percent S1S hardboard. Its furnish consists of poplar, birch, oak, and pine; 23 percent received as bark-free chips and 77 percent as
136

roundwood. Raw. waste load BOD .for th.is plant, 116 kg/Kkg (232 lb/ton), is the highest by far of any fiberboard plant in the country and is cc;msidered. to be atypical of the S2S part. For· this reason the BOD raw. waste load for this plant is not included in the development. of the S2S part design criteria. Its TSS raw waste- load is, however, characteristic of S2S plants and is included in the development of the S2S_part design criteria.
The unit flow and raw BOD waste l.oad data. for Plant 980 were used to obtain the unit flow and BOD design criteria for theS2S part as presented· in Table V~32. · The TSS design criteria were developed using the average of the TSS raw waste·: loads from Plants 980 and ,1. The design criteria were used as ,a-basis for the. cost estimates presented_in Appendix_A of this document.
A unit flow of 24.6 kl/Kkg (5.9 kgal/ton) is considered to be representative of an S2S hardboard plant which produces a full line of hardboard products and which practices internal recycling to the exten~ practicable~
Table V-32. · __ S2S Hardboard--Design Criteria
------------ ----- ------ ~----- ------ --- ---- .. - -----------Unit Wastewater Flow= 24.6 kl/Kkg (5.9 kgal/ton)
Production = 2~q "!<'.~9/d~y _(250_TPD)
Wastewater Flow== 5.7.kl/day· (1.5 MGD}
Influent BOD Concentration= 2,600 mg/1
Influent TSS Concentration= 600 ~g/1 _ _ ------ • -, ----- • ------. -- - -- _<• -• • -- - ----- -- .- • - - ~ --- -- • T : -- ----- -------
Toxic Pollutant Raw Waste Loads
Raw waste concentrations and.raw waste loads for total phenols are shown in Table V-33~ Data presented in this table-were obtained during the 1977 and 1978 verification sampling progr_ams ~Two hardboard plants provided historical total phenols raw waste data, also inclµde_d in Ta_ble V-33. Annual average daily production and waste flow data provided by ~he plants in response to the data collection portfolio were used to calculate the. 1977 and -1978 raw wast~ loads. The average of the 1977 and 1978 loads are presented in _Table V-33.
137

The average raw waste concentration of total phenols for the five SlS hardboard plants (207, 673, 678, 931, 3) is 2.4 mg/1 and for the single S2S hardboard plant (980) is 0.16 mg/1. The S1S hardboard average raw waste load for total phenols is 0.019 kg/Kkg (0.038 lb/ton). The S2S hardboard average is 0.0038 kg/Kkg (0.0075 lb/ton).
Raw waste concentrations of heavy metals are presented for six hardboard plants in Table V-34. Data presented in this table were obtained during the 1977 verification sampling program. One hardboard plant provided 1976 historical data for lead and chromium which are also presented in the table. Annual average daily production and annual daily waste flow provided by the plants in the data collection portfolio were used to calculate the raw waste loads.
138

Table V-33. Plants ...
Raw Waste Concentrations and Loads for Hardboard -- --
Total Phenols
------------------ ------------------------------------ -------- -----
Plant
Raw waste· Con~~ntrations (mg/1)*
1977.:~ 1978
Average+ Raw Waste Loads.·
kg/Kkg (lbs/ton) ----------------------------------------------- ------- ~-- ---------980 ().07
207 0.38
673 1.2
678 () •. 24 0.29**·
931 Ei. 4
3 ~I. 4** -
o. 24,3
0 .. 610
3 •. 8
8.9**
0.0038
0.009
0.015
0.003 0.0037**.
0.043
0.040**
(0.0075)
(0.018)
(0.02)
(0.006) ( 0. 007 4) *,*
(0.086)**
(0.080)** --------------·-·----------------~:--------~------~-~-----------~-~--!""-------* Data obtained ~uring programs. These data composite samples.
1977:· and represent
.
1.978 verification sampling the average of three 24-hour
+ Average of 1977 and 1978 ra~ waste loads. Average daily waste flow and production data supplied by plants in response to data collection portf.olto were used to. calculate waste loads.
** Data are hi.e;torical data· supplied by plant in respon~e to data collection portfolio.
139
''Jl!t

Table \t-34. Raw~ 0,ncmtrati.oai ax1 loa:l~a for Bardboml Plmta-:Met.al.•
RS5l Waste Concentrations (ug/1) PisntNlllt>er
Raw Waste ~:ra~) (lb/too)
93I 9&I l>i:3 933 '1JJ7 6~ 93I !JOO 613 !f33 201 618
BerylliUll .00067 .0005 .00059 .0005 .0005 .0005 .000006 .000013 .000008 • 000005 .000009 .CXXXX>7 (.000012) (.000025) (.000016) (,000001)(.000017) (,000013)
Cadmiun .0031 .0023 .0005 .005 .0005 .0005 .000027 .00006 .000007 .00005 .000009 .000007 (,000054) (.00012) (.000013) (.0001) (.000017) (,00013)
Copper .450 .530 ,033 .1 .49 .260 .0039 .014 .00044 .0011 .009 .0033 (.0078) (.027) (.00088) (.0021) (.017) (.0065)
Lead .007 .0047 .055 .002 .002 .003 .00006 .00012 .0008 .00002 .000035 .000042 (.00012) (.00024) (.0015) ( .00004) ( .000069) (. 000083)
.053* - - - - - .00065* (.0013)*
Nickel .270 .070 .0057 .006 .0033 .009 .0024 ,0018 .0008 .00006 .00006 .00012 c.wm (.0035) (.00015) (.00012) (,00011) .00023
Zirx: 1.0 .190 .19 2.3 .78 .550 .009 .0048 .003 .024 .014 .007 ~ (.017) (.0096) (.005) ( .(}'+8) (.027) (.014) *" 0
Antim:>ny .0018 .003 .0058 .0023 .0005 .008 .000016 .00008 .00008 .000024 .000009 .0001 (.000031) (.00015) (.00015) (.()()()(}'+8)(.000017) (.00020)
Arsenic .0013 .001 .0012 ,0013 .001 .0012 .000016 ,000026 .000016 .000014 .000017 .000015 (.000023) (.000051) (.000032) (.000027)(.000034) (.000030)
Seleni1.111 .002 .0008 .0038 .0023 .0033 ,0018 .000018 .000020 .00005 • 000024 • 00006 .000023 (.000035) (.000040) (.0001) (.()()()(}'+8)(.00011) C.CXXXl45)
Silver .00067 .007 .0005 .0005 .0005 .00067 .000006 .00018 .000007 .000005 .(l()CXX)9 .000009 (.000012) (.00035) (.00013) (.000010)(.000017) (.000017)
Thalliun .0015 .0005 .00099 .0005 .0005 .00067 .000013 .000013 .000013 • 000005 • 000009 .000009 (.000026) (.000025) (.000026) (.000010)(.000017) (.000017)
Chraniun .033 .0073 .072 .008 .001 .420 .00029 .00019 .0001 .00009 .000017 .006 .47(ik (,00058) (.00037) ( .0019) (.00017) (.000034) (.011)
.006* (.012)*
Mercury .002 .00005 .0002 .001 ,018 .0017 .000018 .0000012 .0000027 .000011 ,00031 .000022 (.000035) (.0000025) (.0000053)(.000021)(.00062) (.CXXXl43)
* Data are 1916 historical data supplied by plant in resp:mse to data coilect1on p,rtfoho,

No significant differences in heavy metals concentrations between S l S and S2S hardbo.ard product ion were found. The sources of heavy metal:s in the wastewater from hardboard plants· are:. ( l) trace metals present in the wood raw material; and (2) byproducts of the corrosion of metal ,equipment in contact with the process wastewater. . The average coiicerrfrations. and the· average raw waste .. loadings of each heavy metal are presented in Table V-35.
Table V-36 presents the raw:waste concentrations of organic toxic poll~tant_s ~or SlS hardb.oard plants that were sampled during the 1978 verification _sampling program. Nohe of.· the Sl S hardboard plants presented organic toxic pollutant historical data.
Extremely low.concentrations of .ethylbenzene and toluene were found in the rc1w ... wastewater for .. Plant 207. The origin of these pollutants is probably common industrial solvents. The intake water for Plant 207 contained 10-ug/l of toluene,.whlch is the analytical d,etect.ion 1 imi t for this compound. Available. data on potable water sources demonstrate that few surface -waters are entirely fn~,e of trace organic contaminants.
Extremely low concentrations of chloroform, ben~ene~- and toluene · were found :iin the raw wastewater for Plant 931. These pollutants most likely originated in industrial solvents. Phenol was also found in thia. raw wastewater , and· is an expected · byproduct of hydrolysis reactions that occur as the wood furnish is refined.
Table V-37 p~esents the organic toxic pollutant concentrations of the raw · waste for .S2S hardboard plants that were sampled during the l 978 v•a~ifJ_cation sampling program. None of the S2S hardboard plants_presented organic toxic pollutant data.
No organic toxic pollutants were found in tne raw wastewater for Plant 980. Extremely low concentrations of ~hloroform, benzene, and toluene were found iri the raw waste for Plant 1, however, the plant. intakia. water contained 120 ug/1 benzene and · 80 ug/1 toluene. Chloroform most likely originated in industrial solvents. Phenol was also found in the raw waste for Plant 1 and is an expected byproduct of hydrolysis reactions that occu~ as the wood furnish is refined~
Extremely lc)w concentrations of . l, 2-trichloroethane and tolu·ene were found in the raw waste f6r Plant 943, the origin of which ii most likely industrial solvents.
141

Table V-35. Average Raw Waste Concentration and Loadings for Hardboard Plants--Metals
------------------------·--------------------------- .--~------------Average Concentration Average Raw Waste Load
Metal mg/1 '
kg/Kkg lb/ton ------------------------·-------------------------------------------Beryllium 0.00054 0.000008 0.000016
Cadmium 0.0020 0.000027 0.000053
Copper 0.31 0.0053 0.011
Lead 0.21 0.00018 0.00036
Nickel 0.061 0.00087 0.0017
Zinc 0.84 0.010 0.021
Antimony 0.0036 0.000052 0.00010
Arsenic 0.0012 0.000017 0.000035
Selenium 0.0023 0.000032 0.000065
Silver 0.0016 0.000036 0.000072
Thallium 0.00078 0.000010 0.000021
Chromium 0.099 0.0011 0.0022
Mercury 0.0038 0.000061 0.00012
142

Table V-36. Sl S Hardboard, Raw Wastewater •roxic Pollulant Data, Organics
------------------------------------------------ ------ -----------. .
Average Concentration (ug/1)
Raw Wastewater Parameter Plant 207 Plant 931 ------- --------------------- .--- .--------------------------------. . •. "•·· - "'" ' .. ~ . ' . .. ~
• • 6 •
Chioro!'orm 20
Benzene 80
Ethyl benzene ,20 .·
Toluene* 15 70
Phenol** 680 --------------·-·-····· ,-,,,,, ··-·•''''''''''' ··-··' __ ... _ ... , __ -.,-,., -··, :--------- .. ------ -----* Plant 207 intake water contained 10 ug/1 toluene.
** Plant 207 intak~ water cont~ined 9.7 ug/1 phenol.
Hyphen denotes' that the parameter was not found in concentrations above the detection limit for the compound.
Table V-37.. S2S .Hardboard, Raw Wastewater Toxic Pollutant Data, Organics
--------------------------------------------------------------------
Parameter
,. - -· ' .
Average Concentration (ug/1)
Raw Wastewater Plant 980 Plant l Plant 943
-------------------------------------------------------------------Chlorof.orm·
.. , i~· . ~
1, l, 2 Tf,f6hlorc>ethane
Benzene
Toluene
Phenol
• - - • -, .- - - - ... - C'
20
90*
60*
300
90
10
* Plant intake, water_ was measured at 120 ug/1 benzene and 80 ug/1 toluene.
Hyphen indicates that the parameter was not found in concentrations. above the detection limit for the compound.
14.3 ,.·


SECTION VI
SELECTION OF POLLUTANT PARAMETERS
A review of -timber industry. technical information from the literature, data provided by·the industry and by Agency sampling and analytical activities has revealed that toxic, nonconventional and conventional pollutants are- present in wastewaters generated by the timber industry. ·Table VI-1 illustrates the type of information requested from the industry plants.
TOXIC POLLUTA.N'TS
This section divides . the toxic pollutants, as identified· by Section 307(a} of the Clean.water Act of 1977, into three.major groups. The toxic pollutant groups are: Group l Found Most Frequently; Group 2 Found Infrequently; and Group 3 - Not Generally Found.
Information is also presented regarding the nonconventional and conventional pollutants found in timber industry wastewaters.
The pollutant groupings for the. wood preserving insulation bo,ard/wet process hardboard segments of. the are presented separately.
Wood Preserving Segment
... •· Group l Found Most Frequently
phenol 2-chlorophenol 2,4,6-trichlorophenol pentachlorophenol fluoranthene benzo(b}fluoranthene benzo(k)fluoranthene pyrene benzo(a)pyrene indeno(l,2,3-cd)pyrene benzo(ghi}perylene zinc · ·
phenanthrene/anthracene benzo(a)anthracene dibenzo(a,h}anthracene naphthalene acenaphthene. acenaphthylene fluorene .chryse.ne copper chromium arsenic total. phenols .
145
and the industry

TABLE IJl-1
TOXIC CHEMICAL INFORMATION
For each toxic chemical check on list, and for each wodcl preservative, fire retardant, fungicide, or mildewcide used in plant, complete the following form:
1. Name of Chemical Is this a (check one):
Wood Preservative
Fire Retardant
Fungicide
Mildewcide
2. Quantity and frequency of use
per _____ _
amount period
Other
3. Prooess or operation in which substance is used or generated.
4. Is substance discharged from plant? ___ Yes __ No _ Don't Know
If yes, is it: Air ___ Water
If water, Is it: Direct Discharge
5. Quantity and frequency of substance d.ischarged:
Amount (in units, lbs, tons etc.)
Gas
Liquid
Solid Waste ________ _
6. Description of sampling or monitoring program.
Solid Waste
To POTW
Period per (day, year, etc.)
Does your plant sample or monitor for substance?
__ Yes __ No
If yes, give details.
146

Group 2 Found Infrequently
benzene ethyl benzene toluene
trichloromethane lead nickel
Group 3 Not Generally Found
The pollutants identified as toxic in the 1977 Clean Water A.ct but not 1 isted in Group 1 or Group 2 ..
Wet Process H~rdboard/Insulation Board Segment
Group 1 Found Most Frequently
total :;:,henols copper
nickel zinc
Group 2 FQJ.1!'14 ~.nf r~quently
phenol benzene ethyl benzene toluene
trichlor6methane .. iead · chromium
Group 3 Not Generally Found
The pollutants identified as toxic in the ·1977 Clean Water A.ct but not 1 isted in G_roup l or Group 2.
,, ,\',:"'I, , ',a
TOXIC ORGANIC COMPOUNDS
Pentachloroph~nol
Pentachlorophenol (PCP) biocide used primarily bactericide/fungicide in in paints, in tanning and
(C6 Cl 5 0H) is a commercially produced for wood preservation (90%), as a cooling tower water, as a preservative
textile processing, and as a herbicide.
Transport and_Fate - PCP is only sparingly soluble in water .(14 mg/1 at 20°c) but is highly lipophilic, indicating that it will probably sorb into suspended particulates and organic sediments when introduced to the aquatic environment. Because of its very low vapor pressure (0.00011 torr at 200c), volatilization of PCP is not .expected to be a si9nificant tril:nsport process.
147

Photolysis and biodegradation appear to be the most important processes affecting the ultimate fate of PCP. In clear surface waters, PCP appears to photolyze rapidly, often forming less chlorinated phenols, anisoles, and other compounds which, like PCP, can be highly toxic and bioaccumulate. The lifetime of PCP in natural waters is estimated to be one week when conditions are optimal for photolysis.
At low concentrations, PCP can be degraded by certain microbial cultures in the laboratory; however, the extent of biodegradation in the aquatic environment is not well documented.
Data concerning the effectiveness of biological wastewater treatment in a publicly owned treatment works (POTW) on the removal of PCP are limited and contradictory. The PCP removal efficiencies reported in several studies,• including the ongoing EPA POTW study, range from 4% removal to· 100% removal. Based on aquatic fate information, PCP would be expected to undergo biodegradation slowly and to sorb to a large extent onto suspended solids and subsequently be incorporated into the sludge. Monitoring data at several POTW does indicate that PCP accumulates in sludge.
Toxicity and Exposure - PCP has been found to be toxic to man and animals. The lowest calculated oral dose of PCP lethal to man is 29 mg/kg. Reported lethal doses to rats vary from 11.7 mg/kg to 320 mg/kg, depending on route of exposure and the grade of PCP administered. Non-fatal acute exposure of humans to PCP can result in skin irritation, nasal .and respiratory tract irritation, headache, abdominal pain, fever, fatigue, and eye irritation. Dietary exposure to 100-500 mg/kg technical grade PCP for 90 days is ass()ciated with pronounced liver damage in rats. PCP has been found to be fetotoxic and teratogenic to rats orally exposed to 30 mg/kg/day or more during gestation.
Humans are widely exposed to low levels of PCP. PCP residues have been found in food, water, and human tissues. An analysis of human urine samples from the general U,S. population revealed 85% with detectable levels of PCP. Residues of PCP were detected in 11 of 360 composite food samples collected by the Food and Drug Administration. Residues of 0.004 to 0.017 mg/kg were found in dairy products, grains and cereals, root vegetables, and sugars. PCP has also been found in drinking water at low concentrations. PCP was detected in 86 to 108 finished drinking waters sampled by EPA in 1976. The mean concentration of the positive samples was 0.07 µg/1 and the median was less than 0.01 µg/1. Inhalation exposure data for the general population are not available. Air levels as high as 15 µg/m 3 have been measured in industrial settings.
Phenol
Phenol (C6 H5 0H) is a large volume industrial chemical produced almost entirely for use in the manufacture of commercial products
148

such as adh~sive resins, plastics and films, and other organic chemicals. Total production based on. 1977 figures - was approximately 1,075,000 metric tons. Phenol is known to occur naturally in the environment. Some aquatic plants release sufficient phenol to establish water levels of 300-~60 pg/1. The decomposition of surface vegetation such as oak leaves also releases phenol.· Phenol is produced by microbial action in mammalian intestinal tracts and as a result will be found in raw sewage. Phenol also occurs naturally in fossil fuel deposits.
Transport and Fate - Because phenol is highly soluble in water (solubility at 20°c = 93,000 mg/1) and has.a moderately low vapor pressure 9f (.53 torr at 20°c}, the majority of phenol discharged into an aquatic system should remain in solution rather _than sorbing tc:> sediments or vaporizing into the atmosphere. Laboratory and field studies indicate that biodegradation is probably thi: most important process that determines the fate of phenol in the aquatic environment, although evidence suggests that photooxidation and metal catalyzed oxidation may also be important dE=gradati ve processes in aerated:-clear surface. waters. Neither sorption nor bioaccumulation appear. to be important processes in the aquatic fate of phenol.
The primary fate of phenol in POTW is probably biodegradation. Lab studies indicated that at concentrations of 1 mg/1 to 1 O mg/1, phE=nol was biodegraded in biological treatment systems to levels lower than the detection limit; at a concentration of 1 o·o mg/1, cmly 20 percent of the phenol was removed. At concentrations as low as 1_0 mg/1, however, phenol can inhibit the oxygen uptake of unacclimated activated sludge. With long acclimation periods, activated sludge can be conditioned to metabolize up to 500 mg/1 phenol without exhibiting toxic effects.
Phenol toxicity has also been found to vary with temperature,. !'Jardness, salinity, and dissolved oxygen.
water
Toxicity ar~i Exposure - Phenol is known to be toxic to man and a variety_of animals at high concentrations. Lethal dose ranges of 4. 8 to.. ·.~J 28. O grams have been reported for man. The primary effect.·:6f e,posure to acutely toxic levels of phenol is central nervous system depression. Chronic exposure to phenol via ingestion, ().1 g/kg for six months, has been found to cause kidney and liver damage in rats. Repeated exposures to phenol at high concentrations have resulted in chronic liver damage in man. Al though thm~e is no evidence of human cancer due to phenol, it produces cancer in specially bred laboratory-tested mice when applied repE~atedly to the clipped skin after. initiations with known carcinogens.
Mammals, including man, appear to be constantly exposed to low levels of phenol since it is'. produced by microbial .actions in their intE~stinal · tracts. Reported human urinary free and
·conjugated phenol concentrations range from 5 to 55 mg/1.
149

£-Chlorophenol
2-Chlorophenol (c 6 H4 0Ci), also known as ortho-chlorophenol, is a commercially produced chemical used entirely as an intermediate in the production of other chemicals. It represents a basic chemical feedstock in the manufacture of higher chlorophenols for such uses as fungicides, slimicides, bactericides, antiseptics, disinfectants, and wood ang glue preservatives. 2-Chlorophenol is also used to form intermediates in the production of phenolic resins, and has been utilized in a process f9r extracting sulfur and nitrogen compounds from coal.
Aquatic Transport fil!d ~ Contamination of water with 2-chlorophenol may occur by (.1) chlorination of phenol present in natural water and primary and secondary effluents of waste treatment plants, (2) direct addition of the chemicals or as contaminants or degradation products of 2,4-D used for aquatic weed control, and (3) wet and dry atmospheric fallout.
2-Chlorophenol may be removed from water by several mechanisms. One study indicates that the dissipation of 2-chlorophenol is largely microbiological. Persistence appears to be short, but limnological factors, such as oxygen deficiency, may delay degradation. Microorganisms found in activated sludge and waste lagoons have been demonstrated to degrade 2-chlorophenol rather readily.
A study has found that low concentrations (l mg/1) of 2-chlorophenol ad¢ied to a usual dilution of domestic sewage were not removed during periods of 20 to 30 days, presumably due to the absence of microoganisms capable of attacking the chemical. When a similar concentration was added to polluted river waters, the compound dissipated in 15 to 23 days.
Addition of a seed, consisting of water from a previous persistence experiment, increased significantly the removal of 2-chlorophenol. Apparently, the seed introduced some organisms al~eady adapted to the chemical. This study also indicated that the removal of monochlorophenols requires the presence of an adapted microflora.
Data is available indicating the dechloroination of 2-chlorophenol and other monochlorophenols: within three days of exposure to an activated sludge system.
Toxicity and Exposure - The potential for exposure of man to any synthetic chemical exists through any of several modes. These modes include: 1) exposure of industrial workers during synthesis, formulation, packaging, or transport; 2) exposure of users of the product at either a commercial or retail level; 3) contact with residues or metabolites of the product as a result of using commodi€ies or environments containing the material; and 4) contact with the chemical as a metabolite of some other product.
150

While. a number of studies indicate rapid dissipation of 2-chlorophenol from waters by several mechanisms, human exposure cannot be fully evaluated unless studies are conducted measuririg the 2-chlorophenol content in waters receiving wastes from point sources of chlorophenols or their precursors. Evidence of such studies· was not found.
Contamination · of human foods with 2-chlor,c:>phenol could occur vi.a soil, plants, animals, or aquatjc sources. In all cases, any contamination is probably indirect and primarily a result of the use and subsequent metabolism of phenoxyalkanoic herbicides.
Although2~chlorophenol appears to be short lived in soils, the data are inconclusive, and factors affecting its persistence need further study. ·
The acute toxicity of 2-chloropheno~ has been studied in a variety of organisms. The compound is considered to be an uncoupler of Olcidative phosphorylation and a convulsant poison. No reports of the subacute or chronic toxicity of 2-chlorophenol have been found.
TrichlorophenQJ..
Trichlorophenol (CHC1 3 ), also known as chloroform or trichloromethane is derived from the reaction of chlorinated lime with acetone~ acetaldehyde or ethyl alcohol, or as a by-product from· the chlorination.·· of methane. Its uses are: fluorocarbon refrigerants and propellants, fluorocarbon plastics, solvent, analytical chemistry fungant and insectides.
Aquatic '.!!:fil!§portation !ru! ~ - In an 80 city study, chloroform was found in all :finished drJnking water supplies produced from raw water which had been chlorinated. Chloroform concentrations in the influent· and effluent. of the Cincinnati, Ohio ·sewage treatment plant whe.re chlorination was practiced were. 9. 3. ,,g/1 and 12.1 ,,g/1, respectively. Much higher levels of Chloroform have been found in wastewater effluents and also as the result of accidental industrial spills.
Researche~s reviewed the incidence, significance, and movemeni of chlorinated hydrocarbons in the food chain. They concluded that chloroform is widely distributed in the environment and is present in fish, water birds, marine mammals, and various foods.
In food, the typical range of chlor,oform was highest concentration noted was in Cheshire It was concluded that chloroform levels in acutely toxic to humans~
1 to 30 ,,g/kg. The cheese, at 33 ,,g/kg. food would not be
Pearson· and McConnell {1975) also reviewed the incidence of chlorinated hydrocarbons in various marine organisms and water birds and fo~nd that the concentrations of chloroform iti edible fish and marine organisms ranges from 3 to 180 ,,g/kg.
151

It was estimated that the consumption of products such as bread derived from chloroform treated (as a fumigant) grains would contribute 0.56 µg of chloroform per day ~o the· adult human diet. This number was derived- assuming: (1) consumption of 140 g of bread per day, (2) a chloroform level bf 0.4 µg/g in the bread where chloroform was used as the grain fumigant, and (3) chloroform comprises only one percent of total fumigant use in the United States.
Toxicity fil!Q. Exposure - Human exposure to chloroform may be via inhalation, ingestion, or by cutaneous 9ontact.
Chloroform is well absorbed via the respiratory system (49 to 77 percent). In an early study (1910), chloroform required 80 to 100 minutes to reach equilibrium between blood concentration and inhaled air concentration. Chloroform absorption from the gastrointestinal tract approximates 100 percent (Fry, et al. 1972}.
The National Institute for Occupational Safety and Health (NIOSH). Criteria Document ( 197,!I:) contains a tabulation of the effects of chronic chloroform exposure on humans. One 33 year old male, who habitually had inhaled chloroform for 12 years, was noted to have the psychiatric and neuroligic symptoms of depression, loss of appetite, hallucination, ataxia, and dysarthria. Other symptoms from habitual use are moodiness, mental and physical sluggishness, nausea, rheumatic pain, and·delirium.
Most human toxicological data have resulted from the use of chloroform as a general anesthetic in operations. Delayed chloroform poisoning has often occurred after delivery in obstetrical cases. The delayed toxic effects, ·were usually preceded by a latent period ranging from a few hours to one day. Initially drowsiness, restlessness, jaundice, and vomiting occurred, followed by fever, elevated· pulse rate, liver enlargement, abdominal tenderness, delirium, coma, and abnormal findings in liver and kidney function tests were also reported. Death often ensued, three to ten days postpartum. Autopsy reports generally described the liver as having a bright yellowish color, fatty infiltration with necrosis was found. Other hepatotoxic effects hav.e been reviewed (NIOSH, 1974).
152

h,!-Dimethylie.henol
2,4-Dimethylphenol (2,4-DMP), (C 6-H 3 (CB 3 ) 2 0H}, also known as· 2,4-xylenol, is· found, along with several other isomers of dimethylphen1ol, in complex mixtures derived from coal and petroleum sources. 2,4-Dimethylphenol is a natural product found in cresylic acids derived from coal. and petroleum sources. Except for one manufacturer,·2,4-dimethylphenol is not· separated from the cresylic acids, but is left in this mixture of ciesols, dimethylphenols and phenols. Based on 1976 figures, the total production of .. dimethylphenols, was approximately 5000 metric tons. Cresylic acid, along with its constituent· 2,4-dimethylphenol, is· used in the manufacture of solvents, plasticizers, disinfectants, and pesticides, as well as many other miscellaneous uses~ It is also found in lubricants, gasolines, and other fossil fuel derived products. Pure 2,4-dimethylphenol is mainly used in the manufacture of pharmaceuticals and as a chemical intermediate.
Aquatic Tran~port and Fate - Because relevant data are 'lacking, the aquatic fate of 2,4-dimethylphenol must. be inferred from its physical properties and from the behavior of structurally similar compounds. 2,4-Dimethylphenol is transported to the aquatic environment via direct discharge in industrial eff1uents, leaching from soil, and. by atmospheric rainouL Because of its low vapor pressure (0.0621 torr at 20°c) and moderately high water solubili..ty (at least 1000 mg/1.at 20°c), volatilization of 2,4-dimethylpheriol · from.water is not expected to be significant. Based on studies with similar compounds, 2,4-dimethylphenol should not sorb to inorganic clay and sediments; however, it may sorb to organic detritus and. sediments. as indicated by· its relatively· high log octanol/water partition coefficient of 2.5. The log octanol/water partition coefficient also indicat.es that 2,'4-dimethylphenol may. have. a tendency to be sorbed by aquatic organisms; however, no information concerning the bioacc·umulation of 2, 4-dimet~ylpheno:l has been r~port~d.
The two most important fate mechanisms for 2,4-dimethylphenol in the aquatic environment are probably photooxidation and biodegradation. Based on the photolytic behavior of structurally similar compounds such as toluene, 2,4-dimethylphenol should undergo photooxidation in well aerated, clear surface waters. Data concerning biodegradation are somewhat conflicting and. inconclusive-.·· Cultures of microorganisms obtained· from garden soil, compost, river mud, activated sludge, and the sediment of a petroleum refinery waste. lagoon were all shown to be capable - of degrading 2,4-dimethylphenol .. However,·a series of experiments attempting to duplicate the conditions for biodegradability that would occur in a river indicated that 2,4-dimethylpl;lenol seemed to be very persistent.
Toxicity and Exposure - Although the data are limited, ad~erse health. effects of 2,4-DMP have been demonstrated. Oral LD50 values for 2,4-dimethylphenol of 3,200 mg/kg for the rat and

809 mg/kg for the mouse have been reported. Pathological changes as a result of exposure to acute toxic levels of 2,4-dimethylphenol are not available; however, information for high doses of other dimethylphenol isomers, in general, shows kidney, spleen, and heart cell damage. In a carcinogenic bioassay, 12% of specially bred mice exposed to 2,4-dimethylphenol dissolved in benzene developed carcinomas; however, benzene was not evaluated by itself. In a related study, 2,4-dimethylphenol, when initiated with a single subcarcinogenic dose of 7,12-dimethylbenz{a)anthracene (DMBA) produced carcinomas in 18% of the mice, indicating that 2,4-dimethylphenol may be a promoting agent for carcinogenesis. No data are available on possible mutagenic, teratogenic, or other reproductive effects of 2,4-dimethylphenol.
Data pertaining to mammalian exposure and toxicity to 2,4-dimethylphenol are limited. Although 2,4-dimethylphenol has been detected in drinking water, the data is limited and no specific estimates are available on the amounts of 2,4-dimethylphenol ingested in drinking water. Although it is produced naturally in some plants, such as tea and tobacco, there is no evidence to suggest that 2,4-dimethylphenol occurs in many plants used for food, though it may be assumed that trace·amounts are ingested. Inhalation, as a result of cresol vapors, cigarette smoke and vapors from the combustion of building materials and fossil fuels, is a possible route of mammalian exposure. Even though adverse health effects have been reported as the result of exposure of workers to complex mixtures containing dimethylphenols, the compounds were present in low concentrations relative to other hydrocarbons and the adverse effects were not attributed to dimethylphenol. No quantitative estimates have been made of the amounts of 2,4-dimethylphenols inhaled by the general population. Dermal absorption of 2,4-dimethylphenol is rapid and thought to be the primary route of human exposur~ to complex mixtures containing the chemical. In 1978, NIOSH estimated that 11,000 workers were occupationally exposed to cresol containing 2;4-DMP.
2,4,6,-Trichlorophenol
Production data for 2,4,6-trichlorophenol are confidential; howeve~;~ the production in 1977 was estimated to be as high as 16,000 metric tons.
2,4,6-Trichlorophenol is used directly as a preservative, glue preservative, insecticide antimildew treatment for textiles. It is intermediate in the synthesis of certain disinfectants.
germicide, wood ingredient, and
also used as an pesticides and
Although no environmental emmission estimates are available for 2,4,6- trichlorophenol, available data indicate that various chlorinated phenols, including 2,4,6-trichlorophenol, are formed during the biological degradation and transformation of several pesticides. 2,4,6-Trichlorophenol is also reported to be formed
154

during the chlorination, of wastewater and Qrinking water for disinfection.
Transport ~~~ Fate - Microbial degradation has been demonstrated in soil samplies and in acclimated sewage sludge but it is uncertain a:s a fate process iri ambient surface. waters. Similarly, photolysis of 2,4,6-trichlorophenol and related compounds has been reported in the laboratory, but the environmental relevance of this process is uncertain. Other fate processes prc::,foab1y do not contribute significantly to the aquatic fate of this compound.
Due to its moderate solubility in water (lOO mg/1 at 2soc) and low vapor pressure (1 torr at 76.5°C) volatilization is not considered to be a significant transport process for 2,4,6-trichlc::>rophenol. Although the value of the log octanol/water partition coefficient for 2,4,6-trichlorophenol. (log P=3.38) indicates, a definite potential for 2,4,6-trichlorophenol sorptibn to organic sediments and particulates and for bioaccumulation, no data are available indi,cating that these processes remove significant amounts of 2,4,6-tichlorophenol from water.
Toxicity and El~posure There are no available data on human exposure levels to 2,4,6-trichlorophenol. It can be formed during the chlorination of d~inking water, and it has been detected in drinking water but the amount was not quantified. Exposure to certain pesticides and disinfectants could result in exposure to 2,4~6-trichlorophenol via metabolic degradation of the parent c,ompound.
Benzene
Benzene (C6 H6 } is thirteenth in order of high volume chemicals produced in the United States. It is derived from. fractional distillation of coal tar, catalytic reforming of petroleum and other methods.
Tranport and Fate - Benzene is slightly soluble in surface waters and may volatilize from water to the atmosphere, where it may then wash out with precipitation to surface water. Benzene accumulates 'in aquatic organisms; for example, it accumulates up to 8,450 times in the gall bladder of the Northern Anchovy. The rate of biodegradatton for benzene in the aquatic environment is slow, and thus, any benzene remaining in water is likely to be persistent.
Toxicity i;lnd Exposure - Humans and animals may be exposed to benzene 1n air because of its volatility. Inhalation may cause. depression of the central nervous system, resulting in. paralysis of the respiratory system and death. At 20,000 ppm, benzene can be fatal in a few minutes. Benzene is a ~utagen and a suspecteq carcinogen in man. The National Institute for Occupational
155

Safety and Health (NIOSH) has recommended a 1-ppm limit for worker exposure to benzene in air.
When benzene is discharged to surface water, it can be toxic to aquatic life, humans, and other animals through ingestion or inhalation. Because benzene is not completely removed by current waste treatment facilities, drinking and irrigation water exposes humans to benzene; it has been detected in:drinking water.
Toluene
Toluene (C7 H8 ) is the seventeenth highest volume chemical produced in the United States. Its derivation is by catalytic reforming .of petroleum and by fractional distillation of coal tar light oil.
Transport and Fate Because it is slightly soluble, toluene discharges to surface w~ter will form a colorless slick, dissolving slowly into the water column. Toluene readily volatilizes from water to the atmosphere (half-life in water may be on the order of 31 minutes to 5 hours). Where toluene is subject to photochemical degradation, primarily forming benzaldehyde, the half-life may be about 12 hours. Sorption onto suspended particulates may be an important transport process, but it is unclear how sorption competes with volatilization. Biodegradation of toluene may occur in water. Bioaccumulation of toluene occurs in the marine mussel, and may occur in freshwater aquatic organisms as well.
Toxicity and Exposure Toluene is moderately toxic to humans when ingested or inhaled. The lowest calculated dose lethal to humans is 50 mg/kg when ingested .. Inhalation of 200 ppm can cause central nervous system depression, while increased exposure may induce narcosis, addiction, and death. The Occupational Safety and Health Administration has set 200 ppm in air as the upper limit value for the safety of workers occupationally exposed to toluene.
Benzo(a)pyrene
Benzo(a)pyrene (C20H12 ) is a polynuclear aromatic compound found in coal tar, cigarette smoke and in the atmosphere as a product of incomplete combustion.
Transport and Fate Very little benzo(a)pyrene dissolves in surface water dueto its extreme insolubility. Most of it quickly adsorbs onto suspended sediments and other particulates. In this form, it is available for bioaccumulation by aquatic species. In a laboratory model ecosystem, marine snails accumulated benzo(a) pyrene to 2177 times the ambient water concentration; benzo(a)pyrene was bioconcentrated 882-fold in freshwater worms.
156

Toxicity and ~xp?sure - ~lthou~h there is no firm evidence that benzo(a)pyrene is carcinogenic to man, coal tar and other materials containing this compound and other polynuclear aromatic hydrocarbons.· are human carcinogens. Benzo(a)pyrene is carcinogenic. to mice, rats, hamsters, and other lab animals when they are exposed to doses as low as 1 mg/kg, and it produces more tumors in a shorter· period of time than other polynuclear aromatic hydrocarbons. Benzo(a)pyrene is a teratogen and mutagen in laboratory rats, mice, and rabbits.
Human exposures to benzo(a)pyrene come from many sources including fuel exhaust, air, food crops, and drinking water. The World Heal th Organization recommends 0-. 2 ,,g/1 as the· maximum level of total polynuclear aromatic hydrocarbons safely allowed in drinking water. There are no data available on the amount of benzo(a)pyrene entering the human body from these sources.
Chrysene
Chrysene (also known as 1,2.:..benzphenanthrene or benzo(a)phenanthrene) (C 18H12 ) is a polynuclear aromatic hydrocarbon (PNA) of man-made and perhaps nat~ral origin.
Man is exposed to chrysene and other PNAs from .many sources including automobile and diesel exhaust, incinerator effluents, food crops, cigarette smoke, and water.
Transport ~9. Fate Polynuclear aromatics (PNAs) such as chrysene enter aquatic systems from the atmosphere adsorbed onto particulates and-bacteria and exist in water in association with organic matter or colloids formed from synthetic· detergents. That portion of chrysene which is dissolved in water probably photolyzes like ot_her PNAs, but because of the relative aqueous insolubility· of chrysene, this may not be a significant removal process.
In general PNA compounds are believed to be incorporated and metabolized by organisms throughout the phylogenetic scale. Chrysene's log partition coefficient (log P) of 5.61, together. with the theoretical and empirical data that compounds with high log P values tend to accum~late in biota, indicate that chryserie is bioaccumulated. Unlike persistent chlorinated organics such as DDT and the PCBs, PNAs, once bioaccumulated, appear to be metabolized and eliminated from the organism. Thus bioaccumulati.on is not considered an important fate process.
In mammals metabolism of PNAs is incomplete, the major products being hydro-xylated derivatives and epoxides. Both parent compounds and these metabolites are excreted. via the. urinary system. Bacteria have been shown to utilize PNA compounds as a carbon source, and evidence indicates that they can metabolize PNAs much more completely than mammals. Although microbes are capable of degrading tricyclic aromatic, hydrocarbons, they
157

probably do not degrade higher polynuclear hydrocarbons such as chrysene.
Toxicity and Exposure - Although there is no firm evi.dence that individual PNAs are carcinogenic in man, chrysene and other PNAs are present in coal tars and pitch which are known human carcinogens. Tests with laboratory mice show chrysene to be carcinogenic.
The World Health Organization recommends 0.2µg/1 as the maximum safe level of total PNAs in surface water to protect aquatic life.
Naphthalene
Naphthalene is a polynuclear aromatic compound (C 10H8 ). It is derived from distillation and crystallization of coal tar, and from petroleum fractions after various. catalytic processing operations.
Naphthalene is found in treated effluents, and dr.inking and surface waters. It is toxic to aquatic organisms, tumorogenic to mammals, and can taint fish flesh.
Transport and Fate - Naphthalene is slightly soluble in water and when discharged to surface water, will adsorb onto suspended particulate matter where it is subject to metabolism by microorganisms. Volatilization and photolysis may be important fates for the dissolved portion.
Toxicity and Exposure ·- There is no evidence· that naphthalene is carcinogenic to man, although coal tar and other materials that contain naphthalene and other polynuclear aromatic hydrocarbons are human carcinogens. While no data were found specifically linking cancer to naphthalene, it is toxic to humans and other· mammals.
Human exposure to polynuclear aromatic ·hydrocarbons, including naphthalene, comes frc:>m many sources such as car exhaust, incinerator effluents, food crops and water. Inhalation exposure by workers to naphthalene is regulated by the Occupational Safety and Health Administration which has set 10 ppm in air as the upper limit for health and safety.
Polynuclear Aromatics (PNAs)
Fluoranthene, fluorene, phenanthrene, pyrene, anthracene, benzo(k)fluoranthene, benzo(b)fluoran-thene, indeno(l,2,3-cd) pyrene, benzo(ghi)perylene, benzo(b) anthracene, dibenzo(ah)anthracene, acenaphthylene and acenapthene are polynuclear aromatic hydrocarbons. As a group, polynuclear aromatic hydrocarbons are known to be toxic, mutagenic, teratogenic, and carcinogenic to aquatic organisms and mammals. Little information exists specific to fluoranthene, and its
158

probable environmental effects are, for the most part, inferred from data on polynuclear aromatic hydrocarbon~ as a group. Fluorene is thought to be an inactive carcinogen; its carcinogenic properties are activated in the presence of other polynuclear aromatic hydrocarbons.
Transport ~1d Fate Polynuclear aromatic compounds_ are relatively insoluble in water and when discharged to surface waters will strongly adsorb onto suspended particulate matter. Volatilizaticm from the sorbed state is thought to be very slow and they will likely remain with and be transported by the suspended particulates. In - this form-, polynuclear aromatic hydrocarbons are· available for bioaccumulation and biotransformation. Direct photolysis of the smaller dissolved portion may occur, although evidence is taken from other polynucleaf aromatic hydrocarbons (e.g., benzo(a)pyrene) . While bioaccumulation factors for- polynuclear aromatic. hydrocarbons have been reported as high as 2177 in laboratory ecosystems, they are in . geni=ral rapidly metabolized or depurated from an aquatic organism. L<:>ng-term bioaccumulation, such as that reported for . some chlorinated organics (e.g., DDT and PCBs), is not thought to be, an important fate process. Biodegradation of polynuclear aromatic compounds is known to occur and is believed to be their ultimate aquatic fate.
Toxicity .e_Q.g Exposure There· is no firm evidence that polynuclear aromatic hydrocarbons are carcinogenic to man, although coal tar and other materials that contain fluoranthene and other polynuclear aromatic hydrocarbons are human carcinogens. While no data were found specifically linking. cancer to fluoranthene, it is known to be toxic to. laboratory animals. Human exposure to polynuclear aromatic hydrocarbons comes from fuel exhaust, industrial air, food crops and water.
Ethyl benzene
Ethylbenzene (C6 H5 C2 H5 ) produced in the United and ethylene in the fractionation directly refining.
- ·.
is the twentieth highest volume chemical States. It is·derived by heating benzene presence of aluminum chloride and by from.the mixed xylene stream in petroleum
Transport -~Q. Fate - Ethylbenzene forms a colorless slick on surface waters because it is slightly soluble. Some of it probably adsorbs slowly to suspended particulates,. although adsorption rates are not available. Vapor pressure data suggest that ethylbenzene is likely to volatilize from the water column, though rates are unavailable. Bioaccumulation of ethylbenzene is unlikely.
Toxicity ~£ Exposure - Humans absorb ethylbenzene through the skin after exposure to the pure liquid or aqueous solution at rates of 22 to 33 mg/cm2 /hr and 0.118 to 0.215 mg/cm 2 /hr, respectively. Such exposure to the skin of a rabbit is lethal at
159 ·

5000 mg/kg. Ethylbenzene taken orally at S.5 g/kg is acutely toxic to rats, and chronic exposure induced changes in the liver and kidneys of rats. ·
Humans are adversely affected by ethylbenzene in air, through inhalation or skin contact. Ethylbenzene can irritate the eyes, affect the respiratory tract, and cause vertigo. Human health effects occur at 100 ppm with 8 hours of exposure. The Occupational Safety and Health Administration (OSHA) has set 100 ppm in air as a limit to protect workers, although adverse effects on the skin may occur at lower concentrations.
Copper
Copper (Cu) is a metallic element. It occurs naturally as an ore and its derivation is dependent on the type of ore.
Transport and Fate - Several. processes determine the fate of copper in the aquatic environment, including complex formations, sorption to hydrous metal oxides, clay, and organic materials, and bioaccumulation. Sorption processes are most active in scavenging dissolved copper from solution and thus control its mobility. The effectiveness of the various sorption processes is dependent on pH, oxidation-reduction potential, and the concentration of inorganic and organic materials. Bioaccumulation of copper by various species has been demonstrated.
Toxic~ty and Exposure - Copper is toxic to many types of aquatic organisms and has been used as an effective algicide. It is usually more toxic in soft water than hard ~ater.
Copper in trace amounts is essential for humans. Larger amounts, however are toxic; acute copper poisoning can result in nausea, vomiting, diarrhea, liver enlargement, kidney failure, and hemolytic anemia. Humans exposed for several months to 4 to 7.6 mg/1 of copper in their drinking water developed a prominent skin rastl. :
Chromium
Chromium (Cr) is iron ore by direct divided aluminum solutions.
a metallic element. It is derived from chrome reduction, by reducing the oxide with finely or carbon and by electrolysis of chromium
Transport and fill - Chromium is usually found in the trivalent and hexavalent forms in the aquatic environment.
The hexavalent form is quite soluble in water and is thus quite mobile in the aquatic environment. It is not sorbed to any significant degree by clays or hydrous metal oxides, but it sorbs strongly to activated carbon and theref~re may sorb to organic
160

material. In ~rganic-rich, sulfide-rich, or reducing waters the hexavalent form is converted to the trivalent form.
The trivalent f9rm is _re~~ily hydrolyzed to form inso.luble compounds, and precipLtation of this material to·the sediment is thought· to be the dominant fate of trivalent chromium.in natural waters. The trivalent form can also be removed from the water column by sorption onto inorganic materials~ The trivalent form does form soluble complexes with a variety of organic materials but this is probably not a ~ignificant process. Both forms of chromium can also be· accumulated by aquatic organisms. Bio~oncentration factors as high as 152 have been reported in marine organisms.
It appears, therefore, that chemica~ speciation plays a dominant role in the fate of chromium 1.n the aquatic environment. Conditions favorable for the hexavalent form will keep chromium in a soluble form in the water, while conditions favorable for the trivalent form will lead to accumulation of chromium in the sediments.
Toxicity and Exposure - The data base for the aquatic toxicity of chromium is -fairly extensive. Both trivalent and hexavalent. chromium are toxic to aquatic organisms. Trivalent chromium is substantially more toxic to aquatic life in soft than in hard water. The effect of water hardness on the· toxicity of hexavalent chromium is not as significant.
Chromium can be absorbed to some extent by the digestive tract, the skin, and the lungs. In general, hexavalent chromium is more readily absc,rbed by body tissues than trivalent chromium, presumably beicause of its greater solubility and ease of movement across biological membranes~ Once within cells, hexavalent chromium is likely to be converted to the trivalent .. form. Absorption of: chromium from the digestive tract is slight and may amount to only a few percent of the ingested dose.
Arsenic
Arsenic (As) is a metal.li .. c: element. It. is derived from flue dust of copper and lead . smelt'e.rs, ... as arsenic . ·trioxide. Arsenic trioxide is reduced to the element·witi1 charcoal.
Transport anq Fate - Arsenic is characterized by its extreme mobility and cycling through the water ccilumn, sediments, and biota. The prevailing redox ,a.nd pH conditions are important in determining the forms in which arsenic will be present in the dissolved and solid phase. In the surface layer of the aquatic environment where oxidizing conditions prevail, the dominant species is arsenate. Th.is ar-senate can either be transported by dispersion and convection to the oxygen depleted region where reduction to ar~erilte oc~urs or be coprecipitated with ferric hydroxide to the sediment. In the .sediment where conditions are normally very reducing, chemical redu.ction of ferric arsenate and
161

arsenite results in solubilization or stabilization as an insoluble sulfide or ~rsenic metal. Microbial transmethylation or reduction of the sulfide or metal to arsine mobilizes the remaining arsenic and thus returns it to the cycle. Because of its continuous resolubilization, much if not all of the arsenic introduced to the environment eventually ends up in the ocean. Fish and invertebrate aquatic species enter this cycle by concentrating arsenic, especially trimethylarsine. When discharged to a publicly owned treatment works (POTW), arsenic is likely to be distributed in both the sludge and the effluent. The form of arsenic is not known, but since most arsenic compounds are unstable toward oxidation in the aquatic environment, it is likely that the dominant species in a POTW will be arsenate (+5) or arsenite (+3 ).
Toxicity §!!!g_ Exposure - In humans, the trivalent form (arsenite) is reported to be 60 times more toxic than the pentavalent form (arsenate). Symptoms of acute arsenic poisoning by ,ingestion include abdomi-nal pain and vomiting.• Acute poisoning by inhalation causes giddyness, headache, extreme general weakness and, later nausea, vomiting, colic, diarrhea, and pain in the limbs. Chronic ingestion causes loss of weight, gastrointestinal disturbances, pigmentation and eruptions of the skin, hair loss, and peripheral neuritis. Exposure to arsenic in drinking water has been shown to result in a higher incidence of certain types of cancer, in particular epithelial lesions.
Arsenic is· ubiquitous in the environment and found in all plants and animals. Arsenic may reach the aquatic environment through atmospheric fallout, industrial emissions and the improper application of arsenical herbicides and pesticides.
Poisoning of domestic animals by arsenic appears to occur with a frequency second only to poisoning by lead. It appears to be limited for the most part to forage contaminated by arsenical herbicides, pesticides, and feedstock supplemented by improper amounts of phenylarsonic acid. Because of .the numerous factors that influence toxicity of arsenic, it is virtually impossible to specify toxicity in terms of body weight. The lethal ingested dose for most species, however, appears to range between land 25 mg/kg of body weight a$ sodium.arsenite.
~
Lead {Pb) is a metallic element. It is derived by the roasting and reduction of lead sulfate, lead sulfide and lead carbonate.
Transport and Fate The most important physical process controlling the aquatic fate of lead and its compounds is adsorption by the particulate phase followed by deposition in the sediment. Because this process occurs rapidly, lead generally remains in the vicinity of the source. In severely contaminated areas, precipitation may also ·play a role in removal from solution. Salts of lead are generally not very soluble except at
'
162

low pH, a situation encountered infrequently in natural waters. Benthic microbes can remobilize lead from the sediment by bioaccumulation ,or by biomethylation to tetramethyl lead·. The latter may either be reoxidized as it moves to the aerobic. region of the water column or be volatilized to the atmosphere. Although lead can be passed along the food chain, it is not biomagnified. Bioconcentration factors fall between 60 and 1000 for several aquatic species. Bioaccumulation may play a bigger role in the fate or lead under acidic conditions where lead salts are either more soluble or less adsorbed.
Toxicity !!!J~ Exposure Lead. poisoning in humans may cause several well known but nonspecific clinical syndromes such as acute abdominal pain, acute or chronic encephalopathy, peripheral neuropathy and chronic nephropathy .. Children are in general more susceptible .t.o lead poisoning because, 1) they are more likely ·to exhibit neurotoxic symptoms, 2) they absorb more lead from food, 3) they mobilize more lead from that accumulated in the body, 4) they have a greater caloric intake and hence food intake on a body ~urface area basis and 5) their intake is not limited to food but maiy also include street dust, flakes of paint, etc. Unlike most heavy metals, lead crosses the pla_centa with blood levels in newborn children closely correlated with those of their mothers. ···· ··
There is ccmsiderable evidence from laboratory·studies that·lead is carcino9enic, mutagenic, teratogenic and may even cause reproductive impairment. In . pregnant laboratory rats malformations in fetuses were observed following intravenous injection of 50 mg/kg of lead nitrate.· Ingestion of lead acetate and ·subcutameous injection of tetraethyl lead may lead to kidney and lung tumors and various other malignancies. Cultures of human leukocytes obtained from workers exposed to fumes in a storage battery plant exhibited increased chromosomal abnormalitiE~s. Another study showed alterations in spermatogenE~sis and subsequent loss · of feri 1 i ty in 150 occupationally exposed men~
Zinc
Zinc (Zn) i.s a metallic element. It is derived by one of two main processes, toasting followed by either (1) pyrometallurgical or distillation process, or (2) hydrometallurgical or electrolytic process.
Fate and ~msport - The potential for exposure to zinc is linked in part te> its. fate in the aquatic environment. Removal from solution through adsorption by hydrous iron and manganese oxides, clay minerah;, and organic material is the dominant fate process for zinc · in aerobic waters. The effecti ve:.-iess of adsorption depends upon the composition of the absorbing matrix, pH, redox potential, salinity, concentration of available ligands, and concentrations of zinc. Above a pH of 7, zinc is almost completely adsorbed from solution by sediment or soils; below pH
. 163

6, where zinc is present predominantly as in++, very little is adsorbed. As salinity increases, zinc is also desorbed from sediment. Generally speaking, since salts of zinc are highly soluble in aerobic waters precipitation will play a minor role in determining the fate of zinc. However, in reducing conditions, precipitation of the sulfide may occur, or when certain ligands are present, highly soluble complexes may be formed, thereby decreasing the process of precipitation which in turn will favor adsorption of zinc.
Zinc is bioaccumulated by all organisms and passed along the food chain. Uptake via the food chain appears to be the most important route for fish, whereas uptake from sea water appears to be the preferred route for zooplankton. Even though the biota represent a relatively minor sink when compared to the.sediment, they may play a significant role in the mobility of zinc. Microcosm studies generally indicate that zinc is not biomagnified.
Toxicity and Exposure - Zinc and its compounds are toxic to mammals including humans. Although death in humans may occur, the most commonly observed effects of zinc poisoning are nonfatal metal fume fever caused by inhalation of zinc oxide fumes, various illnesses (congestion of the lu~g, liver, spleen, and brain) caused by ingestion of acidic foods prepared in zinc galvanized containers, and dermatitis by contact with zinc salts.
Nickel
Nickel (Ni) is a metallic element. It ip derived by flotation and roasting of nickel ores, or by leaching' with ammonia.
Transport and Fate - As an element, nickel cannot be degraded in the aquatic environment and appears to be a relatively mobile heavy metal. Although it has several known oxidation states, nickel in the aqueous environment exists primarily in the divalent state. Sorption and precipitation do not appear to be as effective in reducing aqueous nickel concentrations as they are with many other heavy metals (e.g., copper and chromium). However, the hydrous oxides of iron and manganese may exert some control over the mobility of nickel via co-precipitation and sorption. Precipitation of nickel compounds may be important in reducing environments, where the insoluble. sulfide is formed. Nickel may be bioaccumulated by some aquatic organisms, but most concentration factors are less than 1000. Because these processes occur with only low or moderate efficiencies,·most nickel added to the aqueous environment eventually goes to the ocean.
Toxicity and Exposure - A wide variety of physiological effects have been linked with exposure of mammals to nickel and its compounds. Exposure in laboratory animals, following both inhalation and ingestion by other routes, has caused lung congestion, inhibition of insulin release, depressed growth,
J
164

carcinogenesis, and death. In humans; airborne nickel may cause throat irritation, weakness, fever, headache, nausea, muscle and joint pain, eczema or dermatitis, and vomiting~ In addition, it is suspected that nickel inhalation leads to lung and nose cancer. Nickeil carbonyl, an extremely volatile compound, is by far the most toxic of the nickel compounds and is approximately 5 times as toi:ic as carbon monoxide. Therefore, inhalation can lead to high concentrations of elemental nickel in the lungs.
CONVENTIONAL POLLUTANTS.
Biochemical Ox_Y.gen Demand (BOD)
Biochemical oxygen demand is the quantity of oxygen required for the biological and chemical oxidation of waterborne substances under ambient or test conditions. Materials which may contribute to the BOD include: carbonaceous organic materials usable as a food source by aerobic organisms; oxidizable nitrogen derived from nitrites, ammonia, and organic nitrogen compo~nds which serve ·. as. foc>d for specific bacteria; · and certain chemically oxidizable materials such as ferrous iron, sulfides, sulfite, etc., which will react with dissolved oxygen or which are metabolized by bacteria. In timber industry wastewaters, the BOD derives principally from organic materials leached from the wood raw material.
The BOD of a waste adversely affects the dissolved oxygen resources of a body of water by reducing the oxygen available to fish, plant life and other aquatic species. It is possible to reach conditions which totally exhaust the dissolved oxygen in the water, resulting in anaerobic conditions and the production of undesirable gases such as hydrogen sulfide and methane. The reduction of dissolved oxygen can be detrimental to fish populations, fish growth rate, and organisms used as fish food. A total lack of oxygen due to excessive BOD can result in the death of all aerobic aquatic inhabitants in the affect~d area.
Water with a high BOD indicates the presence of decomposing organic matter and associated increased bacterial concentrations that degrade its quality and potential uses. High BOD increases algal concentrations and blooms; these result from decaying organic matter and form the basis of algal populations.
The BOD5 (5 day BOD) test is used.widely to estimate the oxygen requirements of discharged. domestic and industrial wastes. Complete biochE~mical oxidation of a ,given waste may require a period of incubation too long for practical analytical test purposes. For this reason, the 5 day period has been accepted as standard, and Ute test results have been designated as BOD. Specific chemical test methods are not readily available for measuring the quantity of many degradable substances and thetr reaction products. In such cases, testing relies on the collective parameter, BOD. This procedure measures the weight of dissolved oxygi~n utilized by microorganisms as they oxidize or
165

transform the gross mixture of chemical compounds in the wastewater. The biochemical reactions involved in the oxidation of carbon compounds are related to the period of incubation. The 5 day BOD normally measures only 60 to 8,0 percent of the carbonaceous biochemical oxygen demand of the sample, and for many purposes this is a reasonable parameter. Additionally, it can be used to estimate the gross quantity of oxidizable organic matter. Throughout this document BOD1 is expressed as BOD,
Some treated wastewaters result from treatment systems designed to remove ammonia through the nitrification process. In some cases, the nitrifying bacteria present can exert an additional noncarbonaceous, nitrogenous oxygen demand (NOD), within the prescribed 5 day incubation period. In these instances, special inhibitors are added to standard dilution ~aters to ensure the measurement only of carbonaceous organic matter. Ultimate BOD, which is measured after a 20 day incubation period, tests for aggregate measurement of both carbonaceous and nitrogenous oxygen demand when nitrification inhibitors are not added to standard dilution waters. Ultimate BOD is important in the evaluation and design of biological treatment systems. Ultimate BOD can also be useful in estimating the total dissolved oxygen demand of wastewaters discharged to receiving streams with long residence periods. ·
Oil and Grease
Oil is a constituent of both creosote and pentachlorophenol petroleum solutions which occurs in either a free or an emulsified form in wood preserving wastewaters. Concentrations ranging from less than 100 mg/liter to well over 1000 mg/liter are common after primary oil separation. Many of the toxic pollutants found in wood preserving ·wastewaters, such· as pentachlorophenol and polynuclear aromatics, are much more soluble in the oil phase than in the water phase of the waste stream. Oil and grease in the wastewater, therefore, serves as a carrier of these toxic pollutants. The key to satisfactory control of toxic and conventional pollutants in wood preserving wastewaters is the removal of as much free and emulsified oil and grease as possible. '
Data from recent sampling programs indicate that removal of oil and grease from indirect discharging wood preserving plants to levels below 100 mg/1 will result in control of PCP to levels consistent with this compound's solubility in water (approximately 15 mg/1) and will result in control of total toxic pollutant PNAs to approximately one milligram per liter.
Aside from the fact that oil and grease in wood preserving wastewaters serves as a carrier for toxic pollutants, the compounds which comprise the oil and grease phase can settle or float in receiving waters and may exist as solids or liquids. Even in small quantities, oil and grease causes troublesome taste and odor problems. They produce scum lines on water treatment
166

basin walls and other containers and -adverse!ly ·affect fish and · water fowl. Oil emulsions may adhere to the· gills of fish, causing suffocation, and may taint the flesh of fishmi.croorganisms: that w~re exposed to waste oil. Oil deposits .in the bottom se,diments of water, can serve to inhibit normal benthic growth. Oil and grease exhibit an oxygen-demand.
Oil and gre,ase levels which are toxic to aquatic organisms vary greatly, depeinding on the type of pollutant and the species susceptibility. In addition, the presence C>f oil in water can increase the toxicity of other substances discharged into the receiving bodies of water.
Total Suspencl.f.d Solids (TSS)
Suspended s:olids may· include both organic and inorganic materials. 'l~he inorganic compounds may include sand, silt, clay and precipitated metals. The o~ganic fraction may include such materials as ,wood fibers-and unsettled biomass from biological treatment sys;tems.
These solids may settle out rapidly and bottom deposits are often a mixture of both organic ~nd inorganic solids~ Solids may be suspended in water for a time and then settle to the bed of the stream or lake. They may be inert, slowly biodegradable materials, c,r rapidly decomposable substances. While in suspension the~y ·. increase the turbidity of the water, reduce · 1 ight penetration, and impair the photosynthetic activity of aquatic plants. ·
- -
Suspended soli.ds may kill fish and shellfish by causing abrasive injuries, by clogging ·gills and respiratory passages, by screening out light; and by promoting and maintaining the development of noxious conditions through oxygen depletion~ Suspended solids also _reduce the recreational value of the: water.
Total suspencle~d solids are a significant pollutant parameter in the insulaticm board and wet process hardboard subcategories of the industry. Raw wastewaters from these subcategories contain high amountf:; of wood fibers and solids which are not retained in the wet lap or on the forming screen_. Additionally, a significant. amount of biologi.cal suspended sol ids is generated in the large biological treatment systems common to these subcategorieE;. -
Although not a specific pollutant, pH is related to the acidity or alkalinity of a wastewater stream. It is not a linear or direct measurE~ of· either; however, it may properly be used to control both excess acidity and excess alkalinity in water~ The term pH describes the.hydrogen ion hydroxyl ion balance in water. Technically, pH is the hydrogen ion concentration· or activity present in a given solution. pH numbers are the negative
167

logarithm of the hydrogen ion concentration. A pH of 7 generally indicates neutrality or a balance between free hydrogen and free hydroxyl ions. Solutions with a pH above 7 indicate that the solution is alkaline, while a pH below 7 indicates that the solution is acidic.
Knowledge of the pH of water or wastewater aids in determining measures necessary for corrosion control, pollution control, and disinfection. Waters with a pH below 6.0 corrode waterworks structures, distribution lines, and household plumbing fixtures. This corrosion can add such constituents to drinking water as iron, copper, zinc, cadmium, and lead. Low pH waters not only tend to dissolve metals from structures and fixtures but also tend to redissolve or leach metals from sludges and bottom sediments. The hydrogen ion concentration also can affect the taste of water; at a low pH, water tastes "sour." Extremes of pH or rapid pH changes can stress or kill aquatic life. Even moderate changes .from 11 acceptable" pH limits can harm some species. Changes in water pH increase the relative toxicity to aquatic life of many materials. Metalocyanide complexes can increase a thousand-fold in toxicity with a drop of 1 ·. 5 pH uni ts. The toxicity of ammonia similarly is a function of pH. The bactericidal effect of chlorine in most cases lessens as the pH increases, and it is economically advantageous to keep the pH close to 7.
The lacrimal fluid of the human eye has a pH of approximately 7.0 and a deviation of 0.1 pH unit from the norm may result in eye irritation for the swimmer. Appreciable irritation will cause severe pain.
Problems of hydrogen sulfide gas evolution and "bulking" of mixed liquor in biological treatment systems may occur if pH of wastewater drops below 6.0. On the other hand, unusually high pH (for instance 11.0) can cause significant loss of active biomass in biological treatment systems, especially activated sludge.
NONCONVENTIONAL POLLUTANTS
Chemical Oxygen Demand (COD)
Chemical oxygen demand is a purely chemical oxidation test devised as an alternate method of estimating the total oxygen demand of a wastewater. Since the method relies on the oxidation-reduction system of chemical analyses, rather than on biological factors, it is more precise, accurate, and rapid than the BOD test. The COD test estimates the total oxygen demand (ultimate) required to oxidize the compounds in a wastewater. It is based on the fact that organic compounds, with a few exceptions, can be oxidized by strong chemical oxidizing agents under acid conditions with the assistance of certain inorganic catalysts.
168

When an industrial wastewater contains substances which tend to inhibit biological degradation of the carbonaceous. substrate, such as wood preserving wastewaters, COD is a more reliable. indicator of c::,rganic pollutant strength than is BOD.
~ '" " '
The COD test measures those pollutants resistant to biological oxidation. in addition to the ones measured by the BOD test. COD, is therefore a more inclusive measure of oxygen demand than is BOD and results in higher oxygen demand values than the BOD test.
The compounds. which are more.res1stant to biological oxidation ar:e becoming of greater and greater conce;rn, not only be.cause . of their slow lbut continuing oxygen.demand on the resources of the receiving water, but also because of their potential health effects on aquatic. and human life. Many of these compounds have · been found to have carcinogenic, mutagenic, and·. similar adverse effects, ei th,er singly or in combination. Concern about these compounds has increased as a result of demonstrations that their. long life in receiving waters--the result of .a slow biochemical oxidation rate allows them to contaminate downstream water intakes. The commonly used systems of water purification are not·. effective in removing these types of materials, and.disinfection (such as chlorination) inay convert them into even more hazardous· materials. · ···· - · .· ·
Oil and grease contamination from preservative solutions,as well as organic material leached from the wood raw material contribute to the relatively high COD content.common to wastewaters from.the wood preserving segment.
169


SECTION VII
CONTROL AND TREATMENT TECHNOLOGY
GENERAL
This section presents a discussion of the range of wastewater control and treatment technology currently in use and available to the wc>od preserving,, and insulation board/wet process hardboard segments of the timber products processing industry. In-plant pollution control is discussed as well .as end-of-pipe treatment.
•''
Performance data for plants in each industry segment are presented, as well as technology capable of being transferred from related tndustries. For the purpose of cost analysis~ one or more candidate technologies have been selected fo.r each subcategory. For each technology, achievable treated effluent pollutant concentrations are reported for conventional, nonconventional and,toxic pollutants.
It should be noted that there are many possible combinations of in-plant and end-of-pipe systems capable of attaining the pollutant reductions reported for the candidate technologies. The. performance levels reported for the candidate treatment technologies are based upon demonstrated performance of similar systems within. the industry or upon well documented results .of readily transferable technology. These performance levels can be achieved within the industry,using the model treatment systems proposed. ~rhe model treatment systems serve as a basis for a conservative ,economic analysis of · the cost of achieving the effluent levels reported for the candidate treatment technologies. Each individual plant must make the final decision concerning thie specific combination of pollution control ·measures which are best suited to its particular situation, and should. do so · only aft1er a careful study of the treatabi 1 ity of its wastewater, including waste, characterization and pilot plant investigatioms.
Pollution abatement. and control technologies applicable to the industry as a whole were discussed in earlier Agency documents. Summarized versions, which included updated information on current indu:stry practice, w.ere presented in supplemental studies for wood presierving and hardboard production. The portion of the previous studies which detailed in-plant process. changes, waste flow managemient, and other measures having th,e potential to reduce discharge volume or improve effluent quality are repeated in this document for the, purpose of continuity. Additional information ,:l'lrailable from the data collection portfolios. and/or the verification sampling program is included in order to present the most recent information.
171

Various treatment. technologies that are either currently employed, or which may be readily transferre~ to the industry, are summarized in this section. Included in this section are descriptions of exemplary plants and, where available, wastewater treatment data for these exemplary plants. This description is followed by a selection of several treatment regimes applicable to each subcategory.
WOOD PRESERVING
In-Plant Control Measures
Reduction in Wastewater Volume--The characteristics of wood preserving wastewater differ among plants that practice open, modified closed or closed steaming. In the modified closed steaming process, steam condensate is allowed to accumulate in the retort during the steaming operation until it covers the heating coils. At that point, direct steaming is stopped and the remaining steam needed is generated within the retort by utilizing the heating coils. Upon completion of the steaming cycle and after recovery of oils, the wa~er from the cylinder is discarded. In closed steaming, after recovery of free oils, the water in the retort at the end of a steaming cycle is returned to a reservoir and is reused instead of being discarded.
The principal advantage of modified closed steaming over open steaming, aside from reducing the volume of wastewater released by a plant, is that effluents from the retorts are less likely to contain emulsified oils. Free oils are readily separated from the wastewater; and, as a result of the reduction in oil content, the oxygen demand and the solids content of the waste are reduced significantly relative· to effluents from plants using conventional open steaming. Typical oil and COD values for wastewater from a single plant before and after the plant commenced modified closed steaming are shown in Figures VII-1 and VII-2, respectively. The COD of the wastewater was reduced by about two-thirds when modified closed steaming was initiated. Oil content was reduced by a factor of ten.
Water,· ·used in closed steaming operati,ons increases in oxygen demand,· 'solids content, and total phenols concentration with each reuse. The high oxygen demand is attribut.able primarily to wood extracts, principally simple sugars, the concentration of which increases with each use of the water. Because practically all of the solids content of the waste is dissolved solids, only insignificant reductions in oxygen demand and improvement in color result from treatments involving flocculation. The progressive changes in the parameters for water used in a closed steaming operation are shown in Table VII-.1. It is apparent that in time a blowdown of the steaming water is necessary because of the buildup of dissolved materials.
172

25
20 ----... Q Avg .. on content . E 0 15 before closec!I ~ steamlng .. 1360 mg/I -... z w I-z 10 0 (.) Avg. oil content ..J after. closed 6 · steamlng ... 136 mg/I
5
TIME (WEEKS)
Figure VU - 1 Vall'latlon In oil content of effluent with time before and after · initiating closed stGsimlng ( Thompson and Dust, 1971 )
173

65
55
-i 45
., C) ... -Q 0 26 0
15
5 .,__...., __ .,..__ ...... ,--.... r--.. , ..... - ... , ..... .M---, --.. ,---0 10 20 30 40 50 80 120 130
TIME (Days)
Figure VII • 2 Variation In COD of effluent with time before and after closed steaming: Days 0-35 open steaming; Days 35-130 closed steaming (Thompson and Dust, 1971)
174

Table VII-1. Progressive Changes in Selected Characteristics of Water Recycled in Closed Steaming Operations
-------------------------------------.-----------------------------
Charge No.
l 2 3 4 5 7 8
12 13 14 20
Total Phenols
46 169 200 215 23J 254 315 208 230 223 323
COD
15,516 22,208 22,412 49,552 54,824 75,856 99,992
129,914 121,367 110,541 123,429
(mg/liter)
Solids
10,156 17,956 22,204 37,668 66,284 66,968 67,604 99,276
104,960 . 92,092 114,924
Dissolved Solids
8,176 15,176 20,676 31,832 37,048 40,424 41,608 91,848
101,676 91,028 88,796
-------------·-·--------~---!M'-----~----------------------~-------------SOURCE: Miss;j.ssippi State Forest Products Laboratory, 1970.
The technical feasibility of converting a wood preserving plant from open steaming to modified or closed steaming has been demonstrated by many plants within the past five years. The decision to convert a plant is an economic and product quality decision relcLted to the reduced cost of subsequent end-of-pipe treatment of the resulting smaller volume of wastewater ~enerated by a converted plant, and the marketability 9f the plant's production. · ·
Using the his;torical wastewater flow data presented in Section V, an average two retort open steaming plant can reduce its. process wastewater flow from over 41,600 .liters/day (11,000 gpd) to less than 11,400 U.ters/day (3,00Q gpd). Neither figure includes rainwater.
Other possible methods of reducing discharge volume are through reuse of cooling and process water and segregation of waste streams. Re~cycl ing of cooling water at plants that employ barometric ccmdensers is essenti.al because it is not economically feasible to treat the large volume of contaminated water generated when a single pass, system is used. This fact has been recognized by the industry, and within the past five years there has been a. significant increase in the percentage of plants recyc1 ing barc>me_tric cooling water.
175

As an alternativ.e solution to the problem associated with the use of barometric condensers, many plants have installed surface type condensers as replacement equipment.
Reuse of process water is not widely practiced in the industry. There are, however, noteworthy exceptions to this generalization. Process wastewater from salt treatments is so widely used as makeup water for treating solutions that the practice is now considered normal practice. One hundred· sixty of 184 plants treating with salts that were questioned in 1974 indicated that no discharge of direct process wastewater has been achieved through a combination of water conservation measures, including recycling.
Several plants which treat with organic preservatives reuse treated wastewater for boiler make-up or cooling water. Due to the nature of contamination present in wood preserving wastewater, a high degree of treatment is required prior to reuse of wastewater for these purposes.
One of the main sources of uncontaminated water at wood preserving plants is steam coil condensate. While in the past this water was frequently allowed to mix with process wastewater, most plants now segregate it, thus reducing the total volume of waste water, and some reuse· coil condensate for boiler feed water. This latter practice became feasible with the development of turbidity sensing equipment to monitor the water and sound a warning if oil enters the coil condensate return system. Reuse of coil condensate, while of some consequence from a pollution standpoint, can also represent a significant energy saving to a plant.
End-of-Pipe Treatment
Primary Treatment--Primary treatment is defined in this document as treatment applied to the wastewater prlor to biological treatment or its equivalent.
Oil-Water Separation--Because of the deleterious effects that oil has on all subsequent steps in wastewater treatment, efficient oil-water separation is necessary for effective treatment i.n the wood preserving industry. Oil, whether free or in an emulsified form, accounts for a significant part of the oxygen demand of wood preserving effluents and serves as a carrier for concentrations of the toxic pollutants such as PNAs and pentachlorophenol that far exceed their respective solubilities in oil free water. In a real sense, control of oils is the key to wastewater management in the wood preserving industry.
Oil-water separators of the API type are extensively used by wood preserving plants and are the equipment of choice to impart the "primary oil separation" referred to in the proposed treatment regimes which follow. It is preceded and followed at many plants
176

by a rough oil separation and a second oil separation stage,. respectively. The former operation,,.occurs either in the blowdown tank or in a surge tank preceding the API £eparator. Secondary separation usually occurs in another API separator operated in series with toe. fii::-st, or·it may be conducted in. any vessel or lagoon where-the detention time is sufficient to permit further separation: of free oil. Primary oil separation, as.used in 1 this document~ refers to a system which contains rough oil separation in a blowdown tank. fol lowed by a· two-stage grav:ity separator. ·
The oil content of wastewater.entering the blowdown tank·may·be as high as l O percent, with l to 5 percent being a more., normal range. Depending on the efficiency of rough separation, the influent to the primary separator ··will have a free oil conlent ranging from· less than 200 mg/1 to several thousand mg/1. Remov~l efficiencies .of 60 to 95 percent can be achieved, but the results obtained are affected by temperature, oil content, -and separator design--especially detention time. Data published by the American Petroleum Institute (API, 1959) show that BO.percent removal of free oils is normal in the petroleum industry. Secondary s:eparation should remove up to 90 percent of the residual free oil, depending on the technique used.
The costs for primary oil....:water separation presented in Appendix A incluqe bcith the blowdown tanks and the API type separators for a parallel separation system handling both creosote and pentachlorophenol wastewaters. Due t6 the value of the oil and the preservatives recovered in this system, 50 percent of the capital-and annual operating costs can be returned. Therefore, 50 percent of the capital and operating costs of the total system should not be ~alloc_ated to p9llution control.
The following example will serve to illustrate this hypothesis: Table VII-2 depicts a cost estimate for a primary oil.:..water separation system for a plant treating with both creosote and pentachlorophenol and generating 12i500 gallons per day of combined wastewater. Assuming that:
' .
l. Half of the wastewater is due to creosote treating and half is due to·PCP treating (6,250 gpd each system);
·2. Process wastewater enters the blowdown·tanks at
3.
4.
5.
6.
1.5 percent (15,000 mg/1). oil content and leaves the API ~eparator at 500 mg/1; · ·
Creosote cost is $0.75 per gallon;
FuE~l oil cost is $Q.40 _per _gallon;
PCP (solid) cost is $0.60 per pound; and
PCP solution is 7 percent PCP and 93 percent oil;
177

then 831 lbs/day of creosote valued at approximately $68 and 680 lbs/day of PCP solution valued at $62 are .recovered. If the plant operates for 300 days per year, a to'tal of $20,400 worth of creosote and $18,000 worth of PCP solution are recovered per year. This represents 62 percent of the total annual cost of the cre9sote system and 78 percent of the tota.l annual cost of the PCP system. The 50 percent figure was chosen to reflect the decreased value of the recovered material as compared to new solutions.
It should be noted that primary oil separation was a component of the treatment technology identified for BPT and PSES. Since the costs of primary oil separation were previously considered in establishing BPT and PSES, there are no additional costs required to achieve satisfactory primary oil separation for these two treatment technologies. However, the costs of achieving satisfactory primary oil separation are allocable to the costs of achieving NSPS and PSNS .
• 178

Table VII-2. Annual Cost of Primary Oil-Water Separation System
------------------------------------------------------~---------------· Creosote System PCP, System
----------------------------~---------~----------------------------~--Capital Cost
Blowdown Tanks Surge, Skimming Tanks Reclaim Pumps Prim. Sep. w/5 hp Pump Sec. w/Skimmers Land, 0.75 Acre Engineering Site Prep. Foundation,
etc. Contingency
TOTAL
$ 15,800 9,000 3,200
22,000 23,300
7,500 11 , 000
20,200 16, aoo·
$128,800"
Capital Cost
Blowdown .. Tanks Surge, Skimming Tanks !Reclaim Pumps PCP.Primary w/5 hp Pump PCP Polishing Sep. Land, 0.75 Acre Engineering Site Prep., Foundation
etc. Contingency.
TOTAL
$15,800 9,000 3,200 6,300 7,200 7,500 6,200
.12, 000 10,000
$77,200
Amortization 20 yrs·@ 10% = $15,100 Amortization 20 yrs@ 10% = $9,050
Annual Operating Cost:
Labor Maint. Energy Sludge Disposa.l Ins. and Taxes.
TOTAL
$ 9, 3°00 1,900 2,150
500 3,850
$17,600
TOTAL ANNUAL COS'!' = $32,700
179.
Annual Operating Cost:
Labor Maint. Energy Sludge Disposal Ins .. and Taxes
. $ 9,300 1, i 50 1,450
500 2,300
$14,700
TOTAL ANNUAL COST= $23,750

Chemical Flocculation--Because oil-water emulsions are not broken by mechanical oil removal procedures, chemical flocculation is required to reduce the oil content of wastewaters containing emulsions. Lime, ferric chloride, various polyelectrolytes, and clays of several types are used in the industry for this purpose. Automatic metering pumps and mixing equipment have been installed at some plants to expedite the process, which is usually carried out on a batch basis. COD reductions of 30 to 80 percent or higher are achieved--primarily as a result of oil removal. Average COD removal is about 50 percent.
Influent oil concentration varies with the efficiency of mechanical oil separation and the amount of emulsified oil. The latter variable in turn is affected by type of preservative (either pentachlorophenol in petroleum, creosote, or a creosote solution of coal tar or petroleum), conditioning method used, and design of oil-transfer equipment. Pentachlorophenol preservative solutions cause more emulsion problems than creosote or its solutions, and plants that steam condition--especially those that employ open steaming--have more emulsion problems than plants that use the Boulton conditioning method. Plants that use low pressure, high volume oil transfer pumps have less trouble with emulsions than those that use high pressure, low volume equipment.
Typically, influent to the flocculation equipment from a creosote process will have an oil content of less than 500 mg/liter, while that from a pentachlorophenol process may have a value of 1,000 mg/liter or higher. For example, analyses of samples taken from the separator outfalls at ten plants revealed average oil contents of 1,470 mg/liter and 365 mg/lit~r for pentachlorophenol and creosote wastewaters, respectively. The respective ranges of values were 540 to 2,640 mg/liter and 35 to 735 mg/liter. Average separator effluents for three steaming plants sampled in conjunction with the present study gave Oil and Grease values of 1,690 mg/liter and 935 mg/liter for'. pentachlorophenol and creosote separators, respectively.
Flocculated effluent generally has an oil content of 1.ess than 100 mg/liter. Data presented later in this section demonstrate that proper application of .gravity oil-water separation followed by chemical flocculation provides control of PNAs to about 1 mg/1 and control of PCP· to about 15 mg/1.
A few plants achieve almost complete removal of free oils by filtering the wastewater through an oil absorbent medium. This practice is unnecessary if the wastewater: is to be chemically flocculated.
Slow Sand Filtration--Many plants which flocculate wastewater subsequently filter it through sand beds to remove the solids. When properly conducted, this procedure is highly efficient in removing both the solids resulting from the process as well as
180

some of the residual oil. The solids which accumulate on the bed are removed pieriodically along with the upper inch or so .of sand.
A cominon . mista.ke that renders f i 1 ter -beds .almost useless is the application c:>f. incomplete.ly flocculated wastewater. The residual oil retards percolation of the water through the bed, thus necessitating. the replacement of the oil saturated sand. This has happened frequently enough at some plants that the sand filters have been abandoned and a decarttation process used instead. At many plants decantation is part of the flocculation system. Solids removal is expedited by use of vessels with cone shaped bottoms. Frequently, the solids are allowed to accumulate fiom batch t6 batch, a practi~e which is reported to reduce the amount of flocculating agents ·required.
Biological T~eatment--Wastewater generated by the wood preserving industry is amenable to biological treatment. A discussion of biological treatment as well as specific examples of treatment systems is pr1esented iri Appendix E of this document.
Biological treatment has beeri shown to be quite effective in reducing concentrations of COD, total phenols, Oil and Grease, pentachlorophenol, and organic toxic pollutants in wood preserving wastewaters. Actual reduction of these pollutants in the wastewater depends upon influent wastewater quality, detention timie in. the biological system, amount of aeration provided, and the type of .biolo9ical system employed.
Trickling filters, aerated lagoons, oxidation ponds, and activated sludge systems are all used by one or more plants in the industry. Several plants also use spray or soil irrigation as a biological treatment method. In this system, wastewater is sprayed on an irrigation field, and the effluent is either allowed to run off into a collection basin or is collected in underdrains.
The biological systems in"'.'"place in the industry vary from aerated tanks with insufficient detention time and aeration capacity to sophisticated multi stage systems comprised of. activated sludge followed by aerated lagoons and oxidation ponds.
Removal efficiencies for.various pollutants by biological systems in the industry are presented later in this section;
Most plants which employ biological treatment do so for treatment prior to discharge to a ·poTW, or for treatment prior to a no discharge system sucn as spray irrigation, spray evaporation, or recycle of treated etfluent. · ·
Removal of Metals from Wastewater--A method of metals removal recommended for wood preserving wastewaters as early as 1965 by Hyde, but not used by that industry, was adopted from. the plating industry. 'rhis procedure is based on the fact that hexavalent chromium is the only metal (boron ~xcepted} used by the industry
181

that will not precipitate from solution at a neutral or alkaline pH. Thus, the first step in treating wastewaters containing chromium is to reduce it from the hexavalent to the trivalent form. The use of sulfur dioxide for this purpose has been discussed in detail by Chamberline and Day (1956). Chromium reduction proceeds most rapidly in acid solution. Therefore, the wastewater is acidified with sulfuric acid to a pH of 4 or less before introducing the sulfur dioxide. The latter chemical will itself lower the pH to the desired level, but it is less expensive to use the acid.
When the chromium has been reduced, the pH of the wastewater is increased to 8.5 or 9.0 to precipitate not only the trivalent chromium, but also the copper and zinc. If lime is used for the pH adjustment, fluorides and most of the arsenic will also be precipitated. Care must be taken not to raise the pH beyond 9,5, since trivalent chromium is slightly soluble at higher values. Additional arsenic and most residual copper and chromium in solution can be precipitated by hydrogen sulfide gas or sodium Slllfide. Ammonium and phosphate compounds are also reduced by this process.
The procedure is based on the fact that most heavy metals are precipitated as relatively insoluble metal hydroxides at an alkaline pH. The theoretical solubilities of some of the hydroxides are quite low, ranging down to less than 10 ug/1. However, theoretical levels are seldom achieved because of unfavorable settling properties of the precipitates, slow reaction rates, interference of other ions in solution, and other factors. Copper, zinc, chromium, and arsenic can be reduced to levels substantially lower than 1.0 mg/liter by the above procedure.
The metals removal technology upon which the candidate treatment technology is based consists of reduction of chromium by pH reduction with sulfuric acid and· the addition of S02 gas, followed by precipitation of the metal hydroxides after pH adjustment with lime or caustic soda. Final concentrations of copper, chromium, zinc, and arsenic of less than 0.25 mg/1 can be expected, given influent levels similar to those presented in Table V~18, It should be noted that since no wood preserving plant is currently applying metals removal technology to its wastewater, performance data are not available from the industry to confirm the expected final effluent levels.
Carbon adsorption following metals removal by lime precipitation has been reported to provide the most encouraging results for removal of heavy metals, as reported in an EPA study (Technology Transfer, January 1977). The study found that pretreatment of wastes with lime, ferric chloride, or alum followed by carbon adsorption was highly effective. Reductions of chromium, copper, zinc, and arsenic following this treatment·were, in order, 98.2, 90.0, 76.0, and 84.0 percent. Influent co~centrations used in this study were 5.0 mg/1 for all the above listed metals.
I I
182

Carbon Adsorptj..Q!!.--Results of carbon adsorption studies conducted by Thompson and Dust (1972)on a creosote wastewater are shown in Figure YII-3. Granular carbon was used with a contact time o~ 24 hours. The wastewater ·.was flocculated with ferric chloride and its pH adjusted to 4.0 prior to exposure to the carbon.· ·Typical concentrations.of·COD and.total phenols in flocculated wastewater are 4,000 mg/1 and 200 mg/1, respectively. As shown in the figure, 96 percent of the total phenols and 80 percent of the COD were removed from the wastewater at a carbon dosage of 8 g/liter. The loading rate dropped off sharply at that point, and no further incre,ases . in total· phenols removal and only small increases in COD removal occurred by increasing carbon dosage ·to 50 g/liter. Similar results wer:e obtained. in tests using pentachloropheinol wastewater.
Results of adsorption isotherms. that were run on. raw pentachlorophenol wastewater and other samples of raw creosote wastewater followed a pattern-similar to that shown in Figure VII-3. In s:ome instances a residual content of phenolic compounds remaLi.ned in wastewater after a contact period of 24 hours with the highest dosage of activated carbon employed, while in other ins:tances all of the total . phenols were removed. Loading rates of 0.16 kilogram of total.phenols and 1.2.kilograms of COD per kilogram of carbon were typical, but much lower rates were obtained with some wastewaters.
Adsorption isotherms have.-been developed for wood preserving wastes from SE~veral plants to determine the. economic feasibility of employing, activated carbon in lieu of conventional secondary treatments. 'l~he wastewater used for this purpose was. usually pretreated by flocculation and J:il tration to remove oils. Theoretical carbon usage rates obtained "from the isotherms ranged from 85 to almost 454 kg per 3,785 liters (187 to 1,000 pounds per 1,000 gallons) of wastewater.
Use of activated carbon to treat wastewater from a plant producing herbicides was described by Henshaw. With the exception· of wood sugars, this waste was similar to wood preserving effluents, especially in terms of COD (3,600 mg/liter) and phenolic materials .(210 mg/liter). Raw wastewater was piped directly to a carbon adsorber and the carbon was regenerated thermally. Flc>w rate and loading rate were not reported, but the· effluent from the system had a total phenols content of 1 mg/1 i ter. Cc>f;t of the treatment was reported to be about $0. 36 per 3,785 liters (1,000 gallons).
The effect of high organic content on carbon usage rate is well known in industry. Recent work to develop adsorption isotherms for 220 wastewater samples represef:lting 75 SIC categories showed a strong relationship betwe.en carbon usage rate and organic content of the samples, as measured by TOC. Usage rates as high as 681 kg per 3,785 liters (1,500 pounds per 1,000 gallons) were· reported for wastewater samples from the organic chemicals industry. F<>r petroleum refining, the .values ranged from 0.1 to
183

-'$. -1 e CD a: J! 8 «D .c a.
li ~ i cs
8 0
100 w 9-
.Q. ~
ao
60 (u Total Phenols A COD
40
20
0 ... ---....... ~------.,,--..,,..--,. .... -----, ------1 0 .. 10 20 30 40 50
Activated Carbon (g/llter)
Relatlonshlp Between Weight of Activated Carbon Added and Removal of COD and Total Phenols from a Creosote Wastewater
184 Figure Vll-3

64 kg per liter (0.2 to 141 pounds per gallon), depending- upon the TOC of the waste.
"use of acffv.ated carbon in_wastewater treatment in oil refineries is common. Because this industry is-related to wood preserving in terms of wastewater characteristics, a few of the more pertinent articles dealing with activated_ car_bon treatment of refinery wastewater are summarized here.
Workers dealing with treatment process methodology emphasized the' necessity of pretreatment of activated carbon column _influent. Based on these reports,: suspended solids in amounts exceeding SO mg/liter should be removed. Oil and grease in concentrations above 10 mg/liter should lil~ewise not be applied directly to carbon. Both mat.erials cause head loss and can reduce adsorption efficiency by coating the carbon particles. This is apparently more critic.al in the case of oil and grease than for suspended. solids. · ·
Common pretreatment processes used by the industry include chemical clarification, oil flotation, and fi'ltration. Adjustments in pH are frequently made to enhance adsorption efficiency. An acid pH has been. shown to be best for total phenols and ,other weak acids. Flow equalization is, of course, necessary for most treatment processes._
Efficiency of adsorption· vaiies among molecular species. _Ina study of 93 petrochemicals commonly found in that industry's wastewater, adsorption ·was found to incr~ase with •olecular weight and decrease with polarity, solubility, and branching. However, molec;=ules possessing three or more carbons apparently respond favorably to adsorption treatments. ·
Researchers studied the relative efficiency of lignite and bituminous coal carbons and concluded that the former is better for refinery wastes because it-contains more surface area due to its 20- to 500-Angstrom pore.size. ·
The feasibility of activated carbon adsorp,tion for reduction of phenolic compounds, including chlorophenols, and high molecular weight organics, such. as polynuclear aromatics and phthalates, has been demonstrated by several investigators. Since carpon adsorption of flocculated wooq. preserving wastewaters results in high carbon usage ·rates as described above, the· concept of activated carbon as a polishing treatment for removal of total phenols, PNAs, and residual COD following biological treatment.· appears to have merit. In this configuration, -biological treatment removes most of the wood sugars and other readily biodegradabl' organics prior· to carbon adsorption, thus decreasing carbon. doses required and greatly increasing carbon life. Such a system including an activated carbon column system has been chosen as a candidate treatment technology for wood· preserving wastewaters.
185

Experience with carbon adsorption of biologically treated effluents from other industries indicates that a conservative carbon dosage of 4.54 kg per 3,785 liters (10.0 lb/1,000 gal) with two hours contact time is sufficient to result in an expected BO percent removal of COD and 95 percent removal of total phenols, PCP, and PNAs from biologically treated wood preserving effluent. {.~verage concentrations of these parameters present in biologically treated effluents are presented later in this section.) According to Hutchins (1975), it is most economical to discard carbon ·at usage rates lower than 159 to 182 kg (350 to 400 pounds) per day, and to thermally regenerate at. higher usage rates.
It should again be noted that the expected removals of pollutants and design criteria presented above are engineering judgments based on experience with similar industries, and have not been demonstrated within the wood preserving industry since there are no carbon adsorption systems operating for the treatment of wood preserving wastewaters.
Evaporation--Because of the relatively low volumes .of wastewater generated by wood preserving plants, evaporation is a feasible and widely used technology for achieving no discharge status. Based on the large number of plants which have adopted evaporation technology to achieve no discharge status, this technology appears to be the method of choice for many wood preserving plants to comply with Federal, State and local regulations.
Three types of evaporative systems are common in the industry. The first type, spray evaporation, is common to Boulton and steaming plants. This technology involves containing the wastewater in lined lagoons of sufficient size to accommodate several months of process wastewater, as well as the rainwater falling directly on the lagoon. The wastewater is sprayed under pressure through nozzles produ=ing fine aerosols which are evaporated in the atmosphere. The driving force for this evaporation is the difference in relatiye humidity between the atmosphere and the humidity within the spray evaporation area. Temperature, wind speed, spray nozzle height, and pressure are all variables which affect the amount of wastewater which can be evaporated.
186

Reynolds and · ·Shack ( 1976) have. developed the following design equation for s~1ray evaporation ponds:.
[(1-Hr)Ps]
Pa RLn
Climatic Factors: W a W~nd spe7d (mph) 39 66 Pa
P = Air. density = 460 + Ta
where: Pa-= Atmospheric Pres. (AT.) _ Ta • Atmospheric Temp. ( OF)
Hr-= Relative Humidity Ps • Saturation Vapor Pressure
•- . .
Operational Fa.c:tors: h • Height of spray above surface of pond Ky' • Spray mass transfer coefficient Cw• Sur;ace mass transfer.coefficient
L • Pond lengtti (in direction of prevailing wind) R • Ratio of width to the length of the pond
RL • Width of pond · - · n • Number of days in the month E • Evaporation in cu ft pe~:month
Constants: e = Base of the natural logarithms (2.718)
This design is considered by the authors to be conservative as it · neglects pan ,evaporation (whi,ch occurs in most areas of the country), assumes no drift loss, and assumes no evaporation when the sprays are off.
To be effective, spray evaporation should be preceded by primary and secondary oil removal. Excess oil content in the wastewater may retard evaporation and increase the potential for air pollution. Careful segregation-of uncontaminated water from.the wastewater stream . is particularly important i_n evaporative technologies to minimize the amount of wastewater to be evaporated. ,
The second ty'Pe of evaporation technology is cooling tower evaporation. This technology is feasible for Boulton plants o~ly. In this. system, as the wood water vapor is condensed, it gives up heat to the cooling water passing througl:l the surface condenser. The condensed wood water is sent to an accumulator, and from there to an oil-water separator for removal of oils. Rain water and cylinder drippings may also be routed. to the separator. This wastewater stream is then added to the cooli,ng water which recirculates thi6ugh the surface condenser picking_ up
.. 187

heat, then through a forced draft cooling tower where evaporation occurs. Figure VII-4 depicts a cooling to~er evaporation system.
Since the vacuum cycle in a Boulton plant lasts from 12 to 40 hours, sufficient waste heat is usually available to evaporate all of the wastewater. Heat from an external source, usually process steam, can be added to an additional heat exchanger to assist the evaporation of peaks in wastewater generated from time to time.
In steaming plants, the vacuum cycle is much shorter, ranging from l to 3 hours. Therefore, there is not a continuous (or nearly continuous) source of waste heat available to affect the evaporation of wastewater. Generally, about 25 percent of the process wastewater is the maximum amount that·can be evaporated by cooling tower evaporation at a steaming plant.
The third method of evaporation is thermal evaporation using an external heat source. As this method i~ particularly energy intensive and expensive, it is not generally feasible except when used to supplement other treatment methods and when peak surges in wastewater generation occur, as in the cooling tower system.
Soil Irrigation--About ten plants in the wood preserving .industry currently use spray or soil irrfgation as a final treatment step. As shown by the following discussion, this technique is a viable method of treatment for this industry even though it is more land intensive and may be more expensive than other alternatives.
Several applications of wastewaters containing high total phenols concentrations to soil irrigation have been reported. One such report by Fisher related the use of soil irrigation to treat wastewaters from a chemical plant that had the following characteristics:
pH Color COD BOD
9 to 10 5,000 to 42,000 uhits 1,600 to 5,000 mg/liter 800 to 2,000 mg/liter 1
Operating data from a 0.81 hectare (2 acre) field, when irrigated at a rate of 7,570 liters/hectare/day (2,000 gal/acre/day) for a year, showed color removal of 88 to 99 percent and COD removal of 85 to 99 percent.
The same author reported on the use of soil irrigation to treat effluent from two tar plants that contai'ned 7,000 to 15,000 mg/liter total phenols and 20,000 to 54,000 mg/liter COD. The waste was applied to the field at a rate of about 20,000 liters (5,000 gal) per day. Water leaving the area had COD and total phenols concentrations of 60 and l mg/lite~, respectively. Based on the lower influent concentration for each parameter, these values represent oxidation efficiencies o:f well over 99 percent for both total phenols and COD.
188

..... 00
"°
'"rl i6 C i ~ I
,gi.
VAPORS
r COOLING ~000 IN TREATING CYLINDER WOOD OUT
'- I t / 1
. c rNl>ENSER ) WATER
1
PRESERVATIVES TO WORK TANK
WORK TANK
- 1
CYLINDER DRIPPINGS PRESERVATIVES I AND RAIN WATER
TO CYLINDER
1----t RECOVERED OILS I OIL - WATER I \ - SEPARATOR / CONDENSATE
WASTEWATER J I
POLISHING OIL REMOVAL
I M VACUUM
PUMP
ACCUMULATOR
WATER VAPOR
~- f
I
I AIR AND \ YAPORS ;}
WATER\VAPOR C
z s ·I ~ EXTERNAL HEAT, lF NECESSARY
EVAPORATOR COOLING TOWER
MECHANICAL DRAFT COOLING TOWER EVAPORATION SYSTEM

Bench-scale treatment of coke plant effluent by soil irrigation was also studied by Fisher. Wastes containing BOD and total phenols concentrations of 5,000 and 1,550 mg/liter, respectively, were reduced by 95+ and 99+ percent when percolated through 0.9 meter (36 inches) of soil. Fisher pointed out that less efficient removal was achieved with coke plant effluents using the activated sludge process, even when the waste was diluted with high quality water prior to treatment. The effluent from the units had a color rating of 1,000 to 3,000 units, compared to 150 units for water that had been treated by soil irrigation.
Both laboratory and pilot scale field tests of soil irrigation treatments of wood preserving wastewater were conducted by Dust and Thompson (1972). In the laboratory tests, 210-liter (55-gallon) drums containing a heavy clay soil 60 centimeters (24 inches) deep were loaded at rates of 32,800; 49,260; and 82,000 liters/hectare/day (3,500; 5,250; and a,750 gallons/acre/day). Influent COD and total phenols concentrations were 11,500 and 150 mg/liter, respectively. Sufficient nitrogen and phosphorus were added to the waste to provide a COD:N:P ratio of 100:5:1. Weekly effluent samples collected at the bottom of the drums were analyzed for COD and total phenols.
Reductions of more than 99 percent in COD content of the wastewater were observed for the first week in the case of the two highest loadings and through the fourth week for the lowest loading. A breakthrough occurred during the 22nd week for the lowest loading rate and during the fourth week for the highest loading rate. The COD removal steadily decreased thereafter for the duration of the test. Total phenols removal showed no such reduction, but instead remained high throughout the test. The average test results for the three loading rates are given in Table VII-3. Average total phenols removal was 99+ percent. Removal of COD exceeded 99 percent prior to breakthrough and averaged over 85 percent during the last week of the test.
The field portion of Thompson and Dust's study (1972) was carried out on an 0.28-hectare (0.8-acre) plot prepared by grading to an approximately uniform slope and seeded to native grasses. Wood preserving wastewater from an equalization pond was applied to the field at the rate of 32,800 liters/hectare/day (3,~00 gallons/acre/day) for a period of nine months. Average monthly influent COD and total phenols concentrations ranged from .2,000 to 3,800 mg/liter and 235 to 900 mg/liter, respectively. Supplementary nitrogen and phosphorus were not added. Samples for analyses were collected weekly at soil depths of O (surface), 30, 60, and 120 centimeters (l, 2, and 4 feet).
The major biological reduction in COD and total phenols content occurred at the surface and in the upper 30 centimeters (l foot) of soil. A COD reduction of 55.0 percent was attributed to overland flow. The comparable reduction for total phenols content was 55.4 percent (Table VII-4). COD reductions at the three soil depths, based on raw waste to the field, were 94.9,
190

95.3, and 97.4 percent,. ~espectively, for the 30-, 60-, and 120-centimeter (1-, 2-, and 4.,.foot) depths. For total phenols, the reductions were, in -0rder~ 98~9, 99.2, and 99.6 perc~nt.
Table VII-3. Results of Laboratory Tests of Soil Irrigation Method of Wastewater Treatment*
Loading Rates (Liter/ha/day}
Length of Test
(Week)
COD Average% Removal to
Breakthrough
COD Average%
Removal Last Week
of Test
Total Phenols
Average% Removal (All Weeks)
----------------~---~----------~---------~------------------------~-~ 32,800 31 99. 1 (22 wks) 85.8 98.5 (3,500)**
49,260 13 99.6 99 .. 2 99.7 (5,250)
82,000 14 99.0 (4 wks) 84.3 99.7 (8,750)
---------------------------~-----------------------------------------* Creosote wastewater containing 11,500 mg/liter .of COD and
150 mg/liter of total phenols was used.
** Loading rates in parentheses· in gallons/acre/day.
SOURCE: Thompson and Dust, 1972.
191
:, ,....:r.-:

Table VII-4. Reduction of COD and Total Phenols Content in Wastewater Treated by Soil Irrigation*
Month
July August September October November December January February March April
Average% Removal (weighted)
July August September October November December January February March April
Average % Removal (weighted)
Soil Depth (centimeters} Raw Waste 0 . 30 60 120
£.OD (mg/liter}
2,235 1,400 2,030 1,150 2,355 l, 410 1,780 960 2,060 l, 150 3,810 670 2,230 940 2,420 580 2,460 810 2,980 2,410
.55. 0
Total Phenols (mg/liter}
235 186 512 268 923 433 310 150 234 86 327 6 236 70 246 111 277 77 236 172
55.4
150 170
72 121 144 l O 1 126
94.9
4.6 7. 7 1.8 1. 9 4.9 2.3 l • 9
98.9
66 64 90 61 46
91 58 127 64
92 64 l 02 68
76
95.3 97.4
l . 8 0.0 o.o 2.8
3.8 0.0 9.0 3.8 3.8 o.o 2.3 l . 8 l. 9 1.3 0.0 o.a
99.2 99.6 ---------------------------·-------------------------------------------* Adapted from Thompson and Dust (1972).
192

Other Applicable Technologies--Wood Preserving-~Several additional treatment technologies were evaluated to determine their feasibility afs candidate treatment. technologies for BAT, NSPS, and .pretreatment stanaards. The technologies evaTuated for wood preserving included:
Tertiary Metals Removal Systems Membrane Systems Adsorption on Synthetic Adsorbents Oxidation by Chlorine Oxidation by Hydrogen Peroxide Oxidation by Ozone ·
A discussion of each of these technologies and case studies of their application to the wood preserving industry are presented in Appendix F, DISCUSSION OF POTENTIALLY APPLICABLE TECHNOLOGIES.
None of these technologies are candidate technologies because they are experimental in nature, and further research is necessary to sufficiently determine the effectiveness of. treatment which, could be expected if these technologies were to be applied to wood preserving wastewaters.
In-Place Technology
The current lev~l$ Rt. il}-:place technology for plants responding to the DCP and the follow-up telephone survey are presented in Tables VII-5 through VII-9 for Boulton no dischargers, Boulton indirect dischargers, steam no dischargers, steam direct discharger, and steam indirect dischargers, respectively.

Table VII-5. Olrrent Level of In-Place Technology, lbulton, N:> Dischargers
Oil Separation Effluent Recycle Primary Oil by Dissolved Air Evaporation Spray or Cooling T~r Thennal to Boilers or
Plant Separation Flotation Ponis Soil Irrigation Evaporation Evaporation Q:mlensers
61 X X 62 X X 63 X X 64 X Xk 67 X X
144 X X 145 X X 146 X X 147 X X 162 X X .... 273 X X X 1.0
.;:,, 447t 515 X X 534 X X 546 X X 552 X X 554 X X X 583 X X 85 X X
593 X X 657 X X 934 X X 940t
1028t 1085 X
-* Evaporation-Ground Infiltration Ponis. t Information mt availabie for this plant, other than it is m-discharge.
SOORCE: Ihta rollection p'.)rtfolio arrl follow-up telei:none survey.

Table VII-Eii. Current Level. of In-Place Preservi'ng, Boulton, Indirect Dischargers
Technology, .Wood
---------... --.. ·--------------. ---._ - ------· ------------ -----------------
Plant
65
549
555
577
655
743
1027
1078
1110
1111
,, '
Primc:1ry Oil Separation
X
X
X.
X
X
X
X
X
X
X
Chemi.cal Flocculation and/or Oil Absorbent
Media
X
X
x.
X i ' '"
Biological Treatment
X
X --------~---·-·--------------------------------------~--------------------SOURCE: survey.
I>ata collection . portfolio and follow-'up telephone
195

Table VII-7. OJrrent level of In-Ploce 'Tuclnol~y, Stean, N>-Dis::hm:gers
Cllemical Spt'ay-
Assiste:l Effl~nt Q:-avity Fl.occulation S:irrl SJ:ray 'lrellllal. S:>lar S:>lar R:c~le to
Oil-Water or Oil .Aboorp- Filtra- Oxidation krate:l Irriga- I:blding Ell'ap:,ra- Ell'ap:>ra- Ell'ap:>ra- Boiler or Plait Sep:iration tive M:dia tion lagoon lagoon tion Basin tion tion lbn:l tion Cbrrlenser
5 X X 27 X X X 40 X X X 42 X 43* X X X 87 V
A
138 X X X X 140 X 158 X X X 164 X X
.... 177 X X X 10 226 X X X en
237 X X 247 X 266 X X X X X X 307 X X X 330 X X X 340 X X X
-----·--- 3.50 X x- X 355 X X X X X X. 375 X X 376 X X 381 X X X 441 X X 456 X X X X 548 X X X 500 X X X X 587 X X 5~ 591 X 597 X X X X 617 X X X 631 X X X 651 X X X 660

Table VII-7. Cl.lrrent level of In-Place Technolcgy, S::ean, N:>-Dia:hargers ( Cbntinued, page 2 of 2)
Spray-Chem:ical Assistal Effluant
Gravity Flocculation Salli stray Thennal S>l.ar S>lar Rec )l:l.e to Oil-Water or Oil Abrorp- Filtra- Oxidation kratal Irriga- Ibldiil?; E.vaµ>ra- Evaµ>ra- E.vaµ>ra- Boiler or
Plait Separation tive M:rlia tion lagoon lagoon tion Basin tion tion lbn:i tion Cbnienser
488 X X 499 X X X X 665 X X
.. 701 X X X X 705 X 707 X X 717 X X X 750 X X X 752 X 7~ X X X X 800 X
I-' 852 X X X '\O 893 X . ....,
895 X X X X . . , 897 X X X X
900 X X 946 X
1016 X X X 1071 X X 1100 X X X X 1101 X 1105 X X X X 1113 X X 503 X X 595 X X X 656 X X· 666 X X 688 X X 847 X X X
1009 x X X 1112 X X X X
*Plant incinerates excess oily mstemter.
SOORCE: Iata collection JX)rtfulio an folloW'Up telep:ione survey.

..... 1.0 (X)
Table VII-8. OJrrent level of In-Pla:e Tuclnolcgy, S::ean, Direct Diochargers
Cllemical Q.-avity Flocculation Sml S{ray 'Ihennal S::>lar
Oil-Water or Oil llbrorp- Filtra- Oxidation /eratal Irriga- lbld~ E\l'ap:>ra- E\l'ap:>ra-Plmt ~paration tive M:rlia tion lagoon lagoon tion Basin tion tion lbrrl
268 X X X X
SOORCE: Dita collection )Drtfulio a"rl fullow-up teleJi1cme survey.
Spray-Assistal Effl.t.ent
&>lar Ja::ycle tn E\l'ap:>ra- Boiler or
tion Corrlenser
X X

Table VII-9. Cbrrent level of Jn-Pla:e 'leclnol~y, Wxxl lhserv:ing-Stean, biirect Di.s:hargers
Spray-Chemical Assistei Efflt.ent
Q:-avity Flocculation Smi Spray 'lhennal B>lar S:>lar Rec:ycle to Oil-Water or Oil .Aba:>rp- Filtra- Oxidation .Aeratoo Irriga- Iblding Evapora- Evapora- &rapora- Boiler or Pl ... • . M!d. • . lag tinn · Basin · tion . _ tiori. lbni . tion Cbnienser ant Separa~10n - t1v7 ~la- t10n lagoon. oon
139 X 173 X X X X 267 X X X X X 335 X X X
I
' ' 338 X X X X 339 X X X 529 X X 530 X
·i. S47 X X I 582 X X
596 X
i-o: 620 X X \0 693 X X \0 765 X X X
8~ X X 896 X X 898 X X X 899 X X X X 901 X X 910 X X
1076 X X X 1200 X X 1201
L' , -,589 X 575 X .5~ X
1203 x 2~ X X X
1205 X
SOORCE: llita collection {X)rtfulio an fullow-up telei:rone S1.rVey.

Treated Effluent Characteristics
Treated effluent characteristics for wood preserving plants sampled during the Pretreatment Study, the verification sampling programs and the 1972 - 1980 American Wood Preservers Institute (AWPI) sampling program are presented in Tables VII-10 through 34 for traditional parameters and the toxic pollutants. All the. data are presented in terms of both concentrations and waste loads, except for the AWPI data, which is presented only in terms of concentrations. The AWPI data is not presented in terms of waste loads because flow data were not available to correspond with the concentration data.
Data from four sampling and analytical programs are presented. Data for plants sampled during the 1975 Pretreatment Study represent the average of two or more grab samples collected at each plant. Data for plants sampled during the 1977 and 1978 verification sampling programs represent the average of three 24-hour composite samples collected at each point. Data for plants sampled during the 1972-1980 AWPI program represent one or more grab samples collected at each plant. For those plants where two or more grab samples were collected, the data represent an average of all the samples collected.
Treated effluent flow data for some plants may differ somewhat from the raw wastewater flow presented for the same pl.ant during the same sampling period. This is due to either dilution by steam condensate, cooling water, boiler blowdown, etc., occurring after the raw wastewater sampling point; or where no dilution occurs, it is due to evaporative or percolation losses in the treatment system.
For the purpose of data presentation and interpretation, the plants are grouped into categories based on the type of treatment technology which was in-place at the time of sampling.
One category represents plants which have BPT technology or its equivalent in-place. BPT technology consists of primary oilwater separation, flocculation and slow sand filtration, followed by effective biological treatment. Flocculation and slow sand filtration is an optional part of BPT technology which may not be required by plants whose wastewaters do not contain high enough concentrations of emulsified oils to inhibit biological treatment. Only one of the plants in this category is a direct discharger. All of the remaining plants di$charge to a· POTW or to self contained systems following biological treatment. The data presented in the tables indicate that BPT technology achieves effluent PCP levels of about l mg/1.
A second category of plants is indirect dischargers with pretreatment technology in-place. The pretreatment technology consists of primary oil-water separation followed by flocculation and slow sand filtration. Some plants in this category achieve the 100 mg/1 Oil and Grease standard .without slow sand
200

filtration. C)ne pian't repiaces the flocculation/filtration system-with oil absorbent media.
,~ '
The data pres,ented in the tables·· fridicate· that the. pretreatment technology removes most emulsified Oil and Grease to a level of· l 00 mg/1 or l,ess. Removal of Oil and Grease is the key·. to effective pr,etreatment and to the control of toxic pollutants because PCP and PNAs have a much greater affinity .for the oil phase than for the water pha~e. The data present~d in the tables .. show that control of Oil and_ Grease serves as an excellent control for r-emoval of PN/l.s. . When Oi 1 and Grease are removed· . to 100 mg/l or less, corresponding values of total PNAs are about l mg/1 and PCP can be controlled to 15 .mg/1 or less .. ·
The final category of plants for which data are presented are plants · with less than the equivalent of BPT technology in...:.place. These plants have biological systems which do not meet the · effluent limitations for BPT because of insufficient aeration. and/or insufficient detention·time, as compared to a properly designed plarit with BPT technology. . These plants were visited and sampled during the 1975 Pretreatment Study, and all of them discharge to a POTW after treatment.
Metals data are presented according to whether the plants treat· with organic preservatives only, or with both organic and inorganic preservatives .. ·
Average raw and treated· effluent waste loads for traditional. parameters and to1cic pollutants are presented- in Tables VII-35. through 47. Percent removals of pollutant.waste loads are also
·presented in these tables.
201

I\) 0 I\)
Table VII-10, libod Preservi{l!: Treated Effluent Tra:Jitional Paraneters Data for Plants wi.th Less Than the F.quivalent of BPI Technology In-Placek*
Data Fla,, Prcxbction (ft3fDay)
Concentrations (mg/1) Waste Loa:Js (lb/ 1,000 ft3) Plant Soorce (gpd) CDD Total O & G R:P CDD Total O & G R::P
I:benols Hlenols
499 PS'75 < 100 1,950 10,580 5.30 1,220 57.0 <4.52 <o.0023 <o.521 <o.0244
547* PS'75 25,000 8,000
593* PS'75 9,000 12,300
898* PS'75 2,000 3,000
1,980
2,220
5,100
18.9
120
325
78.2
116
449
7.20 51.6 0.493
5.50 13.6 0.7'l9
41.5 28.4 1.81
2.04 0.188
0.706 0.0336
2.49 0.231
Waste Loai Averages <24.5 <o.759 <l.44 <o.119
* Plants used to calrulate treated averages in Table VII-35. ** All four of these plants provide a minimun of biological treatment prior to discharge to a PO'JW.
Plant 499 provides insufficient aeration and detention time for effective biological treatment. Plant 547 provides insufficient aeration for effective biological treatment. Plant 593 provides insufficient aeration for effective biological treatment. Plant 898 provides insufficient aeration and detention time- for effective biological treatment,

N .0 w
Table VII-11. Wood Preserving Treated Effluent Traditional !larameters Data for Plants with Current Pretreatment Technology ln-Place
Data Source
Flow (gpd)
Prod~ction (ft /Day)
Concentrations (mi/1) Waste Loads (lb/1,000 ft3) Plant COD Total o & G PCP COD Total O & G PCP
! 73* PS '75
267 ' ESE '78
2.6 7* ESE' 77
267* PS'75
335*
582*
765*
1076
65*
65*
1078*
1078*
PS'75
PS'75
PS'75
PS'75
ESE'78
'PS'75
ESE '77
PS'75
3,000
9, 120 ·
12,000t
6,, 000
3,880
9,890
5,800
6,600
1,700 . l• 3,400 ·' ,;
13, 750
5,000
12,000
2,200
5,000
10,500**
7,000 .
7,500
2,700
5,500
2,770
5,000
10,900
10,'000
Waste Load Averages
NA Not Analyzed ..
4,866
5,440
4,420
4,315
2,290
3,030
10,513
Phenols
0. 202
13.6
64.4
50. 8.
230.2
80. 2
448.0
4,644 · 169. 7
500
528
3,164
4,078
1. 60.
73.7
680
613.1
339.3 15.0
14.1 5.80
49 6.12
20.0 3.20
NA
31.4
41.8
76. 3
32.7
9.55 15.0
40.0
245.2
87. 8
9.00 46.2
NA .162
134. 0 84. 5
121 17.0 3.31
19.67 2.71 4.40
40.0 NA 25.4
24.9 0.06 23.8
45.1
* Plants used to calculate treated averages in Table VII-36.
Phenols
0.0013
0.105
1.11
0.385
0.960
1. 23
6.92
3.09
0.0106
0.615
5.46
3.58
1.96
2.19 0.097
0.108 0.0446
o. 846 o. 106
0. 152 o. 0243
0.0626 NA
0.612 0.138
3.79 NA
1.60 2.44
o. 801 0.113
0.164 0. 0226
0, 321 NA
'0,145 0.0004
0.899 0.332
t Variations between the· raw and treated flow are due to inclusion of stormwater runoff in treated flow. These data do not alter the val id ity of waste loads ..
** Variations between the raw and treated flow are due. to flow equalization in the treatment system. These data do not alter the validity of waste loads.
PTRRlenols ave. UF/100 2 cu ft)= 2.027.

Table VII-12. AWPI Wood Preserving Treated Effluent Pentachlorophenol (PCP) Data for Plants with Current Pretreatment Technology In-Place ·
Concentrations, mi/1 Plant :Oata Source PCP
547 AWPI, 1980 4,.84
237 AWPI, 1978 3.03
355 AWPI, 1979 10.0
593 AWPI, 1976 14.0
376 AWPI, 1974 10.3
1111 AWPI, 1972 1.03
582 AWPI, ~979 1.20
582 AWPI, 1979 13.0
589 AWPI, 1979. 7.6
894 AWPI, 1980 0.9
894 AWPI, 1980 9.0
894 AWPI, 1980 0.16
901 AWPI, 1980 14.0
' I * Samples were collected by AWPI members and analyzed at the Mississippi State Forest Products Utilization Laboratory.
204.

Table VII-13. W:>od Preservi~ Treata:l Effluent Tra:litional Paraneter Data for Plants With Oirrent BPI' Technology Inflace
Concentratiom (mg/1) Waste Loa:1s (lb/1,000 ft3) Data Fl@ Prod.
Plant Source· (gpd) (ft3 /day) OOD Total O&G ~ OOD Total O&G ~
Phenols Phenols
548** ESE'78 36000 15500 661 0.927 52.3 2.70 12.8 0.0180 1.01 0.0.523
548** ESE'77 14CJOOk 8760 416 0.695 126 0.907 5.54 0.0093 1.68 0.0121
591** ESE'78 1415ott 7920 630 0.260 100 0.032 9.39 O.OOJJ 1.49 0.0005
591** ESE'77 9350 11300 119 0.048 39 0.21 0.821 0.0003 0.269 0.0014
897** ESE'78 42400 18200 230 0.068 9.3 0.069 4.47 0.0013 0.18( 0.0013
1100 ESE'77 66300 16300 2122 7.00 398 8.27 72.0 0.237 13.5 0.281
N 1111** PS'75 25000 7000 100 0.130 < 10 NA 2.98 O,OOJ) (0.298 ti\. 0
0,
Waste Loa:1 Averages 6.00 0.0061 <0.821 0.0135
NA Not Analyred. * Plant.is a self-containa:l discharger. Sanples ~re tacen after M.llti-Stage Biological Treatment. Historical fla,,
data \\'ere used to calculate waste loa:ls. t Data not included in averaging since the treatment system W:!S operati~ under upset conditions during sanpling~
Sanples were collected fron the plant to detennine the effect of upset upon pr~ority pollutant re:ooval. ** Plants usa:l to calculate treated averages in Table VII-37. · tt Variations ben.een the ra,, am treated flow are due to inclusion of boiler blooown and stonnwater runoff in
treata:l flow. This does not alter the validity df the waste loa:ls.

Table VII-14. Substances·Analyzed for but Not Found in Volatile Organic Analysis During 1978 Verification Sampling
vinyl chloride chloroethane chloromethane bromomethane tribromomethane bromodichloromethane dibromochloromethane carbon tetrachloride dichlorodifluoromethane trichlorofluoromethane 1,2-dichloroethane 1,1-dichloroethane 1,1,1-trichloroethane
1,1,2-trichloroethane tetrachloroethane 1,1-dichloroethylene trans 1,2-dichloroethylene tetrachloroethylene trichloroethylene 1,2-dichloropropane 1,3-dichloropropylene Bis-chloromethylether Bis-chloroethylether 2-chloroethylvinylether acrolein acrylonitrile
Generalized machine detection limit for these compounds is 10 ug/1.
206

N 0
.-...J
Toole VII-15. t-bcd Presetvill?; Treate:l Effl.rent Volatile Organics Data fur Plants with Currert: Pretreatnent Technolcgy In-Placet ·
Concentrations (mg/1} Waste Ioals (lb/liOOO ft3) Data Flow Proo.
Plant Source (gpd) (ft3/day) rrecl trclne brrlic1me • bemene eti>emene tohiene neci trdre brdi.ciie beIEene etbeIBene toJuene
65* ESE' 78 2200 27 70 1.90
0.067
0.003
0.033
0.01:?6 (0.0()()1 <0.0001 <0.0001
267 ESE'78 9120 989'.> 0.020 0.033 0.0005 <0.0001 <o.ooor : o.'oooJ
-.--
Waste Ioal Averages 0.0005 <0.0001 <0.0001 0.0003
* Data net inclu<Ed in averagirg since plant ures uniqte netlylene chloride proCESs.
' : t A corresµm:lill?; averages tmle is net presenta:l beca.ise Plant 267 r8i/ wasteloals are mavailable anl Plant 65 uses
a uniqlE netlylene chloride proress. · ·
- Hyphen dmetes that p!lrareter was analyred for but was below detection limit.
Key to Volatile Organics Data Tables
necl = netlylene chloride trche = chlorcfonn (trichloranethane) btdiclme = bronodichloronethane ethemene = etlylbemene
<0.00()1 :. ~0.0001
0.0002 . 0.0003
o.ooaz 0.0003

N 0 <X>
Table Vll-16. Wood Preserving Treated Effluent Volatile Organics Data for Plante with Current l!PT Technology In-Place
Concentrations (mg/1) Data Flow Prod.
Plant Source (gpd) (ft3/day) 11\ecl trclme benzene et benzene toluene
.., 548* ESE'78 36000 15500 0.013 -- -- - --591* ESE'78 l4I50t 7920 0.660 0.023 0.010 -- 0.140
897* ESE'78 42400 18200 0.140 0.003 0.030 -- 0.023
Waste Load Avera~es
Hyphen denotes that parameter was analyzed for but was below detect ion limit.
* Plants used to calculate treated averages in Table VII-38,
Waste Loada (lb/ 1,000 ft3)
aiecl trclme benzene etbenzene
0.0003 <0.0001 <0.0001 <0.0001
0.0098 0,0003 0.0001 <o .0001
0.0027 0.0001 0.0006 <0.0001
0.0043 <0.0002 <o .0003 <0.0001
toluene
<O ,0001
0.0021
0.0005
<0.0009
t-variations between the raw and treated flow are due to inclusion of boiler blowdown and stomwater runoff in treated flow. This does not alter validity of the waste loads,
Key to Volatile Organics Data Tables
mecl = methylene chloride trclme = chloroform (trichloromethane) brdiclme = br.omodichloromethane etbenzene = ethylbenzene

Table VII-17. Substances Analyzed for but Not Found in Base Neutral Fractions During 1977 and 1978 Verification Sampling
-----------~-----~---~---------.---------------~'"'!'---------------------2-chloronaphthalene diethylphthalate di-n-butylphth~late butylbenzylphthalate dimethylphthalate 4-chlorophenyl-phenylether bis(2-chloroisopropyl) ether bis(2-chloroethoxy) methane 4-bromophenyl phenylether N-ni trosodimE~thylamine N-ni trosodi-n--propylamine N-ni trosodiptwnylamine 1,2-dichlorobenzene 1,3-dichlorobenzene
1,4-dichlorobenzene 1,2,4-trichlorobenzene hexachlorobenzene 2,6~dinitrotoluene 2,4-dinit~otoluene benzidine 3,3'-dichlorobenzidine nitrobenzene. hexachlorobutadiene hexachlorocyclopentadiene hexachloroethane isophorone 1,2-diphenylhydrazine 2,3,7,8-tetrachlorodibenzo-p-dioxin
Generalized machine detection limit for ~these compounds is 10 ug/1. ------------------------------------------------------------------' '
209

N ._. 0
Table YII-18. llood Preserving Treated Effluent Base Neutrals Concentrations for Plants llith current Pretreatment Technology In-Place
Plant Data Flow P~d. Nuaber So,urce (gal/day) (ft /day) I ~ 3 4 5
65 ESE '78 2200 2770 -- - -- -- --1078 ESE '77 10500 10900 0.092 -- - 0.027 -
267 ESE '78 9120 9890 17.0 2.50 -- 9,40 -267 ESE '77 12q,oo 5800 - -- -- - --
-- Hyphen denotes that parameter was analyzed for but was below detection limit.
Key to Ba1e Neutral Data Tables
1. Fluoranthene 2. Ben:o (B) Fluoranthene 3. Benzo (k) Fluoranthene 4. Pyrene · 5. Benzo (A) Pyrene 6. Indeno (I, 2, 3-CD) Pyrene 7. Benzo (ghi) Perylene
- 8-. Phenant-hre-ne and/or Anthracene 9. JSen:o (a) Anthracene
10. Dibenzo (a, h) Anthracene 11. Naphthalene 12. Acenap-hthene 13. Acenaplothylene 14. Fluorene 15, Chrysene 16. Bis-2-ethyl-hexyl phthalate
6 7 Concentrations (m.s:/1)
S 9
-- 0.133
- -- 0,058 ---- - 37,0 3.40
-- - 0.059 --
II 12 13 14 15 16
0.930 0.059 0,059 0,019 -- 0,029
36,0 18.0 -- 16.0 1.9
0.820 0,100 0,140 0.036 -- 0,154

N ... ...
Table VI 1-19. Woud PresPrv ing Treated Effluent Base Neutrals Wasle Loads for Plants with Current Pretreatment TPchnology In-Place
Plant Oala Flow Prod. Waste Loads (lb/10,000 ft3) Number SourcP. (gal/day) (ft3/day) I 2 3 4 5 r; ' 8
65tt Ftt<;E '78 2200 2770 <O. 0001 (O. 0001 (0.0001 <O.OOOl 0.0001 (0.0001 <0.0001 0.0009
·t078tt ESF. '77 JOWO* 10900 0.0007 <O. 0001 <0.0001 0. 0002 (O. 0001 <O.OOOl <0.0001 0.0005
267tt '· ESE '77 uooot· 5800 (O. 0001 •: (0. 0001 (0. 0001 (0.0001 (0.0001 <O.OOOl (0.0001 0.0010
267** F.SF. '78 9120 9890 o. 131 0.0192 <0.0001 o. 0123 <o. 0001 (0.000! <O, 0001 0.285
Wasl<> Loa•l AvPragt-s <0.0003 (0,0001 (0. 0001 '(O. 0001 (0. 0001 <0.,0001 <0.0001 0.0008
* Varialio~s 'between the raw and treated flow are due to flow equalization in the treatment system. This does not aller Lhe.validity of the wsste loads. Variations between the raw and treated flow are due to inclusion of stonnwater runoff in treated flow. Thi's. d,,es not· alter the validily of the waste loads. .
** No>l included in the average because of suspected analytical discrepancies. tt Pl ants used to calculate treated averages in T_ahle VII-39.
Key to Base Neutral DaL'a Table~s
1. Fluoranthene · 2. Benzo (B) Fluorant.hene 3. Benzo (k) Fluoranthene 4. Pyrene .
·5. Benzo (A) Pyrene 6. lndeno (1, 2, 3-CD) Pyrene .J. Benzo ( ghi) Perylene 8. l'henanthrene and/or .Anthracene 9. Benzo (a) Anthracene
10. Dihenzo (a, h) Anthrac,me 11. Naphthalene 12. Acenaphthene I 3. Acenaphthylene 14. Fluorene. I 5, Clirysene 16. Bis-2-ethyl-hexyl phthalate
9
(0.0001
<o.oool
(0.0001
0.0261
(0.0001
HJ II (2 Iii 15 16
(0.0001 (O.OOOl (0. 0001 <O. 0001 <O. 0001 (0. 0001 <0.0001
<0.0001 o. 0075 0.0005 o. {',005 0. 0002 (O. O'JO! Q. 0002 .
(0.0001 0.0141 0.0017 0. 0024 o. 0006 <O. 0001 O.Otl?7
(0.0001 o. 277 0.138 (0.0001 0.12.3 0.0146 <O. 0001
(0.0001 (0.0072 (0.0008 (0 .• 0010 <0.0003 <O.OOfll (0.0010
,II

N .... N
Table VII-20. Wood Preserving Treated Effluent Base Neutrals Concentratio·ns for Plants vith Current BPT Technology In-Place
Plant Data (g:tl~ay) (f~5,!;y) Nu,mber Source I 2 3 1i 5
548 ESE '78 36000 15500 1.60 0.210 0.210 1.20 0.290
591 ESE '78 14150 7920 0.210 -- 0.037 0.120 0.015
591 ESE 177 9350 11300 0.120 - - 0.077 -897 ESE '78 42400 18200 0.011 0.057 0.057 0.013 0.070
1100 ESE '77 66300 16300 0.106 -- 0.079 --
-- Hyphen denotes that parameter was analyzed for but was below detection limit.
Key to ·Base Neutral Data Tables
1. Fluoranthene 2. llenzo (B) Fluoranthene 3. Benzo Ck) Fluoranthene 4. Pyrene 5.· Benzo (A) Pyrene 6. Indeno Cl, 2, 3-CD) Pyrene 7. Benzo (ghi) Perylene 8. Phenanthrene and/or Anthracene 9. !en_zo (a) Anthracene
lo. Dibenzo (a, h) Anthracene 11. Naphthalene 12. Acenaphthene 13. Acenaphthylene 14. Fluorene 15. Chrysen·e 16, Bis-2-ethyl-hexyl phthalate
6 1 Concentrations Cms/t>
B g U:I
0.110 0.063 1.40 0.440
0.040 0.002 0.037 0.055
- -- 0.053
0.050 0.011
-- -- 0.420 0.009
rr
0.031
0.140
0.002
0.033
I'2'
0.370
0.065
0.090
0.004
0.203
I3 Ii'+
0.280
0.017
0.067 0.050
0.004 --0,190 0.100
I5 I6
0.270
- 0.009
- 0.010
0.019
- 0.305

. N ..... _
·w
Table Vll-21. Qxicl PreseM.llt Treated Effluent Base Neutrals Waste IDals for Plants with <llrrent BPr TedinolOf!Y In-Place
Plant Data Fla, iSod. Waste Loa:ls (lb/10,000 ft3) lblber Srurce (gal/~ay) (f /day) I 7 l 7j 5 i'i 1 .ll 9 Ill II
S48t ESE '78 36000 15500 0.0310 0.0041 0.0041 0.0232 0.0056 0.0021 0.0012 0.0271 0.00!5 <D.0001 <0.0001
59!t ESE '78 14150** 7920 0.0031 <0.0001 0.0006 0.0018 0.0002 0.0006 <D.0001 0.0006 <Ii .0000 <D.0001 0.0005·
59lt ESE '77 9350 11300 0.0000 <D.0001 <D.0001 0.0005 <D.0001 <D.0001 <D.0001 0.0004 <D .0001 <D .0001 0 .0010
'1100* ES!! '77 66300 16300 0,0036 <0.0001 <D.0001 0,0027 <D,0001 <D.0001 <o.0001 0.0142 0.0003 <0.0001 0.0011
897t ESE. '78 42400 -18200 0.0002 0.0011 0.0011 0.0003 0.0014 . 0.0010 0.0002 <o.0001 <D.0001 <D.0001 <0.0001
Waste Load Averages 0.0088 <D.0014 <0.0015 0.0032 <D.0018 <D.0010 <0.0004 <0.0071 <D,0024 <o.0001 (0.0004
* Data not included in averagi~ since treabnent aystan ws operatiig under upset conlit:iom cluri~ sanpli~. t Plants used to cal01late treatal averages in Table VII-40. ** Variations beo;een the rat. and treatal flew are clue to inclusion of boiler b lOldo,,,n and stoniWlter runoff in treated flew.
This does not alter lhe validity of the wase-e loads •
Key to ~ase Neutral Iiata Tables
1, · Fluoranthene 2. Benzo (B) Fluoranthene 3. llem:o (k) Fluoranthene 4. Pyrene · · 5. Benzo (A) Pyrene 6 • Incleno ( 1, 2, 3-0>) Pyrene 7, Berm (fhi) Perylene 8, Rienanthrene and/ or· Anthracene 9. Benzo (a) Anthracene
10. Dibew,o (a, h) Anthracene 11 , Naphthalene · 12, Acenaphthene 13. Acenaphthylene .14. Fluorene 15, <hrysel)e 16. Bis-2-ethyl-hexyl phthalate
u Il I7i 15 16
0.0072 <0.poo1 0.0054 0.0052 <D.0001
0.0010 <D.0001 0.0003 <o.0001 <D.0001
0.0006. 0.0005 0.0003 <D.0001 0.0001
0.0069 0.0064 0,0034 <o.0001 0.0103
0.0001 0.0001 . <D.0001 0.0004 <D .0001
0.0022 <D.0002 <D.0015 <D.0015 <D.0001

Table VII-22. Toxic Pollutant Phenols Analyzed for but Not Found During 1978 Verification Sampling
---------------------------------·--------------------------------2-nitrophenol 4-nitrophcnol 2,4-dichlorophenol 2,4-dinitrophenol para-chloro-meta-cresol 4,6-dinitro-ortho-cresol
Generalized machine detection limits for these compounds is 25 ug/1. ----------------------------------------------------------------
214

N .... 0,
Table VII-23. Wood Preserving Treated Effluent Toxic Pollutant Phenols Data for Plants with Current Pretreatment Technology In-Place
Concentrations (mg/1) Plant Data Flow Prod. 2- 2,4- 2,4,6-Number Source (gal/day) ( ft3/day) phen clphen dimeph triclph PCP
173t PS '75 3000 3880 NA NA NA NA 15.0 267 ESE '78 9120 9890 16.0 -- -- -- 5.80 267t ESE '77 12000** 5800, NA NA NA NA 5 .39 267t PS '75 6000 6600 NA NA NA NA 3.20 5·82t PS '75 13750 7500 NA NA NA NA 9.00
1076 PS '75 12000 5500 NA NA NA NA 134.
BOULTON --65t ESE '78 • 2200 2770 0.026 0.004 -- 0.005 17 .0 65;t. PS '75 5000 5000 NA NA NA NA 2.71
1078t PS '75 7000 10000 NA NA NA NA 0.055
Waste Load Averages
NA Not analyzed. -- Hyphen denotes that parameter was analyzed for but was below detect ion limit. * Data not included in averages. t Plants used in calculating treated averages in Table VII-41.
Waste Loads (lb/1,000 ft3) 2- 2,4- 2,4,6-
phen clphen dimeph triclph PCP
NA NA NA NA 0.0967 o .123 <0.0001 <o .0001 <0.0001 0.0446
NA NA NA NA 0.0930 NA NA NA NA 0.0243 NA NA NA .NA 0.138 NA NA NA NA 2.44
0.0002 <0.0001 <0.0001 <0.0001 o.u3· NA NA NA NA ·0.0226 NA NA NA NA 10.0003
0.0616 <0.0001 <0.0001 <0.0001 0.330
** Variations between the raw and treated flow are due to inclusion of stormwater runoff in treated flow.· This does not alter the. validity of the waste loads.
Key to 'Volatile Organics Data Tables
phen = phenol 2~clphen = 2-chlorophenol 2,4-dimeph = 2,4-dimethylphenol 2,4,6-t~iclph = 2,4,6-trichlorophenol PCP - pentachlorophenol

N> ..... O'I
Table VII-24. Wood Preserving Treated Effluent Toxic Pollutant Phenols Data for Plants with Current BPT Technology In-Place
Concentrations (mg/1) Waste Loads (lb/10,000 ft3) Plant Data Flow Prod. 2- 2,4- - 2,4;6- 2- 2,4- 2,4,6-Number Source , (gal/day) (ft3/day) phen clphen dimeph triclph PCP phen clphen dimeph triclph PCP
548** ESE '78 36000 15500 -- -- 0.140 -- 2.70 <0.0001 <0.0001 0.0027 <0.0001 0.0523 548** ESE '17 14000* 8760 NA NA NA NA 0.907 NA NA NA NA 0.0121 591** ESE 1 78 14150tt 7920 0.015 -- -- -- 0.032 0.0002 <0.0001 <0.0001 <0.0001 0.0005 591** ESE '77 9350 11300 NA NA NA NA 0.213 NA NA NA NA 0.0015 897** ESE '78 42400 18200 0.015 -- 0.005 0.005 0.069 0.0003 <o.oooi 0.0001 0.0001 0.0013
llOOt ESE '77 66300 16300 NA NA NA NA 8.27 NA NA NA NA 0.281
Waste Load Averages <0.0002 <0.0001 <0.0010 <0.0001 0.0135
NA Not analyzed. -- Hyphen denotes that parameter was analyzed for but was below detection limit. * Plant is a self-contained discharger. Samples were taken after Multi-Stage Biological Treatment.
Historical flow data were used to calculate waste Toads. -t Data not included in averaging since the treatment system was operating under upset conditions during· sampling.
Samples were collected from the plant to determine the effect of upset upon priority pollutant removal. ** Plants used in calculating treated averages in Table VII-42. tt Variations between the raw and treated flow are due to inclusion of boiler blowdown and stormwater runoff in
treated flow. This does not alter the validity of the waste loads.
Key to Volatile Organics Data Tables
phen = phenol 2-clphen = 2-chlorophenol 2 ,4-dimeph = 2,4-·dimethylphenol 2 ,4 ,6-t riclph = 2,l~ ,6-trichlorophenol PCP - pentachlorophenol

I'\) .... ......
Table VI:l-25. Wood ,Preserving Meta'.ls Data, :Organic Preservatives Only,' Treated Eff:tuent for Plants with Current Pretreatment ,Technology In-Place
· Plant
. 267
267
Source
ESE '78
ESE '77
Flow (gpd)
9120
12000
Prod. Effluent Concentrations (mg/1) (£t 3 /day) Arsenic Af!t imony Beryllium Cadmium Copper Chromium Lead Mercury Ni,ckel
9890
5800
0.024
. 0.003 0.001
0.013 0.005 0.270
0.056
0.072
0.005
0.025
0.001
0:046
0.006
-~ Hyphen denote~ that parameter was analyzed for but was below detection limit,
Selenium Silver Thallium Zinc
0.004 .0.001 0.480
0.003 0.001 · 0.579

N I-' CX>
..
Tllble Vll-26. lbod PresetVicw Hatala Deta, Oqra,nie PreeemltMs Only, Treab:d Effluent for Plante with <krent Pretren,tnenl' Techoology In-Place
Fla, ,ocl. Effluent Waste l.oal (lb/11000 ft?2 Plant Sall"Ce (tqXI) (f /dey) Amenic Antianol"!( l!etylliua Cam.I.DI Q:,pper <hrom.1111 Leal Miroiry
267 ESE 178 9120 9890 0.00018 <lJ .00001 0.00010 0,0000'+ 0.00200 0.00055 0,00019. <o.00001
267* ESE 177 12000t 5800 0.00005 0.00002 <o.00001 <D.00001 0.00097 0.00009 0,00002 <0.00001
Aver~e Waste Loafs 0.00011 <D.00002 <0.00006 <o , 00003 0.00153 0,00032 0.00010 <o.00001
* Plant used in calculatill! treated averilges in Table V!!-·43 ..
t Variations bea.,een the ra,, ard treated fla, are due to inclusion of stom,gter runoff in treated fla,. This does not alter validity of waste loafs ..
. Nickel . Seienim Sil\\!!r Thallilllll Zinc
0.00035 <o.00001 0,00003 0,00005 0,00369
0.0001 0,00005 <o.00001 0.00002 0.00)99
0,00023 <o.00003 <o,00002 0.0000'+ 0.00684

1') .... 1,0
Table VII-27. Wood PresP.rving Metals Data, Organic Pre•ervatives Only, Treated Effluent for Plants with Current BPT Technology In-PlacP.
------------------ ------------Flow Prod. Effluent Concentration~ (mg/1)
Plant Source (gpd) (ft 3/day) ~rsenic Antimony Beryl l i urn C•dmium Copper ·Otromium Lead Mercury Nickel
---------------------------------548 ESE '78 36000 15500 6.98 0.014 -- 0.003 0.018 0.015 0.037 -- 0.019
548 F.SE '77 14000 8760' 0.035 o.oot -- -- 0.020 0.003 0.004 -- 0.005
591 ESF. '78 14150 7920 0.028 0.:001 -- 0.001 0.034 0.00,7 0.004 0.002 0,.009
591 '~Sf; '77 9350 11300 0.002 0.:001' -- -- 0.040 0.001 -- 0.0005 0.002
·1 IOU* F,SF, '77 66300 16300 0.227 - -- -- 0.092 0.003 0.003 -- 0.057
----------------------------- llyphPn denotes' that parameter WaS analy7.P.d for but WaS below detection limit,
I!
Selenium Silver Thall iurn Zinc
-- -- -- 0.047'
0.002 - -- 0.054
-- 0.001 -- 0.080
0.001 -- 0.002 0.145
0.003 0.001 0.001' o. 252

N N 0
Table VII-28. 1'bod Presei:vi~ Metals Da,ta, Orpinic PresetV11tives Only, Treatm Effluent for Plants with Current llt'l' Technolqzy In-Place
Flew (f,r~)
Effluent Waste Load (lb/ 1,000 ft3) Plant Source (E!l)d) Arsenic Antimiv l!eryllhm Csrm.1.111
548* ESE '78 36000 15500 0.135* 0.00027 <o.000)1 O.OO'.Xl6
548>'* ESE '77 l4ooott 8760 0.00047 0.00003 <0.00001 <o.00001
591** ESE 178 14150*** 79'l0 0.00042 0.00001 <o.00001 0,00001
591** ESE '77 9350 llJOO 0.00001 0.00001 <0.00001 <o.00001
llOOt ESE. '77 66300 16300 0.00770 <D.00001 <0.00001 <o.00001
Aver~e Wiste Loals 0.02137 <D.00000 <0.00001 <D.00002
- ~en denotes that paraneter was analyzed for 1;,ut was beliw detection limit. * Data not used in aver~ill:,
Cq,per Chram.1.111 Leal M:lra11:y
0.00035 0.000,9 o.ooon <o.00001
0.00027 0.00004 0.00005 <o .00001
0.00051 0.0001 0.00006 0.00()03
0.00028 0.00001 <D.00001 <D.00001
0.0031 0.0001 0.0001 <D.00001
0.00035 0.0001 <o.00021 <D.00001
t Data not inchxled in aver<{!;ill: since treatment systan w:is operatill: wder upset comi.tions durire; sanplire;. Sanples liere collected fran the plant to detennine. the effect of upset upon prioricy pollutant ranoval.
** Plant's used in calrulatirg treated aver<{!;es in Table VII-44. tt Plant is a self contained disch~r. Sanples liere ta<en after Milti-St~ Biological Treatment. Historical flew data
lie re used to calrulate waste loa:ls.
*** Variations bebleen ra1 and treated flaJ are due to inclusion of boiler bla«lown and stolffll,Bter runoff in treated flew. This does not alter validicy of w:iste loa:ls,
Nickel Seleniim Silver Thallit.111 zinc
0 .00()37 <o.00001 <o.00001 <o.00001 0.000}1
0.00007 0.00003 <o.00001 <o.00001 o.ooon 0.0001 <o.00001 0.00001 <o.00001 0.0012
0.00001 0.00001 <o.00001 0,00001 0.00100
0,0019 0.0001 0,00003 0.00003 0.00!55
0.0001 <0.00002 <0.00001 <0.00001 0.000)6

Table VII-29. Wood Preserving !iletals Data, Organic and Inorganic Preservatives, Treated Effluent for Plants with Less Than the Equivalent of BPT Technology In-Place
Plant
499
Data Source_
PS ,-75
NA--Not Analyzed.
N N .....
Flow (gpd)
<100
Prod. (ft3/day)
1950
Effluent Com:entrations (m£/l) Arsenic Antimony Beryllium Cadmium Copper Chranium Leal Merwry
1.02 NA NA NA 4:oo 1.30 NA NA
Nickel Selenium Silver · Thallium Zlnc
NA NA· NA NA tIA

N N N
Table VU-30. l'OOd Pre:iervi~ li:?tals Data, Orpanic an! InoQ?llnic PreaeM1tives, Treate:I Effluent for Pla,nts With Leu Than the Equivalent of llPl' Tedtnolqey Treatment In-Place
Plant Data
Srurce
499* PS '75
Aver~ lilste Loa:ls
NA--tbt Analyzed.
Fl<M (gpd)
<100
Prod. (ft3/dsy) Arsenic Antnony
1950 <O.OOO!i4 Nt\
<O.OOO!i4 NA.
* Plant used in calrulati~ treatm aver<ttes in Table VII-45.
Beryfliun Effluent Waste Loals (lb/1 1000 ft3)
Caiiiiun ~i:er~ram.1.111 Leal ~rrury
Nt\ Nt\ <0.00171 <o.00056 NA. Nt\
NA. NA <0.00171 <D.00056 NA. NA
Nickel Seleniun S1lver Thallill!I Zinc
NA N\ m Nt\ NA.
NA N\ R\ Ni\ Nt\
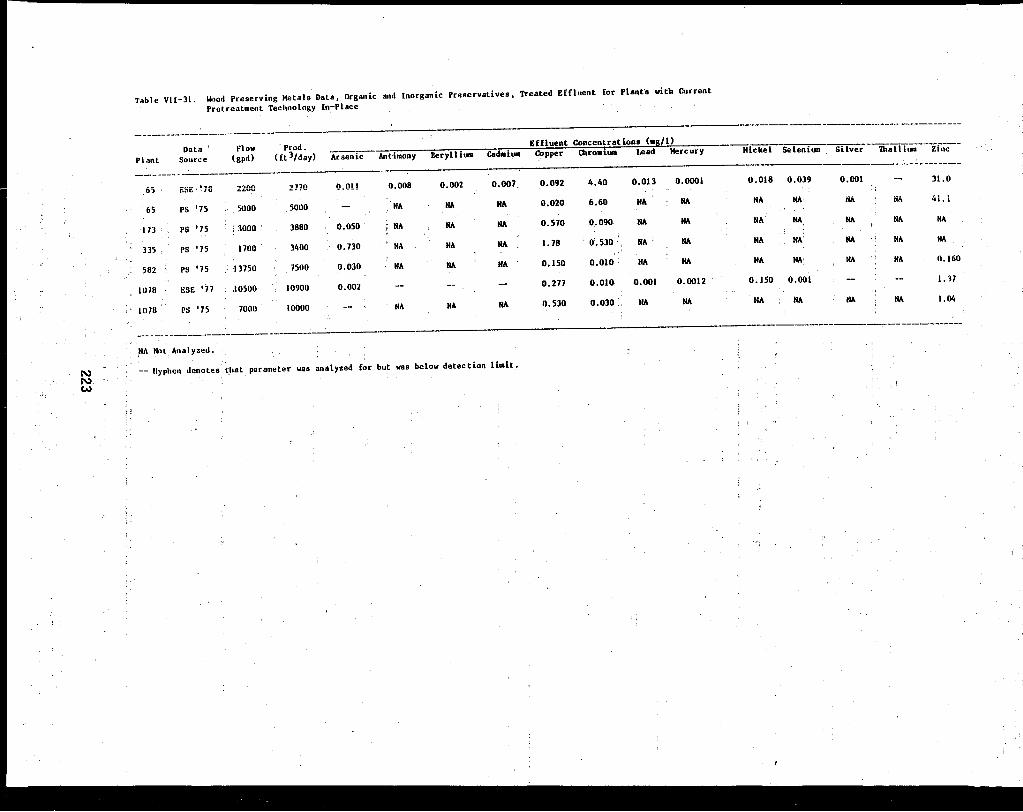
N N w
Tab I e Vl!-31. Wood Pce•erv ing Hetals Data, Organic an,1 Inorganic Preservatives, Treated Effluent for Plant's with Current
Prctreat .. ent Technology In:-Place
--------------------- ------- -Data Flow . Prnd. Effluent Concentration• (ag/1)
Plant Source (gpd) (fl3/day) Arsenic Antimony lleryll it• Cadai\81 Copper O.ro•it• Lead Mercury
--------------------6) r:sr: ~ 78 2200 2770 O.Ol! 0.008 0.002 0.007 0.092 4.40 0.013 0.0001
65 PS '75 ~00 5000 -- NA NA NA 0.020 6.60 11A NA
173 PS '75 3000 3880 0.050 ; NA NA NA 0.570 0.090 NA NA
335 PS '75 1700 3400 o. 730 NA NA NA 1.78 . 0.530 NA NA
582 PS '75 13750 7500 0.030 NA NA NA 0.150 0.010 NA NA
1078 t:SE '77 ,10500 10900 0.002 -- -- -- 0.277 0.010 0.001 0.0012
1076 PS '75 7000 IOOOO -- NA NA NA 0.530 0.030 NA NA
-- --·-- -----------------~A Nol Analyzed.
-- Hyphen denotes that parameter was analyzed for but was below detection li•it.
--------------------- ---------
Nickel Seleni ... Silver 111all it.. Zinc
---------------------0.018 0.039 0.001 -- 31.0
NA NA iiA iiA 41, I
NA NA NA NA NA
NA NA' NA NA NA
NA NA• NA NA 0.160
0.150 0,001 -- -- I. 17
NA NA NA NA 1.04

Table VII-32, \.bod l're.ervil'lf &ta.la Data, Orf,llnic ar'I Inorpranic PrC111m1tive1, l'rea!tc! Effluent for Plants with <hrrent Pretreatlllent Temnol(lzy In-Place
D11ta Fla, (f~~)
Effluent Waste Loafs (lb/ 11000 ft32 Plant Srurce {gixf) Ammie Antiilo11( Betyllillllll C!mi.UII Copper Chrcmitm Leal MmlJry rfi.cl<el Selel\ll.111 Siher 'lhalliun ifoc
65* ESE '78 2200 2770 0.00007 0,000'.)5 0,00001 0,000'.)5 0,00061 0,0291 O,O<XXJJ <0,00001 0,00012 0,00026 0,00001 <0,00001 0,205
65* PS '75 5000 5000 <0.00001 Ii\ Ii\ Ii\ 0,00017 0.0550t Ii\ NA NA N\ Ii\ Ii\ 0.0343t 173 PS '75 3000 3880 0,00032 M\ m m 0.00368 0.00058 Ii\ Ii\ NA N\ M\ Ii\ Ii\ 335* PS '75 1700 3400 0,0030!. Ii\ NA NA 0,00742 0.00221 Ii\ Ii\ NA N\ m. Ii\ Ii\ 582* PS '75 13750 7500 0,00046 m. N,\ M 0,00229 0,00015 tl\ NA NA m. Ii\ Ii\ 0.00245
1078* ESE 177 1050()/rlr IC,JOO 0,00002 <o.00001 <o.00001 <o.00001 0.00223 0.00003 0.00001 o. 0000! 0,00121 0.00001 <o .(){)001 <D ,00001 O.OllO 1078* PS '75 7000 10000 <0.00001 NA NA NA O.OODJ 0.00018 N.i\ N.,\ NA N\ NA. NI. 0.00607
Aver~e Waste Loais <o.00056 <0.00003 <0,00001 N
<o.00003 0.00278 0.005ll 0,00005 <o.00001 0.00067 0.00014 <0.00001 <0.00001 0.0561 I\) ~ * Plants used in calrulati~ treatal aver~es in Tli>le VII-46.
t Not included in 1111er~es becaise the process imolves direct netals contmri.nation of wastewater.
** Variations beb,/een tjle ra., an! treatal flew are due to flew equalization in the treatment systan. This does not alter the validity of waste loafs.
NA Not Anal}'2e<I.

Table VII-33. Wood Preserving Metals Data, Organic and Inorganic Preservatives, Treated Effluent for Plants.with Current BPT Technology In-Place
Plant
89i
Data Source
ESE '78
Flow (gpd)
66700
Prod. (ft3/day) Arsenic Antimony
18200 0.083
Effluent Concentrations (~/1) Beryllium Cadmium Copper Chranium Lead Herrury
0,005 0.058 0.031 0.009 0.0002
-- Hyphen denotes that parameter was analyzed for but was below detect ion limit.
N N U1
Nickel Selenium Sfl ver Thal Hum Zinc
0.011 O.lOO
,, 1_,1

N N O'I
Table VII-34, W:>od Preservi~ &blla DGta, Orpnic am Inoqm,nic Preeetvativet, Treated !flluent for Plants with <ht'rent JWr Tedtnolqty In-Place
Plant Dllta
Srurce Fla,
{gjxl)
897* ESE '78 66700
Aver~e Waste Loa:ls
(f,r~)
18200
Wute loo:la (lb/1,000 fr:3!
Anenic Antirori, Beiyllii. Caimim Q:pper <Jmriuin ~ Mmury
0 .0025 <D .00001 <D .00001 0,0001 0,0018 0,00005 0,0003 0,00001
0.0025 <0.000)1 <D,00001 0,0001 0.0018 0,00005 0.0003 0,00001
* Plant uSEd in calrulatll{! treate:I aver~s in Table VII-47.
Nicl<el SeleniLn Silwr Thallim Zinc
0.00034 <D.00001 <D.00001 <D.00001 0,00306
0 .00034 <0.00001 <D.00001 <D.00001 0.00306

Table VII-35. Wood Preserving . Traditional Data Averages for Plants With Leiss Than the Equivalent of BPT_ Technology. In""".Place
Waste Loads (lb/1,000 ft 3 )
COD Total·Phenols Oil & Grease -Raw* .92.8 1. 77 8.71
Treated** 31.2 1.01 l . 75
PCP
o·. 498
0. l 5 l
% Removal 66.4 42.9 79.9 69.7
* Averages calc11Jlated from data in Table Y-7.
** Averages calicL:t!~.:I:,~~ froin .dat:~ tn 'l;a,bl~ VJI-10_.
-~: 227

i Table VII-36. Woocf ... Preserving Traditional Data for Plants with ~retreatment Technology In-Place
Waste Loads { lb/1, 000 ft 3 )_
COD Total Phenols O & G
Raw*
Treated**
% Removal
80.7
41. 5
48.6
3. 11
2.03
34.7
' * Averages calculated from Tables V-7 and V-8~
** Averages calculated from Table VII-11.
7.82
0.908
88.4
PCP
<0.294
0.0716
<75.6
Table VII-37. Wood Preserving Traditional Data for Plants with BPT Technology Ip-Place
Raw*
Treated**
% Removal
COD
31. 3
6.00
80.8
Waste Loads {lb/1,000 ft3) Total Phenols O & G
2.41
0.0061
99.7
4.32
0.821
>81.0
* Averages calculated from Table V-7.
** Averages calculated from Table VII-13.
228
PCP
<0.268
0.0135
<95.0

Table VII-38. Wood Preserving Volatile Organic Analysis Data for Plants with BPT Technology In Place
-----------------------------------------------------------------. . . .
Waste·Load~(lb/10,000 ft 3 )
mecl trclme benzene etbenzene toluene ------------------------------- -----------------------------------Raw*
Treated**
% Removal
().0049 <0.0001
0.0043 <0.0002
12.2
%0.0200
<0.0003
>98.5
0. 101
<0.0001
>99.9
* Averages calculated from data in Table V-9.
0.0237
<0.0009
>96.2
** Averages calculated from data in Table VII-16. Volatile Organics Data Tables
mecl = mE~thylene chloride.
trclme = chloroform (trichloromethane)
brdiclme = brc,modichoromethane
etbenzene = ethylbenzene
229

Table VII-39. lobod Pres,ervit'{t Bss,e Neutrals Data, Aver~es for Plants with Olrrent Pretreatment Tedmology In-Pla,ce
l 2 .3 4 5 Waste Loals (lb/1,()QO ft3) 6 7 8 -9 10 11 12 13 14 15 16
Ra.wk <0.0057 <D~OOOl <D.0001 <D.00l3 <D.0001 <D.0001 <D.0001 0.0324 <D.0006 <D.0001 <D.0137 <D.0158 <D.0117 <D.OH6 <D.0003 <D.0062
Treatoot 0.0003 <o.0001 <0.0001 <0.0001 <o.()()i()l <0.0001 <0,0001 0.0000 <o.0001 <o.0001 <o.0072 <o.0000 <0,0010 <D.0003 <0.0001 <D.0010
% Raooval <94.7 97.4
*'Averages calrulatoo fran data in Table V-12.
t Averages calrulatoo fran data in Table VII-19.
N Key to Base Neutral Data Tables w 0
1. Fluoranthene 2. Benzo (B) Fluoranthene 3. Benzo (k) Fluoranthene 4. Pyrene 5 • Benzo (A) Pyrene 6 •. Indeno (1, 2, 3-CD) Pyrene 7. Benzo (f?hi) Petylene 8. lhenanthrene arr:J./or Anthracene
97.5 83.3 47.4 94.9 91.5 97.4 66.7 83.9
9. Bemo {a) Anthracene 10. Dibemo (a, h) Anthracene 11. Naphthalene 12. Acenaphthene 13. Acenaphthylene 14. Fluorene 15. Chtysene 16. Bis-2-ethyl-hexyl phthalate

N w .....
Table VII-40. W:xxi ~eserving Ba~ leutrals Iata, .lwerages fur Pl.ants with OJrrent BPI' Tuclm.ol~y lh-Pl.a:e
W:lste loals (lb/11 000 ft3) 1 2 3 4 5 6 7 8 9 10 11 12 13 14 15 16
Ra~ 0.0530 <0.0091 0.0127 0.0395 <0.0105 <0.0073 <0.0015 0.121 <0.0129 <0.0005 >0.186 0.~36 0.0049 0.0344 <0.0112 <O.OOCYl
Treatedt 0.0088 <0.'0014 <0.0015 0.0032 <0.0018 <0.0010 <0.0004 <0.0071 (0.0024 <0.0001 <0.0004 0.0022 <0.0002 <0.0015 <0.0015 <0.0001
% RemcNal 83.4 85.7 )69.7 9'3.0 83.9 89.6 78.9 )94.0 86.0 83.3 >99.8 95.3 >97.0 >95.9 83.1 fl,.]
'* .lwerages calculated fran data in Toble V-12.
t Averages calculated fran data in Toble VII-21.
Key to Base Neutral Data Tables
1. Ft oora:ithene 9. Benm (a) Antlra:ene 2. Benm (B) Ftooranthene 10. Di.hmm (a, h) Antlra:ene 3. Benm (k) Ftumnthene 11. Nlfhthalene 4. fyrene 12. kenBththene 5. Benm (A) Pyrene 13. .kenBththylene 6. Jndeno (1, 2, 3-CD) Pyrene 14. Ftoorene 7. Benm (ghi) Perylene 15. Cllrysene 8. lbena:ithrene arl/or /nthra:ene 16. Bis-2~thyl-lecyl fhthalate

Table VII-41. Wood Preserving Toxic Pollutant Phenols Data for Plants with Pretreatment Technology In-Plac~
Waste Loads (lb/1,000 ft3) phen 2-clph 2,4-dimeph 2,4,6-triclph
Raw* 0.0066 0.0001 0.0001
Treated** 0.0002 0.0001 0.0001
% Removal 97. 1
* Averages calculated from data in Table V-14.
** Averages calculated from data i'n Table VII-23.
Key to Toxic Pollutant Phenols Data Tables
phen
2-clphen
2,4-dimeph
2,4,6-triclph
PCP
= phenol
= 2-chlorophenol
= 2,4-dimethylphenol
= 2,4,6-trichlorophenol
= pentachlorophenol
232
0.0001
0.0001
PCP
0.419
0.0697
83.4

Table VII-42. Wood ·Preserving·Toxic Pollutant Phenols·Data For Plants With BPT T_echnology In-Place
Waste Loads (lb/1,000 ft3) _phen 2-clph 2,4-dimeph 2, 4, 6-:triclph _·
Raw* 0.352 DO. 0004 .. 0.0445 D0.0050
Treated** D0.0002 D0.0001 0.0010
% Removal· >99.9 75.0 >97.8
* Averages calculated from data in Table V-14.
** Averages calculated from d~ta in Table VI_I-24.
Key to Toxic fpllutant Phenols _Data Tables
phen
2-clph
2,4-dimeph
•= phenol
= 2-chlorophenol
== 2, 4-dimethylphenol
2,4,6-triclph = 2,4,6-trichlorophenol
.PCP == pentachlorophenol
233
0.0001
98.0
PCP
0.0736
_0.0135
97.6

Table VU·43. ¾xxl Preservi.~ M:?tals Data, Organic Preservatives Only, Avercges for Plants with Cl.trrent Pretreatment Technolqzy ItrPlace
Raw*
Treatei t
% Raooval
Waste Loa:1s (lb/ 1,000 ft3) Arsenic Antiroony Becyf liun Cadmi.un · Cq>per Chroniun Leal furrury Nickel Seleniun Siher Thalliun Zinc
0.00003 <0.00001 <o.00001 <0.00001 0.00137 0,00001 0.00000 <0.00001 0.00005 0.00001 <0.00001 0.00001 0.00313
0.00005 0.00002 <D.00001 <0.00001 O.OCXJJ7 0,00009 0,00002 <0.00001 0.0001 0.00005 <0.00001 0.00002 0.00099
29.2 75,0
* Averages calrulatei fran data in Table V-17.
t Averages calrulatei fran data in 'fable VII-26.
N (.,,) .i:-

Table VII-44. \obod Pre.sei:virg Metals Data, Organic Presei:vatives Only, Aver~s for Plants with Cltrrent BPr Technology In-Place
Waste Loa:ls (lb/l,_000 ft3) Arsenic Antimot!,7 Berylliun Coomiun Cq,per Chraniun Leai ~rrury Nickel Seleniun Silver Thalliun Zinc
Raw* 0.00014 0.00022 <0.0000! <o.0000! 0.00048 0.00012 0.00043 <0.00001 0.00010 0.00002 <0.00001 (0.00001 0.00163
TreatErlt \ 0.0003 (0.00000 <o.00001 <o.00002 0.00035 0.0001 <0.00021 (0.00001 0.0001 <0.00002 (0.00001 (0.00001 0.00096
% Reooval >63.6 27.1 16.7 )51.2 41.l
* Aver~es calrulatErl fran data in 'l'able V-17 •
. ; t Aver~es calrulatErl fran data in Table VII-28.

N w 0\
Table VII-45. t,bod Preservi.~ Metals Data, Organic an:i Inorganic PresetVatives, Aver~es for Plants With Less 'Ihan Current BPr Tedmolesy In-Place
Waste LoaJs (lb/1,000 £t3) Arsenic Aiit:uool!{ Berylliun Calmi.un Ccpper Chraniun
Raw* 0.000'+3 NA Ne\ Ne\
Treatmt 0.00044 NA Ne\ Ne\
% Raooval
* Aver~es calrulatoo fran data in Table V-19.
t Aver~s calrulate1 fran data in Table VII-30.
NA Not Analy:red.
0.00167 0.00053
0.00171 0.00056
Lea) Mero.iry Nickel Selenit.m Siher 'Ihalliun Zinc
NA Ne\ NA NA NA Ne\ NA
Ne\ NA NA NA NA Ne\ NA
-11

N w ...a
Table VII-46. Wood Presetving Metals Data, Organic and Inorganic Preservatives, Averages for Plants with Current Pretreatment Technology In-Place
Data Waste Loads (lb/1 000 ft3) Sources Arsenic Antimony Beryllium Cadmium Copper Chranium Leal Mercury
;Raw* <0.00030 <0.00005 <0.00001 <0.00002 0.0039 <0.00728 0.00003 (0.00001
Nickel
0.00062
Treated t <0.00060 <0.00003 <0.00001 <0.00003 0.00264 0.00634 0.00005 <0.00001 0.00067
% Removal 40.0· 32.3 (12.9
* Averages calculated from data in Table V-19.
t Averages calculated fran data in Table VII-32.
Selenium Silver Thallium Zinc
0.00019 0.00002 <0.00001 0.0601
0.00014 (0,00001 (0.00001 .. 0,0561
26.3 )50.0 6. 7 •

Table VII-47. llood Pre1ervini lletala Data, Organic and Inorganic Pre1ervativea, Averages for Plants vith Current flPT Technology In-Place
Data llaate Loads Clb/ 1,000 ft3) Sources Arsenic Antimony BerylliUIII CadmiUII Copper Chromium Lead Mercury Nickel Seleniu,111
Raw* 0.00253 <0.00001 <0.00001 0.00002 0.0015 0.00045 0,00031 0.00003 0.00194 <0.00001
N w 0)
Treated t 0.0025
% Removal 1.2
* Averages calculated from data in Table V-19.
t· Averages calculated from data in Table VII-34.
<0.00001 <0.00001 0.0001 0.0018 0,00095 0.0003 0.00001 0.00034 <0.00001
3.2 66.7 82.5
S1lver ThalliU111 Zinc
<0.00001 <0.00001 0,00233
<0.00001 <0.00001 0.00306

Direct Dischargers--Candidate tr·eatment technologies for direct dischargers are applicable only to· the Steam subcategory. Previously published BPT regulations require no discharge for the Boulton subcategory, and no Boulton ·direct dischargers were identified.
These direct discharge candidate technologies are presented primarily for information purposes, as only one direct discharging wood preserving-steam plant.was identified during the BAT review. This plant, Plant 268, discharges only during periods of heavy rainfall. The plant provides primary oil-water separation followed by chemical coagulation, sedimentation, and biological treatment, and is planning steps to eliminate the intermittent discharges of process wastewater from the plant.
Four basic treatment technologies are applicable to steaming direct dischargers:
l. BPT technology (primary oil-water separation, chemical coagulation and sedimentation or filtration, and biological treatment) treatment facilities;
2. B~T with increased biological treatment as above with the addition of activated carbon adsorption as a polishing treatment for the biological effluent; .
3. BPT with increased biological tre·atment as in ( l) above with metals removal by chromium reduction and hydroxide precipitation; and
4. BPT with increased biological treatment and metals removal_ as in_ (3) above with activated carbon adsorption as a polishing treatment for the biological effluent.
Increased biological treatment facilities can be achieved through one of two options. One option is to add an aerated lagoon followed by a facultative lagoon for additional treatment and clarification to . the ex1sting BPT biological_ system. The other option is to provide . an · activa.ted sludge system, including equalization and secondary clari{icatjon i~ addition to the BPT technology~
The effluent quality of each'·- option will be the same. The aerated lagoon option. is less costly than the activated sludge system; however, it requires more land.
The candidate treatment systems selected for direct dischargers in the steam subcategory including both biological treatment options for each of the four basic treatment technologies are:
239

l.
2.
3.
4.
5.
6.
Candidate Treatment Technology A which technology plus· an additional ·aerated lagoon system for increased biological shown in Figure VII-5.
represents BPT and facultative treatment, as
Candidate Treatment Technology B which represents BPT technology plus an additional .activated sludge system including equalization and clarification for increased biological treatment, as shown in Figure VII-6. Candidate Treatment Technology C which represents Technology A plus activated carbon adsorption, as shown in Figure VII-7. Candidate Treatment Technology D which represents Technology B plus activated carbon adsorption, as shown in Figure VII-8.
Candidate Technology VII-9.
Candidate Technology VII-10.
Treatment A plus
Treatment B plus
Technology E which represents metals removal, as shown in Figure
Technology F which represents metals.removal, as shown in Figure
7. Candidate Treatment Technology G which represents Technology E plus activated carbon adsorption, as shown in Figure VIl-11.
8. Candidate Treatment Technology H which. represents Technology F plus activated carbon adsorption, as shown in Figure VII-12.
The representative treated waste loads for Candidate Treatment Technologies A through H are presented i.n Table VI I-48. The waste loads for Technologies A and B were obtained from Table VII-13, with the exception of those for Oil and Grease. The Oil and Grease waste loads shown in Table VII-48 were obtained by averaging the Oil and Grease waste loads demonstrated by Plants 591 (ESE, 1977), 897 (:r:sE, 1978), and 1111 (PS, 1975) as shown in Table VII-13. Plants 548 (ESE, 1977 and 1978) and 591 (ESE, 1978) were not included in this average as both plants are self contained dischargers which either recycle a large portion of. their treated effluent or spray irrigate their treated effluent following treatment. Neither plant met the 30-day average BPT standard for oil and grease during the stated sampling period. There is no need for these plants to optimize Oil and Grease removal because their wastewater disposal systems are apparently operating satisfactorily. Plants 591 (ESE, 1977), 897 (ESE, 1978), and 1111 (PS, 1975) demonstrate that· the BPT Oil and Grease standards are achievable with a biological system.
Waste loads after carbon treatment are calculated based on the assumption that activated carbon will remove 80 percent of the COD, and 95 percent of total phenols including PCP. It should be noted that these reductions are assumptions supported only by
240

N ~ ....
RAW WASTEWATE R·-
~
i......
PUMP STATION
NEUTRALIZATION
NUTRIENT ADDITION -
MONITORING STATION.
WOOD PRESERVING - STEAM (DIRECT DISCHARGERS)
CAt~DIDATE TREATMEtn TECHNOLOGY MODEL PLANT A
OIL-WATER FLOCCULATION SEPARATION
AERATED LAGOON AERATED LAGOON
.,
SLOW SAND FILTRATION
FACULTATIVE LAGOON
SLUDGE DISPOSAL l (TRUCK HAUL)
DISCHARGE
PUMP STATION -
PUMP STATION -
Figure Vll-5

N ~ N
RAW WASTEWATE I I
R PUMP STATION j
.._ PUMP STATION
-
- DISCHARGE
WOO,D PRESERVl1NG • STEAM (DIRECT DISCHARGERS)
CANDIDATE TREATMENT TECHNOLOGY MODEL PLANT B '
OIL-WATER I " I
SEPARATION j FLOCCULATION i
NUTRIENT ADDITION-
NEUTRALIZATION TWO· STAGE
ACTIVATED SLUDGE
-- -- SLUDGE DISPOSAL I (TRUCK HAUL)
I SLOW SANO I I I FILTRATION EQUALIZATION t-
PUMP STATION MONITORING STATION -
··-
Figure Vll-6

I'\) .fo, w
.I
RAW WASTEWATE R-
L-..,
~
PUMP STATION
NEUTRALIZATION
NUTRIENT ADDITION -
PUMP STATION
WOOD PRESERVING • STEAM (DIRECT DISCHARGERS)
CANDIDATE TREATMENT TECHNOLOGY · iviODEL PLANT C
OIL-WATER FLOCCULATION SEPARATION
AERATED LAGOON AERATED LAGOON
-SLOW SAND, FILTRATION
FACULTATIVE LAGOON
SLUDGE DISPOSAL 1 (TRUCK HAUL)
MONITORING DISCHARGE STATION·
PUMP STATION -
ACTIVATED CARBON ADSORPTION -
FigureVll-7

N .,::. .,::.
RAW WASTEWAT :R-
I--.
~
PUMP STATION
PUMP STATION
MONITORING STATION
WOOD PRESERVIING • STEAM (DIRECT DISCHARGERS)
CANDIDATE TREATMENT TECHNOLOGY MODEL PLANT D
-
OIL-WATER FLOCCULATION SEPARATION
NUTRIENT ADDITION-
NEUTRALIZATION TWO· STAGE
ACTIVATED SLUDGE -
SLUDGE DISPOSAL t (TRUCK HAUL)
DISCHARGE
SLOW SAND EQUALIZATION -FILTRATION
ACTIVATED CARBON PUMP STATION ADSORPTION
...... -- - ·- -·· -
Figure Vll-8

N ~ U'I
RAW WASTEWATER-.
' METALS
1--+ REMOVAL
-
WOOD PRESERVING • STEAM (DIRECT DISCHARGERS· OILY WASTEWATER WITH FUGITIVE METALS)
PUMP STATION
FILTRATION
fACULTATIVE LAGOON
CANDIDATE TREATMENT TECHNOLOGY . MODEL PLANT E
H ADJUSTMENT WITH H, SQ •1-
OIL•WATER SLOW SAND FLOCCULATION - SEPARATION - FILTRATION
pH ADJUSTMENT WITH NaOH J
- PUMP STATION NEUTRALIZATION - AERATED LAGOON
NUTRIENT ADDITION •
-- PUMP STATION MONITORING -- DISCHARGE STATION
CHROME - a--, REDUCTION
AERATED LAGOON ,.....
Figure Vll-9

I',) .i:,. a,
WOOD PRESERVltNG - STEAM (DIRECT DISCHARGERS· OILY WASTEWATER WITH FUGITIVE METALS)
RAW WASTEWATER-,,. PUMP STATION
' METALS - FILTRATION
REMOVAL
y . POMP STATION
I
CANDIDATE TREATMENT TECHNOLOGY MODEL PLANT F
I I
pH ADJUSTMENT WITH H,S1
_ I I i OIL-WATER ,J FLOCCULATION ( SLOW SAND I - CHRQM1E I-' SEPARATION FILTRATION REDUCTION I
•:
pH ADJUSTMENT WITH NaOH J NUTRIENT ADDITION -
EQUALIZATION PUMP STATION - NEUTRALIZATION - TWO - STAGE ,__ - - ACTIVATED SLUDGE ~
SLUDGE DISPOSAL I (TRUCK HAUL) f
--'" MONITORING DISCHARGE STATION
Figure Vll-10

RAW WASTEWATER~
1-.) .i:,,. .....
FILTRATION ~
L...+
WOOD PRESERVING • STEAM (DIRECT DISCHARGERS- OILY WASTEWATER WITH FUGITIVE METALS)
CANDIDATE TREATMENTTECHNOLOGY iViODEL PLANT G
pH ADJUSTMENT WITH H.., SO. ,, '
OIL-WATER SLOW SAND - CHROME PUMP STATION - - FLOCCULATION - SEPARATION FILTRATION REDUCTION
METALS REMOVAL
- pH ADJUSTMENT WITH NaOH J ..
. NUffllEm ADDITION -
PUMP Sl"ATION NEUTRALIZATION ~
AERATED LAGOON AERATED LAGOON . FACULTA TIVE . - LAGOON
SLUDGE DISPOSAL i (TRUCK HAUL)
ACTIVATED CARBON . PUMP Sl"ATION C MONITORING f-il, DISCHARGE ADSORPTION STATION
.__
.....
Figure Vll-11
II

I\) .J:>, CX>
RAW WASTEWATER-+
FILTRATION 1---+
L_.
WOOD PRESERVIIN1G • STEAM (DIRECT DISCHARGERS - OILY WASTEWATER WITH FUGITIVE METALS)
CANDIDATE TREATMENT TECHNOLOGY MODEL PLANT H
pH ADJUSTMENT WITH H2 S041
! -PUMP STATION - OIL-WATER FLOCCULATION SLOW SAND CHROME - SEPARATION - FILTRATION REDUCTION -
METALS -REMOVAL pH ADJUSTMENT WITH NaOH _j
-
EQUALIZATION PUMP STATION - NEUTRALIZATION - TWO· STAGE . ACTIVATED CARBON - - -ACTIVATED SLUDGE ADSORPTION ..
NUTRIENT ADDITION • l SLUDGE DISPOSAL (TRUCK HAUL)
PUMP STATION MONITORING DISCHARGE STATION -
Figure VI 1-12

Table VII-48. Production for Dischargers)
Treated Effluent Loads in lb/l,000 ·candidate · Treatment · Technologies
Pollutant Parameter A or B.
COD 6.0
Oil· & Grease O. 25
Total Phenols (). 666'1
PCP 0.014
VOA' s · See Table VII-38
Base Neutrals See Table __ VII-40 .
Toxic See Table Pollutant VII-42 · · Phenols
Heavy Metals. See ·Tahfe VII-44
·· and VII-47
... Candidate Technology . C or D* E or F . ·
1.2
0.25
Q,0003
0.0007
6.0
99+% removal (except. methylene chloride)
. _0.25.
0.0061
0.014
See Table VI I-38
99+% removal
99+% removal
See Table VII"'-44 .
an4 VII"'-47
See Table VII-40
See Ta.ble VI .. I--42. ·
About. 75% _removal, coppe,r, chrome, · zinc, and al;:'.sen,ic*
ft3 of. (Direct
G.or H*
1. 2 7.i-
0. 25
0.0003
0.0007
99+%·removal (except methylene chloride)
99+% removal
99+\. removal
76-98% removal of.copper, chrome; zinc, and arsenic
* Expected treated effluent loads based on literature presented earlier in thiE; section •.
249

literature data and have not been demonstrated in the industry as there are no similar systems currently in-place.
Waste loads after metals removal are calculated based on the removals reported in the literature, as described earlier in this section. They have not been demonstrated in the industry as there are no systems currently in-place.
Direct discharging steaming plants may also achieve no discharge status through the self contained Candidat~ Treatment Technology N, which consists of spray evaporation and is discussed under self contained dischargers later in this section.
The costs associated with the single direct discharging wood preserving plant identified earlier to install the candidate treatment technologies are presented in Appendix A.
Indirect Dischargers--Candidate treatment technologies applicable to indirect dischargers are applicable to both Boulton and Stearn subcategory plants.
Three basic treatment technologies are applicable to the indirect dischargers:
1. Pretreatment technology (primary oil separation followed by chemical flocculation and slow sand filtration).
2. Pretreatment technology with the addition of biological treatment facilities sufficient to meet BPT standards.
3. Pretreatment technology with biological treatment facilities as above with the addition of heavy metals removal by chromium reduction and hydroxide precipitation. '
Biological treatment can be achieved through one of two options. One option consists of an aerated lagoon followed by a facultative lagoon for additional biological treatment and clarification. The other option consists of a single basin activated sludge system inGluding equalization and clarification.
The effluent quality of ~ach option aerated lagoon option is less costly than system; however, it requires more land.
will the
be the same. The activated sludge
The candidate treatment systems selected for indirect dischargers are:
1. Candidate Treatment Technology I which represents pretreatment technology, as shown in Figure VII-13.
2. Candidate Treatment Technology J which represents pretreatment technology plus an aerated lagoon followed
250

by a facul tati ve . lagoon for biological treatment, as shown in Figur~ VII-14.
3. Candidate _Treatment Technology K which represents pretreatment technology plus an activated·sludge system including equalization and clarification, as shown in Figure VII-15.
4.
5.
Candidate Treatment Technology J plus VII-16.
Candidate Technology VII-17.
Treatment K plus
Technology L which represents metals. removal, as shown in Figure
Technology M which represents metals removal, as shown in Figure
The representative treated waste.loads for Candidate Treatment Technologies I through Mare presented in Table VII-49. Treated waste loads presented for Oil and Grease, copper, chromium, and arsenic fc,r treatment technology I are based on pretreatment standards and average wastewater flows presented in Section V. Treated waste loads for the biological systems presented in this table are based on BPT standards. The design and cost estimates, presented in Appendix A, for the indirect discbarger biological systems are based on minimum biological treatment required to provide a BPT effluent quality .. Cost estima,tes are not. presented in Appendix A·for pretreatment technology (Technology I) because no incremental costs of compliance will accrue for the indirect dischargers since they are currently required· to meet effluent levels based on this technolo·gy. Expected treated effluent waste loads of o. qs .... ~.!=>/.1, o.oo: .. cu: .. J:t .. for .PCP for biol<:>gical treatment systems are based on an estimate of PCP removal for plants with sufficient biological treatment to meet mihimum BPT standard~··for regulated parameters. Table VII-10 shows that .the average PCP waste load for plants with biological systems insufficient to meet BPT is 0.119 lb/1,000 cu ft. Table VII~l3 shows that the average PCP waste load.for plants which exceed BrT standards is 0.0135 lb/ 1,000- cu ft.
251

I\)
~
WOOD PRESERVIING • STEAM, BOULTON {IINDl1RECT DISCHARG,ERS • 01,LY WASTEWATER WITH FUGmVE M1ETALS)
CANDIDATE TREATMENT TECHNOLOGY MODEL PLANT I
RAW WASIEWATER • I PIJNP STATION • l I Ol1L•WATER ~ARATION
DISCHARGE -
)I FLOCCULATION
..
SLOW SAND FILTRATION
I
-
Figure Vll-13

I'\).
0, w
RAW WASTEWAT ER,-
L-..+
-
,, PUMP STATION
NEUTRALIZATION
NUTRIENT ADDITION -
DISCHARGE
WOOD PRESERVING· STEAM, BOULTON (INDIR.ECT DISCHARGERS)
CANDIDATE TREATMENT TECHNOLOGY MODEL PLANT J
OIL-WATER FLOCCULATION SEPARATION,
'
AERATED LAGOON FACULTATIVE
LAGOON
SLUDGE DISPOSAL J (TRUCK HAULI
SLOW SAND FILTRATION
PUMP STATION 1--
'
PUMP STATION MONITORING
STATION I--
Figure Vll-14

N U1 .p,
RAW WASTEWATE R
-
~
I I PUMP STATION j
PUMP STATION
DISCHARGE
WOO,D PRESERVl'NG • STEAM, B,OULT01N (INDIRECT DISCHARGERS)
CANDIDATE TREATMENT TECHNOLOGY MODEL PLANT K
I I OIL-WATER j FLOCCULATION i SEPARATION
NUTRIENT ADDITION -
NEUTRALIZATION ONE· STAGE
ACTIVATED SLUDGE
SLUDGE DISPOSAL 1 (TRUCK HAUL)
I I I I SLOW SAND
EQUALIZATION I-FILTRATION
PUMP STATION MONITORING STATION
~
Figure Vll-15

N 01 01
RAW WASTEWATER...,..
' METALS
--* REMOVAL
-
WQOD PRESERVING - STEAM , BOULTON (INDIRECT DISCHARGERS - OILY WASTEWATER WITH FUGITIVE METALS)
PUMP STATION
FILTRATION
,.
PUMP STATION
CANDIDATE TREATMENT TECHNOLOGY MODEL PLANT L
pH ADJUSTMENT WITH H, SQ 1-
OIL-WATER SLOW SAND ~ CHROME ..,__ - FLOCCULATION SEPARATION -. FILTRATION REDUCTION
pH ADJUSTMENT WITH NaOH _j
- AERATED LAGOON - FACULTATIVE -, PUMP STATION NEUTRALIZATION - LAGOON
NUTRIENT ADDITION SLUDGE DISPOSAL ! (TRUCK HAUL)
MONITORING - DISCHARGE STATION
-,
Figure Vll-16

N 1.11
°'
RAW WASTEWATER
I
METALS ~
REMOVAL
I....,+
WO,QD PRESERVIHG • STEAM, BOULTO,N (INDIRECT DISCHARGERS· OILY WASTEWATER WITH FUGITIVE METALS)
PUMP STATION
I
FILTRATION
PUMP STATION
CANDIDATE TREATMENT TECHNOLOGY MODEL PLANT M
- OIL-WATER - FLOCCULATION
pH ADJUSTMENT WITH H, Sl J I !J FILT~ATtOtJ
CHROM1E ~ - SEPARATION REDUCTION
pH ADJUSTMENT WITH NaOH _j NUTRIENT ADDITION-
- PUMP STATION NEUTRALIZATION ONE· STAGE -EQUALIZATION ACTIVATED SWDGE
SLUDGE DISPOSAL ! (TRUCK HAUL)
- MONITORING DISCHARGE ·~ STATION
Figure Vll-17

Table VII-49.. Treated Effluent Loads in lb/1,000 ft3 of Production fen: Candidate Treatment Technologies--Wood Preserving (Indir~ct Dischargers}
'' -------------·-·----------------,~-~-----------------------------------~-Pollutant Parameter I
Candidate Technology J or K L or M ----------~--·-.·-----·--------~--~-------·---.~: __ ~ _______ ;... ________________ _
·- ' J
COD 41.5 34.5 34.5
Oil & Grease 0.93 0.75* 0.75*
Total Phenols 2.0 0.04 0.04
PCP 0.07 0.05* 0.05*
VOAs See Table See Table See Table VII-15. VII..,38 VII-38
Base Neutrals See Table · See Table See Table ViI-39 VlI-4.0 VII--40
Toxic Pollutant See Table See Table See Table Phenols VII-41 v11..:42 VII-42
Heavy Metals ·· 0.05 (cu} See Table 75 percen't 0.04 (er) VII-44 removal, copper, O. 04 {as} and VII-47 chrome, zinc,
See Table ·and arsenic* VII-43 and VII-46
-------------·-~----------------.-------------------------~-----..:-~------*Expected treiated effluent loads based on literature presented earlier in.this section.
257.

Waste loads after metals removal are·calculated based on the removals reported in the literature discussed earlier in this section. They have not been demonstrated in the industry because there are no systems currently in-place.
Indirect discharging Boulton and steaming plants may also achieve no discharge status through the self contained Candidate Treatment Technology N, which. consists of cooling tower evaporation for Boulton plants and spray evaporation for steaming plants. Both of these technologies are di.scussed below.
The costs technologies pretreatment A.
associated with all the candidate treatment applicable to indirect : dischargers, except
technology (Technology I}, are presented in 'Appendix
Self Contained Dischargers-One primary technology applicable to Boulton plants will enable those plants to achieve no discharge status. Candidate Treatment Technology N for Boulton plants consists of primary oil separation, chemical flocculation, and slow sand filtration followed by cooling tower evaporation. This technology is shown in Figure VII-18.
One primary technology applicable to steaming plants will enable them to achieve no discharge status. Candidate Treatment Technology N for st.earning plants consists of primary oil separation, chemical flocculation, and slow sand filtration followed by spray evaporation. This technology is shown in Figure VII-19. Spray evaporation technology can also be used by Boulton plants if the land is available for this system.
Costs for both the abc,ve technologies are presented in Appendix A.
Other Applicable Technologies--Candidate Treatment Technology 0 represents conversion from open to closed steaming. This is applicable to those open steaming plants wishing to reduce the flow of wastewater generated at their plants, and thus reduce the total cost and land requirements of subsequent treatment. Cost estimates for Technology Oare presented in Appendix A. The plant-by-plant cost estimates presented i~ Appendix A were based upon the actual amount of wastewater generated by each plant and do not include the cc,st of Technology O, with the exception of one plant which is clearly identified in Table A-14. For this open steaming plant, wastewater generation was high enough that it was more cost-effective to convert to closed steaming prior to applying other treatment options.
Candidate Technology P entails collection and recycle of rainwater and cylinder drippings from inorganic salts plants. All plants in the Wood Preserving-Water Borne or Nonpressure subcategory are already required to achieve no discharge status.
258

N u, \0
RAW WASTEWATER • PUMP STATION
WOOD PRESERVING • BOULTON ( SELF CONTAINED)
CANDIDATE TREATMENT TECHNOLOGY "10DEl PLANT N
OIL •WATER FLOCCULATION SEPARATION
RECIRCULATING COOLING TOWER EVAPORATION PUMP
Sae Tables A-2 and A-3 for cost summaries·
SLOW SAND FILTRATION
Figure Vll-18

N O'l 0
RAW WASTEWATER - PUMP STATION
WOO,D PR:ESERVl,NG • STEAM (SELF CONTAINED)
CANDIDATE TREATMENT TECHNOLOGY MODEL PLANT N
OIL-WATER FLOCCULATION
SEPARATION
"
-I PUMP STATION ~ SPRAY EVAPORATION I
See Tables A-4 and A-5 for cost summaries
SLOW SAND FILTRATION
Figure Vll-19

New Source Performance Standards--Candidate Technology N for both Boulton and steaming pl.ants can be applied to new sources. New sources have the ability to choose plant locations based on the availability of sufficient land for this option, as well as other potential no. discharge options such as soil irrigation; and non-oil preservative carri_er P.rocesses.
INSULATION BOJ~O AND WET PROCESS HARDBOARD
In-Plant Control Measures
The production of either insulation board or hardboard requires extensive amounts of process water which ultimately becomes contaminated with dissolved and suspended substances through contact with the wood and additives used·as raw material. In the past, most plants used large amounts of fresh water to produce fiberboard products in what was essentially a once through process. ThE~ exclusive use of fresh water in the refining, washing, diluting, and forming of fiberboard results in only one opportunity fc,r dissolved and suspended sol ids to be retained in the product, and leads to· an extensive pollution problem because of the volumes of wastewater generated and the large, costly. endof-pipe treatment facilities required.
More recent practices used by most plants include the use of recycled process whitewater in place of fresh water at various points in th,:? system. Process water can be reused for stock dilution, shower water, and pump seal water. The use of recycled process whitE:?water provides the opportunity for increased retention of 4ls~olv~4. on4. ~uspended solids in the product, results in decreased fresh water consumption, and· decr~ased wastewater volume.
By closing the process whitewater system in a fiberboard plant, it is possiblE:? to reduce the mass discharge of suspended solids in the raw waste load. As a first approximation, the total mass discharge of suspended solids· is roughly proportional to the volume of wastiewater generated (Gran, 1972).
The mass discharge of BOD in the raw waste load, on the other hand, is less influenced by a moderate close up of the process whitewater system. Dissolved solids (which exert BOD) increase in the whitewater system during recycle.
Operating data are available from Plant 929, an S1S hardboard plant, which demonstrates the effect of p~ocess water system close up on BOD loads. Plant 929 began an extensive program to close its whitewater system in March 1976. The wastewater flow from the plant was reduced in steps from an average of 750,000 1/day (200,000 gpd) in March 1976, to 18·,925 1/day (5,000 gpd) in June 1977. The corresponding BOD loads were reduced from 2,710 kg/ day (6,000 lb/day) to 340 kg/day (750 lb/day). Figure VII-20 illustrates the relationship between BOD load and discharge volume for the plant during the close up period. The most
261

C ->, 0 as
N m ,:, -O'I I- :9
N z w -::, >,
as ..I ,:, I.I. -I.I. Q w !Ii::
11eoo,(&oo0)
13200(600,0)
11000(5000)
8800(4000)
6600(3000)
4400)2000)
2200(1000)
0
DEC •
•
•ocr.
P'LANT929
FLOW VS. EFFLUENT BOD
.00038(.10) .00076(.20)
FLOW Kl/day(mgd)
DATA ARE FROM MARCH, 1976 TO FEBRUARY 1977. Figure Vll-20

dramatic reduction in BOD load occurred in October 1976, when the plant achieved a reduction in flow of about 85 percent.
The ability of an insulation poard or hardboard plant to close up its process whitewater system is highly dependent upon the type
·of board products produced and the raw materials used. The increased dissolved solids retained in the board tend to migrate to the board surface during drying and/or pressing, increasing the risk of s.pot formation on the board sheets and sticking in the press.
Decreased pa.intability,. darker and inconsistent board color, surface defects, increased water absorption, and decreased dimensional stability are all quality problems which have been associated with the increased dissolved solids in the whitewater system as a . result of cl.ose up ( Coda, 1978}. Some board products, particularly structural grade insulation boards and industrial grade hardboards, can. tolerate.a degree of quality deterioration~ Excessive degradation of board quality cannot be tolerated in decorative type insulation board, finished hardboard paneling, or certain types of. exterior hardboard siding.
Other probl.E!ms associated with a high degree of process whitewater recycle are corrosion of pumps, plumbing, and equipment frc>m the lowered pH of recycled whitewater; plugging of shower spraye; and decreased freeness (drainage} of stock because of solids bui.ld up; and an elevation of temperature in the process wh i tE!wa ter system. ·
Raw materials are an important factor in the ability of a mill to close up. Furnish must be free of bark. Coda (1978) reports that a maximum of 1.5 percent bark can be tolerated by Plant 929, which has nearly reached completely closed status.. · Whole tree chips and c>ther. types of furnish which would increas.e the dissolved solids load cannot be tolerated in a completely closed system. Moisture content of furnish is also an important factor. One thermomE~c:hanical _ refining insulation board plant (Plant 2), which had achieved complete close up, ~ttributed·the availability· of low moisture plywood and furniture trim furnish. as a major reason for the success of its close up program. Plant 2 is no longer operating because of a management decision not related to pollution. ·
In order tc::> achieve maximum closure, a plant must be willing to invest consid,erable capital and be prepared to accept decreased production during the period of time that optimum plant operating conditions are ·being developed. The primary_benefit to a plant which succeeds in closing its process whitewater. system is effective pollution control without reliance on expensive end~ofpipe treatment.
Some of the, measures which can be used to achieve close up or maximum recycle of the process whitewater system are as follows:
263 ·-'

1. Elimination of extraneous wastewater sources. Pump seal water can be reduced or eliminated by the use of recycled whitewater or by conversion to mechanically sealed pumps where possible. Chip wash water can be reduced by recycle following screening and sedimentation of grit. Housekeeping water use should be kept to an absolute minimum. High pressure sprays and/or dry cleaning methods should be used where possible.
2. Provision of sufficient whitewater equalization. Sufficient equalization capacity for control and containment of whitewater surges should be provided. Several plants employ large outdoor surge ponds for this' purpose. Surge ponds also serve to control whitewater temperature. Several plants use heat exchangers for temperature control and provide sufficient capacity for plant start-up and shut-down.
3. The installation of tyclones following the refiner. This allows the fiber to be blown into the cyclones for steam release and cooling. No water should be added _to these cyclones. The added wate~ condenses the steam which causes higher whitewater temperatures and an additional source of water to" the system.
! 4. Clarification of whitewater. Several plants use
gravity clarifiers to remove grit and settleable solids from the whitewater system. To use forming water for showers or pump seal water, it is necessary to remove the majority of fiber. Screens or f.ilters are available for this purpose, and in·some cases a "saveall" installation may be appropriate. Save-alls are used extensively in the pulp and paper industry. They can result in fiber concentrations of less than 0.20 pound per 1,000 gallons of water, which makes the water suitable for showers and pump seals. This type of device can also dramatically reduce the suspended solids leaving the mill in the raw effluent. The hardboard process can use either a flotation-type saveall or a drum-type unit. Fiber from the save-all can be returned to the process.
5. Extraction of concentrated wastewater. The soluble sugars and other dissolved materials released into the process whitewater during refining can be extracted by efficient countercurrent washing of the stock or by using a dewatering press. The concentrated whitewater can then be evaporated for recovery of an animal feed byproduct. Use of this process allows greater recycle of the remaining whitewater, which is primarily leaner machine whitewater. Plants 673, 678 and 943 currently use stock washers to extract concentrated whitewater for subsequent evaporation to animal feed. Plant 933 has successfully demonstrated the capability of a
264,

dewatering press for the same purpose on one of its production lines. This plant was able to completely clof:H~ the remaining process whi t.'ewater system fol lowing the press. Successful application of this extraction process depends on the use of an evaporator on the conc,entrated . whitewater, otherwise the plant has succeeded only in concentrating its wastewater, which may have adverse. effects· on subsequent· biological' treatment. The high capital expense of such systems must be at least partially amortized by byproduct salies. The economics of ·applying this system will vary from plant to plqnt, and must be evaluated on an individual basis. Some considerations wilL be: amount of material available for recovery; energy costs for wasbewater evaporation; proximity to market; and.market pricie.
6. Corrosion control. The corrosiveness -0f. the recycled process whitewater can be controlled with addition of. caustic soda, lime, or other basic chemicals. Most plants practice chemical pH control to some extent. Corrosion-resistant pumps~ piping,· and tanks can be used to replace· corroded equipment, or for new construction.
7. Control of press sticking. Press sticking can be mitigated by washing the surface of the press plates or cauis ·more· frequently, or by using .release agents. Lowering the· temperature of the hot press may also be eff,ective.
Two thermomethanical refining insulation board plants have achieved complete close up .of pro.cess. wh_i tewater systems. Both plants produce structural grade board only; Plant 186 uses a sav~ all device to clarify the whitewater for further reuse. Plant- 2 used external surge ponds fot whitewater equalization and· temperature control, as well as a gravity clarifier for solids control. As previously discussed, Plant 2, which is now shut down, used locally available low moisture plywood trim as furnish which helped. to maintain the water balance in· the mill. Both plants indicated that extensive process experimentation and modification, during a period of one to .two years., was required . before the board quality/technical problems associated with· the close up were resolved.
Plant 929, as previously discussed, has approached full close up. Major modifications made at this plant included:
l. Installa"tion of cyclones following· the refiner to allow process steam to escape.
2. Increased whitewater equalization.
265

3 .. Replacement of fresh water packing seals on primary grinders with steam, and replacement of pumps requiring fresh sealing water with mechanically sealed pumps.
This plant produces primarily industrial grade hardboard and has experienced some quality control problems as well as a loss in production capacity compared to its previous operations.
I
Another method of close up used by three plants is the recycle of treated effluent from external biological treatment systems for use as process water in the plant. Plant 919 has achieved a complete close up in this· manner. Plant 537 recycles approximately 85 percent of its treated effluent, discharging the remaining 15 percent. Plant 36 recycles 28 percent of its effluent discharging the remaining 72 percent.
Although this approach may eliminate some of the problems associated with close up, such as temperature and corrosiveness of the recycled water, the problems of board quality and process control remain. The characteristics of high color and the secondary treatment solids in the recycled water also pose problems with using this method.
A review of potential in-plant process modifications for both insulation board and hardboard plants indicates that some reductions in raw waste loading can be accomplished. Specific recommendations for in-plant modifications o_n a plant-to-plant basis require a detailed working knowledge of each plant.
End-of-Pipe Treatment
Screening--Screens are used by many fiberboard plants to. remove bark, wood chips, and foreign materials from the wastewater prior to further treatment. Screening equipment may consist of mechanically cleaned bar screens, vibrating screens, or sidehill screens. Screening serves to reduce wear and tear on processing equipment, and also to separate extraneous material from the wood fiber which is returned to'the plant after primary settling in most insulation board plants.
Primary Settling--Most insulation board plants and many ha~dboard plants use gravity-type primary settling facilities to remove a major portion of the wood fibers from the raw wastewater. Primary sludge may be returned to the process for reuse, or it may be thickened and/or dewatered and disposed to a landfill. Common sludge handling devices include ,gravity thickeners and mechanical dewatering equipment.
Settling ponds are the most common primary settling facilities used in the industry; however, several plants are equipped with mechanical clarifiers. Suspended solids removals in primary settling facilities range from about 65 to 80 percent. Data from one plant demonstrated that 10 to 15 percent BOD removal was being achieved by the primary settling facility. One plant
266

achieved 24 percent BOD removal in a mechanical primary settl'ing tank through the use of polymers as a coagulant.
Biological Treatment--Wastewater generated by the insulation board and we!t process hardboard subcategories is amenable to biological tre!atment. A discussion .of this subject is presented in Appendix E:.
All direct discharging plants in the insulation board and wet process hardboard subcategories of the industry apply varying 9egrees of biological treatment to - their wastewaters. The contaminants i.n the wastewaters from the two subcategories are comprised mcd.nly of soluble oxygen-demanding material leached from the wood. These materials. (wc,od sugars, hemicellulose, lignins, etc:.} are readily biodegradable. The suspended solids in th~ raw Wctstewaters are primarily wood fibers, bark particles, and small ctmounts of grit, that easily settle in primary sedimentation basins or aerated lagoons. Because of the large raw wastewate!r flows and high· concentrations of BOD and TSS, as described in Section V, the biological treatment systems required to treat thE!Se wastewaters must be of considerable size to be effettive~. Most plants in both subcategories of the industry have allocated .considerable sums of _money to construct and operate these! __ treatment systems.
·,.,,'
The biologica1 systems in the insulation board and wet process hardboard subcategories vary from- single aerated .. lagoons, usually followed by facultative oxidation ponds for increased solids and BOD removal, to complex contact stabilization activated sludge systems. ·
Spray Irrigaj:ion-.,..Spray irr,igation - is a viable alternative for treatment and ultimate-disposal of wastewaters generated by. the insulation board -and wet process hardboard subcategories. The feasibility c>f spray irrigation is a function of hyc:iraulic and BOD loadings ·on a per unit area basis. Allowable hydraulic and BOD loadings can vary considerably from site to -site depending on vegetation and soil conditions, and should be determined. through site specific studies. Once the allowable BOD loading has been determined, the application of biological treatment to the wastewater fc>r _ BOD reduction prior to spray irrigation may be considered as an alternative to an increase in spray field area.
There are two in~ulatlon board plant~, Pl~nt~ 889 and 186~ which spray irrigate their wastewaters .. Plant 889 applies biological treatment, ccmsisting of an aerated - lagoon followed . by a clarifier, prior to spray irrigation, and thereby achieves a nondischarge status. Philipp (1971) reported on the land disposal of insulation board wastewater at Plant 186. Following in-plant. filtE~ring for fiber recovery, the wastewater was pumped to a 0.4 ha settling pond and then to two holding ponds, the first having~ volume of about 100,000 cum and the second 0Lout
1 378,500 cu m. All wastewater was retained from late October through April. During the period May to October, the effluent
267

from the second holding pond was pumped to the 40.5 ha spray field.
The spray field was located on a sand of high permeability and with a depth of 2 to 4 m. A test underdrainage system was installed at a depth of 1.5 m for the purpose of collecting and testing effluent percolating into the surface aquif~r from the spray field. The entire area was originally cleared and then seeded with Reed Canary grass.
The discharge from the insulation board plant averaged 22 1/sec with a BOD concentration prior to spray irrigation of 1,150 mg/1.
Although Philipp provided no da.ta, he stated that the efficiency of the system for removing BOD, as measured from the influent to the field to the effluent of the underdrainage system, was in excess of 99 percent.
There are three hardboard plants, Plants 943, 979, and 673, which also use spray irrigation for wastewater treatment and ultimate disposal. Plant 673 applies biological treatment,consisting of an aerated lagoon system, prior to spray irrigation, whereas Plants 943 and 979 do not. Plant 673 normally spray irrigates only during dry periods and discharges directly to surface waters during wet periods when spray irrigation is not practicable. At Plant 943 an underdrainage system collects. all wastewater which filters down from the spray field and directs it to two holding ponds prior to discharge to surface waters. Plant 979 achieves a nondischarge status using spray irrigation.
Other Applicable Technologies-Insulation Board and Wet Process Hardboard- Several additional treatment technologies were evaluated to determine their feasibility as candidate treatment technologies for BAT, NSPS, and pretreatment standards. The technologies evaluated for insulation board and wet process hardboard included:
Chemically Assisted Coagulation Granular Media Filtration Activated Carbon Adsorption
A discussion of each of these. technologies and case studies of their application to the insulation board and wet process hardboard industries are presented in Appendix F, DISCUSSION OF POTENTIALLY APPLICABLE TECHNOLOGIES.
None of these were identified as candidate technologies because they are experimental in nature and further research is necessary to sufficiently determine the effectiveness of· treatment which could be expected if these technologies were to be applied to insulation board and hardboard wastewaters.
268

In-Place .Technology and Treated Effluent Data, Insulation Board
Plant 36 pr1oduces structural and decorative insulation board. The plant ha:s reduced its raw waste flow-from 13,250 kl/day (3.5 MGD) to. less than 5,678 kl/day (1.5 MGD) by modification of the pulping process, reuse of process-water, and recycle of treated effluent. The wastewater is screened for removal. of gross· solids. The wastewater. then goes to· two :parallel primary clarifiers followed by an activated sludge system~ Discharge from the biological system is either recycled to the plant or discharged to a creek.
-In 1976, sludge resulting from primary clarification and·a portion of the waste sludge from secondary clarification was. gravity thickened, vacuum fil.tered, and reused in the process. In 1977, only sludge resulting from primary clariif teat ion was recycled. Ten percent of the primary sludge plus waste secondary sludge was thickened, vacuum filtered, and sold as a soil conditioner. In 19771 the ad4ition of polymer in the secondary clarifier was initiated which improved the solids removal. ·Effluent BOD and TSS are presented in Table VII-50.
. -
Plant 725 produces ceiling tiles and panels;. sheathing,: and mineral wool fiber insulation board_. Process water from. the insulation boarq plant receives primary sedimentation. Primary' sludge is returned to;the process. The wastewater is then either reused in the insulation bqard process for stock dilu'tion and shower water, or used as makeup water for the mineral wool fiber plant. The raw wastewc:1ter from the miner::al wool .plant enters the treatment system, which consists of a primary clarifier, an aerated lagoon, and a secondary - clarifier. Sludge from the primary and secondary clarifier is dewatered, either in a settling pond or by a vacuum filter, and hauled to a disposal site. Approximately 1,514 · I/min (400 gpm), of the treated wastewater from the secondary clarifier is discharged to a POTW, ,while approximately 757 1/min ( 200 gpm) is recycled to a freshwater tank for use as makeup water in both. the insulation and mineral w9ol tiber plants.
-
Plant 978 has no treatment or pretreatment facilities. Excess process wastewater, ·combined with pump seal water· and sanitary wastewater, is discharged directly to a POTW. Plant personnel indicated in communications that suspended solids removal equipment. is being considered to reduce current loads to the· POTW.
. '
Plant 360 produces structural and decorative insulation board. The plant collects its process wastewater in a whitewater storage tank, recycles a portion of the whitewater.where needed, and
:sends the remaining portion to the treatment system which consists of an equalization tank, a floe-clarifier, and an aerated lagoon. Polymer addition in the clarifier is used to aid settling. Fiber recovered in the clarifier is recycled to the process. A portion of the clarifier overflow_ is recycled to the
269

Table VII-50. Insulation Board M:chanical Refining, '!teated Efflten~ Otaracteristics*
Plmt Nurber
360t
36
889
Production ~day (TPD)
201
006 600 603
246
(220)
(668) (661) (665)
(270)
Flow kl/Kkg (kgal/ton)
2.%
8.18 8.47 7.38
1.02
(0.,71)
(1.%) (2.03) (1. 77)
(0.24)
00D kg/Kkg . (lbs/ton)
1.05
0.28 0.28 0.28
0.07
(2.10)
(0.56) (0.56) (0.56)
(0.14)
TSS l@'Kkg (lbs/ton)
1.15
2.64 1.46 2.11
0.16
(2.30)
(5.29) (2.91) (4.22)
(0.32)
* First row of data represents 1976 average a:mual daily data; secoad row represents 1977 average a:mual data; third row represents average ainual daily data :fur two-year p:iriod of 1976 a:td 1977 except as noted.
t Indirect discharger.
270

process and the remaining wastewater enters the aerated lagoon, where it is retained about 30 days before discharge to a POTW. The treated waste loads for this plant are presented in Table VII-50.
Plant 889 is a self contained discharger and uses treated wastewater to spray irrigate a 2.3-hectare (5.6-acre) field. Whitewater enters the treatment system at two points: an aerated lagoon· and an evaporation pond. Water from the evaporation pond is routed to the aera.ted lagoon. From the· aerated· lagoon, the wastewater is sent.· to a primary clarifier, where polymer and alum are added to assist in settling and pH adjustment. The supernatant from the clarifier i.s directed to a holding pond. Sl~dge ftbm the clarifier is thickened in a flotation unit and hauled daily .to a cinder dump. Water separated from the sludge enters the holding pond of the spray irrigation sy,5tem. Effluent waste loads applied to: the spray fi.eld determined from data supplied by the plant .are presented i.n Table VI I-50.
Plant 537 produces structural .and decorative insulation board. Its process wastewater (combined with vacuum seal· water, treated septic tank effluent, and stormwater runoff) is routed to a primary clarifier. Sludge drawn from the primary clarifier is recycled to the manufacturing process. Overflow from the clarifie; goes to an a~rated lagoon. Secondary clarification follows, and the waste -econdary sludge is recycled to the process. - ThE~ treated effluent is collected in a sump for reuse in the process. The excess treated effluent is discharged to receiving waters. The discharged waste loads are presented in Table VI I-51 ..
Plant l 08 prc>duces approximately 55 percent insulation board and 45 percent hardboard. The plant has upgraded its wastewater treatment system by installing an oxygen-activated sludge system. Excess whitewater passes through a hydrasieve for removal of gross· solids.. After screening, the wastewater flows to a sump where nutrients are added. From the sump, the wastewater is pumped to a four-cell aeration basin. The aeration basin effluent flows to a clarifier where wastewater generated by paper production is iritroduced and the clarifier effluent is discharged to the receiving waters. Sludge r~mov.ed in . the c.larifier is vacuum filtered and d1sp6sed of in a landfill.
In 1976, tlH:! wastewater treatment system was the same as that described above, except that a rotating biological surface (RBS) system followed screening instead of an oxygen activated sludge system.
Plant l 035 prc:>duces approximately 70 percent insulation board and 30 percent S2S hardboard. The plant has a waste stream which consists of raw process wastewater, and another waste stream which consists of lower strength miscellaneous wastewaters. The raw process W«:istewater is screened for removal of gross sol ids by a bar screen. The screened wastewater flows to a clarifier.
271
··~

Table VII-51. Insulation Board Thennomechanical Refining, Treated Effluent Characteristics*
Plant Production Flow BOD TSS Number Kkg/day (TPD) kl/Kkg (kgal/ton) kg/Kkg (lbs/ton) kg/Kkg (lbs /ton)
537 139 (153) 1.88 (0.45) 2.03 (4.06) 1.71 (3.42) 145 (160) 1. 75 (0.419) 2.18 (4.36) 1.27 (2.54) 145 (159)t 1.69 (0.406) 2.07 (4.14)t 1.31 (2.62)t
108** 605 ( 665)t t 51.3 (12.3) 4.06 (8.12) 12.3 (24.5) -- -- -- -- -- --
570 (628 )t t 22.6 ( 5.41)*** 2.06 (4.13)*** 2.24 ( 4.47)***
1035 359 (395)** 21.9 (5.26) 2.15 (4.31) 0.94 ( 1.88) -- -- -- -- -- -- -- ---- -- -- -- -- -- -- --N
-...i N
* First row of data represents 1976 average anrual daily data; secom row represents 19 77 aver~e anrual daily data; third row represents average anrual daily data for two-year period of 19 76 and 19 77 except as noted. .
-
t Data represent period of 1/1/76 through 3/31/79.
** Data are taken before paper wastewater is added.
tt Includes both insulation board and hardboard production.
*** Data represent period of 9/21/79 through 4/30/80 when oxygen activated sludge sys tan was in operation.

Sludge removi~d from the clarifier flows to a hydrasieve for screening. Screened solids are recycl~d to the process and the wastewater is returned to the clarifier. The clarifier effluent flows successively to two 1.5' ac~e.settling ponds .(in series), a 60~acre settling pond, a 4-acre aeration lagoon, a 2~acre aeration lagoon, and to a 1-acre aeration lagoon. Part of the effluent from the 1-acre aeration lagoon flows to. a 135-acre. oxidation pond, where the lower strength miscellaneous wastewater stream enters the treatment system. The remaining .effluent from. the 1-acre aeration lagoon flows to a 165-acre ·oxidation pond. The effluent from both oxidation ponds is .discharged to,,,.-the receiving waters. The treated effluent waste loads are presented in Table VI I·;...51 .
Piant 186, which produces decorative and miner~! wool insulation board, is a self contained discharger with spray irrigation as the ul timat,e means of wastewater disposal. The process wastewater from.the plant enters a series of three settling ponds with a total· capacity of 587 million liters (155 million gallons). The ponds retain the wastewater up to a period of six months, after which it is sprayed onto a 30-hectare ( 80-acr.e) field of Reed Canary grass. ~he spray irrigation system operate~ 180 days per year· at a rate of 6,435 kl/day ( 1 . 7 MGD) !
Plant 2, which is now closed~ produced structural instilation board. Process.whitewater was completely recycled.
Plant 502 has no wastewater treatment facilities. Wastewater from the thermomechanical pulping and refining of insulation board is collected in a whitewater chest. A portion is recycled to the process.and the remaining wastewater is discharged to a POTW." No monitoring practices for flow or. other parameters exist ..
Plant 183 uses thermomechanical pulping and refining structural and decorative insulation board. wastewater is screened for removal of·gros~ solids collected and is .. either recycled to the process
to produce The process
prior to being or dischar,ged
with no further treatment to a POTW.
Plant 184 produces stru~tural insulation bojid. There are no wastewater treatment facilities, .as no process wastewater is discharged. All process whitewater is recirculated to a sump. Sump waters a.re screened, stored in a clarified whitewater chest, and recycled to the process.
Raw and treated effluent loads of total phenols for four insulation board plants are presented in Table VII-52. Raw and treated efflU1ent loads of heavy-metals for four insulation board plants are presented in Table VII-53. ·
"""'·"
Raw and treated waste concentrations for organic toxic pollutants for the insU1lation board plants that were sampled during the 1978 verification sampling program are presented in Table VII-54.
273

N ...... ~
- - --····
Table VII-52. Raw and Treated Effluent Loads and Percent Reduction for Total Phenols-Insulation Board*
Plant Raw Waste Loadt Treated Waste Loadt Code kg/Kkg (lb/ton) kg/Kkg ( lb/ton) i. Reduction
36 0. 00095 (0.0019) 0.00010 (0. 00021) 89 0.007 (0. 014) 0.00012 (0.00025) 98
183 0.0024 (0.0048) 0.009 (0. 018)
360 0.00040 (0.00079) 0.00008 (0.00015) 81
537 0.0022 (0. 0045) 0.00014 (0.00029) 94 0.0055 (0. 011) 0.00065 (0.0013) 88
* First row of data represents data for 1977; second row of data represents ·data for 1978.
t Total J)henols concentration data obtained during 1977 and 1978 verification sampling programs. Average annual daily waste flow and production data supplied by plants in response to data collection portfolio were used to calculate waste loads.

Table YU-53, Raw and Treated Effluent Loadings and Percent Reduction ,,for tnsulat ion: Board Metals
Plant Ho. Be Cd Cu Pb Ni Zn Sb As Se Ag Tl Cr Hg
360 Raw Waste Load (kg/Kkg) .0000042' ,0000028 .0019 ,000006 ,0008 ,003 ,0000021 ,000013 .000014 ,0000021 .0000028 ,000006 .000028
(lb/ton) (.0000083) (.0000056) (.0037) (,000011) (.0016) (.005 (.0000042) ·(,000025) (.000027) (.0000042) ( ,0.000056) (.000011) (.0000042) Treated Waste Load (kg/Kkg) .0000021 ,0000035 ,0009 :000006 ,0006 ,0014 .000018 .000006 ,000007 ,000002I .000008 ,000022 ,00000042
(lb/ton) ( ,0000042) ( ,0000069) (.0018) (.000011) (.ODIi) (.0028) (,000035) ( ,000011) ( ,000013) (.0000042) ( ,000015) ( ,000044) (.00000083) % Reduction 49% +23% 51% 0% 31% 44% +733% 56% 52% 0% +167% .+300% 80%
183 Raw Waste Load (kg/Kkg) ,000007 ,000008 ,0023 .00017 ,00085 ,0042 .000025 ,000027 ,000035 .0000049 .0000041 .00006 .000041
(lb/ton) (.000014) (.000016) (,0046) ( ,00034) (.0017) (.0084) (.000049) ( .000054) (.00007) (.0000098) ( ,0000082) ' (.00012) ( .000082) Treated Waste Load (kg/Kkg) .000012 ,000013 ,0020 ,00021 .,0009 ,0480 ,000021 ,000013 .000025 .000017 ,0000041 .00020 ,00013
(.lb/ton) ( .000024) (,000026) (.0040) (.00041) (.0018) (.0095) (.000042) (.000026) ( ,000049) (,000033) <.0000082) (,00040) (.00026)
N % Reduction +71% +62% 13% +20% 5% +13% 14% 52% 30% +236% 0% +233% +21%
...... 537 u,
, Raw Waste Load (kg/Kkg) ,00001 .00001 ,000041 .000027 ,00025 ,005 ,000014 ,00006 ,00007 ,00001 .000017 ,00047 ,000021 (lb/ton) '(.00002) (.00002) ( ,000062) (.000053) (.00049) (,01) ( ,000027) ( ,00012) (.00014) ( .00002) <.000933) (,00094) (.000041)
Treated Waste Load (kg/Kkg) .000001 .000001 ,00018 ,0000038 .000013 ,00017 ,0000028 .000006 ,0000044 ,0000013 ,0000013 ,000006 •. 0000019 (lb/ton) (.0000019) (.0000019) ( ,00035) (.0000075) (.000026) ( .00033) ( .0000056) (,000012) (.0000087) (,0000025) ( ,0000025) <.000011) ( .0000038)
% Reduction 90% 90% +326% 85% 94% 96%, 79% 90% 93% 88% 92% 98% 91%
36 Raw Waste Load (kg/Kkg) ,0000055 .0000055 ,0036 .000055 ,0009 ,006 ,000022 .000017 ,000035 .000005 ,0000065 ,00012 ,00008
(lb/ton) (.000011) (.000011) (.0072) . (.00011) (.00018) (.012) (,000044) (,000034) (,00007) <.000011) (.000013) C..00023) (.00016) Treated Waste Load (kg/Kkg) .000006 ,000006 .0012 ,000008 .000037 ,0008 ,000048 ,00002 ,000032 .000007 .000008 ,00009 ,0000007
(lb/ton) ( ,000011) (,000011) (,0023) (,000016) (,000074) (.0016) (,000095) (,00004) (.000063) ( ,000013) ( ,000016) ( ,00017) ( ,0000013) % Reduction 0% 0% 68% 65% 58% 86% +115% +17% 10% +18% +23% 26% 99%
Source: 1977 Verifica.tion Sampling Program.

Only extremely· low concentrations of chloroform, benzene, toluene, and phenol ,were found in the raw wastewaters of the three insulation board plants·sampled. Chloroform, benzene, and toluene most likely originated in industrial solvents, and phenol is an expected byproduct of hydrolysis reactions which occur during refining of the wood furnish. The l~vels of the heavy metals and organic toxic pollutants which were found in the raw wastewaters are so low that no specific technology exists to reduce or remove these pollutants from the wastewater matrix. Biological treatment is effective in reducing most raw heavy metals concentrations as shown in Table VII-53, and in removing all of the few organic toxic pollutants present in the raw wastewater as shown in Table VII-54.
Table VII-54. Insulation Board, Organic Toxic Pollutant Data
---------------------------------------------+--------------------
Pollutant
Chloroform
Benzene
Toluene
Phenol
Average Concentration {ug/1}
Raw Wastewater Plant 183 Plant 36+ Plant 537
20
70
60
40**
40**
40
Treated Effluent Plant 36 Plant 537*
* One of three treated effluent sample contained 40 ug/1 of trichlorofluoromethane.
+ One sample of raw wastewater contained 20 ug/1 of chloroform. Plant intake water contained 10 ug/1 of chloroform.
** Plant intake water contained 50 ug/1 and 30 ug/1 of benzene and toluene, respectively.
Hyphen denotes that the pollutant was not found in . concentrations above the detection limit for 1the compound.
In-Place Technology and Treated Effluent Data, Wet Process Hardboard
Plant 678 produces approximately 90 percent SlS hardboard and approximately 10 percent S2S hardboard for such. uses as paneling, doorskins, siding and concrete formboard. Process wastewaters are collected in a sewer. Cooling water, pump seal water, boiler blowdown, surface runoff, and condensate from the distillation
276

process are ce>mbined in a separate storm sewer. After screening, primary clarification, and flow eq~~lization of each waste stream, the two streams are· combined prior to biological treatment. Solids removed during screening are landfilled. Solids from. primary clarifiication are either landfilled or dewatered and burned in mill boilers. After the two waste streams are ce>mbined, they are routed to a biological system consisting of two.contact stabilization activated sludge systems operating in parallel, followed·by two secondary clarifiers. The activated sludge from the secondary clarifiers is pumped to two stabilization basins,· reaerated for sludge stabilization; and returned to the contact basins. Waste sludg~ is either recycled to the production units or landfilled.
After secondary clarification the wastewater is routed to an aerated lagocm and is discharged after approximately six days detention time to impoundment ponds. A portion of the. lagoon effluent is reused as log flume make-up water. Treated effluent is dischargE~d from the holdi:ng ponds to a creek. Effluent waste loads are presented in Table vrr~ss. · Plant 673, which produces approiimately ··equal amounts of S1S and S2S hardboard, collects all process wastewaters and directs the flow in one c>f two streams to the wastewater treatment faci11 ty ~The two streams are designated as strong and weak. The stron~ wastewater stream (which contains condensate from the evaporation of process whitewater · for animal feed) enter.s two activated. siudge units operating in parallel. Waste sludge is aerobically digested and.pumped to two humus ponds. Water decanted from the humus ponds .enters· the weak wastewater system.· After clarification,, the strong wastewater is combined with the weak wastewater and enters the weak treatment system. The weak system consists of an aerated lagoon, an oxidation and settling pond, and two storage ponds. The wastewater is subsequently routed to either spray irrigation or discharge, depending on the season of the year. B~~tween October 1 and May 14, the effluent from the treatment. facility is usually recycled to th~ process or discharged tc, the river. From May 15·throughSeptember 30, the mill direct!; the. treated effluent to a number of storc:3;ge ponds. The stored. treated effluent is· either discharged to spray irrigation f;i.elds o.r recycled to the manufacturing process. During 1976, because of drought conditions~ the plant was not. allowed to discharge to the river for the major part of the year, and effluent was discharged to the irrigation field. Effluent waste loads are presented in Table vrr~ss. Plant 3 produces SJS hardboard which is used for exterior siding. The process water is first screened to remove gross se>lids which are landfilli=-d. The wastewater then enters two settling ponds used alternati=-ly. Sludge from these ponds is dredged as required and landfilli=-d! The wastewater flows· to the two-stage biological treatment system,· consisting .of an aerated lagoon and a secondary clarifier. The practice of recycling a portion of the waste sludge from the secondary clarifier is under evaluation.
277

N ...... (X)
Table VII-55. S1S Hardboard, Treated Effluent Characteristics (Annual Averages)*
Plant
348
3
931
919tt
673
678
929
207
Production kkg/day (TPDJ
88.7 (97 .5)
194 (213) 194 (213) 194 (213)
117 (129) 115 (127) 119 (131)**
91.9 (101) -- --- -343 (377)
1446 (1589)
111 (122) 111 (122)
83.2 (91. 7) 79.7 (87.8) 81.5 (89.8)
Flow kl/kkg (kgal/ton)
46.6
7.38 9.35 8.22
8.84 8.14
13.26
4.16
9.40
4.24 0.62
17.3 13.9 15.1
(ll.2)t
(1. 78) (2.24) (1. 97)
(2.12) (1. 95) (3.18)**
(1.00)
(2.26)
(1.02) (0.15)
(4.14) (3.32) (3.62)
BOD kg/kkg (lbs/ton)
9.00 (18.0)t
5.05 (10.1) 9.35 (18.7) 7.20 (14.4)
6.85 (13.7) 0. 74 (1.49) 0.92 (1.84)**
0.13 (0.26)
0.97 (1.93)
18.5 (36.9) 5.10 (IO. 2)
4. 71 (9.42) 4.31 (8.62) 4.46 (8.91)
TSS kg/kkg (lbs/ton)
17.1 (34.l)t
4.05 (8.10) 8.50 (17.0) 6.10 (12.2)
10.1 (20.2) 2.52 (5. 03) 3.01 (6.02)**
0.12 (0. 24)
1.14 (2.27)
1. 59 (3.18) 0.59 (1.1,7)
11.1 (22.2) 9.85 (19.7) i0.4 (20.8)
* First row of data represents 1976 average annual daily data; second row represents 1977 average annual daily data; third row represents average annual daily data for two-year period of 1976 and 1977; except as noted.
t Hardboard and paper waste streams are comingled. . ** Data represent period of 10/1/76 through 10/31/79 when upgraded system was in normal operation. tt All of treated effluent is recycled.

Overflow from the clarifier enters a second stage aerated lagoon. Treated effluent from this lagoon is currently discharged to the river. Effluemt waste loads are presented in_ Table yrI-55.
Plant 348 produces SlS hardboard and specialty paper products. The wastewaters from the two processes are comingled with cooling waters and discharged to the treatment system. The plant has completed modifications to eliminate the discharge of cooling water to the·process wastewater treatment system. The treatment system consists of two primary settling ponds, which can operate either in series or parallel, an aerated lagoon, and a. secondary settling pomL The primary settling ponds are decanted and the sludge is pumped to a drying area a~d. landfilled. Secondary sludge is pumped and landfilled. Effluent waste loads are presented in '!'able VI I-55.
Plant 207 produces SlS hardboard. The cooling water is discharged directly to the river. All excess plant whitewater is processed through the treatment facility. The wastewater is first s·creeneid for removal of gross solids, the solids are returned to the process ..
The wastewater then enters a primary settling pond, where it is retained for five days before entering the biological treatment system. Nutrients are added prior to an aerated lagoon. After a twenty-two-day retention period in the aerated lagoon, the wastewater enters a secondary settling pond and is discharged to the river. Sludge from the settlin,g ponds and aerated lagoon is dredged as neicessary and landfilhtd.. Treated waste loads are presented in Table VI I-55 .•
Plarit 931, which prod~ces S1S hardboard, significantly expanded its biological. treatment system during 1976 and began· normal operation in.October, 1976. The treatment system consi~ts of two pair of aera1ted lagoons ( in . series), each pair operating in pa·rallel. Ealch of the aerated lagoons in the first pair has a capacity of 15 million liters (4 million gallons) and the capacity of each lagoon in the second pair is 5.7 million liters ( 1 . 5 mi 11 iorL gallons). Nutrients. are added to the lagoons. The effluent from the second pair of aerated lagoons flows to one or more of thrE~e 4. 9-mi 11 ion-1 iter ( 1 . 3-mi 11 ion-gallon) settling ponds which operate in parallel.· The number of settling ponds used depends on the settleabililty of the suspended solids which, in turn, is: a function of the water temperature. During the winter months, all three ponds are placed in operation. Cooling water is combi.ned with the effluent from the settling ponds prior to discharge to the receiving waters. Effluent waste loads are presented in Table VII-55.
> -""-- -
Plant 919 prc>duces Sl S hardboard for use in siding apd indµstrial furniture. 'l~he plant also operates a veneer pJant. Process waters from the hardboard· and veneer plant are comingledand directed to the treatment ~acility, which consists of.twoprimary settling ponds. in series followed by an activated sludge system~
279

Detention time in the primary settling ponds is approximately nine days. Solids are removed annually by decanting the basins. Nutrients are added as the wastewater enters the activated sludge system, consisting of an aeration basin and a secondary clarifier. Sludge is recycled from the clarifier to the aeration basin at approximately 568 1/min (150 gpm). Waste sludge enters a small aerobic digester and is pumped:to an irrigation field. After biological treatment the treated wastewater flows into two storage basins and is recycled to the manufacturing process. Plant production data are presented in Table VII-55; no treated effluent data were available for this plant.
Plant 929 produces SlS hardboard. The treatment system consists of two settling ·ponds in series. Process wastewater is collected in a sump and directed to the ponds with a theoretical retention time of 10 days before discharge to receiving waters. The treated effluent waste loads are presented in Table VII-55. As previously discussed in the section concerning in-plant controls, Plant 929 has approached complete close up of its process whitewater system, achieving a daily wastewater flow of less than 18,925 1/day (5,000 gpd).
Plant 933, which produces SlS hardboard, cqllects all process wastewater in a system of channels, gravity sewers, and force mains. The wastewater flows into a colleqtion and equalization tank and is pumped to a lime neutralization tank, then to a POTW.
Plant 980, which produces S2S hardbo~rd, collects all plant wastewaters into one sewer prior to any treatment. The treatment system consists of a primary aerated equalization pond (Kinecs Air Pond), two-stage biological treatment, and secondary storage and/or settling. Wastewater is retained in the Kinecs Air Pond for approximately 2.5 days. The primary function of this system is flow and biological equalization, as no BOD or TSS reduction is achieved. After nutrient addition and pH adjustment, wastewater enters the first stage of biological treatment, which consists of two Infilco Aero Accelators. Each Aero Accelator has an aeration compartment and a clarification zone. Biological solids from the clarifier zone are recycled to the aeration compartment. Waste sludge is detained in a surge tank and spray irrigated .. The wastewater is rquted from the Accelators to the secondary stage of biological treatment consisting of two aerated lagoons in series. The retention time in both lagoons is approximately 2.5 days. After final biological tre~tment, the wastewater flows into one of two 22.7 million-liter (6 million-gallon}' facultative lagoons. The lagoons are used alternately to minimize the effects of any thermal inversions. Solids are removed from each basin during the periods it is not in use. Treated effluent is discharged to the river. The effluent waste loads are presented in Table VII-56. Effluent TSS waste loads are not reported for periods, including the period prior to June 16, 1977 when a nonstandard method of TSS analysis was being used.
280

Table VII-56. S2S Hardboard, Treated Effluent Characteristics (Annual Averages)*
Plant Production · Flow BOD TSS 1't •• _,.. __
kkg/day (T'On\ kl/kkg (1,,ga1 ,;.,.,..... \ kg/kkg 71J...,/t-nn\ kg/kkg . Ubs/ton) 1.'1UlllUCJ.. . '.L.L U,I ""n. .L/ '-,'-'LA.,/ , ... ..,...,,, .... _ .. ·"
980 210 (231) 18.3 (4.39) 4.44 (8.88) 216 (238) 20.5 (4.92) 2.86 (5.73) 4.68 (9.35) 213 (235)t 18.9 (4.52)t 3.61 (7 .22)t 214 (236)** 18.9 (4.53)** -- -- 5.00 (10.0)**
1035 359 (395)tt 21.9 (5.26) 2.15 (4.31) 0.94 (1.88) -- -- -- -- -- -- ---- -- -- -- -- -- -- --
N 108 605 (665)tt 51.3 (12.3) 4.06 (8.12) 12.3 (24.5) 00 ..... -- -- -- --570 (628)tt 22·.6 (5 .41)*** ' 2.06 (4 .13)*** 2.24 (4.47)***
1 311 · (343) 25.8 (6.18) 20.8 (41S) ', 43.8 (87.6) -- -- -- -- -- ---- -- --
* First row of data represents 1976 average annual daily data; second row represents 1977 average annual daj.ly data; third row represents average. annual daily data for two-year period of 1976 and 1977; except as noted.
t Data represent period of 1/1/76 through 2/29/80. ** Data represent period of 6/16/.77 through 2/29/80 when standard TSS analyses were perfoI'llled .
. tt Includes both insulation board and hardboard production. ***Data represent period of 9/21/79through 4/30/80 when oxygen activated sludge system was in operation.
Plant 1035 produces thermomechanically pulped and refined insulation board and S2S hardboard. The hardboard is primarily used for exterior siding. Approximately 70 percent of the production is insulation board and fiberboard and 30 percent is hardboard. The wastewater from the insulation and hardboard product lines is collected in a sump, screened, and directed to a primary clarifier. Clarifier underflow is recycled to the process. The solids are pumped over a Bauer hydrosieve, recovered, and recycled to the process. Water may bypass the clarifier and flow directly to settling basins. Water then flows to a 24.3-hectare (60-acre) holding pond, used for flow equalization, and subsequently discharges to a series of four aerated lagoons. The discharge from the fourth aerated lagoon is split between two oxidation ponds. Effluent from the two oxidation ponds is comingled and discharged to the river. The treated effluent waste loads are presented in Table VII-56.
Plant 108 and its wastewater treatment system are described earlier in the discussion of the insulation board plants. Treated effluent waste loads for this treatment system are presented in Table VII-56.
Plant 1 produces approximately 20 percent SlS hardboard and approximately 80 percent S2S hardboard, which is used in tile board, furniture, and merchandising display panels. Wastewater is pumped to an effluent holding tank and then to a primary clarifier with a detention time of three hours. Sludge, consisting mainly of wood fiber, is continuously removed from the clarifier, dewatered, and either. burned in a power boiler or landfilled. The water removed from the sludge is recycled back to the primary clarifier. Clarified effluent flows to the secondary treatment system consisting of a settling pond and two aerated lagoons in series. Primary treated effluent· is held one day in the settling pond and then flows to the first aerated lagoon, where nutrients are added. Average theoretical detention in each basin is 17 days. The first basin was designed to maintain the totally mixed system. The water flows by gravity to the second aerated lagoon, the second half of which is a quiescent zone to allow the biological solids to settle. Treated effluent is discharged from the second aerated lagoon to receiving waters. The treated effluent waste loads are presented in Table VII-56.
A dissolved air flotation system is currently under construction at Plant 1. ·
Plant 979 produces approximately 40 percent S2S hardboard and 60 percent thermomechanically pulped and refined insulation board. The hardboard is used for paneling or cabinets. The insulation board is used for ceiling tiles or sheathing. Plant effluent, after screening to remove gross solids, enters a three-day detention holding pond. The wastewater then flows to two settling ponds operating in parallel. After settling, the water enters a storage pond. Discharge from the storage pond is pumped
282

to irrigation fields. quality.
This plant does not monitor wastewater
Plant 977 produces S2S hardboard,· thermomechanically ·pulped and refined insulation board, and mineral wool fiber. Approximately equal amounts <)f insulation board and hardboard are produced in one manufactur:Lng facility, and mineral wool fiber is produced at a· separate manufacturing facility. Wastewaters from the mineral wool fiber plant are discharged to two settling ·ponds operating in parallel. The hardboard and insulation.board wastewaters are combined with the settling pond effluent and discharged to a POTW.
Plant 943 produces S2S hardboard for use in building siding and thermomechanically pulped and refined insulation bqard. The plant uses a combination of biological and physical wastewater treatment. All wastewaters other than groundwoodwhitewater are discharged tc) a sump. The groundwood whitewater is directed either to a wc)<:>d mo lass.es plant or to a primary · clarifier. Sludge from the clarifier is recycled to the plant, and the overflow wasti~water is directed to the holding tank.. The effluent from the holding tank is spray irrigated. Underdrainage from the spray irrigation field is collected and discharged to t:.he river.
Raw and treab~d effluent loads of . total. phenols for seven hardboard plants are presented in:Table v11..:57. Raw and treated effluent loads of heavy metals for six hardboard plants are presented in Table VII-58.
Table VII-59 preserits the raw and treated waste concentrations of organic toxic pollutants for two SlS hardboard plants which were sampled durini;i the 1978 verification sampling program. Extremely low concentration$ of chloroform, benzene, ethylbenzene, toluene, and phenol were found in the raw wastes. of the· S1S .hardboard plants. All, of these pollutants, with the exception of phenol, most. likely originated in industrial solvents or as a result of the chlorination of incoming process water. Phenol is an expected byproduct.of hydrolysis reactions which occur during refining of the wood furnish. The levels of tne heavy metals and organic toxic pollutants which were found in the raw wastewaters are so low that no specific technology exists, ottier than biological treatment, to remove these pollutants from the ~astewater matrix.
The intake water for Plant 207 contained 10 ug/1 of toluene. This concentration is the analytical detection limit for this compound and, available data on potable water sources demonstrate that few surface waters are entirely free of trace organic contaminants ..
Table VII-60 presents the organic toxic pollutant concentrations of the raw and treated· wastes for the three S2S hardboard plants that were saJ\llpled during the.1978 verification sampling program.
283

N 00 ,Pa
Table VII-57. Raw and Treated Effluent Loads and Percent Reduction for Total Fhenols-Hardboard*
Plant Code
207
673
678
931
933
979
1
Raw Waste Loadt kg/Kkg (lb/ton)
0.005 0.0010
0.01
0.003
0.055 0.031
0.0015
0.10
(0. Ol) (0.021)
(O. 02)
(0.006)
(0.11) (0. 062)
(0. 003)
(0. 21)
Treated Waste Loadt kg/Kkg (lb/ton)
o. 00030 0.00020
0.00015
0.00046. 0.065
0.003
0.0028
0.0005** 0.00095
(0.00059) (0.00040)
(0.0003)
(0.00092) (0.13)
(0.006)
(0.0055)
(0.001)** (0.0019)
% Reduction
94 98
98
99 +110
+83
99
* First row of data represents data for 1977; second row of data represents data· for 1978.
t Total phenols concentration data obtained during 1977 and 1978 verification sampling programs. Average annual daily waste flow and production data supplied by plants in response to data collection portfolio were used to calculate waste loads.
** Data are 1976 historical data supplied by plant in response to data collection portfolio.

Table VU-58. Raw and Treat~d Effluent Loadings and Percent Reduction f?r Hardboard Metals
Plant No. Be - Cd Cu Pb Ni Zn :sb As Se Ag Tl Cr Hg
931 Raw Waste Load (kg/Kkg) .000006 .00029 .0039 .00006 .0024 ,009 .0002 .000012 .000018 .000006 .000013 .00029 ,000018
( lb/ton) (.000012) ( .00057) · (.0078) (.00012) (.0047) (.017) (.00003) (.000023) (.000035) C.000012) (.000026) (.00058) (.000035)
Treated Waste Load (kg/Kkg) .0000045 .0000045 .0014·; ,00002 .0002 .0025 .0000085 .00002 · .000006 .0000005 ,000007 .000006 .000018 ( lb/ton) (.000009) ( .000009) ( .0028) ( ,00004) ( ,0004) (.0049) (. 00017) (.00004) ( .000012) ( ,000001) (.000014) ( ,00011) (.000035)
% Reduct ion 25% 98% 64% 67% 92% '72% 96% +73% increase 33% 92% 46% 98% 0%
980 Raw Wa~oad (kg/Kkg) ,000013 .00006 .014 ,00012 ,0018 .0048 .00008 ,000026 ,00002 ,00018 ,000013 ,00019 ,0000013
( lb/to ) ( .000025) (.000012) (.027) (.00024) ( ,0035) (.0096) (,00015) {,000051) ( .00004) (,00035) (.000025) (.00037) ( ,0000025) Treated W te Load (kg/Kkg) ,000009 .000037 ,009 ,000037 ,00033) ,0008) • 000009 ,000024 .000019 ,000085 ,000013 ,000043 ,000037
(lb/ton) {,000018) ( ,000074) (.017) ( ,000074) ( ,00066) C.0016) (,000018) ( ,000048) ( .000037) (.00017) ( ,000025) (.000085) (.000074) % Reduct ion 31% _ 38% 36% 69% 82% 83% 89% 8% 8% 53% 0% 77% +283% increase
678 R~w Waste Load (kg/KkllJ) .000008' ,000007 ,00044 ,0008 .0008 , ,003 ,00008 , 000016 .00005 ,000007 ,000013 ,0001 ,0000027
(lb/ton) C.000016) (,000013) (.00088) (.0015) ' !:~~~~~; (.005) , (.00015) ( ,000032) ( .0001) (,000013) (. 000026) (.0019) , (.0000053) Treated Waste Load (kg/Kkg) .0000028 ,000008 ,000017 ,000033 ,00026 ,0001 ,000007 I .00002 ,0000033 : ,0000023 ,000024 ,0000011
(lb/ton) ·(.0000056) (,000016) (.00033) ( ,000065) C.000047) (.00052) :'.< ,000020) ( .000014) ( .000039) (.0000066) (.0000045) (.000047) ( ,0000022)
N % Reduct ion 65% +14% increase 96% 96% 97% 91% 87% 56% , 60% 53% 82% 76% 59%
00 933 u, Raw Waste Load (kg/Kkg) .000005 ,000005 .0011 .00002 .00006 ',024 .000024 • 000014 .000024 .000005 .000005 .00009 .000011
(lb/ton) ( ,00001) ( .0001) (.0021) (.00004) (,00012) (.048) ( ,000048) (.000027) ( .000048) ( ,00001) (,00001) ( .00017) {,00002!) Treated Waste Load (kg/Kkg)
(lb/ton) % Reduction
207 Raw Waste Load (kg/Kkg) .000009 ,000009 .009 ,000035 .00006 .014 .000009 .000017 .00006 ,000009 ,000009 .000017 ,00031
( lb/ton) <.000017) (,000017) (.017) (.000069) (.00011) (.027) (.000017) ( ,000034) ( .00011) (.000017) (.000017) ( ,000034) (.00062) Treated Waste Load (kg/Kkg)' , ,000009 ,000009 ,004 ,000026 ;,000035 .0066 -.000009 , 000017 .00047 .000009 ,000009 ,000035 ,00007
(lb/ton) (.000017) (.000017) (.0079) (.000052) (.000069) (.013) ( ,000017) , ( ,000034) ( .000093) (.000017) (.000017) (.000069) ( .00014) % Reduction 0% 0% 56% 26% 42% 53% 0% 0%' 15% 0%: 0% +103% increase 71%
678 Raw Waste Load (kg/Kkg) .000007 .000007 .0033 .000042 ,00012 .007 .0001 .000015 .000015 .000009 .000009 .006 .000022
(lb/ton) (.000013) (.000013) (.0065) (.000083) (.00023) (.014) (.0002) ( .00003) ( .00003) (.000017) (.000017) (.011) (.000043) Treated Waste Load (kg/Kkg) .0000048 .0000048 .0000048 .000036 .00006 .0019 .000011 .0000004 ,0000004 .000006 .000008 .00082 .0000004
( lb/ton) (.0000096) ( .0000096) ( .0000096) (.000071) (.00011) C.0038) (.000023\ C.0000009) (.0000009) (.000011) (.000016) ( .0016) (.0000007) % ReductiOil 31% 31% 99% 14% 50% 73% 89% 97% 97% +547% increase .11% 86% 98%
Sourc·!?: 1977 Verification Sampling,

Table VII-59. SlS Hardboard Toxic Pollutant Data, Organics
Average Concentration (ug/1)
Raw Wastewater Treated Efluent Parameter Plant 207 Plant 931 Plant 207 Plant 931
Chloroform 20
Benzene 80 10 80
Ethyl hen zene 20
Toluene 15* 70 70
Phenol --** 680 20
* Plant 207 intake water contained 10 ug/1 toluene.
** Plant 207 intake water contained 97 ug/1 phenol.
Hyphen denotes that the concentration for the parameter is below the detection limit for the compound.
286

N co .......
Table VII-60. S2S Hardboard Toxic Pollutant Data, Organics
Parameter Plant 980
Chloroform
1,1,2-Trichloroethane
Benzene
Toluene
' Phenol
Average Concentration (ug/1)
Raw Wastewater Plant l
20
90*
60*
300
Plant 943
90
10
Treated Effluent Plant 980 Plant 1 · Plant 943 ·
100**
40
30
* Plant intake water was measured at 120 ug/1 benzene and 80 ug/1 toluene.
** Plant reported a minor solvent spill in final settling pond prior to sampling.
' -- Hyphen denotes that the concentration for the parameter is below the detection 1 imit for the compound.

Extremely low concentrations of chloroform, 1,1,2-trichloroethane, benzene, toluene, and phenol were found in the raw wastes of the pl-ants sampled. All of these pollutants, with the exception of phenol, most likely originated in industrial solvents or as a result of the chlorinatio~ of incoming process water. Phenol is an expected byproduct of hydrolysis reactions which occur during refining of the wood furnish. The levels of the heavy metals and organic toxic pollutants which were found in the raw wastewaters are so low that no specific technology exists to remove these pollutants from the wastewater matrix. Biological treatment is effective in reducing most raw heavy metals concentrations as shown in ,Table VII-58 and in significantly reducing the concentrations of the few organic toxic pollutants found :in the raw wastewat~r.
The treated effluent of Plant 980 contained 100 ug/1 of toluene which is thought to have been caused by a minor solvent spill in the final settling pond prior to sampling.
Insulation Board Candidate Treatment Technologies
There are two basic treatment technologies applicable to insulation board plants. One technology is biological treatment. Two equivalent options for biological treatment are presented--an aerated lagoon option and an activated sludge option. Both options will result in the same degree of treatment and final effluent level. The aerated lagoon option is less costly; however, it requires more.land.
The biological candidate treatment technology schemes for the insulation board subcategory are based on demonstrated performance of Plant 537, a thermomechanical refining plant. The single direct discharging mechanical refining plant, Plant 36, has raw waste loads similar to Plant 537 and based on previously presented data, is capable of achieving treatment performance equivalent to Plant 537.
Candidate Treatment Technology A includes an activated sludge system for biological treatment and secondary clarification with aerobic digestion, sludge thickening, and vacuum filtration for waste sludge conditioning and dewatering. Figure VII-21 presents a schematic of Candidate Treatment Technology A.
Candidate Treatment Technology B, as shown in Figure VII-22, includes an aerated lagoon system with a facultative lagoon for additional biological treatment and clarification. Sludge is dredged from the facultative lagoon and landfilled.
Candidate Treatment Technology C, as shown in Figure VII-23, is a self contained system utilizing spray irrigation. Biological treatment precedes spray irrigati·on to reduce the pollutant load on the spray field. Biological treatment of raw wastewater preceding spray irrigation is not a necessity for successful performance of this technology, The allowable loading rates of
I
288

N (X) ~
RAW WASTEWATER-
PRIMARY CLARIFIER i---
~
INSULATION BOARD (MECHANICAL AND THERMOMECHANICAL REFINING) . (DIRECT DISCHARGE)
PUMP STATION
NUTRIENT ADDITION -
NEUTRALIZATION
SLUDGE
AEROBIC DIGESTOR
CANDIDATE TREATMENT TECHNOLOGY MODEL PLANT A
SCREENING EQUALIZATION
ACTIVATED SLUDGE PUMP STATION
SLUDGE VACUUM i---
THICKENER Fll:TRATION
PUMP STATION
MONITORING · STATION
SLUDGE DISPOS.'\L (TAUC!( HAUL)
CONTROL HOUSE
-
DISCHARGE
Figure vn-21

RAWWASTEWA
N
~
TER-
l1NSULATf,QiN BOAR:D (MIECHAN1ICAl AN1D THE.RM10MECHAN1ICAL REFJ1NliN1G) (DIRECT DISCHARGE)
PUMP STATION
CANDIDATE TREATMENT TECHNOLOGY MODEL PLANT B
SCREEN,ING PUMP STATION NEUTRALIZATION
AERATED LAGOON FACULTATIVE LAGOON PUMP STATION
SLUDGE
SLUDGE DISPOSAL (TRUCK HAUL)
MONITORING STATION
CONTROL HOUSE
i- NUTRIENT ADDITI ON
-
DISCHARGE
Figure Vll-22

N 1.0 ,_.
RAWWASTEWA
INSULATION BOARD (MECHANICAL AND THERMOMECHANICAL REFINING)
TEA- PUMP STATION
AERATED LAGOON
(SELF CONTAINED) .
CANDIDATE TREATMENT TECHNOLOGY MODEL PLANT C
SCREENING PUMP STATION NEUTRAUZA TION
-
FACUL TA TIVE LAGOON
SLUDGE
SLUDG,E DISPOSAL (TRUCK HAUL)
PUMP STATION SPRAY IRRIGATION
See Tables A-6, A-7, A-8, and A-9 for cost summaries
CONTROL HOUSE
NUTRIENT ADDITION
figure Vll-23 ·

BOD per acre of land vary considerably from soil to soil, and there are several demonstrated instances of insulation board and hardboard plants successfully spray irrigating a raw wastewater. Plants 186, 979 and 943 do not provide biological treatment prior to successful application of spray irrigation technology. Candidate Treatment Technology C is usually more land intensive than A or B.
Candidate Treatment Technology C is presented here as providing biological treatment prior to spray irrigation in order to present a conservative basis for new source performance costs and to insure that new source performance standards can be met by plants in areas where allowable BOD loading rates per acre require biological treatment. Sludge is removed from the facultative lagoon and landfilled.
Table VII-61 presents the expected treat~~ effluent waste for the candidate treatment technologies for insulation plants. These treated waste loads are based on those achieved by thermomechanical refining Plant,537.
loads board being
The battery limit costs associated with the insulation board Candidate Treatment Technology C, the NSPS technology, are presented in Appendix A. No other costs are presented for insulation board plants as both direct discharging plants which produce only insulation board already have equivalent technology in place. Cost impacts for plants which produce both insulation board and S2S hardboard are presented in the S2S hardboard discussion. ·
Table VII-61. Treated Effluent Waste Loads for Candidate Treatment Technologies--Ins~lation Board
Candidate Treatment Average Treated Effluent Waste Loads kg/Kkg (lb/ton) Technology BOD TSS
A, B
C
2.07 (4.14)
0
l. 3 l ( 2. 62)
0
~ Process Hardboard Candidate Treatment Technologies
There are two basic treatment technologies applicable to hardboard plants. One technology is biological treatment. As demonstrated by plants in the industry and as discussed earlier in this section, biological treatment facilities may be designed and operated to provide varying degrees of pollutant reduction. Because there are many plants- that have biological systems, demonstrated performance of three of these systems (two for SlS hardboard and one for S2S hardboard plants) were used to develop three levels of biological treatment performance as a basis for the candidate biological treatment systems. Each of these
292

candidate treatment systems described for hardboard plants will result in different final treated effluent levels.
Candidate Treatment Technology A, applicable to SlS hardboard plants and based on the biological treatment system in place at Plant 207, cc,nsists of a primary settling pond or primary clarifier, an aerated lagoon and a facultative settling lagoon. A diagram of this treatment system is presented in Figure VII-24.
. .
Candidate Treatment Technology B, applicable to SlS hardboard plants and based on the biological treatment system in·place at Plant 931, consists of a two stage aerated lagoon system in conjunction with a facultative settling lagoon. This system provides signi.f:icantly more detention time and aeration capacity per pound of· raw BOD waste load than does Candidate Treatment Technology A, and thus exhibits improved performance characteristics. Figure VI I-2·5 is a diagram of Candidate Treatment Technology B.
Candidate Treatment Technology C is applicable to S2S hardboard plants and i.s based on the biological treatment system in place at Plant 980, .except that a primary clarifier and activated sludge system have been specified to replace the Infilco soli.ds contact units used at this plant to provide a combination of primary settling and preliminary biological treatment. This system, wh~ch.includes equalization, primary settling, activated sludge treatment followed by a two stage aerated lagoon system and a facultat:ive lagoon for final settling, is depicted -in Figure VII-26. .
Candidate TrE:!atment Technology D, applicable to Sl s and S2S hardboard plants, is a no discharge spray irrigation system. For cost purposesl' the spray system itself is preceded by biological treatment and sufficient holding capacity for 3 months at design flow, as well as a one mile pipeline and pumping station. A diagram of this system is presented in Figure VII-27.
/
293

N \0 ~
HARDBOARD (StS) ( DIRECT DISCHARGE)
CANDIDATE TREATMENT TECHNOLOGY MODEL PLANT A
RA W WASTEWATER - PUt.1P STATION SCREENING PUMP STATION
r NUTnlENT ADDITION -
PRIMARY CLAIUFIER ,___ NEUTRALIZATION AERATED LAGOON SECONDAR'V CLARIFIER
I SLUDOE ~
' SLUDOE DISPOSAL (TRUCK HAUL)
' PUMP ST A TION MONITORING DISCHARGE
STATION
CONTROL HOUSE
I-
..___
Figures Vll-24

N '\0 u,
I
- -
RAW WASTEWATER - PUMP ST A TION
AERATED LAGOON AERATED LAGOON
HARDBOARD (S1S) (DIRECT DISCHARGE)
CANDIDATE TREATMENT TECHNOLOGY MODEL PLANT B
CONTROL HOUSE
SCREENING PUMP ST A TION NEUTRAUZA TION
f ACULT A JIVE LAGOON
StuDGE
SLUDGE DISPOSAL (TRUCK HAUL)
PUMP ST A TION
i--- NUTRIENT ADDITION
MONITORING STATION DISCHARGE
Figure Vll-25
,,

N 10 0\
RAW WASTEWATER-
PRIMARY CLARIFIER ,__
.._
PUMP STATION.
,
NUTRIENT ADDITION -
NEUTRALIZATION
SLUDGE
-
AEROBIC DIGESTOR
l PUMP STATION
HAR:01BOARD {S2S) (DIRECT DISCHARGE)
CANDIDATE TREATMENT TECHNOLOGY MODEL PLANT C
SCREENING EQUALIZATION
ACTIVATED AERATED SLUDGE LAGOON
-
SLUDGE VACUUM THICKENER FILTRATION -
MONITORING DISCHARGE
STATION -
CONTROL HOUSE
PUMP STATION '-
AERATED FACULTATIVE -LAGOON LAGOON
SLUDGE
SLUDGE DISPOSAl (TRUCK HAI/L)
Figure Vll-26

N 1.0 -..J
RAW WASTEWA' TEA...:- PUMP STATION
AERATED LAGOON
HARDBOARD (S1S AND S2S) ( SELF CONTAINED)
CANDIDATE TREATMENT TECHNOLOGY MODEL PLANT D
SCREENING
FACULTATIVE LAGOON
SLUDGE
SLUDGE DISPOSAL (TRUCK HAULa
PUMP ST A TION
PUMP STATION
See Tables A-10, A-11, and A-12 for cost summaries
CONTROL HOUSE
NEUTRALIZATION
NUTRIENT ADDITION '
SPRAY IRRIGATION
Figure Vll-27 ·

Table VII-62 presents the expected treated effluent levels for these candidate treatment technologies.
Table VII-62. Treated Effluent Waste Loads for Treatment Technologies--Wet ~rocess Hardboard
Candidate
Candidate Treatment Technology
Average Treated Effluent Waste Loads kg/Kkg (lb/ton)
A (SlS)
B {S1S)
C (S2S)
D(Both)
BOD TSS
4.45 (8.91)
0.922(1.84)
3.61(7.22)
0
10.4 (20.8)
3.01 (6.021
5.02 (10.0)
0
Cost estimates are presented in Appendix A for the self contained, NSPS Candidate Technology D only,,as all direct dischargers already have treatment systems in-place. Cost estimates are also presented in Appendix A for hardboard plants which must upgrade their treatment systems to achieve performance equivalent to Candidate Treatment Technologies A and B (for SlS) and C (for S2S).
Pretreatment Technology
No technology for pretreatment was developed for the insulation board/wet process hardboard segment because of the low levels of heavy metals and organic toxic pollutants in the raw wastewater and the lack of technology available to further reduce these levels. A plant may decide to adopt pretreatment in order to reduce its waste loads to the POTW as a matter of individual economics.
298

GENERAL
SECTION VIII
.~;E;SI. PR~C:'.1'.I.C.~~.~. C:QijTR,OL TE.CHNOLOGY .CURRENTLY AVAILABLE
The effluent limitations which wer·e required to be achieved by July 1, 1977, are based on the degree of effluent reduction attainable through the application of the best practicable control technology currentfy available (BPT). The best practicable control technology currently available is based .upon the average of the best existing performances, in· ter~s o! treated effluent discharged, by plants of various sizes, ages and unit processes within the industry. This average is not based upon a broad range of plants ~ithin the timber products industry~ but upon perf,orman,ce levels demonstrated by exemplary plants.
- .
In establishing the best practicable control technology currently available effluent limitations guidelines, EPA must consider several factors, including:
1. the manufacturing processes employed by the industry;
2·. the age and size of equipment and faci 1 i ties involved;
3. the engineering aspects of application of various types ~f control techniques;
4. the cost of achieving the effluent redu~tion r~sulting_ · from the application of the technology; and
5. non-water quality environmental energt requirements).
impact ( including·
While best practicable_ control technology currently available emphasizes treatment facilities at the end of manufacturing processes, it also includes control technologies within the process itself which are ~onsidered normal practice within an industry.
A further consideration is the degree of economic and engineering reliability which must be established for the technology to be ''currently available." As· a result of demonstration projects, pilot ~lant testing, and geniral ~se, there must exist a high degree of confidence in the engineering and economic practicability of the technology at the time of commencement of construction or inst~llation,of the control facilities~
MANUFACTURING-PROCESSES
As .indicated in. earlie~ sections, the differences in ·thnber · products manufacturing processes result·· in varying raw -waste characteristics. The Agency has recognized these variations by
- 299 -
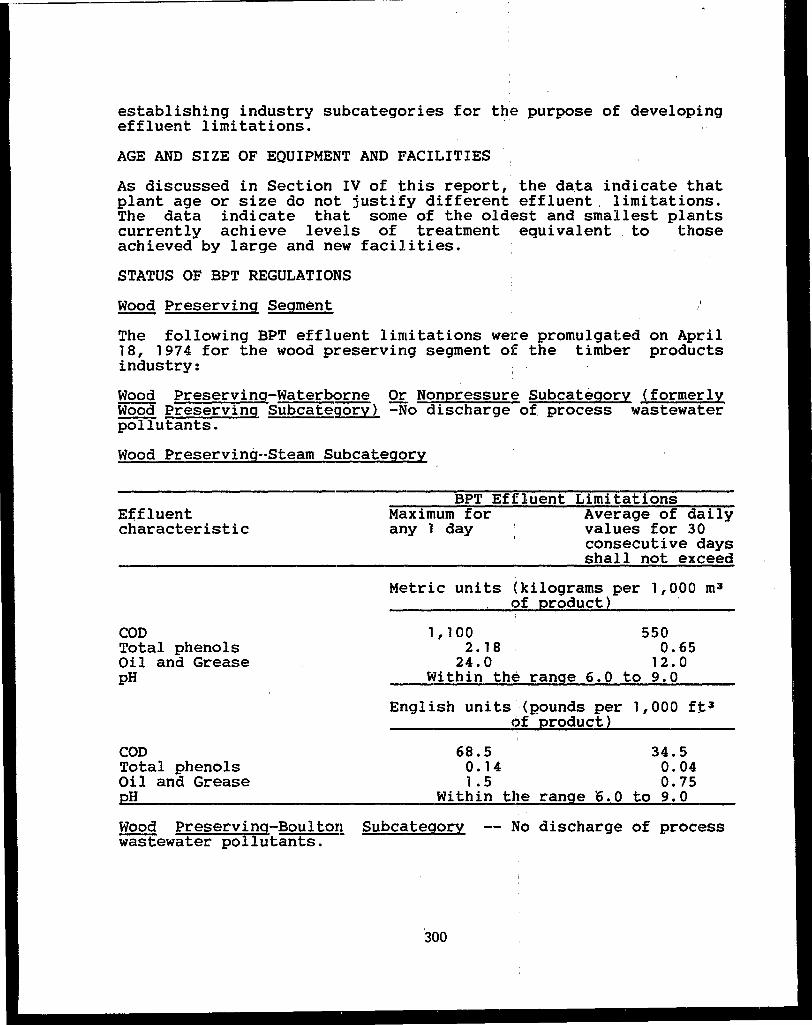
establishing industry subcategories for the purpose of developing effluent limitations.
AGE AND SIZE OF EQUIPMENT AND FACILITIES
As discussed in Section IV of this report, the data indicate that plant age or size do not justify different effluent. limitations. The data indicate that some of the oldest and smallest plants currently achieve levels of treatment equivalent to those achieved by large and new facilities.
STATUS OF BPT REGULATIONS
~ Preserving Segment
The following BPT effluent limitations were promulgated on April 18, 1974 for the wood preserving segment of the timber products industry:
Wood Preserving-Waterbrn Or Nonpressure Subcateoory (formerly Wood Preserving Subcategory) -No discharge of process wastewater pollutants.
Wood Preserving--Steam Subcategory
E~fluent characteristic
COD Total phenols Oil and Grease pH
COD Total phenols Oil and Grease
H
BPT Effluent Limitations Maximum for any 1 day
Average of daily values for 30 consecutive days shall not exceed
Metric units (kilograms per 1,000 m3
of product) ·
1,100 2.18
24.0 Within the range 6.0
550 0.65
12.0 to 9.0
English units (P.ounds per 1,000 ft 3
of product)
68.5 0. 14 1.5
Within the
34.5 0.04 0.75
range 6.0 to 9.0
Wood Preserving-Boulto~ Subcategory -- No discharge of process wastewater pollutants.
300

Insulation Bc~rd/Wet Process Hardboard Segment
Insulation ·l~<:>ard Subcategory-On August 26, 1974, effluent guidelines and standards were proposed for the direct disciharging plants of the insulation board subcategory. Th,e.se proposed regulations wi~re never promulgated. Promulgation was delayed because review of the proposed regulation indicated that additional .information was needed . . . Wet Process !i_ardboard Subcategory:.Following promulgation· of wet process 1hardboard regulations on April 18, 1974,· the industry and the Agency hi~ld a series of meetings to review the information in the Record :supporting these regulations. This review convinced the Agency that the existing regulations should be withdrawn; On September 28, 1977, a notice was published in the Federal Register anm:>uncing the withdrawal of 40 CFR Part· 429 Subpart· EHardboard Wi~t Process, best practicable control technology limitations, best available technolGgy limitations, and new source perfo1rmance standards (BPT,: BAT and NSPS}. ·
BEST PRACTICABLE CONTROL TECHNOLOGY (BPT}
Wood Pr~servil[!g_ Segment
BPT regulati4:>ns promulgated April 18, 1974 C?ntinue.
Wet Process [ardboard/Insulation Board Segment
Best ·practicable conti::-ol-technology.for the wet process hardboard subcategory and the insulation board subcategory are based· on demonstrated, performance of existing end-"of-pipe biologica1 treatment systems. The insulation board BPT technology is defined as primary clarification, followed by secondary treatment (biological by extended aeration}, secondary clarification and recycle and reuse of a portion of the treated wastewater, as practiced. by Pl~nt 537. The_ S1S part of the wet process hardboard $Ubcategory BPT technology is based on primary settling, biological treatment by extended aeration, secondary settling, and discharge, as currently practiced by Plant 207 .· · As discussed bel,ow, the only plant producing only S2S hardboarq has an end-of-pipe treatment system performing at a BCT level rather than a BPT level of performance. Ther.efore, a BPT limitation was calculated for the. S2S part of the wet process hardboard· subcategory from the performance of 'the SlS BPT system applied to S2S raw waste loads. · ·
The BPT limitations for the insulation board and wet process hardboard subcategories presented in this section can be achieved with the treatinent systems outlined above. ,. However,. these systems are not required.· by the regulations. In fact, many plants in these subcategories are currently. achieving SPT, · cir better levels of control with w~stewater treatment and control systems different than those described above.
301

REGULATED POLLUTANTS
The pollutants controlled by the previously promulgated BPT limitations for the Wood Preserving-Steam subcategory are COD, Oil and Grease, total phenols (Standard Methods), and pH. The discharge of these pollutants, except for pH, is controlled by mass effluent limitations, i.e. in kilograms of pollutant per 1000 rn3 of production or pounds of pollutant per 1000 ft3 of production. The existing BPT limitations for the remaining subcategories of the wood preserving segment, the Wood Preserving-Waterborne or Nonpressure and Wood Preserving-Boulton subcategories require no discharge of process wastewater pollutants. The pollutants controlled by the BPT limitations for the insulation board and wet process hardboard subcategories include BOD, TSS, and pH. The discharge of these pollutants, except for pH, is controlled by mass effluent limitations, i.e., kilograms of pollutant per 1000 kilograms of gross production or pounds of pollutant per 1000 pounds of gross production.
METHODOLOGY OF BPT DEVELOPMENT
Wood Preserving Segment
The Agency is retaining the BPT effluent limitations promulgated on April 18, 1974. A detailed discussion of the rationale for determining BPT limitations for each subcategory of the wood preserving segment is presented in the Development Document for Effluent Limitations Guidelines and New Source Performance Standards for the Plywood, Hardboard and Wood Preservi.ng Segments of the Timber Products Industry, U.S. EPA 440/1-73/029, 1974.
All known wood preserving plants are currently in compliance with these existing BPT limitations.
Insulation Board/Wet fr_ocess Hardboard Segment
Insulation Board 2!:!!2_category-Fifteen plants fall into this subcategory, ten which produce solely insulation board, and five which produce both insulation board and S2S hardboard. Five of the fifteen plants are direct dischargers •.
BOD and TSS are the major pollutants present in the wastewater. None of the 124 toxic pollutants were measured at levels that would be further reduced by practicable currently available treatment technologies.
The Agency reviewed and evaluated the treatment systems at all five direct discharging plants in order to choose a tieatment technology repres~ntative of BPT. Requirements for this BPT technology were that it represent exemplary performance within the subcategory and that it be applicable to all plants within the subcategory.
302

Technology insulation Plant 537, insulation
selected as representative of BPT technology for the b1oard s.ubcategory is based on in-place technology at
one of two direct dischargers that produces solely bo.ard.
At Plant 537, process wastewater, septic tank effluent, and storm water r~noff goes to a primary clarifier. Primary sludg~ is recycled .to the process .. Wastewater goes to an aerated lagoon, and then to a secondary clarifier. Secondary claiifier sludge also is. recycled to the process. Clarifier overflow goes to a sump. A portion of the treated water is reused by the plant, and excess treated wastewater is dischi;irged to receiving waters.
In-place technology- at the rema1n1ng four direct discharging plants was not select.ea. as representative BPT technology for the following reasons:
Plant. 36 has a biological treatment system which consists of a primary clarifier followed ·by an activated sludge system~ Although the performance of this system is exemplary, and this treatment system is applicable to other insulation board plants, Plant 36 is the only mechanical refining plant· among the five insulation board dir_ect dischargers. Mechanical refining plants usually have lower raw waste loads than do thermomechanical refining plants. The Agency decided not to base BPT treatment system performance on a system treating wastewater from a mechanical refining plant.
Plant 108 has recently constructed a pure treatment system. Lack of operational prevents it.:. from being conside_red as
. technology. . · · --
oxygen activated sludge data on this system representative of BPT
Plant 1035 has an extensiv~ · bi~logicil treat~erit $ystem consisting of over 1-00. acres of aerated lagoons and oxidation ponds. Although this system provides excellent treatment, it is very land intensive; therefore, the Agency concluded that it ~a not representative of BPT technology.
Plant 943 spray-irrigates primary treated wastewater on 200 acres of underdrained fieldsi Perco.lated water is collected in the underdrains and is discharged. Although this system provides a very high level of treatment, it is. land intensive; for this reason, the Agency concluded that it is not representative of BPT technology. · · ·
One nondischarging plant in the subcat~gory, which was operating at the time of the technical study, but is no longer operating used complete recycle of process wastewater to achieve no discharge status. The Agency believes that complete recycle of process. wastewater is· dependent on the type of end products produced, the, type of raw materials available, and on plant specific variables of process equipment. It is, .therefore, not
303

applicable to all plants in the subcategory and the Agency has not recommended this technology for BPT.
Specific engineering design criteria, based on the treatment system at Plant 537, are presented below for BPT biological treatment technology for the insulation board subcategory:
Primary and Secondary Clarifier Overflow Rate
Nutrient Addition to Maintain C:N:P at
Aerated Lagoon Detention Time
Aeration Capacity
661 gpd/sq ft
100:5:l
0.0019 days/lb BOD removed
0.066 HP/lb BOD removed
Performance data over a three-year period for Plant 537 indicate that the treatment system is performing exceptionally well, with long term average treated effluent loads of 2.07 kg/kkg (lb/1,000 lb) for BOD and 1.31 kg/kkg (lb/1,000 lb) for TSS. The BPT limitations for this subcategory were derived by multiplying the long term average performance of Plant 537 by the daily and 30-day variability factors for Plant 537 documented later in this Section.
Wet Process Hardboard Subcategory - SlS Part-Nine plants fall into this group, seven of which are direct dischargers, one of which is a indirect discharger and one of which is self contained.
BOD and TSS are the major wastewater pollutants. None of the 124 toxic pollutants were measured at levels that could be further reduced by practicable, currently · available treatment technologies.
The Agency reviewed and evaluated the treatment systems at the seven direct discharging plants and the self contained plant .in order to choose a treatment technology representative of BPT. Requirements for the BPT technology were that it represent exemplary performance within the SlS part of the subcategory and that it be applicable to all plants within the SlS part.
Technology selected as representative of BPT technolo9y for the SlS part of the wet process hardboard subcategory is based on inplace technology at Plant 207.
Plant 207 produces only SlS hardboar1· The treatment system consists of primary settling, about twenty two days detention in an aerated lagoon, a secondary settling pond, followed by discharge to the receiving water.
304

In-place technology at the remaining eight S1S hardboard ,plants was not se~lected as represer.t"'ti ve vf :srT te,chnology for the fol lowing remsons:
Plant 348 produces solely sls, hardboard. Adjacent to the hardboard plant, a.plant, owned by the same firtn produces battery components which discharges process wastewater· to the same biological treatment system treating the hardboard plant effluent~ 'l'he plant was not able to separate and prorate wastewater flows from the two operations. The treatment system at this plant consists of a primary settling pond, an aerated lagoon, and a secondary settling pond. The plant is, as of Spring 1979, undertaking modifications of .the treatment system in an attempt tc>. improve its performance.· To date. the plant has the highest leve!l of BOD and, TSS. discharge of.· all SlS plants. Because of poor past performance and because of the presence of battery plant effluent this plant was not con$idered as a BPT candidate.
Plant 3 produces primarily exterior siding grade S1Shardboard. The plant's treatment system consists of primary settling,, an aerated lagoon, a secondary clarifier, followed by , another aerated lagc1c,n. Some wastewater from the final -aerated lagoon is reused in the manufacturing process, and the remainder, is discharged to the receiving water. The plant is considering recycling a portion of the waste sludge fr6m. the ie~ondary clarifier. The treatment system, based on long. term data . analysis, discharges a greater amount of pollutants than does Plant 207. This plant also exhibited a wide swing in treatment efficiency during the two year period for which data is available, indicating that the system has not been stable during that period, and should not be considered a BPT candidate, ·
Two plants, 678 and 673, both of which produce some ... S2S hardboard as well as SlS, dispose of a significant portion of· their process wastewater pollutants bY -an evaporation and drying process that converts ~ood sugars and other pulp degradation products .into a by-product which is marketable as an animal ·feed supplement. This operation considerably reduces the raw. waste load in relation t~_other hardbQard plant~.
Although both. of the$;e plants have activated sludge. treatment systems with better performance. characteristics thari the candidate BP''!' system ( in :terms. of unit discharge of pollutants) of Plant. 207, the combination of evaporation and biological treatment technologies is not considered .applicable to all Sl S . hardboard plants and therefore was· not selected as. a BPT candidate.
Plant 929 produces primarily industrial grade SlS hardboard. Its products are ·U\-sed in, automobile interiors, as backing for upholstered furniturej and as TV cabinet backingt all uses.where the hardboard is not visible, and not likely to be in contact with moisture. Therefore, the appearance and water absorption
305

qualities of the board are not important criteria. The plant has for the past three years been modifying process equipment and techniques to increase recycle and minimize its volume of process wastewater. The plant has reduced its volume of process wastewater more than 90 percent and has also significantly reduced the mass of pollutants discharged in its raw waste. However, because the relatively unique product line of this plant does not have to meet stringent requirements for appearance, paintability, and water absorption, : the internal recycle technology used by this plant is not applicable to all plants in the subcategory and was not chosen as a BPT candidate. This plant treats its relatively low volume of process wastewater in two large oxidation lagoons/settling ponds, which are not in themselves sufficiently effective to be considered as a BPT candidate treatment system.
Plant 931, which produces all S1S hardboard, constructed new treatment facilities which became operational during the last quarter of 1976. This treatment system consists of two parallel pairs of aerated lagoons operated in series, followed by three large settling lagoons operated in parallel. This entire system has a long detention time resulting in the best performance in terms of unit effluent pollutants discharged of any system relying primarily on end-of-pipe biol~gical treatment and applicable to all SlS hardboard plants. Of the seven direct discharging S1S plants from which one to three years historical BOD and TSS data were available, this plant's treatment system exhibited the most consistent uniformity of discharge quality both in terms of daily and long term average discharge. This treatment system is therefore considered to be a BAT or BCT candidate, and was not considered as a BPT candidate tecnnology.
Plant 919 produces only S1S hardboard for use in siding and industrial furniture. Process wastewater from the plant (including wastewater from an adjacent veneer plant owned by the same company) flows to two primary settling ponds followed by an activated sludge system. Following biological treatment, all the treated effluent is recycled to the plant as process, make-up water.
This end-of-pipe treatment/recycle system, although quite effective for Plant 919, is not considered applicable to all S1S plants for the same reasons that Plant 929's internal-process recycle cannot be applied to other S1S plants. Therefore, the treatment system at Plant 919 was not considered as a BPT candidate.
The remaining S1S hardboard indirect discharger with neutralization.
plant is Plant no pretreatment
Specific engineering system at Plant 207,
design criteria, based are presented below for
306
933 which is an other than
on the treatment BPT biological

treatment technology for the SlS part of the wet process hardboard subcategory:
Primary Settling Lagoon Detentic>n Time
Nutrient. Addition to Maintain C:N:P at
Aerated L_agoon _ D~tention Time
Aeration Capacity
Secondary Settling Lagoon Detenticm Time
5.2 days
1 00: 5: 1
0.0046 days/lb BOD .removed ·
0.059 HP/lb BOD removed
2.1 dpyS
Treated effluemt performance data over a two year period for - Plant 207 indicate that the treatment system is performing very
adequately, wi.th long term average treated effluent loads of 4.45 kg/kkg (lb/1000 lb) for BOD and l_0._4 kg/kkg (lb/1000 lb) for TSS.
The BPT limitations for this part of the wet process hardboard subcategory were derived by multiplying the long term average performance c,f Plant 207 by the _dciily and 30-day variability factors for Plant 207 documented later in this SeGtion.
As described in Section V, the 1976 raw waste load for Plant 207 was not used i.n developing the design criteria for the SlS part because a major in-plant retrofitting program, which significantly reduced th'e raw waste flow, was completed during the latter half of 1976. However, the daily treated effluent waste loads did not vary significantly from 1976 to 1977, and therefore, the long term average performance for this plant, in terms of treated effluent waste loads, was used in developing the BPT limitations. ·
Wet Process §lardboard Subcategory - S2S Part-Seven plants fall into this part of the wet process hardboard subcategory, five of which produce botn insulation board and s2s· hardboard. Of the plants which produce only hardboard, one plant produces approximat~ly . 80 percent S2S hardboard and 20 percent- Sl S · hardboard. The remaining plant produces solely S2S hardboard. Five of the seven plants are direct dischargers.
BOD and TSS are the major None of the 124 toxic would be further reduced treatment technoloaies.
pollutants present in the wastewater. pollutants were measured at levels that
by practicable, currently available
The Agency reviewed and evaluated the treatment systems at all five direct discharging plants in order to choose a treatment technology representative of BPT. Requirements for this BPT
307 /

technology were that it represent exemplary performance within the S2S part of the wet process hardboard subcategory and that it be applicable to all plants within the S2S part. Treatment systems at three of the plants were treating to very low effluent levels. Howeve~, two of the plants, 1035 and 943, are practicing a wastewater treatment technology application that is land intensive and not considered applicable to all plants in the subcategory.
Plant 980, the only plant which produces only S2S hardboard, has an exemplary biological treatment system in-place which is applicable to other S2S hardboard plants. The performance of this system, however, in comparison with exemplary plants in the S1S part of the subcategory, is more representative of BAT or BCT technology than it is of BPT technology. For example, the S1S part BPT treatment system demonstrates pollutant removal efficiencies of 86.1 percent for BOD and 64.6 percent for TSS. Plant 980, by comparison, is removing 94.3 percent of BOD and 91.5 percent of TSS. These removal efficiencies are more comparable to the removal efficiencies of the SlS part BCT candidate Plant 931, which removes 97.9 percent of BOD and 92.3 percent of TSS. (TSS removals are based on measured raw waste load TSS plus an additional 0.784 lb TSS per lb BOD removed to take into account biological solids generated in the treatment system. This figure is based on data supplied by the industry).
In the absence of an S2S hardboard treatment system which demonstrates technology representative of BPT, the Agency has calculated BPT for the S2S part based on the pollutant removal efficiencies demonstrated by the SlS part BPT treatment system, as applied to the long term average raw waste load generated by Plant 980, the only hardboard plant producing 100 percent S2S hardboard. Again, solids generated by biological treatment are included in this calculation. The resulting long term average treated effluent waste loads are 8.97 kg/kkg (lb/1000 lb) for· BOD and 19.6 kg/kkg (lb/1000 lb) for TSS. The BPT limitations were derived by multiplying these waste loads by the daily and 30-day variability factors for Plant 980. The design of the treatment system which the Agency believes will result in BPT effluent levels is based on the system in-place at Plant 980, with reduced detention time and aeration-horsepower requirements corresponding to the reduced mass of pollutants to be removed. This system includes equalization in an aerated basin, primary settling, an activated sludge system including secondary clarification followed by an aerated lagoon system and a facultative settling lagoon for further treatment.
308

Specific engineering design criteria, based,.on the· treatment system at Plant .980, are presented ·below for BPT biological treatment technology for the·. S2S part of the·· wet· process har.dboard ·subcategory:
Primary Clarifier Overflow Rate
Nutrient Addition to Maintain C:N:P at
Activated Sludge System·
Detention ·Time
Aeration
Aerated Lagoon
Detention Time
Aeration.Capacity
Final Settling·Lagoon
Det~:mtion Time
BPT LIMITATIONS
400 gpd/sq ft
100:5:l
0.000053 days/ib BOD removed
0.029 ·HP/lb BOD.removed
O.OOQ28 gays)ib BOD removed
0.034 HP/lb· BOD removed
96 hours
Presented below are. the best _practicable control technology limitations promulgated in this rulemaking.
Wood-Preserving Segment . L •
Wood· Preserving Water · Borne or Nonpressure discharge of .process wastewater pollutants.
Subcategory--No
309 ·

~ Preserving-Steam Subcategory
Pollutant or Pollutant Property
COD Phenols Oil and Grease pH
COD Phenols Oi 1 and Grease . pH
BPT Effluent Maximum for any one day
Limitations Average of daily values for 30 consecutive days*
English units (lb/1000 cubic feet of product)
68.5 . 14
1.5 within the range of 6.0
34.5 .04 .75
to 9.0 at all times
Metric units (kg/1000 cum of product)
1,100 550 2.18 .65
24.0 12.0 within the range of 6.0 to 9.0 at all times
* Based on 30 observations for the 30 day ~eriod. '
~ Preserving-Boulto11 Subcategory--No .discharge of process wastewater pollutants.
Insulation Board/Wet Process Hardboard Segment
Insulation Board Subcategory
The following limitations are applicable to plants which produce insulation board:
Pollutant or Pollutant Property
BOD TSS pH
BPT Effluent Limitations Maximum for Average of daily any one day values for 30
consecutive days*
kg/kkg !(lb/1,000 lb) of gross production
8.13 4.32 5.69 2.72
Within the range 6.0 to 9.0 at all times
*Based on 30 observations for the 30 day period.
310

Wet ·Process Hardboard Subcategory (S1S Part)
The. following limitations· are applicable to plants which.produce smooth-one-side (S1S) hardboard::.·
Pollutant or Pollutant Prc,perty ·
BOD TSS pH
' .
B.PT Effluent Maximum for any one day
Limitations Average of daily values for 30 consecutive days*
. kg/kkg . c 1b/1 , ooo 1b-)" of · · gross production)·
20.5 10~7 3 7. 3 .. 24. 6
Within the ~ange 6.0 to 9.0 at all times
*Based. on 30 c::>bservations for the 30-day period.
wet Process Har;-dboard Subcategory (S2S Part>' . .
The following limitations are applicable,'boplants which. produce smooth-two-sides hardboard:
Pollutant or Pollutant Property
BOD TSS pH.
BPT Effluent Maximum for. any one -.day
Limi tat"ions Average of daily. values for 30 consecutive, days•
Jcg/kkg ( lb/1 , ooo lb) .of gross production)
32.9 21-.4 54-.2 37.l
Within the. range 6.0 to 9.0· at all times
*Based on . 30 1::>bservations _ for the 30-day period.
The maximum averag~ of daily values for any thirty conse.cutive day period sh1::>ulcl not· exceed the· 30.day effluent limitations shown above. As shown in the tables above, the 30-day .. eff.luent limitations are based. on 30 observations"for the .- 30-day.: period. The maximum for any one. day should. :no.t exceed -the. daily maximum effluent limitations as shown above. The-limitations shown above for the insulation board anc;i :wet process hardboard ·subcategoriesare in kilograms of pollutant per metric ton of gross production. (pounds of p1::>llutant per 1,000 ·. pounds of gross production). Gross production _ts defined ~s the air dry we.ight of hardboard or insulation board following. formation of the wet mat prior to trimming and finishing operations.
311.

ENGINEERING ASPECTS OF CONTROL.TECHNOLOGY APPLICATION
The specific level of technology defined as BPT is practicable because many plants in the wood preserving and insulation board/wet process hardboard segments of the timber products industry already practice it, and achieve effluent levels equal to or below those specified in the BPT effluent limitations. For the wood preserving segment, no plants were identified which were not meeting existing BPT limitations. For the insulation board/wet process hardboard segment, eleven of fourteen direct dischargers currently meet effluent levels proposed herein as BPT limitations. For this segment, BPT technology and effluent levels are based upon treatment systems currently in place as described by a two to three year data base of daily effluent monitoring data provided by the plants themselves.
TREATMENT VARIABILITY ESTIMATES
BPT effluent limitations guidelines for the insulation board/wet process hardboard segment of the timber industry were calculated by multiplying the long term average performance of the BPT exemplary plants by daily and 30-day performance variability factors for the exemplary BPT plants. The derivation of the BPT numerical limitations is presented in Table VIII-1. For example, in Table VIII-1 the daily variability factor for insulation board BOD is 3.92, and the long-term average is 2.07. Therefore, the BPT numerical limitation for any one day is the product,
(3.92)(2.07) = 8.13*
Similarly, the monthly variability factor from Table VIII-1 for insulation board BOD is 2.08, so the monthly numerical limitation for the average of thirty daily measurements is the product of this variability factor and the long-term mean:
/
(2.08)(2.07) = 4.32*
Daily variability factors were ~alcul-ted using nonparametric estimates of the 99th percentile. These estimates were based on the extended (two to three year) data base available for each exemplary plant. The nonparametric estimation is a standard statistical technique that is fully documented in Appendix G, TREATMENT VARIABILITY ESTIMATES.,
Thirty-day variabilities model which account~
were calculated using a statistical for the effects of seasonality and
*The products of multiplying the variability factors by the long term average treated effluent loads may vary slightly from the BCT numerical limitations shown in Table VIII-1 due to rounding of the variability factors and the long term averages.
312

w .... w
Table VIII-!. BPI' lblerical ,Limitations
Subcategory
Insulation Board
~t-Process Hardboard
SIS
S2S
Daily Variability
Factors BODS TSS
30-Day Variability··
Factors BODS TSS
3. 92 4.34 2.08 2.08
4.61 3.59 2.40 2.37
3.67 2.77 2.39 l.~
I.ong-Tetm k1erage Treated
EffltEnt W:tste wads kg/kkg (lb/1000 lb)
BODS 'ISS ·
2.07
4.45
8.97
1.31
10.4
19.6
13PT Nmerical Limitations _},fmon"IUL-n Average of Thirty
For /my Che Day Daily ~surements kg/kkg (lb/1000 lb) kg/kkg (lb/1000 lb)
BODS 'ISS . :0005 TSS
8.13
20.5
32.9
5.69
37.3
54.2
4.32
10.7
21.4
2.72
24.6
37.1
N:>te: 'Ille prodocts of rultiplying the variability factors by the loog-tetm average treated effltEnt loads my vary slightly frcm the BPI'·nwerical limitations shom above dtE to romding of the variability factors- anf long-tetm averages.

autocorrelation. This model is used· to estimate the 99th percentile of the 30-day monthly averages, using the two to three year data base. Complete details of the statistical methodology used by the Agency in calculating daily and 30-day variability factors for BPT exemplary plants are contained in Appendix G, STATISTICAL METHODOLOGY FOR DETERMINING PERFORMANCE VARIABILITY OF TREATMENT SYSTEMS.
COST AND EFFLUENT REDUCTION BENEFITS-INSULATION BOARD/WET PROCESS HARpBOARD
EPA expects that the total capital investment· necessary to upgrade the treatment systems of the three direct dischargers not achieving BPT. effluent limitations will be $9.6 million. Operation and maintenance costs for all of these plants will increase by $3.7 million per year. Achievement of proposed BPT effluent limitations will remove approximately 2.4 million pounds per yP.ar of conventional pollutants (BOD and TSS).
NONWATER QUALITY ENVIRONMENTAL IMPACT
The primary nonwater quality impact of the BPT limitations is the waste sludge generated in the candidate treatment systems and the increased burden of the land to accept the disposal of this sludge.
In the insulation board/wet process hardboard segment of the industry, large volumes of waste sl,dge are generated in biological wastewater treatment systems .. An estimated 500,000 cubic yards per year of such sludge is currently generated by the 26 plants in the insulation board/wet process hardboard segment. The estimated incremental increase in sludge production as a result of compliance with BPT limitations.as plants upgrade their facilities is expected to be only 34,000 cubic yards per year, or about 6 percent of the total amount of sludge currently generated. Limited data from the preliminary results of a current timber industry study of Best Management Practices (BMP) suggest that significant quantities of toxic materials are not present in insulation board and hardboard sludges, and, they appear to be amenable to disposal in a normal sanitarY. landfill.
Waste sludges from wood preserving treatment systems, although small in volume, have been shown to contain significant quantities of toxic pollutants. These sludges need special consideration insofar as land disposal is concerned.
It was not within the scope of this rulemaking to define whether waste materials from the timber products industry are to be considered hazardous according to recently promulgated Resource Conservation and Recovery Act (RCRA) regulations. Consequently, no efforts were made to fully characterize the sludge produced as a result of wastewater treatment. No sludge samples were collected during the verification sampling programs. Limited
314

information is available, however, from the data collection portfolios, from interviews with plant personnel, and·· from preliminary results of a current timber industry Best Management Practice (BMP) study to estimate the quantities of sludge generated by the various candidate_treatment technologies.
To ,date, no adverse impacts upon air qtial i ty have been .identified which would restrict the adoption of·any of the BPT candidate treatment technologies.
At.some plants spray evaporation or·cooling tower evaporation of wood preserving wastewater is used to achieve no discharge. Because the wastewater being evaporated contains volatile organic compounds there could be drift losses caused by wind. ·
Further, volatile organic compounds can also be stripped .from wastewater by aeration, such as in activated sludge units or aerated lagooins. However, in neither case has any adverse air quality' impacts been identified.
Energy Reguir~ments
There are nc, additional energy requirements for the insulation board subcategory as none of the insulation board plants will be required to construct additional pollution control facilities to comply with BPT.
The current tc>tal annual energy consumption of the wet process hardboard subcategory is. about 6,050,000 megawatt-hours, equivalent tc, about 9,961,000 barrels of oil. This energy is used not only for production processes,. but also to operate in-place wastewater treatment, systems. · Tei attain BP~~,. the annual energy requirements for · the hardboard subcategory will increase by about 30,000 megawatt-hours, or about 49,000 barrels of oil. This additional energy requirement, which is only 0.5 pertent · of the current total energy consumption, is for the operation of additional pollution control equipment.
GUIDANCE TO N1?DES PERMITTING PERSONNEL
Application of Insulation Board/Wet Process Hardboard BPT Effluent Limitations
1. If a plant has production in more than one S"4bcategory, or production in both parts of a subcategory, the allowable discharg4~ (mass) should be prorated on the percentage of the total annual production, divided by th~ discharging days per year, for each subcategory or part.
2. The production figure recommended for calcuiating these limitations is the daily average gross production of the maximum 30 consecutive days. Gross production is defined as the air dry weight of hardboard or insulation board
315

following formation of the wet mat prior to trimming and finishing operations.
3. Daily and 30-day effluent limitations have been derived using statistical estimates of the 99th percentile, i.e., the highest value which will not be exceeded 99 percent of the time. Conversely, large biological treatment systems can be statistically expected to violate the limitations about one percent of the time in normal operation. Enforcement personnel should consider this fact before taking enforcement action against individual plants.
316

SECTION IX
BEST CONVEN-TI_ONAL POLLUTANT. CONTROL .TECHNOLOGY
GEN~L-·
Section 30l(b) (2) (E}<.of The- Act requires that there be achieved, not later than July 1, 1984; effluent limitations. for categories and classes of point sources, other than publicly-owned treatment works, that require the applicati,on of the best conventional pollutant control technolpgy· (BCT) for. control. of conventi.ona1 pollutants as identified in Section 304(a}(4). The -pollutants that have been defined.as conventional _by. the Agency,. at. this. time, are .. · biochemical . oxygen demand, - suspended solids, fecal coliform, oil .and grease, and pH. BAT will remain in force whe1:e tox.ic .pollutants are - present at levels where · treatment and control.options are available to effect reductions.
BCT requires t:hat ··· · 1 imitations for conventional pollutants .be assessed in light of a cost reasonableness test. This._ cost reasonableness test is defined arid described in BEST CONVENTIONAL POLLUTANT CON~rROL TECHNOLOGY, 44 FR .50732, August 29, 1979~ The methodology specified in the Federal Register -noti.ce for determining BCT applies when both BPT. and BAT regulations for.an industry are in force .. The legislative language clearly indicates that final BCT effluent limitations cannot·- be more stringent than BAT or. less stringent than ·BPT~.
BPT and BAT regulations wer_e wot in - force for either the insulation board or wet process hardboard subcategories of the timber products industry when the Act was amended in 1977,. BPT and BAT regµlations for the hardboard subcategory, published in 1974, were·. withdrawn· in December_· 1976. Insulation board regulations, proposed in_ 1974,. were never promulgated.·
BCT 1 imitations for· ihe· ... hardboard subcategory were- determined from a. comparison of the incremental annualized costs .and incremental annualized reductions of conventional pollutants above and beyond the level of control identified as BPT:
WOOD PRESERVING SEGM~NT
BCT limitations are not promulgated in this rulemaking for the wood preserving segment ·of the industry. The Agenc;:y reasoned that.BCT limitations are not appropriate for wood· preserving plants because wastewaters f:rom each of the wood:preserving subcategories contain significant.amounts of -toxic pollutants and because technologies for reducing -.-toxic pollutant. · levels cannot be. separated- from technology for ·reducing conventional pollutant levels. No direct dischargers have been identi:fied in the Wot>d Preserving-Waterborne or Nonpressure and the Wood Preserving~ Boulton subcategories. Previously· promulgated BAT Limitations for these subcategories require no discharge of process wastewater pollutants. These.BAT limitations are being continued
317 ·

by this rulemaking. Only one direct discharger was identified in the Wood Preserving-Steam subcategory. Existing BAT limitations for this subcategory are being withdrawn by the Agency, because national effluent limitations are inappropriate for one plant.
INSULATION BOARD/WET PROCESS HARDBOARD SEGMENT
Upon thorough review and evaluation of the treatment systems of each direct discharging plant in this segment (previously discussed in Section VII, CONTROL AND TREATMENT TECHNOLOGY, AND Section VIII, BEST PRACTICABLE CONTROL TECHNOLOGY) the Agency selected a treatment system representative of conventional pollutant removal equal to or above and beyond that being achieved by the BPT technology, identified in Section VIII, for each subcategory. The Agency concluded that BCT limitations for the insulation board subcategory should be equal to BPT limitations. The reasons for this action are that there is no in-place treatment system in the subcategory which provides both increased pollutant removal above the BPT system and is applicable to all plants in the subcategory. The BPT/BCT treatment system is based upon in-place technology at Plant 537. For the wet process hardboard subcategory, the BCT limitations in the SlS part are based on the performance of Plant 931 and Plant 980 in the S2S part.
The test of cost reasonableness was then applied to determine whether or not the cost per pound of additional conventional pollutants (BOD and TSS) removed using these technologies were equal to or less than the $1.15/lb figure specified as reasonable for a POTW by the BCT methodology. This $1.15/lb figure is based on the maximum 30-day average pollutant load which could be discharged as calculated using the methodology presented in Appendix G. ·
BCT technology passed the test of reasonableness for each subcategory in this segment. Incremental costs per pound of additional conventional pollutants removed ranged from no cost for the insulation board subcategory (BCT technology for this subcategory is the same as BPT technology), to a maximum of $0.754/lb for the SlS part of the wet process hardboard subcategory, and a maximum of $0.593/lb for the S2S part.
BEST CONVENTIONAL CONTROL TECHNOLOGY (BCT)
Wood Preserving Segment
BCT limitations are not promulgated in this rulemaking for the wood preserving segment for reasons described earlier in this section.
318

Insulation Bo~rd/Wet Process Hardboard Segment
Insulation B2,ard Subcategory-Section VIII, BEST PRACTICABLE CONTROL TECHNOLOGY CURRENTLY AVAILABLE, contains, a detailed· discussion of each treatment system in the subcategory. and also details. the specific engineering and design criteria for the insulation board BPT/BCT.treatiment system. The BPT/BCT treatment system is bas,ed upon in place. technology at Plant 537. This technology consists of primary clarification, with recycle of primary sludge, e1ctended aeration, secondary clarification, also with recycle of secondary sludge, recycle of a portion of the treate<i wastewater, and discharge. of the· remainder. ·
Wet Process Hardboard Subcategory - SlS Part-Technology selected as representative of BCT technology for the SlS part .of the wet process hardboard subcategory is based on in-place technology at Plant 931. Plant 931, which produces all SlS .hardboard, constructed new treatment facilities which became operational during the last quarter of 1976. This treatment system consists of two parallel pairs of aerated, lagoons operated in series, followed by three settling .. lagoons operated in parallel. The settling lagoons discharge to navigable waters. This system has a very long detention time resulting in the best performance in terms of conventional pollutants discharged of any system relying primarily on end-of-pipe biological treatment which is applicable to all SlS hardboard plants. Performance data over a three-year period for Plant 931 indicate that• the treatment system is performing exceptionally well, with long term. treated effluent loads of O. 922 kg/kkg (lb/1 000 lb) for BOD and 3. 0.1 kg/kkg (lb/1000 lb) for TSS. The BCT limitations for the S1S part of this subcategory were deriy~d by multiplying the. long term average performance of Plant 931 by the daily and 30-day variability factors for Plant 931 documented later in this section. Specific engineering and design criteria for this BCT system include:
Nutrient Addition to Maintain C:N:P at
Aerated Lagoons · Detention Time
Aeration Capacity
Settling Lagoons Detemtion Time
100:5:l
0.0049days/lb BOD removed·
0.04 HP/lb BOD. removed
15.7 days
Wet Process Hardboard Subcategory - S2S Part-Technology selected as representative of BCT technology for the S2S part of the .. · wet process hardboard subcategory is based on in-place treatment at Plant 980. ~rhis system includes equalization in an. aerated basin, primary settlingi an activated sludge system including secondary clarification, followed by an aerated lagoon system and
319

facultative settling lagoons for additional pollutant removal. Performance data over a four-year period for Plant 980 indicate that the treatment system is discharging after treatment 3.61 kg/kkg (lb/1000 lb) for BOD and 5.02 kg/kkg (lb/1000 lb) for TSS. The BCT limitations for this subcategory were derived by multiplying the long term average performance of Plant 980 by the daily and 30-day variability factors for Plant 980 documented later in this section. Specific engineering and design criteria for this BCT system include:
Primary Clarifier Overflow Rate
Nutrient Addition to Maintain C:N:P at
Activated Sludge System
Detention Time
400 gpd/sg ft
100:5:l
0.000053 days/lb BOD removed
Aeration 0.029 HP/lb BOD removed
Secondary Clarifier Overflow Rate: 284 gpd/sq ft
Aerated Lagoon
Detention Time
Aeration Capacity
Final Settling Lagoon Detention Time
BCT LIMITATIONS
, 0.00028 days/lb BOD removed
0.034 HP/lb BOD removed
;96 hours
The following limitations are applicable to plants which produce insulation board:
Pollutant or Pollutant Property
BOD TSS pH
BCT Effluent Limitations Max~mum f~r Average of daily any one day values for 30
consecutive days* kg/kkg (lb/1000 lb) of
gross production 8.13 4.32 5.69 2.72
Within the range 6.0 to 9.0 at all times
*Based on 30 observations for the 30-day period. I
320

The followin9 limitations are applicable to plants which produce smooth-one-sidE~ ( SlS) hardboard:
Pollutant or Pollutant Property.
BCT Effluent Limitations Maximum for Average of daily any one day values for 30
consecutive days*. kg/kkg, ( lb/1 000. lb) of
gross production BOD -3 . 8 3 . 2 . 5 1 TSS 10~9 7.04 .._P __ H ________ . _____ -- ~W .. i .... t __ h __ i __ n.;;..-_t __ h __ e__.r;;;_a_...n_.q __ e ___ 6 ..... ,_0_....t .... o--'9_. __ 0 ___ a_t~. a=l=l.......aat..aai=m,_e..aas ___
*Based on 30 observations for .the 30-:day period.
The following limitations are applicable to plants which. produce smooth-two-sides (S2S) hardboard:·
Pollutant or Pollutant Property
BOD TSS pH
BCT Effluent Limitations Maximum for Average of daily any one dc.ty values for 30
,· . consecutive .days* kg/kkg (lb/1000 lb) of
.- gross production 13.·2 8.62 . 13.9 9.52
Within the range 6.0 to 9~0 at all times
*Based on 30 observations for the 30 day period
The maximum average of daily values for any thirty consecutive day period should not exceed: the 30-day effluent - limitations shown above .. As shown in the tables above, the 30-day effluent limitations are based on 30 observations for the 30-day. period. The maximum for any one .day should not exceed the daily maximum effluent limitations as shown above. The limitations shown above for insulatio,n board and wet process hardboard subcategories are _ in kilograms of. pollutant per metric ton of gross production (pounds of pollutant per 1,000 pounds - of gross production). Gross production is defined as the air dry weight of hardboard or insulation boat.d following formation of the wet mat prior to trimming and finishing operations.
ENGINEERING ASPECTS OF CONTROL TECHNOLOGY APPLICATION
The technologiy that·achieves a BCT level of control is used - by many plants in the insulation board/wet process hardboard segment of_ the timbeir indllstry to achieve effluent levels equal to or_
321

below those specified in the BCT effluent limitations. For the insulation board/wet process hardboard segment, seven of the fourteen direct dischargers currently· meet BCT effluent limitations presented herein. The BCT effluent levels are based upon treatment systems currently in place and the performance levels are supported by a two to four year data base of daily effluent monitoring data provided by the plants.
TREATMENT VARIABILITY ESTIMATES
BCT effluent guidelines limitations for the insulation board/wet process hardboard segment were calculated by multiplying the long term average treated effluent waste loads of the BCT exemplary plants by the daily and 30-day performanc~ variability factors for the BCT exemplary plants. The derivation of the BCT numerical limitations is presented in Table IX-1. For example, in Table IX-1 the daily variability factor for insulatio'n board BOD is 3.92, and the long term average is 2.07. Therefore, the BCT numerical limitation for any one day is the product,
(3.92)(2.07} = 8.11*
Similarly, the monthly variability factor from Table IX-1 for insulation board BOD is 2.08, so the monthly numerical limitation for the average of thirty daily measurements is the product of this variability factor and the long term mean:
(2.08)(2.07) = 4.31*
Daily variability factors were calculated using nonparametric estimates of the 99th percentile. These estimates were based on the extended (two to four year) data base available for each exemplary plant. The nonparametric estimation is a standard statistical technique that is explained and discussed in Appendix G, STATISTICAL METHODOLOGY FOR DETERMINING PERFORMANCE VARIABILITY OF TREATMENT SYSTEMS . . Thirty-day variabilities were calculated :using a statistical model which accounts for the effects of seasonality and autocorrelation. This model is used to estimate the 99th percentile of the 30-day monthly averages, ;using the two to four year data base. Complete details of the statistical methodology used by the Agency in calculating daily and 30-day variability factors for BCT exemplary piants are contained in Appendix G.
*The products of multiplying the variability factors by the long term average treated effluent loads may vary slightly from the BCT numerical limitations shown in Table IX-1 due to rounding of the variability factors and long term averages.
322

w N w
Table IX-1. BCT Nm=rical Limitations
Subcategory -
Insulation Board
Wet-Process Hardboard
SIS
S2S
Daily Variability _
Factors ' BODS TSS;.
30-Day Variability
Factors BODS . TSS
3. 92 4. 34 2. 08 2. 08
4.15 3.61 2.72 2.34
3.67 2. 77 :2.39 1.90
IDng-Tenn Average Treated
EffliEnt Wiste· !Dads kg/kkg (lb/1000 lb)
BODS TSS ·
2.07
0.922
3.61
1.31
3.01
5.02
Ber Nunerical Limitations Maximun Average of Thirty
For Any· U-1.e Day Iaily M:?asureuents kg/kkg (lb/1000 lb) . kg/kkg (lb/1000 lb)
BODS TSS BODS TSS
8.13
3.83
.13.2
5.69
10,9
13.9
4.32
2.Sl
8.62
2.72
7 .04
9.52
Note: The products of trultiplying the variability factors by the long-tenn average treated effltent loads may vary slightly from the Ber ntm:!rical limitatfons shom. abov!:? dtE to rotniing of the variability factors and long-tenn averages. ·

COST AND EFFLUENT REDUCTION BENEFITS PROCESS HARDBOARD
INSULATION BOARD/WET
EPA expects that the total capital investment necessary to upgrade the treatment systems of the seven .direct dischargers not achieving BCT effluent limitations will be $20.3 million. Operation and maintenance costs for these plants will increase by $6.3 million per year. An incremental increase in capital investment and in the operation and maintenance costs of $11 million and $2.6 million per year, respectively, will be required by the seven direct dischargers to upgrade their treatment systems from BPT to BCT. Achievement of the BCT effluent limitations will remove approximately 13 million pounds per year of conventional pollutants (BOD and TSS). This is an incremental increase of 11 million pounds per year over that removed resulting from the achievement of BPT effluent limitations. EPA believes that these effluent reduction benefits outweigh the associated costs.
NONWATER QUALITY ENVIRONMENTAL IMPACT
The primary nonwater quality impact of the BCT limitations is the waste sludge generated in the candidate treatment systems and the increased burden of the land to accept the disposal of this sludge.
In the insulation board/wet· process hardboard segment of the industry, large volumes of waste sludge are generated in biological wastewater treatment systems. An estimated 500,000 cubic yards per year of such sludge is currently generated by the 26 plants in the insulation board/wet process hardboard segment. The estimated incremental increase in sludge production (from current levels of performance to BCT) as a result of compliance is expected to be 83,000 cubic yards per year, or about 16 percent of the total amount of sludge currently generated. This sludge production represents an incremental increase of 49,000 cubic yards per year over that generated as a result of BPT. Limited data from the preliminary results of a current timber industry study of Best Management Practices (BMP) suggest that significant quantities of toxic materials .are not present in insulation board and hardboard sludges, .and they appear to be amenable to disposal in a normal sanitary landfill.
Energy Requirements
There are no additional energy requirements for the insulation board subcategory as none of the insulation board plants will be required to construct additional pollution control facilities to comply with BCT.
The current total annual energy consumption of the wet process hardboard subcategory is about 6,050,000 megawatt-hours, equivalent to about 9,961,000 barrels of oil. This energy is
324

used not only for production processes, but also to operate. in-place wastewater treatment systems.
To comply with BCTf. the hardboard subcategory will be required to consume an additional 12,000 megawatt-hours per year, or 20,000 .. barrels of oil. per year, beyond that required to attain BPT. This represents an annual energy requirement of only 0.7 percent of the current total annual energy requirement, which is a 0.2 percent increase beyond the energy required to attain BPT. The additional energy required to attain BCT is for the operation of additional pollution control facilities. ·
GUIDANCE TO NPDES PERMITTING PERSONNEL
Application o,f Insulation Board/Wet Process Hardboard BCT Effluent Limitations
1. If a plant has production in more than one subcategory, or production in. both parts of a subcategory, the allowable discharge (mass) should be prorated on the percentage of the total annual production, divided by the discharging days per year, for each subcategory or part ..
2. The production figure recommended for calculating these limitations .. is_ the daily average gross production of the maximum 30 consecutive days. Gross production is defined as the air dry weight of hardboard or insulation board following formation of . :t.Qe wet mat prior to trimming and finishing operations.. ·
3. Daily and 30-day effluent limitations have been dertved. using statistical estimates of the 99th percentile, i.e., th? highE~st value which will not be exceeded 99 percent of the time. Conversely, large biological treatment systems can be statistically expected to violate the limitations about one percent of the time in normal operation. Enforcement personnel should consider this fact before taking enforcement action against individual plants.
325


SECTION K
BEST AVAILABLE TECHNOLOGY ECONOMICALLY ACHIEVABLE
GENERAL Best available technology economically achievable (BAT) is the level of control established for toxic and nonconventional pollutants. BAT effluent limitations which must be achieved by July 1, 1984, are not based on an average of the best performance within an industrial category, but on the very best control· and treatment. technology employed by a specific point source within the industrial category or subcategory, -or by another industry where the control and treatment technology is readily transferable. A specific finding must be made regarding the availability of· control measures and practices to eliminate the discharge of toxic and nonconventional pollutants, taking. into account the cost of such elimination.· BAT may include process changes or internal controls, even when they are not. common industry practice. BAT emphasizes internal controls, as-well as control or additional treatmeryt techniques employed at the end of the production process.
Consideration is also given to:
1. the age of the equipment and facilities- involved;
2. the process employed;
3. the.engineering aspects of the application of various types of control techniques;
4. process changes;·
5. the cost of achievi~~ the effluent reduction resulting from application of the technology; and,
6. nonwater quality environmental eneirgy requirements).
impacts (including
This level c,f technology considers those plant processes and control technologies which, at the pilot plant, semi-works,, and other levels, have demonstrated both technological performances and economic_, viapility at a level sufficient to reasonably justify inve~stment. It is the highest degree · of control technology tbctt has been achieved or has been demonstrated to be capable of being designed for plant-scale operation.up to and including ... '1 r10 discharge" of . process wastewater po.llutants •. Al though econc,mic factors are considered in this development, the. level of control. is intended to be the top-of-the-line of current· technology, e;ubject to l im.i tat ions .. imposeC, by economic and engineering feasibility. There may ·· be some technical risk;
-however, with respect to .·performance- and certainty of costs. Therefore, eic,me process . development and adaptation • may be
327

necessary for application of a technology at a specific plant site.
The statutory assessment of BAT "considers": costs, but does not require a balancing of costs against effluent reduction benefits (see Weyerhaeuser v. Costle, 11 ERC 2149 (D.C. Cir. 1978). In developing the proposed BAT, however, EPA: has given substantial' weight to the reasonableness of costs. The: Agency has considered the volume and.nature of discharges, the vplume and nature of discharges expected after application of BAT, the general environmental effects of the pollutants,. and the costs and economic impacts of the required pollution control levels.
Despite this expanded consideration of costs, the primary determinant of BAT is effluent reduction capability. As a result of the Clean Water Act of 1977, the achievement of BAT has become the principal national means of controlling toxic water pollution. '
Wood Preserving Segment
EPA has divided the wood preserving segment of the timber industry into three subcategories of plants; plants that treat wood using nonpressure processes or ~hich use waterborne preservatives (inorganic salts), plants that use steam conditioning to prepare wood for preservative impregnation, .and plants that use the Boulton process to prepare wood -for preservative impregnation. Those portions of the industry preserving with inorganics, and using the Boulton process are subject to a BAT. limitation of no discharge·of process wastewater pollutants promulgated in 1974.
BAT limitations for the Wood Preserving-Steam subcategory were originally promulgated in 1974. These limitations allowed a discharge of process wastewater, but establ~shed controls on COD, total phenols, oil and grease, and pH.
The technical study conducted to support the regulations presented in this document, identified only one plant in the Wood Preserving - Steam subcategory discharging process wastewater directly to the environment.
The Agency conducted an extensive mail survey, contacting about 290 wood preserving plants and received responses from 216. Telephone and personal contacts were also ~ade with Regional EPA offices, State pollution control offices, wood preserving plants and industrial technical trade associations. The purpose of these mail, telephone, and personal contacts was to determine t~e discharge status, treatment and control practices, and wastewater disposal practices of wood preserving plants.
Almost all wood preserving plants in the steam subcategory have eliminated the direct discharge of process wastewater pollutants, although they were not required to by· law, ,by the application of
328

a variety process controls and wastewater disposal techniques. These techniques and. procedures are discussed ·in detail in Section VII of this docu,ent.
The water conservation.practice most commonly found is the use e>f surface condm1ser:::t rather . than barometric condensers. This, reduces the amount of wastewater requiring treatment and/or disposal by eliminating the contamination of cooling water. Plants that did not replace barometric condensers almos,t without exception, recycle their barometric cooling water. Separation of
·steam condensate and contact process .wastewater results· in a significant.· dE~crease in the amount of process wastewater that must be handlE~d ..
Another optior1. available to plants is to dry the wood· raw material befc,re going into th.e treating cylinder. This ·practice shortens or eliminates the conditioning period in the retort~ Retort conditioning may or may not be needed depending on the amount of moie,ture :J.n the "?Ooq at .the time it · goes into the retort~ This method of controlling the amount of wastewater generation is not always available to wood preseiving plants, the cost of maintaining inventory and the availability of a dry kiln· or untreated wood storage area being the major factors. in determining the feasibility of.this practice~
A broad range of wastewater. treatment and disposal techniques or end-of-pipe tE~chnologies . are available to plants in this sub..category to achieve no discharge status. As presented in Section II, the most· frequent. wastewater disposal· technique is containment.and/or evaporation of wastewater. Evaporation can be assisted by spraying wastewater into the air, the use of heat exchangers, or the application of waste heat..
For the Wood Preserving-Waterborne or Nonpressure and the- Wood Preserving-Boulton subcategories, the Agency has decided to retain existinc;, BAT limitations which require no discharge of process wastewater pollutants. All known.· plants in these subcategories are already in compliance with these ·limitations and retention. of these limitations will insure that none of.the. identified toi:ic p0llutants present in wastewaters from· t.hese. subcategories, as ... described in Sections V, VI and VII of th.is document, will be discharged to receiving waters.
The single Wocjd Preserving-Stefim subcategory direct· discharger is·. located in southern Alabama - the area of the U.S. with the most intense precipitation, in terms of a 24-hour rainfall event .. The plant discharges only,when precipitation events are·intense and frequent. Eva(porati ve losses from. its aeration and holding lagoons are otherwise greater .than the volume of process· wastewater generated .. by the wood preserving operations.
329

~he Agency decided that it would not be appropriate to promulgate a national BAT limitation for one direct discharging plant. This plant, located in a State with NPDES authority, will be required to control the discharge of pollutants according to the terms of the permit. The permit issuing office has this document available to assist the permit writer in developing terms when the discharge permit comes up for renewal. Existing BAT limitations for this subcategory will be withdrawn.
Insulation Board/Wet Process Hardboard
EPA has divided this segment into two subcategories. The basis for the subcategorization is differences in the raw waste load due to the process employed, and the products produced. The insulation board industry makes up one subcategory. The wet process hardboard industry, one subcategory,, is divided by product produced into two parts, smooth-one-side hardboard (SlS) and smooth-two-sides hardboard {S2S).
i
The Agency withdrew BAT regulations, as well as BPT and NSPS regulations for the wet process hardboard subcategory in 1976.
Information presented in Sections V and VII of this document indicated that toxic pollutants, as identified by Section 307{a) of the Clean Water Act are not present in treatable amounts in wastewaters from the insulation board/wet process hardboard segment. BOD and TSS are the conventional pollutants found in high amounts.
Because toxic pollutants are not present a.t treatable levels in raw or treated wastewaters, the Agency has concluded that BAT limitations will not be promulgated for this segment.
Section IX of this document presents BCT limitations for the wet process hardboard/insulation board segment and the rationale for their development.
Barking Subcategory
Effluent guidelines and standards for the Barking subcategory were promulgated in 1974 (39 FR 13942 April 18, 1974). The 1974 rulemaking divided the Barking subcategory into two parts: mechanical barking, a basically dry operation using physical methods, such as blades or abrasive discs, to remove the bark, and hydraulic barking, .an operation that uses water applied to the wood under high pressure to separate the bark from the wood.
The 1974 BAT regulations required mechanical barking operations and hydraulic barking operations to meet an effluent limitation requiring no discharge of process was~ewater pollutants by 1983,
As part operators
of the current study, the Agency contacted all known of· hydraulic barking operations, State pollution
330

control· agencies, regional EPA offices and. equipment manufacturers. The purpose of this survey was. to; .identify hydraulic barking installationsj determine their process wastewater treatment and discharge status, and to determine the progress made by the industry in meeting the BAT implementation date. ·
Fourteen pl~nts having hydraulic barkihg_ installations were identified. Most. plants are practicing some degree of recycle of barking water, usually after clarification. The plant that was identified in 1974 as recycling about 80 percent is still at the 80 percent level of recycle, apparently unable to increase on the amount of recycle. · The plant estimated that., , ,bout 200,000 gallons per day of excess water is being discharged to receiving waters from the spr~y irri9ation system.
The timber indM~try, was surveyed to determine the most recent installation of a hydraulic barking facility and also, the possibilities of new in~tallations. The most recent installation occurred in .1969. Information-from an equipment manufacturer .who supplies the equipment indicated that no recent demand exists for hydraulic barking systems. This statement can be supported by a number of considerations. Energy requirements are- substantial for hydraulic barking; 750 to 2000 horsepower motors are required to develop , the l 000 to 1 500 pounds per square inch water pressures needed; large diameter logs, more easily barked by hydraulic barkers are less available-than they were a few ye~rs ago; capital investment and maintenance requirements of hydraulic barkers are considerably higher than mechanical_ barkers; and, environmental control considerations such as the operation and maintenance of a biological treatment system, are more expensive and· time consuming than.mechanical barkers. -
After review and evaluation of the above information, the Agency considered the ~ppropriateness of the existing BAT regulation.
Because of the industry's inability to increase the amount of reuse 6f treated wastewater and the ~onsiderations discussed above, the Agency decided that the existing BAT, no discharge of process wastewater pollutants, for hydraulic barking operations is not appropriate and should be withdrawn.
Veneer Subcategory
BPT regulations for this subcategory promulgated in 1974, requtred no, discharge of ·process wastewater pollutants for all veneer manufacturing plants, etcept for those plants that use direct stea.m conditioning of veneer logs. This exception was al.lowed· to grive plants -usihg direct steam conditioning. time to modify . thei.r operations before the BAT 1 imitation, · requiring no· discharge of process wastewater pollutants, from all plants, -:::ame in force. , ···· ·

Review of current veneer manufacturing process water management practices determined that no known veneer manufacturing plants are discharging directly.
During the screening phase of the current BAT Review study, sampling and analysis determined that toxic pollutants, particularly heavy metals are present in wastewaters generated by veneer manufacturing facilities.
Based on the current status of process water control, and the presence of toxic pollutants in veneer wastewaters, the Agency has determined that the existing BAT limitation of no discharge of process wastewater pollutants should remain in force.
Log Washing Subcategory
BPT for this subcategory allows the discharge of process wastewater pollutants. BAT regulations published in 1974 for this subcategory requires no discharge of process wastewater pollutants.
Review of current practices in the timber industry determined that, at this time, log washing is being practiced by fewer facilities than previously reported. Plants washing logs before further processing are recycling log wash water after settling and coarse screening. The BAT Review study revealed that toxic pollutants are present in log wash water, particularly heavy metals and phenol.
Based on the current status of process water contrc,l and the presence of toxic pollutants in log wash'waters, the Agency has determined that the existing BAT limitation of no discharge of process wastewater pollutants should remai~ in force.
332

SECTION XI
NEW SOURCE PERFORMANCE STANDARDS
GENERAL
The basis for new· source performance· standards (NSPS) under section 306. of the Act is the best ·available ·demonstrated technology (BADT). New plants have the opportunity. to design the best and mc>st efficient manufacturing processes and wastewater treatment technologies. Therefore, Congress directed EPA to conSi·der the best demonstrated process changes, in:...plant controls, and end-of-pipe treatment technologies which reduce pollution tc> the maximum extent feasible. ··· · ·
The Agency, upon thorough review and evaluation of.each of the candidate treat~ent technologies discussed in Sectioh VII, CONTROL AND TREATMENT TECHNOLOGY, has selected .the_no discharge
. options as the basis for NSPS for all subcategories in ·the'. wood preserving and insulation board/wet process hardboard.segments of the· industry. This. no discharge requirement will provide the maximum feasible control for, conventional, unconventiohal,· and toxic pollutants an~ is_based on demonstrated performance in each subcategory. Technologies required to eliminate th~ di§>charge of process wa~tewater pollutant~ for each subcategory are discussed below.
Wood Presen~Jng-Boul ton Subcategory
NSPS for this subcategory is no discharge of process wastewater pollutants. The candidate technologies for no discharg~ are cooling tower evaporation, spray evaporation, or spray irrigation as described in Section VI I,· CONTROL AND TREATMENT TECHNOLOGY. The BPT and BAT effluent limitations promulgated on April 18, 1974, are nc> discharge of process wastewater pollutants and ·all known Boultcm plants are currently achieving no discharge.
Cost to new sources in the Wood Preserving - Boulton subcategory for adoption of the technologies identified above are presented in Appendix A of this document.
Wood Preser,~ng-Steam Subcategory
NSPS for thE~ Wood Preserving - Steam subcategory is no discharge of process wastewatei:- pollutants. The candidate technologies for achieving no discharge are spray evaporation or spray irrigation, as described in Section VII. Although plants which. utilize the Boulton process for conditioning generally produce enough waste heat to use cooling tower evaporation to achieve no discharge, plants in the Wood Preserving Steam subcategory do not. Consequently, cooling tower evaporation is not a candidate technology for the Wood Preserving - Steam subcategory.
333

About ninety percent of all known Wood Preserving - Steam plants are currently achieving no discharge through the application of the technologies identified above or a combination of these technologies and treated effluent recycle.
Costs to new sources in the Wood Preserving - Steam subcategory for adoption of the spray evaporation and spray irrigation technologies are presented in Appendix A.,
Insulation Board and Wet Process Hardboard Subcategories
No discharge of process wastewater pollutants was selected as NSPS for the insulation board and. wet process hardboard subcategories through the application of spray irrigation technology. There are five plants in the insulation board/wet process hardboard segment which utilize spray irrigation for treatment and/or disposal of process wastewater. This technology has proven successful in this segment of the industry with and without biological treatment preceding spray irrigation as discussed in Section VIL. ·
Although spray irrigation generally requires more land than other technologies, including large b.iological treatment systems, new sources have the ability to choose locations where there is available land for spray irrigation.
Costs to new sources for adoption of this technology are presented in Appendix A of this document.
334

GENERAL
SECTION XII
PRETREATMENT STANDARDS
Section 307(b) of the Act requires EPA to promulgate pretreatment · standards for existing sources (PSES) to prevent the discharge of pollutants which pass through, interfere with, or are. otherwise incompatible with the operation of publicly owned treatment works ( POTW). ThE~ legislative history .of the l 977 Act indicates that pretreatment·standards are to be technology-based, analagous to the best avai.table technology: fot r~moval of toxic. pollutants.
One of .the principal objectives · of · PSES is to ensure parity between the:, treatment· of indirect_ discharger's and direct discharger's effluent. At a miriimum, Congress intended that the pollutant reduction achieved.by the combination of pretreatment and treatment at the municipal treatment ~orks would equal the pollutant reduction achieved by a direct discharger applying BAT treatment. Consequently, where the percentage reduction by a POTW of an indirect discharger's toxic effluent is less than the percentage rE:!duction by a comparable direct discharge BAT system,
.pretreatment is needed. Another objective of PSES.is to. ensure that toxic pollutants in POTW influents do not contaminate the POTW sludg,:! and thereby limit POTW sludge management alternatives, including the beneficial use of sludges on agricultural lands. The general pretreatment regulations which served as the:! framework for these pretreatment. regulations for the timber p1::c)ducts industry, can be found at 40 CFR P~rt ·403.
Pretreatment standards for existing sources must reflect the effluent reduction achievable through the application of the best available pretreatment technology. This includes treatment technology as employed by the industry, as well as in-plant controls coni;idered to be normal practice within the industry.
WOOD PRESERVING
Pretreatment Standards For Existing Sources, PSES ··r
Thirty-nine wood preserving plants discharge to POTW, 29 in the Steam subcatiegory and 1 O in the Boulton subcategory. In 1979, these plants'discharged approximately· 330,000 gallons per day ..
The Agency proposed, on October 31, 1979, to amend the existing PSES for the Wood Preserving-Steam and Boulton subcategories to add a no discharge requirement for penta_chlorophenol (PCP).. The existing PSES imposed a limitation.of 100 mg/1 for oil.and grease and set limits. on the metals copper, .chromium and arsenic.
The primary reason for the no discharge of PCP proposal was the. ·Agency's concern that PCP, a toxic pollutant, was passing through
335

POTW inadequately treated. Data in the Agency's possession, summarized in Table XII-1, demonstrates that at the low influent concentrations typical of a POTW receiving wood preserving wastewater, PCP is not greatly reduced by the POTW treatment processes. This conclusion is buttre~sed by data recently acquired from a POTW with high concentrations of PCP in its influent which demonstrates significant pass through. (See Table XII-1). Another reason for the Agency's proposed no discharge of PCP standard was that PCP was thought to have a relatively strong affinity for absorption on solid particles. If the absorbability of PCP proved to be the predominant mechanism for its removal in a POTW, accumulation of PCP in the :sludge might preclude beneficial uses of such sludge.
A number of commenters critized the proposed no discharge PCP standard on economic and other grounds. Several commenters questioned the practicality of evaporative technology based on potential transfer of toxic pollutants from wastewater to the air. Although neither hard data nor information confirming such transfer was submitted, the Agency has initiated studies to gather additional information regarding this question but none is available for inclusion in this document. However, the results of that study will be considered in future reviews and reevaluations of the effluent guidelines and standards.
! The Agency has decided not to promulgate 'the no discharge PCP standard proposed on October 31, 1979: Although PCP has been determined to pass through POTW, the Agency is troubled by the high (several million dollar) cost associ~te4 with achievement of the standard and the projected closure rate of three to five closures out of a total of twenty-four affected plants. Another factor entering into the Agency's decision is that the present oil and grease limitation 100 mg/1 effectively ensures control of PCP at the level of 15 mg/1. Still another consideration is that the PCP reduction achieved by the proposed PSES would not be huge. If the amount of PCP discharged by particular wood preserving plant causes some problems, PO~W's can establish more stringent controls .on PCP discharge in a case-by-case basis.
i
In the absence of a new PSES for the Wood Preserving-Boulton and -Steam subcategor~es, the existing ?SES will remain in force. This existing standard requires a limitation of 100 mg/1 on oil and grease, as well as 5 mg/1 for copper, ·4 mg/1 for chromium and 4 mg/1 for arsenic.
The Agency's decision to retain existing PSES will also result in no costs of compliance to the wood preserving segment above and beyond those considered in promulgatiqn of the December 1976 standard, and will therefore not result in any plant closures.
336

w . w. ......,
Table XII-1. Summary of Available Data--Pentachlorophenol in POTWs
POTW
Picayune, MS
Eugene, OR
Salem, OR
Corvallis, OR
Macon, GA
Augusta, GA
Seattle, WA
Stockton, CA
Stockton, CA ·
Wood Preserving Plant Discharge
to POTW
2.8 1. 9
Not analyzed·
Not analyzed
Not an~lyzed
14.0
0.90 9.00
. 0.160
1.2 15.0
Not analyzed Not analyzed .Not analyzed Not analyzed
.Not analyzed Not analyzed
PCP Concentration ·POTW
Influent
<0.010 <0.010
0.0041
0.0046
0.0014
0.100
0.060 <0.001
<0.001
0.020 <0.010
0.42 0.24 0.18 0.64 0.48 0.10
(m_g/1) Trickling Filter
Effluent*
"'--t
0.072 0.040
0.16 0.17 0.14 0.44 0.29 0.12
POTW Effluent
<0.010 <0.010
0.0033
0.0044
0.0010
<0.001
0.050 0.035
<0.001
<0.010 <0.010
0.15 0.17 0.16 0.27 0.10 0. Ll
Data Source
ESE, ARL, 1979**
Buhler, 1973tt
Buhler, 1973
Buhler, 1973
AWPI, 1979***
AWPI,. 1979
AWPI, 1979
ESE, ARL, 1980
Burns & Roe, EPA,: 1980ttt
*Trickling filter effluent re·ceives further treatment. consisting of secondary sedimentation, nitrification in polishing pond system, chlorination for disinfection, and dechlorination prior to discharge to receiving water.
tHyphen means not applicable. **Samples coll~cted by ESE and analyzed by Analytical Research Laboratory (ARL). ttBuhler, Rasmusson, and. Nakaue, "Occurrence. of Hexachlorophene and Pentachlorophenol in Sewage and Water,"
Environmental Science and TechnoloPa, October 19.73. . · ***Samples collected by AWPI member pants and analyzed by the Mississippi State University Forest Products
Utilization Laboratory; · tttsamples collected by Burns & Roe and analyzed by EPA Region VII. .

Pretreatment Standards For New Sources, PSNS
Steam and Boulton Subcategories. Section 307(c) of the Act requires EPA to promulgate pretreatment standards for new sources {PSNS) at the same time that it promulgates NSPS. As with PSES, PSNS is intended to prevent the discharge of any pollutant which passes through or interferes with the operation of a POTW, or which limits beneficial uses of POTW sludge. New sources, however, have the opportunity to incorporate the best available demonstrated technologies including process changes, in-plant controls, and end-of-·pipe treatment technologies. New sources also have the opportunity to select the location of new plant sites in such a way as to allow the installation of land intensive technologies.
The Agency proposed a PSNS for the Steam and Boulton subcategories which required no discharge of process wastewater pollutants. The rationale for this proposed standard was something like the Agency's rationale for PSES: (l) such a standard would prevent the wood preserving wastewater pollutants, PCP and heavy ~etals, from passing through POTW inadequately treated, (2) there existed a demonstrated and widely utilized technology in the wood preserving segment for achieving zero discharge.
After careful consideration of the comments, the Agency has decided to promulgate the no discharge PSNS as proposed. The chief factor differentiating the Agency's PSNS decision from its PSES decision is economic.
A new source has opportunities, not always available to an existing source, to install equipment, such as surface condensers, that do not result in the generation of contaminated cooling water. A new source has the opportunity, if spray evaporation or spray irrigation is selected as the wastewater disposal technique, to include land requirements in the decision making process for site selection. These wastewater treatment and disposal options are discussed in detail in Section VII -CONTROL AND TREATMENT TECHNOLOGY.
As a result of this greater flexibility, new sources are often better able to withstand the cost of pollution control technology than existing sources. The Agency's economic impact analysis of the wood preserving industry concludes that the cost of designing and installing the proper systems needed to achieve no discharge status would not hinder the addition of new capacity. Another consideration is the need to ensure that there is no bias in favor of a new source choosing indirect discharge over direct discharge because of different treatment· ~equirements. Inasmuch as new source direct dischargers in .the Boulton and steam subcategories would be required to achieve no discharge, the pretreatment limits should ensure a similiar level of treatment for pollutants which are not adequately treated by PO'rW.
338
I•

Wood Preserv:u,g-Water Borne or Nonpressure Subcategory-- No discharge of process wastewater pollutants was selected as PSNS because technology for achieving no discharge is widely practiced in this subcategory. All known plants in the Wood Preserving Water Borne or Nonpressure subcategory currently apply no discharge technology consisting of process wastewater collection for makeup of future preservative treating solutions.
Costs associated with the process wastewater collection and recycle technology are minimal, and this technology is easily incorporated into the plant design. The no discharge PSNS corresponds with BPT and BAT effluent limitations which were promulgated 011 Apri 1 1 8, 197 4.
WET PROCESS HARDBOARD/INSULATION BOARD
, Pretreatment 1:;·E:andards For New and Existing Sources
The conventional pollutants present in effluents from hardboard and insulation board producing facilities are treatable by biological trieatment as practiced by publicly owned· treatment works. _Sev~n plants in the wet process hardboard/insulation board _segment currently discharge to POTW. The Agency is not aware of any incidents where discharge from one of these plants has caused an upset, or has been otherwise incompatible with the operation of a POTW.
The Agency is promulgating pretreatment standards for new and existing sources in the wet process hardboard and the insulation board subcategories that do not establish numerical limitations on the discharge of spe.cific pollutants but do require conformance with the general requirements of 40 CFR 403 .
.. ,., .... ~39 ..... \:


SECTION XIII
.ACKNOWLEDGEMENTS
Mr. Richard E. Williams served as. the EPA Effluent Guidelines Division Project Officer during the development of the effluent limitations guidelines and the preparation, of this document. His overall guidance and coordination of the technical information was indispensible to the promulgation of this regulation.
The directicm, assistance and cooperation of EPA personnel is greatly appreciated. In particular, Mr. John E. Riley, Chief, Wood and Fiber Products Branch made major contributions. Mr. Steven Schat~!:OW, formerly Associate General Counsel, Mr. · Michael Murchison and Ms. Susan Lepow of the Office of General Counsel. provided positive contributions in molding the technical/legal considerations into a cohesive package.
The technical study supporting the regulation was conducted by Environmental Science and Engineering, Inc~ (ESE), Gainesville, Florida. The Project Directors were Mr. John D. Crane, P.E. and Mr. Bevin A. Beaudet, P.E. Mr. Beaudet and Mr. Russell V. Bowen functioned as Project Managers during the rulemaking development program. Analytical works by ESE was managed by Mr. Stuart Whitlock and Mr. Charles Westerman. ESE staff involved in the technical study and document preparation included Ms. Patricia Markey, Ms. Jacqueline Betz, Mr. Mark Mangone, Mr. William Beckwith, Ms. Patricia McGhee, Ms Joanne Demme, Ms. Kathy Fariella, Mis. Pamela Dickinson, and Ms. Kathleen Hudek.
The contribution of Dr. Warren S. Thompson, Director, Forest Products Utilization Laboratory, Mississippi State University is greatly app1reciated. Dr. Thompson served as a consultant to ESE. Dr. James •r. McClave, INFO-TECH, INC., Gainesville, Florida assisted in the statistical .analysis of wet process hardboard and insulation board effluent data.
The Edward C. Jordan Company, Portland, Maine and Ryckman, Edgerly, Tomlinson and Associates, St. Louis, Missouri also provided information, field sampl in_g and analyti_cal efforts during the project.
Cooperation and assistance provided by timber industry members through their companies and associations is greatly appreciated. Appreciation is expressed to the American Hardboard Products Association (AHA), the American Wood Preservers Institute, · the American W1::,od .. P~~e;er.;ve1:s .... ~~i;:;o~ia~ic:m, and the National Fprest Products Association. Individuals wh6 deserve mention are Mr. C. Curtis Peterson, AHA, Mr. C. C. Stewart, Process Design· Associates, Mr. Wayne Johanson, Superwood.Corporation, Mr. Thomas· Marr, KOPPERS Co., Mr. Charles Best, J. H. Baxter and Sons, and Mr. Charles Burdell, ITT-Rayonier, Inc.
n" ,, " ,,
· ·341

Dale Ruhter, Harold Lester and Susan Green, Office of Analysis and Evaluation, Mark Segal and Alexandar Tarney, Monitoring and Data Support Division, and Sam Napolitano, Office of Planning and Evaluation are recognized for their assis~ance.
Mr. Gregory Aveni, Co-,op student from Drexel University, and Mr. Jim Morrison, Co-op student from Ge~rge Mason University, provided invaluable technical and editorial assistance. The performance of Ms. Carol Swann, of the Guidelines Implementation Branch, Effluent Guidelines Division is greatly appreciated. Her efforts, along with the other members of the Word Processing staff who finalized this document for publication are recognized.
342

SE.CTIQij. XIY ·
BIBLIOGRAPHY
Abitibi Corporation. 1975a. How Abitibi Insulation Board Mill Achieves Zero Effluent. Discharge. Pulp and· Paper. Troy, Michigan.
Abitibi Corporation. 1975b. Zero Water Discharge---Insulation· Board Manufacturing. ·Environmental Improvement Awards Program, American Paper Il'lsti tµte .. ·Troy,. Michigan.
Amberg, H.R. 1965. Aerated Stabilization of Board Water; Purdue University Engine~ring Extension Lafayette, Indiana, 118:525.
Mill . White Series, West
American Petroleum Insbitute. 1960. The API Manual on Disposal of Refinery Wastes. Wastewat~r· Containing Oil. 6th Edition, Volume 1. Washington, D.C.
American Public Health Association, . Water Pollution Control Federation and American Water Wor.ks Association. 1975. Standard Methods for the· Examination of· Water and Wastewater. 14th Edition. Washington, D.C.
American Wate:r Works Association. 1969. Water Treatment Plant Design. Denver, Colorado.
American Wo,c,d · Preservers' Association. 1960. Report of Wastewater Disposal Committee. Proceedings of the American Wood. Preservers' Association~ (56):201.
American Wood Preservers' Association. 1975. Proceedings of the American Woc,d Preservers' Association. Volume 71. Bethesda,. Maryland.
American Wood Preservers' Association. 1976 .. Py;oceedings of the American Wood Preservers'. Asso~iation. Volume 72. . Bethesda, Maryland.
American Wood Preservers' Association.· 1977. Creosote and Creosote Solutions--Wood Preservatives. Proceedings of the American Wood Preservers' Association, (73):32.
Anonymous. 1975. Phenols in Oxidized with aydrogen Peroxide.
Refinery Waste Water Can be Oil and Gas Journal, (73)3:84.
Arsenault, R.D. 1976. Pentachlorophenol and Contained Chlorinated. Dibenzodioxins in the Environment~-A Study of Environmental Fate, Stability and Significance When Used in Wood Preservation. Proceedings of the American Wood Preservers' Association, (72):122. Bethesda, Maryland.
343

Aub, J.C., and Fairhall, L.T. 1942. Excretion of Silver in Urine. Journal of the American Medical Association, (118)4:319.
Auchter, R.J. 1971. Trends and Prospects for Use in Fiber Products, Forest Products Laboratory. USDA Forest Service. Proceedings of the Aspen Symposium, p. 40.
Austin, R.H., et al. 1954. Biological Qxidation of OilContaining Wastewaters in Pilot Scale Trickling Filters. Ind. Eng. Chem., (46)2:316.
Back, E.L., and Larsson, S.A. 1972. Increased Pulp Yield as a Means of Reducing the BOD of Hardboard Mill Effluent. Swedish Forest Products Research Laboratory, Stockholm, Sweden.
Back, E.L. 1972. The Dissolution of Wood Material During Pressurized Refining and Water Pollution Consequences. Swedish Forest Products Research Laboratory, p. 17. Stockholm, Sweden.
Badger, E.H.M., and Jackson, M.I. 1961. Loadings and Efficiencies in the Biological Oxidation of Spent Gas Liquor. Journal and Proceedings of the Institute of Sewage Purification, (2):159.
Baker, D.A. 1975. Petroleum Processing Wastes. Pollution Control Federation, {47)6:1476.
Ji:>urnal Water
Bakir, F., et al. Science, 181:230.
1973. Methylmercury Poisoning in Iraq.
Bartow, E., and Weigle, O.M. 1932. Indus. Eng. Chem., (24)4:463.
Zinc in Water Supplies.
Bennett, D.J., et al. 1973. Pilot Application of the Rotating Biological Surface Concept for Secondary Treatment of Insulating Board Mill Effluent. TAPPI, (56)12:182.
Bergfund, F., and Berlin, M. 1969. Risk of Methylmercury Accumulation in Men and Mammals and the Relation between Body Burden of Methylmercury and Toxic Effects. In: Chemical Fallout, p. 258, M.W. Miller and G.G. Berg, Editors. Springfield, Illinois.
Best, c.w. Proceedings (68):137.
1972. Water Use in Western Wood Preserving Plants. of the American Wood Pr~servers' Association,
Biczyski, Jr., and Suschka, J. 1967. Investigations on Phenolic Wastes Treatment in an Oxidation Ditch. In: Advances in Water Pollution Research. Pergamon Press, New York, 2:285.
Boen, D.F., and Jahannsen, G.L. 1974. Reverse Osmosis for Treated and Untreated Secondary Sewage Effluent. U.S.
344

Environmental Protection Agency., Washington, D.C. 007.
EPA-670/2-,74-
Buhler, D.R., et al. 1973 .. Occurrence of Hexachlorophene.and PentachlorophEmolinSewage and Water. Environmental Science and Technology, (7}10:929.
,, ,
Burns, o~B., Jr., and Eckenfelder, W.W., Jr. 1963. Statistical Study of Five Years' Operation of West Virginia and Paper Company's Waste Treatment Plant. Proceedings of XVIII Purdue In?ustr.~a} Waste, Conterence,. (48} :83 ..
A Pulp the
Cadman, T. w.. 1974.. Techniq~es for· Removing Metals from Process · Wastewater. Chem. Eng.,· ( 81 ),8: 79.
Carus Chemical Company. 1971. Company's Waste Economically. 6001.
How to Clean Phenol from Your Carus Chemical Company, Form M-
Chamber,lin, N.S., and Day,. R.V. 1956. Technology of Chrome Reduction with Sulfur Dioxide. Proceedings of the XI Purdue Industrial Waste Conference, (41.)2:129.
Cheremisinoff, P.N., and Ellerbusch,.F., Editors. 1978. Carbon Adsorption Handbook. Ann Arbor Science Publishers, Ann Arbor, Michigan.
Cheng, M.H., :et al. 1975. Heavy Metal Uptake by Activated Sludge. Journal Water Pollution Control Federation, (47)2:362-376.
Chow, .T.J., and Patterson, C.C. 1962~ ~he Occurrence and· Significance of Lead Isotopes in Pelagic Sediments. Geochim., Cosmochim, Acta~, (26):263.
Christensen, H.E. 1976. Registry of Toxic Effects of Chemical Substances. U.S. Department of Health; Education, PHS, Center for Disease Control, National Institute for Occupational Safety and Healthi Rockville, Maryland.
Clark, J.W., · ~nd Pollution Control. Pennsylvania.
Viessman, W., Jr. 1970. Water Supply and International, Textbook Company, · Scranton,
Coda, R.L. 1978. Water Reuse in a Wet Process Hardboard Manufacturing. Plant. U.S. Environmental Protectidn Agency. Cincinnati, Ohio. . EPA-600/2-78-J 50 .
Coe, R. H . 1 9 5 2 . Activated Sludge.
. Be.nch .. ··scale . Method·. for Treating Waste by Petroleum. Processing, ( 7): 112.8. ·
, L'
Cooke, R., and Graham, P.W .. 1965. The Biological Purification of the Effluent· from a Lurgi.Plant Gasifying ·Bituminous Coals. International Journal of Air and Water Pollution, 9(3):97.
',-:' .,;,"'!"'

Crane, L.E. 1970. An Operational Pollution Control System for Pressure Treating Plant Waste. Proceedings of the Conference on Pollution Abatement and Control in the Wood Preserving Industry, W.S. Thompson, Editor. Mississippi Forest Products Laboratory,, Mississippi State University, State College, Mississippi, p. 261.
Dallons, V. 1976. Comparison of Pollution Loads Resulting from Use of Different Wood Species in the Production of Hardboard. Industrial Environmental Research Laboratory, Cincinnati, Ohio. Corvallis Field Station, Corvallis, Oregon.
Dallons, V. 1978. Pollution from Several Wood Species in Hardboard Production. Forest Products Jo~rnal, (28)1:42.
Dallons, V. 1979. Hardboard Industry. Laboratory, Cincinnati, 2679-008.
Raw Wasteload Characteristics Industrial Environmental
Ohio. Corvallis, Oregon.
of the Research
EPA-600/2-
Davies, J.J. 1970. Economic Considerations of Oxidation Towers. Proceedings of the Conference on Pollution Abatement and Control in the Wood Preserving Industry, W.S. Thompson, Editor. Mississippi Forest Products Laboratory, Mississippi State University, State College, Mississippi, p. 195.
Davis, R.W., et al. 1964. Pollution Control and Waste Treatment at an Inland Refinery. Proceedings of the XIX Purdue Industrial Waste Conference, p. 126.
DeJohn, P.B., and Adams, A.D. 1975. Activated Carbon Improves Wastewater Treatment. Hydrocarbon Proceedings, p. 104.
Dickerson, B.W., and Laffey, W.T. 1959. Pilot Plant Studies of Phenolic Wastes from Petrochemical Operations. Proceedings of the XIV Purdue Industrial Waste Conference, p. 780.
Dobbs, R.A., et al. 1978. Carbon Adsorption Isotherms for Toxic Organics. u:-S.-Environmental Protection Agency, Municipal Environmental Research Laboratory, Office of Research and Development, Cincinnati, Ohio.
Draper, R.E., and Mercer, F.S. 1963. Hydraulic Barker Effluent Clarifier at Wood Products Division. Proceedings of the 11th Pacific Northwest Industrial Conference, p. 168.
Dure!, W.A., and Helfgott, T. Organics by Reverse Osmosis. Federation, (47)1:57.
1975. Removal of Wastewater Journal Water Pollution Control
Dust, J.V., and Thompson, W.S. 1973. Pollution Control in the Wood-Preserving Industry, Part 4. Biological Methods of Treating Wastewater. Forest Products Journal, ( 23 ).9: 59.
346

Eckenfelder, W.W., Jr. 1966. Industrial Water Pollution Control. McGraw-Hill Book Company, New York.
Eisenhauer, H.R~ 1964. Oxidation of Phenolic·wastes. Part I: Oxidation with Hydrogen Peroxide and a Ferrous Salt.Re1gent. Journal Water. Pollution Control Federation, (36)9:1116.
Eisenhauer, H.R. 1971. Increased Rate and Efficiency of Phenolic Waste Ozonization. Journal Water Pollution Control Federation, 43(1):200~208.
Evans, F.L., Treatment. Michigan.
Editor. Ann Arbor
1972. Ozcine in Water and Science i?u.blishers, Inc.,
Wastewater Ann Arbor,
Fang, H.H. ,- and Chian, E.S. 1975. Removal of Alcohols and Aliphatic Acids in Aqueous Solution by NS-100 Membranes. Jour. App 1 . Polymer Sci . , ( 1 ·9 ) : 1 3 4 7 .
Fisher, C.W. 1971. Kopper's Experience Regarding Irrigation. of Industrial Effluent Waters and Especially Wood Treating Plant Effluents. Proceedings of the Conference on Pollution Abatement and Control in the Wood Pre::;erving Ind., W.S. Thompson, Editor. Mississippi Forest Products Laboratory, Mississippi State University,· State College, Mississippi, p; 232.
Fisher, C.W. 1971. $oil Percolation and/or Irrigation of Industrial Effluent Waters--Especially Wood Treating Plant Effluents. Forest Products Journal, (21)9:76.
Fitzgerald, W.F., and Lyons, W.B. 1973.-. Organic Mercury Compounds in.Coastal Waters. Nature, (242)5398:452.
Fleischer, M., et al. 1974. Environmental Impact of Cadmium: A Review by thei Panel on Hazardous Trace Substances. Environmental Health Perspectives. U.S. Government Printing Office, Washington, D.C., 7:253.
•• .+
Ford, D.L., et al. 1972. Temperature Predictions in Activated Sludge Basins Using Mechanical Aerators. Proceedings of the XXVII Purdue Industrial Waste Conference, p. 587.
Francingues, N.R. · 1970. · Evaluation of a Pilot Study on a Creosote Waste~ from the Wood Preserving Industry. Proceedings of Mississippi State University Short Course--on Pollution Abatement and Control i.n the Wood Preserving Industry, p. _ 165.
Gaudy, A.F. ,. Jr. 1971. The Rote of Oxidafion Ponds in a .Wood Treating Plant Waste Abatement Program. Proceedings of the Conference cm . Pollution Abatement and Control in the Wood Preserving Industry, w.s. Thompson, Editor. Mississippi Forest Products Labe>ratory, Mississippi State University, State College, Mississippi, p. 150.
347

Goldsmith, R.L., et al. 1974. Ultrafiltration of Soluble Oil Wastes. Journal Water Pollution Control, (46)9:2183.
Gran, G. 1972. Wastewater. from Fibreboard Mills. Applied Chemistry, p. 29.
Pure and
Harlow, H.W., et al. 1961. A Petrochemical Waste Treatment System. Proceedings of the XVI Purdue Industrial Waste Conference, pp. 156-166.
Henshaw, T.B. 1971. Adsorption/Filtration Plant Cuts Phenols from Effluent. Chem. Eng., (78)5:47.
Hsu, C. P., et al. 1967. Phenolic Industrial Wastes Treatment by a Trickling Filter. Chem. Abs., (67)20:8845.
Hughes, R.A., and Lee, G.F. 1973. Toxaphene Accumulation in Fish in Lakes Treated for Rough Fish Control. Environmental Science and Technology, (7)10:934.
Hurst-Gaul, E. 1974. Expectations of the. Closed Water System Compared with the Costs of Effluent Clarification. Institute of Paper Chemistry, (28)10:443. ·
Hutchins, R.A. 1975. Thermal Regeneration Costs. Progr. , ( 71 ) 5 : 8 O •
Chem. Eng.
Hyde, A.C. 1965. Chemical Plant Waste Treatment by Ten Methods. Journal Water ?ollution Control Federation, (37)11:1486.
Ingols, R.S., et al. 1966. Biological Activity of Halophenols. Journal Water Pollution Control Federation, (38)4:629.
Institute of Paper Chemistry. BOD and Solids Content of Appleton, Wisconsin.
1963. Effect of Steam Pressure on Pulping Effluent, Project 2433.
Irukayama, K., et al. 1962. Studies. on the Origin of the Causative Agent of Minamata Disease, III: Industrial Wastes Containing Mercury Compounds from Minamata Factory. Kumamoto Medical Journal, (15)2:57.
Jacobson, v.c. 1941. Lead and Silver in Urinary Calculi. Journal of the American Medical Associatio~, (117):1557.
Johnsen, Study of National 004c.
R. 1975. Chlorination of Waters for Disinfection--A the Production of Undesirable ,Chlorinated Products. Conference on Polychlorinated Biphenyls. EPA-560/6-75-
Jordan, E.C., Inc. 1976. Summary Report on the Re-Evaluation of the Effluent Guidelines for the Wet Process Hardboard Segment of the Timber Products Processing Point Source Category. EPA/68-01-3287.
348

Junk, G.A., et al. 1974. Contamination of Water by Synthetic Polymer Tubes. Environmental Science and Technology, ( 8} 12: 1100.
Kehoe, R.H., et al. 1944. The Hygienic Significance of the Contamination-- of Water with Certain Mineral Constituents. Journal American: Water Works· Asso.ciation, ( 36): 645 ..
Kirsh, E.J.,-and Etzel, J.E. Pentachlorophenol. Journal (45)2:359.
1973. Microbia~· Decomposition of Water Pollution Control Federation,
Kostenbader, P.D~, and tleck~t~iner, J.~. 1969. Biological Oxidation of Coke Plant Weak Ammonia Liquor. Journal Water Pollution Control Federation, (41}2:1i9.
Kozki, v. P., et al. 1979. Reviews of the Environmental Effect of Pollutants-XI-,-Chlorophenol. EPA-600/1-79-012.
Kremen, S.S. 1975. Reverse Osmosis Makes High Quality Water Now. Environmental Science and Technology, .(9)4:314. ·
Lambert, H.G., and Pease, D.A., Editors. 1977. Directory of the Forest Products. Industry. Miller Freeman Publications. San Francisco, California.
Lieber, M., and Water by.Cadmium. (46)51 :541.
Welsch, W.F .. 1954 .. Con~amination of Ground Journal American .Water Works Association,
Lin, Y.H., an~ tawsori, J.R. 197i. Treatment of'.Oily and MetalContaining Wastewater. Poll. Eng.,· (5·} 11 :45.
Lorenz, L.F., and Gjovik, L.R. Chromatograph~;: Relationship Proceedings c>f the American .. (68} :32.
1972. to
Wood
Analyzing Creosote by Gas Creosot~ Specifications~ Preservers'· · Association,
Loyttyniemi, K. 1975. Transfer of Lindane from InsecticideSprayed Pine Pulpwood into Effluent from a Drum. Paperi Puu, Finnish--Eng. Sum. Abs., (57)10:666.
Bark of Barking
Ludberg, J.E., and Nicks, G.D. Removed from Cc)ke Plant Effluents~·
1969. Phenols and Thiocyanate Ind. Wastes, p. 10.
Martin, J.J., .,Jr. 1973. Removal of Heavy Metals.
Chetnical Treatment of Plating Waste for EPA/'.R2-73;...044.
McKeown, · J. J., anc.f Buckley, D.B. of Aerated Stabilization Basins.
1971. Mixing Characteristics TAPPI, (54)10:1664.
McLain, L. 1973~ Giving Effluents the Ozone Treatment. Could UK Innovation Show the Way? Process Eng., (1):104.
349

Meissner, B. Containing 49:14237.
1955. Wastes
Investigations of the Disposal by Biological Procedures.
of PhenolChem. Abs.,
Merten, U., and Brey, D.T. 1966. Reverse Osmosis for Water Reclamation. Advances in Water Pollution Research. Proceedings of the Third International Conference, Journal Water Pollution Control Federation. Volume 3. Washington, D.C.
Middlebrooks, E.J. 1968. Wastes from the Preservation of Wood. American Society of Civil Engineers Journa·1, p. 41.
Minelli, M.P., and Anderson, A.W. 1976. Factors Affecting Slime Accumulation in Fiberboard Mill Process Water. Water Resources Research Institute. Oregon State University, WRRI-36.
Unpublished data. Mississippi Forest Products Laboratory. 1970. Mississippi Forest Products Laboratory, University. Mississippi State, Mississippi.
Mississippi State
Mitchell, R. 1974. Introduction to Environmental Microbiology. Prentice-Hall, Inc., Englewood Cliffs, New Jersey, p. 181.
Montes, G.E., et al. 1956. Petro-Ch~mical Waste Treatment Problems. Sewageincf:"" Wastes, (28)4:507.
Morris, D.C., et al. 1972. Recycle of Papermill Wastewaters and Application of Reverse Osmosis. EPA Program #12040 FUB.
Morrison, R.T. and Boyd, R.N. 1966. Organic Chemistry. and Bacon, Inc., Boston, Massachusetts, p. 1067.
Allyn
Morton, S.D. and Sawyer, E.W. 1976. : Clay Organics, Viruses, and Heavy Metals from Water. Works. p. 116.
Minerals Remove Water and S~wage
Motto, H.L., et al. 1970. Lead Relationship -to Traffic Volume Environ. Sci. Tech., (4)3:231.
in Soils and and Proximity
Plants: Its to Highways,
Nakashio, M. 1969. Phenolic Waste Treatment by an Activated Sludge Process. Chem. Abs., (71)8:236.
National Council for Stream Improvement, Inc. 1966. Practice in Handling Barker Effluents in Mills in the United States. Technical Bulletin No. 194.
National Institute of Safety and Health (NIOSH). 1975. Suspected Carcinogens, A Subfile of the ,NIOSH Toxic Substances List. Department of Health, Education, and Welfare Publication No. (NIOSH}75-188, p. 93.
National Research Council Committee. 1945. Chemistry of Coal Utilization. John Wiley and Sons, Inc., New York.
350

NCI\SI. 1973 •... Pilof Plant -Studies of Turbidity and- Residual Cell Material Removal. from -Mill Effluent by·.Gra.riular:- Media Filtration.-: NCASI Technical Bull~tin, No. 266.- · ·
.. Neufeld, R.D., and Hermann, E,R. Acclimated Activated Sludge. Federation, C.4 7) 2: 310 •·
1975 ~ Heavy .Metal Re_movai-. by Journal Water Pollution Control
Niegowski, S.J. 1953. Destruction of Phenols b~ oildation with··· Ozone .. Ind. Eng. Chem., (.45) 3: 632:.
Niegowski, S.J. - 1956. Ozone Method for Destruction of Phenols -in Petroleum- Wastewa_ters. Sewage and Industrial -Wastes,_· (28)10:1266.
Nisbet,- I.C.T., et al. 1972~ Rates· and Routes of Transport of PCBs_ in the - Environment. Environmental Health Perspectives, (21)4:21.
Pacific Wood Treating Corporation. 1976. Wood Preserving Waste Recycle and I_ncinerat.ion System. EPA Project Control, 580517901- ., .
. , •: ..
. Parsons, w.-c. 1967_. Spray Irriga_t_ion-. of Wastes from _ the Manufacture of - Hardboard. Proceedings of the XXII Purdue-. Industrial Waste Conference, p. 602.
Patterson,- J .-\q. 1975. Wastewater Treatment Technology. Ann Arbor SciencE! Publishers, - Inc., Ann Arbor, Michigan •.
Philipp, A.H. 1971. Dispos.al of Insulation Board Mill'·Effluent by Land-Irrigation. Journal Water Pollution Control_ Federation, (43)8:1749.
Prather, B. V., Physical,· and Purification. ( 44) 3·: l 05-112.
and Gaudy, _A.F., Jr .. 1964. Combined.Chemical; Biological- Processes in Refinery- Wastewater -Proceedings of the American Petroleum Institute,·
Preussner, _ 1:LD., and Mancini, J. 1966. Extended Aeration Activateq Sludge Treatment of Petrochemical Waste at.the Houston: Plant of Petro-Tex Chemical Corporation. Proceedings of the XXI. Purdue Industrial Waste Confer_ence, p. 591.
Putilina, N.T. 1955. Removal of Phenol from Coke Works wastewaters., _ Water Pollution Abs.,- 28:428.
Quirk, T.P. 1969. Aerated. Stabilization Basin Treatment ofWhite Water., ;Water and Wastes _Eng. Industrial,: p. D-1.
Reid, G.W., and Janson, R.J. · 1955. ·Pilot Plant Studies on Phenolic Wastes at Tinker Air Force Base, Oklahoma· City, Oklahoma. Proceedings of the X Purdue Industrial Waste Conference, ~P· 28-34.
351

Reid, G.W., and Libby, R.W. 1957. Phenolic Waste Treatment Studies. Proceedings of the XII Purdue Industrial Waste Conference, p. 250.
Reid, G.W., et al. 1956. Removal Slimes. Proceedings of the Conference, p. 354.
of Phenol XI Purdue
with Biological Industrial Waste
Reynolds, Preserving Resources Texas.
T.D., and Shack, P.A. 1976. Treatment of Wood Wastewater. Technical Report No. 79. Texas Water
Institute, Texas A&M University, College Station,
Richards, B.R., et al.. 1972. Laboratory Screening Assays on Treated Wood Samples Exposed to Limnoria tripunctata: Part II. Proceedings of the American Wood Preservers' Association, (68):143-1.
Richards, B.R., and Webb, D.A. 1975. Laboratory Screening Assays of Treated Wood Samples Exposed to Limnoria tripunctata: Part III. Proceedings of the American Wood Preservers' Association, (71):30.
Rizzo, J.L., tl al. 1977. Treating Industrial Wastewater with Activated Carbon. Chemical Engineering, p. 95.
Rosfjord, R.E., et al. 1976. Phenols: A Water Pollution Control Assessment. Wat,er and Sewage Works, { l 23) 3: 96.
Ross, W.K., and Sheppard, A.A. 1955. Biological Oxidation of Petroleum Phenolic Wastewaters. Proceedings· of the X Purdue Industrial Waste Conference, pp. 106-119,.
Rozelle, L.T., et al. 1974. Ultrathin Membranes for Treatment of Waste Effluents by Reverse Osmosis. Chem. Abs., 80:6355f.
Scaramelli, A.B., and DiGiano, F.A. 1975. Wastewater Treatment: Physical and Chemical Methods. Journal Water Pollution Control Federation, {47)6:1249.
Semov, V., et al. 1972. Micrqb,ial Degradation of Phenols in the Purification of Phenolic Wastewaters with Activated Sludge. Oakridge National Laboratory, ORNL-tr-2983.
Shukov, A.I. 1959. The Treatment of Phenolic Wastewaters. Water Pollution Abs., {32):424.
Skidmore, J.F. 1964. Toxicity Animals with Special Reference to Biology, (39)3:227
of Zinc Compounds to Aquatic Fish. Quarterly Review of
Skogen, D.B. 1967. Treat HPI Wastes with Bugs. Hydrocarbon Processing, 46(7):105.
352

Stevens, B.W., and Kerner, J.W. 1975. Recovering Organic Materials from Wastewater. Chem .. Eng., (82)1:8.4.
Suhr, L.G., and Culp, G.L. 1974. State of the Art--Activated Carbon· Treatment of Wastewater. Water and Sewage Works, Ref. Rl04.
Sweets, W.H.~ et al. 1954. Microbiological Studies on the Treatment of Petroleum Refinery Phenolic Wastes. Sewage Industrial Wastes, (26):826.
Symons, J.M., et al. 1975. NationalOrganicsReconnaissarice Survey for Halogenated Organics. American Water Works Association Journal, . 67 ( 11 ) : 634.
Thompson, W.S. 1973, Preserving Industry. Preservers' Association,
Status of Pollution Control in the Wood Proceedings of the· American Wood (69):39.
Thompson,. W.S. 1976. Ora.ft Development Document Industry ..
for u.s~ Pretreatment Standards for t:he Wood. Preserving
Environmental. Protection Agency, .8: 23..;.24 . ..
Thompson, W.S., and Dust, J.V. 1972. Pollution Control in the Wood Preserving Industry, Part 2. · In-Plant Process Changes and Sanitation. F'orest Prodt19ts Journal, (22)7:43.
Thompson, w.s., and Dust, J.V. 1972. Pollution Control in· the Wood Preserving· Industry, Part 3. Chemical and Physical Methods of Treating Wastewater. yorest Products Journal, (22)1.2:25.
u.s~ Environmental Aspects of Street EPA/R2-72-081.
Protection Agency. 1972. Water Pollution Surface Contaminants. Washington, D.'C.
U.S. Envircmmental Protection · Agency. 1974. Development Document for Proposed Effluen:t · Li.mitation · Guidelines and New Source Performance Standards for-_· the Plywood, Hardboard,· and Wood Preserving Segments of th~ Tin\J~¥r Products .Industry. EPA-440/1--73-023. . . - .
U.S. Environmental Protection Agency. 1974. Manual of Analytical ME~thods for the Analysis of Pesticide Residue in H~man · and EnvironmE~ntal Samples.
U. s. Envirc;~.nrni~ntal Protection Agency. 1975. National Conference on Polychlorinated Biphenyls, Chicago, Illinois. EPA-560/6-75-004.
U.S. Environmental Protection Agency. 1976. Quality Criteria for Water. Washington, D.C. EPA-440/9-76-023.
353
.. - \
i

U.S. Environmental Protection Agency. 1976. Treating Wood Preserving Plant Wastewater by Chemical and Biological Methods. Ind. Env. Res. Lab., Office of Research and Development, Cincinnati, Ohio. EPA·-600/2-76-231.
U.S. Environmental Protection Agency. 1977. First Environmental Tab--Timber Products Processing, EPA-EGD.
U.S. Environmental Prc,tection Agency. 1977. Survey of Two Municipal Wastewater Treatment Plants ·for Toxic Substances. Wastewater Research Division, Municipal .Environmental Research Laboratory, Cincinnati, Ohio.
U.S. Environmental Protection Agency. 1977. Trace .Metal Removal by Wastewater Treatment. Technology Transfer.
U.S. Environmental Protection Agency. 1980. Biodegradability Studies with Organic Priority Pollutant' Compounds. Municipal Environmental Research Laboratory, Office of Research and Development, Cincinnati, Ohio.
Wheatland, A.B., et al. 1975. Developments in the Treatment of Metal-Bearing Effluents. Water and Environment Group of the SCI in London. Chemistry and Industry, (47)2:322.
Wiley, A.J., et al. 1972. Reverse Osmosis Concentration of Dilute Pulp and Paper Effluents. Pulp Manufacturers' Research League and Institute of Paper Chem. EPA Proj. No. 12040 EEL.
World Health Organization. 1972a. Chloroform. IARC Monographs on the Evaluation of Carcinogenic Risk of Chemicals to Man, 1:61-65. Geneva.
World Health Organization. 1972b. Health Hazards of the Human Environment. Geneva.
Wynn, C.S., et al. 197:3. Pilot Plant for Tertiary Treatment of Wastewater with Ozone. EPA/R2-73-146.
354

·BIBLIOGRAPHY'. OF STATlSTICAL APPENDIX
Bahadur, R.R.· 1966. A Note on· Quantiles in Large Samples. Annals of Mathematical Statistics,, 37: 577.
Berm~n, S.M. 1962a. A Law of·Large Numbers for the Maximum in a Stationary Gaussian Sequence: Annals of Mathematical Statistics, 33:93.
Berman, S.M. 1962b. Limiting Distribution of the Maximum · Term in Sequences of Dependent Random Variables. Annals .of Mathematical· Statistics., 33: 894.
-.,._ ···--·· Berman, S.M.· 1964. Limit . Theorems:. for the Maximum. Term in Stationary Sequences ... · Annals of MathE:matical Statis;_tics, 35: 502.
Box, G.E.P., and Jenkins, Forecasting· and Control. California. -
G.M. 1976. Time Series Analysis:, Inc., San Francisco, Holden .. Day,
Chanda, K~C. 1976. Some Dependent Observations. AS ( 1 4 ) : 1 3 8 5 • ,
Comments Commun.·
',.;,. _;.;
Fuller; W.A. 1976·. Introduction· John Wiley ancLSons., . inc: , 1'1ew York.·
• "',·""IL' ,,• •
on Sample Quantiles for. Statist. -Theor. - Meth. ,
to Statistical Time Series.
Gibbons, J .D. \971. Non-Parametric Statistical Inference. McGraw-Hill,' Inc., New York.
Gurland, J. 1955. Distribution of the Maximum of the Arithmetic Mean · of Correlated Random . Variables.. Annals of Mathem~tical Statistics, 26:294.
. ..
Horowitz, J., and Barakat, S. 1979. Statistical Analysis.·of .the Maximum Concentration of an Air Pollutant: Effects of Autocorrelation and Non-Stationarity. Atmospheric Environment, (13):811.
Jacobs, P.A., and Lewis, P.A. 1978. Discrete Time· Series Generated by Mixtures II:· ,Asymptotic Properties. Journal of Royal Stat. Soc. B,. (40)2:222. ,;(
Javitz, H.S.. 1980. St_atisticai. in'terdependencies in_;,the Ozone. National Ambient .. :· .Air ·ouaf(ty .. Staridai:d. . American Pollution Control Associattori J9µrn.~l,. (30) 1: 58.
Larsen, R. I. 1969.. A New Mathematical Model · of Air Pollutant Concentratic1n Averaging Time and Frequency.···· American Pollution Control Assc1ciation Journal,_ ( 19) 1 : 24.
Larsen, R.I. InterrelatirJg
1974. An Ait. Quality Data Analysis System for. Effects, Standards, and Needed Source Reductions--
I •i" .. . ' I. ... . --·

Part 2. American Pollution (24)6:551.
Control ,Association Journal,
Larsen, R.I. 1977. An Air Quality Data Analysis System for Interrelating Effects, Standards, and Needed Source Reductions-Part 4. A Three-Parameter Averaging-Time Model. American Pollution Control Association Journal, (27)5:454.
McClave, J.T. 1978. Estimating the Order of an Autoregressive Process: the Max X2 Method. Journal of American Statistical Association, (73)361:122.
Mcclave, J.T., and Dietrich, F.A. 1979. Statistics. Publishing Company, San Francisco, California.
Dellen
Mendenhall, w. 1968. Design and Analysis of Scituate, Massachusetts.
Introduction Experiments.
to Linear Models and the Duxbury Press, North
Merz, P.H., et al. 1972. Aerometric Data Analysis--Time Series Analysis and Forecast and an Atmospheric Smog Diagram. Atmospheric Environment, (6):319-342.
Patel, N.R. 1973. Comment on a New Mathematical Model of Air Pollution Concentration, American Pollution Control Association Journal, (23)4:291.
Phillips, P.C.B. 1978. Edgeworth and Saddlepoint Approximations in the First-Order Noncircular Autoregression. Biometrika, (65)1 :91.
Portnoy, S.L. 1977. Robust Estimation in pependent Situations. Annals of Statistics, {5)1:22.
Robinson, P.M. 1977. Estimation of a Time Series Model from Unequally Spaced Data. Stochastic Processes and Their Application, (6h9.
Sen, P.K. 1972. On the Bahadur Representation of Sample Quantiles for Sequences of -Mixing Random Variables. Journal of Multivariat~ Analysis, 2:77.
Singpurwalla, N.D. with Applications (14)3:703.
1972. Extreme Values from a of Air Pollution Problems.
Lognormal Law Technometrics,
Watson, G.S. 1954. Extreme Values in Samples from Independent Stationary Stochastic Processes. Annals of Mathematical Statistics, {25):798.
356

SECTION XV
GLOSSARY bl=' TERMS AND ABBR.EVIATIONS
ACA--Ammonical Copper Sulfate.
"Act "--The Fe!cleral Water Pollution Control Act Amendments ot · 1977.
Activated Sludge:'...:...sludge flo~ produced in raw or settled. wastewater by the growth of zoogleal bacteria and other organisms in the presencE~ of dissolved oxygen .and accumulated in sufficient concentration.by returning floe previously formed.
Activated Sludge Process--A biological wastewater treatment process in which a mixture of wastewater and activated sludge is agitated and aerated. The activated sludge is subsequently separated frc>m the treated wastewater (mixed liquor) by sedimentation ar1d ~ast:ed or .re.t.ur111.ed to the process as needed.
Additive--Any material introduced prior to th~ final consolidation of a board to improve some property of the· final board or to achieve a desired effect in combination with another additive. Additives include binders and. other mater:ials. Sometimes a specific additive may perform more than one function. Fillers and preservatives are ·includ~d under this term.
. .
Aerated Lagoon-"."'A natural or artificial wastewater treatment pond in which mechanical or diffused-air aeration is used to supplement the oxygen supply .
. Aer·obic--Condi·~ion in which free elemental oxygen is present.
Air-drying--Drying lumber prior to preservative impregnation by placing the ·lumber in.stacks open to the atmosphere, in such a way as to allow good circulation of air.
Air-felting--Term applied to the forming of a fiberboard from an air· suspension of wood or other cellulose fiber and to the arrangement of such.fibers into a mat for board~
Anaerobic--Condition in which free.elemental oxygen is absent~
Asplund Method-"."'An attrition mill which combines the steaming and defibering in, one unit in a continuous operation.
""-..;,
Attrition Mill--Machine which produces particles by forcing coarse material, shavings, or pieces of wood between a stationary and a rotating disk, fitted with slotted or grooved segments.
Back--The side reverse to the face of a panel, or the poorer side of a panel in any grade of plywood that has a face and back.
357. ·

Bagasse--The solid matter remaining after extraction of liquids from sugar cane.
Barker--Machines which remove bark from logs. Barkers may be wet or dry, depending on whether or not water is used in the operation. There are several types of barkers including drum barkers, ring barkers, bag barkers, hydraulic barkers, and cutterhead barkers. With the exception of the hydraulic barker, all use abrasion or scraping actions to remove bark. Hydraulic barkers utilize high pressure streams of water.
Biological Wastewater Treatment--Forms of wastewater treatment in which bacterial or biochemical action is intensified to stabilize, oxidize, and nitrify the unstable organic matter present. Intermittent sand filters, contact beds, trickling filters, aeration ponds, and activated. sludge processes are examples. ·
Blowdown--The removal of a portion of any process flow to maintain the constituents of the flow at desired levels.
BODS or BOD--Biochemical Oxygen Demand is a measure of biological decomposition of organic matter in a water sample. It is determined by measuring the oxygen reqlfired by microorganisms to oxidize the organic contaminants of a water sample under standard laboratory conditions. The standard: conditions include incubation for five days at 20°c.
BOD7--A modification of maintained for seven days.
the BOD test :in which incubation is The standard test in Sweden.
Boultonizing--A conditioning process in which unseasoned wood is heated in an oily preservative under a partial vacuum to reduce its moisture content prior to injection of the preservative.
Casein--A derivative of skimmed milk used in making glue.
Caul--A steel plate or screen on which the .formed mat is placed for transfer to the press, and on which the mat rests during the pressing process. ·t·\ : '
CCA-type Preservati ve--·Any one of several inorganic salt formulations based on·salts of copper, chromium, and arsenic.
Chipper--A machine which reduces logs or wood scraps to chips. ' I,
Clarifier--A unit of which the primary purpose is to reduce the amount of suspended matter in a liquid.
Closed Steaming--A method of steaming in which the steam required is generated in the retort by passing boiler steam through heating coils that are covered with wate:r. The water used for this purpose is recycled.
358

cm--Centimeters.
COD-'.'"'Chemical Oxygen Demand. Its determination provides a measure of the oxygen demand equivalent to that portion of matter· in a sample which is susceptible to oxidation by a strong chemical oxidant.
Coil Condensate'.'"'-The condensate formed in st~am lines and heating coils.
Cold Pressing--See Pressing.
Composite Board--Any combination of different· types of board; either with another type board.or with another sheet material. The composite board may be laminated in a separate operation or at the same .time as the board is pressed. Examples. of composite .. boards include veneer-faced. particle board, hardboard-faced insulation board and particle board, and metal-face~ hardboard.
Conditioning--The practice of heating logs prior to ciutting in order to improve the cutting properties of the wood and in some cases to facilit~Je deb~pking.
Conventional pollutants--Those pollutants identified by the Administrator of EPA as conventional pollutants under authorization of Section 304(a)(~) of the 1977 Clean Water Act. Conventional. poJlutants include biochemical oxygen demand, suspended soli.ds, oil and grease, fecal coliform, and pH.
Cooling Porid--A water reservoir equipped with spray aeration equipment frc>m which cooling water is drawn and to which it is returned. ·
Creosote--A complex mixture of organic materials obtained as a by-product .from·coking and petroleum refining.operations.that is used as a wood preservative.
cu m--Cubic meters.
cu ft'.'"''.'"'Cubic feet.
Curing--The physical-chemical change that takes place either to thermosettin9 . synthetic · resins (polymerization). in · the hot presses or to drying oils ( oxidation) used for _oi !-treating board. The treatment to piodtic~ that change.
Cutterhead Barker--See Barker.
Cylinder Cond,:!!nsate_:-Ste·am condensate that forms on the. walls of the retort du1:-ing steaming operat:i.ons.
~ ·. . ' . ' . '
CZC--Chromated Zinc.Chloride.
359 ..

Data Collection Portfol io--Information s.ol ici ted from industry under the authority of section 308 of the Act.
Decker, Deckering--A method of controlling· pulp consistency in hardbo~rd production.
Defiberization--The reduction of wood materials to fibers.
Digester--(1} Device for conditioning chips using high pressure steam, (2) A tank in which biological decomposition (digestion) of the organic matter in sludge takes place.
Disc Pulpers--Machines which produce pulp or fiber through the shredding action of rotating and stationary discs.
DO--Dissolved Oxygen is a measure of the amount of free oxygen in a water sample. It is dependent on the physical, chemical, and biochemical activities of the water sample.
Dry-felting--See Air-felting.
Dry Process--See Air-felting.
Durability--As applied to wood, its lasting qualities or permanence in service with particular reference to decay. May be related directly to an exposure condition. ,
FCAP--Fluor-chrom-arsenate-phenol. An inor9anic waterborne wood preservative.
Fiber (Fibre)--The slender thread-like elements of wood or similar cellulosic material, which, when separated by chemical and/or mechanical means, as in pulping, can be formed into fiberboard.
Fiberboard--A sheet material manufactured from fibers of wood or other ligno-cellulosic materials with the primary bond deriving from the arrangement of the fibers and the~r inherent adhesive properties. Bonding agents or other materials may be added during manufacture to increase strength, resistance to moisture, fire, insects or decay, or to improve some other property of the product. Alternative spelling: fibreboard. Synonym: fibre building board.
Fiber Preparation--The reduction of wood to fiber or pulp, utilizing mechanical, thermal, or explosive methods.
Finishing--The final preparation of the product. Finishing may include redrying, trimming, sanding, sqrting, molding, and storing, depending on the operation and product desired.
Fire Retardant--A formulation of inorganic salts that imparts fire resistance when injected into wood in high concentrations.
360

Flocculation-·-The agglomeration of. colloidal and finely divided suspended matteri
Flotation--The raising of suspended matter to the surface of the liquid in a tank as scum--by aeration, the evolution of gas, chemicals,. electrolysis, heat, or bacterial · decomposi tion--and the subsequent removal of the scum by skimming.
F:M ratio--The ratio of organic material (food) to mixed liquor (microorganisms) in an aerated sludge aeration basin.
Formation (Forming)--The felting fibers into a mat for ffberboard. and wet-felting.
FR--Federal !~~gister.
Gal--Gallons.
GPD--Gallons per day.
GPM--Gallons per minute.
of wood or other cellulose Methods employed: air-felting
Grading--The selection to their suitability for include such features direction.
and categorization of different woods as various uses. Criteria for selection of the wood as color, defects~ and grain
Hardboard-,-A compressed fiberboard with a density greater than 0. 5 g/cu m ( 31 lb/cu ft)~
Hardboard P1~ess--Machine · which completes the· reassembly of wood particles and welds them into a tough, durable, grainless board.
Hardwood--Woc::>d from deciduous or broad-,leaf trees. Hardwoods include· oak, walnut, lavan, elm, cherry,. hickory,.pecan, maple, birch, gum, cativo, .teak; rosewood, and mahogany.
Heat-treated Hardboard--Hardboard that has been- subjected to special heat treatment after hot-pressing to increise strength. and water resistance~
Hoiding Pond:s--See Impoundment.
Hot Pressing--See Pressing.
Humidif icatii::m--The seasoning operation to which newly· pressed hardboard is· subjected to prevent ~arpage due- to excessive dryness. - ·
.. Impoundment--A pond, lake, tank, basin, or other space, either natural or created in whole or in part by the building of engineering structures, which is used for storage, regulation, and control of water, including wastewater.
361·

Insulation Board--A form of fiberboard having a density less than 0.5 g/cu m (31 lb/cu ft). ·
In situ--In the original location.
Kjld-N--Kjeldahl Nitrogen: of a sample.
Total organic nitrogen plus ammonia
Kl/day-Thousands of liters per day.
Lagoon--A pond containing raw or partially 'treated wastewater in which aerobic or anaerobic stabilization o~curs.
Land Spreading--See Soil Irrigation.
Leaching--Mass transfer of chemicals to water from wood which is in contact with it.
1/day--Liters per day.
Metric ton--One thousand kilograms.
MGD--Million gallons per day.
mg/1--Milligrams per liter (equal to parts per million, ppm, when the specific gravity is one).
ug/1--Micrograms per liter (equal to parts per billion, ppb, when the specific gravity is one).
Mixed Liquor--A mixture of activated sludge and organic matter under going activated sludge treatment in an aeration tank.
ml/1--Milliliters per liter.
mm--Millimeters.
Modified-closed Steaming--A method of steam'conditioning in which the condensate formed during open steaming is retained in the retort until sufficient condensate accumulates to cover the coils. The remaining heat required is 9enerated as. in closed steaming.
No Discharge--The complete prevention of wastewater from entering navigable waters.
polluted process
Nonconventional pollutants--Those pollutants not identified as conventional or toxic pollutants.
Nonpressure Process--A method of treating :wood at atomspheric pressure in which the wood is simply soaked in hot or cold preservative.
NPDES--National Pollutant Discharge Elimination System.
362

Nutrients--The nutrients in contaminated. water are routinely analyzed to characterize the.food available for microorganisms to promote organic decomposition. They are: Ammonia Nitrogen (NH3), mg/1 as N ·Kjeldahl Nitrogen (ON), mg/1 ~s N Nitrate Nitrogen (N03), mg/1 as N Total Phosphate (TP), mg/1 as P Ortho Phosphate (OP), mg/1 as P
Oil-Recovery . System--Equipment wastewater.
used to reclaim oil from
Oily Preservative--Pentachlorophenol-petroleum solutions and creosote in the various forms in which it is used.
Open Steaming--A method of steam conditioning in which live steam is injected into the retort.
PCB--Polychlorinated Biphenyls.
PCP--Pentachlorophenol.
Pearl Benson Index--A measure of ·color-producing substances.
Pentachlorophenol--A chlorinated phenoi with the formula Cl 5 C6 0H and formula weight of 266.35 that is used as a wood preservative. Commercial grades of this chemical are usually adulterated with tetrachlorophenol to improve its solubility.
pH--a measure of the acidity or alkalinity of a water sample.· It is equal to the negative log of-the hydrogen ion concentration.
Phenol--The simplest aromatic alcohol (C6 H5 0H).
Phenolic Compounds--A wide range of organic compounds with one or more hydroxyl groups attached to the aromatic ring.
Point Source--A discrete source o,f pollution.
POTW--Publicly owned treatment works.
Pressure Process--A process in which wood preservatives or fire retardants are forced into wood. using air or hydrostatic pressure.
Pretreatment~-Any wastewater treatment processes used to partially reduce pollution load before the wastewater· is delivered into a treatment facility. Usually consists of removal of coarse solids by screening or other means.
Primary Treatment--The first major tr·eatment in a wastewater treatment works. In the classical sense, it normally consists of clarification. As used in this document, it generally refers to treatment steps preceding biological treatment ..
'"'>=,
363

Process Wastewater--Any water, which during manufacturing or processing, comes into·direct contact with or results from the production or use of any raw material, intermediate product, finished product, by-product, or waste product.
psi--Pounds per square inch.
PVA--Polyvinyl alcohol. Binding agent applied to surface of insulation board.
PVAC--Polyvinyl acetate~ insulation board.
·Binding agent applied to surface of
Radio Frequency Heat--Heat generated by the application of an alternating electric current, oscillating in the radio frequency range, to a dielectric material. In recent years the method has been used to cure synthetic resin glues.
Resin--Secretions of saps of certain plants or trees. It is an oxidation or polymerization product of th~ terpenes.
Retort--A steel vessel in which wood products are pressure impregnated with chemicals that protect the wood from biological deterioration or that impart fire resistance. Also called treating cylinder.
Roundwood--Wood that is still in the form of a log, i.e., round.
RWL--Raw Waste wastewater.
Load. Pollutants contained in untreated
S1S Hardboard--Hardboard finished so as to be smooth on one side.
S2S Hardboard--Hardboard finished so as to be smooth on both sides.
Secondary Treatment--The second major step in a waste treatment system.
Sedimentation Tank--A basin or tank in which water or wastewater containing settleable solids is r~tained to remove by gravity a part of the suspended matter.
Settling Ponds--An impoundment for the settling out of settleable solids.
Sludge--The accumulated solids separated from liquids, such as water or wastewater, during processing.
! Softwood--Wood from evergreen or needle-bearing trees.
Soil Irrigation--A method of land disposal. in which wastewater is applied to a prepared field. Also referred to as soil percolation.
364

Solids-'.""'Various types of solids·are commonly-determined on· water samples. TJ')ese types ·of sol ids are: · · ·
Tota1 Sol ids ( TS) ,;_-The material left after .evaporation and -dryi.ng a sample at 1030"'"10:soc.
Suspended Sol ids ( SS) ~;;;;The. material . rem·oved fro~ a s~mpie filtered through a standard glass fiber filter. Then it is dried at 1030-1os 0 c. Total Suspended Solids (TSS)--Same a~ Sus~ended So.lids. Dissolved Solids (DS)--The difference between the total
and suspended solids. Volatile Sol.ids (VS)--The material which is: lost when the sample is heatec;l to. SSOOC~-' Settle.able.:·: Sol.ids (TSS)--The material which settles in an Immhoff · cone in· one:·hour .
. ~ ~ ... Spray Evaporation--A _method of wastti!w~'ter disposal iri.whi.ch the. water in a holding lagoon is. sprayed into- the air ·to·, expedite evaporation. ·
Sp~ay lrri9ation--A method of disposing of some .. organic wastewaters by spraying them. <?~ .. I.and, __ us_ya1Jy from_ pipes equJpped with spray nozzles. See Soil Irrigation ..
sq m--Square meter.··::.
Steam Conditioning-~A conditioning . method · ·in . which unseason.ed wood is subjected to an.atmosphere of steam at 12ooc 0 (2490F) to reduce its moisture content and improve its p~rmeability preparatory to prese'rvati ve treatment. ·· · ·
Steaming--Treating wood material with steam to-prepare it for preservative impregnation.
Sump--{1) A tank-or pit that receives drainage and stores it temporarily, and ., from· · whi'ch the drainage is pumped or: eje.cted; ( 2) ·· A tank or pit. that. rece_i:y.es ·1 i9ui~s. ·· · · ·
Synthetic Resin (Thermosetting)...::'..:Artifici.ai. resin use.a ·. in- . board manufacture· as· a bind.er. A combination of chemicals whtch can be polymerized, e.g., by the application of heat,· into a compound which. is usE~d to pro~uce_._ the borid . or improve the bqnd in a fiberboard <>r ·· particle board. Types .. usually used in board manufacture are'" phenol formaldehyde, urea formaldehyde, or melamine formaldehyde.
Tempered Hardboard--Hardboard that.has been specially treated in manufacture_ to improve its physical properties considerably. Includes, for example, oil-,.tempered· hardboard.· $ynonym: superhardboai::4•
Tertiary Treatment--The third major step in-. a waste treatment facility. As used iri this document, the term ,refers to treatment processes fc>llowing biological treatment.
365

Thermal Conductivity--The quantity of heat which flows per unit time across unit area of the subsurface of unit thickness when the temperature of the faces differs by one degree.
Thermosetting--Adhesives which, when cured under heat or pressure, "set" or harden to form bonds of great tenacity and strength. Subsequent heating in no way softens the bonding matrix.
TOC--Total Organic Carbon is a measure contamination of a water sample. It relationship with the biochemical and chemical
I
of the organic has an empirical oxygen demands.
T-P04-P--Total phosphate as phosphorus. S~e Nutrients.
Total Phenols--Total phenols as determined analytical method of Standard Methods. ·
by the 4-AAP
Toxic Pollutants--Those compounds Decree and Section 307(a) the Water 1977.
listed in the 1976 Consent Quality Act Amendments of
Traditional Parameters--Those parameters historically of interest, e.g., BOD, COD, TSS, as compared to Toxic Pollutants.
' Turbidity--(1) A condition in water or wastewater caused by the presence of suspended matter, resulting in the scattering and absorption of light rays; (2) A measure of the fine suspended matter in liquids; (3) An analytical quantity usually reported in arbitrary turbidity units determined by measurements of light diffraction.
Vacuum Water--Water extracted from wood during the vacuum period following steam conditioning.
Vapor Drying--A process in which unseasoned wood is heated in the hot vapors of an organic solvent, such as xylene, to season it prior to preservative treatment.
Vat--Large metal containers in which "conditioned" or heated prior to cutting.· for heating are by direct steam contact in steam-heated water in "hot water vats."
veneer logs are The two basic methods "steam vats" or by
Veneer--A thin sheet of wood of uniform thickness produced by peeling, slicing, or sawing logs, bolts, or flitches. Veneers may be categorized as either hardwood or softwood, depending on the type of woods used and the intended purpose.
Water Balance--The water gain (incoming water) of a system versus water loss (water discharged or lost).
366

Water-borne Preservative--Any one of several formulations of inorganic salts, the. most common of which are based on copper, chromium, and arsenic.
Wet-felting--Term applied to the forming of a fiberboard from a suspension of pulp in water usually on a cylinder, deck1e box, or Fourdcinier machine; the interfelting of wood fibers from a water suspension into a mat for board.
Wet. Process--See Wet-felting.
Wet Scrubber--An air pollution control device which lnvolves the wetting of particles in an air stream and the impingement of wet or dry particles on collecting surfaces,_followed by flushing ..
Wood Extractives·--A mixture of. chemical compounds,. primarily carbohydrates, removed from wood during steam conditioning.
Wood Preservatives--A chemical or mixture of chemicals with fungistatic and insecticidal ~roperties that is injected ihto wood to protect it from biolo9ical determination.
Zero Discharge--See No Discharge.
367


APPENDIX A
'COSTS OF TREATMENT AND.CONTROL SYSTE;MS
COST INFORMATION.
Cost information for the ~andidate treatment technologies developed in Section VII is presented in this appendix for the purpose of enabling an assessment of the economic impact on the industry. A separate economic analysis has been prepared and the results have been published in a separate document.
Two types of cost estimates are presented in this appendix. ·First,. the total battery limit costs of the NSPS and PSNS Candidate Treatment Technologies are estimated for the model plants accordtng to raw wastewater characteristics developed in Section V for each subcategory. These estfmates include the cost of, each unit process associated with the NSPS and PSNS candidate technology.· As shown in Section VII, most existing plants already have substantial treatment systems in operation. These total battery limit costs, therefore, are"not applicable to these plants as they do not reflect the true cost to the industry of achieving the candidate techriologies. · Since rio technology can be assumed to be in-place for new sources, the total battery limit NSPS and PSNS cost· estimates do represent the costs to .the industry of ach~eving the NSPS and PSNS candidate technologies.
The second type of cost estimate presented is a plant-by-plant estimate of .the costs of achieving the applicable candidate technologies for direct and/or indirect dischargers within each subcategory. This estimate, prepared for every affected plant in the technical data base, takes into consideratio.n the plants' raw and treated wastewater characteristics and the- treatment technology currently in-place and is i more accurate estimata_gf the actual cost of the candidate technologies to the industry as a whole.
It should be noted that a number of factors affect th~ cost of a particular facility,. and that these highly variable factors may differ from those. assumed hereJn. _ Qne of the most variable factors is the cost of land, which may range from a few hundred dollars. per hectare in rural areas to millions of-dollars (or total unavailability) in -urban areas. Other site-specific factors which can cause variations in actual cost include local soil conditions, building codes~ and labor costs.
In some cases, individual installations may use cost accounting systems which cause reported costs to differ from those in this section. For example, it is not-uncommon for a portion of a manufacturing plant's administrative costs to be allocated to the waste ·treatment system. Such factors are not.included in ~his document.
369

Table A-1 presents the cost assumptions used, in developing the cost estimates described above .
. Table A-1. Cost Assumptions ---------------------------------------------~-----------·---------------1. All costs are reported in June 1977 dollars. 2. Excavation costs $5.00 per cubic yard. · 3. Reinforced concrete costs $210 per cubic yard. 4. Site preparation costs $2,000 per acre. 5. Contract hauling of sludge to landfill costs $25 per cubic yard. 6. Land costs $10,000 per acre except for those alternatives including
spray irrigation, in which case land costs $2,000 per acre. 7. Surface dressing for lagoons costs $0.03 per square foot. 8. Fencing costs $2.00 per linear foot, installed. 9. Clay lining for lagoons ~osts $0.23 per square foot. 10. New carbon costs $0.40 per pound. 11. Epoxy coating costs $2.00 per square foot. 12. Electricity costs $0.05 per kilowatt-hour. 13. Phosphoric acid costs $0.25 per pound. 14. Anhydrous ammonia costs $0.18 per pound.· 15. Polymer costs $0.60 per pound. 16. Sulfuric acid costs $0.06 per pound. 17. Sodium hydroxide costs $0.10 per pound. 18. Sulfur dioxide costs $0.25 per pound. 19. Average roofing costs $5.50 per square foot. 20. Engineering costs 15 percent of construction cost. 21. Contingency is 15 percent of the sum of the capital cost, land
cost, and engineering cost. 22. Capital recovery is based on 20 years at 1'0 percent. 23. Annual insurance and taxes cost 3 percent of the sum of the capi
tal cost plus land cost. 24. Average labor costs $20,000 per man per year, including fringe
benefits and overhead. 25. Annual operating costs include amortization, operation and mainte-
nance, energy, taxes and insurance and sludge disposal costs (hauling)
Energy Requirements of Candidate Technologies.
Itemized energy costs are shown in each of the cost estimates presented in this appendix.
Total Cost of Candidate Technologies
Tables A-2 through A-5 present the total battery limit costs of NSPS and PSNS candidate technologies for the:rnodel plants in the Wood Preserving-Boulton and Stearn subcategories. (The candidate technologies are the same). The design criteria for the model plants for these subcategories.are presented on page 110 in Table V-21 of Section V, WASTEWATER CHARACTERISTICS. Tables A-6 through A-9 present the total battery limit costs of NSPS candidate technologies for the model plants in the insulation board subcategory. The design criteria for the mechanical and therrnornechanical refining model plants in the insulation board subcategory are presented on page 122 in Tables V-24 and V-25 of
370

Section V, respectively. Tables A-10 throµgh A-12 present the total battery limit costs of .NSPS candidate technologies for the wet process ha'rdboard subcategory. The model plant design criteria for the SlS and S2S parts of the wet process hardboard subcategory are presented on page 136 in Table V-31 and on page 137 in Table V-32 of Section V, respectively.
It should be noted that the battery limit costs shown for primary.oil separation for new sources in the wood preserving segment, including capital, annual operating,. and annual energy costs, are·· 50 percent of the actual values estimated during the cost analysis. This is because,. as discussed in Section VI~ of this document, 50 percerit of the total costs of this technology can be amortized through recovery of oils.
Total battery limit costs were not developed for the Wood Preserving Water Borne· or Non-Pressure subcategory PSNS candidate technology because the costs are minimal. As discussed in Section XII, PRETREATMENT' STANDARDS, the PSNS candidate cechnology for this subcategory is process wastewater collection and recycle to achieve no qischarge. Process wastewater is collected and reused to make up .future· preservative treating solutions. This technology is easily incorporated into the overall plant design and the costs. for this.technology are minimal compared to the costs of constructing and operating the preservative treat~ent facilities.
Costs of ~ompliance for Indirect Discharging Plants--Wood Preserving
Assumptions made in estimating plant-by-plant costs were: (1) technology required to achieve BPT standards, or its equivalent, should be in-place for existing direct dischargersj therefore no costs were included for primary and secondary oil separation or for an aerated lagoon of sufficient size and aeration capacity to achieve the B,PT standards; { 2) technology required to achieve current pretreatment standards, or its equivalent, .should be inplace for existing indirect dischargers~ therefore no costs were in½luded for primary and secondary oil removal; {3)· plants currently achieving no discharge through self containment {spray irrigation,. evaporation, recycle, etc4) will incur no costs of compliance; and (4) the cost of converting a .steam subcategory plant from o,pen to closed steaming was estimated and included in the compliance cost only when this conversion and subsequent treatment of a reduced flow results in a lower overall cost than does treatment. of the larger, open steaming flow.
Costs of compliance for individual wood preserving plants are shown in Tabl eis A-1 3 through A-1 5.
Costs of ComE~iance Hardboard/Insulation Board
A plant-by-plant· analysis was performed on each plant in the technical data base to determine the cost of compliance for each
371

applicable candidate treatment technology. The individual plant's wastewater flow, raw and treated wastewater characteristics, and in-place technology were considered in determining the cost of compliance.
372

Table A-2. Wood Preserving-Boulton Subcategory Cost ,Summary . for Model Plant N~l*, NSPS, PSNS Battery Limit Costs
---------------- ------.----, ~,---~-- .----------.--------------------, Capital Cost
Annual Operating Cost .
Annual En.ergy. Cost
------------------- ------- ----· --- - -- -------- -------------------Primary Oil Separation
Flocculation and SlowSand Filtration
P.ump Station
Cooling Tower Evaporation (Including Recirculation Pumps)
Engineering
Land
Contingency
Sludge Disposal
Capital Recover~,
Insurance and Taxes
Labor
TOTAL
$ 40,000
16,000
6,300
57,000
17,900
5,000
21,330
$163,530
$ 2,500
3,900
1,470
6,880
1,000
18,620
3,730
20,000
$58,100
$1,500.
400
l , 160.
5, .1 00
$8,160 -------------------------- -- -- - --- ... ---- --- ... --------------------*A diagram of· thE~ Candidate Tre,atment Technology is shown in Figure VII-18.
373

Table A-3. Wood Preserving-Boulton Subcategory Cost Summary for Model Plant N-2*, NSPS, PSNS Battery Limit Costs
Capital Cost Annual
Operating Cost Annual
Energy Cost --------------------------------------------~---------------------------Primary Oil Separation
Flocculation and SlowSand Filtration
Pump Station
Cooling Tower Evaporation (Including Recirculation Pumps)
Engineering
Land
Contingency
Sludge Disposal
Capital Recovery
Insurance and Taxes
Labor
TOTAL
$ 56,750
19,500
7,300
82,000
24,830
7,500
29,680
$227,560
$ 3,000
5,200
1,900
14,990
2,000
25,850
5,190
25,000
$83,130
$ 1, 750
400
1,480
12,500
$16,130
*A diagram of the Candidate Treatment Technology is shown in Figure VII-18.
374

Table A-4. Wood.Preserving-Steam Subcategory ·cost Summary f1::>r Mod~l Plant N-:3* ~. NSPS, PSNS Battery Limit Costs
--------------------------------------------------------------------Annual
Capital Cost Operating Cost Annual
Energy.Cost ---------------------------------------------------- - ' -- -~ ---------Primary Oil Separation
Flocculation and. Slow-Sand Filtration
Pump Station
Spray Evaporation
Engineering
Land
Contingency
Sludge Disposal
Capital Recovery.
Insurance and Taxes
Labor
TOTAL
$ 40,000
16,000
5,790
92,000
"23,070
9,000
27,880
$213,700
$ 2 ,. 500
3,900
1,290
1,590
1,000
24,050
4,880
20,000
$59,200
$1,500
400
1,020
270
$3., 200 ------------------------------------------------------------------------" '
*A diagram of the Candidate Treatment Technology is shown in Figure·VlI-19.
375

Table A-5. Wood Preserving-Steam Subcategory Cost Summary for Model Plant N-4*, NSPS, P$NS Battery Limit Costs
-------------------------·-------------------------------------------Capital Cost
'Annual Operating Cost
Annual Energy Cost
-------------------------·-------------------------------- ---------------Primary Oil Separation
Flocculation and Slow-Sand Filtration
Pump Station
Spray Evaporation
Engineering
Land
Contingency
Sludge Disposal
Capital Recovery
Insurance and Taxes
Labor
TOTAL
$ 56,750
19,500
6,800
155,000
35,710
19,500
43,990
$337,250
$3,000
5,200
1,710
1,620
2,000
37,320
7,730
25,000
$83,580
$1,750
400
1,340
280
$3,770 -------------------------------------------------------------------------*A diagram of the Candidate Treatment T~chnology is shown in Figure VII-19.
376

Table A-6. Insulation Board Mechanical Refining Cost.Summary for Model Plant C-1*, NSPS Bat~eryLimit Costs
----------------·-------------------· --------- - ------------- . -------- - ----Capital Cost Operating Cost Energy Cost
- ' - - - - . ~ ------------------------------------------------------------------------Pump Stations (3)
Screening
Neutralization
Nutrient Addition
Aerated Lagoon
Facultative Lagoon
Spray Irrigation
Control House
Engineering
Land
Contingency
Sludge Disposal
Capital Recovery
Insurance and Ta:ices
Labor
TOTAL
- . . . . ' - '
$ 105,000
16,000
11;800
2,7,'300
722,000
292,600
46,400
75,680
194;500
539,900
· 304,700
$2, 335., 880
$11,700
. l , 220
3,600
35,600
156,000
14,800
~,980
8,000
211,000
55,100
40,000
$543,000
$ 3,540
140
128,000
12,500
2,950
$147,130
*A diagram of thi~ Candidate Treatment Technology is shown in Figure VII-23.
377

Table A-7. Insulation Board Mechanical Refining Cost Summary for Model Plant C-2~, NSPS Battery Limit Costs
----------------------------------------~---~--------------------------
Pump Stations (3)
Screening
Neutralization
Nutrient Addition
Aerated Lagoon
Facultative Lagoon
Spray Irrigation
Control House
Engineering
Land
Contingency
Sludge Disposal
Capitai Recovery
Insurance and Taxes
Labor
TOTAL
Capital Cost Operating Cost
$ 165,000
34,000
16,600
39,200
1,130,000
425,600
76,000
75,680
294,300
1,260,300
527,500
' $4,044, 180
$ 20,100
1,900
7,280
82,000
338,000
25,700
5,980
19,200
327,000
96,700
40,000
·$963,860
Energy Cost
$ 7,350
200
306,000
21,000
2,950
$337,500 ------------------------------------------------------------~-----------*A diagram of the Candidate Treatment Technology is shown in Figure VII-23.
378

Table A-8. Insulation Board Thermomechanical Refining Cost Summary for Model Plant C.;..1 *, NSPS ,Ba_ttery Limit Costs
-----------------------------------------------------------------------·
Pump Stations (3)
Screening
Neutralization
Nutrient Addition
Aerated Lagoon
Facultative Lagoon
Spray Irrigation
Control House
Engineering
Land
Contingency
Sludge Disposal
Capital Recovery
Insurance and Taxes
Labor
TOTAL
Capital Cost
$ 105,000
16,000
11,800
43,400
1,104,000
292,600
46,490
75,680
254,200
539,, 900
373,400
~-
.$2,862,380
Annual Operating Cost
$11,700
1,220
3,600
104,000
422,000
14,800
5,980
8,000
·212,eoo
67,000
40,000
$951,100
Annual Energy Cost
$ 3,540
140
396,000
12,500
2,950
$415,130
*A diagram of the Ca.rididate Treatment Technology is shown in Figure VII-23.
_ 379

Table A-9. Insulation Board Thermomechanical Ref.ining Cost Summar.y for Model Plant C-2*, NSPS Battery Limit Costs
Pump Stations (3)
Screening
Neutralization
Nutrient Addition
Aerated Lagoon
Facultative Lagoon
Spray Irrigation
Control House
Engineering
Land
Contingency
Sludge Disposal
Capital Recovery
Insurance and Taxes
Labor
Capital Cost
$ 165,000
·34,000
16,600
55,300
2,206,900
425,600
76,000
75,680
458,300
1,261,000
716,2.00
Annual Operating Cost
$ 20,100
1,900
7,280
238,000
1,000,000
25,700
5,980
19,200
496,800
129,500
40,000
Annual Energy Cost
$ 7,350
200
960,000
21,000
2,950
TOTAL $5,490,580 $1,984, 469\ · $991 , 500 -----------------------------------------------~------~~~-------------->''
*A diagram of the Candidate TreatJDent Technology ls shown in Figure VII-23.
380

Table A-10. Wet Process Hardboard Subcategory (S1S Part) Cost Summary for Model Plant C-1*, NSPS Battery Limit Costs
-- - - - '. ---------------------------------------------------------------------~---Capital Cost
Annual Operat,ing Cost
Annual Energy Cost.
------------------------------------------------------------------------Pump Stations ( 3.)
Screening
Neutralization
Nutrient Addition
Aerated Lagoon
Facultative Lagoon
Spray Irrigation
Control House
Engineering
Land
Contingency
Sludge Disposal
Capital Recovery
Insurance and Taxes
Labor
TOTAL
$ 84,000
9., 500
9,600
27,700
726,000
233,400
35 ,·soo
75,680
180,200
317,000.
254,800
$1,953,380
$ 8,700
1,000
2,440
36,300
168,000·
10,900
5,980
4,480
192,200
45,600.
40,000
$515,600
$ 2,340
120
138,000
9,200
2,950
$152,610
*A diagram of th~~ Candidate Treatment ·· Technology is shown in Figure VII-27.
381 '' ··,.

Table A-11. Wet Process Hardboard Subcategory (SlS Part) Cost Summary for Model Plant C-2*, NSPS Battery Limit Costs
Pump Stations (3)
Screening
Neutralization
Nutrient Addition
Aerated Lagoon •
Facultative Lagoon
Spray Irrigation
Control House
Engineering
Land
Contingency
Sludge Disposal
Capital Recovery
Insurance and Taxes
Labor
TOTAL
Capital Cost
$ 135,000
24,000
14,300
43,300
726,000
. 364,000
62,000
75,680
216,600
873,800
380,200
$2,914,880
· Annual Operating Cost
· $ 15,900
1,550
5,380
104,800
168,000
20,100
5,980
13,440,
239,700
69,500
40,000
.$684, 350
Annual Energy Cost
$ 5,340
170
138,000
16,900
2,950
$163,360 ---------------------------·------------------ :--------------------------*A diagram of the Candidate Treatment Tec,hnology is shown in Figure VII-27.
382

Table A-12. Wet Process Hardboard Subcategory (S2S Part) Cost Summary for Model Plant C*, NSPS Battery Limit Costs
. ·• . - - . -------------------- .· -- --------- ------------- ---- ------------------
Pump Stations ( 3)
Screening
Neutralization
Nutrient Addition
Aerated Lagoon
Facultative Lagoon
Spray Irrigation
Control House
Engineering
Land
Contingency·
Sludge· Di·sposal
Capital Recovery
Insurance and Taxes
Labor
TOTAL
·capital Cost
$ 187,500,
40,000
18,000
47,500
1,535,900
468,400
87,500
·75,680'
369,100
1,583,400
662,000
$5,074,980
Annual Operating Cost
$ 23,400
2,200
8,850
143,000
584,000
30,000
5,980
24,000
410,100
121,300
40,000 ·
$1 , 3 9 2 , a 3. R, <_ ·,
Annual Energy Cost
$ 9,000
230
576,000
24,000
2,950
$612,180 ------------------------------------------------------- ·----------------·".). ~·.)\;~
*A diagram of the Candidate Treatment Technology is-· · shown in Figure VII-27.
-- 383

w (X) .p.
Table A-13. Wood Preserving--Steam Subcategory Costs of Compliance for Individual Plants Direct Dischargers
Plant
268
Biological Treatment (Technology A or B)
Capital Cost
0
Annual Annual Operating Energy
Cost Cost
0 0
Biological Treatment Pl us .Activated
Carbon Adsorption (Technolo~~ C or D)
Capital Cost
68,800
Annual Annual Operating Energy
Cost Cost
30,900 1,300
Spray Evaporation (Technolofil'_ N)
Capital Cost
176,600
Annual Operating
Cost
36,000
Annual Energy
Cost
200

Table A-14. Wood Preserving--Steam Subcategory Costs of Compliance for Individual Plants Indirect Dischargers
Spray Evaporation Biological Treatment (Technology N) Plus Conversion
Biological Treatment Plus Metals Removal srray Evaporation From Open: to Closed Steaming (Technolos;x: J or K) (Technologx: Lor M) Technologx:N) (Technologt O)
Annual Annual An1U1al Annnal Anrual Anrual AnlUla · Annual Capital Operating Energy Capital Operating Energy .capital Operatill!; Energy Capital Operating Energy
Plant Cost Cost Cost Cost Cost Cost Cost Cost Cost Cost Cost Cost
173 65,100 25,400 2,400 167,000 52,500 3,400 119,100 29,900 300 0 0 0
ti 267 118,000 37,100 4,ooo· 0 0 0 198,000 40,200 300 0 0 0 335 80,800 29 ,40·0 2,900 191,900 . 59,000 4,000 147,900 33,700 300 0 0 0
' 338 83,400 30,100 3,000 0 0 0 J.52,500. . 34,300 300 0 0 0 339 68,500 · 33,500 5,200 0 0 0 88,600 26,000 300' 0 0 0 547 79,100 38,700 6,700 0 0 0 .116 ,400 29,900 300 0 0 0 582* 163,100 46,800 5,400 308,600 91,500 7,100 256,400 49,700 1 ;100 . 0 0 0. 596 .' 46;100 . 21,300 1,800 129,400 42,900 2,500 78,400 24,400 Joo·: 0 0 0 620 148,700 44,000 5,100 291,500 87,300 6,700 233,700 44,900 300 0 0 0 6.93* 70,300 27,200 2,700 ·o 0 0 133,500. 31,800 300 0 0 0 765 110,200 35,900 3,900 0 0 0 188,100 38,900 300 0 0 0 894 119,400 47,800 4,200 . 0 0 0 208,400 53,300 1,600 · 0 .o 0 898 42,600 · 9,700 1,300 0 0 0 106,100 15,900 200 0 0 0 899 210,900 66,300 ·r 6,800 369,600 116,400 8,700 296,600 65,200 1,800 0 0 0 901 75,100, 28,200 .. 2,800, 0 0 0 145,600 34,700 1,400: .. · · 0 0 0
w 910 82,200 29,900 3,000 0 0 0 149,400 33,900 300, 0 0 0 CX) 1076* 128,500 39,800 4,500 0 0 0 209,900 41,600 300 0 0 0 <J'1 1200 240,200 61,800 7,400 0 0 0 322,800 57,500 300 0 0 :Q
1201 164,600 47,300 5,600 311,300 92,400 7,300 251,400 47,200 300: 0 0 .. 0 896 0 0 0 0 0 0 0 0 0 112,200 30,800 1,100 139 46,100 21,300 1,800 0 0 0 79,100 24,500 300 0 ,0 .o 589 72,100 27,400 · 2,700 177,900 57,800 3,700 132,800 31,700 300 0 0 0 57S 152,000 . 44,700. 5,200 0 0 0 239,800 45,300 1,600 0 0 0 594* 326,100 89,700 9,500· 0 0 0 403,400 ' 79,200 300 0 0 0 530 49,300 21,900 1,800 0 0 0 83,300 25,100 300 0 0 0 529 46,100 .21,300 . 1,/300 0 0 0 79,100 24,400 300 0 0 0
1203* 69,200 26,900 . 2,500 0 0 0 128,500 31,100 '300 0 0 0 294 46,900 30,500 1,900 0 0 0 79,100 24,400 300 0 0 0
1205 46,900 30,500 l,900 0 0 0 79,100 24,400 300 0 0 0
* I?entified as potential closure candidate due to the compliance costs of attaining the proposed no discharge of.. PCP pretreatment standard. A site specific study .was conducted following the proposed pretreatment standard .to refine the· compliance cost analysis. This study determined that the refined compliance costs were iri general agreement. with the original compliance costs and were still high enough for the plant to be considered a potential closure candidate.

w CX) O'I
Table A-15. Wood Preserving--Boulton Subcategory Costs of Compliance for Individual Plants Indirect Dischargers
Biological Treatment Biological Treatment Plus Metals Removal Cooling Tower Evaporation (Technolo~l J or K) (Technology Lor M) (Technology N)
Annual Annual Annual Annual, Annual Annual Capital Operating Energy Capital Operating Energy Capital Operating Energy
Plant Cost Cost Cost Cost Gost Cost Cost Cost Cost
65* 104,000 35,100 4,100 231,000 72,900 5,400 71,900 36,800 6,500
549 976,000 20J, 100 21,400 0 0 0 178,200 110,100 62,000
555 0 0 0 0 0 0 110,400 55,300 18,500
577 352,000 84,300 10,000 536,100 148,700 12,400 118,500 59,900 22,000
655 238,000 61,700 7,400 406,200 116,800 9,400 103,500 51,000 15,500
743* 82,300 33,300 3,000 0 0 0 62,100 33,000 4,400
1027 173,900 48,800 5,600 322,300 96,000 7,300 92,000 44,600 11,000 ------
1078 134,500 41,000 4,700 273,500 83,700 6,200 81,600 40,700 8,800
1110 104,000 35,100 4,100 0 0 0 71,900 36,800 6,500
1111 0 0 0 0 0 0 103,500 51,100 15,500
* Identified as potential closure candidate due to the compliance costs of attaining the proposed no discharge of PCP pretreatment standard. A site specific study was conducted following the proposed pretreatment standard to refine the compliance cost analysis. This study detennined that the refined compliance costs were in general agreement with the original compliance costs and were sti~l high enough for the plant to be considered a potential closure can:lidate.

Costs. of. Compliance for Individual Plants--Insulation Board and Hardboard
A plant-by-plant analysis was performed·on·each insulation board· and. hardboard·plant -to determine .the ·cost of compliance-for each applicable lE~vel of biological treatment technology discussed in· Section VII. The individu~l plant's wastewater flow, raw and treated wastewater characteristics and in-place technology were all considerE:.>d in determining cost of compliance.
Insulation Board-Mechanical Refining Plants--There is only one mechanical refining direct discharger in the insulation· board subcategory._ This plant exhibits exemplary treatment, therefore no cost of compliance ·will be incurred.· The remaining plants in this subcategory are either self contained {no discharge} or indirect dischargers, and no . costs of compliance will··. be incurred. As previously discussed in.Section VII,pretreatment of raw wastE:.>waters - from this subcategory is not considered necessary due to· the extremely low levels of toxic pollutant contamination~ .~
Insulation Board-Thermomechanical Plants-There are· four thermomechanical refining direct dischargers in the insulatfon board subcategory. Three of these exhibit exemplary treatment and no· cost of compliance will be incurred.· The fourth ,direct discharger also produces S2S hardboard and the cost analysis for this plant will be. presented in the S2S hardboard .discussion-· below.
SlS Hardboard--Of the nine SlS hardboard plants, seven are direct dischargers. Three of these plants exhibit-effluent le~els lower in pollutant loadings than the two candidate levels of biological . treatment described in Section.VII. No costs of compliance will be incurred by these plants. One plant is an indirect ·discharger and will not· incur a cost of compliance as pretreatment of wastewaters from the SlS p~rt of .this subcategory is not considered to be necessary because of the.extremely low.levels of toxic pollutant contamination and lack of available technology to further reduce those levels. Another plant is self. contained and, therefore, will not incur_a cost of compliance. Table A-16 presents thE:.> costs of compliance for the remaining plants foreach of the two candidate _levels of biological treatment.
S2S Hardboard--Of the sev.en S2S hardboard plants, five are direct dischargers .. Of the five, three plants exhibit effluent levels lower. in pollutant loadings than. the candidate levels·. of biological treatment~described in Section VII. No costs of compliance will be incurred by these plants._ The fourth direct discharger is currently- constructing extensive treatment-" facilities expected to be normally operating this year. Costs of· compliance for this plant are based on expected (and designed}' effluent levE:!ls which will be achieved by the new system. Costs of comp! ianci:!. for the direct dischargers required to upgrade are presented in Table A~17 for each of the candidate levels· of
-387

' biological treatment. Of the remaining two:plants, one is self contained (no discharge) and the other is an indirect discharger. No costs of compliance will be incurred by these plants. Pretreatment of raw wastewater from the S2S part of this subcategory is not considered necessary due to the extremely low levels of toxic pollutant contamination.
388

w (X) '0
l
Table A-16. Wet Process Hardbo,ard Subcategory ( S 1S Part) Costs of Compliance for Individual Plants Direct Dischargers
Biological Treatment Based on Can- Biological Treatment Based on didate Treatment Technology A (BPT) Candidate Treatment Technology B (BCT)
Annual Annual Annual Annual Capital Operating Energy Capital Operating Energy
Plant Cost Cost ·Cost Cost Co0st Cost
(00207) -- -- -- 1,228,000 251,000 18,000
(00348) 2,004,700 526,800 128,400 2,938,000 739,000 213,000
(00003) 285,000 84,000 1,000 1,, 105,300 237,000 1,000
(00929) -- -- -- 183,000 122,000 30,000
(00678) -- -- -- 599,000 173,000 41,000
Energy costs are lower for the BCT option due to technology differences between options.

w \0 0
Table A-17. Wet Process Hardboard Subcategory (S2S Part) Costs of Compliance for Individual Plants,. Direct Dischargers
1
108
BPT Biological Treatment Based on Performance Equivalent to SlS
Subcategor~ BPT Plant Capital Operatlng Energy
Cost Cost Cost
7,266,000
0
3,068,000
0
1,368,000
0
BCT Biological Treatment Based on Performance of Plant 980 Candidate Treatment Technology C
Capital Operating Energy Cost Cost Cost
7,436,000 3,173,000
6,856,000 1,601,000
1,408,000
375,000

APPENDIX B-1
TOXIC OR POTENTIALLY TOXIC SUBSTANCES NAMED IN CONSENT DECREE
Acenapthene Acrolein Acrylonitr i lE:! Aldrin/Dieldrin Antimony Arsenic Asbestos Benzidine Benzene Beryllium Cadmium Carbon Tetrachloride Chlordane Chlorinated Benzenes Chlorinated Ethanes Chloroalkyl Ethers Chlorinated Naphthalene Chlorinated.Phenols Chloroform 2-Chlorophenc:,l Chromium Copper Cyanide DDT Dichlorobenzenes Dichlorobenzidine Dichloroethylenes 2,4-Dichlorophenol Dichloropropane and Dichloropropene 2,4-Di-ethylphenol Dini trotoluE:me 1,2-Diphenylhydrazine Endosulfan Endrin Ethy 1 benzenE:? Fluoranthern:? Haloethers Halomethanes Heptachlor Hexachlorobutadiene Hexachlorocyclohexane Hexachlorocyclopentadiene Isophorone Lead Mercury Napthalene Nickel Ni trobenzeni:? Nitrophenols Nitrosamines
391

Pentachlorophenoi Phenol Phthalate Esters Po·lynuclear Aromatic Hydrocarbons ( PNAs) Polychlorinated Biphenyls (PCB's) Selenium Silver 2,3,7,8 Tetrachlorodibenzo-p-dioxin (TCDD) Tetrachloroethylene Thallium Toluene Trichloroethylene Toxaphene Vinyl chloride Zinc
392

. '' .. ' .
LIST OF SPECIFIC TOXIC POLLUTANTS
1. benzidine 2. 1,2,4-trichlorobenzene 3. hexachlorobenzene 4. chlorobenezene 5. bis(chloromethyl) ether 6. bis(2-chloroethyl} ether 7. 2-chloroe·t.hyl vinyl ether (mixed) 8. l,2-dichl9robenzene 9. 1,3-dichlorobenzene
10. 1,4-dichlorobenzene 11. 3,3'-dichlorobenzidine 12. 2,4-dinitrotoluene· 13i 2,6-dinitrotoluene 14. 1,2-diphenylhydrazine 15. ethylbenzene 16. 4-chlorophenyl phenyl ether 17. 4-bromophenyl phenyl ether 18. bis(2-chloroisopropyl) ether 19. bis(2-chloroethoxy) methane 20. isophorone . 21. nitrobenzene 22. N-nitrosodimethylamine 23. N-nitrosodiphenylamine 24. N-nitrosodi-n-propylamine 25. bis(2-ethylhexyl) phthalate 26. butyl benzyl phthalate 27. dt~n-butyl phthalate 28. diethyl phthalate 29. dimethyl phthalate 30. toluene 31. vinyl chloride (chloroethylene) 32. acrolein 33. acryfonitrile 34. acenaphthene 35. 2-chloronaphthalene 36. fluoranthene 37. naphthalene 38. 1,2-benzanthracene 39. benzo(a)pyrene(3,4-benzopyrene) 40. 3,4-benzofluoranthene 41. 11,12-benzofluoranthene 42. chrysene 43. acenaphthylene 44. anthracene 45. 1,12-benzoperylene 46. fluorene 47. phenanthrene 48. 1,2,5,6-dibenzanthracene
393

49. indeno (1,2,3-,cd)pyrene 50. pyrene 51. benzene 52. carbon tetrachloride (tetrachlorometbane) 53. 1,2-dichloroethane 54. 1,1,1-trichloroethane 55. hexachloroethane 56. 1,1-dichloroethane 57. 1,1,2-trichloroethane 58. 1,1,2,2-tetrachloroethane 59. chloroethane 60. 1,1-dichloroethylene 61. 1,2-trans-dichloroethylene 62. 1,2-dichloropropane : 63. 1,2-dichloropropylene (l,2-dichloropropene) 64. methylene chloride (dichloromethane) 65. methyl chloride (chloromethane} 66. methyl bromide (bromomethane) 67. bromoform (tribromomethane.} 68. dichlorobromomethane 69. chlorodibromomethane 70. hexachlorobutadiene 71. hexachlorocyclopentadiene 72. tetrachloroethylene 73. chloroform (trichloromethane} 74. trichloroethylene 75. aldrine 76. dieldrin 77. chlordane (technical mixture and metabolites) 78. 4,4'-DDT 79. 4,4'-DDE (p,p'-DDX) 80. 4,4'-DDD (p,p'-TDE) Bl. a-endosulfan-Alpha 82. b-endosulfan-Beta 83. endosulfan sulfate 84, endrin 85. endrin aldehyde 86. endrin ketone 87. heptachlor 88. heptachlor epoxide 89. a-BHC-Alpha 90. b-BHC-Beta 91, r-BHC (lindane}-Gamma 92. g-BHC-Delta 93. PCB-1242 (Arochlor 1242) 94, PCB-1254 (Arochlor 1254) 95. toxaphene 96. 2,3,7,8-tetrachlorodibenzo-p-dioxin (TCDD) 97. 2,4,6-trichlorophenol 98. parachlorometa cresol 99. 2-chlorophenol 100. 2,4-dichlorophenol 101. 2,4-dimethylphenol 102. 2-nitrophenol
394

103. 4-nitrophenol 104. 2,4-dinitrophenol 105. 4,6-dinitro-o-cresol 106. pentachlorophenol 107. phenol 108. cyanide (Total) 109. asbestos (Fibrous) 110. arsenic (Total) 111. antimony(Total.) 112. beryllium (Tot~l) 113. cadmium (Total) 114. chromium (Total) 115. copper (Total) 116. lead (Total) 117. mercury (Total) 118. nickel (Total) 119. selenium (Total) 120. silver (Total) 121 .. thallium (Total) 122. zinc (Total)
395


APPENDIX C
ANALYTICAL METHODS AND EXPERIMENTAL PROCEDURE
. INTRODUCTION
EPA Protocols Used
The analytical effort for the Timber Products Processing Point Source Category began in November 1976 with. the analyses of screening samples. The protocol available at that time was the draft "Protocol for the Measurement of Toxic Substances," U.S. EPA, Cincinnati, Ohio, October 1976. ·
• C,,F - -
Analyses of. verification samples were conducted from February 1977 to t4ay 1978, by which time the protocol, "Sampling and Analysis Procedures for Screening of Industrial Effluents," March 1977 (revised April 1977) was available.
Nature of th~. Samples
The wastewaters analyzed are characterized by BOD values as high as 7,500 mg/li suspended solids concentrations as high as 3,000 mg/1, and Oil and Grease values as high as 10,000 mg/1. Such gross quarit1ties of materials in the samples provided the potential for interference during workup and subsequent analysis. High concentrations of dfssolved organics also. imposed constraints on the achievable sensitivity~.
This problem was partially circumvented by the use of smaller sample aliquots and by dilution of the resulting extract. The interference was not of consequence when analyzing classical or inorganic parameters. Clean'"'.up procedures could· be used for specific parameters, but the need for screening and verification data on a large number of _compounds precludes th~ use of general clean-up procedures.
Overview of Methods
The toxic pollutants may be considered according to· the· broad classification of organics and metals. The organic toxic pollutants constitute the larger group and were analyzed according to the categories of purgeable volatiles, extractabl~ semi-volatiles, and pesticides and PCB's. The principal analytical method for identification and quantitation or organic toxic pollutants, other than pesticides and PCB's, was repetitive scanning GC/MS. ·
In the screening phase, GC/MS compound identification was made in. terms of the· proper chromatographic· retentfon.time and comparison of the entire mass spect~um with that of ari authentic standard or that from a reference work when the standard was not ayailable or the substance was. too toxic to obtain.
397

Compound quantitation was performed in terms of the integrated areas of individual peaks in the total ibn current chromatogram compared with an external standard.
In the verification phase, compound identification was based on the following criteria: (1) appropriate retention time within a window defined as :1: 1 minute that of .. the compound in the standard; (2) coincidence of the extracted ion current profile maxima of two (volatiles} or three (extractables} characteristic ions enumerated in the protocol; and (3) proper relative ratios of these extracterl ion current profile peaks.
Toxic pollutants were quantitated with direct integration of peak areas from extracted ion current profiles and relative response factors in terms of the internal standard dlO- anthracene.
·1
An alternate GC/FID procedure (Chriswell, Chang, and :f'ritz, Anal. Chem., 47, 1325, (1975}} was employed for the phenols for the screeningsamples. In the procedure, phenol samples were steam distilled and the resultant distillate was subjected to the ion exchange separation followed by GC/FID identification and quantitation.
The use of this method was prompted because of the severe emulsion problems encountered when extracting the samples by the draft protocol method. Recovery data for the draft protocol method was unacceptable .for these wastewaters and therefore this procedure was substituted.
In both screening and verification phases the pesticides and PCB's were analyzed by the use of GC/ECD. Identification was based on retention time relative to a standard injected under the same conditions. Quantitation was based on peak area for the same standard injection. The metals were done by flameless atomic absorption and all classical parameters were done by standard methods. There were slight differences between the screening method and verification method that were largely due to the evolution of the analytical protocol t6 its present form.
DETAILED DESCRIPTION OF ANALYTICAL METHODS
Volatile Toxic Poilutants
The purgeable volatile toxic pollutants are those compounds which possess a relatively high vapor pressure and low water solubility. These compounds are readily stripped with high efficiency from the water by bubbling an inert gas through the sample at ambient temperature.
I The analytical methodolc)gy employed for the volatiles was based on the dynamic headspace technique of Bellar and Lichtenberg. This procedure consists of two steps. Volatile organics are purged from the raw-water sample onto a Tenax GC-silica gel trap with a stream of inert gas. The volatile organics are then
398

thermally de:si:,rbed into th~. GC inlet for subsequent GC/MS identification and quantitation ..
·-
The purgable volatile toxic pollutants considered in the final verification phase are listed,in Table C-1.
• - , r: • -~ -~-
A 5 ml aliquot of the raw water sample was purged at ambient temperature with He for 12 miriutes onto a 25 cm x 1/8 in. o.d. stainless steel trap containing.an 18 cm bed.of Tenax GC 60/80 mesh and a 5 cm bed of Davison Grade 15 silica gel 35/60 · mesh. This 5 ml aliquot represented a single sample or a composite of the various vc,latile samples collected at the individual station.
The organics were thermally desorbed from the trap for 4. minutes at 180° with a He flow of ~O ml/min into the ... GC inlet. The collection of repetitively scanned mass spectra was initiated with the application of heat to.thetrap .. The enumeration of all instrument parameters is presented in Table C-2.
The gross quantities of organics contained·in many of ·the process waste streams necessitated preliminary.screening of samples. To accomplish such screening; a .10 .ml portion of the sample was extracted with a single portion of solvent and the.extract was subjected to GC/FID analysis to permit the judicious selection of appropriate s,ample volume, i.e., less than 5 ~l, for purge and trap analysis.
Although nonvolatile compounds purge poorly, significant quantities ca:n accumulate on the analytical column from samples containing high levels of thes.e materials. A column of O .1 percent SP-1000 (Carbomax 20M esterified with nitroterephthalic acid) on 80/100 mesh Carbopac C was employed for the verification phase. The greater.. temperature stabi 1 i ty of the SP-1000 stationary phase, as compared with the lower molecular weight Carbomax 1500, permitted column·bake out at· elevated temperatures for extended periods of time without adverse effects.
The purge and trap apparatus employed emphasized: (1) shortheated transfer lines, (2) low dead-volume construction, (3) manually-operated multiport. valve, and (4) ready replacement·of all. component parts. Although the .operation of the purge and trap apparatus is straightforward conceptually, cross contamination between samples and/or standards can be a serious problem. This design permitted the ready. substitution of component parts with thoroughly preconditioned replacement parts when serious contamination was indicated by system blanks.
Foaming tend,ed to be excessive with a number of· the samples, particularly those analyzed neat. The brief ~pplication of localized heat to the foam trap, as foam began to accumulate, was effective in breaking the foam.
A stock standard was prepared on a weight basis by dissolving the volatile solutes in methanol: Intermediate concentrations
399

prepared by dilution were employed to prepare aqueous standards at the 20 and 100 ppb levels. A 5 ml aliquot of these standards was analyzed in a manner identical to. that employed with the samples. The attendant reconstructed total ion current chromatogram for a purgeable volatile organic standard is presented in Figure C-1.
Semivolatile Toxic Pollutants
The extractable semivolatile toxic pollutants are compounds which are readily extracted with methylene chloride. They are subjected to a solubility class separation by serial extraction of the sample with methylene chloride at pH of 11 or greater and at pH 2 or less. This provides the groups referred to as base neutrals and acidics (phenolics), respectively.
Base neutrals and phenolics were fractionated on the basis of a solubility class separation. Due to the widely varying chemical and physical properties possessed by the individual semivolatile toxic pollutants, the whole sample, i.e., suspended solids, etc., was subjected to extraction. Enumeration of· the base neutrals and acidic semivolatiles is provided in Tables C-3 and C-4. A 1-liter sample was subjected to two successive extractions with three portions of methylene chloride (150, 75, and 75 ml) at pH 11 or greater and pH 2 or less to provide the base neutral and acidic fractions, respectively.
Emulsions were broken by the addition of Na 2 S04 or methanol or simply by standing.
The extract from each fraction was dried by passage through Na2S04, and and the volume was reduced .with a Kuderna-Danish evaporator to 5 to 10 ml. The extract ~as further concentrated to 1 ml in the Kuderna-Danish tube under a gentle stream of organic-free nitrogen.
The solvent volume was reduced to 1.0 ml $piked with 10 ul of the dlOanthracene internal standard soution of 2 ug/ul and subjected to GC/MS analysis.
The presence of gross quantities of a variety of organics in the extracts of many of the process waste streams necessitated screening of all extracts by GC/FID prior to GC/MS analysis. Sample extracts were diluted as indicated by the GC/FID scan and subjected to GC/MS analysis. A reconstructed total ion curr,ent
400

Table C-1. Purgeable Volatile ·Toxic Pollutants
--------~--------~~-~----~-----~-~-----~~--~~--------------~-~----chloromethane bromomethane chloroethane trichlorofluoromethane trans-1,2-dichloroethylene 1,2-dichloroethane · carbon tetrachloride bis-chloromethyl ~ther (d) trans-l,3-dichloropropene dibromochloromethane 1,1,2-trichloroethane 2-chloroethylvinyl ether bromoform 1,1,2,2-tetrachloroethane toluene
ethyl benzene dichlorodifluoromethane vinyl chloride methylene chloride l,1-:-dichlQroethylene J,1-dichloroethane
. chloroform · 1,1,1-trichloroethane bromodichloromethane 1,2-dichloropropane trichloroethylene cis-1,3-dichloropropene benzene
· 1,1,2,2-tetrachloroethene chlorobenzene
' ' ," ' '' ' .~ ,-_ .. - ' . . - ' ' . ' ' . ------~----~----~--~~------~-~~~--~--~-----~~----------~-----------
401

Table C-2. Parameters for Volatile Organic Analysis ! --------------------------------------------~---------------------
Purge Parameters
Gas Purge duration Purge volume Purge temperature Trap
Desorption temperature Desorption time
GC Parameter
Column
Carrier Program
Separator
MS Parameters
Instrument Mass Range Ionization Mode Ionization Potential Emission Current Scan time
He 40 ml/min 12 min 5 ml Ambient, 7 in Tenax GC 60/80 mesh plus
2 in Davison Grade 15 silica gel 35/60 mesh in 10 in X 1/8 in o.d. ss
180° 4 min
8 ft x 1/8 in, nickel, 0.1% SP-1000 on Carbopac C 80/100
He 30 ml/min 500 isothermal 4 min then 8°/min to 1750 isothermal 10 min Single-stage glass jet at 1850
Hewlett Packard 5985A 35-335 amu Electron impact 70 eV 200 uA 2 sec
--------------------------------------------------------------------
402

:E cC a: CJ -00 I- a: <C <C :E i 0~ i U) 00
(.) I- -zz w .ce a: CJ a: a: :::, ,0 o· w z~ Q~ ...I ...I <C 0 I- > o· I- ~
~·! I- CJ 0 a: :::, :::, a: a. :;; a: zo 0 LI. 0 w a:
ETHYL BENZENE
CHLOROBENZENE
TOLUENE
TETRACHLOROETHENIE. 1,4 • DICHLOROBUTANE
1, 1,2, 2 • TETRACHLOIIIOETHANE
_,
BROMOFORM -----==~~=::;;;;;~~§~ CIS • 1,3 • DICHLOROPROPENE
1,1,2. TRICHLOROETHANE & BENZENE RiicHwR01ffiiVl:fNlf.::=;~~~~~= TRICHLOROETHVLENE TRANS· 1,3 • DICHLO~R;_;O~P~R;O;;P;E:N~E==~~~===
1,2 • DICHLOROPROPANE ·
CARBC>N TETRACHLORIDE _....,,.,-======= 1, 1, 1 • TRICHLOROETHANE
TRANS· 1,2 • DICHLOROETHYLENE ·.;;.::=:: 1,2 • DICHLOROIETHANE .-===::::._
CHLOROFORM-======
1, 1 • DICHLOROETHANE _i::::;;;;;;_ 1, 1 • DICHLOROETHYLENE
BROMOCHLOROMETHANE--,am:,==:::::::=::::::::::::::::::::::::::::::~:::::__
ACETONE
403

Table C-3. Base Neutral Extractables
1,3-dichlorobenzene hexachloroethane bis(2-chloroisopropyl) ether 1,2,4-trichlorobenzene bis(2-chloroethyl) ether nitrobenzene 2-chloronaphthalene acenaphthene fluorene 1,2-diphenylhydrazine N-nitrosodiphenylamine 4-bromophenyl phenyl ether anthracene diethylphthalate pyrene benzidine chrysene benzo(a)anthracene benzo(k)fluoranthene indeno(l,2,3-cd)pyrene benzo(g h i)perylene N-nitrosodi-n-propylamine endrin aldehyde 2,3,7,8-tetrachlorodibenzo-p-dioxin
Table C-4. Acidic Extractables
2-chlorophenol 2-nitrophenol phenol 2,4-dimethylphenol 2,4-dichlorophenol 2,4,6-trichlorophenol 4-chloro-m-cresol 2,4-dinitrophenol 4,6-dinitro-o-cresol pentachlorophenol 4-nitrophenol
404
1,4-dichlorobenzene 1,2-dichlorobenzene hexachlorobutadiene naphthalene hexachlorocyclopentadiene bis(2-chloroethoxy) methane acenaphthylene isophorone 2,6-dinitrotoluene 2,4-dinitrotoluene hexachlorobenzene phenanthrene dimethylphthalate fluoranthene di-n-butylphthalate butyl benzylphthalate bis(2-ethylhexyl)phthalate benzo(b)fluoranthene benzo(a)pyrene dibenzo(a,h)anthracene N-nttrosodimethylamine 4-chloro-phenyl phenyl ether 3,3'-dichlorobenzidine bis(chloromethyl) ether

chromatogram for base neutrals· and for phenolic standard are shown in Figures C-2 and C-3, respectively.
GC/MS instrument parameters employed for the analysis of base neutrals and phenolics are presented in T~bles C-5 and C-6.
The SP-1240 DA chromatographic phase employed for the analysis phenolic extracts in the verification phase provided superior performance as compared with that achieved on Tenax GC. The SP-1240 DA phase provided improved separation, decreased tailing, decreased adsorption of nitrophenols and pentachlorophenol,· and increased column life.
Emulsion formation in basic solution. under the protocol conditions precluded an efficient extraction of phenolic compounds. An alternate procedure, requiring a separate portion of sample for the acidic extraction, was employed to minimize this problem i.n the verification phase.
A 1-liter portion of sample was adjusted to pH of 2 or less and extracted with three portions.of methylene chloride (100, 75, and 75 ml). These extracts were combined and .. the acidic compounds were backextracted with two .100 ml portions of aqueous base (pH 12). The basic aqueous extracts were then acidified to pH of 2 or less and E~>::tracted again with two l 00 ml portions of methylene chloride. The resultant extract was then processed as discus~ed above under protocol pr<:>cedure.
PESTICIDES ANI> PCB's
Pesticides and PCB's were extracted and analyzed as a separate sample. These compounds wer.e analyzed by gas chromatograph with electron capture detection (GC/ECD). Only when the. compounds were present at high levels were the samples subjected to GC/MS confirmation ..
The need for the increase. in concentration is due to the sensitivity of the GC/MS as compared to the GC/ECD. The absolute detection limit for pesticides by GC/MS is approximately 2 parts per billion .. GC/ECD.detection limit varies due to the degree of chlorination, but ranges from one-half part per billion for PCB's to 50 parts per trillion for chlorinated pesticides. The implications of this fact are that all pesticides and PCB's that are reported below 2 ppb have been confirmed on two columns using GC/ECD, but not confirmed on GC/MS. Table C-7 presents the GC/ECD paramE~ters employed for the analysis of pesticides and PCB's.
The proceduri~ taken from the demonstration analysis.
used for the analysis of pesticides and PCB's was Federal Register. Figure C-4 is a graphic
of the step-by-step procedure used in this
405

"' ..J <C a: I::, w z w ~ m a: 0 u. :l: <C a: C, 0 ~ :5 0 a: :c 0 1-z w a.! a: ::, 0 z 0 -..J
~ 0 I-Q w lo ::, a: I-
"' z 0 0 w a:
BENZO (G,H,I) PERYLENE c.-._____
DIBENZO (A,H) ANTI-IRACENE--------INDENO (1,2,3 - C,D) PYRENE _______ _
BENZO (A) ANTHRACENE--- 3,3' - DICHLOROBENZIDINE CHRYSENE· ~~ i
BIS (2 • ETHYLHEXYL) PHTHYLATE 3 BUTYLBENZYLPHTHYLATE -------------==:_:::;,_ BENZI DINE---=::..
PYRENE-----a::::::::;;.,. FLUORANTHENE-------=::__..,;,=::.,
DI · N · BUTYLPHTHYLATE --------=••=::::.
N • HITROSODIPHENYLAMINE HEXACHLOROBENZENE
DIETHYLPHTHYLATE ==--=:-::: , AZOBENZENE FLUORENE:
DIMETHYLPHTHYLATE ACENAPHTHENE .
ACENAPHTHYLENE
2·CHLORONAPHTHALENE----=:::::,
HEXACHLOROCYCLOPENTADl~NE ----.a::=:::-.,
1,2,4 • TRICHLOROBENZENE & ----~NA~P~H~T~H~A~L:EN:E;_:==~~~ HEXACHLOROBUTADIENE
N - NITR0SODIPROPYLAMINE
1,2 • DICHLOROBENZENE & -------=====::... HEXACHLOROETHANE 1,4 - DICHLOROBENZENE
1,3 - DICHLOROBENZENE
406
N I
(.)
Ul

Q C: < Q z ,c tu, () ::; 0 z w :t: 0. a: 0 u. :E < a: C, 0 ~ :e 0 cc :c (.)
.... z w a: a: ::, '(.)
z 0 ..J < .... 0 I-Q w 1-(.) :::, a: ~ z 0 (.) W· a:
4 • NITROPHENOL
PENTACHLOROPHENOL-11a:11::====~
2,4•D1NITFl0PHEN0L + 4,8 • DINITRO • 0 • CFIESOL
D,o • ANTHR.t.CENE
2,4,1 • TRICHLOFIOPHENOL------========:::..
2,4 • DICHLOFIOPHENOL 2,4 • D1P.4ETttVLPHEN0L
2 • NITFIOPHENOL
2 • CH.LOFIOPHENOL----s=====:::..
407
N ....
,...
+

Table C-5. Parameters for Base Neutral Analysis
GC Parameters
Column
Carrier Program
Injector Separator Injection Volume
MS Parameters ·
Instrument Mass Range Ionization Mode Ionization Potential Emission Current Scan time
6 ft x 2 mm i.d., glass, 1% SP-2250 ~n 100/120 mesh Supelcoport He 30 ml/min 500 isot,hermal 4 min then so/min to 2750 for· 8 min 285° Single-stage glass jet at 2750 2 ul
Hewlett Packard 5985 A 35-335 aniu Electron impact 70 ev 200 uA 2.4 sec
Table C-6. Parameter~ for Phenolic Analysis
GC Parameters
Column
Carrier Program
Injector Separator Injection Volume
MS Parameters
6 ft x 2 mm i . d . , glass , l % SP-1240 DA on 100/120 mesh Supelcoport He 30 ml/min 90 to 200° at 8°/min with 16 .. ,riin hold
2500 Single-stage glass jet at 250° 2 ul
Instrument Hewlett Packard 5985 A Mass Range 35-335 amu Ionization Mode Electron .impact Ionization Potential 70 ev Emission Current 200 uA Scan time 2. 4 sec i ---------------------------------------------~--------------------
408

FLC)W CHART FOR PESTICIDES AND PCB'S
Fraction I Containing
PCB
Concentration
GC/ECD Column I
GC/ECD -.:... GCMS Column II Conf.
I I
Quantitation __ J
Sample Received
Adjust pH
Measure Volume
Seri a 1 Solvent Extraction
Concentration
Silica Gel Separation
Fraction II Containing
TOX, Chl~rdane, DDT
Concentration
GC/ECD Column I
GC/ECD __ GCMS Column II Conf.
Tabulation·
Report
409 ..
I I __ J
Fr act ion II I Containing Cyclodienes
Concentration
GC/ECD. Column I
GCMS Cont.
I I L Quantitation
·Figure C·4

The compounds of interest are listed in Table C-8 and a chromatogram of some selected representatives is shown in Figure c-s. METALS
Metals analyzed consisted of the following:
Beryllium Cadmium Chromium Copper Nickel Lead Zinc
Silver Arsenic Antimony Selenium Thallium Mercury
With the exception of mercury, the screening metal analyses were performed by Inductively Coupled Argon Plasma at the EPA Laboratory in Chicago. Mercury samples were collected separately in 500-ml glass containers with nitric acid preservative and analyzed by the standard cold v·apor technique.
Metals analysis for the verification phase were performed by atomic absorption according to the protocol method. This method entailed the complete digestion of the samples with strong acid and peroxide, then injection into a graphite furnace. Quantitation was accomplished by the standard addition method.
TRADITIONAL OR CLASSICAL PARAMETERS
The traditional parameters investigated included:
BOD COD TSS TOC Oil and Grease Total Phenol Total Cyanide
All of these parameters were analyzed by standard methods. There were no deviations from these methods, noted for any of the analyses.
The colormetric protocol method for cyanide entailed the steam distillation of cyanide from strongly acidic solution. The hydrogen cyanide gas was absorbed in a solution of sodium hydroxide, and the color was developed with addition of pyridinepyrazolone.
.410

Table C-7. GC:/ECD Pararneteri:i for' Pesticide and PCB Analysis
-----------~-·- - .. ·-----.--·- ----------------------------------Column
Carrier
Program
6 ft x 1/8-in glass 1.5% OV-17/1.95% QF-1 Conf~rmation 6% SFc-30/4% OV210 On Supelcoport 80/100
5% methane/Argon 50 ml/min
200°c isothermal Ni63 Fe CD
-------------------------------- -------------------- -----------Table C-8. Pesticides and PCB's
- - ---------------'!"··----.-----------------------------------------------~ a-endost1lfan
a-BBC, r-BHC d-BHC delta -BHC
aldrin heptachlor heptachlor epoxide
b-endosulfan dieldr:in 4, 4' -Dl)lE: 4, 4 '-D])]D 4, 4 '-DlD'r endrin endrin aldehyde
endosulfan sulfate chlordane t:oxaphene. PCB-1242 PCB-1254
---------------------. ------------~---. ------~--. -.--------------- '
411

Q a: ct Q z ct ... Cf)
Q w >< -:E w Q -0 -... Cf) w Cl.
HEPTACHLOR E:POXIDE
4,4 • DDT
4,4 ~ DOD
2,4•00T?
ENDRIN
2,4-DDD<
DIELDAIN~
4,4 • ODE
HEPTACHLOR
')'. BHC
co .,..
N .,..
0 .,..
co
. c:::========================::==--------L!
412
II) I
(.)
! :::, Q ii:

APPENDIX D CONVERSION TABLE
Multiply (English Units) By To Obtain (Metric Units)
English Unit Abbreviation Conversion Abbreviation Metric Unit
acre ac 0.405 ha hectares
acre-feet ac ft 1233.5 cu m cubic meters
British Thermal BTU 0.252 kg cal kilogram-Unit calories
British Thermal BTU/lb 0.555 kg cal/kg kilogram Unit/pound calories
per kilo-gram.
cubic feet cfm 0.028 cu m/min cubic meters per minute per minute
cubic·feet cfs 1.7 cu m/min cubic.meters per second - per minute
cubic feet cu ft 0.028 cu m cubic meters
cubic feet cu ft 28.32 1 liters
cubic inches cu in 16.39 cu cm. cubic centi-meters
degree r'arenheit. OF 0.555(0F-32)* oc degree Centigrade
feet ft 0.3048 m meters
gallon gal 3.785 1 liter
gallon per gpm 0.0631 1/sec liters per minute . second
gallon per ton gal/ton 4.173 1/kkg liters per metric ton
horsepower hp 0.7457 kw kilowatts
inches in 2.54 cm centimeters
pounds per psi 0.06803 atm atmospheres square inch (absolute)
413

APPENDIX D (continued}
Multiply (English Units} By
English Unit Abbreviation Conversion
million gallons MGD per day
3. 7 X l 0-3
pounds per square inch (gauge} psi (0.06805 psi +
pounds lb 0.454
board feet b.f. 0.0023
ton ton 0.907
mile mi 1. 609
square feet ft2 .0929
To Obtain (Metric Units
Abbreviation Metric Unit
cum/day ·cubic meters per day
1 } * atm atmospheres
kg kilograms
cu m, m3 cubic meters
kkg metric ton
km kilometer
m2 square meters --------------------------------------------------------------------------* Actual conversion, not a multiplier.
414

APJ>ENDIX E
LIT:E.RATURE DISCUSSION OF BIOLOGICAL .TREATMENT
ACTIVATED SLUDGE
Cooke and. Graham (1965) performed laboratory scale studies on the biological degradation of phenolic wastes by the completed mixed activated sludge system. While many of the basic parameters needed for design were not presented, the final results were conclusive. The feed liquors contained· phenolic compounds, thiocyanates, ammonia, and organic acids. Aeration varied from 8 to 50 hours. Influent concentration and percentage rembval of total phenols averaged 281 mg/1 and 78 percent, resp~ctively, at. a volumetric loading of 144 to 1,600 kg/100 cubic meters/day (9 to l 00 lb/1, 000 cubic feet/day).
Badger and Jackman (196f), studying bacteriological oxidation of total phenols in aerated reaction vessels on a continuous flow. basis with a loading of approximately 1,600 to 2,400 kg/1,000 cubic meters/day (100 to 150 lb of total phenols/1,000 cubic feet/day) and· MLSS of 2,000 mg/1, found that with wastes
· containing up to. 5,000 mg/1 total phenols, a two-day retention period could' produce removal efficiencies in excess of 90 percent. Because the investigators were working.with a coke gasification plant waste, the liquor contained. thiocyanates. Higher oxidation efficiencj_es could beachieved with a reduction of .the thiocyanate in the waste. Gas, chromatography indicated no phenolic end products of degradation with original waste being a mixture of 36 percent rnonohydric and 64 percent polyhydric phenols.
Pruessner and Mancini (1967). obtained a 99 percent oxidation efficiency for BOD in petrochemical wastes. Similarly, Coe (1952) reported reductions of both BOD and total phenols of 95 percent from pe~roleum wastes in bench-scale tests of the activated sludge process. Optimum BOD loads of 2,247 kilograms/1,000·cubic meters per day (140 lb/1,000 cubic feet per day) were obtained. Coke. plant effluents were successfully treated by Ludberg and Nicks (1969), although some difficulty in. start-up of the activated sludge system was experienced because of the high total phenols content of. the water.
The completei mixed, acfivated sludge· process was employed to process a high phenolic wastewater from a coal-tar distilling .
. plant in Ontario· (American Wood Preservers' Association, 1960). Initial total· phenols and COD concentrations of 500 and 6,000 mg/liter, respectively, were reduced in ~xcess of 99 percent for total phenols and 90 percent for COD. ·
Coal gas washing liquor was successfully treated bi Nakashio (1969) using activated sludge at a_loading rate of 0.116 kg of total phene>ls/kg ·· MLSS/day. An influent total phenols
415

concentration of 1,200 mg/1 was reduced by more than 99 percent in this year-long study. Similar total phenols removal rates were obtained by Reid and Janson (1955) in treating wastewaters generated by the washing and decarbonization of aircraft engine parts. Other examples of biological treatment of phenolic wastes include work by Putilena (1952, 1955), Meissner (1955), and Shukov, et al. (1957, 1959).
Of particular interest is a specific test on the biological treatment of coke plant wastes containing phenolic compounds and various organics. In a report of pilot and full scale studies performed by Kostenbader and Flacksteiner (1969), the complete mixed activated sludge process achieved greater than 99.8 percent oxidation efficiency of total phenols. S~ccessful results were achieved with total phenols loadings of 0.86 kg total phenols/kg MLSS/day with an equivalent BOD loading of'.2 kg BOD/kg MLSS/day.· In comparison, a typical activated sludge loading is 0.4 kg BOD/kg MLSS/day. Effluent concentrations of total phenols from the pilot plant were 0.2 mg/1 in contrast to influent concentrations of 3,500 mg/1. Slight variations in process efficiency were encountered with varying temperatures a.nd loading rates. Phosphoric acid was addea to achieve a phosphorus-tototal phenols ratio of 1:70. At the termination of pilot plant work, a similar large scale treatment plant processing of 424 cubic meters/day {112,000 gpd) was installed and resulted in an effluent containing less than 0.1 mg/1 of total phenols.
Dust and Thompson {1972) conducted bench-scale tests of complete mixed activated sludge treatment of creosote and pentachlorophenol wastewaters using 5-liter units and detention times of 5, 10, 15, and 20 days. The operational data collected at steady-state conditions of substrate rem6val for the creosote waste are shown in Table E-1. A plot of these data showed that the treatability factor, K, was 0.30 days-1. {Figure E-1). The resulting design equation,· with t expressed in days, is: Le= Lo/ ( 1 + o • 3 Ot} 1
A plpt of percent COD removal versus detention time in the aerator based on the above equation, shown in Figure E-2, indicates that an·oxidation efficiency of about 90.percent can be expected with a detention ~ime of 20 days in units of this type.
Dust and Thompson (1972} also attempted to determine the degree of biodegradability of pentachlorophenol · waste. Cultures of bacteria prepared from soil removed from a drainage ditch containing pentachlorophenol- waste were used to inoculate the treatment units. Feed to the units contained 10 mg/liter of pentachlorophenol and 2,400 mg/liter COD. For the two 5-liter units {A and B} the feed was 500 and 1,000 ml/day and detention times were, in order, 10 and 5 days. Removal rates for pentachlorophenol and COD are given in Table E-2. For the first 20 days, Unit A removed only 35 percent of 'the pentachlorophenol added to the unit. However, removal increased dramatically afterward and averaged 94 percent during the. remaining 10 days of
416

the study. Unit B consistently removed over 90 percent of the pentachlorophenol added. Beginning on the 46th day and continuing through the 51st day, pentachlorophenol loading was increased at two-day intervals to a maximum of about 59 mg/liter. Removal rates for the 3 two-day periods of increased loadings were 94, 97, and 99 percent. COD removal for the two units averaged about 90 percent over the duration of the study.
Also working.wiEh .the a~tivated slud~e process, Kirsh and Etzel (1972) obtained removal rates for pentachlorophenol in excess of 97 percent using an 8-hour detention time and ~ feed conc.entration . of 150 mg/1 i ter. The pentachlorophenol was supplied to the system in a mixture that included 100 mg/liter phenol. Ess:emtially complete decomposition of thephenol was obtained, along with a 92 p~rcent reduction in COD.
Coopet and Catchpole (1969) reported greater than 95 percent oxidation, of total phenols using activated sludge units treating coke. plant effluents containing phenolic compounds, thiocyanates, and sulfides. Adequate data :were not available on the detailed operating par~meters of the activated sludge plant.
TRICKLING FILTERS
Hsu, Yany, and Weng (1967) reported successful .treatment of coke plant phenolic wastes with a trickling filter, removing over 80 percent of total phenols~ It was stated that influent total phenols concE:mtrations should not exceed 1 00 mg/1 i ter.
,., ...... ,,.,.,
Using a Surfp,:ic trickling filter, Francingues (1970) was able to remove 80 to 90 percent of the influent total phenols from a wood preserving creosote wastewater at. a loading rate of about 16 kg/1,000 cubic meters/day (1 pound total phenols/1,000 cubic feet/day).
Sweets, Hamdy, ·· and· Weiser· ( 1954) studied the bacteria .responsible for total phenols reductions in industrial waste and reported good total pfnenols removal from synthesized waste containing concentrations of 400 mg/1. Reducti6ns of 23 to 28 percent were achieved in a single pass of the wastev .. ater through a pilot trickling filter having a. filter bed only 30 centimeters (12 inches) deep.
Waters containing total phenols concentrations of up to 7,500 mg/1 were successfuJly treated in laboratory tests conducted by Reid and Libby (1957). Total phenols removals of ao, to 90 percent were obtained for concentrations on the order of 400 mg/1. Their work confirmed that of Ross and Shepard (1955) who found that. strains· of bacteria isolated from a trickling filter could survive total phenols concentrations of 1,600 mg/liter and were able to _oxidize total phenols in concentrations of 450 mg/liter at better than 99 per~ent efficiency. Reid, Wortman, and Walker (1956) found that many pure cultures of bacteria were able to 1 i ve_ in i:~~al phe.nol~ concentrations of up to 200 mg/1,
'4ii

and although the bacteria survived concentrations above 900 mg/1, some were grown in concentrations as high:as 3,700 mg/1.
Barlow, Shannon, and Sercu {1961) described the operation of a commercial size trickling filter containing "Dowpac" filter medium that was used to process wastewater containing 25 mg/1 total phenols and 450 to 100 mg/1 BOD. R~ductions of 96 percent for total phenols and 97 percent for BOD were obtained in this unit. Their results compare favorably with those reported by Montes, Allen, and Schowell {1956) who obtained BOD reductions of 90 percent in a trickling filter using i 1·:2 recycle ratio, and Dickerson and Laffey {1958), who obtained total phenols and BOD reductions of 99. 9 and 96. 5 per.cent, respectively, in a trickling filter used to process refinery wastewater.
A combination biological waste treatment system employing a trickling filter and an oxidation pond was reported by Davies, Biehl, and Smith {1967). The filter, which was packed with a plastic medium, was used for a roughing treatment of 10.6 million liters (2.8 million gallons) of waste~ater per day, with final treatment occurring in the oxidation pond. Removal rates of 95 percent· for total phenols and 60 percent for BOD were obtained in the filter, notwithstanding the fact that the pH of the influent averaged 9.5. ·
A study of biological treatment of refinery wastewaters by Austin, Meehan, and Stockham {1954) employed a series of four trickling filters, with each filter operating at a different recycle ratio. The waste contained 22 to 125 mg/1 of oil which adversely affected BOD removal. However, total phenols removal was unaffected by oil concentrations within the range studies.
Prather and Gaudy (1964) found that significant reductions of COD, BOD, and total phenols concentrations in refinery wastewater were achieved by simple aeration treatments. They concluded that this phenomenon accounted for the high allowable loading rates for biological treatments such as trickling filtration.
The practicality of using trickling f~lters for secondary treatment of wastewaters from the wood preserving industry was explored by Thompson and Dust (1972). Creosote wastewater was applied at BOD loading rates of from 400 to 3,050 kg/1,000 cu m/day {25 to 190 lb/1,000 cu ft/day) to a pilot unit containing a 6.4 meter- {21 foot-) filter bed of ,plastic media. The corresponding total phenols loadings were 1.6 to 54.6 kg/ 1,000 cum/day {O.l to 3,4 lb/1,000 cu ft/day). Raw feed-to-recycle ratios varied from 1:7 to 1:28, Daily samples were analyzed over a period of seven months that included both winter and summer operating conditions. Because of wastewater characteristics at the particular plant cooperating in t~e study, the following pretreatment steps were necessary: {l)·equalization of wastes; (2) primary treatment by coagulation for partial solids removal; (3) dilution of the wastewater to obtain BOD loading rates commensurate with the raw flow levels provided by the equipment;
418

and (4) addition to the raw feed of supplementary nitrogen and phosphorus. Dilution ratios of Oto 14 were used.
The efficiency of the system was essentially stable for BOD loadings of less than 1,200 kg/1,000 cu m/day (75 lb/1,000 cu ft/day). '!'he best removal rate was achieved when the hydraulic application rate was 2.85 1/min/m (0.07 gpm/sq ft) of raw waste and 40. 7 1/min/m ( 1. O .. gpm/sq ft) of recycled waste. The COD, BOD, and total phenols removals obtained under these conditions are given in Table E-3. Table E-4 shows the relationship between BOD loadin9 rate and removal efficiency. BOD removal efj:iciency at loading rates of 1,060 kg/1,000 cu m/day (66 lb/ 1,000 cu ft/day) was on the order of 92 percent, and was not improved at reduced loadings. Comparable values for total phenols at loading rates. of 19. ~I kg/1, 000 cu m/day ( 1. 2. pounds/1, 000 cu ft/day.) were about 97 .percent~
Since total phenols concentr~tions were more readily reduced· to levels compatible with existing standards than were BOD concentrati()l1S, the sizing of commercial units was based :on BOD removal rat.E~s. Various combinations of filter-bed depths, tower diameters, and volumes of filter media that were calculated to provide a BOD removal rate of 90 percent for an influent having a BOD of 1,500 mg/1 are shown in Table E-5 for a plant with a flow rate of 75,700 1/day, (20,000 gpd}. ·
STABILIZATION PONDS
The America111 Petroleum Institute' s "Manual. on Disposal . of Refinery Wastes"· (1960) refers to several industries that have successfully used oxidation ponds to treat phenolic wastes. Montes (1956) reported on results of field studies involving the treatment of petrochemical wastes' using oxidation ponds. He obtained BOD reductions of 90 to 95 percent in ponds loaded at the rate of 84 kg of BOD per hectare per day (75 lb/acre/day}.
Total phenols concentrations of 990 mg/1 in coke oven effluents were reduced by about 7 mg/1 in field studies of oxidation ponds conducted by Biczyski and Suschka (1967). Similar results have been reported by Skogen (1967) for a refinery waste.
The literature contains operating data on only one pond used for treating wastewater from wood preserving operations (Crane, 1971; Gaudy, et ~l., 1965; Gaudy,. 1971). The oxidation pond is used as part of a waste treatment system by a wood preserving plant. As originally designed and operated in the early 1960's, the waste treatment system consisted of holding tanks into which water from oil-recovery system flowed. From the holding tan)cs the water was sprayed into a terraced hillside from which it flowed into a mixing chamber adjacent to the pond. Here it was.diluted 1:1 with creek water, fertilized with ammonia and phosphates, and discharged into the pond proper. Retention time in the pond was 45 days. 'I'he quality of the effluent was quite variable, with total phenols content ranging up to 40 mg/1. In 1966, the system
419

was modified by installing a raceway contqining a surface aerator and a settling basin in a portion of the pond. The discharge from the mixing chamber now enters a raceway where it is treated with a flocculating agent. The resulting floe collects in the settling basin. Detention time is 48 hours in the raceway and 18 hours in the settling basin from which the wastewater enters the pond proper.
These modifications in effect changed the treating system from an oxidation pond to a combination aerated lagoon and polishing pond, and the effect on the quality of the effluent was dramatic. Figure E-3 shows the total phenols content at the outfall of the pond before and after installation of the aerator. As shown by these data, total phenols content decreased abruptly from an average of about 40 mg/1 to 5 mg/1.
Even with the modifications described, the efficiency of the system remains seasonaJly dependent. T~ble E-6 gives total phenols and BOD values for the pond effluent by month for 1968 and 1970. The smaller fluctuations in the$e parameters in 1970 as compared with 1968 indicate a gradual improvement in the system. ...
Amberg (cir. 1964) reported on an aerated iagoon with an oxygen supply of 2,620 kg/day which (5,770 lb/day) was used to treat whitewater with a design BOD load of 2,780 kg/day (6,120 lb/day). The lagoon was uniformly mixed and had an average dissolved oxygen concentration of 2.9 mg/1.
Suspended solids increased across the lagoon as a result of biological floe formation, but could be readily removed by subsequent sedimentation. The final effluent averaged 87 mg/1 suspended solids during the three days of the study.
The overall plant efficiency for BOD removal was 94 percent, producing a final effluent with an average BOD concentration of 60 mg/1.
Quirk (1969) reported on a pilot plant study of aerated stabilization of boxboard wastewater. Detention times ranged from 0.5 to 0.6 day. The study indicated that full-scale performance, with nutrient addition, could achieve a 90 percent reduction of BOD with a detention time of 4 days.
420

Table E-1. Substrate Removal at Steady-State Conditions in Activated Sludge Units Containing"Creosote Wastewater
Aeration Time, Days
COD Raw, mg/1
COD Effluent, mg/1
% COD Removal
COD Raw/COD Effluent
5.0
447
178
60. l
2.5
10.0
447
103
76.9
4.3
14.7
442
79
82.2
5.6
20. l
444
67
84.8
6.6 ----------------------------------------------------- - --------------SOURCE: Thompson and Dust, 197"2.,
421

7
6
5
4
~ -(I) -(0 C - 1
== Cl)
Slope= K = 0.30 day :,
~ e 3 w
a: C -.5 Q Q 0 0 0
~ Le= La
.91.3 2
1 + 0.30t
1
0 ,... _____ ....,·------,------1----------; ..... 0 5 10 15 20
Aeration Time (Days)
Determination of Reaction Rate Constant for, a Creosote Wastewater
422 Figure E·1

·_.::. N w
::!! a C: ; m
I N
0 0 .... ,c ~
e•
ilo 0 ...I ...I .....__
'ii g E ,. C 0 CJ -C:
I I.
90 "'i
80
· 70
&oi / Lo Le=
lt0.30t
50
·40 ,----·- ---. 0 5 10 15 20
Aeration Time (days)
COD Removal from a Creosote Wastewater by Aerated Lagoon without Sludge Return

Table E-2. Reduction in Pentachlorophenol, and COD in Wastewater Treated in Activated Sludge Units
----------------------------------------------------------------'
Days Raw Waste
{mg/1)
Effluent from Unit (% Removal)
-----------------------·-------------------------------·--------------' ,
"A" "B"
1-5 6-10 11-15 Removal 16-20 21-25 26-30 31-35
1-5 6- 10 11-15 16-20 21-25 26-30 31-35 36-40 41-45 46-47 48-49 50-51
2350 2181 2735 2361 2288 2490 2407
PENTACHLOROPHENOL
7.9 10.2 7.4 6.6 7.0
12.5 5.8
10.3 10.0 20.0 30.0 40.0
78 79 76 82 90
83
20 55 33 30
94 94
78 79 75 68 86 84 80
77 95 94 79 87 94 91 91 96 95 97 99 ----------------------------------------.--~----------·--------------
SOURCE: Thompson and Dust, 1972.
424

Table E-3. BOD, COD, and Total Phenols Loading and Removal Rates for Pilot Trickling Filter Processing ·A.Creosote. Wastewater* - . ~ ;
' . --------------------------------------------------------------------------Characteristics
Measurement BOD COD Total Phenols
Raw Flow Rate l/mh1/sq m 2~85 2.85 2.85 (gpm/1;q ft) (0~07) · (0.07) (0;07)
Recycle Flow Raw 1/min/sq m 40.7 40.7 40.7 (gpm/1;q ft) ( 1.0) ( 1 • 0) (LO)·
Influent Concen.tration (mg/1) 1968 3105 31
Loading Rate gm/c1L1·m/day 1075 1967 19.5 (66.3) (121.3) ( 1 • 2)
Effluent Concentration (mg/1) ·137 709 1.0
Removal ( % ) 9L9 77.0 99+ -----------------·-----------.---------------~----------~----~-------------* Based on work at the Mississippi Forest Products Laboratory as reported by Davies ( 197_1).
425

Table E-4. Relationship Between BOD Loading and Treatability for Pilot Trickling Filter Processing A Creosote Wastewater . ' .
i -------------------------------------------------------------------BOD Loading kg/cum
BOD Loading (lb/cu ft/day)
Removal (%)
Treatability* Factor
----------------------------------------------------------~--------373 (23) 91 0.0301
421 (26) 95 0.0383
599 (37) 92 0.0458
859 (53) 93 0.0347
1069 · ( 66) 92 0.0312
1231 (76) 82 0.0339
1377 (85) 80 0.0286
1863 ( 115} 75 0.0182
2527 ( 156} 62 0.0130 -------------------------------------------~-----------------------* Based on the equation:
' .
Le= eKD/Q0.5 (EPA, 1976) Lo
' .
in which Le= BOD concentration of settled effluent, Lp = BOD of feed, Q2 • hydraulic application rate of raw waste in gpm/sq ft, D = depth of media in feet, and K = treatability factor (rate coefficient).
426
"' '0 ,t' I
t·· ·l •
. ~.· .• ··:

Table E-5. Sizing of Trickling Filter for a Wood Preserving Plant
NOTE: Data are based on a flow rate of 75,700 liters per day (20,000 gallons per day) with filter influent BOD of 1,500 and effluent BOD of 150 mg/1.
------------------------------------------------ -- ----- --------------Depth of Filter
Bed m (ft)
Raw Flow · 1/min/sq m (gpm/sq ft)
Filter Sur:f:ace
Recycle Flow 1/min/sq m
(gpm/sq ft} Filter Surface
}
Filter Surface- Tower Volume Area dia of Media. sq m sq rn cum
(sq ft) (s~ ft) (cu ft) ------------------------------ ----~ ----- ~ -- --------------------- -
3.26 (10.7)
3.81 (12.5)
4.36 (14.3)
4.91 (16.1)
5.46 (17.9)
5.97 (19.6)
6.52 (21.4)
0.774 (0.019)
1.059 (0.206)
l • ~185 (0 .. 034)
l .. 793 ( 0 .. 044)
2.:rno (0.054)
2. '4548 (0.065)
3. '178 (0 .. 078)
29~7 (0.73)
29.3 ( 0. ;7 2,)
28.9 (0.71)
28.5 (0.70)
28.l (0.69)
27.7 (0.68)
27.3 (0.67)
427
65.8 (708)
48.3 (520)
37.0 ( 3 QB) ;
29.3 ( 31 5 )_
23.7 (255)
19.5 (210)
16.4 ( 177)
9.14 213 (30.0) (7617)
7.83 183 (25.7) (6529)
6.86 160 (~2.5) _ (5724)
6.10 142 (20.0) (5079)
5.49 128 (18.0) (4572)
4.97 116 (16.3) (4156)
4.57 107 (15.0) (3810)

45
40
35
30
=--r 25 ...... ~
.,:,. ~ N (X) 0 u
20
!I 0 15 z w :c D. .... C
i:> I-
10
5 "II ii C ii m I 0 w
JAN FEB MAR APR MAY JUNE JULY AUG SEPT OCT NOV DEC
MONTH
TOTAL PHENOLS CONTENT IN OXIDATION POND EFFLUENT BEFORE AND AFTER INSTALLATION IN JUNE 19,66 OF AERATOR

- .. ~.
Table E-6. Avera9E~ Monthly Total Phenols and BOD Concentrations in Effluent from Oxj.dation Pond
------------------·------, --------------------- , -----------------. -----------
Month
' .
1968 Total Phenols BOD
1970 Total Phenols BOD
---------------------------------- .-------------------------------------January. 26
February 27
March 25
April 11
May 6
June 5
July 7
August 7
September 7
October 16
November 7
December 11
290
235
190
150
100
70
90
70
110
150
155
205
7
9
6
3
1
1
1
l
' l
95
140
155
95
80
60
35
45
25
----------------------~~~~~-----~------------------------------------------SOURCE: Crane, 1971; Gaudy, et al., 1965; Gaudy, 1971.
429
'' ''
'


APPENDIX F.
DISCUSSION OF POTENTIALLY APPLICABLE TECHNOLOGIES
WOOD PRESERVING
Tertiary Metal.§. Removal
The most difficult ion to reduce to acceptable concentrations· levels is arsenic. Treatment of water containing •- arsenic with lime generally removes only about 85 percent of the metal. Removal rates in the range of 94 to 98 percent have been reported for filtration through ferric hydroxide. However, none of these methods is entirely satisfactory, particularly for aisenic concentrations above 20 mg/liter.
A detailed treatise on treatment technology for wastewater containing heavy metals was recently published in book form (Patterson, 1975). Methods of treatment for arsenic presented by the author are, shown in Table F-1-~
Chemical prec:ipitation and filtration em'J;>loyingferric compounds and sulfides were at.least as effective as lime precipitationi which, as indicated above, has been employed to a limited extent by the woocl preserving industry. However, with one or two possible exceptions, none of the methods is as effective as. the combination physical-chemical method de~cribed in the EPA report discussed above (Technology Transfer, January 1977), particularly when initial · concentration is taken into . account.· Chemical oxidation of arsenate to arsenite prior to coagulation treatment was reported to improve arsenic removal. Incomplete removal of the metal by.coagulation treatments was believed by the author to be caused by the formation of a stable. complex with the. precipi tatin9 -metal. More complete.-- removal of -- arseni te was assumed to indicate that ariertate forms the more stable complexes.
Among other· m.ethods of chemical precipitation, - use of thioacetamid4:! and dibromo-oxine is mentioned in the 1 i terature ( Cadman, 1974). _ "Complete" recovery ·of chromium and zinc is claimed for the· first-named chemical, and "1 DO-percent,"- recovery of copper, z:inc, and chromium is repe>rted for:dibromo-oxine.
Considering b:>st, nO more efficient chemical method. of- removing hexavalent chromium and copper from solutfon than the standard method (reduction of chromium to trivalent form fpllowed by lime precipitation of both· metals) is revealed by the literature. However, to 1neet increasingly stringent effluent standards, some -industries have turned to an ion exchange technique. ·
Cadman (1974} from wastewat~r removed
has reported excellent resµlts in removing metals using ion exchange. The resin, Chelex-100,
431

"essentially" 1. 00 percent of the zinc,· copper, and chromium in his tests. Chitosan, Amberlite, and Permutit-S1005 were also reported to be highly effective. The Permutit resin removed 100 percent of the copper and zinc but· only 10 percent of the chromium.
Membrane Systems
This term refers to both ultrafiltration and reverse osmosis (RO). The main difference between these two membrane systems involves the difference in pore size· of the membrane. The ultrafiltration membrane, with the larger pore openings, separates substances from wastewater mainly because the physical size and shape of the molecules of the substances do not allow them_ to pass through the membrane. Ultrafiltration is employed primarily to remove suspended solids and emulsified materials · in wastewater, although some dissolved substances of large molecular size will also be removed. The RO membrane, with smaller pore openings, relies on both physical separation, as utilized in ultrafiltration, and a particle charge repulsion mechanism. RO removes all or part of the dissolved substances, depending upon the molecular species involved, and 'virtually all of the suspended substances. Both technologies are currently used as· part of the wastewater treatment system of many diverse industries (Lin and Lawson, 1973; Goldsmith, et al., 1973; Stadnisky, 1974) and have potential application in the Wood Preserving Industry for oil removal.
Ultrafiltration treatment of oily waste basically involves passing the waste under a pressure of 2.1 to 3.6 atm (30 to 50 psi) over a membrane cast onto the inside of a porous fiberglass tube. The water phase of the waste is forced through the membrane and discarded, reused, or further processed by other means. The oil and other solids not in solution remain in the tube. The process in effect concentrates the waste. Volume reductions on the order of 90 to 96 percent have been reported (Goldsmith, et al., 1973; Stadnisky, 1974) ..
Results obtained in pilot- and full-:scale operations of ultrafiltration systems have been mixed. Goldsmith, et fil_., (1973), operated a pilot unit continuously (24 hours per day) for six weeks processing waste emulsions containing l to 3 percent oil. The permeate from the system, which was 95 percent of the original volume, contained 212 mg/liter ether extractables-primarily water-soluble surfactants. ~ 15,140-1/day (4,000 gpd) system installed, based on the pilot plant data, produced a permeate containing 25 mg/liter ether. extractables. No significant reduction in flux rate with ttme was <>bserved in either the pilot- or full-scale operation.·
'- '-....... t
Ultrafiltration t~sts of a pentachlorophenol wastewater were conducted by Abcor, Inc., in cooperation· with the Mississippi Forest Products Laboratory (1974). The ~amples contained 2,160
432

mg/liter oil and had a total solids ·conceniration of 3,900 mg/1 i ter. Flow rate. through the system was 95 1/min ( 25 gpm) - at a pressure of 3.3 .atm (4S psi). A 26-fold volum~tric concentration, representing a volume reduction of 96.2 percent, was achieved .. Two membrane types were tested. Both showed a flux decline on the order of 55 to 60 percent ~ith increasing volumetric concentration. A detergent flush of the system was found to be necessary at the end of each run to restore the normal flux values 0£: 35 1/sq. m/day ( 35 gal/sq ft/day). Oil, content of the permeate was 55 mg/liter. While.this.value represents a_reduction of over 97 percent, it does not meet the requirements for stream discharge.· COD was reduced 73.per.cent.
The principal of reverse osmosis. (RO) is similar to that. of ultrafiltration. However, higher hydraulic· pressures, 27w2 to 40.8 atm (400 to fiOO psi), are employed and the membranes are semipermeat:>lE~ and . are manufactured to achieve . rejection of various molE~cular sizes. Efficfency . varies, but· rejection of various salts in excess of 99 percent has been reported, (Merten and Bray, 1966). For organic chemicals, rejection appears to'be a function of mol~cular $ize _a11d shape. Increases in chain length and branching·ar~ reported to increase rejection (Durvel. and Helfgott, 1975). Total phenols a~e removed to the.extent of only about 20 percent by cellulose acetate.membranes, while polyethylenirnine membranes increase this percentage to 70 but achieve a lower flux rate (Fang and Chian, 1975). In case studies that:have been cited, RO was found to be competitive-with conventional waste treatment .. jy~teis. -only ~hen extr~mely· high levels of treatment were required (Kremen; 1975).
Removals of ·a3 percent TOC and .96 percent. TDS were reported .. for RO in which ci~llulose acetate membranes at 4.0. 8 atm · ( 600 psi) were used (Boen and Jahannsen, 1974). Flux rates in this work of 129 to 136 1/sq m/day ( 34, to 36 gal/sq ft/day) were achiev1:d. However, in other work, pretreatment by carbon adsorption.or sand filtration was found to be necessar~ to prevent membrane fouli~g (Rozelle, 1973). Work by ·the Institute· of Paper Chemist~y (Morris, et, al., 1972) indicates that membranE! · fouling 'by suspended sc:>lids or large . mole.cular weight o.rgc;tnics can be ·controlled in part by appropr;iate pretreatment, periodic pr:essure. pulsations, and washing .of the memb~aqe surfaces. in, this and other work (Wiley, et al., 1972), it was concluded that RO ·is effective in concentratingdilute papermill waste and produces a clarified wate~\~hat can be recjcl~d for pr6cess purpos~s.
. .
Recycling of process wastewater, following ultrafiltration ang RO treatment, was being attempted PY Pacific Wood Treattng Corpora ... tion, Ridgefield, Washington. The concentrated waste is incinerated and. the permeate from thesystem,is used for boiler feed water. 'rh~ system, which cost approximately. $200,000 began operation in' 1977. An · evaluation .of .t.he. effectj_ veness of the system will be made under an EPA grant.
433

Data on the use of RO with wood preserving wastewater were provided by the cooperative work between Abcor, Inc., and the Mississippi Forest Products Laboratory referred t;o above (1974). In this work, the permeate from the ultrafiltration (UF) system was processed further in an RO unit. Severe pressure drop across the system indicated that fouling of the membranes occurred. However, module rejection remained consistent throughout the run. Permeate from the system had an oil content of 17 mg/liter, down from 55 mg/liter, and the COD was reduced by 73 percent. Total oil removal and COD reductions in the UF and RO systems were 99 percent and 92 percent, respectively.
Adsorption Q!! Synthetic Adsorbents
Polymeric adsorbents have been recommer:ided for use under conditions similar to those where carbon ~dsorption is indicated (Stevens and Kerner, 1975). Advantages cited for these materials include effi~ient removal of both polar and nonpolar molecules from wastewater, ability to tailor-make an adsorbent for a particular contaminant, small energy inputs for regeneration compared to carbon, and lower cost compared to carbon where carbon depletion rates are greater than 2.3 kg per 3,785 liters (5 pounds per 1,000 gallons). Data on efficiency of polymeric adsorbents were not presented.
Clay minerals, such as attapulgite clay, have for use in removing certain organics 'and wastewater (Morton and Sawyer, 1976).
Oxidation QY. Chlorine
been recommended heavy metals from
The use of chlorine and hrpochlorite~ as a treatment to oxidize phenol-based chemicals 1~ wastewater is widely covered in the literature. A review of this literature, with emphasis on the employment of chlorine in treating wood preserving wastewaters, was presented in a recent EPA document (1973).
The continued use of chlorine as an oxidizing agent for phenols is in question for at least ·two reasons. ~here is, first of all, a concern over recent supply problems and the increasing cost of the chemicil (Rosfjord, et al., 1976)·. Secondly, chlorine treatments of phenolic- wastes ~or~ mono-, di-, and trichlorophenols which persist unless sufficient dosages are used to rupture the benzene ring (EPA, 1973). It is probably true that low-level chlorine treatments of these waters are worse than no treatment at all because of the formation of such compounds.
!
For these and possibly other reasons, attention on other oxidizing agents equally as capable oxidizing phenolic compounds without creating problems.
434
has been focused as chlorine of these additional

Oxidation !2Y, j?otassium Permanganate
This is a str4:mg oxidizing agent that is being marketed as a. replacement :fior · phenol. One vendor ( Carus Chemical Company, 1971) claims that the chemical "cleaves the aromatic carbon ring of the· phemol and destroys it" and then degrades the aliphatic chain thus created to innocuous compounds. Stoicheometrically, 7.13 kg of KMn0 4 are required to oxidize one kilogram·of phenol. According to lRosf jord, et al. ( 1976), however, ring cleavage occurs at ratios of about 7 to 1. A higher ratio is required to reduce the residual organics to CO 2 and H2 0.
As in the case of chlorine (EPA, 1973), the presence of oxidizable ,materials other than phenol in wastewater greatly increases the amount of KMn0 4 required.to oxidize a given amount of phenol. In the trade literature cited above, it was stated that $10 worth of KMn04 .was required to treat 3,785 liters (1,000 gallons) of foundry waste containing 60 to 100 mg/liter of total phenols. Eighty milligrams per liter of total phenols in 3,785 liters (1,000 gallons) is equivalent to 0.3 kg (0.67 pounds). At a 7:1 ratio, the treatment should have cost $2.35.
The actual ratio was 30: l and the ·cost was about $15 per O. 454 kilograms (one pound) of totaJ phenols removed. The latter fi~ure agrees with one vendorls dita, which indicated a cost of $0.15 per mg/liter of· total phenols per 3,785 liters (1,000 gallons) of wastewater.
Limited studies conducted by the Mississippi Forest Products Laboratory revealed no cost advantage of KMn04 over chlorine in treating wood preserving wastewater. The high content of oxidizable materials other than phenol in this typeof waste consumes so much of the chemical that massive doses are required to eliminate phenolic compounds.
Oxidation !2Y_ Hydrogen Peroxide
This is ·a powerful oxidiz.ing agent, the efficacy of which is apparently enhanced by the presence of ferrous sulfate which acts as a catalyst. Reductions in total phenols content of 99.9 percent ( in. ..wastew~ter containing 500 mg/1 i ter) have been reported for 8 2 0 2 when applied in a 2:1 ratio (Anonymous, 1975). A reaction time of 5 minutes was required. Ferrous sulfate concentrations of O.l to 0.3 percent were used. COD concentration was reduced to 760 mg/liter from 1,105 mg/liter.
According to Eisenhauer (1964), the reaction involves the intermediate formation of catechol and ~ydroquinone, which are oxidized by the ferric ion to quinones. -As is the case with other oxidizing agents, the degree of substitution on the phenol molecule affects the rate of reaction. · Subs ti tuenti? in fhe or tho and para positions reduced. the reaction rate the most, and complete substitution (e.g., pentachlorophenol) prevented the
435

reaction from taking place. Solution pH 1had a significant effect on the efficiency of the treatment. Optimum pH was in the range of 3.0 to 4.0, with efficiency decreasing rapidly at both higher and lower values.
Treatments of industrial wastes were reported by Eisenhauer to require higher levels of 8 2 0 2 than simple phenol solutions because of the presence of other oxidizable materials. In fact, the required ratio of H2 0 2 to total phenqls varied directly with COD above the level contributed by the total phenols itself. At all ratios studied with industrial wastes, total phenols levels dropped rapidly during the early part of the reaction period, then remained unchanged thereafter. For 'some types of wastes, the addition of high concentrations of ~ 2 0 2 , up to molar ratios of 16: l, did not cause significant furth:er decreases in total phenols content. Similar results have been reported for wood preserving wastewater treated with c,hlorine ( EPA, 197 3) . Prechlorination of wastes with high COD contents reduced the amount of 8 2 0 2 required in some cases, bu1;t not in others.
Hydrogen peroxide (H 2 0 2 ) has not been use~ on a commercial scale to treat wastewater from the wood prese1rving industry or, based on the available literature, wastewaters trom related industries. The cost of the chemical is such that a re)atively high phenol removal efficiency must ensue to justify its use. The available evidence suggests that, in common with other oxidizing compounds, organics other than phenol consume so much of the reagent as to render the treatment impractical. Its use in a tertiary treating capacity may be practical, depending upon the residual COD of the treated effluent.· '
Oxidation EY Ozone I
Ozone has been studied extensively as a possible treatment for industrial wastewaters (Evans, 1972; Eisephauer, 1970; Niegowaki, 1956). No practical success has attended these efforts. The literature reveals only one example in the U.S. of the application of ozone to treat an industrial waste. Boeing Corporation is reported to have operated a 6.8 kg/hour ozonator to treat cyanide and phenolic wastes (McLain, 1973). Worldwide, the situatiop is ~imilar. The literature mentions a plant in France and one in Canada, both of which use ozone to treat cyanide and phenolic wastes from biologically treated effluents. Conversely, there have been numerous pilot plant studies of the application of ozone for industrial wastes, and ozone is widely used in Europe, especially France, to treat domestic water supplies. Pilot studies to assess the feasibility of using ozone to treat domestic wastes have been sp<;>nsored by EPA (Wynn, et al., 1973). · -
The problem is one of economics. Eisenhauer (1970) concluded from his work that the ozonization of phenol to CO2 and H2 cannot be achieved economically. By contrast, Niegowski (1953) reported
436

that in pilot plant .tests of ozone, chlorine, and chlorine dioxide, ozi::me was demonstrated to be the most . economical treatment for total phenols. - ·
No example 1of the use of ozone to treat timber products wastewater appears in the literature. However, one wood preserving plant· installed a small -0zone gener~tor and directed the gas int'o a large lagoon .. The tre.atment had . no measurable effect on wastewater quality.
INSULATION BOARD AND HARDBOARD ·
Chemically-Assisted Coagulation
Chemically-assisted clarificition, as defined in this document, is the use of coagulants or coagulant aids to increase the settleability of biological suspended solids in the clarifier of the biological treatment system. This technology is particularly applicable to the fiberboard.industry, as this- industry relies heavily on biological treatment fo~ end-of-pipe pollution control.
The mechanisms by which a coagulant aids the precipitation of colloidal matter, such as biological suspended solids, are discussed at length in an AWWA Committee Report (1971), "State of the Art of Coagulation." The chemicals generally used. to increase removals of fine •nd colloidal particles in conjunction with this technology are the metal salts of aluminum and iron, as well as synthetic organic polymers.
When metal salts are used, hydrolysis products are formed which desta bilize colloidal partic::les bya complex series of chemical and physical interactions. Polyelectrolytes are extended-chain polymers of high molecular weight. Particles are adsorbed at sites along the chains of thes~ polymers- which interlock to form a physical bridge, thereby d~stabilizing the sorbed particles.
Chemically-assisted coagulation may be used as an additional treatment process applied to the effluent of· the secondary clarifier of the biological treatment system. This requires separate mixing, flocculation, and settling facilities, and a considerable capital investment. A recent study performed for the EPA (E.C. Jordan Co., 1977)· on chemically assisted clarificatio,n. (CAC) demonstrated that increased. suspended solids removal may ,be obtained when-applying CAC as an integral part of the biological system. The advantage to this application is that capital and operating costs are kept at a minimum. Mixing takes place using the natur·al turbulence inherent in the latter stages of the bio,logical system, and settling occurs in the biological secondary clarifiei;-.
Insulation bciard Plant 36 and Sl S hardboard Plant 931 reported the use of polyelectrolytes to increase solids removal in the
437

biological secondary clarifiers of their respective treatment systems. Plant 931 adds the polyelectrolyte at the influent weir of the final settling pond; little mixing is achieved by application of the polymer at this point. The annual average daily TSS effluent concentration of this plant for the last four months of 1976 (following completion of upgraded treatment facilities) was about 488 mg/1. This represents an 81 percent reduction in TSS in the total system. ·
Plant 36 adds polyelectrolyte in the a~ration basin of the activated sludge unit, achieving better ml~ing than Plant 931.
' The annual average daily TSS concentration of the final effluent is about 320 mg/1, which represents a 93 percent reduction in TSS. Both plants noted increased TSS removals using the polyelectrolyte, however, no comparable data are available to quantify the amount of TSS reduction due tp polymer addition.
Selection of the proper coagulant, point of addition, and optimum dose for this technology can be approximated in the laboratory using jar test procedures. Since the capital cost is minimum, in-plant studies can be easily conducted to optimize operating characteristics for maximum effectiveness.
Granular Media Filtration
Granular media filtration as a tertiary process for control of biological suspended solids, is receiving growing attention in the pulp and paper, food processing, textile, and oi.l refining industries. It is a physical/electrical/chemical process consisting of: (1) transport of the 'particles from the suspension to the media; and (2) contact with and adhesion to the media or other solids previously absorbed 9n the media.
There are currently no hardboard or insulation board plants using granular filtration; however, several :applications of this technology exist in the puip and paper industry.
The National Council for Air and Stream Improvement conducted a pilot study to investigate the effectiveness of three manufactured granular media filters in removing suspended solids, BOD, and turbidity from papermaking secondary effluents (NCASI, 1973). The three filter systems were studied for TSS and BOD removals when filtering the effluent from an integrated bleached kraft mill and a boxboard mill. The report summarized the study findings by stating that all three units could reduce suspended solids concentrations and turbidity by. 25 to 50 percent when chemicals were not used. Reductions of greater than 90 percent were possible with chemical addition.
A recent study performed for EPA on the Direct Filtration and Chemically Assisted Clarification of Biologically Treated Pulp and Paper Industry Wastewater concluded that, based on actual
438

plant operatin9 .data, direct with chemical addition to percent reduction in filter maximum removals of 80 to 90
filtration achieve, effluent
percent.
systems can be designed on average, at least 50 TSS concentration, with
It should be m>ted that influent suspended solids characteristics are an important factor in determining filter performance. Biological treated effluent from the insulation board and hardboard inclustrj.~s, differs. greatly from that of .the pulp and paper industry. P.ilot plant studies are needed to properly design a wastE~water filter for any specific application. Actual plant operating data will also be· required to effectively estimate actual TSS removals for the insulation board · .and hardboard indm;tries. ·
Activated Cad!!:m Adsorption
Several activated carbon isbtherms were performed on the treated effluents of two hardboard plants to determine the feasibi 1 i ty ,.of carbon adsorption as a tertiary treatment for this,industry. Although the C:.arbon was quit~ effective at reducing the influent COD to one-half: or less of its original concentration, the carbon dosage reguit·E~d for this purpose and the rigorous pretreatment , require~ents were so high as to rule out activated carbon as a technically feasible tertiary treatment.
439

Table F-1. Summary of Arsenic Treatment Methods and Removals Achieved*
---------------------------------------------·-----------------
Treatment
Initial Arsenic
(mg/l) I
Final Arsenic
(mg/1) Percent
Removal ---------------------------------------------+---------------------------Charcoal Filtration
Lime Softening
Precipitation with Lime plus Iron
Precipitation with Alum
Precipitation with Ferric Sulfate
Precipitation with Ferric Sulfate
Precipitation with Ferric Chloride
Precipitation with Ferric Chloride
Precipitation with Ferric Hydroxide
Ferric Sulfide Filter Bed
Precipitation with Sulfide
Precipitation with Sulfide
* Adopted from Patterson, 1975.
440
0.2
0.2
0.35 '
0.31-0.35
25~0
0.58-0,90
362.0
0.8
0.06
0.03
0.05
0.003-0.006
5
0.05
0.0-0.13
15-20
0.05
0.05
26.4
70
85
85-92
98-99
80
98
81-100
94-96
94
80

APPENDIX G
STATISTICAL METHODOLOGY FOR DETERMINING PERFORMANCE VARIABILITY OF TREATMENT SYSTEMS
Effluent limitations guidelines for the hardboard arid insulation board segment were determined by analysis of long term, historical monitoring data for thos.e biologica:l treatment systems selected .. as representative of BPT or BCT for ea~h subcategory. The long term pollutant wasteload averages for these treatment systems were presented in Section VII, Control and Tiea~~erit~Techcologj, of this do~ument. Treatment systems do not ~~rform continuously at their long term average performance level. It is necessary, therefore1 to consider the variability of such systems in relation to long term average performance in order to develop effluent limitations.
This section.presents the results· of a ·statistical vari'ability analysis performed on the effluent data from representative treatment systems in .order to determine their maximum daily and maximum 30-day effluent variabilities.
' . . .
Effluent limitations presented in Sections VIII arid IX of thi$ document were calculated by multiplying a representative pla.nt's long term average wasteloads by its respective daily and,30-day variability factors. The purpose of this appendix is to describe the methodology used to determine appropriate variability factors used to calcul.ate. the effluent limitations guidelines.
METHODOLOGY USED TO DEVELOP VARIABILITY FACTORS.FOR EFFLUENT LlMI'l'ATIONS PROPOSED ON OCTOBER 31,· 1979
Hardboard and insulatio~ b~ard plantsr identified BPT and BCT systems for each subcategory, all monitoring data for calendar years 1976 and 1977. an additional ,four months of data for 1978.
as representative of provided available
One plant provided
The data provided included daily gross· production figures and th~ plant's monitoring results for its treated effluent wastestrea~. The only wastewater parameters reported by the plants with sufficient frequency for variability analysis wer.~ BOD and ,TSS. The va.riability analysis was li•ited to_ t~ea;e~_effluent, streams, as it is· the variability of these str~ams that must be taken into consideration in the development of· numerical efflue.nt limitations. guideline$. ·
Table G-1 presents the number of .observ.ations in each data set used for the variab'ili't-y analysis. Fo"i· Plarit 931,· the variability. 'analysis
:. 441

was performed using a ~ata base of October l, 1976 through December 31, 1977. ruring 1976, the wastewater treatment system was expanded and the new system did not begin normal operation until the beginning of October 1976. Consequent!~, the data repo~ted for the period prior to October 1976 were excluded from the analysis.
The long term data base provided by Plant 980 was for the period. of January 1, 1976 through April 30, 1978; however) a nonstandard method of TSS analysis was used by the plant prior to June 16, 1977. Therefore, the data base used for the TSS variability analysis was for the period of June 16, 1977 through April 30,. 1978, and the data base for the BOD variability analysis was for the longer period of January 1, 1976 through April 30, 1978.
I A statistical analysis was performed on the data base from each plant to determine the.daily and 30-day effluent variability factors associated with the biological treatment systems of the plants. The units used were lbs/day for both BOD and TSS throughout the analysis. The purpose of the analysis was to estimate the 99th percentile of the effluent loadings.
Two basic approaches were considered for estimating the 99th percentile of a set of data. The 99th percentile is defined as that value which exceeds 99 percent of the values in the population from which the data were drawn.
The first approach consists of fitting a specific distributional.model to the data. For example, the normal or mound-shaped distribution may be used, or the log-normal distribution, which hypothesizes that the logarithms of the data follow a normal distribution. Once the model is fit to the data, the 99th percentile can be determined mathematically. For example, if the normal model is used, the 99th percentile is the value 2.33 standard deviations above the mean. This approach is called the parametric approach, because it requires that a specific distribution with fixed parameters be used~
The second approach is nonparametric, since it requires no particular distributional model. Assuming the data are drawn from some unknown distribution at random, it is possible to calculate the probability that the 99th percentile is greater than the largest measurement in the data set, the second largest, the third largest, etc. This calculation uses only the fact that each measurement is assumed to have a .01 probability of exceeding the 99th percentile, and a .99 chance of falling below it; the particular form of tpe distribution is not required in this calculation.
To assist in deciding whether to take the ·parametric or the nonparametric· approach, goodness-of-fit tests were conducted on the daily readings of BOD and TSS for the 1976 and the 1977 data. Two of the more powerful tests of goodness of fit, the Kolmogorov-Smirnov and Anderson-Darling tests, were used to determine whether or not the
442

normal distribu.t.ion, logarithmic·normal distribution, or three parameter logarithmic normal distribution provided an adequate fit to the data.
The results of the tests indicated .a consist~nt lack of fit at the 5 percent l~vel of significance using the Kolmogocov~smirnov and Anderson-Darling testsw Consequently, the use of the normal or lognormal distributicin for estimating the 99th percentile was ruled out and the nonparametric approach was adopted .•
Daily Variability Factors
The daily maximum variability factor is defin~d as the estimate of the 99th percentile of the distribution of daily·pollutant discharge divided by the long term mean. Thus, giverr a set of n daily observations, the d~ily variability factor is
where Xis the arithmetic average of the daily observations, and u.99 is. an estimate of the true 99th percentile, K.99·
The value for u· 99 ··~as ~btained is the rth largest (w~ere r < n) sample value, denoted by X(r), chosen so the probability that X(rl is greater than 01~ equal to K ~9 was at least O. SQ. As described above, the value of r J:or which tii.is criterion was satisfied.was determined by nonparametric methods (see e.g., J.D. Gibbons, Non-Pa~ametric Statistical Inference, McGraw-Hill, 1971). An estimate chosen in this manner is referred to as a nonparametric 50 percent tolerance level estimate for the 99th percentile. The daily variability factors calculated by the above described method are shown in Table G-2.
30-Day Variability Factors
The -monthly vaJ::iability factors were also determined using _a nonpara- .. metric analysis.
It is assumed .that the daily variable X has a distribution F with_ mean µ and variapce a 2
• Even if we made .. the nonparametric assumption that the form of Fis unknown, the m6nfhly means would be ~pproxi~ mately normally distributed with meanµ and variance a 2/30~ This formula assume:;; that 30 observations are available during the monthly period. This approach is nonparametric or distribution free ·in the sense that no restrictive assumption is made regarding the form of F. If there are n daily measurements, then
X =
11 J;x; i==l ---n
443
... f .:·~ : .'
, ;", ~:

where X is the daily BOD or TSS in pounds. per' day, and
s2 =
n E (Xi-X)2
i=l n-1
estimatesµ and u2, respectively. Therefore, the 99th percentile estimate is:
X + 2.33 S/ V30
and the monthly variability factor is:
VF!= X + 2.33 S/ V3Q x Thus, the normal model fo1::- the monthly mean' was used, since sample means are approximately normally distributed even when the raw data is not (e.g., see McClave & Dietrich, Statistics, Dellen, 1979).
These results of the analysis of 30-day varia~ility factors are shown in Table G-3.
INDUSTRY COMMENT ON STATISTICAL METHODOLOGY USED TO DEVELOP EFFLUENT LIMITATIONS PROPOSED ON OCTOBER 31, 1979
Several industry participants commented on th~ above described statistical methodology used to calculate performance variability factors. The comments received can be summarized as follows: ( 1) the Ag ency' s data base was criticized as being limited in that it contained too few data points to provide more than a tough estimation of iong term averages; (2) the nonparametric statistical m~thodology was criticized because it assumes that data consist of independent observations, when in fact the data are time and temperature (seasonally) dependent; (3) it was stated that the Agendy incorrectly relied upon the assumption that the monthly means are normally distributed in their analysis of 30-day variability factors, resulting in the BPT and BCT model plants' failure to achieve the proposed limitations with frequency consistent with the limitations being established at the 99th percentile.
REVISED STATISTICAL METHODOLOGY
As a result of continuing efforts to improve its statistical methods and in response to industry comment, the Agency conducted a thorough re-evaluation of the variability analysis ~sed to determine the proposed timber limitations.
Extended data bases, in most cases representing 1 year or more of additional treated effluent and productidn daia, were requested from
444

each of the treatment systems used, to determine the· proposed effluent limitations for the wet process hardboard and insulation board subcategories. All but one plant provided this requested data. The 515 hardboard BPT model treatment plant did not provide the requested data on the basis that it was unrepresentative of normal treatment system operation because of a 1978 flood whj,ch washed out a solid.s settling lagoon.
Analyses were·conducted ~sing the original data base fbr Plant 207 (1/1/76 to 12/31/77) and extended .data bases for Plants 5'37 (1/1/76. to 3/31/79), 931 (10/1/76 to 10/31/79), and 980 (1/1/76 to 2/29/80 for BOD and 6/16/77 to 2/29/80 for TSS).
The objectives of: the re-evaluation were to:
l. Evaluate the effects of autocorrelation {"non independence 11)
on the proposed daily and monthly variability factors;
2. Evaluate the effects of seasonality and temperature dependence of pollution load on the proposed daily and monthly variability factors;
3. Propose: statistical techniques to account for autocorrelation and seasonality in -the data, and compare daily and monthly 99th percentile estimates obtained using these methods to the 99th percentile estimates used to calculate the proposed limitations; and
4. Evaluat:e the daily and monthly variability factors for the companieis' extended data bases, i.e., data collected since the analyses which generated the variability factors used to develop proposed.limitations;
This discussion will ... fo~_u_s_ on presentation of results of the analyses conducted to accomplish the above objectives. To facilitate the presentation of results, most statistical details will be placed in the Theoretical Supplement to Appendix G. ·
Daily Variabilit:] Factors
To review briefly the method:of calculating the nonparametric tolerance level estimate, th~ daily-data are first ranked from lowest to highest numerical value. The probability that the largest value exceeds the true 99th percentile of the distribution is calculated using the binomfal distribution. This probability, based on a total of n meas~rements, is
' -- ,'",'i: -,-
p
= l
= l
[largest
- p [all
- (.99)I'l
of n measurements exceeds the true 99th- percentile]
n measurements are less than the 99th percen~ile]
445

Similarly,
p [second largest of n measurements exceeds the 99th percentile]
= 1 - (.99)n - n (.99)n-l (.01)
and, in general, '
P [kth largest of n measurements exceeds the 99th percentile]
The measurement taken to be the nonpara~etric estimate of the 99th percentile is the smallest measurement which causes the above probability to exceed 0.50. Thus, the estimator is said to represent an upper 50 percent tolerance level for the 99th percentile. This procedure will produce estimates whi.ch have the interpretation that in a large number of random samples each consisting of n observations, approximately 50 percent of the estimates will exceed the 99th per-centile. ·
The nonparametric technique makes no assumption about the distribution of the data, but the observations are assumed to be independent. As will be demonstrated, there is evidence that ,the daily pollution load data is autocorrelated (i.e., correlated over time), so that this assumption may not be satisfied. One objective of the re-evaluation is to analyze the effect of this autocorrelation on the nonp~rametric tolerance level estimate of the 99th percentile.
The first step in the analysis is to obtain a description of the data base and to estimate the autocorrelation, or degree of dependence, of the data. Preliminary analysis of the data revealed little or no correlation between pollution load and available production informa t'ion. All data are therefore analyzed in pounds per day. Table G-4 lists the number of daily values used in the analysis, the arithmetic mean, standard deviation, and the minimum and maximum values for each of the four plants.
Lagged autocorrelations measure the correlation between t.he pollution load on one day with that on previous days, and they therefore measure the time dependence of the data. The Lag 1 autocorrelation measures the correlation between today's and yesterday's load, the Lag. 2 autocorrelation measures dependence between today's and 2 day's' ago, etc. Like ordinary correlations (product-moment) between variables, autocorrelations range from -1 to +l, with negative values indicating negative time dependence, values near zero .little or no time dependence, and positive values indicating positive time dependence between the loads at the specified time lag.
446

Table G-5 lists the autocorrelations for the pollution load data up to Lag 7 (l week). These autocorrelations are computed for daily values after subtracting the monthly mean from each measurement. The monthly mean is subtracted to account ,for seasonal effects. Also given in Tabie G-5 are the number of pairs of data values. which were available to compute each autocorrelation. This number varies considerably because daily data were not available every day for any one of the plants. Plant 980 comes closes~ to having daily _data, and the siz-~ of_ this data. base makes it the best of the four for statistical analys·is. In contrast, Plant 207 is primarily weekly data, so that v~ry few contiguous days' data (as few as four pairs) are available for several lag autocorrelations.
The autocorrelations in Table G:..5 leave little doubt that· the pollu-tion loads are time dependent. In every case, the Lag l au tocorrelation is positive and relatively large, implying 'that a high load on one day is likely to be followed on the next day by another high value. The physical explanation of this positive autocorrelation is probably related to the long detention time in the aeration and settling ponds of the treatment systems. ·
Assuming, then, that the data are positively autocorrelated, the binomial formula used to compute the tolerance probabilities does not yield exact values. Instead, they are approximations, and some indication of how well they approximate the exact probabilities should be given. Although no direct analogy to the binomial formula has been found for dependent data, there are methods available to measure the effect of dependence on the standard error of the sample -percentile estimator of the 99th percentile. The standard error of an estimator is a measure of its variability (standard deviation) in repeated usage and therefore measures the potential error of estimation. ·
T~e sample percentile estimates of the 99th percentile of the pollution loads are given in Table G--6, with the standard errors of these values given under four diffetent assumptions~ independence, "weak" dependence, "moderate" dependencei and "strong" dependence. The model which was used to express the various levels of. dependence is th~ first order autoregressive model. This model relates the present daily value, Zt' to yesterday's value, zt-l' by the equation:
Zt = (,iJ Zt-1 + Et
where Et is random error, uncorrelated over time, and <,iJ is a constant which determines the strength of dependence. Data from Table G-5 demonstrates that the fitst order autocorrelation is generally significant for all plants while no ·other autocorrelations are significant for all plants, suggesting the appropriateness of using a first .order autoregressive model. The autoregressive model implies that the daily values are dependent, with the·dependence growing steadily weaker as the time between the daily mea$urements increases, an implication
447

' which is generally supported by the autocorrelations of the data (see Table G-5). The assumption of independence corresponds to~= O, "weak" dependence to~= .2, "moderate" dependence to~= .s, and "strong" dependence to ~ = .a. Further stat,istical definitions and details are given in the Theoretical Supplement to Appendix G.
Inspection of Table G-6 reveals that the standard errors increase as the assumed level of dependence increases, but the increase is moderate when compared to the absolute value of the load estimates, i.e., the increase in relative standard error is generally less than 10 percent of the estimated percentile. The variability ~actors under the various time-dependence conditions are given in Table G-7. The variability factors from the Development Document supporting the proposed regulations (1979) are shown, along with those obtained by using the sample percentile estimates plus two standard errors. The 1979 Development Document variability factors are based upon 50 percent tolerance interval estimates of the 99th percentile, while those presented in this appendix under the assumption of time dependence are upper 95 percent confidence level estimates oe the 99 percentile. Even. with the more conservative approach used in the time-dependent case, the uniformity of the var.iability factors in Table G-7 clearly indicates that the estimators of the 99th percentile are relatively insensitive to autocorrelation of the data. In fact, the 50 percent tolerance interval value appears to yield variability factors which are conservatively high, even when the data are time dependent. Thus, the daily variability factors established in the 1979 Development Document are reliable estimates which are minimally affected by the autocorrelation of the data.
Monthly Variability Factors
In the 1979 Development Document, monthly variability factors were derived using a probabilistic result known· as the Central Limit Theorem. This theorem assures the approximate normality of' the distribution of the monthly means regardless of the underlying distribution of the data, assuming that the number of observations comprising the mean is sufficiently large. Most textbooks use sample sizes of 25 or 30 as a minimum, although as few as 10 to 15 may be sufficient if the underlying distribution is not excessively skewed.
The limitations presented in the 1979 Developm~nt Document: were based on the assumption of 30 daily measurements per month*, a point which was overlooked or misunderstood in induitry's review of the document, since they incorrectly applied the 30-day limitation to monthly means based upon varying sample sizes. However; even if the monthly
*The 30-day 99th percentile estimator was defined as X + 2.33 s/V30.
448

limitation werE~ to be adjusted for the actual number of daily measurements, the number ·of exceedances (monthly ·means wh Leh exceed the. limitation) wouid. be greater, ·than eJcpected. · This fact is probably attributable to the dependence in the data. Seasonality ~nd autocor~ relation are two main sources of i dependence, an~ in this section, a method of establishing monthly 1 imitations which .. take · these facto rs into account is developed.
The method of dev0eloping limitations which take autocorrelation and seasonality into account is to construct a statistical model which explicitly contains these componet1t§. Alth9ugh most of _the statistical details will be presented in the Theoretical Supplement to AppendixG, it .is useful to und.er.stand the basic concept of ,the model. The daily· pollv.tion load model consists of three basi.c components:
Daily Load == [Long Term Mean] + [Month Effect (Random}]·
+ (Day. E.ffe~t (~andom and Autocorrelated)].
Thus, each daily v~lue consists of a fixed mean val~e with two raridom components added to the mean: a monthly effect and a daily effect, with the latter assumed to be autocorrelated. The differences between this model and the one used in the 1979 Development Document are the addition of the Month Effect as a random component and the specification that Daily Effects are autocorrelated. The. intent is that the Month Effect accounts for the season•lity,of.the data, whil~ the autocorrelated Daily Effects a~cpunt for th~ time dependence of the data. · · · ··· · ·
In Table G-8, the 99th percentile estimates derived using th.is model are presented fen: each of· the f_our plants •.
For purposes of c::omparison, the 99th percentile estimates are given, assuming independent, w~akly dependent- moderately dependent~ and strongly dependEmt Daily Effect. A conclusion which becomes clear on studying thi~ tabl~ i~ that the effect of,dtily autocorrelation on the monthly 99th pe1:-<::enti'le estimate appears to be minimal; that is, the estimate does n<>t change significantly as the strength of the autocorrelation inci~eases. The reason is 'that.the Month Effect dominates the Daily Effect, probably due to seasonality of the data.
The assumption of moderate dependence is based upon analysis of the daily autocorrelation (detailed in the Th~oretical. Supplement to Appendix G), which reveals that this level of dependence provides the best descriptior1 of the autocorrelation observed· in the data. That is, based on the available data, the first order autoregressive model with~= .5 provides a good fit~ Since Table G-8 revealed that the strength of dependence plays a relatively unimportant role in determining the monthly variability factors, there is little justification for attempting to find a more exact value for <) for each plant.
449

~he monthly variability factors are shown in Table G-9, assuming 30 daily values and moderate dependence. The variability factors from the 1979 Development Document are also given; recall they were also based on 30 daily values. Note that the variability factors which take seasonality and autocorrelation into a~count are larger than the ones given in the 1979 Development Docum~nt, primarily due to the inclusion of a term (Month Effect) which allows for seasonal variability of the data. ·
In summary, the revised model provides a means of deriving monthly variability factors which take into account the seasonality and autocorrelation of the data. Even with minor deviations from normality, the use of 2.33 standard deviations provides a liberal limitation for the monthly means.·
MODIFICATIONS TO VARIABILITY FACTORS AS A RESULT OF STATISTICAL RE-EVALUATION
I
The daily variability factors derived in the 1979 Development Document are relatively insensitive to autocorrelation in the data. Additionally, since they are based upon the larger observed pollutant loads, seasonality is automatically factored into their calculation. Thus, EPA has decided that no change will be made in the method used to calculate the daily limitations. These da~ly limitations have been recalculated to reflect the additional data :received, however.
The monthly limitation proposed in the 1979 Development Document did not take autocorrelation and seasonality into account. The random effects model presented here was constructed to remedy this. The results of the analyses using this model support an increase in the 30-day limitation. While the BOD variability factors for the four plants used in this analysis range from ~.34 to 1.44 in the 1979 Development Docurnen t, they range from 2. 0 8 to 2. 7 2 when the random effects model is used. Similarly, the TSS variability factors range from 1.33 to 1.46 in the 1979 Development Document and from l.90 to 2.37 when the seasonal and autocorrelatiqn adjustments are made. Whereas more monthly exceedances (i.e., monthly means which exceed the limitation) than expected occur when the 1~79 Development Document variability factors are used, very few exceedances occur using the new variability factors. Thus, EPA has increased the monthly limitations to levels consistent with those developed using the revised model.
450

THEORETICAL SUPPLEMENT
Given a set of N ordered values ~<l>-, ~< 2 ), ••• , XfN) on the random variable x, the. 99th percentile 1.s aef1.nea (Bahadur, 966} to·be
ON.= x(.99N) if.99N is an integer
= Xe [.99NJ+l) if .99N is not an integer.
where [.99N] is the largest integer contained in (.99)N. For example, if N = 100, ON i.s the 99th orqered daily value, since .99N = 99. But if N is 101, .99N = 99.99 so. that [ .99N] + t = 100. Thus, QN is the 100th ordered observation. Note that this sample percentile estimate differs in definition from the 50 percent tolerance level estimate (Section 1), w.i.th the latter generally more conservative.
If Q is the true 99th percentile 9£ the distribution, then it has been shown (Bahadur, 1966) that if the daily vaiues are independent,
_o_~> N(O, pq) f2(Q}
( l)
where D ::> dm1otes "has an asymptotic distribution," the probability p that a randomly selected observation is less than- the 99th ·percentile is .99, the probability q that a randomly selected obaervat~on exceeds the 99th percentile is .01, and f(Q) is the probability density function of X evaluated at. Q, the tr~e 99th percentile. Thus, the distributicm of ~ can be approximated by the normal with mean Q and variance pq/Nf2(Q) when N is large. The problem with applying this result is that ~he density f must be known to estimate the standard error, which requires specification of a parametric distribution fC)i: x. However, tolerance interval probabilities can be calculated for independent observations using the binomial formula given in Appendix G, and these require no specification ·of the., probability distr:Lbu.ti9n of X. Thus, even though the tolerance interval method tends to produce conservatively high estimates of Q, it is preferable to using QN when the distribution of Xis in doubt.
The tolerance level method requires that the daily observations be independent. Since no analagous nonparametric method exists for dependent time i;eries, the parametric method should be used to assess the 99th percentile estimator. Chanda (1976) and Sen (1971) hav~ shown that under certain rather unrestrictive conditidns on the structure of dependence,
451

(2)
2 where i'v = P{Xt.i Q, Xt+ vi Q) - p • To see, that this distribution reduces to (1) in the independent case, note that
i'v= P(Xt i Q) P(Xt+ ,,i Q} - p2
= p2 _ p2 = o if 11 ~ 0
and
i'0 = P(Xt < Q) - p2
= p - p2 = p ( 1-p) :: pq Q0
When the data are dependent, both ~·"Yv and f(Q) must be ·estimated. Since the log transform appears to be more symmetrically distributed than the raw data, the lognormal distribution was used to develop an estimate of the standard error of the 99th percentile for comparison with· the 50 percent tolerance level estimator~ Thus,
2 f(Q) = (v'21.T<TQ)-l exp(-1 (log Q-JJ.) 1 i
2 q2 . ( 3)
where µ and q are the mean and standard deviation, respectivei'y, of the log transform of X, which will be ;denoted by Y [i.e., Y = log(X)].
The estimation of f(Q) is accomplished by estimatingµ by the logarithmic mean, say Y, a by the logarithmic standard deviation, Sy, and Q by ON• Substituting into (3), :
. - 2 f'(QN) = C Y2/isy QN)-1 exp[-~ (log Q~-y> l
Sy
is an estimator for f(Q). 00
In order to estimate -~i'v, note that
= P[XtiQ, xt+viOJ -p 2
2 = P[Yt < log(Q), Yt+u .s, log(Q)] - p
= F [loa(Q), log(Q)] - p 2 µ,a,p 'l
452

where Fµ,a,p is the bivariate normal distribution with meanµ, standard deviation a, and correlation co•fficient p. By again substituting the estimates¥ ands forµ and a, and QN for Q, an estimate of Yv is .obtained for varidus correlation coefficients:
I\
Y v = F y, Sy; p [ log ( QN) , log ( QN) ] - p 2
co . Kl\ Subsequently,~ Yv can be estimated by ~ Yv
-co -K
where K is chosen so that the addition of subsequent terms adds less than 10-6 to the summation.
Finally, an estimation of the ~t~ri~ard irror of the sample 99th percentile QN for the dependent case is
Estimate~ Standard Error (QN) = {
~ Yv -K
/2
These estimated standard errors are given in Table G-6 for the case of P = O, .2, .s, and .8, referred to in the report as independence, weak dependence, moderate dependence, and strong dependence, respectively.
The next step is to 6titain an estimate of. the limitations and variability factors. To estimate the 99th percentile, the approximate upper 95 percent. confidence level for Q is estimated, i.e.,
I\ L = QN + 2a QN
This represents an extremely conservative estimator as compared to the 50 percent tolet'ance level estimator, since it wi 11 provide an est ima te which exceecls the· true 99th percentile approximately 95 percent of the time in rE!peated, independent usage, while the tolerance level estimator will exceed the true 99th percentile appr6ximately 50 percent of the time in repeated, independent usage.
The variability.factor is then defined by
L V.F. = -X
where Xis the long-term mean of the data. When these variability factors are compared in Table G-7 to those from the 1979 Development Document, a reassuring consistency is observed. A study of this table indicates that t:he ~Dev!:: lopmen t Document values, derived using the
453

tolerance interval method, are approximately the same as those which use the sample percentiles and take daily data dependence into account.* This fact indicates that the tolerance interval method is insensitive to departures from independence, even when a more conservative confidence level of 95 percent is employed, and that the variability factors derived using the 50 percent tolerance level estimator remain very reasonable.
NOTE: Although the method of estimating the 99th percentile developed in this Appendix·is referred to as "parametric", the estimator itself is nonparametric, since the sample percentile QN does not involve the distributional form of the daily values. However, the standard error of QN do,s explicitly involve the distribution,· ~aking the balculation of a confidence· bound for Q a parametric operation.
*As expected, the values for the more conservative percentile estimates, at 95 percent confidence, usualiy exceed the tolerance interval estimate, at 50 percent confidence. However, the difference is generally relatively small. In one case, Plant 207 BOD, the tolerance interval estimate exceeds the percentile estimate assuming weakly or moderately dependent daily values, probably due to the relatively small sample size (133).
454

CENTRAL LIMIT THEO.REM
The Central Limit Theorem states that the· asymptotic'distrib.uti:on of vn(X'-µ) is app1:oximately normal with mean O and v~riance u 2 , where :X" is the sample mean.based on n independent observations, and µ and u 2
are the mean atnd variance, respectively, of the distribution .. from which the obsEu:vations wer·e selected. · This Theorem conti'nues to hold for ·dependent observations (Fuller, 1976) fr<>m a stationary process, with the modU:ication that the variance is
where Pv is the autocorrelation between Xt and Xt+v' two observations separated by II time units. The only as£umption in either case is that the meanµ and variance u 2 (oru2 l:p 11 ) must be finite, an unrestrictive,a.ssumption which holds for mg,st data.
The most _comm<:>n _application of this Theorem is to use the normal d is t r'i but ion w i th me an µ. and var i an c e CJ 3/ n to approx i ma t e the distribution c>j: X', the sample mean. The approximation improves as the sample size, n; is increased. It can be- quite-good for very small samples if thE! underlying distribution of the c;iata is symmetric and unimodal, and quite bad for relatively large samples if the data are skewed or bimc>dal. It is generally accepted that. a sample size of 25 to 30 is. suffic:.ient for the normal approximation to be adequate for means fr6m almost all distiibutions. ·
An important pc>int to note is that the sample size plays an explicit role in the va1:iance of the sample mean. That is,
Var(Jr) · = CJ 3/n This point was apparently overlooked in industry's response 'to the 1979 DevelopmEmt Document, beca.use all the monthly means were grouped into a single plot, and compared to the same limitation (which was based on 30 sample measurements per month>,.
MONTHLY RANDOM EFFECTS MODEL
The· intent of this section is to'. provide. the s·tat'istic.al. details fo.r the model used in Appendix G of the. report to.derive the 30 ... aay variability factors. ·
The model used ij.a rando~ efJ~cts model, which may be wiitten as follows:
455

where Xit is the observable daily pollution load,µ is the expected value of Xit (the "long term" mean), Mi is a r,andom effect associated with the itli wnth, and zit is a random effect associated with the tth day in the it month. It is assumed that:
E(Mi) = E(Zit) = 0
0'2· m , Var(Zit) = u 2
and
Cov(Mi, Mj) = O, Cov{Mi, Zit)= 0
In addition, the daily effects are assumed to be autocorre~lated, with a first order autoregressive model used to describe the autocorrelation:
Zit= ~Zi,t-1 + Eit
where¢ is a correlation paramet.er {-1 < ~ < 1) and Eit is white noise, i.e., uncorrelated and satisfying the conditions
E(Eit} = O,
Var{Eit>
The autoregressive model is a time series model, i.e., a model which describes a random phenomenon observed over time. The model implies that the daily values are dependent, or autocorrelated, with the strength of the dependence greatest between consecutive daily values. The autoregressive model also implies that the dependence between daily observations weakens as the number of days between observations increases. Positive values of the parameter indicate positive dependence, the usual case in practical time series applicat~ons, and the strength of the dependence increases as the value of~ approaches one.
In Table G-5 the first seven autocorrelations, for the daily effects associated with t~e various data series were presented. In Figures G-l to G-6 graphs of the first 50 autocorrelations for plants 537, 931, and 980 for BOD and TSS are presented. Although the estimates are based on data which were not collected every day, there are sufficient data available for three of the plants {all but Plant 207) to see that the autoregressive model is a reasonable one. The autocorrelations for Plant 537 appear to have a 7 day cyclical pattern, possibly implying a mote complex model, but the data are insufficient to identify and estimate such a model. No distributional assumptions on Mi or zit are necessary .at this stage.
456 ·,'

Before developing estimators of the z:-andom. ~~;ects model parameters, some- discuss.ion of ·its- motivation is warranted.· A more famil.iar-:model which has been pr_o,posed- to ·accouht for s~aso.nality is:··
Xit = f(t) + Zit
where E(Xit) - = 1:( t) is a deterministic fu.nc.tion of time .which mode.ls the seasonality of the data,. and Zit is the random daily ef feet, as before. ·· · ·· ·
Examples -of seasonal functio_ris, f( t), are tr°i'go.nometric flfnc.tions; or dummy. variables to .account for monthly effects-.- Although_· such, a mode,1 might provide a good fit.-to. the data, .. the.· imp'licatio·n ·of using.-the model -is "th~t- seasonal limitations are to- be. ,established, a·s ·oppos.ed· to a single limitation applicable to all the seasons. Th.at· is,. if the mean of the. daily values .is mo.deled w_ith a determin.istic· seasonal component,: the rn<:mthly limitations and variability. factors--.will also vary seasonally.* · ·
Since the objective i$. tQ .<;2evelop a uniform ·limitation·, the se.asonal comOonent.is modeled :as a random component-, so that the seasonal variability is explicitly conside~ed. and included in:the, m~nthiy limitations.. Note that the variance of .. an ·individual daily value is ·
Var(X1t> = u~ + c, 2
while that for a monthly. mean value based on~ d daily val.ues, ·
is
x. = l.
. -
d X /d .. ,-.. :£1. it · t== . '
'; ... ;.
V { X ) . . 2 · 2 . d . de c z · · z ·> ar i = a + u --~ ~ orr is' it
m cf.r"s=.=lt=l · -.
= q2 m
·· 2 d d lt-sl · + a _ ~ :t -91
cfr°s~lt=l ·
_ · u2 + 0'2 cl+g. m. d 1-91
r.-!""~·t ~- .•',1 • ... •
... ( l)
('2)
*When fixed ef~~ct m~~els-were fi~ to t~~se data, a iignificant year.-month. interaction was. found in every case, indicat'ing: t_hat the· seasonal effe6t is inconsistent from yeat to year. This furthe~ supports the use of a random effects model •
. 457

where for an autoregressive model Corr(Zis,Zit> = ~ lt-s 1, and it has been assumed that the d daily values occur on contiguous days! The variance will be somewhat smaller if th~ daily values are not contiguous, so that (2) represents a conservativelj high variance in this case. Note tnat if the daily values are independent (~=0), the variance is a;,+ 0"2td, the usual variance of a: sample mean in a random effects mode.L.
The variance parameters of the random ef feet~ model, u ~ and u 2, must be estimated from the data in order to develop the limitations. The Analysis of Variance Sums of Squares are useq for this purpose in the independent errors case, and they can be adapted for use with dependent errors.
First, the Sum of Squares for Months (SSM). is given by the formula
m d. 2 SSM = !, kl. (X.-X)~ =
i=l "t=l l.
m !
i=l - - 2 d. (X.-X)
J. J. ( 3)
where m 'is the number of months during which data are available, and di is the number €! days on which data are observed in the i th month. Also, Xi is the i monthly mean and X is t.Qe mean of ,all available data. Substituting (1) into (3),
m SSM = !
i=l
- 2 d. (M. -M) + J. J.
m m + k ! a.a. (M.-M) (Z.-Z)
i:=l j=l J.J J. J.
where
m
M i~l Mi
= m
m a. ! kl. zit
z i=l t=l = N
and
N m d. = ~ i~l J.
is the total sample size.
458
( 4)

Now the expected value of ·SSM is
singe the expected value of the cross product is zero.
The components of ( 5 ) ar_e
and
m· E[ l',
i=l
- 2 d. (M.-M) ] l. . l.
m 2 . = I, d. [E(M. )
i=l l. l.
m m ( I. MJ. ) 2 Mi l', MJ.
+ E ( j •l 2 . ). - 2E ( j = l ) ] m m
= N(m-1) 0'2 m m
ri m a. l'. z. 2 I l'. l.
m E f =l /t
E(. l t=l = I. di + J=
i=l a. N2 l.
a. m d.i
-2 E(ti~ zit j~l tl1 zjt>
d.N . 'J.
. '
z.t)2 J
2 rn l d. d. ID -Dt I l N N ID -ot I = ( ~ . I.l. l',l.lO s - -N I k yJ s
a 1-:1 clj~ s=l t=l s=l t=l
459
(5)
)
( 6)
( 7)

where ID -o I is the absolute difference of the number of days separati~g the daily values at times sand; t, i.e., the time period between the pair of daily values being correlated.
Substituting (6) and (7) into (5),
E(SSM) • (m-1 )N a2 m m
( 8)
Note that in the case of independence (~=O), and a balanced design (N•md), equation (8) reduces to
E(SSM) • (m-1) (da! + a 2 )
' which is the correct expected sum of squ-res effects model with independent error structure. for a discussion of the random effects (nes~ed) error structure. ·
Similarly, for the sum of Squares for Error case),
m d. -- 2 SSE= :t :tl. exit-xi>
i•l t=l
m d. - I :tl. - +
for the usual random See Mendenhall (1968)
model with independent
C _or •oays•, in this
a. I1 2
i•l t=l [ ( Jl + Mi + zit> ( Jl + Mi:
t=l zit)]
di
m d. - 2 = l: l:l.
C zit-z i > i•l t=l
Then
m d. - 2 E(SSE) = }; ~l. E(Z.t-Z.) - J. J. i=l t=l
460

«1 2 m d.
1 a. d. ID -D I = :I: I. l [l - ~ I.l I.l~ s t]
i=l t=l l s=l t=l
m 1 d. d. ID -Dt I
0'2 = [N k I. l I.l.91 s J -i=l di s=l t=l
In the case of independence an~ balance, (9) reduces to
E(SSE} = m(d-l)u2
~hich agre~s with the usual result~
Writing
(m-l)N cl = __ m __ _
m 1 di ~i!2JID6 -Dtl c2 = I. -;r~ I -
i=l .l s=l. t=l
and
1 N
m 1 C3 N-=
d. J.
d. I r5 ·-ot I I 112' s !. F." I.
i==l J. s=l t=l
it has been shc:>wn · in ( 8) and ( 9) that
E(SSM) = c~~! + c2a2
N N I D6 -ot I I. :t !2J-
s=l t~l
Given an estim,ate qf !2J, the .values of c1 , c2 ,. and- c 3 can be .calculated·, . and theri estimate~ of · ut and u2 can oe cal cu Ia ted· using. the obse:c:v~d SSM a11d SSE as. follows.: _ . .
46f
", .. ~ ' i· 1.,~,, · '.

/\2 SSE Cl = CJ
/\2 SSM-C2<t2 a ...
C1 m
In Table G-10, the values of ~~ ~nd ~ 2 are given for eac::h plant, with ~ = .s. Note that~; is generally of the same order as ~ 2, indicating that much seasonal variability is present in these data.
I
The most important function of the model is its use in establishing a monthly limitation. The variance of the monthly mean based on d dai·ly values now can be estimat:ed from equation (2) by
" " ~ 2 1+g · 2a·, 1-ad > · Var(X'i) = u~+ °dr [1_ -~ 1 ,
To derive the limitations and variability factors in the report, a value of~• .s was used. This estimate is based on the daily residual autocorrelations shown in Figures G-1 to G-6, which are relatively consistent with such a model. A more exact estimator of~ was not derived because of the many missing daily values in each series of data, and because the effect o( the value of~ on the limitations was very minimal, esP.ecially whe~ compared to the effect of seasonality (as measured by u 2). The autocorrelations were also analyzed using the ·model identification algorithm developed by McClave (1978), and the first order autoregressive model was supported!
The 99th percentile of the monthly mean is estimated
L = X + 2. 33 Vva~X'f)
and the variability factor by
L VF=~
where Xis the mean of all the daily values, i.e., the "long term" mean.
The validity of the limitation and variability factor as 99th percentile estimators depends on the normality of the two random quantities in X-i: Mi and Z"i. The approximate normality of "Z'. follows· from the Central Limit Theorem for reasonably large d, but the normality of M, must be assumed. On a hueristic level, t~is may be a reason~ble a~sumption even if the data themselves are s~ewed, since the distribu.tion of the daily random component, Zit' may be skewed, while that of
462

Mi is approximately normal. Unfortunately, the prese~t data are insufficient to t:est the hypothesis of Mi's n..)rmalitJ.*
*Such a test is difficult in any,cas~, since. M is not an observable random variable..
463

Table G-1. Number of Observations in Data Set, as Presented in 1979 Development Document
BOD TSS 19·76 & 1976 &
Plant 1976 1977 1977 1976 1977 1977
537 139 135 274 139 134 273
207 52 81 133 96 122 218
931 205 203 254* 205 203 254*
980 361 356 834t 360 356 311**
*Data represents period of 10/1/76 through 12/31/77 when upgraded system was in working operation.
tData represents period of 1/1/76 through 4/30/78. **Data represents period of 6/16/77 through 4/30/78 when
standard TSS analyses were performed.
464

.· Table G-2. Non-Parametric Daily Variability Facto'rs for.
Plant.· .:..
931
537
207
980
-
Insulation Soard and Hardboard Plants, as Pre_s.ented ir;, 1979 · Qevelopment Document.
BOD TSS 1976 & 1976 &
1976 1977 1977 1976 1977 1977
4 ., 7 5.64 , 5 C 58* 4 .. 1 4.49 4.56* ..
7 .. 3 3c72 3.93 5.6 6 .32 4.22
t 4 .. 87 4;61 3.3 4.24 3.59
3 .. 6 3.89 4.06** 3.3 6.79tt 6.79tt
*Data represents period. of·l0/1/76 through· 12/31/77 wh~n upgraded treatment system was under: normal.operation~
tinsufficient data·to obtain,a 50 percent confidehce estimate for the 99th percentile.
**Data represents period of 1/1/76 through 4/30/78. ttData represents period of 6/16/77 through 4/30/78 when
standard TSS analyses were performed.
465

Table G-3. Non-Parametric 30-Day Variability Factors for Insulation 'Board and Hardbqard Plants, as Presented in 1979 Development Document
BOD TSS 1976 & 1976 &
Plant 1976 1977 1977 1976 1977 1977
' 537 1.45 1.67 1.40 ~.41 1.76 1.41
207 1.34 1.34 1.34 1.33 1.33 1.33
931 1.48 1.54 1.-44 l.42 1.44 1.39
980 1.31 1.40 1.3·5* 1.27 1.72 l.46t
... *Data represents period of 1/1/76 through 4/30/78. tData represents period of 6/16/77 through 4/30/78 when standard TSS analyses were performed.
466

Table G-4. Descriptive Statistics of Extended Data Base
'Long-Term Avg. Arithmetic Standard Production Sample Mean Deviation Minimum Maximum
Plant ( tons/day) Pollutant Size (lbs/day) (lbs/day) (lbs/day) ( lbs/day)
-207 89.8 BOD 133 800.0 640.9 40.8 3685.0
1/1/76 to TSS 218 1868.2 144.9. 8 18.0 7345.0 12/31/77
537 159.3 BOD 445 659.9 594.4 7.0 4565.0 .1/1/76 _to TSS 447 417.0 387.3 6.0 2916.0
.J:o, 3/31/79 °' .......
931 130.9 BOD 627 241.5 223.8 6.0 1274.0 10/1/76 to TSS 627 788.3 630.6 15.0 3663.0 10/31/79
980* 234.7 BOD 1359 1694.3 1352.8 30.0 13541.6 1/1/76 to TSS 838 2367.8 1873.5 125.4 34273.5 2/29/80
*TSS data base period is 6/16/77 to 2/29/80 which represents the period of time when standard TSS an~lyses were performed. Long-term average production from this period is 236 tons/day.

Table G-5. Autocorrelations
BOD TSS Auto- Auto-
Plant Lag N correlation N correlation
207 1 4 .18 49 .09 2 48 .03 76 .25 3 7 .49 52 .28 4 4 .24 59 .51 5 39 .23 63 .10 6 4 .18 72 .Ol 7 75 -.12 112 -.OS
537 l 150 .. 44 150 .41 2 145 ~ .. 03 146 -.02 3 137 - .,25" 139 -.18 4 131 .. 01 132 -.23 5 137 .,06 138 -.08 6 144 - .. 04 145 -.06 7 379 .08 384 .09
931 1 464 .. 43 464 .45 2 305 .. 03 305 .03 3 146 - .. 30 146 -.24 4 146 .. 20 146 .20 5 304 .. 18 304 .07 6 462 .. 07 462 .08 7 609 - .. 06 I 609 .OS
980 1 1333 ., 61 819 .51 2 1314 .. 41 802 .29 3 1302 .32 790 .02 4 1289 .. 16 779 -.04 5 1281 .11 770 -.07 6 1273 .08 761 -.06 7 1264 -.01 753 -.07
468

Table G-6. Daily 99th Percentile Estimates and Standard Errors
Standard Error of the 99th Percentile Estimate 99th Percentile Independent
Estimate Observations Deeendent Observations llbsLday) Plant Pollutant (lbs/day) (lbs/day) Weak Moderate Strong
207 BOD 2896.7 295.6 302.1 340.9 502.3 TSS 6580.8 407.5 416.5 469.9 692.3
537 BOD 2575.0 124.7 127,5 143.9 211.9 .i:,.. TSS 1742.0 97.7 99.8 112.6 165.9 O'I U)
931 BOD 1000.0 52.2 53.4 60.2 88.8 TSS 2785.0 107.2 109.6 123.6 182.2
980 BOD 5990.5 170.5 174.3 196. 6 , 289.7 TSS 6355.0 218.7 223.6 252.3 "371.6

Table G-7. Daily Variability Factors
Upper Confidence Limit (95 percent)
Daily for the New VariabilitX Factort
Independent
Plant Variability Observations Deeendent Observations (lbs/daX)
Pollutant Factor* {lbs/day) Weak Moderate Strong
207 BOD 4.61** 4.36 4.38 4.47 4.88 TSS 3.59** 3.96 3.97 4.03 4.26
537 BOD 3.93** 3.92tt 4.28 4.29 4.34 4.54 TSS 4.22** 4.34tt 4.65 4.66 4.72 4.97
.;,. c3 931 BOD 5.58** 4.15tt 4.57 4.58 4.64 4.88
TSS 4.56** 3.6ltt 3.80 3.81 3. 85 3.99
980 BOD 4.06** 3.67tt 3.74 3.74 3.77 3.88 TSS 6.79** 2.77tt 2.87 2.87 2.90 3.00
- . -
*Based on 50 percent tolerance level estimates of the 99th percentile. tBased on the upper 95 percent confidence limit for the 99th percentile. All variability factors, except Plant 207, are based on extended data bases.
**Based on original data base, as presented in.1979 Development Document. ttBased on extended data base, calculated using the same methodology as described in the
1979 Development Document.

Table G-8. 99th Percentile Estimate for 30-Day Average Based on Arithmetic Mean
Number of BOD TSS Observations Independent Dependent observations Independent Dependent Observations
in Monthly Qb;aervations (lbsfdaiz Observatio.ns . · pbsLdav) · Mean {m) ( lbs/d.ay) Wealc Moa.era-e Strong (lbs/day) Weak Moderate · $trong
PLANT 207
30 1913.9 1917.4 1919.2 1906.9 4414.3 4418.9 4424.5 4413.B
PLANT 537
.i::,. 30 1373.7 1374.2 1375.7 1359.6 865.7 866.2 867.4 856.5
....... .... PLANT 931
30 658.2 657.6 657.4 657.3 1845.2 1842.8 1841.8 1841.6
PLANT 980
30 4051.1 4049.2 4044.0 4025.6 4537.0 4526.3 4495. 6 4391. 4 ·

' Table G-9. Thirty Day Variability Factors
BOD TSS 1979 Random 1979 Random
Developmen·~ Effects D4avelopment Effects Plant Document Model Document Model
207 1.34 2.40 1.33 2.37
537 1.40 2.08 1.41 2.08
931 1.44 2.72 i.39 2.34
980 1.35 2.39 1.46 1.90
472

Table G-·10. Estimates .,;>f the Variances for the Random Effects Model ..
:- ""' -'··~~ ~.. . ,',
Raw .Data Monthlv Variance Daily Variance
Plant Pollutant (~) ( fr2)
207 BOD ,·.,21.0, 924 207,529
TSS 1,104,187 1,041;546
537 ·BOD 66,796 288,561
TSS 25,376 i25,371
931 BOD 29,853 ·21,031
TSS 183,462 219,328
980 BOD .929 ,068 920,109
TSS 548,184 2,988,834
----,.-·--------------------------All values are computed assuming ·rJ = 0.5 (Moderate Dependenc::e) e
· · 473

no,o •c
FIGURE G-1
<000> DAILY EFFECT AUTOCORRElATlOtl Pl.ANT 537
•• 00 •----- ----------------------·-----··-------------------------------------------------------------Oo 95 t
"· 90 • 0,8!! t O, P.10 • 0,7!! • 0.10 t o. e!! • 0.60 • o. !!5 t 0o$0 P---------------------••••••••-••••••-••-•••••••-•••••-••••••-••-•-•-••••--••••••-••••-•-••-•••----••-•••••• l.45 0,40 O,J!! OoJ() o. 25 Oo ?O Oo I !5 Oe I 0
• • • • • • • •
"
,. A A A A A A
OoO!! • A A A A A
A
OoOO t•••••••·•----------A------------------------------------A-•••A•••A•-••A•••••-A•A----------------------• 3. ,,, + " " ,. ,. " " " •
.i::,. -o.i,• ,. ,.,.,. -..J •()• 15 t A A A A A .i::,. -J • 20 t A A A A A A
.,,. 25 • A A A A •0,JOt A A -l.J!!. • o. 41) t -0,4!! t
-J.50 ~-------------~---~--~-~~-----~.-----------------------------------------------------~--~-~---------~-----------------e. ~5 • · -0.60 t -0,65 t -o. 70 + -o, 75 t -o. 1.10 • -i).8~. •J,90 t - :,, 9!5 +
-1.00 •--------------------------------------------------------------------------------------------------------
-----------•-•-•-•-•-•-•-•-•-+-+-+-t-•-•-•-•-•-•-•-•-•-•-•-•-•--•-+-•-•-•-•-•-•-•-•-•-•-•~•-•-+-•-•-•-•-•-•-•-•----------1 l I I l I l I I I 2 2 2 2 2; 2 2 2 2.3 J 3 J 3 J 3 J l J 4 • • 4 4 4 4 4 4 4 5 () l 2 J 4 !! 6 1 e 9 0 I 2 ~ 4 !! 6 1 8 9 0 I 2 3 4 ! ~ 7 8 9 0 Ii~ 4 ! 6 7 e 9 0 I 2 3 -· 5 6 7 8 9 0
T

~ -...J U'I
,ss AC t
!
FIGURE G-2
<TSSJ DAILY EFFECT AUTOCORRELATION PLANr 537
, • 0 0 t --- - - -------------------------------------------------------------------------------------------------------o. 95 • · 0.90 • o. 85 t o. 80 t 0.1s • 0.10 • o.t!\ • 0 .60 t o. !15 t o·. so • ------- -------- ---------------- _______________ ----------------------------------------------------------------0., s .o. 40 t o.Js • OolO t 0.25 • 0 • 20 t
A
A
o. 15 • A 0 • 10 t A A A A 0 • 05 • A . A A " " 0-1 0 0 • ---- -- --- -------A---- -------A------...------------------------=-·---•A----------~-----------A------------A----- -• ----•
-0.05 t A ,. A A A A A A A A A -'l.lOt A A A AA -o. I 'I t " ,, " •O • 20 • A A A A " -Oo 2'1 t A A A A A A -OjJQ • " " -3.35 • -.). 40 t -o.~s • .,. .) • 5 0 • -·- ----------------------------------------·---------------------------------·--------- - --------------------.. -- 0. 55 • . -o .60 t - :,. 65 t -o • 70 t -:,.75 •. .;. o •. 80 -t -0.85. t -o •. 9.o_ • -0.9!1 t
-,.,, i----------~--------------------------------------------------------------------------------------
1
I - ----- ------·-·-· -•-• -•-•-•-•- t.- t- •-t-t•t- +-•- t- •-•-•-•-•-•-•-+-•-·--·-•-•-•-•-•-•-• -•-•-•-•-•-•-•-•-•-•- •-•-•-•-----------• I I l l l l l I l 2 2 2 2 2 2 2 2 2 2 3.3 3 3 3 3 l 3 l 3 4 4 4 4 4 4 4 4 4 4 5
o a 2 l • s 6 1 e ~ o 1 2 3 4 s 6 1 a ~ c 1 2 :, • ! 6 1 e 9 o 1 a l • s 6 1 a , o 1 2 :, • s 6 1 a 9 o
'

"' I (:>
LLJ
s (:>
u:
a § u.l
~
i .. I- ,., (.) 0,
If I:; HJ~ ~ 25 § -
u C
8 IC
I I I I I I I I I I I I I I I I ..
I CI I IC I
I I C I
I C I I I
I C I I
C I I
C I I I I
CI I
C I I I C I I
C I I Cl
I C t
cl I
C
C
C
C
C
C
C I IC I .. I
Cl t
C ' ' I C .. C
C
C
C
C
C
C
<C
C
C
<C
C
<C
<C
C
C
C
C
C
C I I
<C I I
C I I I I I I
I I I I I I
I I ···············6······················· o,no"'oino,no~otno~oinoinoino~o.,oinoinohoinoinoinoino~o o~~~m~~~~~~••""~~--o~o--~N~~-·~~~c~~e•Doo ............................ •: ........... . -oooooooooooooooooooooooooooooonoooooooo-
1 I I I I I I t, t I I I I I I I I I I I
476
I I I I I I I I I I I I +ino I ... .,. I ... 111 I ..... i .. .a i .. .,, 1 ...... I ... ,., J.,.N I ··-t ••o I . .., ... I .,., .. I . .., .. I • ..,,o
1 "'.,, !.., ... I . .., .. , I ....... I .... -I +PIO t +NU' !Ne I •N .. J.N., I ·"··· I .. •N• I ., . .., I •NN I •N-I •No I ._.,. I •-c I ·-.. I •-.a I •-in I .... I •-ri I •-N I ·--I •-o I • .,. I • Cl I • .. I • ,0 I • .. I • .. I
• "' I .. N I ... I ... 0 I I I
I I I I I I t t

I I I I I I I I I I I I I I I I I I
I ' I I ' I I I I I I
I I I I
C I I •,no I 1.oa Cl I
I I l.111 C I I I
C . ., ..
I I I
I"' I • .,,o I
C I I • •on I I I
I C I ••• I I I ,. I
I cl I I .. .., I
I .
I C I I •<PN I I I I
I I ct I I .... I I I I I I C I I
•• o I I I I C I • ..,c,a I I I I !..,. I I C I I I I I I I
I I C I I ... , ... I I I I
I clc I ·"''°
I I I .L .. ,,n I I
I cl I I I I ·"'<I
I I I I
1 q . .., ... I I I
z IC I .,.,_
0 I I I I
§ I IC I .... -I I I I
C I •Pl-:>
UJ I I I
a:: I C I •NII'
a:: I cl I 1 ... ., 0 u I I. 0 I Cf ....... I-~;;; I I I
~ I C •NO I .,. I I I
I.!)
~!z I ' C •NIP
UJ I I I .. a:: !t:5 I IC ..... => I ' le UJ a.. I I , ... I .... .., u. > I I I I
...1 I C I 4'NN - t I I I
~ I I Cf ...... I I I I ' ' C I +NO
~ ' I I I ,L ... g, I I I C I
t 1 I I I I
' I I < •-Cl I I I I I 0 I < I ..... 0 I I I I
u I I C I •~--o 0 ! I 0 I I C I •-1111 I I I I I I C I ...... ' I I I I I ., I < I ....... I I I I I
I I I C I +-N I I
I I I < I ·--I I I
I I C ·I ... o
I C I J.. ~ 1 I 1
I C .,
I I
Cl • .. I I I
< I • .., I
Cl • "' I I C ' • .,
I I
I I C • ... I I t
' C I • C\!
I I I C I • I I I I I • 0 I I I I I I I I ' .. I I I I I I ,· I I I I I -----· .....................................................
u o,no,no,nono,noono,no,no,no,noono111to,no,no,no,no~o~o~o,no • oo,.,.~mP.P.,O,O,n,n••~"'NN--000--NN ... ~ •• ~~,o,o .... .,~.,.~o ············~·••011•••······················ "' -oooon~ooooooooooo~cooon~ooooonooooooooo-"' I I I I I I I I I I I I I I I I I I I I
477

on I
c.:, UJ ; u.
~ §
I. "' ldj !t
~ ~ 0 s -
u " 0 C C
I
I I I I
I I I
I C I C I
C
C
C
C
• C
C
C
C I • I
C I 1c C I IC I IC I
1: I IC
-le I IC
le I
C
~
C
C I C 1·
I C I C I
C I
C I I
C I I I C I I
I I C I I C I I
I I C I I I I
C I I I I I I C
I I I I C I I I IC I I
le I I I I I I C I I I I
C I I I I
C I I I C I I
I I C a I 0 I C ' I V I C I I
C I I I
I I I I
I I
I I I
I I I
I I I I I I
I I I I ·······~······················ .............. o~oono~a~oon~onoon~onoonoono,no~oonoon6,no~o~oono~orc o~~GC~~~~~~··~~NN--Ooo--NN~~ •• ~~~~~~~c~~c ......................................... -ooooooooonooo~ooooo~o~eooooonnoonnooo~o-
1 I I I I I I I I I I I I I I I I I I I
478
I I I
I I I I I
I •1110 I ••II' I ..... I ...... I .. .,, I .. ,,, I ••• I ..... I •ctN I ··-I ••o 1.,. I ..... I ...... I .... l .... ,,, 1..,. I ....... 1.., .. J...,_ I • ..,o I •NU' iN• I •N"" I •NW I •N., I ... •N4' I ....... I ...... I •N• I ... ., I ·-· 1-. I ..... I .... I •-111 I ·-· I ._ ... I •-N I ·--I •-o !• CP I • • I • .. I
• ,0 I + Ill I + .. I + "' I • N I + I • 0 I I I I I I I I I I I I

.,.
.s:,.
....... ID
m " I
FIG~E G-6
1TSS1 OAILY EFFECT AUTOC01RELATION Pl.ANT 980
' :I , .. oo • -. ------ ------------------------------.------------------.. -------------. -------------------·------.. -- ----------o .~, • . o· .• ·110, • o.,,. 0,BO t o. ,, • ,), 1;) • ) ,t,5 •. O.t.O t 0, !15 t ·o.5n •-----------A---------------------------------------------------------·-------------------------------0-. 45 t ) • 40 t .o. )5 t 0, 10 • ,.2,. 0,20 t :) , 1.5 t 0. I'> t ~.6'1:~ A A A 4 A 0, Jll .. t -- -- - - -----------A---------------------------------------A-----A-A-A-A-----A-A-A-4-A-A-A-A---A-A•"-A-A-A-A----------
- •>, 'l5 t A A A A A A A A A A -l,·10• A•AAAAA AAA A -0,l'lt A -->~20 t -•l, Z5 • ->. 1') • -o. ,, • -o.•o··· -'l,45 t -·),53 ·--------------------------------------------------· ---------------- ----------------------------------------,> • .,.. • . .
-o •. ,.o • -\). t 5 • -i).10 t -o. 15 t -,> .110. t - o. ,, .. , • - .l. •,o • -0 ,115 t -1. 00 t ----- -- -------------------------------------------------------------- - ----------------------··-- .. ---------
----- -------• -• -• -•-• -· -· -•-•-•-• -•-•-• -•- •-•-•-•- •- •-•-t-•-•-•- t-•-•- •-•- •-•- •- t- t- •- t- •- t-t- t-t-t - ·-· -•-•-•-•··•- ----------·1111111111 a2aaaa22 a I l J l l JJJJll4444 • • • • • • &
o I Z l • 5 6 1 8 9 0 I 2 3 4 I 6 1 U 9 0 l I I 4 I d f 8 ~ 0 I a l 4 5 6 1 8 ~ 0 I 2 l 4 5 6 1 8 ~ 0
V


APPENDIX.H
481

.f::,, CX) N
Nae
Title
Address
Signature
R!SPONSIIL! PERSOH PR!LIHIHARY Dl!F1N1TI0NS AIID INSTRUCTIONS
For the purpose of this survey, the following definitions apply:
Process Wastewater may be defined as any spent water imich results from
or has had contact with the manufacturing process. It includes any
water for which there is a reasonable possibility of contamination from
the process or from rawaaterial-intel'111ediate product-final product
storage, transportation, handling, processing, cleaning, or fire
control. Cooling water and storawaters are considered to be process
wastewaters where they can be contaminated by the process, as in the
case of barometric condenser water and runoff from storage piles.
Non-Process Wastewater is that wastewater which is not contaainated by
the process or related materials. Examples of non-process wastewater - - -- - ·- -- - - - -
include boiler blowdown, surface condenser cooling water, sanitary
sewage, and storm water imich is not contaminated by the process.
A Direct Discharger is considered to be a plant, a manufacturing
process, or an operation which releues treated or untreated process
wastewater into navigable waterways, waters of the contiguous zone, or
the oceans.
The fact that a plant may release process wastewater into a ditch,
culvert, pipe, stream bed, fissure, or similar conveyance located on

t· w
'*:,·· .,.
plant property does not exclude the plant from being a direct discharger
if the wastewater so released eventually enters navigable waters,
An Indirect Discharger is considered to be,a plant, a manufacburing
process, or an operation wich releases process wastewater, treated or
untreated, to a publicly owed treatment works (POTW).
A Self-Contained Discharger is considered to be a plant, a manufacturing
process, or an operation wich releases process wastewater, treated or
untreated, to disposal by spreading on the land, to containment in
evaporation ponds, to a deep aquifer by subsurface injection, to appli
cation on solid waste material which is subsequently burned or disposed
of in a landfill, or other method which does not result in discharge to
navigable w11ter,s, water of the contiguous 2one, oceans, or a POTW,
Navigable Waters are considered to be any surface water bodies not
totally contained on the property of the discharger.
Historical Data is effluent quality data, relating to treated or
untreated wastewater collected for a period of 30 days or longer.
Requests for historical data in this portfolio are for the most recent
12-month period, or 30 days to 12 months if less than 12 months are
available.
According to the definitions above, does operation of your plant or
manufacturing process result in the release of any process wastewater?
Yes No __ _
----
If Yes, according to the definitions above, ,is your plant or manu-
, facturing operation a direct, indirect, or self-contained discharger?
Direct ___ _ Indirect, ___ _ Self-Contained_
'If direct, do you release effluent into the ocean?
Yes ___ _ No __ _
If your plant is a direct discharger, do you have an NPDES discharge
permit issued by a state and/or regional EPA office?
Yes No. ___ _
If yes, enclose a copy of the permit, Also identify municipal, county,
or regional regulations which control discharge from your plant, if any.
Then complete Parts One, Two, Three, Four, and Five and retur,n.

..i::,. 00 ~
l f your plant ia a direct diacbarger and does not nave an NPDES
discharge permit, do you have a,n application for auch a permit pending
before a state and/or regional EPA office?
Yea. ___ _ Ho __ _
lf Yes, provide the location of the state and/or regional EPA office
where the application is on tile. __________________ _
If your plant is a direct discharger and does not have an NPDES
discharge permit, do you have historical data on the quantity and/or
quality of your raw process wastewater.and/or your treated process
wastewater?
Yes ---- No __ _
If your plant is an indirect discharger, do you pretreat the raw
wastewater prior to discharge into the sewer!
Yes--- No ---
If your plant is an indirect discharger, do you have historical data on
the quantity and quality of your raw process wastewater and your treated
process wastewater?
Yes ___ _ No ---
Indirect dilcbargera: Identify the namea, location, and local
governi:ient office responsible for the publicly 01111ed treatment '1/0rka to
which you discharge.
Indirect dischargers: Identify specific pretreatment requirements
(other than feder~l) or limits upon pollutant parameters imposed by the
POTW system to which you discharge,
If your plant is a self-contained ~i'!_c:harger, i..ndicate .method -of
effluent release.
___ Land disposal
___ Containment in ev:aporation ponds
___ Subsurface injection
___ Spray on solid waste and incinerate
___ Spra_y on solid waste and landfill
Other (Specify) _________________ _

,.i::,.. ,oo u,
If your plant is a self-contained discharger, do you pretreat the raw
wastewater prior to effluent release to dis;;osal?
Yes ___ _ No __ _
-,, - :rf your pla~t is a self-contained discharger, do you have historical
data on the quantity and/or quality .of your raw process wastewater
and/or your treated process wastewater?
Yes ____ _ No __ _
Self-cvntained dischargers: Identify specific ·requirements:, conditions,
or limi.ts upon pollutant parameters imposed upon your effluent disposal
system by local or state pollution control authorities. Also identify
the local or state regulating office or authority.
The person who should be contacted concerning your response to this
letter is:
Name
Title
Address
Telephone ______________________ _
PART ONE
SUBCATEGOR!ZAXION CHECKLIST
The .following is a list of· manufacturing processes or operations which
are associated with the Timber Products Processing Category, Please
identify those processes or operations which occur to· your plant by
placing an "X" in the appropi;iate space. Check all appropriate
·_responses,
___ Timber Harvesting Operations_
___ ·'_' Logging camps
___ Transportation of logs by truck
___ Transportation of logs :by rail
___ Transportation of logs by ship or barge'-
___ Transportat_fon by log rafts floating directly in the water
Other (specify) ___________________ _
__ Raw Materials Storage
___ Log storage by dry land deck
___ Log storage by wet land ·deck
___ Log storage, pond (self contained)
___ Log storage,· pond (flow-through)
___ Log storage in estuary, river, or other large publicly-owned
body.of water.
_ __ Fractionated wood (chip piles, et~.)
Other (specify) ___________________ _

~ 00 0\
___ !arking'Operation1
___ Mechanical debarkere
___ Hydraulic clebarker•
___ Other (apecify) _________________ _
___ Log Washing
Describe the process used, _________________ _
___ Sawmills and Planning Mills
___ General lUl!lber production
___ Hardwood dimeneion and flooring
___ Specialty sawinills (specify) _____________ _
_----__ ,MUlwork -
Describe the type of millwork performed, __________ _
___ Veneer Production
Hardwood veneer
___ Softwood veneer
___ Steam or hot water conditioning of logs in preparation for
veneering
___ Other (specify) __________________ _
___ -Plywood Productio,n
__ Softwood plywood
___ Hardwood plywood
___ Softwood core with hardwood face
_ __ Hardboard or particleboard core with hardwood face
___ Other (specify) __________________ _
_ __ Wood Container Production
___ Nailed wooden boxes
___ Wireboard boxes and crates
___ vaneer and plywood cont~iners
___ Cooperage
___ - Other (specify) __________________ _
_ __ structural Wood Members and Wood Laminates --· - ----- -
Mechani:cal fasteners used
___ Nonwater soluble adhesives used
_ __ Water soluble adhesives used
___ Other (specify) _ _:;. ________________ _
_ __ Finishing Operations (followng edging or trilDlling)
___ Kiln drying
___ Planning
___ Dipping
___ End coating

·$,, 00 ......
. Moisture proofing
___ Steinir.g or painting
___ Machining~ general
·?abrication using water· soluble adhesives
!•brication using nonwater soluble adhesives
Molded wod products
Other (specify) __________________ _
___ Wood Preserving
___ Sten.conditioning
___ Boultonizing Process
FCAP treatment
___ Vapor drying methods
___ Creosote treatment
___ Pentachlorophenol treatment
___ Tre°atment with CCA, ACA, ACC, CZC, or other salts
Fire retardants
Other (specify). ________________ ....,. __
~rdboard Prod~tion (density greater than 31 lbs/cf)
___ Dry felting - dry pressing
___ Dry felting - wet pressing
___ Wet felting - wet pressing
___ .Wet felting - dry pressing
___ O.ther (specify). __________________ _
___ Insulation Board Production (density less than 31 lbs/cf)
___ Mechanical pulping and Tefining only
___ Thermo-mechanical (ste11111) pulping and refining
___ Chemical or aemichemical pulping
___ Hardboard production at the same facility
Other (specify). __________________ _
Particleboard or Flakeboard Production
~t forced
Extruded
Other (specify) __________________ _
___ Wood Furniture and Fixture Production
With water wash spray booths
~ith on-site la~ndry facilities
Without either ·of the above
___ Other (specify) __________________ _
_ __ Manufacturing operations related to, but not '-included in the
timber products processing category
___ Pulp and paper production
Charcoal production
___ Gum·and·wood chemicals manufacture
___ Production of.wood preserving chemicals
_ __ Other (specify). ________ _.;. _________ _

.j::,, (X) (X)
PART IWO
DESCRIPTIOII OF PLAIIT OPERATIOIIS
(This information ia required for each proceu identified in Part ·0ne,
Subcategorization Checklist, u pertaining to your plant. List answers
by number on a aepar~te aheet.)
l. List the date the plant was bui_lt and the date major process
equipment was installed. Also list the dates of any rebuilds,
renovations, or modification of major process eqipment or
eJtpans ions.
2. Give the location of the plant •
3. List the design capacity for each process or product produced
(including byproducts, if any). State the basis used in reporting
the design capacity. If the basis is other than in weight or mass
units (pounds, tons, kilograms), indicate the density of the
finished product (use Attachment I).
4. Provide the approximate tons/day of raw materials and additives.
State whether the tons/day are reported on a dry or wet basis. If a
wet basis is used, estimate the percent ,moisture contained in the
raw material. For wood, specify the type (softwood or hardwood),
sp.ecies, and form (roundwood, chips, veneer, etc.). For mineral or
If your plant prO<lucea a product or conducts a manufacturing proceu or . o,pentfon \obich ia not listed above, please identify •

.,:a (IC) \0
chemical additives, give sufficient information to completely
identify the material (i,e,, phenolic resin, 10 tons/day), point of
addition,~ reason for uae. Por solutions, state the voluae and
concentration (i.e., ferric chloride, 1 percent solution,
500 gal'longa/day); · For trade name chemicals ·or additives, . state
trade'naine, amount uaed'per day, point of '.addition,· and reason· for·
· use (use Attachment U).
Si Provide a .schmatic diagram of the procesa or operation. Indicate on
this diagram; a pencil drawing will be sufficient, showing a thru e:
a. Each point where materials and additives listed in 4 above,
enter _the process.
b. 'l'he location of each point where fresh water from an external
source is applied to the process anc1· the approximate flow rate.
of this water,
c. Each proc·ess ••tewater streua with approxi!aate flow rates and
destinations.
d. Bach proceu water recycle stream. Be sure to indicate the
-aource, destination,· and approxillate fl.,.;. rates of each recycle
stream,
e. 'l'he point where any nonprocess was~ewater at ream is mixed with
any process .. tewater iltre-. Also indicate the so':'rce and
approximate flow rate of this co11111ingled nonprocess wastewater,
6, For each 4!l'ternal source of ~reah water applied to the syatem, list
the ~ource (municipal, dver-; wells or property, etc,) of this water
and the quality, if known, If any external water source ,require•
treatment prior to application to the system, describe the water
treatment system, If the water treatment syatea reaults in the
production of a waate stre- or sludge, estimate the flow rate or
volume and the quality of this waste stream,
7, · List all solid waste produced by the process, the source.of. the
wastes, approximate tons/day, and the method of solid .. te
diaposal.
8, Por each proceH .. tewater stream ind:u:ated in 5,c above, state.
whether the approximate flow rate pr;,,,ided is constant or flu_ctuates
·during plant operation, Estimate the range o·f variation in any
fluctuating wastewater stream and explain what cauaea the
variation,

,Ila l;0 0
PAKT l1IUE
IIASflllATIK aL\RACTllRIZATIOII AIID 1lfAH!IIT OR
PRSTRIATH!iNT SYST&H DrFO'iUIATIOH
(This information ie required for each process identified in Part One,
Subcategorization Checklist, aa pertaining to your plant, Lht answers
by nunber on a separate 1heet,)
1. Describe the wastewater treatment or pretreataent facilities for
each process. The.following information is requested:
a. Type, oize, and design basis (both hydraulic and pollutant
loading) for each unit in the system (i.e., aerated lagoon,
15,000 ft3, 1,0 mgd, and 30 lb BQo/ft3/day peak flow;
0.5 mgd, and 15 lb BOD5/ft3/day normal flow) (see
Attachment III).
b. A schematic diagram of the wastewater treatment r pretreatment
facilities, Identify all wastewater streams treated by each·
unit. Indicate on this diagram sampling points for which
historical data are available.
·-c·.- Amount· of· ·walit"e 'sTtiage· produced;- in pounds ·and cubic yards per
day, week, or month, State method of sludge disposal. If
sludge transported off the premises for disposal, indicate the
distance to disposal site. Include sludge disposal costs, in
detail. Estimate the annual energy requirements of KWH, or
other standard energy units of the wastewater treatment or
pretreataent syatea, If thi• information la unavailable, .,at the
total installed hor1epowe~ for effluent treat111ent or pretreatment
ayatema,
2. Report the monthly production of each product produced during the
ao1t recent 12-month period for which this data i1 available. If
daily or weekly production figures are kept include thea. State
basis used for all production figures (please indicate if you want
this information kept confidential.) (Use Attachment IV).
3. For the same 12-month period for which product.ion data is provided,
provide the daily monitoring data for the raw process wastewater
and the treated final effluent from the plant. Parameters of
interest are fJow rate, BOD5, COD, TOC, TSS, phenol, heavy ·
metals, and any of the toxic substances listed in Part Four or. this
letter for which data are available. If the combined raw process
wastewater reported contains nonprocess wastewater, estimate the
flow rate and BOD5, COD, TOC, TSS, phenol, and toxic substance
~oncentrat.ions. .. af_ .this-- noni>roeess wastewater; ··Al1ro,- ·c-o-mp!et"e- ·
Attachments V and VI.
4. For the 12"1110nth period used ip reporting 2 and 3 above, report (or
estimate) the total energy requirements of the production process.
Report_:!!! energy requirements in KWH, gallons of fuel oil (state
type of oil), SCF of natural gas (state heating value/CF) solid
fuel, etc.

I
~ 1.0 .....
5. Describe the type and frequency of sampling conducted to obtain the
data in Items 3 and 4 [i.e., weekly grab samples, daily flow
proportioned samples, week•ly time ;coinposi,tes (1 hour duration,
samples,????)] that sampling points are marked on the diagram of
the treatment system. State the methods used to analyze the
reported data, give references for Standard Methods, and describe
any nonstandard methods. State whether or not acclimated seed is
used in BOD analyses.
6. If air pollution abatement equipment in your plant results in the•
production of wastewater, estimate flow rate,, BOD5, COD, TOC,
TSS, phenols, ,and toxic substances in this wastewater stream.
7. Describe and fully explain 'any. in-process technology used to reduc;e
pollution discharges for liquid and solid waste (e.g., housekeeping
pr·actices, Wa.ter streams recycled, conversion of wastes into
by-products).
8. Describe any methods or devices used to reduce or contain leaks of
process water and spills during the manufacturing process. If a
major leak or o~erflow occurs ,in the process, what is the fate of
the res,ulting wastewater? Do' you have a spill 'prevention and
control plant (SPCC) on file? If so, please furnish ,a copy,
in ,•ding logs or descriptions of past spill occurrences and the
act. ,t> ,caken.
9. , Discuss seasonality effects on operations, waste load generation,
treatment effectiveness, etc. Provide documentation, if
available.
10. Are you conducting, or have you conducted in the past J years, any,,
of the following for water pollution abatement.
a. Pilot Studies
b. Process Modifications
C •
d.
Treatment System
Improvements
Grants
Yes No
If.answer is yes to any of the above, give details.
11. Are additional end of plpo treatment modules or modifications being
planned in order to enable your plant to• meet July 1, 1977 (BPT)
guidelines? If so, give details and estim~ted costs. Report only
those faci,lities which are planned to be on-line by July 1977,
Yes ___ _ No __ _

PAAT J'OUlt
TOXIC CHEMICAL C!l!CICLIST
The following is a list of pollutant• identified by the EPA as
potentially toxic compounds. Indicate by placing an ''X1'1 in the
appropriate apace which, if any, of these pollutanta, to your knowledge,
are used or generated in your plant. For each of the pollutants
identified u uaed or generated in your p~ant, also provide the
following information (use Attachment Vll).
1. The quantity and frequency of use.
2. Identify the proceH or operation in which the substance is used or .P,· \Q generated • N
3. Whether it is known if the substance is discharged from the plant
(this includes direct and indirect discharges).
-4. The quantity of each substance discharged u liquid, gaseous, or
solid waste, if known.
5. Toe frequency with which such discharges occur, i.e., continuously
or intermittently (weekly, hourly, etc.), if known.
6. The aaplias or aonitoriag prost'a fo,r each polluhnt, if any.
It ~hould be noted that uny plant• my be 1111in,g quantitiea of the
listed chemical• u additivee, cleaning aolution, or aolventa which
are purchased and referred to by a trade name. All trade nae
chemical• ueed in the plant should be surveyed to detenaine if they
contain aubatancea liated below. List all wood preservative, fire
retardants, fungicides, and 11ildewcidea used in the plant. Liat by
generic nue (creosote, CCA, etc.), if known. If generic nae ia
unknown, list by trade nuie.
___ Acenaphthene
Acrolein
___ Acrylonitrile
,Benzene
_Benzidine
Carbon Tetrachloride (Tetrachloromethane)
Chlorobenzene
___ 1,2,4-trichlorobenzene
Hexachlorobenzene
___ 1,2-dichloroethane
___ 1, 1, 1-trichl:oroethane
Hexachloroethane
___ 1,1-dichloroethane
___ 1,1,2-trichloroethane

~ 'O w
___ 1,1,2,2-tetrachloroethane
___ Chloroethane
___ Bis(chloromethyl) Ether
___ Bis(2~chloroethyl) Ether
_._.· __ 2'..chlor~ethyl '.'vinyl Ethel' (Mixed)
___ 2-chloronaphthalene
___ 2 ,4, 6-trich lor'~phenol
. ___ Panachlorometa Cresol
___ Chioroform (Trichloromethane)
____ 2-chlorophenol
___ l ,2-dichlorobenzene
___ 1,3-dichlorobenzene
___ l,4-dichlorobenzene
___ ._3,3 '~ichlorobenzidine
___ ._i, 1-dichloroethylene
_____ 1-2,-trans-dichloroethylene
_· ___ 2,4-dichlorophenol
___ 1,2-dichloropr~pane
___ 1,3-dichloropr~pylene (1,3-dichlor~propene)
___ 2,4-dimethylphenol
___ 2,4-dinitrotoluene
___ Z,6-dinitrotolue~e
· ___ 1,2-diphenylhydrazine
___ Ethylbenzene
Fluroanthene
___ 4-chlorophenyl Phenyl Ether
___ 4-bromophenyl Phenyl Ether
___ Bis(2-chloroisopropyl) Ether
___ Bis(2-chl~roethoxy) Methane
___ Methylene Chlor,ide (Dichloromethane) _
___ Methyl ,Chloride (Chloromethane)
___ Methyl. Brom_ide (Bromomethane)
___ Bromoform (Tribromomethane)
___ Dichlorobromomethane
Trichlorofluoromethane
Dichlorodifluoromethane
___ ,_Chlorodibromomethane
1 Hexachlorobutadiene
· ___ Hexachlorocyclopentadiene
___ Is.ophorone
___ Naphthalene
Nitrobenzene
·---·-. 2-nitrophenol
___ 4-n~trophenol
___ 2,4-dinitrophenol
___ 4,6-dinitro-o-cresol
___ N-nitrosodimethylamine
N-nitrosodiphenylamine --- i' ' t
___ N-nitrosodi-n-propyl~mine
___ Pentachlorophenol

i
__ Dieldrbi
___ ailordane (Technical Mixtu,re md "Metabolite.)
___ 4,4'-DDT
___ 4,41-DD!(p,p1-DDX)
___ 4,4 1-Dl>D(p,p 1-TI>!)
___ alph-!ndo1ulf1111
___ beta-!ndo1ulfan
___ !ndoaulfan Sulfate
___ Endrin
___ Endrin Aldehyde
___ Baptachlor
___ Heptachlor !xpoxide
___ alpha-BBC
___ beta-BBC
___ g-a-BRC (Lind1111e)
___ delta-BBC
__ PCB-1242 CArochior 1242)
___ PCB-2)54 (Arochlor 1254)
___ Touphene
___ Anti-y (Total)
___ Ar1enic (Total)
___ Asbeato1 (Fibrou)
___ Berylli1111 (Total)
___ Clchaiua (Total)
___ Chr011i1111 (Total)
___ !benol
___ Bi1(2-ethylhexyl) Phthalate
___ Butyl Beiu:yl Pbthalate
___ Di-11-bu,tyl Phthalate
___ Diethyl Phthalate
___ Diaethyl Pbthalate
___ 1,2-benzuthraceue
___ Benzo (a)pyrene (3,4-benzopyreae)
___ 3,4-benaofluoranthene
___ 11,12-benzofluoranthene
___ Chryaene
___ Acenaphthylene
___ Anthracene
___ 1,12-beuzoperylene
___ Fluroene
___ Pheaanthrene
___ 1,2:5,6-dibenzanthracene
___ Indeno(l,2,3-C,D)pyrene
. ___ Pyreae
___ 2,3,7,8-tetrachlorodibenzo-p-dioxia (TCDD)
___ Tetrachloroethylene
___ Toluene
___ Trichloroethylene
___ Vinyl Chloride (Cbloroetbylene)
___ Aldrin

j;
.p, \0 u,
___ Copper (Total)
___ Cyanide (Total)
___ Lead (Total)
. ___ Mercury· (Total)
___ Bicket (Total)
___ Seleniwi,·(~otal)
___ Silver (Totat>
___ 'lballi...; (Total)
Zinc (Total)
ATTACHMENT I PART TWO QUESTION 3.
PRODUCT OR PROCESS
GENERAL LUMBER
.HARDWOOD DIMENSION AND FLOORING
SPECIALTY SAliMILLS
MILLWORK
'VENEER
PLYWOOD
WOOD CONTAINERS
STRUCTURAL MEMBERS :AND LAMINATES
WOOD PRESERVING
HARDBOARD
INSULATION BOARD
PARTICLEBOARD
WOOD FURNITURE
DESIGN UNITS OF MOISTURE DENSITY UNITS OF CAPACITY CAPACITY ~ (if Applicable) DENSITY
---
------ ---
------
------
------ --- ------- ------ ------ ------ ---

AtTACIIH!IIT II PART 'IIIO
QIJl!STIOH 3,
PlmJC:l'atPRn,;5 RNl K\I'ERL',Uj
<m!&\I.IUIEt
HARIMXDDIM!NSIOO ml R.CXlUlG
SPEx:rAL'lY sm,m.rs
Mlll..'!!lK
VENml
PIXlml .J:>, 1.0 en
lrol <nm\Il£RS
S'Il!IJClUAAL !elB88S
Am lAllNll1'ES
lrol j?RllSEIMN'.:
HARillnlRD
Il&JIJITTOO ro\RD
PAl!l'ICI1!1WlUJ
lrol FUmmURE
% KlIS'lllRE A1DITMS ~
---
------------
---
------
---------
AlTACHMEIIT III PART TIIRl!E QUESTIOH 1,
WASTEWATER TREAnt!h"T PROCESS
SCREENING
FILTRATION
BIOLOGICAL,
ANAEROBIC
AEROBIC
Dl!SIGH BASIS AND SIZE
ACTIVATED SLUDGE _________________ _
TRICKLING FILTER ------------------EVAPORATION
SPRAY IRRIGATION
OTHER
YEAR CONSTRUCTED

KflAf1WBl IV PARr 'IllREE ~CN2.
ATTACHMENT IV PART THREE QUESTION 3.
·MlillllLY PRJDIJCITCN (In:licate M,nt:h :in Parent:heses)
lb1!:h .1 ~bath 2 !t:mth 3. lt:mth 4 lt:mth 5 M:ml:h 6 Month 7 Month 8 Month 9 Month 10 Month 11 _< __ ) _( __ ) _( __ )_( __ )_( __ ) _( __ )_( __ ) _(_•_) _< __ )_( __ ) ( )
-· --- --- . --- . --- --- --- ---- -----
'~
TREATED PROCESS W~SJE _,LC;'ADS DISCHARGED
Corporation----------------'--------Plant -------------------------Discharge Point---,---·
Month 12 ( )
Units-of Production
Do you post~chlorinate this effluent? ·Yes No If yes,, do .. you· ch.lorinate? ___ (A) ,Full-time ___ (B) Part-time
Time period represented_-'--'---'--'-------'--'-----
. Daill Calendar
Monthly Averages Parameter (Provide
Mini~um Long Term
Information Available) AveraS:e Maximum Minimum Maximum Remarks
Flow (MGD) ph (ph Units)- ---Temperature (°C)--Wastewater ---Temperature (°C)--Ambient .Air BOD1_ (lbs/day)
COD (lbs/day)
TOC (lbs/day) TSS (lbs/day)
TDS (lbs/day) NHl as N (lbs/day) TKN as N (lbs/day) Phenol (lbs/day)
Significant Metals (Identify). (lbs/day) (lbs/day) (lbs/day) (lbs/day)
'. ,, ,, . ' . . .
,,
Others (Identify) (lbs/day) --- --- ---(lbs/clay) (lbs/clay).
497

~ \0 00
.. C ;,,
8 ~ i ~ .., ~ 2 Cl 0 :ll Q ~
"' "' w .. ~
"' 0 0 w
m .... 0 ...
ATTAC\IM!ll'I IV PMT lllU! QU!STIO!f 2.
WASTE LOADS TO TREATMENT FACILITIES.
Corporation ___________________ _
Pl1mt ______________________ _
Wastewater Source(a) _______________ _
Time Period Represented ______________ _
Parameter (Provide Information Available)
Flow (MGD) 0
ph ( ph Units) Teaperature (°C)-'llastewater Tmnperature (°C)--hllbient Air BODS (lbs/day) COD-(lbs/day) TOC (lb9/day) TSS (lbs/day) TDS (lbs/day) NH3 as N (lbs/day) TKN as N (lbs/ day) Phenol (lbs/day) Significant Metals (Identify) _________ (lbs/day) _________ (lbs/day) _________ (lbs/day) _________ (lbs/day)
Others (Identify) _________ (lbs/day) _________ (lbs/day) _________ (lbs/day)
Dailx: Long Term
~ Average Maximum
Calendar Monthly Averages
Minimum ~ Remarks