Evaluating South Africa’s Post-Apartheid Democratic Prospects through the Lens of Economic...
40
EVALUATING SOUTH AFRICA’S POST-APARTHEID DEMOCRATIC PROSPECTS THROUGH THE LENS OF ECONOMIC DEVELOPMENT THEORY Jonathan L. Marshfield * ABSTRACT Political scientists have identified compelling correlations be- tween economic development and democratic stability. In general, the wealthier and more developed a country, the greater its chances of maintaining a long-term, stable democracy. This Article evaluates whether South Africa’s post-apartheid economic conditions are trend- ing towards conditions that generally correlate to stable democracies. It compares South Africa’s post-apartheid economic conditions to the empirical trends that development theorists have identified as correla- tive to democratic stability. This analysis is important because if South Africa’s post-apartheid economic conditions do not exhibit positive trends, this may suggest that despite the just end of apartheid, condi- tions are becoming progressively more difficult for South Africa to maintain a democratic government. The Article finds that South Af- rica is exhibiting positive trends in relevant criteria such as levels of per capita income, education, urbanization, industrialization, and cumula- tive economic growth. The one exception is income inequality, which has remained constant and extremely high since the fall of apartheid. The Article reveals, however, that there have been various qualitative improvements in the nature of income inequality since the end of apartheid, which suggests that necessary quantitative improvements may be on the horizon. With that one notable caveat, the Article con- cludes that South Africa’s democratic prospects appear bright when viewed through the lens of economic development. * LL.M. New York University School of Law (2010); J.D. Rutgers University School of Law (2006); B.A. Cedarville University (2002). The author was a resi- dent of Durban, South Africa from 1982 to 1998 and is also the author of Authoriz- ing Subnational Constitutions in Transitional Federal States: South Africa, Democracy, and the KwaZulu-Natal Constitution, 41 VAND. J. TRANSNAT’L L. 585 (2008). 431
Transcript of Evaluating South Africa’s Post-Apartheid Democratic Prospects through the Lens of Economic...

EVALUATING SOUTH AFRICA’S POST-APARTHEIDDEMOCRATIC PROSPECTS THROUGH
THE LENS OF ECONOMICDEVELOPMENT THEORY
Jonathan L. Marshfield*
ABSTRACT
Political scientists have identified compelling correlations be-tween economic development and democratic stability. In general, thewealthier and more developed a country, the greater its chances ofmaintaining a long-term, stable democracy. This Article evaluateswhether South Africa’s post-apartheid economic conditions are trend-ing towards conditions that generally correlate to stable democracies.It compares South Africa’s post-apartheid economic conditions to theempirical trends that development theorists have identified as correla-tive to democratic stability. This analysis is important because if SouthAfrica’s post-apartheid economic conditions do not exhibit positivetrends, this may suggest that despite the just end of apartheid, condi-tions are becoming progressively more difficult for South Africa tomaintain a democratic government. The Article finds that South Af-rica is exhibiting positive trends in relevant criteria such as levels of percapita income, education, urbanization, industrialization, and cumula-tive economic growth. The one exception is income inequality, whichhas remained constant and extremely high since the fall of apartheid.The Article reveals, however, that there have been various qualitativeimprovements in the nature of income inequality since the end ofapartheid, which suggests that necessary quantitative improvementsmay be on the horizon. With that one notable caveat, the Article con-cludes that South Africa’s democratic prospects appear bright whenviewed through the lens of economic development.
* LL.M. New York University School of Law (2010); J.D. Rutgers UniversitySchool of Law (2006); B.A. Cedarville University (2002). The author was a resi-dent of Durban, South Africa from 1982 to 1998 and is also the author of Authoriz-ing Subnational Constitutions in Transitional Federal States: South Africa,Democracy, and the KwaZulu-Natal Constitution, 41 VAND. J. TRANSNAT’L L. 585(2008).
431
432 RICHMOND JOURNAL OF GLOBAL LAW & BUSINESS [Vol. 9:4
TABLE OF CONTENTS
INTRODUCTION . . . . . . . . . . . . . . . . . . . . . . . . . . . . . . . . . . . . . . . . . . . . . . 433I. BASIC ASSUMPTIONS, QUALIFICATIONS, AND
METHODOLOGY . . . . . . . . . . . . . . . . . . . . . . . . . . . . . . . . . . . . . . 435II. MODERNIZATION AND DEVELOPMENT THEORY . . . 437
A. S.M. Lipset’s Thesis, Methodology, andConclusions . . . . . . . . . . . . . . . . . . . . . . . . . . . . . . . . . . . . . . . . . 438
B. Relevant Contributions by Adam Przeworski, et al. . . 440C. Income Equality as a Condition of Democracy . . . . . . . 442D. Crafting an Approach Suited to Evaluating South
Africa’s Democratic Prospects . . . . . . . . . . . . . . . . . . . . . . . . 4451. Step One: Przeworski’s Income-Based Probability
Calculations . . . . . . . . . . . . . . . . . . . . . . . . . . . . . . . . . . . . . 4462. Step Two: Lipset’s Background Conditions . . . . . . 4463. Step Three: Income Inequality . . . . . . . . . . . . . . . . . . 448
III. EVALUATING SOUTH AFRICA’S POST-APARTHEIDECONOMIC DATA . . . . . . . . . . . . . . . . . . . . . . . . . . . . . . . . . . . . . 449A. Applying Przeworski’s Income-Based Probability
Calculations . . . . . . . . . . . . . . . . . . . . . . . . . . . . . . . . . . . . . . . . 449B. Post-Apartheid Trends Regarding Lipset’s Back-
ground Conditions . . . . . . . . . . . . . . . . . . . . . . . . . . . . . . . . . . 452C. Income Inequality in South Africa . . . . . . . . . . . . . . . . . . . 456
1. Applying Przeworski and Boix’s Findings . . . . . . . . 4572. Toward A More Sophisticated Understanding of
Income Inequality and Democratic Stability inSouth Africa . . . . . . . . . . . . . . . . . . . . . . . . . . . . . . . . . . . . 459
CONCLUSION . . . . . . . . . . . . . . . . . . . . . . . . . . . . . . . . . . . . . . . . . . . . . . . . 462APPENDIX 1.1: PER CAPITA INCOME (ARGENTINA) . . . . . . . 463APPENDIX 1.2: PER CAPITA INCOME (SOUTH AFRICA) . . . 464APPENDIX 2.1: INDICES OF INDUSTRIALIZATION . . . . . . . . 465APPENDIX 2.2: INDICES OF INDUSTRIALIZATION
(CONT.) . . . . . . . . . . . . . . . . . . . . . . . . . . . . . . . . . . . . . . . . . . . . . . . . 466APPENDIX 2.3: INDICES OF INDUSTRIALIZATION
(CONT.) . . . . . . . . . . . . . . . . . . . . . . . . . . . . . . . . . . . . . . . . . . . . . . . . 467APPENDIX 3: INDICES OF URBANIZATION . . . . . . . . . . . . . . . . 468APPENDIX 4: INDICES OF EDUCATION . . . . . . . . . . . . . . . . . . . . 469APPENDIX 5: INDICES OF WEALTH . . . . . . . . . . . . . . . . . . . . . . . . 470

2010] POST-APARTHEID DEMOCRATIC PROSPECTS 433
INTRODUCTION
Emerging democracies are notoriously fragile, especially in Af-rica. One commentator has estimated that in any given year since thedecolonization of Africa, there have been at least twenty ongoing civilwars.1 Each of these conflicts is complex in its own right, but there arerecurring trends contributing to the instability of democracies in Af-rica. Ethnic division, vestiges of colonial exploitation, abusive govern-ment, and abject poverty seem to plague the continent.2 South Africa’shistory under apartheid exhibits many of these unfortunate character-istics. South Africa does, however, stand apart from the trends in atleast one important criterion: wealth.
South Africa is rich in natural resources. Unlike most othercentral and southern African countries, South Africa also has a well-developed infrastructure that was not destroyed during the transitionto democracy.3 South Africa has also maintained a capitalist-basedeconomy and negotiated a reasonable continuity in property rights(unlike many African countries that transitioned to democracy duringthe height of the Cold War and were embroiled in extreme post-revolu-tion redistribution plans).4 These factors, combined with the lifting ofinternational sanctions, resulted in an influx of foreign investment im-mediately following the demise of apartheid.5 Thus, relative to otheremerging democracies in Africa, South Africa’s economic prospectswere bright when it transitioned from apartheid.6 Indeed, in 1994, theyear of the country’s first democratic election, South Africa was the
1 Larry Diamond, Building a Democratic Africa, HOOVER DIG., July 30, 1998, at116, available at http://www.hoover.org/publications/digest/3532546.html.2 Id.3 See John Daniel, Jessica Lutchman & Sanusha Naidu, Post-Apartheid South Af-rica’s Corporate Expansion into Africa, 31 REV. AFR. POL. ECON. 343 (2004).4 Id. at 343 (discussing South Africa’s positive economic conditions followingapartheid as compared to other cold-war era transitions to democracy). A classiccounter-example to South Africa’s positive economic conditions and policies is theunfortunate plight of Zimbabwe under President Robert Mugabe. See Edward A.Brett, From Corporatism to Liberalization in Zimbabwe: Economic Policy Regimesand Political Crisis, 1980-97, 26 INT’L POL. SCI. REV. 91 (2005) (explaining thenature, extent, and effects of Mugabe’s property redistribution polices). For ahelpful discussion of how South Africa’s economic and redistribution policies im-mediately following apartheid helped to facilitate economic growth, see LeslieBoyd, Michael Spicer & Gavin Keeton, Economic Scenarios for South Africa: ABusiness Perspective, DAEDALUS, Winter 2001, at 71.5 Boyd et al., supra note 4, at 74-76.6 See Daniel et al., supra note 3, at 343. However, for a more pessimistic accountof South Africa’s economic conditions in 1994, see Boyd et al., supra note 3.
434 RICHMOND JOURNAL OF GLOBAL LAW & BUSINESS [Vol. 9:4
sixty-second wealthiest nation in the world, and one of the wealthiestnations in central and southern Africa.7
These positive economic conditions tell us a great deal aboutSouth Africa’s chances of maintaining a stable democracy. Ever sinceS.M. Lipset identified a correlation between economic developmentand democratic stability, development theorists have sought to moreprecisely understand the relationship between democracy and develop-ment.8 These theorists have identified some compelling aggregatetrends. Adam Przeworski, for example, has concluded that “no democ-racy ever fell, regardless of everything else, in a country with a percapita income higher than . . . $6,055.”9 Other theorists have identi-fied strong correlations between democratic stability and levels of edu-cation, urbanization, industrialization, economic growth, and incomeequality.10
This Article evaluates whether South Africa’s post-apartheideconomic conditions are trending towards conditions that generallycorrelate to stable democracies. The goal is to compare South Africa’spost-apartheid economic conditions with the empirical trends that de-velopment theorists have identified as correlative to democratic stabil-ity. If South Africa’s post-apartheid economic conditions do not exhibitpositive trends, this may suggest that despite the just end ofapartheid, conditions are becoming progressively more difficult forSouth Africa to maintain a democratic government.
I begin by reviewing relevant findings by development theo-rists and organizing those findings into a systematic approach thatcan be used to evaluate post-apartheid South Africa. I then presentand analyze post-apartheid economic data pursuant to this approach.I conclude that South Africa has exhibited positive trends in almost allrelevant background criteria except income inequality, which has re-mained relatively constant and extremely high since the fall ofapartheid. However, a closer analysis of income inequality shows that
7 These comparisons are based on data from the Penn World Tables 6.2. Compari-sons are based on Real GDP per capita (Constant Prices: Laspeyres, in 2000 U.S $Constant Prices). See Alan Heston, Robert Summers, Bettina Aten, Penn WorldTables 6.2, http://datacentre2.chass.utoronto.ca/pwt/ (last visited Dec. 17, 2009)(data report on file with author).8 Lipset first posited this correlation in Seymour Martin Lipset, Some Social Req-uisites of Democracy: Economic Development and Political Legitimacy, 53 AM. POL.SCI. REV. 69 (1959).9 Adam Przeworski & Fernando Limongi, Modernization: Theories and Facts, 49WORLD POL. 155, 165 (1997).10 See, e.g., CARLES BOIX, DEMOCRACY AND REDISTRIBUTION (2003); Seymour Mar-tin Lipset, The Social Requisites of Democracy Revisited: 1993 Presidential Ad-dress, 59 AM. SOC. REV. 1 (1994).

2010] POST-APARTHEID DEMOCRATIC PROSPECTS 435
although levels of inequality have not changed, the nature of inequal-ity has changed dramatically.11
Inequality under apartheid was race-based, enforced by law,and funded by the elites’ exploitation of immobile assets such as valua-ble minerals. Since the fall of apartheid, previously disenfranchisedgroups have obtained ownership of a large portion of the country’swealth. Additionally, South Africa’s economy is trending away fromits historic dependence on mining towards mobile assets that are moreconducive to the development of a middle class. These changes sug-gest that there has been qualitative progress regarding inequalitysince the fall of apartheid. Thus, although the empirical findings ofdevelopment theorists suggest that South Africa’s high level of incomeinequality poses a serious threat to democratic stability, I concludethat South Africa’s qualitative progress in this area suggests thatquantitative improvements may be on the horizon. Nevertheless, fromthe standpoint of development theory, income inequality represents areal threat to prolonged democratic stability in South Africa. Withthat one caveat, however, South Africa’s democratic prospects appearbright when viewed through the lens of development theory.
Part I of this Article outlines the study’s basic methodology andassumptions. Part II provides a critical review of the statistical find-ings of development theorists and organizes those findings into a sys-tematic model that can be used to evaluate South Africa’s post-apartheid economic data. Part III presents and analyzes South Af-rica’s economic data pursuant to that model. Part III also conducts aqualitative analysis of income inequality in post-apartheid South Af-rica and provides an overall assessment of South Africa’s democraticprospects.
I. BASIC ASSUMPTIONS, QUALIFICATIONS, ANDMETHODOLOGY
Some preliminary qualifications and stated assumptions arenecessary. First, the purpose of this Article is to place South Africawithin the broader context of the aggregate trends and probabilitiesidentified by development theorists. I do not claim that South Africa’sdemocracy must satisfy the described background conditions in orderto survive. Rather, I argue that its chances of survival based on eco-nomic factors can be roughly appraised by drawing upon the probabili-ties and trends identified in development theory. It is surely possible,notwithstanding prevailing aggregate trends, for South Africa to fol-low a deviant path to democratic stability. Costa Rica, for example, iswell known for maintaining a longstanding democracy despite its rela-
11 See infra Part III.C. (discussing income inequality in South Africa).

436 RICHMOND JOURNAL OF GLOBAL LAW & BUSINESS [Vol. 9:4
tive poverty and lack of development.12 This Article does not attemptto exclude all possible deviant paths. It tries only to identify whatodds South Africa is facing given its post-apartheid economiccircumstances.
Second, a significant debate in development theory is whethereconomic conditions cause transitions to democracy or whether theysimply contribute to the stability of established democratic regimesthat arise for a variety of other reasons.13 This Article does not look atthe degree to which economic conditions may have caused the downfallof apartheid.14 The Article assumes the establishment of democracyand attempts to evaluate whether economic conditions following theestablishment of democracy are becoming more or less conducive todemocratic stability.15
Third, because my methodology includes a trend analysis of ec-onomic conditions in post-apartheid South Africa, an important issueis when to begin the analysis. South Africa held its first democraticelection in 1994. However, this date is somewhat artificial when con-sidering issues such as urbanization, education, and industrializa-tion.16 Prohibitions on black South Africans owning property andbusiness interests as well as prohibitions on black South Africans ad-
12 See Mitchell A. Seligson & Edward N. Muller, Democratic Stability and Eco-nomic Crisis: Costa Rica, 1978-1983, 31 INT’L STUD. Q. 301 (1987). Incidentally,the analogy between Costa Rica and South Africa is weak. South Africa currentlyranks among the twenty-five wealthiest countries in the world (GDP 2008 PPP).See World Bank, World Development Indicators Database http://siteresources.worldbank.org/DATASTATISTICS/Resources/GDP_PPP.pdf (last visited Dec. 5,2009). Cost Rica is significantly poorer, ranking eighty-fourth. Id.13 See infra Parts II.B-C (discussing this debate in development theory).14 For a discussion of this sort, see Boyd et al., supra note 4.15 It should be noted that development theorists generally use minimalist defini-tions of democracy that do not require democracies to recognize universalfranchise or a bare minimum of human rights protections. See, e.g., S.M. LIPSET,POLITICAL MAN: THE SOCIAL BASES OF POLITICS 27-28 (Johns Hopkins 1981) (1960)(expressly adopting minimalist definitions of democracy developed by JosephSchumpeter and Max Weber); ADAM PRZEWORSKI ET AL., DEMOCRACY AND DEVEL-
OPMENT: POLITICAL INSTITUTIONS AND WELL-BEING IN THE WORLD, 1950-1990 5, 18-20 (2000). Thus, these studies often classify apartheid-South Africa as democraticbecause regular elections were held for white South Africans. See, e g., PRZEWOR-
SKI ET AL., supra at 73. The fact that apartheid era statistics were included in thedata that Przeworski used to calculate world-wide aggregates for democracies doesnot materially affect the analysis in this Article because South Africa was only onedatum point and because I am concerned with economic data after 1994, whichfalls outside any data set used by Przeworski.16 For a general discussion of the chronology of the transition to democracy andthe gradual appeal of apartheid laws, see LEONARD THOMPSON, A HISTORY OF
SOUTH AFRICA 221-65 (2001).
2010] POST-APARTHEID DEMOCRATIC PROSPECTS 437
vancing beyond “semi-skilled occupational classes” were graduallyeased beginning in the 1970s.17 The infamous “pass laws,” which reg-ulated the location of residence, employment, and day-to-day mobilityof black South Africans, were repealed in 1986.18 Desegregation ofpublic schools, on the other hand, did not occur until 1994,19 and inter-national sanctions were not lifted until the end of 1993.20 However,because the full cumulative effect of these reforms and policies was notfelt until 1994, and because a genuinely democratic government wasnot in place until that time, I generally begin my trends analyses in1994.21 Where earlier data is relevant, it is noted in the analysis.22
Finally, this Article does not purport to provide a complete andfull picture of all economic and social problems relevant to the stabilityof South Africa’s young democracy. The purpose (and value) of thisproject is to place South Africa’s post-apartheid democracy within alarger context, namely the aggregate trends associated with demo-cratic stability that have been identified in development theory. To dothis, certain simplifications are necessary so that reasonable compari-sons between South Africa and aggregate trends can be made. In thisway I am able to asses South Africa’s democratic prospects by compar-ing its economic conditions to the aggregate conditions that have beenfound to correlate with democratic stability. This necessarily resultsin an oversimplification of South Africa’s background conditions. ThisArticle knowingly ignores factors such as domestic political cultureand global political and economic dynamics. However, in the few in-stances where I believe these simplifications particularly distort SouthAfrica’s economic condition, the most notable instance being incomeinequality, I have noted and explained my reasoning.
II. MODERNIZATION AND DEVELOPMENT THEORY
There is a significant body of literature exploring the relation-ship between economic development and democracy. This section pro-
17 ALAN HIRSCH, SEASON OF HOPE: ECONOMIC REFORM UNDER MANDELA AND
MBEKI 17 (2005).18 Id. at 11.19 See Clive Harber, Desegregation, Racial Conflict and Education for Democracyin the New South Africa: A Case Study of Institutional Change, 44 INT’L REV.EDUC. 569, 571-73 (1998) (discussing legal measures taken to desegregate schools).20 G.A. Res. 48/1, U.N. Doc. A/RES/48/1 (Oct. 12, 1993); see Philip I. Levy, Sanc-tions on South Africa: What Did They Do?, 89 AM. ECON. REV. 415 (describing thetiming of imposition and removal of international sanctions on South Africa dur-ing apartheid).21 In some instances, the beginning of my analysis is dictated by the availability ofdata. I appropriately note those instances.22 Additionally for purposes of critical evaluation, the attached Appendices in-clude data from as far back as 1960 when it is available.
438 RICHMOND JOURNAL OF GLOBAL LAW & BUSINESS [Vol. 9:4
vides a brief summary of relevant theories and empirical findings andargues for a particular methodology – derived from these theories andfindings – as a way of evaluating South Africa’s post-apartheid demo-cratic prospects.23
A. S.M. Lipset’s Thesis, Methodology, and Conclusions
In his ground-breaking 1959 study, S.M. Lipset set out to em-pirically test the thesis that “the more well-to-do a nation, the greaterthe chances that it will sustain democracy.”24 Lipset employed athree-step methodology. First, he grouped nations into regions that hethought represented reasonably coherent “political culture areas.”25
He did this to avoid “complications introduced by the sharp variationsin political practices in different parts of the earth.”26 Second, focus-ing on only three regions, he divided the countries within each regioninto two groups: (1) democratic and (2) less democratic.27 Finally, hecompiled data measuring wealth, industrialization, urbanization, andeducation for each nation and then calculated averages for the demo-cratic and less-democratic groups.28
Significant for present purposes, Lipset thought that his meth-odology accounted for “deviant cases.”29 He recognized that in somecases “unique events may account for either the persistence or the fail-ure of democracy in any particular society.”30 However, he assertedthat his methodology of grouping nations and computing averagesmade “deviant cases fall into proper perspective.”31 According to Lip-set, “[t]he statistical preponderance of evidence supporting the rela-
23 Julian Wucherpfennig & Franziska Deutsch, Modernization and Democracy:Theories and Evidence Revised, LIVING REVIEWS DEMOCRACY, Sept. 2009, at 1 (pro-viding a roadmap of the current state of affairs in development theory).24 Lipset, supra note 8, at 75. His study was updated in 1962 and 1981 as a booktitled POLITICAL MAN: THE SOCIAL BASES OF POLITICS, supra note 15, but themethodology and findings remained essentially the same. Wucherpfennig &Deutsch, supra note 23, at n.1.25 Lipset, supra note 8, at 73.26 Id.27 Id. at 73-74.28 To measure wealth, Lipset looked to per capita income, number of persons permotor vehicle, number of physicians per 1000 people, and number of radios, tele-phones, and newspapers per 1000 people. For industrialization, he used “percent-age of males in agriculture” and “per capita energy consumed.” For urbanization,he used the percentage of persons living in communities of various sizes. And, foreducation, he used literacy and educational enrollment at three levels of educa-tion. Id. at 76-77.29 Id. at 69-70.30 Id. at 72.31 Id. at 70.

2010] POST-APARTHEID DEMOCRATIC PROSPECTS 439
tionship of a variable such as education to democracy indicates thatthe existence of deviant cases (such as Germany, which succumbed todictatorship in spite of an advanced educational system) cannot be thesole basis for rejecting the hypothesis.”32 Thus, Lipset premised thestrength of his conclusions partially on the aggregation of data acrossmultiple variables. As addressed later in this Article, this has signifi-cant implications for applying Lipset’s conclusions and methodology toa particular case study.33
Lipset found that in each of the economic categories he studied,the more democratic countries (on aggregate) scored significantlyhigher than the less democratic countries (on aggregate).34 Based onthese empirical findings, Lipset asserted that “it seems clear that thefactors of industrialization, urbanization, wealth, and education, areso closely interrelated as to form one common factor. And the factorssubsumed under economic development carry with it the political cor-relate of democracy.”35 Thus, Lipset’s rather modest conclusion wasthat certain statistical correlations exist between economic develop-ment and democracy. He did not assert a direct, tractable casual rela-tionship between economic development and democracy, nor did heclaim that economic development is a prerequisite to democracy. Hesimply concluded that statistical correlations exist between the clusterof economic factors he identified and sustainable democracy.36
Lipset did, however, speculate as to why these correlations ex-ist.37 His primary explanation was that economic development lessensand mitigates potency of wealth inequality.38 Drawing heavily onMarx, Lipset argued that wealthier countries have richer lower clas-ses, “which means increased income, greater economic security, andhigher education,” which, in turn, “permit those in this status to de-
32 Id. at 70.33 See infra Part II.D.2.34 Id. at 75.35 Id. at 80.36 See Wucherpfennig & Deutsch, supra note 23, at 2.37 I refer to this aspect of Lipset’s work as “speculation” because it does not appearto be supported by his data. He offers no empirical evidence, for example, regard-ing wealth distribution in democratic and non-democratic countries.38 LIPSET, supra note 15, at 45-53; Lipset, supra note 8, at 83-84. He also stressedthe importance of education over other indices of development. He believed that itwas “close to being a necessary condition” for democracy. Id. at 80. This conclu-sion seems to be based on his reliance on prevailing statistical research, and hedoes not offer a compelling or sophisticated theory as to why education correlatesto democracy other than the colloquial notion that “[e]ducation presumably broad-ens man’s outlook, enables him to understand the need for norms of tolerance,restrains him from adhering to extremist doctrines, and increases his capacity tomake rational electoral choices.” LIPSET, supra note 15, at 39.

440 RICHMOND JOURNAL OF GLOBAL LAW & BUSINESS [Vol. 9:4
velop longer time perspectives and more complex and gradualist viewsof politics.”39 Lipset believed economic development resulted in alarger middle-class and that a large middle-class operated as a stabi-lizing force for democracy.40 Thus, Lipset concluded that “[a] societydivided between a large impoverished mass and a small favored elitewould result either in oligarchy . . . or in tyranny.”41 It is important tonote that Lipset offered this theory as an explanation as to why eco-nomic development correlates to democracy. Implicit in his argument,therefore, is the assumption that overall economic development resultsin a large middle-class or at least a wealthier and better educatedlower class. Lipset did not, however, provide any data or statisticalanalysis to support this explanation.
B. Relevant Contributions by Adam Przeworski, et al.
Although Lipset’s work was met with a variety of criticisms,42
Adam Przeworski’s study published in 2000 represents the next majorshift in development theory.43 Przeworski attempted to disentangletwo questions: (1) whether “[d]emocracies may be more likely toemerge as countries develop economically” (the “endogenous” theory)and (2) whether, “having been established for whatever reasons, de-mocracies may be more likely to survive in developed countries” (the“exogenous” theory).44 Relying solely on per capita income as a mea-sure of economic development, Przeworski attempted to analyze “howthe respective transition probabilities change with the level ofdevelopment.”45
Przeworski analyzed per capita income from 135 countriesfrom 1950 to 1990 and concluded that “no democracy has ever beensubverted, not during the period we studied nor ever before nor after,regardless of anything else, in a country with a per capita income
39 Lipset, supra note 8, at 83.40 See Wucherpfennig & Deutsch, supra note 23, at 1-2.41 Lipset, supra note 8, at 75.42 See PRZEWORSKI, ET AL., supra note 15, at 88-90 (discussing Lipset’s most “influ-ential critic,” Guillermo O’Donnell); Wucherpfennig & Deutsch, supra note 23, at1-4 (discussing criticisms of Lipset’s approach).43 See Wucherpfennig & Deutsch, supra note 23, at 3-4 (discussing the signifi-cance of Przeworski’s findings).44 PRZEWORSKI ET AL., supra note 15, at 88; see also Wucherpfennig & Deutsch,supra note 23, at 3-4.45 PRZEWORSKI ET AL., supra note 15, at 92. Przeworski looked at other indicesbesides per capita income, but his probability matrix relied solely on per capitaincome. Id. at 81 & n.2.

2010] POST-APARTHEID DEMOCRATIC PROSPECTS 441
higher than that of Argentina in 1975: $6,055.”46 He further con-cluded that “the probability of a democracy dying declines monotoni-cally with per capita income.”47 Thus, one of Przeworski’s keycontributions is the claim that once democracies reach a certainthreshold of wealth, democracy is “impregnable.”48 Below that thresh-old, however, democracies are relatively vulnerable. Przeworski foundthat approximately 56% of democracies under the threshold failed.49
Nevertheless, several of the democracies that survived below thisthreshold were particularly poor.50 Przeworski therefore concludedthat “though we already know that in affluent countries democracy isimpregnable, wealth is not necessary for democracies to survive.”51
In view of this conclusion, Przeworksi examined three addi-tional development variables in an attempt to understand why democ-racies below the income threshold succeed or fail: education, economicgrowth, and income disparity.52 Regarding education, Przeworskifound that although the probability of a democracy failing decreaseswith higher education levels, wealth stabilizes democracies indepen-dent of education.53 For example, Przeworski found that democracieswith low education levels (between three to six years of education forthe average member of the labor force) but high per capita income (be-tween $4,001 and $8,000) are very stable (less than a 5% probability offailure).54 However, the inverse also appears true from Przeworski’sdata: education can stabilize democracy independently of wealth.55
Thus, Przeworski’s data seem to corroborate Lipset’s assertion that ed-ucation is correlative to sustaining democracy.
46 Id. at 98. All of Przeworski’s income data are “expressed in 1985 constantpurchasing power parity (PPP) dollars, from Penn World Tables (PWT 5.6).” Id. at81 n.2, 295.47 Id. at 99. He also concluded that the probability of a democracy dying is unre-lated to its age. Id. at 101-103 (“[O]nce the level of development is taken intoaccount, the hazard rates become independent of age, meaning that for a givenlevel of development, democracies are about equally likely to die at any age.”).48 Id. at 109 (“[I]n affluent countries democracy is impregnable.”).49 Id. at 91, 98-101 (finding that thirty-nine of the sixty-nine democracies belowthe income threshold failed); see also Przeworski, supra note 9, at 165 (same).50 PRZEWORSKI ET AL., supra note 15, at 109.51 Id.52 Id. at 101-22. He also considered various other non-development related vari-ables, such as presidentialism versus parliamentarianism, that are beyond thescope of this Article. Id. at 122-36.53 Id. at 101.54 Id. at 101-02.55 Id. at 102. Table 2.7 shows that if income is held constant, but education levelsare adjusted, the probability of a democracy failing decreases. Id.

442 RICHMOND JOURNAL OF GLOBAL LAW & BUSINESS [Vol. 9:4
The most important variable for Przeworski, other than levelsof per capita income, was economic growth.56 He found that demo-cratic regimes are more than three times likely to die while facing adecline in income than during periods of income growth.57 Specifi-cally, democracies fail at a rate of 0.74% if their income increases dur-ing any three or more consecutive years, but they fail at a rate of 7.7%if their income falls during any two consecutive years.58 Przeworskialso found that democracies are less likely to die during periods ofrapid economic growth than periods of slow economic growth.59
C. Income Equality as a Condition of Democracy
Przeworski also conducted a rather curt analysis of income ine-quality and its correlation to the stability of democracies.60 To mea-sure income disparity, Przeworski used the Gini index and thedistribution of income between the top and bottom quintiles of the re-spective populations.61 He found that only one democracy failed whilemaintaining a Gini index below 35 (zero represents absolute equalityand 100 represents complete inequality), while five democracies failedwhile maintaining a Gini index greater than 35.62 Similarly, when theratio between the top and bottom quintiles was less than nine, no de-mocracy fell, but five democracies failed when the ratio was greaterthan nine.63
Przeworski also tested whether increasing or decreasing ine-quality has any effect on the stability of democratic regimes.64 Hefound that democracies are “slightly less stable” when the share of thetop quintile increases, or when the share of the bottom two quintilesdecreases.65 Przeworski further concluded that democracies are lessstable when labor receives a lower share of value added in manufac-turing.66 Overall, Przeworski concluded that “democracies are less
56 Id. at 111-12.57 Id. at 109. I converted Przeworski’s probabilities of 1 in 66 (economic growth)and 1 in 20 (economic decline) into a comparative ratio. Id.58 Id.59 Id. at 109-10. Przeworski defined rapid economic growth as growth faster than5% per annum. Id. at 109.60 Id. at 117-22. This was in part because of his claim that reliable income ine-quality data was very difficult to obtain. Id. at 117, 120.61 Id. at 118-19.62 Id. at 118, 120.63 Id. at 120.64 Id.65 Id. at 119, 121. The probability went from 0.0088 to 0.0183 when the top quin-tile’s share increased and from 0.0095 to 0.0211 when the bottom two quintiles’shares decreased. Id.66 Id. at 121-22.

2010] POST-APARTHEID DEMOCRATIC PROSPECTS 443
stable in societies that are more unequal to begin with, in societies inwhich household income inequality increases, and in societies in whichlabor receives a lower share of value added in manufacturing.”67
Przeworski’s findings suggest that income equality is not a nec-essary condition for democracy but income inequality can contribute,albeit minimally, to the instability of a democracy. Przeworski’s anal-ysis recognized but minimized the role of income inequality for demo-cratic stability.68 Importantly, despite recognizing that incomeequality played some role in destabilizing democracies, Przeworskifailed to offer a theory explaining this.
In 2001, Daron Acemoglu and James A. Robinson offered a the-ory of regime change that was based on income inequality.69 Applyinga game-theory model to political transitions, they concluded that “ahighly unequal society is likely to fluctuate in and out of democracy.”70
They set up their model as follows. There are two groups of power insociety: “the poor and the rich”.71 A state can be either democratic ornon-democratic.72 In a democracy, the poor set the tax rate becausethey represent the median voter.73 In a non-democratic state, the richset the tax rate.74 In a non-democratic state, the poor can mount arevolution and the rich have to decide whether democracy, with its at-tendant tax increase, is an acceptable alternative to open rebellion bythe poor.75 In a democracy, the rich can “mount a coup,” and the poor
67 Id. at 122.68 Id. at 117-22. One reason for this may be that Przeworski’s work seems focusedon disproving Lipset’s contention that development can cause transition to democ-racy. His finding regarding income inequality and non-democratic regimes wasthat income inequality had a “negligible” effect on the stability of non-democraticregimes, which supports his theory that development does not cause democratictransitions. Id. at 120. This may explain why he did not dig any deeper on theissue. This does not mean, however, that income inequality does not do significantwork in stabilizing or destabilizing democracies that fall below the income thresh-old. Przeworksi himself recognized that income inequality has a non-negligibleeffect on democracies. Id. Subsequent theorists have found strong correlations be-tween the instability of democracies and income inequality. See infra notes 69-82and accompanying text (discussing these theorists).69 Daron Acemoglu & James A. Robinson, A Theory of Political Transitions, 91AM. ECON. REV. 938 (2001); see Wucherpfennig & Deutsch, supra note 23, at 4-5(discussing Acemoglu and Robinson’s contribution).70 Acemoglu & Robinson, supra note 69, at 939.71 Id. at 940 (setting out the full model).72 Id.73 Id.74 Id.75 Democracy is the relevant alternative (as opposed to simple redistribution ofwealth by the rich) because it ensures that the rich will not revoke promises ofredistribution or reverse their policies over time. Id. at 939.
444 RICHMOND JOURNAL OF GLOBAL LAW & BUSINESS [Vol. 9:4
have to decide whether tax relief for the rich is worth the savings ofavoiding a coup.76 In highly unequal democracies, the poor will im-pose heavy taxes on the rich, making it more likely that the rich willmount a coup.77 This model, according to Acemoglu and Robinson,demonstrates that unequal democracies will be very unstable.78
Acemoglu and Robinson presented a “framework for analyzing”inequality and democracy, but they did not test their theory againsteconomic data.79 In 2003, Carles Boix and Susan C. Stokes tested asimilar game-theory model against economic data.80 Boix postulatedthat “a democratic outcome becomes possible when the inequality ofconditions among individuals, and therefore the intensity of redistrib-utive demands, falls to the point that an authoritarian strategy toblock redistribution ceases to be attractive to the well-off.”81 Examin-ing data from 1850-1990, they concluded that income equality is, infact, both a significant cause of transitions to democracy and a signifi-cant cause of transitions from democracy to authoritarian rule.82
What is perhaps most significant (for present purposes) aboutBoix and Stokes’ work is that it relied on indices of development otherthan per capita income.83 They found that “per capita income . . .behaves mostly as a proxy for other more fundamental factors,” andthat inequality was the most important variable directly affectingdemocratic stability.84 Furthermore, they found that certain factors
76 Id. at 940.77 Id. at 938, 940.78 Id. at 957.79 Id. at 938.80 Carles Boix & Susan C. Stokes, Endogenous Democratization, 55 WORLD POL.517 (2003); see Wucherpfennig & Deutsch, supra note 23, at 4-5 (discussing Boixand Stokes’ study). Boix and Stokes’ theory was slightly different from Acemogluand Robinson’s theory. Boix modeled the game this way:
As countries develop, incomes become more equally distributed.Income equality means that the redistributive scheme thatwould win democratic support (the one supported by the medianvoter) would deprive the rich of less income than the one the me-dian voter would support if income distribution were highly une-qual. Hence the rich find a democratic tax structure to be lessexpensive for them as their country gets wealthier, and they aremore willing to countenance democratization.
Boix & Stokes, supra at 539-40.81 BOIX, supra note 10, at 19. Boix and Stokes’ 2003 study actually applied amodel developed by Boix in DEMOCRACY AND REDISTRIBUTION.82 Boix & Stokes, supra note 80, at 539-44.83 Id. at 534, 539-44.84 Id. at 543-44 (“Not higher income but income equality cause countries to democ-ratize and to sustain democracy.”). It should be noted that Boix did not discreditPrzeworski’s finding that income correlates to democratic stability. Id. at 544.

2010] POST-APARTHEID DEMOCRATIC PROSPECTS 445
such as education, literacy, urbanization, and industrialization func-tioned as accurate indices of inequality.85 Thus, unlike Przeworski,who relied almost exclusively on per capita income, Boix and Stokesanalyzed other economic factors and concluded that “democracy iscaused not by income per se but by other changes that accompany de-velopment, in particular, income equality.”86
Another important contribution by Boix and Stokes was theiranalysis of the relationship between the mobility of capital and cleav-ages created by income inequality.87 Their model stated that the morea society is dependent on immobile forms of capital (such as oil andother discrete natural resources) the higher the costs of redistributionfor the rich, and consequently, the greater the resistance by the rich todemocracy.88 Conversely, the more a country’s economy is based onmobile capital (such as those that appear in industrialized nations),the less expensive tax redistribution will be for the rich and the moreopen they will be to democracy.89 Thus, Boix and Stokes found that ahighly unequal society with an economy that is driven by immobileforms of capital is less likely to support a stable democracy.90
Boix and Stokes therefore provide statistical support and amore compelling explanation for Lipset’s original speculation that “thefactors of industrialization, urbanization, wealth, and education, areso closely interrelated as to form one common factor.”91 Their modelevaluates these factors in a more sophisticated way: it incorporatesthem because they bear on income inequality and the mobility of capi-tal, which, in turn, are indicative of the volatility of the class struggle(as originally speculated by Lipset).
D. Crafting an Approach Suited to Evaluating South Africa’sDemocratic Prospects
Having extracted the relevant statistical findings and theoreti-cal models from the current literature, it is now necessary to outline
Rather, he found that income inequality was the more fundamental indicium. Id.(“[P]er capita incomes rise in countries where incomes are becoming more equal.”).85 Id. at 541-44.86 Id. at 540.87 BOIX, supra note 10, at 19-20; Boix & Stokes, supra note 80, at 534;88 BOIX, supra note 10, at 19-20.89 Id. Underlying this model is the assumption that immobile assets are easy totax and therefore easy to target in redistribution plans. Id. at 19. Highly mobilecapital, in contrast, is not as easy to target for redistribution. This means that therich in societies dependent on immobile capital are more fearful of democracy,while the rich dependent on mobile capital are more willing to entertain democ-racy. Id.90 Boix & Stokes, supra note 80, at 544-45.91 Lipset, supra note 8, at 80.

446 RICHMOND JOURNAL OF GLOBAL LAW & BUSINESS [Vol. 9:4
an appropriate method for evaluating South Africa’s economic back-ground conditions. The task in this section is to craft an analysis thatwill evaluate South Africa’s democratic prospects as accurately as pos-sible based on post-apartheid economic data. Stated more crudely,how do we use the findings discussed above to approximate South Af-rica’s chances of sustaining democracy? I believe that this questioncan best be answered by applying three models.
1. Step One: Przeworski’s Income-Based Probability Calculations
First, I must determine South Africa’s status vis-a-vis Przewor-ski’s income threshold. This is perhaps the most reliable and least dis-puted indicator of democratic success and stability. No theoristappears to dispute Przeworski’s claim that, regardless of all other vari-ables, no democracy above the income threshold has ever failed.92 IfSouth Africa has breached this threshold, the sustainability of its de-mocracy from an economic perspective would, presumably, be sound.
If South Africa has not crossed the income threshold (which ithas not), I will then use Przeworski’s probability calculations (whichare based entirely on per capita income) to estimate South Africa’sprobability of democratic failure. This second aspect of Przeworski’swork also remains sound. As noted above, critics such as Boix andStokes have leveled two criticisms of Przeworski’s work: (1) that de-velopment does in fact cause democracy to occur and (2) that per capitaincome is only a proxy for a variety of more fundamental factors ofdevelopment that more directly affect a country’s democratic pros-pects.93 Despite these criticisms, they nevertheless accept that percapita income correlates with the stability of established democracies.Thus, Przeworski’s probability calculations remain valuable tools inassessing whether economic conditions in a particular democracy aremore or less conducive to democratic stability even though other more“fundamental” variables may be driving the correlation between in-come and democratic stability.
2. Step Two: Lipset’s Background Conditions
Second, I will apply Lipset’s “correlation” thesis to South Af-rica’s transition from apartheid to democracy. As noted above, Lipset’swork has been severely criticized, and a defense of using his approachis therefore necessary. Przeworski and others have criticized Lipsetprimarily for blending the “endogenous” and “exogenous” theories ofdemocracy and development.94 Przeworski agreed that a strong corre-lation between democracy and development exists, but he thought that
92 See Wucherpfennig & Deutsch, supra note 23, at 4-5.93 Boix & Stokes, supra note 80, at 539-44.94 See Wucherpfennig & Deutsch, supra note 23, at 3-4.

2010] POST-APARTHEID DEMOCRATIC PROSPECTS 447
this was because, once established, democracies are “impregnable” inwealthy countries.95 He disputed Lipset’s claim that development willcause countries to transition from non-democratic to democratic re-gimes. Thus, Przeworski did not dispute that a correlation exists be-tween democracy and development. He simply offered a moresophisticated explanation for this correlation.96
More importantly, Przeworski did not offer a compelling reasonfor why Lipset’s cluster of economic indices was less appropriate formeasuring development. In fact, he simply asserts in a footnote thathe believes per capita income is the best indicator of development.97
Based on the rest of Przeworski’s findings, we can speculate that thisis because per capita income bears a strong correlation to regime sta-bility. It seems that Przeworski relied so heavily on per capita incomebecause it displayed the most compelling correlations.
Nevertheless, as Boix and Stokes point out, there is reason tobelieve that per capita income is a good indicator of regime stabilityonly because it is a proxy for more fundamental economic variables.98
Although these underlying variables are less important at the ex-tremes, where they likely trend in predictable correlation with per cap-ita income, separate analysis of these indicia may be important forregimes that lie between economic extremes. A country that has aneven chance of democratic success according to Przeworski’s income-based probability calculations would surely be interested in an analy-sis of the more “fundamental factors” for which per capita income maybe acting as a proxy.99 It may be, for instance, that certain of theseunderlying factors are trending in different directions. Analysis ofthese underlying conditions could help to more precisely identify par-ticular economic threats to democratic stability.
For these reasons, it is helpful to apply a modified version ofLipset’s correlation thesis to South Africa. My methodology is as fol-lows. I conduct a trend analysis regarding indices of urbanization, in-dustrialization, education, and wealth (other than per capita income).I evaluate whether, since the fall of apartheid, South Africa is exhibit-ing positive trends in these development categories. The underlyingintuition (adopted from Lipset) is that if South Africa is exhibitingnegative trends in these categories, economic conditions may be get-
95 PRZEWORSKI ET AL., supra note 15, at 109.96 Id. at 101 (“Thus, Lipset was right in thinking that the richer the country, themore likely it is to sustain democracy.”).97 Id. at 81 n.2.98 Boix & Stokes, supra note 80, at 543.99 Id.

448 RICHMOND JOURNAL OF GLOBAL LAW & BUSINESS [Vol. 9:4
ting progressively more difficult for maintaining a stabledemocracy.100
3. Step Three: Income Inequality
Third, in light of Boix’s findings that income inequality is a sig-nificant factor for democratic stability, I will evaluate income inequal-ity in South Africa from three perspectives. First, I will consider thelevel of inequality in South Africa as compared to the other democra-cies evaluated by Przeworski, specifically as it compares to the Giniindex threshold of 35 used by Przeworski.101 Second, I will evaluatetrends in the level and nature of income inequality within South Africasince the fall of apartheid. Finally, I will evaluate trends regardingthe mobility of capital as described by Boix.102 This final step is im-portant because South Africa’s economy has historically been drivenby highly immobile forms of capital (mining).103 Thus, to the degreethat South Africa’s economy is diversifying and capital is shifting tomore mobile forms, data regarding income disparities may be mislead-ing in terms of the country’s progress towards equality.
100 At least one caveat to this approach is necessary. Lipset was emphatic thatthe strength of his approached derived from aggregating data from various coun-tries so that outliers would not disproportionately dominate tractable correlations.That is, he believed that country-to-country comparisons are not useful in drawingout general correlations between democracy and development because many in-compatible eccentricities may exist between the two sample countries. See Lipset,supra note 8, at 69-72. By aggregating data from a variety of countries withroughly similar political traditions, Lipset believed that visible trends could berelied on as generally applicable correlations and not anomalies. See id. By com-paring South Africa to itself, I am bypassing this methodological safeguard. It ispossible that South Africa could follow an aberrational path. That is, it could sus-tain a democracy under economic conditions that do not track Lipset’s correlationthesis. However, my goal here is not to prove that South Africa’s economic condi-tions are a fail-safe indication of its democratic future. Rather, I take for grantedLipset’s finding that there is a correlation between development and democracyand that, generally speaking, “the more well-to-do a nation, the greater thechances that it will sustain democracy.” Id. at 75. Thus, the longevity of SouthAfrica’s post-apartheid democracy depends on whether it is trending towards suffi-ciently high levels of economic development.101 See supra notes 60-68 and accompanying text.102 See supra notes 87-91 and accompanying text.103 See MBendi, Mining in South Africa—Overview, http://www.mbendi.com/indy/ming/af/sa/p0005.htm (last visited Dec. 17, 2009) (describing the historic signifi-cance of mining for South Africa’s economy).

2010] POST-APARTHEID DEMOCRATIC PROSPECTS 449
III. EVALUATING SOUTH AFRICA’S POST-APARTHEIDECONOMIC DATA
In this section, I apply the above methodology to data collectedregarding South Africa’s economic background conditions. Sources forall data are noted appropriately. All of my own conversions are notedand presented in the attached appendices.
A. Applying Przeworski’s Income-Based Probability Calculations
Przeworski found that “no democracy has ever been subverted,not during the period we studied nor ever before nor after, regardlessof everything else, in a country with a per capita income higher thanthat of Argentina in 1975: $6,055.”104 More precisely, Przeworksifound that “up until 1990 thirty-one democracies had lived 742 yearswith incomes above that of Argentina in 1975, and not one had everfallen.”105 Thus, Argentina’s per capita income in 1975 represents astatistical threshold for democratic stability. That is, according toPrzeworski, a democracy’s chances for survival are ideal when its percapita income breaches $6,055, regardless of any other economic vari-ables.106 Przeworski’s income threshold was “expressed in 1985 con-stant purchasing power parity (PPP) dollars, from the Penn WorldTables (PWT 5.6).”107 When this is expressed in terms of 2000 con-stant PPP dollars from the updated Penn World Tables (PWT 6.2), it is$10,364.108
104 PRZEWORSKI ET AL., supra note 15, at 98.105 Id.106 See Przeworski & Limongi, supra note 9, at 169 (describing this threshold as a“miracle” of certainty).107 PRZEWORSKI ET AL., supra note 15, at 81 n.2,.108 PWT 5.6 provides income data for South Africa only up until 1992. See App.1.2. PWT 6.2 provides income data for South Africa from 1960 until 2004. How-ever, PWT 6.2 expresses income in terms of 2000 constant PPP dollars. Thus, itwas necessary to identify Argentina’s income in 1975 in terms of 2000 constantPPP prices so that South Africa’s post-apartheid income data could be compared tothe threshold. As can be seen in App. 1.1., Argentina’s income in 1975 in terms of2000 constant PPP from PWT 6.2 was $10,364.

450 RICHMOND JOURNAL OF GLOBAL LAW & BUSINESS [Vol. 9:4
SOUTH AFRICA’S PER CAPITA INCOME (1990-2004)CHART 1
6000
6500
7000
7500
8000
8500
9000
9500
10000
10500
11000
1990
1991
1992
1993
1994
1995
1996
1997
1998
1999
2000
2001
2002
2003
2004
Year
Per
Cap
ita
Inco
me
Przeworski’s Income Threshold
At no point between 1960 and 2004 has South Africa breachedPrzeworski’s income threshold.109 In 1994, the year of South Africa’sfirst election, its per capita income was well below the threshold at$7,311.110 However, as Chart 1 illustrates, South Africa is closing inon Przeworski’s income threshold. South Africa’s per capita incomerose steadily between 1994 and 2004, when it reached $9,145.111 Since2004, South Africa’s per capita income has continued to rise, sug-gesting that, from an economic perspective, South Africa is trendingtowards that class of democracies that is “impregnable.”112
Nevertheless, South Africa has yet to cross Przeworski’sthreshold. Although direct application of Przeworski’s probability cal-culations is difficult because available data for South Africa after 1992is based on a different price index than the one used by Przeworski,113
109 See App. 1.2.110 Id.111 Id.112 Data is not available for 2004 to 2008 from PWT 6.2; thus making a fair com-parison to Przeworski’s threshold difficult for those years. Nevertheless, theWorld Bank data, which are based on a different PPP index, shows that SouthAfrica’s per capita income increased from $8,197 to $9,343 between 2004 and 2008.See App. 1.2. This represents a 13% increase. If South Africa’s income for 2004from PWT 6.2 ($9,145) is projected forward at the same rate, South Africa’s incomefor 2008 would be $10,334, which is just $30 lower than Przeworski’s threshold.113 See supra note 108. Przeworski’s income threshold does not create the sameconversion problem because it is based exclusively on Argentina’s per capita in-

2010] POST-APARTHEID DEMOCRATIC PROSPECTS 451
a conservative estimate can be made about where post-apartheidSouth Africa lies in Przeworski’s probability matrix.114 First, in 1992,South Africa’s per capita income, as indicated in the same data setrelied upon by Przeworski, located South Africa within the category ofcountries that Przeworski estimates to have a 0.0278 probability offailure during the given year.115 Second, income data from severalmore recent data sets show that South Africa’s per capita income in-creased every year from 1992 to 2008.116 Thus, a conservative esti-mate finds that South Africa remains (as of 2008) in the sameprobability category. That probability of democratic failure as esti-mated by Przeworski (0.0278 ) translates to an estimated life of thirty-six years.117
Regarding economic growth, Przeworski found strong statisti-cal probabilities of democratic failure when per capital income de-creased during two or more consecutive years.118 South Africaexhibits positive trends regarding economic growth. Income dropped
come in 1975. Przeworski’s probability matrix, however, is based on aggregate percapita income ranges from various countries; making a direct conversion of hisincome ranges using PWT 6.3 impossible. See PRZEWORSKI ET AL., supra note 15,at 93 (Table 2.3).114 Another difficulty with directly applying Przeworski’s probability calculationswas brought to my attention by Boix and Stokes’ article. Even though income dataare adjusted based on appropriate price and exchange indices so that they can becompared accurately across time, the nature of world development suggests thatPrzeworski’s threshold is increasing over time. See Boix & Stokes, supra note 80,at 545. That is, the price for “ ‘buy’[ing] democracy,” as Boix puts it, has increased.Id. Since Przeworski’s study, which covered 1950-1990, it may be that the price ofguaranteed democratic stability, i.e. the income threshold, has increased. How-ever, because this increase would likely have been nominal for the interveningnine years, and because no updated threshold is available, I rely on Przeworski’sprobability calculations and evaluate South Africa’s situation by applying themdirectly.115 App. 1.2 (the same data used by Przeworski) shows that South Africa had a percapita income of $3,073 in 1992 based on 1985 PPP dollars. According to Przewor-ski’s probability matrix, countries with per capita income between $3,001 and$4,000 have a 0.0278 probability of failure. PRZEWORSKI ET AL., supra note 15, at93 (Table 2.3).116 PWT 6.2 shows that South Africa’s per capita income only increased after 1992and the World Bank data show that per capita income continued to rise between2004 and 2008. See App. 1.2. Thus, a very conservative estimate would be that asof 2008 South Africa remains at least in the $3,001-$4,000 range identified byPrzeworski as having a 0.0278 probability of failure. PRZEWORSKI ET AL., supranote 15, at 93 (Table 2.3).117 PRZEWORSKI ET AL., supra note 15, at 98 (providing estimated-life calculationsfor corresponding probabilities).118 Id. at 109.

452 RICHMOND JOURNAL OF GLOBAL LAW & BUSINESS [Vol. 9:4
slightly in both 1998 and 1999, but, since 1994, there have been noother consecutive years of decreasing income.119
In sum, if we look exclusively at per capita income and eco-nomic growth as measured by Przeworski, South Africa’s prospects formaintaining a stable democracy appear less than certain, but strongand trending in the right direction.
B. Post-Apartheid Trends Regarding Lipset’s BackgroundConditions
As noted above, Litpset’s general premise was that democracywould be more stable in countries that were becoming more developed.He found that more democratic countries were wealthier, more indus-trialized, more urbanized, and better educated than less -democraticcountries. Since the fall of apartheid, South Africa has exhibited al-most universally positive trends in these areas. This suggests that, atleast as far as Lipset’s background criteria are concerned, South Africacontinues to move towards economic conditions that are favorable todemocracy.
Industrialization. Lipset measured industrialization by refer-ence to two indices: (1) the percentage of males in agriculture and (2)the “per capita commercially produced ‘energy’ being used in the coun-try.”120 These indices, as well as other more contemporary measures,suggest that South Africa is relatively industrialized and trending pos-itively in this area.
Although accurate employment data is not available any ear-lier than 2000, South Africa exhibits a strong and uninterrupted trendaway from agriculture-based employment. The percentage of the pop-ulation employed in agriculture has steadily decreased from 16% in2000 to 9% in 2007.121 This trend is buttressed by increased employ-ment in other sectors. Employment in services rose from 59% to65%.122 Employment in industry rose more modestly from 24% to26%.123 Moreover, unemployment has fluctuated, but decreased over-all from 27% to 23% for the same period,124 suggesting that the posi-tive trend away from agricultural employment is not being materiallydistorted by increased unemployment.
Energy consumption per capita presents a more puzzlingtrend. Between 1971 and 2006 consumption was at its highest in
119 See App. 1.2.120 LIPSET, supra note 15, at 34.121 See App. 2.1.122 See App. 2.2.123 See App. 2.1. Data for employment in manufacturing were not available.124 See App. 2.2.

2010] POST-APARTHEID DEMOCRATIC PROSPECTS 453
1988.125 From there, it steadily declined until 2002, when it reachedits lowest point since 1980.126 Since 2002, it has trended upwards butremains below the 1988 high.127 Other indices also suggest that in-dustry’s significance in the economy is no longer growing. Industry’sshare of value added to the GDP, for example, has decreased from 35%in 1994 to 31% in 2008.128
This somewhat anomalous trend requires an explanation. Onepossibility is that it is indicative of the fact that South Africa under-went significant industrialization during apartheid.129 Thus, industri-alization in post-apartheid South Africa may be a bad indicium ofdevelopment because South Africa’s economy was already largely in-dustrialized.130 This trend may not be indicative of economic digres-sion because, consistent with trends in other post-industrialeconomies, the economy has become increasingly dependent on theservice sector.131 Although industry’s share of value added to the GDPhas decreased slightly since apartheid, agriculture’s contribution tothe GDP has also continued to decline.132 The service sector’s contri-bution, on the other hand, has steadily increased from 55% of the GDPin 1970 to 66% in 2008.133 Although industry’s significance has beendecreasing slightly, the country is certainly not slipping back into anagrarian economy, which is an important variable in South Africa be-
125 See App. 2.1.126 Id.127 Id.128 See App. 2.2.129 See Marie Huchzermeyer, Informal Settlements: Production and Interventionin Twentieth-Century Brazil and South Africa, LATIN AM. PERSP., Jan. 2002, at 83,88.130 It is important to remember that Lipset was looking at the word during a verydifferent era where many countries had yet to experience industrialization.131 See generally Thomas J. Kirn, Growth and Change in the Service Sector of theU.S.: A Spatial Perspective, 77 ANNALS ASS’N. AM. GEOGRAPHERS 353 (1987) (re-viewing the reasons of increased role of service sector in “developed economies”).132 See App. 2.2.133 See App. 2.3. Service sector statistics must be read with caution in South Af-rica because there is such a large segment of the population employed in unskilled,domestic service and other informal service industries. See Nicoli Nattrass & Jer-emy Seekings, Democracy and Distribution in Highly Unequal Economies: TheCase of South Africa, 39 J. MODERN AFR. STUD. 471, 476 (2001). Nevertheless, onewould expect that the end of apartheid would correspond to a decrease in domesticservice, which was made available very cheaply under apartheid because of lawsregulating employment opportunities for black South Africans.

454 RICHMOND JOURNAL OF GLOBAL LAW & BUSINESS [Vol. 9:4
cause a high percentage of the population relies on an unskilled bread-winner for support.134
Thus, South Africa’s post-apartheid economic development inthis area seems modest, but positive. More people continue to moveout of agricultural employment and into more modern, and presuma-bly skilled, sectors of work.
Urbanization. Lipset evaluated urbanization by looking at thepercentage of the population that resided in three different sized com-munities: (1) metropolitan areas; (2) cities over 100,000; and (3) citiesover 20,000.135 Data for South Africa regarding similar urbanizationdelineations are available from the World Bank, which divides commu-nities between “rural,” “urban,” and “population in urban agglomera-tions of more than 1 million.”136 Within these categories, South Africaexhibits positive trends. Since 1970, the percentage of people living incities of more than one million has grown monotonically from 23% to33% in 2007.137 The rural population has also decreased, althoughslightly more erratically, from 52% in 1970 to 39% in 2008.138 Theoverall urban population has grown from 48% in 1970 to 61% in2008.139
These data must be viewed with caution. Under apartheid, thepass laws kept blacks from living and working in cities. Blacks werepermitted to live and work in urban areas only with express govern-ment permission and were required to leave their families in rural ar-eas.140 When these laws were finally lifted in 1986, the result was aninflux of previously excluded people to urban areas.141 Thus, this shift
134 Indeed, in 1993, 41% of all households were supported by a breadwinner whowas in “semi-skilled or unskilled employment in the agricultural and domestic sec-tors.” Nattrass & Seekings, supra note 133, at 475.135 LIPSET, supra note 15, at 34-38.136 The World Bank does not provide any more specificity regarding the defini-tions of “rural” and “urban.” It states only that “ ‘[u]rban population’ is the mid-year population of areas defined as urban in each country as reported to theUnited Nations. It is measured here as the percentage of the total population.”The World Bank, Population and Demographic Indicators, http://econ.worldbank.org/WBSITE/EXTERNAL/DATASTATISTICS/0,,contentMDK:20451597~hlPK:1365919~isCURL:Y~menuPK:64133159~pagePK:64133150~piPK:64133175~theSitePK:239419,00.html (last visited Dec. 17, 2009).137 See App. 3.138 Id.139 Id.140 See Valerie Moller, Quality of Life in South Africa: Post-Apartheid Trends, 43SOC. INDICATORS RES. 27, 29 (1998) (discussing the pass laws).141 Id.

2010] POST-APARTHEID DEMOCRATIC PROSPECTS 455
in demographics, which is clearly visible in the data,142 was in somesense artificial. It was not necessarily the product of a growing andmagnetic metropolitan culture, increased labor needs as a result of ec-onomic growth, or a shift from an agrarian to industrial economy. In-deed, the result of this influx has not been vibrant metropolitancommunities, but large informal settlements surrounding most majorcities, with hosts of attendant social, environmental, and economicproblems.143 “Urbanization,” at least as reflected in this data, may bea misleading indicium of development in South Africa. Nevertheless,South Africa continues to become more urban, and because this coin-cides with overall economic growth, positive trends in the service andindustry sectors, and a move away from agricultural employment, thisrepresents a positive development trend.
Education. Lipset measured education by literacy rates andschool enrollment.144 South Africa exhibits positive trends in thesecategories. The literacy rate in South Africa has risen from 76% in1980 to 88% in 2007.145 Primary school enrollment represents ananomaly. It dropped from 90% in 1991 to 86% in 2007.146 However,secondary school enrollment rose significantly from 62% in 1998 to73% in 2007, and tertiary enrollment rose from 12% in 1991 to 15% in2006.147 With the exception of primary school enrollment, these sta-tistics bode well. Indeed, South Africa’s 88% literacy rate in 2007 iswell above the aggregate rate of 62% for sub-Saharan Africa148 and,incidentally, well above the aggregate literacy rate Lipset identifiedfor democracies in Latin America.149
142 The increase in population in cities of one million or more best illustrates thisphenomenon. See App. 3 (showing an increase from 25% in 1985 to 33% in 2007).143 See generally Huchzermeyer, supra note 129.144 LIPSET, supra note 15, at 35-41.145 See App. 4.146 Id.147 Id. . A significant factor not reflected in these statistics was the integration ofpublic schools, which made better schools available to non-whites. See Servaas vander Berg, Apartheid’s Enduring Legacy: Inequalities in Education, 16 J. AFR.ECONOMIES 849 (2007). Education inequality along racial lines persists, however.Id.148 See App. 4.149 LIPSET, supra note 15, at 37. This sort of cross-temporal comparison is under-standably questionable. The digital information explosion and general trends inoverall world development have resulted in literacy rates slowly rising in even themost impoverished places. Nevertheless, it does not follow that the educationthreshold for democratic stability rises in stride with this trend and therefore, thiscomparison seems helpful in evaluating South Africa’s economic circumstancesvis-a-vis other poor democracies that have had success in achieving stability.

456 RICHMOND JOURNAL OF GLOBAL LAW & BUSINESS [Vol. 9:4
Wealth. In addition to per capita income, Lipset looked atother indicia of wealth such as the number of persons per doctor andmotor vehicle and the number of telephones, radios, and newspapersper 1,000 people.150 South Africa has exhibited positive post-apartheid trends in these supplemental wealth indicia. The number ofdoctors per 1,000 people rose monotonically from 0.61 in 1992 to 0.77in 2004.151 The number of vehicles per 1,000 people rose from 139.24in 1990 to 151.08 in 2006.152 The percentage of households with tele-visions rose from 53.80% in 2001 to 59.20 % in 2004.153 The number ofmobile and fixed phone lines per 100 people went from 4.67 in 1975 to97.87 in 2007.154 Other more contemporary indicia of wealth, such asthe number of personal computers per 100 people, also exhibit positivetrends.155 These variables corroborate the positive economic growthreflected in the per capita income data.156
In sum, even when we dig below per capita income as a mea-sure of South Africa’s post-apartheid economic development, South Af-rica exhibits generally positive trends regarding Lipset’s backgroundconditions for democratic stability. South Africa may not have reachedprime economic conditions, but Lipset’s background conditions seem toconfirm that, since the fall of apartheid, it has trended steadily in thatdirection.
C. Income Inequality in South Africa
Notwithstanding the positive trends discussed above, incomeinequality represents an undeniably negative economic condition inSouth Africa. As one commentator has observed, “[a]mong the coun-tries that have democratised as part of the ‘Third Wave’ . . . SouthAfrica and Brazil hold the undesirable record of having the most une-
150 LIPSET, supra note 15, at 33-36.151 See App. 5.152 Id.153 Id. I did not include data regarding newspapers because I felt that the digitalinformation revolution made changes in this area unreflective of any economicconditions within South Africa.154 Id.155 Id.156 Although I discuss income inequality in more detail in the next section, theabove indicia are also relevant because they may reflect on the nature of SouthAfrica’s middle class. Because per capita income is calculated as an aggregateover the entire population, it does not capture income inequality. These indicia,which are based on per-person ratios, may capture some forms of wealth inequal-ity. See Boix & Stokes, supra note 80, at 539-44 (discussing Boix’s supplementalindicia of income inequality).

2010] POST-APARTHEID DEMOCRATIC PROSPECTS 457
qual distribution of income.”157 South Africa’s Gini index at the timeof its democratization varies from study to study. Conservative esti-mates placed the Gini index at 59 in 1993.158 Other estimates rangefrom 62 to 68.159 By all accounts, however, South Africa transitionedto democracy as an incredibly unequal society.
1. Applying Przeworski and Boix’s Findings
Przeworski looked at two primary indicators of inequality: theGini index and the ratio between the income of the top quintile and theincome of the bottom quintile.160 Data regarding post-apartheid in-come distributions is incredibly limited. The World Bank reports onlythree datum points for South Africa’s Gini index and income distribu-tions by quintile between 1993 and 2000. Nevertheless, looking at thelimited data from the World Bank, inequality seems to be perched at ahigh, but stable figure. The table below shows the World Bankdata.161
Year Gini Index Income Ratio1993 59 221995 57 172000 58 20
With a Gini index of 58 in 2000, South Africa remained wellabove Przeworski’s Gini index threshold of 35. This places South Af-rica in the bottom of that class of democracies that Przeworski calcu-lated to have a 0.0132 probability of failing in a given year.162
Similarly, South Africa’s income ratio in 2000 was 20:1, which is wellabove Przeworski’s 9:1 ratio.163 This places South Africa in the classof democracies that Przeworski calculated to have a 0.0187 probability
157 Nattrass & Seekings, supra note 133, at 471. South Africa’s income disparityis well-known. See also Moller, supra note 140, at 34 (quoting a 1994 finding that“South Africa has the worst distribution of income for any country for which na-tional household data is available.”).158 World Bank, World Development Indicators and Global Development FinanceDatabase, http://databank.worldbank.org/ (select first database, click Next, selectSouth Africa, click Next, select GINI Index, click Next, select 1993, click Next,click Formatted Report) (last visited Sept. 16, 2010).159 See Moller supra note 140, at 34 (listing a constant Gini index of 68 from 1975-1991).160 PRZEWORSKI ET AL., supra note 15, at 117-22.161 World Bank, World Development Indicators Database, http://databank.worldbank.org/ (follow instructions in fn 158, using the relevant variables) (last visitedSept. 29, 2010).162 PRZEWORSKI ET AL., supra note 15, at 118 tbl. 2.15.163 Id.

458 RICHMOND JOURNAL OF GLOBAL LAW & BUSINESS [Vol. 9:4
of failing in a given year.164 However, what is striking about SouthAfrica’s data is that inequality has not trended significantly upward ordownward since 1993. Although inequality dropped 5% in 1995 (Giniindex), it rose slightly in 2000, resulting in only nominal aggregatechanges (for the better) between 1993 and 2003.
In 2007, Jorge Aguero et al. evaluated various sources of avail-able data other than those provided by the World Bank.165 Comment-ing on this data, Aguero concluded that poverty and inequality likelyincreased between 1993 and 1998, but there was a partial reversal ofthese trends after 1998.166 Another influential study by Berk Ozlerconsidered non-World Bank data but also concluded that “[c]hanges inoverall inequality were mostly negligible.”167 Ozler found that theGini index remained nearly constant at 0.57 between 1995 and2000.168 Thus, inequality seems to have remained relatively constantsince the fall of apartheid.
When one looks at the additional indicia suggested by Boix (ed-ucation, “occupational diversification,” and land used for agricul-ture),169 more positive non-nominal changes are visible. Asdemonstrated above, post-apartheid trends in education have beengenerally positive. Regarding occupational diversification, Boix wasconcerned primarily with combined trends in urbanization and indus-trialization.170 As demonstrated above, South Africa has moved awayfrom agricultural employment towards increased service-based em-ployment. The percentage of land used for agriculture increased from80 to 82% between 1990 and 1994, but has been locked at 82% from1994 to 2005, suggesting that this variable has stabilized.171
164 Id.165 Jorge Aguero et al., Poverty and Inequality in the First Decade of South Af-rica’s Democracy: What Can Be Learned from Panel Data?, 16 J. AFR. ECONOMIES
782, 784-89 (2007). These data sets included a study conducted within the prov-ince of KwaZulu-Natal (KwaZulu-Natal Income Dynamics Study), the All Mediaand Products Survey, and the South African government’s General Household andLabor Force Survey. Id.166 Id. at 807.167 Berk Ozler, Not Separate Not Equal: Poverty and Inequality in Post-ApartheidSouth Africa, 55 ECON. DEVELOPMENT & CULTURAL CHANGE 487, 491 (2007).168 Id. at 506-07. Ozler also considered the data sources used by Aguero et al. Id.at 515-17.169 Boix & Stokes, supra note 80, at 539-44.170 Id. at 542 tbl.2 n.d.171 See App. 2.3.

2010] POST-APARTHEID DEMOCRATIC PROSPECTS 459
2. Toward A More Sophisticated Understanding of IncomeInequality and Democratic Stability in South Africa
The common intuition following the fall of apartheid was that“the reduction of discriminatory measures . . . [would] have had anequalising impact on the income distribution.”172 However, as dis-cussed above, the available data do not corroborate this intuition. In-come distribution, at least between 1993 and 2000, seems to haveremained relatively constant, with some positive trends in supplemen-tal indicia such as education and urbanization.173 How should this ev-idence be interpreted and what are its implications for South Africa’sdemocratic stability? Two key facts shed some light on the surprisingstagnation of inequality in post-apartheid South Africa.
First, as Nicoli Nattrass has argued, inequality in South Africamay not have changed quantitatively, but it has certainly changedqualitatively.174 Aggregate inequality statistics hide the fact that thewealth of non-white South Africans has increased dramatically sincethe fall of apartheid.175 The result is that “[i]nequality in South Africahas thus become increasingly a question of employment and occupa-tion rather than racial discrimination; class is no longer coterminouswith race.”176 Nattrass’ findings are buttressed by data presented byOzler regarding racial inequality. Ozler found that although inequal-ity did not increase significantly on the aggregate, inequality rose dra-matically amongst blacks.177 This statistic captures the fact that therepeal of discriminatory laws allowed blacks, for the first time, to accu-mulate wealth. Equality among blacks existed under apartheid be-cause blacks were systematically impoverished. The end of apartheidresulted in increased inequality among blacks but almost instantequality between white elites and a new class of black elites.178
172 Nattrass & Seekings, supra note 133, at 472.173 Some contend that inequality has widened significantly and systematicallysince the fall of apartheid. See Craig Schwabe, Fact Sheet: Poverty in South Af-rica, HUMAN SCI. RES. COUNCIL, available at http://www.sarpn.org.za/documents/d0000990/ (suggesting an increase from 0.68 in 1991 to 0.77 in 2001). However, theavailable data do not seem to support this conclusion. See Nattrass & Seekings,supra note 133, at 472 (discussing available data and concluding that levels ofinequality have remained mostly constant).174 Nattrass & Seekings, supra note 133, at 473.175 Id. at 473 (attributing this to the “steady decline in wage and job discrimina-tion, upward occupational mobility, and increased bargaining power through legaltrade unions”) (citations omitted).176 Id.177 Ozler, supra note 167, at 508.178 See Jo Beall et al., Fragile Stability: State and Society in Democratic SouthAfrica, 31 J. S. AFR. STUDIES 681, 693-94 (2005) (“The face of ‘big business’ (for-merly owned and run only by whites) has changed as a result of the creation of a

460 RICHMOND JOURNAL OF GLOBAL LAW & BUSINESS [Vol. 9:4
This change in the nature of wealth inequality is significantwhen evaluating the stability of South Africa’s democracy. Boix, Lip-set, and Acemoglu all model the effect of income inequality on democ-racy in terms of a class struggle between the poor and the rich. InSouth Africa, that struggle had an additional layer: race. Race-basedlegislation defined and maintained social strata. Thus, the necessaryfirst step in dissipating the class struggle was to de-racialize wealth.Once income inequality is viewed from this layered perspective, Ithink there is reason to believe that South Africa is trending towardseconomic conditions that can develop and support a non-racial middleclass.
First, and perhaps most importantly, recall Boix’s point re-garding the mobility of capital. Although not analogous in degree tooil-producing countries,179 South Africa has historically relied on min-ing, a highly immobile form of capital, to drive its economy.180 How-ever, South Africa’s dependence on mining has steadily decreased overthe last several decades. According to the most recent data providedby the South African government, the two largest contributors to theGDP are manufacturing (18% of GDP) and the financial industry(21%).181 Mining now comprises only 8% of the GDP.182 Thus, the fallof apartheid did not involve the transfer of highly immobile assetsfrom one group of elites to another. This is important because, accord-ing to Boix, the mobility of capital determines the stakes in the classstruggle. Highly immobile capital increases the stakes for the rich,but mobile capital lowers those stakes and increases the chances of ademocratic compromise between the poor and the rich.183 Because ofSouth Africa’s increased dependence on mobile capital, the nature ofthe post-racial class struggle is more suited to democratic stability andthe development of a non-racial middle class.
Second, economic conditions are favorable for the developmentof a middle class. As noted in detail above, all of Lipset’s backgroundconditions are exhibiting generally positive trends. Education rates
black stratum of owners and managers. This has been one of the most visiblemarkers of change over the past decade. It is now no longer possible to character-ise big business as ‘white’, or to distinguish on racial lines between public positionsof leading business figures or organisations.”).179 See BOIX, supra note 10, at 19-20 (explaining that these countries illustratewhy democracy is difficult when capital is immobile); Boix & Stokes, supra note80, at 526-29 (same).180 See MBendi, supra note 103.181 STAT. S. AFR., GROSS DOMESTIC PRODUCT THIRD QUARTER 14 (2009), http://www.statssa.gov.za/publications/statsdownload.asp?PPN=P0441&SCH=4524(last visited Dec. 17, 2009).182 Id.183 BOIX, supra note 10, at 19-20.

2010] POST-APARTHEID DEMOCRATIC PROSPECTS 461
are up, the economy is growing, and urbanization and industrializa-tion are exhibiting positive trends. All of these indicia suggest thatthe class struggle will shift to the development of a middle class that isnot based on legally enforced racial categories.
Finally, the post-apartheid government’s policies favor contin-ued economic development. Unlike other Sub-Saharan African coun-tries that underwent massive redistribution programs that entirelydestabilized property rights and scared away foreign investment(Zimbabwe is the most notable example)184 South Africa’s redistribu-tion efforts have been moderate and, most important, aimed at devel-oping a middle class. In 1996, the African National Congresspublished Growth, Employment, and Redistribution (GEAR), whichset out the parties’ economic strategy.185 The program sought to “cre-ate the desired growth by changing the economy to increase theamount of goods and services that are exported, particularly in thenon-gold sector . . . [by creating] a good and stable domestic environ-ment to encourage domestic and foreign investments in South Af-rica.”186 Regarding distribution, the government’s strategy was tocreate jobs by securing foreign investment and investing in domesticinfrastructure, particularly education.187 The program was controver-sial because it was so conservative, but it nevertheless set the tone foreconomic development in post-apartheid South Africa.188 A secondgovernment program that more clearly illustrates the priority of devel-oping a strong middle class was called Black Economic Empowerment– a form of affirmative action targeted at the small-business sector.189
Among other things, the policy gives companies distinct advantageswhen bidding for public works contracts if 51% or more of the companyis owned by black South Africans.190 These policies suggest that thegovernment’s strategies are aimed at building a strong non-racial mid-dle class, which, depending on their success, may help to lesseninequality.191
184 See generally Brett, supra note 4.185 See Nattrass & Seekings, supra note 133, at 482-84 (discussing GEAR).186 African National Congress, Understanding GEAR, http://www.anc.org.za/show.php?include=docs/umrabulo/1997/umrabulo2p.html (last visited Dec. 17,2009).187 Id.188 Beall et al., supra note 178, at 688-90 (discussing controversy of GEAR).189 Jeffrey Herbst, Mbeki’s South Africa, FOREIGN AFF., Dec. 2005, at 100-103 (dis-cussing BEE).190 Id.191 The BEE has been severely criticized as overrun with corruption. Critics al-lege that the program is a pretext for awarding government contracts to a fewselect companies based on patronage and, as a result of this corruption, BEE isserving only to create a small group of post-apartheid elites rather than promote

462 RICHMOND JOURNAL OF GLOBAL LAW & BUSINESS [Vol. 9:4
CONCLUSION
Empirical findings in development theory provide a valuabletool for assessing a country’s prospects for democratic stability. Withthe exception of high levels of income inequality, South Africa has ex-hibited positive trends regarding almost all relevant indicia of eco-nomic development. Because South Africa has exhibited positivequalitative changes in income inequality, I believe that South Africa’soverall prospects for sustaining a stable democracy, as measuredsolely by economic criteria, are relatively bright.
the development of a strong black middle class. See Beall et al., supra note 178, at693-94 (discussing these criticisms). Whether or not these criticisms are true, mypoint here is that the government has taken steps expressly designed to deal withthe inequality. The real effect of these policies may be undermined by corruptionand rule-of-law deficiencies, but the government is nevertheless taking steps to-wards empowering a middle class.

2010] POST-APARTHEID DEMOCRATIC PROSPECTS 463
APPENDIX 1.1: PER CAPITA INCOME (ARGENTINA)
Argentina / Real GDP per capita Real GDP per capita (Constant(Constant Prices: Laspeyres) (I$ in Princes: Laspeyres) (I$ in 2000
Year 1985 Constant Prices) (PWT 5.6)* Constant Prices) (PWT 6.2)**
1960 4481 78591961 4790 80681962 4541 79681963 4298 75451964 4703 80311965 5011 87391966 4948 85691967 5012 87011968 5166 90051969 5505 96471970 5642 97401971 5823 99481972 5816 99461973 5929 101791974 6171 105911975 6055 103641976 5851 101071977 6128 105041978 5846 100931979 6305 107161980 6505 108071981 6070 100801982 5488 94931983 5610 97231984 5726 98291985 5324 89741986 5624 95331987 5720 96231988 5349 92281989 4908 84651990 4708 82311991 . . 90991992 . . 100541993 . . 105351994 . . 109681995 . . 105731996 . . 109111997 . . 116051998 . . 119331999 . . 115872000 . . 113322001 . . 106912002 . . 95612003 . . 101722004 . . 10945* Data from Penn World Tables 5.6. Alan Heston, Robert Summers and Bettina Aten, Penn WorldTable, Center for International Comparisons of Production, Income and Prices at the University ofPennsylvania (available at http://datacentre2.chass.utoronto.ca/pwt56/). This is the exact datarelied upon by Przeworski.**Data from Penn World Tables 6.2. Alan Heston, Robert Summers and Bettina Aten, Penn WorldTable Version 6.2, Center for International Comparisons of Production, Income and Prices at theUniversity of Pennsylvania, September 2006 (available at http://datacentre2.chass.utoronto.ca/pwt62/).

464 RICHMOND JOURNAL OF GLOBAL LAW & BUSINESS [Vol. 9:4
APPENDIX 1.2: PER CAPITA INCOME (SOUTH AFRICA)
Real GDP per capita Real GDP per capita(Constant Prices: (Constant Prices:Laspeyres) (I$ in 1985 Laspeyres) (I$ in 2000 GDP per capita, PPPConstant Prices) Constant Prices) (constant 2005
Year (PWT 5.6)* (PWT 6.2)** international $) (WDI)***1960 2185 4886 . .1961 2211 5195 . .1962 2294 5496 . .1963 2423 5528 . .1964 2547 5511 . .1965 2627 5712 . .1966 2690 5924 . .1967 2798 5981 . .1968 2867 6233 . .1969 3015 6294 . .1970 3264 6404 . .1971 3360 6481 . .1972 3280 6682 . .1973 3418 6707 . .1974 3638 6569 . .1975 3579 6821 . .1976 3535 6984 . .1977 3332 7138 . .1978 3345 7083 . .1979 3351 7220 . .1980 3496 7514 85971981 3679 7467 88411982 3590 7588 85891983 3366 7794 82171984 3502 7761 84151985 3322 7649 81001986 3293 7427 78961987 3299 7458 78631988 3360 7543 80001989 3340 7687 80111990 3250 7723 78241991 3190 7562 75871992 3073 7279 72711993 . . 7284 72071994 . . 7311 72831995 . . 7335 73491996 . . 7545 74971997 . . 7672 75211998 . . 7697 73841999 . . 7916 73782000 . . 8226 74972001 . . 8447 75622002 . . 8655 77652003 . . 8835 79102004 . . 9145 81972005 . . . . 85042006 . . . . 88622007 . . . . 92242008 . . . . 9343* Data from Penn World Tables 5.6. Alan Heston, Robert Summers and Bettina Aten, Penn WorldTable, Center for International Comparisons of Production, Income and Prices at the University ofPennsylvania (available at http://datacentre2.chass.utoronto.ca/pwt56/).**Data from Penn World Tables 6.2. Alan Heston, Robert Summers and Bettina Aten, Penn WorldTable Version 6.2, Center for International Comparisons of Production, Income and Prices at theUniversity of Pennsylvania, September 2006 (available at http://datacentre2.chass.utoronto.ca/pwt62/).*** Data from The World Bank: World Development Indicators: World Bank, InternationalComparison Program database.

2010] POST-APARTHEID DEMOCRATIC PROSPECTS 465
APPENDIX 2.1: INDICES OF INDUSTRIALIZATION*
Employees, Employment in Energy use (kg Employment inagriculture, agriculture of oil industrymale (% of male (% of total equivalent per (% of total
Year employment) employment) capita) employment)1960 . . . . . . . .1961 . . . . . . . .1962 . . . . . . . .1963 . . . . . . . .1964 . . . . . . . .1965 . . . . . . . .1966 . . . . . . . .1967 . . . . . . . .1968 . . . . . . . .1969 . . . . . . . .1970 . . . . . . . .1971 . . . . 2005 . .1972 . . . . 1997 . .1973 . . . . 2074 . .1974 . . . . 2115 . .1975 . . . . 2184 . .1976 . . . . 2212 . .1977 . . . . 2195 . .1978 . . . . 2272 . .1979 . . . . 2298 . .1980 . . . . 2372 . .1981 . . . . 2551 . .1982 . . . . 2710 . .1983 . . . . 2685 . .1984 . . . . 2839 . .1985 . . . . 2771 . .1986 . . . . 2819 . .1987 . . . . 2835 . .1988 . . . . 2890 . .1989 . . . . 2702 . .1990 . . . . 2592 . .1991 . . . . 2655 . .1992 . . . . 2438 . .1993 . . . . 2541 . .1994 . . . . 2622 . .1995 . . . . 2696 . .1996 . . . . 2652 . .1997 . . . . 2626 . .1998 . . . . 2600 . .1999 . . . . 2544 . .2000 15 16 2529 242001 13 11 2436 262002 14 13 2327 262003 13 11 2579 252004 10 9 2790 262005 9 8 2722 262006 9 9 2739 262007 11 9 . . 262008 . . . . . . . .* Data from The World Bank: World Development Indicators: International LabourOrganization, Key Indicators of the Labour Market database; and International EnergyAgency.

466 RICHMOND JOURNAL OF GLOBAL LAW & BUSINESS [Vol. 9:4
APPENDIX 2.2: INDICES OF INDUSTRIALIZATION (CONT.)*
Employment inservices Unemployment Agriculture, Industry, value(% of total (% of total labor value added added
Year employment) force) (% of GDP) (% of GDP)1960 . . . . 11 381961 . . . . 12 381962 . . . . 11 381963 . . . . 11 381964 . . . . 9 391965 . . . . 9 401966 . . . . 9 391967 . . . . 10 381968 . . . . 9 381969 . . . . 8 381970 . . . . 7 381971 . . . . 8 371972 . . . . 8 381973 . . . . 7 401974 . . . . 9 401975 . . . . 8 411976 . . . . 7 421977 . . . . 7 411978 . . . . 7 421979 . . . . 6 461980 . . . . 6 481981 . . . . 6 461982 . . . . 6 441983 . . . . 4 451984 . . . . 5 431985 . . . . 5 441986 . . . . 5 441987 . . . . 6 421988 . . . . 6 421989 . . . . 5 411990 . . . . 5 401991 . . . . 5 381992 . . . . 4 361993 . . . . 4 361994 . . 20 5 351995 . . 17 4 351996 . . 21 4 331997 . . 23 4 331998 . . 25 4 321999 . . 25 4 312000 59 27 3 322001 63 29 4 322002 61 30 4 332003 64 31 4 322004 65 26 3 312005 67 27 3 312006 66 26 3 312007 65 23 3 312008 . . . . 3 31* Data from The World Bank: World Development Indicators: International LabourOrganization, Key Indicators of the Labour Market database; and World Bank nationalaccounts data, and OECD National Accounts data files.

2010] POST-APARTHEID DEMOCRATIC PROSPECTS 467
APPENDIX 2.3: INDICES OF INDUSTRIALIZATION (CONT.)*
Industry, value Manufacturing, Services, etc., Agriculturaladded (annual value added value added land (% of land
Year % growth) (% of GDP) (% of GDP) area)1960 . . 20 51 . .1961 5 21 50 841962 7 21 51 831963 8 21 51 821964 11 22 51 811965 6 23 51 801966 4 23 51 801967 3 22 52 801968 5 22 54 801969 6 22 53 791970 6 23 55 791971 3 22 56 791972 1 21 55 791973 4 22 53 791974 2 21 51 791975 1 23 51 781976 3 23 52 781977 !1 21 52 781978 3 21 51 781979 6 22 48 781980 5 22 45 781981 6 24 48 781982 !3 24 50 781983 !1 23 51 781984 5 23 52 781985 !2 22 51 781986 !2 22 51 781987 !1 22 53 781988 5 23 53 791989 2 23 54 791990 !1 24 55 801991 !3 23 57 801992 !2 22 60 811993 0 21 60 811994 2 21 60 821995 3 21 61 821996 2 20 62 821997 3 20 63 821998 !1 19 64 821999 0 19 65 822000 5 19 65 822001 2 19 64 822002 3 20 63 822003 1 19 65 822004 4 19 66 822005 5 18 67 822006 5 18 66 . .2007 4 18 66 . .2008 5 19 66 . .* Data from The World Bank: World Development Indicators: World Bank national accountsdata, OECD National Accounts data files; and Food and Agriculture Organization electronicfiles and website.

468 RICHMOND JOURNAL OF GLOBAL LAW & BUSINESS [Vol. 9:4
APPENDIX 3: INDICES OF URBANIZATION*
Population in urbanagglomerations of Rural Ruralmore than 1 million population Urban population(% of total (% of total population growth
Year population) population) (% of total) (annual %)1960 23 53 47 1.641961 . . 53 47 2.911962 . . 53 47 2.571963 . . 53 47 2.321964 . . 53 47 2.141965 23 53 47 2.021966 . . 53 47 1.951967 . . 53 47 1.911968 . . 52 48 1.901969 . . 52 48 1.921970 23 52 48 1.941971 . . 52 48 2.191972 . . 52 48 2.181973 . . 52 48 2.151974 . . 52 48 2.121975 24 52 48 2.081976 . . 52 48 2.041977 . . 52 48 1.991978 . . 52 48 1.991979 . . 52 48 2.081980 24 52 48 2.211981 . . 51 49 2.041982 . . 51 49 2.121983 . . 51 49 2.171984 . . 51 49 2.201985 25 51 49 2.201986 . . 50 50 1.531987 . . 50 50 1.451988 . . 49 51 1.331989 . . 49 51 1.171990 25 48 52 0.961991 . . 48 53 1.011992 . . 47 53 1.031993 . . 47 54 1.041994 . . 46 54 1.061995 27 46 55 1.071996 . . 45 55 1.161997 . . 45 55 1.221998 . . 44 56 1.271999 . . 44 56 1.322000 28 43 57 1.372001 . . 43 57 0.712002 . . 42 58 !0.172003 . . 42 58 0.082004 . . 41 59 0.032005 30 41 59 0.002006 . . 40 60 !0.132007 33 40 60 !0.242008 . . 39 61 0.52* Data from The World Bank: World Development Indicators: United Nations, WorldUrbanization Prospects, World Bank national accounts data; and World Bank Staffestimates based on United Nations, World Urbanization Prospects.

2010] POST-APARTHEID DEMOCRATIC PROSPECTS 469
APPENDIX 4: INDICES OF EDUCATION*
Literacy rate,Literacy aggregate forrate, adult sub-Saharantotal (% of School School School Africa, adultpeople ages enrollment, enrollment, enrollment, total (% of15 and primary secondary tertiary people ages 15
Year above) (% net) (% net) (% gross) and above)1960 . . . . . . . . . .1961 . . . . . . . . . .1962 . . . . . . . . . .1963 . . . . . . . . . .1964 . . . . . . . . . .1965 . . . . . . . . . .1966 . . . . . . . . . .1967 . . . . . . . . . .1968 . . . . . . . . . .1969 . . . . . . . . . .1970 . . . . . . . . . .1971 . . . . . . . . . .1972 . . . . . . . . . .1973 . . . . . . . . . .1974 . . . . . . . . . .1975 . . . . . . . . . .1976 . . . . . . . . . .1977 . . . . . . . . . .1978 . . . . . . . . . .1979 . . . . . . . . . .1980 76 . . . . . . . .1981 . . . . . . . . . .1982 . . . . . . . . . .1983 . . . . . . . . . .1984 . . . . . . . . . .1985 . . . . . . . . . .1986 . . . . . . . . . .1987 . . . . . . . . . .1988 . . . . . . . . . .1989 . . . . . . . . . .1990 . . . . . . . . 541991 . . 90 . . 12 . .1992 . . . . . . . . . .1993 . . . . . . . . . .1994 . . . . . . . . . .1995 . . . . . . . . . .1996 82 . . . . . . . .1997 . . . . . . . . . .1998 . . 93 62 14 . .1999 . . 94 62 14 . .2000 . . 92 62 14 592001 . . 91 . . 14 . .2002 . . 90 . . 15 . .2003 . . 90 . . 15 . .2004 . . 88 . . 16 . .2005 . . 86 72 15 . .2006 . . 85 74 15 . .2007 88 86 73 . . 622008 . . . . . . . . . .* Data from The World Bank: World Development Indicators: United Nations Educational,Scientific, and Cultural Organization (UNESCO) Institute for Statistics.
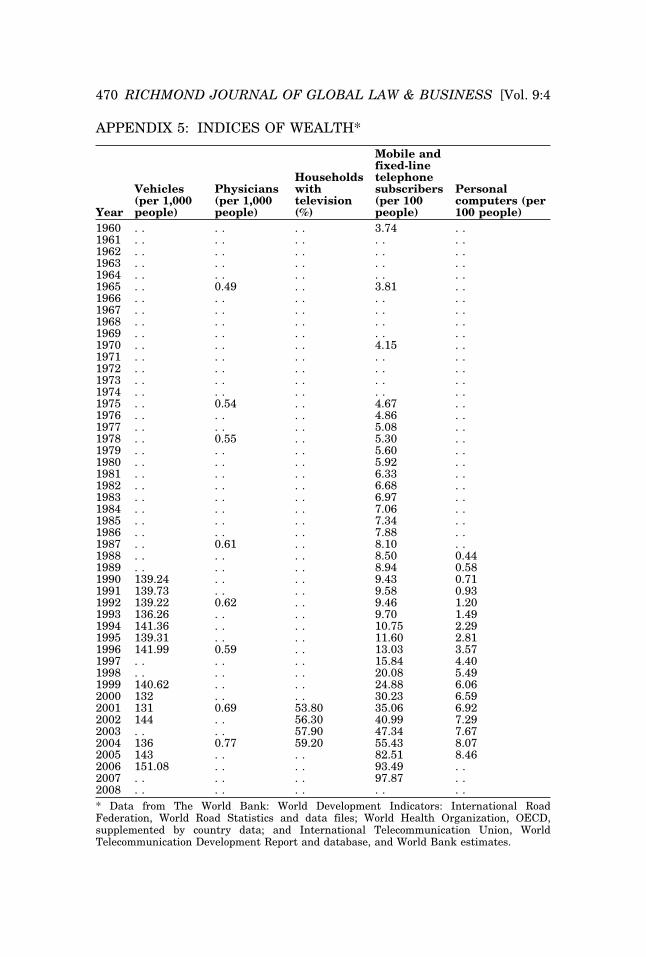
470 RICHMOND JOURNAL OF GLOBAL LAW & BUSINESS [Vol. 9:4
APPENDIX 5: INDICES OF WEALTH*
Mobile andfixed-line
Households telephoneVehicles Physicians with subscribers Personal(per 1,000 (per 1,000 television (per 100 computers (per
Year people) people) (%) people) 100 people)1960 . . . . . . 3.74 . .1961 . . . . . . . . . .1962 . . . . . . . . . .1963 . . . . . . . . . .1964 . . . . . . . . . .1965 . . 0.49 . . 3.81 . .1966 . . . . . . . . . .1967 . . . . . . . . . .1968 . . . . . . . . . .1969 . . . . . . . . . .1970 . . . . . . 4.15 . .1971 . . . . . . . . . .1972 . . . . . . . . . .1973 . . . . . . . . . .1974 . . . . . . . . . .1975 . . 0.54 . . 4.67 . .1976 . . . . . . 4.86 . .1977 . . . . . . 5.08 . .1978 . . 0.55 . . 5.30 . .1979 . . . . . . 5.60 . .1980 . . . . . . 5.92 . .1981 . . . . . . 6.33 . .1982 . . . . . . 6.68 . .1983 . . . . . . 6.97 . .1984 . . . . . . 7.06 . .1985 . . . . . . 7.34 . .1986 . . . . . . 7.88 . .1987 . . 0.61 . . 8.10 . .1988 . . . . . . 8.50 0.441989 . . . . . . 8.94 0.581990 139.24 . . . . 9.43 0.711991 139.73 . . . . 9.58 0.931992 139.22 0.62 . . 9.46 1.201993 136.26 . . . . 9.70 1.491994 141.36 . . . . 10.75 2.291995 139.31 . . . . 11.60 2.811996 141.99 0.59 . . 13.03 3.571997 . . . . . . 15.84 4.401998 . . . . . . 20.08 5.491999 140.62 . . . . 24.88 6.062000 132 . . . . 30.23 6.592001 131 0.69 53.80 35.06 6.922002 144 . . 56.30 40.99 7.292003 . . . . 57.90 47.34 7.672004 136 0.77 59.20 55.43 8.072005 143 . . . . 82.51 8.462006 151.08 . . . . 93.49 . .2007 . . . . . . 97.87 . .2008 . . . . . . . . . .* Data from The World Bank: World Development Indicators: International RoadFederation, World Road Statistics and data files; World Health Organization, OECD,supplemented by country data; and International Telecommunication Union, WorldTelecommunication Development Report and database, and World Bank estimates.