Africa’s Money in Africa: Human and Physical Capital Dimensions
23
4 AFRICA’S MONEY IN AFRICA: HUMAN AND PHYSICAL CAPITAL DIMENSIONS 1 OSABUOHIEN Stephen Evans, Ph.D Dept. of Economics & Development Studies, Covenant University, Ota, Ogun State, Nigeria Email: [email protected] and [email protected] EFOBI Rapuluchukwu Uchenna School of Business Covenant University, Ota, Ogun State, Nigeria Email: [email protected] and [email protected] Abstract Some studies contest that remittance induces ‘careless spending’; others posit that it can promote economic development particularly through human and physical capital. This study observes that not much empirical work that examines the im- pact of remittance on human and physical capital in Africa has been carried out. The main objective of the study was achieved by using a sample of African coun- tries. It was found that remittance impacts both human and physical capital posi- tively and significantly, principally when it is complimented with sound institu- tions. In effect, institutions help to improve the linkage between remittance human and physical capital. 1 The final version is published as: Osabouhien, E.S. & Efobi, U. R (2014).Africa’s Money in Africa: Human and Physical Dimensions. In S. Sahoo & B.K. Pattanaik (Eds.) Global Diaspora and Development: Socioeconomic, Cultur- al and Policy Perspectives, India: Springer, 87-104. DOI: 10.1007/978-81-322- 1047-4_5
-
Upload
covenanuniversity -
Category
Documents
-
view
0 -
download
0
Transcript of Africa’s Money in Africa: Human and Physical Capital Dimensions
4 AFRICA’S MONEY IN AFRICA: HUMAN
AND PHYSICAL CAPITAL DIMENSIONS1
OSABUOHIEN Stephen Evans, Ph.D
Dept. of Economics & Development Studies,
Covenant University, Ota, Ogun State, Nigeria
Email: [email protected] and [email protected]
EFOBI Rapuluchukwu Uchenna
School of Business
Covenant University, Ota, Ogun State, Nigeria
Email: [email protected] and [email protected]
Abstract
Some studies contest that remittance induces ‘careless spending’; others posit that
it can promote economic development particularly through human and physical
capital. This study observes that not much empirical work that examines the im-
pact of remittance on human and physical capital in Africa has been carried out.
The main objective of the study was achieved by using a sample of African coun-
tries. It was found that remittance impacts both human and physical capital posi-
tively and significantly, principally when it is complimented with sound institu-
tions. In effect, institutions help to improve the linkage between remittance human
and physical capital.
1The final version is published as: Osabouhien, E.S. & Efobi, U. R
(2014).Africa’s Money in Africa: Human and Physical Dimensions. In S. Sahoo &
B.K. Pattanaik (Eds.) Global Diaspora and Development: Socioeconomic, Cultur-
al and Policy Perspectives, India: Springer, 87-104. DOI: 10.1007/978-81-322-
1047-4_5

80 OSABUOHIEN Stephen Evans, EFOBI Rapuluchukwu Uchenna80
4.1. INTRODUCTION
Remittance can be conceptualised as monetary transfer (funds) by a migrant to
relatives, other persons or group of persons in his/her country of origin. In Africa,
this is becoming an important source of finance (Gupta et al. 2007; Adams and
Cuecuecha 2010). For instance, the total amount of remittance inflow in Africa
was USD 10.2 billion in 1995, which experienced marked increase to USD 39.7
billion in 2010. In terms of impact, it accounted for 2.6% of gross domestic prod-
ucts (GDP) in 2009, compared to other sources of foreign financial inflow such as
private debt and portfolio equity, which was 0.8% of GDP (World Bank, 2011).
The growth in remittance flow across the world has been attributed to its unique
features such as: less volatility and less dependence on international politics and
events, compared to other sources of foreign inflows (Arieff et al. 2010; Osabu-
ohien and Efobi, 2013).
Remittance inflow can enhance investment in recipient economies when
channelled to development activities such as small scale business outfits, ed-
ucation, construction and repair of buildings (Bjuggren et al. 2010). Thus, re-
mittance has the potential to improve both human capital (through expenditure on
education and health purposes) and physical capital (through development of
business ventures, construction/repair of buildings). However, the aforementioned
impacts of remittance cannot be realised without functional institutional
framework in the recipient economies to channel the inflow to development
purposes. The above is crucial as it has also been debated that the inflow of remit-
tance can lead to a ‘Dutch Disease’ phenomenon and unguarded consumption ex-
penditure resulting from money illusion (Bourdet and Falck 2006).
Institutional framework entails the structure, rules, and guidelines that are set-up
to direct and regulate human behaviours in a given society. This is with the aim of
maintaining social order and protecting economic agents from the challenge of
adverse selection and moral hazards (Akerlof 1970; North, 1991; Osabuohien and
Efobi 2011). In this regard, this study captures institutional framework from two
broad measures and assesses how they relate with remittance. They include: polit-
ical institutions and financial institutions. Political institutions include the institu-
tions guiding the human behaviour as a result of regulations from public pro-
nouncement, voice and accountability of the citizenry and the rule of law.
Financial institutions involve regulations that are aimed at developing the financial
sector so as to considerably utilise the inflow from remittance. They include fi-
nancial development measures such as credit facility, stock market development,
among others.
From the above background, the main thesis of this study is to empirically under-
score the role of institutional framework for effective utilisation of remittance to
4 REMITTANCE, HUMAN AND PHYSICAL CAPITAL IN AFRICA 81
engender human and physical capital development. This study fills the gap in ex-
tant literature as not much empirical work has been done that examines the impact
of remittance on human and physical capital as well as the interaction with institu-
tional framework in Africa. The study achieves its objective using a sample of 44
African countries that cut across the five sub-regions (Central, East, North, South-
ern and West Africa).
The remaining part of the study is sub-divided into sections: next section presents
some background facts on the related concepts, followed by remittance and its im-
pacts. The theoretical framework, empirical model and estimation technique are
encapsulated in section four, while section five reports the empirical results and
discussions. The last section concludes.
4.2. REMITTANCE, HUMAN AND PHYSICAL CAPITAL
This section discusses some background facts on the relationship between
remittance, human and physical capital in Africa, comparing values with other
regions of the world. It also relates remittance to other categories of foreign
financial inflows. First, it starts with the distribution of migrants across the world.
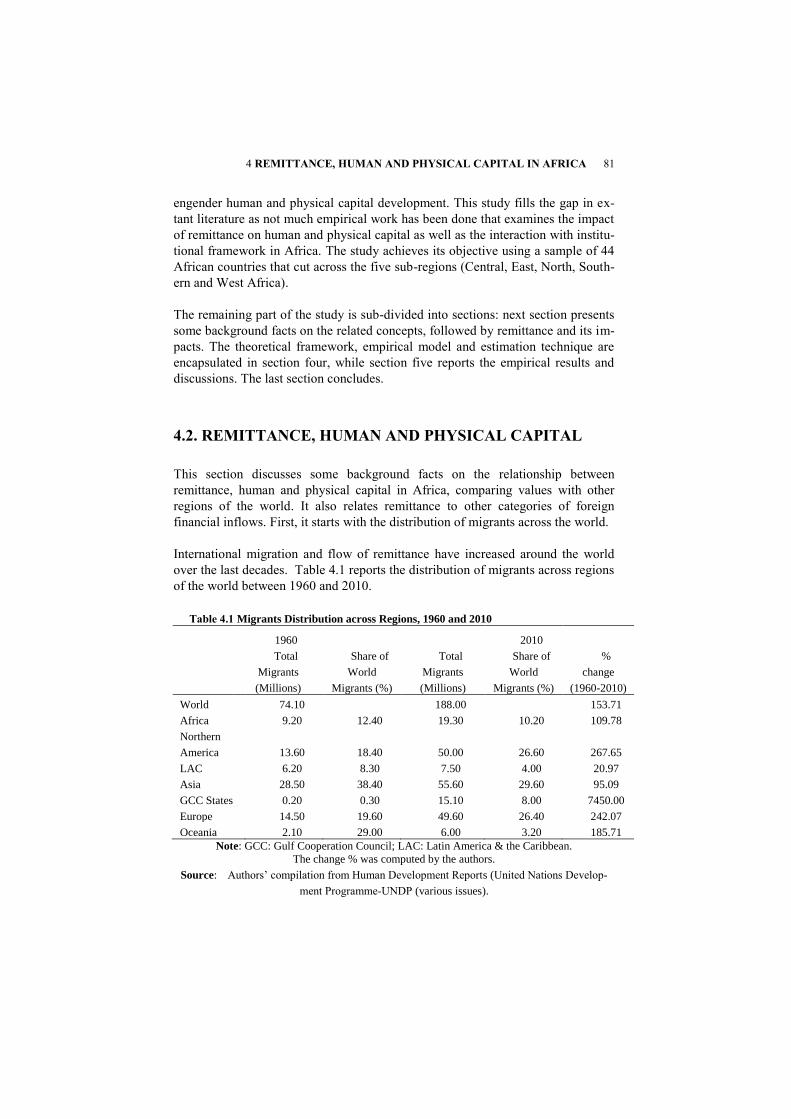
International migration and flow of remittance have increased around the world
over the last decades. Table 4.1 reports the distribution of migrants across regions
of the world between 1960 and 2010.
Table 4.1 Migrants Distribution across Regions, 1960 and 2010
1960
2010
Total
Migrants
(Millions)
Share of
World
Migrants (%)
Total
Migrants
(Millions)
Share of
World
Migrants (%)
%
change
(1960-2010)
World 74.10
188.00
153.71
Africa 9.20 12.40 19.30 10.20 109.78
Northern
America 13.60 18.40 50.00 26.60 267.65
LAC 6.20 8.30 7.50 4.00 20.97
Asia 28.50 38.40 55.60 29.60 95.09
GCC States 0.20 0.30 15.10 8.00 7450.00
Europe 14.50 19.60 49.60 26.40 242.07
Oceania 2.10 29.00 6.00 3.20 185.71
Note: GCC: Gulf Cooperation Council; LAC: Latin America & the Caribbean.
The change % was computed by the authors.
Source: Authors’ compilation from Human Development Reports (United Nations Develop-
ment Programme-UNDP (various issues).
82 OSABUOHIEN Stephen Evans, EFOBI Rapuluchukwu Uchenna82
As can be seen in Table 4.1, the number of African migrants grew by over 109%,
while the global value increased by 153% within the same period. In the respec-
tive regions, the percentage changes between 1960 and 2010 were above 100%
except for Latin America and the Caribbean (LAC) and Asia region, with values
of 20.97% and 95.09%, respectively. The increase in migration rate across the
world can be traced to better earning capacity, demand for skilled labour and pro-
fessional services, as well as developments in most part of the world, especially
the Global North.
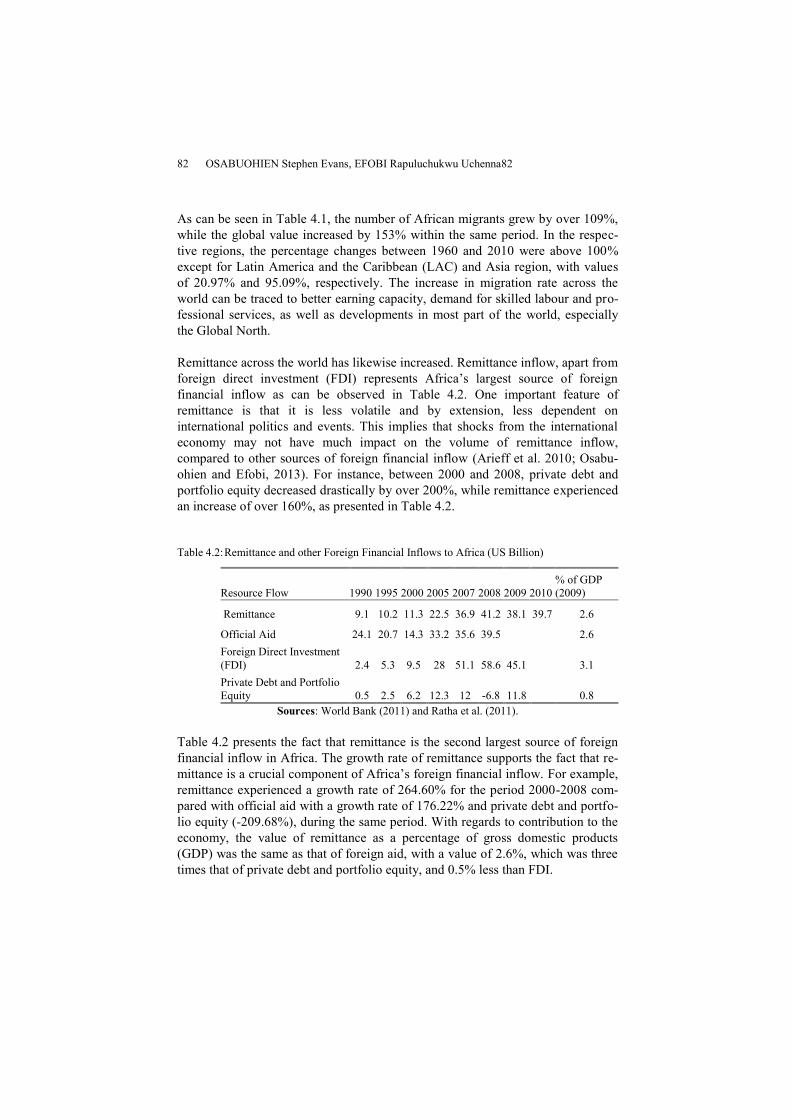
Remittance across the world has likewise increased. Remittance inflow, apart from
foreign direct investment (FDI) represents Africa’s largest source of foreign
financial inflow as can be observed in Table 4.2. One important feature of
remittance is that it is less volatile and by extension, less dependent on
international politics and events. This implies that shocks from the international
economy may not have much impact on the volume of remittance inflow,
compared to other sources of foreign financial inflow (Arieff et al. 2010; Osabu-
ohien and Efobi, 2013). For instance, between 2000 and 2008, private debt and
portfolio equity decreased drastically by over 200%, while remittance experienced
an increase of over 160%, as presented in Table 4.2.
Table 4.2: Remittance and other Foreign Financial Inflows to Africa (US Billion)
Resource Flow 1990 1995 2000 2005 2007 2008 2009 2010
% of GDP
(2009)
Remittance 9.1 10.2 11.3 22.5 36.9 41.2 38.1 39.7 2.6
Official Aid 24.1 20.7 14.3 33.2 35.6 39.5 2.6
Foreign Direct Investment
(FDI) 2.4 5.3 9.5 28 51.1 58.6 45.1 3.1
Private Debt and Portfolio
Equity 0.5 2.5 6.2 12.3 12 -6.8 11.8 0.8
Sources: World Bank (2011) and Ratha et al. (2011).
Table 4.2 presents the fact that remittance is the second largest source of foreign
financial inflow in Africa. The growth rate of remittance supports the fact that re-
mittance is a crucial component of Africa’s foreign financial inflow. For example,
remittance experienced a growth rate of 264.60% for the period 2000-2008 com-
pared with official aid with a growth rate of 176.22% and private debt and portfo-
lio equity (-209.68%), during the same period. With regards to contribution to the
economy, the value of remittance as a percentage of gross domestic products
(GDP) was the same as that of foreign aid, with a value of 2.6%, which was three
times that of private debt and portfolio equity, and 0.5% less than FDI.
4 REMITTANCE, HUMAN AND PHYSICAL CAPITAL IN AFRICA 83
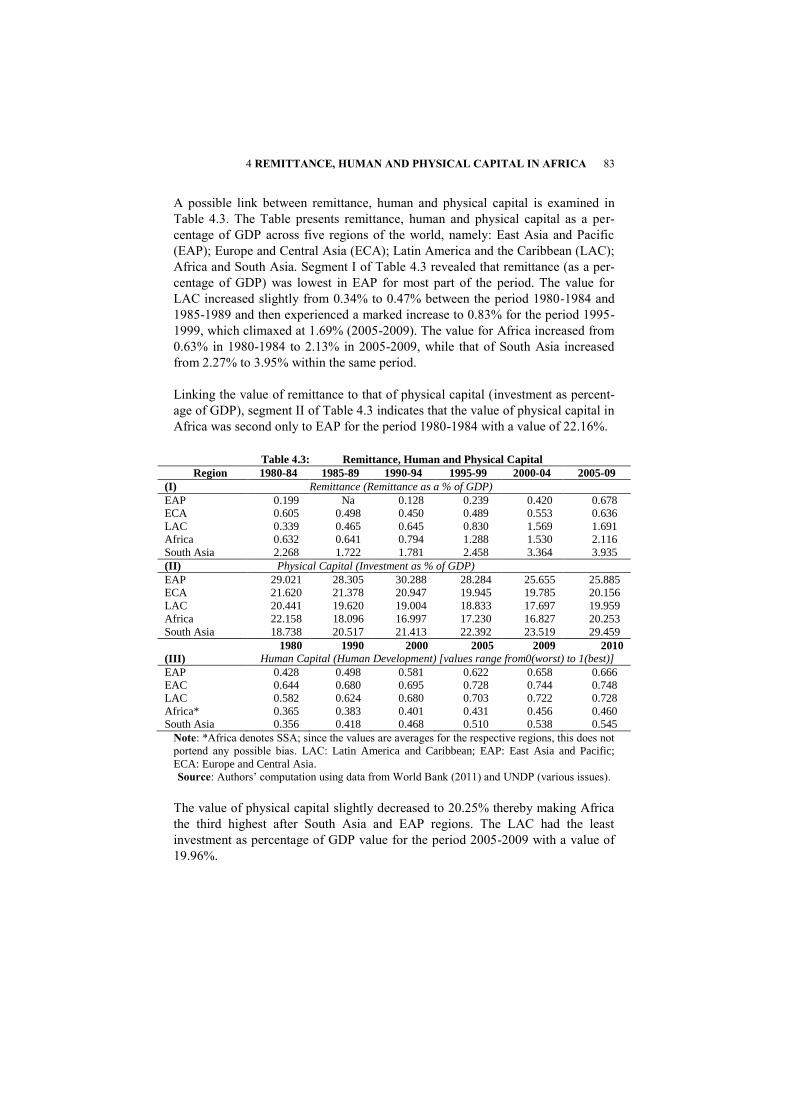
A possible link between remittance, human and physical capital is examined in
Table 4.3. The Table presents remittance, human and physical capital as a per-
centage of GDP across five regions of the world, namely: East Asia and Pacific
(EAP); Europe and Central Asia (ECA); Latin America and the Caribbean (LAC);
Africa and South Asia. Segment I of Table 4.3 revealed that remittance (as a per-
centage of GDP) was lowest in EAP for most part of the period. The value for
LAC increased slightly from 0.34% to 0.47% between the period 1980-1984 and
1985-1989 and then experienced a marked increase to 0.83% for the period 1995-
1999, which climaxed at 1.69% (2005-2009). The value for Africa increased from
0.63% in 1980-1984 to 2.13% in 2005-2009, while that of South Asia increased
from 2.27% to 3.95% within the same period.
Linking the value of remittance to that of physical capital (investment as percent-
age of GDP), segment II of Table 4.3 indicates that the value of physical capital in
Africa was second only to EAP for the period 1980-1984 with a value of 22.16%.
Table 4.3: Remittance, Human and Physical Capital
Region 1980-84 1985-89 1990-94 1995-99 2000-04 2005-09
(I) Remittance (Remittance as a % of GDP)
EAP 0.199 Na 0.128 0.239 0.420 0.678
ECA 0.605 0.498 0.450 0.489 0.553 0.636
LAC 0.339 0.465 0.645 0.830 1.569 1.691
Africa 0.632 0.641 0.794 1.288 1.530 2.116
South Asia 2.268 1.722 1.781 2.458 3.364 3.935
(II) Physical Capital (Investment as % of GDP)
EAP 29.021 28.305 30.288 28.284 25.655 25.885
ECA 21.620 21.378 20.947 19.945 19.785 20.156
LAC 20.441 19.620 19.004 18.833 17.697 19.959
Africa 22.158 18.096 16.997 17.230 16.827 20.253
South Asia 18.738 20.517 21.413 22.392 23.519 29.459
1980 1990 2000 2005 2009 2010
(III) Human Capital (Human Development) [values range from0(worst) to 1(best)]
EAP 0.428 0.498 0.581 0.622 0.658 0.666
EAC 0.644 0.680 0.695 0.728 0.744 0.748
LAC 0.582 0.624 0.680 0.703 0.722 0.728
Africa* 0.365 0.383 0.401 0.431 0.456 0.460
South Asia 0.356 0.418 0.468 0.510 0.538 0.545
Note: *Africa denotes SSA; since the values are averages for the respective regions, this does not
portend any possible bias. LAC: Latin America and Caribbean; EAP: East Asia and Pacific;
ECA: Europe and Central Asia.
Source: Authors’ computation using data from World Bank (2011) and UNDP (various issues).
The value of physical capital slightly decreased to 20.25% thereby making Africa
the third highest after South Asia and EAP regions. The LAC had the least
investment as percentage of GDP value for the period 2005-2009 with a value of
19.96%.
84 OSABUOHIEN Stephen Evans, EFOBI Rapuluchukwu Uchenna84
In Table 4.3, the value for human capital in segment III shows the level of human
capital (proxied by human development index-HDI) across the regions of the
world for the period 1980 to 2010. The values indicate that Europe and Central
Asia have the highest level of human capital development for the period 1980-
1984 with a value of 0.644. This is followed by LAC with a value of 0.582. Africa
was the second lowest with a value of 0.365, followed by South Asia (0.356).
Focusing on Africa, the level of human capital development has experienced some
marginal increase from 0.365 (1980) to 0.383 (1990), and finally to its highest
value 0.460 (2010).
The summary that can be drawn from the foregoing is that remittance and human
capital have experienced growth in Africa over the period while physical capital
was observed to have exhibited some measure of fluctuation over the period.
Thus, the important issue is to empirically examine the linkage between remit-
tance human and physical capital in Africa.
4.3. REMITTANCE AND THE ECONOMY
Carling (2005) viewed remittance as the transfer of economic value by emigrants
or their descendants to their countries of origin. These values include: financial
and non-financial transfers e.g. ideas, behaviours and other social capital (Levitt
and Nyberg-Sorensen 2004). International Monetary Fund-IMF (2011) described
remittance in three ways: 1) workers’ remittances, which are current transfers
made by migrants who are employed and resident in another country for a year or
longer; 2) compensation of employees including wages, salaries and other benefits
earned by non-resident workers for economic activities; 3) migrant transfer such
as financial items arising from change of residence of individuals from one econ-
omy to another. World Bank (2011) also defined workers’ remittance as current
transfers by migrants that are employed or intend to remain employed for more
than one year in another economy where they are considered residents.
This study conceptualises remittance as monetary transfer (funds) by a migrant to
relatives, other persons or group of persons in his/her country of origin. These
funds include personal deposits, investments, intra-family transfers, donations to
relatives or other projects in their country of origin, pension and social security
transfers, inter alia (International Organisation for Migration-IOM 2011). This is
imperative as it has been noted that migrants usually send remittance to relatives
based on three major reasons: personal investment (sending money to
friends/relatives to help develop projects such as buildings), altruism (sending re-
mittance as a matter of love and concerns for relatives), and for counter cyclical
purposes (transfers made to hedge against unfavourable macroeconomic condi-
tions) [Ratha et al. 2011].
4 REMITTANCE, HUMAN AND PHYSICAL CAPITAL IN AFRICA 85
The impact of remittance on the economy differs in varying magnitudes, which
includes: overcoming credit constraints and the accumulation of human capital.
Adams and Cuecuecha (2010) noted that households in Guatemala who receive
remittance tend to spend more on education and housing compared to consump-
tion goods. Furthermore, Adams et al. (2008) studied the effect of remittance on
Ghanaian household consumption and investment and established that Ghanaian
households use remittance received for investment and other consumption. How-
ever, their spending habit is dependent on household characteristics like educa-
tional level of the household, the way the recipient views the economic policy and
lifestyle of the recipient, rather than on remittance receipt.
Institutions can play a meaningful role in the management of economic resources,
including remittance, as most economic transactions require an institutional
framework to thrive (Osabuohien and Efobi 2011). Institutions therefore entail the
framework that help and (re)structure political, economic and social interactions
among economic agents by reducing uncertainties in the exchange of economic
values (North 1991; Acemoglu et al. 2001; Osabuohien and Efobi 2011). North
(1991) added that institutions are humanly formulated framework that control in-
teraction, which consist of informal institutions (such as sanctions, customs, tradi-
tions) and formal institutions (e.g. constitutions, laws). Ostrom (2005) further de-
scribes institutions as the prescriptions that humans use to organise different types
of cyclic and structured interactions, which include institutionalised cultural val-
ues as well as formal organisations.
The quality of institutions in a country can bedevil the efficient utilisation of re-
sources (both financial and non-financial), therefore dampening the transmission
of such resources to productive activities. For instance, in the presence of coup
d’etat, political and economic instability, the efficient transmission of financial re-
sources towards profitable utilisation can be hampered (Rodrik 1999; Acemoglu et
al. 2001). Fosu (2003) also observed from 30 SSA countries using various coups
incidences (‘successful’ coups, abortive coups, and coup plots), that political in-
stability can adversely affect economic activities and by inclusion, remittance uti-
lisation. Reichert (1993) observed that recipient households in Egypt face the chal-
lenge of translating remittance to investment decision because of poor supportive
facilities as well as harsh economic environments that impair growth of enterprise.
International Organisation for Migration-IOM (2011) also noted that in Egypt, up
until 2004, business environments were not conducive and the banking sector was
not as sophisticated, especially with regards to credit availability and facility for
channelling remittance to investment purposes.
The discussions from this section emphasise that efficient utilisation of remittance
(human/ physical capital development) require good institutions (McCormick and
86 OSABUOHIEN Stephen Evans, EFOBI Rapuluchukwu Uchenna86
Wahba 2001; Adams 2005; Ghosh 2006; Bjuggren et al. 2010). This study ob-
served that not much empirical work has been done in understanding this linkage.
4.3.1 Connection between Remittance, Human and Physical Capital
The relative effectiveness of remittance with regards to its transmission mecha-
nism into the developmental process (such as: human and physical capital) can
vary across recipient countries. This can be informed by some factors such as in-
stitutional quality (Bjuggren et al. 2010; Osabuohien and Efobi 2011). The above
is in tandem with the submission of New Institutional Economics (NIE) tenets
that, institutions matter in influencing economic activities. In this wise, the quality
of institutions can either impair or improve the transmission mechanism of remit-
tance.
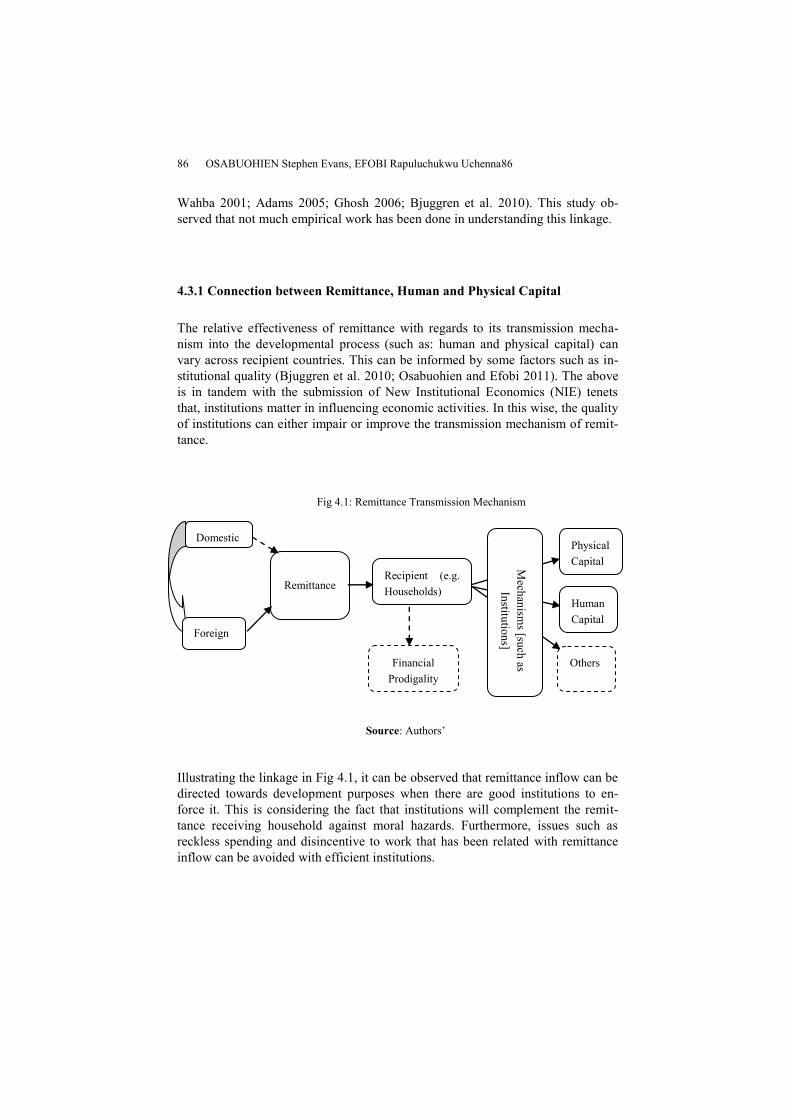
Fig 4.1: Remittance Transmission Mechanism
Source: Authors’
Illustrating the linkage in Fig 4.1, it can be observed that remittance inflow can be
directed towards development purposes when there are good institutions to en-
force it. This is considering the fact that institutions will complement the remit-
tance receiving household against moral hazards. Furthermore, issues such as
reckless spending and disincentive to work that has been related with remittance
inflow can be avoided with efficient institutions.
Domestic
Foreign
Remittance Recipient (e.g.
Households)
Financial
Prodigality
Mech
anism
s [such
as
Institu
tion
s]
Physical
Capital
Human
Capital
Others
4 REMITTANCE, HUMAN AND PHYSICAL CAPITAL IN AFRICA 87
In this context, institutions involve those policies, guidelines and framework that
can help channel remittance receiving households to use their funds for investment
purposes. Tasneem and Chowdhury (2003) noted that for efficient utilisation of
remittance in Bangladesh, there must be adequate institutions to foster investment
at home. In this respect, law and order situation should be improved upon, so that
potential investors feel secure to invest. They went further to advocate for incen-
tive programmes by the government such as bonds, shares and mutual funds at at-
tractive rates to encourage remittance households to invest. Similarly, the Central
Bank of Bangladesh was encouraged to consider allowing financial institutions to
appoint commissioned brokers/agents, with the responsibility of mobilising the
utilisation of remittances.
In the same light, the outcome from the transmission can be influenced by institu-
tions (political institutions, financial institutions etc.) and can be channelled on
productive purposes or outright prodigality. The instance of ‘financial prodigality’
is illustrated elsewhere (Osabuohien and Efobi, 2013). The focus of this study is
on the productive outcome, which includes expenditure on human and physical
capital as depicted by the solid arrow in Fig 4.1.
4.4. THE ECONOMETRIC MODEL
The empirical model formulated for this study comprises of four variables includ-
ing human capital (hk) and physical capital (pk), remittance inflow (Drem), politi-
cal institution (pinst) and financial institution (finst). This can be rewritten explic-
itly as:
Capjit = β0 + β1Dremit + β2Pinstit + β3Finstit + µit (1)
As stated in Fig 4.1, the influence of institutional variables cannot be neglected in
explaining the impact of remittance inflow on both the human and physical capital
of the recipient country. This study took cognisance of this by including the inter-
active variables between remittance and political institutions as well as financial
institutions. Thus, equation (1) was modified as:
Capjit = β0 + β1Dremit + β2Pinstit + β3Finstit + β4Drem_Pinstit +
β5Drem_Finstit + µit (2)
Where:
Capj: capital, which can be divided into two: the human capital investment-
human development index (Hk) and physical capital-ratio of gross fixed
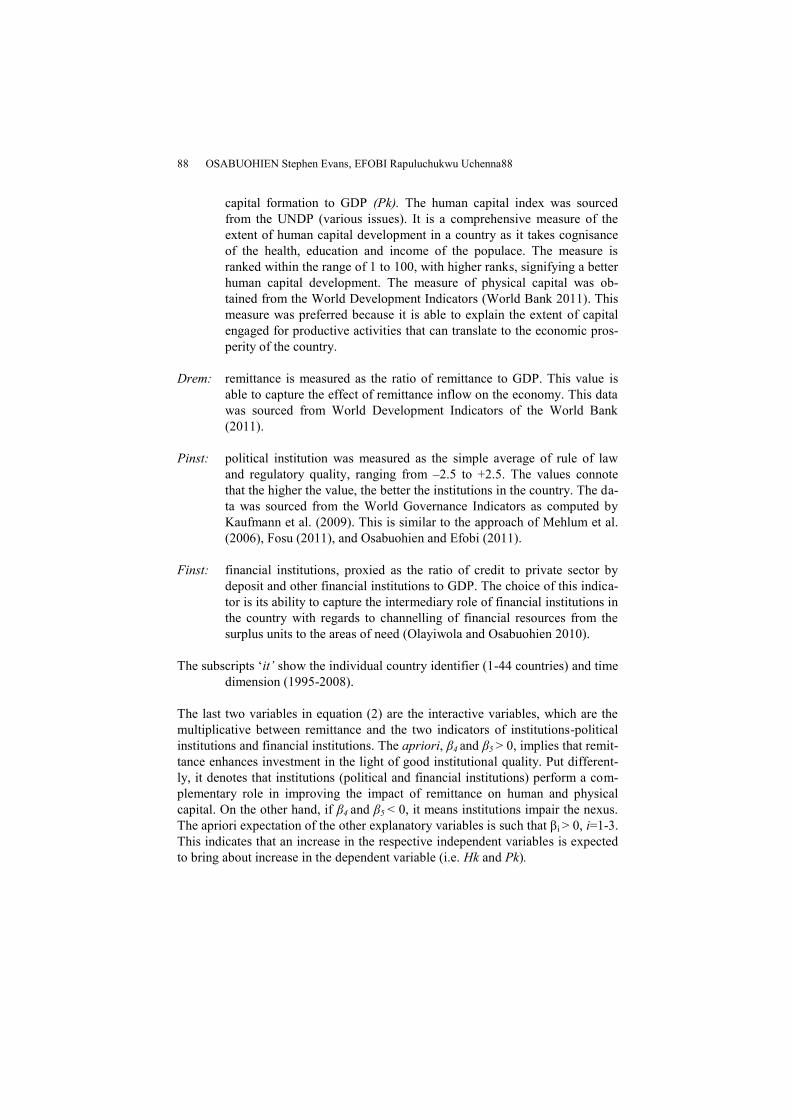
88 OSABUOHIEN Stephen Evans, EFOBI Rapuluchukwu Uchenna88
capital formation to GDP (Pk). The human capital index was sourced
from the UNDP (various issues). It is a comprehensive measure of the
extent of human capital development in a country as it takes cognisance
of the health, education and income of the populace. The measure is
ranked within the range of 1 to 100, with higher ranks, signifying a better
human capital development. The measure of physical capital was ob-
tained from the World Development Indicators (World Bank 2011). This
measure was preferred because it is able to explain the extent of capital
engaged for productive activities that can translate to the economic pros-
perity of the country.
Drem: remittance is measured as the ratio of remittance to GDP. This value is
able to capture the effect of remittance inflow on the economy. This data
was sourced from World Development Indicators of the World Bank
(2011).
Pinst: political institution was measured as the simple average of rule of law
and regulatory quality, ranging from –2.5 to +2.5. The values connote
that the higher the value, the better the institutions in the country. The da-
ta was sourced from the World Governance Indicators as computed by
Kaufmann et al. (2009). This is similar to the approach of Mehlum et al.
(2006), Fosu (2011), and Osabuohien and Efobi (2011).
Finst: financial institutions, proxied as the ratio of credit to private sector by
deposit and other financial institutions to GDP. The choice of this indica-
tor is its ability to capture the intermediary role of financial institutions in
the country with regards to channelling of financial resources from the
surplus units to the areas of need (Olayiwola and Osabuohien 2010).
The subscripts ‘it’ show the individual country identifier (1-44 countries) and time
dimension (1995-2008).
The last two variables in equation (2) are the interactive variables, which are the
multiplicative between remittance and the two indicators of institutions-political
institutions and financial institutions. The apriori, β4 and β5 ˃ 0, implies that remit-
tance enhances investment in the light of good institutional quality. Put different-
ly, it denotes that institutions (political and financial institutions) perform a com-
plementary role in improving the impact of remittance on human and physical
capital. On the other hand, if β4 and β5 < 0, it means institutions impair the nexus.
The apriori expectation of the other explanatory variables is such that βi ˃ 0, i=1-3.
This indicates that an increase in the respective independent variables is expected
to bring about increase in the dependent variable (i.e. Hk and Pk).
4 REMITTANCE, HUMAN AND PHYSICAL CAPITAL IN AFRICA 89
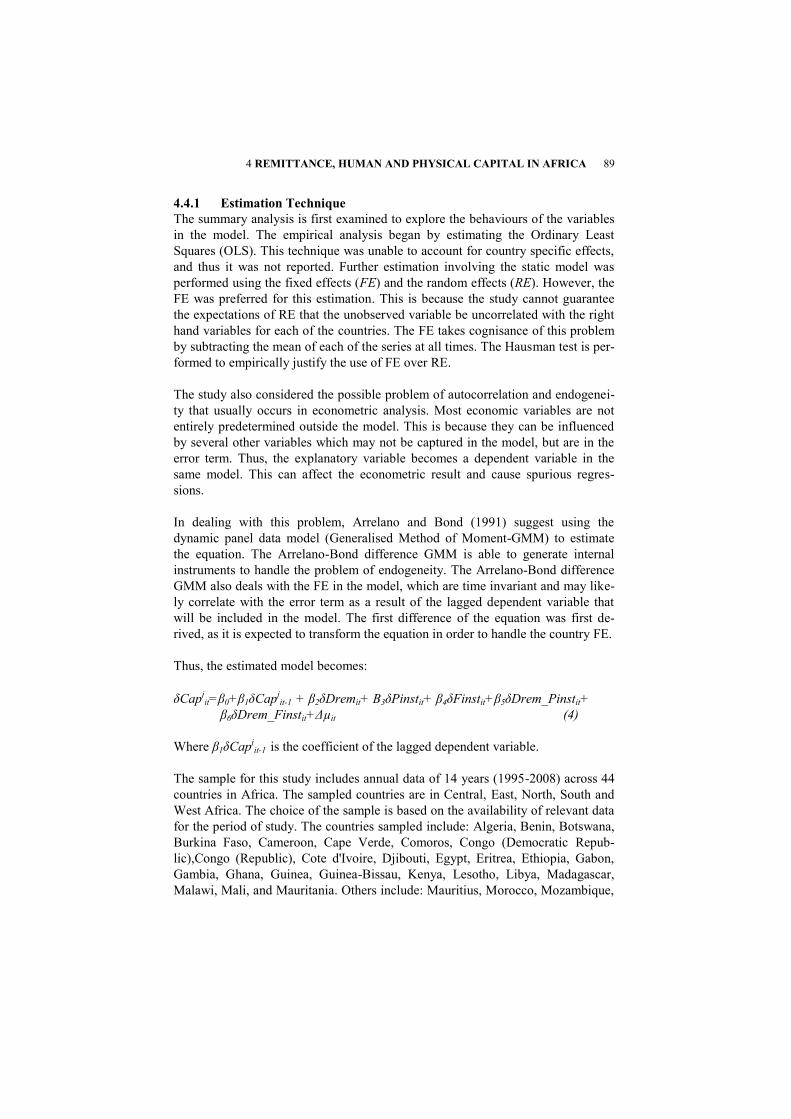
4.4.1 Estimation Technique
The summary analysis is first examined to explore the behaviours of the variables
in the model. The empirical analysis began by estimating the Ordinary Least
Squares (OLS). This technique was unable to account for country specific effects,
and thus it was not reported. Further estimation involving the static model was
performed using the fixed effects (FE) and the random effects (RE). However, the
FE was preferred for this estimation. This is because the study cannot guarantee
the expectations of RE that the unobserved variable be uncorrelated with the right
hand variables for each of the countries. The FE takes cognisance of this problem
by subtracting the mean of each of the series at all times. The Hausman test is per-
formed to empirically justify the use of FE over RE.
The study also considered the possible problem of autocorrelation and endogenei-
ty that usually occurs in econometric analysis. Most economic variables are not
entirely predetermined outside the model. This is because they can be influenced
by several other variables which may not be captured in the model, but are in the
error term. Thus, the explanatory variable becomes a dependent variable in the
same model. This can affect the econometric result and cause spurious regres-
sions.
In dealing with this problem, Arrelano and Bond (1991) suggest using the
dynamic panel data model (Generalised Method of Moment-GMM) to estimate
the equation. The Arrelano-Bond difference GMM is able to generate internal
instruments to handle the problem of endogeneity. The Arrelano-Bond difference
GMM also deals with the FE in the model, which are time invariant and may like-
ly correlate with the error term as a result of the lagged dependent variable that
will be included in the model. The first difference of the equation was first de-
rived, as it is expected to transform the equation in order to handle the country FE.
Thus, the estimated model becomes:
δCap
jit=β0+β1δCap
jit-1 + β2δDremit+ Β3δPinstit+ β4δFinstit+β5δDrem_Pinstit+
β6δDrem_Finstit+Δµit (4)
Where β1δCapjit-1 is the coefficient of the lagged dependent variable.
The sample for this study includes annual data of 14 years (1995-2008) across 44
countries in Africa. The sampled countries are in Central, East, North, South and
West Africa. The choice of the sample is based on the availability of relevant data
for the period of study. The countries sampled include: Algeria, Benin, Botswana,
Burkina Faso, Cameroon, Cape Verde, Comoros, Congo (Democratic Repub-
lic),Congo (Republic), Cote d'Ivoire, Djibouti, Egypt, Eritrea, Ethiopia, Gabon,
Gambia, Ghana, Guinea, Guinea-Bissau, Kenya, Lesotho, Libya, Madagascar,
Malawi, Mali, and Mauritania. Others include: Mauritius, Morocco, Mozambique,
90 OSABUOHIEN Stephen Evans, EFOBI Rapuluchukwu Uchenna90
Namibia, Niger, Nigeria, Rwanda, Senegal, Seychelles, Sierra Leone, South Afri-
ca, Sudan, Swaziland, Tanzania, Togo, Tunisia, Uganda, and Zambia.
4.5. EMPIRICAL RESULTS AND DISCUSSIONS
This section contains the descriptive analysis, the correlation and the econometric
analysis.
4.5.1. Descriptive Analysis
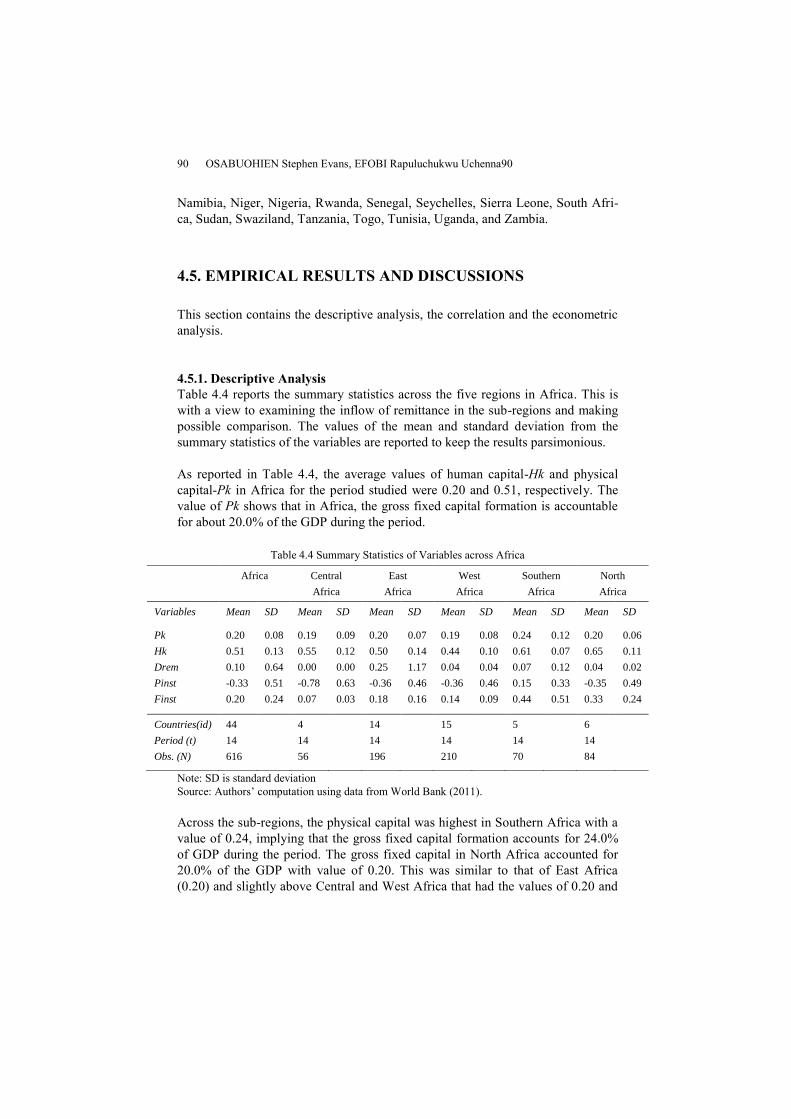
Table 4.4 reports the summary statistics across the five regions in Africa. This is
with a view to examining the inflow of remittance in the sub-regions and making
possible comparison. The values of the mean and standard deviation from the
summary statistics of the variables are reported to keep the results parsimonious.
As reported in Table 4.4, the average values of human capital-Hk and physical
capital-Pk in Africa for the period studied were 0.20 and 0.51, respectively. The
value of Pk shows that in Africa, the gross fixed capital formation is accountable
for about 20.0% of the GDP during the period.
Table 4.4 Summary Statistics of Variables across Africa
Note: SD is standard deviation
Source: Authors’ computation using data from World Bank (2011).
Across the sub-regions, the physical capital was highest in Southern Africa with a
value of 0.24, implying that the gross fixed capital formation accounts for 24.0%
of GDP during the period. The gross fixed capital in North Africa accounted for
20.0% of the GDP with value of 0.20. This was similar to that of East Africa
(0.20) and slightly above Central and West Africa that had the values of 0.20 and
Africa Central
Africa
East
Africa
West
Africa
Southern
Africa
North
Africa
Variables Mean SD Mean SD Mean SD Mean SD Mean SD Mean SD
Pk 0.20 0.08 0.19 0.09 0.20 0.07 0.19 0.08 0.24 0.12 0.20 0.06
Hk 0.51 0.13 0.55 0.12 0.50 0.14 0.44 0.10 0.61 0.07 0.65 0.11
Drem 0.10 0.64 0.00 0.00 0.25 1.17 0.04 0.04 0.07 0.12 0.04 0.02
Pinst -0.33 0.51 -0.78 0.63 -0.36 0.46 -0.36 0.46 0.15 0.33 -0.35 0.49
Finst 0.20 0.24 0.07 0.03 0.18 0.16 0.14 0.09 0.44 0.51 0.33 0.24
Countries(id) 44 4 14 15 5 6
Period (t) 14 14 14 14 14 14
Obs. (N) 616 56 196 210 70 84
4 REMITTANCE, HUMAN AND PHYSICAL CAPITAL IN AFRICA 91
0.19, respectively. The human capital was highest for the North African sub-
region with the value of 0.65 closely followed by Southern Africa that had a value
of 0.61. The average value for East Africa was 0.50 while the least was in West
Africa with the value of 0.44. The major inference from the above is that the level
of human and physical capital development in Africa is quite low.
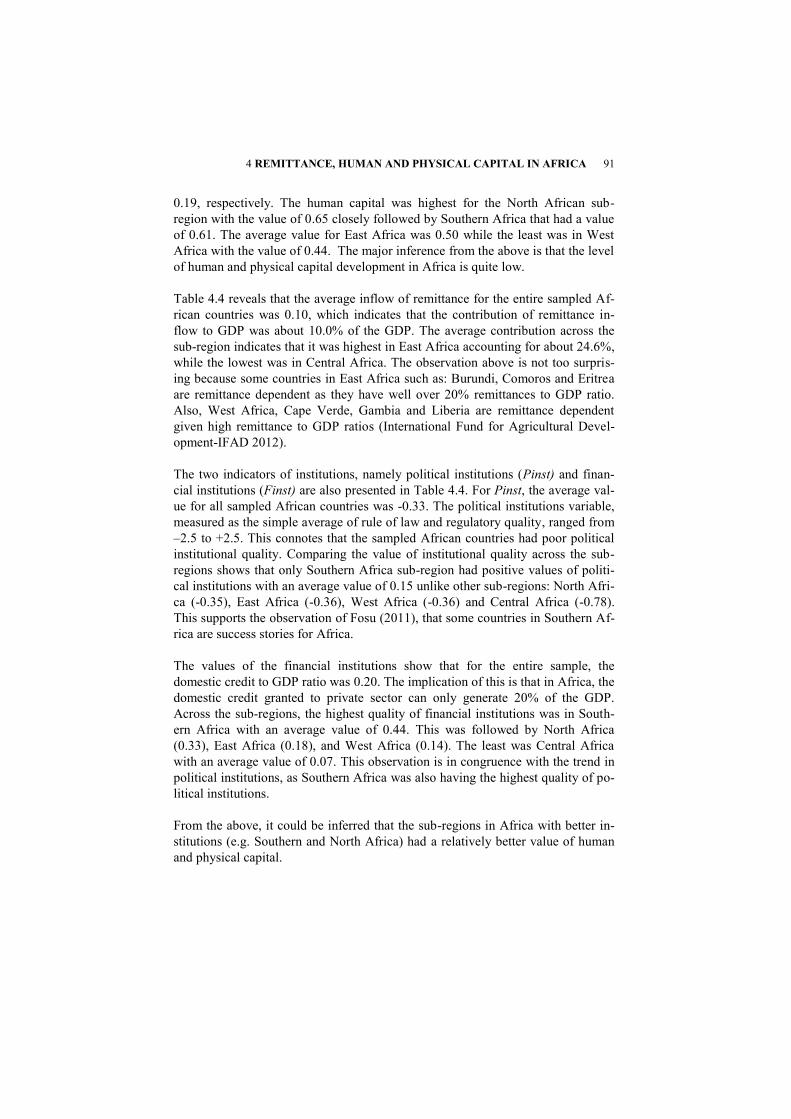
Table 4.4 reveals that the average inflow of remittance for the entire sampled Af-
rican countries was 0.10, which indicates that the contribution of remittance in-
flow to GDP was about 10.0% of the GDP. The average contribution across the
sub-region indicates that it was highest in East Africa accounting for about 24.6%,
while the lowest was in Central Africa. The observation above is not too surpris-
ing because some countries in East Africa such as: Burundi, Comoros and Eritrea
are remittance dependent as they have well over 20% remittances to GDP ratio.
Also, West Africa, Cape Verde, Gambia and Liberia are remittance dependent
given high remittance to GDP ratios (International Fund for Agricultural Devel-
opment-IFAD 2012).
The two indicators of institutions, namely political institutions (Pinst) and finan-
cial institutions (Finst) are also presented in Table 4.4. For Pinst, the average val-
ue for all sampled African countries was -0.33. The political institutions variable,
measured as the simple average of rule of law and regulatory quality, ranged from
–2.5 to +2.5. This connotes that the sampled African countries had poor political
institutional quality. Comparing the value of institutional quality across the sub-
regions shows that only Southern Africa sub-region had positive values of politi-
cal institutions with an average value of 0.15 unlike other sub-regions: North Afri-
ca (-0.35), East Africa (-0.36), West Africa (-0.36) and Central Africa (-0.78).
This supports the observation of Fosu (2011), that some countries in Southern Af-
rica are success stories for Africa.
The values of the financial institutions show that for the entire sample, the
domestic credit to GDP ratio was 0.20. The implication of this is that in Africa, the
domestic credit granted to private sector can only generate 20% of the GDP.
Across the sub-regions, the highest quality of financial institutions was in South-
ern Africa with an average value of 0.44. This was followed by North Africa
(0.33), East Africa (0.18), and West Africa (0.14). The least was Central Africa
with an average value of 0.07. This observation is in congruence with the trend in
political institutions, as Southern Africa was also having the highest quality of po-
litical institutions.
From the above, it could be inferred that the sub-regions in Africa with better in-
stitutions (e.g. Southern and North Africa) had a relatively better value of human
and physical capital.
92 OSABUOHIEN Stephen Evans, EFOBI Rapuluchukwu Uchenna92
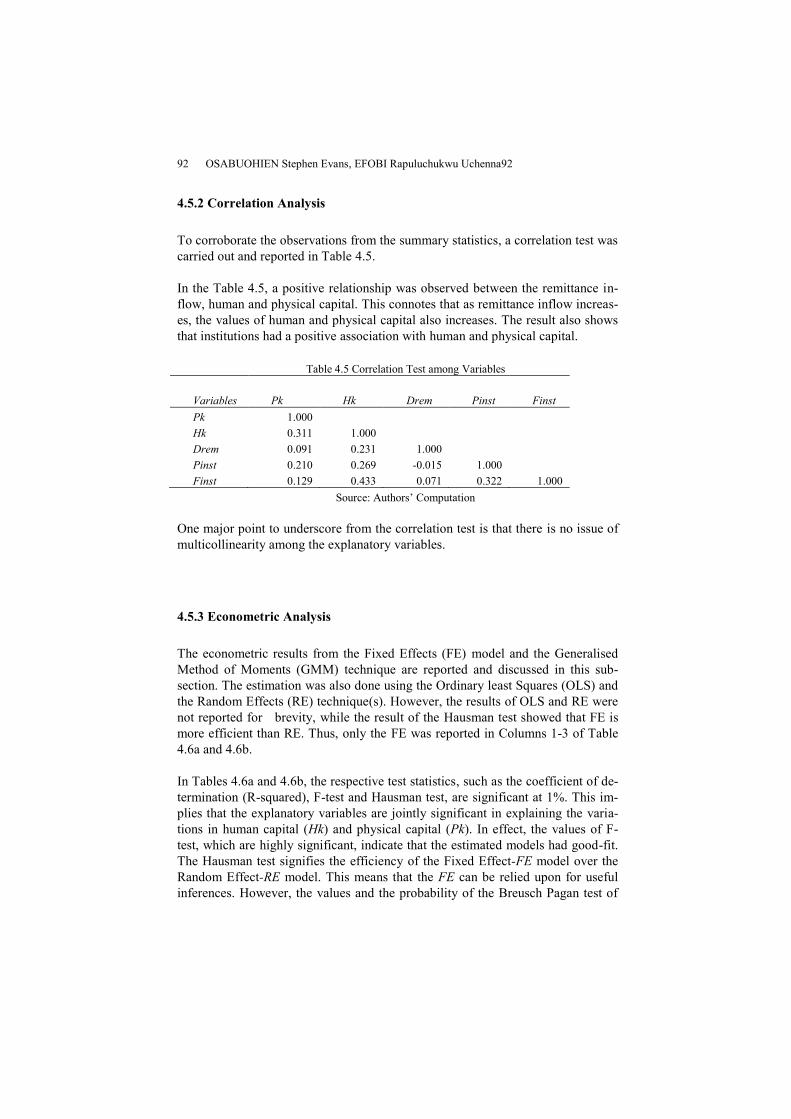
4.5.2 Correlation Analysis
To corroborate the observations from the summary statistics, a correlation test was
carried out and reported in Table 4.5.
In the Table 4.5, a positive relationship was observed between the remittance in-
flow, human and physical capital. This connotes that as remittance inflow increas-
es, the values of human and physical capital also increases. The result also shows
that institutions had a positive association with human and physical capital.
Table 4.5 Correlation Test among Variables
Variables Pk Hk Drem Pinst Finst
Pk 1.000
Hk 0.311 1.000
Drem 0.091 0.231 1.000
Pinst 0.210 0.269 -0.015 1.000
Finst 0.129 0.433 0.071 0.322 1.000
Source: Authors’ Computation
One major point to underscore from the correlation test is that there is no issue of
multicollinearity among the explanatory variables.
4.5.3 Econometric Analysis
The econometric results from the Fixed Effects (FE) model and the Generalised
Method of Moments (GMM) technique are reported and discussed in this sub-
section. The estimation was also done using the Ordinary least Squares (OLS) and
the Random Effects (RE) technique(s). However, the results of OLS and RE were
not reported for brevity, while the result of the Hausman test showed that FE is
more efficient than RE. Thus, only the FE was reported in Columns 1-3 of Table
4.6a and 4.6b.
In Tables 4.6a and 4.6b, the respective test statistics, such as the coefficient of de-
termination (R-squared), F-test and Hausman test, are significant at 1%. This im-
plies that the explanatory variables are jointly significant in explaining the varia-
tions in human capital (Hk) and physical capital (Pk). In effect, the values of F-
test, which are highly significant, indicate that the estimated models had good-fit.
The Hausman test signifies the efficiency of the Fixed Effect-FE model over the
Random Effect-RE model. This means that the FE can be relied upon for useful
inferences. However, the values and the probability of the Breusch Pagan test of
4 REMITTANCE, HUMAN AND PHYSICAL CAPITAL IN AFRICA 93
heteroscedasticity denote that the null hypothesis which states that the errors are
normally distributed cannot be rejected at 10%.
The issue of endogeneity was taken into consideration using the system GMM as
reported in Columns 4-6 of Tables 4.6a and 4.6b, for human and physical capital
as the respective dependent variable. To evaluate the efficiency and validity of the
instruments in the model, the test for First-Order [AR (1)] and Second-Order [AR
(2)] serial correlation of the residuals in the differenced equation were carried out
as reported in the last rows of Tables 4.6a and 4.6b. Usually, the instruments are
said to be valid when they are uncorrelated with the idiosyncratic component of
the error term. This can be ascertained by considering the probability value of the
AR(2), which is expected to be greater than 0.05.
The GMM estimator requires the presence of AR (1) but not AR(2) in the residuals
(Arellano and Bond 1991; Leyaro and Morrissey 2010). Based on the above, the
results in Tables 4.6a and 4.6b points that the instruments were valid, which im-
plies that the GMM estimates are reliable. Hence, this study focuses its discus-
sions on the GMM, especially with regards to how institutions can influence the
transmission of remittance to human and physical capital.
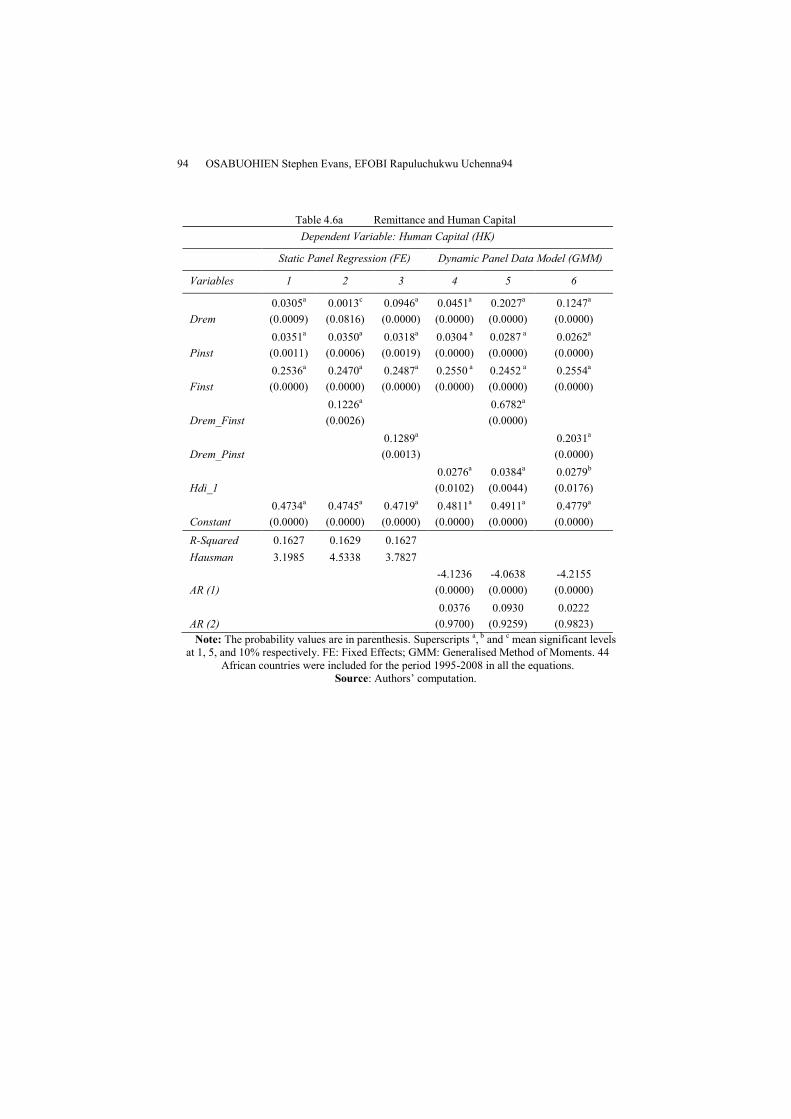
94 OSABUOHIEN Stephen Evans, EFOBI Rapuluchukwu Uchenna94
Table 4.6a Remittance and Human Capital
Dependent Variable: Human Capital (HK)
Static Panel Regression (FE) Dynamic Panel Data Model (GMM)
Variables 1 2 3 4 5 6
Drem
0.0305a
(0.0009)
0.0013c
(0.0816)
0.0946a
(0.0000)
0.0451a
(0.0000)
0.2027a
(0.0000)
0.1247a
(0.0000)
Pinst
0.0351a
(0.0011)
0.0350a
(0.0006)
0.0318a
(0.0019)
0.0304 a
(0.0000)
0.0287 a
(0.0000)
0.0262a
(0.0000)
Finst
0.2536a
(0.0000)
0.2470a
(0.0000)
0.2487a
(0.0000)
0.2550 a
(0.0000)
0.2452 a
(0.0000)
0.2554a
(0.0000)
Drem_Finst
0.1226a
(0.0026)
0.6782a
(0.0000)
Drem_Pinst
0.1289a
(0.0013)
0.2031a
(0.0000)
Hdi_1
0.0276a
(0.0102)
0.0384a
(0.0044)
0.0279b
(0.0176)
Constant
0.4734a
(0.0000)
0.4745a
(0.0000)
0.4719a
(0.0000)
0.4811a
(0.0000)
0.4911a
(0.0000)
0.4779a
(0.0000)
R-Squared 0.1627 0.1629 0.1627
Hausman 3.1985 4.5338 3.7827
AR (1)
-4.1236
(0.0000)
-4.0638
(0.0000)
-4.2155
(0.0000)
AR (2)
0.0376
(0.9700)
0.0930
(0.9259)
0.0222
(0.9823)
Note: The probability values are in parenthesis. Superscripts a, b and
c mean significant levels
at 1, 5, and 10% respectively. FE: Fixed Effects; GMM: Generalised Method of Moments. 44
African countries were included for the period 1995-2008 in all the equations.
Source: Authors’ computation.
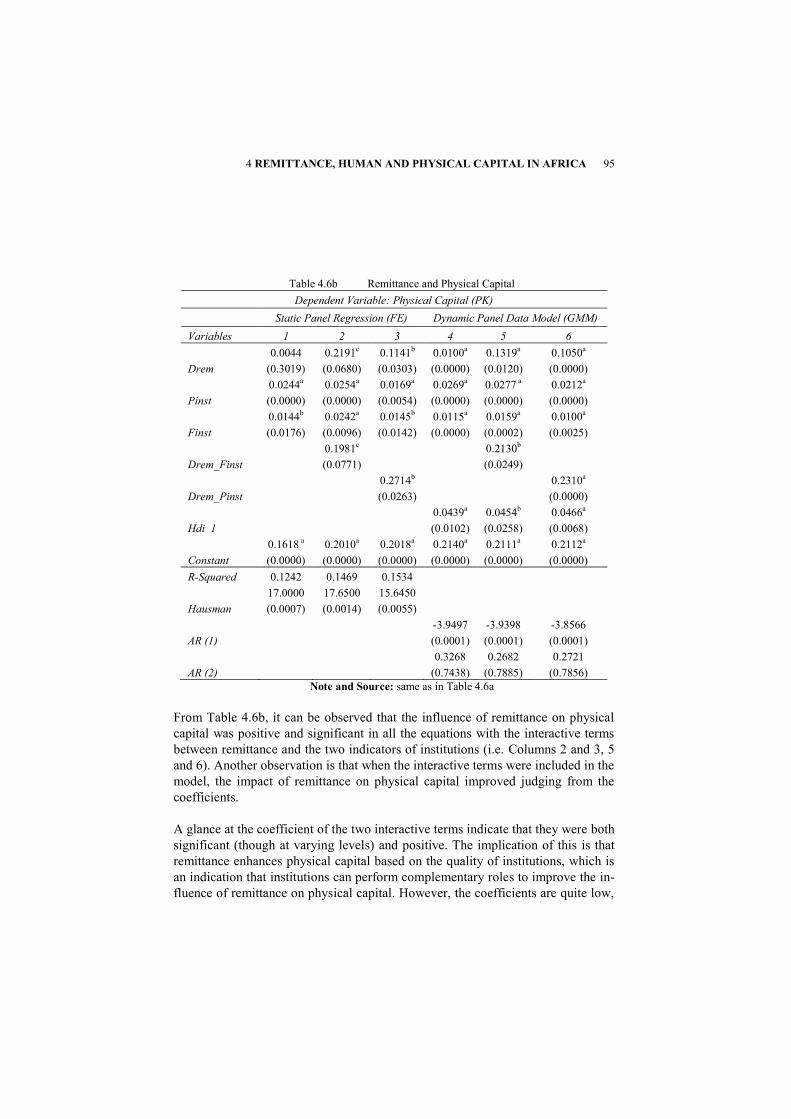
4 REMITTANCE, HUMAN AND PHYSICAL CAPITAL IN AFRICA 95
Table 4.6b Remittance and Physical Capital
Dependent Variable: Physical Capital (PK)
Static Panel Regression (FE) Dynamic Panel Data Model (GMM)
Variables 1 2 3 4 5 6
Drem
0.0044
(0.3019)
0.2191c
(0.0680)
0.1141b
(0.0303)
0.0100a
(0.0000)
0.1319a
(0.0120)
0.1050a
(0.0000)
Pinst
0.0244a
(0.0000)
0.0254a
(0.0000)
0.0169a
(0.0054)
0.0269a
(0.0000)
0.0277 a
(0.0000)
0.0212a
(0.0000)
Finst
0.0144b
(0.0176)
0.0242a
(0.0096)
0.0145b
(0.0142)
0.0115a
(0.0000)
0.0159a
(0.0002)
0.0100a
(0.0025)
Drem_Finst
0.1981c
(0.0771)
0.2130b
(0.0249)
Drem_Pinst
0.2714b
(0.0263)
0.2310a
(0.0000)
Hdi_1
0.0439a
(0.0102)
0.0454b
(0.0258)
0.0466a
(0.0068)
Constant
0.1618 a
(0.0000)
0.2010a
(0.0000)
0.2018a
(0.0000)
0.2140a
(0.0000)
0.2111a
(0.0000)
0.2112a
(0.0000)
R-Squared 0.1242 0.1469 0.1534
Hausman
17.0000
(0.0007)
17.6500
(0.0014)
15.6450
(0.0055)
AR (1)
-3.9497
(0.0001)
-3.9398
(0.0001)
-3.8566
(0.0001)
AR (2)
0.3268
(0.7438)
0.2682
(0.7885)
0.2721
(0.7856)
Note and Source: same as in Table 4.6a
From Table 4.6b, it can be observed that the influence of remittance on physical
capital was positive and significant in all the equations with the interactive terms
between remittance and the two indicators of institutions (i.e. Columns 2 and 3, 5
and 6). Another observation is that when the interactive terms were included in the
model, the impact of remittance on physical capital improved judging from the
coefficients.
A glance at the coefficient of the two interactive terms indicate that they were both
significant (though at varying levels) and positive. The implication of this is that
remittance enhances physical capital based on the quality of institutions, which is
an indication that institutions can perform complementary roles to improve the in-
fluence of remittance on physical capital. However, the coefficients are quite low,
96 OSABUOHIEN Stephen Evans, EFOBI Rapuluchukwu Uchenna96
which implies that improvement in the institutional quality in Africa is germane
especially in the transmission of remittance to physical capital. This finding lends
support to some previous empirical work (e.g. Fosu 2011; Osabuohien and Efobi
2011) that institutions play a crucial role in the economic outcomes in Africa. This
is paramount as institutions can influence how economic actors (e.g. households
and firms) make decisions on their investment outlays.
The above can further be elucidated when the coefficients of remittance are exam-
ined. In the GMM equations (i.e. Columns 4-6), it is observed that without the in-
teraction variables, the impact of remittance on physical capital was about 1%
(0.01), which increased significantly to about 13.2% and 10.5% when interacted
with the two indicators of institutions. This signifies that the level of impact of
remittance on physical capital can in effect be improved with institutions. In other
words, without adequate institutions (both financial and political), the impact of
remittance on physical capital development will be low. This finding therefore
helps to clarify the argument as to whether institutions play a complementary or
substitutive role in remittance enhancing investment (human and physical capital)
in Africa.
Observing other explanatory variables in Table 4.6b, it can be seen that institu-
tional indicators (notably financial and political institutions) exert a significant and
positive impact(s) on physical capital. Thus, improvement in the quality of institu-
tions in Africa is crucial in enhancing the level of physical capital development.
This finding supports the submission of Mehlum et al. (2006) and Fosu (2011) that
economic growth in Africa depends on good institutions and not merely resources.
This can be substantiated further as investors will be willing to carry out invest-
ment expenditure when they are optimistic of the returns on their investment and
their rights are relatively protected. This is imperative as most African countries
still have low levels of physical capital despite the available rich resources.
Taking into consideration the lagged value of physical capital, it is obvious that
the previous value of physical capital significantly and positively exerts influence
on its current value. This denotes that investors take into cognisance the nature of
the previous year’s level of physical capital in making the current level of invest-
ment. This may also be as a result of learning by doing, as the experience of the
previous period can be brought to bear in the current period. In essence, an im-
provement in the current level of physical capital investment will significantly im-
prove the level of next period’s physical investment, ceteris paribus.
For human capital (Hk), the results in Table 4.6a were quite similar to those in Ta-
ble 4.6b especially the significance and magnitude of remittance, indicators of in-
stitutions and the two interactive terms. In effect, the results show that remittance
has a positive and significant impact on the human capital, which also improves
4 REMITTANCE, HUMAN AND PHYSICAL CAPITAL IN AFRICA 97
with the inclusion of the interactive variables. The magnitude improved from
about 4.51% to 20.3% but later declined to 12.5% when the model was estimated
with the two interactive terms. This becomes clearer when one considers the posi-
tive and significant interaction between remittance and the two indicators of insti-
tutions. The impact of remittance on human capital can be improved, given the
complimentary role of political and financial institutions. The above is further but-
tressed by the positive and significant influence of political and financial institu-
tions on human capital as can be seen in Table 4.6a. The coefficients indicate that
a unit improvement in political and financial institutions will result in a 0.03 unit
and a 0.25 unit increase in human capital, respectively. The results in Table 4.6a
equally support the fact that previous level of human capital can significantly in-
fluence the current level positively.
The connotation of these findings is that remittance can influence human capital
investment more substantially in an economy with strong political and financial
institutions. This is crucial as remittance will be better transmitted to human capi-
tal investment activities like education, on-the-job-training and so on, in an econ-
omy with relatively stable political and financial institutions. For instance, in situ-
ations where the government supports education advancement through the quality
of educational institutions and the reduction in cost of education, the remittance
inflow can be productively invested in education of the household members.
4.6 CONCLUSION
The study established that remittance significantly and positively influences hu-
man and physical capital with the level of impact increasing, when interacted with
institutions. This finding implies that remittance can enhance the level of both
human and physical capital when there is the complimentary role of institutions.
The policy recommendation that can stem from this finding is that any efforts to
improve institutional quality in Africa will be relevant in enhancing the impact of
remittance on human and physical capital. Thus, this clarifies the debate on
whether institutions play a complementary or substitutive role in transmitting re-
mittance to human and physical capital in Africa. This is essential as the study
confirms that the impact of remittance on human and physical capital more than
tripled when it was interacted with institutions. Thus, institutions help to improve
the nexus between remittance and capital (human and physical).
In addition, institutions have a positive and significant impact on both human and
physical capital. This means that when institutional quality in Africa is enhanced,
it will translate to better improvement of human and physical capital. The policy
implication of this is that good institutions are essential in developing both human
98 OSABUOHIEN Stephen Evans, EFOBI Rapuluchukwu Uchenna98
and physical capital in Africa as it will make the investment environment friendli-
er. In this case, returns to both human and physical capital will be more rewarding
in an economy where rights are protected. Thus, an improvement of the quality of
political and financial institutions in Africa cannot be overemphasised in the de-
velopment of human and physical capital. Another important conclusion is that the
previous levels of human and physical capital are essential in determining their
current level. The policy implication of this is that steps in the direction of enhanc-
ing today’s level of human and physical capital will go a long way in improving
tomorrow’s outcome. The earlier efforts are targeted at improving the current level
of these investments, the better Africa secures her future.
Acknowledgments1Conference grants from Royal Economic Society, UK and Covenant Univer-
sity, Nigeria are appreciated. The authors also express gratitude to the organisers of the Interna-
tional Conference on “Diaspora and Development: Prospects and Implications for Nation States”
for covering in-country expenses as well as valuable comments from participants. The helpful
assistance from Beecroft Ibukun of Covenant University in the revision process is appreciated.
Comments from anonymous reviewers are acknowledged.
REFERENCES
Acemoglu,D. Johnson, S. and Robinson, J. (2001). The colonial origin of compar-
ative development: An Empirical Investigation. American Economic Re-
view, 91(5): 1369-1401.
Adams, R. (2005). Remittances, Household Expenditure and Investment in Gua-
temala. World Bank Policy Research Working Paper, 1-36.
Adams, R. and Cuecuecha, A. (2010). Remittances, Household Expenditure and
Investment in Guatemala. World Development, 20 (10), 1-16.
Adams, R., Cuecuecha, A. and Page, J. (2008). Remittances, Consumption and
Investment in Ghana. The World Bank Development Economics
Department Policy research Working Paper, No.4515
Akerlof, G. (1970). The Market for Lemon: Qualitative Uncertainty and the Mar-
ket Mechanism. Quarterly Journal of Economics, 84, 488-500.
Arieff, A, Weiss, M., and Jones, V. (2010). The Global Financial Crisis: Impact
on Sub-Saharan Africa and Global Policy Responses, Congressional Re-
search Service. Available at http://www.fas.org/sgp/crs/row/R40778.pdf
4 REMITTANCE, HUMAN AND PHYSICAL CAPITAL IN AFRICA 99
Arrelano, M. and Bond, S. (1991). Some Tests of Specification for Panel Data:
Monte Carlo Evidence and an Application for Employment Equations.
Review of Economic Studies, 58(2), 277-297.
Bjuggren, P., Dzansi, J., and Shukur, G. (2010). Remittances and Investment.
Centre for Excellence for Science and Innovation Studies (CESIS) Work-
ing Paper, No. 216.
Bourdet, Y. and Falck, H. (2006). Emigrants’ Remittances and Dutch Disease in
Cape Verde. International Economic Journal, 20 (3), 267-284.
Carling, J. (2005). Migrant Remittances and Development Cooperation. Oslo:
International Peace Research Institute (PRIO)
Fosu, A.K. (2011). Terms of Trade and Growth of Resource Economies; A Tale of
Two Countries. UNU-WIDER Working Paper, No.2011/28.
Fosu, A.K. (2003). Political Instability and Export Performance in Sub-Saharan
Africa. Journal of Development Studies, 39(4), 68-82.
Ghosh, B. (2006). Migrants’ Remittances and Development: Myths, Rhetoric and
Realities, Paper for the International Organization for Migration, pp. 1-
118.
Gupta, S., Pattillo, C., and Wagh, S. (2007). Making Remittance Work for Africa.
Finance and Development. 44(2), 1-8.
International Fund for Agricultural Development-IFAD (2012), Africa
http://www.ifad.org/remittances/maps/africa.htm, Accessed 22/04/2012).
International Monetary Fund-IMF (2011). Balance of Payment Statistics database.
Retrieved from http://elibrary-
data.imf.org/FindDataReports.aspx?d=33061&e=170784.
International Organization for Migration (2011). A Study on Remittances and In-
vestment Opportunities for Egyptian Migrants. Cairo, Egypt, Internation-
al Organization for Migration
Kaufmann, D., Kraay, A., and Mastruzzi, M. (2009). Governance Matters VII:
Aggregate and Individual Governance Indicators 1996-2008. World Bank
Policy Research Working Paper, No. 4978.
100 OSABUOHIEN Stephen Evans, EFOBI Rapuluchukwu Uchenna100
Levitt, P. and Nyberg-Sorensen, N. (2004). The Transnational Turn in Migration.
Global Migration Perspectives, No.6, October, Global Commission on
International Migration, pp. 1-14.
Leyaro, V. and Morrissey, O., (2010), Trade and Growth: Is Sub-Saharan Africa
Different. CREDIT Research Paper, No.10/04.
McCormick, B. and Wahba, J. (2001). Overseas Work Experience, Savings and
Entrepreneurship amongst Return Migrants to LDCs. Scottish Journal of
Political Economy, 48(2), 164-178.
Mehlun, H., Moene, K., and Toryik, (2006). Institutions and the Resource Curse.
Economic Journal, 116, 1-20.
North, D. C. (1991). Institutions. The Journal of Economic Perspectives, 5(1): 97-
112.
Olayiwola, K.W., and Osabuohien, E.S. (2010). Evaluation of the Role of Fiscal
Policy in Promoting Savings, Investment and Capital Formation in
Nigeria. The Journal of Banking and Finance, 10(1), 26-45.
Osabuohien, E. and Efobi, U. (2011). Trade Outcomes in Africa’s Regional
Economic Communities and Institutional Quality: Some Policy
Prescriptions, Petroleum-Gas University of Ploiesti Economic Sciences
Series, LXIII (4), 19-32.
Osabouhien, E.S. and Efobi, U. R (2013). Africa’s Money in Africa. South African
Journal of Economics, (in press).
Ostrom, E. (2005).Understanding Institutional Diversity. Princeton: Princeton Universi-
ty Press.
Ratha, D., Mohapatra, S., Ozden, C., Plaza, S., Shaw, W., and Shimeles, A.
(2011). Leveraging Migration for Africa; Remittances, Skills and Invest-
ments, Washington, DC: World Bank.
Reichert, C. (1993). Labour Migration and rural Development in Egypt: A Study
of Return Migration in Six Villages. Sociologia Ruralis, 33(1): 42-60.
Rodrik, D. (1999). The New Global Economy and Developing Countries: Making
Openness Work, London: Overseas Development Institute.
Tasneem, S., and Chowdhury, A. (2003). Migrant Worker Remittances and Micro-
Finance in Bangladesh. Social Finance Programme Working Paper, No.

4 REMITTANCE, HUMAN AND PHYSICAL CAPITAL IN AFRICA 101
38. Available at
http://www.ilo.int/wcmsp5/groups/public/@ed_emp/documents/publicati
on/wcms_117970.pdf
United Nations Development Programme-UNDP (Various Issues) Human Devel-
opment Index, New York: UNDP.
World Bank (2011). World Development Indicators. Washington, DC: World
Bank.