evaluating retail banking service quality and convenience with ...
21
EVALUATING RETAIL BANKING SERVICE QUALITY AND CONVENIENCE WITH MCDA TECHNIQUES: A CASE STUDY AT THE BANK BRANCH LEVEL Fernando A. F. Ferreira 1 , Sérgio P. Santos 2 , Paulo M. M. Rodrigues 3 , Ronald W. Spahr 4 1 School of Management and Technology, Polytechnic Institute of Santarém, Complexo Andaluz, Apartado 295, 2001-904 Santarém, Portugal 2 Faculty of Economics, University of Algarve, Campus de Gambelas, 8005-139 Faro, Portugal 3 Economics and Research Department, Banco de Portugal, Av. Almirante Reis 71, 1150-012 Lisboa, Portugal 4 Fogelman College of Business and Economics, University of Memphis, Memphis, TN 38152-3120, USA E-mails: 1 [email protected] (corresponding author); 2 [email protected]; 3 [email protected]; 4 [email protected] Received 03 December 2011; accepted 05 March 2012 Abstract: The intangibility of banking services makes the evaluation of service quality and customer convenience difficult to measure. This paper aims to construct an integrated evaluation system for retail banking service quality and convenience at the bank branch level by combining cognitive mapping with measuring attractiveness by a categorical based evaluation technique. We strive to introduce transparency in the decision making process and add to the performance literature in retail banking. Strengths, weaknesses and practical applications of our multiple criteria evaluation system are also discussed. Keywords: bank branch, cognitive mapping, multiple criteria decision analysis, perfor- mance evaluation, retail banking, service quality and convenience. Reference to this paper should be made as follows: Ferreira, F. A. F.; Santos, S. P.; Rodrigues, P. M. M.; Spahr, R. W. 2014. Evaluating retail banking service quality and convenience with MCDA techniques: a case study at the bank branch level, Journal of Business Economics and Management 15(1): 1–21. JEL Classification: C44, G21, L25, M10. Introduction Retail banking service quality and convenience at the bank branch level is difficult to measure because of its intrinsic intangibility and difficulty in identifying appropriate measurement factors. Bankers obviously recognize the importance of intangible factors, but under conditions of increasing competition, instability and pressures placed on op- erating margins, the evaluation of customer perceived service quality is fundamental to improvement initiatives. It is generally agreed that intensification of competition result- ing from the recent world-wide economic crisis places additional pressure on already Journal of Business Economics and Management ISSN 1611-1699 print / ISSN 2029-4433 online 2014 Volume 15(1): 1–21 doi:10.3846/16111699.2012.673504 Copyright © 2014 Vilnius Gediminas Technical University (VGTU) Press Technika http://www.tandfonline.com/TBEM
-
Upload
khangminh22 -
Category
Documents
-
view
0 -
download
0
Transcript of evaluating retail banking service quality and convenience with ...
EVALUATING RETAIL BANKING SERVICE QUALITY AND CONVENIENCE WITH MCDA TECHNIQUES: A CASE STUDY
AT THE BANK BRANCH LEVEL
Fernando A. F. Ferreira1, Sérgio P. Santos2, Paulo M. M. Rodrigues3, Ronald W. Spahr4
1School of Management and Technology, Polytechnic Institute of Santarém, Complexo Andaluz, Apartado 295, 2001-904 Santarém, Portugal
2Faculty of Economics, University of Algarve, Campus de Gambelas, 8005-139 Faro, Portugal
3Economics and Research Department, Banco de Portugal, Av. Almirante Reis 71, 1150-012 Lisboa, Portugal
4Fogelman College of Business and Economics, University of Memphis, Memphis, TN 38152-3120, USA
E-mails: [email protected] (corresponding author); [email protected]; [email protected]; [email protected]
Received 03 December 2011; accepted 05 March 2012
Abstract: The intangibility of banking services makes the evaluation of service quality and customer convenience difficult to measure. This paper aims to construct an integrated evaluation system for retail banking service quality and convenience at the bank branch level by combining cognitive mapping with measuring attractiveness by a categorical based evaluation technique. We strive to introduce transparency in the decision making process and add to the performance literature in retail banking. Strengths, weaknesses and practical applications of our multiple criteria evaluation system are also discussed.Keywords: bank branch, cognitive mapping, multiple criteria decision analysis, perfor-mance evaluation, retail banking, service quality and convenience.Reference to this paper should be made as follows: Ferreira, F. A. F.; Santos, S. P.; Rodrigues, P. M. M.; Spahr, R. W. 2014. Evaluating retail banking service quality and convenience with MCDA techniques: a case study at the bank branch level, Journal of Business Economics and Management 15(1): 1–21.JEL Classification: C44, G21, L25, M10.
IntroductionRetail banking service quality and convenience at the bank branch level is difficult to measure because of its intrinsic intangibility and difficulty in identifying appropriate measurement factors. Bankers obviously recognize the importance of intangible factors, but under conditions of increasing competition, instability and pressures placed on op-erating margins, the evaluation of customer perceived service quality is fundamental to improvement initiatives. It is generally agreed that intensification of competition result-ing from the recent world-wide economic crisis places additional pressure on already
Journal of Business Economics and ManagementISSN 1611-1699 print / ISSN 2029-4433 online
2014 Volume 15(1): 1–21doi:10.3846/16111699.2012.673504
Copyright © 2014 Vilnius Gediminas Technical University (VGTU) Press Technikahttp://www.tandfonline.com/TBEM

2
chronically low operating margins. Recent pressures have had direct implications in the way banks manage their service quality and define their customer approach. Also, as defended by Serna (2005) and Ferreira et al. (2011a), few would contest that bank branches still maintain an important role in retail banking. Thus, it is generally agreed that retail banking success depends strongly on the competitiveness and improvement of branch service systems where bank branch evaluation may be the primary tool in determining how to improve service quality and convenience.Because of the importance of bank branch service quality and convenience to retail banking, significant literature exists regarding bank branch in retail banking perfor-mance (e.g. Athanassopoulos 1997; Jackson III et al. 2003; Karatepea et al. 2005; Ar-bore, Busacca 2009; Lee et al. 2011; Oliveira, von Hippelb 2011 – these contributions are further discussed in section 1). Nevertheless, despite the strengths and widespread application of current methodologies, each has specific shortcomings where clarifica-tion is required on a number of issues. According to Ferreira et al. (2011a), there are technical issues related to the method by which evaluation criteria are selected, and the way trade-offs among those same criteria are made explicit. By integrating cogni-tive mapping with measuring attractiveness by a categorical based evaluation technique (MACBETH) (Bana e Costa, Vansnick 1994; Bana e Costa et al. 2005), we aim to sup-port the development of an integrated evaluation system for bank branch service quality and convenience, and overcome some current methodological limitations. Following Ferreira et al. (2011b), our integrated evaluation system will also add to the literature on performance evaluation in retail banking.The multiple criteria evaluation system framework applied in this paper extends the work of Ferreira et al. (2011a), which was a result of several working sessions with a panel of directors from the most representative banks in Portugal. Since both studies make use of the same methodological tools, it should be clarified that the difference between them relies on the fact that Ferreira et al. (2011a) present a broader framework for bank branch performance evaluation, while our study is particularly focused on bank branch service quality and convenience. We know of no prior work integrating the use of cognitive mapping and MACBETH to support the conception of evaluation systems for retail banking service quality and convenience at the bank branch level.The remainder of the paper is structured as follows. The next section includes an over-view of the literature on the evaluation of bank branch service quality and convenience. Section 2 describes and illustrates the evaluation system designed in our study. Section 3 concludes the paper by discussing advantages and disadvantages of our framework, and presenting lines for future research.
1. Bank branch service quality and convenience evaluation
A number of different approaches have been developed to deal explicitly with bank branch performance evaluation. Ferreira et al. (2011a) categorize these approaches in four major groups of methods: (1) traditional coefficients or ratios; (2) parametric or econometric models; (3) non-parametric techniques, and (4) integrated systems for performance evaluation. According to the authors, remarkable progress in bank branch
F. A. F. Ferreira, et al. Evaluating retail banking service quality and convenience with MCDA techniques ...
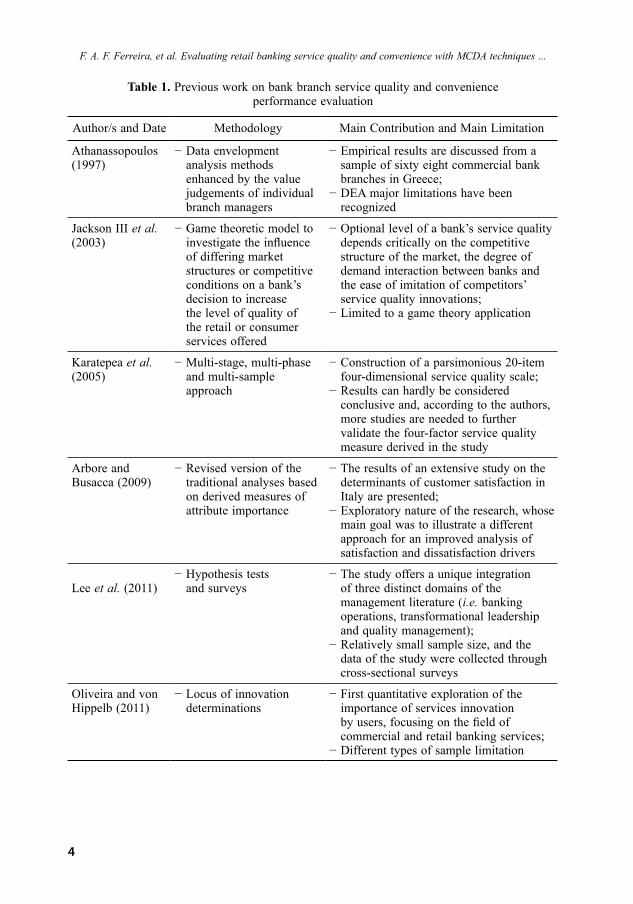
3
evaluation has occurred over the last few decades; however, none of these methods is without limitations. Traditional coefficients (or ratios), for example, have been criticized for being operationally limited when dealing with multiple criteria and providing lagged information (Lau, Sholihin 2005; Wu et al. 2006). On the other hand, parametric (or econometric) models have been criticized for requiring a prior specification of a cost or production function and their limitation in explaining causal relations among criteria. Following this line, non-parametric techniques (or distribution-free tools as they are also categorized) have been recognized as a step forward by the performance measurement literature, namely in terms of bank branch performance evaluation (Dekker, Post 2001; Halkos, Salamouris 2004; Paradi, Schaffnit 2004; Camanho, Dyson 2005; Yang 2009). One of the most widely and successfully applied non-parametric techniques is data en-velopment analysis (DEA), introduced by Charnes et al. (1978), which allows handling multiple input and multiple output variables without requiring the a prior definition of a production function. Still, standard DEA models have been criticized for associating all deviations from the frontier to inefficiency, ignoring possible stochastic noise in the data and, even knowing that some outputs are not easily measurable, they accept the possibility of fully characterizing the production function. As a result of the perceived dissatisfaction with some of the previous identified shortcomings, integrated systems for performance evaluation have been conceived and improved over the years (for a broader discussion on business performance evaluation methodologies, see, for instance, Acar, Zehir 2010; Pan et al. 2012). However, in the banking context, integrated performance evaluation systems such as the balanced scorecard (BSC) (Kaplan, Norton 1992) have been largely unexplored. Except for a few essays in the banking context (e.g. Suwignjo et al. 2000; Ferreira et al. 2011a), integrated systems for performance measurement, with special emphasis on the BSC, are generally criticized for, among other things, over simplicity and not explicitly specifying how compensations among evaluation criteria are made (Brignall 1992; Neely et al. 1995; Davis, Albright 2004). As a complement to this discussion, Table 1 presents a synopsis of the literature on bank branch service quality and convenience performance evaluation. As is evident, despite the progress achieved, most limitations discussed are still present.Based on the information in Table 1 and previous discussion, two major lines of criti-cism have been pointed out with regard to the four categories of methods. First, the method by which performance measures are often selected may lead to the omission of relevant evaluation criteria (Lovell, Pastor 1997; Manandhar, Tang 2002; Jahanshahloo et al. 2004; Camanho, Dyson 2005). Second, according to Suwignjo et al. (2000), Mi-helis et al. (2001) and Wu et al. (2006), among others, a lack of transparency exists in the way compensations among those criteria are obtained. We illustrate, in the following sections of the paper, how the integrated use of cognitive mapping and the MACBETH process may improve the selection of appropriate performance measures and/or the calculation of compensations among evaluation criteria.
Journal of Business Economics and Management, 2014, 15(1): 1–21
4
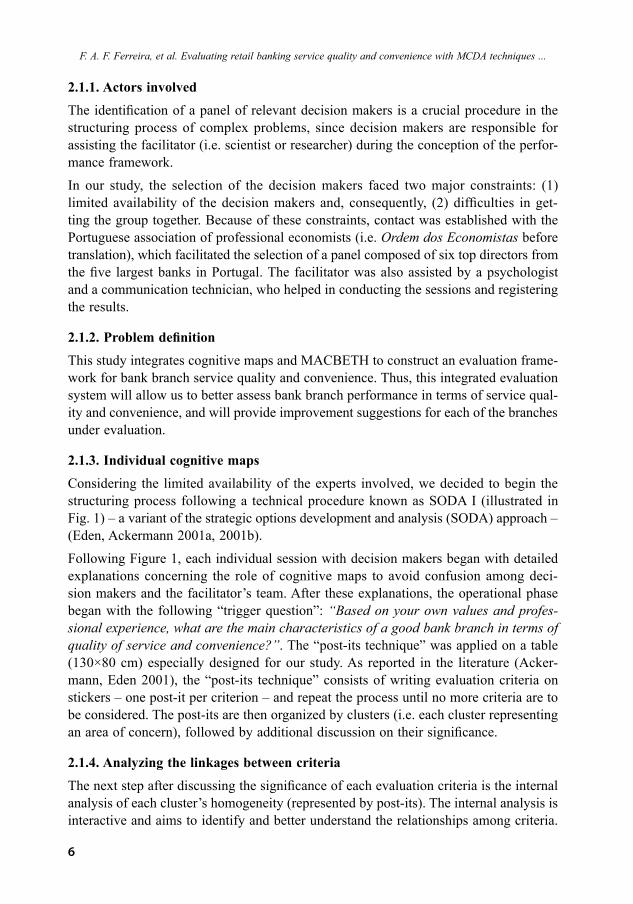
Table 1. Previous work on bank branch service quality and convenience performance evaluation
Author/s and Date Methodology Main Contribution and Main Limitation
Athanassopoulos (1997)
− Data envelopment analysis methods enhanced by the value judgements of individual branch managers
− Empirical results are discussed from a sample of sixty eight commercial bank branches in Greece;
− DEA major limitations have been recognized
Jackson III et al. (2003)
− Game theoretic model to investigate the influence of differing market structures or competitive conditions on a bank’s decision to increase the level of quality of the retail or consumer services offered
− Optional level of a bank’s service quality depends critically on the competitive structure of the market, the degree of demand interaction between banks and the ease of imitation of competitors’ service quality innovations;
− Limited to a game theory application
Karatepea et al. (2005)
− Multi-stage, multi-phase and multi-sample approach
− Construction of a parsimonious 20-item four-dimensional service quality scale;
− Results can hardly be considered conclusive and, according to the authors, more studies are needed to further validate the four-factor service quality measure derived in the study
Arbore and Busacca (2009)
− Revised version of the traditional analyses based on derived measures of attribute importance
− The results of an extensive study on the determinants of customer satisfaction in Italy are presented;
− Exploratory nature of the research, whose main goal was to illustrate a different approach for an improved analysis of satisfaction and dissatisfaction drivers
Lee et al. (2011) − Hypothesis tests and surveys
− The study offers a unique integration of three distinct domains of the management literature (i.e. banking operations, transformational leadership and quality management);
− Relatively small sample size, and the data of the study were collected through cross-sectional surveys
Oliveira and von Hippelb (2011)
− Locus of innovation determinations
− First quantitative exploration of the importance of services innovation by users, focusing on the field of commercial and retail banking services;
− Different types of sample limitation
F. A. F. Ferreira, et al. Evaluating retail banking service quality and convenience with MCDA techniques ...

5
2. A “new” system for bank branch service quality and convenience evaluation
It is generally recognized in the cognitive mapping literature that cognitive maps are im-portant instruments for the structuring process of complex problems (Ackermann, Eden 2001; Eden, Ackermann 2001b; Belton, Stewart 2002; Eden, Banville 2003; Eden 2004; Ackermann, Eden 2011; Howick, Ackermann 2011; Ackermann 2012). Because cog-nitive maps are simple, interactive and extremely versatile, they promote discussion among the agents involved in a decision making process. This allows increased trans-parency and a reduction of omitted criteria. Thus, simplicity and transparency lead to a better understanding of the problem under consideration.MACBETH, also an interactive approach, was created in the 1990s by Bana e Costa and Vansnick (Bana e Costa, Vansnick 1994; Bana e Costa et al. 2005). Technically, it is an interactive procedure conceived to quantify differences of attractiveness among elements of a certain set. Through a constructive learning process supported by visual interactive software (M-MACBETH), MACBETH is based on numerical scales of in-tervals. More specifically, the fulfilment of value judgement matrices allows for the definition of local preference scales for the different criteria involved in the decision process and assists the definition of cardinal value functions for the descriptors created (Bana e Costa et al. 2005). In our study, numerical interval scales are important to as-sist the calculation of trade-offs among criteria. As a particular technique in multiple criteria decision analysis (MCDA), MACBETH supports a constructivist based analysis, and uses a simple qualitative question-answer procedure that allows decision makers to enter the domain of cardinal measurement (Belton, Stewart 2002) (for other examples of MCDA techniques, see also Korsakienė 2004; Podvezko 2009). From this perspec-tive, and given that MACBETH takes into account the professional experience of the decision makers involved in the process, it brings together humanistic, interactive and constructivist insights. Thus, the technique has great potential in dealing with weighted measurements in bank branch service quality and convenience evaluation, where most of the variables are intangible.Following a constructivist approach, this study is organized in three phases. The struc-turing phase, which is concerned with the development of cognitive and strategic maps, allows us to identify important performance measures for bank branch service quality and convenience evaluation. The evaluation phase focuses on the application of MAC-BETH to allow for trade-offs among explicit criteria. Finally, the recommendations phase discusses the major advantages and shortcomings of the integrated use of these methods (i.e. cognitive maps and MACBETH) for bank branch service quality and convenience evaluation.
2.1. The structuring phaseDuring the structuring phase, a panel of decision makers and actors were organized, in several work sessions, to address the formulation of a “trigger question”; the conception of cognitive and strategic maps; and the definition of a tree of evaluation criteria, with associated descriptors and respective impact levels.
Journal of Business Economics and Management, 2014, 15(1): 1–21
6
2.1.1. Actors involvedThe identification of a panel of relevant decision makers is a crucial procedure in the structuring process of complex problems, since decision makers are responsible for assisting the facilitator (i.e. scientist or researcher) during the conception of the perfor-mance framework.In our study, the selection of the decision makers faced two major constraints: (1) limited availability of the decision makers and, consequently, (2) difficulties in get-ting the group together. Because of these constraints, contact was established with the Portuguese association of professional economists (i.e. Ordem dos Economistas before translation), which facilitated the selection of a panel composed of six top directors from the five largest banks in Portugal. The facilitator was also assisted by a psychologist and a communication technician, who helped in conducting the sessions and registering the results.
2.1.2. Problem definitionThis study integrates cognitive maps and MACBETH to construct an evaluation frame-work for bank branch service quality and convenience. Thus, this integrated evaluation system will allow us to better assess bank branch performance in terms of service qual-ity and convenience, and will provide improvement suggestions for each of the branches under evaluation.
2.1.3. Individual cognitive mapsConsidering the limited availability of the experts involved, we decided to begin the structuring process following a technical procedure known as SODA I (illustrated in Fig. 1) – a variant of the strategic options development and analysis (SODA) approach – (Eden, Ackermann 2001a, 2001b).Following Figure 1, each individual session with decision makers began with detailed explanations concerning the role of cognitive maps to avoid confusion among deci-sion makers and the facilitator’s team. After these explanations, the operational phase began with the following “trigger question”: “Based on your own values and profes-sional experience, what are the main characteristics of a good bank branch in terms of quality of service and convenience?”. The “post-its technique” was applied on a table (130×80 cm) especially designed for our study. As reported in the literature (Acker-mann, Eden 2001), the “post-its technique” consists of writing evaluation criteria on stickers – one post-it per criterion – and repeat the process until no more criteria are to be considered. The post-its are then organized by clusters (i.e. each cluster representing an area of concern), followed by additional discussion on their significance.
2.1.4. Analyzing the linkages between criteriaThe next step after discussing the significance of each evaluation criteria is the internal analysis of each cluster’s homogeneity (represented by post-its). The internal analysis is interactive and aims to identify and better understand the relationships among criteria.
F. A. F. Ferreira, et al. Evaluating retail banking service quality and convenience with MCDA techniques ...

7
The final step in this procedure is for decision makers and the communication techni-cian to register all links (represented by arrows) in the individual cognitive map. As defended by Ackermann and Eden (2001), this last procedure should be accompanied by the opportunity to reflect, reshape and/or even restart the entire process.
2.1.5. “Aggregated” and “strategic” maps
Following the SODA I methodological guidelines, the task of aggregating the indi-vidual cognitive maps resulting from the individual sessions is the responsibility of the research team. The research team then proposes a single collective map (also known as “aggregated map”) to be discussed with the panel members in a group workshop.
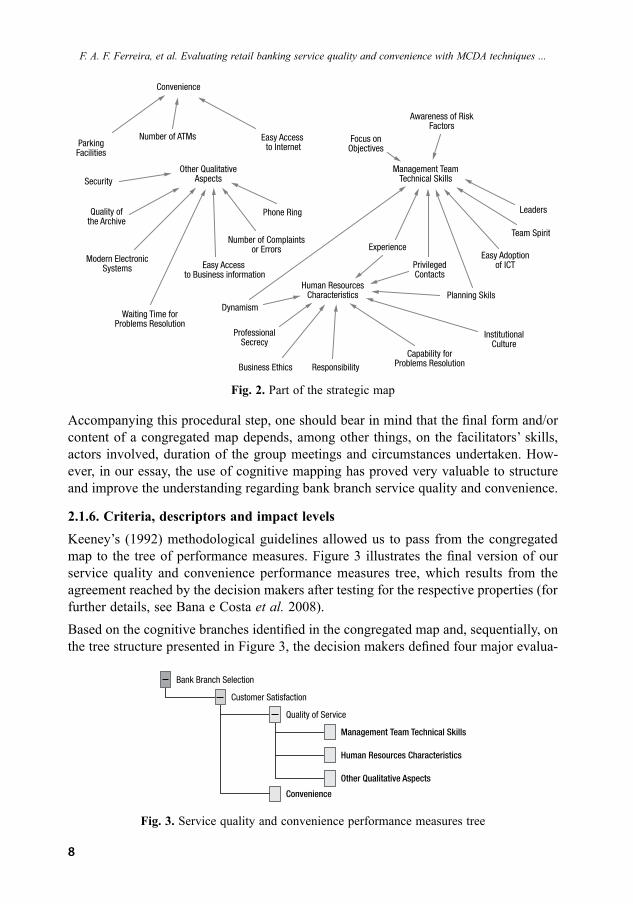
During the group meeting, the aggregated map should be presented to the panel mem-bers for discussion because it should serve as a negotiation tool to reach a compromise solution. The constructivist approach is omnipresent during the process, and interactiv-ity among actors allows the panel members to achieve convergence of opinions. As highlighted by Ackermann and Eden (2001), Cossette and Audet (2003), when this convergence of opinions is achieved in terms of form and content, the collective map is designated as “congregated” or “strategic” map. Figure 2 presents part of the congre-gated map developed in this study.
Fig. 1. SODA I conceptual scheme
IndividualMap I
No
Yes
IndividualMap I
IndividualMap I
No No
Yes
Yes
Aggregated Map
Yes
Discussion
Consensus?No
Agreement? Agreement? Agreement?
Strategic Map
Dis
cuss
ion
Analysis
Journal of Business Economics and Management, 2014, 15(1): 1–21
8
Accompanying this procedural step, one should bear in mind that the final form and/or content of a congregated map depends, among other things, on the facilitators’ skills, actors involved, duration of the group meetings and circumstances undertaken. How-ever, in our essay, the use of cognitive mapping has proved very valuable to structure and improve the understanding regarding bank branch service quality and convenience.
2.1.6. Criteria, descriptors and impact levelsKeeney’s (1992) methodological guidelines allowed us to pass from the congregated map to the tree of performance measures. Figure 3 illustrates the final version of our service quality and convenience performance measures tree, which results from the agreement reached by the decision makers after testing for the respective properties (for further details, see Bana e Costa et al. 2008).Based on the cognitive branches identified in the congregated map and, sequentially, on the tree structure presented in Figure 3, the decision makers defined four major evalua-
Fig. 2. Part of the strategic map
Convenience
Number of ATMsParkingFacilities
Security
Quality ofthe Archive
Modern ElectronicSystems
Other QualitativeAspects
Easy Accessto Internet
Phone Ring
Number of Complaintsor Errors
Easy Accessto Business information
Waiting Time forProblems Resolution
Dynamism
ProfessionalSecrecy
Human ResourcesCharacteristics
Business Ethics Responsibility
Focus onObjectives
Awareness of RiskFactors
Management TeamTechnical Skills
Experience
PrivilegedContacts
Leaders
Team Spirit
Easy Adoptionof ICT
Planning Skils
Capability forProblems Resolution
InstitutionalCulture
Fig. 3. Service quality and convenience performance measures tree
Bank Branch Selection
Customer Satisfaction
Quality of Service
Management Team Technical Skills
Human Resources Characteristics
Other Qualitative Aspects
Convenience
F. A. F. Ferreira, et al. Evaluating retail banking service quality and convenience with MCDA techniques ...
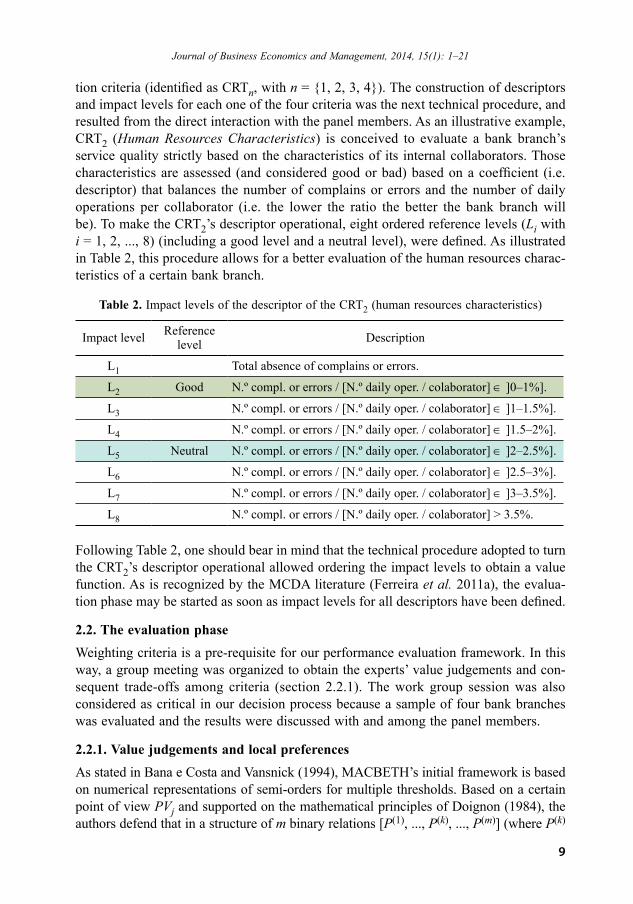
9
tion criteria (identified as CRTn, with n = {1, 2, 3, 4}). The construction of descriptors and impact levels for each one of the four criteria was the next technical procedure, and resulted from the direct interaction with the panel members. As an illustrative example, CRT2 (Human Resources Characteristics) is conceived to evaluate a bank branch’s service quality strictly based on the characteristics of its internal collaborators. Those characteristics are assessed (and considered good or bad) based on a coefficient (i.e. descriptor) that balances the number of complains or errors and the number of daily operations per collaborator (i.e. the lower the ratio the better the bank branch will be). To make the CRT2’s descriptor operational, eight ordered reference levels (Li with i = 1, 2, ..., 8) (including a good level and a neutral level), were defined. As illustrated in Table 2, this procedure allows for a better evaluation of the human resources charac-teristics of a certain bank branch.
Table 2. Impact levels of the descriptor of the CRT2 (human resources characteristics)
Impact level Reference level Description
L1 Total absence of complains or errors.
L2 Good N.º compl. or errors / [N.º daily oper. / colaborator] ∈ ]0–1%].
L3 N.º compl. or errors / [N.º daily oper. / colaborator] ∈ ]1–1.5%].
L4 N.º compl. or errors / [N.º daily oper. / colaborator] ∈ ]1.5–2%].
L5 Neutral N.º compl. or errors / [N.º daily oper. / colaborator] ∈ ]2–2.5%].
L6 N.º compl. or errors / [N.º daily oper. / colaborator] ∈ ]2.5–3%].
L7 N.º compl. or errors / [N.º daily oper. / colaborator] ∈ ]3–3.5%].
L8 N.º compl. or errors / [N.º daily oper. / colaborator] > 3.5%.
Following Table 2, one should bear in mind that the technical procedure adopted to turn the CRT2’s descriptor operational allowed ordering the impact levels to obtain a value function. As is recognized by the MCDA literature (Ferreira et al. 2011a), the evalua-tion phase may be started as soon as impact levels for all descriptors have been defined.
2.2. The evaluation phaseWeighting criteria is a pre-requisite for our performance evaluation framework. In this way, a group meeting was organized to obtain the experts’ value judgements and con-sequent trade-offs among criteria (section 2.2.1). The work group session was also considered as critical in our decision process because a sample of four bank branches was evaluated and the results were discussed with and among the panel members.
2.2.1. Value judgements and local preferencesAs stated in Bana e Costa and Vansnick (1994), MACBETH’s initial framework is based on numerical representations of semi-orders for multiple thresholds. Based on a certain point of view PVj and supported on the mathematical principles of Doignon (1984), the authors defend that in a structure of m binary relations [P(1), ..., P(k), ..., P(m)] (where P(k)
Journal of Business Economics and Management, 2014, 15(1): 1–21
10
stands for a preference that is stronger the greater the k), the numerical codification of preferences is pos-sible. As such, the MACBETH procedure consists in the association of each action of X (with X = {a, b, ..., n} being a finite set of n actions), to a value x (resulting from a value function v(.): X → R) such that differences as v(a) – v(b) (with a strictly more attractive than b (i.e. a P b)), are as compatible as possible with the decision makers’ value judgements.
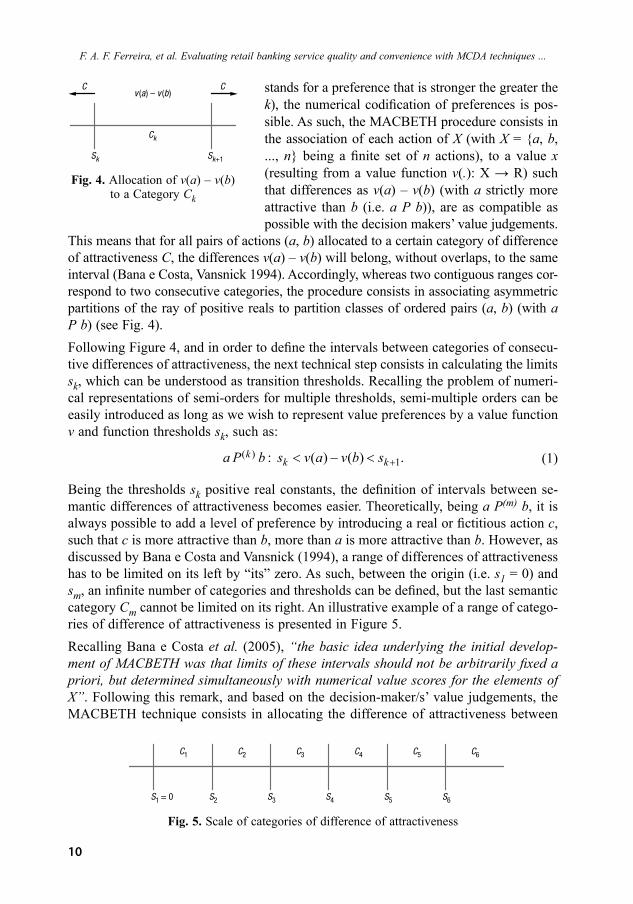
This means that for all pairs of actions (a, b) allocated to a certain category of difference of attractiveness C, the differences v(a) – v(b) will belong, without overlaps, to the same interval (Bana e Costa, Vansnick 1994). Accordingly, whereas two contiguous ranges cor-respond to two consecutive categories, the procedure consists in associating asymmetric partitions of the ray of positive reals to partition classes of ordered pairs (a, b) (with a P b) (see Fig. 4).Following Figure 4, and in order to define the intervals between categories of consecu-tive differences of attractiveness, the next technical step consists in calculating the limits sk, which can be understood as transition thresholds. Recalling the problem of numeri-cal representations of semi-orders for multiple thresholds, semi-multiple orders can be easily introduced as long as we wish to represent value preferences by a value function v and function thresholds sk, such as: ( )
1: ( ) ( ) .kk ka P b s v a v b s +< − < (1)
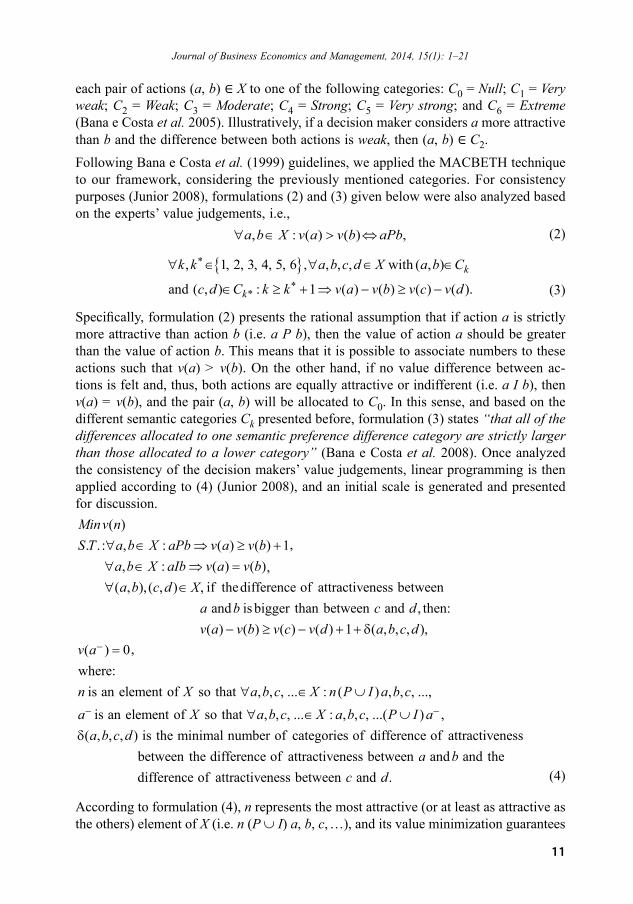
Being the thresholds sk positive real constants, the definition of intervals between se-mantic differences of attractiveness becomes easier. Theoretically, being a P(m) b, it is always possible to add a level of preference by introducing a real or fictitious action c, such that c is more attractive than b, more than a is more attractive than b. However, as discussed by Bana e Costa and Vansnick (1994), a range of differences of attractiveness has to be limited on its left by “its” zero. As such, between the origin (i.e. s1 = 0) and sm, an infinite number of categories and thresholds can be defined, but the last semantic category Cm cannot be limited on its right. An illustrative example of a range of catego-ries of difference of attractiveness is presented in Figure 5.Recalling Bana e Costa et al. (2005), “the basic idea underlying the initial develop-ment of MACBETH was that limits of these intervals should not be arbitrarily fixed a priori, but determined simultaneously with numerical value scores for the elements of X”. Following this remark, and based on the decision-maker/s’ value judgements, the MACBETH technique consists in allocating the difference of attractiveness between
Fig. 5. Scale of categories of difference of attractiveness
Fig. 4. Allocation of v(a) – v(b) to a Category Ck
C
Sk
Sk+1
Ck
Cv a v b( ) – ( )
S1 = 0 S2
C1
S3 S4 S5 S6
C2 C3 C4 C5 C6
F. A. F. Ferreira, et al. Evaluating retail banking service quality and convenience with MCDA techniques ...
11
each pair of actions (a, b) ∈ X to one of the following categories: C0 = Null; C1 = Very weak; C2 = Weak; C3 = Moderate; C4 = Strong; C5 = Very strong; and C6 = Extreme (Bana e Costa et al. 2005). Illustratively, if a decision maker considers a more attractive than b and the difference between both actions is weak, then (a, b) ∈ C2.Following Bana e Costa et al. (1999) guidelines, we applied the MACBETH technique to our framework, considering the previously mentioned categories. For consistency purposes (Junior 2008), formulations (2) and (3) given below were also analyzed based on the experts’ value judgements, i.e.,
, : ( ) ( ) ,a b X v a v b aPb∀ ∈ > ⇔ (2)
{ }*
**
, 1, 2, 3, 4, 5, 6 , , , , with ( , )
and ( , ) : 1 ( ) ( ) ( ) ( ).
∀ ∈ ∀ ∈ ∈
∈ ≥ + ⇒ − ≥ −k
k
k k a b c d X a b C
c d C k k v a v b v c v d (3)
Specifically, formulation (2) presents the rational assumption that if action a is strictly more attractive than action b (i.e. a P b), then the value of action a should be greater than the value of action b. This means that it is possible to associate numbers to these actions such that v(a) > v(b). On the other hand, if no value difference between ac-tions is felt and, thus, both actions are equally attractive or indifferent (i.e. a I b), then v(a) = v(b), and the pair (a, b) will be allocated to C0. In this sense, and based on the different semantic categories Ck presented before, formulation (3) states “that all of the differences allocated to one semantic preference difference category are strictly larger than those allocated to a lower category” (Bana e Costa et al. 2008). Once analyzed the consistency of the decision makers’ value judgements, linear programming is then applied according to (4) (Junior 2008), and an initial scale is generated and presented for discussion.
( ). . : , : ( ) ( ) 1
, : ( ) ( )( , ), ( , ) , if thedifference of attractiveness between
and is bigger than between and , then:( ) ( ) ( ) ( ) 1 ( , , , ),
Minv nS T a b X aPb v a v b
a b X aIb v a v ba b c d P
a b c dv a v b v c v d a b c d
∀ ∈ ⇒ ≥ +∀ ∈ ⇒ =∀ ∈
− ≥ − + + d( ) 0
where:is an element of so that , , , ... : ( ) , , , ...,is an element of so that , , , ... : , , , ...( ) ,
( , , , ) is the minimal number of categories of difference of attractivenessbetween the differ
−
− −
=
∀ ∈ ∪
∀ ∈ ∪d
v a
n X a b c X n P I a b ca X a b c X a b c P I a
a b c dence of attractiveness between and and the
difference of attractiveness between and .a b
c d
(4)
According to formulation (4), n represents the most attractive (or at least as attractive as the others) element of X (i.e. n (P ∪ I) a, b, c, …), and its value minimization guarantees
Journal of Business Economics and Management, 2014, 15(1): 1–21
,,
X
,
12
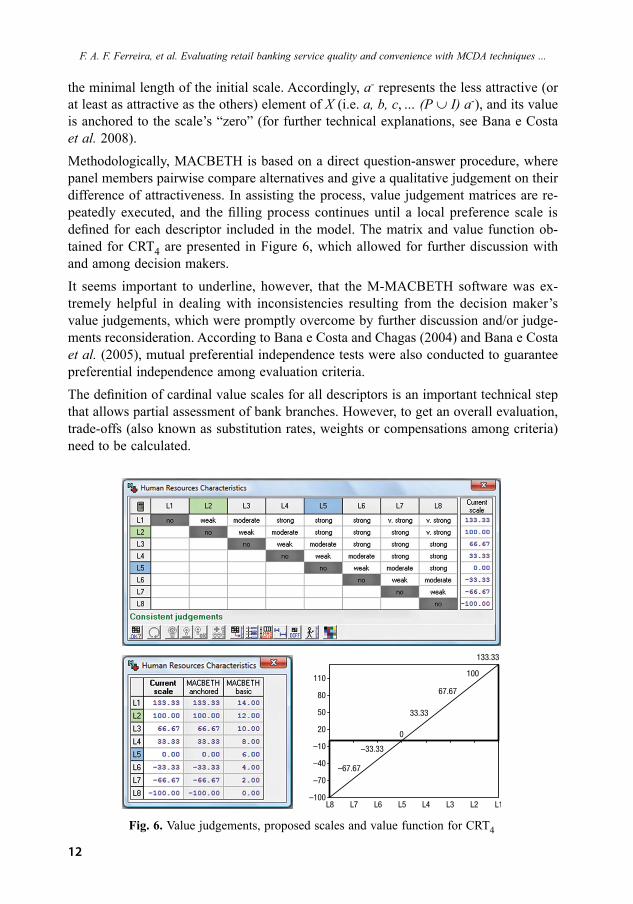
the minimal length of the initial scale. Accordingly, a- represents the less attractive (or at least as attractive as the others) element of X (i.e. a, b, c, … (P ∪ I) a-), and its value is anchored to the scale’s “zero” (for further technical explanations, see Bana e Costa et al. 2008). Methodologically, MACBETH is based on a direct question-answer procedure, where panel members pairwise compare alternatives and give a qualitative judgement on their difference of attractiveness. In assisting the process, value judgement matrices are re-peatedly executed, and the filling process continues until a local preference scale is defined for each descriptor included in the model. The matrix and value function ob-tained for CRT4 are presented in Figure 6, which allowed for further discussion with and among decision makers.It seems important to underline, however, that the M-MACBETH software was ex-tremely helpful in dealing with inconsistencies resulting from the decision maker’s value judgements, which were promptly overcome by further discussion and/or judge-ments reconsideration. According to Bana e Costa and Chagas (2004) and Bana e Costa et al. (2005), mutual preferential independence tests were also conducted to guarantee preferential independence among evaluation criteria. The definition of cardinal value scales for all descriptors is an important technical step that allows partial assessment of bank branches. However, to get an overall evaluation, trade-offs (also known as substitution rates, weights or compensations among criteria) need to be calculated.
F. A. F. Ferreira, et al. Evaluating retail banking service quality and convenience with MCDA techniques ...
Fig. 6. Value judgements, proposed scales and value function for CRT4
–100
–70
–40
–10
20
50
80
110
L8 L7 L6 L5 L4 L3 L2 L1
–67.67
–33.33
0
33.33
67.67
100
133.33

13
2.2.2. The trade-offs proceduresTo obtain the compensation rates among criteria, decision makers were asked to rank the four criteria in terms of overall attractiveness. To support the ranking procedure, an alternative a0 (composed of the worst impact levels) was compared to an alternative an (composed of the best impact levels), and the different preferences of the decision makers were registered in a matrix of comparisons (for further details on this technical procedure, see Bana e Costa, Chagas 2004). Once ordered the criteria, with CRT2 being considered overall preferable to the others, the panel members were invited to express their value judgements in terms of difference of attractiveness among criteria. Based on the same procedure previously followed for the local scales (cf. Fig. 6), an initial scale and respective trade-offs were made explicit and proposed for discussion (Fig. 7).As can be seen in Figure 7, the M-MACBETH software made the trade-offs calculi easier and enabled the construction of an additive value model as presented in (5) (Bana e Costa et al. 2008):
1 1( ) ( ) with 1 and 0, (good ) 100 and (neutral ) 0.
n n
i iV a x v a x x v vi i i i i i i i
= == = > = =∑ ∑ (5)
Following formulation (5), it should be clarified that this additive model allows for the aggregation of the partial scores vi(a) and consequent calculation of the overall score V(a). Moreover, vi(goodi) and vi(neutrali) represent the partial scores of two specific performance levels (i.e. good and neutral), that have been defined in all descriptors to facilitate cognitive comparisons. In this sense, based on the discussion with the decision makers, it became possible to approve the trade-offs and assess bank branches’ partial and overall service quality and convenience.
Fig. 7. Value judgements, proposed scales and criteria weights
Journal of Business Economics and Management, 2014, 15(1): 1–21

14
F. A. F. Ferreira, et al. Evaluating retail banking service quality and convenience with MCDA techniques ...
2.2.3. Measuring bank branch service quality and convenienceFor testing our service quality and convenience evaluation framework, data on bank branch performance were formally requested from the Portuguese public bank Caixa Geral de Depósitos (CGD), which is, perhaps, the largest bank operating in Portugal. It seems relevant to point out that the information on four bank branches (called Alphas from now on) was randomly and anonymously provided by the bank’s administration, and resulted from internal surveys referred to a single period of time (month). Despite these limitations, the information provided was extremely useful, not only to test our service quality and convenience evaluation system but also to augment the interest and discussion among the decision makers involved in the process.Considering the descriptors and the value functions previously obtained for each cri-terion, the first measurement step was to calculate partial performance values for each one of the alphas (Fig. 8 and Table 3).
Table 3. Levels and partial values revealed by the alphas
CRT1 CRT2 CRT3 CRT4
Alpha 1 L2 300 L3 66.67 L6 –800 L2 100
Alpha 2 L2 300 L4 33.33 L6 –800 L5 25
Alpha 3 L2 300 L4 33.33 L6 –800 L6 0
Alpha 4 L5 0 L2 100 L6 –800 L6 0
Good L4 100 L2 100 L2 100 L2 100
Neutral L5 0 L5 0 L3 0 L6 0
To facilitate the analysis of Table 3, it is appropriated to point out that Good and Neutral are two fictitious bank branches introduced in the model to simplify cognitive compari-sons. Good stands for a bank branch that performs at a good level for all the criteria considered, and Neutral represents a bank branch that performs at neutral levels (i.e. neither attractive nor unattractive) for those same evaluation criteria. By following this procedure, performance comparisons among branches became possible (e.g. Alpha 4 is
Fig. 8. Partial performance conceptual scheme
CRT1 CRT2 CRTn
I1(a)
I1(b)
I2(b)
I2(a)
In(b)
In(a)
X
a
b

15
the worst performer on CRT1, which corresponds to the neutral level, but it is also the best performer on CRT2). These comparisons among performances are useful not only because they enable the panel members to better understand the evaluation process but also because they allow proposing and/or implementing well localized improvement suggestions. The partial and overall performance values of the six bank branches evalu-ated (Good and Neutral included) are presented in Table 4.
Basing our discussion on Table 4, Alpha 1 appears to be the best bank branch with an overall score of 109.45, while Alpha 4 may be considered the worst performer with an overall score of 4.69. Nonetheless, these results should be faced with proper reservation. As stated by Nowak (2011), the emphasis should be placed on the constructive analysis and discussion that emerged from the panel members.
2.2.4. Analysing resultsThe bank branch service quality and convenience evaluation system developed above allowed the panel members to: (1) discriminate the alphas according to their own value judgements; (2) compare the alphas with the Good and Neutral references; (3) promote discussion and increase transparency in the decision framework; (4) serve as a learning mechanism for improvement suggestions; and (5) show how cognitive maps and MCDA can be integrated in a bank branch service quality evaluation context.Once a final ranking is approved by the decision makers, the evaluation phase is con-sidered complete (Bana e Costa, Chagas 2004); however, additional analyses such as sensitivity and robustness analyses are encouraged to validate results and analyze their stability, which should serve as basis for further discussion. Figure 9 shows the sensitiv-ity analysis carried out for CRT2.Based on Figure 9 and recalling previous discussion, the weight attributed to CRT2 is 42.85. However, the sensitivity analysis carried out for this criterion allows us to conclude that the model is strong because the criterion’s weight can vary significantly without vio-lating the alphas’ ranking position and, consequently, the value judgements of the decision makers. However, because sensitivity analysis deals with variations of isolated variables, other types of analyses were carried out. Figure 10 illustrates the robustness analysis developed, which considers possible variations of different variables at the same time.
Table 4. Partial values and overall attractiveness revealed by the alphas
Journal of Business Economics and Management, 2014, 15(1): 1–21

16
Both sensitive and robustness analyses were supported by the M-MACBETH software. However, in the particular case of the robustness analysis, one should clarify that each cross represents a typical situation of additive dominance, which means that despite of a better overall performance, a certain alpha does not present the best local performance in all the criteria (e.g. Alpha 2 (with an overall score of 80.87) is overall more attractive than Alpha 4 (with an overall score of 4.69), but Alpha 2 performs worse than Alpha 4 on CTR2 (cf. Table 4)). On the other hand, each triangle represents a situation of classic dominance (i.e. no matter which trade-offs are obtained, a certain alpha dominates the others in terms of partial and overall performance e.g. Alpha 1 is always better than or at least equal to Alpha 2).Our previous analysis indicates that the evaluation framework developed is strong and robust, and presents encouraging results. Nonetheless, these results should be treated with appropriate reservation. Some of the reasons why our results should be treated with reservation are discussed in the recommendations phase of the study.
Fig. 9. Sensitivity analysis on CRT2’s weight
Fig. 10. Robustness analysis and overall thermometer
F. A. F. Ferreira, et al. Evaluating retail banking service quality and convenience with MCDA techniques ...

17
2.3. The recommendations phase of the studyOur bank branch service quality and convenience evaluation framework is encouraging based on the satisfaction expressed by the decision makers. Nevertheless, it should be emphasized that our evaluation procedure is process-oriented, where a non-prescriptive position has always been assumed. From this perspective, our performance evaluation system should be primarily seen as a learning mechanism and not as a final solution and/or tool to reach optimal solutions. Since the results depend on the context and ac-tors involved, any generalization should be questioned before implementation. This may be considered a shortcoming. However, the integrated use of cognitive maps and MCDA techniques also offers adjustment possibilities and this, on its turn, increases the potentialities of the framework.
Discussions and conclusions
Service quality and convenience at the retail bank branch level are inherently difficult to measure; however, we have presented an MCDA framework that attempts to evaluate bank branches. Considering the recent progress that has taken place, it seems generally agreed that several aspects still require discussion and clarification. With that purpose in mind, we extend the research in Ferreira et al. (2011a) and report a few outcomes of the interaction maintained with directors from the five largest banks in Portugal. While bank customers’ were not directly involved in the design of the performance measurement framework, the evaluation criteria identified by the directors, and which are represented in the performance measures tree (see Fig. 3), capture some of the factors that most impact customers’ perceptions regarding the quality of service and convenience of bank branches (e.g. number of complains, errors, easy access to information and services, waiting times and security) (see the strategic map diagrammed in Fig. 2).In practical terms, our framework allowed us to deal with two major limitations of existing methodologies for performance measurement: (1) the way performance meas-ures are often selected may lead to the omission of relevant evaluation criteria; and (2) there seems to be lack of transparency in the way compensations among those same criteria are obtained. Using cognitive maps integrated with the MACBETH approach we were able to support criteria selection and obtain compensation rates. To the best of our knowledge, we are unaware of any prior evidence reporting the integrated use of these two methodologies to support the conception of bank branch service quality and convenience evaluation systems. Among other things, our performance evaluation system may be particularly useful to: (1) monitor the progress of the branches over time; (2) identify and desirably implement corrective actions; (3) increase transparency in criteria selection and trade-offs calcula-tion; and (4) incorporate professional know-how and experience in the decision making process, in order to increase the realism of the evaluation process.It should be noted, however, that the procedure proposed in this study is not without its own limitations and weaknesses. For example, as previously stated, our results depend on the context and decision makers involved. Nonetheless, earlier research carried out by Weber and Borcherding (1993) suggests that no superior methodological approach
Journal of Business Economics and Management, 2014, 15(1): 1–21
18
exists and that the choice of method is strongly dependent on the decision context, making it very difficult to prove that one approach or method is superior to others in supporting the decision making process (for a broader discussion, see also Ananda, Herath 2009). In this sense, our results should be analyzed with reservations, and fur-ther research (including case studies) is necessarily encouraged. We then recommend conducting: (1) a different panel study and within a different country; (2) a survey to receive feedback from more than just a few experts; and (3) a comparative study to con-front the results obtained from different methodological applications in this particular context. We are optimistic that possible improvements will help strengthen the potential and interest of the proposal presented herein.
ReferencesAcar, A.; Zehir, C. 2010. The harmonized effects of generic strategies and business capabilities on business performance, Journal of Business Economics and Management 11(4): 689–711. http://dx.doi.org/10.3846/jbem.2010.34Ackermann, F. 2012. Problem structuring methods ‘in the dock’: arguing the case for soft OR, European Journal of Operational Research 219(3): 652–658.http://dx.doi.org/10.1016/j.ejor.2011.11.014 Ackermann, F.; Eden, C. 2001. SODA – Journey making and mapping in practice, in J. Rosen-head, J. Mingers (Eds.). Rational analysis for a problematic world revisited: problem structuring methods for complexity, uncertainty and conflict. 2nd ed. Chichester: John Wiley & Sons, 43–60.Ackermann, F.; Eden, C. 2011. Strategic management of stakeholders: theory and practice, Long Range Planning 44(3): 179–196. http://dx.doi.org/10.1016/j.lrp.2010.08.001 Ananda, J.; Herath, G. 2009. A critical review of multi-criteria decision making methods with special reference to forest management and planning, Ecological Economics 68(10): 2535–2548. http://dx.doi.org/10.1016/j.ecolecon.2009.05.010Arbore, A.; Busacca, B. 2009. Customer satisfaction and dissatisfaction in retail banking: explor-ing the asymmetric impact of attribute performances, Journal of Retailing and Consumer Services 16(4): 271–280. http://dx.doi.org/10.1016/j.jretconser.2009.02.002Athanassopoulos, A. 1997. Service quality and operating efficiency synergies for management control in the provision of financial services: evidence from Greek bank branches, European Jour-nal of Operational Research 98(2): 300–313. http://dx.doi.org/10.1016/S0377-2217(96)00349-9Bana e Costa, C.; Chagas, M. 2004. A career choice problem: an example of how to use MAC-BETH to build a quantitative value model based on qualitative value judgements, European Jour-nal of Operational Research 153(2): 323–331. http://dx.doi.org/10.1016/S0377-2217(03)00155-3Bana e Costa, C.; De Corte, J.; Vansnick, J. 2005. On the mathematical foundations of MAC-BETH, in J. Figueira, S. Greco, M. Ehrgott (Eds.). Multiple criteria decision analysis: the state of the art surveys. New York: Springer, 409–442.Bana e Costa, C.; Ensslin, L.; Corrêa, E.; Vansnick, J. 1999. Decision support systems in action: integrated application in a multicriteria decision aid process, European Journal of Operational Research 113(2): 315–335. http://dx.doi.org/10.1016/S0377-2217(98)00219-7Bana e Costa, C.; Lourenço, J.; Chagas, M.; Bana e Costa, J. 2008. Development of reusable bid evaluation models for the Portuguese electric transmission company, Decision Analysis 5(1): 22–42. http://dx.doi.org/10.1287/deca.1080.0104Bana e Costa, C.; Vansnick, J. 1994. MACBETH: an interactive path towards the construction of cardinal value functions, International Transactions in Operational Research 1(4): 489–500. http://dx.doi.org/10.1016/0969-6016(94)90010-8
F. A. F. Ferreira, et al. Evaluating retail banking service quality and convenience with MCDA techniques ...
19
Belton, V.; Stewart, T. 2002. Multiple criteria decision analysis: an integrated approach. Dordrecht: Kluwer Academic Publishers.Brignall, S. 1992. Performance measurement systems as change agents: a case for further re-search, Research Paper 72. Warwick: Warwick Business School.Camanho, A.; Dyson, R. 2005. Cost efficiency measurement with price uncertainty: a DEA ap-plication to bank branches assessments, European Journal of Operational Research 161(2): 432–446. http://dx.doi.org/10.1016/j.ejor.2003.07.018Charnes, A.; Cooper, W.; Rhodes, E. 1978. Measuring the efficiency of decision making units, European Journal of Operational Research 2(6): 429–444. http://dx.doi.org/10.1016/0377-2217(78)90138-8Cossette, P.; Audet, M. 2003. Qu’est qu’une carte cognitive?, in P. Cossette (Ed.). Cartes Cogni-tives et Organizations, Les Éditions de L’ADREG, 31–60 [online], [cited February 2012]. Avail-able from Internet: http://asso.nordnet.fr/adreg/Adreg_05.pdfDavis, S.; Albright, T. 2004. An investigation of the effect of the Balanced Scorecard implemen-tation on financial performance, Management Accounting Research 15(2): 135–153. http://dx.doi.org/10.1016/j.mar.2003.11.001Dekker, D.; Post, T. 2001. A quasi-concave DEA model with an application for bank branch performance evaluation, European Journal of Operational Research 132(2): 296–311. http://dx.doi.org/10.1016/S0377-2217(00)00153-3Doignon, J. 1984. Threshold representations of multiple semiorders, SIAM Journal of Algebraic Discrete Methods 8(1): 77–84. http://dx.doi.org/10.1137/0608005Eden, C. 2004. Analyzing cognitive maps to help structure issues or problems, European Journal of Operational Research 159(3): 673–686. http://dx.doi.org/10.1016/S0377-2217(03)00431-4Eden, C.; Ackermann, F. 2001a. Group decision and negotiation in strategy making, Group Deci-sion and Negotiation 10(4): 119–140. http://dx.doi.org/10.1023/A:1008710816126Eden, C.; Ackermann, F. 2001b. SODA – the principles, in J. Rosenhead, J. Mingers (Eds.). Rational analysis for a problematic world revisited: problem structuring methods for complexity, uncertainty and conflict. 1st ed. Chichester: John Wiley & Sons, 21–41.Eden, C.; Banville, C. 2003. Construction d’une vision stratégique au moyen de la cartographie cognitive assisté par ordinateur, in P. Cossette (Ed.). Cartes Cognitives et Organisations, Les Éditions de L’ADREG, 125–166 [online], [cited February 2012]. Available from Internet: http://asso.nordnet.fr/adreg/Adreg_05.pdf. Ferreira, F.; Santos, S.; Rodrigues, P. 2011a. Adding value to bank branch performance evalua-tion using cognitive maps and MCDA: a case study, Journal of the Operational Research Society 62(7): 1320–1333. http://dx.doi.org/10.1057/jors.2010.111Ferreira, F.; Spahr, R.; Pereira, J. 2011b. New banking trends, MCDA and financial decisions: insights and a framework for retail banking, Banks and Bank Systems 6(2): 23–35.Halkos, G.; Salamouris, D. 2004. Efficiency measurement of the Greek commercial banks with the use of financial ratios: a data envelopment analysis approach, Management Accounting Re-search 15(2): 201–224. http://dx.doi.org/10.1016/j.mar.2004.02.001Howick, S.; Ackermann, F. 2011. Mixing OR methods in practice: past, present and future direc-tions, European Journal of Operational Research 215(3): 503–511.http://dx.doi.org/10.1016/j.ejor.2011.03.013Jackson III, W.; Nandakumarb, P.; Roth, A. 2003. Market structure, consumer banking, and op-timal level of service quality, Review of Financial Economics 12(1): 49–63. http://dx.doi.org/10.1016/S1058-3300(03)00006-5
Journal of Business Economics and Management, 2014, 15(1): 1–21
20
Jahanshahloo, G.; Amirteimoori, A.; Kordrostami, S. 2004. Multi-component performance, pro-gress and regress measurement and shared inputs and outputs in DEA for panel data: an applica-tion in commercial bank branches, Applied Mathematics and Computation 151(1): 1–16. http://dx.doi.org/10.1016/S0096-3003(03)00318-7Junior, H. 2008. Multicriteria approach to data envelopment analysis, Pesquisa Operacional 28(2): 231–242. http://dx.doi.org/10.1590/S0101-74382008000200004Kaplan, R.; Norton, D. 1992. The balanced scorecard: measures that drive performance, Harvard Business Review 70(1): 71–79.Karatepea, O.; Yavasb, U.; Babakus, E. 2005. Measuring service quality of banks: scale develop-ment and validation, Journal of Retailing and Consumer Services 12(5): 373–383. http://dx.doi.org/10.1016/j.jretconser.2005.01.001Keeney, R. 1992. Value-focused thinking: a path to creative decision making. Harvard: Harvard University Press.Korsakienė, R. 2004. Determining competitive advantage: the analytical hierarchic process, Jour-nal of Business Economics and Management 5(4): 205–215. http://dx.doi.org/10.1080/16111699.2004.9636084 Lau, C.; Sholihin, M. 2005. Financial and non-financial performance measures: how do they affect job satisfaction?, British Accounting Review 37(4): 389–413. http://dx.doi.org/10.1016/j.bar.2005.06.002Lee, P.; Cheng, T.; Yeung, A.; Lai, K. 2011. An empirical study of transformational leadership, team performance and service quality in retail banks, Omega 39(6): 690–701. http://dx.doi.org/10.1016/j.omega.2011.02.001Lovell, C.; Pastor, J. 1997. Target setting: an application to a bank branch network, European Jour-nal of Operational Research 98(2): 290–299. http://dx.doi.org/10.1016/S0377-2217(96)00348-7Manandhar, R.; Tang, J. 2002. The evaluation of bank branch performance using data envelop-ment analysis: a framework, Journal of High Technology Management Research 13(1): 1–17. http://dx.doi.org/10.1016/S1047-8310(01)00045-1Mihelis, G.; Grigoroudis, E.; Siskos, Y.; Politis, Y.; Malandrakis, Y. 2001. Customer satisfaction measurement in the private bank sector, European Journal of Operational Research 130(2): 347–360. http://dx.doi.org/10.1016/S0377-2217(00)00036-9Neely, A.; Gregory, M.; Platts, K. 1995. Performance measurement system design: a literature review and research agenda, International Journal of Operations and Production Management 15(4): 80–116. http://dx.doi.org/10.1108/01443579510083622Nowak, M. 2011. Interactive multicriteria decision aiding under risk: methods and applications, Journal of Business Economics and Management 12(1): 69–91. http://dx.doi.org/10.3846/16111699.2011.555366Oliveira, P.; Hippelb, von E. 2011. Users as service innovators: the case of banking services, Research Policy 40(6): 806–818. http://dx.doi.org/10.1016/j.respol.2011.03.009Pan, Y.; Sheng, S.; Xie, F. 2012. Antecedents of customer loyalty: an empirical synthesis and reexamination, Journal of Retailing and Consumer Services 19(9): 150–158.http://dx.doi.org/10.1016/j.jbusres.2012.04.014Paradi, J.; Schaffnit, C. 2004. Commercial branch performance evaluation and results commu-nication in a Canadian bank: a DEA application, European Journal of Operational Research 156(3): 719–735. http://dx.doi.org/10.1016/S0377-2217(03)00108-5Podvezko, V. 2009. Application of AHP technique, Journal of Business Economics and Manage-ment 10(2): 181–189. http://dx.doi.org/10.3846/1611-1699.2009.10.181-189
F. A. F. Ferreira, et al. Evaluating retail banking service quality and convenience with MCDA techniques ...
21
Serna, R. 2005. Where are the bank branches in my community? An analysis of branch distribu-tion in low-income neighborhoods, California Reinvestment Coalition Report [online], [cited February 2006]. Available from Internet: http://www.calreinvest.orgSuwignjo, P.; Bititci, U.; Carrie, A. 2000. Quantitative models for performance measurement system, International Journal of Production Economics 64(1/3): 231–241. http://dx.doi.org/10.1016/S0925-5273(99)00061-4Weber, M; Borcherding, K. 1993. Behavioral influences on weight judgments in multiattribute decision making, European Journal of Operational Research 67(1): 1–12. http://dx.doi.org/10.1016/0377-2217(93)90318-HWu, D.; Yang, Z.; Liang, L. 2006. Using DEA-neural network approach to evaluate branch ef-ficiency of a large Canadian bank, Expert Systems with Applications 31(1): 108–115. http://dx.doi.org/10.1016/j.eswa.2005.09.034Yang, Z. 2009. Assessing the performance of Canadian bank branches using data envelopment analysis, Journal of the Operational Research Society 60(6): 771–780. http://dx.doi.org/10.1057/palgrave.jors.2602619
Fernando A. F. FERREIRA is an Adjunct Professor and Vice-President of the Scientific Council at the School of Management and Technology of the Polytechnic Institute of Santarém, Portugal, and Adjunct Research Professor at the University of Memphis, TN, USA. He holds a PhD in Quantita-tive Methods Applied to Economics and Management from the University of Algarve, Portugal, and received his MSc in Economic and Business Sciences from the University of Algarve and the Techni-cal University of Lisbon, Portugal. In 2009, he was granted with a Calouste Gulbenkian Foundation fellowship for Post-Doctoral studies at the Fogelman College of Business and Economics of the University of Memphis. He has authored books, book chapters, peer-reviewed papers and made many conference presentations. His main research interests include multiple criteria decision analysis and integrated systems for performance measurement in the banking sector.
Sérgio P. SANTOS is an Assistant Professor at the Faculty of Economics of the University of Algarve and a member of the Centre for Advanced Studies in Management and Economics at the University of Évora, Portugal. He holds a PhD in Management Science from the University of Strathclyde, and a MA in Economics and Econometrics from the University of Manchester, UK. His main research interests include performance measurement and management in the private and public sectors. He has published in national and international journals such as Omega – The International Journal of Management Science, the International Journal of Production and Operations Management and the Journal of the Operational Research Society
Paulo M. M. RODRIGUES is an economist at the Economics and Research Department of the Banco de Portugal, and Professor of Econometrics at NOVA School of Business and Economics, Uni-versidade Nova de Lisboa, Portugal. He received his PhD and MA from the University of Manchester, UK. Previously he was Associate Professor at the University of Algarve, Portugal, a Jean Monnet Fellow at the European University Institute in Florence, Italy, and Visiting Scholar at the University of Navarra, Spain, the Institute for Advanced Studies in Vienna, Austria, and the University of British Columbia, Vancouver, Canada.
Ronald W. SPAHR is a Professor and Former Chairman in the Department of Finance, Insurance and Real Estate of the Fogelman College of Business and Economics of the University of Memphis, TN, USA. He received his PhD and MBA from the University of Wisconsin-Madison, MS in Operations Management from the University of Southern California and BS in Mechanical Engineering from South Dakota State University. Previously, he was the National City Bank Distinguished Professor of Banking and Finance at the University of Illinois, Belk Distinguished Professor of Finance at the University of North Carolina and Professor of Finance at the University of Wyoming. He has also lectured at a number of European universities.
Journal of Business Economics and Management, 2014, 15(1): 1–21