Eustress in Advanced Placement (AP) and International ...
173
University of South Florida Scholar Commons Graduate eses and Dissertations Graduate School October 2018 Eustress in Advanced Placement (AP) and International Baccalaureate (IB) Students Amanda C. Moseley University of South Florida, [email protected] Follow this and additional works at: hps://scholarcommons.usf.edu/etd Part of the Educational Psychology Commons is Ed. Specalist is brought to you for free and open access by the Graduate School at Scholar Commons. It has been accepted for inclusion in Graduate eses and Dissertations by an authorized administrator of Scholar Commons. For more information, please contact [email protected]. Scholar Commons Citation Moseley, Amanda C., "Eustress in Advanced Placement (AP) and International Baccalaureate (IB) Students" (2018). Graduate eses and Dissertations. hps://scholarcommons.usf.edu/etd/7549
-
Upload
khangminh22 -
Category
Documents
-
view
0 -
download
0
Transcript of Eustress in Advanced Placement (AP) and International ...
University of South FloridaScholar Commons
Graduate Theses and Dissertations Graduate School
October 2018
Eustress in Advanced Placement (AP) andInternational Baccalaureate (IB) StudentsAmanda C. MoseleyUniversity of South Florida, [email protected]
Follow this and additional works at: https://scholarcommons.usf.edu/etd
Part of the Educational Psychology Commons
This Ed. Specalist is brought to you for free and open access by the Graduate School at Scholar Commons. It has been accepted for inclusion inGraduate Theses and Dissertations by an authorized administrator of Scholar Commons. For more information, please [email protected].
Scholar Commons CitationMoseley, Amanda C., "Eustress in Advanced Placement (AP) and International Baccalaureate (IB) Students" (2018). Graduate Thesesand Dissertations.https://scholarcommons.usf.edu/etd/7549
Eustress in Advanced Placement (AP) and International Baccalaureate (IB) Students
by
Amanda C. Moseley
A thesis submitted in partial fulfillment
of the requirements for the degree of Education Specialist
Department of Educational and Psychological Studies
College of Education
University of South Florida
Major Professor: Shannon Suldo, Ph.D.
Lindsey O’Brennan, Ph.D.
Robert Dedrick, Ph.D.
Date of Approval:
October 1, 2018
Keywords: adolescents, high school accelerated curricula, stress self-report
Copyright © 2018, Amanda Moseley
ACKNOWLEDGEMENTS
There are several individuals who have supported me throughout the completion of my
thesis whom I would like to thank. First, I have had a wonderful thesis committee that has
supported and encouraged me throughout this process. Dr. Shannon Suldo has been a constant
source of support and encouragement and has helped enormously with this project from
conceptualization to completion. I have become a better thinker, writer, and mental health
professional due to her guidance and mentoring. I would also like to thank Dr. Robert Dedrick
for his thoughtful contribution to the research methodology in this study, and his willingness to
support me through complicated analyses. I would also like to thank Dr. Lindsey O’Brennan for
constantly being a positive influence and supporter of me throughout this project, and many
other endeavors. Additionally, I am thankful to be surrounded my wonderful peers from the USF
School Psychology program whom I consider mentors, colleagues, and friends. Last, I am
forever grateful to my amazing parents, Ken and Caroline, and my wonderful husband, Ryan, for
encouraging me to be the best person I can.

i
TABLE OF CONTENTS
List of Tables v
List of Figures vi
Abstract vii
Chapter I: Introduction 1
Statement of the Problem 1
Measurement of eustress. 1
Correlates of eustress. 2
Outcomes of eustress. 3
Eustress in unique youth populations, namely students in accelerated curricula. 4
Purpose of the Study 4
Definition of Key Terms 5
Academic success 6
Advanced Placement (AP). 6
Coping. 6
Emotional well-being. 6
Engagement. 6
Eustress. 6
Flow 7
Grit. 7
International Baccalaureate (IB). 7
Nomological network. 7
Savoring. 7
Self-efficacy. 7
Stress. 7
Student success. 8
Research Questions 8
Hypotheses 9
Significance of the Study 11
Chapter II: Literature Review 13
Conceptualization of Stress 13
Theoretical Background of Stress 15
Holistic Stress Model. 16
Conceptualization of stress in the current study. 17
Conceptualizing Eustress 18
Challenge Stressor-Hindrance Stressor Framework. 23
ii
Measurement of Eustress 24
Qualitative approach. 25
Quantitative approach. 26
Constructs Related to Eustress among Adolescents 34
The Adolescent Development Context and Stressors 36
Constructs Potentially Associated with Eustress in Adolescents 37
Self-efficacy. 37
Flow. 38
Student engagement. 39
Coping. 41
Grit. 42
Adolescents in Accelerated Curricula 43
Summary of the Literature 46
Chapter III: Methods 48
Participants 48
Issues of Diversity 50
Procedures 51
Data collection. 51
Measures: Nomological Network of Eustress 52
School Attitude Assessment Survey-Revised 52
Perceived Stress Scale 54
Eustress Scale 54
Coping with Academic Demands Scale 56
Short Dispositional Flow Scale-2 57
Short Grit Scale 58
Measures: Outcomes 58
Student’s Life Satisfaction Scale 58
Behavioral and Emotional Screening System 59
School Burnout Inventory 59
Academic outcomes 60
Grade Point Average 60
Ethical Concerns 62
Data Analysis 62
Chapter IV: Results 66
Data Screening 66
Data entry 66
Missing data 66
Psychometric Properties of the Eustress Scale 67
Descriptive statistics. 67
Factor structure. 69
Total sample. 69
Gender. 72
iii
Grade. 73
Program. 75
Reliability. 76
Eustress by Gender, Grade, and Program 76
Correlates of Eustress 77
Distress. 77
Student engagement. 79
Coping strategies. 82
Self-efficacy. 86
Flow. 87
Grit. 89
Relationship Between Eustress and Student Outcomes 90
Academic Performance. 91
Life Satisfaction. 92
School Burnout. 93
Psychopathology 95
Chapter V: Discussion 99
Measuring Eustress within Adolescents in Rigorous Academic Programs 99
Measuring Eustress within Gender, Grade Level, and Program Subgroups 101
Correlates of Eustress 103
Relationship between Eustress and Student Outcomes 106
Implications for School Psychologists 107
Contributions to the Literature 109
Limitations 111
Summary and Future Directions 112
References 116
Appendices 126
Appendix A: Eustress Scale used by O’Sullivan (2011) 127
Appendix B: Parent Consent Form 128
Appendix C: Student Assent 130
Appendix D: Demographics Form 131
Appendix E: School Attitude Assessment Survey-Revised (SAAS-R) 132
Appendix F: Perceived Stress Scale (PSS) 134
Appendix G: Modified Eustress Scale 135
Appendix H: Coping with Academic Demands Scale (CADS) 136
Appendix I: Short Grit Scale 140
Appendix J: Student Life Satisfaction Scale (SLSS) 142
Appendix K: School Burnout Inventory (SBI) 143
Appendix L: Confirmatory Factor Analysis for Gender 144
Appendix M: Confirmatory Factor Analysis for Grade 145
Appendix N: Confirmatory Factor Analysis for Program 147
iv
Appendix O: Eustress Distress Model 148
Appendix P: Eustress Affective Engagement Model 149
Appendix Q: Eustress Cognitive Engagement Model 150
Appendix R: Eustress Time and Task Management Model 151
Appendix S: Eustress Cognitive Reappraisal Model 152
Appendix T: Eustress Talk with Classmates and Friends Model 153
Appendix U: Eustress Deterioration Model 154
Appendix V: Eustress Self-Efficacy Model 155
Appendix W: Eustress Flow Model 156
Appendix X: Eustress Grit Model 157
Appendix Y: Model Fit Information for Eustress and Student Outcomes 158
Appendix Z: Permission Information for Figure 2 159
Appendix AA: IRB Approval Letter 160
v
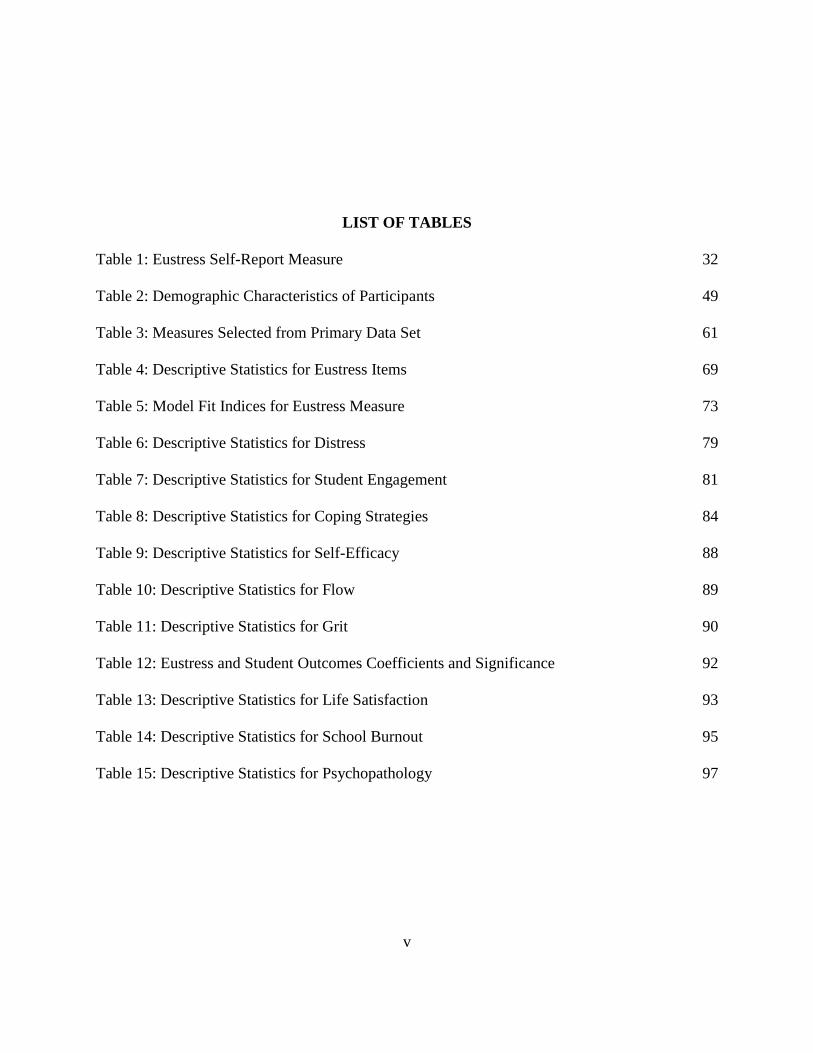
LIST OF TABLES
Table 1: Eustress Self-Report Measure 32
Table 2: Demographic Characteristics of Participants 49
Table 3: Measures Selected from Primary Data Set 61
Table 4: Descriptive Statistics for Eustress Items 69
Table 5: Model Fit Indices for Eustress Measure 73
Table 6: Descriptive Statistics for Distress 79
Table 7: Descriptive Statistics for Student Engagement 81
Table 8: Descriptive Statistics for Coping Strategies 84
Table 9: Descriptive Statistics for Self-Efficacy 88
Table 10: Descriptive Statistics for Flow 89
Table 11: Descriptive Statistics for Grit 90
Table 12: Eustress and Student Outcomes Coefficients and Significance 92
Table 13: Descriptive Statistics for Life Satisfaction 93
Table 14: Descriptive Statistics for School Burnout 95
Table 15: Descriptive Statistics for Psychopathology 97
vi
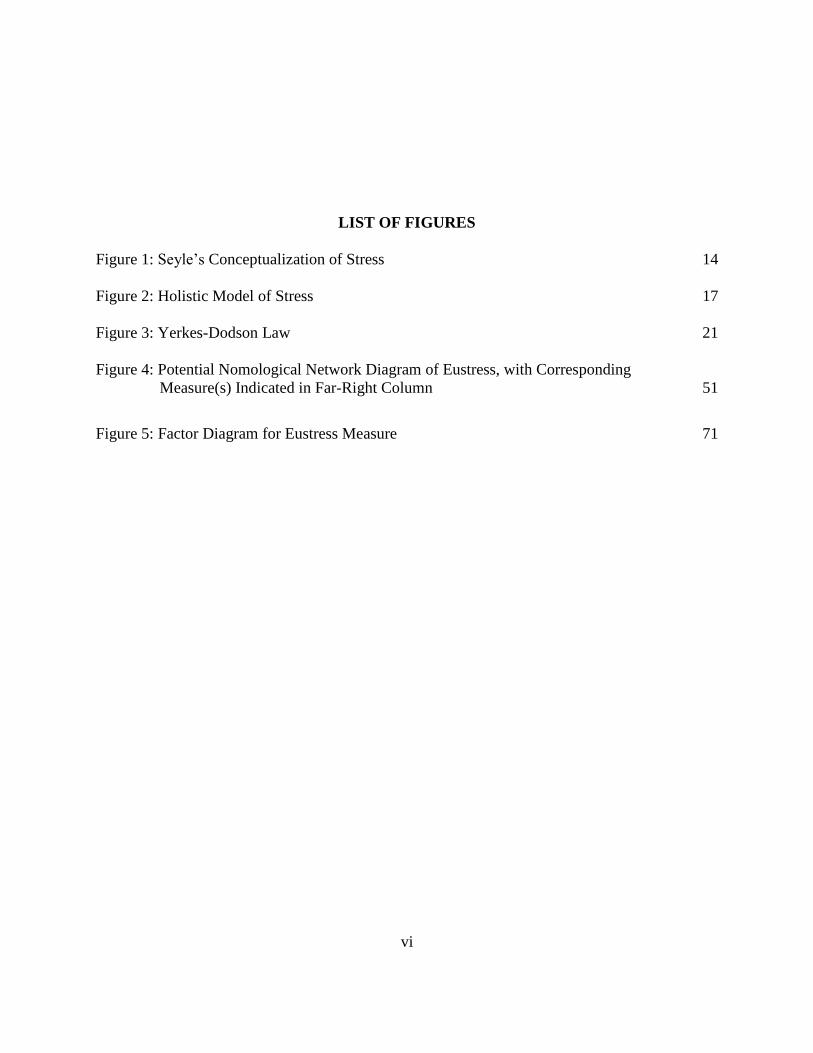
LIST OF FIGURES
Figure 1: Seyle’s Conceptualization of Stress 14
Figure 2: Holistic Model of Stress 17
Figure 3: Yerkes-Dodson Law 21
Figure 4: Potential Nomological Network Diagram of Eustress, with Corresponding
Measure(s) Indicated in Far-Right Column 51
Figure 5: Factor Diagram for Eustress Measure 71
vii
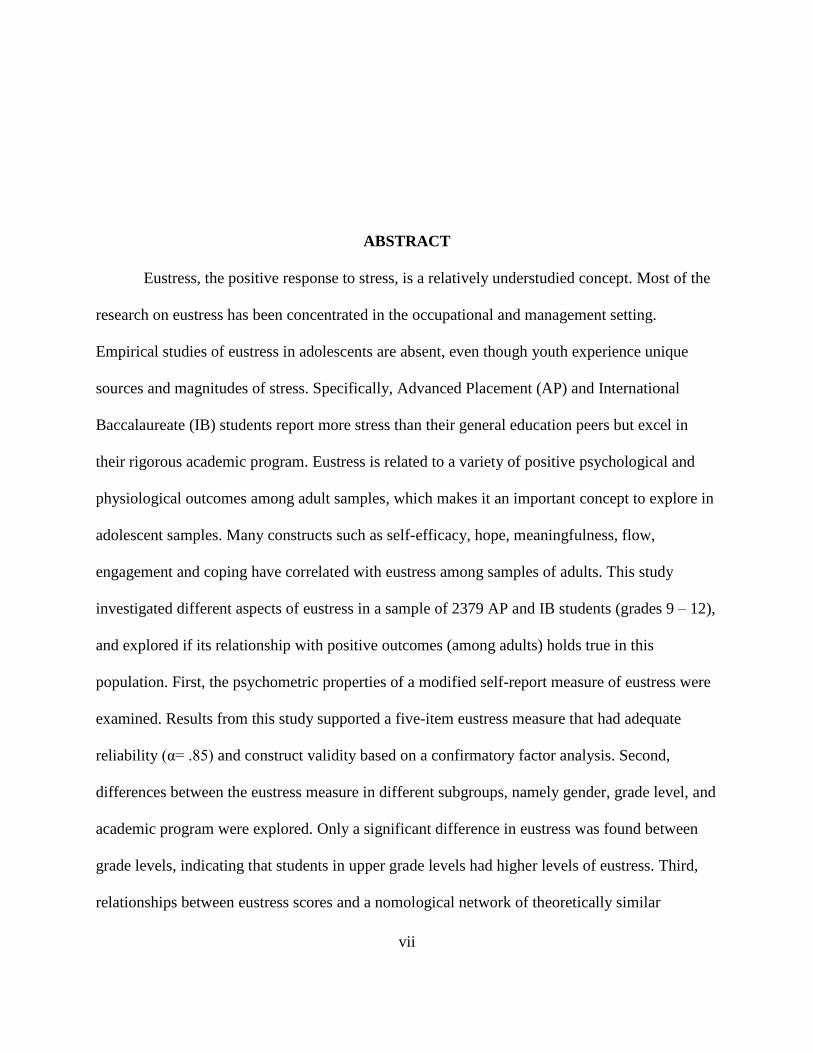
ABSTRACT
Eustress, the positive response to stress, is a relatively understudied concept. Most of the
research on eustress has been concentrated in the occupational and management setting.
Empirical studies of eustress in adolescents are absent, even though youth experience unique
sources and magnitudes of stress. Specifically, Advanced Placement (AP) and International
Baccalaureate (IB) students report more stress than their general education peers but excel in
their rigorous academic program. Eustress is related to a variety of positive psychological and
physiological outcomes among adult samples, which makes it an important concept to explore in
adolescent samples. Many constructs such as self-efficacy, hope, meaningfulness, flow,
engagement and coping have correlated with eustress among samples of adults. This study
investigated different aspects of eustress in a sample of 2379 AP and IB students (grades 9 – 12),
and explored if its relationship with positive outcomes (among adults) holds true in this
population. First, the psychometric properties of a modified self-report measure of eustress were
examined. Results from this study supported a five-item eustress measure that had adequate
reliability (α= .85) and construct validity based on a confirmatory factor analysis. Second,
differences between the eustress measure in different subgroups, namely gender, grade level, and
academic program were explored. Only a significant difference in eustress was found between
grade levels, indicating that students in upper grade levels had higher levels of eustress. Third,
relationships between eustress scores and a nomological network of theoretically similar
viii
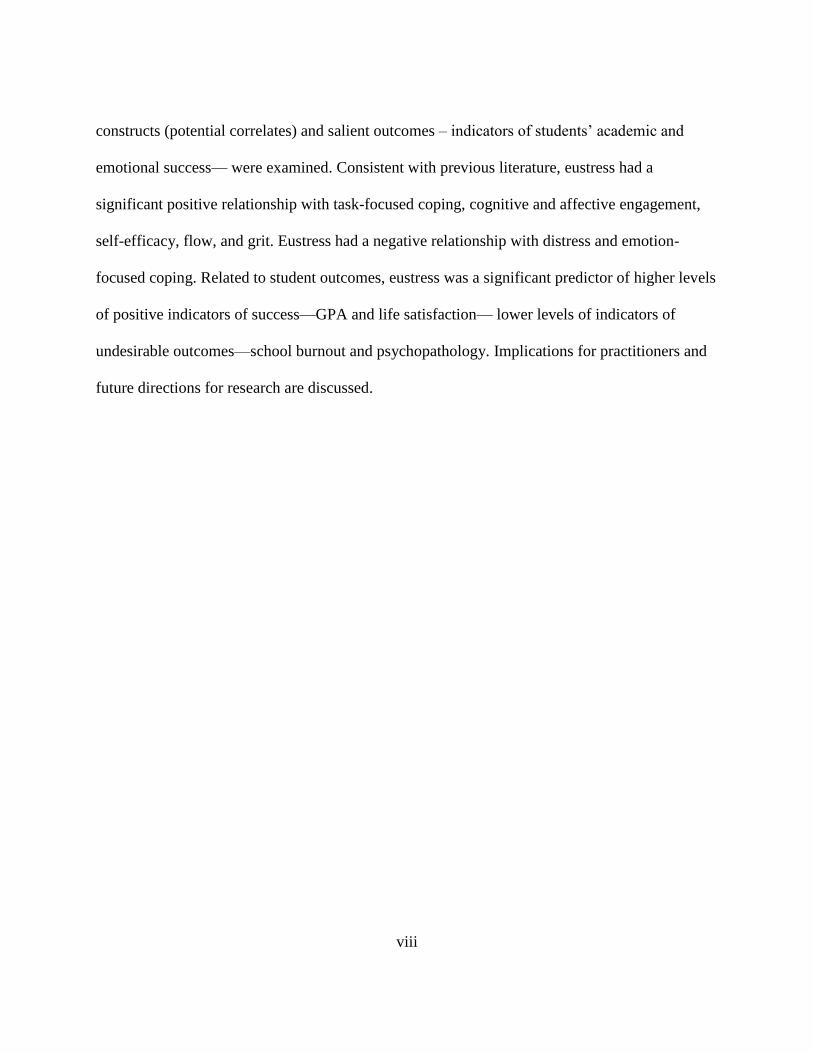
constructs (potential correlates) and salient outcomes – indicators of students’ academic and
emotional success— were examined. Consistent with previous literature, eustress had a
significant positive relationship with task-focused coping, cognitive and affective engagement,
self-efficacy, flow, and grit. Eustress had a negative relationship with distress and emotion-
focused coping. Related to student outcomes, eustress was a significant predictor of higher levels
of positive indicators of success—GPA and life satisfaction— lower levels of indicators of
undesirable outcomes—school burnout and psychopathology. Implications for practitioners and
future directions for research are discussed.
1
CHAPTER I: INTRODUCTION
Statement of the Problem
It has been well documented in the literature that stress causes undesirable outcomes in
adolescents physically, emotionally and psychologically (Byrne, Davenport, & Mazanov, 2007).
While the word “stress” has been traditionally interpreted in a negative way, the original
definition of stress by Hans Seyle (1975) was that “stress is the nonspecific response of the body
to any demand” (p. 39). In this context, stress can take the form of distress, which is a negative
response to stress, but it can also take the form of eustress, which is a positive response to stress.
While coping strategies exist for students to cope with distress, the form of stress that motivates
people in a positive direction has received little attention in the literature. Even though the term
eustress originated in 1975, it has been relatively understudied. However, the little that we know
about eustress has shown associations between this concept and a variety of desirable outcomes
psychically, cognitively and emotionally (Cavanaugh, Boswell, Roehling, & Boudreau, 2000;
Hargrove, Nelson, & Cooper, 2013; Jamieson, Nock, & Mendes, 2012; Little, Simmons, &
Nelson, 2007; O’Sullivan, 2011; Quinones, Rodríguez-Carvajal, & Griffiths, 2017; Simmons &
Nelson, 2001)
Measurement of eustress. Initial studies of eustress have involved construct definition
and corresponding measurement approaches using qualitative data, physiological data, measures
of indirect constructs, and direct self-report measures. The qualitative approach has utilized
semi-structured interviews (Oksman et al., 2016). Physiological data have consisted of heart rate
2
and blood pressure (Bhat, Sameer, & Ganaraja, 2011; Oksman, Ermes, & Kati, 2016). Indirect
measurements of eustress have included the presence of positive psychological states, such as
positive affect, meaningfulness, and hope (Nelson & Simmons, 2011; Simmons & Nelson,
2001). Lastly, other studies have utilized a self-report Likert-scale direct measure of eustress
(Cavanaugh et al., 2000; Gibbons, Deempster, & Moutray, 2009; O’Sullivan, 2011). This study
approached the measurement of eustress through direct measurement so that quantitative data
can be analyzed regarding an individual’s perception of stress. A 2011 study of eustress in
college students advanced a 15-item direct self-report measure called the Eustress Scale
(O’Sullivan, 2011). The psychometric properties of this measure with youth, such as high school
students, have yet to be examined in published research.
Correlates of eustress. Eustress, when conceptualized as a positive response to stress,
has been related to positive psychology states such as positive affect, meaningfulness, and hope
(Edwards & Cooper, 1998; Nelson & Simmons, 2004). Also, it is proposed in the literature that
eustress leads to savoring (i.e., attending to and appreciating positive experiences; Bryant &
Veroff, 2007), which in turn leads to a flow state (i.e., a state of peak performance where an
individual is completely absorbed in a task), which is touted as the ultimate eustress experience
(Hargrove et al., 2013). Flow has been seen to facilitate an indirect relationship between eustress
and student engagement (Mesurado, Cristina Richaud, & José Mateo, 2016). Certain individual
characteristics such as optimism, locus of control, hardiness (reflected in one’s commitment
[viewing tasks as interesting and meaningful], challenge, and sense of control), self-reliance, and
sense of coherence are theorized to promote eustress (Nelson & Simmons, 2011). Personal
beliefs about one’s abilities to be successful in a particular task or domain, captured by the
3
construct self-efficacy, have also been seen to contribute to a positive response to stress
(O’Sullivan, 2010). Similarly, coping strategies seem to be associated with the development of
eustress; specifically, task-focused coping strategies have been seen to precede eustress, whereas
emotion-focused coping strategies were precursors to distress (McGowan, Gardner, & Fletcher,
2006). Correlates of eustress are still being explored in the literature. This study examined
specific correlates within a high-achieving high school population, a group that has been shown
to experience elevated levels of distress (Suldo & Shaunessy-Dedrick, 2013).
Outcomes of eustress. Even with the limited amount of research available on this construct,
multiple studies have shown a correlational relationship between eustress and indicators of
emotional and occupational success. Specifically, eustress relates positively to job satisfaction
and life satisfaction, as well as benefits people physiologically through adaptive cardiovascular
stress response, and cognitively through increased attention (Cavanaugh et al., 2000; Jamieson et
al., 2012; O’Sullivan, 2011). For example, youth who viewed the Graduate Record Exam (GRE)
as a challenge, rather than an anxiety-provoking situation, performed better than a control group
during a simulated GRE test, as well as on the actual GRE months later (Jamieson, Mendes,
Blackstock, & Schmader, 2010). In workplace settings, it is theorized that eustress is associated
with improved employee performance (Hargrove, Becker, & Hargrove, 2015). Conversely,
distress has been associated with decreased job satisfaction and the development of
psychopathology (Cavanaugh et al., 2000; Grant et al., 2003; McMahon et al., 2003). With
students taking accelerated curricula, such as Advanced Placement (AP) classes and International
Baccalaureate (IB) programs, experiencing more distress and academic stressors than their
general education peers (Suldo & Shaunessy-Dedrick, 2013b; Suldo, Dedrick, Shaunessy-
4
Dedrick, Roth, & Ferron, 2015b), it is important that students have the ability to reap the benefits
associated with eustress as well as prevent and limit the detrimental effects associated with
distress. More information regarding AP/IB classes is provided in the next section.
Eustress in unique youth populations, namely students in accelerated curricula. The
notion of eustress may be especially relevant to populations that experience more overall stress,
such as teenagers in AP and IB (Suldo & Shaunessy-Dedrick, 2013). Students in AP classes and
IB programs experience intense academic stressors (Suldo, Shaunessy, Thalji, Michalowski, &
Shaffer, 2009). Despite their academic demands, they maintain exceptionally high academic
performance, while remaining similar to their peers in general education on psychological
functioning (Suldo & Shaunessy-Dedrick, 2013b). A successful student status might be captured
through indicators of both academic and emotional success; eustress would seem to lead to
higher levels of all relevant outcomes including optimal performance in classes and the presence
of positive emotional states. However, little research of eustress has been conducted in the
educational realm. Most studies have concentrated in the occupational/management literature
(Cavanaugh et al., 2000; Oksman et al., 2016; Simmons & Nelson, 2001). While, it can be
hypothesized that improved work performance would be parallel to improved school
performance, there have not been any studies to support that hypothesis.
Purpose of the Study
The purpose of this study was to examine the concept of eustress in the growing
population of AP and IB students. First, the psychometric properties of a modified self-report
measure of eustress (Eustress Scale; O’Sullivan, 2011) were examined for the total sample, as
well as different subpopulations. Second, differences between the eustress measure in different
5
subpopulations were explored. Third, in an initial effort to find out if this is a meaningful concept
in this population, relationships between eustress scores and a nomological network of
theoretically similar constructs (potential correlates) and salient outcomes – indicators of
students’ academic and emotional success were examined. These analyses occurred through
secondary analysis of data collected in 2012 as part of a larger study that examined predictors of
success among AP and IB students (Suldo & Shaunessy, 2010; Suldo, Shaunessy-Dedrick,
Ferron, & Dedrick, 2018). A quantitative approach was used to examine cross-sectional data
from students from all grade levels (9th-12th).
This study provided a first step in exploring the concept of eustress in high school
students in accelerated curricula. Basic research of this construct needs to be established before
applied research (e.g., how to facilitate eustress) can begin. Long-term, fostering student eustress
might help them capitalize on an automatic biological response to improve performance and
keep students engaged. Also, if educators learn how to foster eustress first instead of preventing
and treating distress, it is possible that fewer students would experience the negative
consequences associated with distress. More research is needed to take this largely theoretical
concept, which is associated with positive outcomes in preliminary research with adults, from an
idea in the research literature to having practical implications for educators and psychologists.
Definition of Key Terms
Throughout the study, many of the terms listed below are used frequently. They are
defined when they are introduced in the text, and the reader can use the list below as a reference.
Academic success. Achievement can be indexed through attitudes, behaviors, or skills
that co-occur with and predict positive school-related outcomes, such as on-time graduation and
6
attainment of postsecondary education. In the current study, students’ academic success is
indexed by grade point averages, an outcome that is highly pertinent to the high school years and
participation in accelerated curricula.
Advanced Placement (AP). College-level classes offered in high school that generally
have higher academic rigor than general education classes (College Board, 2003).
Coping. Coping refers to the resources, either in the cognitive or behavioral realm, that
an individual uses to manage the demand(s) placed upon him or her (Lazarus & Folkman, 1984).
Emotional well-being. Mental health defined in accordance with a dual-factor
framework (Suldo & Shaffer, 2008), in which high well-being is reflected in the presence of
positive indicators (i.e., high levels of life satisfaction) and subclinical levels of negative
indicators (e.g., symptoms of academic burnout and psychopathology).
Engagement. The construct of student engagement is multidimensional, and often
consists of three different types of engagement: behavioral, affective, and cognitive. Together,
these constructs define how involved students are in school-related activities, how much pride
and belonging they feel towards their school, and how students regulate and motivate themselves
to achieve future academic goals (Reschly & Christenson, 2012).
Eustress. A form of stress that reflects a positive interpretation and response to the stress
response (Nelson & Simmons, 2011).
Flow. A state individuals experience where they feel completely involved in something
and all other things not related to the task are temporarily forgotten (Csikszentmihalyi,
Abuhamdeh, & Nakamura, 2005).
7
Grit. An internal drive, “perseverance and passion” (Duckworth, Peterson, Matthews, &
Kelly, 2007, p. 1087) that pushes an individual to consistently persist towards his or her goals
through time. Grit is considered a “noncognitive quality,” (p.1088), but it is seen as an important
predictor of success.
International Baccalaureate (IB). A comprehensive, internationally recognized
program for high school juniors and seniors that emphasizes content depth, metacognitive
thinking, global understanding, interpersonal and communication skills, and service to the
community. Students who are freshman and sophomores can take a pre-IB curriculum or enroll
in the Middle Years Program (International Baccalaureate Organization [IBO], 2018).
Nomological network. A nomological network is a synthesis of the constructs,
outcomes, and the dynamic relationships between the factors of a given concept (Connelly, Ones,
& Chernyshenko, 2014).
Savoring. The act of savoring refers to how well people “attend to, appreciate, and
enhance positive experiences in their lives” (Bryant & Veroff, 2007, p. 2).
Self-efficacy. Self-efficacy represents one’s beliefs about their ability to meet the
demands of a task, such as school assignments and learning. People develop self-efficacy in
different areas (e.g., academic vs. social efficacy) and to varying degrees (Bandura, 2006).
Stress. “The pattern of specific and nonspecific responses an organism makes to stimulus
events that disturb its equilibrium and tax or exceed its ability to cope” (Gerrig & Zimbardo,
2002, “S,” para. 74). In addition to such psychological definitions of stress as causing distress
(perceived stress, a form of stress that reflects a negative interpretation and response to the stress
response; Lazarus & Folkman, 1984; Nelson & Simmons, 2011), it can be examined more
8
objectively as consisting of environmental stressors (i.e., “physical or psychological stimuli to
which the individual responds”; Nelson & Simmons, 2011, p. 57) or physiologically via tests of
heartrate, cortisol, etc.
Student success. In prior studies of optimal outcomes among high school students in
accelerated curricula, student success has been examined with attention to indicators of both
academic success and emotional well-being (e.g., Grade Point Average [GPA], happiness; Suldo
& Shaunessy-Dedrick, 2013a).
Research Questions
The specific research questions that were examined in this study are as follows:
1. What are the psychometric properties of the Eustress Scale in students in accelerated
curricula, with regard to the:
a) Factor structure
b) Internal consistency reliability?
2. To what extent, if any, does eustress differ in students in accelerated curricula by:
a) Gender
b) Grade level (9th-12th)
c) Program (AP vs. IB)?
3. What is the nomological network of eustress in students in accelerated curricula , as
determined through examination of concurrent associations with:
a) Distress
b) Student engagement
c) Coping strategies
9
d) Self-efficacy
e) Flow
f) Grit?
4. To what extent, if any, is eustress in students in accelerated curricula related to indicators
of student success, including:
a) Academic performance
b) Emotional well-being?
Hypotheses
Since eustress has been relatively understudied, with no studies within an adolescent
sample, the research questions are mainly exploratory. Drawing on the limited research, for
question one, this researcher hypothesized that eustress can reliably be measured in adolescents
using an adapted version of an instrument that yielded acceptable psychometric properties in an
earlier study of college students (Time 1 α = .77 and Time 2 α = .81; O’Sullivan, 2011). For
question two, the differences in eustress among various subgroups of youth are impossible to
speculate about given the absence of prior research with adolescent samples. For question three,
this researcher’s tentative hypotheses were informed by findings from different studies
(Cavanaugh et al., 2000; McGowan, Gardner, & Fletcher, 2006; Mesurado et al., 2016,
O’Sullivan, 2011) and aspects of conceptual frameworks (Lepine, Podsakoff, & Lepine, 2005,
Nelson & Simmons, 2011). For (a) distress, it is hypothesized that eustress and distress will have
some association (due to the hypothesized concept that eustress and distress can occur in the
same context), but the exact nature of the association is unclear. Cavanaugh and colleagues
(2000) measured both challenge stressors (related to eustress) and hinderance stressors (related to
10
distress) but only performed analysis on their relationship with outcomes, and not the
relationship between these two constructs. Since eustress is usually associated with positive
outcomes, and distress is generally associated with negative outcomes, it is possible that an
inverse association would occur between eustress and distress. For (b) student engagement, it is
hypothesized that eustress will have a positive association with engagement, based on prior
studies finding positive correlations with different aspects of engagement (Mesurado et al.,
2016). Based on the theoretical Holistic Stress framework by Nelson and Simmons (2011),
student engagement may be a proxy for “community involvement,” (p. 56) which is indicated as
an outcome of eustress. For (c) coping strategies, it is hypothesized that eustress will have a
positive association with task/problem-focused coping strategies, and no relationship with
emotion-focused coping strategies. This hypothesis is based on similar results from McGowan
and colleagues (2006) who examined eustress and distress in relation to coping strategies, and
Lepine, Podsakoff, and Lepine (2005) who stated that challenge stressors (related to eustress)
can “activate [a] problem-solving style of coping” (p.765). For (d) self-efficacy, O’Sullivan
(2011) found a positive correlation between eustress and self-efficacy in college-aged students. It
is hypothesized that a similar relationship would be found among this sample of AP/IB students.
Also, self-efficacy may be a proxy of “self-reliance” (p. 56) which is indicated as an individual
difference that precedes eustress in the Nelson and Simmons (2011) model. It is hypothesized to
be a construct that precedes eustress because it is a factor that might help an individual appraise a
stressor more positively, if they feel that have more internal resources to manage the stressor. For
(e) flow, it is hypothesized that flow would have a positive association with eustress, and be an
outcome of eustress, because it has been reported as the ultimate eustress experience (Mesurado
11
et al., 2016). Last, (f) grit is hypothesized to mimic self-efficacy’s relationship with eustress.
There have been no studies examining the relationship between grit and eustress, but grit may be
a proxy for “hardiness” (p. 56) which is also indicated as an individual difference in the Nelson
and Simmons (2011) model, and may be a contributing factor to whether an individual appraises
a stressor negatively or positively. For question four, higher eustress scores are hypothesized to
co-occur with higher scores on positive indicators of academic and emotional success, since it
has been previously related to increased work performance and positive psychology states,
respectively (Hargrove, Nelson & Cooper, 2013). It is also hypothesized that negative
relationships will be found between eustress and negative emotional indicators, such as
psychopathology and school burnout.
Significance of the Study
The results of this study are important for a number of reasons. First, this study provided
descriptive information about eustress in an academically advanced high school population, and
began building a literature base of eustress in adolescents. A reliable and validated measure of
eustress has not yet been established; this study provided psychometric data on a modified
version of a direct measure of eustress that has been used in college students (O’Sullivan, 2011).
Second, this study shed light on other constructs that are related to eustress and provided future
directions for research. The nomological network of eustress was explored in adolescents, and
theoretically related constructs to eustress were examined. Research in this area contributes to a
more refined knowledge base, and paves the way for use of this construct in work with youth.
For instance, this study shed light on how eustress relates to different coping strategies used in
adolescents; findings might provide practical implications and support for fostering specific
12
styles of coping, pending support for eustress as related to positive outcomes. Third, this study
helped determine if eustress is related to overall positive indicators in an adolescent population,
by investigating the relationship of eustress with indicators of student success, e.g., academic
performance and emotional well-being.
13
CHAPTER II: LITERATURE REVIEW
Eustress, the positive response to stress, is a relatively understudied concept. This review
aimed to explore stress as a non-specific response, specifically its ability to be interpreted
positively and negatively. Different theoretical constructs of stress were examined to provide a
rationale for the current study’s theoretical underpinning. Next, consistencies and inconsistencies
in the current literature on eustress were described and synthesized to construct a thorough
understanding of the construct, including the varied measurement approaches that have been
used to capture eustress. Factors found to be related to eustress such as self-efficacy, flow,
engagement, and coping were explored, as well as theoretically similar constructs such as grit
(related to hardiness). Lastly, research and rationale for examining this construct in AP and IB
students were presented. While this is not an exhaustive review of all literature on stress, the
most relevant studies based on population and method were selected.
Conceptualization of Stress
The American Psychological Association (APA, 2002) defines stress as “the pattern of
specific and nonspecific responses an organism makes to stimulus events that disturb its
equilibrium and tax or exceed its ability to cope” (Gerrig & Zimbardo, 2002, “S,” para. 74). As
this definition states, stress does not always manifest itself in a negative way. This non-
directionality view of stress is contrary to popular belief about stress and how the term is
colloquially used. Stress is a popular area of research since it is a pervasive and common
response across the life span, and can arise in many aspects of life.
14
While the term “stress” has been used by individuals- including scientists- for centuries,
an endocrinologist named Hans Seyle applied the term to the biological sciences in 1936. Seyle
defined stress as “the nonspecific response of the body to any demand for change” (Seyle, 1987,
p. 17). Many years later, the APA has kept true to this non-directional definition of stress. The
reason for this non-directionality is that Selye conceptualized that stress could be perceived and
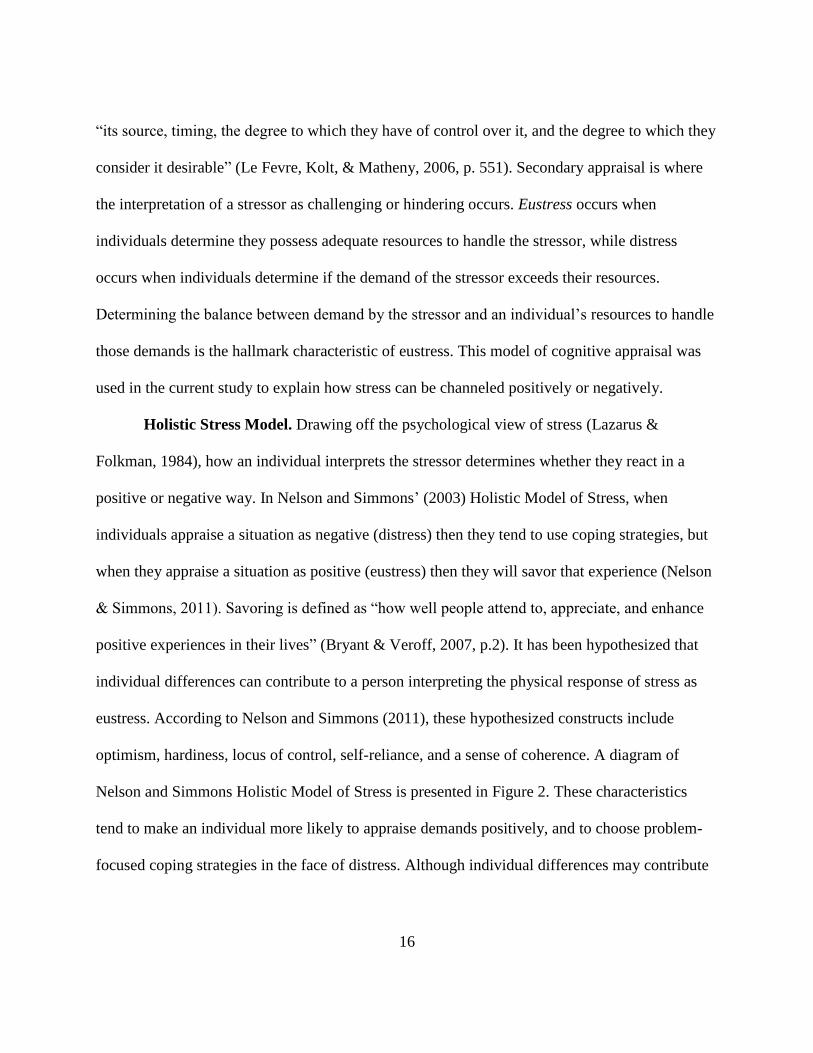
manifested either positively or negatively (Seyle, 1975). According to his model, when a person
encounters a stressor, his or her body may automatically react with the physiological stress
response, but the outcome and interpretation of this stressor can either be positive or negative.
The evaluation stage is when a person determines the directionality of the stress. In this model,
the negative conceptualization and reaction to stress is referred to as “distress.” This is typically
the reaction people are talking about when they mention stress. However, stress can also be
responded to positively and related to positive outcomes. This positive response to stress is
called “eustress.” See Figure 1 (Seyle, 1975) for a diagram of this process.
Figure 1. Seyle’s Conceptualization of Stress
Throughout this study, the term “stress” is used to describe physiological arousal,
“distress” is used to denote a negative reaction to stress, and “eustress” is used to describe a
Stress
(nonspecific Stressor
(cause)
Eustress
(positive
Distress
(negative
15
positive response to stress. The following sections describe the theoretical models of stress,
describe the limited research base on eustress, explore factors related to eustress, and identify the
gaps in the literature that this study aims to fill.
Theoretical Background of Stress
Three distinct models of stress have been put forth in the literature that conceptualize
stress: the medical model, the environmental model, and the psychological model (McNamara,
2000). The medical model focuses on the body’s physiological response to a stressor (Szabo,
Tache, & Somogyi, 2012). The environmental model focuses on the external (environmental)
characteristics that induce stress, and views the psychological appraisal of stress as potentially
confounding (Cohen, Kessler, & Gordon, 1995; McNamara, 2000). While stressors place an
environmental demand upon the individual, eustress and distress are a result of the interpretation
of those demands, which is sometimes based on an evaluation of one’s personal resources.
Lastly, in the psychological model, stress is conceptualized as an interactive relationship between
the stressors individuals face, and their cognitive appraisal of their ability to manage the stressor
(Lazarus & Folkman, 1984).
The psychological model, or theory of cognitive appraisal, by Lazarus and Folkman
(1984), is the conceptualization of stress most pertinent to this study. This model purports that
the response to stress consists of a primary and secondary appraisal of the stressor. The primary
appraisal determines whether the stressor is worth attending to, and the secondary appraisal
requires individuals to determine the amount of resources this stressor requires, and if they
possess the resources to handle the stressor. Besides the perception of the amount of demand
required by the stressor, the way we view stress can also be influenced by characteristics such as
16
“its source, timing, the degree to which they have of control over it, and the degree to which they
consider it desirable” (Le Fevre, Kolt, & Matheny, 2006, p. 551). Secondary appraisal is where
the interpretation of a stressor as challenging or hindering occurs. Eustress occurs when
individuals determine they possess adequate resources to handle the stressor, while distress
occurs when individuals determine if the demand of the stressor exceeds their resources.
Determining the balance between demand by the stressor and an individual’s resources to handle
those demands is the hallmark characteristic of eustress. This model of cognitive appraisal was
used in the current study to explain how stress can be channeled positively or negatively.
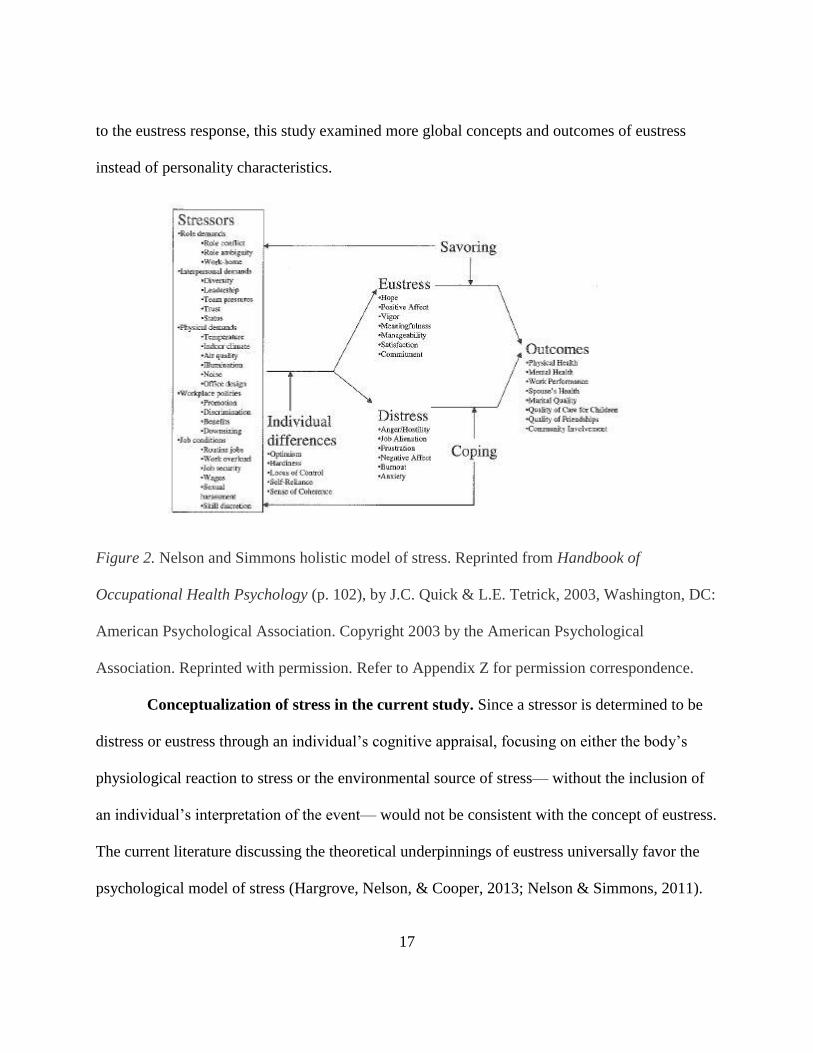
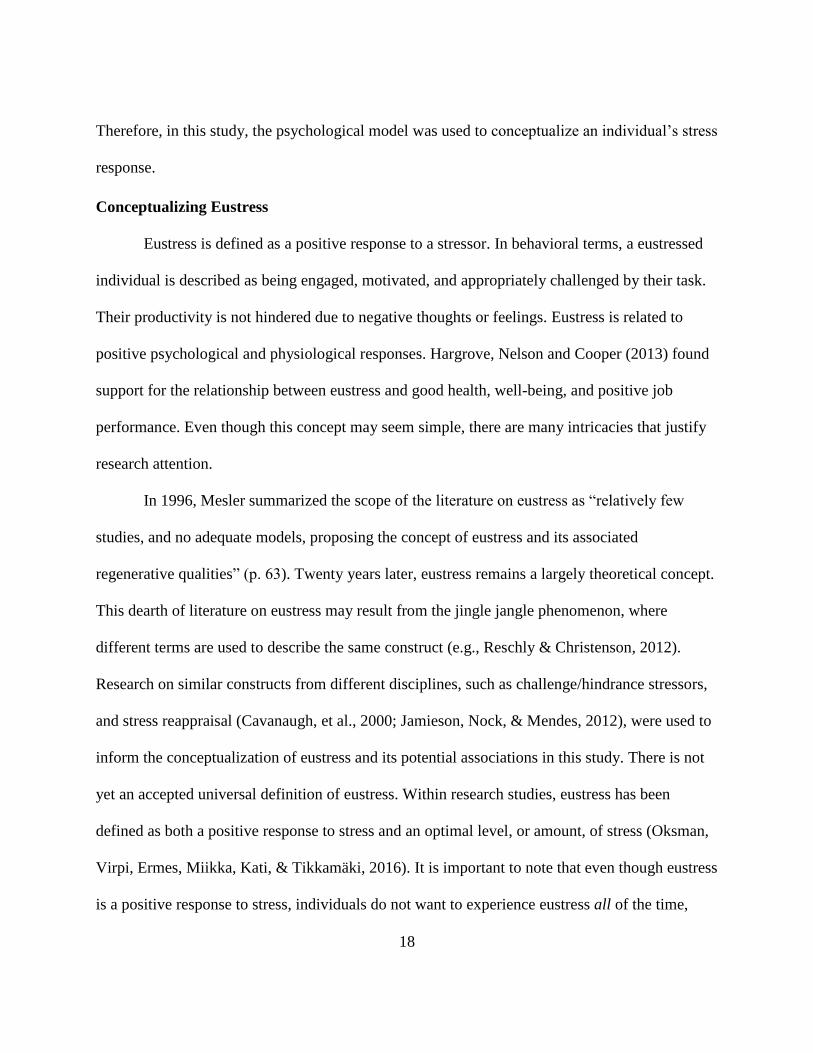
Holistic Stress Model. Drawing off the psychological view of stress (Lazarus &
Folkman, 1984), how an individual interprets the stressor determines whether they react in a
positive or negative way. In Nelson and Simmons’ (2003) Holistic Model of Stress, when
individuals appraise a situation as negative (distress) then they tend to use coping strategies, but
when they appraise a situation as positive (eustress) then they will savor that experience (Nelson
& Simmons, 2011). Savoring is defined as “how well people attend to, appreciate, and enhance
positive experiences in their lives” (Bryant & Veroff, 2007, p.2). It has been hypothesized that
individual differences can contribute to a person interpreting the physical response of stress as
eustress. According to Nelson and Simmons (2011), these hypothesized constructs include
optimism, hardiness, locus of control, self-reliance, and a sense of coherence. A diagram of
Nelson and Simmons Holistic Model of Stress is presented in Figure 2. These characteristics
tend to make an individual more likely to appraise demands positively, and to choose problem-
focused coping strategies in the face of distress. Although individual differences may contribute
17
to the eustress response, this study examined more global concepts and outcomes of eustress
instead of personality characteristics.
Figure 2. Nelson and Simmons holistic model of stress. Reprinted from Handbook of
Occupational Health Psychology (p. 102), by J.C. Quick & L.E. Tetrick, 2003, Washington, DC:
American Psychological Association. Copyright 2003 by the American Psychological
Association. Reprinted with permission. Refer to Appendix Z for permission correspondence.
Conceptualization of stress in the current study. Since a stressor is determined to be
distress or eustress through an individual’s cognitive appraisal, focusing on either the body’s
physiological reaction to stress or the environmental source of stress— without the inclusion of
an individual’s interpretation of the event— would not be consistent with the concept of eustress.
The current literature discussing the theoretical underpinnings of eustress universally favor the
psychological model of stress (Hargrove, Nelson, & Cooper, 2013; Nelson & Simmons, 2011).
18
Therefore, in this study, the psychological model was used to conceptualize an individual’s stress
response.
Conceptualizing Eustress
Eustress is defined as a positive response to a stressor. In behavioral terms, a eustressed
individual is described as being engaged, motivated, and appropriately challenged by their task.
Their productivity is not hindered due to negative thoughts or feelings. Eustress is related to
positive psychological and physiological responses. Hargrove, Nelson and Cooper (2013) found
support for the relationship between eustress and good health, well-being, and positive job
performance. Even though this concept may seem simple, there are many intricacies that justify
research attention.
In 1996, Mesler summarized the scope of the literature on eustress as “relatively few
studies, and no adequate models, proposing the concept of eustress and its associated
regenerative qualities” (p. 63). Twenty years later, eustress remains a largely theoretical concept.
This dearth of literature on eustress may result from the jingle jangle phenomenon, where
different terms are used to describe the same construct (e.g., Reschly & Christenson, 2012).
Research on similar constructs from different disciplines, such as challenge/hindrance stressors,
and stress reappraisal (Cavanaugh, et al., 2000; Jamieson, Nock, & Mendes, 2012), were used to
inform the conceptualization of eustress and its potential associations in this study. There is not
yet an accepted universal definition of eustress. Within research studies, eustress has been
defined as both a positive response to stress and an optimal level, or amount, of stress (Oksman,
Virpi, Ermes, Miikka, Kati, & Tikkamäki, 2016). It is important to note that even though eustress
is a positive response to stress, individuals do not want to experience eustress all of the time,
19
since individuals need time to relax and recover from stressors (Hargrove et al. 2013). This
literature review attempts to examine the most salient studies related to eustress, in order to
combine similar views and point out discrepancies between them.
A fundamental similarity in the literature is that eustress and distress are distinct
constructs and are not opposite ends of a spectrum (Le Fevre, Kolt, & Matheny, 2006; Nelson &
Simmons, 2011). Eustress and distress can occur simultaneously, and manipulating the amount
of either eustress or distress does not automatically increase or decrease the other construct.
Nelson and Simmons (2011) are prominent authors in the eustress literature who have
contributed empirical and theoretical pieces related to this construct. They advocate for a holistic
view of stress that incorporates both the positive and negative responses, and supports the notion
that we may respond to a stressor with both eustress and distress at the same time (Nelson &
Simmons, 2011). For example, Nelson and Simmons (2011) examined the situation of getting a
promotion at work. This could elicit eustress from an individual if he or she finds the new
position engaging and meaningful and looks at it as a challenge, and it could also elicit distress if
an individual is worried about meeting the standards and expectation of the new position. An
example more relevant to AP/IB youth could be getting into the IB program or an AP class itself.
The student may feel eustress about the growth in learning they will experience from the class,
but they may feel distress about the expectations or workload required by the class. Overall,
Nelson and Simmons (2011) reaffirm that eustress and distress are distinct constructs and that
individual differences may affect eustress. If both states of stress are present, it is not clear which
one an individual will attend to the most. Future research should gather information about which
20
stress response is dominant if both are present. Regardless, it is important to note that eustress
and distress are separate and distinct constructs.
A fundamental difference exists in the literature regarding if a positive response to stress,
eustress, is related to the amount of stress or the interpretation of the stress response. This debate
about amount versus interpretation comes from the Yerkes-Dodson law (Cohen, 2011) and how
Seyle’s (1975) stress research has been applied to this concept. Psychologists Robert Yerkes and
John Dodson established this law in 1908 when they investigated increasing arousal levels on
maze completion in rats. The two scientists discovered that a mild electric shock was associated
with the best maze performance, whereas when the shock became too strong the rat’s
performance declined. This led the scientists to conclude that arousal level and performance were
associated in an inverted U shape. This means that as arousal level increases, so does
performance, but only up to a certain point. Once a tipping point is reached, performance
decreases with increasing arousal level. However, this optimal amount of stress is not defined in
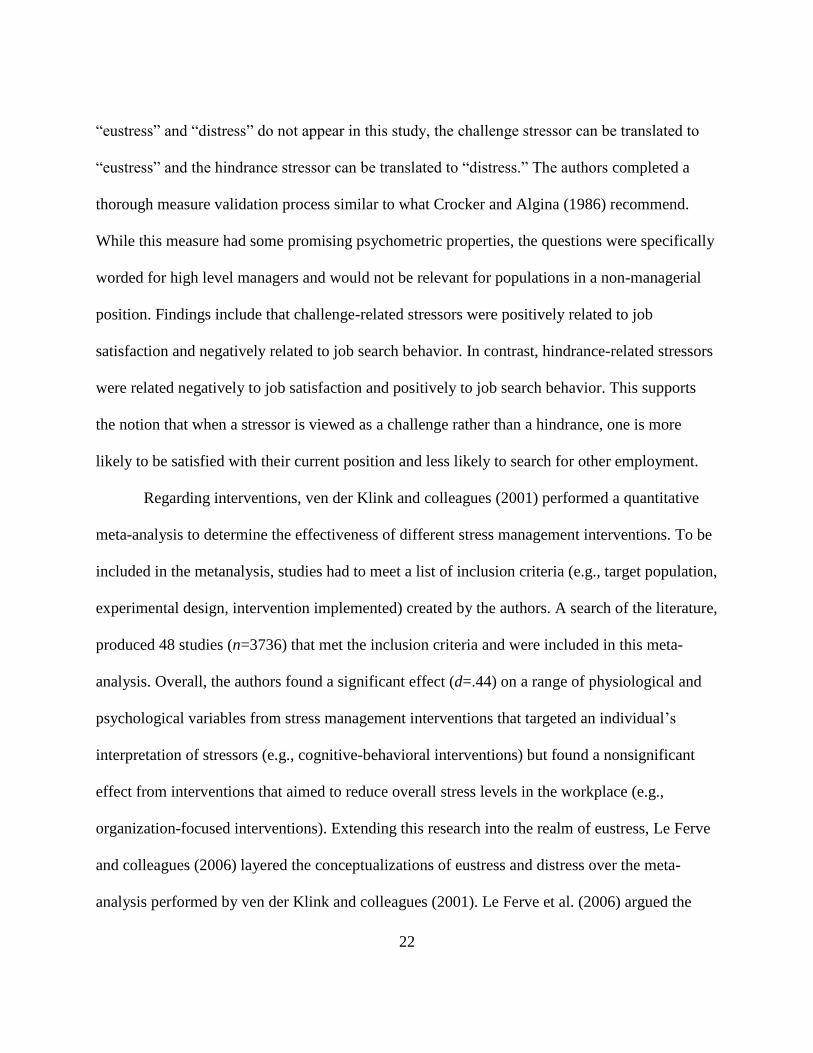
the literature. Figure 3 displays the Yerkes-Dodson law. The application of the Yerkes-Dodson
law to eustress suggests that there exists an optimal level of stress, which some interpret as
eustress, that is associated with positive outcomes, namely optimal performance. This application
of eustress to the Yerkes-Dodson law has come under some debate. Le Fevre, Matheny, and Kolt
(2003) argue that the Yerkes-Dodson law is not an accurate representation of Seyle’s (1975)
original concept of eustress. The original concept of eustress is a positive response to stress due
to interpretation, not amount, and this delineation cannot be measured using rats. In other words,
to keep true to Seyle’s (1987) fundamental conceptualization of eustress, Le Fervre and
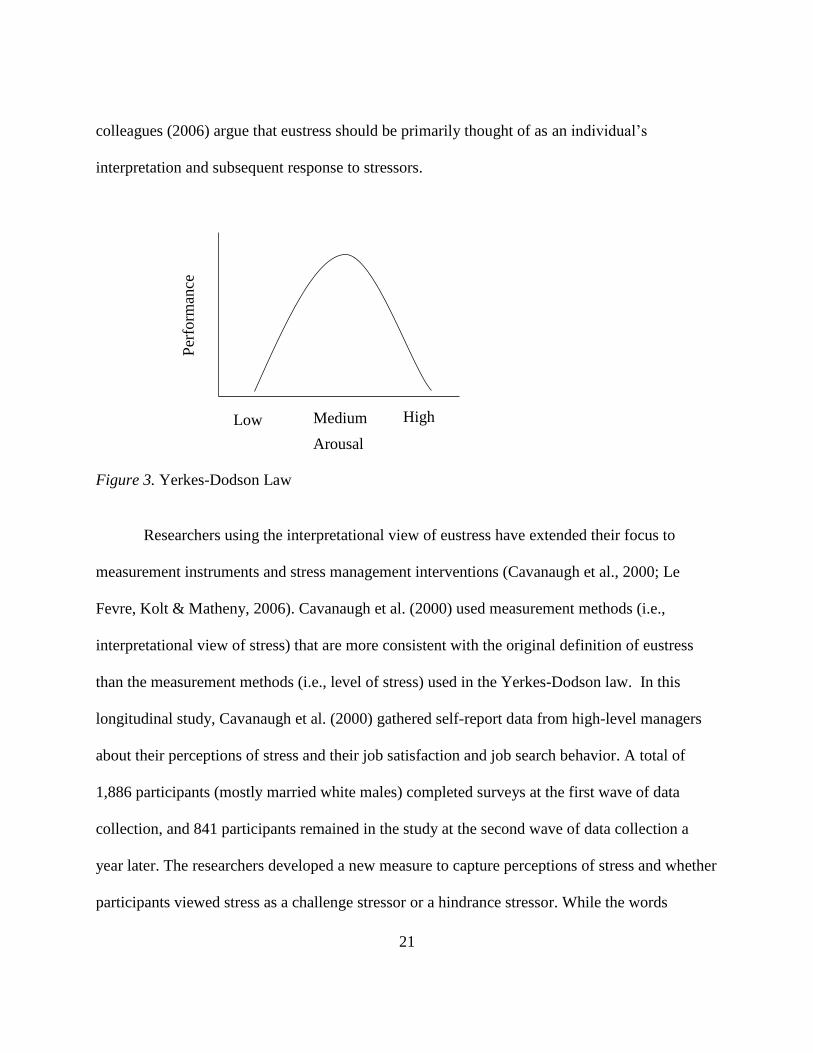
21
colleagues (2006) argue that eustress should be primarily thought of as an individual’s
interpretation and subsequent response to stressors.
Figure 3. Yerkes-Dodson Law
Researchers using the interpretational view of eustress have extended their focus to
measurement instruments and stress management interventions (Cavanaugh et al., 2000; Le
Fevre, Kolt & Matheny, 2006). Cavanaugh et al. (2000) used measurement methods (i.e.,
interpretational view of stress) that are more consistent with the original definition of eustress
than the measurement methods (i.e., level of stress) used in the Yerkes-Dodson law. In this
longitudinal study, Cavanaugh et al. (2000) gathered self-report data from high-level managers
about their perceptions of stress and their job satisfaction and job search behavior. A total of
1,886 participants (mostly married white males) completed surveys at the first wave of data
collection, and 841 participants remained in the study at the second wave of data collection a
year later. The researchers developed a new measure to capture perceptions of stress and whether
participants viewed stress as a challenge stressor or a hindrance stressor. While the words
Per
form
ance
Arousal
Low Medium High
22
“eustress” and “distress” do not appear in this study, the challenge stressor can be translated to
“eustress” and the hindrance stressor can be translated to “distress.” The authors completed a
thorough measure validation process similar to what Crocker and Algina (1986) recommend.
While this measure had some promising psychometric properties, the questions were specifically
worded for high level managers and would not be relevant for populations in a non-managerial
position. Findings include that challenge-related stressors were positively related to job
satisfaction and negatively related to job search behavior. In contrast, hindrance-related stressors
were related negatively to job satisfaction and positively to job search behavior. This supports
the notion that when a stressor is viewed as a challenge rather than a hindrance, one is more
likely to be satisfied with their current position and less likely to search for other employment.
Regarding interventions, ven der Klink and colleagues (2001) performed a quantitative
meta-analysis to determine the effectiveness of different stress management interventions. To be
included in the metanalysis, studies had to meet a list of inclusion criteria (e.g., target population,
experimental design, intervention implemented) created by the authors. A search of the literature,
produced 48 studies (n=3736) that met the inclusion criteria and were included in this meta-
analysis. Overall, the authors found a significant effect (d=.44) on a range of physiological and
psychological variables from stress management interventions that targeted an individual’s
interpretation of stressors (e.g., cognitive-behavioral interventions) but found a nonsignificant
effect from interventions that aimed to reduce overall stress levels in the workplace (e.g.,
organization-focused interventions). Extending this research into the realm of eustress, Le Ferve
and colleagues (2006) layered the conceptualizations of eustress and distress over the meta-
analysis performed by ven der Klink and colleagues (2001). Le Ferve et al. (2006) argued the
23
results from this meta-analysis (ven der Klink et al., 2001) support the notion that the expression
of eustress and distress is determined by “the individual’s perception of the amount of demand it
represents,” (p. 551) and their recognition of certain characteristics about the stressor such as its
“source, timing, the degree to which they have control over it, and the degree to which they
consider it desirable” (p. 551). These studies provide preliminary support for using an
interpretational view to measure eustress, rather than strictly looking at the sheer amount of
stress to classify it as positive or negative.
While the literature is not advanced enough to definitively state if it is a combination of
the two concepts, amount and interpretation, that elicits eustress, previous research supports the
interpretational view of eustress (Cavanaugh et al., 2000; Le Fevre, Kolt & Matheny, 2006).
Therefore, for the purposes of this study, eustress was conceptualized as the interpretation of the
stressor, and not as an optimal amount of stress.
Challenge Stressor-Hindrance Stressor Framework. The aforementioned Yerkes-
Dodson law (Cohen, 2011) proposed that there is an ideal level of stress that corresponds with an
ideal level of performance, however, multiple studies have not supported this relationship
(Lienert & Baumler, 1994; Teigen, 1994; Westman & Eden, 1996). The Challenge Stressor
Hindrance Stressor Framework (CSHSF) provides one explanation for the inconsistent
relationship between stress and performance (Lepine, Podsakoff, & Lepine, 2005). In the
CSHSF, the challenge stressors are those situations that are appraised as “having the potential to
promote personal gain or growth, trigger positive emotions, and activate [a] problem-solving
style of coping” (p.765), and the hindrance stressors are demands that are appraised as “having
the potential to harm personal growth or gain, trigger negative emotions, and [activate] a passive
24
style of coping” (p. 765). Using the expectancy theory (Vroom, 1964), it is hypothesized that
with challenge stressors, people would be more motivated, because they are likely to believe that
they possess the resources to cope with the demands, and that the effort put into the situation will
produce desired and personally valuable results. On the other hand, it is hypothesized that
hindrance stressors would be associated with low motivation, because people believe they are
less likely to successfully cope with these demands, so this roadblock prevents them from
evaluating the potential outcomes of the situation because success is viewed as extremely
unlikely. Results from the meta-analysis examining this framework (Lepine et al., 2005), showed
that the relationship between motivation and challenge stressors was significantly positive
(=.22), and the relationship between motivation and hindrance stressors was significantly
negative (= -.19). Regarding overall performance, stressors as a whole explained 8% of the
variance in performance, with challenge stressors having a positive relationship (= .21), and
hindrance stressors having a negative relationship (=-.27). This framework is applicable to the
proposed study, because it increases the importance of understanding and harnessing “good
stress” to increase performance and motivation. Since eustress is relatively understudied in the
literature, related constructs such as challenge stressors, can be used to deepen our understanding
of eustress and the potential benefits it might provide to those in occupational or educational
realms.
Measurement of Eustress
Since eustress is a relatively understudied concept, measurement, which is the next step
in bringing this concept into more applied research, is an important aspect to analyze. Reliability
and validity are important indicators of a psychometrically sound measure. Reliability refers to
25
the consistency of a measure and indicates that the timing of assessment should not affect results
(American Educational Research Association [AERA], APA, & National Council on
Measurement in Education [NCME], 2014). According to the Standards for Educational and
Psychological Testing (2014), assessing validity, i.e., support that the measure appropriately
assesses its intended construct(s), is foundational for any proposed measurement tool. Validity is
established through five essential components: content, response process, internal structure,
relationships to other variables, and consequences of testing (AERA, APA, & NCME, 2014). If
available, data related to these different aspects of measurement will be reported for the different
measures presented below.
Qualitative approach. The qualitative approach, which is limited in this literature, has
consisted of mainly interviews with specific groups of people who experience high levels of
stress (Gibbons et al., 2008; Oksman et al., 2016). For example, Oksman and colleagues (2016)
examined eustress in 21 entrepreneurs in Finland through semi-structured interviews to find out
how they balanced positive and negative stress. Nine of these participants also wore a heart-rate
monitor for a week to capture physiological data. This physiological stress measurement uses
heart rate to determine if the body is in recovery mode or stress mode, while considering
situational factors. Since this physiological data does not differentiate between positive and
negative stress, the semi-structured interviews were used to in conjunction with this data to
determine results. The participants were primarily in their thirties and forties and were leaders of
small companies. The interviews took approximately two hours. Qualitatively, the participants
confirmed the presence of both eustress and distress in situations, such that they were “mixed
with both positive and negative emotions, such as excitement, joy, and anxiety” (p. 346), even
26
when the physiological data showed similar levels of stress across situations. The researchers
concluded that the physiological reaction to stress is similar, and that it is the individual’s
interpretation of the situation that determines how he or she reacts. The situations that triggered a
positive stress experience were a presentation, a challenging negotiation, and preparing for a
meeting with a potential client. However, the individuals reported that it was difficult to
categorize events as either positive or negative stress experiences, because both emotions were
present together frequently. This study illustrates that the concept of eustress cannot be
determined by the amount physiological stress experienced, rather it is understood in how an
individual interprets the stressor.
Quantitative approach. The quantitative approach is the most prevalent in measuring
eustress, and has consisted of largely self-report measures (Gibbons et al., 2009, O’Sullivan,
2011, Rodriguez, Kozusnik, & Perio, 2013; Simmons, 2001). Researchers have taken two
different approaches in the quantitative measurement of eustress: indirect or direct measurement.
Indirect measurement of eustress. In some studies and conceptual frameworks (Nelson
& Simmons, 2011; Simmons & Nelson, 2001), eustress was conceptualized and measured in an
indirect way as the presence of positive psychology states (Little, Simmons, & Nelson, 2007;
Simmons & Nelson, 2001). For example, Nelson and Simmons (2011) proposed that positive
psychological states such as hope, positive affect, vigor, meaningfulness, manageability,
satisfaction, and commitment are indicators of eustress. The Holistic Stress Model (Nelson &
Simmons, 2003) only focuses on the psychological response to stress, so Nelson and Simmons
(2011) argue that a positive response to stress, i.e. eustress, is equivalent to positive psychology
states, e.g. hope.
27
Simmons and Nelson (2001) examined eustress and its relationship to perceived health in
158 hospital nurses, a population selected because their line of work is associated with high
levels of stress. The researchers defined eustress as “a positive psychological response to a
stressor, as indicated by the presence of positive psychological states” (p. 9), specifically positive
affect, meaningfulness, and hope. In this cross-sectional study, the independent variables were
measured through self-report questionnaires measuring each of these positive states to represent
eustress, and negative affect to represent distress. Measures included the Positive and Negative
Affect Schedule (PANAS; Watson, Clark, & Tellegen, 1988), the meaningfulness subscale of a
situational sense of coherence measure (Artinian & Conger, 1997), and the State Hope Scale
(Snyder, Sympson, Ybasco, Borders, Babyk, & Higgins, 1996). The dependent variable was
perceived physical health, measured by select items from the Health Perceptions Questionnaire
(Ware, Davies-Avery, & Donald, 1978). The study found that eustress can be distinguished from
distress, and that the positive relationship between hope and perceptions of health ( = .51)
indicated the benefits of eustress. The researchers noted that even with large exposure to
stressors, the nurses who dealt with the most extreme cases were the most actively engaged in
their work. These findings illustrate that even in populations with high stress levels, people can
still view stress positively and manifest positive psychology states. While this study shows how
positive responses to stress in the form of hope, meaningfulness, and positive affect led to
positive health, eustress was measured indirectly and the three states were not combined into one
composite score of eustress. Instead, each positive state was deemed an appropriate proxy of
eustress and was examined individually in relation to outcomes.
28
Little, Simmons, and Nelson (2007) examined eustress and distress in pastors to assess
the health of these organizational leaders. The positive psychological state of engagement and
the positive behavior of forgiveness were conceptualized as indicators of eustress. Indicators of
distress included the negative psychological state of burnout and the negative behavior of
revenge. The study sample consisted of 117 male pastors, with the most endorsed age range
falling between 45-54 years old (24.1%). Participants completed self-report measures of family-
work conflict, negative affect, positive affect, burnout, engagement, revenge behavior,
forgiveness behavior, and perception of health. After controlling for family-work conflict,
positive affect positively related to health (r= .47), and revenge behavior negatively related to
health (r= -.29). This result adds support to the research that suggests eustress (as defined by
eustress proxies) is related to better perceptions of health. However, it is unclear whether positive
psychology states are a part of eustress, related to eustress, or by-products of eustress. The
indirect measurement of eustress is questionable, since using related constructs requires more
interpretation by the researcher and may not accurately capture what eustress uniquely
contributes to the relationship. There is not enough research, especially with adolescents, to
determine how these positive psychology states are related to eustress.
Direct measurement of eustress. Other studies have used a direct measurement of the
interpretation of stress (Gibbons, 2009; O’Sullivan, 2011; Rodriguez et al., 2013). To date, there
are three direct measurement scales of eustress. Each of the scales is reviewed below, as well as
summarized in Table 1.
Gibbons et al. (2009) explored what stressors in nursing students were related to distress
and/or eustress, using the Index of Sources of Stress in Nursing Students (ISSN). Many stress
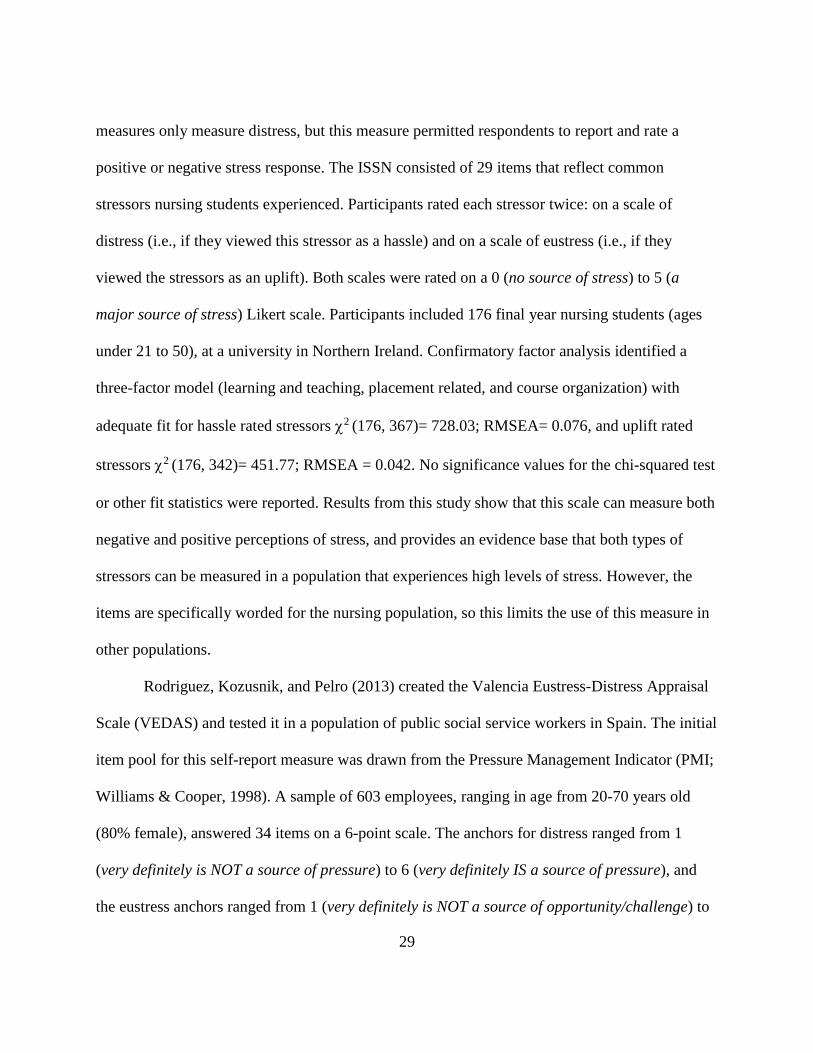
29
measures only measure distress, but this measure permitted respondents to report and rate a
positive or negative stress response. The ISSN consisted of 29 items that reflect common
stressors nursing students experienced. Participants rated each stressor twice: on a scale of
distress (i.e., if they viewed this stressor as a hassle) and on a scale of eustress (i.e., if they
viewed the stressors as an uplift). Both scales were rated on a 0 (no source of stress) to 5 (a
major source of stress) Likert scale. Participants included 176 final year nursing students (ages
under 21 to 50), at a university in Northern Ireland. Confirmatory factor analysis identified a
three-factor model (learning and teaching, placement related, and course organization) with
adequate fit for hassle rated stressors 2 (176, 367)= 728.03; RMSEA= 0.076, and uplift rated
stressors 2 (176, 342)= 451.77; RMSEA = 0.042. No significance values for the chi-squared test
or other fit statistics were reported. Results from this study show that this scale can measure both
negative and positive perceptions of stress, and provides an evidence base that both types of
stressors can be measured in a population that experiences high levels of stress. However, the
items are specifically worded for the nursing population, so this limits the use of this measure in
other populations.
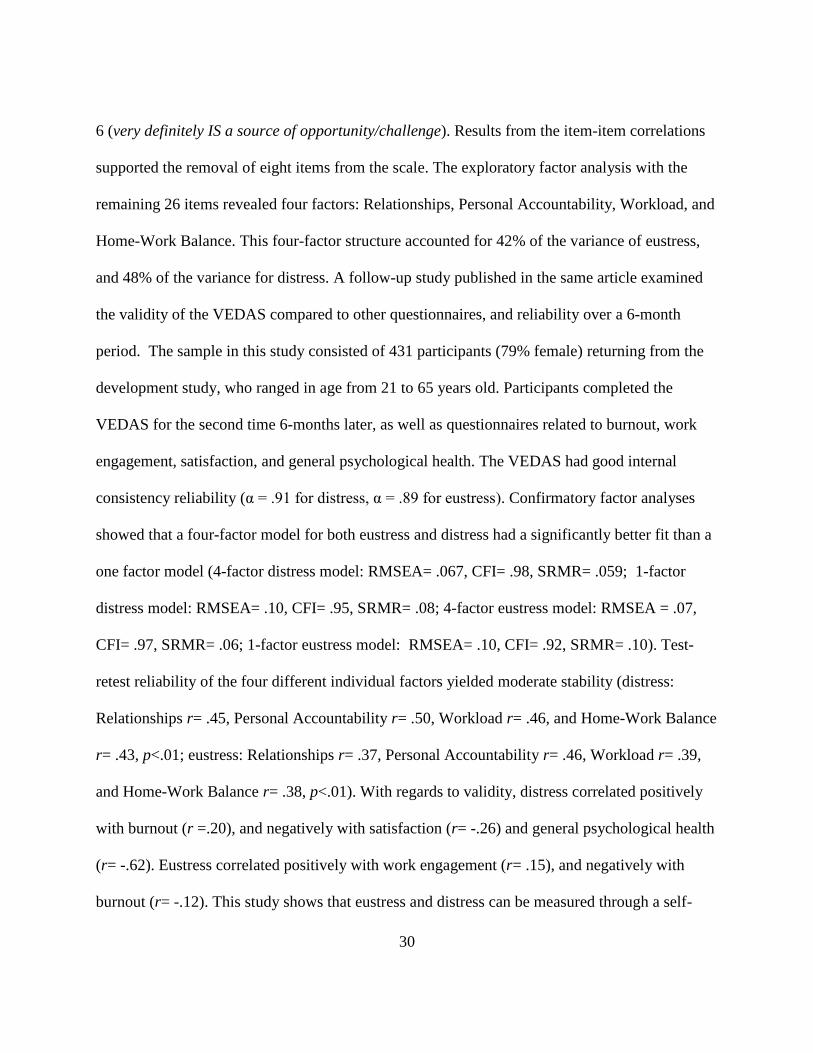
Rodriguez, Kozusnik, and Pelro (2013) created the Valencia Eustress-Distress Appraisal
Scale (VEDAS) and tested it in a population of public social service workers in Spain. The initial
item pool for this self-report measure was drawn from the Pressure Management Indicator (PMI;
Williams & Cooper, 1998). A sample of 603 employees, ranging in age from 20-70 years old
(80% female), answered 34 items on a 6-point scale. The anchors for distress ranged from 1
(very definitely is NOT a source of pressure) to 6 (very definitely IS a source of pressure), and
the eustress anchors ranged from 1 (very definitely is NOT a source of opportunity/challenge) to
30
6 (very definitely IS a source of opportunity/challenge). Results from the item-item correlations
supported the removal of eight items from the scale. The exploratory factor analysis with the
remaining 26 items revealed four factors: Relationships, Personal Accountability, Workload, and
Home-Work Balance. This four-factor structure accounted for 42% of the variance of eustress,
and 48% of the variance for distress. A follow-up study published in the same article examined
the validity of the VEDAS compared to other questionnaires, and reliability over a 6-month
period. The sample in this study consisted of 431 participants (79% female) returning from the
development study, who ranged in age from 21 to 65 years old. Participants completed the
VEDAS for the second time 6-months later, as well as questionnaires related to burnout, work
engagement, satisfaction, and general psychological health. The VEDAS had good internal
consistency reliability (α = .91 for distress, α = .89 for eustress). Confirmatory factor analyses
showed that a four-factor model for both eustress and distress had a significantly better fit than a
one factor model (4-factor distress model: RMSEA= .067, CFI= .98, SRMR= .059; 1-factor
distress model: RMSEA= .10, CFI= .95, SRMR= .08; 4-factor eustress model: RMSEA = .07,
CFI= .97, SRMR= .06; 1-factor eustress model: RMSEA= .10, CFI= .92, SRMR= .10). Test-
retest reliability of the four different individual factors yielded moderate stability (distress:
Relationships r= .45, Personal Accountability r= .50, Workload r= .46, and Home-Work Balance
r= .43, p<.01; eustress: Relationships r= .37, Personal Accountability r= .46, Workload r= .39,
and Home-Work Balance r= .38, p<.01). With regards to validity, distress correlated positively
with burnout (r =.20), and negatively with satisfaction (r= -.26) and general psychological health
(r= -.62). Eustress correlated positively with work engagement (r= .15), and negatively with
burnout (r= -.12). This study shows that eustress and distress can be measured through a self-
31
report measure with adequate psychometric properties. While this tool is more generic than the
ISSN described above, this scale was designed for adults in an occupational setting, and not
youth in an educational setting.
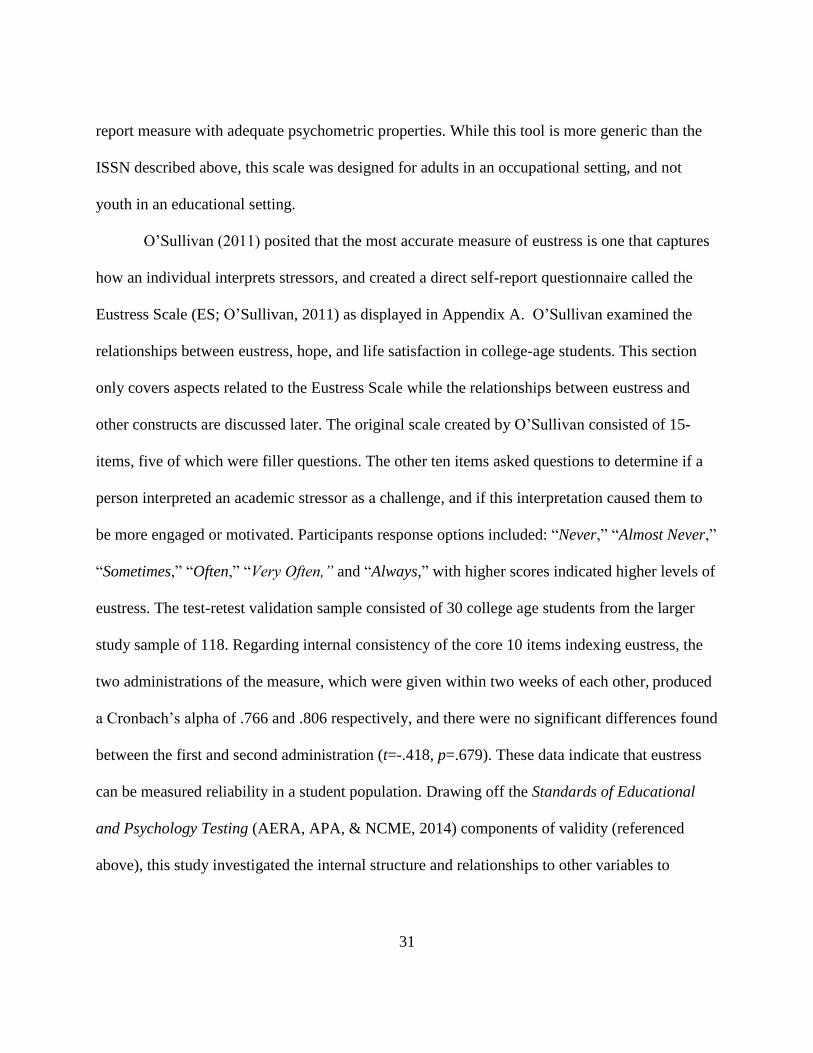
O’Sullivan (2011) posited that the most accurate measure of eustress is one that captures
how an individual interprets stressors, and created a direct self-report questionnaire called the
Eustress Scale (ES; O’Sullivan, 2011) as displayed in Appendix A. O’Sullivan examined the
relationships between eustress, hope, and life satisfaction in college-age students. This section
only covers aspects related to the Eustress Scale while the relationships between eustress and
other constructs are discussed later. The original scale created by O’Sullivan consisted of 15-
items, five of which were filler questions. The other ten items asked questions to determine if a
person interpreted an academic stressor as a challenge, and if this interpretation caused them to
be more engaged or motivated. Participants response options included: “Never,” “Almost Never,”
“Sometimes,” “Often,” “Very Often,” and “Always,” with higher scores indicated higher levels of
eustress. The test-retest validation sample consisted of 30 college age students from the larger
study sample of 118. Regarding internal consistency of the core 10 items indexing eustress, the
two administrations of the measure, which were given within two weeks of each other, produced
a Cronbach’s alpha of .766 and .806 respectively, and there were no significant differences found
between the first and second administration (t=-.418, p=.679). These data indicate that eustress
can be measured reliability in a student population. Drawing off the Standards of Educational
and Psychology Testing (AERA, APA, & NCME, 2014) components of validity (referenced
above), this study investigated the internal structure and relationships to other variables to
32
advance the validity of this measure in an adolescent population. Further details about this
instrument are described in the methods section of Chapter 3.
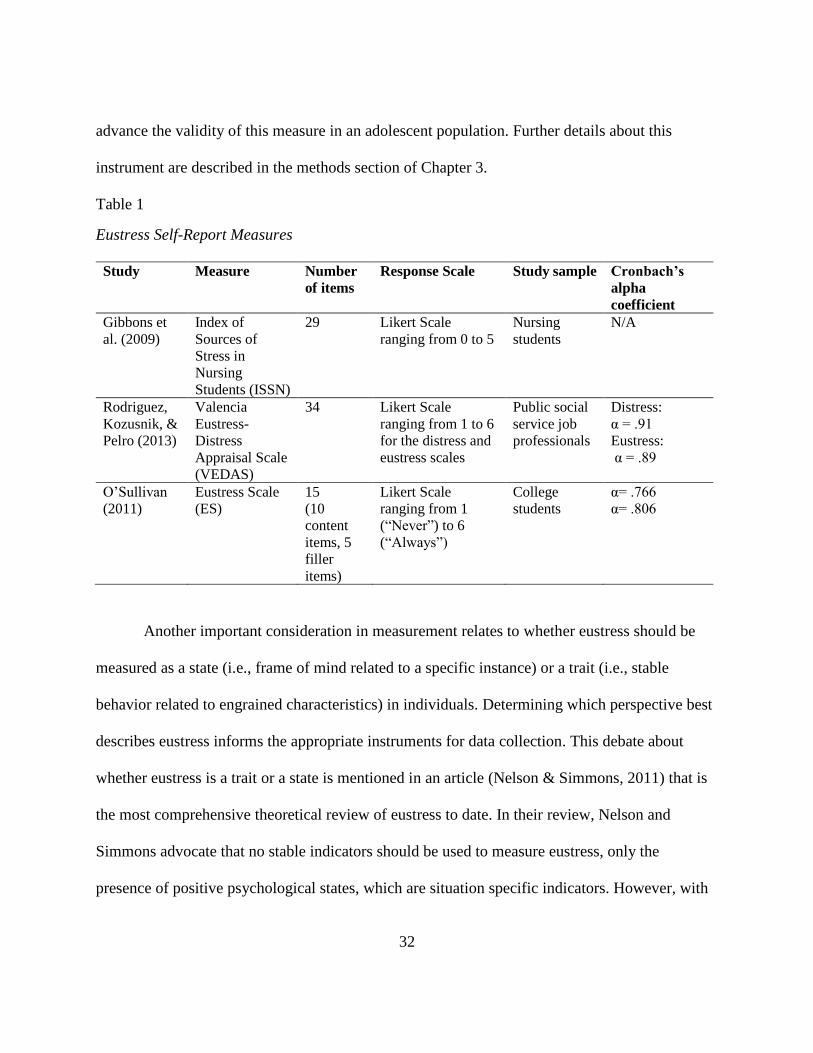
Table 1
Eustress Self-Report Measures
Study Measure Number
of items
Response Scale Study sample Cronbach’s
alpha
coefficient
Gibbons et
al. (2009)
Index of
Sources of
Stress in
Nursing
Students (ISSN)
29 Likert Scale
ranging from 0 to 5
Nursing
students
N/A
Rodriguez,
Kozusnik, &
Pelro (2013)
Valencia
Eustress-
Distress
Appraisal Scale
(VEDAS)
34 Likert Scale
ranging from 1 to 6
for the distress and
eustress scales
Public social
service job
professionals
Distress:
α = .91
Eustress:
α = .89
O’Sullivan
(2011)
Eustress Scale
(ES)
15
(10
content
items, 5
filler
items)
Likert Scale
ranging from 1
(“Never”) to 6
(“Always”)
College
students
α= .766
α= .806
Another important consideration in measurement relates to whether eustress should be
measured as a state (i.e., frame of mind related to a specific instance) or a trait (i.e., stable
behavior related to engrained characteristics) in individuals. Determining which perspective best
describes eustress informs the appropriate instruments for data collection. This debate about
whether eustress is a trait or a state is mentioned in an article (Nelson & Simmons, 2011) that is
the most comprehensive theoretical review of eustress to date. In their review, Nelson and
Simmons advocate that no stable indicators should be used to measure eustress, only the
presence of positive psychological states, which are situation specific indicators. However, with
33
the relationship of positive psychological states, e.g., hope, being an acceptable proxy of
eustress, there is precedent for these concepts to be measured as both a state and a trait.
Specifically, in the case of hope, Snyder, Lopez, Shorey, Rand, and Feldman (2003) assert that
hope can be measured as both a stable personality characteristic (trait), or as a temporary
situation specific frame of mind (state). To support this claim, Snyder et al. (2003) cited the work
of Curry et al. (1997), where data were combined from both a state measure of hope and a trait
measure of hope to analyze the holistic construct of hope related to other measures (Curry et al.,
1997). Such findings show that data can be effectively used from either conceptualization, and
that a concept like hope, or eustress, does not have to be viewed through a singular lens.
Regarding the transactional model of stress in which each stressor is evaluated based on the
demand imposed on the individual, and the individual’s skills to handle the situation, it would
seem that each situation could have a unique equation. However, in this cognitive appraisal, the
individual is evaluating his or her skill set to handle a specific problem. Likely this skill set has
some variability, but there may be many skills that are relatively stable and do not rapidly
change. For example, if a student is able to write a two-page journal for history, he or she would
also likely apply those same skills in writing a four-page book report in English. While the
situation is different, the academic skill set in basic writing, grammar, and organization is likely
relatively stable. This would tend to support the view of eustress as taking on the characteristics
of a trait. With a stable skill set, and likely a predictable way a person naturally interprets the
world, eustress may not be as situation dependent as it may have appeared at first glance.
However, in the overall conceptualization of eustress, data from both types of measurement are
valuable in the understanding of this construct.
34
This study subscribed to a direct measure of eustress, since using related constructs
requires more interpretation by the researcher and may not accurately capture what eustress
uniquely contributes to the relationship. A modified version of the Eustress Scale (ES;
O’Sullivan, 2011) was chosen because of its concise nature and its appropriateness of use with a
younger population (i.e., college students vs. adult workers). Eustress was measured as
representing a trait, rather than a situation specific state. The Eustress Scale used in this study
asked about high school students’ perceptions of feeling motivated by their academic stress
during this past school year. While this is a more time limited trait, it asks students to think about
their academic stressors as a whole, and then rate their interpretation of their stressor overall, and
not in specific situations. In the education setting, for measurement purposes, a detailed state
measure may not be feasible. Measuring eustress as a time-limited trait allows for more efficient
measurement and provides consistency with the previous use of this measure. Future research
should explore this differentiation, since this difference in conceptualization has not been
thoroughly explored.
Constructs Related to Eustress among Adolescents
Nearly all the studies of eustress have been conducted and examined in occupational
settings measuring work performance (Cavanaugh et al., 2000; Oksman et al., 2016; Simmons &
Nelson, 2001). These studies have found eustress is associated with better physical and
emotional health (Cavanaugh et al., 2000; Simmons & Nelson, 2001). Only a few studies have
examined eustress in the realm of education, namely among college students (Gibbons,
Dempster, & Moutray, 2008; O’Sullivan, 2011). While there is no current research of eustress in
adolescents, the populations studied by Gibbons and colleagues (2008) and O’Sullivan (2011)
35
are most representative of high school students in advanced coursework, because their studies
took place in an educational setting, with a population taking college-level classes associated
with high amounts of stress.
Closer to the target population of AP and IB high school students in the proposed study,
Gibbons et al. (2008) examined eustress qualitatively in nursing students. They conducted focus
groups with 16 nursing students who reported high academic stress levels which manifested in
longer hours of study, and therefore a lack of free time. Participants were female students in the
United Kingdom ranging in age from 18-42. The focus group yielded information that showed
that experiential learning and interacting with patients were associated with eustress, and that
social support, especially from peers, moderated the relationship between stressors and a positive
outlook. To handle academic demands, utilizing academic tutoring from an instructor who was
empathic and gave guidance were associated with eustress. These results have limited
generalizability due to the small and largely homogeneous sample.
O’Sullivan’s (2011) study of relationships between eustress, hope, self-efficacy, and life
satisfaction in college students is most closely related to the proposed study in terms of
population and measurement approach. The sample consisted of 118 students between the ages
of 18 and 25. Participants completed the Eustress Scale, as described in a prior section, in
addition to the six-item Hope Scale (Snyder, 2000), a modified 10-item self-efficacy scale
(Bandura, 2006), and a modified 10-item Satisfaction with Life Scale (Diener et al., 1985).
Results included positive correlations between eustress and hope (r= .30 p <.01), self-efficacy
(r= .21 p <.05), and life satisfaction (r= .33, p <.01), as well as between hope and self-efficacy
(r=.367, p<.01). The combination of eustress, hope, and self-efficacy explained 22.1% of the
36
variance of life satisfaction, which was greater than predicted by eustress alone (11%). In sum,
eustress emerged as a key predictor of students’ life satisfaction.
These aforementioned studies encompass relevant populations and measurement styles,
and shed light on related constructs. However, there are many things that are as of yet unknown.
There is a lack of an established definition of eustress and the populations this construct has been
studied in are relatively isolated to one or two settings. Also, there have been very few studies in
the realm of education, and no published studies conducted with a sample of adolescents. Since
stress is an experience that extends across the lifespan, and can culminate in perfect storm during
adolescence due to the changing and heighted demands and physical development, it is important
to extend the realm of research to this population so that the unique characteristics of eustress
can be understood and applied.
The Adolescent Development Context and Stressors
While stress affects many groups of people, the nature and frequency of stressors faced
by adolescents in particular create vulnerability. Youths face stressors in the realms of
academics, home life, and peer relationships, to name a few (Byrne, Davenport, & Mazanov,
2007). As social media becomes more prevalent, modern adolescents are exposed to even more
stressors, with females being more susceptible to stressors than their male counterparts (Byrne,
Davenport, & Mazanov, 2007; McNamara, 2000). Much research has been done to document the
deleterious effects of stress on academic success and emotional health (Hess & Copeland, 2001;
McKnight, Huebner, & Suldo, 2002). The construct of eustress is important to investigate in this
age group, in part because of the advantages that can potentially come from viewing a stressor in
a positive light. While the research on distress is quite expansive and prevalent, little attention
37
has been paid to its positive counterpart, eustress. Notably, no studies have looked at eustress in
an adolescent population. The types of stressors experienced by adolescents varies in part as a
function of their curricular experiences and academic emphasis. Because academic stressors (i.e.,
stress inherent to school, their primary developmental context) for adolescents can mirror work
stressors in adults, it is reasonable to expect that the correlates of eustress in occupational realms
might apply to the educational realm for high-achieving high school students. Given correlates
identified in prior research with adults, this study proposes to examine associations between
eustress and the constructs described next.
Constructs Potentially Associated with Eustress in Adolescents
Self-efficacy. The seminal researcher on self-efficacy defines it as follows: “perceived
self-efficacy is concerned with people’s beliefs in their capabilities to produce given
attainments” (Bandura, 2006, p. 307). Self-efficacy is an especially important factor to study
alongside eustress, because it likely contributes to the interpretational response of a stressor. The
balance between demand by the stressor and an individual’s resources to handle those demands
can become skewed depending on an individual’s belief in their ability to succeed in a particular
situation.
In a larger context, Mesurado et al. (2016) looked at the relationship between self-
efficacy, eustress, flow, and academic engagement in 347 college students residing in two
different countries: the Philippines (N= 176; Age: M=17.54, SD= 1.32) and Argentina (N= 171;
Age: M=20.07, SD= 1.05). The authors conceptualized that self-efficacy and eustress would each
individually contribute to the manifestation of flow and academic engagement, but they also
allowed the two variables to co-vary in the tested model. Both measures of self-efficacy and
38
eustress were drawn from O’ Sullivan’s (2011) work. O’Sullivan’s (2011) self-efficacy scale
requires participants to rate their confidence on a scale from zero to six in performing 10
academic tasks (e.g., “Organize my schoolwork”). The 15-item Eustress Scale (O’Sullivan,
2011) was used to quantify the construct of eustress. Results from the tested model in both
countries, The Philippines: 2 (6, 176) = 3.12, p=ns, CFI=.99, RMR= .01, RMSEA= .01 and
Argentina: 2 (6, 171) = 7.77, p=ns, CFI=.99, RMR= .02, RMSEA= .04, indicated that self-
efficacy had a direct relationship with both flow and academic engagement, while eustress only
had a direct relationship with flow. The two constructs, self-efficacy and eustress, had a small to
moderate correlation in each country (The Philippines: r= .34, p < .01; Argentina: r= .15, p <
.05) but no other analyses were performed with these two factors.
As described earlier, O’Sullivan (2011) found a positive correlation between eustress
and self-efficacy (r=.21, p<.05) among young adults. The author of this study located no
published studies that investigated the relationship among eustress and self-efficacy in younger
samples. Prior research has shown a positive relationship between self-efficacy and performance
(Risemberg & Zimmerman, 1992; Stajkovic & Luthans, 1998), so it is important to understand
the contribution of eustress on academic performance beyond the influence of self-efficacy.
Flow. Csikszentmihalyi et al. (2005) defined flow as “a subjective state that people report
when they are completely involved in something to the point of forgetting time, fatigue, and
everything else but the activity itself” (p.600). A relationship between flow and eustress has been
posited by Hargrove et al. (2013) and Mesurado et al. (2016). Flow happens when individuals are
appropriately challenged by a situation, and are at their peak performance. High school students
who experience flow in relation to academic demands might increase their enjoyment of tasks of
39
that nature. It is proposed that eustress leads to savoring, which in turn can lead to a flow state.
Flow might be thought of as the “ultimate eustress experience- the epitome of eustress”
(Hargrove et al., 2013, p. 67).
The study by Mesurado et al. (2016), described in the section above, used the Optimal
Experience Scale (Mesurado, 2008) to measure flow. This measure consists of 26 items which
assess two aspects of the flow experience: “cognitive and affective experiences [which
participants rated on a seven-point Likert scale] and …achievement and ability perceptions
[which participants rated on a five-point Likert scale],” (p. 9). The correlation between eustress
and flow was small but significant in the Argentinian population (r=.17, p<.05), and in the
Philippines population, the correlation fell in the moderate range (r=.39, p<.01). Results from the
tested model (described above) indicated that eustress had a direct effect on flow (standardized
coefficient for model with Philippines participants= .20, p<.01; standardized coefficient for
model with Argentinean participants= .18, p <.01), but a non-significant direct effect on
academic engagement. From these data, Mesurado and colleagues (2016) suggest that eustress
has a direct effect on flow, and an indirect effect on engagement through flow. Considering the
paucity of research relating eustress to predictors and/or facilitators of engagement, it is
important to further investigate these relationships in different cultures and populations. This
study provided another examination of relationships between these variables, in youth.
Student engagement. While flow is a fluctuating mental state that depends on the
balance between demand and skill, engagement has been considered a more stable and persistent
state of mind (Mesurado et al. 2016). Nelson and Simmons (2011) note that eustressed
individuals are engaged, meaning “they are enthusiastically involved in and pleasurably occupied
40
by the demands of the work at hand” (p.58). While engagement seems to be a related construct
to eustress that leads to positive outcomes, such as academic performance (Salanova, Schaufeli,
Martinez, & Breso, 2010), the relationship between eustress and engagement is understudied to
date. Many of the indicators of eustress put forth by Nelson and Simmons (2011), such as
positive affect, meaningfulness, manageability, hope, satisfaction, commitment and vigor, are
related to the different aspects of student engagement namely a combination of interest,
enjoyment, and concentration (Mesurado et al., 2016). The most widely accepted model of
engagement proposes that engagement is multidimensional, and that it consists of behavioral
engagement, emotional engagement, and cognitive engagement (Fredericks, Blumenfeld, &
Paris, 2004). As indicated in the section above, results from the study done by Mesurado and
colleagues (2016), supported the theory that eustress (measured by the Eustress Scale;
O’Sullivan, 2011) had an indirect effect on student engagement (measured by the Utrecht
Student Engagement Scale; Schaufeli, Martinez, et al., 2002) through flow (measured by the
Optimal Experience Scale; Mesurado, 2008). The Utrecht Student Engagement Scale used to
measure academic engagement consisted of three subscales, namely vigor, dedication, and
absorption, that are meant to capture the underlying constructs of engagement. While the article
does not refer to Fredericks and colleagues’ (2004) conceptualization of engagement, sample
items from the different constructs (e.g. I find my studies to be full of meaning and purpose,
When studying I feel strong and vigorous) indicate that this measure may tap into the cognitive
and affective aspects of engagement, but not the behavioral aspect. Even though a non-
significant direct relationship was found between eustress and these selected indicators of
academic engagement, eustress had a significant moderate correlation with these three measured
41
aspects of engagement in the Philippines sample (Vigor: r=.32, p<.01; Dedication: r=.33, p<.01;
Absorption: r=.33, p<.01), and a small correlation in the Argentinean sample (Vigor: r=.15,
p<.05; Dedication: r=.16, p<.05; Absorption: r=.15, p<.05). The literature is still unclear about
the directionality and pathways by which eustress and engagement interact. Further research is
needed to explore this relationship in adolescents, using indicators of affective, behavioral, and
cognitive engagement.
Coping. Nelson and Simmons (2011) contend that the stress response is complex, and
that positive and negative responses can be triggered by a stressor. In the Holistic Model of
Stress, when distress is experienced a coping strategy is employed by the individual. Resolving
the stressor positively, namely with effective coping strategies, may lead to different future
appraisal beliefs and positive emotions. McGowan and colleagues (2006) gathered self-report
data from 141 public sector employees, ages 18 to 55+, to assess the relationship between stress
(eustress vs. distress) and coping (task-focused vs. emotion-focused). The Job Related Affective
Wellbeing Scale (JAWS) assessed participants’ emotional response to a stressor, e.g. eustress or
distress in the last 30 days, and the Ways of Coping Questionnaire (WCQ; Folkman & Lazarus,
1988) assessed the coping strategies used to handle a previous stressful situation. In this study
the specific task-focused coping strategies were “planful problem solving, positive reappraisal,
seeking social support and self-controlling,” (p. 95), and specific emotion-focused coping
strategies were “confrontive coping, distancing, accepting responsibility, and escape avoidance,”
(p. 95). This study employed a similar classification style of coping styles into task-focused and
emotion-focused strategies as used by Suldo and colleagues (2015) in a study of AP/IB students.
Results from the study supported the hypotheses that task-focused strategies were associated
42
with eustress (r=.37, p<.01), while emotion-focused strategies were associated with distress
(r=.53, p<.01). Correlations between eustress and emotion-focused coping (r=-.03, p=ns), and
distress and task-focused coping (r=.09, p=ns), were close to zero and non-significant. Eustress
was also associated with a satisfactory outcome (measured by a participants agreement with the
statement, “I felt positive about the outcomes of the situation,” (p. 94); r=.25, p<.05), while
distress was negatively correlated with one’s satisfaction with an event’s outcome (r=-.34,
p<.05). Due to the positive student outcomes associated with coping strategies that directly
address the stressor (Suldo, Shaunessy-Dedrick, Ferron, & Dedrick, 2018), instruction in
task/problem-focused coping strategies to promote eustress may be a promising avenue to
explore in adolescents.
Grit. In the last decade or so, the field of psychology has recognized that when predicting
an individual’s ability to succeed in his or her job, or in achieving goals in general, a broader
range of factors beyond cognitive ability needs to be considered. Duckworth, Peterson,
Matthews, and Kelly (2007) posit that one of those essential factors is grit, which is defined as
“perseverance and passion for long-term goals” (p. 1087). Having the determination and
persistence to continuously pursue a course of action through time and circumstances is an
essential internal factor in achievement and success. Since advanced high school curricula and
higher education (e.g., college, graduate school) likely require persistence through rigorous
coursework, it is important to understand the influence grit has on students. Duckworth and
colleagues (2007) developed a self-report measure of grit (12-item Grit Scale), which was used
to investigate the relationship between grit and retention in 1,218 freshman cadets at West Point.
Results included that those cadets who scored higher on the grit measure (by 1 standard
43
deviation) were 60% more likely to be enrolled after the summer semester. In a later study of
West Point cadets (Kelly, Matthews, & Bartone, 2014), the researchers focused on measuring
both hardiness and grit in this population. Hardiness is defined as “a personality dimension
linked to continued health and performance,” (p. 330), which has three dimensions:
“commitment, challenge, and control” (Nelson & Simmons, 2011, p. 64). While these constructs
are measured separately, grit and hardiness share a common thread of an individual characteristic
that is essential is pushing one to persist through the difficult circumstances to ultimately achieve
their desired goals. In the study by Kelly and colleagues (2014), grit was shown to have a
moderate correlation with hardiness (r=.34, p > .01). While there have been no studies of grit
and eustress in the literature, Nelson and Simmons (2011) hypothesized that hardiness may be
related to eustress in the appraisal process of a stressor. Individuals with a high level of hardiness
may be more likely to view stressors as challenges, instead of obstacles, which is commiserate
with the eustress experience. However, this hypothesis exists only at the theoretical level. Using
a proxy of hardiness, namely grit, this study provided initial empirical evidence about the
relationship between this individual characteristic and eustress.
Adolescents in Accelerated Curricula
High schools are on the rise in offering students the chance to take college-level courses
early, such as through Advanced Placement (AP) classes or the International Baccalaureate (IB)
program. For example, recent estimates show that 1,777 schools are offering IB programs (IBO,
2018). Students are enrolling in these accelerated curricula in part due to the educational and
monetary benefits of taking college level classes in high school. These students are engaged in
coursework and service requirements that are above and beyond that of state graduation
44
requirements (Suldo, Shaunessy, & Hardesty, 2008). While students in these advanced classes
tend to succeed, they report overall higher stress levels than their general education peers (Suldo
& Shaunessy-Dedrick, 2013) primarily due to academic stressors (Suldo, Shaunessy, Thalji,
Michalowski, & Shaffer, 2009). Due to this fact, a small body of research exists examining the
academic functioning and socio-emotional well-being of this population of students. It is
important to study eustress in this population because these youths experience heightened levels
of stress but have positive outcomes, including academic superiority and levels of mental health
(psychopathology and life satisfaction) that are on par with age expectations. Modern definitions
have indicated the need for a dual factor model of mental health, which defines mental health not
just as the absence of psychopathology, but the presence of well-being (Suldo & Shaffer, 2008).
It is important to assess both positive indicators of well-being (life satisfaction) and negative
aspects of distress (psychopathology) for a complete picture of mental health in adolescents.
Typical sources of stress that AP/IB students face that are similar to other general high
school students include studying for tests, getting good grades, completing homework and
managing time; nevertheless, their elevated stress levels can be linked to their rigorous academic
demands (Suldo & Shaunessy-Dedrick, 2013b). Suldo and Shaunessy-Dedrick (2013b) gathered
self-report measures related to perceived stress levels (Perceived Stress Scale; Cohen, Kamarck,
& Mermelstein, 1983), psychopathology (Youth Self-Report; Achenbach & Rescorla, 2001),
anxiety (Multidimensional Anxiety Scale for Children; March, Parker, Sullivan, Stallings, &
Conners, 1997), and life satisfaction (Student Life Satisfaction Scale; Huebner, 1991) from 134
youth prior to their entry into high school, and then one semester into their chosen academic
program (general education or IB program). Results identified differences in student stress levels
45
once they began their chosen academic track. Specifically, students in the IB program had a
significantly steeper incline in their stress levels compared to their general education peers (IB
group slope=.54, General education group slope=.08, p=.03). Even though these students in
accelerated curricula experienced increased stress, they had similar socioemotional functioning
to their general education peers. Could the presence of eustress be a unique contributor to these
positive outcomes? Hargrove, Nelson and Cooper (2013) mention four specific kinds of stressors
that are associated with eustress: work load, work pace, job responsibility, and job complexity. If
the word “job” was replaced with “school” or “academics,” most of these stressors would apply
to AP and IB students. It is important to explore if eustress is related to similar positive outcomes
in adolescents as it is in adults.
Suldo, Dedrick, Shaunessy-Dedrick, Fefer, and Ferron (2015) explored how youth in
accelerated curricula cope with their elevated academic stress. Coping generally targets two
different aspects related to the stressor. Problem-focused strategies are used to directly manage
the stressor, while emotion-focused strategies are used to mitigate the unpleasant emotions and
thoughts associated with the stressor. Suldo and colleagues (2015) developed a measure that
identifies coping strategies used by AP/IB youth. While there are an infinite number of coping
behaviors, 16 factors emerged as meaningful on the Coping with Academic Demands Scale:
“Time and task management, Cognitive reappraisal, Seek academic support, Turn to family, Talk
with classmates and friends, Skip school, Social diversions, Athletic diversions, Creative
diversions, Technology diversions, Substance use, Reduce effort on school work, Attempt to
handle problems alone, Deterioration, Sleep, and Spirituality” (p. 368). AP/IB students
commonly coped with stress through the factors reflecting Cognitive Reappraisal and Attempt to
46
Handle Problems Alone, and rarely coped with stress by Substance Use. Related to positive
student outcomes (e.g., high GPA and life satisfaction), students who relied on
approach/problem-focused strategies, such as Time and Task Management, and Cognitive
Reappraisal, had the best outcomes. The empirical associations between frequency of use of
specific coping styles and eustress levels have yet to be examined thoroughly in youth, but is
warranted in part due to significant associations between coping and valued outcomes reflective
of student success.
Summary of the Literature
The concept of eustress has been around for many years but has recently received more
attention in the literature. There is not yet an agreed upon universal definition of eustress, and
some studies measure eustress directly through quantitative or qualitative means, whereas others
capture it through the presence of positive psychological states. Eustress is related to a variety of
positive psychological and physiological outcomes among adult samples. Most of this research
has been concentrated in the occupational and management setting. Outcomes associated with
eustress in youth are anticipated but not yet confirmed. While it is debated whether eustress
results from an optimal level or interpretation of stress, this study used the psychological model
of stress and took the approach that an individual’s interpretation of the stressor determines
whether they react positively or negatively to it. Many constructs such as self-efficacy, hope,
meaningfulness, flow, engagement and coping have been seen to correlate with eustress among
samples of adults. However, it is unclear how much eustress contributes to outcomes above and
beyond these other constructs. There has been no research of eustress in adolescents, even
though they experience unique sources and magnitudes of stress. Specifically, AP and IB
47
students report more stress than their general education peers but excel in their rigorous
academic program. This study investigated eustress in AP and IB students, and explored if its
relationship with positive outcomes (among adults) holds true in this population. Potential
predictors or eustress were also examined to help expand the literature base on characteristics of
individuals that correlate with eustress.
48
CHAPTER III: METHODS
This study involved secondary data analysis of an archival dataset. This dataset arose
from an Institute of Education Sciences (IES) grant (R305A100911) awarded to the University
of South Florida, via principal investigators Drs. Shannon Suldo and Elizabeth Shaunessy-
Dedrick (2010). The purpose of the grant was to examine malleable predictors of success for AP
and IB students. The study within the grant that yielded the dataset was a cross-sectional study,
and data were collected in March through May of 2012. This is the largest known dataset
consisting exclusively of AP and IB students, and the variables collected include a eustress
measure as well as other related factors (as reported in Suldo, Shaunessy-Dedrick, Ferron, &
Dedrick, 2018). Due to the size and relevance of this dataset, the current researcher performed a
secondary analysis of these data. This study employed a correlational design to investigate the
research questions. Permission was granted from the principal investigators to access this data
for secondary analysis.
Participants
The participants in the dataset consist of 2,379 students who were enrolled in AP classes
or in the IB program during 2012. Students were drawn from 20 total programs (10 AP and 10
IB) from five districts in a southeastern state. These five districts were diverse and included
urban and suburban settings. The sample was also diverse in regards to socioeconomic status,
with 27.7% of students eligible for free or reduced-price lunch, as well as in regards to gender
and race/ethnicity. The demographic features of the sample can be found in Table 2.
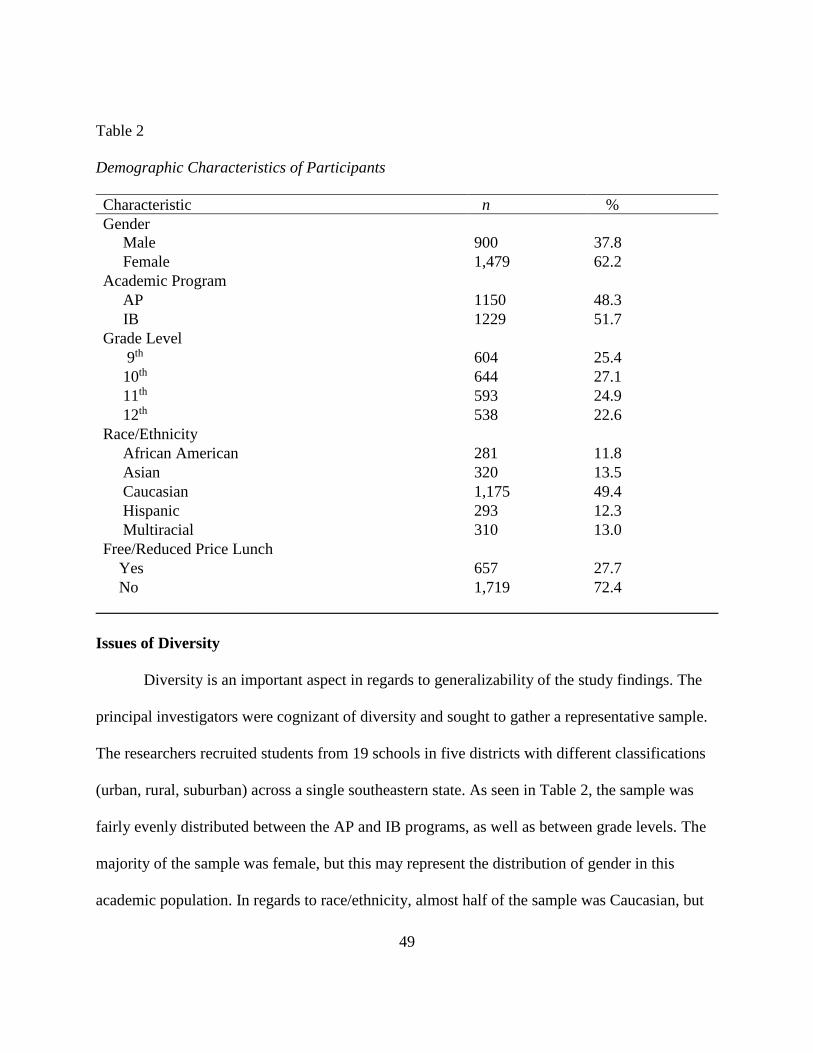
49
Table 2
Demographic Characteristics of Participants
Characteristic n %
Gender
Male 900 37.8
Female 1,479 62.2
Academic Program
AP 1150 48.3
IB 1229 51.7
Grade Level
9th 604 25.4
10th 644 27.1
11th 593 24.9
12th 538 22.6
Race/Ethnicity
African American 281 11.8
Asian 320 13.5
Caucasian 1,175 49.4
Hispanic 293 12.3
Multiracial 310 13.0
Free/Reduced Price Lunch
Yes 657 27.7
No 1,719 72.4
______________________________________________________________________________
Issues of Diversity
Diversity is an important aspect in regards to generalizability of the study findings. The
principal investigators were cognizant of diversity and sought to gather a representative sample.
The researchers recruited students from 19 schools in five districts with different classifications
(urban, rural, suburban) across a single southeastern state. As seen in Table 2, the sample was
fairly evenly distributed between the AP and IB programs, as well as between grade levels. The
majority of the sample was female, but this may represent the distribution of gender in this
academic population. In regards to race/ethnicity, almost half of the sample was Caucasian, but
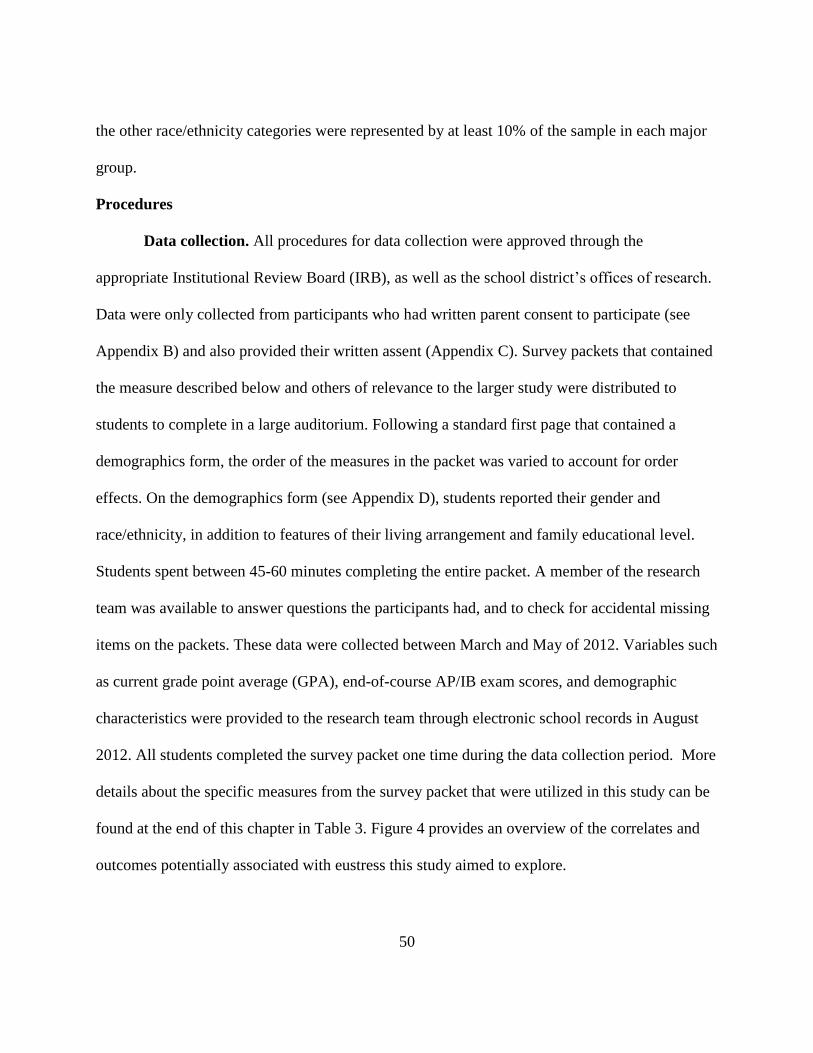
50
the other race/ethnicity categories were represented by at least 10% of the sample in each major
group.
Procedures
Data collection. All procedures for data collection were approved through the
appropriate Institutional Review Board (IRB), as well as the school district’s offices of research.
Data were only collected from participants who had written parent consent to participate (see
Appendix B) and also provided their written assent (Appendix C). Survey packets that contained
the measure described below and others of relevance to the larger study were distributed to
students to complete in a large auditorium. Following a standard first page that contained a
demographics form, the order of the measures in the packet was varied to account for order
effects. On the demographics form (see Appendix D), students reported their gender and
race/ethnicity, in addition to features of their living arrangement and family educational level.
Students spent between 45-60 minutes completing the entire packet. A member of the research
team was available to answer questions the participants had, and to check for accidental missing
items on the packets. These data were collected between March and May of 2012. Variables such
as current grade point average (GPA), end-of-course AP/IB exam scores, and demographic
characteristics were provided to the research team through electronic school records in August
2012. All students completed the survey packet one time during the data collection period. More
details about the specific measures from the survey packet that were utilized in this study can be
found at the end of this chapter in Table 3. Figure 4 provides an overview of the correlates and
outcomes potentially associated with eustress this study aimed to explore.
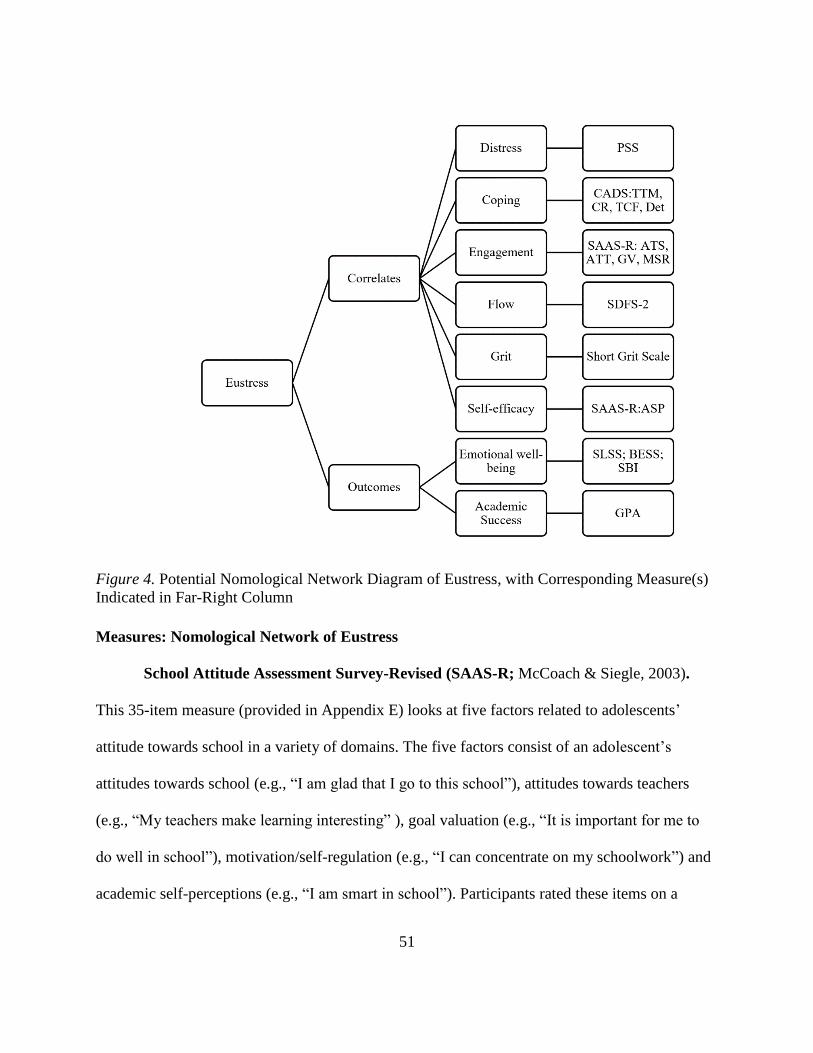
51
Figure 4. Potential Nomological Network Diagram of Eustress, with Corresponding Measure(s)
Indicated in Far-Right Column
Measures: Nomological Network of Eustress
School Attitude Assessment Survey-Revised (SAAS-R; McCoach & Siegle, 2003).
This 35-item measure (provided in Appendix E) looks at five factors related to adolescents’
attitude towards school in a variety of domains. The five factors consist of an adolescent’s
attitudes towards school (e.g., “I am glad that I go to this school”), attitudes towards teachers
(e.g., “My teachers make learning interesting” ), goal valuation (e.g., “It is important for me to
do well in school”), motivation/self-regulation (e.g., “I can concentrate on my schoolwork”) and
academic self-perceptions (e.g., “I am smart in school”). Participants rated these items on a
52
seven-point Likert scale ranging from “Strongly Disagree” to “Strongly Agree.” The distribution
of the number of items for each factor are as follows: five questions measure attitudes towards
school, seven questions measure attitudes towards teachers, six questions measure goal
valuation, 10 questions measure motivation/self-regulation, and eight questions measure
academic self-perceptions. McCoach and Siegle (2003) found a moderate correlation (r= .30 to
.65) between each of the five factors (attitudes towards school, attitudes towards teachers, goal
valuation, motivation, and academic self-perceptions), with the exception of the correlation
between the goal valuation and motivation factor (r=.74). Regarding internal consistency, each
factor had an α ≥ .85. Dedrick, Shaunessy-Dedrick, Suldo, and Ferron (2015) examined the
psychometrics of the SAAS-R in high school aged youth (grades 9-12) in accelerated
coursework (pre-IB and IB program). The authors found adequate reliability for each of the five
scales of this measure for use with this population (α ≥ .80). The academic self-perceptions
subscale was analyzed in this study to index participants’ levels of self-efficacy.
In examining the different aspects of engagement (affective, cognitive, and behavioral) in
relation to eustress, affective engagement and cognitive engagement appear most conceptually
aligned with eustress. These particular aspects of engagement may influence how an individual
interprets a stressor because high scores on these aspects of engagement signal positive feelings
about an individual’s environment and strong relationships/support with the people in an
individual’s environment. A student may perceive a stressor as more manageable if they are
generally satisfied with their school, and have positive relationships with teachers from whom
they can ask for help. In this study, the affective and cognitive aspects of engagement were
explored in relation to eustress. Reschly and Christenson (2012) purport that affective
53
engagement is indicated by “belonging/identification with school and school connectedness”
(p10), and cognitive engagement is indicated by “self-regulation, relevance of school to future
aspirations, and value of learning (goal setting)” (p.10). To this end, the attitudes towards school
and the attitudes towards teachers subscales was used to index affective engagement, and the
goal valuation and motivation/self-regulation subscales was used to index cognitive engagement.
Perceived Stress Scale (PSS; Cohen, Kamarck, & Mermelstein, 1983). This six-item
measure (provided in Appendix F) is an indicator of global perceived distress, assessing the
extent to which a situation is perceived as stressful. The original PSS (Cohen, Kamarck, &
Mermelstein, 1983) contained 14-items, which consisted of a mixture of positively-worded items
and negatively-worded items. Research investigating this version of the PSS found that
negatively-worded items (6 items) made up a distress factor, while the positively-worded items
loaded onto a perceived coping factor (Golden-Kreutz, Browne, Frierson, & Anderson, 2004).
Due to the fact that distress was the target construct, participants were only asked direct
questions related to perceived stress, e.g., In the last month, how often have you felt nervous and
“stressed?” and In the last month, how often have you felt difficulties were piling up so high that
you could not overcome them?, which they rated on a 5-point scale ranging from 1 (Never) to 5
(Very Often). Suldo, Shaunessy, and Hardesty (2008) obtained a Cronbach’s alpha of .91 for the
six-item PSS in a population of high-achieving students (enrolled in the IB program).
Eustress Scale (ES; O’Sullivan, 2011). This scale was designed to be a direct
measurement of eustress. The original Eustress Scale consisted of 15 items, five of which were
filler items. Higher scores on the 10 non-filler items indicated higher levels of eustress.
O’Sullivan gathered internal consistency and test-retest data on the measure by administering the
54
eustress measure to the total sample (N= 118), and then to a small subset of the sample (N= 30)
within two weeks of the original administration. The Cronbach’s alpha from the first and second
administrations were .77 and .81 respectively, and there were no significant differences found
between the first and second administrations (t=-.418, p=.679). Besides the reliability
coefficients presented by O’Sullivan (2011), there is no other literature that analyzed the
development, factor structure, or validation of this scale.
The Eustress Scale administered to the sample of students in the archival dataset that was
analyzed in the current study (see Appendix G) was a modified version of the O’Sullivan (2011)
measure. Before the modified eustress measure was included in data collection in 2012, several
steps were taken by the research team in consultation with the initial developer of the measure to
ensure its usability with adolescents. First, the developer of the measure (O’Sullivan, 2011) gave
permission via electronic commination for the eustress measure to be modified for a different
target demographic (S. Suldo, personal communication, February 1, 2012). The original eustress
measure was used with an older population (college-aged students between the ages of 18-24).
Before data collection in 2012, Suldo and colleagues removed the filler questions and then pilot
tested the original versions of the remaining 10 items with a convenience sample of 19 high
school students (14 in 9th grade, 5 in 12th grade) drawn from AP classes, to determine the
acceptability and readability of the 10 content items with a younger population. After filling out
the measure, the high school students were interviewed in small groups, and asked about what
words or items were unclear or difficult to understand (S. Suldo, personal communication, April
12, 2018). Students had challenges with five of the ten items, for instance not knowing what was
meant by “irritating academic hassle” or to “fail” at an academic task. From this pilot work, the
55
research team decided to only retain the five items that were most easily understood by
adolescents, e.g. “In general, how often do you feel motivated by your stress?” This reduction of
items falls in line with the current interest in the measurement field to have shorter self-report
scales for youth. To ensure readability, the shortened five-item measure was administered to
another sample of 38 sophomores in an IB program. No concerns were expressed by participants
in that sample. In sum, as reported by Suldo and colleagues (2018), a total of 57 AP and IB
students in grades 9, 10 and 12 took part in pilot work on the Eustress Scale before the resulting
5-item version was administered during data collection for the primary study. That pilot sample
of students was not a part of the primary study sample that was examined in the current study.
Coping with Academic Demands Scale (CADS; Suldo, Dedrick, Shaunessy-Dedrick,
Fefer, & Ferron, 2015). The CADS (see Appendix H) was designed to assess the ways that AP
and IB students in particular cope with academic stressors/demands. The CADS consists of 58-
items that measure 16 different coping styles. Participants respond to each item on a five-point
scale, indicating if they engage in this coping behavior “1=Never” to “5=Almost Always,” with
each factor of coping consisting of a range from three and six individual items. The 16 coping
styles, sample items from each CADS factor, and internal consistency reliability for each factor
are as follows: Time and Task Management (e.g., Prioritize the order in which you complete
work, α= .77), Cognitive Reappraisal (e.g., Adopt an optimistic or positive attitude, α= .74), Seek
Academic Support (e.g., Get extra help for class from tutors, α= .55), Turn to Family (e.g.,
Spend time with family, α= .79), Talk with Classmates and Friends (e.g., Talk to classmates
(friends in your school program) about what’s bothering you, α= .75), Spirituality (e.g., Rely on
your faith to help deal with the problem, α= .90), Social Diversions (e.g., Have fun with other
56
people to get your mind off the problem, α= .68), Athletic Diversions (e.g., Play team sports
(basketball, soccer, football, etc., α= .73), Creative Diversions (e.g., Write creatively (poetry,
lyrics, etc.), α= .62), Technology Diversions (e.g., Surf the internet (YouTube, news websites,
etc.), α= .53), Substance Use (e.g., Smoke cigarettes or use other tobacco products, α= .71),
Reduce Effort on Schoolwork (e.g., Stop caring about schoolwork ,α= .79), Attempt to Handle
Problems Alone (e.g., Keep problems to yourself ,α= .61), Deterioration (e.g., Panic or “freak
out” about the problem without trying to fix it, α= .79), Sleep (e.g., Take naps, α= .75), and Skip
School (e.g., Take a day off from school to get work done, α= .86). Psychometric properties,
including internal consistency (for 11 of 16 factors α ≥ .70) and test-retest reliability (coefficients
ranged from .71 to .93), were acceptable for the majority of the 16 factors. Those factors that had
an internal consistency coefficient below .70 were made up of the least number of items (e.g.,
only three items). In the current study, two most representative types of task-focused coping
strategies (Time and Task Management, Cognitive Reappraisal), and two most representative
types of emotion-focused coping strategies (Talk with Classmates and Friends, Deterioration)
were examined in data analysis.
Short Dispositional Flow Scale-2 (SDFS-2; Jackson, Martin, & Eklund, 2008). This
scale is used to measure the concept of dispositional (general approximation of a holistic
experience) flow. The short dispositional flow scale is a nine-item measure that captures each of
the nine dimensions of flow. Respondents rate each item on a five-point scale, with responses
ranging from “Never” to “Always.” Analysis on the psychometric properties of the SDFS-2
(Jackson, Martin, & Eklund, 2008) revealed acceptable model fit, CFA: 2 (27, N= 692) = 66.89,
p=not reported, CFI=.99, RMSEA= .05, SRMR= .03, and acceptable Cronbach’s alpha at two
57
different administrations, .81 and .74. While Jackson and colleagues’ (2008) research was done
with young adults (M=26 years old, SD=10.55), Martin, Tipler, Marsh, Richards, and Williams
(2006) explored the use of this measure with high school students. These authors found an
acceptable reliability coefficient (α= .82), lending support for the use of this measure with the
current sample of AP and IB youth. The SDFS-2 is not included in the Appendix due to
copyright restrictions.
Short Grit Scale (Duckworth & Quinn, 2009). This measure (see Appendix I) is used to
quantify grit, which is conceptualized as an individual’s persistence and dedication towards long-
terms goals. This eight-item measure retains the two-factor structure (consistency of interest and
perseverance of effort) of the original longer (12-item) grit measure. Respondents answered
items such as, “I often set a goal but later chose to pursue a different one,” and “I am a hard
worker,” on a 5-point scale ranging from “Very much like me,” to “Not like me at all.” In four
different samples of participants ranging from high-school aged students to college-aged students
the internal consistency for the short grit scale was above .70 for all groups (ranged from .73 to
.83).
Measures: Outcomes
Student’s Life Satisfaction Scale (SLSS; Huebner, 1991). This 7-item questionnaire
(see Appendix J) assesses global life satisfaction with a mixture of direct and reverse-scored
items (e.g., “My life is just right,” and “I wish I had a different kind of life”) in children ages 8 –
18. Participants mark which agreement response on the six-point Likert scale, ranging from
“Strongly disagree” to “Strongly agree” best describes them. Higher scores on this measure
indicate higher life satisfaction. Through initial psychometric validation of this scale (Huebner,
58
1991), and additional research of its application in high school youth (Gilman & Huebner, 1997;
Suldo & Huebner, 2006), this scale has demonstrated good internal consistency with estimates
ranging from α = .82 to .86.
Behavioral and Emotional Screening System (BESS; Kamphaus & Reynolds, 2007).
This measure was used to assess psychopathology, specifically symptoms of internalizing
problems, inattention/hyperactivity, social problems, and school problems. There are three
different versions of the BESS, a student, teacher, and parent report. Due to the age of the
population (adolescents) and consistency with other rating scales, the student self-report measure
was administered in the primary study. For the student report measure, participants rate 30 items
on a 1 (Never) to a 4 (Almost Always) scale. Their responses are combined into a total score that
assess their total level of emotional and behavioral distress; resulting T-scores can be categorized
as normal, elevated, or extremely elevated. The BESS is regarded as a universal screening
instrument that was derived from the items on the larger Behavior Assessment System for
Children (BASC). Kamphaus and Reynolds (2007) reported a test-retest reliability coefficient for
the student BESS of .80. Renshaw, Eklund, Dowdy, Jimerson, Hart, Earhart, and Jones (2009)
supported the validity of the BESS through significant correlations with students identified at
academic/emotional risk based on other indicators, e.g., report card. While most of the studies of
this measure have been done with elementary age students, the measure is designed to be a
screening instrument for students from elementary to high school aged. The BESS is not
included in the Appendix due to copyright restrictions.
School Burnout Inventory (SBI; Salmela-Aro, Kiuru, Leskinen, & Nurmi, 2009). This
10-item measure (see Appendix K) was used to assess school burnout in the larger study.
59
Respondents rated each item, e.g., I feel overwhelmed by my schoolwork, I feel that I am losing
interest in my schoolwork, on a six-point Likert scale, with response options ranging from 1
(Completely disagree) to 6 (Strongly agree). In a sample of 1,418 high school and vocational
school students (Mean age= 16.47, SD=1.73), the SBI was found to have three dimensions: (1)
exhaustion at school, (2) critical toward the meaning of school, and (3) a sense of failure at
school. Confirmatory factor analysis supported the conceptualization and measurement of a three
factor model χ² (24, N =1344) = 108.91, p < .001, RMSEA = .05, CFI = .98, SRMR = .03). For
the three-factor model that fit the data best, the authors also found adequate factor score
reliability coefficients for each factor: exhaustion (α=.84), cynicism (α=.89), and inadequacy
(α=.91). Concurrent validity was also assessed, and school burnout significantly correlated with
depression (correlations ranging from .50 to .59, p<.001, for the three factors), and lower levels
of academic achievement (correlations ranging from -.11 to .13, p<.01, for the three factors), and
school engagement (correlations ranging from -.36 to .57, p<.001, for the three factors).
Academic outcomes
Grade Point Average (GPA). Researchers from the primary study quantified students’
academic achievement through their unweighted GPA earned during the semester of collection
of student self-report data (Spring 2012). School administrators provided the researchers with
electronic records for each student consisting of the title of the courses taken that semester and
the letter grade the student received in that class. The research team used these data to calculate a
student’s unweighted GPA for the spring semester. For the calculation of the unweighted GPA,
the standard point system used by the public schools that these data were collected from was
utilized (A= 4 points, B= 3 points, C= 2 points, D= 1 point, F= 0 points). Additional weightings
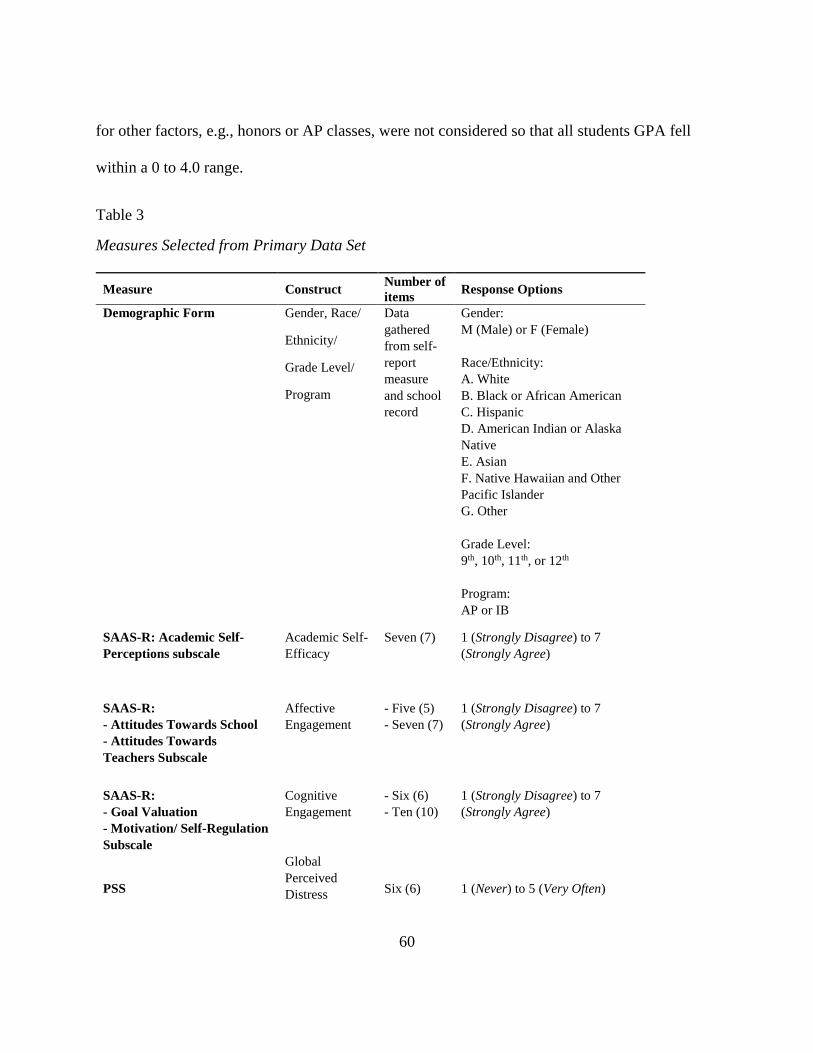
60
for other factors, e.g., honors or AP classes, were not considered so that all students GPA fell
within a 0 to 4.0 range.
Table 3
Measures Selected from Primary Data Set
Measure Construct Number of
items Response Options
Demographic Form Gender, Race/
Ethnicity/
Grade Level/
Program
Data
gathered
from self-
report
measure
and school
record
Gender:
M (Male) or F (Female)
Race/Ethnicity:
A. White
B. Black or African American
C. Hispanic
D. American Indian or Alaska
Native
E. Asian
F. Native Hawaiian and Other
Pacific Islander
G. Other
Grade Level:
9th, 10th, 11th, or 12th
Program:
AP or IB
SAAS-R: Academic Self-
Perceptions subscale
Academic Self-
Efficacy
Seven (7) 1 (Strongly Disagree) to 7
(Strongly Agree)
SAAS-R:
- Attitudes Towards School
- Attitudes Towards
Teachers Subscale
Affective
Engagement
- Five (5)
- Seven (7)
1 (Strongly Disagree) to 7
(Strongly Agree)
SAAS-R:
- Goal Valuation
- Motivation/ Self-Regulation
Subscale
Cognitive
Engagement
- Six (6)
- Ten (10)
1 (Strongly Disagree) to 7
(Strongly Agree)
PSS
Global
Perceived
Distress
Six (6)
1 (Never) to 5 (Very Often)
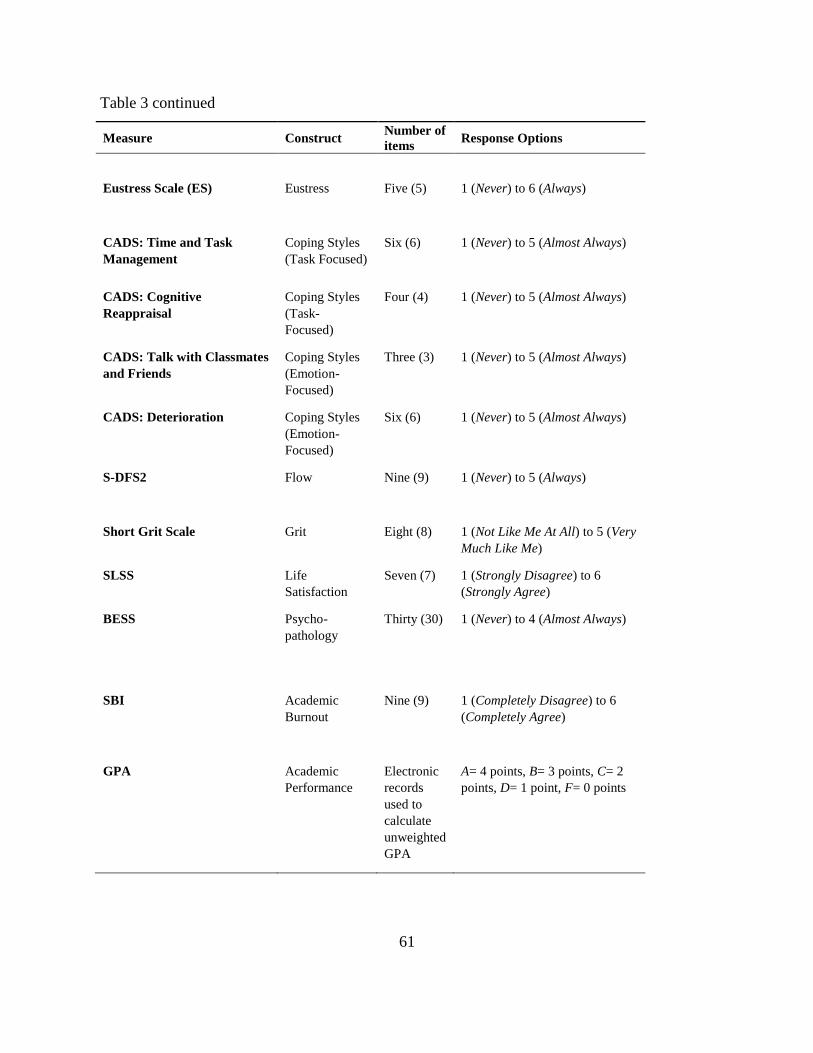
61
Measure Construct Number of
items Response Options
Eustress Scale (ES) Eustress Five (5) 1 (Never) to 6 (Always)
CADS: Time and Task
Management
Coping Styles
(Task Focused)
Six (6) 1 (Never) to 5 (Almost Always)
CADS: Cognitive
Reappraisal
Coping Styles
(Task-
Focused)
Four (4) 1 (Never) to 5 (Almost Always)
CADS: Talk with Classmates
and Friends
Coping Styles
(Emotion-
Focused)
Three (3) 1 (Never) to 5 (Almost Always)
CADS: Deterioration Coping Styles
(Emotion-
Focused)
Six (6) 1 (Never) to 5 (Almost Always)
S-DFS2 Flow Nine (9) 1 (Never) to 5 (Always)
Short Grit Scale
Grit
Eight (8)
1 (Not Like Me At All) to 5 (Very
Much Like Me)
SLSS Life
Satisfaction
Seven (7) 1 (Strongly Disagree) to 6
(Strongly Agree)
BESS Psycho-
pathology
Thirty (30) 1 (Never) to 4 (Almost Always)
SBI
Academic
Burnout
Nine (9)
1 (Completely Disagree) to 6
(Completely Agree)
GPA Academic
Performance
Electronic
records
used to
calculate
unweighted
GPA
A= 4 points, B= 3 points, C= 2
points, D= 1 point, F= 0 points
Table 3 continued
62
Ethical Concerns
Data used in this study were collected in accordance with approved IRB produces
regarding ethical considerations. All students obtained written parent permission and provided
written assent for their data to be collected. The archival database contains de-identified data,
and this study did not use any personal identifying information. Since this is secondary analysis,
this study had no contact with the original participants. The main purpose of this study was
aligned with investigating stress, namely eustress, and this aim fit within the original study aims
to explore stress and coping in AP and IB students. Therefore, using the data for a secondary
analysis is within the scope of to what the participants originally consented.
Data Analysis
Permission was obtained from the principal investigators for secondary analysis to be
conducted. The measures specific to this study, described in Table 3, were extracted from this
larger data set and put into a secondary data file. This secondary data file was used to conduct all
analyses. The unit of analysis for this study was the individual student level. Due to the fact the
students were nested within programs, analyses took into account the nesting of data using the
Type=Complex within Mplus. In consultation with the committee, the specific analyses that were
run were decided a priori. Visual analysis and descriptive statistics were utilized first to assess
any inconsistencies in the data prior to analysis.
Research Question 1:
What are the psychometric properties of the Eustress Scale in students in accelerated curricula,
with regard to the factor structure and internal consistency reliability?
63
Composite reliability was used to determine the reliability of the five-item measure in the
sample. This measure was only administered at one-time point, so test-retest analysis cannot be
performed. Since no studies have performed factor analysis on this measure, a confirmatory
factor analysis (CFA) was conducted to determine if all five items load onto a single factor. For
this research question, the statistical software Mplus, using the complex option, was utilized to
take into account the nested data. The CFA was performed in the total sample of AP/IB students,
as well as in different subpopulations, namely gender, grade, and program. Since this research
question conceptualizes eustress as a latent variable with five measured individual variables, in
accordance with sound methodical practice, latent variables and measured variables were kept
consistent throughout each research question. Distinguishing between measured variables, e.g.,
items on a self-report scale, and latent variables, e.g., the larger factor they aim to index or
represent, accounts for the measurement error that exists within data collection. This factor
analytic view of eustress was used throughout the analyses of this study, as well as with all other
factors of interest, e.g., self-efficacy, grit.
Research Question 2: To what extent, if any, does eustress differ in students in accelerated
curricula by gender, by grade level (9th-12th), and by program (AP or IB)?
In research question one, the factor structure of the eustress measure in these different
populations was assessed using CFA in Mplus Version 8. A variety of model fit indices were
presented for each group. For analysis regarding the differences in eustress among the variables
of interest, i.e., gender, grade level, and program, a multiple regression with latent variables was
run using Mplus Version 8. A single model with all the variables was run so that all for each
factor, e.g., grade, the other factors were controlled, e.g., gender, program. The significance
64
levels associated with the regression coefficient signal whether there are significant differences
between groups.
Research Question 3: What is the nomological network of eustress in students in accelerated
curricula and its concurrent associations with distress, student engagement, coping strategies,
self-efficacy, flow, and grit?
First, descriptive statistics for each construct were assessed and analyzed before further
analyses were performed. Second, model fit indices for each construct with eustress were
calculated. To examine the bivariate associations between all variables of interest, particularly
eustress in relation to the other constructs, correlations were computed. Correlation of constructs
using a latent variable framework was performed using Mplus Version 8 using the complex
option to take into account the nested data structure.
Research Question 4: To what extent, if any, is eustress in students in accelerated curricula
related to academic performance and/or emotional well-being?
Similar to question three, descriptive statistics for each construct were assessed for
normality before further analyses were performed. Academic success was represented by a
student’s unweighted GPA. Emotional success was represented by three indicators, namely life
satisfaction, academic burnout and psychopathology. To be consistent with demographic
variables of interest, program, gender, and grade were incorporated as predictor variables in each
model. Individual models, with eustress, program, gender, and grade as the predictor variables
and each indicator of academic performance (GPA) and emotional success (life satisfaction,
burnout psychopathology) as the continuous dependent variable were analyzed. A multiple
regression with latent variables was run using Mplus Version 8. After the original model was run
65
with all the predictors, another model was run with only the demographic predictor variables to
explore the amount of variance explained by the demographic variables compared to the variance
explained when eustress is an additional predictor. Each academic and emotional indicator was
analyzed separately so that important differences were not masked by combining variables.
66
CHAPTER IV: RESULTS
This chapter presents the results of statistical analyses used to answer the study’s four
research questions. First, data screening, such as data entry and missing data is discussed, then,
the analyses and results for the four research questions are presented sequentially.
Data Screening
Data entry. Data from the research study were entered and verified using a systematic
process. First, once survey packets were completed by students, graduate research assistants used
a software program, Remark, to scan in survey packets. The Remark software automatically
alerts the user to abnormalities in every survey packet, e.g. missing items, two responses marked
for one question. After this stage of scanning and screening, the data were input into SPSS,
where it went through another process of data screening lead by the statistical consultant, a Ph.D.
level measurement professor, working on the grant. To ensure accuracy of the data, 10% of the
packets were verified by a different research assistant from original entry. If errors were detected
in data entry, research assistants corrected the errors in both the database and the surveys, and the
packets before and after the corrected survey were also checked for accuracy. This process was
repeated until there were no errors discovered in the checked packets. Overall, the researchers
took care to systematically enter and screen the data for accuracy.
Missing data. There were low rates of missing data on the student self-report measures.
During data collection, research assistants checked each students packet for any missing items
and offered them a chance to respond to any items that were not skipped intentionally. Data that
67
were collected from school records ranged in their amount of missing data, due to researchers
limited access to these systems.
Psychometric Properties of the Eustress Scale
To answer research question one, which aimed to explore the psychometric properties of
the modified Eustress Scale in AP/IB students, descriptive statistics, factor structure, and
reliability of this measure were investigated. Descriptive statistics were analyzed before a factor
analysis was performed. Since this study was analyzing the eustress measure in a new
population, the factor structure of the five-item eustress measure was assessed with the total
sample, as well as with different subgroups namely gender, grade, and program. Last, the
reliability of the Eustress Scale was calculated using composite reliability.
Descriptive statistics. Descriptive statistics, including the number of responses for each
item (N), mean (M), standard deviation (SD), skewness, kurtosis, and the distribution of
responses for each of the five items on the eustress measure are presented in Table 4.
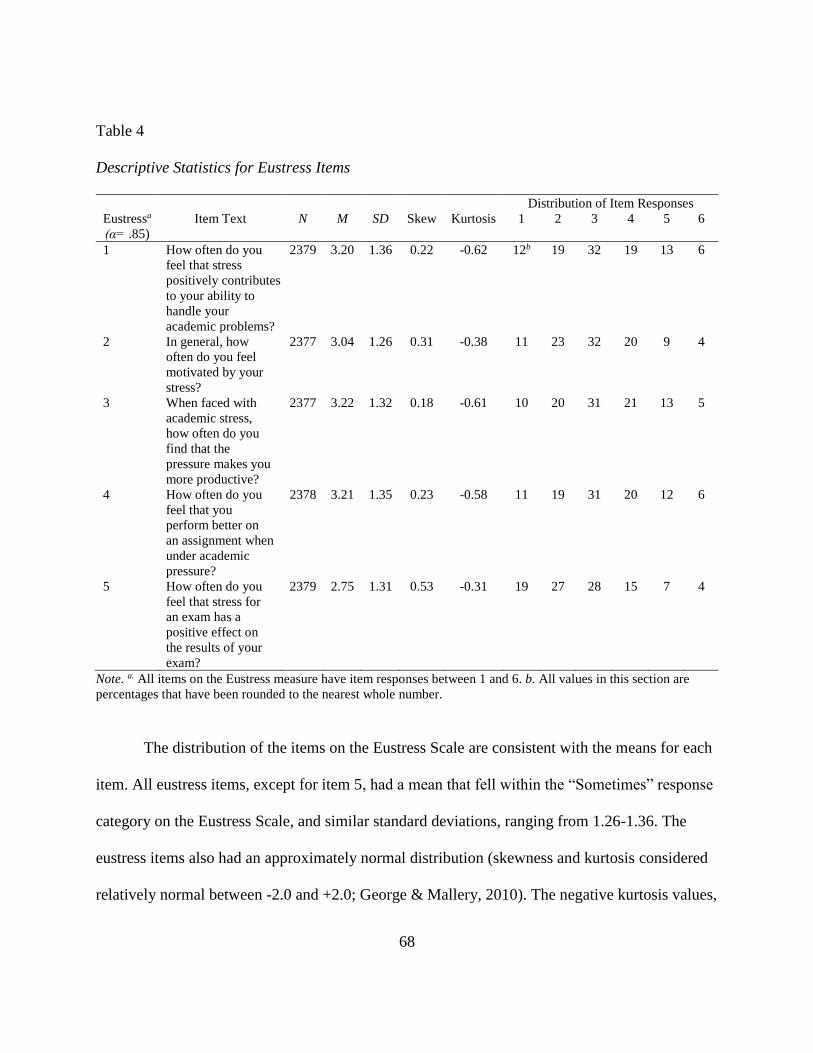
68
Table 4
Descriptive Statistics for Eustress Items
Distribution of Item Responses
Eustressa
(α= .85)
Item Text N M SD Skew Kurtosis 1 2 3 4 5 6
1 How often do you
feel that stress
positively contributes
to your ability to
handle your
academic problems?
2379 3.20 1.36 0.22 -0.62 12b 19 32 19 13 6
2 In general, how
often do you feel
motivated by your
stress?
2377 3.04 1.26 0.31 -0.38 11 23 32 20 9 4
3 When faced with
academic stress,
how often do you
find that the
pressure makes you
more productive?
2377 3.22 1.32 0.18 -0.61 10 20 31 21 13 5
4 How often do you
feel that you
perform better on
an assignment when
under academic
pressure?
2378 3.21 1.35 0.23 -0.58 11 19 31 20 12 6
5 How often do you
feel that stress for
an exam has a
positive effect on
the results of your
exam?
2379 2.75 1.31 0.53 -0.31 19 27 28 15 7 4
Note. a. All items on the Eustress measure have item responses between 1 and 6. b. All values in this section are
percentages that have been rounded to the nearest whole number.
The distribution of the items on the Eustress Scale are consistent with the means for each
item. All eustress items, except for item 5, had a mean that fell within the “Sometimes” response
category on the Eustress Scale, and similar standard deviations, ranging from 1.26-1.36. The
eustress items also had an approximately normal distribution (skewness and kurtosis considered
relatively normal between -2.0 and +2.0; George & Mallery, 2010). The negative kurtosis values,
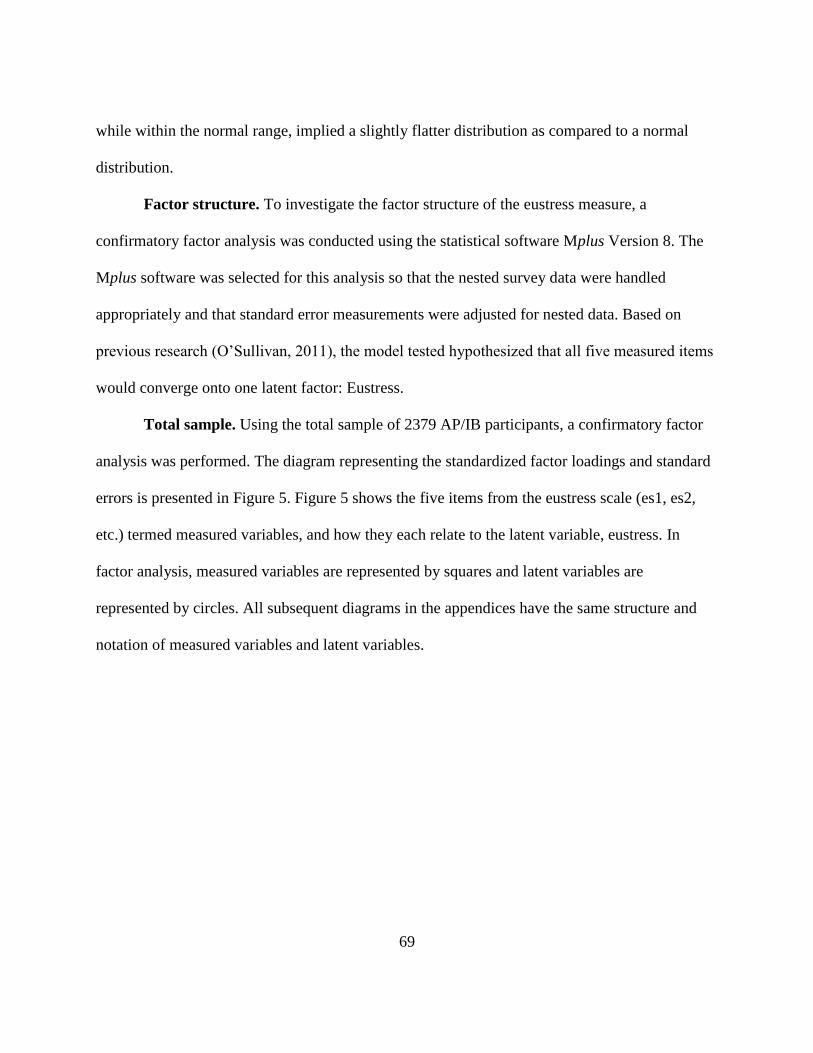
69
while within the normal range, implied a slightly flatter distribution as compared to a normal
distribution.
Factor structure. To investigate the factor structure of the eustress measure, a
confirmatory factor analysis was conducted using the statistical software Mplus Version 8. The
Mplus software was selected for this analysis so that the nested survey data were handled
appropriately and that standard error measurements were adjusted for nested data. Based on
previous research (O’Sullivan, 2011), the model tested hypothesized that all five measured items
would converge onto one latent factor: Eustress.
Total sample. Using the total sample of 2379 AP/IB participants, a confirmatory factor
analysis was performed. The diagram representing the standardized factor loadings and standard
errors is presented in Figure 5. Figure 5 shows the five items from the eustress scale (es1, es2,
etc.) termed measured variables, and how they each relate to the latent variable, eustress. In
factor analysis, measured variables are represented by squares and latent variables are
represented by circles. All subsequent diagrams in the appendices have the same structure and
notation of measured variables and latent variables.
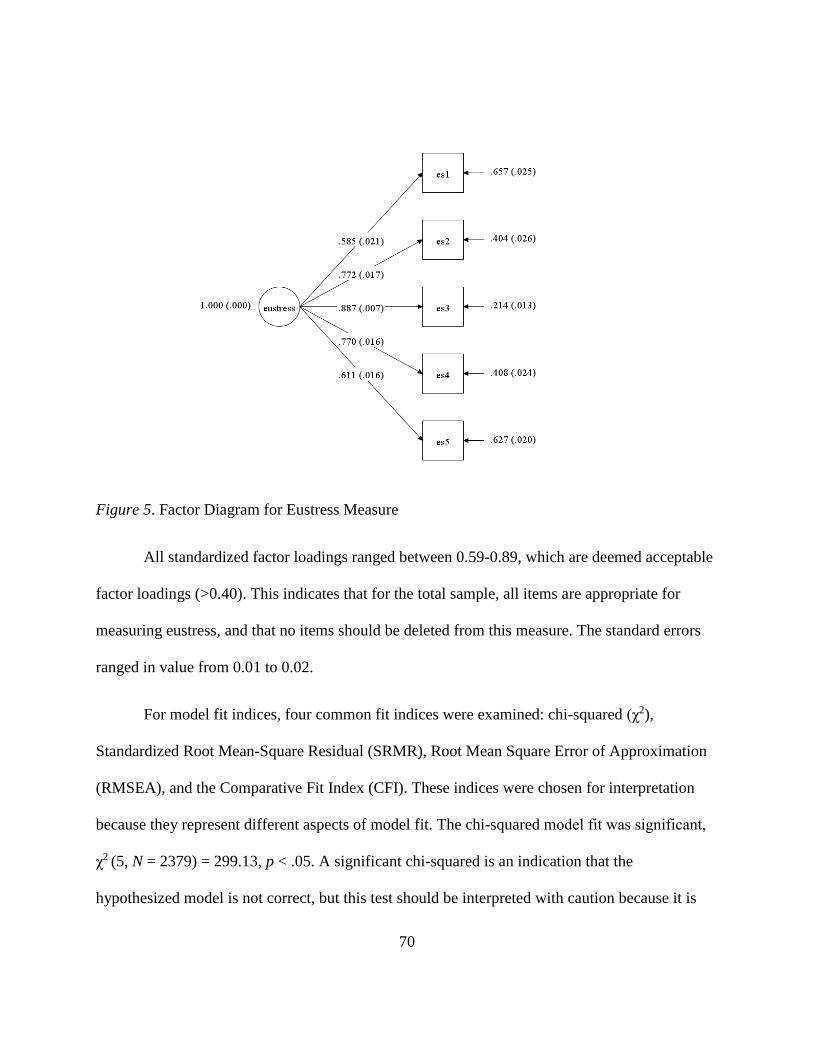
70
Figure 5. Factor Diagram for Eustress Measure
All standardized factor loadings ranged between 0.59-0.89, which are deemed acceptable
factor loadings (>0.40). This indicates that for the total sample, all items are appropriate for
measuring eustress, and that no items should be deleted from this measure. The standard errors
ranged in value from 0.01 to 0.02.
For model fit indices, four common fit indices were examined: chi-squared (ꭓ2),
Standardized Root Mean-Square Residual (SRMR), Root Mean Square Error of Approximation
(RMSEA), and the Comparative Fit Index (CFI). These indices were chosen for interpretation
because they represent different aspects of model fit. The chi-squared model fit was significant,
ꭓ2 (5, N = 2379) = 299.13, p < .05. A significant chi-squared is an indication that the
hypothesized model is not correct, but this test should be interpreted with caution because it is
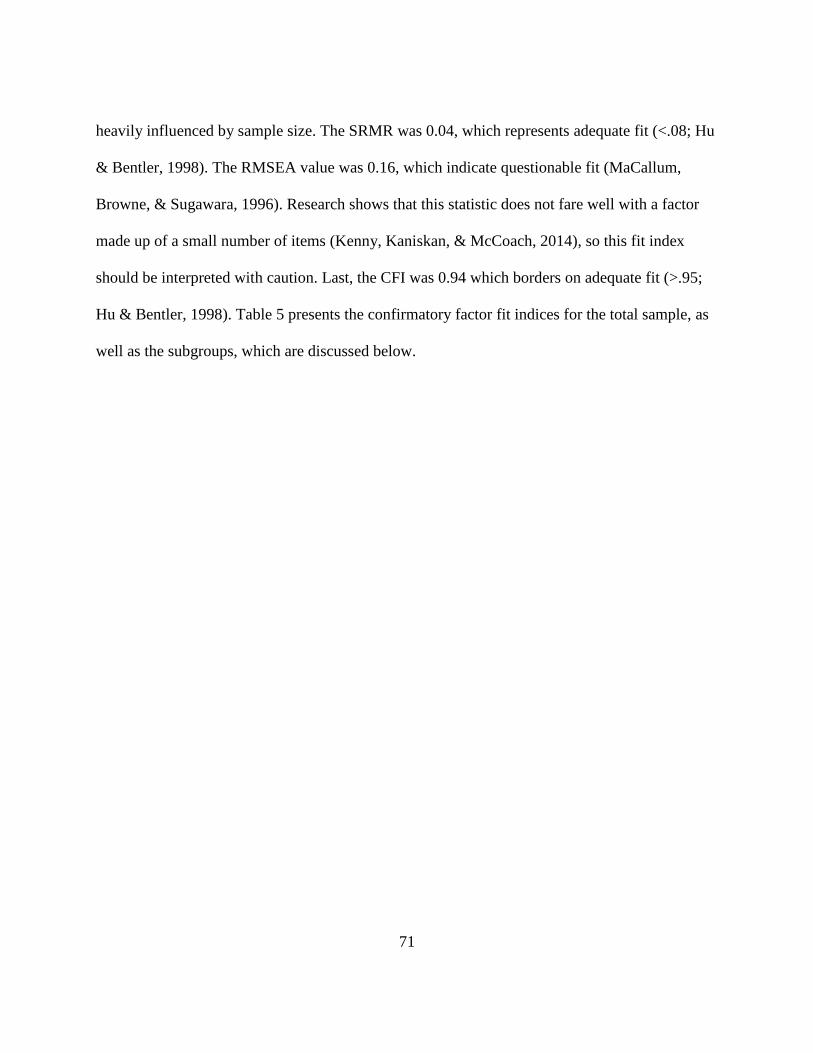
71
heavily influenced by sample size. The SRMR was 0.04, which represents adequate fit (<.08; Hu
& Bentler, 1998). The RMSEA value was 0.16, which indicate questionable fit (MaCallum,
Browne, & Sugawara, 1996). Research shows that this statistic does not fare well with a factor
made up of a small number of items (Kenny, Kaniskan, & McCoach, 2014), so this fit index
should be interpreted with caution. Last, the CFI was 0.94 which borders on adequate fit (>.95;
Hu & Bentler, 1998). Table 5 presents the confirmatory factor fit indices for the total sample, as
well as the subgroups, which are discussed below.
72
Table 5
Model Fit Indices for Eustress Measure
Sample N ꭓ2 SRMRa RMSEAb CFIc
Total 2379 299.13* .04 .16 .94
Gender
Male 900 127.93* .04 .17 .93
Female 1479 207.57* .05 .17 .90
Grade
9 604 82.23* .05 .16 .94
10 644 136.82* .05 .20 .84
11 593 59.92* .04 .14 .95
12 538 57.53* .05 .14 .93
Program
AP 1150 274.46* .05 .22 .87
IB 1229 116.32* .04 .14 .97
Note. All chi-squared (ꭓ2) tests had 5 degrees of freedom. *p < .001, two-tailed. a For the SRMR, smaller values
indicate better fit, with value less than .08 representing adequate fit. b For the RMSEA, smaller values indicate better
fit, with values <.05 representing close fit, values <.08 representing reasonable fit, and values >.10 representing
questionable fit. c For the CFI, higher numbers indicate better fit, with values >.95 representing adequate fit.
Gender. The five-item eustress factor structure was tested to explore the model fit for
males and females. Table 5 presents the confirmatory factor fit indices for both males and
females. There was a large difference in sample size between the two groups (579 more females
than males), but each group had a sample size adequate for analysis. A diagram representing the
CFA for eustress by gender is presented in Appendix L. For the overall gender fit indices, the chi
squared index was significant in both groups, the SRMR ranged between 0.04 – 0.05 (M=0.045),
73
the RMSEA was consistent (0.17), and the CFI ranged between 0.90 - 0.93 (M= 0.915). Specific
fit indices for each group are presented below.
For the model fit indices for males, the chi-squared model fit was significant, ꭓ2 (5, N =
900) = 127.93, p < .05. The SRMR was 0.04, which is the same as the SRMR value for the total
sample. The RMSEA value was 0.17, similar to the value found for the total sample. Last, the
CFI was 0.93 which borders on adequate fit and is only slightly lower than the value found for
the total sample.
For females, the chi-squared model fit was significant, ꭓ2 (5, N = 1479) = 207.57, p < .05.
The SRMR was 0.05, which is slightly higher than the SRMR values for the total sample and for
males. The RMSEA value was 0.17, which mirrors the value found for males, but is .01 higher
than the total sample. Last, the CFI was 0.90 which is .04 and .03 lower than the values found for
both the total sample and males, respectively.
Grade. This study also explored the five-item eustress factor structure for each high-
school grade level, namely 9th, 10th, 11th, and 12th. Table 4 above presents the confirmatory factor
fit indices for all grade levels. There was a fairly even distribution of students for each grade
level, with 10th grade having the largest sample (N= 644) and 12th grade having the smallest
sample (N=538). A diagram representing the CFA for eustress by grade is presented in Appendix
M. For the overall grade fit indices, the chi squared index was significant in all four groups, the
SRMR ranged between 0.04 – 0.05 (M=0.048), the RMSEA ranged between 0.14 – 0.20
(M=0.16), and the CFI ranged between 0.84 - 0.95 (M= 0.92). Specific fit indices for each group
are presented below.
74
Regarding the model fit indices for 9th graders, the chi-squared model fit was significant,
ꭓ2 (5, N= 604) = 82.22, p < .05. The SRMR was 0.05, which is slightly higher than the SRMR
value for the total sample. The RMSEA value was 0.16, which is similar to the value found for
the total sample. Last, the CFI was 0.94 which is slightly higher than the value found for the total
sample.
For the indices for 10th grade students, the chi-squared model fit was significant, ꭓ2 (5,
N= 644) = 136.82, p < .05. The SRMR was 0.05, which is slightly higher than the SRMR values
for the total sample but the same as the value for 9th graders. The RMSEA value was 0.20, which
is .03 higher than value for the total sample. Last, the CFI was 0.84 which is lower than the
values found for both the total sample and 9th graders.
Regarding the model fit indices for 11th grade students, the chi-squared model fit was
significant, ꭓ2 (5, N= 593) = 59.92, p < .05. The SRMR was 0.04, which is similar to the value
for the SRMR for the total sample and is lower than the values for 9th and 10th graders. The
RMSEA value was 0.14, which is lower than value for the total sample, 9th and 10th graders.
Last, the CFI was 0.95 which represent adequate fit, and is slightly higher than the value for the
total sample.
Last, regarding the model fit indices for 12th grade students, the chi-squared model fit
was significant, ꭓ2 (5, N= 538) = 57.53, p < .05. The SRMR was 0.05, which is similar to the
SRMR for 9th and 10th graders. The RMSEA value was 0.14, which is similar to the RMSEA
value for 11th graders, and lower than the value for the total sample, 9th and 10th graders. Last,
the CFI was 0.93 which is slightly lower than the value for the total sample.
75
Program. The five-item eustress factor structure was also explored for students who
were in AP classes vs. IB programs. Table 5 above presents the confirmatory factor fit indices
for both programs, AP and IB. There was a large sample size for each program type, with IB
having slightly more participants (N=1229) than AP (N=1150). A diagram representing the CFA
for eustress by program is presented in Appendix N. For the overall program fit indices, the chi
squared index was significant in both groups, the SRMR ranged between 0.04 – 0.05 (M=0.045),
the RMSEA ranged between 0.14 – 0.22 (M= 0.18), and the CFI ranged between 0.87 – 0.97
(M= 0.92). Specific fit indices for each group are described below.
For the model fit indices for students in AP, the chi-squared model fit was significant, ꭓ2
(5, N= 1150) = 274.46, p < .05. The SRMR was 0.05, which is slightly higher than the SRMR
value for the total sample, but still represents adequate fit. The RMSEA value was 0.22, which is
.06 higher than the value found for the total sample. Last, the CFI was 0.87, which is .07 lower
than the value found for the total sample.
Regarding students in IB, the chi-squared model fit was significant, ꭓ2 (5, N= 1229) =
116.32, p < .05. The SRMR was 0.04, same as the SRMR values for the total sample and slightly
lower than the value for AP students. The RMSEA value was 0.14, which is lower than the total
sample and for AP students. Last, the CFI was 0.97 which represents adequate fit and is .10
higher than the value found for the total sample and AP students.
Overall, taking into account all the fit indices, the factor structure of the eustress measure
is considered adequate. There were certain groups for whom the factor structure fit was slightly
worse, such as 10th graders, and AP students, and groups for whom the factor structure fit
slightly better, such as 11th grade students and IB students. Since there was relatively low
76
variation in the factor structure of the eustress measure for the different subgroups, the total
sample seems to be a representative structure that was used in the other research questions this
study explored.
Reliability. To assess the internal consistency of the eustress measure, composite
reliability was considered to be most appropriate approach. Cronbach’s alpha is the most
commonly used statistic for this construct (and was also calculated for this measure), but it
assumes equal factor loadings for each item. Since that assumption was not most representative
of the eustress measure, composite reliability was calculated which takes into account the
varying factor loading of each item. The value for composite reliability was .85, which is the
same as the Cronbach’s alpha value for this measure.
Overall, the modified eustress measure seems to be a psychometrically sound measure
and is acceptable to be used in further statistical analyses.
Eustress by Gender, Grade, and Program
To answer research question two, this study explored the eustress measure in the AP/IB
population in regards to gender, grade, and program. The differences in sample size between the
different groups are discussed above. For analysis, a multiple regression with a latent variable for
eustress was run using Mplus Version 8 (the predictor variables of gender, grade, and program
were added to the latent variable model that included the five items measuring eustress). A single
model was run with all three variables, so results show the effects of one variable while
controlling for the other two variables. Gender (0=Male, 1=Female) and program (0=AP, 1=IB)
were coded as dummy variables; grade was coded 9, 10, 11, 12. Unstandardized coefficients
were reported for this model which is common to use when examining different groups, however
77
the significance value remains the same for both standardized and unstandardized models. For
gender, the coefficient from the model was -0.02 (SE=0.04), but it was nonsignificant (p=.58).
For grade, the coefficient was 0.079 (SE=0.02), and significant (p <.05). This indicates that
students in higher grades are expected to have significantly higher eustress than those in lower
grades. Last, for program, the coefficient was 0.052 (SE=0.05), but it was non-significant
(p=0.33). In sum, of the demographic variables, there was only a significant difference in
eustress by grade level. However, it should be noted that these three predictors, gender, grade,
and program, only explain 1.3% of the variance in eustress (R2= 0.013, p < .05).
Correlates of Eustress
For research question three, this study explored the nomological network of eustress and
its concurrent associations with distress, student engagement, coping strategies, self-efficacy,
flow and grit. First, descriptive statistics for each construct measures are presented below
(descriptive statistics for eustress are presented above). In accordance with the same
conceptualization of eustress, each construct consisted of its measured variables, and the overall
factor of interest was considered a latent variable. Second, the model fit indices for the model of
eustress and distress is presented. Third, correlations of constructs using a latent variable
framework in Mplus Version 8 are also presented below.
Distress. Descriptive statistics, including sample size (N), mean (M), standard deviation
(SD), skewness, and kurtosis for the individual items from the Perceived Stress Scale, which
measures distress, are presented in Table 6. The PSS items had an approximately normal
distribution (skewness and kurtosis between -2.0 and +2.0). The negative skewness and kurtosis
values, while within the normal range, indicate data that are slightly skewed left in a flatter
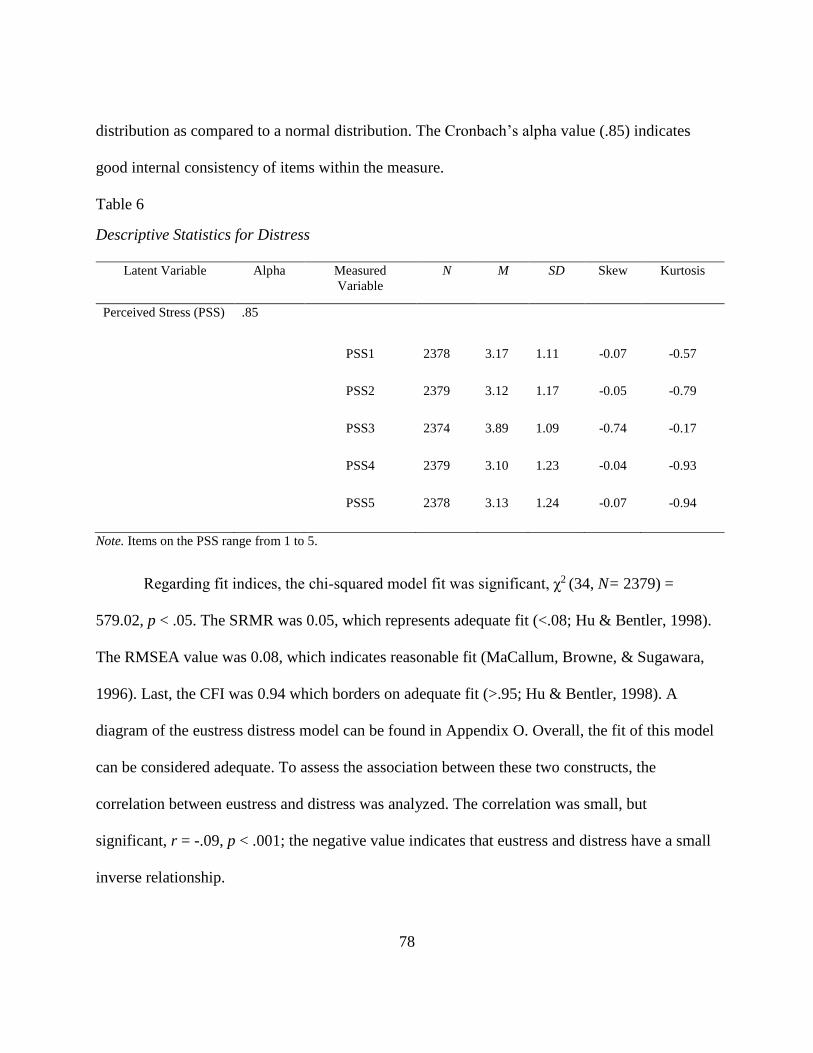
78
distribution as compared to a normal distribution. The Cronbach’s alpha value (.85) indicates
good internal consistency of items within the measure.
Table 6
Descriptive Statistics for Distress
Latent Variable Alpha Measured
Variable
N M SD Skew Kurtosis
Perceived Stress (PSS) .85
PSS1 2378 3.17 1.11 -0.07 -0.57
PSS2 2379 3.12 1.17 -0.05 -0.79
PSS3 2374 3.89 1.09 -0.74 -0.17
PSS4 2379 3.10 1.23 -0.04 -0.93
PSS5 2378 3.13 1.24 -0.07 -0.94
Note. Items on the PSS range from 1 to 5.
Regarding fit indices, the chi-squared model fit was significant, ꭓ2 (34, N= 2379) =
579.02, p < .05. The SRMR was 0.05, which represents adequate fit (<.08; Hu & Bentler, 1998).
The RMSEA value was 0.08, which indicates reasonable fit (MaCallum, Browne, & Sugawara,
1996). Last, the CFI was 0.94 which borders on adequate fit (>.95; Hu & Bentler, 1998). A
diagram of the eustress distress model can be found in Appendix O. Overall, the fit of this model
can be considered adequate. To assess the association between these two constructs, the
correlation between eustress and distress was analyzed. The correlation was small, but
significant, r = -.09, p < .001; the negative value indicates that eustress and distress have a small
inverse relationship.
79
Student engagement. Student engagement was represented by two different types of
engagement: affective engagement and cognitive engagement. Each aspect of engagement was
represented by two subscales on the School Attitude Assessment Survey-Revised (SAAS-R).
Descriptive statistics, including sample size (N), mean (M), standard deviation (SD), skewness,
and kurtosis for the individual items for all subscales, are presented in Table 7 below. The
affective engagement items had an approximately normal distribution (skewness and kurtosis
between -2.0 and +2.0). For the cognitive engagement items, the motivation/self-regulation
subscale had approximately normal distribution, however, the goal valuation subscale had a non-
normal distribution. The mean score on the goal valuation subscale on the SAAS-R was high, so
the skewness and kurtosis values reflect the limited variation of scores. Findings from this
subscale should be interpreted with caution. The Cronbach’s alpha values, which ranged between
.90 - .95, indicate good internal consistency of items within the measure.
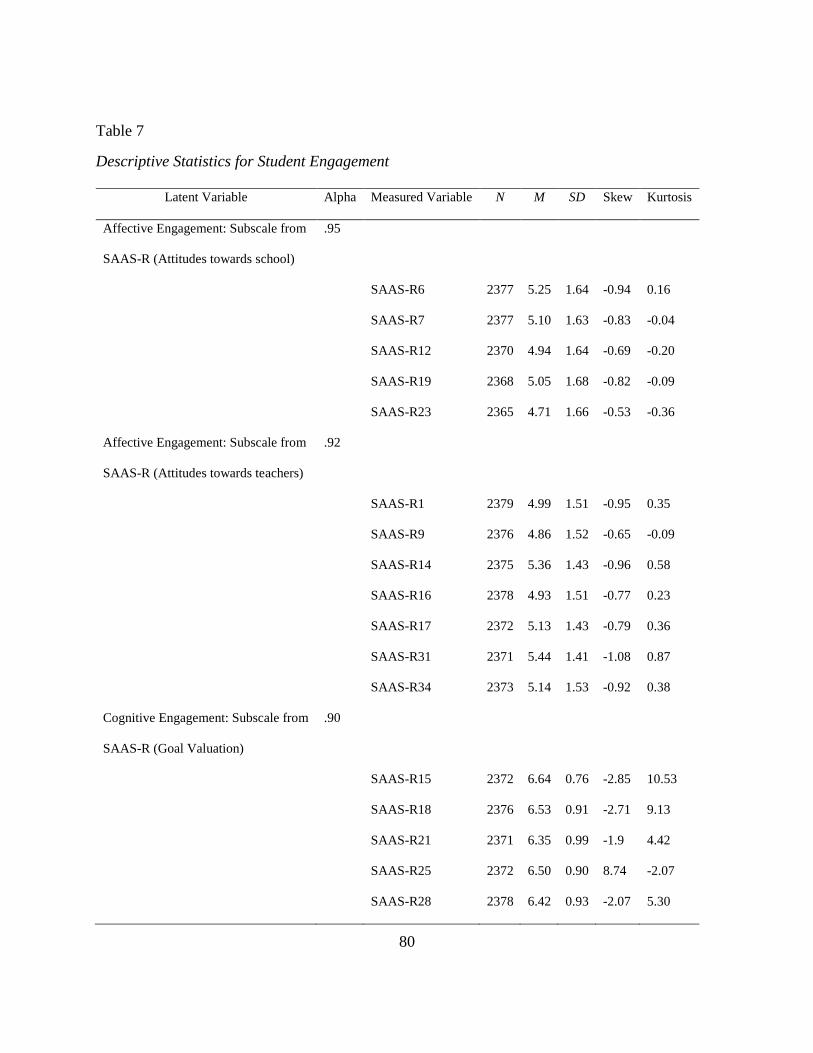
80
Table 7
Descriptive Statistics for Student Engagement
Latent Variable Alpha Measured Variable N M SD Skew Kurtosis
Affective Engagement: Subscale from
SAAS-R (Attitudes towards school)
.95
SAAS-R6 2377 5.25 1.64 -0.94 0.16
SAAS-R7 2377 5.10 1.63 -0.83 -0.04
SAAS-R12 2370 4.94 1.64 -0.69 -0.20
SAAS-R19 2368 5.05 1.68 -0.82 -0.09
SAAS-R23 2365 4.71 1.66 -0.53 -0.36
Affective Engagement: Subscale from
SAAS-R (Attitudes towards teachers)
.92
SAAS-R1 2379 4.99 1.51 -0.95 0.35
SAAS-R9 2376 4.86 1.52 -0.65 -0.09
SAAS-R14 2375 5.36 1.43 -0.96 0.58
SAAS-R16 2378 4.93 1.51 -0.77 0.23
SAAS-R17 2372 5.13 1.43 -0.79 0.36
SAAS-R31 2371 5.44 1.41 -1.08 0.87
SAAS-R34 2373 5.14 1.53 -0.92 0.38
Cognitive Engagement: Subscale from
SAAS-R (Goal Valuation)
.90
SAAS-R15 2372 6.64 0.76 -2.85 10.53
SAAS-R18 2376 6.53 0.91 -2.71 9.13
SAAS-R21 2371 6.35 0.99 -1.9 4.42
SAAS-R25 2372 6.50 0.90 8.74 -2.07
SAAS-R28 2378 6.42 0.93 -2.07 5.30
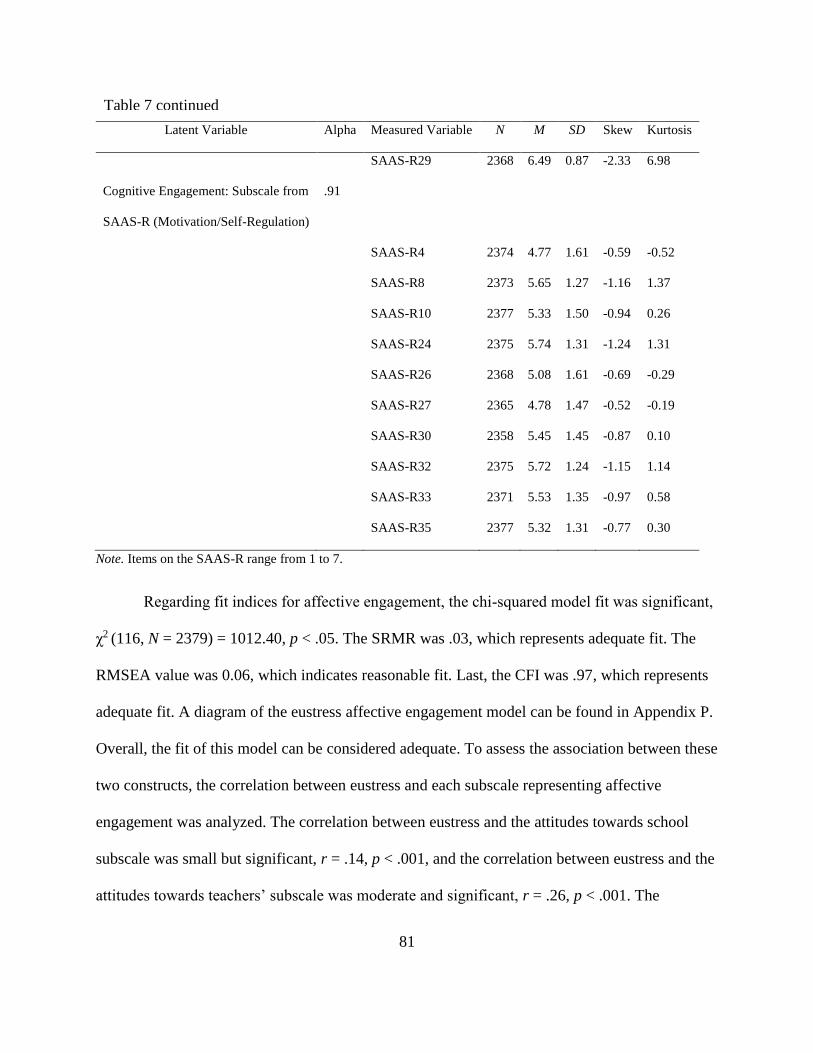
81
Latent Variable Alpha Measured Variable N M SD Skew Kurtosis
SAAS-R29 2368 6.49 0.87 -2.33 6.98
Cognitive Engagement: Subscale from
SAAS-R (Motivation/Self-Regulation)
.91
SAAS-R4 2374 4.77 1.61 -0.59 -0.52
SAAS-R8 2373 5.65 1.27 -1.16 1.37
SAAS-R10 2377 5.33 1.50 -0.94 0.26
SAAS-R24 2375 5.74 1.31 -1.24 1.31
SAAS-R26 2368 5.08 1.61 -0.69 -0.29
SAAS-R27 2365 4.78 1.47 -0.52 -0.19
SAAS-R30 2358 5.45 1.45 -0.87 0.10
SAAS-R32 2375 5.72 1.24 -1.15 1.14
SAAS-R33 2371 5.53 1.35 -0.97 0.58
SAAS-R35 2377 5.32 1.31 -0.77 0.30
Note. Items on the SAAS-R range from 1 to 7.
Regarding fit indices for affective engagement, the chi-squared model fit was significant,
ꭓ2 (116, N = 2379) = 1012.40, p < .05. The SRMR was .03, which represents adequate fit. The
RMSEA value was 0.06, which indicates reasonable fit. Last, the CFI was .97, which represents
adequate fit. A diagram of the eustress affective engagement model can be found in Appendix P.
Overall, the fit of this model can be considered adequate. To assess the association between these
two constructs, the correlation between eustress and each subscale representing affective
engagement was analyzed. The correlation between eustress and the attitudes towards school
subscale was small but significant, r = .14, p < .001, and the correlation between eustress and the
attitudes towards teachers’ subscale was moderate and significant, r = .26, p < .001. The
Table 7 continued
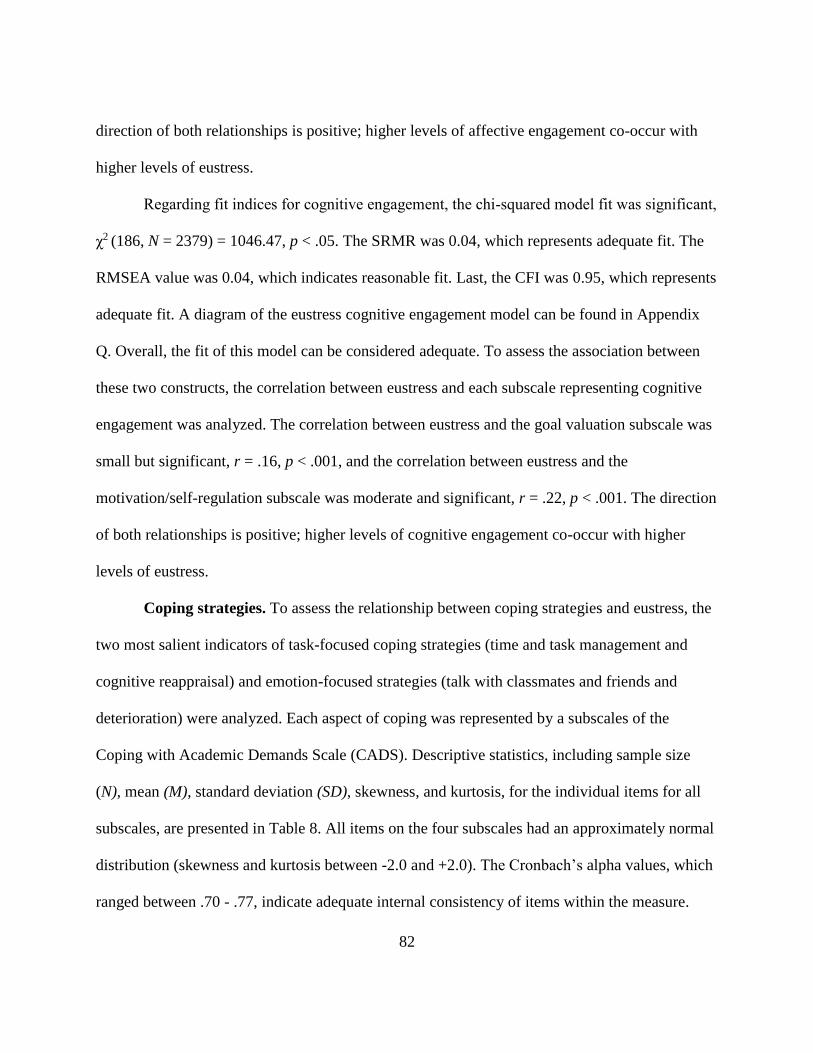
82
direction of both relationships is positive; higher levels of affective engagement co-occur with
higher levels of eustress.
Regarding fit indices for cognitive engagement, the chi-squared model fit was significant,
ꭓ2 (186, N = 2379) = 1046.47, p < .05. The SRMR was 0.04, which represents adequate fit. The
RMSEA value was 0.04, which indicates reasonable fit. Last, the CFI was 0.95, which represents
adequate fit. A diagram of the eustress cognitive engagement model can be found in Appendix
Q. Overall, the fit of this model can be considered adequate. To assess the association between
these two constructs, the correlation between eustress and each subscale representing cognitive
engagement was analyzed. The correlation between eustress and the goal valuation subscale was
small but significant, r = .16, p < .001, and the correlation between eustress and the
motivation/self-regulation subscale was moderate and significant, r = .22, p < .001. The direction
of both relationships is positive; higher levels of cognitive engagement co-occur with higher
levels of eustress.
Coping strategies. To assess the relationship between coping strategies and eustress, the
two most salient indicators of task-focused coping strategies (time and task management and
cognitive reappraisal) and emotion-focused strategies (talk with classmates and friends and
deterioration) were analyzed. Each aspect of coping was represented by a subscales of the
Coping with Academic Demands Scale (CADS). Descriptive statistics, including sample size
(N), mean (M), standard deviation (SD), skewness, and kurtosis, for the individual items for all
subscales, are presented in Table 8. All items on the four subscales had an approximately normal
distribution (skewness and kurtosis between -2.0 and +2.0). The Cronbach’s alpha values, which
ranged between .70 - .77, indicate adequate internal consistency of items within the measure.
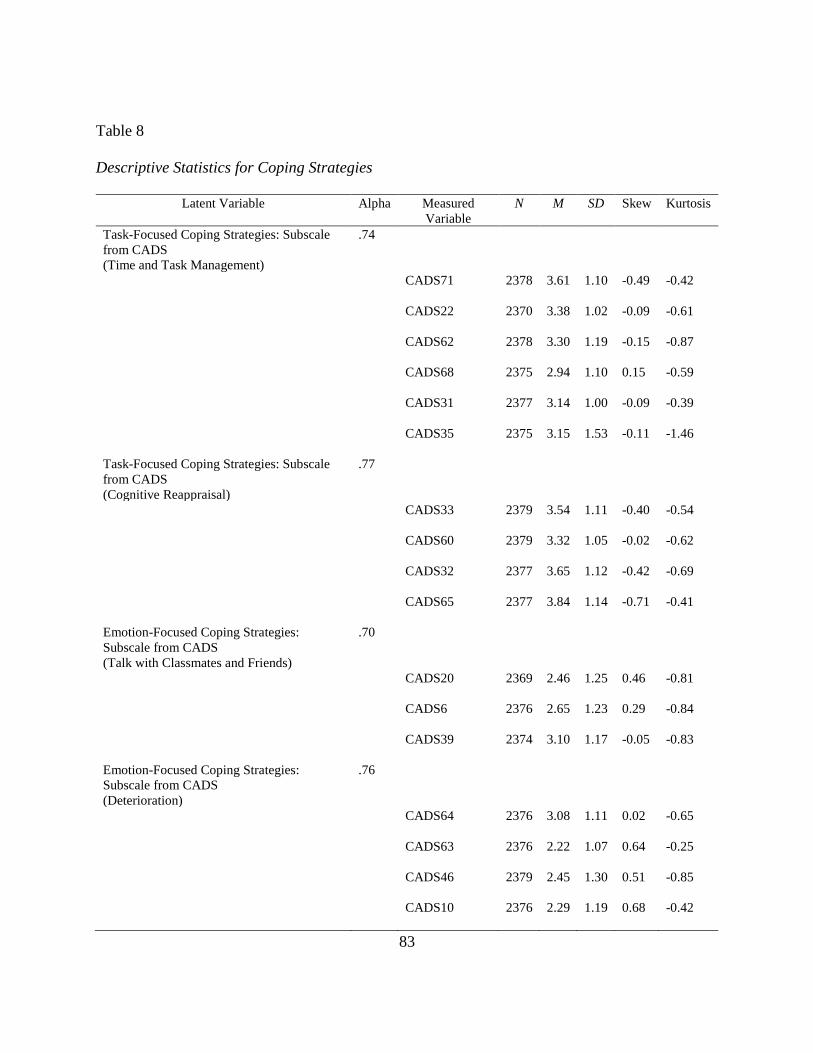
83
Table 8
Descriptive Statistics for Coping Strategies
Latent Variable Alpha Measured
Variable
N M SD Skew Kurtosis
Task-Focused Coping Strategies: Subscale
from CADS
(Time and Task Management)
.74
CADS71 2378 3.61 1.10 -0.49 -0.42
CADS22 2370 3.38 1.02 -0.09 -0.61
CADS62 2378 3.30 1.19 -0.15 -0.87
CADS68 2375 2.94 1.10 0.15 -0.59
CADS31 2377 3.14 1.00 -0.09 -0.39
CADS35 2375 3.15 1.53 -0.11 -1.46
Task-Focused Coping Strategies: Subscale
from CADS
(Cognitive Reappraisal)
.77
CADS33 2379 3.54 1.11 -0.40 -0.54
CADS60 2379 3.32 1.05 -0.02 -0.62
CADS32 2377 3.65 1.12 -0.42 -0.69
CADS65 2377 3.84 1.14 -0.71 -0.41
Emotion-Focused Coping Strategies:
Subscale from CADS
(Talk with Classmates and Friends)
.70
CADS20 2369 2.46 1.25 0.46 -0.81
CADS6 2376 2.65 1.23 0.29 -0.84
CADS39 2374 3.10 1.17 -0.05 -0.83
Emotion-Focused Coping Strategies:
Subscale from CADS
(Deterioration)
.76
CADS64 2376 3.08 1.11 0.02 -0.65
CADS63 2376 2.22 1.07 0.64 -0.25
CADS46 2379 2.45 1.30 0.51 -0.85
CADS10 2376 2.29 1.19 0.68 -0.42
84
Latent Variable Alpha Measured
Variable
N M SD Skew Kurtosis
CADS26 2379 3.31 1.19 -0.17 -0.90
CADS37 2374 3.43 1.15 -0.28 -0.77
Note. Items on the CADS range from 1 to 5.
Fit indices and correlations were assessed for task-focused coping strategies. Regarding
fit indices for the time and task management coping strategy, the chi-squared model fit was
significant, ꭓ2 (43, N =2379) = 536.89, p < .05. The SRMR was 0.04, which represents adequate
fit. The RMSEA value was 0.07, which indicates reasonable fit. Last, the CFI was 0.92, which
borders on adequate fit. A diagram of the eustress time and task management model can be
found in Appendix R. Overall, the fit of this model can be considered adequate. To assess the
association between these two constructs, the correlation between eustress and time and task
management was analyzed. The correlation between eustress and the time and task management
subscale was moderate and significant, r = .25, p < .001.
For fit indices for the cognitive reappraisal coping strategy, the chi-squared model fit was
significant, ꭓ2 (26, N =2379) = 419.36, p < .05. The SRMR was 0.04, which represents adequate
fit. The RMSEA value was 0.08, which indicates reasonable fit. Last, the CFI was 0.94, which
borders on adequate fit. A diagram of the eustress cognitive reappraisal model can be found in
Appendix S. Overall, the fit of this model can be considered adequate. To assess the association
between these two constructs, the correlation between eustress and cognitive reappraisal was
analyzed. The correlation between eustress and the cognitive reappraisal subscale was moderate
and significant, r = .29, p < .001. The direction of the associations between eustress and
indicators of task-focused coping was positive, indicating more frequent use of task-focused
Table 8 continued
85
coping behaviors (time and task management, cognitive reappraisal) co-occurred with higher
levels of eustress.
Fit indices and correlations were assessed for emotion-focused coping strategies.
Regarding fit indices for talk with classmates and friends, the chi-squared model fit was
significant, ꭓ2 (19, N =2379) = 370.22, p < .05. The SRMR was 0.03, which represents adequate
fit. The RMSEA value was 0.09, which boarders on reasonable fit. Last, the CFI was 0.95 which
represents adequate fit. A diagram of the eustress talk with classmates and friends model can be
found in Appendix T. Overall, the fit of this model can be considered adequate. To assess the
association between these two constructs, the correlation between eustress and talk with
classmates and friends was analyzed. The correlation between eustress and the talk with
classmates and friends’ subscale was small but significant, r = .06, p < .05.
For fit indices for deterioration, the chi-squared model fit was significant, ꭓ2 (43, N=
2379) = 777.89, p < .05. The SRMR was 0.05, which represents adequate fit. The RMSEA value
was 0.09, which boarders on reasonable fit. Last, the CFI was 0.89, which does not indicate
adequate fit. A diagram of the eustress deterioration model can be found in Appendix U. Overall,
the fit of this model can be considered questionable to adequate. To assess the association
between these two constructs, the correlation between eustress and deterioration was analyzed.
The correlation between eustress and the deterioration subscale was small but significant, r = -
.10, p < .05. This negative association between deterioration and eustress indicates that higher
levels of coping through behaviors that reflect emotional deterioration are associated with lower
levels of eustress.
86
Overall, the associations between eustress and task-focused coping strategies were
moderate positive correlations, while the associations between eustress and emotion-focused
strategies were small, and one coping strategy (deterioration) had a negative association.
Self-efficacy. Self-efficacy was assessed using the academic self-perceptions subscale
from the SAAS-R. Descriptive statistics, including sample size (N), mean (M), standard
deviation (SD), skewness, and kurtosis, for the individual items from the academic self-
perceptions subscale, are presented in Table 9 below. The academic self-perceptions subscale
items had an approximately normal distribution (skewness and kurtosis between -2.0 and +2.0),
except for the kurtosis for item two. While the kurtosis values were mixed (positive and negative
values), the negative skewness values, while within the normal range, indicate data that are
slightly skewed left. The Cronbach’s alpha value (.87) indicates good internal consistency of
items within the measure.
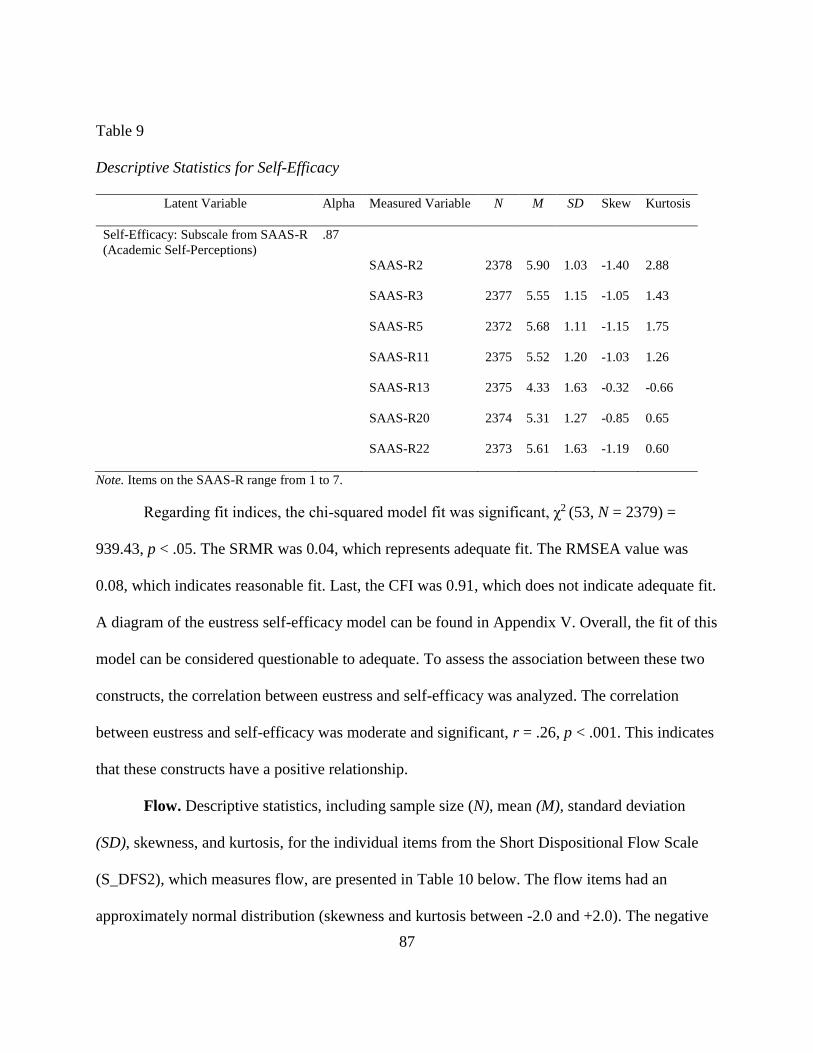
87
Table 9
Descriptive Statistics for Self-Efficacy
Latent Variable Alpha Measured Variable N M SD Skew Kurtosis
Self-Efficacy: Subscale from SAAS-R
(Academic Self-Perceptions)
.87
SAAS-R2 2378 5.90 1.03 -1.40 2.88
SAAS-R3 2377 5.55 1.15 -1.05 1.43
SAAS-R5 2372 5.68 1.11 -1.15 1.75
SAAS-R11 2375 5.52 1.20 -1.03 1.26
SAAS-R13 2375 4.33 1.63 -0.32 -0.66
SAAS-R20 2374 5.31 1.27 -0.85 0.65
SAAS-R22 2373 5.61 1.63 -1.19 0.60
Note. Items on the SAAS-R range from 1 to 7.
Regarding fit indices, the chi-squared model fit was significant, ꭓ2 (53, N = 2379) =
939.43, p < .05. The SRMR was 0.04, which represents adequate fit. The RMSEA value was
0.08, which indicates reasonable fit. Last, the CFI was 0.91, which does not indicate adequate fit.
A diagram of the eustress self-efficacy model can be found in Appendix V. Overall, the fit of this
model can be considered questionable to adequate. To assess the association between these two
constructs, the correlation between eustress and self-efficacy was analyzed. The correlation
between eustress and self-efficacy was moderate and significant, r = .26, p < .001. This indicates
that these constructs have a positive relationship.
Flow. Descriptive statistics, including sample size (N), mean (M), standard deviation
(SD), skewness, and kurtosis, for the individual items from the Short Dispositional Flow Scale
(S_DFS2), which measures flow, are presented in Table 10 below. The flow items had an
approximately normal distribution (skewness and kurtosis between -2.0 and +2.0). The negative
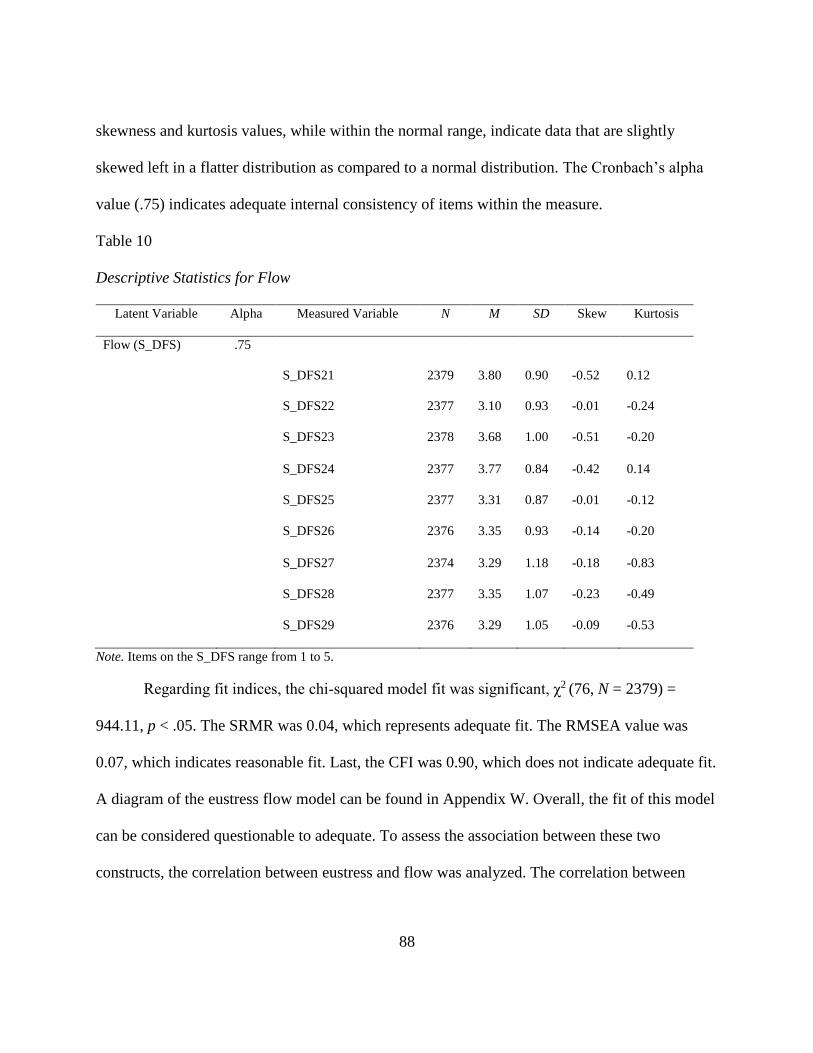
88
skewness and kurtosis values, while within the normal range, indicate data that are slightly
skewed left in a flatter distribution as compared to a normal distribution. The Cronbach’s alpha
value (.75) indicates adequate internal consistency of items within the measure.
Table 10
Descriptive Statistics for Flow
Latent Variable Alpha Measured Variable N M SD Skew Kurtosis
Flow (S_DFS) .75
S_DFS21 2379 3.80 0.90 -0.52 0.12
S_DFS22 2377 3.10 0.93 -0.01 -0.24
S_DFS23 2378 3.68 1.00 -0.51 -0.20
S_DFS24 2377 3.77 0.84 -0.42 0.14
S_DFS25 2377 3.31 0.87 -0.01 -0.12
S_DFS26 2376 3.35 0.93 -0.14 -0.20
S_DFS27 2374 3.29 1.18 -0.18 -0.83
S_DFS28 2377 3.35 1.07 -0.23 -0.49
S_DFS29 2376 3.29 1.05 -0.09 -0.53
Note. Items on the S_DFS range from 1 to 5.
Regarding fit indices, the chi-squared model fit was significant, ꭓ2 (76, N = 2379) =
944.11, p < .05. The SRMR was 0.04, which represents adequate fit. The RMSEA value was
0.07, which indicates reasonable fit. Last, the CFI was 0.90, which does not indicate adequate fit.
A diagram of the eustress flow model can be found in Appendix W. Overall, the fit of this model
can be considered questionable to adequate. To assess the association between these two
constructs, the correlation between eustress and flow was analyzed. The correlation between
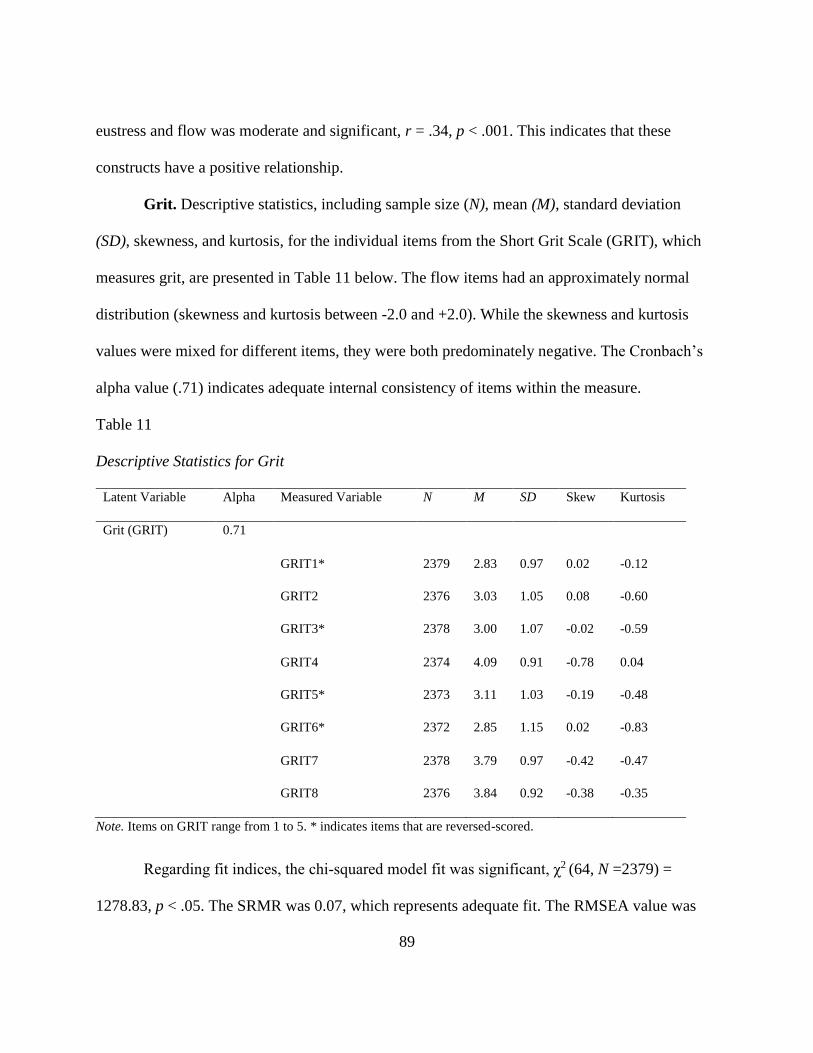
89
eustress and flow was moderate and significant, r = .34, p < .001. This indicates that these
constructs have a positive relationship.
Grit. Descriptive statistics, including sample size (N), mean (M), standard deviation
(SD), skewness, and kurtosis, for the individual items from the Short Grit Scale (GRIT), which
measures grit, are presented in Table 11 below. The flow items had an approximately normal
distribution (skewness and kurtosis between -2.0 and +2.0). While the skewness and kurtosis
values were mixed for different items, they were both predominately negative. The Cronbach’s
alpha value (.71) indicates adequate internal consistency of items within the measure.
Table 11
Descriptive Statistics for Grit
Latent Variable Alpha Measured Variable N M SD Skew Kurtosis
Grit (GRIT) 0.71
GRIT1* 2379 2.83 0.97 0.02 -0.12
GRIT2 2376 3.03 1.05 0.08 -0.60
GRIT3* 2378 3.00 1.07 -0.02 -0.59
GRIT4 2374 4.09 0.91 -0.78 0.04
GRIT5* 2373 3.11 1.03 -0.19 -0.48
GRIT6* 2372 2.85 1.15 0.02 -0.83
GRIT7 2378 3.79 0.97 -0.42 -0.47
GRIT8 2376 3.84 0.92 -0.38 -0.35
Note. Items on GRIT range from 1 to 5. * indicates items that are reversed-scored.
Regarding fit indices, the chi-squared model fit was significant, ꭓ2 (64, N =2379) =
1278.83, p < .05. The SRMR was 0.07, which represents adequate fit. The RMSEA value was
90
0.09, which indicates between reasonable and questionable fit. Last, the CFI was 0.83, which
does not indicate adequate fit. A diagram of the eustress grit model can be found in Appendix X.
Overall, the fit of this model can be considered questionable to adequate. To assess the
association between these two constructs, the correlation between eustress and grit was analyzed.
The correlation between eustress and grit was moderate and significant, r = .20, p < .001. This
indicates that these constructs have a positive relationship.
Relationship Between Eustress and Student Outcomes
To answer research question four, this study explored the eustress measure in relation to
student outcomes variables, namely academic performance and emotional well-being. Academic
performance was measured by unweighted semester GPA, and student emotional well-being was
captured by three measures related to life satisfaction (SLSS), school burnout (SBI), and
psychopathology (BESS). All measures representing emotional well-being were analyzed
separately so as not to mask differences in associations with various aspects of mental health
through group analysis. For analysis, a multiple regression was run using Mplus Version 8, with
each outcome variables, i.e. life satisfaction predicted by eustress, gender, grade, and program. A
single model was run with all variables, so results show the effects of each variable while
controlling for the other variables in the model. Gender (0=Male, 1=Female) and program
(0=AP, 1=IB) were coded as dummy variables; grade was coded 9, 10, 11, 12. Unstandardized
coefficients were reported for this model which is common to use when examining different
groups, however the significance value remains the same for both standardized and
unstandardized models. Table 12 below summarizes the results of the analyses performed for all
variables. The beta coefficient (b), standard error (SE), the coefficient of determination (R2) and
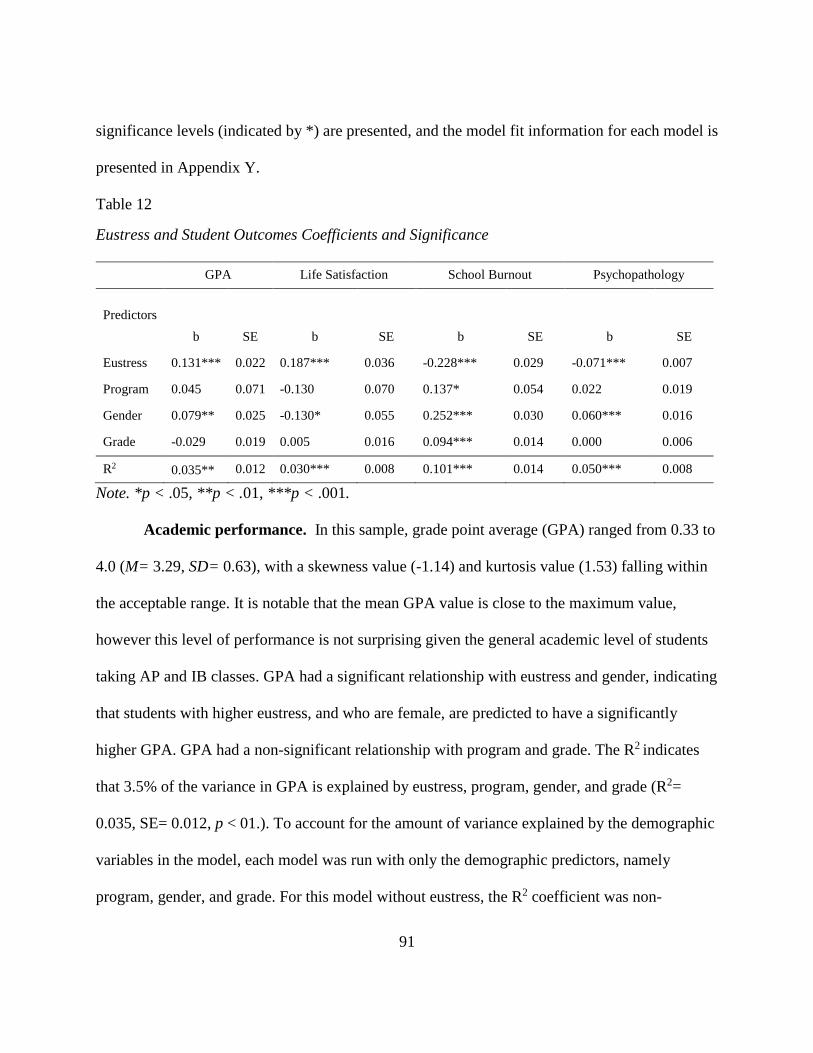
91
significance levels (indicated by *) are presented, and the model fit information for each model is
presented in Appendix Y.
Table 12
Eustress and Student Outcomes Coefficients and Significance
GPA Life Satisfaction School Burnout Psychopathology
Predictors
b SE b SE b SE b SE
Eustress 0.131*** 0.022 0.187*** 0.036 -0.228*** 0.029 -0.071*** 0.007
Program 0.045 0.071 -0.130 0.070 0.137* 0.054 0.022 0.019
Gender 0.079** 0.025 -0.130* 0.055 0.252*** 0.030 0.060*** 0.016
Grade -0.029 0.019 0.005 0.016 0.094*** 0.014 0.000 0.006
R2 0.035** 0.012 0.030*** 0.008 0.101*** 0.014 0.050*** 0.008
Note. *p < .05, **p < .01, ***p < .001.
Academic performance. In this sample, grade point average (GPA) ranged from 0.33 to
4.0 (M= 3.29, SD= 0.63), with a skewness value (-1.14) and kurtosis value (1.53) falling within
the acceptable range. It is notable that the mean GPA value is close to the maximum value,
however this level of performance is not surprising given the general academic level of students
taking AP and IB classes. GPA had a significant relationship with eustress and gender, indicating
that students with higher eustress, and who are female, are predicted to have a significantly
higher GPA. GPA had a non-significant relationship with program and grade. The R2 indicates
that 3.5% of the variance in GPA is explained by eustress, program, gender, and grade (R2=
0.035, SE= 0.012, p < 01.). To account for the amount of variance explained by the demographic
variables in the model, each model was run with only the demographic predictors, namely
program, gender, and grade. For this model without eustress, the R2 coefficient was non-
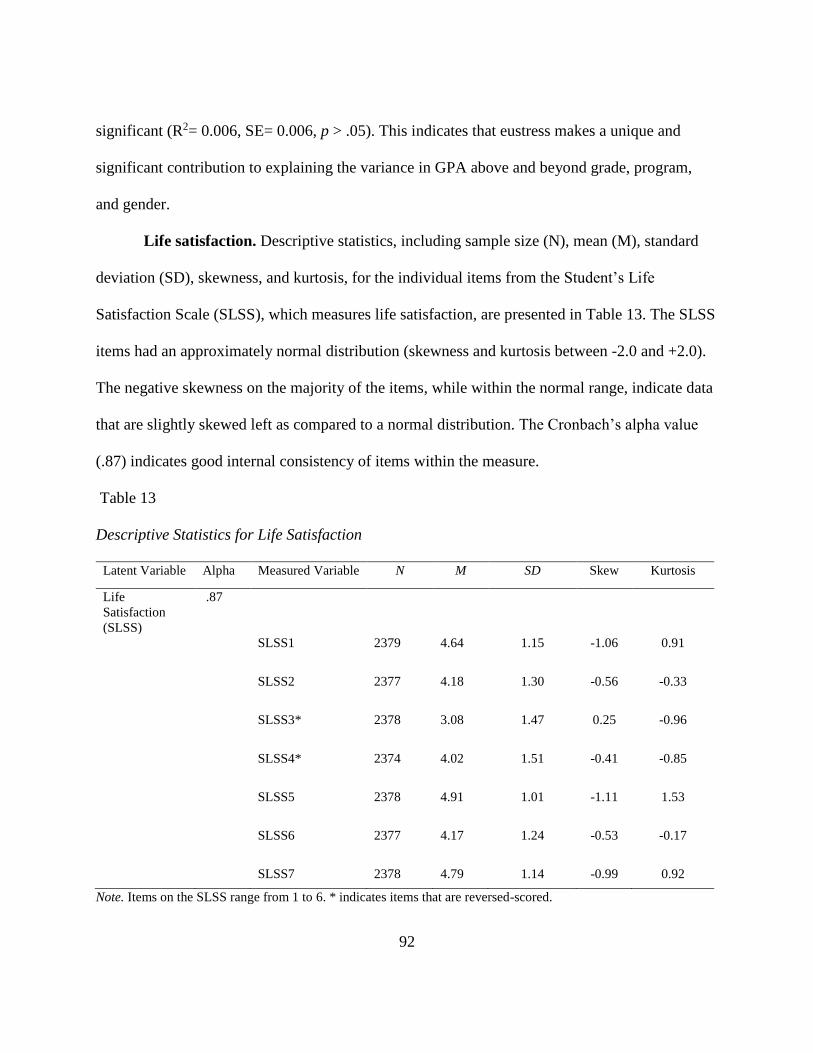
92
significant (R2= 0.006, SE= 0.006, p > .05). This indicates that eustress makes a unique and
significant contribution to explaining the variance in GPA above and beyond grade, program,
and gender.
Life satisfaction. Descriptive statistics, including sample size (N), mean (M), standard
deviation (SD), skewness, and kurtosis, for the individual items from the Student’s Life
Satisfaction Scale (SLSS), which measures life satisfaction, are presented in Table 13. The SLSS
items had an approximately normal distribution (skewness and kurtosis between -2.0 and +2.0).
The negative skewness on the majority of the items, while within the normal range, indicate data
that are slightly skewed left as compared to a normal distribution. The Cronbach’s alpha value
(.87) indicates good internal consistency of items within the measure.
Table 13
Descriptive Statistics for Life Satisfaction
Latent Variable Alpha Measured Variable N M SD Skew Kurtosis
Life
Satisfaction
(SLSS)
.87
SLSS1 2379 4.64 1.15 -1.06 0.91
SLSS2 2377 4.18 1.30 -0.56 -0.33
SLSS3* 2378 3.08 1.47 0.25 -0.96
SLSS4* 2374 4.02 1.51 -0.41 -0.85
SLSS5 2378 4.91 1.01 -1.11 1.53
SLSS6 2377 4.17 1.24 -0.53 -0.17
SLSS7 2378 4.79 1.14 -0.99 0.92
Note. Items on the SLSS range from 1 to 6. * indicates items that are reversed-scored.
93
Life Satisfaction had a significant relationship with eustress and gender, indicating that
students with higher eustress, and who are female, are predicted to have significantly higher life
satisfaction. Life Satisfaction had a non-significant relationship with program and grade. The R2
indicates that 3.0% of the variance in life satisfaction is explained by eustress, program, gender,
and grade (R2= 0.030, SE= 0.008, p < 001.). For the model without eustress, the R2 coefficient
was non-significant (R2= 0.008, SE= 0.005, p > .05). This indicates that eustress makes a unique
and significant contribution to explaining the variance in life satisfaction above and beyond
grade, program, and gender.
School burnout. Descriptive statistics, including sample size (N), mean (M), standard
deviation (SD), skewness, and kurtosis, for the individual items from the School Burnout
Inventory (SBI), which measures academic burnout, are presented in Table 14. The SBI items
had an approximately normal distribution (skewness and kurtosis between -2.0 and +2.0). The
negative skewness and kurtosis values (with the exception of the skewness value on SBI9), while
within the normal range, indicate data that are slightly skewed left in a flatter distribution as
compared to a normal distribution. The Cronbach’s alpha value (.88) indicates good internal
consistency of items within the measure.
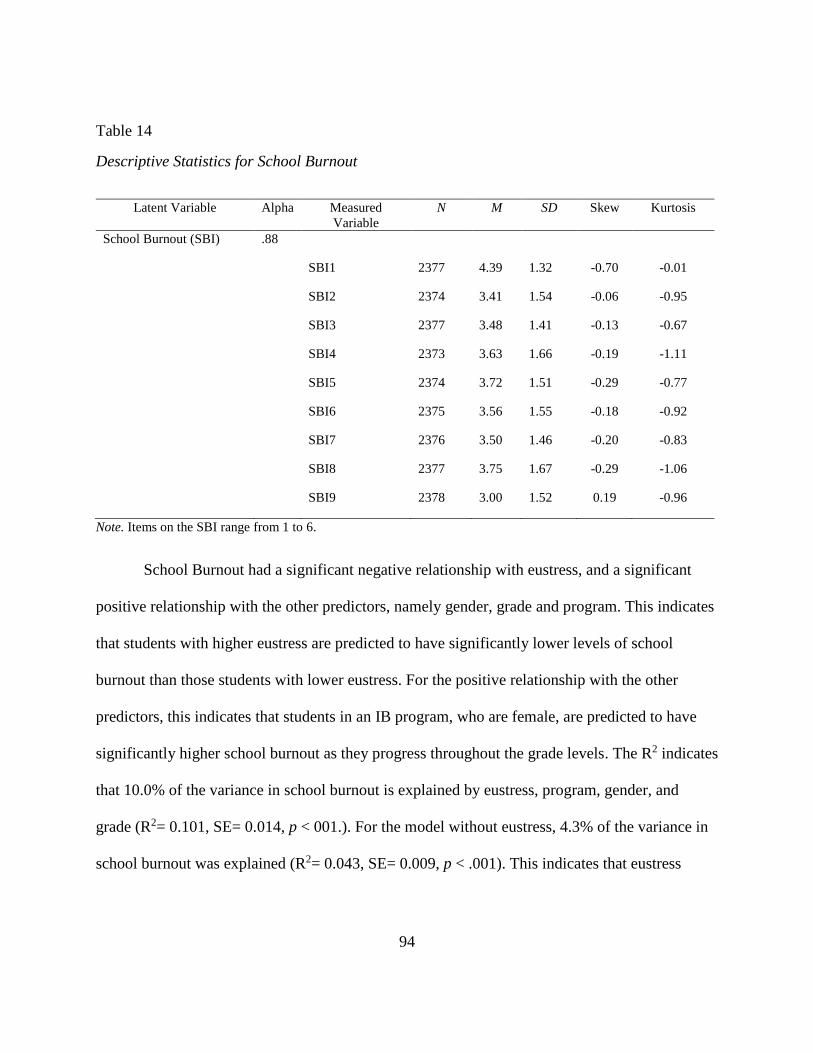
94
Table 14
Descriptive Statistics for School Burnout
Latent Variable Alpha Measured
Variable
N M SD Skew Kurtosis
School Burnout (SBI) .88
SBI1 2377 4.39 1.32 -0.70 -0.01
SBI2 2374 3.41 1.54 -0.06 -0.95
SBI3 2377 3.48 1.41 -0.13 -0.67
SBI4 2373 3.63 1.66 -0.19 -1.11
SBI5 2374 3.72 1.51 -0.29 -0.77
SBI6 2375 3.56 1.55 -0.18 -0.92
SBI7 2376 3.50 1.46 -0.20 -0.83
SBI8 2377 3.75 1.67 -0.29 -1.06
SBI9 2378 3.00 1.52 0.19 -0.96
Note. Items on the SBI range from 1 to 6.
School Burnout had a significant negative relationship with eustress, and a significant
positive relationship with the other predictors, namely gender, grade and program. This indicates
that students with higher eustress are predicted to have significantly lower levels of school
burnout than those students with lower eustress. For the positive relationship with the other
predictors, this indicates that students in an IB program, who are female, are predicted to have
significantly higher school burnout as they progress throughout the grade levels. The R2 indicates
that 10.0% of the variance in school burnout is explained by eustress, program, gender, and
grade (R2= 0.101, SE= 0.014, p < 001.). For the model without eustress, 4.3% of the variance in
school burnout was explained (R2= 0.043, SE= 0.009, p < .001). This indicates that eustress
95
makes a unique contribution (5.7%) in explaining the variance in school burnout above and
beyond grade, program, and gender.
Psychopathology Descriptive statistics, including sample size (N), mean (M), standard
deviation (SD), skewness, and kurtosis, for the individual items from the Behavioral and
Emotional Screening System (BESS), which measures psychopathology, are presented in Table
15. The vast majority of BESS items had an approximately normal distribution (skewness and
kurtosis between -2.0 and +2.0), with items 6 and 13 falling slightly outside of the normal range.
The Cronbach’s alpha value (.89) indicates good internal consistency of items within the
measure.
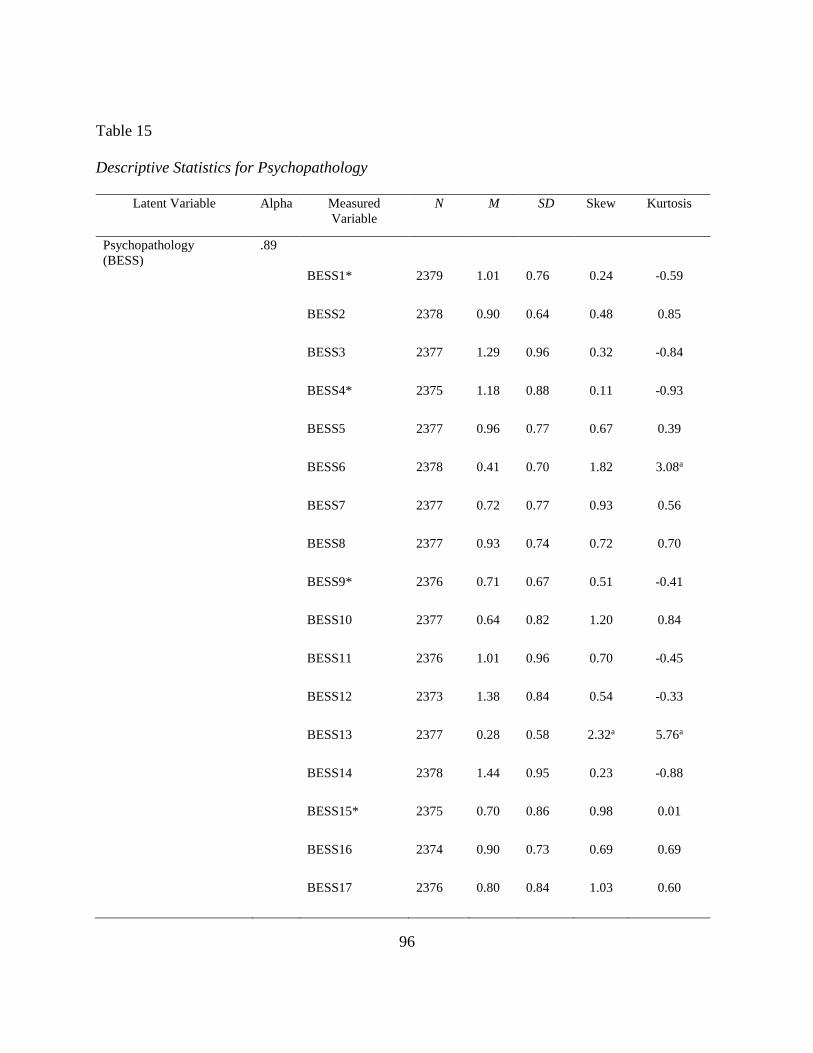
96
Table 15
Descriptive Statistics for Psychopathology
Latent Variable Alpha Measured
Variable
N M SD Skew Kurtosis
Psychopathology
(BESS)
.89
BESS1* 2379 1.01 0.76 0.24 -0.59
BESS2 2378 0.90 0.64 0.48 0.85
BESS3 2377 1.29 0.96 0.32 -0.84
BESS4* 2375 1.18 0.88 0.11 -0.93
BESS5 2377 0.96 0.77 0.67 0.39
BESS6 2378 0.41 0.70 1.82 3.08a
BESS7 2377 0.72 0.77 0.93 0.56
BESS8 2377 0.93 0.74 0.72 0.70
BESS9* 2376 0.71 0.67 0.51 -0.41
BESS10 2377 0.64 0.82 1.20 0.84
BESS11 2376 1.01 0.96 0.70 -0.45
BESS12 2373 1.38 0.84 0.54 -0.33
BESS13 2377 0.28 0.58 2.32a 5.76a
BESS14 2378 1.44 0.95 0.23 -0.88
BESS15* 2375 0.70 0.86 0.98 0.01
BESS16 2374 0.90 0.73 0.69 0.69
BESS17 2376 0.80 0.84 1.03 0.60
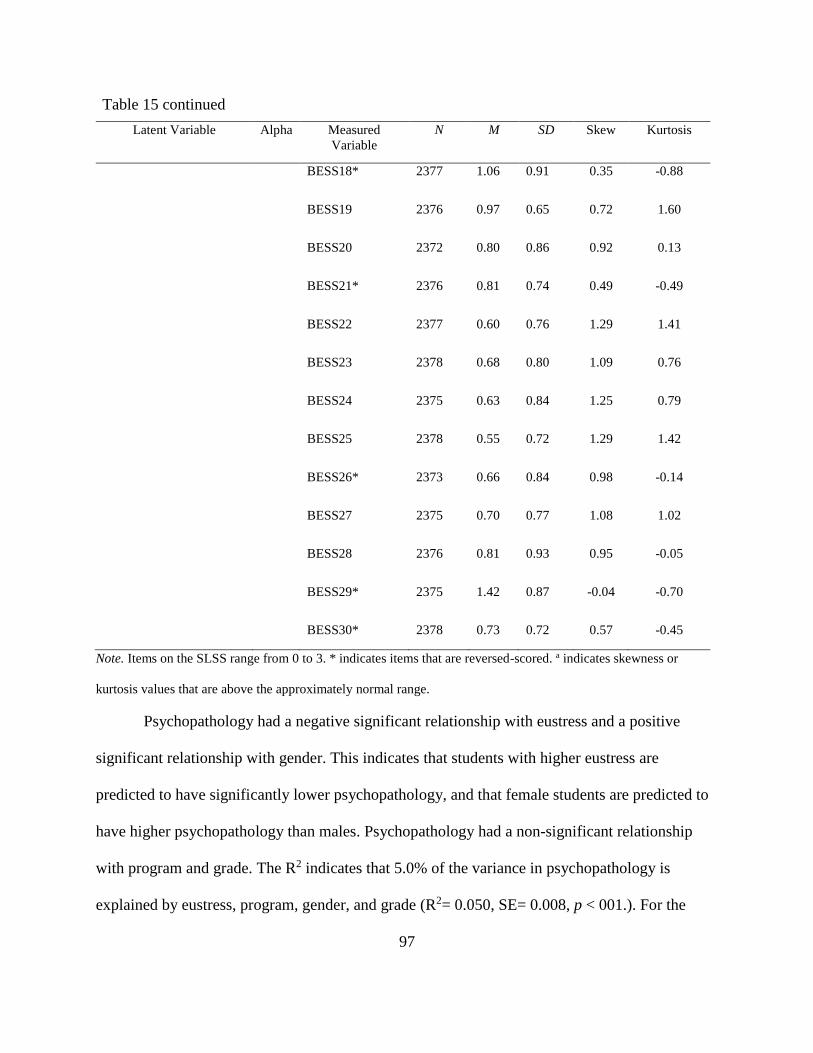
97
Latent Variable Alpha Measured
Variable
N M SD Skew Kurtosis
BESS18* 2377 1.06 0.91 0.35 -0.88
BESS19 2376 0.97 0.65 0.72 1.60
BESS20 2372 0.80 0.86 0.92 0.13
BESS21* 2376 0.81 0.74 0.49 -0.49
BESS22 2377 0.60 0.76 1.29 1.41
BESS23 2378 0.68 0.80 1.09 0.76
BESS24 2375 0.63 0.84 1.25 0.79
BESS25 2378 0.55 0.72 1.29 1.42
BESS26* 2373 0.66 0.84 0.98 -0.14
BESS27 2375 0.70 0.77 1.08 1.02
BESS28 2376 0.81 0.93 0.95 -0.05
BESS29* 2375 1.42 0.87 -0.04 -0.70
BESS30* 2378 0.73 0.72 0.57 -0.45
Note. Items on the SLSS range from 0 to 3. * indicates items that are reversed-scored. a indicates skewness or
kurtosis values that are above the approximately normal range.
Psychopathology had a negative significant relationship with eustress and a positive
significant relationship with gender. This indicates that students with higher eustress are
predicted to have significantly lower psychopathology, and that female students are predicted to
have higher psychopathology than males. Psychopathology had a non-significant relationship
with program and grade. The R2 indicates that 5.0% of the variance in psychopathology is
explained by eustress, program, gender, and grade (R2= 0.050, SE= 0.008, p < 001.). For the
Table 15 continued

98
model without eustress, the R2 coefficient was non-significant (R2= 0.012, SE= 0.006, p > .05).
This indicates that eustress makes a unique and significant contribution to explaining the
variance in psychopathology above and beyond grade, program, and gender.
99
CHAPTER V: DISCUSSION
The purpose of this study was to explore the construct of eustress and extend this concept
to an adolescent population that experiences a particularly high level of stress due to their
rigorous academic demands. Specifically, this study explored the psychometric properties of a
modified self-report eustress measure in the general AP/IB student population, as well as in
different subgroups within the sample. Additionally, this study brought together hypothesized
and existing correlates of eustress and examined their relationship within this population. Last,
this study examined the relationship between eustress and important student outcomes, namely
academic and emotional success. This section summarizes the results of the analyses performed
and discusses key findings for each research question including in the context of existing
literature. The implications of the results, including the limitations of the study and directions for
future research are discussed.
Measuring Eustress within Adolescents in Rigorous Academic Programs
Since eustress is a relatively understudied concept, measurement is an important first step
in further studying and applying eustress in real world practices. To date, there are no published
measurement tools that have been developed for adolescents, or researched in adolescents. To
fill this gap, this study explored the psychometric properties of an existing eustress measure—the
Eustress Scale (O’Sullivan, 2011)—which was modified (i.e., reduced in item length) to be used
with adolescents.
100
Results from a confirmatory factor analysis showed that all five items on the modified
Eustress Scale mapped onto the construct of eustress substantially (standardized factor loadings
between 0.59 and 0.89). This supports all five retained items as valid indicators of eustress in this
population; no item was found to be extraneous or unrelated to eustress. In addition to the factor
loadings of the items, the unidimensional factor structure of the Eustress Scale was explored
within the total sample of AP/IB students. Four model fit indices were examined as pieces of
evidence to assess the goodness of fit of this measure. Model fit indices are not black and white,
and different data considerations (e.g., sample size, number of items on a measure) must be
considered when reviewing these indices. For the total sample, two of the four fit indices that are
relatively independent of sample size and number of items (SRMR and CFI) indicated that the
five-item eustress measure was close to, or achieved adequate fit. Within the total student
sample, the internal consistency reliability for the Eustress Scale fell within the acceptable range
(.85). Test-retest reliability was not examined due to the cross-sectional nature of the data.
Taken together, this study found initial support for the psychometric properties of the
five-item Eustress Scale in AP and IB students, with regard to reliability and factorial validity.
The reliability of the eustress measure fell within the acceptable range, but further studies should
explore the consistency of the measure when it is administered at different times. To examine
validity, this study explored the internal structure component of validity as indicated in the
Standards for Educational and Psychological Testing (2014), through factor loadings and model
fit indices. In examining indicators of both reliability and validity, this study provides support
that the five-item modified Eustress Scale has adequate psychometric properties when used to
assess eustress in adolescents in AP classes or the IB program. These results are consistent with
101
the hypothesis posited by this study that eustress can be reliability measured in adolescents using
an adapted version of a eustress measure that previously yielded acceptable psychometric
properties (O’Sullivan, 2011).
Measuring Eustress within Gender, Grade Level, and Program Subgroups
In addition to examining the model fit of the modified (5-item) Eustress Scale in the total
sample of AP/IB students, this study explored the model fit of the modified Eustress Scale in
different subgroups, namely by gender, grade level, and program. This was done to confirm that
the model fit of the total sample was representative of different subgroups by exploring if vast
differences in model fit existed within different groups. With regard to gender, there was
relatively little difference with the fit indices for males and females, as compared to the total
sample. This indicates that by taking into account only gender for AP/IB students, the model fit
is relatively the same. When grade (9, 10, 11, 12) is taken into account, there was a slight change
in one of the fit indices, which indicated that the model fit is best in 11th grade students (CFI=
0.95), and worse in 10th grade students (CFI=0.84). In regards to program, the model fit also had
a slight differentiation in one of the model indices that indicted that the eustress measure had a
better fit for students in the IB program (CFI= 0.97) than students taking AP classes (CFI=0.87).
Even though small differences emerged, overall the model fit indices for the total group were
relatively similar to the model fit indices among the subgroups.
To extend the understanding of eustress in different groups, a multiple regression was
performed to detect any significant differences in eustress in regards to gender, grade, and
program. This study employed a purely exploratory approach for this research question since
there were no previous studies of eustress in adolescents on which to base a hypothesis. Results
102
indicated that there were no statistically significant gender differences in eustress levels among
AP/IB students, and there were also not significant differences in eustress levels among students
in different programs, i.e. AP or IB. However, a significant difference in eustress was found for
students in different grade levels. Students in older high school grade levels reported
significantly higher levels of eustress. There are a few possible factors that may explain this
trend. First, with more experience in AP/IB classes throughout the years, students may incur
success experiences in this setting that increase their self-efficacy in their ability to handle
academic tasks. Since they have risen to the academic demands in past classes, students may
perceive new academic tasks with more knowledge on how to be successful and feel greater
confidence in their abilities. Second, as students progress in their high school career, they may be
able to take classes that are of personal interest, such as AP Psychology, so the tasks associated
with that class may be intrinsically interesting and therefore perceived as more of a challenge
than an obstacle. It is also worth noting that this increase in eustress throughout the grade levels
could be due to survivorship bias. In a school setting, survivorship bias relates to the fact that the
students taking AP/IB classes in higher grades are those who had higher eustress initially, and
those with lower eustress stopped taking higher levels courses and effectively removed
themselves from the sample.
Of note, gender, grade, and program only explained 1.3% of the variance in eustress
among this sample of AP/IB students. These three factors, which are generally fixed, explain
very little of the difference in eustress between students. Since 98.7% of the variance in eustress
is unexplained, it is possible that eustress is explained by factors that are potentially malleable,
103
e.g., coping strategies, as well as factors that are non-malleable, e.g., ethnicity, that were not
explored in this model.
Correlates of Eustress
To better understand the concept of eustress in relation to other variables in the target
population, a nomological network of potential correlates was explored including distress,
engagement, coping, self-efficacy, flow, and grit. This analysis also helped to explore another
component of validity, namely relationships to other variables (AERA, APA, & NCME, 2014).
Previous research on eustress and distress has posited that the constructs are distinct, but
that they are also able to occur in the same context (Le Fevre, Kolt, & Matheny, 2006; Nelson &
Simmons, 2011). Going off this conceptualization, some researchers have measured both
eustress and distress with their participants (Cavanaugh et al., 2000), but the relationship
between these two constructs has not been analyzed. For this study, the researcher predicted that
eustress and distress would have an inverse relationship, due to the opposite nature of the
constructs they represent. Results from analysis show that eustress and distress have a
significant, albeit small, inverse relationship (r = -.09, p < .001). These results fall in line with
the posited hypothesis, and support the notion that eustress and distress are distinct constructs,
and not opposite ends of a stress spectrum. This theoretical notion has been accepted in the
literature, but this study provides quantitative data to support this relationship among youth.
The next relationship explored in this study was between eustress and student
engagement. Prior studies found a positive correlation between eustress and engagement
(Mesurado et al., 2016), thus it was hypothesized that eustress would continue to demonstrate a
positive relationship with engagement in an adolescent sample. Both affective engagement and
104
cognitive engagement demonstrated a positive relationship with eustress. Out of the different
subscales representing engagement, the Attitudes Towards Teachers subscale had the highest
correlation with eustress (r = .26, p < .001). It is possible that a student’s perception of their
teacher as supportive and promoting improvement, influences how they perceive academic tasks
as either an obstacle or a challenge. This finding warrants further investigating as a possible
target to influence eustress in adolescents.
Coping was another variable examined in the nomological network of eustress. The
emotion-focused coping strategies were found to be weakly related to eustress or to have an
inverse relationship with eustress. Both problem-focused coping strategies, time and task
management and cognitive reappraisal, had a moderate positive relationship with eustress, with
cognitive reappraisal having the largest effect size (r = .29, p < .001). These findings are
congruent with previous research by McGowan and colleagues (2006) and Lepine, Podsakoff,
and Lepine (2005), which found that eustress has a positive relationship with task/problem-
focused coping strategies, and a small to non-existent relationship with emotion-focused coping
strategies. Conceptually, it seems that eustress and cognitive reappraisal both involve mindset,
therefore coping with stress through cognitive reappraisal could be a plausible target to increase
eustress. This could also open the doorway for other mindset reappraisal strategies, possibly
from positive psychology and mindfulness, to be pathways to increasing eustress. These ideas
are in need of further research given the cross-sectional, observational nature of the current
study.
The relationship between self-efficacy and eustress was explored in previous studies.
O’Sullivan (2011) found a positive correlation between eustress and self-efficacy in college-aged
105
students. A similar relationship between eustress and self-efficacy was predicted to occur due to
the commonality of college-level academic demands. Results showed that the effect size between
eustress and self-efficacy was moderate and positive in AP/IB youth (r=.26, p < .001), with an
association of similar size to the magnitude observed in college-aged students (r=.21, p < .05).
Across age groups, self-efficacy may be linked to eustress because it is a factor that might help
an individual appraise a stressor more positively.
Flow has been touted as the ultimate eustress experience (Mesurado et al., 2016), so it
was hypothesized that flow and eustress would have a significant positive relationship. This
notion by Mesurado and colleagues (2016) that eustress and flow were highly related, was
supported by the fact that flow had the largest effect size with eustress (r = .34, p < .001)
compared to all other correlates. Future studies should examine the direction of the flow eustress
relationship.
No other studies have explored the relationship between eustress and grit, but the
theoretically similar construct, hardiness, was related to eustress. Therefore, it was hypothesized
that grit and eustress would have a positive relationship. As expected, grit and eustress had a
small to moderate, positive relationship (r = .20, p < .001). Tasks that require continual work
throughout the year, e.g., the IB extended essay, may be less daunting, and perceived more
positively, by students who have the stamina to persist through tasks whether they take weeks,
months or years.
Overall, all the relationships between eustress and potential correlates were significant,
and fit the hypothesizes that were based on prior research with adults. Eustress had the strongest
association with flow, and the weakest association with the emotion-focused coping strategy, talk
106
to classmates and friends. There was only a negative relationship between eustress and distress,
and the emotion-focused coping strategy, deterioration. Examining the nomological network of
eustress supported the validity of the eustress measure since it produced relationships that were
conceptually sound, and it also uncovered some associations with variables that could be
examined as targets in future intervention development studies that aim to foster eustress in
AP/IB youth.
Relationship between Eustress and Student Outcomes
Previous research has supported positive relationships between eustress and increased
work performance and positive psychology states (Hargrove, Nelson, & Cooper, 2013). Thus, it
was hypothesized that higher eustress would co-occur with higher scores on positive indicators
of academic success (GPA) and emotional success (life satisfaction). It was also hypothesized
that eustress would have a negative relationship with undesirable emotional indicators
(psychopathology and school burnout).
As predicted, eustress was a significant positive predictor of GPA and life satisfaction,
and a negative predictor of burnout and psychopathology. This falls in line with previous
literature that eustress is associated with positive outcomes and negatively associated with
undesirable outcomes. For GPA, life satisfaction, and psychopathology, between 3% to 5% of
the variance was explained by gender, grade, program and eustress, but the model became non-
significant when eustress was removed. Eustress had a small effect on life satisfaction and
psychopathology, likely because these are constructs that have a wide breadth of factors that
influence how they manifest. GPA is more confined to the school realm, but that is likely
influenced by previous academic experience, e.g., middle school performance, which was not
107
accounted for in the model. However, for school burnout, all predictors were significant
(negative coefficient of eustress, positive coefficient for gender, grade, and program), and the
full model explained 10% of the variance in school burnout, which is double the amount of
variance explained in the other outcomes. Without eustress, the model was still significant, but
only 4.3% of the variance in school burnout was explained. School burnout is a more confined
construct and is influenced more by school-related stress, and current school-related factors than
the other outcomes. The current study can not isolate the directionality of the relationships
between eustress and those variables conceptualized as outcomes. But, if level and change in
eustress does influence these outcomes, even small gains in GPA and mental health (life
satisfaction, psychopathology), attributable to eustress, would be clinically and educationally
important. Further, increasing eustress might one day be shown to be a promising avenue in
reducing burnout in students taking rigorous classes. Reduced burnout is advantageous in that it
may help students continue to pursue higher levels of education and not be dissuaded from
academic experiences with high level academic tasks, e.g. writing a dissertation, because they
have become burnt out by school. Increasing eustress may be a way that students are not limited
in their academic potential by a negative emotional state.
Implications for School Psychologists
The popularity of the IB program and AP classes are on the rise in high school, and it is
documented that these students experience more (dis)stress than students in traditional high
school classes (Suldo et al., 2018). Stress is a major factor that school psychologists will be
called upon to address in these students. This study provides some insights into ways that the
concept of eustress is relevant to AP/IB students.
108
First, this study advances a psychometrically sound measure that can be used to assess
eustress in school-based assessments. Many school psychologists are called upon to select
appropriate measures for both screening and targeted assessments. For tier 1, the modified
Eustress Scale is brief enough (only five items) that it might lend well to universal screening.
This measure is easily scored and interpreted, and can be used to gauge the eustress level of the
whole school, or certain grade levels. At the selective level (tiers 2 and 3), this measure might be
part of a myriad of tools used to identify why students are struggling with AP/IB classes.
Second, since eustress was seen to increase by grade level, it might be useful to have a
mentoring program that connects younger students with older students to promote eustress. In
these mentoring meetings, the older students can share the ways they acclimated to the workload
of AP/IB classes and share strategies for challenging stress positively. By sharing these lessons
with students early in their high school career, younger students may develop a positive
conceptualization of stress in earlier grades and employ this mindset in high school longer.
Third, some of the correlates of eustress that were positively associated with eustress,
e.g., task-focused coping strategies, affective engagement, are also associated with other positive
outcomes (Suldo et al., 2018). Encouraging students to engage in these behaviors may have an
added bonus of increasing their eustress, an idea that can be examined in future longitudinal and
experimental research.
Last, eustress is a significant predictor of academic and emotional outcomes, including
mental health, course grades, and especially school burnout. The establishment of links between
eustress and salient student outcomes provides further rationale for attending to eustress in
research and practice. With regard to practice, it is possible that students who take accelerated
109
courses and do not experience much eustress may feel burnt-out and not choose to pursue post-
secondary education. Given societal trends that generally encourage higher education, increasing
eustress could be a way to accomplish that goal. It could be useful to increase eustress, so that
students can continue to utilize their advanced academic skills in post-secondary education
without being limited by feelings of burnout.
Contributions to the Literature
This study contributes to the eustress literature by bolstering previous findings and
providing new insights from a previously under-studied population. The literature base for
eustress is growing, but many of the previous studies of eustress are theoretical and/or limited to
the occupational realm. This concept of positive stress is ripe for expansion to other groups for
whom stress is particularly salient.
From this study of eustress in AP/IB youth, several findings from the previous eustress
literature were extended to this population as well. First, a fundamental similarity between
findings from this study to findings in existing literature is that eustress and distress are distinct
constructs and are not opposite ends of a spectrum (Le Fevre, Kolt, & Matheny, 2006; Nelson &
Simmons, 2011). The correlation found between eustress and distress showed that they are
weakly related, providing support that these are not highly related constructs. With eustress and
distress being distinct factors, it is logical to expect that interventions for combating distress may
not automatically result in increasing eustress. This underscores the need for separate
interventions to increase eustress in students. Also, similar relationships between eustress and
other correlates were found in this population of adolescents. Previous research found positive
relationships between eustress and self-efficacy, engagement, task-focused coping, and flow
110
(McGowan et al., 2006; Mesurado et al., 2016; O’Sullivan, 201); the same relationships were
found to be significant in this sample, demonstrating that eustress is related to the same factors
for youth and adults. In relation to outcomes, Hargrove, Nelson and Cooper (2013) found
support for relationships between eustress and good health, well-being, and positive job
performance in people considered to be in stressful positions. Those findings illustrate that even
in populations with high stress levels, people can still view stress positively and manifest
positive psychology states. This study also found positive relationship between eustress and
desirable outcomes, namely higher life satisfaction and GPA in AP/IB youth. This same
phenomenon of high stress levels being able to translate to positive outcomes may also be
applicable to AP/IB students. This bolsters the notion from prior research that eustress is related
to positive outcomes.
This study also contributes to research by building upon the available measurement tools.
Currently, only three quantitative self-report measurement tools exist to gather eustress data. The
Index of Sources of Stress in Nursing Students (ISSN) and the Valencia Eustress-Distress
Appraisal Scale (VEDAS) are both longer measures (ranging between 29-34 items) and intended
to be used for a specific population. O’Sullivan (2011) created a shorter measurement tool (15
items) that was able to be used more generally. To translate measures into the education field,
there is a need for tools that are developmentally appropriate, can be administered quickly, and
are easily interpreted. This study provided data that support the use of the modified five-item
Eustress Scale with adolescents. Several aspects of reliability and validity of this measure were
found to be acceptable in this sample of AP/IB students. In the realm of measurement, there is
now an additional self-report eustress measure that can be used with adolescents, in particular
111
those in accelerated courses. Having this additional measurement tool may pave the way for
further study of eustress in this population. Data analyses provided initial insight into the levels
of eustress related to gender, gravel level, and academic program, which can be expanded upon
in further studies.
Limitations
There were several limitations to this study that should be noted. First, the
generalizability of these findings may be limited since this sample consisted of participants from
a single southeastern state. While this sample was diverse in race/ethnicity and district type, e.g.,
urban, suburban, rural, there may be unaccounted variance related to regional differences. For
example, there may be different entry requirements for AP/IB classes in different states, which
could create a population with different characteristics than the one in this study. With this study
as a foundation for bringing eustress into education, a more national sample would be preferred
to determine if there are different trends in eustress in AP/IB in other states. Second, the data
gathered were non-experimental, so analyses were limited to correlational findings. This
researcher was unable to manipulate any variables to test causal relationships. While these
analyses pave the way for experimental studies, key findings and recommendations from this
study are based on non-causal relationships and should be interpreted as such. Third, since this
was an archival dataset, decisions points were reached regarding constructs for analysis. In this
archival dataset, there were constructs that were not available for analysis, specifically, certain
positive psychology states, e.g., positive affect, optimism. Conversely, there were other
constructs present in the archival dataset, e.g., ethnicity, AP/IB exam performance, that were not
analyzed. With a large archival dataset, a manageable number of constructs that were available
112
and consistent with previous literature were chosen for analysis. Future studies should expand
the nomological network of eustress by analyzing different constructs in relation to eustress.
Fourth, the data was only gathered at one time point, so changes in eustress and its different
correlates were not able to be measured. It is important to assess relationships both at a single
time point, and over time. For example, it was found in this study that eustress levels are
significantly different across grade levels. Longitudinal data analysis would be a way to uncover
how these eustress levels change over time in the same students. Also, related to student
outcomes, it would be beneficial to see how eustress affect student’s progression through AP/IB
education.
Summary and Future Directions
In sum, the current study adds to the existing literature on eustress by studying this
construct in a new population, namely youth in AP/IB classes. Results from the study advanced a
five-item eustress measure that was found to have adequate reliability and validity in a large
sample of AP/IB students. To initially understand how eustress presents in high school aged
youth, levels of eustress were examined by gender, grade and program. Only a significant
difference in eustress was found between grade levels. A nomological network of theoretical and
previous correlates of eustress was explored in this population. Consistent with previous
literature, eustress had a significant positive relationship with task-focused coping, engagement,
self-efficacy, flow, and grit. Eustress had a negative relationship with distress and emotion-
focused coping. These analyses provide the first look at correlates of eustress in an adolescent
population. Last, eustress was a significant positive predictor of positive indicators of success,
GPA and life satisfaction, and a significant negative predictor of indicators of undesirable
113
outcomes, school burnout and psychopathology. While eustress only accounted for a small
amount of variance in these different outcomes, these analyses show that eustress may contribute
a small piece of the puzzle in academic and emotional success in AP/IB students.
Given that this is the first study to investigate eustress in an adolescent population, there
are several future directions for research. First, this cross-sectional data provided foundational
research for eustress in adolescents, but future studies should investigate eustress in AP/IB youth
longitudinally. The test-retest reliability of the eustress measure was not able to be computed due
to fact that data were only collected at one time. Also, exploring developmental trends in eustress
over time may provide valuable information related to the manifestation of eustress through
internal or environmental factors. Future studies should look to collect a longitudinal data set of
eustress on students every year in high school. Second, to expand the understanding of eustress,
future researchers should use cognitive interviewing techniques to explore how youth interpret
items on the Eustress Scale. Gathering qualitative data will allow researchers to further explore
how adolescents attribute meaning to items within the Eustress Scale. Third, while it is
documented that AP/IB student experience heightened levels of stress, adolescents not in
advanced classes also experience life stressors (Byrne et al., 2007). Future studies should explore
the psychometric properties of the modified eustress measure in adolescents in traditional
classes. It would be interesting to determine if the modified eustress measure is appropriate for
all adolescents, and if there are different trends in eustress between AP/IB youth and youth in
traditional classes. Last, this quantitative study suggests targets to be explored in future research
on intervention strategies for increasing eustress. Intervention strategies from different

114
disciplines, e.g., positive psychology, should be vetted theoretically and then experimentally
tested with adolescents.
115
REFERENCES
Abuhamdeh, S., Nakamura, J., & Csikszentmihalyi, M. (2005). Flow. In AJ Elliot & C. Dweck.
Handbook of Competence and Motivation, pp. 598-608. New York: Guilford
Publications.
Achenbach, T. M., & Rescorla, L. (2001). Manual for the Achenbach system of empirically
based assessment school-age forms profiles. Burlington, VT: ASEBA.
American Educational Research Association, American Psychological Association, & National
Council on Measurement in Education. (2014). Standards for educational and
psychological testing. Washington, DC: American Educational Research Association.
American Psychological Association, (2002). Glossary of Psychological Terms: Stress.
Retrieved from http://www.apa.org/research/action/glossary.aspx.
Artinian, B. M., & Conger, M. M. (1997). The intersystem model: Integrating theory and
practice. Thousand Oaks, California: Sage.
Bandura, A. (2006). Guide for constructing self-efficacy scales. Self-Efficacy Beliefs of
Adolescents, 5, 307-337.
Bhat, R. M., Sameer, M. K., & Ganaraja, B. (2011). Eustress in education: Analysis of the
perceived stress score (PSS) and blood pressure (BP) during examinations in medical
students. Journal of Clinical and Diagnostic Research, 5(7), 331-1335.
Byrne, D. G., Davenport, S. C., & Mazanov, J. (2007). Profiles of adolescent stress: The
116
development of the adolescent stress questionnaire (ASQ). Journal of Adolescence, 30(3),
393-416.
Cavanaugh, M. A., Boswell, W. R., Roehling, M. V., & Boudreau, J. W. (2000). An empirical
examination of self-reported work stress among US managers. Journal of Applied
Psychology, 85(1), 65-74.
Cohen, S., Kamarck, T., & Mermelstein, R. (1983). A global measure of perceived
stress. Journal of Health and Social Behavior, 24(4), 385-396.
Cohen, S., Kessler, R. C., & Gordon, L. U. (1995). Strategies for measuring stress in studies of
psychiatric and physical disorders. In Measuring Stress: A Guide for Health and Social
Scientists (pp. 3-26). New York: Oxford University Press.
Cohen, R. A. (2011). Yerkes–Dodson law. In Encyclopedia of Clinical Neuropsychology (2737-
2738). New York: Springer.
Connelly, B. S., Ones, D. S., & Chernyshenko, O. S. (2014). Introducing the special section on
openness to experience: Review of openness taxonomies, measurement, and nomological
net. Journal of Personality Assessment, 96(1), 1-16.
College Board (2003). A brief history of the advanced placement program. Retrieved from
http://www.collegeboard.com/prod_downloads/about/news_info/ap/ap_history_english.p
df.
Crocker, L., & Algina, J. (1986). Introduction to classical and modern test theory. Orlando:
Holt, Rinehart and Winston.
Curry, L. A., Snyder, C. R., Cook, D. L., Ruby, B. C., & Rehm, M. (1997). Role of hope in
117
academic and sport achievement. Journal of Personality and Social Psychology, 73(6),
1257-1267.
Dedrick, R. F., Shaunessy-Dedrick, E., Suldo, S. M., & Ferron, J. M. (2015). Psychometric
properties of the school attitude assessment survey–revised with international
baccalaureate high school students. Gifted Child Quarterly, 59(1), 38-54.
Duckworth, A. L., Peterson, C., Matthews, M. D., & Kelly, D. R. (2007). Grit: perseverance and
passion for long-term goals. Journal of Personality and Social Psychology, 92(6), 1087-
1101.
Duckworth, A. L., & Quinn, P. D. (2009). Development and validation of the short grit scale
(GRIT–S). Journal of Personality Assessment, 91(2), 166-174.
Folkman, S., & Lazarus, R. S. (1988). Coping as a mediator of emotion. Journal of Personality
and Social Psychology, 54(3), 466-475.
Fredricks, J. A., Blumenfeld, P. C., & Paris, A. H. (2004). School engagement: Potential of the
concept, state of the evidence. Review of Educational Research, 74(1), 59-109.
George, D., & Mallery, M. (2010). SPSS for windows step by step: A simple guide and
reference, 17.0 update (10a ed.) Boston: Pearson.
Gerrig, R. J. & Zimbardo, P.G. (2002). Glossary of psychological terms. Psychology and life
(16th ed.). Boston: Allyn and Bacon.
Gibbons, C., Dempster, M., & Moutray, M. (2008). Stress and eustress in nursing
students. Journal of Advanced Nursing, 61(3), 282-290.
Gibbons, C., Dempster, M., & Moutray, M. (2009). Index of sources of stress in nursing
118
students: A confirmatory factor analysis. Journal of Advanced Nursing, 65(5), 1095-
1102.
Golden-Kreutz, D. M., Browne, M. W., Frierson, G. M., & Andersen, B. L. (2004). Assessing
stress in cancer patients: A second-order factor analysis model for the perceived stress
scale. Assessment, 11(3), 216-223.
Hargrove, M. B., Nelson, D. L., & Cooper, C. L. (2013). Generating eustress by challenging
employees. Organizational Dynamics, 42(1), 61-69.
Hess, R. S., & Copeland, E. P. (2001). Students' stress, coping strategies, and school completion:
A longitudinal perspective. School Psychology Quarterly, 16(4), 389-405.
Hu, L. T., & Bentler, P. M. (1998). Fit indices in covariance structure modeling: Sensitivity to
underparameterized model misspecification. Psychological Methods, 3(4), 424-453.
Huebner, E. S. (1991). Initial development of the student's life satisfaction scale. School
Psychology International, 12(3), 231-240.
International Baccalaureate Organization. (2018). Facts about IB programmes and schools.
Retrieved from https://www.ibo.org/about-the-ib/facts-and-figures/.
Jackson, S. A., Martin, A. J., & Eklund, R. C. (2008). Long and short measures of flow: The
construct validity of the FSS-2, DFS-2, and new brief counterparts. Journal of Sport &
Exercise Psychology, 30(5), 561-587.
Kamphaus, R. W., & Reynolds, C. R. (2007). Behavior assessment system for children—
second edition (BASC–2): Behavioral and emotional screening system (BESS) manual.
Bloomington, MN: Pearson.
Kelly, D. R., Matthews, M. D., & Bartone, P. T. (2014). Grit and hardiness as predictors of
119
performance among West Point cadets. Military Psychology, 26(4), 327-342.
Kenny, D. A., Kaniskan, B., & McCoach, D. B. (2014). The performance of RMSEA in models
with small degrees of freedom. Sociological Methods & Research, 44(3), 486-507.
Lazarus, R. S., & Folkman, S. (1984). Stress, appraisal and coping. New York: Springer.
Le Fevre, M., Matheny, J., & Kolt, G. S. (2003). Eustress, distress, and interpretation in
occupational stress. Journal of Managerial psychology, 18(7), 726-744.
Le Fevre, M., Kolt, G. S., & Matheny, J. (2006). Eustress, distress and their interpretation in
primary and secondary occupational stress management interventions: Which way
first?. Journal of Managerial Psychology, 21(6), 547-565.
LePine, J. A., Podsakoff, N. P., & LePine, M. A. (2005). A meta-analytic test of the challenge
stressor–hindrance stressor framework: An explanation for inconsistent relationships
among stressors and performance. Academy of Management Journal, 48(5), 764-775.
Lienert, G. A., & Bäumler, G. (1994). A bivariate and nonparametric evaluation of the Yerkes-
Dodson law. Studia Psychologica, 36(2), 123-128.
MacCallum, R. C., Browne, M. W., & Sugawara, H. M. (1996). Power analysis and
determination of sample size for covariance structure modeling. Psychological Methods,
1(2), 130-149.
March, J. S., Parker, J. D., Sullivan, K., Stallings, P., & Conners, C. K. (1997). The
multidimensional anxiety scale for children (MASC): Factor structure, reliability, and
validity. Journal of the American Academy of Child & Adolescent Psychiatry, 36(4), 554-
565.
Martin, A. J., Tipler, D. V., Marsh, H. W., Richards, G. E., & Williams, M. R. (2006). Assessing
120
multidimensional physical activity motivation: A construct validity study of high school
students. Journal of Sport and Exercise Psychology, 28(2), 171-192.
McCoach, D. B., & Siegle, D. (2003). The school attitude assessment survey-revised: A new
instrument to identify academically able students who underachieve. Educational and
Psychological Measurement, 63(3), 414-429.
McGowan, J., Gardner, D., & Fletcher, R. (2006). Positive and negative affective outcomes of
occupational stress. New Zealand Journal of Psychology, 35(2), 92-98.
McKnight, C. G., Huebner, E. S., & Suldo, S. (2002). Relationships among stressful life events,
temperament, problem behavior, and global life satisfaction in adolescents. Psychology in
the Schools, 39(6), 677-687.
McNamara, S. (2000). Stress in young people: What's new and what to do. New York:
Continuum.
Mesler, R. (1996). A model of eustress: Health and healing at the individual level. (Order No.
9610745). Available from ProQuest Dissertations & Theses Global. (304083939)
Retrieved from https://search.proquest.com/docview/304083939?accountid=14745 .
Mesurado, B. (2008). Validez factorial y fiabilidad del cuestionario de experiencia óptima
(Flow) para niños y adolescentes [Factorial validity and reliability of the optimal
experience (flow) questionnaire for children and teenagers] Revista Iberoamericana de
Diagnóstico y Evaluación Psicológica, 25(1), 159–178.
Mesurado, B., Cristina Richaud, M., & José Mateo, N. (2016). Engagement, flow, self-efficacy,
and eustress of university students: A cross-national comparison between the Philippines
and Argentina. The Journal of Psychology, 150(3), 281-299.
121
Nelson, D. L., & Simmons, B. L. (2011). Savoring eustress while coping with distress: The
holistic model of stress. Handbook of occupational health psychology, 55-74.
Oksman, V., Ermes, M., & Kati, T. (2016). Eustress-findings concerning the indication and
interpretation of positive stress among entrepreneurs-a case study. The Business &
Management Review, 7(3), 342-347.
O’Sullivan, G. (2011). The relationship between hope, eustress, self-efficacy, and life
satisfaction among undergraduates. Social Indicators Research, 101(1), 155-172.
Renshaw, T. L., Eklund, K., Dowdy, E., Jimerson, S. R., Hart, S. R., Earhart, J., & Jones, C. N.
(2009). Examining the relationship between scores on the behavioral and emotional
screening system and student academic, behavioral, and engagement outcomes: An
investigation of concurrent validity in elementary school. The California School
Psychologist, 14(1), 81-88.
Reschly, A. L., & Christenson, S. L. (2012). Jingle, jangle, and conceptual haziness: Evolution
and future directions of the engagement construct. In Handbook of Research on Student
Engagement (pp. 3-19). Boston, MA: Springer.
Rodríguez, I., Kozusnik, M. W., & Peiro, J. M. (2013). Development and validation of the
valencia eustress-distress appraisal scale. International Journal of Stress Management,
20(4), 279–308.
Salanova, M., Schaufeli, W., Martínez, I., & Breso, E. (2010). How obstacles and facilitators
predict academic performance: The mediating role of study burnout and engagement.
Anxiety, Stress & Coping, 23(1), 53-70.
122
Salmela-Aro, K., Kiuru, N., Leskinen, E., & Nurmi, J. E. (2009). School burnout inventory (SBI)
reliability and validity. European Journal of Psychological Assessment, 25(1), 48-57.
Selye, H. (1975). Confusion and controversy in the stress field. Journal of Human Stress, 1(2),
37-44.
Selye, H. (1987). Stress without distress. London: Transworld.
Simmons, B. L., & Nelson, D. L. (2001). Eustress at work: The relationship between hope and
health in hospital nurses. Health Care Management Review, 26(4), 7-18.
Snyder, C. R., Lopez, S. J., Shorey, H. S., Rand, K. L., & Feldman, D. B. (2003). Hope theory,
measurements, and applications to school psychology. School Psychology Quarterly,
18(2), 122-139.
Snyder, C. R., Sympson, S. C., Ybasco, F. C., Borders, T. F., Babyak, M. A., & Higgins, R. L.
(1996). Development and validation of the State Hope Scale. Journal of Personality and
Social Psychology, 70(2), 321-325.
Suldo, S.M., Shaffer, E., Michalowski, J., Farmer, J., Riley, K., Friedrich, A., Dixon, J.,
Metellus, N., & Merrifield, H. (2008). Looking beyond psychopathology: The dual-factor
model of mental health in youth. School Psychology Review, 37(1), 52-68.
Suldo, S. M., Shaunessy, E., Thalji, A., Michalowski, J., & Shaffer, E. (2009). Sources of stress
for students in high school college preparatory and general education programs: Group
differences and associations with adjustment. Adolescence, 44(176), 925-948.
Suldo, S. M., & Shaunessy-Dedrick, E. (2013). The psychosocial functioning of high school
students in academically rigorous programs. Psychology in the Schools, 50(8), 823 –843.
doi: 10.1002/pits.21708.
123
Suldo, S. M., Dedrick, R. F., Shaunessy-Dedrick, E., Fefer, S.A., & Ferron, J. (2015a).
Development and initial validation of the coping with academic demands scale (CADS):
How students in accelerated high school curricula cope with school-related stressors.
Journal of Psychoeducational Assessment, 33(4), 357-374. doi:
10.1177/0734282914552165
Suldo, S. M., Dedrick, R. F., Shaunessy-Dedrick, E., Roth, R. A., & Ferron, J. (2015b).
Development and initial validation of the student rating of environmental stressors scale:
Stressors faced by students in accelerated high school curricula. Journal of
Psychoeducational Assessment, 33(4), 339-356.
Szabo, S., Tache, Y., & Somogyi, A. (2012). The legacy of Hans Selye and the origins of stress
research: A retrospective 75 years after his landmark brief “letter” to the editor of
nature. Stress, 15(5), 472-478.
Teigen, K. H. (1994). Yerkes-dodson: A law for all seasons. Theory & Psychology, 4(4), 525-
547.
Van der Klink, J. J., Blonk, R. W., Schene, A. H., & Van Dijk, F. J. (2001). The benefits of
interventions for work-related stress. American Journal of Public Health, 91(2), 270-276.
Vroom, V. H. (1964). Work and motivation. New York: John Wiley & Sons.
Ware, J. E., Davies-Avery, A., & Donald, C. A. (1978). Conceptualization and measurement of
health for adults in the health insurance study. In General health perceptions vol. V, (479-
469) Santa Monica, CA: Rand Corporation.
124
Watson, D., Clark, L. A., & Tellegen, A. (1988). Development and validation of brief measures
of positive and negative affect: The PANAS scales. Journal of Personality and Social
Psychology, 54(6), 1063-1070.
Westman, M., & Eden, D. (1996). The inverted-U relationship between stress and performance:
A field study. Work & Stress, 10(2), 165-173.

125
APPENDICES
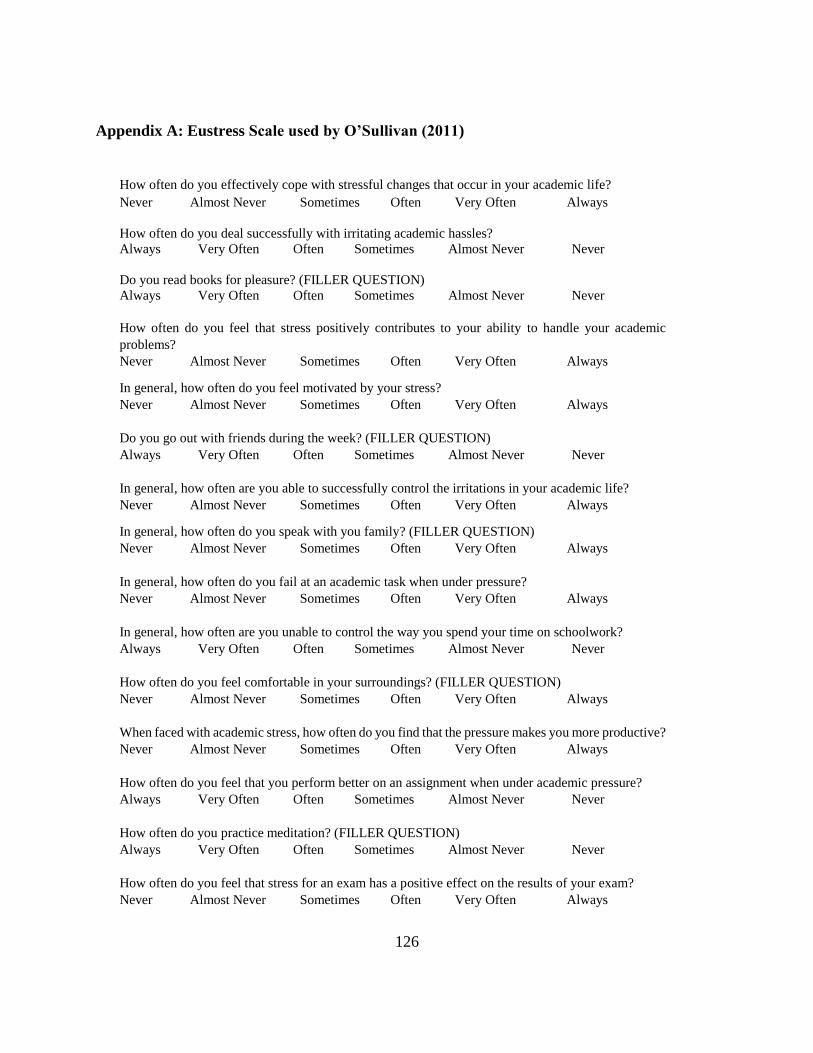
126
Appendix A: Eustress Scale used by O’Sullivan (2011)
How often do you effectively cope with stressful changes that occur in your academic life?
Never Almost Never Sometimes Often Very Often Always
How often do you deal successfully with irritating academic hassles?
Always Very Often Often Sometimes Almost Never Never
Do you read books for pleasure? (FILLER QUESTION)
Always Very Often Often Sometimes Almost Never Never
How often do you feel that stress positively contributes to your ability to handle your academic
problems?
Never Almost Never Sometimes Often Very Often Always
In general, how often do you feel motivated by your stress?
Never Almost Never Sometimes Often Very Often Always
Do you go out with friends during the week? (FILLER QUESTION)
Always Very Often Often Sometimes Almost Never Never
In general, how often are you able to successfully control the irritations in your academic life?
Never Almost Never Sometimes Often Very Often Always
In general, how often do you speak with you family? (FILLER QUESTION)
Never Almost Never Sometimes Often Very Often Always
In general, how often do you fail at an academic task when under pressure?
Never Almost Never Sometimes Often Very Often Always
In general, how often are you unable to control the way you spend your time on schoolwork?
Always Very Often Often Sometimes Almost Never Never
How often do you feel comfortable in your surroundings? (FILLER QUESTION)
Never Almost Never Sometimes Often Very Often Always
When faced with academic stress, how often do you find that the pressure makes you more productive?
Never Almost Never Sometimes Often Very Often Always
How often do you feel that you perform better on an assignment when under academic pressure?
Always Very Often Often Sometimes Almost Never Never
How often do you practice meditation? (FILLER QUESTION)
Always Very Often Often Sometimes Almost Never Never
How often do you feel that stress for an exam has a positive effect on the results of your exam?
Never Almost Never Sometimes Often Very Often Always
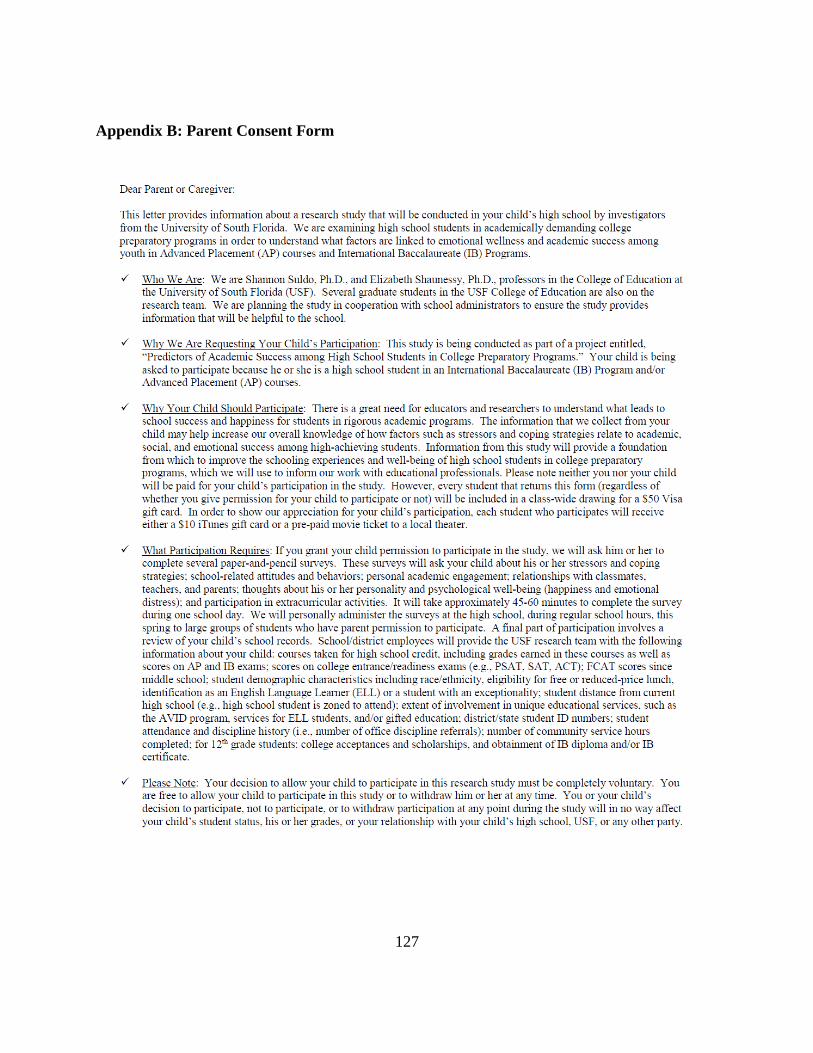
127
Appendix B: Parent Consent Form
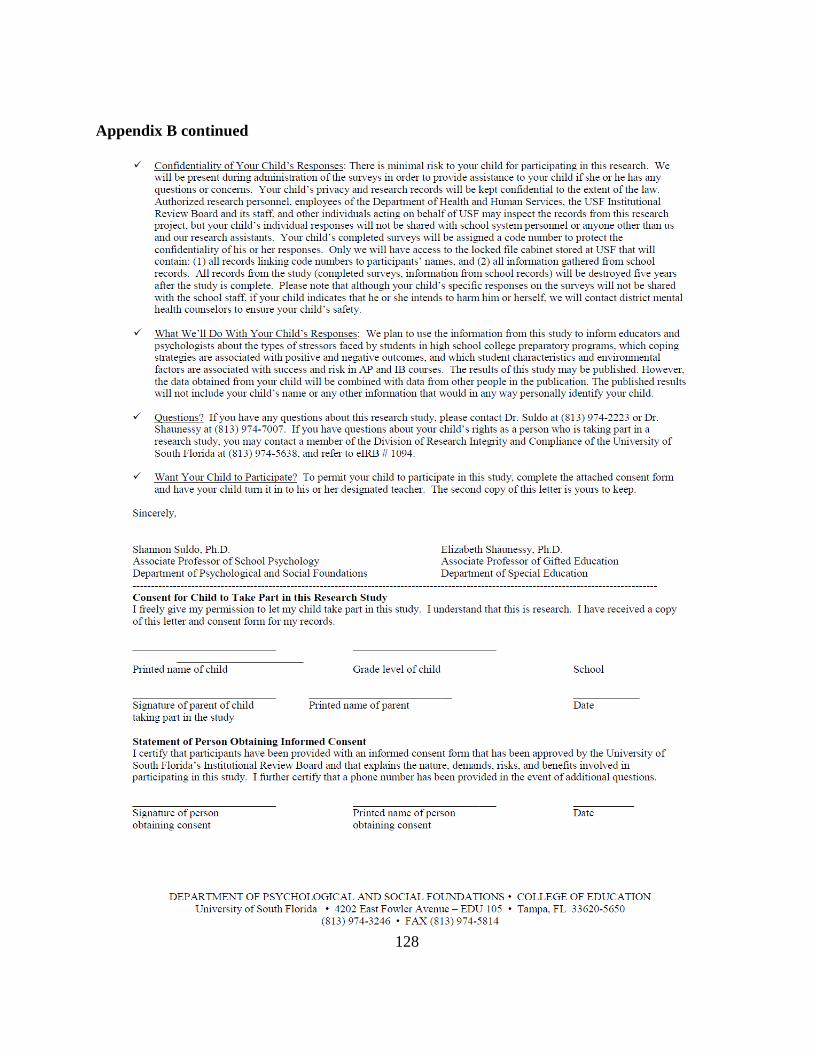
128
Appendix B continued
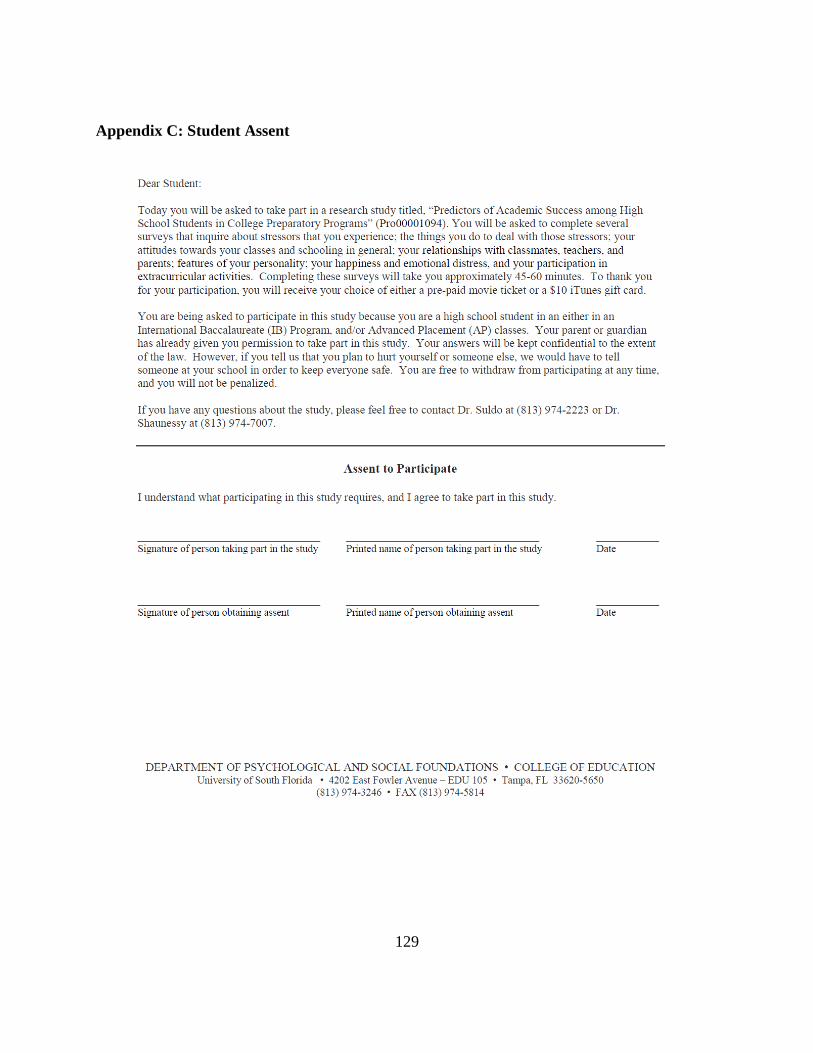
129
Appendix C: Student Assent
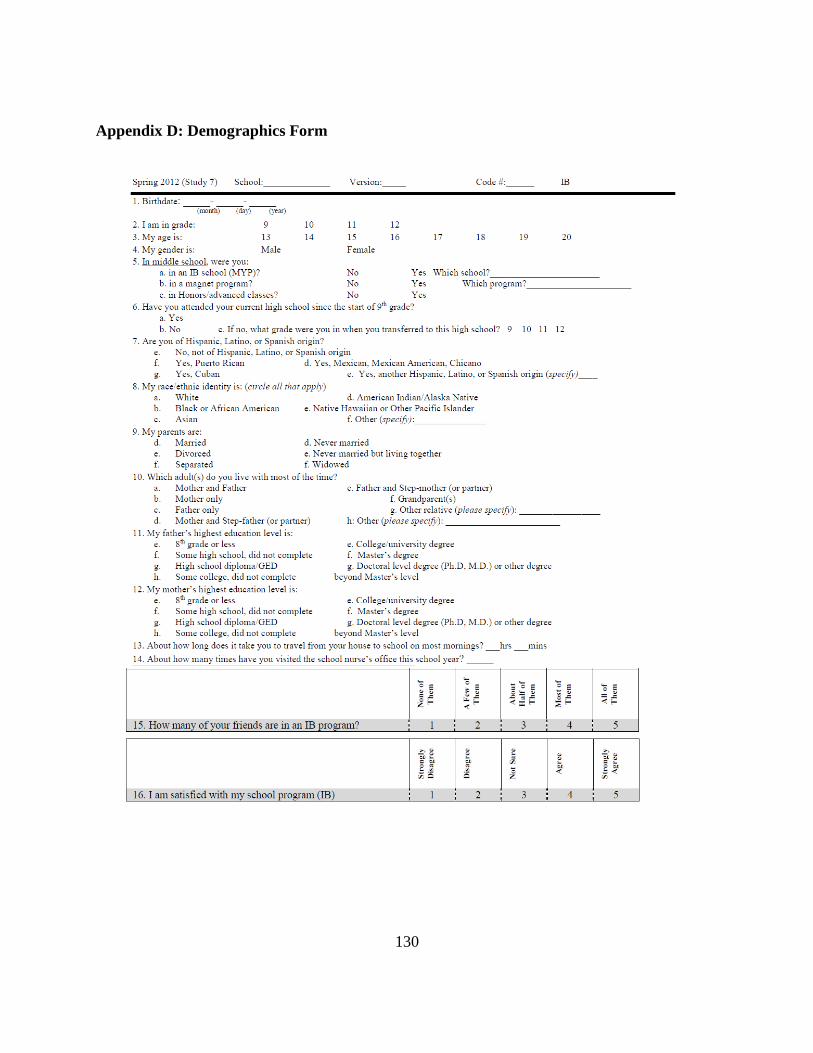
130
Appendix D: Demographics Form
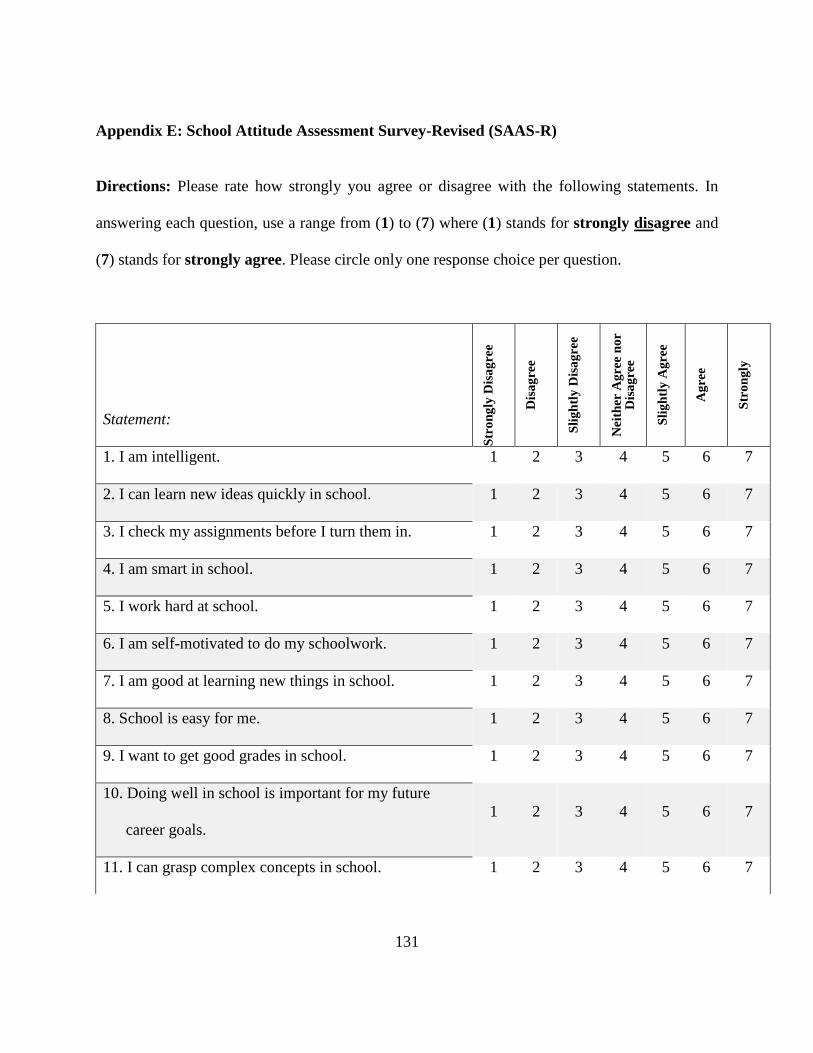
131
Appendix E: School Attitude Assessment Survey-Revised (SAAS-R)
Directions: Please rate how strongly you agree or disagree with the following statements. In
answering each question, use a range from (1) to (7) where (1) stands for strongly disagree and
(7) stands for strongly agree. Please circle only one response choice per question.
Statement:
Str
on
gly
Dis
ag
ree
Dis
ag
ree
Sli
gh
tly
Dis
ag
ree
Nei
ther
Ag
ree
no
r D
isa
gre
e
Sli
gh
tly
Ag
ree
Ag
ree
Str
on
gly
Ag
ree
1. I am intelligent. 1 2 3 4 5 6 7
2. I can learn new ideas quickly in school. 1 2 3 4 5 6 7
3. I check my assignments before I turn them in. 1 2 3 4 5 6 7
4. I am smart in school. 1 2 3 4 5 6 7
5. I work hard at school. 1 2 3 4 5 6 7
6. I am self-motivated to do my schoolwork. 1 2 3 4 5 6 7
7. I am good at learning new things in school. 1 2 3 4 5 6 7
8. School is easy for me. 1 2 3 4 5 6 7
9. I want to get good grades in school. 1 2 3 4 5 6 7
10. Doing well in school is important for my future
career goals.
1 2 3 4 5 6 7
11. I can grasp complex concepts in school. 1 2 3 4 5 6 7
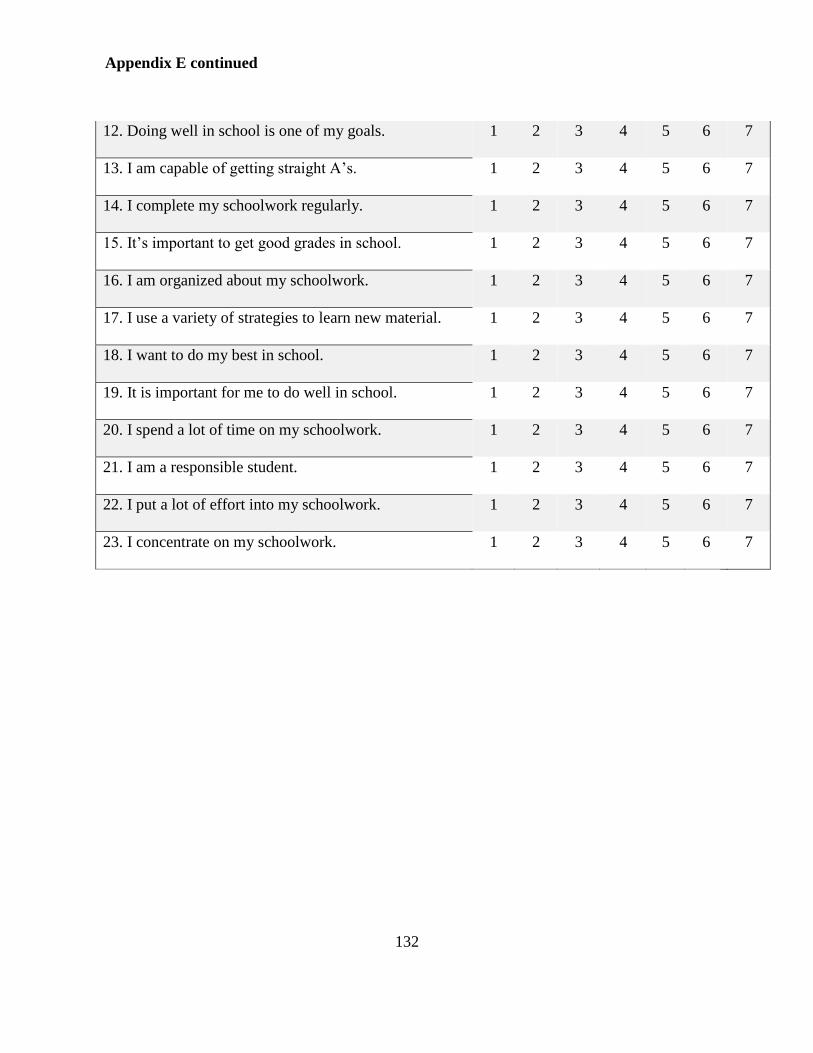
132
12. Doing well in school is one of my goals. 1 2 3 4 5 6 7
13. I am capable of getting straight A’s. 1 2 3 4 5 6 7
14. I complete my schoolwork regularly. 1 2 3 4 5 6 7
15. It’s important to get good grades in school. 1 2 3 4 5 6 7
16. I am organized about my schoolwork. 1 2 3 4 5 6 7
17. I use a variety of strategies to learn new material. 1 2 3 4 5 6 7
18. I want to do my best in school. 1 2 3 4 5 6 7
19. It is important for me to do well in school. 1 2 3 4 5 6 7
20. I spend a lot of time on my schoolwork. 1 2 3 4 5 6 7
21. I am a responsible student. 1 2 3 4 5 6 7
22. I put a lot of effort into my schoolwork. 1 2 3 4 5 6 7
23. I concentrate on my schoolwork. 1 2 3 4 5 6 7
Appendix E continued
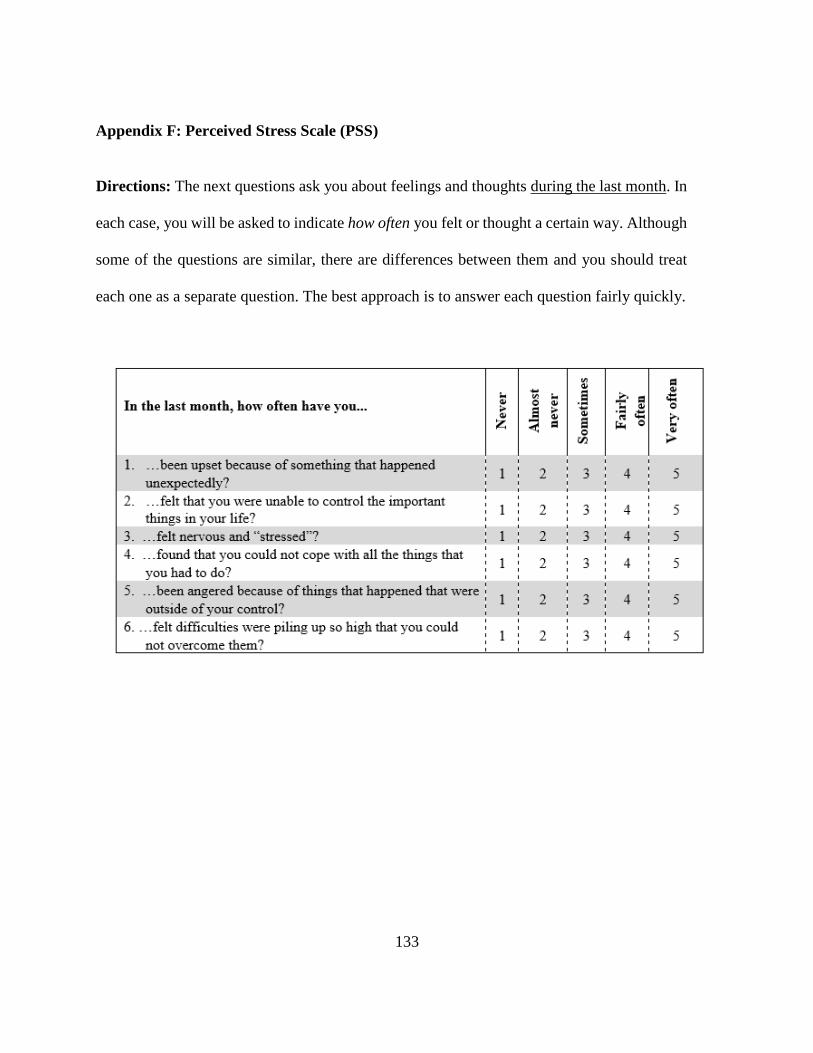
133
Appendix F: Perceived Stress Scale (PSS)
Directions: The next questions ask you about feelings and thoughts during the last month. In
each case, you will be asked to indicate how often you felt or thought a certain way. Although
some of the questions are similar, there are differences between them and you should treat
each one as a separate question. The best approach is to answer each question fairly quickly.
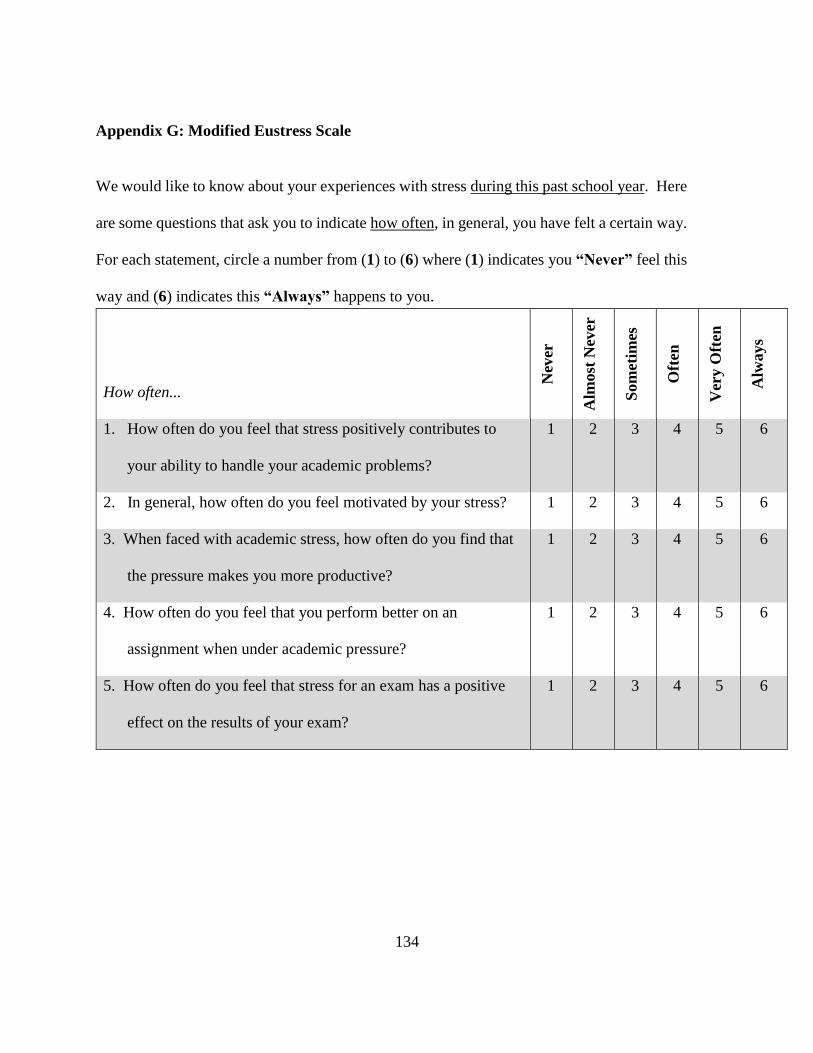
134
Appendix G: Modified Eustress Scale
We would like to know about your experiences with stress during this past school year. Here
are some questions that ask you to indicate how often, in general, you have felt a certain way.
For each statement, circle a number from (1) to (6) where (1) indicates you “Never” feel this
way and (6) indicates this “Always” happens to you.
How often...
Nev
er
Alm
ost
Nev
er
Som
etim
es
Oft
en
Ver
y O
ften
Alw
ays
1. How often do you feel that stress positively contributes to
your ability to handle your academic problems?
1 2 3 4 5 6
2. In general, how often do you feel motivated by your stress? 1 2 3 4 5 6
3. When faced with academic stress, how often do you find that
the pressure makes you more productive?
1 2 3 4 5 6
4. How often do you feel that you perform better on an
assignment when under academic pressure?
1 2 3 4 5 6
5. How often do you feel that stress for an exam has a positive
effect on the results of your exam?
1 2 3 4 5 6
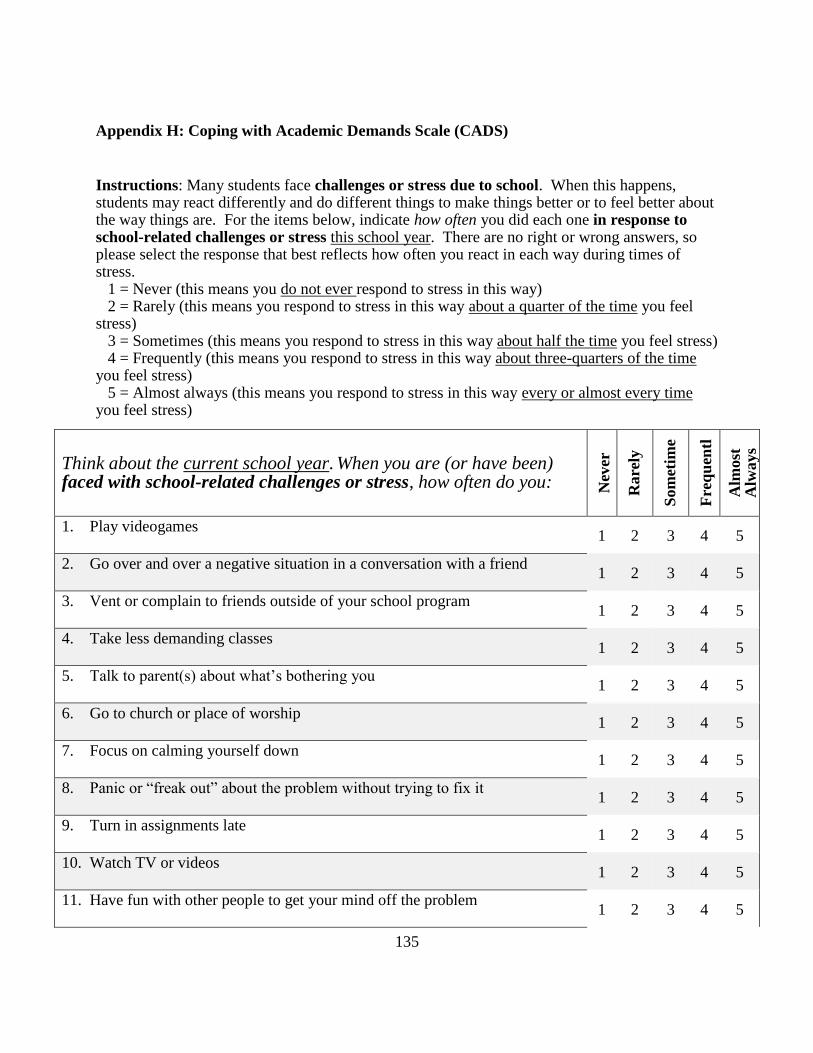
135
Appendix H: Coping with Academic Demands Scale (CADS)
Instructions: Many students face challenges or stress due to school. When this happens, students may react differently and do different things to make things better or to feel better about the way things are. For the items below, indicate how often you did each one in response to school-related challenges or stress this school year. There are no right or wrong answers, so please select the response that best reflects how often you react in each way during times of stress. 1 = Never (this means you do not ever respond to stress in this way) 2 = Rarely (this means you respond to stress in this way about a quarter of the time you feel stress) 3 = Sometimes (this means you respond to stress in this way about half the time you feel stress) 4 = Frequently (this means you respond to stress in this way about three-quarters of the time you feel stress) 5 = Almost always (this means you respond to stress in this way every or almost every time you feel stress)
Think about the current school year. When you are (or have been) faced with school-related challenges or stress, how often do you: N
ever
Rare
ly
Som
etim
e
s F
req
uen
tl
y
Alm
ost
A
lways
1. Play videogames 1 2 3 4 5
2. Go over and over a negative situation in a conversation with a friend 1 2 3 4 5
3. Vent or complain to friends outside of your school program 1 2 3 4 5
4. Take less demanding classes 1 2 3 4 5
5. Talk to parent(s) about what’s bothering you 1 2 3 4 5
6. Go to church or place of worship 1 2 3 4 5
7. Focus on calming yourself down 1 2 3 4 5
8. Panic or “freak out” about the problem without trying to fix it 1 2 3 4 5
9. Turn in assignments late 1 2 3 4 5
10. Watch TV or videos 1 2 3 4 5
11. Have fun with other people to get your mind off the problem 1 2 3 4 5
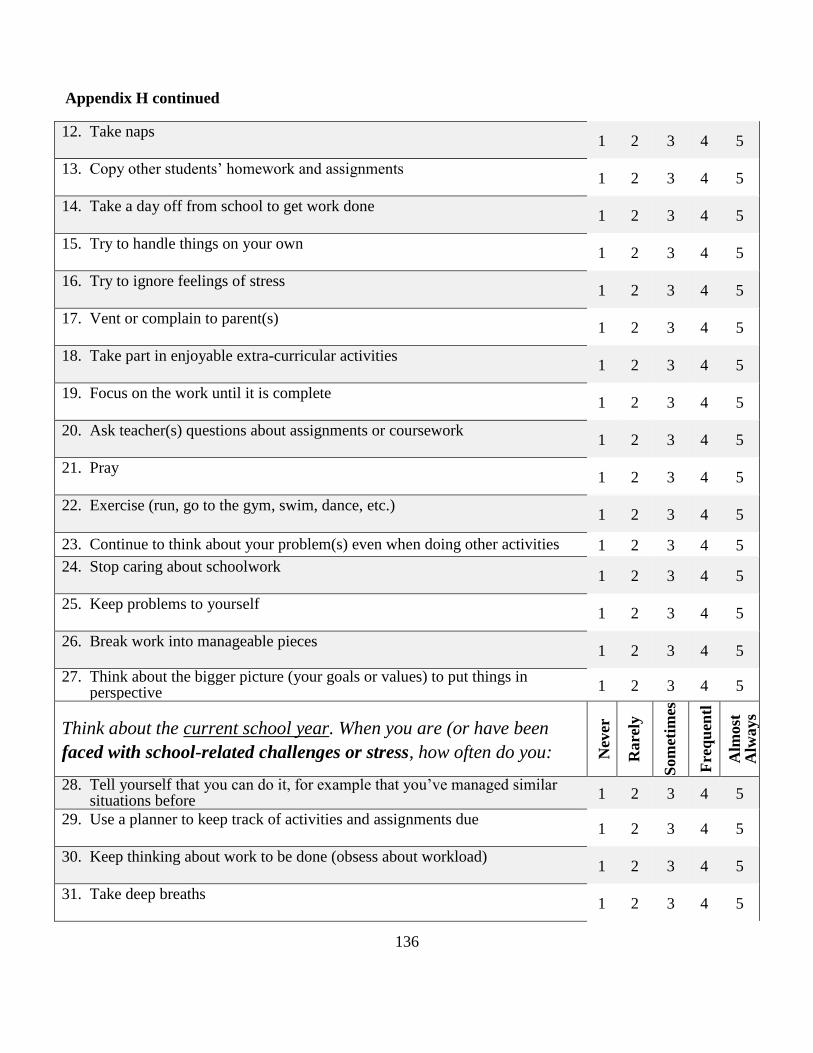
136
12. Take naps 1 2 3 4 5
13. Copy other students’ homework and assignments 1 2 3 4 5
14. Take a day off from school to get work done 1 2 3 4 5
15. Try to handle things on your own 1 2 3 4 5
16. Try to ignore feelings of stress 1 2 3 4 5
17. Vent or complain to parent(s) 1 2 3 4 5
18. Take part in enjoyable extra-curricular activities 1 2 3 4 5
19. Focus on the work until it is complete 1 2 3 4 5
20. Ask teacher(s) questions about assignments or coursework 1 2 3 4 5
21. Pray 1 2 3 4 5
22. Exercise (run, go to the gym, swim, dance, etc.) 1 2 3 4 5
23. Continue to think about your problem(s) even when doing other activities 1 2 3 4 5
24. Stop caring about schoolwork 1 2 3 4 5
25. Keep problems to yourself 1 2 3 4 5
26. Break work into manageable pieces 1 2 3 4 5
27. Think about the bigger picture (your goals or values) to put things in perspective 1 2 3 4 5
Think about the current school year. When you are (or have been
faced with school-related challenges or stress, how often do you: Nev
er
Rare
ly
Som
etim
es
Fre
qu
entl
y
Alm
ost
A
lways
28. Tell yourself that you can do it, for example that you’ve managed similar situations before 1 2 3 4 5
29. Use a planner to keep track of activities and assignments due 1 2 3 4 5
30. Keep thinking about work to be done (obsess about workload) 1 2 3 4 5
31. Take deep breaths 1 2 3 4 5
Appendix H continued
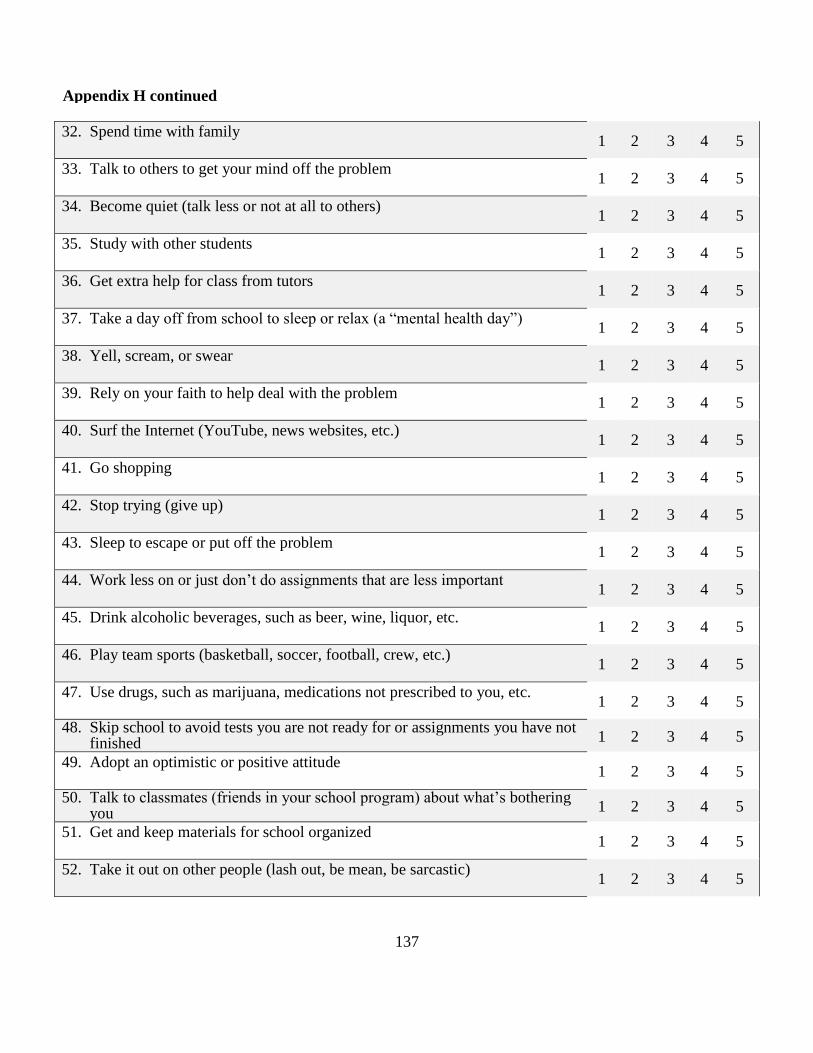
137
32. Spend time with family 1 2 3 4 5
33. Talk to others to get your mind off the problem 1 2 3 4 5
34. Become quiet (talk less or not at all to others) 1 2 3 4 5
35. Study with other students 1 2 3 4 5
36. Get extra help for class from tutors 1 2 3 4 5
37. Take a day off from school to sleep or relax (a “mental health day”) 1 2 3 4 5
38. Yell, scream, or swear 1 2 3 4 5
39. Rely on your faith to help deal with the problem 1 2 3 4 5
40. Surf the Internet (YouTube, news websites, etc.) 1 2 3 4 5
41. Go shopping 1 2 3 4 5
42. Stop trying (give up) 1 2 3 4 5
43. Sleep to escape or put off the problem 1 2 3 4 5
44. Work less on or just don’t do assignments that are less important 1 2 3 4 5
45. Drink alcoholic beverages, such as beer, wine, liquor, etc. 1 2 3 4 5
46. Play team sports (basketball, soccer, football, crew, etc.) 1 2 3 4 5
47. Use drugs, such as marijuana, medications not prescribed to you, etc. 1 2 3 4 5
48. Skip school to avoid tests you are not ready for or assignments you have not finished 1 2 3 4 5
49. Adopt an optimistic or positive attitude 1 2 3 4 5
50. Talk to classmates (friends in your school program) about what’s bothering you 1 2 3 4 5
51. Get and keep materials for school organized 1 2 3 4 5
52. Take it out on other people (lash out, be mean, be sarcastic) 1 2 3 4 5
Appendix H continued
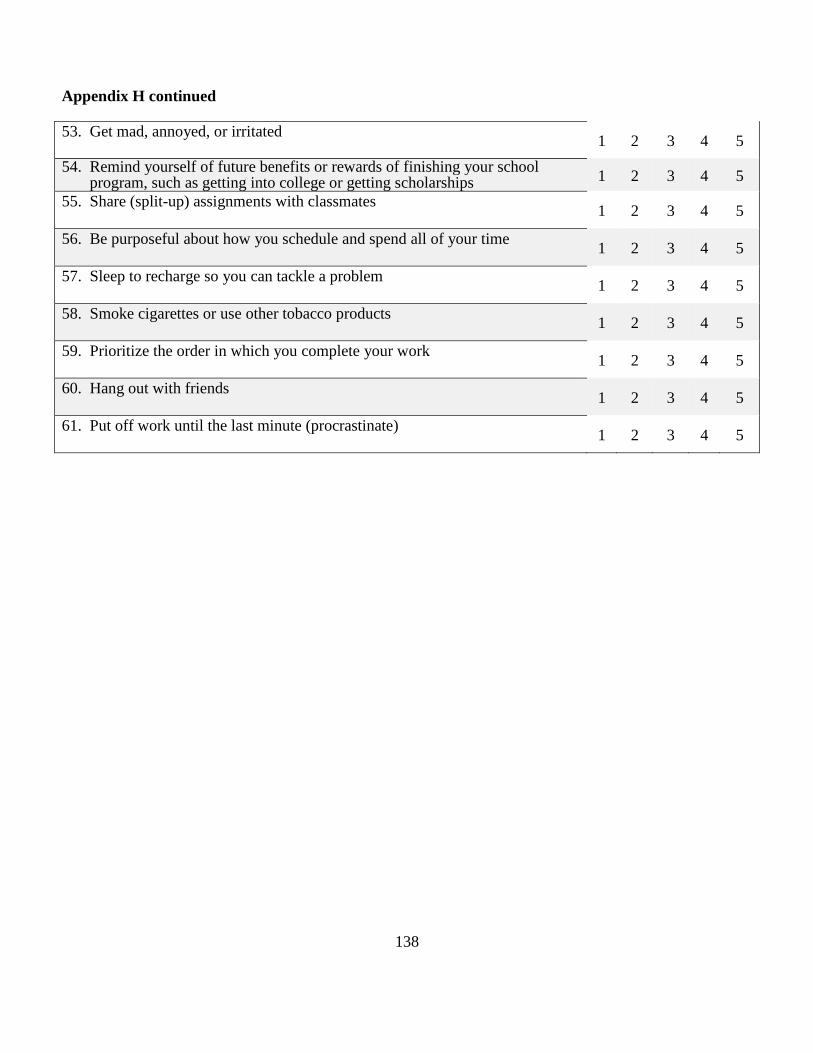
138
53. Get mad, annoyed, or irritated 1 2 3 4 5
54. Remind yourself of future benefits or rewards of finishing your school program, such as getting into college or getting scholarships 1 2 3 4 5
55. Share (split-up) assignments with classmates 1 2 3 4 5
56. Be purposeful about how you schedule and spend all of your time 1 2 3 4 5
57. Sleep to recharge so you can tackle a problem 1 2 3 4 5
58. Smoke cigarettes or use other tobacco products 1 2 3 4 5
59. Prioritize the order in which you complete your work 1 2 3 4 5
60. Hang out with friends 1 2 3 4 5
61. Put off work until the last minute (procrastinate) 1 2 3 4 5
Appendix H continued
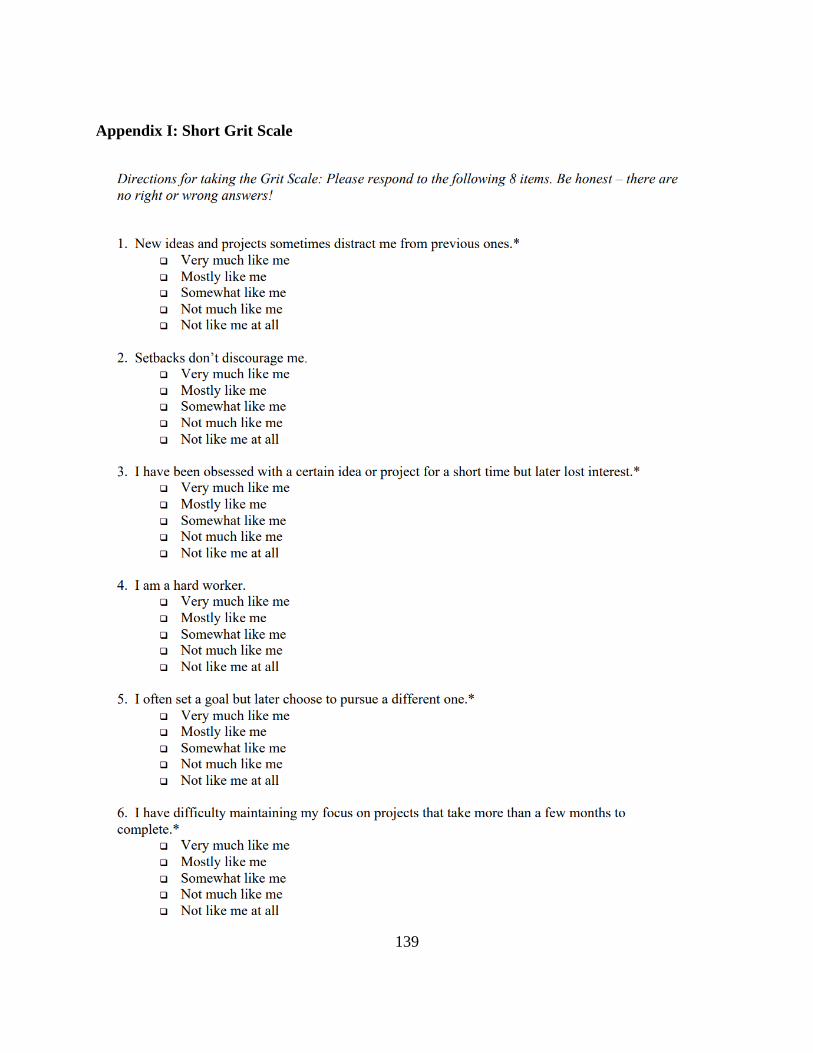
139
Appendix I: Short Grit Scale
140
Appendix I continued
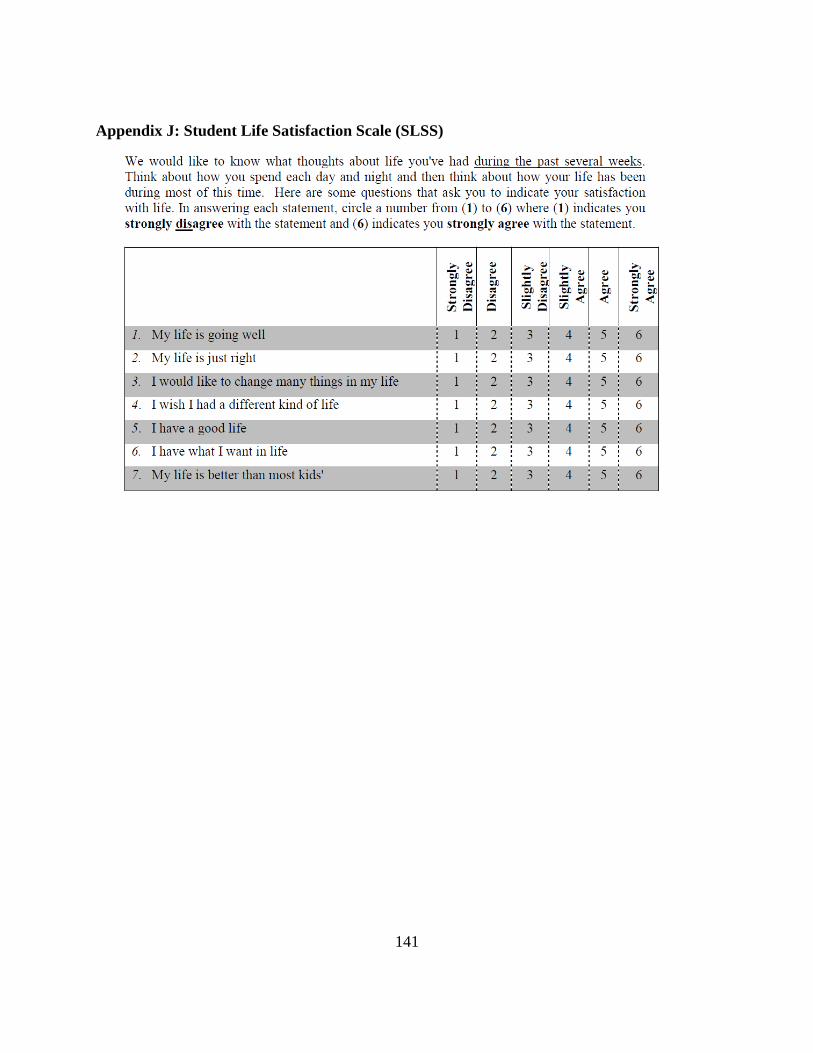
141
Appendix J: Student Life Satisfaction Scale (SLSS)
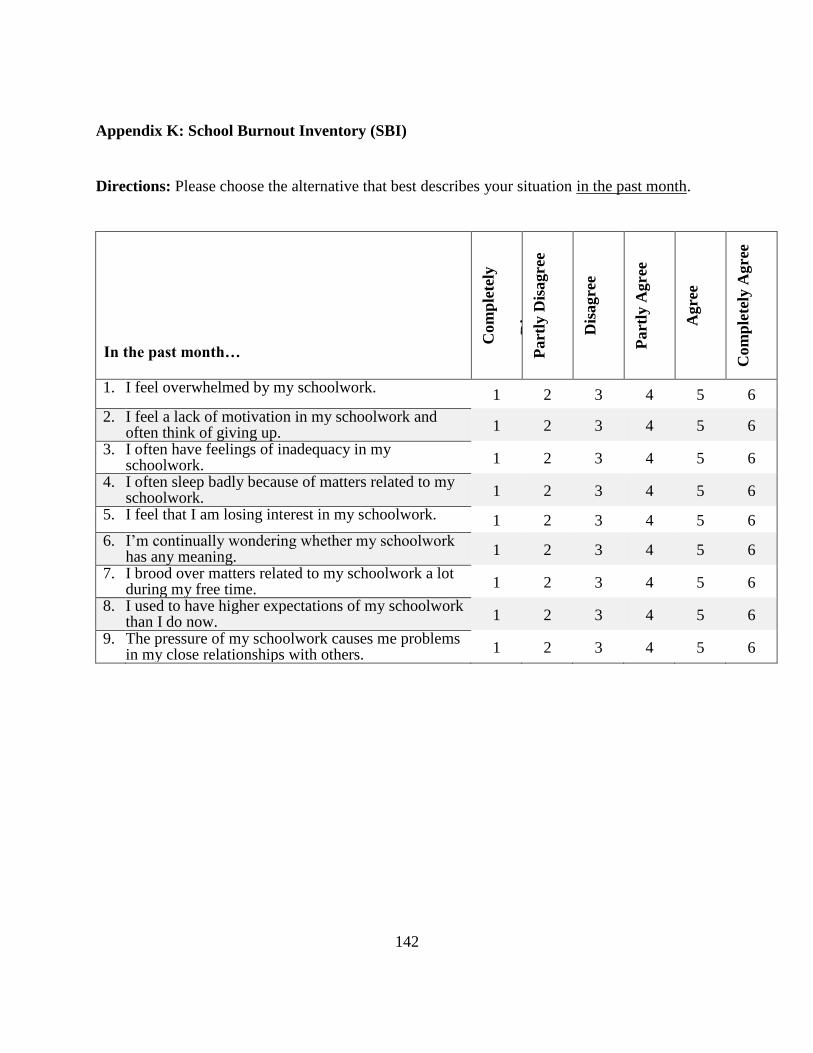
142
Appendix K: School Burnout Inventory (SBI)
Directions: Please choose the alternative that best describes your situation in the past month.
In the past month…
Com
ple
tely
Dis
agre
e
Part
ly D
isagre
e
Dis
agre
e
Part
ly A
gree
Agre
e
Com
ple
tely
Agree
1. I feel overwhelmed by my schoolwork. 1 2 3 4 5 6
2. I feel a lack of motivation in my schoolwork and often think of giving up. 1 2 3 4 5 6
3. I often have feelings of inadequacy in my schoolwork. 1 2 3 4 5 6
4. I often sleep badly because of matters related to my schoolwork. 1 2 3 4 5 6
5. I feel that I am losing interest in my schoolwork. 1 2 3 4 5 6
6. I’m continually wondering whether my schoolwork has any meaning. 1 2 3 4 5 6
7. I brood over matters related to my schoolwork a lot during my free time. 1 2 3 4 5 6
8. I used to have higher expectations of my schoolwork than I do now. 1 2 3 4 5 6
9. The pressure of my schoolwork causes me problems in my close relationships with others. 1 2 3 4 5 6
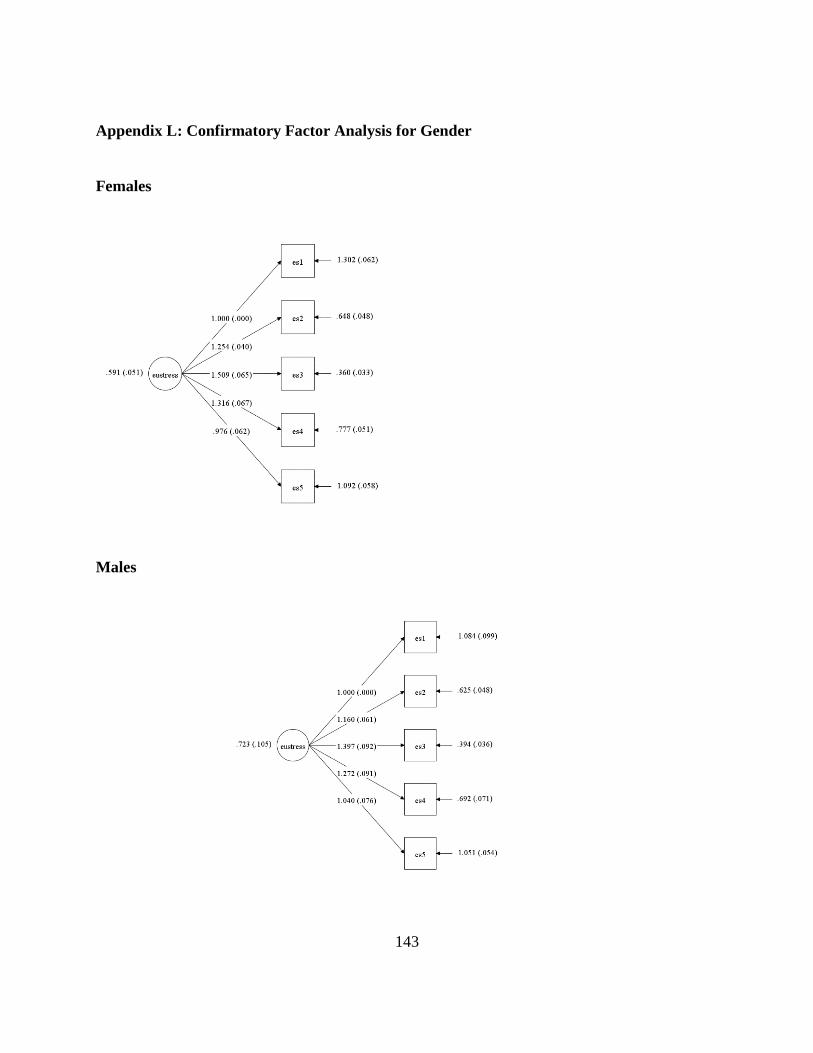
143
Appendix L: Confirmatory Factor Analysis for Gender
Females
Males
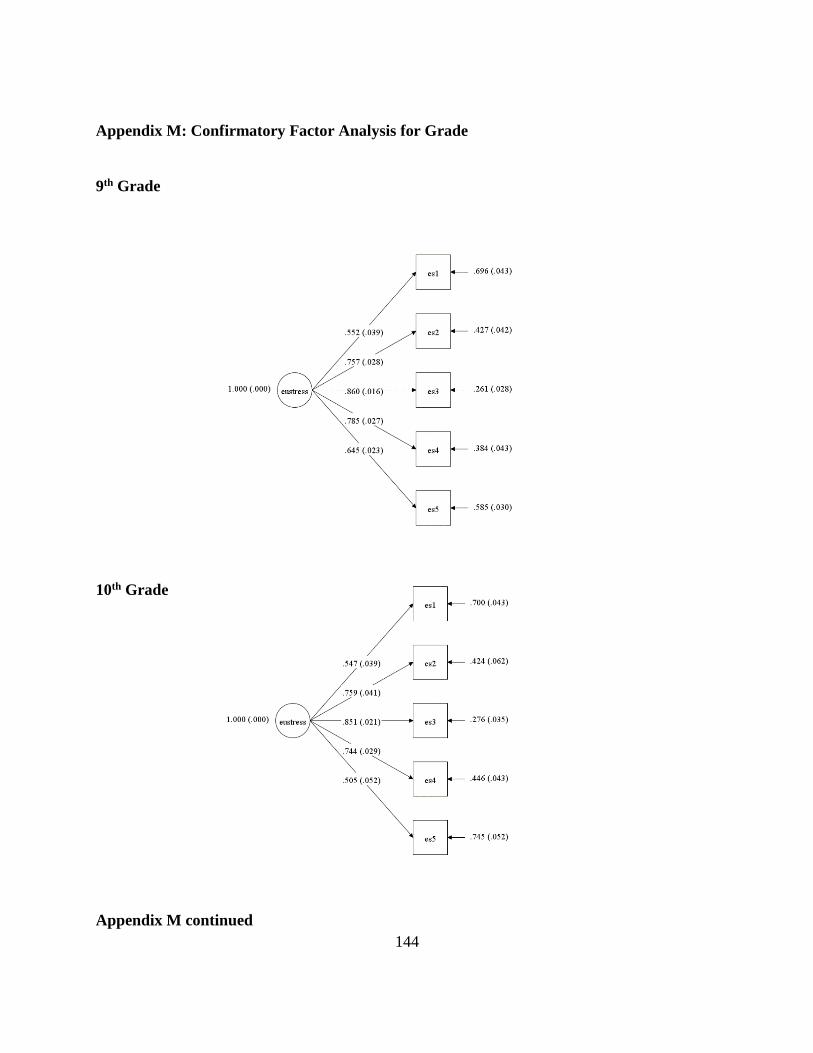
144
Appendix M: Confirmatory Factor Analysis for Grade
9th Grade
10th Grade
Appendix M continued
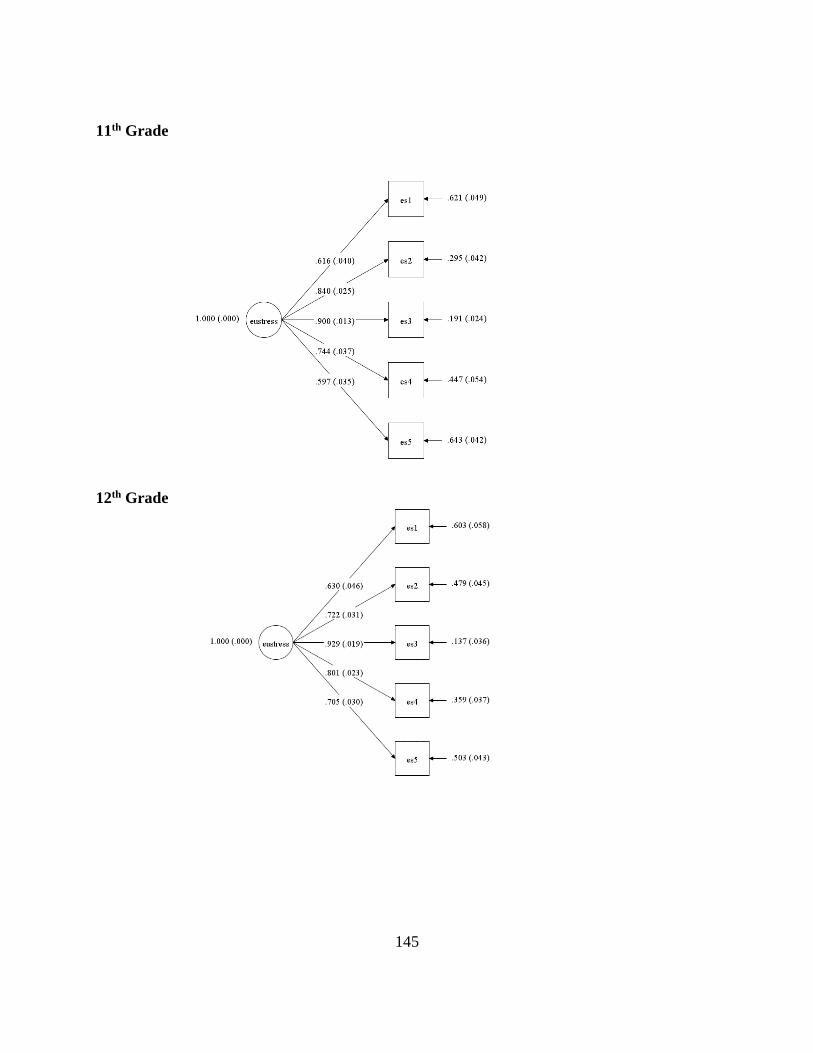
145
11th Grade
12th Grade
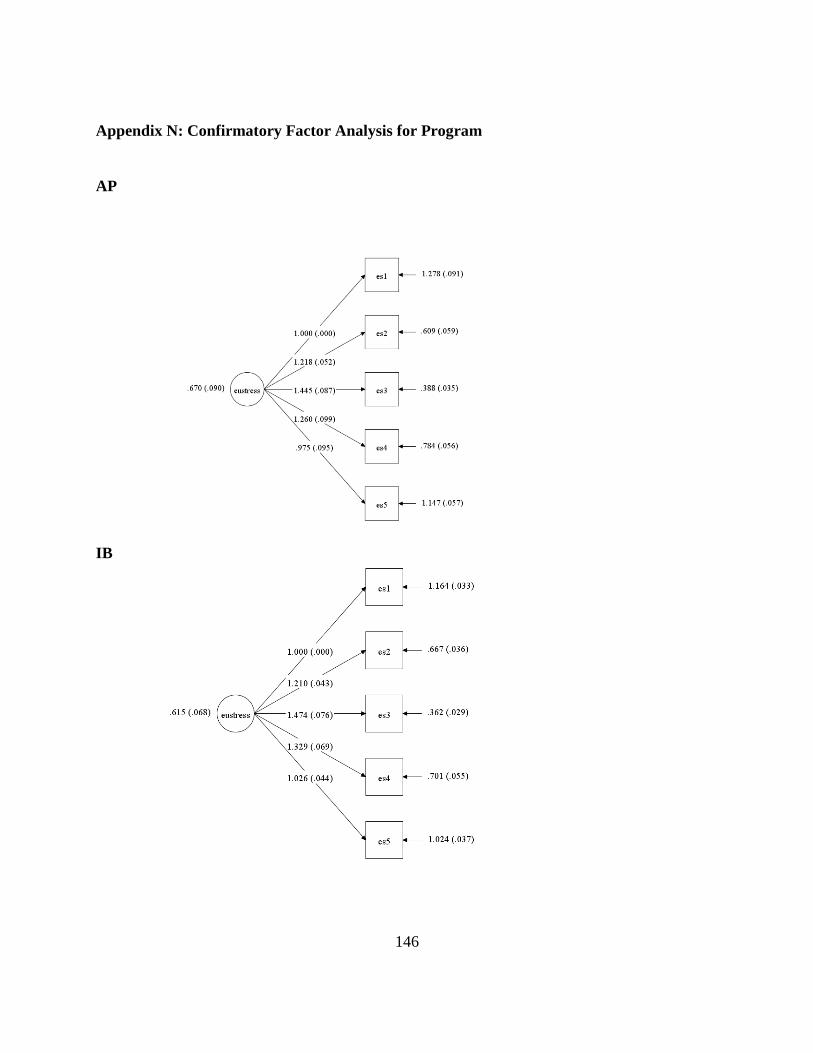
146
Appendix N: Confirmatory Factor Analysis for Program
AP
IB
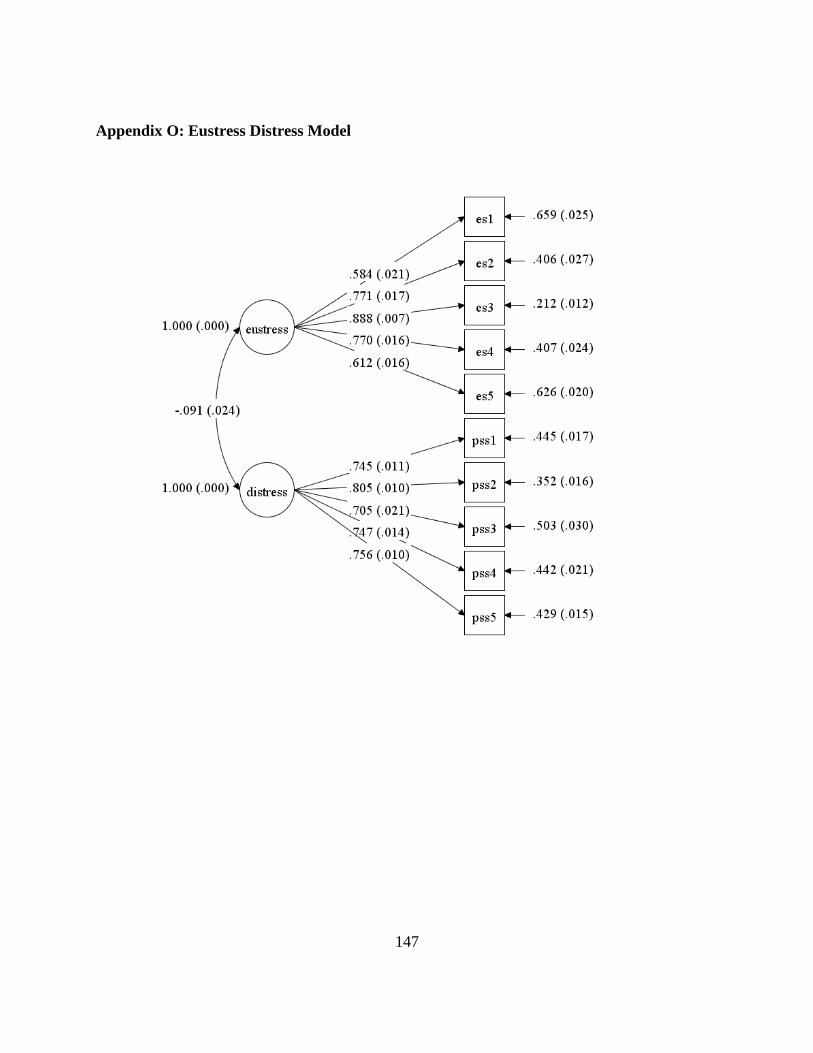
147
Appendix O: Eustress Distress Model
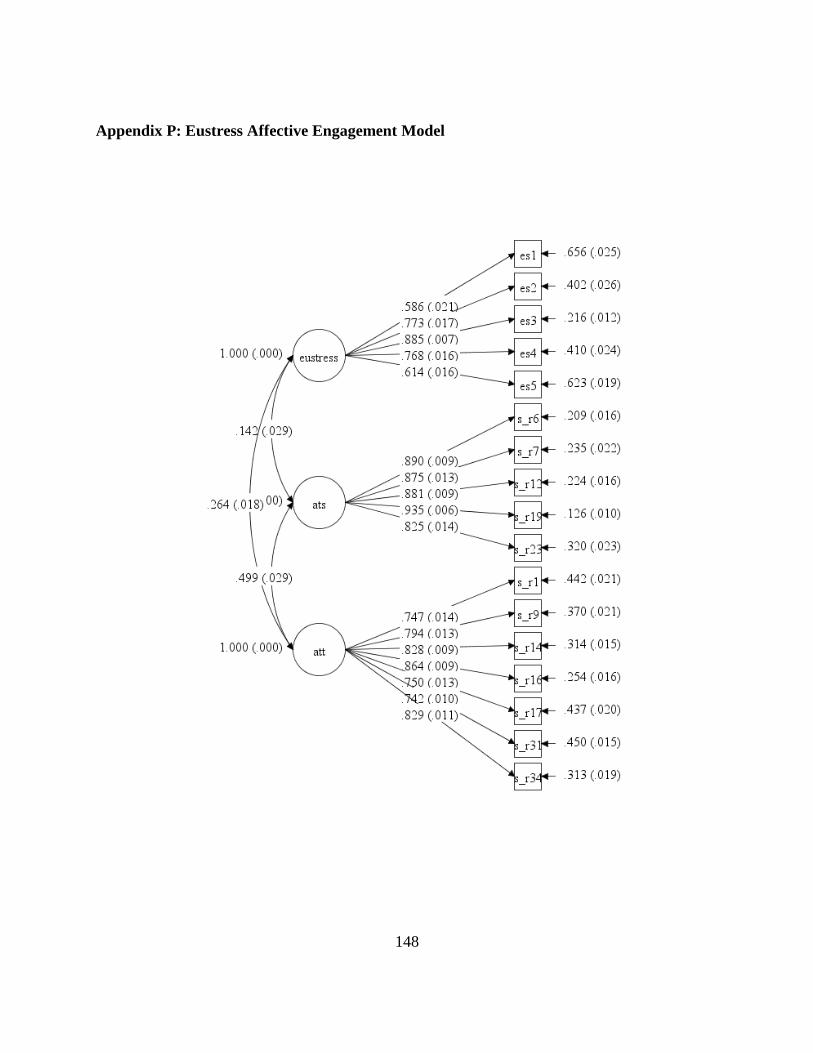
148
Appendix P: Eustress Affective Engagement Model
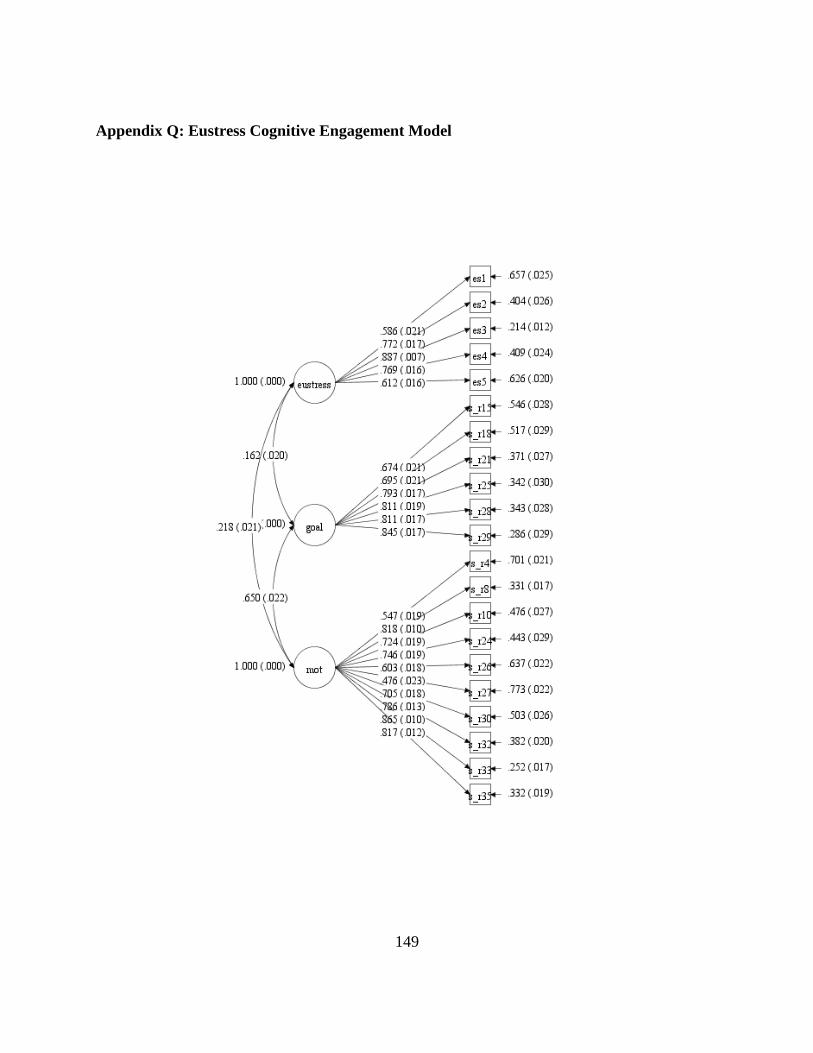
149
Appendix Q: Eustress Cognitive Engagement Model
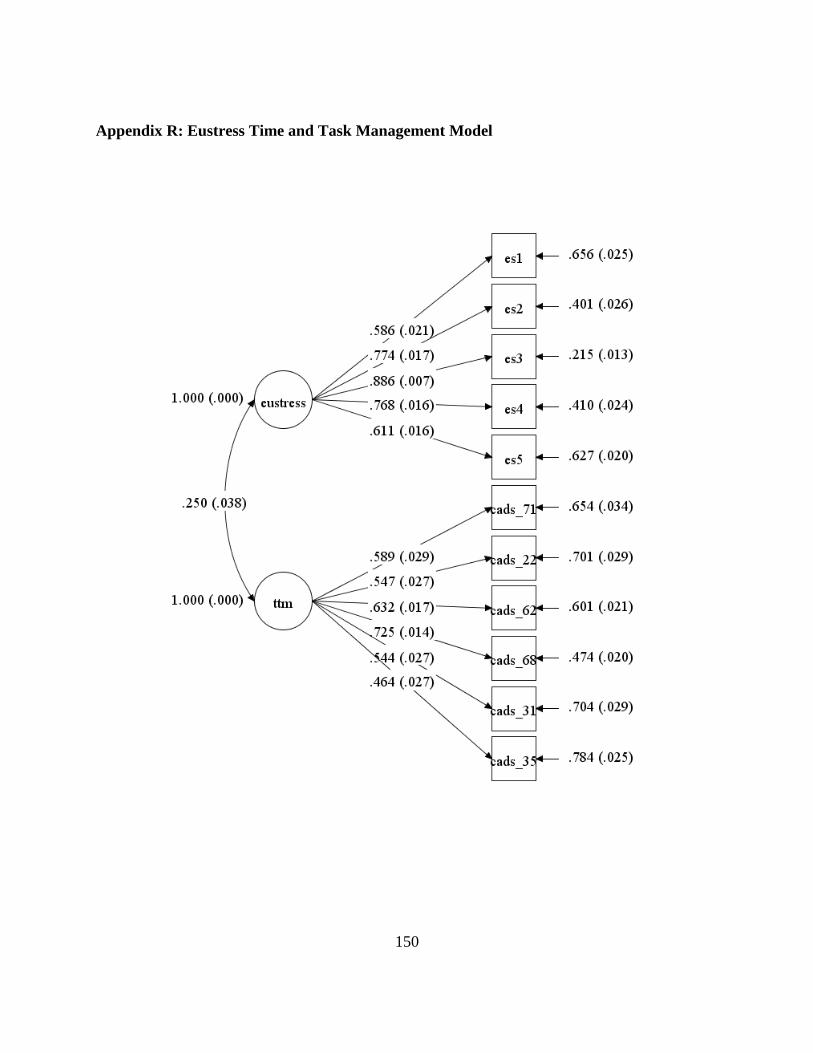
150
Appendix R: Eustress Time and Task Management Model
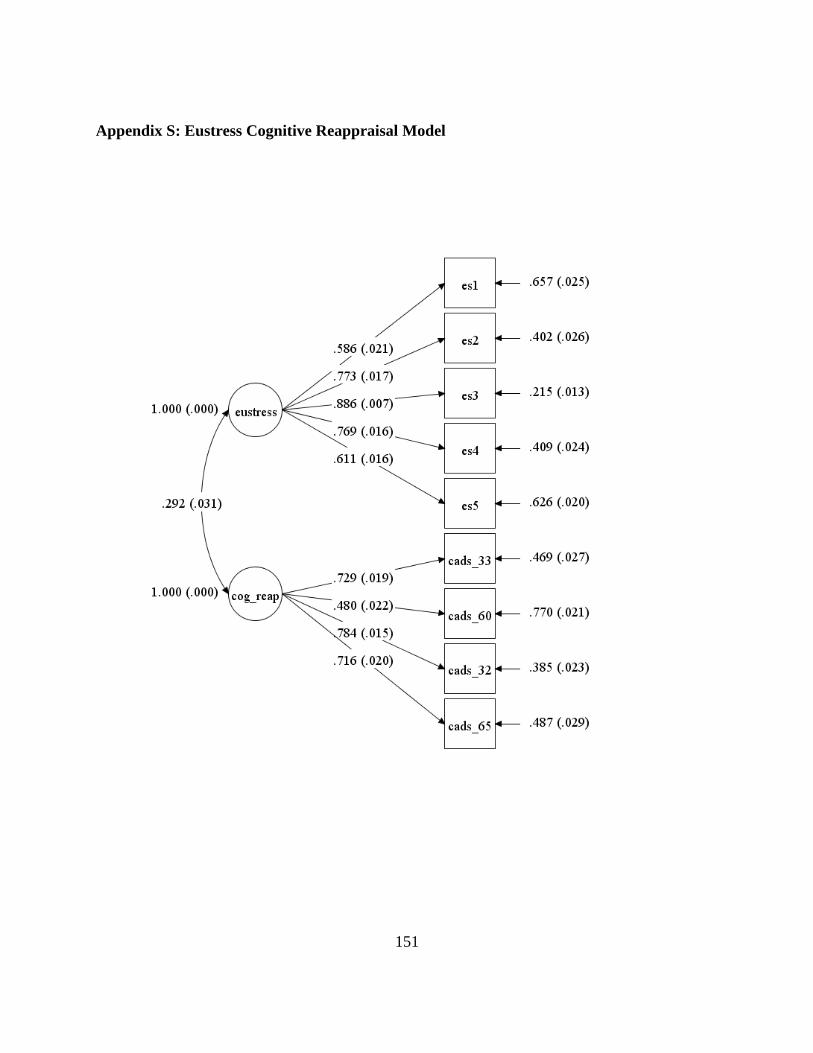
151
Appendix S: Eustress Cognitive Reappraisal Model
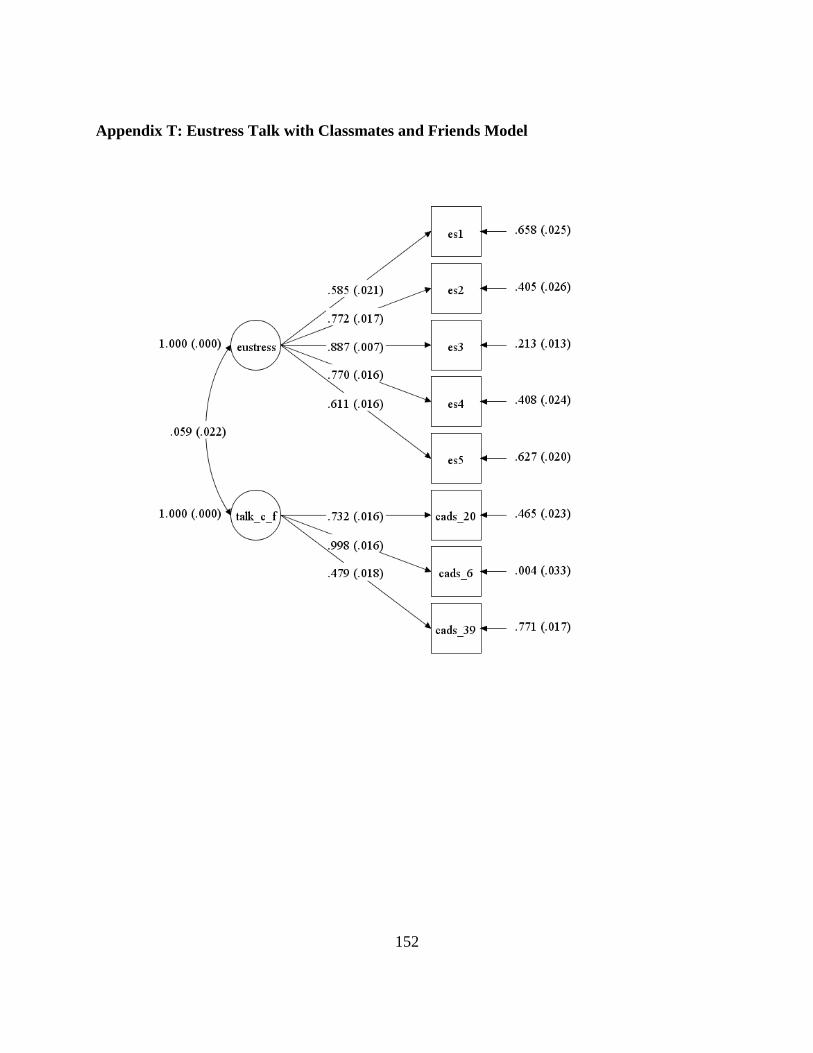
152
Appendix T: Eustress Talk with Classmates and Friends Model
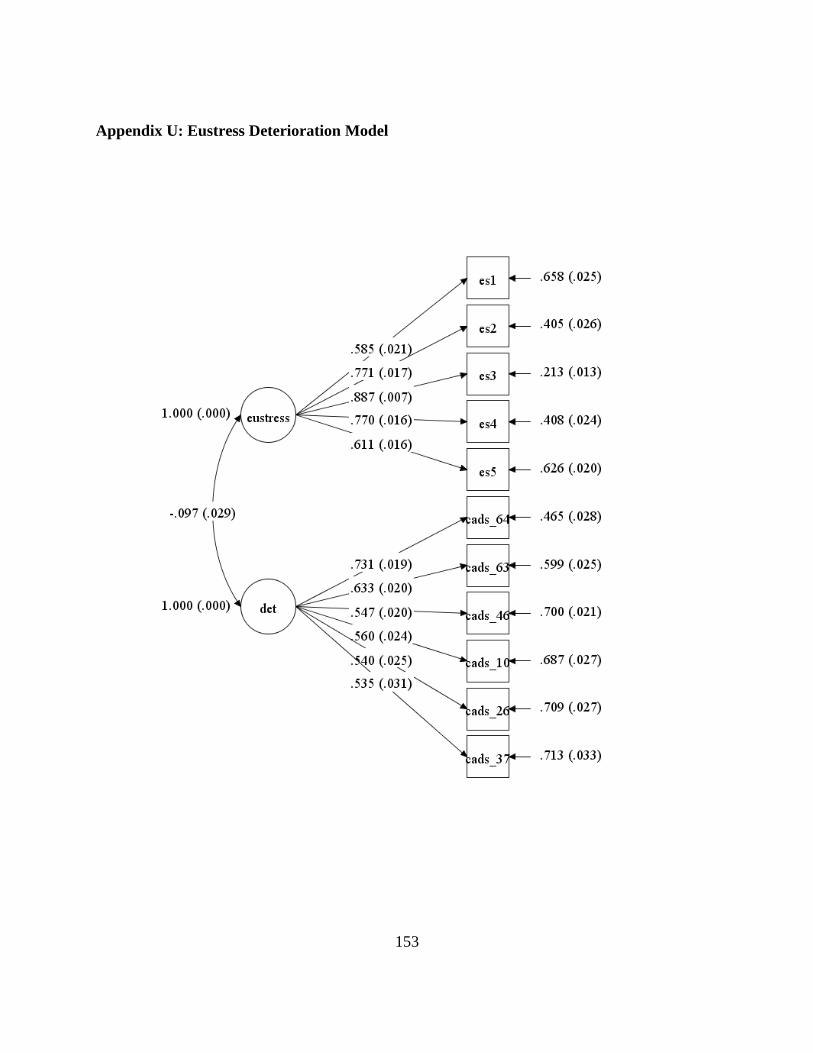
153
Appendix U: Eustress Deterioration Model
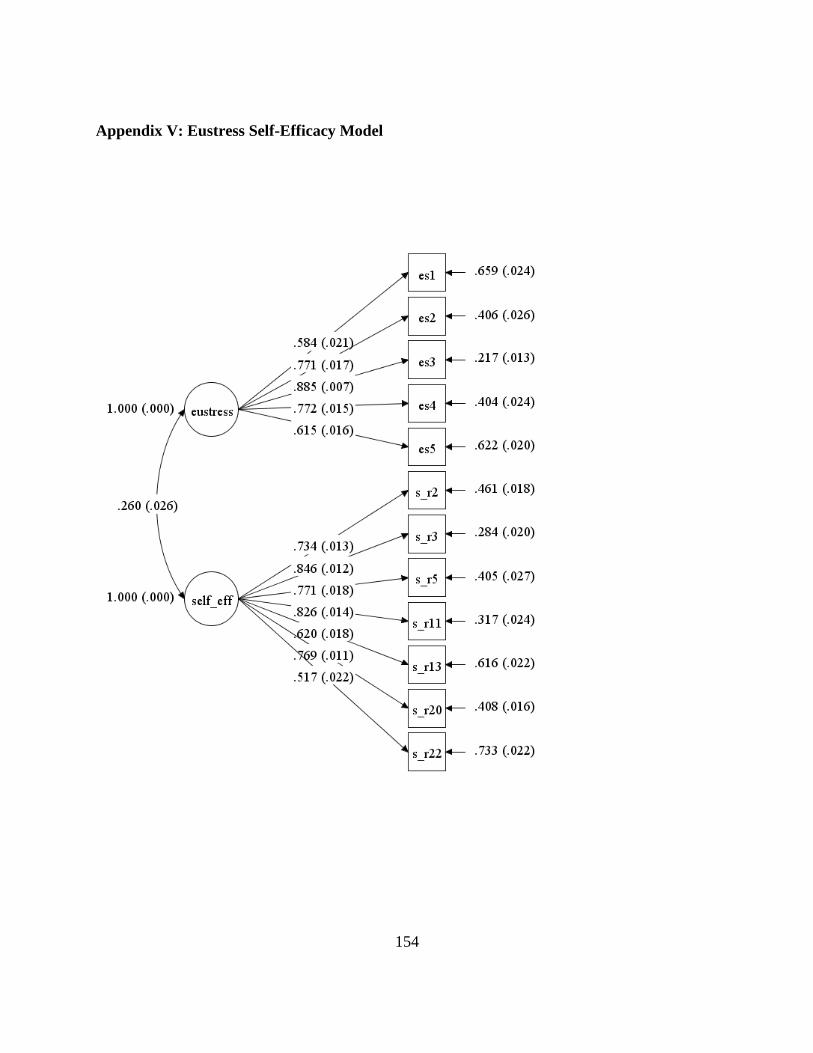
154
Appendix V: Eustress Self-Efficacy Model
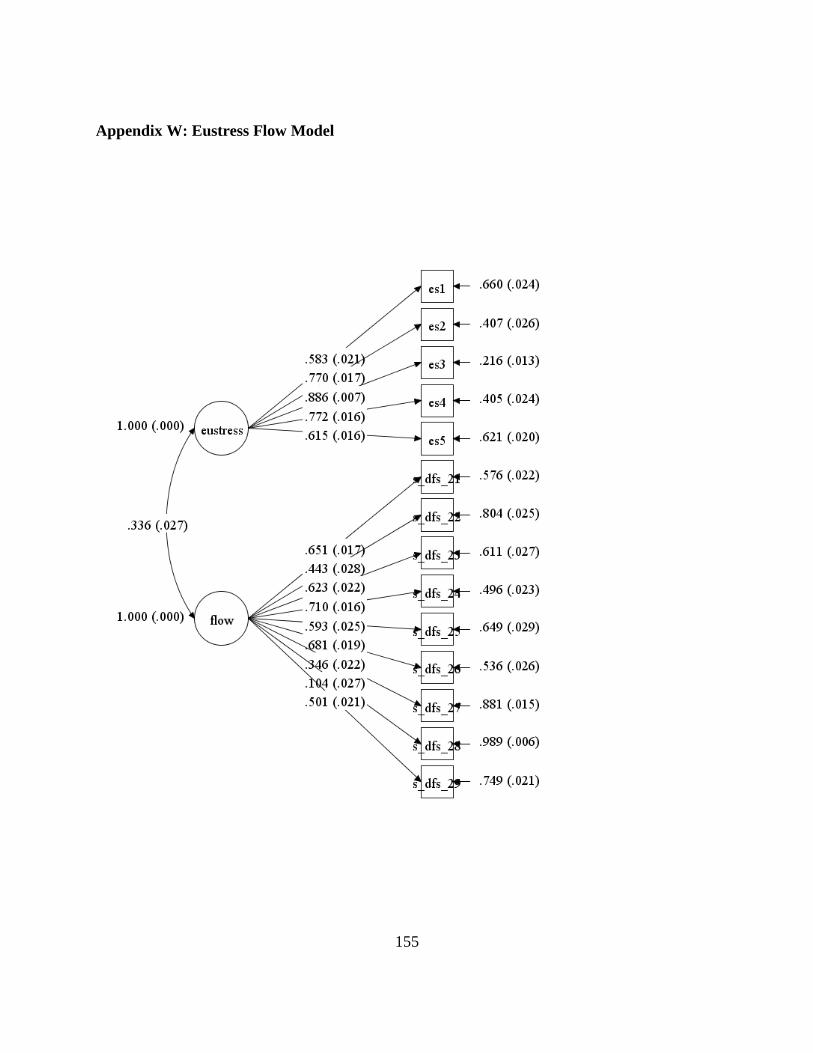
155
Appendix W: Eustress Flow Model
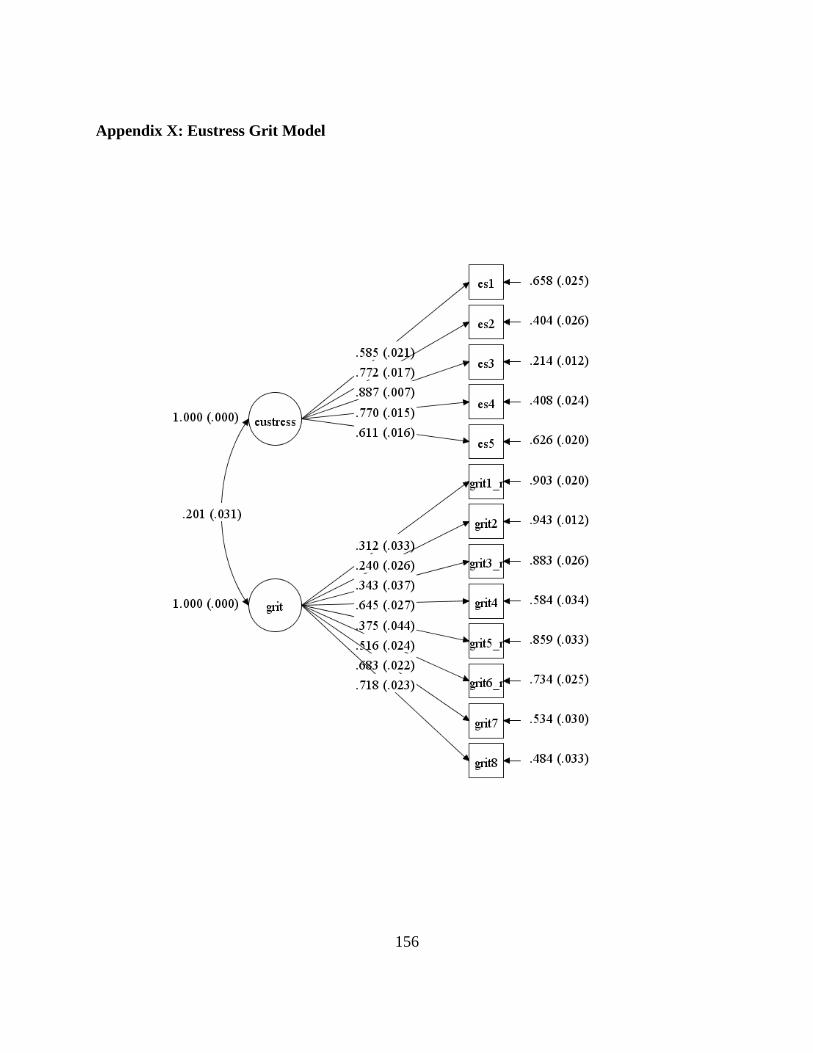
156
Appendix X: Eustress Grit Model
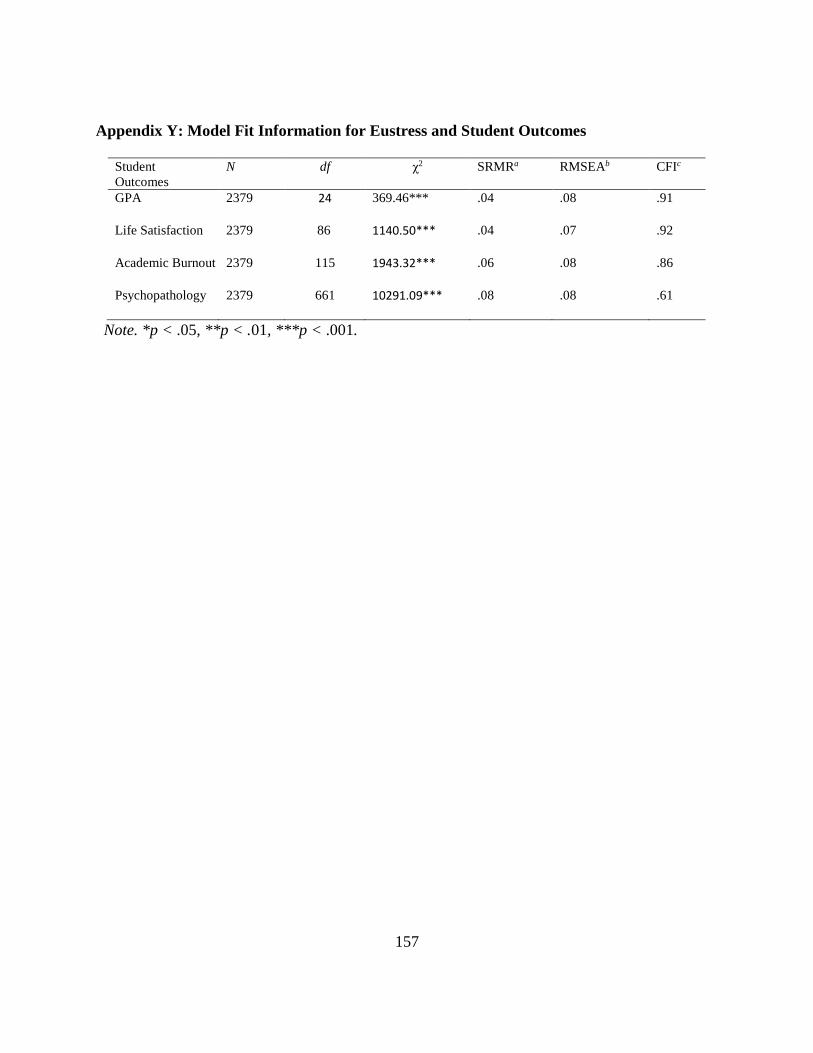
157
Appendix Y: Model Fit Information for Eustress and Student Outcomes
Student
Outcomes
N df ꭓ2 SRMRa RMSEAb CFIc
GPA 2379 24 369.46*** .04 .08 .91
Life Satisfaction 2379 86 1140.50*** .04 .07 .92
Academic Burnout 2379 115 1943.32*** .06 .08 .86
Psychopathology 2379 661 10291.09*** .08 .08 .61
Note. *p < .05, **p < .01, ***p < .001.
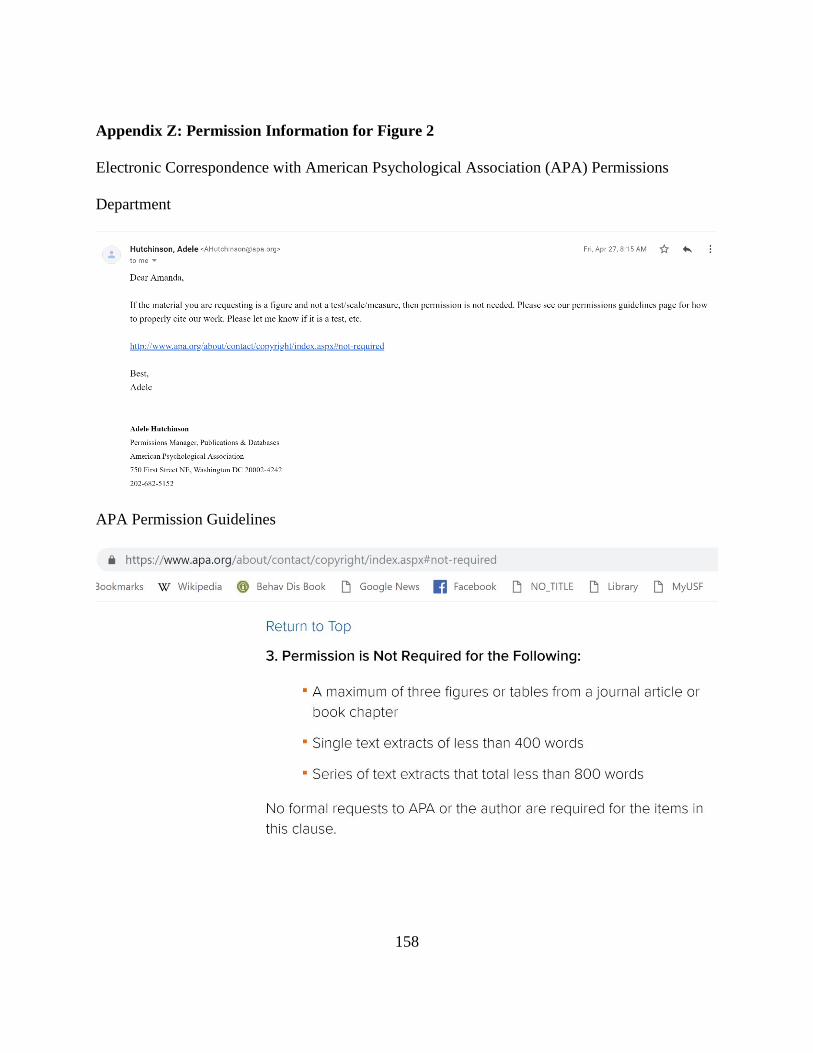
158
Appendix Z: Permission Information for Figure 2
Electronic Correspondence with American Psychological Association (APA) Permissions
Department
APA Permission Guidelines
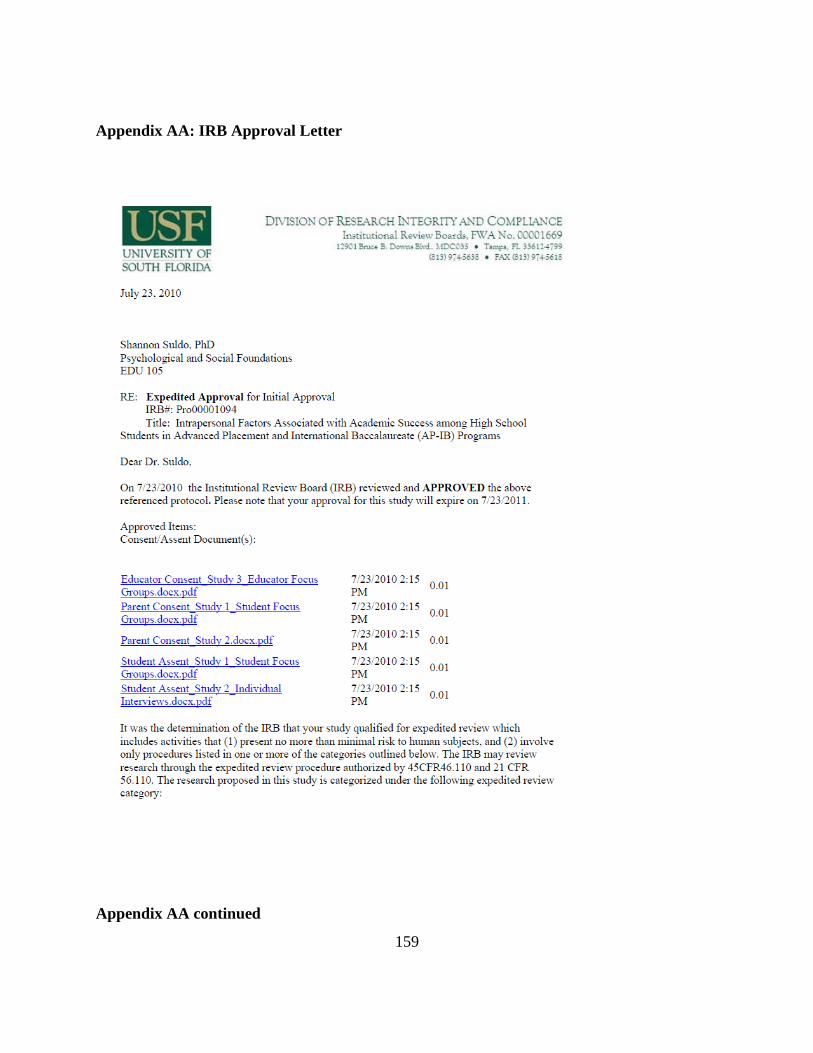
159
Appendix AA: IRB Approval Letter
Appendix AA continued
160
161
Appendix AA continued
162
Appendix AA continued