Intersectional analysis of Advanced Placement Physics ...
16
Intersectional analysis of Advanced Placement Physics participation and performance by gender and ethnicity Robert Krakehl Institute for STEM Education, Stony Brook University, 092 Life Sciences, Stony Brook, New York 11794-5233, USA and Manhasset High School, 200 Memorial Place, Manhasset, New York 11030, USA Angela M. Kelly * Department of Physics & Astronomy and Institute for STEM Education, Stony Brook University, 092 Life Sciences, Stony Brook, New York 11794-5233, USA (Received 2 April 2021; accepted 17 June 2021; published 29 July 2021) Access and performance in advanced high school physics have been persistently inequitable when considering student ethnicity and gender. This quasiexperimental, observational study examined access and performance of students in four Advanced Placement (AP) Physics courses in 2018–2019: AP Physics 1 (N ¼ 150 451), AP Physics 2 (N ¼ 20 466), AP Physics C Mechanics (N ¼ 49 951), and AP Physics C Electricity & Magnetism (N ¼ 21 602); this analysis utilized an intersectional lens of ethnicity and gender in identifying enrollment and performance disparities. Descriptive and inferential analyses were conducted to determine whether the distribution of student ethnicities and genders of students who took the examinations was similar to that of U.S. schools. Further analyses were conducted to determine whether achievement on AP Physics examinations varied by 14 unique intersectional groups characterized by gender and ethnicity. Results indicated that AP Physics 1 was a relatively accessible course, though enrollment disparities among genders, ethnicities, and intersectional groups grew as the AP Physics courses became more advanced with physics and/or calculus prerequisites or corequisites. There were large decreases in course enrollments from first- to second-year AP Physics courses, particularly for women who were also underrepresented ethnic minorities. In terms of performance, AP Physics 1 had the lowest overall weighted average, with the majority of students failing the examination. Women who were traditionally underrepresented ethnic minorities were found to have failure rates of over 80% on the AP Physics 1 examination, and failure rates near 50% for AP Physics 2 and the AP Physics C courses compared to nonminority men who had approximately half the failure rates. In most cases, men outperformed women who shared their ethnicities. These results present opportunities for physics education policy makers and researchers to design interventions for students in intersecting marginalized social groups, many of whom have disproportionately low representation and achievement in advanced high school physics, which occurs at a critical juncture in the physics pipeline. DOI: 10.1103/PhysRevPhysEducRes.17.020105 I. INTRODUCTION A. Physics and equity in the precollege STEM pipeline Precollege physics coursetaking plays a vital role for students who wish to pursue postsecondary science, tech- nology, engineering, and mathematics (STEM) study. Students who took a quantitative physics course in high school have demonstrated higher rates of STEM degree attainment in the U.S. [1–3]. Those who took a rigorous physics course also demonstrated higher STEM career interest [4,5]. While there has been an increase in high school physics course taking [6] and physics bachelor’ s degree attainment [7] in the U.S. in recent years, indicating an increase in physics persistence, there remains inequi- table physics access and achievement when considering demographic factors such as ethnicity [8–13], gender [8], and socioeconomic status [6,8,14,15]. 1. Intersectional perspectives While there has been a considerable amount of research related to equitable physics access and achievement for * [email protected] Published by the American Physical Society under the terms of the Creative Commons Attribution 4.0 International license. Further distribution of this work must maintain attribution to the author(s) and the published article’s title, journal citation, and DOI. PHYSICAL REVIEW PHYSICS EDUCATION RESEARCH 17, 020105 (2021) 2469-9896=21=17(2)=020105(16) 020105-1 Published by the American Physical Society
-
Upload
khangminh22 -
Category
Documents
-
view
2 -
download
0
Transcript of Intersectional analysis of Advanced Placement Physics ...

Intersectional analysis of Advanced Placement Physics participationand performance by gender and ethnicity
Robert KrakehlInstitute for STEM Education, Stony Brook University, 092 Life Sciences,
Stony Brook, New York 11794-5233, USAand Manhasset High School, 200 Memorial Place, Manhasset, New York 11030, USA
Angela M. Kelly *
Department of Physics & Astronomy and Institute for STEM Education, Stony Brook University,092 Life Sciences, Stony Brook, New York 11794-5233, USA
(Received 2 April 2021; accepted 17 June 2021; published 29 July 2021)
Access and performance in advanced high school physics have been persistently inequitable whenconsidering student ethnicity and gender. This quasiexperimental, observational study examined access andperformance of students in four Advanced Placement (AP) Physics courses in 2018–2019: AP Physics 1(N ¼ 150 451), AP Physics 2 (N ¼ 20 466), AP Physics C Mechanics (N ¼ 49 951), and AP Physics CElectricity & Magnetism (N ¼ 21 602); this analysis utilized an intersectional lens of ethnicity and genderin identifying enrollment and performance disparities. Descriptive and inferential analyses were conductedto determine whether the distribution of student ethnicities and genders of students who took theexaminations was similar to that of U.S. schools. Further analyses were conducted to determine whetherachievement on AP Physics examinations varied by 14 unique intersectional groups characterized bygender and ethnicity. Results indicated that AP Physics 1 was a relatively accessible course, thoughenrollment disparities among genders, ethnicities, and intersectional groups grew as the AP Physics coursesbecame more advanced with physics and/or calculus prerequisites or corequisites. There were largedecreases in course enrollments from first- to second-year AP Physics courses, particularly for women whowere also underrepresented ethnic minorities. In terms of performance, AP Physics 1 had the lowest overallweighted average, with the majority of students failing the examination. Women who were traditionallyunderrepresented ethnic minorities were found to have failure rates of over 80% on the AP Physics 1examination, and failure rates near 50% for AP Physics 2 and the AP Physics C courses compared tononminority men who had approximately half the failure rates. In most cases, men outperformed womenwho shared their ethnicities. These results present opportunities for physics education policy makers andresearchers to design interventions for students in intersecting marginalized social groups, many of whomhave disproportionately low representation and achievement in advanced high school physics, whichoccurs at a critical juncture in the physics pipeline.
DOI: 10.1103/PhysRevPhysEducRes.17.020105
I. INTRODUCTION
A. Physics and equity in the precollege STEM pipeline
Precollege physics coursetaking plays a vital role forstudents who wish to pursue postsecondary science, tech-nology, engineering, and mathematics (STEM) study.Students who took a quantitative physics course in high
school have demonstrated higher rates of STEM degreeattainment in the U.S. [1–3]. Those who took a rigorousphysics course also demonstrated higher STEM careerinterest [4,5]. While there has been an increase in highschool physics course taking [6] and physics bachelor’sdegree attainment [7] in the U.S. in recent years, indicatingan increase in physics persistence, there remains inequi-table physics access and achievement when consideringdemographic factors such as ethnicity [8–13], gender [8],and socioeconomic status [6,8,14,15].
1. Intersectional perspectives
While there has been a considerable amount of researchrelated to equitable physics access and achievement for
Published by the American Physical Society under the terms ofthe Creative Commons Attribution 4.0 International license.Further distribution of this work must maintain attribution tothe author(s) and the published article’s title, journal citation,and DOI.
PHYSICAL REVIEW PHYSICS EDUCATION RESEARCH 17, 020105 (2021)
2469-9896=21=17(2)=020105(16) 020105-1 Published by the American Physical Society

both ethnicity and gender, these two factors are oftenviewed in isolation from one another. STEM inclusion is acomplex issue that requires broad perspectives and method-ologies in contextualizing systemic disparities [16].Malcolm et al.’s seminal work [17], The Double Bind:The Price of Being a Minority Woman in Science, was oneof the first attempts to identify science exclusion in terms ofboth gender and ethnic minority status. The authorsstressed the importance of intersectional data reportingthat specifies both gender and ethnicity in all categories;this practice serves to highlight the educational position ofminority women while identifying areas for potentialintervention [17]. More recent physics education researchincorporating the intersectionality of gender and ethnicityhas demonstrated the insightful potential of this frameworkin improving performance, persistence, and diversity inphysics [18–22]. However, there has been little researchregarding intersectionality in precollege physics education,which constitutes a critical part of the STEM pipeline.Addressing the STEM pipeline problem in the U.S.
requires understanding of the educational gaps that may bewidened throughout the academic continuum. Research hasshown that 75% of female physics majors decided on theirchoice before and during high school, with 93% of femaleundergraduate degree holders taking physics during highschool [23]. Despite recent research claiming gender parityin undergraduate physics performance in the U.S. [24],there remains evidence that physics persistence in terms ofgraduate study and careers remains a chronic issue [15].While there has been an overall decrease in the genderachievement gap, with woman earning 57.3% of all scienceand engineer bachelor’s degrees in 2017, they accountedfor only 20.4% of bachelor’s degrees in physics; thiscontrasts with related fields including chemistry andmathematics or statistics, which approximate parity indegree attainment [15]. Similarly, while there has beengrowth in previously identified underrepresented minoritygroups receiving bachelor’s degrees in science and engi-neering fields, there still remain large achievement gaps.When compared to the distribution of ethnicities in theU.S., some groups such as Black, Hispanic, and AmericanIndian students remain underrepresented in attaining bach-elor’s degrees in physics [15,25].
2. Precollege physics access
Similar disparities may be found within the K-12education system in the U.S., which indicates this maybe a hierarchical issue in the narrowing of the STEMpipeline [13]. The American Institute of Physics reportedthat parity was nearly achieved between men and womenwho enrolled in physics in 2009, although there wereinequities when considering more advanced high schoolphysics courses [23,26]. There has been growth in under-represented minority students enrolling in physics [13],however, only 35% of the Black and 37% of the Hispanic
student populations enrolled in physics in 2013 [15]. Blackand Hispanic students were also shown to be at a positionaldisadvantage as they were often enrolled in “worse off”schools which offered fewer advanced physics coursescompared to “better off” schools [10,13,14,27].Historically, U.S. precollege physics has been the cul-
minating science of either a three- or four-year high schoolsequence [28]. Even after the release of A Nation at RiskReport [29] calling for increased science and mathematicsgraduation requirements, physics has consistently had thelowest enrollments among the core sciences that alsoinclude biology and chemistry [15]. This is a particularissue for underrepresented students who have been iden-tified as less likely to enroll in advanced mathematics andscience courses [30,31]. Research has suggested that earlierplacements in mathematics and science courses positionstudents for later participation in advanced STEM courses[32,33]. However, accelerated learning has been shown tobe inequitable based on sociocultural background [34],often leading to racial stratification in learning opportu-nities [35]. This has been the case in mathematics, whichhas led to negative influences on enrollment and achieve-ment in advanced sciences [36,37]. In an effort to furtherexplore equity issues of physics access and performance inprecollege settings, the present study examines the inter-sectionality of ethnicity and gender in AP Physics accessand performance.
B. AP course taking and academic advantage
The College Board’s Advanced Placement Program wasinitiated in 1952 in an effort to expand access and uni-formity in U.S. higher education. Advanced Placementcourses are elective college-like courses that are offered insome secondary schools throughout the U.S. These coursesculminate in a summative assessment that measures astudent’s ability in the course on a scale of one to five. Ascore of one implies that it is not recommended that astudent receive credit for an equivalent course. A score of afive implies a student is extremely well qualified and hasearned the equivalent of an Aþ or A in the respectivecollege-level course. Equivalent courses are determined bythe postsecondary school for which the student is attempt-ing to receive credit [38]. This program has allowedadvanced students to earn college credit to avoid courseredundancy and to narrow the academic gap betweensecondary school and higher education [39,40].While there has been a large expansion of access to AP
examinations in recent years, there has also been increasedfailure rates, with the number of students earning a score ofone nearly doubling [41]. In some cases, AP programscontinued to grow although few students earned a three orabove on specific examinations [42]. Some schools push thenotion of early college readiness, allowing for AP enrollmentas early as 9th and 10th grade although academic capabilitiesand preparation may be deficient [41].
ROBERT KRAKEHL and ANGELA M. KELLY PHYS. REV. PHYS. EDUC. RES. 17, 020105 (2021)
020105-2

This expansion has not been equitable when consideringcontextual factors such as socioeconomic status, ethnicity,and school size. Larger and densely populated schools tendto offer more AP courses, as opposed to smaller and highneed schools [40,43]. Students traditionally underrepre-sented in STEM have been less likely to be enrolledcompared to their counterparts, even when academicallyready [44]. Klugman [35] suggested a supply and demandviewpoint for enrollment, indicating that while moreunderrepresented students may be recruited into APcourses, parity is difficult to achieve due to a greaterdemand for AP courses from affluent communities. Highlycompetitive colleges and universities consider AP experi-ence a desirable credential [45], placing students whoattend schools with limited AP access at a disadvantage.In terms of performance, research has indicated that Black,Hispanic, and low socioeconomic status students havepassing rates of approximately one-third of the rates forWhite and higher income students [46]. Researchers havesuggested equal access to AP courses should be paired withequitable preparation and support for all students [47,48].
1. AP STEM and academic advantage
Research has documented several academic and posi-tional advantages for students who enroll in AP science. Taiet al. [49] indicated that after controlling for prior academicachievement and early career expectations, students whotook AP Calculus have been more likely to persist inphysical science and engineering. Students who took an APscience other than environmental science were found topersist in life sciences as opposed to nonscience majors[49]. Dougherty et al. [50] found that students who took APcourses were often self-selecting and had characteristicsthat were linked to better college performance. AP par-ticipation may be an indicator of existing academicmotivation as opposed to AP participation increasingacademic motivation [51]. Students who enroll in an APscience courses typically have higher achievement in thesame science in college, regardless of prior educationalhistory and performance [52,53]. However, disparitiespersist in AP STEM performance. While overall APSTEM participation has grown, the failure rates haveincreased steadily from 1997 to 2010, more so for ethnicminorities than White and Asian students [54].Participation in AP Physics has grown in recent years,
and students who have taken the course experience certainadvantages. Enrollment in AP or second year physics hasgrown from 25 000 students in 1987, to 229 000 students in2013, and 241 317 in 2019 [6,55]. A recent study indicatedthat in terms of introductory calculus-based physics per-formance, students who took AP Physics C performed well,and a score of five on the AP Physics 1 exam was also apredictor of strong performance. This suggests that bothalgebra- and calculus-based AP Physics courses are ben-eficial in terms of college physics performance [56]. More
research is needed to understand student performance interms of AP course variability [57], which is particularlyappropriate in physics since there are four AP options.
II. THEORETICAL FRAMEWORK
The theoretical framework for the present study incor-porates an intersectional perspective in examining equity inprecollege advanced physics access and performance.Intersectionality is a theoretical paradigm that identifiesways in which structural discrimination may be embeddedin academic domains [58]. Research has shown that ethnicand gender stereotypes are not additive—the intersectionalhypothesis suggests perceptions of intersectional groupswithin social hierarchies are unique and distinct [59]. Theexamination of group differences in terms of the inter-section of ethnicity and gender may surface STEM dis-parities that require remediation [60]. Such analyses mayidentify opportunities for meaningful reforms that promotethe inclusion of women and traditionally underrepresentedminorities in STEM disciplines. Institutional disaggregatedata often provide a more complete understanding of howstudents with multiple identities experience the complex-ities of STEM learning environments [61].Intersecting marginalized groups of students may share
unique experiences and outcomes that affect STEM abilityperceptions and persistence [62]. For example, women ofcolor have often experienced both overt and subtle tensionsand barriers in pursuing STEM post-secondary study andcareers. Many STEM academic programs designed to servewomen disproportionately advantage White women, whilesimilar programs for underrepresented minority groupsdisproportionately favor men [63]; this concept has beencharacterized as double jeopardy due to the increasedstigma of membership in two or more marginalizedgroups [64].Researchers have identified physics as a particularly
challenging space—women earned 21% of physics bach-elor’s degrees in 2016, yet just 4% were awarded to Blackwomen and 7% to Hispanic women [26]. Women of colorhave often struggled to assume legitimacy in physics due toexperiences involving stereotype threat, perceived intellec-tual incompetence, microaggressions, and dissonance withthe cultural practices of physics communities [21,65,66].More work is needed to quantify structural inequities ineducational settings that may contribute to the persistentlylow representation of women of color in mathematics-intensive fields [67].This research examined intersectional access and perfor-
mance to AP Physics in precollege settings. Since APPhysics is available in four different courses, two algebra-based and two calculus-based, this variability was exploredthrough separate analyses for each course type.Differentiated access and performance by intersectionalgroup may characterize contributing factors to hierarchicalstereotypes and structural inequities in physics learning,
INTERSECTIONAL ANALYSIS OF ADVANCED … PHYS. REV. PHYS. EDUC. RES. 17, 020105 (2021)
020105-3
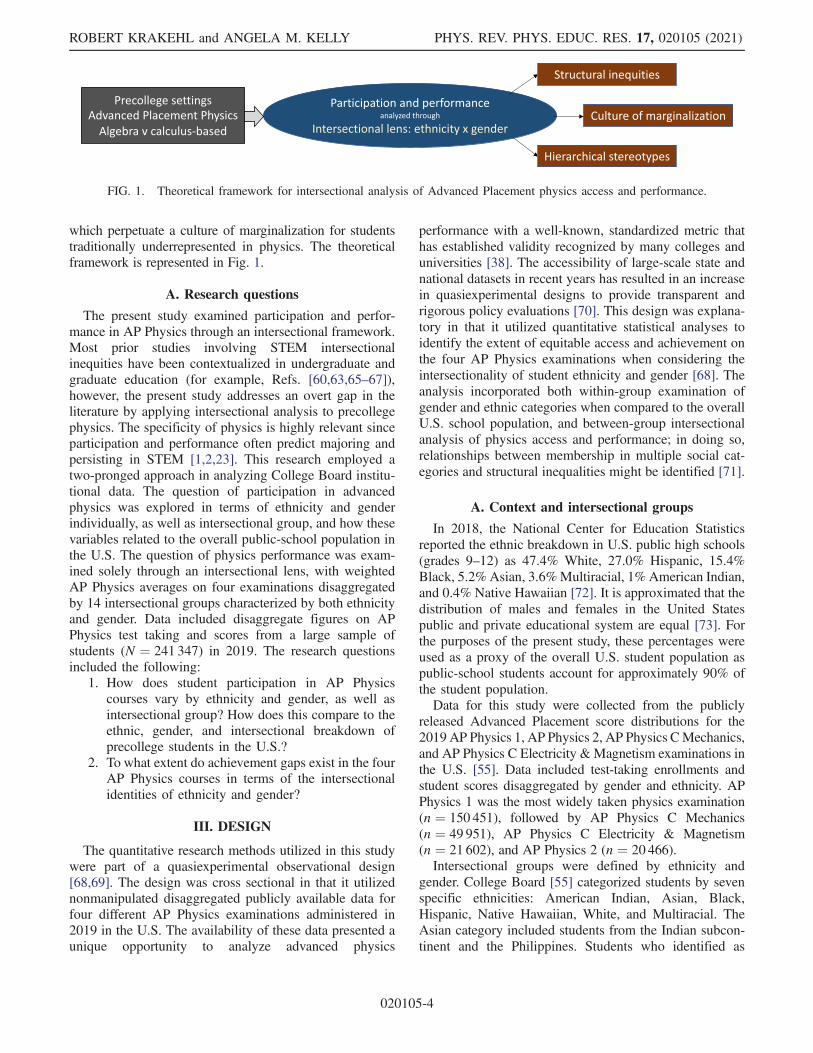
which perpetuate a culture of marginalization for studentstraditionally underrepresented in physics. The theoreticalframework is represented in Fig. 1.
A. Research questions
The present study examined participation and perfor-mance in AP Physics through an intersectional framework.Most prior studies involving STEM intersectionalinequities have been contextualized in undergraduate andgraduate education (for example, Refs. [60,63,65–67]),however, the present study addresses an overt gap in theliterature by applying intersectional analysis to precollegephysics. The specificity of physics is highly relevant sinceparticipation and performance often predict majoring andpersisting in STEM [1,2,23]. This research employed atwo-pronged approach in analyzing College Board institu-tional data. The question of participation in advancedphysics was explored in terms of ethnicity and genderindividually, as well as intersectional group, and how thesevariables related to the overall public-school population inthe U.S. The question of physics performance was exam-ined solely through an intersectional lens, with weightedAP Physics averages on four examinations disaggregatedby 14 intersectional groups characterized by both ethnicityand gender. Data included disaggregate figures on APPhysics test taking and scores from a large sample ofstudents (N ¼ 241 347) in 2019. The research questionsincluded the following:
1. How does student participation in AP Physicscourses vary by ethnicity and gender, as well asintersectional group? How does this compare to theethnic, gender, and intersectional breakdown ofprecollege students in the U.S.?
2. To what extent do achievement gaps exist in the fourAP Physics courses in terms of the intersectionalidentities of ethnicity and gender?
III. DESIGN
The quantitative research methods utilized in this studywere part of a quasiexperimental observational design[68,69]. The design was cross sectional in that it utilizednonmanipulated disaggregated publicly available data forfour different AP Physics examinations administered in2019 in the U.S. The availability of these data presented aunique opportunity to analyze advanced physics
performance with a well-known, standardized metric thathas established validity recognized by many colleges anduniversities [38]. The accessibility of large-scale state andnational datasets in recent years has resulted in an increasein quasiexperimental designs to provide transparent andrigorous policy evaluations [70]. This design was explana-tory in that it utilized quantitative statistical analyses toidentify the extent of equitable access and achievement onthe four AP Physics examinations when considering theintersectionality of student ethnicity and gender [68]. Theanalysis incorporated both within-group examination ofgender and ethnic categories when compared to the overallU.S. school population, and between-group intersectionalanalysis of physics access and performance; in doing so,relationships between membership in multiple social cat-egories and structural inequalities might be identified [71].
A. Context and intersectional groups
In 2018, the National Center for Education Statisticsreported the ethnic breakdown in U.S. public high schools(grades 9–12) as 47.4% White, 27.0% Hispanic, 15.4%Black, 5.2% Asian, 3.6%Multiracial, 1% American Indian,and 0.4% Native Hawaiian [72]. It is approximated that thedistribution of males and females in the United Statespublic and private educational system are equal [73]. Forthe purposes of the present study, these percentages wereused as a proxy of the overall U.S. student population aspublic-school students account for approximately 90% ofthe student population.Data for this study were collected from the publicly
released Advanced Placement score distributions for the2019 AP Physics 1, AP Physics 2, AP Physics CMechanics,and AP Physics C Electricity & Magnetism examinations inthe U.S. [55]. Data included test-taking enrollments andstudent scores disaggregated by gender and ethnicity. APPhysics 1 was the most widely taken physics examination(n ¼ 150 451), followed by AP Physics C Mechanics(n ¼ 49 951), AP Physics C Electricity & Magnetism(n ¼ 21 602), and AP Physics 2 (n ¼ 20 466).Intersectional groups were defined by ethnicity and
gender. College Board [55] categorized students by sevenspecific ethnicities: American Indian, Asian, Black,Hispanic, Native Hawaiian, White, and Multiracial. TheAsian category included students from the Indian subcon-tinent and the Philippines. Students who identified as
FIG. 1. Theoretical framework for intersectional analysis of Advanced Placement physics access and performance.
ROBERT KRAKEHL and ANGELA M. KELLY PHYS. REV. PHYS. EDUC. RES. 17, 020105 (2021)
020105-4

Hispanic and another race were reported as Hispanic, andstudents reported as Multiracial were considered non-Hispanic. These categories align with the NationalCenter for Education Statistics guidelines of combiningrace and ethnicity in educational data reporting [72,74].Race or ethnicity was a categorical variable with sevenclassifications. Gender was reported as a dichotomousvariable (male or female). Consequently, there were 14intersectional ethnicity and gender groups for each physicsexamination. These groups were not considered as additivein terms of gender and ethnicity, rather, they were identifiedand analyzed as unique, distinct entities, consistent with theintersectional hypothesis [59,62].
B. AP Physics course content
As of 2021, there were four AP Physics courses offeredby the College Board. The curriculum for each AP Physicscourse and sample examination questions are publiclyavailable from the College Board [75–78].AP Physics 1 was designed to be a first-year algebra-
based physics course, requiring no previous physics knowl-edge but recommending geometry as a prerequisite andalgebra II as a corequisite [75]. According to CollegeBoard, AP Physics 1 is equivalent to a first-semesteralgebra-based college course with topics including kin-ematics; Newtonian mechanics; rotational kinematics andmechanics; and work, energy, and power.AP Physics 2 was designed as a second-year algebra-
based physics course, building on the topics of AP Physics1 or a comparable course, with precalculus as a prerequisiteor corequisite [76]. AP Physics 2 is equivalent to a secondsemester introductory college physics course coveringtopics such as fluid mechanics; thermodynamics; electricityand magnetism; and atomic and nuclear physics.The AP Physics C courses are both calculus-based
physics courses that are recommended as second-yearcourses in high school. Some schools offer AP PhysicsC Mechanics as an intensive first year course although it isnot recommended by the College Board [77,78]. Calculusis a recommended prerequisite or corequisite. Topicscovered in AP C Mechanics include kinematics;Newton’s laws of motion; work, energy, and power;systems of particles and linear momentum; rotation; andoscillations and gravitation [78]. AP C Electricity &Magnetism includes topics such as electrostatics; conduc-tors, capacitors, and dielectrics; electric circuits; magneticfields; and electromagnetism [77].For all the AP Physics courses, the College Board
recommends a minimum of 25% of course time dedicatedto experimentation, equivalent to that of a college labo-ratory [75–78]. Notably, there is considerable overlapbetween AP Physics 1 and AP Physics C Mechanics, aswell as AP Physics 2 and AP Physics C Electricity &Magnetism, although there are topics in AP Physics 2 not
covered in AP Physics C such as fluid mechanics, thermo-dynamics, optics, and modern physics.
C. Data analysis
Data analytical methods for this study included descrip-tive statistics, chi-square goodness-of-fit tests, and non-parametric comparisons of means. Descriptive statisticswere generated using publicly available datasets thatreported nationwide intersectional enrollment and achieve-ment on AP Physics 1, AP Physics 2, AP Physics CMechanics, and AP Physics C Electricity & Magnetismexaminations in 2019. These statistics included enrollmentby intersectional groups, and the number within each groupwho achieved scores from one through five. The passingscore on the AP examinations is generally a three, althoughthis varies in terms of scores needed to earn credit atspecific colleges [38]. A score of a three was consideredpassing for the purposes of this study. From the scores, aweighted average was calculated based upon the percent-ages of each group in each scoring category.The following null hypotheses were tested to answer the
corresponding research questions:Research Question 1: How does student participation in
AP Physics courses vary by ethnicity and gender, as well asintersectional group? How does this compare to the ethnic,gender, and intersectional breakdown of precollege stu-dents in the U.S.?
1. H0: The representation of each ethnic group whotook the AP Physics examinations was not differentthan the percentage of each ethnic group enrolled inU.S. schools.
2. H0: The representation of each gender group whotook the AP Physics examinations was not differentthan the percentage of each gender group enrolled inU.S. schools.
3. H0: The representation of each intersectional groupwho took the AP Physics examinations was notdifferent than the percentage of each intersectionalgroup enrolled in U.S. schools.
Research Question 2: To what extent do achievementgaps exist in the four AP Physics courses in terms of theintersectional identities of ethnicity and gender?
4. H0: Physics performance will not vary by intersec-tional groups defined by ethnicity and gender.
5. H0: Physics performance will not vary when com-paring men and women within each ethnic group.
To test the first, second, and third hypotheses, chi-squaregoodness-of-fit tests were conducted to determine whetherthere were significant differences between the distributionof gender, ethnicities, and intersectional groups for studentswho took each AP Physics examination and the studentsenrolled in U.S. public schools. For the fourth and fifthhypotheses, Welch’s analysis of variance (ANOVA) withGames-Howell post hoc tests were conducted to determinewhether there were significant differences in physics
INTERSECTIONAL ANALYSIS OF ADVANCED … PHYS. REV. PHYS. EDUC. RES. 17, 020105 (2021)
020105-5

achievement in terms of intersectional groups of ethnicityand gender. American Indian and Native Hawaiian intersec-tional groups were not included in the performanceanalyses since there enrollments were less than 0.15% ofthe population for each test. In some cases, as few as fourstudents from one of these groups took an exam which mayhave compromised their anonymity. The post hoc testsrevealed whether there were significant differences betweenmen and women within each ethnic group. ANOVA resultswere analyzed in conjunction with descriptive statistics toidentify performance disparities in intersectional groups.Assumptions of normality were checked by Q-Q plots.
Because of the size of the samples tested, it was assumedthat the skewed distributions could be modeled by normaldistributions due to the central limit theorem [79].Homogeneity of variance between groups could not beassumed for each of the ANOVA tests, as determined byLevene’s test (p < 0.001), consequently, Welch’s ANOVAand Games-Howell post hoc tests were used.
IV. RESULTS
A. AP Physics enrollment
1. AP Physics 1 access
A chi-square test indicated that the observed ethnicdistribution for students taking the AP Physics 1 exami-nation was significantly different than the expected dis-tributions when compared to public schools in the U.S.,χ2ð6Þ ¼ 54.43, p < 0.001. Descriptive data are summa-rized in Table I. Asian students accounted for a largerportion of students than expected. Hispanic, Black,American Indian, and Native Hawaiian students accounted
for a lower percentage than expected. Additionally, asecond chi-square test indicated that the expected equaldistribution of men and women did not match the observedvalues, with men accounting for 60.4% of the sample,χ2ð1Þ ¼ 4.37, p ¼ 0.036. The distribution of intersectionalgroups was significantly different than expected whencompared to the distribution in public schools in theU.S., χ2ð13Þ ¼ 61.40, p < 0.001. The participation ofall female groups was lower than their male counterparts,with the exception of Black students. White men enrolled ata higher rate than expected, and White women enrolled at alower rate.
2. AP Physics 2 access
Similarly, a chi-square analysis was performed to com-pare observed ethnic distributions for students taking theAP Physics 2 examination. The model was significant,χ2ð6Þ ¼ 89.78, p < 0.001. Black, Hispanic, AmericanIndian, and Native Hawaiian students accounted for a lowerpercentage than expected, whereas Asian studentsaccounted for a larger portion than expected. The distri-bution ofmen andwomen in AP Physics 2 was significantlydifferent than expected, χ2ð1Þ ¼ 18.88, p < 0.001. Menaccounted for 71.7%of the students taking theAP Physics 2examination. The distribution of intersectional groups wassignificantly different than expected when compared to thepublic schools in the U.S., χ2ð13Þ ¼ 122.23, p < 0.001.The participation of all female groups was lower thantheir male counterparts. As with AP Physics 1, White menenrolled at a higher rate, and White women enrolled at alower rate.
TABLE I. AP Physics enrollment percentages by intersectional group as compared to U.S. secondary enrollment in grades 9–12, 2018[55,72].
Intersectional groupaU.S. secondarypopulation (%) AP Physics 1 (%) AP Physics 2 (%) AP Physics C Mechanics (%) AP Physics C E/M (%)
Amer Indian female 0.5 0.085 0.034 0.038 0.023Amer Indian male 0.5 0.14 0.13 0.10 0.083Asian female 2.6 8.2 7.6 9.3 9.5Asian male 2.6 12.1 16.9 20.9 26.4Black female 7.7 2.4 1.1 0.84 0.54Black male 7.7 2.4 1.8 1.6 1.4Hispanic female 13.5 8.2 4.0 2.8 2.0Hispanic male 13.5 11.5 10.3 7.3 6.6Multiracial female 1.8 2.0 1.4 1.5 1.2Multiracial male 1.8 2.8 3.4 3.4 3.5Nat Hawaiian female 0.2 0.051 0.020 0.026 0.037Nat Hawaiian male 0.2 0.092 0.083 0.046 0.046White female 23.7 18.6 14.1 13.7 10.8White male 23.7 31.4 39.1 38.5 37.7
aEthnic group percentages were divided in two to estimate intersectional group percentages, since the National Center for EducationStatistics and many states do not report secondary enrollments by gender.
ROBERT KRAKEHL and ANGELA M. KELLY PHYS. REV. PHYS. EDUC. RES. 17, 020105 (2021)
020105-6
3. AP Physics C Mechanics access
The chi square model examining AP Physics CMechanics access was significant, χ2ð6Þ ¼ 143.64,p < 0.001, indicating variance in distributions by ethnicity.Black, Hispanic, American Indian, and Native Hawaiianstudents accounted for lower percentages of the studentpopulation than expected, while Asian students accountedfor a larger portion than expected. The distribution of menand women in AP Physics C Mechanics was significantlyhigher than expected, χ2ð1Þ ¼ 19.05, p < 0.001. Menaccounted for 71.9% of the students taking AP PhysicsC Mechanics. The distribution of intersectional groups wassignificantly different than expected when compared to thepublic schools in the U.S., χ2ð13Þ ¼ 184.29, p < 0.001.Similar trends for both AP Physics 1 and 2 were found witha larger percentage of White men than expected, and Whitewomen enrolling at a lower rate than expected. In all cases,the participation of all female groups was lower than theirmale counterparts.
4. AP Physics C Electricity & Magnetism access
The chi square model measuring ethnic participation APPhysics C Electricity & Magnetism was significantχ2ð6Þ ¼ 206.96, p < 0.001, indicating variance in distri-butions. Black, Hispanic, American Indian, and NativeHawaiian students accounted for lower portions of thestudent population than expected, whereas Asian studentsaccounted for a larger portion than expected. The distri-bution of men in AP Physics C Electricity & Magnetismwas significantly higher than expected, χ2ð1Þ ¼ 26.66,p < 0.001. Men accounted for 75.8% of the AP PhysicsElectricity & Magnetism students. The distribution ofintersectional groups was significantly different thanexpected when compared to public schools in the U.S.,χ2ð13Þ ¼ 279.46, p < 0.001. A larger percentage of Whitemen than expected, and White women enrolling at a lowerrate than expected. The participation of all female groupswas lower than their male counterparts.
5. AP Physics access summary
For all AP physics examinations, Asian women tended tobe overrepresented compared to all other intersectionalgroups that included women, except for Multiracial womenin the AP Physics 1 course. Asian, White, and Multiracialmen were found to be overrepresented in each of the APPhysics courses, whereas Black, Hispanic, AmericanIndian, and Native Hawaiian men tended to be under-represented. The percentage of men in each examinationwas higher than their women counterparts, except for Blackmen and women in AP Physics 1.Enrollment and performance data for all AP Physics
examinations are summarized in Table I.
B. Performance in AP Physics 1 and 2
1. Intersectional analysis of AP Physics 1 performance
When examining differences among intersectional groupAP Physics 1 scores, a one-way ANOVAwith the Games—Howell post hoc test indicated that there were significantdifferences in the weighted mean scores, Welch’sFð9;24908.82Þ¼3163.62, p < 0.001, Cohen’s d ¼ 0.77,a medium to large effect. Since so few American Indian andNative Hawaiian scores were reported, intersectionalgroups with these ethnicities were not included in sub-sequent analyses. For all remaining ethnic groups, men hada higher weighted average than women (p < 0.001). Thisis consistent with research that suggests gender is often astronger predictor of academic outcomes related to STEMcareer pathways than ethnicity [80].Notable findings were further identified by descriptive
statistics for all intersectional groups, as represented inTable II. More than half of students who took the APPhysics 1 examination (56.1%) scored below a score ofthree, with an overall weighted average score of x̄ ¼ 2.46.This is consistent with research suggesting expandedaccess to AP course taking often results in lower passingrates [41,42].When considering intersectional groups, Asian men and
White men performed the highest on the AP Physics 1examination, with average scores of x̄ ¼ 2.98 andx̄ ¼ 2.78, respectively; however, a significant number ofthese intersectional groups still failed the examination(38.7% of Asian men and 44.9% of White men). Thesegroups outperformed their female ethnic counterparts(p < 0.001), with Asian women experiencing a failurerate of 49.7%, and White women a failure rate of 59.2%.The failure rates for women who were also under-
represented ethnic minorities was exceedingly high.These groups included Hispanic women (86.4%) andBlack women (87.7%), who were also outperformed bytheir male ethnic counterparts (p < 0.001). The failurerates for men from traditionally underrepresented ethnicgroups in STEM were: Hispanic men (72.7%) and Blackmen (76.8%).Multiracial men outperformed Multiracial women
(p < 0.001), and their respective performances were onthe borderline between the dominant and underrepresentedethnicities. Multiracial men had a failure rate of 46.3%, andMultiracial women 60.5%.
2. Intersectional analysis of AP Physics 2 performance
AP Physics 2 scores were also analyzed for differencesamong intersectional groups. A one-way ANOVAwith theGames-Howell post hoc test indicated that there weresignificant differences among the weighted mean scores,Welch’s Fð9; 2278.63Þ ¼ 203.36, p < 0.001, d ¼ 0.59, amedium to large effect. When looking at gender differences
INTERSECTIONAL ANALYSIS OF ADVANCED … PHYS. REV. PHYS. EDUC. RES. 17, 020105 (2021)
020105-7
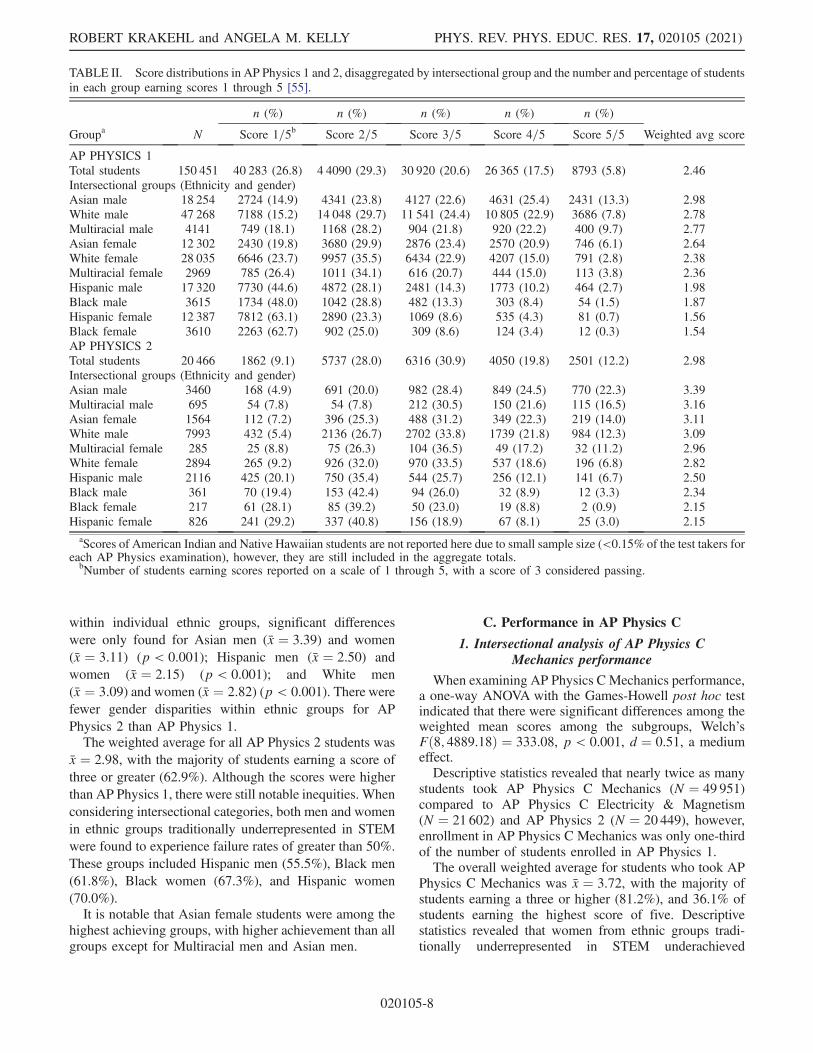
within individual ethnic groups, significant differenceswere only found for Asian men (x̄ ¼ 3.39) and women(x̄ ¼ 3.11) (p < 0.001); Hispanic men (x̄ ¼ 2.50) andwomen (x̄ ¼ 2.15) (p < 0.001); and White men(x̄ ¼ 3.09) and women (x̄ ¼ 2.82) (p < 0.001). There werefewer gender disparities within ethnic groups for APPhysics 2 than AP Physics 1.The weighted average for all AP Physics 2 students was
x̄ ¼ 2.98, with the majority of students earning a score ofthree or greater (62.9%). Although the scores were higherthan AP Physics 1, there were still notable inequities. Whenconsidering intersectional categories, both men and womenin ethnic groups traditionally underrepresented in STEMwere found to experience failure rates of greater than 50%.These groups included Hispanic men (55.5%), Black men(61.8%), Black women (67.3%), and Hispanic women(70.0%).It is notable that Asian female students were among the
highest achieving groups, with higher achievement than allgroups except for Multiracial men and Asian men.
C. Performance in AP Physics C
1. Intersectional analysis of AP Physics CMechanics performance
When examining AP Physics C Mechanics performance,a one-way ANOVA with the Games-Howell post hoc testindicated that there were significant differences among theweighted mean scores among the subgroups, Welch’sFð8; 4889.18Þ ¼ 333.08, p < 0.001, d ¼ 0.51, a mediumeffect.Descriptive statistics revealed that nearly twice as many
students took AP Physics C Mechanics (N ¼ 49 951)compared to AP Physics C Electricity & Magnetism(N ¼ 21 602) and AP Physics 2 (N ¼ 20 449), however,enrollment in AP Physics C Mechanics was only one-thirdof the number of students enrolled in AP Physics 1.The overall weighted average for students who took AP
Physics C Mechanics was x̄ ¼ 3.72, with the majority ofstudents earning a three or higher (81.2%), and 36.1% ofstudents earning the highest score of five. Descriptivestatistics revealed that women from ethnic groups tradi-tionally underrepresented in STEM underachieved
TABLE II. Score distributions in AP Physics 1 and 2, disaggregated by intersectional group and the number and percentage of studentsin each group earning scores 1 through 5 [55].
n (%) n (%) n (%) n (%) n (%)
Groupa N Score 1=5b Score 2=5 Score 3=5 Score 4=5 Score 5=5 Weighted avg score
AP PHYSICS 1Total students 150 451 40 283 (26.8) 4 4090 (29.3) 30 920 (20.6) 26 365 (17.5) 8793 (5.8) 2.46Intersectional groups (Ethnicity and gender)Asian male 18 254 2724 (14.9) 4341 (23.8) 4127 (22.6) 4631 (25.4) 2431 (13.3) 2.98White male 47 268 7188 (15.2) 14 048 (29.7) 11 541 (24.4) 10 805 (22.9) 3686 (7.8) 2.78Multiracial male 4141 749 (18.1) 1168 (28.2) 904 (21.8) 920 (22.2) 400 (9.7) 2.77Asian female 12 302 2430 (19.8) 3680 (29.9) 2876 (23.4) 2570 (20.9) 746 (6.1) 2.64White female 28 035 6646 (23.7) 9957 (35.5) 6434 (22.9) 4207 (15.0) 791 (2.8) 2.38Multiracial female 2969 785 (26.4) 1011 (34.1) 616 (20.7) 444 (15.0) 113 (3.8) 2.36Hispanic male 17 320 7730 (44.6) 4872 (28.1) 2481 (14.3) 1773 (10.2) 464 (2.7) 1.98Black male 3615 1734 (48.0) 1042 (28.8) 482 (13.3) 303 (8.4) 54 (1.5) 1.87Hispanic female 12 387 7812 (63.1) 2890 (23.3) 1069 (8.6) 535 (4.3) 81 (0.7) 1.56Black female 3610 2263 (62.7) 902 (25.0) 309 (8.6) 124 (3.4) 12 (0.3) 1.54AP PHYSICS 2Total students 20 466 1862 (9.1) 5737 (28.0) 6316 (30.9) 4050 (19.8) 2501 (12.2) 2.98Intersectional groups (Ethnicity and gender)Asian male 3460 168 (4.9) 691 (20.0) 982 (28.4) 849 (24.5) 770 (22.3) 3.39Multiracial male 695 54 (7.8) 54 (7.8) 212 (30.5) 150 (21.6) 115 (16.5) 3.16Asian female 1564 112 (7.2) 396 (25.3) 488 (31.2) 349 (22.3) 219 (14.0) 3.11White male 7993 432 (5.4) 2136 (26.7) 2702 (33.8) 1739 (21.8) 984 (12.3) 3.09Multiracial female 285 25 (8.8) 75 (26.3) 104 (36.5) 49 (17.2) 32 (11.2) 2.96White female 2894 265 (9.2) 926 (32.0) 970 (33.5) 537 (18.6) 196 (6.8) 2.82Hispanic male 2116 425 (20.1) 750 (35.4) 544 (25.7) 256 (12.1) 141 (6.7) 2.50Black male 361 70 (19.4) 153 (42.4) 94 (26.0) 32 (8.9) 12 (3.3) 2.34Black female 217 61 (28.1) 85 (39.2) 50 (23.0) 19 (8.8) 2 (0.9) 2.15Hispanic female 826 241 (29.2) 337 (40.8) 156 (18.9) 67 (8.1) 25 (3.0) 2.15
aScores of American Indian and Native Hawaiian students are not reported here due to small sample size (<0.15% of the test takers foreach AP Physics examination), however, they are still included in the aggregate totals.
bNumber of students earning scores reported on a scale of 1 through 5, with a score of 3 considered passing.
ROBERT KRAKEHL and ANGELA M. KELLY PHYS. REV. PHYS. EDUC. RES. 17, 020105 (2021)
020105-8

compared to other intersectional groups. Black womenwere found to be at a particular disadvantage with 50.6% oftest takers failing the examination. For all other intersec-tional groups, more than half the students passed the APPhysics C Mechanics examination, although the lowestscores (x̄ < 3.00) were earned by Hispanic women(x̄ ¼ 2.73), and Black women (x̄ ¼ 2.53). Significantdifferences were found in the mean weighted averagesbetween men and women within each ethnicity (Table III).
2. Intersectional analysis of AP Physics CElectricity & Magnetism performance
With regard to AP Physics C Electricity & Magnetismperformance, a one-way ANOVA with the Games-Howellpost hoc test indicated that there were significantdifferences between the weighted mean score among thesubgroups, Welch’s Fð9; 1615.90Þ ¼ 103.73, p < 0.001,d ¼ 0.42, a small to medium effect.The overall weighted average for students who took the
AP Physics C Electricity & Magnetism exam wasx̄ ¼ 3.55, with the majority of students earning a scoreof three or better (71.9%), and 35.4% of students earning a
five. Similar to the other AP physics examinations, sig-nificant differences were found between the genders withineach ethnicity.When considering intersectional groups, results were
similar to those of AP Physics C Mechanics. Asian men(x̄ ¼ 3.82), Multiracial men (x̄ ¼ 3.71), Asian women(x̄ ¼ 3.62), and White men (x̄ ¼ 3.59) were the highestachievers. The lowest scores (x̄ ¼ 3.00) were earned byBlack men (x̄ ¼ 2.75), Hispanic women (x̄ ¼ 2.60), andBlack women (x̄ ¼ 2.14). Failure rates of greater than 50%were experienced by Black men (51.2%), Hispanic women(55.8%), and Black women (68.2%).
V. DISCUSSION
A. Conclusions
The results of the present study highlight considerabledemographic disparities in enrollment and performance inAP Physics. Precollege physics is an important contextsince many women and underrepresented ethnic groups donot persist in physics in post-secondary study; indeed, thistime period has been identified as the “one significant leak
TABLE III. Score distributions in AP Physics C Mechanics and Electricity & Magnetism, disaggregated by intersectional group andthe number and percentage of students in each group earning scores 1 through 5 [55].
n (%) n (%) n (%) n (%) n (%)Groupa N Score 1=5b Score 2=5 Score 3=5 Score 4=5 Score 5=5 Weighted avg score
AP PHYSICS C—MECHANICSTotal students 49 951 4160 (8.3) 5212 (10.4) 8957 (17.9) 13 582 (27.2) 18 040 (36.1) 3.72Intersectional groups (Ethnicity and gender)Asian male 10 450 545 (5.2) 738 (7.1) 1434 (13.7) 2678 (25.6) 5055 (48.4) 4.05Multiracial male 1705 101 (5.9) 161 (9.4) 280 (16.4) 455 (26.7) 708 (41.5) 3.88White male 19 253 1225 (6.4) 1737 (9.0) 3363 (17.5) 5553 (28.8) 7375 (38.3) 3.84Asian female 4623 299 (6.5) 446 (9.6) 868 (18.8) 1317 (28.5) 1693 (36.6) 3.79Multiracial female 752 67 (8.9) 104 (13.8) 173 (23.0) 202 (26.9) 206 (27.4) 3.50White female 6850 690 (10.1) 959 (14.0) 1487 (21.7) 1950 (28.5) 1764 (25.8) 3.46Hispanic male 3639 598 (16.4) 531 (14.6) 753 (20.7) 886 (24.3) 871 (23.9) 3.25Black male 775 142 (18.3) 140 (18.1) 168 (21.7) 181 (23.4) 144 (18.6) 3.06Hispanic female 1376 336 (24.4) 298 (21.7) 309 (22.5) 261 (19.0) 172 (12.5) 2.73Black female 421 132 (31.4) 81 (19.2) 98 (23.3) 74 (17.6) 36 (8.6) 2.53AP PHYSICS C—ELECTRICITY & MAGNETISMTotal students 21 602 2311 (10.7) 3767 (17.4) 2893 (13.4) 4989 (23.1) 7642 (35.4) 3.55Intersectional groups (Ethnicity and gender)Asian male 5707 456 (8.0) 783 (13.7) 660 (11.6) 1219 (21.4) 2589 (45.4) 3.82Multiracial male 764 59 (7.7) 115 (15.1) 109 (14.3) 190 (24.9) 291 (38.1) 3.71Asian female 2054 177 (8.6) 358 (17.4) 269 (13.1) 511 (24.9) 739 (36.0) 3.62White male 8148 778 (9.5) 1406 (17.3) 1107 (13.6) 1907 (23.4) 2950 (36.2) 3.59Multiracial female 267 25 (9.4) 62 (23.2) 45 (16.9) 65 (24.3) 70 (26.2) 3.35White female 2341 280 (12.0) 523 (22.3) 370 (15.8) 612 (26.1) 556 (23.8) 3.27Hispanic male 1423 276 (19.4) 275 (19.3) 213 (15.0) 328 (23.0) 331 (23.3) 3.11Black male 299 81 (27.1) 72 (24.1) 39 (13.0) 55 (18.4) 52 (17.4) 2.75Hispanic female 442 112 (25.3) 135 (30.5) 67 (15.2) 76 (17.2) 52 (11.8) 2.60Black female 116 54 (46.6) 25 (21.6) 11 (9.5) 19 (16.4) 7 (6.0) 2.14
aScores of American Indian and Native Hawaiian students are not reported here due to small sample size (<0.15% of the test takers foreach AP Physics examination), however, they are still included in the aggregate totals.
bNumber of students earning scores reported on a scale of 1 through 5, with a score of 3 considered passing.
INTERSECTIONAL ANALYSIS OF ADVANCED … PHYS. REV. PHYS. EDUC. RES. 17, 020105 (2021)
020105-9
in the physics pipeline” since many young women takephysics in high school yet they earn few of bachelor’sdegrees in physics [81] (p. 13). Although intersectionalityhas been proposed as an insightful analytical lens forexploring inequities in STEM participation and perfor-mance [21,60,61,67], this perspective has rarely beenapplied in physics education research, particularly at thehigh school level. The results of this study are discussed interms of AP access and performance, and intersectionalgroup disparities. This is followed by implications forpractice, study limitations, and suggestions for future linesof inquiry.
1. AP Physics access and performance
The four AP Physics courses were differentiated in termsof enrollment and performance. Enrollment in algebra-based AP Physics 1 was over 150 000 in 2019, which wasapproximately three times the enrollment in AP Physics CMechanics, and seven times the enrollment in AP Physics 2and AP Physics C Electricity & Magnetism. The relativelyhigh student participation in AP Physics 1 may beexplained by the nature of the course—it was designedto be taken as a first-year course, and it requires a lowerlevel of mathematical preparation and proficiency than theAP Physics C courses. AP Physics 1 is typically aprerequisite for AP Physics 2. Notably, the high enrollmentin AP Physics 1 may be positioning students at a long-termdisadvantage with regard to STEM persistence, since theoverall weighted mean score was x̄ ¼ 2.46, and more thanhalf of students in all but four of the intersectional groupsfailed the examination. Exceptionally high failure rateswere reported for underrepresented women, with 88% ofBlack women and 86% of Hispanic women failing. Womenfrom ethnic groups traditionally underrepresented in STEMhave been previously identified as having to reconcilemultiple identities with their cultural misalignment withphysics communities in order to develop a sense ofbelonging in the field [21,65,66]. With so many of studentsin traditionally marginalized groups experiencing failure, itraises the question as to how well schools are serving thesestudents at a critical juncture in the STEM pipeline.The high enrollment and low performance in AP Physics
1 is consistent with studies that suggested such coursesreach a point of saturation, where too many unpreparedstudents are enrolling and not meeting AP academicstandards [41,42]. Research has indicated that schoolsmay be incentivized to enroll students in as many APcourses as possible for accreditation and accountability[82], while many students who took AP Physics did notreport their scores to their colleges [56,83]. Althoughstudies have demonstrated that physics course taking iscorrelated to persistence and post-secondary success inSTEM [1–3], student achievement in these courses was notdirectly addressed, which may have perpetuated a mis-leading narrative that exposure is equivalent to learning the
material. The coinciding of high enrollments with highfailure rates necessitates the examination of persistence asmore than just course taking—supports for learning andperformance must be implemented for expanded access toadvanced physics to be effective.Students in second-year AP Physics courses all demon-
strated higher passing rates [AP Physics 2 (x̄ ¼ 2.98), APPhysics C Mechanics (x̄ ¼ 3.72), AP Physics C Electricity& Magnetism (x̄ ¼ 3.55)] and lower failure rates whencompared to AP Physics 1 [AP Physics 2 (27.1%), APPhysics C Mechanics (18.8%), AP Physics C Electricity &Magnetism (28.1%)]. However, intersectional analysesindicated inequitably higher failure rates for studentstraditionally underrepresented in physics, particularlyBlack and Hispanic women. The higher scores may havebeen due to the prerequisites of the courses, includingpassing AP Physics 1, and the expected mathematicalprecursors and proficiencies. Since many students failedAP Physics 1, fewer students may have been allowed toenroll in second-year physics courses. This is also sup-ported by the notion that students enrolling in second-yearcourses may be self-selecting motivated students whoalready possess positional academic advantages tied topersistence in STEM [50,51].
2. Intersectional group disparities
As the selectivity and rigor increased among the APPhysics courses (in terms of recommended prerequisitiesand mathematical presentation), the enrollment distributionof student ethnicities increasingly diverged from the U.S.school population. As indicated in prior research related toAP participation, Black, Hispanic, American Indian, andNative Hawaiian students were all underrepresented inAP Physics courses [84]. Since AP Physics 2 and APPhysics C courses were recommended as second-yearcourses, the inequitable decreases in enrollment maybe partly explained by disparities in access based onstudents’ socioeconomic and sociocultural backgrounds[10,13,14,27,34,35]. Furthermore, research has shown thathigh poverty schools that serve a majority of studentsunderrepresented in STEM tend to have restricted access toadvanced science and mathematics courses such as APPhysics [10,14,30,31,35,85]. Failure rates in AP Physics 1may also provide a plausible explanation, which is furthersupported by the lack of students reporting AP Physicsscores [56,83]. The negative reputation associated with thelikelihood of failure may discourage students from takingAP Physics courses due to undesirable academic repercus-sions and diminished post-secondary options.For nearly all AP Physics courses, men tended to
outscore women in most ethnicities. Black and Hispanicwomen tended to be among the lowest scoring groups on allAP Physics examinations. This exemplifies the “doublejeopardy” consequence for women traditionally under-represented in physics, where they experience cumulative
ROBERT KRAKEHL and ANGELA M. KELLY PHYS. REV. PHYS. EDUC. RES. 17, 020105 (2021)
020105-10

disadvantages by virtue of their membership in multipleunderrepresented groups [64,86]. Membership in sociallymarginalized groups may disproportionately influencestudents’ experiences and feelings of belonging in physics[21,65,66]. More research is needed to understand howthese experiences might deter high school students, par-ticularly women of color, from persisting in STEM due tonegative experiences with academic failure and the culturalpractices of physics classrooms.
B. Implications
1. Broadening access and diminished performance
While high school physics access has been a persistentissue [6,8–15], it is important for schools and policy makersto consider the idea of oversaturation [41,42]. Algebra-based AP Physics provided the widest access likely due tolower-level mathematical prerequisites and corequisities,yet the failure rates were extremely high, suggestingunderlying problems related to prior academic preparation.Also, increased selectivity and mathematical rigor in APPhysics C increased the gender gap in participation yetdecreased the achievement gap, as evidenced by effectsizes. While research has suggested there is increasedachievement with when access is restricted [14], theseconditions may be confounded by student self-selectionbased on perceived relevance and interest [87,88] andprerequisite science and mathematics course taking [89].With increased access to AP coursework there needs to bean equivalent increase in student academic preparation andsupport [47,48], particularly for academically marginalizedintersectional groups.Findings may also indicate misalignment between what is
taught in the course andwhat ismeasured on the examination[83]. Curricular fidelity to College Board standards has oftenbeen cited as an issue in select schools [90,91]. While theCollege Board states prerequisite recommendations in theirexamination descriptions [75–78], the audit process does notappear to take into considerationwhether students had accessto the academic prerequisites. Additionally, some studentsmay be at a disadvantage as the courses have material basedon physics experimentation, which may be inequitabledepending on available school resources [31,89]. Theseissues require further exploration to determine whethercontextual structural inequalities impact ethnic minoritywomen disproportionately.Traditionally in the U.S., students take physics in either
11th or 12th grade and often follow a four-year sciencesequence which may inhibit the taking of a second year ofphysics [28,92]. Research has shown that many of thestudents who were identified as underrepresented in thisstudy’s findings have been shown to have lower enroll-ments in prerequisite and corequisite courses [11,15,30].The science course sequence and availability of advancedmathematics are issues for consideration in designinginterventions to promote physics accessibility and learning.
2. Physics failure and sociocognitive impacts
It is important to consider some of the psychosocialphenomena that often result from a lack of academicsuccess. The prevalence of failure in high enrollmentadvanced STEM courses such as AP Physics 1 mayinfluence the task self-efficacy beliefs, physics self-concept, and outcomes expectations of many students,particularly those underrepresented in the field. More than80% of women of color failed this examination and did notreceive college credit for the course. This is an alarmingrate of failure that may impact the intentions of thesewomen to pursue STEM careers that involve post-secondary physics coursetaking. One such sociocognitiveimpact is diminished self-efficacy, which is the belief thatone can accomplish specific tasks to reach a certain goal[93], in this case, understanding and applying the physicsprinciples in the curriculum. Self-efficacy has been shownto be a significant predictor of physics achievement andpersistence [94–96]. If these women do not believe they canmaster an introductory physics course, they may notformulate career aspirations that depend upon this task.Self-efficacy and career outcomes expectations have beenidentified as significant predictors of the STEM careerintentions of intersectional groups [60].Physics related self-concept, or sense of belonging in the
field, is often formed by comparing one’s academicperformance to that of one’s peers, and evaluating personalphysics academic success when compared to other schoolsubjects [97]; this has also been shown as a significantpredictor of physics achievement and career interest [98].Students who do not formulate a sense of belonging basedon failure in AP Physics may further exacerbate the lack ofdiversity in physics post-secondary study and careers.Students who are traditionally underrepresented inSTEM, specifically, women of color, may be particularlyvulnerable to the effects of failure. Poor performance mayreinforce stereotype threat, or the confirmation of negativeracial and gender stereotypes about their capacity to excelin physics [99]. These stereotypes may also influenceinstructors’ perceptions and latent biases about physicsperformance [100]; this is consequential since teacherencouragement has been shown to foster physics identity[101,102]. Physics educators should consider ways inwhich traditionally marginalized high school studentsmight be better supported in advanced physics coursework.Potential interventions include critical feedback [103],instructors communicating beliefs about effort and malle-able intelligence [104], and fostering social inclusion inphysics communities of practice [65].
C. Limitations
There were several limitations to this study. The datacollected and released by the College Board were detailed,yet certain categorizations were missing [55]. Althoughintersectionality data were disaggregated in terms of
INTERSECTIONAL ANALYSIS OF ADVANCED … PHYS. REV. PHYS. EDUC. RES. 17, 020105 (2021)
020105-11

ethnicity and gender, other relevant identities were notconsidered, for example, socioeconomic status, physical orcognitive disability, and sexual orientation. Both socioeco-nomic status and location have been shown to be predictorsof physics achievement [14], therefore, the inclusion ofother social categorizations would provide additional trans-parency. Intersectional data provide context for students’experiences in shared academic pursuits, which identifiesareas for targeted interventions. Since the data wereaggregated across the U.S., many of the contextual detailscould not be studied. Although the use of national data mayincrease generalizability, the nature of education policylocalized. Data disaggregated by locale and school needs-to-resource capacity would highlight poverty-relateddisparities.Some students enrolled in AP Physics did not take the
exam, and some who took the exam did not report theirscores [83]. Consequently, select students enrolled in APPhysics in 2019 were not included as part of the sample.This may have introduced selection bias with lowerperforming students not included in the analysis. Sincestudents had to pay to take the examinations, it is possiblethat students took the course but could not afford the testingfee, which may have eliminated students in high povertyschools from the sample.The College Board recommends course credit if students
earn a score of a three of greater [38]. While this metric hasoften been used in research [57], it is not generalizablesince not all colleges accept a score of a three as credit, ifthey accept the AP score at all. Some colleges requirescores of a four or a five [38]. Utilizing three as a cutoffpoint may mask further inequities that are related topersistence, since students may be unwilling to repeatsimilar coursework in college.The study also has some limited internal validity related
to the research design. Many variables contributed tostudent performance outcomes aside from correlatingmembership in gender, ethnic, and intersectional groups.These include students’ sociocognitive perspectives, schoolconditions and resources, teacher characteristics and qual-ifications, and fidelity to the AP Physics curricula. Theauthors acknowledge that the intersectional analysis hadinherent limitations related to the limited predictive scopeof the independent variables. Future research might exam-ine contextual conditions that more clearly characterizeobserved disparities.
D. Future research
This study has raised several questions that may beexamined in future studies to elicit insights for broadening
access and improving performance in secondary physics.As physics education is largely contextual and localized,large scale hierarchical studies could examine additionalschool-, teacher-, and student-level variables that maypredict, mediate, and/or moderate access and performance.Such independent variables may include the availability ofscience or mathematics prerequisities, tracking, socioeco-nomic status, teacher certification and experience, studentSTEM interest, and prior academic performance. Qualitativeresearch on the formulation and persistence of STEM careeraspirations in relation to AP Physics performance may beconducted to examine factors that inform targeted interven-tions. In both quantitative and qualitative work, an intersec-tional lens provides ameans to evaluate group discriminationbased upon marginalized social identities; these studies mayprovide powerful, insightful paradigms for deconstructingstructural inequalities [71]. This work is essential in STEMcommunities where women of color are persistently under-represented [17,60,61,67].With AP Physics 1 being reasonably accessible but
demonstrating significant achievement gaps among inter-sectional groups, interventions that target high risk studentsin AP Physics 1 may be explored in order to improve thequality of learning occurring in the classrooms.Researchers should examine ways in which supports andscaffolds may be implemented to improve overall perfor-mance and diminish achievement gaps for traditionallymarginalized students. With many students only taking afirst-year course that is predominantly mechanics based,qualitative studies regarding student beliefs on the rel-evance of physics topics are warranted. This may fostermore culturally relevant learning environments that bettersupport students [105].The present study provides a unique examination of how
enrollment and performance in AP Physics is differentiatedamong intersectional groups, as well as singular groupsdefined by ethnicity and gender. The identification of thesedisparities in high school physics presents opportunities forpolicy makers and researchers to explore this issue ingreater depth. In pursuing this line of inquiry in futurework, more equitable practices and outcomes may beidentified to avoid chronic physics pipeline constraints atthe juncture of high school and higher education.
ACKNOWLEDGMENTS
The authors would like to thank Martin Palermo, KeithSheppard, Eric Mazur, Thomas Weinacht, and the anony-mous reviewers for their insightful recommendations forthis manuscript.
ROBERT KRAKEHL and ANGELA M. KELLY PHYS. REV. PHYS. EDUC. RES. 17, 020105 (2021)
020105-12

[1] W. Tyson, R. Lee, K. M. Borman, and M. A. Hanson,Science, technology, engineering, and mathematics(STEM) pathways: High school science and math course-work and postsecondary degree attainment, J. Educ.Students Placed at Risk 12, 243 (2007).
[2] W. Tyson, Modeling engineering degree attainmentusing high school and college physics and calculuscoursetaking and achievement, J. Eng. Educ. 100, 760(2011).
[3] X. Wang, Why students choose STEM majors: Motiva-tion, high school learning, and postsecondary context ofsupport, Am. Educ. Res. J. 50, 1081 (2013).
[4] ACT, Developing the STEM Education Pipeline (ACT,Washington, DC, 2006).
[5] P. M. Sadler, G. Sonnert, Z. Hazari, and R. Tai, The role ofadvanced high school coursework in increasing stemcareer interest, Sci. Educat. 23, 1 (2014), https://eric.ed.gov/?id=EJ1034751.
[6] S. White and C. L. Tesfaye, High School Physics Coursesand Enrollments: Results from the 2012-13 NationwideSurvey of High School Physics Teachers, https://www.aip.org/statistics/reports/high-school-physics-courses-enrollments-0, 2014
[7] P. J. Mulvey and S. Nicholson, Physics Bachelor’sDegrees: 2018. Results from the 2018 Survey of Enroll-ments and Degrees, https://www.aip.org/statistics/reports/physics-bachelors-degrees-2018, 2020.
[8] A. L. Griffith, Persistence of women and minorities inSTEM field majors: Is it the school that matters?, Econ.Educ. Rev. 29, 911 (2010).
[9] A. M. Kelly and K. Sheppard, Newton in the Big Apple:Access to high school physics in New York City, Phys.Teach. 46, 280 (2008).
[10] A. M. Kelly and K. Sheppard, Secondary physics avail-ability in an urban setting: Issues related to academicachievement and course offerings, Am. J. Phys. 77, 902(2009).
[11] U. S. Department of Education, Office of civil rights, inSTEM Course Taking (U. S. Department of Education,Washington, DC, 2018).
[12] S. White and J. Tyler, Who Teaches High School Physics?Results from the 2012-13 Nationwide Survey of HighSchool Physics Teachers, https://www.aip.org/statistics/reports/who-teaches-high-school-physics-0, 2014.
[13] S. White and J. Tyler, Underrepresented Minorities in HighSchool Physics: Results from the 2012-13 NationwideSurvey of High School Physics Teachers, https://www.aip.org/statistics/reports/underrepresented-minorities-high-school-physics, 2015.
[14] R. Krakehl, A. M. Kelly, K. Sheppard, and M. Palermo,Physics teacher isolation, contextual characteristics, andstudent achievement, Phys. Rev. Phys. Educ. Res. 16,020117 (2020).
[15] National Science Board, Science and Engineering Indica-tors 2018 (National Science Foundation, Alexandria, VA,2018).
[16] H. Metcalf, D. Russell, and C. Hill, Broadening thescience of broadening participation in STEM throughcritical mixed methodologies and intersectionality frame-works, Am. Behav. Sci. 62, 580 (2018).
[17] S. M. Malcom, P. Q. Hall, and J. W. Brown, The DoubleBind: The Price of Being a Minority Woman in Science(American Association for the Advancement of Science,Report of a Conference of Minority Women Scientists,Arlie House, Warrenton, VA, 1976).
[18] E. Hennessey, J. Cole, P. Shastri, J. Esquivel, C. Singh, R.Johnson, and S. Ghose, Workshop report: Intersectingidentities—gender and intersectionality in physics, AIPConf. Proc. 2109, 040001 (2019).
[19] L. T. Ko, R. R. Kachchaf, M. Ong, and A. K. Hodari,Narratives of the double bind: Intersectionality in lifestories of women of color in physics, astrophysics andastronomy, AIP Conf. Proc. 1513, 222 (2013).
[20] J. M. Nissen, I. H. M. Horses, and B. Van Dusen, Inves-tigating society’s educational debts due to racism andsexism in student attitudes about physics using quantita-tive critical race theory. Phys. Rev. Phys. Educ. Res. 17,010116 (2021).
[21] A. L. Traxler, X. C. Cid, J. Blue, and R. Barthelemy,Enriching gender in physics education research: A binarypast and a complex future, Phys. Rev. Phys. Educ. Res.12, 020114 (2016).
[22] B. Van Dusen and J. Nissen, Equity in college physicsstudent learning: A critical quantitative intersectionalityinvestigation, J. Res. Sci. Teach. 57, 33 (2020).
[23] S.White andC. L.Tesfaye,Female Students inHighSchoolPhysics: Results from the 2008-09 Nationwide Survey ofHigh School Physics Teachers (American Institute ofPhysics, College Park, MD, 2011), https://www.aip.org/statistics/reports/female-students-high-school-physics
[24] M. Dew, J. Perry, L. Ford, W. Bassichis, and T. Erukhi-mova, Gendered performance differences in introductoryphysics: A study from a large land-grant university, Phys.Rev. Phys. Educ. Res. 17, 010106 (2021).
[25] U. S. Census Bureau, QuickFacts United States (U. S.Department ofCommerce,Washington,DC, 2019), https://www.census.gov/quickfacts/fact/table/US/PST045219.
[26] A. M. Porter and R. Ivie, Women in Physics andAstronomy, 2019, https://www.aip.org/statistics/reports/women-physics-and-astronomy-2019?dm_i=21LG,682YQ,EMUFG9,OIV4Y,1, 2019.
[27] A.M. Kelly andK. Sheppard, Access to elite urban scienceschools in the U.S.: Opportunity, disparate impact, andequal protection, Teachers College Record (2019), https://www.tcrecord.org/Content.asp?ContentID=22951.
[28] K. Sheppard and D. M. Robbins, Physics was once firstand was once for all, Phys. Teach. 41, 420 (2003).
[29] National Commission on Excellence in Education, ANation at Risk: The Imperative for Educational Reform(U.S. Department of Education, Washington, DC, 1983).
[30] National Action Council for Minorities in Engineering,Inc., Pre-College Challenges for URMs in Engineering(National Action Council for Minorities in Engineering,Inc., White Plains, NY, 2014).
[31] W. F. Tate, B. D. Jones, E. Thorne-Wallington, andM. C. Hogrebe, Science and the city: Thinking geo-spatially about opportunity to learn, Urban Educ. 47,399 (2012).
[32] F. G. Paul, Grouping within Algebra I: A structural sievewith powerful effects for low-income, minority, and
INTERSECTIONAL ANALYSIS OF ADVANCED … PHYS. REV. PHYS. EDUC. RES. 17, 020105 (2021)
020105-13

immigrant students, Educ. Eval. Policy Anal. 19, 262(2005).
[33] F. R. Spielhagen, Closing the achievement gap in math:The long-term effects of eighth-grade algebra, J. Adv.Academics 18, 34 (2006).
[34] H. Ayalon and A. Gamoran, Stratification in academicsecondary programs and educational inequality in Israeland the United States, Comparative Educ. 44, 54 (2000).
[35] J. Klugman, The Advanced Placement arms race and thereproduction of educational inequality, Teachers CollegeRecord 115, 1 (2013), https://www.tcrecord.org/Content.asp?ContentId=16965.
[36] X. Ma, Understanding the relationship between math-ematics, and science coursework patterns, Teachers Col-lege Record 111, 2101 (2009), https://www.tcrecord.org/Content.asp?ContentId=15382.
[37] C. Muller, C. Riegle-Crumb, K. S. Schiller, L. Wilkinson,and K. Frank, Race and academic achievement in raciallydiverse high schools: Opportunity and stratification,Teachers College Record 112, 1038 (2010), https://www.ncbi.nlm.nih.gov/pmc/articles/PMC2893342/.
[38] College Board, AP Credit Policy Search (College Board,New York, NY, 2021).
[39] K. Klopfenstein and M. K. Thomas, The link betweenAdvanced Placement experience and early collegesuccess, South. Econ. J. 75, 873 (2009), https://www.semanticscholar.org/paper/The-Link-between-Advanced-Placement-Experience-and-Klopfenstein-Thomas/5d97cdec475fe0c410a08970dc2394d938e0f720.
[40] R. T. Warne, R. Larsen, B. Anderson, and A. J. Odasso,The impact of participation in the Advanced Placementprogram on students’ college admissions test scores, J.Educ. Res. 108, 400 (2015).
[41] E. Judson and A. Hobson, Growth and achievementtrends of Advanced Placement (AP) exams in Americanhigh schools, Am. Secondary Educ. 43, 59 (2015), https://www.jstor.org/stable/43694211.
[42] W. Lichten, in AP: A Critical Examination of theAdvanced Placement Program, edited by P. M. Sadler,G. Sonnert, R. H. Tai, and K. Klopfenstein (HarvardEducation Press, Cambridge, MA, 2010), pp. 233–243.
[43] P. Handwerk, N. Tognatta, R. J. Coley, and D. H. Gitomer,Access to Success: Patterns of Advanced PlacementParticipation in U.S. High Schools, Policy Informa-tion Report (Educational Testing Service, Princeton,NJ, 2008).
[44] College Board, The 9th Annual AP Report to the Nation(College Board, New York, NY, 2013).
[45] C. O. Sathre and C. D. Blanco, Moving the Needle onAccess and Success: A Study of State and InstitutionalPolicies and Practices (Western Interstate Commissionfor Higher Education, Boulder, CO, 2006).
[46] National Center for Educational Achievement, TheAdvanced Placement Program Benefits Mainly Well-Prepared Students Who Pass AP Exams (ACT, Inc.,Iowa City, IA, 2010).
[47] C. M. Callahan, Advanced Placement and InternationalBaccalaureate Programs for Talented Students in Ameri-can High Schools: A Focus on Science and Mathematics
(National Research Center on the Gifted and Talented,Storrs, CT, 2003).
[48] R. M. Kyburg, H. Hertberg-Davis, and C. M. Callahan,Advanced Placement and International BaccalaureatePrograms: Optimal learning environments for talentedminorities?, J. Adv. Academics 18, 172 (2007).
[49] R. H. Tai, C. Q. Liu, J. T. Almarode, and X. Fan, in AP: ACritical Examination of the Advanced Placement Pro-gram, edited by P. M. Sadler, G. Sonnert, R. H. Tai, andK. Klopfenstein (Harvard Education Press, Cambridge,MA, 2010), pp. 109–119.
[50] C. Dougherty, L. Mellor, and S. Jian, The Relationshipbetween Advanced Placement and College Graduation.2005 AP Study Series, Report 1 (National Center forEducational Achievement, Austin, TX, 2006).
[51] R. R. Bryan, S. M. Glynn, and J. Kittleson, Motivation,achievement, and Advanced Placement intent of highschool students learning science, Sci. Educ. 95, 1049(2011).
[52] P. M. Sadler and G. Sonnert, in AP: A Critical Exami-nation of the Advanced Placement Program, edited byP. M. Sadler, G. Sonnert, R. H. Tai, and K. Klopfenstein(Harvard Education Press, Cambridge, MA, 2010),pp. 119–137.
[53] P. M. Sadler and R. H. Tai, Advanced Placement examscores as a predictor of performance in introductorycollege biology, chemistry and physics courses, Sci.Educat. 16, 1 (2007), https://files.eric.ed.gov/fulltext/EJ783418.pdf.
[54] E. Judson, Science and mathematics Advanced Placementexams: Growth and achievement over time, J. Educ. Res.110, 209 (2017).
[55] College Board, AP Participation and Performance Data2019 (College Board, New York, NY, 2019).
[56] E. W. Burkholder, AP physics: A closer look, Phys. Rev.Phys. Educ. Res. 17, 013101 (2021).
[57] R. T. Warne, Research on the academic benefits of theAdvanced Placement program: Taking stock and lookingforward, SAGE Open 7, 1 (2017).
[58] S. Cho, K. W. Crenshaw, and L. McCall, Toward a field ofintersectionality studies: Theory, applications, and praxis,Signs: J. Women Culture Soc. 38, 785 (2013).
[59] N. Ghavami and L. A. Peplau, An intersectional analysisof gender and ethnic stereotypes: Testing three hypoth-eses, Psychol. Women Q. 37, 113 (2013).
[60] A. Byars-Winston and J. G. Rogers, Testing intersection-ality of race=ethnicity × gender in a social–cognitivecareer theory model with science identity, J. Counsel.Psychol. 66, 30 (2019).
[61] J. Gaston Gayles and K. N. Smith, Advancing theoreticalframeworks for intersectional research on women inSTEM, New Dir. Institutional Res. 2018, 27 (2018).
[62] D. T. Ireland, K. E. Freeman, C. E. Winston-Proctor,K. D. DeLaine, S. McDonald Lowe, and K. M. Woodson,(Un) hidden figures: A synthesis of research examiningthe intersectional experiences of Black women and girlsin STEM education, Rev. Res. Educ. 42, 226 (2018).
[63] M. Ong, C. Wright, L. Espinosa, and G. Orfield, Insidethe double bind: A synthesis of empirical research on
ROBERT KRAKEHL and ANGELA M. KELLY PHYS. REV. PHYS. EDUC. RES. 17, 020105 (2021)
020105-14

undergraduate and graduate women of color in science,technology, engineering, and mathematics, Harv. Educ.Rev. 81, 172 (2011).
[64] J. C. Williams, Double jeopardy? An empirical study withimplications for the debates over implicit bias and inter-sectionality, Harvard J. LawGender 37, 185 (2014), https://repository.uchastings.edu/faculty_scholarship/1278.
[65] M. Ong, Body projects of young women of color inphysics: Intersections of gender, race, and science, Soc.Probl. 52, 593 (2005).
[66] M. Ong, J. M. Smith, and L. T. Ko, Counterspaces forwomen of color in STEM higher education: Marginal andcentral spaces for persistence and success, J. Res. Sci.Teach. 55, 206 (2018).
[67] L. Malcom and S. M. Malcom, The double bind: The nextgeneration, Harv. Educ. Rev. 81, 162 (2011).
[68] B. Johnson, Toward a new classification of nonexper-imental quantitative research, Educ. Res. 30, 3 (2001).
[69] W. R. Shadish, T. D. Cook, and D. T. Campbell, Exper-imental and Quasi-Experimental Designs for GeneralizedCausal Inference (Houghton Mifflin, Boston, MA, 2002).
[70] M. Gopalan, K. Rosinger, and J. B. Ahn, Use of quasi-experimental research designs in education research:Growth, promises, and challenges, Rev. Res. Educ. 44,218 (2020).
[71] N. M. Else-Quest and J. S. Hyde, Intersectionality inquantitative psychological research: II. Methods andtechniques, Psychol. Women Q. 40, 319 (2016).
[72] National Center for Education Statistics, Enrollment inPublic Elementary and Secondary Schools by Level,Grade, and Race/Ethnicity 2018, https://nces.ed.gov/programs/digest/d20/tables/dt20_203.65.asp?current=yes.
[73] K. Bauman and S. Cranney, School Enrollment in theUnited States: 2018, Population Characteristics, CurrentPopulation Reports P20-584 (U.S. Census Bureau,Washington, DC, 2020).
[74] National Center for Education Statistics, Status andTrends in the Education of Racial and Ethnic Groups2016 (U.S. Department of Education, Washington, DC,2016).
[75] College Board, AP Physics 1 Course and Exam Descrip-tion (College Board, New York, NY, 2019).
[76] College Board, AP Physics 2 Course and Exam Descrip-tion (College Board, New York, NY, 2019).
[77] College Board, AP Physics C: Electricity and MagnetismCourse and Exam Description (College Board, New York,NY, 2019).
[78] College Board, AP Physics C: Mechanics Course andExam Description (College Board, New York, NY, 2019).
[79] R. G. Miller, Beyond ANOVA: Basics of Applied Statistics(CRC Press, Boca Raton, FL, 1997).
[80] S. Nix and L. Perez-Felkner, Difficulty orientations,gender, and race/ethnicity: an intersectional analysis ofpathways to STEM degrees, Soc. Sci. 8, 43 (2019).
[81] R. Ivie and K. N. Ray,Women in physics and astronomy,2005, https://www.aip.org/sites/default/files/statistics/women/women-pa-05.pdf, 2005.
[82] Education Commission of the States, Adavanced Place-ment: State Provides Accountability Incentives for AP
Courses (Education Commission of the States, Denver,CO, 2021).
[83] E. W. Burkholder and C. E. Wieman, What do AP physicscourses teach and the AP physics exam measure?, Phys.Rev. Phys. Educ. Res. 15, 020117 (2019).
[84] J. P. Gollub and R. Spital, Advanced physics in the highschools, Phys. Today 55, No. 5, 47 (2002).
[85] S. White and C. L. Tesfaye, High School Physics Avail-ability: Results from the 2012-13 Nationwide Survey ofHigh School Physics Teachers, https://www.aip.org/statistics/reports/high-school-physics-availability-0, 2014.
[86] S. Yang, B. A. Jackson, and A. Zajicek, A changinglandscape? An intersectional analysis of race and genderdisparity in access to social capital, Sociol. Spectrum 41,80 (2021).
[87] C. Williams, M. Stanisstreet, K. Spall, E. Boyes, and D.Dickson, Why aren’t secondary students interested inphysics?, Phys. Educ. 38, 324 (2005).
[88] F. McDonnell, Why so few choose physics: An alternativeexplanation for the leaky pipeline, Am. J. Phys. 73, 583(2005).
[89] A. M. Kelly, Physics teachers’ perspectives in factors thataffect urban physics participation and accessibility, Phys.Rev. Phys. Educ. Res. 9, 010122 (2013).
[90] S. J. Cech, Number of schools offering AP falls afterfirst audit of courses, Educ. Week 27, 1 (2007), https://www.edweek.org/teaching-learning/number-of-schools-offering-ap-falls-after-first-audit-of-courses/2007/11.
[91] R. W. Schwenz and S. Miller, The AP Chemistry courseaudit: A fertile ground for identifying and addressingmisconceptions about the course and process, J. Chem.Educ. 91, 1362 (2014).
[92] K. Sheppard and D. M. Robbins, Chemistry, the centralscience? The history of the high school science sequence,J. Chem. Educ. 82, 561 (2005).
[93] G. Hardy, Academic self-concept: Modeling and meas-uring for science, Res. Sci. Educ. 44, 549 (2014).
[94] A. M. Cavallo, W. H. Potter, and M. Rozman, Genderdifferences in learning constructs, shifts in learningconstructs, and their relationship to course achievementin a structured inquiry, yearlong college physics coursefor life science majors, School Sci. Math. 104, 288(2004).
[95] V. Sawtelle, E. Brewe, and L. H. Kramer, Exploring therelationship between self-efficacy and retention in intro-ductory physics, J. Res. Sci. Teach. 49, 1096 (2012).
[96] G. Nehmeh and A. M. Kelly, Facilitating the self-deter-mination of undergraduate women in physics: The role ofexternal validation, Res. Sci. Technol. Educ. (2020).
[97] J. Möller and H.W. Marsh, Dimensional comparisontheory, Psychol. Rev. 120, 544 (2013).
[98] B. Nagengast and H.W. Marsh, Big fish in little pondsaspire more: Mediation and cross-cultural generalizabilityof school-average ability effects on self-concept andcareer aspirations in science, J. Educ. Psychol. 104,1033 (2012).
[99] G. C. Marchand and G. Taasoobshirazi, Stereotype threatand women’s performance in physics, Int. J. Sci. Educ.35, 3050 (2013).
INTERSECTIONAL ANALYSIS OF ADVANCED … PHYS. REV. PHYS. EDUC. RES. 17, 020105 (2021)
020105-15

[100] S. I. Hofer, Studying gender bias in physics grading: Therole of teaching experience and country, Int. J. Sci. Educ.37, 2879 (2015).
[101] Z. Hazari, G. Sonnert, P. M. Sadler, and M.-C.Shanahan, Connecting high school physics experiences,outcome expectations, physics identity, and physicscareer choice: A gender study, J. Res. Sci. Teach. 47,978 (2010).
[102] G. Nehmeh and A. M. Kelly, Women physicistsand sociocognitive considerations in career choice andpersistence, J. Women Minorities Sci. Engr. 24, 95(2018).
[103] D. S. Yeager, V. Purdie-Vaughns, J. Garcia, N. Apfel, P.Brzustoski, A. Master, W. T. Hessert, M. E. Williams, andG. L. Cohen, Breaking the cycle of mistrust: Wiseinterventions to provide critical feedback across the racialdivide, J. Exp. Psychol. Gen. 143, 804 (2014).
[104] L. S. Blackwell, K. H. Trzesniewski, and C. S. Dweck,Implicit theories of intelligence predict achievementacross an adolescent transition: A longitudinal studyand an intervention, Child Dev. 78, 246 (2007).
[105] F. Lawrenz, N. B. Wood, A. Kirchhoff, N. K. Kim, and A.Eisenkraft, Variables affecting physics achievement, J.Res. Sci. Teach. 46, 961 (2009).
ROBERT KRAKEHL and ANGELA M. KELLY PHYS. REV. PHYS. EDUC. RES. 17, 020105 (2021)
020105-16