Energy transport in plasma etching of nanoporous dielectric materials
Upload
khangminh22Category
view
0download
0
Trends to 2030 – update 2005
EUROPEANCOMMISSION
Directorate-General for Energy and Transport
EUROPEAN ENERGY AND TRANSPORT
ISSN 1683-142X

EUROPEAN ENERGY AND TRANSPORT
Trends to 2030 – update 2005
European Commission

Europe Direct is a service to help you find answers
to your questions about the European Union
Freephone number (*):
00 800 6 7 8 9 10 11(*) Certain mobile telephone operators do not allow access to 00 800 numbers or these calls may be billed.
A great deal of additional information on the European Union is available on the Internet. It can be accessed through the Europa server (http://europa.eu).
Any comments and questions on this publication may be sent to: [email protected]
Luxembourg: Office for Official Publications of the European Communities, 2006
ISBN 92-79-02305-5
Cover illustrations: European Communities, ExxonMobil, Wintershall, Uniport Bilbao
© European Communities, 2006 Reproduction is authorised provided the source is acknowledged.
Printed in Belgium
PRINTED ON WHITE CHLORINE-FREE BLEACHED PAPER
Legal Notice
The European Commission does not guarantee the accuracy of the data included in this publication, nor does it accept responsibility for any use made thereof.
The manuscript was completed on 22 May 2006.
This publication was prepared by the Institute of Communication and Computer Systems of National Technical University of Athens (ICCS-NTUA), E3M-Lab, Greece, for the Directorate-General for Energy and Transport and represents that organisation’s views on energy facts, figures and projections. These views have not been adopted or in any way approved by the Commission and should not be relied upon as a statement of the Commission’s or the Directorate-General’s views.
Authors: Dr. L. Mantzos and Prof. P. Capros.

3
Table of Contents EXECUTIVE SUMMARY ................................................................................................................................. 5
1. EU-25 ENERGY AND TRANSPORT REFERENCE CASE TO 2030 (BASELINE)......................... 13
1.1. INTRODUCTION..................................................................................................................................... 13 1.2. MAIN ASSUMPTIONS OF THE BASELINE SCENARIO ............................................................................... 13
1.2.1. Demographic and weather assumptions...................................................................................... 14 1.2.2. Macroeconomic assumptions....................................................................................................... 15 1.2.3. International fuel prices .............................................................................................................. 18 1.2.4. Policy assumptions ...................................................................................................................... 19 1.2.5. Committed investment and decommissioning in power generation ............................................. 21 1.2.6. Other Assumptions....................................................................................................................... 21
1.3. BASELINE SCENARIO RESULTS.............................................................................................................. 22 1.3.1. Main Findings.............................................................................................................................. 22 1.3.2. Primary Energy Needs................................................................................................................. 23 1.3.3. Final Energy Demand projections............................................................................................... 27
1.3.3.1. Final energy demand by sector.................................................................................................................27 1.3.3.2. Final energy demand by fuel ....................................................................................................................29
1.3.4. Electricity and steam generation ................................................................................................. 31 1.3.4.1. Electricity and steam demand...................................................................................................................31 1.3.4.2. Capacities .................................................................................................................................................33 1.3.4.3. Electricity and steam generation by fuel type...........................................................................................35 1.3.4.4. Fuel input and efficiency in power generation .........................................................................................36
1.3.5. The outlook for energy-related CO2 emissions ............................................................................ 37 1.3.6. Key indicators.............................................................................................................................. 38
1.4. CONCLUDING REMARKS ....................................................................................................................... 41 2. EU-27 AND EUROPE-30 ENERGY AND TRANSPORT OUTLOOK TO 2030................................ 44
2.1. INTRODUCTION..................................................................................................................................... 44 2.2. MAIN ASSUMPTIONS ............................................................................................................................. 44 2.3. ENERGY AND CO2 EMISSION DEVELOPMENTS IN EU-27 AND EUROPE-30 ............................................ 45 2.4. CONCLUDING REMARKS ....................................................................................................................... 48
GLOSSARY....................................................................................................................................................... 49
APPENDIX 1: BASELINE SCENARIO DEMOGRAPHIC AND MACROECONOMIC ASSUMPTIONS ................................................................................................................................................ 53
SUMMARY ASSUMPTIONS BY COUNTRY AND GROUPS OF COUNTRIES ........................................................... 53 APPENDIX 2: BASELINE SCENARIO RESULTS (SUMMARY RESULTS) ......................................... 73
SUMMARY RESULTS BY COUNTRY AND GROUPS OF COUNTRIES .................................................................... 73

4
List of figures
FIGURE 1-1: STRUCTURE OF THE EU-25 ECONOMY, SHARES IN GROSS VALUE ADDED 2000, 2030 18
FIGURE 1-2: EU-25 PRIMARY ENERGY INDICATORS (INDEX 1990=100), 1995-2030 23 FIGURE 1-3: STRUCTURE OF PRIMARY ENERGY DEMAND IN EU-25. 26 FIGURE 1-4: STRUCTURE OF FINAL ENERGY DEMAND BY FUEL IN EU-25. 30 FIGURE 1-5: ELECTRICITY GENERATION BY FUEL IN EU-25 35 FIGURE 1-6: CONVERGENCE IN EU-25 (RATIOS: EU-15 TO NMS) 40 FIGURE 1-7: EVOLUTION OF ENERGY INTENSITY IN EU-25 (IN TOE PER MEURO’00) 41 FIGURE 2-1: STRUCTURE OF THE ECONOMY, SHARES IN GROSS VALUE ADDED 2000, 2030: EU-
27 AND EUROPE-30 COMPARED WITH EU-25 45 FIGURE 2-2: STRUCTURE OF PRIMARY ENERGY DEMAND, SHARES IN 2000, 2030: EU-27 AND
EUROPE-30 COMPARED WITH EU-25 46
List of Tables
TABLE 1-1: POPULATION TRENDS IN THE EU-25, 1990 TO 2030 14 TABLE 1-2: NUMBER OF HOUSEHOLDS IN EU-25, 1990 TO 2030 15 TABLE 1-3: EVOLUTION OF GROSS DOMESTIC PRODUCT IN EU-25, 1990 TO 2030 16 TABLE 1-4: PER CAPITA GDP IN EU-25 17 TABLE 1-5: EVOLUTION OF SECTORAL VALUE ADDED IN EU-25 17 TABLE 1-6: INTERNATIONAL PRICE ASSUMPTIONS 19 TABLE 1-7: PRIMARY PRODUCTION OF FUELS IN EU-25 24 TABLE 1-8: PRIMARY ENERGY DEMAND IN EU-25 25 TABLE 1-9: IMPORT DEPENDENCY IN EU-25 26 TABLE 1-10: FINAL ENERGY DEMAND IN EU-25 BY SECTOR 28 TABLE 1-11: FINAL ENERGY DEMAND IN EU-25 BY FUEL 30 TABLE 1-12: ELECTRICITY REQUIREMENTS BY SECTOR IN EU-25 31 TABLE 1-13: DISTRIBUTED STEAM REQUIREMENTS BY SECTOR IN EU-25 32 TABLE 1-14: POWER GENERATION CAPACITY BY TYPE OF PLANT IN EU-25, 1995-2030. 34 TABLE 1-15: FUEL USE FOR ELECTRICITY GENERATION IN EU-25 36 TABLE 1-16: CO2 EMISSIONS BY SECTOR IN EU-25 37 TABLE 1-17: KEY INDICATORS FOR THE EU-25 ENERGY SYSTEM 39 TABLE 2-1: POPULATION TRENDS IN EU-27 AND EUROPE-30, 1990 TO 2030 44 TABLE 2-2: EVOLUTION OF GROSS DOMESTIC PRODUCT IN EU-27 AND EUROPE-30, 1990 TO 2030
45 TABLE 2-3: GROSS INLAND CONSUMPTION IN EU-27 AND EUROPE -30 46 TABLE 2-4: IMPORT DEPENDENCY IN EU-27 AND EUROPE-30 47 TABLE 2-5: EVOLUTION OF CO2 EMISSIONS IN EU-27 AND EUROPE-30 47

5
Executive Summary
The Baseline 2005 report provides an update of the “Trends to 2030” published in 2003. The new Baseline takes into account a high energy import price environment, the unsatisfactory economic growth of recent years and the more subdued growth prospects taking into account demographic developments. It includes, furthermore, new policies and measures implemented in the Member States. The results were derived with the PRIMES model by a consortium led by the National Technical University of Athens, supported by some more specialised models.
The Baseline for the EU and each of its Member States simulates current trends and policies as implemented in the Member States by the end of 2004. While informing about the development of policy relevant indicators, such as the renewables shares in 2010, the Baseline does not assume that indicative targets, as set out in Directives, will be necessarily met. The numerical values for these indicators are outcomes of the modelling; they reflect implemented policies rather than targets. This applies also for CO2 emissions.
The projections for passenger and freight transport activity, which are a key driver for energy demand, stem from the “partial implementation scenario” of the mid-term review of the Transport White Paper; this provides a transport forecast under current conditions.
In addition to its role as a trend projection, the Baseline is a reference development for policy scenarios. Policy scenarios that will be constructed with reference to the Baseline examine – among other things – the achievement of energy policy targets. The Baseline scenario is used as the reference for additional policy-relevant scenario analyses addressing issues such as renewables, nuclear, energy efficiency, energy import prices, alternative fuels in transport and the effects of transport policy action as well as climate change.
Assumptions
The baseline scenario for EU-25 represents current trends and policies as implemented in the Member States up to the end of 2004. In particular, the baseline modelling assumes a continuation of policies on economic reform (Lisbon) and the completion of the internal energy market. The baseline scenario includes current policies on energy efficiency and renewables, without assuming that specific targets are necessarily met. For example, the renewables shares in electricity are modelling results (some 18% in 2010 for the EU) that show the effects of policies or their absence in the Member States. On transport, the baseline assumes that the targets agreed for 2008/09 with the car industry on the reduction of specific CO2 emissions for new cars are achieved without assuming a further strengthening of targets thereafter. The baseline assumes furthermore that decisions on nuclear phase-out in some old Member States will be implemented as decided and that certain nuclear plants with safety concerns in new Member States will be closed as agreed. Nevertheless, in Member States without a phase-out decision, the baseline scenario assumptions result in considerable investment in new nuclear capacity depending on the economics of power generation and the overall energy policy context in the individual countries.
The baseline does not take into account possible additional action in the Member States for living up to their Kyoto commitments, nor the possible development of climate change policy for the years after 2012. CO2 emissions are modelling results based on the development of the energy economy, which in turn reflects among other things policies implemented so far. For the purpose of the baseline a CO2 price of 5 €/t CO2 has been assumed up to 2030 for those sectors covered by the EU Emission Trading Scheme (ETS) as a reflection of the medium-term price level of the emerging international carbon market (including Clean Development Mechanism) and the EU ETS being connected to it.
6
The 2005 update of the energy baseline takes into account lower economic growth expectations (2.0% on average up to 2030) in line with DG ECFIN short and long term projections as well as slightly increasing population up to 2020, which is more or less stagnant thereafter.
The projections are based on a high oil price environment with oil prices of 55$/bbl on average in 2005 and 58$/bbl in 2030 (prices are in 2005 money; in nominal terms this could be 95 $/bbl in 2030 if one can assume that the inflation target of the ECB of 2% pa would be achieved)1. The baseline price assumptions for the EU are the result of world energy modelling with the POLES model that derives price trajectories for oil, gas and coal under a conventional wisdom view of the development of the world energy system2.
Overall results on energy consumption
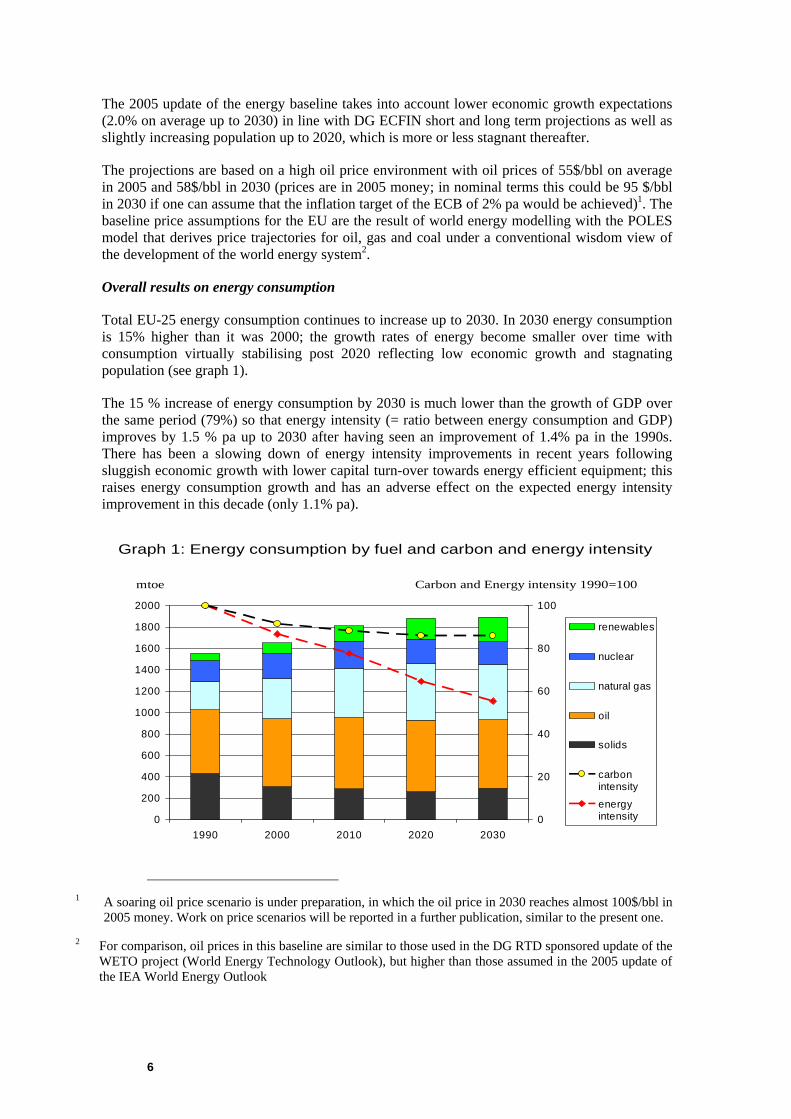
Total EU-25 energy consumption continues to increase up to 2030. In 2030 energy consumption is 15% higher than it was 2000; the growth rates of energy become smaller over time with consumption virtually stabilising post 2020 reflecting low economic growth and stagnating population (see graph 1).
The 15 % increase of energy consumption by 2030 is much lower than the growth of GDP over the same period (79%) so that energy intensity (= ratio between energy consumption and GDP) improves by 1.5 % pa up to 2030 after having seen an improvement of 1.4% pa in the 1990s. There has been a slowing down of energy intensity improvements in recent years following sluggish economic growth with lower capital turn-over towards energy efficient equipment; this raises energy consumption growth and has an adverse effect on the expected energy intensity improvement in this decade (only 1.1% pa).
Graph 1: Energy consumption by fuel and carbon and energy intensity
0
200
400
600
800
1000
1200
1400
1600
1800
2000
1990 2000 2010 2020 20300
20
40
60
80
100
renewables
nuclear
natural gas
oil
solids
carbonintensity
energyintensity
Carbon and Energy intensity 1990=100mtoe
1 A soaring oil price scenario is under preparation, in which the oil price in 2030 reaches almost 100$/bbl in
2005 money. Work on price scenarios will be reported in a further publication, similar to the present one.
2 For comparison, oil prices in this baseline are similar to those used in the DG RTD sponsored update of the WETO project (World Energy Technology Outlook), but higher than those assumed in the 2005 update of the IEA World Energy Outlook

7
The energy consumption increase of 240 mtoe between 2000 and 2030 will be met by natural gas and renewables, which are the only energy sources that increase their market shares.
Oil remains the most important fuel, although its consumption in 2030 should not exceed the current level. Natural gas demand is expected to expand considerably by 140 mtoe up to 2030 after the substantial increase already seen in the 1990s. Solid fuels are projected to decrease somewhat by 2020 and to come back almost to the current level in 2030 following high oil and gas prices and the nuclear phase-out in certain Member States.
Renewables increase more than all other fuels in relative terms (more than doubling their contribution from current levels by the year 2030). In absolute terms they increase by 135 mtoe from 2000 to 2030 contributing nearly as much as natural gas towards the increase of energy demand.
Following the political decisions on nuclear-phase out in certain old Member States and the closure of plants with safety concerns in some new Member States, nuclear is somewhat smaller in 2030 than it was in 2000 (minus 11 %). Although nuclear generation has been rising in recent years, after 2010 the agreed policies on nuclear and the replacement cycles for older plants lead to more nuclear plant closure than there will be new investment. Nevertheless, high fossil fuel prices encourage significant investment in new nuclear power stations (including the new EPR type) in several Member States.
The carbon free and indigenous energy sources, renewables and nuclear, increase their joint contribution considerably by almost one third or nearly 100 mtoe up to 2030.
Consequently, carbon intensity (ratio of CO2 emission to energy consumption) improves in large parts of the projection period. However, this improvement comes to a halt post 2020 as nuclear plants are progressively retired and largely replaced by coal.
Despite the increase in fossil fuel use, their share in total energy consumption falls through 2030 reaching 77% (compared with 80% in 2000); the shares of solid fuels and oil decline by 3 and 5 percentage points respectively while the gas share increases 5 percentage points.
Share of energy sources in total energy consumptions (in %):
1990 2000 2010 2020 2030
Solid fuels
Oil
Gas
Nuclear
Renewables
27.8
38.3
16.7
12.7
4.4
18.5
38.4
22.8
14.4
5.8
15.8
36.9
25.5
13.7
7.9
13.8
35.5
28.1
12.1
10.4
15.5
33.8
27.3
11.1
12.2
The renewables share rises throughout the projection period from less than 6% in 2000 to 8% in 2010, to over 10% in 2020 and to 12% in 2030. Nevertheless, under baseline conditions the EU target on renewables for 2010 will not be achieved and meeting the 20% target under discussion for renewables will require almost a doubling of the share compared with the baseline development3.
3 A policy scenario is being prepared that is designed to have a renewables share close to 20% in 2020
reflecting possible targets put forward in the present policy debate. A further publication, similar to the present one, will report on such a scenario as well as an energy efficiency scenario and its combination with renewables scenarios.

8
The share of nuclear in total energy consumption remains close to 14% up to 2010, from where it decreases to 11% by 2030; in total the share of indigenous and carbon free energy sources rises from 20% in 2000 to 23% in 2030.
Production, import dependency and CO2 emissions
While energy consumption increases at a rather low pace through 2030, there is a steep decline in indigenous production, in particular of hydrocarbons, solid fuels and nuclear. Only renewables production is expected to increase In 2030, current baseline projections have oil production declining by 73%, gas production would be 59% lower and solid fuel production is expected to sink by 41%. Nuclear generation might decrease by 11%, whereas the production of renewables should more than double between 2000 and 2030. All together, total indigenous energy production in 2030 would be 25% lower than it was in 2000.
Import dependency continues growing to two thirds in 2030, which is up nearly 15 percentage points from today’s level. Import dependency for oil continues to be highest reaching 94% in 2030. Gas import dependency rises substantially from somewhat over 50% at present to 84% in 2030. Similarly, solid fuel supplies will be increasingly based on imports reaching 59% in 2030.
Energy related CO2 emissions (including international air transport) sank between 1990 and 2000; in 2005 they have returned to the 1990 level. However, over the next years, CO2 emissions are projected to increase significantly exceeding the 1990 level by 3% in 2010 and by 5% in 2030. The strong short term increase to 2010 is due to high price increases for oil and particularly gas that encourage coal use in power stations. In the long term, the moderate further CO2 increase reflects low energy consumption growth and the rather strong role of the CO2 free sources renewables and nuclear.
Final energy demand
Final energy consumption for transport and stationary purposes (e.g. in industry, services and households) increases by 25% from 2000 to 2030. This is 10 percentage points more than the growth of total energy demand (which, in addition to final energy, includes also losses in electricity generation and other transformation processes). The lower percentage increase of total energy consumption compared with final energy demand means that there are significant improvements in the transformation efficiency of the EU energy system over the next decades. The replacement of old power stations with more efficient ones is driving this development.
Graph 2: Final energy consumption by sector
0
250
500
750
1000
1250
1500
1990 2000 2010 2020 2030
households
agriculture
services
industry
transport
mtoe

9
Final energy demand rises most in the services sector due to the increasing share of services in modern economies. Energy demand for services is projected to be 49% higher in 2030 than it was in 2000. This development is driven by increasing demand for electricity (e.g. office equipment). With this strong penetration of electricity in the service sector, there is a considerably smaller increase in CO2 emissions from services (+17% by 2030) compared with the 49% increase of energy demand 4.
On the contrary, energy demand in agriculture increases least, growing nevertheless by 10% between 2000 and 2030.
Household energy demand is expected to rise by 29% between 2000 and 2030. The increasing number of households (+ 25% up to 2030) following demographic and lifestyle changes towards smaller household size is an important factor for this development. On the other hand, there are some saturation effects concerning heating energy demand. The increasing use of electric appliances and air conditioning entail rising electricity demand (+ 83%). Given this shift towards electricity use in households, CO2 emissions from households increase significantly slower (+ 8%) than energy demand (+29%).
Transport energy demand in 2030 is projected to be 21% higher than in 2000. After having seen very high growth rates in the 1990s, the increase of energy use for transportation decelerates. In the projection period, transport energy demand growth rates decline over time reaching the lowest value in the decade to 2030. This reflects the declining growth rates over time of both passenger and freight transport activity. In addition, there are important fuel efficiency improvements in particular in passenger transport (e.g. private cars). Therefore, energy demand in transport grows less than transport activity (in passenger- and tonne-km).
Contrary to the past, the projection period has some significant fuel switching in the transport sector as a result of the implementation of the biofuels Directive. Under baseline conditions the biofuels share in 2010 rises strongly to almost 4% - however, falling somewhat short of the indicative target of 5.75. Nevertheless, this target would be nearly met in 2015 (5.5%) and the share continues increasing up to 2030 to reach 8.3%. No other alternative fuels are penetrating in this scenario reflecting current policies and the cost development in the modelling of “non-conventional” fuels relative to petrol and diesel. As a consequence, CO2 emissions from transport are expected to grow less than energy use (13% versus 21% from 2000 to 2030).
Energy demand in industry is 19% higher in 2030 compared with 2000. This rather low growth reflects shifts in the industrial production structure towards less energy intensive branches focusing on higher value added. Energy intensity in industry (energy consumption in industry related to value added) improves therefore by 1.2% pa up to 2030. This shift in the production structure entails also much higher use of electricity in industry (+ 34%), which in turn results in CO2 emissions that increase significantly less than energy demand (+ 9% compared with + 19%).
Overall, electricity is the fastest rising fuel in final demand (+ 58% up to 2030). There is also strong growth of heat from CHP and district heating (+ 39%). Natural gas continues to make major inroads for heating purposes (+28%). Oil demand increases only moderately due to limited consumption growth in transportation and its replacement by gas and electricity in stationary uses. Solid fuels continue to decline strongly so that their use becomes more and more concentrated on some heavy industries. Renewables almost double their contribution – however from a rather small basis in final demand encompassing both traditional uses, such as wood combustion, but also solar water heating and biofuels in transport. Higher deployment of biofuels
4 It should be noted that CO2 emissions are accounted for in the sectors where they occur (e.g. power
generation) and not in the sectors that ultimately cause them, such as services or households using more and more electricity.

10
is the major driving force for greater renewables penetration in final demand (as distinct from renewables use for power generation, where hydro and wind are established sources with a great potential for further wind penetration).
Power generation
Following soaring electricity demand, power generation is expected to grow considerably given the limited potential for higher electricity imports from outside the EU. Electricity production is expected to increase by 51 % between 2000 and 2030. An increasing share of electricity will be produced in form of combined heat and power (up almost 10 percentage points to reach a 24 % CHP share in 2030).
The structure of power generation changes significantly in favour of renewables and natural gas while nuclear and solid fuels lose market shares.
The renewables share in power generation rises to 18% in 2010 – which falls however short of the indicative target of the renewables electricity directive – indicating that the measures implemented in the Member States by the end of 2004 are not yet sufficient. In any case, the baseline shows a dynamic development in renewables penetration in electricity, as the renewables share rises further to 23% in 2020 and 28% in 2030.
This development is clearly driven by the high growth rates of wind energy – especially in this decade; but growth rates are still impressing in coming decades. In total, wind energy in 2030 provides twenty times as much electricity as was available from this source in 2000. The increase of wind over 30 years in absolute terms (420 TWh) corresponds to the total present day electricity consumption in the UK. In 2030, wind power is expected to produce more electricity than hydro.
Biomass use for power generation also rises considerably; solar PV has high growth rates from a small basis, while the additional contribution from hydro power is small as a result of limited additional potential and environmental restrictions.
Graph 3: Electricity production by fuel and carbon intensity
0
500
1000
1500
2000
2500
3000
3500
4000
4500
5000
2000 2010 2020 20300
25
50
75
100
renewables
nuclear
gas
oil
solids
carbonintensity
Carbon intensity 1990=100TWh
Nuclear, the other major CO2 free energy source for power generation, declines as a result of political decisions. The nuclear share falls from over 30% to only 19% in 2030 despite considerable investment in new nuclear plants in countries without restrictions on nuclear (largely replacing old nuclear plants). Overall, the share of indigenous and carbon free sources (renewables plus nuclear) remains flat at the current level of 45-46% throughout the projection period.

11
Solid fuels lose market shares in power generation in the medium terms and compensate these losses in later years towards 2030 in their function as replacement for nuclear and also as a result of the competitiveness losses of natural gas following increasing gas prices. Nevertheless, gas continues to gain market share due to its advantages as clean, efficient and low carbon fuel. The role of oil diminishes further in power generation. Overall, the share of fossil fuels remains flat at broadly 55%.
As a result of these changes towards fuels with a low (gas) or zero carbon content (renewables and nuclear), CO2 emissions from power generation (+10% by 2030) grow considerably slower than electricity production (+ 51%). Consequently, the carbon intensity of power generation declines considerably. However, in the long term post 2020 the decrease of carbon intensity comes to a halt on account of the nuclear phase-out becoming effective and the ensuing replacement of nuclear with coal, which is not sufficiently compensated by the further penetration of renewables. In addition, high oil and gas prices discourage further penetration of natural gas leaving much scope for solid fuels in the baseline that does not assume that CO2 targets will be necessarily met.
The increasing electricity demand and to some extent the higher penetration of intermittent renewables require substantially higher power generation capacities. The net capacity increase from 2000 to 2030 amounts to 430 GW, which corresponds to two thirds of the present generation capacity. In addition, the power plants that will be closed over the next decades needs be replaced.
Challenges
While there have been certain improvements in terms of policy relevant indicators compared with the “Trends to 2030” of 2003 (slightly higher share of non-fossil fuels and especially renewables, slightly lower growth of energy demand and import dependency than modelled in 2003), this 2005 Baseline shows several challenges ahead for energy policy. This concerns in particular energy efficiency to curtail energy demand growth as well as action on renewables to achieve agreed targets, to further diversify energy supply and reduce CO2 emissions.
Energy consumption continues growing with supplies being increasingly met by imports, which come to a large extent from geopolitically unstable regions. With decreasing indigenous fossil fuel production and a limited combined contribution from renewables and nuclear, the EU dependency on imports grows to about two thirds in 2030.
Energy demand growth is particularly strong for natural gas, which needs to be imported in increasing quantities over wider distances. Renewables also increase their contribution while the shares of solid fuels, oil and nuclear decline. There are issues concerning the achievement of agreed targets. This concerns reaching the 12% renewables share objective for 2010 as well as meeting Kyoto targets. The Baseline has increasing CO2 emissions which is clearly incompatible with EU climate change policy.
Better energy efficiency should contribute to reducing CO2 emissions, improving European competitiveness and will be important for managing external dependency in the context of high energy import prices and a difficult geopolitical environment. The increased use of indigenous and CO2 free energy sources, (renewables and nuclear) will help in living up to the EU’s commitments on greenhouse gas emission through keeping CO2 emissions under control, while at the same time improving energy security.

12

13
1. EU-25 energy and transport reference case to 2030 (baseline)
1.1. Introduction
The baseline scenario provides projections of energy demand, supply and transformation on the basis of current knowledge, technology forecasting and policies. The baseline scenario for EU-25 represents current trends and policies as implemented in the Member States up to the end of 2004.
The new baseline scenario, used in the present analysis, involves a major update from the one presented in the latest publication of DG TREN “Scenarios on Key drives” in 2004. More specifically, the latest available data have been incorporated in the model database as regards:
• energy balances by member-state (statistics available up to 2003-EUROSTAT)
• energy prices and fiscal policies (statistics up to 2005)
• macroeconomic data (statistics available up to 2004-EUROSTAT) plus DG ECFIN projections
• power generation data (2005 update of power plant inventory, plant investment and decommissioning schedules, latest cogeneration data from EUROSTAT)
• 2005 updated statistics and latest potential estimations for renewables
Furthermore, the new Baseline takes into account a high energy import price environment, the unsatisfactory economic growth of recent years and the more subdued growth prospects taking into account demographic developments. It also includes new policies and measures implemented in the Member States. The results were derived with the PRIMES model by a consortium led by the National Technical University of Athens, supported by some more specialised models.
The scenario, as well as the model’s database, includes the year 2000 as a base year for which a complete statistical database exists. However the figures for year 2005 are also based on statistical information, rather than being pure model results; in other words the model results for 2005 are partly ‘calibrated’ to available statistics.
1.2. Main assumptions of the Baseline Scenario 5
The definition of the Baseline scenario is important because it constitutes the basis for further policy analysis in addition to its function as a projection on the basis of current trends and policies.
The Baseline scenario includes existing trends and the effects of policies in place and/or in the process of being implemented by the end of 2004. In particular, the baseline modelling assumes a continuation of policies on economic reform (Lisbon) and the completion of the internal energy market. The baseline scenario includes current policies on energy efficiency and renewables, without assuming that specific targets are necessarily met. On transport, the baseline assumes that the targets agreed for 2008 with the car industry on the reduction of specific CO2 emissions for new cars are achieved without assuming a further strengthening of targets thereafter. The baseline assumes
5 Demographic and macro-economic assumptions by country and by group of countries (EU-25, EU-15,
NMS, EU-27, EU-28 and Europe-30) and country can be found in Appendix 1

14
furthermore that decisions on nuclear phase-out in some old Member States will be implemented as decided and that certain nuclear plants with safety concerns in new Member States will be closed as agreed. Nevertheless, in Member States without a phase-out decision, the baseline scenario assumptions result in considerable investment in new nuclear capacity depending on the economics of power generation and the overall energy policy context in the individual countries.
While informing about the development of policy relevant indicators, such as the renewables shares in 2010, the Baseline does not assume that indicative targets, as set out in Directives, will be necessarily met. The numerical values for these indicators are outcomes of the modelling; they reflect implemented policies rather than targets. This applies also for CO2 emissions. For analytical reasons the Baseline scenario excludes all additional policies and measures that aim at further reductions of CO2 emissions so as to comply with the Kyoto emission commitments. The establishment of an emission trading regime in Europe is included in the Baseline scenario assuming a permit price of 5 €00/t CO2 for those sectors covered by the EU Emission Trading Scheme (ETS) as a reflection of the medium-term price level of the emerging international carbon market (including Clean Development Mechanism) and the EU ETS being connected to it.
Tax rates reflect the situation of July 2005 in the EU-25 Member States; thereafter they increase with inflation. As regards new Member States a gradual convergence of energy taxes towards those in EU-15 has been assumed. By 2010, the first year after 2005 with modelling results, all EU-15 Member States are assumed to comply with the energy taxation Directive,6 whereas the compliance period for the new Member States (NMS) is prolonged according to the amendments of 29.4.2004 of the taxation Directive.
The Baseline scenario is used as the reference for additional policy-relevant scenario analyses addressing issues such as renewables, nuclear, energy efficiency, energy import prices, alternative fuels in transport and the effects of transport policy action as well as climate change.
The main assumptions underlying the Baseline scenario are presented below.
1.2.1. Demographic and weather assumptions
Population is an important determinant both of overall economic performance and of energy trends, especially in the transportation, household and services sectors. EUROSTAT figures have been used in the PRIMES Baseline scenario both as regards historical data and projections for the evolution of population in the EU-25 Member States.
Table 1-1: Population trends in the EU-25, 1990 to 2030
1990 2000 2010 2020 2030EU15 365.75 378.06 390.65 397.46 398.74NMS 75.04 74.85 73.40 71.81 70.63
EU-25 440.79 452.92 464.05 469.27 469.37
90/00 00/10 10/20 20/30 00/30EU15 0.33 0.33 0.17 0.03 0.18NMS -0.02 -0.20 -0.22 -0.17 -0.19
EU-25 0.27 0.24 0.11 0.00 0.12
Million inhabitants
annual growth rate
Source: EUROSTAT.
6 European Commission Directive 2003/96/EC of the European Parliament and of the Council, 27 October
2003, on restructuring the Community framework for the taxation of energy products and electricity and its amendments of 29.4.2004.

15
EU-25 population is projected to remain rather stable, peaking in 2025 at some 470 million (see Table 1-1). The population in NMS is projected to decline by some 4.2 million people or 5.6% between 2000 and 2030. The NMS accounts by 2030 for 15.0% of the EU-25 population, compared to 16.5% in 2000.
Another key demographic factor that plays an important role as regards the growth of energy demand in households is the household size (i.e. number of persons per household). Rising life expectancy, combined with declining birth rates and changes in societal and economic conditions, are the main drivers for a significant decline in average household size, both in the EU-15 and in NMS. Following UN projections,7 average household size in the EU-15 is expected to decline from 2.4 persons in 2000 to 1.98 persons in 2030 (-0.65% pa in 2000-2030). The corresponding decline in NMS is less pronounced (-0.53% pa, from 2.66 persons per household in 2000 to 2.27 persons in 2030). This trend gives rise to significant growth in the number of households, which increase by 47.2 million between 2000 and 2030 (+0.8% pa in 2000-2030) in the EU-25 despite the rather stable evolution of population (see Table 1-2). Growth in the number of households is one of the key drivers of energy demand in the residential sector.
Table 1-2: Number of households in EU-25, 1990 to 2030
1990 2000 2010 2020 2030EU15 141.14 157.37 175.15 190.25 201.59NMS 25.70 28.18 30.05 30.63 31.16
EU-25 166.85 185.55 205.20 220.88 232.75
90/00 00/10 10/20 20/30 00/30EU15 1.09 1.08 0.83 0.58 0.83NMS 0.92 0.65 0.19 0.17 0.34
EU-25 1.07 1.01 0.74 0.52 0.76
Million households
annual growth rate
Source: Global Urban Observatory and Statistics Unit of UN-HABITAT, PRIMES.
Weather conditions, which are important in determining both the intensity and the overall pattern of energy use (mainly as regards heating requirements), are assumed to remain unchanged over the projection period, i.e. the degree-days parameter is taken as constant at 2000 levels.
1.2.2. Macroeconomic assumptions
The economic outlook presented below is based on a number of underlying assumptions. For example, the recent economic slowdown is assumed to be transitory, and the longer-term global economic climate is assumed to remain generally positive, although economic growth rates in this update are considerably lower than in the Trends to 2030 of 2003. In addition, the EU-25 is projected to benefit from economic and monetary unification as well as from a continued increase in world trade, as barriers continue to fall. Increases in commodity prices and inflation are assumed to remain modest.
The economic growth assumptions have been chosen in order to evaluate the energy, transport and environmental consequences of an economic development that accommodates policy efforts to reduce unemployment and to cope with an ageing population. Still higher economic growth might materialise if the Lisbon economic reform agenda is successfully implemented. On the other hand, with the weak state of the
7 United Nations (2002) Global Urban Observatory and Statistics Unit of UN-HABITAT (UN Centre for
Human Settlements): Human Settlement Statistical Database version 4: Data and forecasts of population, number of households and household size (http://www.unchs.org/habrdd/CONTENTS.html) for EU-15 Member States; Human Settlement Statistical Database version 4 (http://www.unhabitat.org/programmes/guo/guo_hsdb4.asp) for new Member States.

16
economy seen in the last few years, lower growth rates than those shown in the Baseline are also possible.
The slowdown in economic growth for NMS between 1990 and 2000 (+1.8% pa compared to +2.1% for the EU-15) largely reflects the major reforms of political and economic structures that Central and Eastern European countries (CEEC) have experienced since the early 1990s. These included: industrial restructuring and privatisation; establishment of viable legal structures and regulatory systems; reform of capital markets and trade policies, etc., which in turn induced a deep recession between 1990 and 1993 in all countries except Poland.
The GDP projections for EU-25 Member States are based on Economic and Financial Affairs DG forecasts of April 2005 for the short term (2004-2006)8 and the long term (2005-2030),9 adjusted to reflect recent developments, for the horizon to 2030. Furthermore, additional inputs were taken into account from Member States’ stability programmes and long-term projections, and the results of the GEM-E3 model.10 Economic growth is not uniformly distributed across countries, but the convergence of Member States’ economies (including NMS) is assumed to continue over the projection period. Furthermore, the integration of new Member States into the European Union is assumed to generate accelerated growth for their economies.
Table 1-3: Evolution of gross domestic product in EU-25, 1990 to 2030
1990 2000 2010 2020 2030EU15 6982 8572 10391 12836 14949NMS 313 375 555 821 1103
EU-25 7295 8947 10947 13656 16051
90/00 00/10 10/20 20/30 00/30EU15 2.07 1.94 2.13 1.54 1.87NMS 1.82 4.01 3.98 3.00 3.66
EU-25 2.06 2.04 2.24 1.63 1.97
000 MEuro'00
annual growth rate
Source: EUROSTAT, Economic and Financial Affairs DG, PRIMES.11
The Baseline economic outlook of EU-25 is dominated by the evolution of the EU-15 economy. This is because the contribution of new Member States, despite their much faster growth over the projection period (+3.7% pa in 2000-2030 compared to +1.9% pa in EU-15), remains rather limited in terms of overall EU-25 GDP (see Table 1-3). By 2030, NMS GDP reaches 6.9% of EU-25 economic activity compared to 4.2% in 2000 and, consequently, overall economic growth of EU-25 (+2.0% pa) follows closely that of the EU-15.
8 European Commission Economic Forecasts, Spring 2005 (EUROPEAN ECONOMY. No. 2/ 2005. Office
for Official Publications of the EC. ISBN92-894-8881-6). Also available at: http://europa.eu.int/comm/economy_finance/publications/european_economy/2005/ee205en.pdf .
9 European Commission, DG-ECFIN “Long Run Labour Productivity and Potential Growth Rate Projections For the EU25 countries up to 2050 (information note for Members of the EPC’s working group an ageing populations)”, ECFIN/50485/04-EN.
10 The GEM-E3 model has been constructed under the co-ordination of NTUA within collaborative projects supported by DG-RESEARCH involving CES-KULeuven and ZEW.
11 Incorporating results obtained from the GEM-E3 model runs (this applies to all the macroeconomic assumptions).

17
Table 1-4: Per capita GDP in EU-25
1990 2000 2010 2020 2030EU15 19089 22674 26600 32295 37490NMS 4169 5007 7565 11427 15612
EU-25 16549 19754 23589 29101 34198
90/00 00/10 10/20 20/30 00/30EU15 1.74 1.61 1.96 1.50 1.69NMS 1.85 4.21 4.21 3.17 3.86
EU-25 1.79 1.79 2.12 1.63 1.85
Euro'00 per capita
annual growth rate
Source: EUROSTAT, Economic and Financial Affairs DG, PRIMES.
However, the convergence of NMS economies towards EU-15 levels remains far from complete even by 2030 (see Table 1-4). Despite much faster growth of per capita income projected in NMS than in EU-15 (+3.9% pa in 2000-2030 compared to +1.7% pa), per capita GDP in NMS amounts to 41.6% of the corresponding EU-15 figure in 2030 (compared, however, to only 21.8% in 2000).
The projected evolution of sectoral value added in EU-25 is given in Table 1-5. The Baseline assumptions for economic growth of the EU-25 Member States reflect the long established trend of structural changes in developed economies, away from the primary and secondary sectors and towards services and high value-added products (less material and energy-intensive products). However the pace of change is expected to decelerate in the long run.
Table 1-5: Evolution of sectoral value added in EU-25
1990 2000 2010 2020 2030Gross Value added 6797 8332 10230 12785 15009
Industry 1460 1685 1974 2454 2863Energy intensive 323 380 454 563 653Non Energy intensive 1137 1305 1520 1892 2210
Construction 430 435 500 604 683Services 4462 5696 7210 9126 10819Agriculture 197 221 230 253 269Energy branch 248 295 316 348 374
90/00 00/10 10/20 20/30 00/30Gross Value added 2.06 2.07 2.25 1.62 1.98
Industry 1.45 1.60 2.20 1.55 1.78Energy intensive 1.64 1.80 2.17 1.51 1.82Non Energy intensive 1.39 1.54 2.21 1.57 1.77
Construction 0.10 1.40 1.92 1.24 1.52Services 2.47 2.39 2.38 1.72 2.16Agriculture 1.16 0.37 0.96 0.63 0.65Energy branch 1.77 0.69 0.96 0.72 0.79
000 MEuro'00
annual growth rate
Source: EUROSTAT, Economic and Financial Affairs DG, PRIMES.
Services value added increases over the projection period at rates above average, implying a continuous increase of its share in total economic activity (72.1% in 2030 compared to 68.4% in 2000). This increase in market share of services occurs to the detriment of all other sectors of the economy. The market share of industrial activity, which grows at rates slightly below average, declines by 0.9 percentage points over the projection period (from 20.2% in 2000 to 19.1% in 2030). The lowest economic growth is projected for agriculture (+0.65% pa in 2000-2030), while the energy branch and construction sectors are also projected to exhibit a significant decline in terms of market shares, growing by 0.8% pa and 1.5% pa, respectively, to 2030.

18
As illustrated in Figure 1-1, the existing structural differences between the EU-15 and the NMS economies in 2000, are not projected to be fully eliminated by 2030. The new Member States’ economies are projected to remain more reliant on industry, the market share of which is projected to increase from 2000 levels in the horizon to 2030 by 3.5 percentage points compared to a decline by 1.5 percentage points in the EU-15. Thus, in 2030 the market share of industrial activity in the NMS economies is projected to be some 8.5 percentage point higher than in the EU-15; in 2000 industry’s share in value added in the NMS exceeded the corresponding share in EU-15 by 4.8 percentage points. Services sector exhibits a strong growth both in the EU-15 and the NMS (+4 percentage points and +3.5 percentage points in 2030 respectively from 2000 levels) with the share of services in the EU-15 being, however, 11.5 percentage points higher than in the NMS by 2030. Agriculture and other economic activities (construction and energy sector) continuously lose market share over the projection period both in the EU-15 and the NMS, however even by 2030 the NMS economies are projected to remain more reliant on such activities (accounting for 11.7% of gross value added in 2030 from 17.3% in 2000) than the EU-15 (8.7% in 2030 compared to 11.2% in 2000).
Figure 1-1: Structure of the EU-25 economy, shares in gross value added 2000, 2030
20.2 19.1 20.0 18.524.8 27.0
68.4 72.1 68.8 72.8 57.861.3
5.2
8.23.51.72.62.7
1.8 12.17.08.67.08.8
0%
10%
20%
30%
40%
50%
60%
70%
80%
90%
100%
2000 2030 2000 2030 2000 2030
EU-25 EU-15 NMSIndustry Services Agriculture Other
Source: PRIMES.
The key features of the macroeconomic and demographic outlook of EU-25, EU-15 and NMS (but also Europe-30 including in addition Bulgaria, Romania, Turkey, Norway and Switzerland) as well as sectoral forecasts are presented in Appendix 1.
1.2.3. International fuel prices
The Baseline projections on the evolution of international fuel prices describe a world with relatively abundant oil and gas resources and moderate international energy price increases until 2030, however from relatively high levels already reached in 2005. Compared with the “Trends to 2030” of 2003, energy import prices in this update are

19
considerably higher. These projections derive from the output of the POLES model.12
These assumptions on primary energy prices follow from a conventional wisdom view of the development of the world energy system taking into account the rather high price levels seen up to mid 2005 (when the energy modelling for this update started). 13
Table 1-6: International price assumptions
1990 2000 2010 2020 2030Crude oil 32.4 31.3 44.6 48.1 57.6Natural gas 18.3 16.8 33.9 37.0 44.7Hard coal 15.4 8.4 12.5 14.1 14.9
1990-2000 2000-2010 2010-2020 2020-2030Crude oil -0.34 3.59 0.76 1.82Natural gas -0.88 7.29 0.89 1.91Hard coal -5.86 4.04 1.18 0.58
Average border prices in the EU-25 ($05/boe)
annual growth rate
Source: POLES
The evolution of primary fuel prices is illustrated in Table 1-6. Oil prices in this modelling are projected to decrease over the next few years from their high 2005 level of 55US$(2005). The 2010 oil price is projected at 44.6US$(2005), from where it grows smoothly to reach by 2030 57.6US$(2005). Natural gas prices are assumed to reach 33.9US$(2005) per barrel of oil equivalent in 2010 from 30.3 US$(2005) in 2005. This means a medium term decrease in the oil–gas price gap. With increasing gas-to-gas competition gas prices are decoupled from oil prices in the second part of the projection period as the difference between both prices becomes larger. Coal prices decline from 13.3 US$(2005) in 2005 to reach 12.5 US$(2005) in 2010, and exhibit a smooth increase thereafter to reach 14.9 US$(2005) in 2030.
1.2.4. Policy assumptions
The Baseline scenario assumes that agreed policies addressing economic actors in the EU-25 Member States, as known by the end of 2004, will continue. It presumes that all current policies and those in the process of being implemented at the end of 2004 will continue in the future. However, in the Baseline scenario it is not assumed that the indicative targets, as set out in various EC Directives (renewables electricity Directive 2001/77, Directive 2003/30 on renewable energy in transport and any additional follow-up Directives, etc.) will be necessarily met. The numerical values for these indicators are outcomes of the modelling; they reflect implemented policies rather than targets.
This approach allows the Baseline scenario to be considered as the benchmark against which a number of alternative policies can be judged, assisting policy analysts in the evaluation of alternative measures. Hence, the Baseline scenario takes into account:
• Technological progress, induced both by economic growth and by modernisation of installations in all sectors of the economy, thereby improving the efficiency of the energy system.
12 The POLES model is a global sectoral model of the world energy system. The development of the POLES
model has been partially funded under the Joule II and Joule III programmes of DG XII of the European Commission. Since 1997 the model has been fully operational and can produce detailed long-term (2030) world energy and CO2 emission outlooks with demand, supply and price projections by main region. The model splits the world into 26 regions. For the model design see the model reference manual: POLES 2.2. European Commission, DG XII, December 1996.
13 For comparison, oil prices in this baseline are similar to those used in the DG RTD sponsored update of the WETO project (World Energy Technology Outlook), but higher than those assumed in the 2005 update of the IEA World Energy Outlook

20
• The restructuring of the sectoral pattern of economic growth, which gradually shifts away from traditional energy-intensive products and concentrates on high value added activities, thereby reducing energy intensity.
• The effects from restructuring of markets through the liberalisation of electricity and gas in the EU, which proceeds in line with EC directives; liberalisation is assumed to be fully implemented in the period to 2010.14 Completion of the internal electricity and gas markets is also assumed to take place in the new Member States.
• The restructuring in power and steam generation, which is enabled by mature gas-based power generation technologies that are efficient, involve low capital costs and are flexible regarding plant size, co-generation and independent power production.
• Changes in primary energy production patterns (especially in many new Member States), characterised by the closure of unprofitable coalmines that took place in the 1990s and which is expected to continue to some extent over the next few decades.
• Energy policies that aim at promoting renewable energy (wind, small hydro, solar energy, biomass and waste) and co-generation are assumed to continue, involving subsidies on capital costs and preferential electricity selling prices. Rather than imposing the indicative targets of the EC renewables electricity Directive15 for each Member State, the Baseline includes policy measures in view of higher renewables deployment in individual countries.
• Continuation of energy efficiency measures in the Member States.
• Ongoing infrastructure projects involving the introduction of natural gas. These are assumed to be completed in the next few years.
• Differences in current policies of EU-25 Member States as regards nuclear capacity, taking into account policy decisions as regards nuclear phase out in Belgium, Germany and Sweden; and plans concerning nuclear plant refurbishment/closure, as already agreed or under negotiation with the European Commission for new Member States.
• The effects arising from the voluntary agreement reached between the European Commission and the European automobile industry on specific CO2 emissions from new cars (followed in 1999 by similar agreements with Korean and Japanese car manufacturers).16
14 This country-by-country modelling has focused on the dynamics of the energy system within a country,
while considering trade in fuels between countries. The analysis has fully taken into account the economic opportunities of electricity and gas trade within the EU Internal Energy Market as well as the engineering and operating constraints of the European transmission system as this evolves in relation to the completion of new interconnectors as planned in the context of the Trans-european Energy Networks. The extension and stabilisation of the UCTE system has also been considered. The endogenous treatment of electricity and gas imports and exports is a new feature of the PRIMES model (PRIMES ver.2005)
15 European Commission Directive 2001/77/EC of the European Parliament and of the Council on The Promotion of Electricity Produced from Renewable Energy Sources in the Internal Electricity Market. Brussels, 27 September 2001.
16 European Commission (2000) Commission recommendations on the reduction of CO2 emissions from passenger cars, Official Journal of the European Communities, No L 40/49-13.2.99, L 100/57-20.4.2000 and L 100/55-20.4.2000. Also available at: http://europa.eu.int/comm/environment/co2/co2_agreements.htm
21
• Concerning the use of biofuels in transportation, it was assumed that all countries would follow EU rules17 sooner or later. The impact of blending gasoline and diesel with biofuels on final consumer prices was assumed to be negligible, since higher fuel production costs will probably be offset by tax reductions scheduled to be implemented on these fuel blends.
The establishment of an emission trading regime in Europe18 is included in the Baseline scenario assuming a permit price of 5 €00/t CO2 (constant from 2010 onwards), which reflects the expected medium-term price level of the emerging international carbon market (including Clean Development Mechanism) and the EU ETS being connected to it; this assumption can also be justified by a multitude of other diverging influences.19
In line with the Baseline philosophy, policy initiatives related to climate change are included only to the extent that they are agreed policy measures. For the purposes of the study it is assumed that no specific new policies and measures aimed at meeting Kyoto targets in 2008-2012, and possible more severe ones in the future, are implemented over the next 25 years. This assumption may be judged somewhat unrealistic; but it does help maintain the benchmark character of the reference case, allowing it to serve as a Baseline for comparisons with alternative CO2 abatement policy scenarios.
However, it is assumed that stringent regulation for acid rain pollutants continues, especially for large combustion plants. Similarly, other clean air policies are assumed to continue.
1.2.5. Committed investment and decommissioning in power generation
The Baseline scenario assumes that all capacity expansion and decommissioning plans in power generation, already decided, would take place as indicated in the EURPROG report of EURELECTRIC and other statistical sources (e.g. EPIC)20. Beyond 2010 plant decommissioning occurs on the basis of technical lifetimes and agreed policies on nuclear phase-out.
1.2.6. Other Assumptions
The discount rate plays an important role within the PRIMES model. It is a crucial element in the determination of investment decisions by economic agents regarding
17 European Commission Communication COM(2001) 547 of the European Commission of 07/11/01 on an
action plan and two proposals for Directives to foster the use of alternative fuels for transport, starting with the regulatory and fiscal promotion of biofuels. Also at: http://europa.eu.int/comm/energy/library/comm2001-547-en.pdf
18 European Commission Directive 2003/87/EC of the European Parliament and of the Council of 13 October 2003 establishing a scheme for greenhouse gas emissions allowance trading within the Community and amending Council Directive 96/61/EC.
19 In Spring 2006 the permit price stood at around 25 €00/t CO2 but nearly all permits have been given out for free (“grandfathering”). Real costs are incurred only to the extent that permits actually need to be bought for a marginal part of the activity of trading sectors. However, holders of permits consider them increasingly as property rights (given that they could sell them instead of using them); and thus these opportunity costs increase electricity prices. On the other hand, as no real costs are involved for permits given out for free, the “windfall profit” from permits can be considered as a “subsidy” on capital investment (baseline has much capital expansion in power generation putting upward pressure on prices); this might be mitigated through “windfall profit”. Furthermore, permit prices may decrease once emissions registries in all Member States are full up and running, as well as, through higher use of project based Kyoto instruments (such as CDM and Joint Implementation).
20 EURPROG report of 2005. The Epic database, developed by ESAP SA, gives a technical description, unit by unit, of power generation capacity. For EU-25 it contains more than 26,500 units above 100 kW. More information is available at www.esap.be.

22
energy using equipment. Three (real) rates are currently used within the model. The first, used mostly for large utilities, is set at 8%; the second, used for large industrial and commercial entities, is set at 12%; the third, used for households in determining their spending on transportation and household equipment, is set at 17.5%.
1.3. Baseline scenario results21
1.3.1. Main Findings
Between 1990 and 2000 primary energy needs grew by 6.3% in the EU-25 energy system exhibiting a strong decoupling from GDP growth that reached 22.7%, with energy intensity of the EU-25 energy system (expressed as primary energy demand per unit of GDP) improving at a rate of 1.4% pa in 1990-2000. In the same period CO2 emissions22 decreased by -2.7% implying a significant improvement in the carbon intensity (-0.9% pa in 1990-2000) of the EU-25 energy system. The changes in the fuel mix during this decade, in combination to the restructuring of CEEC economies were the key driver for this improvement.
The results of the Baseline scenario show that, despite the evidence of some saturation for some energy uses in the EU-25, energy demand is expected to continue to grow, albeit at rates significantly lower than those experienced in the recent past.
Figure 1-2 illustrates the links between GDP, energy use and CO2 emissions growth from 1990 to 2030 (with energy and carbon intensity plotted against the secondary axis).
21 Aggregate results by country and by group of countries (EU-25, EU-15, NMS, EU-27, EU-28 and Europe-
30) can be found in Appendix 2. 22 It should be noted here that, within the PRIMES model, aviation includes both national and international
flights from the EU, without distinguishing between the two (data on the split between domestic and international aviation are not currently available) following the corresponding EUROSTAT convention as regards energy consumption in aviation. Consequently total CO2 emissions from aviation are accounted for at the level of each Member State. However, consumption of international maritime bunkers is excluded from the analysis according to EUROSTAT conventions; consequently it is not accounted for in national CO2 emissions. According to the Guidelines for National Greenhouse Gas Inventories of the Intergovernmental Panel on Climate Change (IPCC), both emissions based upon fuel sold to aircraft engaged in international transport and to international maritime fleets should not be included in national totals, but reported separately.

23
Figure 1-2: EU-25 primary energy indicators (index 1990=100), 1995-2030
0
20
40
60
80
100
120
140
160
180
200
220
240
1995 2000 2005 2010 2015 2020 2025 203040
50
60
70
80
90
100
110GDPPrimary Energy DemandCO2 emissions
Energy Intensity
Carbon intensity
Source: PRIMES.
Primary energy demand in the EU-25 is projected to increase at an annual rate of 0.5% in 2000 to 2030 compared to an annual growth rate of 2.0% for GDP, implying that the energy intensity of the EU-25 energy system will improve at a rate of 1.5% pa in 2000-2030. CO2 emissions are foreseen to grow throughout the projection period, but at lower rates than those for primary energy demand. In 2010, CO2 emissions are projected to exceed the 1990 level by +2.8% (whereas the corresponding growth for primary energy needs reaches +16.5%). In 2030 CO2 emissions exceed the 1990 level by 4.7% (+21.8% for primary energy demand). Nevertheless, the strong decoupling between EU-25 energy demand and CO2 emissions, which occurred between 1990 and 2000, is not projected to continue in the long run with a near stabilisation of carbon intensity from 2015 onwards (improving at rate of 0.2% pa in 2000-2030) as a reflection of a declining nuclear share that is not compensated sufficiently by additional renewables penetration.
1.3.2. Primary Energy Needs
Total indigenous production of primary energy in EU-25 is expected to decline continuously over the projection period (-0.9% pa in 2000-2030). As illustrated in Table 1-7 the decline is more pronounced in fossil fuels production while, in contrast, renewable energy forms are expected to grow over the projection period. Indigenous production of solid fuels declines by some 41% in the 2000-2030 period (-53% for coal, -17% for lignite) driven by the increasing competitiveness of imported coal and natural gas. Crude oil and natural gas production also experiences a significant decline (-73% and -59% respectively from 2000 levels by 2030) due to the exhaustion of currently exploited reserves.

24
Table 1-7: Primary production of fuels in EU-25
1990 2000 2010 2020 2030 Solid Fuels 351.6 204.1 154.5 131.1 120.2
Hard coal 237.3 136.1 97.2 76.8 63.6Lignite 114.4 68.0 57.3 54.3 56.6
Liquid Fuels 120.4 163.6 117.2 53.0 43.4 Natural Gas 139.7 196.7 172.2 98.3 79.8 Nuclear 196.9 237.7 248.8 228.6 210.8 Renewable En. Sources 68.9 96.5 143.8 195.5 230.8Total 877.5 898.6 836.4 706.5 685.1
EU-15 707.9 761.6 709.6 580.5 551.7NMS 169.6 137.0 126.8 126.0 133.4
90/00 00/10 10/20 20/30 00/30 Solid Fuels -5.3 -2.7 -1.6 -0.9 -1.8
Hard coal -5.4 -3.3 -2.3 -1.9 -2.5Lignite -5.1 -1.7 -0.5 0.4 -0.6
Liquid Fuels 3.1 -3.3 -7.6 -2.0 -4.3 Natural Gas 3.5 -1.3 -5.4 -2.1 -3.0 Nuclear 1.9 0.5 -0.8 -0.8 -0.4 Renewable En. Sources 3.4 4.1 3.1 1.7 3.0Total 0.2 -0.7 -1.7 -0.3 -0.9
EU-15 0.7 -0.7 -2.0 -0.5 -1.1NMS -2.1 -0.8 -0.1 0.6 -0.1
Mtoe
Annual Growth Rate (%)
Source: PRIMES.
Nuclear production is projected to experience limited growth to 2010. Thereafter it is likely to decline steeply (-15% between 2010 and in 2030), as a result of the nuclear phase-out policies decided in certain EU-15 Member States. In other countries the decommissioning of nuclear plants at the end of their lifetime is not always compensated by new nuclear investment. As regards the use of renewable energy forms in the EU-25 energy system, policy measures and technological progress are the key drivers for the significant boost projected (+140% in 2000-2030). By 2015, renewable energy forms become the second most important indigenous energy source (after nuclear) in the EU-25 energy system and from 2025 onwards the most important one.
Primary energy demand in the EU-25 rose some 6.3% between 1990 and 2000 with very different trends in EU-15 (+10%) and NMS (-16.6%). In new Member States, the slowdown of economic activity in CEEC, the massive closure of old energy-inefficient factories and increasing energy prices progressively aligned to world energy market levels, led to a rapid decline of primary energy needs in the nineties. It is important to note that, before 1990, the CEEC were characterised by the world’s highest energy intensity after the Former Soviet Union. This situation resulted from an industrial structure based on energy-intensive industries (steel, cement, chemicals) using energy inefficiently; and very low energy prices, as energy consumption was largely supplied from the Former Soviet Union at prices usually well below world market levels. New Member States accounted in 2000 for some 11.9% of primary energy needs in EU-25 (from 15.2% in 1990) compared to 16.5% of the population and 4.2% of GDP, clearly reflecting the great inefficiencies that still prevailed in the NMS energy system.
In the Baseline scenario primary energy demand is projected to grow by 14.6% in EU-25 between 2000 and 2030 (see Table 1-8), with energy needs growing significantly faster in NMS (+45.6%) compared to the EU-15 (+10.4%). The increase in primary energy needs is more pronounced in the short term (+9.6% in 2010 from 2000 levels) as sluggish economic growth in recent years limits the scope for energy intensity improvements (only +1.1% pa in 2000-2010 compared to +1.5% pa in 2000-2030). In the long run consumption virtually stabilises reflecting a more service oriented economy, low economic growth, saturation effects in the demand side and stagnating population. By 2030 primary energy demand in NMS is projected to reach 15.1% of overall energy

25
needs in EU-25. Thus, the evolution of EU-25 primary energy needs is still dominated by prevailing trends in the EU-15 energy system over the projection period.
Table 1-8: Primary energy demand in EU-25
1990 2000 2010 2020 2030 Solid Fuels 431.9 306.5 286.8 259.5 293.1 Liquid Fuels 595.7 634.7 668.7 669.9 640.5 Natural Gas 260.5 376.3 462.2 529.7 517.8 Nuclear 196.9 237.7 248.8 228.6 210.8 Renewable En. Sources 68.9 96.5 143.8 195.5 230.8Total 1556.2 1653.8 1812.5 1885.3 1895.2
EU-15 1320.0 1456.9 1587.0 1623.8 1608.5NMS 236.2 196.9 225.5 261.5 286.7
90/00 00/10 10/20 20/30 00/30 Solid Fuels -3.4 -0.7 -1.0 1.2 -0.1 Liquid Fuels 0.6 0.5 0.0 -0.4 0.0 Natural Gas 3.7 2.1 1.4 -0.2 1.1 Nuclear 1.9 0.5 -0.8 -0.8 -0.4 Renewable En. Sources 3.4 4.1 3.1 1.7 3.0Total 0.6 0.9 0.4 0.1 0.5
EU-15 1.0 0.9 0.2 -0.1 0.3NMS -1.8 1.4 1.5 0.9 1.3
Mtoe
Annual Growth Rate (%)
Source: PRIMES.
Natural gas and renewable energy forms are projected to remain the fastest growing fuels in the EU-25 energy system (as was the case during the last decade), growing at rates 2 and 6 times faster respectively than overall energy needs over the projection period (+1.1% pa in 2000-2030 for natural gas; and +3.0% pa for renewable energy forms). Primary energy demand for liquid fuels remains rather stable over the projection period (+1% in 2030 from 2000 levels). Solid fuels, after a strong decline to 2020, are projected to regain some market share in the EU-25 energy system beyond 2025 as a result of the increasing competitiveness of imported coal and also nuclear plant decommissioning. By 2030, primary energy demand for solid fuels is projected to come close to that observed in 2000 (-4.4% from 2000 levels in 2030). Novel energy forms, such as hydrogen and methanol, are not projected to make significant inroads in the EU-25 energy system in the period to 2030 under Baseline conditions.
In the Baseline, the EU-25 energy system dependence on fossil fuels is projected to exhibit a significant decline, combined, in addition, with significant changes occurring in the fuel mix (see Figure 1-3). Following a substantial decline during the last decade (from 27.8% of primary energy needs in 1990, down to 18.5% in 2000), the share of solid fuels is projected to decline further to 2020 (accounting then for 13.8% of primary energy needs), regaining some market share thereafter (15.5% in 2030). Liquid fuels are also projected to exhibit a modest decline, with their market share reaching 33.8% in 2030 compared to 38.4% in 2000. In contrast natural gas, spurred by its rapid penetration both on the demand and the supply sides, accounts by 2030 for 27.3% of primary energy needs (+4.6 percentage points compared to 2000 levels), with a peak share of 28.1% observed, however, in 2020. Overall, in the Baseline case, the share of fossil fuels is projected to reach 76.6% of primary energy demand in the EU-25 energy system by 2030 compare to 79.7% in 2000.

26
Figure 1-3: Structure of primary energy demand in EU-25.
12.7 14.4 13.7 12.1 11.1
27.818.5 15.8 13.8 15.5
38.3
38.436.9
35.5 33.8
16.722.8
25.528.1 27.3
4.4 5.8 7.9 10.4 12.2
0%
20%
40%
60%
80%
100%
1990 2000 2010 2020 2030
Nuclear Solid Fuels Liquid Fuels Natural Gas Renewable En. Sources
Source: PRIMES.
As regards non fossil fuels, nuclear energy accounts for 11.1% of primary energy demand in 2030 (compared to 14.4% in 2000) following the political decisions on nuclear-phase out in certain old Member States and the closure of plants with safety concerns in some new Member States, and the decommissioning of old nuclear power plants at the end of their lifetimes with a default value of 40 years in this modelling exercise. Nevertheless, high fossil fuel prices encourage significant investment in new nuclear power stations (including the new EPR type) in several Member States. The share of renewable energy forms increases significantly from 5.8% of primary energy demand in 2000 to reach 12.2% in 2030. It should be recalled that the Baseline models policy measures in support of renewables but does not assume that indicative targets on renewables are necessarily met (e.g. renewables electricity Directive of 2001).
Table 1-9: Import dependency in EU-25
1990 2000 2010 2020 2030Solid fuels 17.5 30.8 46.1 49.5 59.0Liquid fuels 80.9 76.4 83.7 92.7 93.8Natural gas 47.5 49.6 62.8 81.4 84.6
Total 44.7 47.2 55.0 63.5 64.9EU-15 47.5 49.5 56.6 65.4 66.8NMS 28.7 30.1 44.1 52.0 53.7
%
Source: PRIMES.
The combined effect of increasing primary energy demand (in absolute terms) for fossil fuels and declining primary production results in a significant growth of import dependency for the EU-25 energy system from 47.2% in 2000 up to 64.9% in 2030 (see Table 1-9), an increase of close to 18 percentage points. By 2030, 93.8% of EU-25 oil demand (including bunkers) will be satisfied by imports compared to 76.4% in 2000. Oil imports are projected to continue consisting mainly of crude oil, as net imports of oil products will remain marginal. The EU-25 external dependence in terms of natural gas is projected to increase sharply, reaching 84.6% by 2030 compared to 49.6% in 2000. As regards solid fuels, though import dependency under Baseline assumptions is also
27
projected to grow significantly, it remains at lower levels compared to oil and gas, reaching by 2030 59.0% - up from 30.8% in 2000.
Import dependency in the EU-15 energy system is projected to reach 66.8% in 2030. The current position of new Member States, with an import dependency of 30.1% in 2000 compared to 49.5% in the EU-15 allows for a less pronounced growth of import dependency in the NMS reaching 53.7% in 2030. However, in percentage point terms the growth of import dependency in NMS is significantly higher than in the EU15 (+23.6 percentage point in 2030 from 2000 levels compared to +17.3 percentage points in the EU15). Faster growing energy needs in NMS, combined with a steep decline of indigenous solid fuels production, are the main reasons for this trend.
The increasing dependence of the EU-25 energy system on energy imports (close to two thirds of primary energy needs in 2030) raises significant concerns as regards the security of supply in the long run. This is especially the case for natural gas given the increasing dependence upon gas imports from a limited number of suppliers and the need for long distance transport infrastructures, as well as the increasing natural gas demand in other world regions such as Asia. In the oil market, supply is increasingly concentrated in the Middle East while North Sea production declines. On the other hand, the world coal market remains well diversified with abundant supplies.
1.3.3. Final Energy Demand projections
Final demand sectors have undergone significant changes both in the EU-15 and the NMS during the last decade. In EU-15, changes in the 1990s related mainly to shifts towards less energy-intensive manufacturing industries and services, higher standards of living, associated with widespread ownership of private cars and domestic appliances, increasing comfort levels in space heating and cooling, and changes in the fuel mix away from solid and liquid fuels towards gas and electricity uses. As regards new Member States, the restructuring of Central and Eastern European countries’ economies between 1990 and 2000, including the massive closure of old energy-inefficient factories and increasing energy prices progressively aligned to world energy market levels, explain the changes on the demand side.
Between 1990 and 2000 final energy demand in EU-25 increased by 7% with the EU-15 exhibiting growth of 12%, whilst energy demand in NMS declined by -20%. Under Baseline assumptions, the factors that prevailed during the last decade in EU-15 are assumed to continue to do so in the future, while they are also likely to become important for NMS as the restructuring in CEEC progresses and economic conditions improve, further stimulated by the process of convergence.
Final energy demand in EU-25 is projected to increase by 25.1% between 2000 and 2030, well above that projected for primary energy needs (+14.6%). This difference reflects the significant efficiency gains in power generation expected under Baseline assumptions. Overall final energy demand growth is significantly lower in the EU-15 than in the NMS regions (+19.9% compared to +65.6% respectively in 2000-2030), exhibiting, in addition, significant differences in terms of growth patterns (see Table 1-10). Thus, while demand growth in EU-15 is projected to peak in the next decade and to decelerate afterwards, energy demand in NMS is projected to exhibit similar levels of growth between 2010 and 2020 compared to the present decade and then to slow down in the long run. The main drivers for these different growth patterns include the different economic evolution between EU-15 and NMS and the likely faster development of saturation effects for a number of energy uses beyond 2010 in the EU-15.
1.3.3.1. Final energy demand by sector
The evolution of energy demand by sector for the EU-25 energy system is illustrated in Table 1-10. Between 1990 and 2000, structural changes in the EU-15 industrial sectors, combined with the impacts of industrial restructuring in CEEC, led to a decline of energy

28
demand in industry by -3%. In the same period industrial value added increased by 15.4% with implied intensity gains in the sector reaching 1.7% pa. In the period 2000-2030, energy demand in EU-25 industry is projected to grow by 18.6% driven by higher economic growth (sectoral value added increases by 70% between 2000 and 2030). Energy intensity gains remain significant over the projection period (+1.2% pa) driven by structural changes towards less energy-intensive manufacturing processes but also by the exploitation of energy saving options; changes in the fuel mix towards fuels allowing for higher efficiency in use also contribute to this development.
Table 1-10: Final energy demand in EU-25 by sector
1990 2000 2010 2020 2030Industry 341.1 330.1 356.4 382.4 391.6
En. intensive industries 216.8 211.6 220.8 228.4 224.9Other industrial sectors 124.3 118.4 135.7 154.0 166.6
Domestic 407.6 432.3 500.5 550.6 576.6Residential 261.0 273.3 312.0 338.7 351.3Tertiary 146.6 159.0 188.5 211.9 225.3
Transport 273.2 333.0 381.1 405.5 402.3Total 1021.9 1095.4 1238.0 1338.5 1370.5
EU-15 866.5 970.7 1086.7 1155.1 1163.9NMS 155.5 124.7 151.3 183.4 206.5
90/00 00/10 10/20 20/30 00/30Industry -0.3 0.8 0.7 0.2 0.6
En. intensive industries -0.2 0.4 0.3 -0.2 0.2Other industrial sectors -0.5 1.4 1.3 0.8 1.1
Domestic 0.6 1.5 1.0 0.5 1.0Residential 0.5 1.3 0.8 0.4 0.8Tertiary 0.8 1.7 1.2 0.6 1.2
Transport 2.0 1.4 0.6 -0.1 0.6Total 0.7 1.2 0.8 0.2 0.7
EU-15 1.1 1.1 0.6 0.1 0.6NMS -2.2 2.0 1.9 1.2 1.7
Mtoe
Annual Growth Rate (%)
Source: PRIMES.
Energy demand in the tertiary sector exhibited a limited increase in the last decade (+0.8% pa). However, demand growth in the sector was much slower than that of economic activity, which increased by 2.4% pa in 1990-2000, implying energy intensity gains that reached up to 1.6% pa. In the Baseline scenario energy demand in the tertiary sector is likely to continue growing over the projection period (+1.2% pa in 2000-2030) while the expected continuation of the restructuring of the EU-25 economy towards services leads to an economic growth of 2.1% pa. The improvement of energy intensity in this sector (energy consumption per unit of value added) is projected to reach +0.9% pa in 2000-2030.
The EU-25 residential sector also exhibited limited growth in terms of energy demand (+0.5% pa) between 1990 and 2000. The restructuring of CEEC economies (involving a more rational use of energy in the context of increasing energy prices), technological improvements (both in buildings and equipment), changes in the fuel mix, and saturation effects in many end uses for the EU-15 are some of the reasons for the limited growth of household energy needs. In the period to 2010, energy demand in households is projected to grow by 1.3% pa, but to decelerate afterwards to 0.8% pa in 2010-2020 and 0.4% pa in 2020-2030. The implied energy intensity improvement23 in the residential sector reaches +1.1% pa in 2000-2030 compared to +1.5% pa observed in the last decade.
23 Energy intensity in households is computed using per capita income as the denominator.

29
The transport sector exhibited the highest demand growth between 1990 and 2000 (+2.0% pa), accounting for some 80% of the total increase of EU-25 final energy demand. Following the strong decline of energy needs in industry in the same decade, the transport sector (excluding marine bunkers) became by 2000 the largest demand side sector - accounting for 30.4% of final energy demand compared to 26.7% in 1990. The predominant role of the transport sector in final energy demand growth is projected to continue under Baseline assumptions in the horizon to 2010 (+1.4% pa). However beyond that period the combined effect of decoupling of transport activity24 from economic growth (especially in passenger transport in EU-15) and technological progress lead to a deceleration of transport demand growth in 2010-2020 (+0.8% pa) and even a decline of transport demand energy needs in 2020-2030 (-0.1% pa). Thus, the transport sector is projected to be the third fastest growing demand sector over the projection period (+20.8% in 2000-2030 compared to +18.6% in industry, +41.7% in the tertiary and +28.5% in the residential sector). Transport in EU-25 is expected to account for 30% of final energy demand in 2030, remaining still the largest demand side sector.
1.3.3.2. Final energy demand by fuel
The demand side of the EU-25 energy system has undergone significant changes in terms of the fuel mix during the last decade as a result of shifts towards the use of more efficient energy forms. Demand for solid fuels declined by more than 50% between 1990 and 2000 while demand growth for liquid fuels (+0.9% pa) was significantly lower than that in the transport sector (+2.0% pa), implying a decline in oil consumption in all other final demand sectors. Natural gas (growing by 2.3% pa - a rate more than three times higher than average) and electricity (+1.8% pa) made some significant inroads on the demand side during the last decade, substituting for solids and liquid fuels. Demand for biomass and waste also increased at rates above average, although still representing a rather small proportion of final energy needs in 2000; while demand for distributed steam exhibited a growth at rates slightly above average in the last decade.
Under Baseline assumptions these trends are also projected to prevail in the future evolution of final energy demand in EU-25 (see Table 1-11). Liquid fuels are expected to remain the main energy carrier in the EU-25 energy demand sectors over the projection period, but growing at rates well below average, constantly losing market share. By 2030 some 77 % of liquid fuels demand is projected to arise from the transport sector, compared to close to 65% in 2000. Solid fuels demand declines over the projection period and, by 2030, they become an obsolete energy form in final use except for some heavy industries. Demand for biomass and waste grows over the projection period at rates above average as the increasing use in industry more than counterbalances the fall in the number of rural households. Electricity demand is projected to exhibit the highest growth among the main energy carriers in the demand side over the period (+1.5% pa in 2000-2030). However, the projected electricity demand growth (+1.5% pa) can be considered as modest given that, historically, electricity use grew at rates above GDP. Saturation effects, technological progress and the exploitation of energy savings options are the main reasons limiting electricity demand growth in the Baseline scenario. Demand growth for natural gas (+0.8% pa in 2000-2030) decelerates in the long run due to some saturation in space heating, limitations in infrastructure but also technological factors, such as the lack in widespread availability of gas as a transport fuel. The exploitation of cogeneration opportunities leads to significant growth of demand for distributed steam (+1.1% pa) over the outlook period. Novel final energy forms, such as hydrogen and ethanol, do not progress under Baseline assumptions primarily because of
24 The projections for passenger and freight transport activity, which are a key driver for energy demand,
stem from the “partial implementation scenario” of the ASSESS study prepared for DG-TREN in the context of the mid-term review of the Transport White Paper.

30
cost considerations. Finally, other renewable energy forms, such as solar energy used in water heaters, grow quite rapidly (+5.7% pa in 2000-2030) but they remain insignificant as a proportion of overall final consumption.
Table 1-11: Final energy demand in EU-25 by fuel
1990 2000 2010 2020 2030Solid Fuels 123.9 56.6 45.2 39.4 34.0Liquid Fuels 428.1 468.3 517.3 529.9 511.8Gas fuels 200.2 251.9 279.2 309.7 321.4Heat (from CHP/Dist. Heating) 63.1 68.7 80.2 87.7 95.3Electricity 176.5 211.4 259.3 302.9 334.0New fuels (hydrogen etc.) 0.0 0.0 0.3 1.2 1.8Biomass-waste 29.6 37.7 54.6 64.8 67.8Other renewables 0.5 0.8 1.9 2.9 4.1
Total 1021.9 1095.4 1238.0 1338.5 1370.5
90/00 00/10 10/20 20/30 00/30Solid Fuels -7.5 -2.2 -1.4 -1.5 -1.7Liquid Fuels 0.9 1.0 0.2 -0.3 0.3Gas fuels 2.3 1.0 1.0 0.4 0.8Heat (from CHP/Dist. Heating) 0.9 1.6 0.9 0.8 1.1Electricity 1.8 2.1 1.6 1.0 1.5New fuels (hydrogen etc.) - - 13.4 4.6 -Biomass-waste 2.4 3.8 1.7 0.5 2.0Other renewables 5.2 9.1 4.5 3.7 5.7
Total 0.7 1.2 0.8 0.2 0.7
Mtoe
Annual Growth Rate (%)
Source: PRIMES.
The changes of the fuel mix in final demand sectors in the Baseline are illustrated in Figure 1-4.
Figure 1-4: Structure of Final Energy Demand by fuel in EU-25.
12.15.2
41.942.8 41.8 39.6 37.3
19.623.0
22.6 23.1 23.5
6.2 6.36.5 6.6 7.0
17.3 19.3 20.9 22.6 24.4
2.9 3.5 4.6 5.1 5.4
3.7 2.9 2.50%
10%
20%
30%
40%
50%
60%
70%
80%
90%
100%
1990 2000 2010 2020 2030
Solid Fuels Liquid Fuels Gas fuels Steam Electricity Other fuels
Source: PRIMES.
By 2030 solid fuels account for 2.5% of energy needs on the demand side, compared to 5.2% in 2000 and 12.1% in 1990. Oil is also projected to lose market share dropping to 37.3% in 2030 from 42.8% in 2000. It should be noted here that part of oil consumption

31
refers to biofuels blended in gasoline and diesel oil used for transport purposes as a result of the implementation of the biofuels Directive. Under baseline conditions the biofuels share in 2010 rises strongly to almost 4% of gasoline and diesel oil consumption in the transport sector - however, falling somewhat short of the indicative target of 5.75. Nevertheless, this target would be nearly met in 2015 (5.5%) and the share continues increasing up to 2030 to reach 8.3%. Thus, biofuels account for 1% of final energy demand in 2010 (from 0.05% in 2000) rising to 1.7% in 2020 and 2.0 in 2030.
The share of gas rises to 23.5% by 2030, while that of distributed steam reaches 7.0% by 2030 (from 6.3% in 2000) because of increasing use of steam from co-generation plants. The most notable change is the increase by 5.1 percentage points in the share of electricity though, even by 2030, it accounts for less than a quarter of final energy demand.
1.3.4. Electricity and steam generation
1.3.4.1. Electricity and steam demand
As discussed in the preceding section, demand for electricity will exhibit growth at rates well above average over the projection period. The increasing number of processes, appliances and applications that can use energy only in the form of electricity, but also issues related to the favourable characteristics of electricity (easy controllability, cleanliness at the point of use, etc.), lead to the increasing use of electricity in the EU-25 energy system. This projection is in line with the well-established long-term trend towards increased electrification in most sectors of developed economies.
Table 1-12: Electricity requirements by sector in EU-2525
1990 2000 2010 2020 2030Industry 921.5 1042.2 1199.9 1318.5 1396.5Residential 568.7 694.6 880.5 1097.5 1272.3Tertiary 502.7 651.9 856.2 1032.4 1144.4Transports 59.1 68.8 78.7 73.9 71.0Energy sector 268.7 267.9 298.8 312.2 317.2Trans. and distr. Losses 160.4 200.3 195.1 195.9 190.7(Net imports) 25.4 24.9 26.0 24.7 25.6
Electricity generation 2455.7 2900.8 3483.2 4005.8 4366.6EU-15 2138.9 2576.5 3082.7 3484.7 3735.4NMS 316.7 324.3 400.4 521.0 631.2
90/00 00/10 10/20 20/30 00/30Industry 1.2 1.4 0.9 0.6 1.0Residential 2.0 2.4 2.2 1.5 2.0Tertiary 2.6 2.8 1.9 1.0 1.9Transports 1.5 1.4 -0.6 -0.4 0.1Energy sector 0.0 1.1 0.4 0.2 0.6Trans. and distr. Losses 2.2 -0.3 0.0 -0.3 -0.2(Net imports) -0.2 0.4 -0.5 0.4 0.1
Electricity generation 1.7 1.8 1.4 0.9 1.4EU-15 1.9 1.8 1.2 0.7 1.2NMS 0.2 2.1 2.7 1.9 2.2
TWh
Annual Growth Rate (%)
Source: PRIMES.
Electricity requirements in EU-25 have shown an average increase of 1.7% pa between 1990 and 2000. Demand growth in the current EU-15 reached 1.9% pa while in NMS electricity requirements exhibited limited growth from 1990 levels (+0.2% pa). The
25 Electricity consumption in refineries as well as on-site auto-consumption of electricity in the power
generation sector are included in the energy sector.

32
restructuring of CEEC economies led to a decline of electricity demand in NMS by -1.0% pa in 1990-1995, which was strongly related to the progressive ending of subsidy policies for electricity prices. However, this downward trend was reversed in the second part of the last decade with electricity demand rising by 1.5% pa.
Under Baseline assumptions total electricity generation is projected to expand by 1.4% pa in 2000-2030 (see Table 1-12). Demand growth will be especially rapid in the tertiary and the residential sector, while electricity demand in industry grows at rates below average.
The different levels of electrification achieved in the EU-15 and in the NMS by 2000 are also reflected in the evolution of electricity demand to 2030. Thus, while electricity demand increases by 1.2% pa in the EU-15 between 2000 and 2030, with a decelerating pace over time, much more pronounced growth is projected for new Member States (+2.2% pa in 2000-2030) with an accelerating pace in the period to 2020.
Distributed steam demand in the EU-25 energy system increased at a rate of +1.5% pa in 1990-2000 as the massive closure of inefficient district heating units in the nineties in CEEC, was more than counterbalanced by the increase in the use of distributed steam in the EU-15 energy system. The decrease in NMS reached -2.6% pa clearly reflecting the restructuring of their energy system, which was characterised in the past by high levels of district heating utilisation with great inefficiencies that prevailed mainly at the level of steam distribution in CEEC in the past. In contrast, the use of distributed steam grew by +3.7% pa in the EU-15, driven by the further exploitation of cogeneration potential.
Table 1-13: Distributed steam requirements by sector in EU-2526
1990 2000 2010 2020 2030Industry 426.5 471.3 565.6 638.8 713.3Residential 194.4 211.8 238.9 243.3 254.8Tertiary 112.7 115.9 127.8 137.6 140.3Energy sector 4.4 63.9 106.1 130.0 154.4Trans. and distr. Losses 31.3 32.8 26.2 28.1 29.1
Total 769.3 895.7 1064.5 1177.8 1291.9EU-15 453.0 651.8 773.9 845.7 910.2NMS 316.3 243.9 290.6 332.1 381.7
90/00 00/10 10/20 20/30 00/30Industry 1.0 1.8 1.2 1.1 1.4Residential 0.9 1.2 0.2 0.5 0.6Tertiary 0.3 1.0 0.7 0.2 0.6Energy sector 30.8 5.2 2.1 1.7 3.0Trans. and distr. Losses 0.5 -2.2 0.7 0.3 -0.4
Total 1.5 1.7 1.0 0.9 1.2EU-15 3.7 1.7 0.9 0.7 1.1NMS -2.6 1.8 1.3 1.4 1.5
TWh
Annual Growth Rate (%)
Source: PRIMES.
The shift towards the decentralisation of electricity and steam production, projected to occur over the outlook period, as well as technological progress allowing for smaller-scale distribution networks, are the key drivers for the further growth of distributed steam demand in the EU-15 (+1.1% pa in 2000-2030) and the reversal of past trends in NMS (+1.5% pa in 2000-2030). Overall distributed steam demand (i.e. excluding industrial and refinery boilers) is projected to grow in the EU-25 by 1.2% pa between 2000 and 2030 (see Table 1-13). Industry is projected to remain the dominant user of steam over the outlook period, with distributed steam demand in the energy sector, a potentially large
26 Including on-site consumption of non-marketed steam from industrial co-generation units.
33
user of steam (mainly in refineries), exhibiting the highest growth over the outlook period.
1.3.4.2. Capacities
Increasing energy requirements for electricity and steam lead to a large expansion of installed capacity in the EU-25 energy system, which is projected to increase by 66% in 2030 from 2000 levels (see Table 1-14). The rise in capacity is higher than the electricity production increase because more pronounced penetration of renewables with lower load factors compared to fossil fuel plants means higher capacity requirements.
Technological advances and the progressive deregulation of electricity markets - with smaller companies entering the market preferring plants with shorter lead times, lower capital costs and higher efficiency - are projected to cause significant growth in the use of gas for electricity generation. This is mainly through the extensive use of gas turbine combined cycle units. Thus installed capacity of gas fired plants is projected to increase dramatically, especially in the period to 2020, reaching 360 GW by 2030 from 132 GW in 2000. Gas accounts for close to 33% of total EU-25 generating capacity in 2030 compared to 20% in 2000.
The growth of gas-fired power plants occurs mainly at the expense of conventional solid and oil fired power plants, as well as nuclear power plants. The nuclear sector faces four major issues: the closure of unsafe nuclear plants in NMS; substantial decommissioning of existing nuclear plants beyond 2015; the nuclear phase-out policies in certain EU-15 Member States; and the likely decisions of economic actors not to replace all decommissioned nuclear with new nuclear plants on economic grounds. These factors result in a continuous decline of nuclear capacity, which by 2030 accounts for no more than 9.2% of total installed capacity in EU-25 (from 21.3% in 2000).
Installed capacity of solids fired power plants is projected to decline very rapidly both in absolute terms and as a share of total installed capacity in the horizon to 2010 (from 189 MW in 2000 down to 156.5 MW in 2010 with a market share of 19.3% - a decline of 9.2 percentage point from 2000 levels). In the horizon to 2020 installed capacity of solid fuel fired power plants is projected to remain rather stable whereas their market share exhibits a further decline to 16.6%. However, under Baseline assumptions, a predominant role in the replacement of retired nuclear plants will be played by advanced coal technologies (supercritical units and other clean coal technologies, e.g. IGCC and PFBC) as they are projected to become a cost-effective option in the long run, on the basis of the currently prevailing technology forecasts for power generation and the assumed evolution of international fuel prices. Thus solids fired capacity is projected to exhibit a significant growth in 2020-2030 with installed capacity exceeding 211 GW in 2030 (19.3% of total installed capacity). As regards oil fired power plants their capacity is projected to continuously decline over the projection period accounting by 2030 for just 3.2% of total installed capacity compared to 11.2% in 2000.
Renewable energy forms are also expected to have an important role in power generation in future. However, capacity expansion in hydropower plants is projected to be rather limited over the outlook period as a result of the already high exploitation of suitable sites in the EU-25 energy system and environmental restrictions especially in Nordic countries. This results in a decreasing share for hydro plants (from 14.7% in 2000 to 10.2% in 2030). In contrast, given supportive policies for renewable energy forms in the EU-15 - also likely to develop in new Member States - wind turbine capacity increases substantially, reaching by 2030 up to 183 GW (16.7% of total installed capacity) compared to less than 13 GW in 2000. Solar photovoltaic energy starts emerging mainly beyond 2020 (accounting for 0.9% of total installed capacity by 2030).
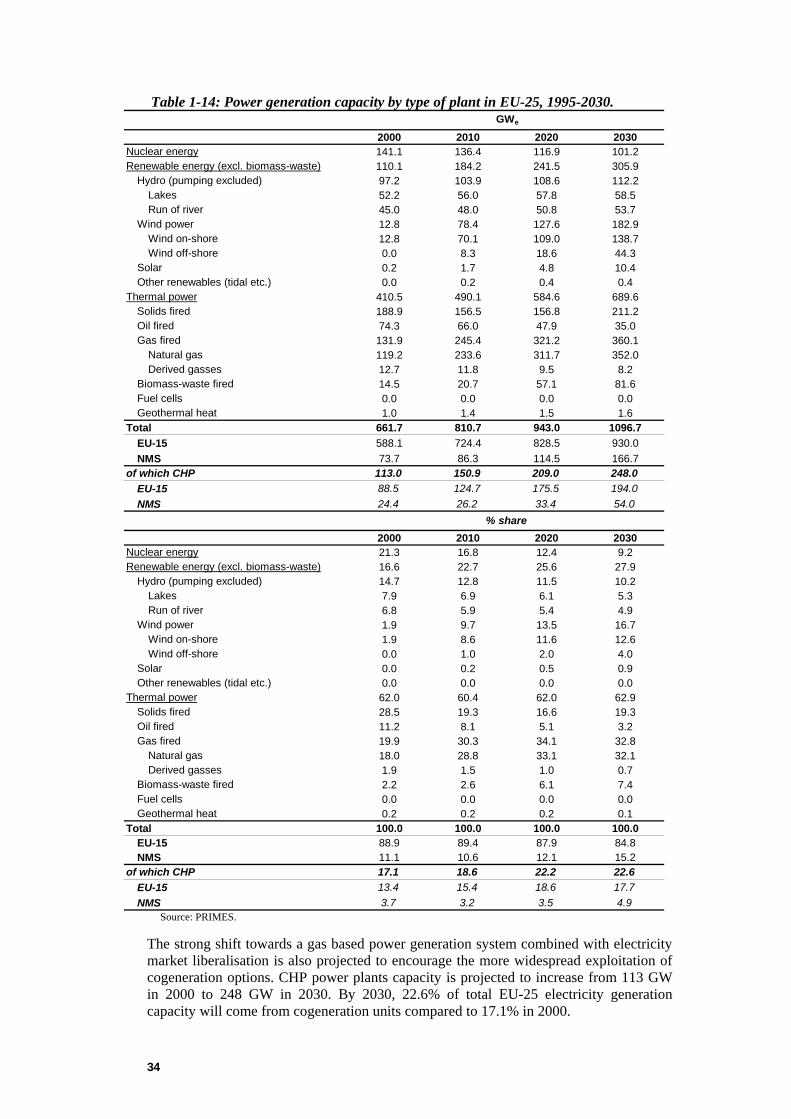
34
Table 1-14: Power generation capacity by type of plant in EU-25, 1995-2030.
2000 2010 2020 2030Nuclear energy 141.1 136.4 116.9 101.2Renewable energy (excl. biomass-waste) 110.1 184.2 241.5 305.9
Hydro (pumping excluded) 97.2 103.9 108.6 112.2Lakes 52.2 56.0 57.8 58.5Run of river 45.0 48.0 50.8 53.7
Wind power 12.8 78.4 127.6 182.9Wind on-shore 12.8 70.1 109.0 138.7Wind off-shore 0.0 8.3 18.6 44.3
Solar 0.2 1.7 4.8 10.4Other renewables (tidal etc.) 0.0 0.2 0.4 0.4
Thermal power 410.5 490.1 584.6 689.6Solids fired 188.9 156.5 156.8 211.2Oil fired 74.3 66.0 47.9 35.0Gas fired 131.9 245.4 321.2 360.1
Natural gas 119.2 233.6 311.7 352.0Derived gasses 12.7 11.8 9.5 8.2
Biomass-waste fired 14.5 20.7 57.1 81.6Fuel cells 0.0 0.0 0.0 0.0Geothermal heat 1.0 1.4 1.5 1.6
Total 661.7 810.7 943.0 1096.7EU-15 588.1 724.4 828.5 930.0NMS 73.7 86.3 114.5 166.7
of which CHP 113.0 150.9 209.0 248.0EU-15 88.5 124.7 175.5 194.0NMS 24.4 26.2 33.4 54.0
2000 2010 2020 2030Nuclear energy 21.3 16.8 12.4 9.2Renewable energy (excl. biomass-waste) 16.6 22.7 25.6 27.9
Hydro (pumping excluded) 14.7 12.8 11.5 10.2Lakes 7.9 6.9 6.1 5.3Run of river 6.8 5.9 5.4 4.9
Wind power 1.9 9.7 13.5 16.7Wind on-shore 1.9 8.6 11.6 12.6Wind off-shore 0.0 1.0 2.0 4.0
Solar 0.0 0.2 0.5 0.9Other renewables (tidal etc.) 0.0 0.0 0.0 0.0
Thermal power 62.0 60.4 62.0 62.9Solids fired 28.5 19.3 16.6 19.3Oil fired 11.2 8.1 5.1 3.2Gas fired 19.9 30.3 34.1 32.8
Natural gas 18.0 28.8 33.1 32.1Derived gasses 1.9 1.5 1.0 0.7
Biomass-waste fired 2.2 2.6 6.1 7.4Fuel cells 0.0 0.0 0.0 0.0Geothermal heat 0.2 0.2 0.2 0.1
Total 100.0 100.0 100.0 100.0EU-15 88.9 89.4 87.9 84.8NMS 11.1 10.6 12.1 15.2
of which CHP 17.1 18.6 22.2 22.6EU-15 13.4 15.4 18.6 17.7NMS 3.7 3.2 3.5 4.9
GWe
% share
Source: PRIMES.
The strong shift towards a gas based power generation system combined with electricity market liberalisation is also projected to encourage the more widespread exploitation of cogeneration options. CHP power plants capacity is projected to increase from 113 GW in 2000 to 248 GW in 2030. By 2030, 22.6% of total EU-25 electricity generation capacity will come from cogeneration units compared to 17.1% in 2000.

35
1.3.4.3. Electricity and steam generation by fuel type
As a result of nuclear phase-out policies and decommissioning of existing nuclear capacity that is not always replaced by new nuclear plants due to economic considerations, nuclear electricity generation declines quite dramatically in the long run accounting for 18.7% of electricity production in 2030 compared to 31.7% in 2000 (see Figure 1-5).
Figure 1-5: Electricity generation by fuel in EU-25
31.7 30.7 27.7 24.8 22.1 18.8 18.7
30.1 29.024.9
21.9 22.4 25.8 27.6
6.14.6
3.8
29.729.5 26.2 24.0
7.9 8.1
9.5 9.4
9.5 10.1
2.22.33.2
2.6
25.520.317.4
2.2 2.3 2.6 3.9 6.2
9.69.910.210.811.82.4 5.3 6.5 7.6
0%
10%
20%
30%
40%
50%
60%
70%
80%
90%
100%
2000 2005 2010 2015 2020 2025 2030Nuclear Solids Oil Gas Biomass-waste Hydro and other renewables Wind energy
Source: PRIMES.
Electricity production from solid fuels exhibits a continuous decline in the short/medium term, but it later recovers as a replacement fuel for nuclear both in absolute terms and as a share of total electricity generated (27.6% in 2030 compared to 30.1% in 2000). The emerging gap in the medium term is largely covered by greater use of natural gas, which in 2015-2025 is projected to become the main energy input for electricity generation. It is interesting to note, however, that beyond 2020 gas use exhibits a decline both in absolute terms and as regards its share in electricity generation. Thus in 2030 it is solid fuels that become the main energy input for power generation, a trend largely related to the increasing cost-effectiveness of coal fired technologies expected in that period and the assumed absence of additional climate change policies in the Baseline that would negatively affect solid fuel use. 27
The contribution of renewable energy forms in power generation (including biomass and waste) is projected to grow over time, reaching 27.6% of total electricity production in 2030 from 14.7% in 2000. The limited potential for further exploitation and, consequently, the declining share of electricity generation from hydropower largely offsets the increasing contribution of wind energy in electricity generation, taking into account the rapidly growing electricity demand. Moreover, it should be recalled that the indicative targets of Directive 2001/77 of September 2001 were not assumed to be necessarily met in the Baseline.
27 This Baseline scenario reflecting current trends and policies does not include carbon sequestration as an
option in power generation.

36
Higher cogeneration capacity allows for an increasing share of electricity generation from CHP power plants in electricity generation reaching 24.3% in 2030 compared to 14.5% in 2000. This is also reflected in heat/steam generation, with district heating plants (producing only heat) continuously losing market share under Baseline conditions (accounting for 11.4% of distributed steam supplies in 2030, down from 17.4% of total distributed steam in 2000).
1.3.4.4. Fuel input and efficiency in power generation
Fuel input in power generation is projected to experience lower growth (0.4% pa in 2000-2030) than the increases in electricity generation (1.4% pa) and in steam cogeneration (1.2% pa).
Table 1-15: Fuel use for electricity generation in EU-25
1990 2000 2010 2020 2030Hard coal 166.9 148.0 159.3 145.0 184.1Lignite 79.4 66.5 55.6 53.5 56.2Oil products 49.0 41.9 31.6 23.3 19.8Gas 47.1 105.5 152.8 182.7 155.2Biomass-Waste 10.2 21.2 29.1 53.6 69.4Nuclear energy 196.8 237.7 248.8 228.6 210.8Geothermal Heat 2.8 2.9 3.7 4.6 5.3
Total 552.2 623.7 681.0 691.4 700.8EU-15 463.5 542.2 587.5 584.4 583.1NMS 88.7 81.5 93.5 107.0 117.7
90/00 00/10 10/20 20/30 00/30Hard coal -1.2 0.7 -0.9 2.4 0.7Lignite -1.8 -1.8 -0.4 0.5 -0.6Oil products -1.6 -2.8 -3.0 -1.6 -2.5Gas 8.4 3.8 1.8 -1.6 1.3Biomass-waste 7.6 3.2 6.3 2.6 4.0Nuclear energy 1.9 0.5 -0.8 -0.8 -0.4Geothermal Heat 0.6 2.3 2.3 1.3 2.0
Total 1.2 0.9 0.2 0.1 0.4EU-15 1.6 0.8 -0.1 0.0 0.2NMS -0.8 1.4 1.4 1.0 1.2
Mtoe
Annual Growth Rate (%)
Source: PRIMES.
As illustrated in Table 1-15, consumption of gas in power generation peaks in 2020 but declines thereafter accounting for 22% of power generation fuel consumption by 2030 compared to 17% in 2000. Beyond 2010, and especially in the long run, coal is projected to make a strong come back accounting by 2030 for 26.2% of power generation fuel consumption (+2.5 percentage points higher than in 2000). This, however, is not the case for lignite because the emergence of advanced solid fired technologies in the EU-25 power generation system is projected to be accompanied by a strong shift towards use of imported coal. Imported coal prices are lower than those for much domestically-produced coal and lignite; and state aids for coal and in some cases also lignite are assumed to be substantially reduced by 2030. Consumption of biomass and waste also grows at rates above average over the projection period but these fuels are expected to account for less than 10% of total fuel input in 2030 (3.4% in 2000).
The significantly lower growth of fuel inputs in power generation compared to the corresponding electricity and steam production largely reflects the investment choices of electricity generators towards technologies with high conversion efficiencies, such as gas turbine combined cycle plants, and certain renewable energy forms. The replacement of nuclear power plants (with efficiency typically between 33-35%) by other forms of generation (with efficiencies of some 55% for gas combined cycles or 100% as attributed by statistical conventions for e.g. hydro and wind) further contributes to this

37
development. Efficiency of EU-25 thermal electricity production increases by 11.4 percentage points between 2000 and 2030 to reach 47.5%.
1.3.5. The outlook for energy-related CO2 emissions
The evolution of the EU-25 energy system in the last decade has been characterised by a strong decoupling of energy demand from economic growth and, in addition, by a decoupling between energy demand and CO2 emissions growth. While primary energy needs increased by 6.3% in 1990-2000, CO2 emissions declined in the same period by -2.7%. The restructuring of CEEC economies was the main driver for this trend (CO2 emissions in NMS in 2000 were 22.7% lower than in 1990). In EU-15 structural shifts towards less energy-intensive uses, technological progress and changes in the fuel mix all limited the CO2 emissions growth to 1.9% between 1990 and 2000. As a result in 2000 new Member States accounted for 14.9% of overall CO2 emissions at the EU-25 level compared to 18.7% in 1990.
CO2 emissions, under Baseline assumptions, are projected to grow over the outlook period (+0.2% pa in 2000-2030; see Table 1-16). The growth is more pronounced in the NMS (+0.5% pa) than in the EU-15 (+0.2% pa). However, even in 2030, CO2 emissions in NMS remain at levels significantly below those observed in 1990 (-9.0% lower) while emissions in the EU-15 are projected to rise by +7.9% from 1990 levels.
Table 1-16: CO2 emissions by sector in EU-25
1990 2000 2010 2020 2030Power generation 1264.3 1250.0 1328.0 1303.7 1392.5District heating 98.3 44.9 33.9 29.6 31.5New fuels (hydrogen etc.) prod. 0.0 0.0 0.2 1.2 2.2Energy Branch 141.5 144.9 123.7 112.7 97.5Industry 698.9 567.7 577.0 595.2 569.8Residential 506.1 452.1 482.7 494.9 486.7Tertiary 274.2 244.6 261.8 275.8 281.9Transport 792.7 969.9 1074.6 1115.5 1092.9
Total 3776.1 3674.1 3881.9 3928.6 3955.0EU-15 3068.4 3127.0 3290.9 3301.0 3311.0NMS 707.7 547.1 591.0 627.5 644.0
90/00 00/10 10/20 20/30 00/30Power generation -0.1 0.6 -0.2 0.7 0.4District heating -7.5 -2.8 -1.3 0.6 -1.2New fuels (hydrogen etc.) prod. - - 20.4 5.8 -Energy Branch 0.2 -1.6 -0.9 -1.4 -1.3Industry -2.1 0.2 0.3 -0.4 0.0Residential -1.1 0.7 0.3 -0.2 0.2Tertiary -1.1 0.7 0.5 0.2 0.5Transport 2.0 1.0 0.4 -0.2 0.4
Total -0.3 0.6 0.1 0.1 0.2EU-15 0.4 0.5 0.0 0.0 0.2NMS -5.0 0.8 0.6 0.3 0.5
Mt CO2
Annual Growth Rate (%)
Source: PRIMES.
In the period 2000-2010, CO2 emissions for EU-25 are projected to grow by 5.7%, exceeding the 1990 level by +2.8%. The strong short term increase to 2010 is due to high price increases for oil and particularly gas that encourage coal use in power stations, as well as the limited investment in energy efficient equipment, both in the demand and the supply side, caused by the slowdown of economic growth in the EU-25 that occurred in the recent past. Beyond 2010, CO2 emissions are projected to rise at a much slower pace (+1.2 in 2010-2020, +0.7% in 2020-2030), with the demand side being the main driver for emissions growth in 2010-2020 and the power generation sector becoming the main driver for this increase in 2020-2030 due to the massive decommissioning of nuclear power plants and increasing competitiveness of coal in the power sector.

38
Following a substantial decline in 1990-2000 (-2.1% pa), driven mainly by the shift away from energy intensive industrial activities in the EU15 and restructuring of CEEC economies, CO2 emissions in industry are projected to exhibit an increase in the horizon to 2020 and to decline thereafter, so that industrial CO2 emissions in 2030 are virtually back to the 2000 level (just +0.4% higher in 30 years); in the same period industrial energy demand increases by 18.6%. The shift towards the use of electricity and co-generated steam are the key drivers for the significant carbon intensity gains achieved in the sector (0.6% pa in 2000-2030). In 2030 industry accounts for 14.4% of total CO2 emissions in the EU-25 energy system; 1 percentage point less than in 2000.
CO2 emissions in the tertiary and the residential sector increase by 15.2% and 7.7% respectively with carbon intensity gains reaching 0.7% pa in the tertiary sector and 0.6% pa in the residential sector as increasing demand requirements mainly arise for electricity specific energy uses. Despite the fact that the tertiary sector exhibits the highest growth in CO2 emissions among all sectors of the EU-25 energy system, its share in total CO2 emissions remains rather small (7.1% in 2030 from 6.7% in 2000). The share of the residential sector in total CO2 emissions remains stable over the projection period (12.3% both in 2000 and 2030).
The growth of CO2 emissions in the transport sector decelerates over the projection period and even becomes negative in the long run. This slowdown in transport emissions growth takes place in spite of modal shifts towards less energy efficient modes. Technological progress, the projected decoupling of transport activity from economic growth and the increasing penetration of biofuels blended in gasoline and diesel oil allowing for carbon intensity gains explain the above trend. In 2030 CO2 emissions in the transport sector are projected to be 12.7% higher than in 2000 (with carbon intensity in the sector improving by 0.2% pa) accounting for 27.6% of total CO2 emissions, up from 26.4% in 2000.
By 2030 power generation accounts for 35.2% of total CO2 emissions (from 34.0% in 2000) with emissions in the sector increasing by 10% from 2000 levels compared to an increase of electricity generation by 50.5%. Carbon intensity improvements of 0.8% pa arise from the structural changes in the sector towards the use of low (gas) or zero (renewables and nuclear) carbon content fuels. However, beyond 2020 carbon intensity improvement is limited to 0.2% pa as a result of the declining contribution of nuclear energy and the ensuing replacement of nuclear with coal, which is not sufficiently compensated by the further penetration of renewables. In addition, high oil and gas prices discourage further penetration of natural gas leaving much scope for solid fuels in the baseline that does not assume that CO2 targets will be necessarily met.
It is important to note that the demand for transport, as well as for electricity and steam, derives from various social and economic activities related to different economic sectors (industry, services, agriculture, and households). Furthermore, to the extent that final demand sectors, such as industry, services and households, switch to more electricity or steam, they “export” considerable CO2 emissions caused by their activities to the power and steam generation sector.28
1.3.6. Key indicators
In the Baseline case, total GDP growth from 1990 to 2030 reaches 120% (see Table 1-17). The corresponding increase in primary energy demand is limited to 21.8%, reflecting a considerable improvement in energy intensity (energy demand per unit of
28 The breakdown of CO2 emissions by sector is based on the statistical conventions of EUROSTAT and
others, with power and steam generation being one sector. Therefore, future emissions are calculated to reflect this convention, and the projected CO2 emissions are reported in line with these statistical practices.

39
GDP). The role of energy intensity gains remains considerable over the whole projection period leading to strong decoupling between energy demand growth and GDP growth. Energy intensity gains in 1990-2010 reach 22.4% and improve a further 22.3% in 2010-2030 compared to the 1990 level (-28.7% on the basis of the 2010 level).
Table 1-17: Key indicators for the EU-25 energy system
1990 2000 2010 2020 2030Gross Domestic Product 100 123 150 187 220Gross Inland Consumption 100 106 116 121 122CO2 emissions 100 97 103 104 105Energy intensity 100 87 78 65 55Carbon intensity 100 92 88 86 86CO2 emissions / unit of GDP 100 79 69 56 48
Index (1990 = 100)
Source: PRIMES.
CO2 emissions grow more slowly than energy demand, the carbon intensity (CO2 emissions per unit of primary energy needs) of the EU-25 energy system improves, however, by no more than 5.6% between 2000 and 2030 compared to an improvement of 8.4% in 1990-2000. Beyond 2020 carbon intensity worsens slightly and CO2 emissions rise accordingly to exceed in 2030 the 1990 level by 4.7%. Given the above described energy intensity gains, the carbon intensity of the economy (i.e. CO2 emissions per unit of GDP) evolves favourably with one unit of GDP in 2030 being produced with only 47.6% of the CO2 emissions emitted in 1990. However, the challenge of climate change and the Kyoto process might require deep cuts in emissions up to 2030; and therefore much better results than projected in the Baseline case might well be needed.
Convergence between old and new Member States
The Baseline trends in energy consumption and economic growth materialise both in the new Member States and in EU-15 as there will be convergence between the old and new Member States. The NMS energy system is characterised by modernisation and economic restructuring away from energy-intensive activities, by energy efficiency improvements and more rational use of energy, and by progressive implementation of EU policies.
However, differences between the EU-15 energy system and that of the new Member States remain significant, as can be seen by comparing per capita levels of key indicators of the energy system, namely GDP, gross inland consumption (GIC) and CO2 emissions (see Figure 1-6). By 2030, GDP per capita in EU-15 remains some 2.4 times higher than in new Member States compared to close to 5 times higher in 2000. This indicates that, despite the significant improvements in new Member States’ economies, convergence with the EU-15 might not be completed by 2030.
On the other hand, convergence in terms of energy consumed per capita very pronounced, with EU-15 citizens consuming by 2030 1% less energy per person than citizens in the NMS (compared to 46% more in NMS in 2000). This result is largely explained by the significantly higher dematerialisation of the EU-15 energy system compared to that of the NMS (industrial activity in the NMS accounts for 27% of gross value added in 2030 compared to 18.5% in the EU-15, whereas that of services in NMS is limited to 61.3% - 11.5 percentage points lower than in the EU-15). Furthermore differences in the power generation sector contribute to explain the convergence of per capita consumption at the level of primary energy needs despite of higher GDP per capita in EU-15. These differences in power generation include a higher contribution of nuclear energy in the NMS than in the EU-15 (accounting in 2030 for 20.4% of electricity generation in the NMS versus 18.4% in the EU-15), the slower development of renewable energy forms (17.4% in the NMS versus 29.3% in the EU-15), the less pronounced improvement of thermal power plants efficiency (reaching 45.3% in 2030 for the NMS compared to 47.9% in the EU-15) and also the exporting character of the NMS

40
power sector (more than 55% of electricity imports in the EU-15 being satisfied by NMS in 2030). Such differences contribute to bringing about higher energy consumption in NMS, which compensates for lower energy demand per capita in NMS that would otherwise follow from lower per capita income.
Figure 1-6: Convergence in EU-25 (ratios: EU-15 to NMS)
0.89 1.02 1.13 1.12 1.05 0.99 0.95 0.93 0.91
4.58 4.53
3.98
3.523.14
2.832.59
2.40
0.991.051.121.221.321.421.461.321.15
4.94
0.0
1.0
2.0
3.0
4.0
5.0
6.0
1990 1995 2000 2005 2010 2015 2020 2025 2030
GIC per capita CO2 per capita GDP per capita Source: PRIMES.
CO2 emissions per capita in 2000 were 13% higher in the EU-15 than in the NMS, whereas they had been 11% lower in 1990 in EU-15 compared with the NMS due to energy inefficient and carbon intensive structures that prevailed in CEEC. The restructuring in CEEC in the 1990s resulted in a decline of CO2 emissions by an astonishing -22.7% for the NMS region in 1990-2000 as well as in lower per capita CO2 emissions in 2000 compared with EU-15. However, in the long term this development is reversed again with CO2 emissions per capita in 2030 in the EU-15 being 9% lower than in the NMS. The more pronounced growth of energy consumption in the NMS combined with the higher use of carbon intensive energy forms (and especially indigenous solid fuels) are the key drivers for this result. In 2030 the share of carbon free fuels in total primary energy needs reaches 22.7% in the NMS compared to 23.4% for the EU-15, whereas that of solid fuels declines to 26% (from 46.1% in 2000), remaining, however, 12.4 percentage points higher than that in the EU-15 (13.6% in 2030 from 14.8% in 2000).
The energy intensity (primary energy demand per unit of GDP) of the EU-25 energy system improves at a rate of 1.5% pa in 2000-2030 compared to 1.4% pa in 1990-2000). Energy intensity reaches 118 toe per million € in 2030 from 213 in 1990. However, as illustrated in Figure 1-7, the pace of improvement is significantly different between the EU-15 and the NMS. Following a substantial improvement in energy intensity of 3.6% pa during the last decade, driven by the economic restructuring of CEEC, energy intensity in NMS is projected to further improve at rates well above the EU-25 average over the projection period (-2.3% pa in 2000-2030) reaching 260 toe per million € in 2030 compared to 755 toe per million € in 1990. The energy intensity improvement in EU-15 is less pronounced with a decrease from 189 toe per million € in 1990 to 108 in 2030 (-1.5% pa in 2000-2030). Nevertheless, energy intensity for NMS remains, even by

41
2030, more than twice that of the EU-15 (compared to 4 times higher in 1990 and 3 times higher in 2000).
Figure 1-7: Evolution of energy intensity in EU-25 (in toe per MEuro’00)
189.1 170.0 152.7
525.3
406.1
318.7
260.0213.3
184.8 165.6138.1 118.1
107.6126.5
755.2
050
100150200250300350400450500550600650700750800
1990 2000 2010 2020 2030
EU-15 NMS EU-25 Source: PRIMES.
1.4. Concluding remarks
The EU-25 energy system will need to deal with a number of major challenges over the next 30 years, including issues related to security of supply, tightening environmental pressures, competitive energy prices and critical investment decisions. The integration of the new Member States in the EU is not projected to cause radical changes in the projected evolution of the EU-25 energy system in the period to 2030. This is because of the relatively small size of the new Member States, both in economic and in energy terms, compared to the current EU-15. However the urgency with which these issues will become increasingly important for the energy system is certainly affected by the enlargement of the EU.
The GDP in EU-25 is projected to increase by close to 80% between 2000 and 2030 (or +2.0% pa) while the growth of primary energy demand is projected to be only 15% (or 0.5% pa) in the same period. This is a rate significantly lower than that observed historically, but demonstrates that there is still no complete decoupling between energy demand and economic growth. Energy intensity gains of 1.5% pa are driven by structural changes on the demand side, better efficiency and technology in the individual sectors, and investment decisions in power generation.
The further dematerialization of EU-25 industry, combined with structural changes within sectors, strong saturation effects for a number of energy uses, improvements in thermal characteristics of buildings in the tertiary and household sectors, the slowdown in transport activity growth and the impacts arising from the EU agreement with car manufacturers, all contribute towards the decoupling of energy demand from economic growth. Improvements in energy technology, and changes in the fuel mix towards more efficient energy forms, also have a positive impact on energy intensity. In particular, the changes projected to occur in power generation towards the use of renewable energy forms and more efficient technologies and fuels further contribute to this tendency. The

42
huge inefficiencies that prevailed in new Member States, and especially in CEEC, in the past and consequently the larger scope for efficiency gains compared to the EU-15, also act in favour of the decoupling between energy demand and economic growth in the EU-25.
The EU-25 energy system will remain dominated by fossil fuels over the next 30 years. Their share is projected, however, to decline by more than 3 percentage points over the projection period, reaching 76.6% of overall energy needs by 2030 compared to 79.7% in 2000. This trend occurs despite the substantial decline in nuclear power plant capacity due to occur beyond 2015, following the nuclear phase-out policies in certain Member States, the closure of nuclear plants with safety concerns in some new Member States, or the decisions of economic actors who do not always replace decommissioned nuclear plants with new nuclear units; the share of nuclear energy in primary energy needs decreases to 11.1% in 2030 from 14.4% in 2000. The gap generated is satisfied by renewable energy forms that grow at a pace 6 times higher than that of overall primary energy needs (3.0% pa in 2000-2030). The exploitation of renewable options in power generation is the key driver for this result. However, even in 2030, the renewables share amounts to only 12.2% of primary energy needs (+6.3 percentage points from 2000 levels), well below indicative targets set within the EU-25 even over the horizon to 2010.
The use of fuels in the EU-25 energy system will become increasingly specialised. Solid fuel consumption declines over the period to 2020 but strongly increases thereafter as a highly competitive option in power generation in replacement of nuclear but also of natural gas. Higher natural gas import prices and maturity of advanced coal technologies are the key drivers for this result. By 2030 the bulk of solid fuels consumption occurs in power generation and in process-specific industrial uses (iron and steel, and cement). Oil becomes a fuel overwhelmingly used in the transport sector and as a petrochemical feedstock, growing at rates significantly lower than average. By 2030 its share in gross inland consumption declines to about 34%, about 4.5 percentage points below 2000 levels. Gas demand is projected to continue growing strongly over the period to 2020 (+1.7% pa in 2000-2020) but decline thereafter (-0.2% in 2020-2030), due to reduced competitiveness against coal in power generation but also limited potential under baseline conditions for further changes in the fuel mix towards the use of gas in the final demand sectors. Renewable energy forms are projected to remain the fastest growing energy carrier in the EU-25 energy system over the projection period (+3.0% pa in 2000-2030). Novel energy forms (hydrogen, methanol etc.) do not make significant inroads under Baseline assumptions primarily due to cost considerations.
The projected increase in the use of fossil fuels has a twofold impact upon the EU-25 energy system. First, fossil fuels are mainly imported and - with their continuing dominance – close to two thirds of EU-25 primary energy requirements will need to be imported by 2030, compared to slightly less than half in 2000. The most significant change regarding EU-25 energy security relates to the increasing dependence upon gas imports from a limited number of suppliers and significantly more distant locations. Secondly, fossil fuels give rise to CO2 emissions. CO2 emissions for EU-25 are projected to continuously increase over the projection period exceeding the 1990 level by +2.8% in 2010 and +4.7% in 2030.
Developments in transport and power generation will have a dominant role in the future evolution of the EU-25 energy system. The transport sector is characterised by increasing energy needs over the projection period, although some decoupling of transport activity from economic growth is projected in the long run; and it also suffers from the lack of alternatives under baseline conditions as regards changes in the fuel mix towards less carbon intensive fuels. In the EU-25 power generation sector some 83% of the installed capacity by 2030 will need to be commissioned over the next three decades. This key sector will, therefore, face strategic technology and fuel choice dilemmas over that period. In turn, the solutions to these will have a major effect upon the overall EU-25 energy system in the long run. Therefore, energy and transport policies will face

43
considerable challenges in dealing with those energy security and climate change issues that will become increasingly critical in the period to 2030 for the EU-25 energy system.
While the policy challenges emerging from this Baseline are similar to the ones shown in the “Trends to 2030” of 2003 and the “Scenarios on key drivers” of 2004, there are some improvements in policy relevant indicators on the basis of somewhat different assumptions. The previous baseline included higher GDP growth, lower oil prices and policies up to the end of 2001. Compared with the previous baseline of 2003 the new 2005 baseline exhibits the following main differences:
• The renewables share is up in comparison with the old baseline (between half a percentage point for 2010 and 3.5 percentage points for 2030);
• The contribution of nuclear is also higher (11% in 2030 compared with only 9.5% in the old baseline);
• Import dependency in 2030 is now projected at 65% (two percentage points less than in the previous baseline);
• CO2 emissions in the long term develop more favourably (increase in 2020 over 1990 level is cut by 4 percentage points and the increase up to 2030 is 9 percentage points lower reaching a level of just 5% above the 1990 emissions;
• However, for 2010, CO2 emissions are now projected to be somewhat higher reflecting strong coal use following high gas prices as well as the disappointing energy intensity developments in recent years, which are due to sluggish economic growth that does not provide for enough modernisation of the economy and investment in energy efficient new technology;
• The share of indigenous and carbon free fuels in electricity generation (renewables and nuclear) stabilises at current levels (some 45%) rather than decreasing markedly as projected in the 2003 baseline; carbon intensity develops somewhat more favourably than in the 2003 baseline, in which there was a worsening after 2015 due to considerable nuclear decline, replacement with coal and slow renewables penetration.

44
2. EU-27 and Europe-30 energy and transport outlook to 2030
2.1. Introduction
Further to the EU-25 energy system, the analysis performed in the context of the study also dealt with the future evolution of the energy systems of Bulgaria and Romania (likely to accede the European Union in the beginning of 2007), as well as those of Turkey (EU candidate), Norway and Switzerland. Developments in both candidate and neighbouring countries will influence energy developments in the wider European energy system.
The Baseline scenario for the energy system of candidate and neighbouring countries was constructed following the same approach as that for EU Member States, i.e. it is based on current trends and policies. Chapter 2 of this report provides a short presentation of the evolution of the EU-27 (EU-25 plus Bulgaria and Romania) and the Europe-30 energy systems and the key differences to the projected evolution for the EU-25 energy system.
2.2. Main assumptions
In the context of Europe-30, the EU-25 accounted for some 80.5% of population in 2000, a share increasing to 85.9% for the enlarged EU-27 (following the accession in the European Union of Bulgaria and Romania). As illustrated Table 2-1 the highest population growth (0.22% pa in 2000-2030) is foreseen at the Europe-30 level (driven by increasing population in Turkey), whereas the significant population decline in Bulgaria and Romania (from 30.6 million in 2000 down to 25.4 million in 2030 according to EUROSTAT projections) limits the population growth at 0.08% pa in 2000-2030 for the EU-27 (compared to 0.12% for the EU-25). By 2030 the EU-25 accounts for 78.2% of population in Europe-30 and the EU-27 for 82.4% (2.3 and 3.5 percentage points below 2000 levels, respectively).
Table 2-1: Population trends in EU-27 and Europe-30, 1990 to 2030
1990 2000 2010 2020 2030EU-25 440.79 452.92 464.05 469.27 469.37EU-27 472.71 483.52 492.84 496.41 494.78Europe-30 539.95 562.68 582.13 594.59 600.25
90/00 00/10 10/20 20/30 00/30EU-25 0.27 0.24 0.11 0.00 0.12EU-27 0.23 0.19 0.07 -0.03 0.08Europe-30 0.41 0.34 0.21 0.09 0.22
Million inhabitants
annual growth rate
Source: EUROSTAT.
In the Baseline scenario, the Bulgarian and Romanian economies are projected to see accelerated growth with GDP rising between 2000 and 2030 by 390% or 5.4% pa. However, their share in the EU-27 economy remains small (1.6% in 2030 from 0.9% in 2000). Consequently, economic growth in the EU-27 is similar to that of the EU-25 (see Table 2-2). At the Europe-30 level, economic growth is projected to reach 2.1% pa in 2000-2030 (compared to 2.0% pa for the EU-25 and the EU-27), driven by the accelerated growth of the Turkish economy (5.4% pa). In 2030, the economies of Turkey, Norway and Switzerland account for 10% of Europe-30 GDP compared to 6.6% in 2000.

45
Table 2-2: Evolution of gross domestic product in EU-27 and Europe-30, 1990 to 2030
1990 2000 2010 2020 2030EU-25 7295 8947 10947 13656 16051EU-27 7359 9001 11044 13825 16316Europe-30 7877 9666 11899 15058 18137
90/00 00/10 10/20 20/30 00/30EU-25 2.06 2.04 2.24 1.63 1.97EU-27 2.03 2.07 2.27 1.67 2.00Europe-30 2.07 2.10 2.38 1.88 2.12
000 MEuro'00
annual growth rate
Source: EUROSTAT, Economic and Financial Affairs DG, PRIMES.
As illustrated in Figure 2-1, structural differences between the EU-25, the EU-27 and the Europe-30 economies in 2000 are rather limited, reflecting the predominant role of the EU-25 economy in Europe-30.
Figure 2-1: Structure of the economy, shares in gross value added 2000, 2030: EU-27 and Europe-30 compared with EU-25
20.3 19.6 20.3 19.2 20.2 19.1
67.7 70.8 68.2 71.7 68.4 72.1
2.77.0
1.81.92.73.02.3
8.87.28.87.39.0
0%
10%
20%
30%
40%
50%
60%
70%
80%
90%
100%
2000 2030 2000 2030 2000 2030
Europe-30 EU-27 EU-25Industry Services Agriculture Other
Source: PRIMES.
By 2030 services are projected to account for 70.8% in 2030 (compared to 71.7% in the EU-27 and 72.1% in the EU-25), with their market share increasing by 4.1 percentage points (compared to 3.5 and 3.7 percentage points, respectively, in the EU-27 and the EU-25). The growth in the market share of services takes place to the detriment of all other economic activities with the market share of agricultural activity exhibiting the strongest decline (-1.7 percentage points in Europe-30, -1.6 in the EU-27 and -1.8 in the EU-25). In 2030, industrial activity accounts for 19.6% of total economic activity in Europe-30, 19.2% in the EU-27 and 19.1% in the EU-25 (-0.7, -1.1 and -1.1 percentage points, respectively from 2000 levels).
2.3. Energy and CO2 emission developments in EU-27 and Europe-30
Primary energy needs in Bulgaria and Romania are projected to grow at a rate of 1.9% pa in 2000-2030, a rate close to four times higher than that in the EU-25 (see Table 2-3).

46
Bulgaria and Romania account in 2030 for 4.9% of primary energy needs in the EU-27 from 3.2% in 2000. An even more pronounced growth of primary energy needs is projected for Turkey, Norway and Switzerland (+2.3% pa in 2000-2030). The evolution of the Turkish energy system is the key driver for this result (primary energy needs grow at a rate of 3.2% pa in 2000-2030) whereas energy requirements in Norway and Switzerland grow at a much slower pace (+0.3% pa and +0.5% pa, respectively). In 2030, Turkey, Norway and Switzerland account for 11.5% of primary energy requirements in Europe-30 (+4.4 percentage points from 2000 levels).
Table 2-3: Gross inland consumption in EU-27 and Europe -30
1990 2000 2010 2020 2030EU-25 1556.2 1653.8 1812.5 1885.3 1895.2BU,RO 89.3 55.3 65.9 84.5 97.1EU-27 1645.5 1709.1 1878.5 1969.8 1992.3TU,NO,SW 106.1 130.0 153.8 201.7 258.6Europe-30 1751.6 1839.1 2032.2 2171.5 2250.9
90/00 00/10 10/20 20/30 00/30EU-25 0.6 0.9 0.4 0.1 0.5BU,RO -4.7 1.8 2.5 1.4 1.9EU-27 0.4 0.9 0.5 0.1 0.5TU,NO,SW 2.1 1.7 2.8 2.5 2.3Europe-30 0.5 1.0 0.7 0.4 0.7
Mtoe
Annual Growth Rate (%)
Source: PRIMES.
As regards the structure of primary energy needs by fuel similar evolution patterns to those projected for the EU-25 energy system are also projected for Europe-30 and EU-27 (see Figure 2-2).
Figure 2-2: Structure of primary energy demand, shares in 2000, 2030: EU-27 and Europe-30 compared with EU-25
11.1
18.815.7
18.815.9
18.515.5
38.2
33.8
38.0
33.4
38.4
33.8
22.8
7.1 12.75.9
12.15.8
12.2
13.6 10.3 14.3 11.1 14.4
27.5
22.4 23.0
27.4 27.3
0%
20%
40%
60%
80%
100%
2000 2030 2000 2030 2000 2030
Europe-30 EU-27 EU-25 Nuclear Solid Fuels Liquid Fuels Natural Gas Renewable En. Sources
Source: PRIMES.
The market shares of natural gas and renewable energy forms are projected to grow well above 2000 levels, an increase occurring to the detriment of oil, solid fuels and nuclear energy. In 2030, fossil fuels account for 77% of primary energy needs in Europe-30

47
(from 79.3% in 2000), 76.7% in the EU-27 (from 79.7% in 2000) and 76.6% in the EU-25 (from 79.7% in 2000). The renewables shares in EU-27 are similar to those in EU-25 both in 2000 and 2030, whereas in Europe-30 the renewables share is somewhat higher particularly due to large hydro use in Norway and also in Switzerland.
Another important issue for the Europe-30 energy system in the long run is the rising import dependency. Higher energy requirements combined with lower indigenous fossil fuel production and declining nuclear generation, lead to an import dependency for Europe-30 of 56.3% by 2030, up from 36.4% in 2000 (see Table 2-4). However, import dependency in Europe-30 remains 8.6 percentage points lower than in the EU-25 in 2030 (compared to 10.8 percentage points lower in 2000), a result strongly related to Norwegian indigenous oil and gas resources.
Table 2-4: Import dependency in EU-27 and Europe-30
1990 2000 2010 2020 2030EU-25 44.7 47.2 55.0 63.5 64.9EU-27 44.6 46.7 54.4 62.9 64.2Europe-30 38.9 36.4 44.4 52.4 56.3
%
Source: PRIMES.
The generally greater reliance of Bulgaria and Romania on indigenous energy sources (mainly solid fuels) means slightly lower import dependence for the EU-27 than in the EU-25 (0.7 percentage points lower in 2030 from 0.5 percentage points lower in 2000) with a slightly lower increase in EU-27 compared with EU-25.
Table 2-5: Evolution of CO2 emissions in EU-27 and Europe-30
1990 2000 2010 2020 2030EU-25 3776.1 3674.1 3881.9 3928.6 3955.0BU,RO 233.7 126.1 160.9 203.1 225.4EU-27 4009.9 3800.2 4042.8 4131.6 4180.4TU,NO,SW 197.8 276.6 333.6 447.9 575.0Europe-30 4207.7 4076.8 4376.4 4579.5 4755.4
90/00 00/10 10/20 20/30 00/30EU-25 -0.3 0.6 0.1 0.1 0.2BU,RO -6.0 2.5 2.4 1.1 2.0EU-27 -0.5 0.6 0.2 0.1 0.3TU,NO,SW 3.4 1.9 3.0 2.5 2.5Europe-30 -0.3 0.7 0.5 0.4 0.5
Mt CO2
Annual Growth Rate (%)
Source: PRIMES.
The higher share of fossil fuels in total primary energy needs for Europe-30 and the EU-27 energy systems in comparison to the EU-25, in combination to the higher growth of energy requirements is also clearly reflected in the evolution of energy related CO2 emissions (see Table 2-5). In 2000-2030 CO2 emissions are projected to grow at a rate of 0.3% pa in the EU-27 (0.1 percentage points more than in the EU-25 as CO2 emissions in Bulgaria and Romania are projected to grow at a rate of 2.0 pa). In Europe-30, CO2 emissions increase by 0.5% pa between 2000 and 2030 with emissions growing at a rate of 3.1% pa in Turkey and remaining rather stable over the projection period for Norway and Switzerland.
However, CO2 emissions growth from 1990 levels in less pronounced for the EU-27 energy system than in EU-25 (0.8% compared to 2.8% in 2010, 4.3% compared to 4.7% in 2030). This result reflects the substantial CO2 emissions decline of -32.2% that occurred between 1990 and 2000 in Bulgaria and Romania arising from the restructuring of their economies. On the other hand CO2 emissions in Europe-30 are projected to exceed the 1990 level by +4.0% in 2010 and by +13.0% in 2030 (8.3 percentage point

48
more than in the EU-25, a result strongly influenced by developments in Turkey involving high population and economic growth.
2.4. Concluding remarks
The challenges for energy policy are very similar at the EU-27 and the EU-25 levels. Energy consumption continues growing with supplies being increasingly met by imports, which come to a large extent from geopolitically unstable regions. With decreasing indigenous fossil fuel production and a limited combined contribution from renewables and nuclear, the EU dependency on imports grows to about two thirds in 2030.
Energy demand growth is particularly strong for natural gas, which needs to be imported in increasing quantities over wider distances. Renewables also increase their contribution while the shares of solid fuels, oil and nuclear decline. There are issues concerning the achievement of agreed targets. This concerns reaching the 12% renewables share objective for 2010 as well as meeting Kyoto targets. The Baseline has increasing CO2 emissions for EU-25 as well as for EU-27 and the renewables share stays well below 12% in 2010.
This picture is rather similar at the Europe-30 level showing increasing import dependency, albeit at a lower level, as well as a low renewables penetration and rising CO2 emissions.

49
Glossary Carbon intensity: The amount of CO2 by weight emitted per unit of energy consumed or produced (t of CO2/tonne of oil equivalent (toe) or MWh)
Clean coal units: A number of innovative, new technologies designed to use coal in a more efficient and cost-effective manner while enhancing environmental protection. Among the most promising technologies are fluidised-bed combustion (PFBC), integrated gasification combined cycle (IGCC), coal liquefaction and coal gasification.
CO2 Emissions to GDP: The amount of CO2 by weight emitted per unit of GDP (carbon intensity of GDP - t of CO2/MEuro'00).
Cogeneration thermal plant: A system using a common energy source to produce both electricity and steam for other uses, resulting in increased fuel efficiency (see also: CHP).
Combined Cycle Gas Turbine plant (CCGT): A technology which combines gas turbines and steam turbines, connected to one or more electrical generators at the same plant. The gas turbine (usually fuelled by natural gas or oil) produces mechanical power, which drives the generator, and heat in the form of hot exhaust gases. These gases are fed to a boiler, where steam is raised at pressure to drive a conventional steam turbine, which is also connected to an electrical generator. This has the effect of producing additional electricity from the same fuel compared to an open cycle turbine.
Combined Heat and Power: This means cogeneration of useful heat and power (electricity) in a single process. In contrast to conventional power plants that convert only a limited part of the primary energy into electricity with the remainder of this energy being discharged as waste heat. CHP makes use of large parts of this energy for e.g. industrial processes, district heating, and space heating. CHP therefore improves energy efficiency (see also: cogeneration thermal plant).
Efficiency for thermal electricity production: A measure of the efficiency of converting a fuel to electricity and useful heat; heat and electricity output divided by the calorific value of input fuel times 100 (for expressing this ratio in percent).
Efficiency indicator in freight transport (activity related): Energy efficiency in freight transport is computed on the basis of energy use per tonne-km. Given the existence of inconsistencies between transport and energy statistics, absolute numbers (especially at the level of individual Member States) might be misleading in some cases. For that reason, the numbers given are only illustrative of the trends in certain cases.
Efficiency indicator in passenger transport (activity related): Energy efficiency in passenger transport is computed on the basis of energy use per passenger-km travelled. Issues related to consistency of transport and energy statistics also apply to passenger transport (see also: Efficiency indicator in freight transport).
Energy branch consumption: Energy consumed in refineries, electricity and steam generation and in other transformation processes; it does not include the energy input for transformation as such.
Energy intensity: energy consumption/GDP or another indicator for economic activity
Energy intensive industries: Iron and steel, non-ferrous, chemicals, non-metallic minerals, and paper and pulp industries.
Final energy demand: Energy finally consumed in the transport, industrial, household and tertiary sectors with tertiary comprising services and agriculture. It excludes deliveries to the energy transformation sector (e.g. power plants) and to the energy branch. It includes electricity consumption in the above final demand sectors.
50
Freight transport activity: Expressed in tonne kilometres (1 Gtkm = 109 tkm); one tkm = one tonne transported a distance of one km. It should be noted that inland navigation includes both waterborne inland transport activity and domestic sea shipping. However, international short sea shipping is not included in the above category as, according to EUROSTAT energy balances, energy needs for international shipping are allocated to bunkers.
Fuel cells: A fuel cell is an electrochemical energy conversion device converting hydrogen and oxygen into electricity and heat with the help of catalysts. The fuel cell provides a direct current voltage that can be used to power various electrical devices including motors and lights.
Fuel input to power generation: Fuel use in electricity, CHP plants and heat plants.
Gas: Includes natural gas, blast furnace gas, coke-oven gas and gasworks gas.
Generation capacity: The maximum rated output of a generator, prime mover, or other electric power production equipment under specific conditions designated by the manufacturer.
Geothermal plant: A plant in which the prime mover is a steam turbine. The turbine is driven either by steam produced from hot water or by natural steam that derives its energy from heat in rocks or fluids beneath the surface of the earth. The energy is extracted by drilling and/or pumping.
Gross Inland Consumption: Quantity of energy consumed within the borders of a country. It is calculated as primary production + recovered products + imports +/- stock changes – exports – bunkers (i.e. quantities supplied to sea-going ships).
Gross Inland Consumption/GDP: Energy intensity indicator calculated as the ratio of total energy consumption to GDP – (toe/MEuro'00).
Hydro power plant: A plant producing energy with the use of moving water. For the purposes of these energy balance projections, hydro excludes pumped storage plants that generate electricity during peak load periods by using water previously pumped into an elevated storage reservoir during off-peak periods when excess generating capacity is available.
Non fossil fuels: Nuclear and renewable energy sources.
Non-energy uses: Non-energy consumption of energy carriers in petrochemicals and other sectors, such as chemical feedstocks, lubricants and asphalt for road construction.
Nuclear power plant: A plant in which a nuclear fission chain reaction can be initiated, controlled, and sustained at a specific rate. They include new nuclear designs (such as the EPR as well as the AP1000 and AP600) with passive safety features (which reduce core fusion probability from 10-5/year of existing nuclear plants to less than 5.10-7/year).
Oil: Includes refinery gas, liquefied petroleum gas, kerosene, gasoline, diesel oil, fuel oil, crude oil, naphtha and feedstocks.
Open cycle units: A turbine connected to an electrical generator. Less efficient than a combined cycle gas turbine (CCGT) because it does not recover and use the heat of the exhaust gases. Open cycle units include polyvalent units, monovalent coal-lignite units, monovalent oil-gas units and monovalent biomass-waste units.
Passenger transport activity: Expressed in passenger kilometres (1 Gpkm = 109 pkm); one pkm relates to one person travelling a distance of one km. Passenger transport activity includes energy consuming passenger transport on roads (public and private), by rail, in airplanes and on ships as far as this takes place on rivers, canals, lakes and as domestic sea shipping; international short sea shipping is not included as, according to
51
EUROSTAT energy balances, energy needs for international shipping are allocated to bunkers.
Primary production: Total indigenous production.
Renewable energy sources: Energy resources that are naturally replenishing but flow-limited. They are virtually inexhaustible in duration but limited in the amount of energy that is available per unit of time. Renewable energy resources include: biomass, hydro, wind, geothermal, solar, wave and tidal energy.
Solar power plant: A plant producing energy with the use of radiant energy from the sun; includes solar thermal and photovoltaic (direct conversion of solar energy into electricity) plants.
Solids: Include both primary products (hard coal and lignite) and derived fuels (patent fuels, coke, tar, pitch and benzol).
Supercritical polyvalent units: A power plant for which the evaporator part of the boiler operates at pressures above 22.1 MegaPascals (MPa). The cycle-medium in this case is a single phase fluid with homogenous properties and thus there is no need to separate steam from water in a drum, allowing for higher efficiency in power generation.
Thermal power plants: Type of electric generating station in which the source of energy for the prime mover is heat.
Wind power plant: Typically a group of wind turbines interconnected to a common utility system through a system of transformers, distribution lines, and (usually) one substation. Operation, control, and maintenance functions are often centralised through a network of computerised monitoring systems, supplemented by visual inspection.

52

53
APPENDIX 1: Baseline scenario demographic and macroeconomic assumptions
Summary assumptions by country and groups of countries

BASELINE SCENARIOEU-25: Key Demographic and Economic Assumptions
1990 2000 2010 2020 2030 '90-'00 '00-'10 '10-'20 '20-'30 1990 2000 2010 2020 2030Annual % Change % Structure of total value added
Main Demographic AssumptionsPopulation (Million) 440.8 452.9 464.1 469.3 469.4 0.3 0.2 0.1 0.0Average household size (persons) 2.6 2.4 2.3 2.1 2.0 -0.8 -0.8 -0.6 -0.5Number of households (Million) 166.8 185.5 205.2 220.9 232.7 1.1 1.0 0.7 0.5Gross Domestic product (in 000 MEuro'00) 7294.7 8947.0 10946.8 13656.3 16051.4 2.1 2.0 2.2 1.6Households expenditure (in 000 MEuro'00) 4254.7 5192.0 6327.8 7822.6 9163.7 2.0 2.0 2.1 1.6Gross Value Added (in 000 MEuro'00) 6796.9 8332.2 10230.4 12785.3 15009.0 2.1 2.1 2.3 1.6Industry 1459.7 1685.0 1974.0 2454.3 2863.3 1.4 1.6 2.2 1.6 21.5 20.2 19.3 19.2 19.1
iron and steel 48.7 43.5 47.1 51.7 54.7 -1.1 0.8 0.9 0.6 0.7 0.5 0.5 0.4 0.4non ferrous metals 18.3 21.3 25.7 30.5 33.9 1.5 1.9 1.7 1.1 0.3 0.3 0.3 0.2 0.2chemicals 139.1 183.6 236.5 308.9 371.7 2.8 2.6 2.7 1.9 2.0 2.2 2.3 2.4 2.5
petrochemicals,fertilisers and others 90.7 106.3 126.0 149.0 166.1 1.6 1.7 1.7 1.1 1.3 1.3 1.2 1.2 1.1pharmaceuticals and cosmetics 48.4 77.4 110.5 159.8 205.5 4.8 3.6 3.8 2.5 0.7 0.9 1.1 1.3 1.4
non metallic minerals 70.1 79.5 89.1 105.9 118.6 1.3 1.1 1.7 1.1 1.0 1.0 0.9 0.8 0.8paper, pulp, printing 133.6 157.5 174.1 216.2 252.6 1.7 1.0 2.2 1.6 2.0 1.9 1.7 1.7 1.7
paper and pulp production 46.4 51.8 55.4 65.6 74.4 1.1 0.7 1.7 1.3 0.7 0.6 0.5 0.5 0.5printing and publishing 87.2 105.7 118.7 150.6 178.2 1.9 1.2 2.4 1.7 1.3 1.3 1.2 1.2 1.2
food, drink, tobacco 174.8 203.5 245.3 307.1 359.6 1.5 1.9 2.3 1.6 2.6 2.4 2.4 2.4 2.4textiles and leather 109.8 92.5 78.9 78.4 79.0 -1.7 -1.6 -0.1 0.1 1.6 1.1 0.8 0.6 0.5engineering 614.3 721.2 865.1 1089.4 1280.9 1.6 1.8 2.3 1.6 9.0 8.7 8.5 8.5 8.5other industries 150.9 182.4 212.2 266.3 312.3 1.9 1.5 2.3 1.6 2.2 2.2 2.1 2.1 2.1
Construction 430.3 434.7 499.8 604.4 683.4 0.1 1.4 1.9 1.2 6.3 5.2 4.9 4.7 4.6Services 4461.9 5695.7 7210.4 9125.5 10818.9 2.5 2.4 2.4 1.7 65.6 68.4 70.5 71.4 72.1
market services 1591.9 2131.2 2740.7 3538.4 4251.8 3.0 2.5 2.6 1.9 23.4 25.6 26.8 27.7 28.3non-market services 1448.2 1711.2 2077.2 2435.9 2702.9 1.7 2.0 1.6 1.0 21.3 20.5 20.3 19.1 18.0trade 1421.8 1853.3 2392.5 3151.3 3864.2 2.7 2.6 2.8 2.1 20.9 22.2 23.4 24.6 25.7
Agriculture 197.3 221.5 229.8 252.8 269.1 1.2 0.4 1.0 0.6 2.9 2.7 2.2 2.0 1.8Energy sector 247.7 295.3 316.4 348.3 374.1 1.8 0.7 1.0 0.7 3.6 3.5 3.1 2.7 2.5
BASELINE SCENARIOEU15: Key Demographic and Economic Assumptions
1990 2000 2010 2020 2030 '90-'00 '00-'10 '10-'20 '20-'30 1990 2000 2010 2020 2030Annual % Change % Structure of total value added
Main Demographic AssumptionsPopulation (Million) 365.7 378.1 390.7 397.5 398.7 0.3 0.3 0.2 0.0Average household size (persons) 2.6 2.4 2.2 2.1 2.0 -0.8 -0.7 -0.7 -0.5Number of households (Million) 141.1 157.4 175.1 190.3 201.6 1.1 1.1 0.8 0.6Gross Domestic product (in 000 MEuro'00) 6981.9 8572.2 10391.5 12835.7 14948.8 2.1 1.9 2.1 1.5Households expenditure (in 000 MEuro'00) 4074.3 4972.5 5997.3 7329.2 8496.5 2.0 1.9 2.0 1.5Gross Value Added (in 000 MEuro'00) 6517.5 8001.9 9742.6 12065.2 14042.0 2.1 2.0 2.2 1.5Industry 1394.1 1603.2 1839.2 2253.4 2602.1 1.4 1.4 2.1 1.4 21.4 20.0 18.9 18.7 18.5
iron and steel 45.6 40.4 44.2 48.3 50.9 -1.2 0.9 0.9 0.5 0.7 0.5 0.5 0.4 0.4non ferrous metals 17.8 20.4 24.4 28.9 32.1 1.4 1.8 1.7 1.1 0.3 0.3 0.3 0.2 0.2chemicals 133.9 177.7 227.4 293.5 350.3 2.9 2.5 2.6 1.8 2.1 2.2 2.3 2.4 2.5
petrochemicals,fertilisers and others 86.7 103.0 120.9 141.5 156.1 1.7 1.6 1.6 1.0 1.3 1.3 1.2 1.2 1.1pharmaceuticals and cosmetics 47.2 74.7 106.5 152.0 194.2 4.7 3.6 3.6 2.5 0.7 0.9 1.1 1.3 1.4
non metallic minerals 66.2 74.3 80.4 92.8 101.9 1.2 0.8 1.4 0.9 1.0 0.9 0.8 0.8 0.7paper, pulp, printing 128.5 151.9 164.9 203.0 236.5 1.7 0.8 2.1 1.5 2.0 1.9 1.7 1.7 1.7
paper and pulp production 43.8 49.8 52.6 62.1 70.5 1.3 0.5 1.7 1.3 0.7 0.6 0.5 0.5 0.5printing and publishing 84.7 102.1 112.2 140.9 166.0 1.9 1.0 2.3 1.7 1.3 1.3 1.2 1.2 1.2
food, drink, tobacco 163.8 188.0 218.1 266.6 306.8 1.4 1.5 2.0 1.4 2.5 2.3 2.2 2.2 2.2textiles and leather 101.5 86.6 71.8 70.2 70.0 -1.6 -1.9 -0.2 0.0 1.6 1.1 0.7 0.6 0.5engineering 593.4 692.3 815.1 1013.6 1180.4 1.6 1.6 2.2 1.5 9.1 8.7 8.4 8.4 8.4other industries 143.5 171.6 192.9 236.6 273.1 1.8 1.2 2.1 1.4 2.2 2.1 2.0 2.0 1.9
Construction 406.5 414.2 474.1 563.7 629.7 0.2 1.4 1.7 1.1 6.2 5.2 4.9 4.7 4.5Services 4314.7 5504.6 6926.5 8698.2 10225.9 2.5 2.3 2.3 1.6 66.2 68.8 71.1 72.1 72.8
market services 1556.7 2083.8 2667.8 3425.4 4091.7 3.0 2.5 2.5 1.8 23.9 26.0 27.4 28.4 29.1non-market services 1394.1 1654.5 2004.6 2339.9 2583.4 1.7 1.9 1.6 1.0 21.4 20.7 20.6 19.4 18.4trade 1363.8 1766.3 2254.1 2932.9 3550.8 2.6 2.5 2.7 1.9 20.9 22.1 23.1 24.3 25.3
Agriculture 180.7 204.2 206.1 223.8 235.5 1.2 0.1 0.8 0.5 2.8 2.6 2.1 1.9 1.7Energy sector 221.5 275.7 296.7 326.1 348.9 2.2 0.7 0.9 0.7 3.4 3.4 3.0 2.7 2.5
Source: PRIMES
Source: PRIMES
54

BASELINE SCENARIONew Member States: Key Demographic and Economic Assumptions
1990 2000 2010 2020 2030 '90-'00 '00-'10 '10-'20 '20-'30 1990 2000 2010 2020 2030Annual % Change % Structure of total value added
Main Demographic AssumptionsPopulation (Million) 75.0 74.9 73.4 71.8 70.6 0.0 -0.2 -0.2 -0.2Average household size (persons) 2.9 2.7 2.4 2.3 2.3 -0.9 -0.8 -0.4 -0.3Number of households (Million) 25.7 28.2 30.1 30.6 31.2 0.9 0.6 0.2 0.2Gross Domestic product (in 000 MEuro'00) 312.8 374.8 555.3 820.6 1102.7 1.8 4.0 4.0 3.0Households expenditure (in 000 MEuro'00) 180.4 219.5 330.4 493.4 667.2 2.0 4.2 4.1 3.1Gross Value Added (in 000 MEuro'00) 279.4 330.3 487.9 720.0 966.9 1.7 4.0 4.0 3.0Industry 65.6 81.8 134.8 200.9 261.3 2.2 5.1 4.1 2.7 23.5 24.8 27.6 27.9 27.0
iron and steel 3.1 3.0 3.6 4.1 4.5 -0.2 1.7 1.3 0.9 1.1 0.9 0.7 0.6 0.5non ferrous metals 0.5 0.9 1.2 1.6 1.8 5.6 3.2 2.3 1.5 0.2 0.3 0.3 0.2 0.2chemicals 5.3 6.0 9.2 15.4 21.3 1.2 4.4 5.3 3.3 1.9 1.8 1.9 2.1 2.2
petrochemicals,fertilisers and others 4.0 3.3 4.1 5.8 7.5 -2.0 2.1 3.6 2.6 1.4 1.0 0.8 0.8 0.8pharmaceuticals and cosmetics 1.2 2.7 5.1 9.6 13.8 7.9 6.7 6.6 3.7 0.4 0.8 1.0 1.3 1.4
non metallic minerals 3.9 5.2 8.6 13.1 16.6 3.0 5.2 4.3 2.4 1.4 1.6 1.8 1.8 1.7paper, pulp, printing 5.2 5.6 9.3 13.2 16.1 0.7 5.2 3.6 2.0 1.9 1.7 1.9 1.8 1.7
paper and pulp production 2.6 2.0 2.8 3.4 3.9 -2.9 3.6 2.1 1.3 0.9 0.6 0.6 0.5 0.4printing and publishing 2.5 3.6 6.5 9.7 12.2 3.5 6.1 4.2 2.3 0.9 1.1 1.3 1.4 1.3
food, drink, tobacco 11.1 15.5 27.2 40.6 52.8 3.4 5.8 4.1 2.7 4.0 4.7 5.6 5.6 5.5textiles and leather 8.3 5.9 7.1 8.2 9.1 -3.3 1.9 1.4 1.1 3.0 1.8 1.5 1.1 0.9engineering 20.9 28.9 49.3 75.1 99.8 3.3 5.5 4.3 2.9 7.5 8.8 10.1 10.4 10.3other industries 7.4 10.8 19.3 29.6 39.2 3.8 6.0 4.4 2.8 2.6 3.3 4.0 4.1 4.1
Construction 23.7 20.6 25.7 40.7 53.8 -1.4 2.3 4.7 2.8 8.5 6.2 5.3 5.6 5.6Services 147.3 191.0 283.9 427.3 593.0 2.6 4.0 4.2 3.3 52.7 57.8 58.2 59.3 61.3
market services 35.2 47.4 72.9 112.9 160.1 3.0 4.4 4.5 3.5 12.6 14.4 14.9 15.7 16.6non-market services 54.1 56.6 72.6 96.0 119.6 0.5 2.5 2.8 2.2 19.4 17.1 14.9 13.3 12.4trade 58.0 87.0 138.4 218.4 313.4 4.1 4.8 4.7 3.7 20.8 26.3 28.4 30.3 32.4
Agriculture 16.6 17.3 23.7 29.0 33.6 0.4 3.2 2.1 1.5 6.0 5.2 4.9 4.0 3.5Energy sector 26.1 19.5 19.7 22.2 25.3 -2.9 0.1 1.2 1.3 9.4 5.9 4.0 3.1 2.6
BASELINE SCENARIOEU-27: Key Demographic and Economic Assumptions
1990 2000 2010 2020 2030 '90-'00 '00-'10 '10-'20 '20-'30 1990 2000 2010 2020 2030Annual % Change % Structure of total value added
Main Demographic AssumptionsPopulation (Million) 472.7 483.5 492.8 496.4 494.8 0.2 0.2 0.1 0.0Average household size (persons) 2.7 2.5 2.3 2.1 2.0 -0.8 -0.8 -0.6 -0.5Number of households (Million) 177.0 196.5 216.6 232.2 243.8 1.0 1.0 0.7 0.5Gross Domestic product (in 000 MEuro'00) 7358.9 9001.0 11044.1 13825.4 16315.6 2.0 2.1 2.3 1.7Households expenditure (in 000 MEuro'00) 4298.2 5232.0 6400.6 7938.0 9331.0 2.0 2.0 2.2 1.6Gross Value Added (in 000 MEuro'00) 6859.9 8382.6 10318.6 12935.7 15242.0 2.0 2.1 2.3 1.7Industry 1479.4 1699.3 1998.9 2497.7 2932.0 1.4 1.6 2.3 1.6 21.6 20.3 19.4 19.3 19.2
iron and steel 49.6 44.2 48.1 52.9 56.2 -1.1 0.8 1.0 0.6 0.7 0.5 0.5 0.4 0.4non ferrous metals 18.5 21.3 25.7 30.5 34.0 1.4 1.9 1.7 1.1 0.3 0.3 0.2 0.2 0.2chemicals 140.7 184.6 238.8 313.5 379.5 2.8 2.6 2.8 1.9 2.1 2.2 2.3 2.4 2.5
petrochemicals,fertilisers and others 92.1 106.8 127.0 150.8 169.0 1.5 1.7 1.7 1.1 1.3 1.3 1.2 1.2 1.1pharmaceuticals and cosmetics 48.6 77.7 111.8 162.7 210.5 4.8 3.7 3.8 2.6 0.7 0.9 1.1 1.3 1.4
non metallic minerals 71.3 80.2 90.0 107.5 120.9 1.2 1.2 1.8 1.2 1.0 1.0 0.9 0.8 0.8paper, pulp, printing 134.1 158.0 175.0 217.8 255.2 1.7 1.0 2.2 1.6 2.0 1.9 1.7 1.7 1.7
paper and pulp production 46.8 52.0 55.7 65.9 74.9 1.1 0.7 1.7 1.3 0.7 0.6 0.5 0.5 0.5printing and publishing 87.4 106.0 119.3 151.8 180.3 2.0 1.2 2.4 1.7 1.3 1.3 1.2 1.2 1.2
food, drink, tobacco 178.8 208.1 253.3 319.5 377.7 1.5 2.0 2.3 1.7 2.6 2.5 2.5 2.5 2.5textiles and leather 111.7 94.7 81.7 82.4 84.3 -1.6 -1.5 0.1 0.2 1.6 1.1 0.8 0.6 0.6engineering 620.8 724.3 870.9 1101.3 1301.9 1.6 1.9 2.4 1.7 9.0 8.6 8.4 8.5 8.5other industries 153.9 183.9 215.3 272.3 322.3 1.8 1.6 2.4 1.7 2.2 2.2 2.1 2.1 2.1
Construction 433.0 437.6 505.5 615.3 701.7 0.1 1.5 2.0 1.3 6.3 5.2 4.9 4.8 4.6Services 4484.8 5717.9 7251.5 9197.6 10931.3 2.5 2.4 2.4 1.7 65.4 68.2 70.3 71.1 71.7
market services 1598.0 2136.7 2754.3 3562.8 4289.9 2.9 2.6 2.6 1.9 23.3 25.5 26.7 27.5 28.1non-market services 1452.8 1717.5 2086.6 2451.7 2727.2 1.7 2.0 1.6 1.1 21.2 20.5 20.2 19.0 17.9trade 1434.0 1863.7 2410.6 3183.1 3914.2 2.7 2.6 2.8 2.1 20.9 22.2 23.4 24.6 25.7
Agriculture 212.0 229.2 240.7 267.6 288.6 0.8 0.5 1.1 0.8 3.1 2.7 2.3 2.1 1.9Energy sector 250.7 298.6 322.0 357.5 388.3 1.8 0.8 1.1 0.8 3.7 3.6 3.1 2.8 2.5
Source: PRIMES
Source: PRIMES
55

BASELINE SCENARIOEU-28: Key Demographic and Economic Assumptions
1990 2000 2010 2020 2030 '90-'00 '00-'10 '10-'20 '20-'30 1990 2000 2010 2020 2030Annual % Change % Structure of total value added
Main Demographic AssumptionsPopulation (Million) 528.9 551.0 570.0 582.2 587.5 0.4 0.3 0.2 0.1Average household size (persons) 2.8 2.6 2.4 2.3 2.2 -0.7 -0.8 -0.6 -0.5Number of households (Million) 188.7 211.6 236.2 256.1 271.6 1.2 1.1 0.8 0.6Gross Domestic product (in 000 MEuro'00) 7511.4 9217.8 11370.5 14408.7 17374.7 2.1 2.1 2.4 1.9Households expenditure (in 000 MEuro'00) 4408.1 5385.6 6618.6 8314.0 9999.5 2.0 2.1 2.3 1.9Gross Value Added (in 000 MEuro'00) 7018.4 8606.7 10654.2 13535.5 16331.0 2.1 2.2 2.4 1.9Industry 1511.6 1748.0 2078.8 2644.5 3206.2 1.5 1.7 2.4 1.9 21.5 20.3 19.5 19.5 19.6
iron and steel 51.6 46.9 51.3 56.9 61.3 -0.9 0.9 1.1 0.7 0.7 0.5 0.5 0.4 0.4non ferrous metals 18.8 21.6 25.9 30.8 34.3 1.4 1.9 1.7 1.1 0.3 0.3 0.2 0.2 0.2chemicals 143.9 189.4 246.9 328.7 407.9 2.8 2.7 2.9 2.2 2.1 2.2 2.3 2.4 2.5
petrochemicals,fertilisers and others 95.3 111.5 134.4 163.3 189.9 1.6 1.9 2.0 1.5 1.4 1.3 1.3 1.2 1.2pharmaceuticals and cosmetics 48.6 78.0 112.5 165.3 218.0 4.8 3.7 3.9 2.8 0.7 0.9 1.1 1.2 1.3
non metallic minerals 73.9 83.8 94.8 116.2 136.3 1.3 1.2 2.1 1.6 1.1 1.0 0.9 0.9 0.8paper, pulp, printing 135.1 159.5 177.7 222.9 264.9 1.7 1.1 2.3 1.7 1.9 1.9 1.7 1.6 1.6
paper and pulp production 47.4 52.6 56.5 67.2 76.7 1.0 0.7 1.7 1.3 0.7 0.6 0.5 0.5 0.5printing and publishing 87.7 106.9 121.2 155.8 188.2 2.0 1.3 2.5 1.9 1.2 1.2 1.1 1.2 1.2
food, drink, tobacco 182.0 214.4 264.2 339.2 414.2 1.7 2.1 2.5 2.0 2.6 2.5 2.5 2.5 2.5textiles and leather 119.8 102.0 89.3 91.8 97.3 -1.6 -1.3 0.3 0.6 1.7 1.2 0.8 0.7 0.6engineering 624.0 734.1 894.4 1151.3 1405.1 1.6 2.0 2.6 2.0 8.9 8.5 8.4 8.5 8.6other industries 162.6 196.2 234.2 306.5 384.8 1.9 1.8 2.7 2.3 2.3 2.3 2.2 2.3 2.4
Construction 442.0 447.6 517.3 636.6 743.7 0.1 1.5 2.1 1.6 6.3 5.2 4.9 4.7 4.6Services 4569.8 5844.6 7449.0 9556.4 11585.1 2.5 2.5 2.5 1.9 65.1 67.9 69.9 70.6 70.9
market services 1616.0 2159.2 2791.1 3641.7 4467.7 2.9 2.6 2.7 2.1 23.0 25.1 26.2 26.9 27.4non-market services 1471.8 1746.4 2133.6 2537.1 2877.4 1.7 2.0 1.7 1.3 21.0 20.3 20.0 18.7 17.6trade 1482.0 1939.0 2524.3 3377.6 4240.1 2.7 2.7 3.0 2.3 21.1 22.5 23.7 25.0 26.0
Agriculture 239.0 259.7 277.0 325.0 381.9 0.8 0.6 1.6 1.6 3.4 3.0 2.6 2.4 2.3Energy sector 256.1 306.8 332.1 373.1 414.1 1.8 0.8 1.2 1.0 3.6 3.6 3.1 2.8 2.5
BASELINE SCENARIOEUROPE - 30: Key Demographic and Economic Assumptions
1990 2000 2010 2020 2030 '90-'00 '00-'10 '10-'20 '20-'30 1990 2000 2010 2020 2030Annual % Change % Structure of total value added
Main Demographic AssumptionsPopulation (Million) 540.0 562.7 582.1 594.6 600.3 0.4 0.3 0.2 0.1Average household size (persons) 2.8 2.6 2.4 2.3 2.2 -0.7 -0.8 -0.6 -0.5Number of households (Million) 193.5 217.1 242.4 263.0 278.8 1.2 1.1 0.8 0.6Gross Domestic product (in 000 MEuro'00) 7877.3 9665.6 11898.8 15057.8 18137.4 2.1 2.1 2.4 1.9Households expenditure (in 000 MEuro'00) 4613.4 5634.9 6917.6 8684.4 10436.6 2.0 2.1 2.3 1.9Gross Value Added (in 000 MEuro'00) 7340.7 9000.6 11123.8 14116.6 17016.6 2.1 2.1 2.4 1.9Industry 1568.1 1829.4 2172.6 2761.5 3343.6 1.6 1.7 2.4 1.9 21.4 20.3 19.5 19.6 19.6
iron and steel 53.4 48.4 53.6 59.5 63.9 -1.0 1.0 1.0 0.7 0.7 0.5 0.5 0.4 0.4non ferrous metals 20.1 23.4 28.1 33.4 37.3 1.5 1.9 1.7 1.1 0.3 0.3 0.3 0.2 0.2chemicals 150.9 201.0 260.0 345.2 427.5 2.9 2.6 2.9 2.2 2.1 2.2 2.3 2.4 2.5
petrochemicals,fertilisers and others 98.3 114.6 136.6 165.3 191.6 1.5 1.8 1.9 1.5 1.3 1.3 1.2 1.2 1.1pharmaceuticals and cosmetics 52.6 86.3 123.4 179.9 235.9 5.1 3.6 3.8 2.7 0.7 1.0 1.1 1.3 1.4
non metallic minerals 75.4 86.1 97.3 119.2 139.6 1.3 1.2 2.0 1.6 1.0 1.0 0.9 0.8 0.8paper, pulp, printing 144.0 168.5 187.8 235.5 279.6 1.6 1.1 2.3 1.7 2.0 1.9 1.7 1.7 1.6
paper and pulp production 50.7 55.0 59.2 70.4 80.4 0.8 0.7 1.7 1.3 0.7 0.6 0.5 0.5 0.5printing and publishing 93.3 113.5 128.6 165.1 199.2 2.0 1.3 2.5 1.9 1.3 1.3 1.2 1.2 1.2
food, drink, tobacco 187.0 222.4 272.8 349.8 426.9 1.7 2.1 2.5 2.0 2.5 2.5 2.5 2.5 2.5textiles and leather 120.9 103.8 91.0 93.6 99.2 -1.5 -1.3 0.3 0.6 1.6 1.2 0.8 0.7 0.6engineering 650.2 771.2 938.2 1207.1 1471.2 1.7 2.0 2.6 2.0 8.9 8.6 8.4 8.6 8.6other industries 166.3 204.6 243.7 318.3 398.4 2.1 1.8 2.7 2.3 2.3 2.3 2.2 2.3 2.3
Construction 457.7 464.0 534.7 655.6 764.4 0.1 1.4 2.1 1.5 6.2 5.2 4.8 4.6 4.5Services 4788.3 6096.5 7758.8 9943.3 12045.1 2.4 2.4 2.5 1.9 65.2 67.7 69.7 70.4 70.8
market services 1713.2 2273.1 2931.7 3819.5 4680.9 2.9 2.6 2.7 2.1 23.3 25.3 26.4 27.1 27.5non-market services 1536.6 1815.0 2214.2 2633.1 2987.6 1.7 2.0 1.7 1.3 20.9 20.2 19.9 18.7 17.6trade 1538.5 2008.4 2612.9 3490.7 4376.5 2.7 2.7 2.9 2.3 21.0 22.3 23.5 24.7 25.7
Agriculture 246.5 267.2 284.7 333.1 390.4 0.8 0.6 1.6 1.6 3.4 3.0 2.6 2.4 2.3Energy sector 280.1 343.6 373.0 423.0 473.2 2.1 0.8 1.3 1.1 3.8 3.8 3.4 3.0 2.8
Source: PRIMES
Source: PRIMES
56

BASELINE SCENARIOAUSTRIA: Key Demographic and Economic Assumptions
1990 2000 2010 2020 2030 '90-'00 '00-'10 '10-'20 '20-'30 1990 2000 2010 2020 2030Annual % Change % Structure of total value added
Main Demographic AssumptionsPopulation (Million) 7.7 8.0 8.3 8.4 8.5 0.4 0.3 0.2 0.1Average household size (persons) 2.6 2.5 2.4 2.3 2.2 -0.3 -0.5 -0.4 -0.4Number of households (Million) 3.0 3.2 3.5 3.7 3.9 0.7 0.8 0.7 0.4Gross Domestic product (in 000 MEuro'00) 163.5 210.4 254.6 309.0 353.9 2.6 1.9 2.0 1.4Households expenditure (in 000 MEuro'00) 93.6 115.7 136.8 165.2 188.4 2.1 1.7 1.9 1.3Gross Value Added (in 000 MEuro'00) 146.2 189.1 229.7 279.5 320.7 2.6 2.0 2.0 1.4Industry 29.5 38.4 49.7 60.8 70.0 2.7 2.6 2.0 1.4 20.2 20.3 21.6 21.8 21.8
iron and steel 1.4 1.7 2.1 2.2 2.3 1.9 2.4 0.5 0.2 0.9 0.9 0.9 0.8 0.7non ferrous metals 0.5 0.7 1.1 1.5 1.8 3.9 4.4 3.0 2.4 0.3 0.4 0.5 0.5 0.6chemicals 1.7 2.5 3.5 4.5 5.4 4.1 3.5 2.5 1.9 1.1 1.3 1.5 1.6 1.7
petrochemicals,fertilisers and others 1.1 1.4 1.8 2.1 2.4 1.8 2.6 1.9 1.2 0.8 0.7 0.8 0.8 0.8pharmaceuticals and cosmetics 0.5 1.1 1.7 2.4 3.0 7.9 4.5 3.1 2.4 0.4 0.6 0.8 0.8 0.9
non metallic minerals 2.3 2.3 2.7 3.2 3.5 0.1 1.4 1.8 0.9 1.6 1.2 1.2 1.1 1.1paper, pulp, printing 2.7 3.9 4.4 5.2 5.8 3.8 1.1 1.7 1.1 1.8 2.1 1.9 1.8 1.8
paper and pulp production 1.3 1.9 1.9 2.1 2.3 4.1 0.2 0.9 0.7 0.9 1.0 0.8 0.8 0.7printing and publishing 1.4 2.0 2.4 3.0 3.5 3.6 1.9 2.3 1.4 1.0 1.1 1.1 1.1 1.1
food, drink, tobacco 3.3 4.5 5.1 6.2 7.0 3.2 1.3 1.9 1.3 2.2 2.4 2.2 2.2 2.2textiles and leather 2.3 1.9 1.8 1.7 1.7 -1.9 -0.6 -0.2 -0.1 1.6 1.0 0.8 0.6 0.5engineering 11.1 15.0 21.1 26.6 31.4 3.1 3.5 2.4 1.7 7.6 7.9 9.2 9.5 9.8other industries 4.3 6.0 8.0 9.8 11.1 3.2 2.9 2.1 1.2 3.0 3.2 3.5 3.5 3.4
Construction 10.4 14.2 16.2 19.0 21.3 3.1 1.4 1.6 1.2 7.1 7.5 7.1 6.8 6.6Services 96.8 124.6 148.9 182.3 210.0 2.6 1.8 2.0 1.4 66.2 65.9 64.8 65.2 65.5
market services 27.9 38.7 47.2 58.3 68.4 3.3 2.0 2.1 1.6 19.1 20.5 20.6 20.8 21.3non-market services 33.2 39.5 42.6 49.9 54.6 1.8 0.8 1.6 0.9 22.7 20.9 18.6 17.8 17.0trade 35.7 46.3 59.1 74.2 87.0 2.6 2.5 2.3 1.6 24.4 24.5 25.7 26.5 27.1
Agriculture 4.3 4.9 5.8 6.7 7.3 1.2 1.8 1.4 0.9 3.0 2.6 2.5 2.4 2.3Energy sector 5.1 7.1 9.0 10.8 12.2 3.3 2.5 1.8 1.2 3.5 3.7 3.9 3.8 3.8
BASELINE SCENARIOBELGIUM: Key Demographic and Economic Assumptions
1990 2000 2010 2020 2030 '90-'00 '00-'10 '10-'20 '20-'30 1990 2000 2010 2020 2030Annual % Change % Structure of total value added
Main Demographic AssumptionsPopulation (Million) 10.0 10.2 10.6 10.8 11.0 0.3 0.3 0.2 0.2Average household size (persons) 2.6 2.4 2.3 2.2 2.1 -0.6 -0.6 -0.5 -0.4Number of households (Million) 3.9 4.2 4.6 5.0 5.3 0.8 0.9 0.8 0.6Gross Domestic product (in 000 MEuro'00) 200.1 247.9 302.9 370.1 431.7 2.2 2.0 2.0 1.5Households expenditure (in 000 MEuro'00) 108.0 132.2 157.1 185.9 213.1 2.0 1.7 1.7 1.4Gross Value Added (in 000 MEuro'00) 188.0 229.1 278.0 336.6 390.2 2.0 2.0 1.9 1.5Industry 39.8 46.4 53.4 62.5 71.5 1.6 1.4 1.6 1.3 21.1 20.3 19.2 18.6 18.3
iron and steel 3.6 2.6 2.7 2.8 2.8 -3.1 0.3 0.1 0.0 1.9 1.1 1.0 0.8 0.7non ferrous metals 1.1 1.0 1.3 1.4 1.5 -0.4 2.3 1.0 0.3 0.6 0.4 0.5 0.4 0.4chemicals 6.2 9.6 12.2 14.9 17.6 4.5 2.5 2.0 1.7 3.3 4.2 4.4 4.4 4.5
petrochemicals,fertilisers and others 4.1 6.1 7.1 7.9 8.4 4.0 1.5 1.1 0.6 2.2 2.7 2.6 2.4 2.2pharmaceuticals and cosmetics 2.0 3.4 5.1 6.9 9.2 5.3 4.0 3.1 2.8 1.1 1.5 1.8 2.1 2.3
non metallic minerals 2.1 2.1 2.1 2.5 2.7 0.2 0.0 1.5 0.9 1.1 0.9 0.8 0.7 0.7paper, pulp, printing 2.9 3.3 3.9 4.7 5.3 1.1 1.9 1.8 1.4 1.6 1.4 1.4 1.4 1.4
paper and pulp production 1.6 1.2 1.4 1.6 1.8 -3.4 1.7 1.5 0.9 0.9 0.5 0.5 0.5 0.4printing and publishing 1.3 2.1 2.6 3.1 3.6 5.0 1.9 1.9 1.6 0.7 0.9 0.9 0.9 0.9
food, drink, tobacco 5.2 5.1 6.1 7.0 7.8 -0.1 1.7 1.4 1.0 2.8 2.2 2.2 2.1 2.0textiles and leather 2.7 2.6 2.2 2.2 2.2 -0.3 -1.5 -0.1 0.0 1.4 1.1 0.8 0.7 0.6engineering 12.8 16.2 18.3 21.6 25.1 2.4 1.2 1.7 1.5 6.8 7.1 6.6 6.4 6.4other industries 3.2 3.8 4.5 5.5 6.5 1.8 1.6 2.1 1.7 1.7 1.7 1.6 1.6 1.7
Construction 10.1 11.6 13.1 15.0 16.7 1.4 1.2 1.3 1.1 5.4 5.1 4.7 4.5 4.3Services 128.6 158.9 199.9 246.4 288.4 2.1 2.3 2.1 1.6 68.4 69.4 71.9 73.2 73.9
market services 44.1 62.7 78.1 96.9 115.2 3.6 2.2 2.2 1.7 23.4 27.3 28.1 28.8 29.5non-market services 45.0 52.3 64.0 75.4 81.2 1.5 2.0 1.7 0.7 23.9 22.8 23.0 22.4 20.8trade 39.6 44.0 57.7 74.0 92.0 1.1 2.8 2.5 2.2 21.0 19.2 20.8 22.0 23.6
Agriculture 2.6 3.7 3.7 4.0 4.1 3.7 0.0 0.8 0.3 1.4 1.6 1.3 1.2 1.1Energy sector 7.0 8.5 7.9 8.8 9.6 2.0 -0.7 1.0 0.9 3.7 3.7 2.9 2.6 2.4
Source: PRIMES
Source: PRIMES
57

BASELINE SCENARIOCYPRUS: Key Demographic and Economic Assumptions
1990 2000 2010 2020 2030 '90-'00 '00-'10 '10-'20 '20-'30 1990 2000 2010 2020 2030Annual % Change % Structure of total value added
Main Demographic AssumptionsPopulation (Million) 0.6 0.7 0.8 0.9 0.9 1.9 1.2 1.0 0.6Average household size (persons) 4.6 4.7 4.5 4.5 4.6 0.1 -0.4 0.1 0.2Number of households (Million) 0.1 0.1 0.2 0.2 0.2 1.8 1.6 0.9 0.4Gross Domestic product (in 000 MEuro'00) 6.3 9.9 14.2 19.9 24.9 4.5 3.7 3.5 2.3Households expenditure (in 000 MEuro'00) 3.6 6.5 9.6 13.7 17.0 6.0 3.9 3.6 2.2Gross Value Added (in 000 MEuro'00) 5.9 9.3 13.4 19.0 23.8 4.7 3.7 3.5 2.3Industry 0.7 0.9 1.2 1.7 2.1 2.7 2.4 3.3 2.3 12.3 10.2 9.0 8.8 8.8
iron and steel 0.0 0.0 0.0 0.0 0.0 0.0 0.0 0.0 0.0 0.0non ferrous metals 0.0 0.0 0.0 0.0 0.0 0.0 0.0 0.0 0.0 0.0chemicals 0.0 0.1 0.1 0.1 0.1 7.2 0.9 3.0 2.0 0.6 0.7 0.5 0.5 0.5
petrochemicals,fertilisers and others 0.0 0.0 0.0 0.0 0.0 3.4 -0.8 0.7 0.4 0.2 0.2 0.1 0.1 0.1pharmaceuticals and cosmetics 0.0 0.1 0.1 0.1 0.1 8.8 1.4 3.5 2.3 0.4 0.5 0.4 0.4 0.4
non metallic minerals 0.1 0.1 0.2 0.2 0.3 0.1 4.1 3.3 1.6 1.8 1.2 1.2 1.2 1.1paper, pulp, printing 0.0 0.1 0.1 0.1 0.1 1.6 2.4 1.2 0.0 0.9 0.8 0.7 0.6
paper and pulp production 0.0 0.0 0.0 0.0 0.0 0.0 0.0 0.0 0.0 0.0printing and publishing 0.0 0.1 0.1 0.1 0.1 1.6 2.4 1.2 0.0 0.9 0.8 0.7 0.6
food, drink, tobacco 0.2 0.3 0.4 0.6 0.7 6.3 2.8 3.3 2.3 2.8 3.2 3.0 2.9 2.9textiles and leather 0.2 0.1 0.1 0.1 0.1 -7.3 -3.7 -0.2 0.5 2.7 0.8 0.4 0.3 0.2engineering 0.1 0.1 0.2 0.3 0.5 1.5 4.2 4.9 3.9 2.0 1.5 1.6 1.8 2.1other industries 0.1 0.2 0.2 0.3 0.3 1.7 1.9 2.6 1.6 2.4 1.8 1.5 1.4 1.3
Construction 0.8 0.6 1.0 1.5 1.8 -2.3 5.4 3.5 1.8 13.2 6.6 7.8 7.8 7.4Services 3.9 7.1 10.3 14.7 18.7 6.2 3.7 3.6 2.4 65.7 76.2 76.4 77.4 78.4
market services 1.1 2.1 3.4 4.9 6.3 6.7 4.8 3.9 2.5 18.6 22.6 25.0 25.9 26.4non-market services 1.1 1.9 2.9 4.0 4.8 5.9 4.2 3.4 1.9 18.1 20.4 21.3 21.1 20.3trade 1.7 3.1 4.1 5.8 7.5 6.1 2.7 3.6 2.7 29.0 33.3 30.1 30.5 31.7
Agriculture 0.3 0.4 0.5 0.6 0.7 1.4 2.8 1.7 1.3 5.7 4.1 3.8 3.2 2.9Energy sector 0.2 0.3 0.4 0.5 0.6 3.5 4.6 2.7 1.6 3.2 2.8 3.1 2.8 2.6
BASELINE SCENARIOCZECH REPUBLIC: Key Demographic and Economic Assumptions
1990 2000 2010 2020 2030 '90-'00 '00-'10 '10-'20 '20-'30 1990 2000 2010 2020 2030Annual % Change % Structure of total value added
Main Demographic AssumptionsPopulation (Million) 10.4 10.3 10.1 9.9 9.7 -0.1 -0.1 -0.2 -0.2Average household size (persons) 2.9 2.6 2.4 2.3 2.3 -0.9 -0.7 -0.4 -0.3Number of households (Million) 3.6 3.9 4.2 4.2 4.3 0.8 0.5 0.2 0.0Gross Domestic product (in 000 MEuro'00) 59.0 60.4 84.3 117.1 147.3 0.2 3.4 3.3 2.3Households expenditure (in 000 MEuro'00) 30.4 32.1 45.7 65.8 84.0 0.6 3.6 3.7 2.5Gross Value Added (in 000 MEuro'00) 53.1 56.6 77.3 105.0 130.4 0.6 3.2 3.1 2.2Industry 13.0 15.2 24.0 32.6 40.3 1.6 4.7 3.1 2.1 24.4 26.9 31.1 31.1 30.9
iron and steel 0.6 0.8 1.0 1.1 1.1 2.6 1.8 0.9 0.7 1.2 1.4 1.3 1.0 0.9non ferrous metals 0.1 0.1 0.2 0.2 0.2 10.0 2.1 1.1 0.7 0.1 0.2 0.2 0.2 0.2chemicals 1.3 1.0 1.3 1.9 2.7 -2.0 2.3 4.0 3.3 2.4 1.8 1.7 1.8 2.0
petrochemicals,fertilisers and others 1.1 0.8 0.9 1.2 1.5 -3.7 1.6 2.6 2.5 2.1 1.4 1.2 1.1 1.1pharmaceuticals and cosmetics 0.2 0.3 0.4 0.8 1.2 5.7 4.2 6.6 4.4 0.3 0.5 0.5 0.7 0.9
non metallic minerals 0.9 1.3 1.9 2.7 3.3 4.0 3.5 3.5 2.1 1.7 2.4 2.4 2.5 2.5paper, pulp, printing 1.5 0.9 1.2 1.6 2.0 -5.5 3.5 3.0 2.1 2.9 1.5 1.6 1.6 1.5
paper and pulp production 1.0 0.4 0.5 0.7 0.8 -7.9 2.8 2.2 1.7 1.8 0.7 0.7 0.6 0.6printing and publishing 0.6 0.4 0.7 1.0 1.2 -2.3 4.2 3.7 2.3 1.1 0.8 0.9 0.9 0.9
food, drink, tobacco 1.4 1.8 2.9 4.0 5.1 2.6 4.7 3.4 2.4 2.7 3.2 3.7 3.8 3.9textiles and leather 2.0 1.0 0.9 0.9 0.9 -7.0 -0.7 0.3 0.3 3.7 1.7 1.1 0.9 0.7engineering 3.6 6.4 11.0 15.1 18.6 6.0 5.5 3.2 2.1 6.8 11.4 14.3 14.3 14.3other industries 1.6 1.8 3.6 5.1 6.4 1.2 7.2 3.5 2.2 3.0 3.2 4.7 4.9 4.9
Construction 6.5 3.0 3.3 4.7 5.8 -7.4 0.9 3.6 2.1 12.2 5.3 4.2 4.5 4.4Services 24.1 31.6 43.3 60.3 76.2 2.7 3.2 3.4 2.4 45.3 55.8 56.0 57.4 58.5
market services 8.4 9.6 14.8 21.3 26.8 1.4 4.5 3.7 2.3 15.7 16.9 19.2 20.3 20.5non-market services 6.9 7.7 9.0 11.5 14.2 1.2 1.5 2.6 2.1 12.9 13.7 11.6 11.0 10.9trade 8.8 14.2 19.5 27.5 35.3 4.9 3.2 3.5 2.5 16.6 25.2 25.2 26.2 27.1
Agriculture 1.9 2.9 2.8 3.1 3.3 4.3 -0.2 0.9 0.7 3.5 5.1 3.6 2.9 2.5Energy sector 7.7 3.9 3.9 4.4 4.8 -6.6 0.1 1.1 0.9 14.5 6.9 5.1 4.2 3.7
Source: PRIMES
Source: PRIMES
58

BASELINE SCENARIODENMARK: Key Demographic and Economic Assumptions
1990 2000 2010 2020 2030 '90-'00 '00-'10 '10-'20 '20-'30 1990 2000 2010 2020 2030Annual % Change % Structure of total value added
Main Demographic AssumptionsPopulation (Million) 5.1 5.3 5.5 5.5 5.6 0.4 0.2 0.1 0.1Average household size (persons) 2.3 2.2 2.1 2.0 1.9 -0.4 -0.6 -0.5 -0.4Number of households (Million) 2.2 2.4 2.6 2.8 2.9 0.7 0.8 0.7 0.5Gross Domestic product (in 000 MEuro'00) 136.3 171.6 202.2 235.2 269.2 2.3 1.7 1.5 1.4Households expenditure (in 000 MEuro'00) 67.6 81.7 97.5 112.5 128.1 1.9 1.8 1.4 1.3Gross Value Added (in 000 MEuro'00) 124.7 154.4 181.6 211.0 241.3 2.2 1.6 1.5 1.4Industry 21.0 24.8 26.5 30.3 34.1 1.7 0.7 1.4 1.2 16.8 16.1 14.6 14.4 14.1
iron and steel 0.3 0.3 0.3 0.3 0.3 1.8 -0.3 0.3 0.2 0.2 0.2 0.2 0.2 0.1non ferrous metals 0.1 0.1 0.2 0.3 0.3 3.1 4.2 2.6 2.1 0.1 0.1 0.1 0.1 0.1chemicals 1.5 3.6 3.9 4.6 5.3 9.0 0.8 1.8 1.4 1.2 2.3 2.1 2.2 2.2
petrochemicals,fertilisers and others 0.6 1.1 1.1 1.2 1.3 6.2 0.4 1.1 0.7 0.5 0.7 0.6 0.6 0.5pharmaceuticals and cosmetics 0.9 2.5 2.8 3.4 4.0 10.4 1.0 2.1 1.7 0.7 1.6 1.5 1.6 1.7
non metallic minerals 1.0 1.2 1.1 1.3 1.4 1.5 -0.5 1.2 1.2 0.8 0.8 0.6 0.6 0.6paper, pulp, printing 2.6 2.6 2.4 2.8 3.1 -0.2 -0.6 1.3 1.2 2.1 1.7 1.3 1.3 1.3
paper and pulp production 0.9 0.5 0.5 0.6 0.7 -4.6 0.1 1.1 0.8 0.7 0.3 0.3 0.3 0.3printing and publishing 1.8 2.0 1.9 2.2 2.4 1.4 -0.8 1.4 1.3 1.4 1.3 1.0 1.0 1.0
food, drink, tobacco 3.9 4.0 4.6 5.3 6.0 0.3 1.3 1.4 1.2 3.1 2.6 2.5 2.5 2.5textiles and leather 1.0 0.7 0.5 0.5 0.5 -3.0 -3.0 -0.4 -0.3 0.8 0.5 0.3 0.2 0.2engineering 7.5 9.1 10.1 11.4 12.9 1.9 1.0 1.3 1.2 6.0 5.9 5.5 5.4 5.3other industries 3.1 3.2 3.4 3.8 4.3 0.4 0.6 1.3 1.2 2.5 2.1 1.9 1.8 1.8
Construction 6.4 7.3 8.4 9.6 10.9 1.4 1.3 1.4 1.2 5.1 4.8 4.6 4.6 4.5Services 89.7 111.0 135.2 158.7 183.4 2.2 2.0 1.6 1.5 71.9 71.9 74.5 75.2 76.0
market services 30.3 35.9 43.5 51.8 60.8 1.7 1.9 1.8 1.6 24.3 23.2 23.9 24.5 25.2non-market services 32.4 37.7 42.9 46.7 49.6 1.5 1.3 0.9 0.6 26.0 24.4 23.6 22.1 20.5trade 27.0 37.4 48.8 60.2 73.0 3.3 2.7 2.1 1.9 21.6 24.2 26.9 28.5 30.2
Agriculture 4.2 5.5 5.8 6.2 6.4 2.8 0.5 0.7 0.3 3.4 3.6 3.2 2.9 2.6Energy sector 3.5 5.8 5.7 6.3 6.6 5.3 -0.1 0.9 0.6 2.8 3.7 3.2 3.0 2.7
BASELINE SCENARIOESTONIA: Key Demographic and Economic Assumptions
1990 2000 2010 2020 2030 '90-'00 '00-'10 '10-'20 '20-'30 1990 2000 2010 2020 2030Annual % Change % Structure of total value added
Main Demographic AssumptionsPopulation (Million) 1.6 1.4 1.3 1.2 1.2 -1.3 -0.4 -0.5 -0.4Average household size (persons) 2.6 2.4 2.1 1.9 1.7 -0.6 -1.6 -1.0 -1.2Number of households (Million) 0.6 0.6 0.6 0.7 0.7 -0.7 1.2 0.5 0.9Gross Domestic product (in 000 MEuro'00) 6.6 5.9 10.3 15.4 20.9 -1.1 5.6 4.2 3.1Households expenditure (in 000 MEuro'00) 3.6 3.4 6.0 9.2 12.5 -0.5 5.9 4.3 3.1Gross Value Added (in 000 MEuro'00) 6.0 5.3 9.2 13.8 18.6 -1.1 5.6 4.1 3.1Industry 1.5 1.0 2.2 3.4 4.6 -3.9 8.2 4.5 3.2 24.7 18.6 23.7 24.4 24.8
iron and steel 0.0 0.0 0.0 0.0 0.0 0.0 0.0 0.0 0.0 0.0non ferrous metals 0.0 0.0 0.0 0.0 0.0 0.0 0.0 0.0 0.0 0.0chemicals 0.0 0.0 0.1 0.2 0.2 3.3 6.7 6.8 4.5 0.5 0.8 0.9 1.1 1.3
petrochemicals,fertilisers and others 0.0 0.0 0.1 0.1 0.2 3.1 6.2 6.7 4.3 0.5 0.8 0.8 1.0 1.2pharmaceuticals and cosmetics 0.0 0.0 0.0 0.0 0.0 10.0 15.2 8.4 6.0 0.0 0.0 0.1 0.1 0.1
non metallic minerals 0.0 0.1 0.1 0.2 0.2 8.4 6.2 4.2 2.7 0.5 1.2 1.3 1.3 1.3paper, pulp, printing 0.0 0.1 0.2 0.3 0.3 9.5 8.3 4.0 2.6 0.6 1.5 2.0 2.0 1.9
paper and pulp production 0.0 0.0 0.1 0.1 0.1 15.4 8.8 3.3 1.3 0.1 0.4 0.6 0.5 0.4printing and publishing 0.0 0.1 0.1 0.2 0.3 7.9 8.2 4.2 3.0 0.5 1.1 1.4 1.4 1.4
food, drink, tobacco 0.3 0.2 0.3 0.4 0.5 -6.2 3.9 3.6 2.4 5.5 3.3 2.8 2.6 2.5textiles and leather 0.5 0.1 0.3 0.3 0.3 -12.1 5.5 1.7 1.0 9.1 2.8 2.8 2.2 1.8engineering 0.2 0.3 0.6 0.9 1.4 3.5 8.4 5.0 4.1 3.0 4.7 6.1 6.7 7.4other industries 0.3 0.2 0.7 1.2 1.6 -3.9 12.2 5.1 3.3 5.6 4.2 7.8 8.5 8.7
Construction 0.4 0.4 0.9 1.4 1.8 -0.6 8.8 4.8 2.7 6.7 7.1 9.6 10.2 9.8Services 2.5 3.4 5.5 8.3 11.4 3.1 4.9 4.2 3.2 42.0 64.1 59.9 60.1 61.0
market services 0.8 1.1 1.7 2.7 3.8 3.6 4.6 4.4 3.6 13.0 20.7 18.8 19.3 20.4non-market services 0.7 0.8 1.1 1.6 2.1 2.1 3.1 3.6 2.8 11.4 15.8 12.5 11.8 11.6trade 1.0 1.5 2.6 4.0 5.4 3.4 6.0 4.3 3.1 17.6 27.6 28.6 29.0 29.1
Agriculture 1.2 0.3 0.3 0.3 0.3 -11.7 -1.3 0.8 0.7 19.6 6.3 3.2 2.3 1.8Energy sector 0.4 0.2 0.3 0.4 0.5 -6.8 4.9 2.1 1.3 7.0 3.9 3.6 3.0 2.5
Source: PRIMES
Source: PRIMES
59

BASELINE SCENARIOFINLAND: Key Demographic and Economic Assumptions
1990 2000 2010 2020 2030 '90-'00 '00-'10 '10-'20 '20-'30 1990 2000 2010 2020 2030Annual % Change % Structure of total value added
Main Demographic AssumptionsPopulation (Million) 5.0 5.2 5.3 5.4 5.4 0.4 0.2 0.2 0.1Average household size (persons) 2.5 2.3 2.1 2.0 1.9 -0.8 -0.8 -0.7 -0.6Number of households (Million) 2.0 2.3 2.5 2.7 2.9 1.2 1.0 0.9 0.7Gross Domestic product (in 000 MEuro'00) 108.1 130.1 163.9 197.4 227.6 1.9 2.3 1.9 1.4Households expenditure (in 000 MEuro'00) 55.9 63.1 79.3 93.8 107.1 1.2 2.3 1.7 1.3Gross Value Added (in 000 MEuro'00) 96.3 118.0 149.6 181.2 209.7 2.1 2.4 1.9 1.5Industry 21.0 33.1 41.4 50.0 56.9 4.7 2.3 1.9 1.3 21.8 28.0 27.7 27.6 27.2
iron and steel 0.7 1.2 1.5 1.7 1.8 5.3 2.8 0.9 0.6 0.7 1.0 1.0 0.9 0.8non ferrous metals 0.3 0.4 0.5 0.6 0.6 3.9 1.4 1.2 1.0 0.3 0.4 0.3 0.3 0.3chemicals 1.4 1.8 1.9 2.1 2.2 2.9 0.7 0.9 0.3 1.4 1.5 1.3 1.2 1.0
petrochemicals,fertilisers and others 1.0 1.4 1.4 1.4 1.4 2.7 0.2 0.2 0.1 1.1 1.1 0.9 0.8 0.7pharmaceuticals and cosmetics 0.3 0.5 0.6 0.7 0.8 3.4 1.9 2.5 0.7 0.3 0.4 0.4 0.4 0.4
non metallic minerals 0.9 0.8 0.9 1.0 1.1 -0.3 1.1 1.0 0.6 0.9 0.7 0.6 0.6 0.5paper, pulp, printing 5.5 7.3 8.4 9.8 11.0 2.9 1.4 1.5 1.2 5.7 6.2 5.6 5.4 5.3
paper and pulp production 3.3 5.6 5.9 6.7 7.6 5.6 0.5 1.3 1.2 3.4 4.8 4.0 3.7 3.6printing and publishing 2.2 1.7 2.5 3.1 3.5 -2.8 4.1 2.1 1.3 2.3 1.4 1.7 1.7 1.7
food, drink, tobacco 2.2 2.4 3.0 3.5 3.7 0.9 2.3 1.6 0.5 2.2 2.0 2.0 1.9 1.8textiles and leather 0.9 0.6 0.5 0.5 0.5 -4.3 -1.0 -0.4 -0.2 1.0 0.5 0.4 0.3 0.2engineering 6.6 15.2 20.9 26.6 31.3 8.7 3.3 2.4 1.7 6.8 12.9 14.0 14.7 14.9other industries 2.6 3.3 3.7 4.2 4.7 2.6 0.9 1.5 1.1 2.7 2.8 2.4 2.3 2.3
Construction 6.9 5.2 6.4 6.9 7.3 -2.8 2.0 0.8 0.5 7.2 4.4 4.3 3.8 3.5Services 61.3 71.5 92.6 114.3 134.9 1.5 2.6 2.1 1.7 63.7 60.6 61.9 63.1 64.3
market services 17.7 22.7 29.4 36.6 43.8 2.5 2.6 2.2 1.8 18.4 19.2 19.7 20.2 20.9non-market services 22.3 23.2 28.4 33.3 37.0 0.4 2.1 1.6 1.1 23.1 19.6 19.0 18.3 17.6trade 21.4 25.6 34.7 44.4 54.2 1.8 3.1 2.5 2.0 22.2 21.7 23.2 24.5 25.8
Agriculture 4.3 4.9 5.2 5.4 5.5 1.3 0.6 0.4 0.2 4.5 4.2 3.5 3.0 2.6Energy sector 2.7 3.3 4.0 4.6 5.0 2.1 1.9 1.4 0.9 2.8 2.8 2.7 2.5 2.4
BASELINE SCENARIOFRANCE: Key Demographic and Economic Assumptions
1990 2000 2010 2020 2030 '90-'00 '00-'10 '10-'20 '20-'30 1990 2000 2010 2020 2030Annual % Change % Structure of total value added
Main Demographic AssumptionsPopulation (Million) 58.2 60.6 61.5 63.6 65.1 0.4 0.1 0.3 0.2Average household size (persons) 2.6 2.4 2.2 2.1 1.9 -0.8 -0.8 -0.7 -0.6Number of households (Million) 22.5 25.5 27.9 31.0 33.7 1.3 0.9 1.0 0.8Gross Domestic product (in 000 MEuro'00) 1180.3 1420.1 1723.1 2113.3 2505.3 1.9 2.0 2.1 1.7Households expenditure (in 000 MEuro'00) 666.1 767.7 933.8 1115.2 1298.6 1.4 2.0 1.8 1.5Gross Value Added (in 000 MEuro'00) 1102.3 1307.6 1574.4 1916.0 2259.1 1.7 1.9 2.0 1.7Industry 196.6 242.4 292.5 358.1 422.2 2.1 1.9 2.0 1.7 17.8 18.5 18.6 18.7 18.7
iron and steel 6.6 6.2 6.8 7.4 7.8 -0.7 1.0 0.8 0.6 0.6 0.5 0.4 0.4 0.3non ferrous metals 2.6 3.0 3.8 4.6 5.4 1.5 2.4 2.0 1.6 0.2 0.2 0.2 0.2 0.2chemicals 19.5 29.6 37.0 46.2 55.1 4.2 2.3 2.2 1.8 1.8 2.3 2.3 2.4 2.4
petrochemicals,fertilisers and others 10.6 13.0 15.0 17.3 19.3 2.1 1.4 1.4 1.1 1.0 1.0 1.0 0.9 0.9pharmaceuticals and cosmetics 8.9 16.5 21.9 28.8 35.8 6.3 2.9 2.8 2.2 0.8 1.3 1.4 1.5 1.6
non metallic minerals 8.4 9.2 10.4 11.5 12.3 0.9 1.3 1.0 0.6 0.8 0.7 0.7 0.6 0.5paper, pulp, printing 18.4 19.3 21.2 24.9 27.9 0.5 1.0 1.6 1.1 1.7 1.5 1.3 1.3 1.2
paper and pulp production 6.8 6.0 6.2 6.8 7.3 -1.3 0.3 1.0 0.7 0.6 0.5 0.4 0.4 0.3printing and publishing 11.6 13.3 15.1 18.1 20.6 1.4 1.3 1.9 1.3 1.1 1.0 1.0 0.9 0.9
food, drink, tobacco 30.2 32.1 36.9 43.5 49.7 0.6 1.4 1.7 1.3 2.7 2.5 2.3 2.3 2.2textiles and leather 13.7 10.7 9.6 9.2 9.0 -2.4 -1.2 -0.4 -0.1 1.2 0.8 0.6 0.5 0.4engineering 77.1 107.7 137.5 175.8 215.7 3.4 2.5 2.5 2.1 7.0 8.2 8.7 9.2 9.5other industries 20.2 24.6 29.4 35.0 39.3 2.0 1.8 1.8 1.2 1.8 1.9 1.9 1.8 1.7
Construction 65.3 56.3 60.7 70.3 79.3 -1.5 0.7 1.5 1.2 5.9 4.3 3.9 3.7 3.5Services 773.9 926.5 1136.5 1393.1 1655.8 1.8 2.1 2.1 1.7 70.2 70.9 72.2 72.7 73.3
market services 312.2 364.7 453.8 560.2 671.1 1.6 2.2 2.1 1.8 28.3 27.9 28.8 29.2 29.7non-market services 245.5 295.1 369.3 430.1 486.0 1.9 2.3 1.5 1.2 22.3 22.6 23.5 22.4 21.5trade 216.2 266.6 313.4 402.8 498.7 2.1 1.6 2.5 2.2 19.6 20.4 19.9 21.0 22.1
Agriculture 35.8 41.2 36.4 37.5 39.0 1.4 -1.2 0.3 0.4 3.2 3.1 2.3 2.0 1.7Energy sector 30.6 41.3 48.2 57.1 62.9 3.0 1.6 1.7 1.0 2.8 3.2 3.1 3.0 2.8
Source: PRIMES
Source: PRIMES
60

BASELINE SCENARIOGERMANY: Key Demographic and Economic Assumptions
1990 2000 2010 2020 2030 '90-'00 '00-'10 '10-'20 '20-'30 1990 2000 2010 2020 2030Annual % Change % Structure of total value added
Main Demographic AssumptionsPopulation (Million) 79.4 82.2 82.8 82.7 81.1 0.3 0.1 0.0 -0.2Average household size (persons) 2.4 2.2 2.1 2.0 1.9 -0.5 -0.7 -0.4 -0.4Number of households (Million) 33.8 36.7 39.6 41.3 42.2 0.8 0.8 0.4 0.2Gross Domestic product (in 000 MEuro'00) 1736.6 2030.0 2295.8 2714.9 3007.3 1.6 1.2 1.7 1.0Households expenditure (in 000 MEuro'00) 980.7 1155.7 1269.9 1475.4 1633.6 1.7 0.9 1.5 1.0Gross Value Added (in 000 MEuro'00) 1617.7 1944.4 2259.6 2713.4 3005.6 1.9 1.5 1.8 1.0Industry 412.1 412.5 475.0 562.1 625.0 0.0 1.4 1.7 1.1 25.5 21.2 21.0 20.7 20.8
iron and steel 11.9 10.8 11.7 13.5 14.8 -0.9 0.8 1.4 0.9 0.7 0.6 0.5 0.5 0.5non ferrous metals 4.5 6.0 7.7 9.2 10.1 2.9 2.6 1.8 1.0 0.3 0.3 0.3 0.3 0.3chemicals 38.7 43.1 53.5 64.8 72.8 1.1 2.2 1.9 1.2 2.4 2.2 2.4 2.4 2.4
petrochemicals,fertilisers and others 29.2 30.1 34.3 37.4 39.0 0.3 1.3 0.9 0.4 1.8 1.5 1.5 1.4 1.3pharmaceuticals and cosmetics 9.5 13.0 19.2 27.3 33.8 3.1 4.0 3.6 2.2 0.6 0.7 0.8 1.0 1.1
non metallic minerals 15.2 17.8 17.8 20.0 21.7 1.6 0.0 1.2 0.8 0.9 0.9 0.8 0.7 0.7paper, pulp, printing 29.9 30.7 30.5 35.6 39.5 0.2 0.0 1.6 1.0 1.8 1.6 1.4 1.3 1.3
paper and pulp production 9.4 9.6 9.7 10.5 10.8 0.2 0.1 0.8 0.3 0.6 0.5 0.4 0.4 0.4printing and publishing 20.5 21.0 20.8 25.1 28.7 0.3 -0.1 1.9 1.4 1.3 1.1 0.9 0.9 1.0
food, drink, tobacco 32.3 38.8 43.0 49.4 53.4 1.8 1.0 1.4 0.8 2.0 2.0 1.9 1.8 1.8textiles and leather 16.4 9.7 8.2 7.8 7.6 -5.1 -1.7 -0.5 -0.3 1.0 0.5 0.4 0.3 0.3engineering 224.7 215.1 256.8 308.2 345.9 -0.4 1.8 1.8 1.2 13.9 11.1 11.4 11.4 11.5other industries 38.4 40.7 45.6 53.6 59.2 0.6 1.2 1.6 1.0 2.4 2.1 2.0 2.0 2.0
Construction 104.7 105.8 83.3 96.7 102.2 0.1 -2.4 1.5 0.6 6.5 5.4 3.7 3.6 3.4Services 1029.7 1349.1 1618.9 1964.5 2185.2 2.7 1.8 2.0 1.1 63.7 69.4 71.6 72.4 72.7
market services 404.6 590.5 712.5 887.4 1007.0 3.9 1.9 2.2 1.3 25.0 30.4 31.5 32.7 33.5non-market services 339.0 402.0 451.6 506.5 525.0 1.7 1.2 1.2 0.4 21.0 20.7 20.0 18.7 17.5trade 286.1 356.5 454.7 570.7 653.2 2.2 2.5 2.3 1.4 17.7 18.3 20.1 21.0 21.7
Agriculture 20.4 25.3 27.2 30.2 30.9 2.2 0.7 1.1 0.2 1.3 1.3 1.2 1.1 1.0Energy sector 50.8 51.7 55.3 59.9 62.3 0.2 0.7 0.8 0.4 3.1 2.7 2.4 2.2 2.1
BASELINE SCENARIOGREECE: Key Demographic and Economic Assumptions
1990 2000 2010 2020 2030 '90-'00 '00-'10 '10-'20 '20-'30 1990 2000 2010 2020 2030Annual % Change % Structure of total value added
Main Demographic AssumptionsPopulation (Million) 10.2 10.9 11.3 11.4 11.3 0.7 0.3 0.1 -0.1Average household size (persons) 3.0 2.8 2.7 2.6 2.6 -0.7 -0.4 -0.3 -0.3Number of households (Million) 3.3 3.9 4.1 4.3 4.4 1.5 0.7 0.5 0.2Gross Domestic product (in 000 MEuro'00) 97.7 123.2 178.7 241.4 291.8 2.3 3.8 3.0 1.9Households expenditure (in 000 MEuro'00) 69.3 86.4 118.4 154.6 186.2 2.2 3.2 2.7 1.9Gross Value Added (in 000 MEuro'00) 92.8 112.0 161.7 218.0 263.6 1.9 3.7 3.0 1.9Industry 10.3 13.0 15.8 20.4 23.4 2.4 1.9 2.6 1.4 11.1 11.6 9.8 9.4 8.9
iron and steel 0.2 0.3 0.6 0.7 0.7 4.0 7.2 1.7 0.6 0.2 0.3 0.4 0.3 0.3non ferrous metals 0.6 0.5 0.6 0.7 0.9 -0.9 1.0 2.1 1.3 0.6 0.5 0.4 0.3 0.3chemicals 0.6 0.9 1.1 1.6 1.9 3.4 2.6 3.5 2.0 0.7 0.8 0.7 0.7 0.7
petrochemicals,fertilisers and others 0.3 0.4 0.5 0.6 0.7 2.9 2.1 2.9 1.0 0.3 0.3 0.3 0.3 0.3pharmaceuticals and cosmetics 0.3 0.5 0.6 0.9 1.2 3.9 3.1 4.0 2.5 0.3 0.4 0.4 0.4 0.5
non metallic minerals 0.4 1.0 1.3 1.7 1.9 9.6 3.2 2.7 1.3 0.4 0.9 0.8 0.8 0.7paper, pulp, printing 0.7 0.8 0.9 1.1 1.2 1.7 1.5 1.9 1.2 0.7 0.7 0.6 0.5 0.5
paper and pulp production 0.1 0.1 0.1 0.1 0.1 -0.1 0.9 1.2 0.5 0.1 0.1 0.0 0.0 0.0printing and publishing 0.6 0.7 0.8 1.0 1.2 1.9 1.5 2.0 1.2 0.6 0.6 0.5 0.5 0.4
food, drink, tobacco 2.2 2.9 3.7 5.2 6.0 2.7 2.5 3.3 1.5 2.4 2.6 2.3 2.4 2.3textiles and leather 2.6 2.8 2.9 3.0 3.0 1.0 0.3 0.4 -0.2 2.8 2.5 1.8 1.4 1.1engineering 1.0 2.2 2.7 3.9 4.9 8.3 2.4 3.7 2.3 1.0 1.9 1.7 1.8 1.9other industries 2.1 1.6 1.8 2.4 2.8 -2.3 1.2 2.8 1.5 2.2 1.5 1.1 1.1 1.1
Construction 6.2 7.7 12.8 16.8 19.0 2.1 5.3 2.8 1.3 6.7 6.8 7.9 7.7 7.2Services 61.1 77.5 118.3 164.2 203.1 2.4 4.3 3.3 2.2 65.8 69.2 73.2 75.3 77.1
market services 18.6 23.3 32.3 46.6 59.8 2.3 3.3 3.8 2.5 20.0 20.8 20.0 21.4 22.7non-market services 18.5 20.4 30.7 36.0 39.5 1.0 4.2 1.6 0.9 19.9 18.2 19.0 16.5 15.0trade 24.0 33.8 55.4 81.6 103.8 3.5 5.0 4.0 2.4 25.9 30.2 34.3 37.4 39.4
Agriculture 11.4 9.4 9.6 10.8 11.8 -1.9 0.2 1.2 0.9 12.2 8.4 5.9 4.9 4.5Energy sector 3.9 4.5 5.2 5.8 6.2 1.4 1.6 1.1 0.6 4.2 4.0 3.2 2.7 2.4
Source: PRIMES
Source: PRIMES
61
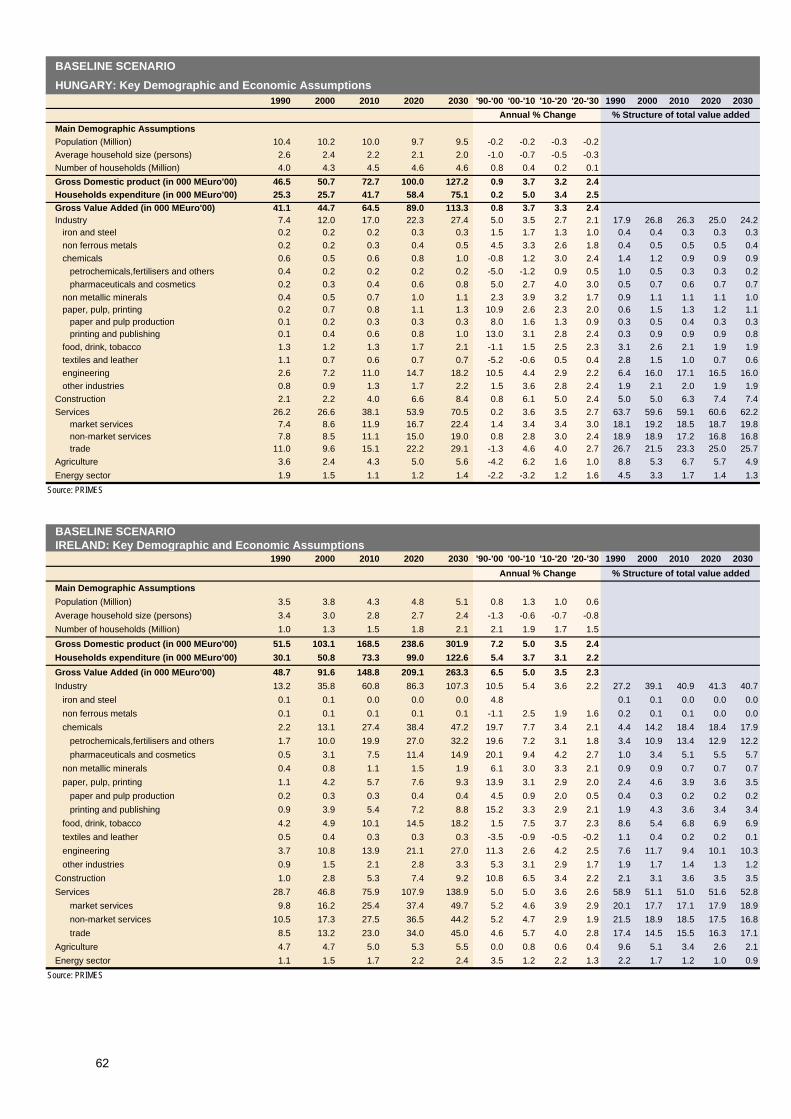
BASELINE SCENARIOHUNGARY: Key Demographic and Economic Assumptions
1990 2000 2010 2020 2030 '90-'00 '00-'10 '10-'20 '20-'30 1990 2000 2010 2020 2030Annual % Change % Structure of total value added
Main Demographic AssumptionsPopulation (Million) 10.4 10.2 10.0 9.7 9.5 -0.2 -0.2 -0.3 -0.2Average household size (persons) 2.6 2.4 2.2 2.1 2.0 -1.0 -0.7 -0.5 -0.3Number of households (Million) 4.0 4.3 4.5 4.6 4.6 0.8 0.4 0.2 0.1Gross Domestic product (in 000 MEuro'00) 46.5 50.7 72.7 100.0 127.2 0.9 3.7 3.2 2.4Households expenditure (in 000 MEuro'00) 25.3 25.7 41.7 58.4 75.1 0.2 5.0 3.4 2.5Gross Value Added (in 000 MEuro'00) 41.1 44.7 64.5 89.0 113.3 0.8 3.7 3.3 2.4Industry 7.4 12.0 17.0 22.3 27.4 5.0 3.5 2.7 2.1 17.9 26.8 26.3 25.0 24.2
iron and steel 0.2 0.2 0.2 0.3 0.3 1.5 1.7 1.3 1.0 0.4 0.4 0.3 0.3 0.3non ferrous metals 0.2 0.2 0.3 0.4 0.5 4.5 3.3 2.6 1.8 0.4 0.5 0.5 0.5 0.4chemicals 0.6 0.5 0.6 0.8 1.0 -0.8 1.2 3.0 2.4 1.4 1.2 0.9 0.9 0.9
petrochemicals,fertilisers and others 0.4 0.2 0.2 0.2 0.2 -5.0 -1.2 0.9 0.5 1.0 0.5 0.3 0.3 0.2pharmaceuticals and cosmetics 0.2 0.3 0.4 0.6 0.8 5.0 2.7 4.0 3.0 0.5 0.7 0.6 0.7 0.7
non metallic minerals 0.4 0.5 0.7 1.0 1.1 2.3 3.9 3.2 1.7 0.9 1.1 1.1 1.1 1.0paper, pulp, printing 0.2 0.7 0.8 1.1 1.3 10.9 2.6 2.3 2.0 0.6 1.5 1.3 1.2 1.1
paper and pulp production 0.1 0.2 0.3 0.3 0.3 8.0 1.6 1.3 0.9 0.3 0.5 0.4 0.3 0.3printing and publishing 0.1 0.4 0.6 0.8 1.0 13.0 3.1 2.8 2.4 0.3 0.9 0.9 0.9 0.8
food, drink, tobacco 1.3 1.2 1.3 1.7 2.1 -1.1 1.5 2.5 2.3 3.1 2.6 2.1 1.9 1.9textiles and leather 1.1 0.7 0.6 0.7 0.7 -5.2 -0.6 0.5 0.4 2.8 1.5 1.0 0.7 0.6engineering 2.6 7.2 11.0 14.7 18.2 10.5 4.4 2.9 2.2 6.4 16.0 17.1 16.5 16.0other industries 0.8 0.9 1.3 1.7 2.2 1.5 3.6 2.8 2.4 1.9 2.1 2.0 1.9 1.9
Construction 2.1 2.2 4.0 6.6 8.4 0.8 6.1 5.0 2.4 5.0 5.0 6.3 7.4 7.4Services 26.2 26.6 38.1 53.9 70.5 0.2 3.6 3.5 2.7 63.7 59.6 59.1 60.6 62.2
market services 7.4 8.6 11.9 16.7 22.4 1.4 3.4 3.4 3.0 18.1 19.2 18.5 18.7 19.8non-market services 7.8 8.5 11.1 15.0 19.0 0.8 2.8 3.0 2.4 18.9 18.9 17.2 16.8 16.8trade 11.0 9.6 15.1 22.2 29.1 -1.3 4.6 4.0 2.7 26.7 21.5 23.3 25.0 25.7
Agriculture 3.6 2.4 4.3 5.0 5.6 -4.2 6.2 1.6 1.0 8.8 5.3 6.7 5.7 4.9Energy sector 1.9 1.5 1.1 1.2 1.4 -2.2 -3.2 1.2 1.6 4.5 3.3 1.7 1.4 1.3
BASELINE SCENARIOIRELAND: Key Demographic and Economic Assumptions
1990 2000 2010 2020 2030 '90-'00 '00-'10 '10-'20 '20-'30 1990 2000 2010 2020 2030Annual % Change % Structure of total value added
Main Demographic AssumptionsPopulation (Million) 3.5 3.8 4.3 4.8 5.1 0.8 1.3 1.0 0.6Average household size (persons) 3.4 3.0 2.8 2.7 2.4 -1.3 -0.6 -0.7 -0.8Number of households (Million) 1.0 1.3 1.5 1.8 2.1 2.1 1.9 1.7 1.5Gross Domestic product (in 000 MEuro'00) 51.5 103.1 168.5 238.6 301.9 7.2 5.0 3.5 2.4Households expenditure (in 000 MEuro'00) 30.1 50.8 73.3 99.0 122.6 5.4 3.7 3.1 2.2Gross Value Added (in 000 MEuro'00) 48.7 91.6 148.8 209.1 263.3 6.5 5.0 3.5 2.3Industry 13.2 35.8 60.8 86.3 107.3 10.5 5.4 3.6 2.2 27.2 39.1 40.9 41.3 40.7
iron and steel 0.1 0.1 0.0 0.0 0.0 4.8 0.1 0.1 0.0 0.0 0.0non ferrous metals 0.1 0.1 0.1 0.1 0.1 -1.1 2.5 1.9 1.6 0.2 0.1 0.1 0.0 0.0chemicals 2.2 13.1 27.4 38.4 47.2 19.7 7.7 3.4 2.1 4.4 14.2 18.4 18.4 17.9
petrochemicals,fertilisers and others 1.7 10.0 19.9 27.0 32.2 19.6 7.2 3.1 1.8 3.4 10.9 13.4 12.9 12.2pharmaceuticals and cosmetics 0.5 3.1 7.5 11.4 14.9 20.1 9.4 4.2 2.7 1.0 3.4 5.1 5.5 5.7
non metallic minerals 0.4 0.8 1.1 1.5 1.9 6.1 3.0 3.3 2.1 0.9 0.9 0.7 0.7 0.7paper, pulp, printing 1.1 4.2 5.7 7.6 9.3 13.9 3.1 2.9 2.0 2.4 4.6 3.9 3.6 3.5
paper and pulp production 0.2 0.3 0.3 0.4 0.4 4.5 0.9 2.0 0.5 0.4 0.3 0.2 0.2 0.2printing and publishing 0.9 3.9 5.4 7.2 8.8 15.2 3.3 2.9 2.1 1.9 4.3 3.6 3.4 3.4
food, drink, tobacco 4.2 4.9 10.1 14.5 18.2 1.5 7.5 3.7 2.3 8.6 5.4 6.8 6.9 6.9textiles and leather 0.5 0.4 0.3 0.3 0.3 -3.5 -0.9 -0.5 -0.2 1.1 0.4 0.2 0.2 0.1engineering 3.7 10.8 13.9 21.1 27.0 11.3 2.6 4.2 2.5 7.6 11.7 9.4 10.1 10.3other industries 0.9 1.5 2.1 2.8 3.3 5.3 3.1 2.9 1.7 1.9 1.7 1.4 1.3 1.2
Construction 1.0 2.8 5.3 7.4 9.2 10.8 6.5 3.4 2.2 2.1 3.1 3.6 3.5 3.5Services 28.7 46.8 75.9 107.9 138.9 5.0 5.0 3.6 2.6 58.9 51.1 51.0 51.6 52.8
market services 9.8 16.2 25.4 37.4 49.7 5.2 4.6 3.9 2.9 20.1 17.7 17.1 17.9 18.9non-market services 10.5 17.3 27.5 36.5 44.2 5.2 4.7 2.9 1.9 21.5 18.9 18.5 17.5 16.8trade 8.5 13.2 23.0 34.0 45.0 4.6 5.7 4.0 2.8 17.4 14.5 15.5 16.3 17.1
Agriculture 4.7 4.7 5.0 5.3 5.5 0.0 0.8 0.6 0.4 9.6 5.1 3.4 2.6 2.1Energy sector 1.1 1.5 1.7 2.2 2.4 3.5 1.2 2.2 1.3 2.2 1.7 1.2 1.0 0.9
Source: PRIMES
Source: PRIMES
62

BASELINE SCENARIOITALY: Key Demographic and Economic Assumptions
1990 2000 2010 2020 2030 '90-'00 '00-'10 '10-'20 '20-'30 1990 2000 2010 2020 2030Annual % Change % Structure of total value added
Main Demographic AssumptionsPopulation (Million) 56.7 57.8 58.6 58.3 57.1 0.2 0.1 -0.1 -0.2Average household size (persons) 2.6 2.4 2.2 2.0 1.8 -1.1 -0.9 -0.9 -0.7Number of households (Million) 21.5 24.4 27.1 29.6 31.1 1.3 1.1 0.9 0.5Gross Domestic product (in 000 MEuro'00) 995.9 1166.5 1313.2 1604.2 1846.2 1.6 1.2 2.0 1.4Households expenditure (in 000 MEuro'00) 597.1 708.5 799.1 983.5 1131.9 1.7 1.2 2.1 1.4Gross Value Added (in 000 MEuro'00) 936.3 1098.5 1243.3 1525.8 1760.8 1.6 1.2 2.1 1.4Industry 200.3 231.3 239.3 302.1 363.0 1.5 0.3 2.4 1.9 21.4 21.1 19.2 19.8 20.6
iron and steel 6.3 5.5 6.0 6.6 7.1 -1.3 0.8 1.0 0.7 0.7 0.5 0.5 0.4 0.4non ferrous metals 1.9 2.7 2.8 3.1 3.4 3.3 0.3 1.2 0.8 0.2 0.2 0.2 0.2 0.2chemicals 17.2 19.3 20.7 30.5 40.8 1.1 0.7 4.0 3.0 1.8 1.8 1.7 2.0 2.3
petrochemicals,fertilisers and others 9.1 9.3 8.6 10.6 12.1 0.2 -0.7 2.0 1.4 1.0 0.8 0.7 0.7 0.7pharmaceuticals and cosmetics 8.1 10.0 12.0 19.9 28.7 2.1 1.8 5.2 3.7 0.9 0.9 1.0 1.3 1.6
non metallic minerals 13.1 15.0 16.2 17.3 18.0 1.4 0.7 0.7 0.4 1.4 1.4 1.3 1.1 1.0paper, pulp, printing 13.2 16.0 18.8 27.7 38.3 1.9 1.7 4.0 3.3 1.4 1.5 1.5 1.8 2.2
paper and pulp production 4.6 5.6 6.3 8.8 11.8 2.1 1.1 3.5 3.0 0.5 0.5 0.5 0.6 0.7printing and publishing 8.7 10.3 12.5 18.9 26.4 1.8 1.9 4.2 3.4 0.9 0.9 1.0 1.2 1.5
food, drink, tobacco 19.7 22.4 27.5 36.8 46.0 1.3 2.1 3.0 2.3 2.1 2.0 2.2 2.4 2.6textiles and leather 29.7 31.5 25.7 24.9 24.8 0.6 -2.0 -0.3 0.0 3.2 2.9 2.1 1.6 1.4engineering 76.6 90.2 90.9 116.2 137.9 1.6 0.1 2.5 1.7 8.2 8.2 7.3 7.6 7.8other industries 22.5 28.8 30.8 38.9 46.8 2.5 0.7 2.4 1.9 2.4 2.6 2.5 2.5 2.7
Construction 54.4 54.5 66.0 69.0 71.0 0.0 1.9 0.5 0.3 5.8 5.0 5.3 4.5 4.0Services 621.7 746.6 864.5 1073.3 1238.9 1.8 1.5 2.2 1.4 66.4 68.0 69.5 70.3 70.4
market services 218.4 270.9 314.5 403.8 475.3 2.2 1.5 2.5 1.6 23.3 24.7 25.3 26.5 27.0non-market services 181.8 199.8 234.3 262.6 278.3 0.9 1.6 1.1 0.6 19.4 18.2 18.8 17.2 15.8trade 221.5 275.8 315.7 406.9 485.4 2.2 1.4 2.6 1.8 23.7 25.1 25.4 26.7 27.6
Agriculture 28.8 34.6 36.1 39.6 41.9 1.9 0.4 0.9 0.6 3.1 3.2 2.9 2.6 2.4Energy sector 31.2 31.5 37.4 41.7 45.9 0.1 1.7 1.1 1.0 3.3 2.9 3.0 2.7 2.6
BASELINE SCENARIOLATVIA: Key Demographic and Economic Assumptions
1990 2000 2010 2020 2030 '90-'00 '00-'10 '10-'20 '20-'30 1990 2000 2010 2020 2030Annual % Change % Structure of total value added
Main Demographic AssumptionsPopulation (Million) 2.7 2.4 2.2 2.1 2.0 -1.2 -0.6 -0.6 -0.4Average household size (persons) 2.7 2.6 2.4 2.3 2.2 -0.5 -0.6 -0.3 -0.5Number of households (Million) 1.0 0.9 0.9 0.9 0.9 -0.7 0.0 -0.3 0.1Gross Domestic product (in 000 MEuro'00) 12.1 8.4 17.0 27.9 39.1 -3.6 7.4 5.1 3.4Households expenditure (in 000 MEuro'00) 7.5 5.3 11.0 18.1 25.4 -3.4 7.6 5.1 3.5Gross Value Added (in 000 MEuro'00) 10.7 7.4 15.1 24.7 34.7 -3.6 7.4 5.1 3.5Industry 3.3 1.4 3.4 5.9 8.3 -8.0 8.8 5.7 3.6 30.9 19.4 22.3 23.7 24.0
iron and steel 0.1 0.1 0.1 0.1 0.1 -0.1 2.5 1.6 1.0 0.6 0.9 0.5 0.4 0.3non ferrous metals 0.0 0.0 0.0 0.0 0.0 0.0 0.0 0.0 0.0 0.0chemicals 0.1 0.0 0.3 0.5 0.8 -7.5 17.8 7.5 4.4 1.0 0.7 1.7 2.1 2.3
petrochemicals,fertilisers and others 0.1 0.0 0.1 0.2 0.3 -15.7 16.9 6.7 4.0 1.0 0.3 0.6 0.7 0.8pharmaceuticals and cosmetics 0.0 0.0 0.2 0.3 0.5 49.4 18.4 7.9 4.6 0.0 0.4 1.1 1.4 1.6
non metallic minerals 0.1 0.0 0.1 0.1 0.2 -7.2 8.0 5.3 3.1 0.8 0.5 0.6 0.6 0.6paper, pulp, printing 0.6 0.1 0.4 0.7 1.0 -12.6 10.7 6.0 3.3 5.2 1.9 2.6 2.8 2.8
paper and pulp production 0.1 0.0 0.0 0.0 0.1 -15.9 3.8 3.2 2.5 1.2 0.3 0.2 0.2 0.2printing and publishing 0.4 0.1 0.4 0.7 0.9 -11.8 11.6 6.2 3.3 4.0 1.6 2.4 2.7 2.6
food, drink, tobacco 0.9 0.4 1.2 2.1 3.0 -7.9 11.8 5.9 3.6 8.3 5.3 7.9 8.5 8.6textiles and leather 0.5 0.2 0.2 0.3 0.4 -10.8 4.2 3.2 2.1 4.6 2.1 1.6 1.3 1.1engineering 0.9 0.2 0.4 0.8 1.2 -12.7 7.1 6.2 4.5 8.1 3.0 2.9 3.3 3.6other industries 0.2 0.4 0.7 1.2 1.6 4.6 6.1 5.6 3.3 2.2 5.0 4.5 4.7 4.6
Construction 1.9 0.4 1.0 1.7 2.3 -14.4 9.5 5.4 2.9 18.1 5.5 6.7 6.9 6.5Services 4.1 4.8 9.6 15.9 22.8 1.5 7.3 5.1 3.6 38.3 64.3 64.0 64.4 65.6
market services 1.1 1.3 2.6 4.4 6.5 1.2 7.1 5.5 4.0 10.7 17.5 17.1 17.7 18.7non-market services 1.0 1.3 1.9 2.7 3.5 2.6 3.5 3.4 2.9 9.8 18.2 12.6 10.8 10.2trade 1.9 2.1 5.2 8.9 12.7 1.1 9.3 5.6 3.7 17.8 28.7 34.3 35.9 36.7
Agriculture 0.9 0.5 0.7 0.8 0.9 -5.1 2.7 1.3 1.0 8.4 7.2 4.6 3.2 2.5Energy sector 0.5 0.3 0.4 0.4 0.5 -5.3 3.2 1.8 1.2 4.3 3.6 2.4 1.7 1.4
Source: PRIMES
Source: PRIMES
63

BASELINE SCENARIOLITHUANIA: Key Demographic and Economic Assumptions
1990 2000 2010 2020 2030 '90-'00 '00-'10 '10-'20 '20-'30 1990 2000 2010 2020 2030Annual % Change % Structure of total value added
Main Demographic AssumptionsPopulation (Million) 3.7 3.5 3.3 3.2 3.1 -0.5 -0.5 -0.5 -0.3Average household size (persons) 2.9 2.8 2.4 2.3 2.1 -0.4 -1.2 -0.8 -0.6Number of households (Million) 1.3 1.3 1.4 1.4 1.5 -0.1 0.8 0.3 0.3Gross Domestic product (in 000 MEuro'00) 17.3 12.3 23.1 37.2 54.3 -3.3 6.5 4.9 3.8Households expenditure (in 000 MEuro'00) 11.6 8.7 16.7 27.1 39.8 -2.8 6.7 5.0 3.9Gross Value Added (in 000 MEuro'00) 15.1 11.3 20.8 33.6 49.2 -2.9 6.3 4.9 3.9Industry 3.8 2.3 5.2 8.8 13.0 -4.7 8.3 5.5 3.9 25.0 20.8 25.0 26.3 26.4
iron and steel 0.0 0.0 0.0 0.0 0.0 0.0 0.0 0.0 0.0 0.0non ferrous metals 0.0 0.0 0.0 0.0 0.0 0.0 0.0 0.0 0.0 0.0chemicals 0.2 0.2 0.3 0.6 1.1 2.4 4.7 7.2 5.5 1.0 1.8 1.5 1.9 2.2
petrochemicals,fertilisers and others 0.1 0.1 0.2 0.3 0.5 1.7 4.3 4.4 3.8 0.8 1.2 1.0 1.0 0.9pharmaceuticals and cosmetics 0.0 0.1 0.1 0.3 0.6 4.0 5.7 11.4 7.2 0.3 0.5 0.5 0.9 1.2
non metallic minerals 0.3 0.1 0.2 0.4 0.6 -11.2 9.5 6.0 3.2 2.2 0.9 1.2 1.3 1.2paper, pulp, printing 0.9 0.2 0.3 0.4 0.5 -13.8 4.1 2.9 2.3 6.0 1.8 1.5 1.2 1.0
paper and pulp production 0.4 0.0 0.0 0.1 0.1 -19.0 0.4 1.7 1.5 2.4 0.4 0.2 0.2 0.1printing and publishing 0.5 0.2 0.3 0.4 0.4 -11.5 4.9 3.1 2.4 3.6 1.4 1.2 1.0 0.9
food, drink, tobacco 0.8 0.6 0.9 1.4 2.0 -2.5 4.0 4.4 3.7 5.1 5.3 4.3 4.1 4.0textiles and leather 0.6 0.4 0.6 0.7 0.8 -3.2 2.7 1.5 1.1 4.1 3.9 2.8 2.0 1.5engineering 0.7 0.4 1.3 2.5 3.8 -4.9 12.5 6.7 4.4 4.4 3.6 6.3 7.4 7.8other industries 0.3 0.4 1.6 2.8 4.2 2.0 14.6 6.2 4.0 2.2 3.5 7.5 8.5 8.6
Construction 1.5 0.6 1.5 2.6 3.7 -8.6 9.1 5.6 3.8 10.1 5.5 7.2 7.6 7.6Services 6.1 6.6 11.6 19.1 28.7 0.8 5.8 5.1 4.2 40.1 58.7 55.9 56.8 58.5
market services 1.0 1.5 2.6 4.7 7.8 4.6 5.7 6.1 5.2 6.3 13.3 12.5 13.9 15.8non-market services 2.4 2.0 2.5 3.7 5.0 -1.7 2.1 3.9 3.1 15.9 18.0 12.0 10.9 10.2trade 2.7 3.1 6.5 10.7 16.0 1.3 7.8 5.1 4.0 17.9 27.4 31.4 31.9 32.5
Agriculture 1.4 1.1 1.2 1.3 1.5 -2.6 0.9 1.3 0.8 9.4 9.7 5.7 4.0 3.0Energy sector 2.3 0.6 1.3 1.8 2.3 -12.9 8.2 3.2 2.5 15.4 5.2 6.2 5.3 4.6
BASELINE SCENARIOLUXEMBOURG: Key Demographic and Economic Assumptions
1990 2000 2010 2020 2030 '90-'00 '00-'10 '10-'20 '20-'30 1990 2000 2010 2020 2030Annual % Change % Structure of total value added
Main Demographic AssumptionsPopulation (Million) 0.4 0.4 0.5 0.5 0.6 1.4 0.8 0.9 0.9Average household size (persons) 2.7 2.5 2.4 2.2 2.1 -0.6 -0.6 -0.7 -0.5Number of households (Million) 0.1 0.2 0.2 0.2 0.3 2.0 1.4 1.5 1.3Gross Domestic product (in 000 MEuro'00) 12.5 21.3 31.7 50.7 64.4 5.5 4.1 4.8 2.4Households expenditure (in 000 MEuro'00) 6.4 9.0 12.9 19.5 24.8 3.4 3.7 4.3 2.4Gross Value Added (in 000 MEuro'00) 12.9 22.0 32.9 52.5 66.2 5.5 4.1 4.8 2.4Industry 1.9 2.6 3.5 5.6 7.0 3.0 3.2 4.7 2.2 14.9 11.7 10.8 10.7 10.6
iron and steel 0.4 0.5 0.5 0.6 0.6 2.9 0.9 1.1 0.3 2.8 2.2 1.6 1.1 0.9non ferrous metals 0.0 0.0 0.0 0.0 0.0 0.0 0.0 0.0 0.0 0.0chemicals 0.1 0.1 0.2 0.4 0.6 1.7 8.5 5.8 2.8 0.7 0.5 0.7 0.8 0.8
petrochemicals,fertilisers and others 0.1 0.1 0.2 0.4 0.6 1.7 8.5 5.8 2.8 0.7 0.5 0.7 0.8 0.8pharmaceuticals and cosmetics 0.0 0.0 0.0 0.0 0.0 0.0 0.0 0.0 0.0 0.0
non metallic minerals 0.2 0.2 0.3 0.4 0.5 1.4 0.9 3.9 2.2 1.6 1.1 0.8 0.7 0.7paper, pulp, printing 0.1 0.2 0.3 0.5 0.6 1.3 6.6 5.3 2.4 1.0 0.7 0.9 0.9 0.9
paper and pulp production 0.0 0.0 0.0 0.0 0.0 0.0 0.0 0.0 0.0 0.0printing and publishing 0.1 0.2 0.3 0.5 0.6 1.3 6.6 5.3 2.4 1.0 0.7 0.9 0.9 0.9
food, drink, tobacco 0.2 0.2 0.2 0.4 0.5 -1.9 3.5 5.7 2.5 1.5 0.8 0.7 0.8 0.8textiles and leather 0.1 0.2 0.2 0.3 0.3 4.5 2.4 1.6 0.6 0.9 0.8 0.7 0.5 0.4engineering 0.6 0.8 1.0 1.7 2.2 3.2 2.6 5.2 2.7 4.4 3.5 3.0 3.2 3.3other industries 0.3 0.5 0.8 1.4 1.8 6.9 4.7 6.2 2.5 2.0 2.2 2.4 2.7 2.7
Construction 0.9 1.2 2.1 3.1 3.7 3.5 5.4 3.9 1.9 6.8 5.6 6.4 5.9 5.6Services 9.8 17.7 26.7 43.0 54.6 6.1 4.2 4.9 2.4 75.7 80.4 81.0 82.0 82.4
market services 5.0 9.1 12.6 20.4 26.3 6.2 3.3 5.0 2.6 38.6 41.4 38.2 39.0 39.8non-market services 2.3 3.3 4.7 6.7 7.7 3.6 3.7 3.6 1.5 17.7 14.8 14.2 12.7 11.7trade 2.5 5.3 9.4 15.9 20.6 7.8 5.9 5.4 2.6 19.4 24.2 28.6 30.3 31.0
Agriculture 0.1 0.2 0.1 0.1 0.1 2.3 -2.6 0.5 0.7 1.0 0.7 0.4 0.2 0.2Energy sector 0.2 0.3 0.5 0.6 0.8 5.2 3.3 2.8 2.1 1.6 1.6 1.4 1.2 1.2
Source: PRIMES
Source: PRIMES
64

BASELINE SCENARIOMALTA: Key Demographic and Economic Assumptions
1990 2000 2010 2020 2030 '90-'00 '00-'10 '10-'20 '20-'30 1990 2000 2010 2020 2030Annual % Change % Structure of total value added
Main Demographic AssumptionsPopulation (Million) 0.4 0.4 0.4 0.5 0.5 0.8 0.8 0.7 0.5Average household size (persons) 3.2 2.9 2.6 2.5 2.3 -0.8 -1.0 -0.7 -0.6Number of households (Million) 0.1 0.1 0.2 0.2 0.2 1.7 1.9 1.4 1.2Gross Domestic product (in 000 MEuro'00) 2.6 4.1 4.7 6.6 8.7 4.9 1.3 3.4 2.8Households expenditure (in 000 MEuro'00) 1.6 2.6 2.9 3.9 5.0 4.9 1.4 3.0 2.5Gross Value Added (in 000 MEuro'00) 2.3 3.7 4.2 5.9 7.7 4.9 1.3 3.4 2.8Industry 0.6 0.8 1.1 1.4 1.9 3.7 2.7 2.9 2.8 25.3 22.5 25.7 24.3 24.4
iron and steel 0.0 0.0 0.0 0.0 0.0 0.0 0.0 0.0 0.0 0.0non ferrous metals 0.0 0.0 0.0 0.0 0.0 0.0 0.0 0.0 0.0 0.0chemicals 0.0 0.0 0.0 0.0 0.0 0.0 0.0 0.0 0.0 0.0
petrochemicals,fertilisers and others 0.0 0.0 0.0 0.0 0.0 0.0 0.0 0.0 0.0 0.0pharmaceuticals and cosmetics 0.0 0.0 0.0 0.0 0.0 0.0 0.0 0.0 0.0 0.0
non metallic minerals 0.0 0.0 0.0 0.0 0.0 0.0 0.0 0.0 0.0 0.0paper, pulp, printing 0.0 0.0 0.0 0.0 0.0 0.0 0.0 0.0 0.0 0.0
paper and pulp production 0.0 0.0 0.0 0.0 0.0 0.0 0.0 0.0 0.0 0.0printing and publishing 0.0 0.0 0.0 0.0 0.0 0.0 0.0 0.0 0.0 0.0
food, drink, tobacco 0.0 0.0 0.0 0.0 0.0 0.0 0.0 0.0 0.0 0.0textiles and leather 0.0 0.0 0.0 0.0 0.0 0.0 0.0 0.0 0.0 0.0engineering 0.0 0.0 0.0 0.0 0.0 0.0 0.0 0.0 0.0 0.0other industries 0.6 0.8 1.1 1.4 1.9 3.7 2.7 2.9 2.8 25.3 22.5 25.7 24.3 24.4
Construction 0.1 0.1 0.1 0.2 0.2 1.9 2.5 3.2 2.7 3.4 2.5 2.8 2.8 2.7Services 1.5 2.6 2.8 4.1 5.4 5.5 0.8 3.7 2.9 66.9 71.0 67.2 69.3 69.7
market services 0.3 0.7 1.1 1.6 2.2 7.9 3.9 3.8 3.5 15.2 20.1 25.8 26.7 28.4non-market services 0.5 1.0 0.9 1.2 1.4 7.1 -1.3 2.7 2.0 23.1 28.4 21.8 20.3 18.7trade 0.7 0.8 0.8 1.3 1.7 2.4 -0.1 4.8 2.9 28.7 22.5 19.6 22.3 22.6
Agriculture 0.0 0.0 0.0 0.0 0.0 0.0 0.0 0.0 0.0 0.0Energy sector 0.1 0.1 0.2 0.2 0.2 3.7 2.1 1.7 1.6 4.5 4.0 4.3 3.6 3.2
BASELINE SCENARIOTHE NETHERLANDS: Key Demographic and Economic Assumptions
1990 2000 2010 2020 2030 '90-'00 '00-'10 '10-'20 '20-'30 1990 2000 2010 2020 2030Annual % Change % Structure of total value added
Main Demographic AssumptionsPopulation (Million) 14.9 15.9 16.7 17.2 17.6 0.6 0.5 0.3 0.2Average household size (persons) 2.5 2.4 2.2 2.0 1.9 -0.6 -0.8 -0.7 -0.5Number of households (Million) 6.0 6.8 7.7 8.5 9.2 1.2 1.3 1.0 0.7Gross Domestic product (in 000 MEuro'00) 302.0 402.3 463.3 555.6 641.9 2.9 1.4 1.8 1.5Households expenditure (in 000 MEuro'00) 152.0 200.0 223.2 268.8 309.8 2.8 1.1 1.9 1.4Gross Value Added (in 000 MEuro'00) 283.0 373.8 429.6 513.8 592.6 2.8 1.4 1.8 1.4Industry 50.3 62.5 64.7 75.0 84.3 2.2 0.4 1.5 1.2 17.8 16.7 15.1 14.6 14.2
iron and steel 1.4 1.3 1.4 1.5 1.5 -0.6 0.9 0.6 0.1 0.5 0.3 0.3 0.3 0.3non ferrous metals 0.6 0.7 0.8 0.9 0.9 1.5 0.6 1.3 0.6 0.2 0.2 0.2 0.2 0.2chemicals 8.4 10.5 12.2 14.2 16.0 2.3 1.5 1.5 1.2 3.0 2.8 2.8 2.8 2.7
petrochemicals,fertilisers and others 7.4 8.1 9.1 9.9 10.5 0.9 1.2 0.9 0.6 2.6 2.2 2.1 1.9 1.8pharmaceuticals and cosmetics 1.0 2.5 3.2 4.3 5.5 9.2 2.5 3.2 2.5 0.4 0.7 0.7 0.8 0.9
non metallic minerals 2.3 2.6 2.5 2.8 3.1 1.4 -0.6 1.2 1.0 0.8 0.7 0.6 0.5 0.5paper, pulp, printing 6.4 7.9 7.8 9.0 10.1 2.2 -0.2 1.5 1.2 2.2 2.1 1.8 1.7 1.7
paper and pulp production 1.6 1.8 1.8 2.1 2.3 0.8 0.3 1.4 1.0 0.6 0.5 0.4 0.4 0.4printing and publishing 4.7 6.1 5.9 6.9 7.8 2.6 -0.3 1.5 1.3 1.7 1.6 1.4 1.3 1.3
food, drink, tobacco 8.3 11.0 11.9 13.9 15.7 2.9 0.8 1.5 1.2 2.9 3.0 2.8 2.7 2.7textiles and leather 1.6 1.6 1.3 1.3 1.3 -0.4 -1.6 0.0 0.1 0.6 0.4 0.3 0.3 0.2engineering 15.5 19.7 19.5 22.9 25.9 2.4 -0.1 1.6 1.3 5.5 5.3 4.5 4.4 4.4other industries 5.8 7.2 7.4 8.6 9.8 2.1 0.3 1.5 1.3 2.1 1.9 1.7 1.7 1.6
Construction 18.0 19.4 20.2 22.9 25.2 0.7 0.4 1.3 1.0 6.4 5.2 4.7 4.5 4.3Services 191.1 265.4 318.2 387.5 453.4 3.3 1.8 2.0 1.6 67.5 71.0 74.1 75.4 76.5
market services 59.0 91.5 104.9 127.8 151.0 4.5 1.4 2.0 1.7 20.9 24.5 24.4 24.9 25.5non-market services 69.8 79.6 104.3 124.4 140.6 1.3 2.7 1.8 1.2 24.7 21.3 24.3 24.2 23.7trade 62.3 94.3 109.1 135.3 161.8 4.2 1.5 2.2 1.8 22.0 25.2 25.4 26.3 27.3
Agriculture 9.5 12.1 11.1 11.9 12.5 2.4 -0.8 0.7 0.5 3.4 3.2 2.6 2.3 2.1Energy sector 14.1 14.5 15.4 16.6 17.2 0.3 0.6 0.8 0.4 5.0 3.9 3.6 3.2 2.9
Source: PRIMES
Source: PRIMES
65

BASELINE SCENARIOPOLAND: Key Demographic and Economic Assumptions
1990 2000 2010 2020 2030 '90-'00 '00-'10 '10-'20 '20-'30 1990 2000 2010 2020 2030Annual % Change % Structure of total value added
Main Demographic AssumptionsPopulation (Million) 38.1 38.6 37.8 37.1 36.5 0.1 -0.2 -0.2 -0.1Average household size (persons) 3.1 2.8 2.6 2.5 2.4 -1.0 -0.9 -0.3 -0.3Number of households (Million) 12.3 13.8 14.7 14.9 15.1 1.2 0.7 0.1 0.2Gross Domestic product (in 000 MEuro'00) 126.2 180.6 265.4 406.9 564.6 3.7 3.9 4.4 3.3Households expenditure (in 000 MEuro'00) 76.2 111.8 163.8 252.0 350.9 3.9 3.9 4.4 3.4Gross Value Added (in 000 MEuro'00) 109.8 154.6 226.6 349.2 485.9 3.5 3.9 4.4 3.4Industry 25.7 38.2 64.4 101.5 133.6 4.0 5.4 4.7 2.8 23.4 24.7 28.4 29.1 27.5
iron and steel 1.8 1.4 1.5 1.7 1.9 -2.6 0.7 1.2 0.9 1.7 0.9 0.7 0.5 0.4non ferrous metals 0.2 0.3 0.4 0.5 0.5 4.0 1.8 2.2 1.4 0.2 0.2 0.2 0.1 0.1chemicals 2.4 3.0 5.1 9.3 12.9 2.5 5.5 6.1 3.3 2.2 2.0 2.3 2.7 2.6
petrochemicals,fertilisers and others 1.7 1.6 1.9 2.9 3.8 -0.9 2.1 4.3 2.7 1.6 1.0 0.9 0.8 0.8pharmaceuticals and cosmetics 0.6 1.4 3.2 6.4 9.0 8.5 8.3 7.1 3.5 0.6 0.9 1.4 1.8 1.9
non metallic minerals 1.4 2.6 4.5 7.1 9.1 6.1 5.6 4.7 2.5 1.3 1.7 2.0 2.0 1.9paper, pulp, printing 1.1 2.7 4.9 7.1 8.4 9.7 6.1 3.8 1.8 1.0 1.7 2.2 2.0 1.7
paper and pulp production 0.6 0.8 1.2 1.5 1.7 3.4 4.7 2.2 1.2 0.5 0.5 0.5 0.4 0.4printing and publishing 0.5 1.9 3.6 5.5 6.7 14.1 6.6 4.3 1.9 0.5 1.2 1.6 1.6 1.4
food, drink, tobacco 4.7 10.0 18.7 28.3 36.7 7.7 6.5 4.2 2.6 4.3 6.5 8.3 8.1 7.6textiles and leather 2.2 2.6 3.4 4.0 4.5 1.9 2.8 1.6 1.2 2.0 1.7 1.5 1.1 0.9engineering 9.8 10.8 18.0 31.0 43.1 1.0 5.3 5.6 3.3 8.9 7.0 8.0 8.9 8.9other industries 2.1 4.8 7.9 12.5 16.6 8.5 5.0 4.8 2.9 1.9 3.1 3.5 3.6 3.4
Construction 8.3 11.3 11.2 18.1 24.9 3.1 -0.1 5.0 3.2 7.6 7.3 4.9 5.2 5.1Services 60.8 86.2 128.8 203.0 296.2 3.6 4.1 4.7 3.8 55.4 55.8 56.9 58.1 61.0
market services 10.2 15.9 24.1 41.0 63.5 4.5 4.2 5.5 4.5 9.3 10.3 10.6 11.8 13.1non-market services 28.5 26.7 32.9 42.9 53.0 -0.6 2.1 2.7 2.1 25.9 17.2 14.5 12.3 10.9trade 22.1 43.6 71.8 119.1 179.7 7.0 5.1 5.2 4.2 20.1 28.2 31.7 34.1 37.0
Agriculture 5.1 8.0 11.7 15.2 18.3 4.5 4.0 2.6 1.9 4.7 5.1 5.2 4.4 3.8Energy sector 9.8 11.0 10.4 11.4 12.9 1.1 -0.5 0.9 1.3 8.9 7.1 4.6 3.3 2.7
BASELINE SCENARIOPORTUGAL: Key Demographic and Economic Assumptions
1990 2000 2010 2020 2030 '90-'00 '00-'10 '10-'20 '20-'30 1990 2000 2010 2020 2030Annual % Change % Structure of total value added
Main Demographic AssumptionsPopulation (Million) 10.0 10.2 10.7 10.8 10.7 0.2 0.4 0.1 -0.1Average household size (persons) 3.0 2.8 2.6 2.5 2.3 -0.9 -0.6 -0.6 -0.5Number of households (Million) 3.3 3.7 4.1 4.4 4.6 1.1 1.0 0.7 0.4Gross Domestic product (in 000 MEuro'00) 87.9 115.5 131.2 172.2 221.3 2.8 1.3 2.8 2.5Households expenditure (in 000 MEuro'00) 54.0 73.2 86.2 112.9 145.4 3.1 1.6 2.7 2.6Gross Value Added (in 000 MEuro'00) 80.7 107.2 123.7 164.6 213.7 2.9 1.4 2.9 2.6Industry 17.6 21.1 21.6 27.2 33.4 1.8 0.2 2.3 2.1 21.9 19.7 17.5 16.5 15.6
iron and steel 0.1 0.2 0.2 0.2 0.2 4.1 -1.0 1.0 0.5 0.2 0.2 0.2 0.1 0.1non ferrous metals 0.1 0.1 0.1 0.2 0.2 1.0 2.7 1.5 1.1 0.1 0.1 0.1 0.1 0.1chemicals 1.6 1.3 1.4 1.8 2.4 -1.4 0.3 2.8 2.6 1.9 1.3 1.1 1.1 1.1
petrochemicals,fertilisers and others 1.0 0.8 0.8 0.9 1.0 -3.1 -0.1 1.8 1.3 1.3 0.7 0.6 0.5 0.5pharmaceuticals and cosmetics 0.5 0.6 0.6 0.9 1.3 1.3 0.9 3.8 3.7 0.6 0.5 0.5 0.6 0.6
non metallic minerals 1.2 2.0 2.1 2.7 3.2 5.2 0.5 2.5 2.0 1.5 1.8 1.7 1.6 1.5paper, pulp, printing 1.8 2.5 2.7 3.5 4.4 3.7 0.5 2.7 2.3 2.2 2.4 2.2 2.1 2.0
paper and pulp production 0.6 1.3 1.4 1.9 2.3 7.2 1.3 2.6 2.0 0.8 1.2 1.2 1.1 1.1printing and publishing 1.1 1.3 1.2 1.6 2.1 1.2 -0.4 2.8 2.6 1.4 1.2 1.0 1.0 1.0
food, drink, tobacco 3.3 2.9 3.0 3.8 4.6 -1.3 0.2 2.3 2.1 4.2 2.7 2.4 2.3 2.2textiles and leather 4.8 4.2 4.0 4.6 5.1 -1.3 -0.3 1.4 0.9 5.9 3.9 3.3 2.8 2.4engineering 3.0 5.3 5.6 7.3 9.3 5.9 0.5 2.7 2.5 3.7 5.0 4.5 4.4 4.4other industries 1.8 2.5 2.5 3.2 4.0 3.5 0.2 2.4 2.2 2.2 2.3 2.0 1.9 1.9
Construction 5.4 7.3 6.1 7.7 9.6 3.1 -1.7 2.3 2.2 6.7 6.8 5.0 4.7 4.5Services 50.9 70.7 87.1 118.8 158.5 3.3 2.1 3.2 2.9 63.1 66.0 70.4 72.2 74.2
market services 12.2 22.5 29.7 42.0 58.2 6.3 2.8 3.5 3.3 15.1 21.0 24.0 25.5 27.2non-market services 18.5 23.0 27.0 34.5 42.0 2.2 1.6 2.5 2.0 23.0 21.4 21.8 20.9 19.7trade 20.1 25.2 30.4 42.4 58.3 2.3 1.9 3.4 3.2 24.9 23.5 24.6 25.7 27.3
Agriculture 4.2 4.4 4.9 6.3 7.2 0.3 1.1 2.6 1.3 5.2 4.1 3.9 3.8 3.4Energy sector 2.5 3.6 3.9 4.6 5.1 3.7 0.8 1.4 1.1 3.1 3.4 3.2 2.8 2.4
Source: PRIMES
Source: PRIMES
66

BASELINE SCENARIOSLOVAKIA: Key Demographic and Economic Assumptions
1990 2000 2010 2020 2030 '90-'00 '00-'10 '10-'20 '20-'30 1990 2000 2010 2020 2030Annual % Change % Structure of total value added
Main Demographic AssumptionsPopulation (Million) 5.3 5.4 5.3 5.3 5.2 0.2 -0.1 -0.1 -0.2Average household size (persons) 2.5 2.2 2.0 1.9 1.8 -1.3 -1.0 -0.5 -0.5Number of households (Million) 2.1 2.5 2.7 2.8 2.9 1.5 0.9 0.4 0.3Gross Domestic product (in 000 MEuro'00) 19.1 21.9 34.4 52.5 71.9 1.4 4.6 4.3 3.2Households expenditure (in 000 MEuro'00) 11.7 11.8 17.3 25.5 34.3 0.1 3.9 4.0 3.0Gross Value Added (in 000 MEuro'00) 20.1 19.6 31.5 47.8 65.4 -0.2 4.8 4.3 3.2Industry 4.9 4.8 8.4 13.2 18.3 -0.2 5.9 4.6 3.3 24.1 24.3 26.8 27.6 27.9
iron and steel 0.3 0.4 0.6 0.7 0.8 3.9 3.7 1.9 1.1 1.5 2.2 2.0 1.6 1.3non ferrous metals 0.0 0.2 0.3 0.3 0.4 17.5 5.5 2.5 1.3 0.2 0.8 0.8 0.7 0.6chemicals 0.6 0.4 0.4 0.6 1.0 -3.7 0.6 4.1 4.1 3.0 2.1 1.4 1.4 1.5
petrochemicals,fertilisers and others 0.4 0.3 0.3 0.4 0.5 -4.1 0.7 2.6 2.5 2.2 1.5 1.0 0.8 0.8pharmaceuticals and cosmetics 0.2 0.1 0.1 0.2 0.5 -2.8 0.5 6.9 6.4 0.8 0.6 0.4 0.5 0.7
non metallic minerals 0.4 0.3 0.6 0.9 1.3 -3.4 8.0 4.9 2.9 1.9 1.4 1.9 2.0 1.9paper, pulp, printing 0.4 0.4 0.7 1.1 1.5 -0.4 5.9 4.6 2.9 2.1 2.1 2.3 2.4 2.3
paper and pulp production 0.3 0.3 0.4 0.5 0.5 -1.5 3.2 2.2 1.4 1.6 1.4 1.2 1.0 0.8printing and publishing 0.1 0.1 0.3 0.7 1.0 2.3 10.1 6.7 3.9 0.5 0.7 1.1 1.4 1.5
food, drink, tobacco 0.8 0.5 0.6 1.0 1.4 -4.4 1.7 4.8 3.5 4.1 2.7 2.0 2.1 2.2textiles and leather 0.5 0.4 0.5 0.7 0.9 -2.3 3.7 3.1 2.3 2.4 1.9 1.7 1.5 1.4engineering 1.2 1.6 3.4 5.6 8.0 2.8 7.6 5.0 3.7 6.2 8.3 10.8 11.6 12.2other industries 0.6 0.6 1.2 2.1 3.0 -0.3 8.2 5.6 3.6 2.8 2.8 3.8 4.4 4.5
Construction 1.2 0.8 1.3 2.1 2.8 -3.6 4.3 5.0 2.8 6.0 4.3 4.1 4.4 4.2Services 10.0 11.8 19.1 29.2 40.6 1.7 5.0 4.3 3.3 49.5 60.0 60.6 61.2 62.1
market services 2.5 3.3 5.8 9.2 12.8 3.1 5.7 4.7 3.4 12.2 17.0 18.5 19.2 19.5non-market services 2.7 3.1 5.4 7.7 10.2 1.1 5.9 3.6 2.8 13.6 15.5 17.2 16.2 15.5trade 4.8 5.4 7.9 12.3 17.6 1.3 3.8 4.6 3.7 23.6 27.5 24.9 25.8 27.0
Agriculture 1.5 1.2 1.6 2.1 2.6 -2.6 3.5 2.6 2.0 7.4 5.9 5.2 4.4 3.9Energy sector 2.6 1.1 1.1 1.2 1.2 -8.3 -0.3 0.8 0.8 12.9 5.6 3.4 2.4 1.9
BASELINE SCENARIOSLOVENIA: Key Demographic and Economic Assumptions
1990 2000 2010 2020 2030 '90-'00 '00-'10 '10-'20 '20-'30 1990 2000 2010 2020 2030Annual % Change % Structure of total value added
Main Demographic AssumptionsPopulation (Million) 2.0 2.0 2.0 2.0 2.0 0.0 0.1 0.0 -0.1Average household size (persons) 3.3 3.1 2.8 2.7 2.7 -0.8 -0.8 -0.4 -0.3Number of households (Million) 0.6 0.6 0.7 0.7 0.8 0.7 1.0 0.4 0.2Gross Domestic product (in 000 MEuro'00) 17.2 20.6 29.2 37.1 43.8 1.8 3.6 2.4 1.7Households expenditure (in 000 MEuro'00) 9.0 11.5 15.6 19.7 23.2 2.5 3.1 2.4 1.7Gross Value Added (in 000 MEuro'00) 15.2 17.8 25.4 32.1 37.9 1.6 3.6 2.4 1.7Industry 4.8 5.2 8.0 10.1 11.8 0.6 4.5 2.4 1.6 31.8 28.9 31.5 31.4 31.2
iron and steel 0.1 0.1 0.2 0.2 0.2 1.9 3.4 1.3 0.9 0.7 0.8 0.7 0.7 0.6non ferrous metals 0.1 0.1 0.1 0.2 0.2 -1.3 4.7 2.8 2.0 0.6 0.4 0.5 0.5 0.5chemicals 0.1 0.6 1.0 1.3 1.6 17.9 4.8 3.1 2.0 0.8 3.4 3.8 4.1 4.2
petrochemicals,fertilisers and others 0.1 0.2 0.3 0.4 0.5 11.2 4.0 2.2 1.5 0.5 1.3 1.3 1.3 1.3pharmaceuticals and cosmetics 0.0 0.4 0.6 0.9 1.1 25.4 5.3 3.5 2.3 0.3 2.1 2.5 2.8 2.9
non metallic minerals 0.3 0.2 0.4 0.5 0.6 -1.3 4.9 2.8 1.4 1.7 1.3 1.5 1.5 1.5paper, pulp, printing 0.4 0.4 0.6 0.8 0.9 -0.2 3.8 2.3 1.6 2.9 2.4 2.5 2.4 2.4
paper and pulp production 0.2 0.2 0.2 0.3 0.3 -1.6 3.0 1.8 0.8 1.3 1.0 0.9 0.9 0.8printing and publishing 0.2 0.3 0.4 0.5 0.6 0.9 4.3 2.6 1.9 1.5 1.4 1.6 1.6 1.6
food, drink, tobacco 0.6 0.6 0.9 1.1 1.3 -1.2 4.4 2.6 1.7 4.2 3.2 3.4 3.5 3.5textiles and leather 0.7 0.5 0.5 0.5 0.5 -3.6 0.6 0.1 -0.1 4.6 2.7 2.0 1.6 1.4engineering 1.8 1.9 3.3 4.2 5.0 0.6 5.4 2.6 1.8 11.9 10.8 12.9 13.1 13.3other industries 0.7 0.7 1.1 1.3 1.5 0.4 4.2 2.0 1.2 4.5 4.0 4.2 4.0 3.9
Construction 0.9 1.1 1.4 1.9 2.2 1.5 2.5 2.9 1.4 6.2 6.2 5.6 5.9 5.7Services 8.2 10.4 14.8 18.9 22.6 2.5 3.6 2.4 1.8 53.5 58.3 58.4 58.7 59.5
market services 2.4 3.3 4.9 6.6 8.0 3.3 4.1 3.0 2.0 15.5 18.4 19.3 20.5 21.1non-market services 2.5 3.5 4.9 5.7 6.3 3.6 3.2 1.6 1.0 16.4 19.9 19.2 17.7 16.6trade 3.3 3.6 5.0 6.6 8.3 0.8 3.5 2.7 2.3 21.6 20.1 19.9 20.6 21.9
Agriculture 0.7 0.6 0.5 0.5 0.6 -0.8 -2.0 0.8 0.6 4.4 3.5 2.0 1.7 1.5Energy sector 0.6 0.6 0.7 0.7 0.7 -1.2 1.8 0.8 0.5 4.1 3.1 2.6 2.2 2.0
Source: PRIMES
Source: PRIMES
67

BASELINE SCENARIOSPAIN: Key Demographic and Economic Assumptions
1990 2000 2010 2020 2030 '90-'00 '00-'10 '10-'20 '20-'30 1990 2000 2010 2020 2030Annual % Change % Structure of total value added
Main Demographic AssumptionsPopulation (Million) 38.9 39.9 44.6 45.6 45.4 0.3 1.1 0.2 0.0Average household size (persons) 3.2 2.9 2.7 2.6 2.4 -1.0 -0.5 -0.6 -0.6Number of households (Million) 12.3 14.0 16.5 17.9 18.8 1.3 1.7 0.8 0.5Gross Domestic product (in 000 MEuro'00) 468.3 610.5 801.8 1040.2 1240.4 2.7 2.8 2.6 1.8Households expenditure (in 000 MEuro'00) 284.6 361.5 484.4 625.4 743.2 2.4 3.0 2.6 1.7Gross Value Added (in 000 MEuro'00) 463.5 578.1 750.0 974.5 1170.5 2.2 2.6 2.7 1.8Industry 88.5 108.0 134.3 176.5 210.3 2.0 2.2 2.8 1.8 19.1 18.7 17.9 18.1 18.0
iron and steel 3.5 3.3 3.8 4.1 4.2 -0.4 1.4 0.7 0.2 0.7 0.6 0.5 0.4 0.4non ferrous metals 0.9 1.4 1.9 2.3 2.7 4.5 2.8 2.1 1.5 0.2 0.2 0.2 0.2 0.2chemicals 7.6 9.6 13.7 19.7 25.0 2.4 3.7 3.7 2.4 1.6 1.7 1.8 2.0 2.1
petrochemicals,fertilisers and others 4.3 5.4 7.5 10.2 11.8 2.3 3.3 3.0 1.5 0.9 0.9 1.0 1.0 1.0pharmaceuticals and cosmetics 3.2 4.1 6.1 9.5 13.2 2.5 4.0 4.5 3.3 0.7 0.7 0.8 1.0 1.1
non metallic minerals 7.2 8.9 11.4 14.7 17.3 2.2 2.5 2.6 1.7 1.5 1.5 1.5 1.5 1.5paper, pulp, printing 6.7 9.6 12.4 16.3 19.1 3.7 2.6 2.8 1.6 1.4 1.7 1.7 1.7 1.6
paper and pulp production 1.9 3.2 4.2 5.5 6.5 5.3 2.8 2.7 1.7 0.4 0.6 0.6 0.6 0.6printing and publishing 4.8 6.4 8.2 10.8 12.6 2.9 2.5 2.8 1.6 1.0 1.1 1.1 1.1 1.1
food, drink, tobacco 14.4 15.7 19.1 24.8 29.5 0.9 2.0 2.6 1.7 3.1 2.7 2.5 2.5 2.5textiles and leather 9.0 8.2 7.5 8.1 8.3 -0.9 -1.0 0.8 0.3 1.9 1.4 1.0 0.8 0.7engineering 29.4 37.8 47.9 64.6 77.9 2.5 2.4 3.0 1.9 6.3 6.5 6.4 6.6 6.7other industries 9.9 13.5 16.6 21.9 26.3 3.1 2.1 2.8 1.8 2.1 2.3 2.2 2.3 2.2
Construction 38.3 45.7 69.1 89.6 106.1 1.8 4.2 2.6 1.7 8.3 7.9 9.2 9.2 9.1Services 299.0 376.9 494.3 646.8 784.7 2.3 2.7 2.7 2.0 64.5 65.2 65.9 66.4 67.0
market services 89.5 105.5 142.2 189.7 231.8 1.7 3.0 2.9 2.0 19.3 18.2 19.0 19.5 19.8non-market services 87.9 116.2 152.5 189.1 222.4 2.8 2.8 2.2 1.6 19.0 20.1 20.3 19.4 19.0trade 121.6 155.2 199.7 268.0 330.5 2.5 2.6 3.0 2.1 26.2 26.8 26.6 27.5 28.2
Agriculture 22.3 25.1 25.1 28.6 31.4 1.2 0.0 1.3 0.9 4.8 4.3 3.3 2.9 2.7Energy sector 15.4 22.4 27.3 33.0 37.9 3.8 2.0 1.9 1.4 3.3 3.9 3.6 3.4 3.2
BASELINE SCENARIOSWEDEN: Key Demographic and Economic Assumptions
1990 2000 2010 2020 2030 '90-'00 '00-'10 '10-'20 '20-'30 1990 2000 2010 2020 2030Annual % Change % Structure of total value added
Main Demographic AssumptionsPopulation (Million) 8.6 8.9 9.2 9.6 9.9 0.4 0.4 0.4 0.3Average household size (persons) 2.2 2.1 2.0 1.9 1.8 -0.4 -0.7 -0.6 -0.4Number of households (Million) 3.9 4.1 4.6 5.1 5.5 0.7 1.1 1.0 0.8Gross Domestic product (in 000 MEuro'00) 213.3 259.9 329.1 414.0 484.3 2.0 2.4 2.3 1.6Households expenditure (in 000 MEuro'00) 109.3 126.7 153.3 188.5 218.7 1.5 1.9 2.1 1.5Gross Value Added (in 000 MEuro'00) 188.9 236.1 302.7 385.1 453.4 2.3 2.5 2.4 1.6Industry 34.3 62.4 88.3 115.5 135.5 6.2 3.5 2.7 1.6 18.2 26.4 29.2 30.0 29.9
iron and steel 1.5 2.2 2.7 2.9 2.9 3.8 1.9 0.5 0.2 0.8 0.9 0.9 0.7 0.6non ferrous metals 0.4 0.5 0.6 0.7 0.7 0.8 2.0 1.5 0.6 0.2 0.2 0.2 0.2 0.2chemicals 2.4 5.8 9.6 13.1 15.7 9.2 5.2 3.1 1.9 1.3 2.4 3.2 3.4 3.5
petrochemicals,fertilisers and others 1.4 2.3 2.5 2.8 3.0 5.3 0.9 1.1 0.7 0.7 1.0 0.8 0.7 0.7pharmaceuticals and cosmetics 1.0 3.4 7.1 10.2 12.7 13.1 7.5 3.8 2.2 0.5 1.5 2.3 2.7 2.8
non metallic minerals 1.2 1.0 1.4 1.7 1.9 -1.8 3.1 2.0 1.2 0.6 0.4 0.5 0.4 0.4paper, pulp, printing 7.4 8.3 9.4 12.0 13.9 1.1 1.2 2.5 1.5 3.9 3.5 3.1 3.1 3.1
paper and pulp production 4.1 5.4 5.9 7.3 8.5 2.7 0.9 2.1 1.5 2.2 2.3 1.9 1.9 1.9printing and publishing 3.3 2.9 3.5 4.7 5.4 -1.3 1.8 3.2 1.4 1.7 1.2 1.1 1.2 1.2
food, drink, tobacco 2.7 3.5 4.1 5.3 6.0 2.8 1.5 2.6 1.3 1.4 1.5 1.4 1.4 1.3textiles and leather 0.6 0.5 0.5 0.5 0.5 -1.9 -1.1 0.8 0.7 0.3 0.2 0.1 0.1 0.1engineering 14.3 35.5 54.2 72.0 85.4 9.5 4.3 2.9 1.7 7.6 15.0 17.9 18.7 18.8other industries 3.7 5.2 5.9 7.5 8.5 3.4 1.4 2.3 1.3 2.0 2.2 2.0 1.9 1.9
Construction 10.4 8.6 11.2 14.0 15.7 -1.8 2.6 2.2 1.2 5.5 3.7 3.7 3.6 3.5Services 128.5 152.6 189.1 240.6 286.4 1.7 2.2 2.4 1.8 68.0 64.6 62.5 62.5 63.2
market services 40.7 53.5 64.1 84.3 103.6 2.8 1.8 2.8 2.1 21.6 22.7 21.2 21.9 22.8non-market services 51.0 50.8 61.6 72.2 79.2 0.0 1.9 1.6 0.9 27.0 21.5 20.4 18.7 17.5trade 36.8 48.2 63.4 84.1 103.7 2.7 2.8 2.9 2.1 19.5 20.4 20.9 21.8 22.9
Agriculture 5.8 5.3 6.6 7.2 7.6 -0.8 2.1 0.9 0.6 3.1 2.3 2.2 1.9 1.7Energy sector 9.9 7.2 7.6 7.9 8.2 -3.2 0.6 0.5 0.4 5.2 3.0 2.5 2.1 1.8
Source: PRIMES
Source: PRIMES
68

BASELINE SCENARIOUNITED KINGDOM: Key Demographic and Economic Assumptions
1990 2000 2010 2020 2030 '90-'00 '00-'10 '10-'20 '20-'30 1990 2000 2010 2020 2030Annual % Change % Structure of total value added
Main Demographic AssumptionsPopulation (Million) 57.2 58.6 60.9 62.9 64.4 0.2 0.4 0.3 0.2Average household size (persons) 2.6 2.4 2.1 2.0 1.9 -0.8 -1.0 -0.8 -0.6Number of households (Million) 22.4 24.8 28.5 31.8 34.6 1.1 1.4 1.1 0.8Gross Domestic product (in 000 MEuro'00) 1227.8 1559.6 2031.5 2578.9 3061.6 2.4 2.7 2.4 1.7Households expenditure (in 000 MEuro'00) 799.6 1040.3 1372.0 1729.0 2045.1 2.7 2.8 2.3 1.7Gross Value Added (in 000 MEuro'00) 1135.5 1439.8 1876.9 2384.1 2831.2 2.4 2.7 2.4 1.7Industry 257.7 268.8 272.3 321.0 358.1 0.4 0.1 1.7 1.1 22.7 18.7 14.5 13.5 12.6
iron and steel 7.8 4.3 3.8 4.0 4.0 -5.7 -1.3 0.5 0.0 0.7 0.3 0.2 0.2 0.1non ferrous metals 4.1 3.1 3.0 3.4 3.5 -2.7 -0.2 1.2 0.1 0.4 0.2 0.2 0.1 0.1chemicals 24.9 27.1 29.0 36.7 42.5 0.8 0.7 2.4 1.5 2.2 1.9 1.5 1.5 1.5
petrochemicals,fertilisers and others 14.8 13.6 11.0 11.7 12.3 -0.8 -2.1 0.6 0.5 1.3 0.9 0.6 0.5 0.4pharmaceuticals and cosmetics 10.1 13.5 18.0 25.1 30.2 2.9 2.9 3.4 1.9 0.9 0.9 1.0 1.1 1.1
non metallic minerals 10.4 9.3 9.1 10.4 11.3 -1.1 -0.3 1.4 0.9 0.9 0.6 0.5 0.4 0.4paper, pulp, printing 29.0 35.5 36.1 42.4 47.0 2.1 0.2 1.6 1.0 2.6 2.5 1.9 1.8 1.7
paper and pulp production 7.4 7.3 6.9 7.7 8.2 0.0 -0.6 1.0 0.7 0.6 0.5 0.4 0.3 0.3printing and publishing 21.6 28.2 29.2 34.7 38.8 2.7 0.3 1.8 1.1 1.9 2.0 1.6 1.5 1.4
food, drink, tobacco 31.7 37.4 39.7 47.0 52.6 1.7 0.6 1.7 1.1 2.8 2.6 2.1 2.0 1.9textiles and leather 15.7 10.9 6.4 5.2 4.8 -3.5 -5.2 -2.0 -0.9 1.4 0.8 0.3 0.2 0.2engineering 109.6 111.9 114.7 133.8 147.7 0.2 0.3 1.5 1.0 9.6 7.8 6.1 5.6 5.2other industries 24.7 29.2 30.5 38.0 44.7 1.7 0.4 2.2 1.6 2.2 2.0 1.6 1.6 1.6
Construction 67.9 66.4 93.2 115.8 132.6 -0.2 3.4 2.2 1.4 6.0 4.6 5.0 4.9 4.7Services 743.9 1009.0 1420.3 1856.8 2249.6 3.1 3.5 2.7 1.9 65.5 70.1 75.7 77.9 79.5
market services 266.8 376.0 577.7 782.1 969.7 3.5 4.4 3.1 2.2 23.5 26.1 30.8 32.8 34.3non-market services 236.5 294.4 363.1 436.2 496.1 2.2 2.1 1.8 1.3 20.8 20.4 19.3 18.3 17.5trade 240.6 338.6 479.5 638.5 783.7 3.5 3.5 2.9 2.1 21.2 23.5 25.5 26.8 27.7
Agriculture 22.4 23.1 23.6 24.1 24.3 0.3 0.2 0.2 0.1 2.0 1.6 1.3 1.0 0.9Energy sector 43.6 72.5 67.5 66.4 66.6 5.2 -0.7 -0.2 0.0 3.8 5.0 3.6 2.8 2.4
BASELINE SCENARIOBULGARIA: Key Demographic and Economic Assumptions
1990 2000 2010 2020 2030 '90-'00 '00-'10 '10-'20 '20-'30 1990 2000 2010 2020 2030Annual % Change % Structure of total value added
Main Demographic AssumptionsPopulation (Million) 8.7 8.2 7.4 6.8 6.2 -0.6 -0.9 -0.9 -1.0Average household size (persons) 2.9 2.6 2.3 2.1 1.9 -0.9 -1.2 -0.9 -0.9Number of households (Million) 3.0 3.1 3.2 3.2 3.2 0.3 0.3 0.0 -0.1Gross Domestic product (in 000 MEuro'00) 16.3 13.7 23.4 39.8 61.1 -1.7 5.5 5.5 4.4Households expenditure (in 000 MEuro'00) 11.3 10.2 17.3 28.4 42.4 -1.1 5.5 5.1 4.1Gross Value Added (in 000 MEuro'00) 18.3 12.5 21.2 36.3 55.8 -3.8 5.5 5.5 4.4Industry 4.1 2.3 4.0 7.3 11.8 -5.8 5.8 6.1 4.9 22.6 18.3 18.9 20.1 21.1
iron and steel 0.4 0.2 0.3 0.4 0.5 -6.3 3.1 3.2 2.5 2.2 1.7 1.3 1.1 0.9non ferrous metals 0.2 0.1 0.1 0.1 0.1 -11.0 -0.1 1.7 1.2 0.9 0.4 0.2 0.2 0.1chemicals 0.5 0.3 0.6 1.2 2.1 -5.1 7.3 7.5 5.7 2.7 2.3 2.7 3.3 3.7
petrochemicals,fertilisers and others 0.4 0.1 0.2 0.3 0.6 -10.3 1.5 7.4 5.2 2.3 1.1 0.8 0.9 1.0pharmaceuticals and cosmetics 0.1 0.1 0.4 0.9 1.5 7.3 11.0 7.5 5.8 0.4 1.2 2.0 2.4 2.7
non metallic minerals 0.1 0.1 0.2 0.3 0.5 -0.5 4.2 5.8 4.6 0.7 0.9 0.8 0.8 0.9paper, pulp, printing 0.1 0.1 0.2 0.4 0.7 1.1 6.1 6.9 5.9 0.5 0.9 0.9 1.1 1.2
paper and pulp production 0.1 0.0 0.0 0.1 0.1 -5.8 2.7 3.9 3.1 0.3 0.2 0.2 0.2 0.1printing and publishing 0.0 0.1 0.2 0.3 0.6 6.5 7.3 7.5 6.3 0.2 0.6 0.7 0.9 1.1
food, drink, tobacco 0.3 0.5 0.9 1.6 2.5 4.2 6.2 5.7 4.6 1.8 4.0 4.2 4.3 4.4textiles and leather 0.1 0.3 0.5 0.7 0.9 10.0 3.0 4.2 2.9 0.7 2.8 2.2 1.9 1.7engineering 0.8 0.5 1.1 2.1 3.7 -3.7 7.4 7.2 5.6 4.2 4.2 5.0 5.9 6.6other industries 1.6 0.1 0.3 0.5 0.9 -21.5 7.2 6.3 4.9 8.9 1.2 1.4 1.5 1.6
Construction 0.5 0.5 0.8 1.5 2.5 0.3 4.2 7.0 5.1 2.7 4.1 3.6 4.1 4.5Services 7.1 6.8 12.3 21.0 32.1 -0.6 6.2 5.5 4.3 39.0 54.2 57.9 58.0 57.6
market services 3.7 2.4 4.2 7.0 10.5 -4.3 5.8 5.3 4.1 20.3 19.1 19.7 19.3 18.8non-market services 1.0 1.7 3.0 4.8 7.0 5.7 5.7 4.8 3.7 5.5 14.0 14.3 13.4 12.5trade 2.4 2.6 5.1 9.2 14.7 0.8 6.8 6.1 4.8 13.3 21.1 23.9 25.4 26.3
Agriculture 5.6 1.6 1.7 2.2 2.7 -11.9 1.1 2.3 2.1 30.3 12.5 8.2 6.0 4.8Energy sector 1.0 1.4 2.4 4.2 6.7 3.1 6.0 5.8 4.7 5.5 10.9 11.4 11.7 12.1
Source: PRIMES
Source: PRIMES
69
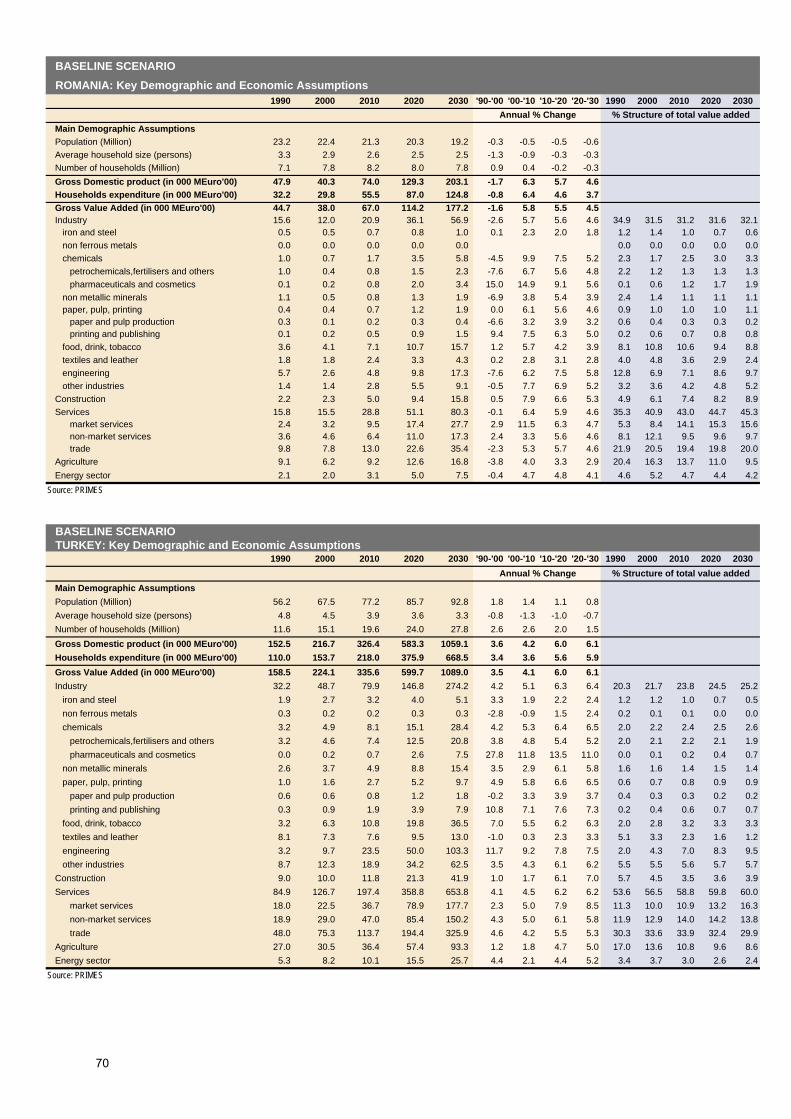
BASELINE SCENARIOROMANIA: Key Demographic and Economic Assumptions
1990 2000 2010 2020 2030 '90-'00 '00-'10 '10-'20 '20-'30 1990 2000 2010 2020 2030Annual % Change % Structure of total value added
Main Demographic AssumptionsPopulation (Million) 23.2 22.4 21.3 20.3 19.2 -0.3 -0.5 -0.5 -0.6Average household size (persons) 3.3 2.9 2.6 2.5 2.5 -1.3 -0.9 -0.3 -0.3Number of households (Million) 7.1 7.8 8.2 8.0 7.8 0.9 0.4 -0.2 -0.3Gross Domestic product (in 000 MEuro'00) 47.9 40.3 74.0 129.3 203.1 -1.7 6.3 5.7 4.6Households expenditure (in 000 MEuro'00) 32.2 29.8 55.5 87.0 124.8 -0.8 6.4 4.6 3.7Gross Value Added (in 000 MEuro'00) 44.7 38.0 67.0 114.2 177.2 -1.6 5.8 5.5 4.5Industry 15.6 12.0 20.9 36.1 56.9 -2.6 5.7 5.6 4.6 34.9 31.5 31.2 31.6 32.1
iron and steel 0.5 0.5 0.7 0.8 1.0 0.1 2.3 2.0 1.8 1.2 1.4 1.0 0.7 0.6non ferrous metals 0.0 0.0 0.0 0.0 0.0 0.0 0.0 0.0 0.0 0.0chemicals 1.0 0.7 1.7 3.5 5.8 -4.5 9.9 7.5 5.2 2.3 1.7 2.5 3.0 3.3
petrochemicals,fertilisers and others 1.0 0.4 0.8 1.5 2.3 -7.6 6.7 5.6 4.8 2.2 1.2 1.3 1.3 1.3pharmaceuticals and cosmetics 0.1 0.2 0.8 2.0 3.4 15.0 14.9 9.1 5.6 0.1 0.6 1.2 1.7 1.9
non metallic minerals 1.1 0.5 0.8 1.3 1.9 -6.9 3.8 5.4 3.9 2.4 1.4 1.1 1.1 1.1paper, pulp, printing 0.4 0.4 0.7 1.2 1.9 0.0 6.1 5.6 4.6 0.9 1.0 1.0 1.0 1.1
paper and pulp production 0.3 0.1 0.2 0.3 0.4 -6.6 3.2 3.9 3.2 0.6 0.4 0.3 0.3 0.2printing and publishing 0.1 0.2 0.5 0.9 1.5 9.4 7.5 6.3 5.0 0.2 0.6 0.7 0.8 0.8
food, drink, tobacco 3.6 4.1 7.1 10.7 15.7 1.2 5.7 4.2 3.9 8.1 10.8 10.6 9.4 8.8textiles and leather 1.8 1.8 2.4 3.3 4.3 0.2 2.8 3.1 2.8 4.0 4.8 3.6 2.9 2.4engineering 5.7 2.6 4.8 9.8 17.3 -7.6 6.2 7.5 5.8 12.8 6.9 7.1 8.6 9.7other industries 1.4 1.4 2.8 5.5 9.1 -0.5 7.7 6.9 5.2 3.2 3.6 4.2 4.8 5.2
Construction 2.2 2.3 5.0 9.4 15.8 0.5 7.9 6.6 5.3 4.9 6.1 7.4 8.2 8.9Services 15.8 15.5 28.8 51.1 80.3 -0.1 6.4 5.9 4.6 35.3 40.9 43.0 44.7 45.3
market services 2.4 3.2 9.5 17.4 27.7 2.9 11.5 6.3 4.7 5.3 8.4 14.1 15.3 15.6non-market services 3.6 4.6 6.4 11.0 17.3 2.4 3.3 5.6 4.6 8.1 12.1 9.5 9.6 9.7trade 9.8 7.8 13.0 22.6 35.4 -2.3 5.3 5.7 4.6 21.9 20.5 19.4 19.8 20.0
Agriculture 9.1 6.2 9.2 12.6 16.8 -3.8 4.0 3.3 2.9 20.4 16.3 13.7 11.0 9.5Energy sector 2.1 2.0 3.1 5.0 7.5 -0.4 4.7 4.8 4.1 4.6 5.2 4.7 4.4 4.2
BASELINE SCENARIOTURKEY: Key Demographic and Economic Assumptions
1990 2000 2010 2020 2030 '90-'00 '00-'10 '10-'20 '20-'30 1990 2000 2010 2020 2030Annual % Change % Structure of total value added
Main Demographic AssumptionsPopulation (Million) 56.2 67.5 77.2 85.7 92.8 1.8 1.4 1.1 0.8Average household size (persons) 4.8 4.5 3.9 3.6 3.3 -0.8 -1.3 -1.0 -0.7Number of households (Million) 11.6 15.1 19.6 24.0 27.8 2.6 2.6 2.0 1.5Gross Domestic product (in 000 MEuro'00) 152.5 216.7 326.4 583.3 1059.1 3.6 4.2 6.0 6.1Households expenditure (in 000 MEuro'00) 110.0 153.7 218.0 375.9 668.5 3.4 3.6 5.6 5.9Gross Value Added (in 000 MEuro'00) 158.5 224.1 335.6 599.7 1089.0 3.5 4.1 6.0 6.1Industry 32.2 48.7 79.9 146.8 274.2 4.2 5.1 6.3 6.4 20.3 21.7 23.8 24.5 25.2
iron and steel 1.9 2.7 3.2 4.0 5.1 3.3 1.9 2.2 2.4 1.2 1.2 1.0 0.7 0.5non ferrous metals 0.3 0.2 0.2 0.3 0.3 -2.8 -0.9 1.5 2.4 0.2 0.1 0.1 0.0 0.0chemicals 3.2 4.9 8.1 15.1 28.4 4.2 5.3 6.4 6.5 2.0 2.2 2.4 2.5 2.6
petrochemicals,fertilisers and others 3.2 4.6 7.4 12.5 20.8 3.8 4.8 5.4 5.2 2.0 2.1 2.2 2.1 1.9pharmaceuticals and cosmetics 0.0 0.2 0.7 2.6 7.5 27.8 11.8 13.5 11.0 0.0 0.1 0.2 0.4 0.7
non metallic minerals 2.6 3.7 4.9 8.8 15.4 3.5 2.9 6.1 5.8 1.6 1.6 1.4 1.5 1.4paper, pulp, printing 1.0 1.6 2.7 5.2 9.7 4.9 5.8 6.6 6.5 0.6 0.7 0.8 0.9 0.9
paper and pulp production 0.6 0.6 0.8 1.2 1.8 -0.2 3.3 3.9 3.7 0.4 0.3 0.3 0.2 0.2printing and publishing 0.3 0.9 1.9 3.9 7.9 10.8 7.1 7.6 7.3 0.2 0.4 0.6 0.7 0.7
food, drink, tobacco 3.2 6.3 10.8 19.8 36.5 7.0 5.5 6.2 6.3 2.0 2.8 3.2 3.3 3.3textiles and leather 8.1 7.3 7.6 9.5 13.0 -1.0 0.3 2.3 3.3 5.1 3.3 2.3 1.6 1.2engineering 3.2 9.7 23.5 50.0 103.3 11.7 9.2 7.8 7.5 2.0 4.3 7.0 8.3 9.5other industries 8.7 12.3 18.9 34.2 62.5 3.5 4.3 6.1 6.2 5.5 5.5 5.6 5.7 5.7
Construction 9.0 10.0 11.8 21.3 41.9 1.0 1.7 6.1 7.0 5.7 4.5 3.5 3.6 3.9Services 84.9 126.7 197.4 358.8 653.8 4.1 4.5 6.2 6.2 53.6 56.5 58.8 59.8 60.0
market services 18.0 22.5 36.7 78.9 177.7 2.3 5.0 7.9 8.5 11.3 10.0 10.9 13.2 16.3non-market services 18.9 29.0 47.0 85.4 150.2 4.3 5.0 6.1 5.8 11.9 12.9 14.0 14.2 13.8trade 48.0 75.3 113.7 194.4 325.9 4.6 4.2 5.5 5.3 30.3 33.6 33.9 32.4 29.9
Agriculture 27.0 30.5 36.4 57.4 93.3 1.2 1.8 4.7 5.0 17.0 13.6 10.8 9.6 8.6Energy sector 5.3 8.2 10.1 15.5 25.7 4.4 2.1 4.4 5.2 3.4 3.7 3.0 2.6 2.4
Source: PRIMES
Source: PRIMES
70

BASELINE SCENARIONORWAY: Key Demographic and Economic Assumptions
1990 2000 2010 2020 2030 '90-'00 '00-'10 '10-'20 '20-'30 1990 2000 2010 2020 2030Annual % Change % Structure of total value added
Main Demographic AssumptionsPopulation (Million) 4.2 4.5 4.7 4.9 5.2 0.6 0.5 0.5 0.5Average household size (persons) 2.4 2.3 2.1 2.0 1.9 -0.5 -0.8 -0.8 -0.5Number of households (Million) 1.7 1.9 2.2 2.5 2.7 1.0 1.3 1.3 0.9Gross Domestic product (in 000 MEuro'00) 125.6 181.1 225.8 285.0 343.5 3.7 2.2 2.4 1.9Households expenditure (in 000 MEuro'00) 65.3 90.6 115.3 146.4 177.2 3.3 2.4 2.4 1.9Gross Value Added (in 000 MEuro'00) 112.0 160.5 198.6 249.7 300.2 3.7 2.2 2.3 1.9Industry 16.2 18.9 20.8 26.3 32.3 1.6 1.0 2.4 2.1 14.4 11.8 10.5 10.5 10.8
iron and steel 0.4 0.5 0.5 0.6 0.7 2.0 1.4 1.4 1.0 0.3 0.3 0.3 0.2 0.2non ferrous metals 0.7 1.5 1.9 2.3 2.6 7.5 2.1 2.1 1.4 0.7 0.9 0.9 0.9 0.9chemicals 2.0 1.9 1.9 2.2 2.6 -0.6 0.0 1.6 1.5 1.8 1.2 1.0 0.9 0.9
petrochemicals,fertilisers and others 1.6 1.5 1.4 1.5 1.6 -0.4 -1.1 0.6 0.8 1.4 1.0 0.7 0.6 0.5pharmaceuticals and cosmetics 0.4 0.3 0.5 0.8 1.0 -1.4 4.2 3.8 2.6 0.4 0.2 0.3 0.3 0.3
non metallic minerals 0.6 0.6 0.6 0.7 0.8 0.4 0.5 0.8 0.9 0.5 0.4 0.3 0.3 0.3paper, pulp, printing 2.5 2.8 3.0 3.9 4.7 1.1 0.7 2.5 2.0 2.3 1.8 1.5 1.6 1.6
paper and pulp production 1.2 1.1 1.2 1.4 1.7 -1.0 0.9 2.1 1.8 1.0 0.7 0.6 0.6 0.6printing and publishing 1.4 1.8 1.9 2.5 3.0 2.6 0.6 2.6 2.1 1.2 1.1 1.0 1.0 1.0
food, drink, tobacco 2.3 3.1 3.1 3.6 4.3 3.3 -0.1 1.6 1.8 2.0 1.9 1.6 1.5 1.4textiles and leather 0.3 0.3 0.3 0.3 0.3 0.1 -1.7 0.2 0.6 0.3 0.2 0.1 0.1 0.1engineering 5.6 6.3 7.4 10.1 13.2 1.2 1.6 3.2 2.7 5.0 3.9 3.7 4.0 4.4other industries 1.8 1.8 2.1 2.7 3.1 0.3 1.5 2.3 1.6 1.6 1.2 1.1 1.1 1.0
Construction 5.6 6.1 6.4 6.9 7.5 0.9 0.5 0.7 0.9 5.0 3.8 3.2 2.7 2.5Services 72.8 105.8 138.8 177.0 213.9 3.8 2.8 2.5 1.9 65.0 65.9 69.9 70.9 71.3
market services 21.4 31.6 42.9 57.0 71.6 4.0 3.1 2.9 2.3 19.1 19.7 21.6 22.8 23.9non-market services 26.9 33.6 39.8 45.9 51.5 2.2 1.7 1.4 1.2 24.1 21.0 20.0 18.4 17.2trade 24.4 40.5 56.1 74.1 90.7 5.2 3.3 2.8 2.0 21.8 25.2 28.3 29.7 30.2
Agriculture 3.1 4.0 4.2 4.4 4.5 2.5 0.5 0.4 0.3 2.8 2.5 2.1 1.7 1.5Energy sector 14.4 25.8 28.4 35.1 42.0 6.0 1.0 2.1 1.8 12.9 16.1 14.3 14.1 14.0
BASELINE SCENARIOSWITZERLAND: Key Demographic and Economic Assumptions
1990 2000 2010 2020 2030 '90-'00 '00-'10 '10-'20 '20-'30 1990 2000 2010 2020 2030Annual % Change % Structure of total value added
Main Demographic AssumptionsPopulation (Million) 6.8 7.2 7.4 7.5 7.5 0.6 0.3 0.1 0.1Average household size (persons) 2.2 2.1 1.9 1.7 1.7 -0.8 -1.0 -0.8 -0.3Number of households (Million) 3.0 3.5 4.0 4.4 4.5 1.4 1.3 0.9 0.3Gross Domestic product (in 000 MEuro'00) 240.3 266.7 302.5 364.2 419.2 1.0 1.3 1.9 1.4Households expenditure (in 000 MEuro'00) 139.9 158.6 183.7 224.0 259.9 1.3 1.5 2.0 1.5Gross Value Added (in 000 MEuro'00) 210.3 233.4 271.0 331.5 385.5 1.0 1.5 2.0 1.5Industry 40.3 62.5 73.0 90.7 105.1 4.5 1.6 2.2 1.5 19.2 26.8 26.9 27.4 27.3
iron and steel 1.4 1.0 1.1 1.2 1.3 -3.0 0.8 1.0 0.6 0.7 0.4 0.4 0.4 0.3non ferrous metals 0.5 0.3 0.3 0.4 0.4 -5.2 -0.2 1.4 0.9 0.3 0.1 0.1 0.1 0.1chemicals 5.0 9.6 11.2 14.3 17.0 6.8 1.5 2.5 1.8 2.4 4.1 4.1 4.3 4.4
petrochemicals,fertilisers and others 1.4 1.6 1.8 2.2 2.6 1.3 1.1 2.2 1.6 0.7 0.7 0.7 0.7 0.7pharmaceuticals and cosmetics 3.6 8.0 9.4 12.0 14.4 8.4 1.5 2.5 1.8 1.7 3.4 3.5 3.6 3.7
non metallic minerals 1.0 1.7 1.9 2.2 2.6 5.8 1.0 1.9 1.3 0.5 0.7 0.7 0.7 0.7paper, pulp, printing 6.3 6.1 7.0 8.7 10.0 -0.4 1.4 2.2 1.4 3.0 2.6 2.6 2.6 2.6
paper and pulp production 2.1 1.3 1.6 1.8 2.0 -4.6 1.5 1.6 1.0 1.0 0.6 0.6 0.5 0.5printing and publishing 4.2 4.7 5.5 6.9 8.0 1.2 1.4 2.3 1.5 2.0 2.0 2.0 2.1 2.1
food, drink, tobacco 2.7 4.9 5.6 6.9 8.4 5.9 1.4 2.2 1.9 1.3 2.1 2.1 2.1 2.2textiles and leather 0.9 1.5 1.5 1.6 1.6 5.9 -0.2 0.5 0.2 0.4 0.7 0.5 0.5 0.4engineering 20.6 30.8 37.1 46.4 53.6 4.1 1.9 2.3 1.4 9.8 13.2 13.7 14.0 13.9other industries 1.9 6.6 7.4 9.1 10.4 13.3 1.2 2.0 1.4 0.9 2.8 2.7 2.7 2.7
Construction 10.1 10.3 11.0 12.2 13.3 0.2 0.7 1.0 0.8 4.8 4.4 4.1 3.7 3.4Services 145.8 146.1 171.1 209.9 246.1 0.0 1.6 2.1 1.6 69.3 62.6 63.1 63.3 63.8
market services 75.8 82.2 97.8 120.7 141.6 0.8 1.7 2.1 1.6 36.1 35.2 36.1 36.4 36.7non-market services 37.9 35.0 40.8 50.2 58.8 -0.8 1.6 2.1 1.6 18.0 15.0 15.1 15.1 15.2trade 32.1 28.9 32.4 39.0 45.7 -1.0 1.2 1.9 1.6 15.3 12.4 12.0 11.8 11.9
Agriculture 4.4 3.5 3.5 3.8 4.0 -2.4 -0.1 0.9 0.4 2.1 1.5 1.3 1.1 1.0Energy sector 9.6 11.0 12.5 14.9 17.1 1.4 1.2 1.8 1.4 4.6 4.7 4.6 4.5 4.4
Source: PRIMES
Source: PRIMES
71

72

73
APPENDIX 2: Baseline scenario results (summary results)
Summary results by country and groups of countries

EU25: Baseline scenario SUMMARY ENERGY BALANCE AND INDICATORS (A) ktoe 1990 1995 2000 2005 2010 2015 2020 2025 2030 '90-'00 '00-'10 '10-'20 '20-'30
Annual % ChangePrimary Production 877543 896935 898598 885034 836416 741087 706521 691710 685103 0.2 -0.7 -1.7 -0.3
Solids 351650 264403 204139 189650 154528 132849 131082 128136 120197 -5.3 -2.7 -1.6 -0.9Oil 120396 162231 163631 134107 117178 75189 52958 47721 43449 3.1 -3.3 -7.6 -2.0Natural gas 139723 174169 196665 197203 172179 124785 98349 88938 79806 3.5 -1.3 -5.4 -2.1Nuclear 196920 215258 237664 251349 248776 241224 228638 204708 210808 1.9 0.5 -0.8 -0.8Renewable energy sources 68855 80874 96499 112725 143756 167040 195493 222207 230842 3.4 4.1 3.1 1.7
Hydro 23391 26285 28982 28900 29878 31273 32203 33306 33881 2.2 0.3 0.8 0.5Biomass & Waste 42151 50608 61865 72595 92408 108094 129192 145563 148880 3.9 4.1 3.4 1.4Wind 67 351 1913 6492 15786 21012 26241 34291 37942 39.8 23.5 5.2 3.8Solar and others 145 273 417 1047 1490 2036 2747 3560 4394 11.2 13.6 6.3 4.8Geothermal 3101 3357 3322 3691 4194 4625 5110 5487 5746 0.7 2.4 2.0 1.2
Net Imports 711300 701364 801061 903660 1024275 1166612 1231691 1243442 1265567 1.2 2.5 1.9 0.3Solids 75449 73961 94307 115387 132287 131963 128394 152744 172919 2.3 3.4 -0.3 3.0Oil 510017 490616 518147 560230 599698 647166 669865 655403 652450 0.2 1.5 1.1 -0.3 - Crude oil and Feedstocks 479112 471342 496826 520227 561357 611062 636675 626020 626251 0.4 1.2 1.3 -0.2 - Oil products 30905 19274 21321 40003 38341 36104 33190 29382 26199 -3.6 6.0 -1.4 -2.3Natural gas 123653 135413 186463 225528 290053 385355 431310 433152 437996 4.2 4.5 4.0 0.2Electricity 2181 1373 2144 2515 2237 2128 2122 2143 2202 -0.2 0.4 -0.5 0.4
Gross Inland Consumption 1556194 1571949 1653841 1743574 1812532 1856993 1885336 1881055 1895237 0.6 0.9 0.4 0.1Solids 431944 345411 306538 305037 286815 264812 259476 280880 293117 -3.4 -0.7 -1.0 1.2Oil 595746 621073 634711 649216 668718 671648 669949 649026 640466 0.6 0.5 0.0 -0.4Natural gas 260548 307959 376284 422731 462231 510141 529659 522090 517802 3.7 2.1 1.4 -0.2Nuclear 196920 215258 237664 251349 248776 241224 228638 204708 210808 1.9 0.5 -0.8 -0.8Electricity 2181 1373 2144 2515 2237 2128 2122 2143 2202 -0.2 0.4 -0.5 0.4Renewable energy forms 68855 80874 96499 112725 143756 167040 195493 222207 230842 3.4 4.1 3.1 1.7
as % in Gross Inland ConsumptionSolids 27.8 22.0 18.5 17.5 15.8 14.3 13.8 14.9 15.5Oil 38.3 39.5 38.4 37.2 36.9 36.2 35.5 34.5 33.8Natural gas 16.7 19.6 22.8 24.2 25.5 27.5 28.1 27.8 27.3Nuclear 12.7 13.7 14.4 14.4 13.7 13.0 12.1 10.9 11.1Renewable energy forms 4.4 5.1 5.8 6.5 7.9 9.0 10.4 11.8 12.2
Electricity Generation in GWhe 2455674 2608843 2900835 3177346 3483186 3764508 4005775 4212062 4366599 1.7 1.8 1.4 0.9Nuclear 780056 864404 921193 974239 964265 934990 886207 793447 817092 1.7 0.5 -0.8 -0.8Hydro & wind 272788 309719 359249 412484 532544 610454 683851 792163 843723 2.8 4.0 2.5 2.1Thermal (incl. biomass) 1402830 1434720 1620392 1790623 1986376 2219064 2435718 2626452 2705784 1.5 2.1 2.1 1.1
Fuel Inputs for Thermal Power Generation (1) 355362 352353 385987 410276 432241 449791 462771 484113 490038 0.8 1.1 0.7 0.6Solids 246377 220956 214488 224313 214950 197852 198501 223929 240311 -1.4 0.0 -0.8 1.9Oil (including refinery gas) 48954 48762 41870 34457 31633 28252 23312 21168 19795 -1.6 -2.8 -3.0 -1.6Gas 47057 65292 105480 122896 152826 182201 182731 167191 155248 8.4 3.8 1.8 -1.6Biomass & Waste 10201 14351 21211 25403 29147 37365 53619 66833 69424 7.6 3.2 6.3 2.6Geothermal heat 2774 2992 2939 3206 3685 4122 4608 4992 5260 0.6 2.3 2.3 1.3Hydrogen - Methanol 0 0 0 0 0 0 0 0 0
Fuel Input in other transformation proc. 797634 778572 796450 784166 812897 820511 824095 805339 797065 0.0 0.2 0.1 -0.3Refineries 642275 675873 710448 705361 728922 733608 734025 715011 708103 1.0 0.3 0.1 -0.4Biofuels and hydrogen production 2 198 637 5802 16792 23650 31004 34715 36375 81.7 38.7 6.3 1.6District heating 31035 22310 17261 14917 15250 14746 13818 13936 14734 -5.7 -1.2 -1.0 0.6Others 124322 80191 68104 58086 51932 48508 45249 41677 37853 -5.8 -2.7 -1.4 -1.8
Energy Branch Consumption 73032 79401 80377 80698 81498 81525 81166 79313 78134 1.0 0.1 0.0 -0.4Non-Energy Uses 94476 103521 105950 105233 107847 109684 111200 111744 112165 1.2 0.2 0.3 0.1Final Energy Demand 1021913 1035507 1095359 1168130 1238006 1291672 1338504 1359581 1370453 0.7 1.2 0.8 0.2by sectorIndustry(1) 341087 316738 330062 339213 356420 372190 382402 388453 391565 -0.3 0.8 0.7 0.2 - energy intensive industries 216809 203107 211616 214509 220760 226326 228392 227150 224932 -0.2 0.4 0.3 -0.2 - other industrial sectors 124278 113631 118446 124704 135661 145864 154010 161303 166633 -0.5 1.4 1.3 0.8Residential 261006 274620 273302 294612 311966 327949 338741 346027 351285 0.5 1.3 0.8 0.4Tertiary 146622 149313 158975 173698 188487 201207 211856 219031 225316 0.8 1.7 1.2 0.6Transport 273198 294836 333020 360607 381133 390326 405505 406070 402286 2.0 1.4 0.6 -0.1by fuel (1)
Solids 123937 79722 56633 50603 45202 42330 39420 37162 34024 -7.5 -2.2 -1.4 -1.5Oil 428121 446290 468312 497167 517342 523868 529896 521729 511837 0.9 1.0 0.2 -0.3Gas 200242 227244 251885 269385 279174 295721 309726 315457 321398 2.3 1.0 1.0 0.4Electricity 176468 187817 211352 233767 259310 282344 302918 321035 334043 1.8 2.1 1.6 1.0Heat (from CHP and District Heating) 63092 59882 68712 74217 80177 83571 87691 91659 95325 0.9 1.6 0.9 0.8Other 30053 34552 38465 42992 56802 63837 68854 72539 73826 2.5 4.0 1.9 0.7
CO2 Emissions (Mt of CO2) 3776.1 3637.2 3674.1 3803.2 3881.9 3911.9 3928.6 3955.2 3955.0 -0.3 0.6 0.1 0.1Power generation/District heating 1362.6 1268.0 1294.9 1341.9 1361.9 1348.2 1333.2 1390.3 1424.0 -0.5 0.5 -0.2 0.7Energy Branch 141.5 161.5 144.9 126.5 123.9 120.5 113.9 104.7 99.7 0.2 -1.6 -0.8 -1.3Industry 698.9 611.0 567.7 576.4 577.0 592.7 595.2 584.0 569.8 -2.1 0.2 0.3 -0.4Residential 506.1 485.6 452.1 467.7 482.7 493.9 494.9 489.6 486.7 -1.1 0.7 0.3 -0.2Tertiary 274.2 254.7 244.6 251.8 261.8 269.6 275.8 278.4 281.9 -1.1 0.7 0.5 0.2Transport 792.7 856.5 969.9 1038.8 1074.6 1087.0 1115.5 1108.1 1092.9 2.0 1.0 0.4 -0.2
CO2 Emissions Index (1990=100) 100.0 96.3 97.3 100.7 102.8 103.6 104.0 104.7 104.7
Source: PRIMES
74

EU25: Baseline scenario SUMMARY ENERGY BALANCE AND INDICATORS (B)1990 1995 2000 2005 2010 2015 2020 2025 2030 '90-'00 '00-'10 '10-'20 '20-'30
Annual % ChangeMain Energy System IndicatorsPopulation (Million) 440.788 448.121 452.915 458.842 464.054 467.306 469.270 470.057 469.365 0.3 0.2 0.1 0.0GDP (in 000 MEUR'00) 7294.7 7794.0 8947.0 9715.5 10946.8 12304.8 13656.3 14963.7 16051.4 2.1 2.0 2.2 1.6Gross Inl. Cons./GDP (toe/MEUR'00) 213.3 201.7 184.8 179.5 165.6 150.9 138.1 125.7 118.1 -1.4 -1.1 -1.8 -1.6Gross Inl. Cons./Capita (toe/inhabitant) 3.53 3.51 3.65 3.80 3.91 3.97 4.02 4.00 4.04 0.3 0.7 0.3 0.1Electricity Generated/Capita (kWh/inhabitant) 5571 5822 6405 6925 7506 8056 8536 8961 9303 1.4 1.6 1.3 0.9Carbon intensity (t of CO2/toe of GIC) 2.43 2.31 2.22 2.18 2.14 2.11 2.08 2.10 2.09 -0.9 -0.4 -0.3 0.0CO2 Emissions/Capita (t of CO2/inhabitant) 8.57 8.12 8.11 8.29 8.37 8.37 8.37 8.41 8.43 -0.5 0.3 0.0 0.1CO2 Emissions to GDP (t of CO2/MEUR'00) 517.7 466.7 410.7 391.5 354.6 317.9 287.7 264.3 246.4 -2.3 -1.5 -2.1 -1.5Import Dependency % 44.7 43.6 47.2 50.5 55.0 61.2 63.5 64.3 64.9 0.0 0.0 0.0 0.0
Energy intensity indicators (1990=100)Industry (Energy on Value added) 100.0 90.8 83.8 82.2 77.3 71.9 66.7 61.9 58.5 -1.7 -0.8 -1.5 -1.3Residential (Energy on Private Income) 100.0 99.4 85.8 84.9 80.4 75.6 70.6 66.0 62.5 -1.5 -0.7 -1.3 -1.2Tertiary (Energy on Value added) 100.0 93.3 84.9 83.7 79.6 74.8 70.6 66.4 63.4 -1.6 -0.7 -1.2 -1.1Transport (Energy on GDP) 100.0 101.0 99.4 99.1 93.0 84.7 79.3 72.5 66.9 -0.1 -0.7 -1.6 -1.7
Carbon Intensity indicatorsElectricity and Steam production (t of CO2/MWh) 0.41 0.32 0.30 0.28 0.27 0.25 0.23 0.23 0.23 -3.2 -1.1 -1.4 -0.1Final energy demand (t of CO2/toe) 2.22 2.13 2.04 2.00 1.94 1.89 1.85 1.81 1.77 -0.9 -0.5 -0.4 -0.4
Industry 2.05 1.93 1.72 1.70 1.62 1.59 1.56 1.50 1.46 -1.7 -0.6 -0.4 -0.7Residential 1.94 1.77 1.65 1.59 1.55 1.51 1.46 1.41 1.39 -1.6 -0.7 -0.6 -0.5Tertiary 1.87 1.71 1.54 1.45 1.39 1.34 1.30 1.27 1.25 -1.9 -1.0 -0.6 -0.4Transport 2.90 2.90 2.91 2.88 2.82 2.78 2.75 2.73 2.72 0.0 -0.3 -0.2 -0.1
Electricity and steam generationGeneration Capacity in MWe 661750 725717 810507 866290 942581 1029203 1096292 2.0 1.5 1.5
Nuclear 141082 137466 136430 125468 116936 96762 101216 -0.3 -1.5 -1.4Hydro (pumping excluded) 97168 99690 103934 106792 108617 110905 112201 0.7 0.4 0.3Wind 12785 37711 78392 103006 127624 164342 182931 19.9 5.0 3.7Solar 176 773 1658 2918 4850 7277 10364 25.1 11.3 7.9Thermal 410539 450077 490094 528106 584554 649917 689580 1.8 1.8 1.7
of which cogeneration units 112958 135302 150870 174826 208961 234795 247999 2.9 3.3 1.7Solids fired 188879 186736 156536 143186 156806 187936 211236 -1.9 0.0 3.0Gas fired 131875 170919 245438 287293 321208 344356 360134 6.4 2.7 1.2Oil fired 74302 74986 66049 59647 47930 41086 34966 -1.2 -3.2 -3.1Biomass-waste fired 14462 16090 20714 36581 57094 74936 81601 3.7 10.7 3.6Fuel Cells 0 0 0 0 0 0 0Geothermal heat 1022 1346 1356 1398 1517 1602 1643 2.9 1.1 0.8
IndicatorsEfficiency for thermal electricity production (%) 36.1 37.5 39.5 42.4 45.3 46.7 47.5 0.0 0.0 0.0 0.0Load factor for gross electric capacities (%) 50.0 50.0 49.1 49.6 48.5 46.7 45.5 0.0 0.0 0.0 0.0CHP indicator (% of electricity from CHP) 14.5 16.4 17.9 19.9 21.8 23.6 24.3 0.0 0.0 0.0 0.0Non fossil fuels in electricity generation (%) 46.5 46.1 45.8 45.2 45.6 45.7 46.3 0.0 0.0 0.0 0.0 - nuclear 31.8 30.7 27.7 24.8 22.1 18.8 18.7 0.0 0.0 0.0 0.0 - renewable energy forms 14.7 15.4 18.1 20.3 23.4 26.9 27.6 0.0 0.0 0.0 0.0
Transport sectorPassenger transport activity (Gpkm) 4640.8 4934.2 5466.3 5893.0 6449.4 6935.8 7402.0 7792.2 8130.2 1.7 1.7 1.4 0.9
Public road transport 504.1 463.0 480.1 484.4 495.0 487.5 480.6 474.4 466.7 -0.5 0.3 -0.3 -0.3Private cars and motorcycles 3529.3 3857.5 4253.1 4580.5 5016.6 5408.2 5780.7 6090.1 6358.6 1.9 1.7 1.4 1.0Rail 411.9 369.4 402.7 422.0 446.4 462.3 478.5 493.7 505.6 -0.2 1.0 0.7 0.6Aviation 166.3 212.5 296.9 369.7 451.6 535.2 616.7 686.1 749.7 6.0 4.3 3.2 2.0Inland navigation 29.2 31.9 33.6 36.4 39.7 42.6 45.5 47.8 49.5 1.4 1.7 1.4 0.9
Travel per person (km per capita) 10528 11011 12069 12843 13898 14842 15773 16577 17322 1.4 1.4 1.3 0.9
Freight transport activity (Gtkm) 1753.9 1854.3 2131.5 2321.3 2582.2 2815.7 3048.7 3257.9 3431.9 2.0 1.9 1.7 1.2Trucks 1034.1 1230.4 1486.3 1655.9 1891.2 2098.8 2311.7 2499.5 2657.4 3.7 2.4 2.0 1.4Rail 461.7 358.5 374.2 386.8 402.0 413.8 421.4 431.4 438.9 -2.1 0.7 0.5 0.4Inland navigation 258.1 265.4 271.0 278.5 289.0 303.2 315.6 327.0 335.6 0.5 0.6 0.9 0.6
Freight activity per unit of GDP (tkm/000 Euro'00) 240 238 238 239 236 229 223 218 214 -0.1 -0.1 -0.5 -0.4
Energy demand in transport (ktoe) 273198 294836 333020 360607 381133 390326 405505 406070 402286 2.0 1.4 0.6 -0.1Public road transport 7841 6960 7018 7015 7020 6707 6274 5794 5320 -1.1 0.0 -1.1 -1.6Private cars and motorcycles 138202 146118 158349 169295 170177 164449 168901 166483 159851 1.4 0.7 -0.1 -0.5Trucks 82444 92357 108068 119824 135648 148374 156830 162445 164385 2.7 2.3 1.5 0.5Rail 9066 8814 8897 8872 8307 7236 6518 6164 6019 -0.2 -0.7 -2.4 -0.8Aviation 28932 33702 45320 50029 54174 57511 60777 58885 60358 4.6 1.8 1.2 -0.1Inland navigation 6714 6884 5368 5571 5808 6048 6205 6300 6352 -2.2 0.8 0.7 0.2
Efficiency indicator (activity related)Passenger transport (toe/Mpkm) 39.3 39.4 39.9 39.7 37.0 33.9 32.7 30.4 28.4 0.1 -0.8 -1.2 -1.4Freight transport (toe/Mtkm) 51.7 54.2 53.9 54.6 55.3 55.2 53.7 52.0 49.9 0.4 0.3 -0.3 -0.7
75

EU15: Baseline scenario SUMMARY ENERGY BALANCE AND INDICATORS (A) ktoe 1990 1995 2000 2005 2010 2015 2020 2025 2030 '90-'00 '00-'10 '10-'20 '20-'30
Annual % ChangePrimary Production 707946 738402 761643 746715 709637 620740 580499 561271 551733 0.7 -0.7 -2.0 -0.5
Solids 210737 137538 100172 88896 68259 57393 59996 60559 58617 -7.2 -3.8 -1.3 -0.2Oil 117782 159250 160552 131496 114818 73056 50828 45731 41597 3.1 -3.3 -7.8 -2.0Natural gas 132975 166758 190581 191258 166420 119298 93035 83920 75016 3.7 -1.3 -5.6 -2.1Nuclear 181439 201239 222846 233543 231522 223792 207161 178554 177586 2.1 0.4 -1.1 -1.5Renewable energy sources 65014 73616 87491 101522 128619 147201 169479 192506 198916 3.0 3.9 2.8 1.6
Hydro 22275 24947 27627 27512 28416 29740 30543 31503 32014 2.2 0.3 0.7 0.5Biomass & Waste 39426 44719 54257 62925 79319 90783 106223 120089 122407 3.2 3.9 3.0 1.4Wind 67 351 1912 6476 15381 20253 25178 32294 34907 39.8 23.2 5.1 3.3Solar and others 145 242 381 931 1325 1817 2445 3156 3866 10.2 13.3 6.3 4.7Geothermal 3101 3357 3315 3678 4178 4607 5089 5464 5721 0.7 2.3 2.0 1.2
Net Imports 643284 652030 741591 833105 924425 1042924 1094900 1099138 1110843 1.4 2.2 1.7 0.1Solids 89663 94574 110142 130569 135081 128111 123477 145244 159953 2.1 2.1 -0.9 2.6Oil 458793 446731 472543 511043 542759 585275 603563 585908 579418 0.3 1.4 1.1 -0.4 - Crude oil and Feedstocks 435365 434779 455606 479408 513832 559321 581132 567662 564901 0.5 1.2 1.2 -0.3 - Oil products 23428 11952 16937 31635 28927 25954 22432 18247 14517 -3.2 5.5 -2.5 -4.3Natural gas 92495 109229 155262 187185 242762 325886 364086 363427 366511 5.3 4.6 4.1 0.1Electricity 2333 1496 3644 4308 3823 3651 3774 4559 4962 4.6 0.5 -0.1 2.8
Gross Inland Consumption 1319965 1363265 1456936 1535728 1587045 1614168 1623798 1607624 1608500 1.0 0.9 0.2 -0.1Solids 303612 237108 215739 219464 203339 185504 183473 205803 218570 -3.4 -0.6 -1.0 1.8Oil 544159 575619 587926 598447 610560 608835 602789 578855 566939 0.8 0.4 -0.1 -0.6Natural gas 223408 274186 339289 378443 409181 445184 457121 447347 441527 4.3 1.9 1.1 -0.3Nuclear 181439 201239 222846 233543 231522 223792 207161 178554 177586 2.1 0.4 -1.1 -1.5Electricity 2333 1496 3644 4308 3823 3651 3774 4559 4962 4.6 0.5 -0.1 2.8Renewable energy forms 65014 73616 87491 101522 128619 147201 169479 192506 198916 3.0 3.9 2.8 1.6
as % in Gross Inland ConsumptionSolids 23.0 17.4 14.8 14.3 12.8 11.5 11.3 12.8 13.6Oil 41.2 42.2 40.4 39.0 38.5 37.7 37.1 36.0 35.2Natural gas 16.9 20.1 23.3 24.6 25.8 27.6 28.2 27.8 27.4Nuclear 13.7 14.8 15.3 15.2 14.6 13.9 12.8 11.1 11.0Renewable energy forms 4.9 5.4 6.0 6.6 8.1 9.1 10.4 12.0 12.4
Electricity Generation in GWhe 2138940 2308271 2576502 2825710 3082750 3301261 3484742 3629778 3735445 1.9 1.8 1.2 0.7Nuclear 720059 810120 863760 905222 897389 867425 802961 692072 688319 1.8 0.4 -1.1 -1.5Hydro & wind 259810 294155 343478 396161 510816 583729 652024 747645 786067 2.8 4.0 2.5 1.9Thermal (incl. biomass) 1159070 1203996 1369264 1524327 1674545 1850107 2029758 2190062 2261060 1.7 2.0 1.9 1.1
Fuel Inputs for Thermal Power Generation (1) 282186 285979 319336 340741 355980 368554 377224 398250 405562 1.2 1.1 0.6 0.7Solids 184170 163250 158097 166679 156355 141828 142805 167841 184186 -1.5 -0.1 -0.9 2.6Oil (including refinery gas) 43718 44438 38588 31332 28700 25769 20959 18846 17473 -1.2 -2.9 -3.1 -1.8Gas 41697 61211 99188 115542 140935 164422 163852 149667 139835 9.1 3.6 1.5 -1.6Biomass & Waste 9827 14088 20524 23982 26306 32413 45001 56904 58807 7.6 2.5 5.5 2.7Geothermal heat 2774 2992 2939 3206 3685 4122 4608 4992 5260 0.6 2.3 2.3 1.3Hydrogen - Methanol 0 0 0 0 0 0 0 0 0
Fuel Input in other transformation proc. 704402 704382 725664 717503 739949 743332 742852 721245 709821 0.3 0.2 0.0 -0.5Refineries 595036 635942 665476 661082 678086 678682 675187 653422 643612 1.1 0.2 0.0 -0.5Biofuels and hydrogen production 2 188 604 5490 15525 21781 28194 31307 32520 80.7 38.4 6.1 1.4District heating 13085 10060 8717 6565 6736 6098 5461 5253 5647 -4.0 -2.5 -2.1 0.3Others 96279 58191 50868 44366 39601 36772 34010 31263 28042 -6.2 -2.5 -1.5 -1.9
Energy Branch Consumption 63555 68817 67696 68777 68845 68229 67521 65623 64208 0.6 0.2 -0.2 -0.5Non-Energy Uses 84387 94132 95815 95440 97063 97587 97796 97304 96782 1.3 0.1 0.1 -0.1Final Energy Demand 866453 904512 970663 1032641 1086735 1123971 1155105 1163842 1163926 1.1 1.1 0.6 0.1by sectorIndustry(1) 272481 267360 284781 293505 306769 317309 323058 325606 326133 0.4 0.7 0.5 0.1 - energy intensive industries 182306 173386 182967 186470 191515 194860 195291 193082 190253 0.0 0.5 0.2 -0.3 - other industrial sectors 90175 93974 101814 107035 115254 122449 127767 132524 135879 1.2 1.2 1.0 0.6Residential 220020 233619 238404 255742 269121 280589 286998 290825 293114 0.8 1.2 0.6 0.2Tertiary 121346 128708 137376 150502 161622 170311 177217 181059 184489 1.2 1.6 0.9 0.4Transport 252606 274825 310102 332892 349224 355763 367832 366353 360190 2.1 1.2 0.5 -0.2by fuel (1)
Solids 79761 46664 35330 32210 28625 26791 25315 23786 21612 -7.8 -2.1 -1.2 -1.6Oil 393325 416360 434547 458763 473137 475387 477256 466563 453854 1.0 0.9 0.1 -0.5Gas 173014 202214 226415 238642 244666 256067 265493 268446 271100 2.7 0.8 0.8 0.2Electricity 155929 169309 191711 211987 233163 251061 266607 279904 289096 2.1 2.0 1.3 0.8Heat (from CHP and District Heating) 36558 40840 50708 55669 59891 62167 64756 66740 68990 3.3 1.7 0.8 0.6Other 27865 29124 31953 35370 47253 52498 55679 58403 59272 1.4 4.0 1.7 0.6
CO2 Emissions (Mt of CO2) 3068.4 3034.7 3127.0 3244.9 3290.9 3298.7 3301.0 3320.1 3311.0 0.2 0.5 0.0 0.0Power generation/District heating 1021.1 969.7 1014.7 1057.0 1063.7 1049.1 1036.6 1095.9 1132.6 -0.1 0.5 -0.3 0.9Energy Branch 127.2 142.3 127.0 116.1 112.7 108.6 102.7 94.4 89.5 0.0 -1.2 -0.9 -1.4Industry 545.2 495.1 471.6 479.2 475.8 482.7 480.6 467.2 451.2 -1.4 0.1 0.1 -0.6Residential 419.7 413.6 401.5 414.6 427.3 436.0 434.8 429.1 425.2 -0.4 0.6 0.2 -0.2Tertiary 220.7 214.0 207.4 217.8 225.7 230.5 233.3 232.4 232.6 -0.6 0.8 0.3 0.0Transport 734.5 800.0 904.8 960.3 985.8 991.7 1013.0 1001.0 979.8 2.1 0.9 0.3 -0.3
CO2 Emissions Index (1990=100) 100.0 98.9 101.9 105.8 107.2 107.5 107.6 108.2 107.9
Source: PRIMES
76

EU15: Baseline scenario SUMMARY ENERGY BALANCE AND INDICATORS (B)1990 1995 2000 2005 2010 2015 2020 2025 2030 '90-'00 '00-'10 '10-'20 '20-'30
Annual % ChangeMain Energy System IndicatorsPopulation (Million) 365.749 372.917 378.062 384.825 390.652 394.726 397.458 398.780 398.737 0.3 0.3 0.2 0.0GDP (in 000 MEUR'00) 6981.9 7488.1 8572.2 9268.2 10391.5 11623.9 12835.7 13997.7 14948.8 2.1 1.9 2.1 1.5Gross Inl. Cons./GDP (toe/MEUR'00) 189.1 182.1 170.0 165.7 152.7 138.9 126.5 114.8 107.6 -1.1 -1.1 -1.9 -1.6Gross Inl. Cons./Capita (toe/inhabitant) 3.61 3.66 3.85 3.99 4.06 4.09 4.09 4.03 4.03 0.7 0.5 0.1 -0.1Electricity Generated/Capita (kWh/inhabitant) 5848 6190 6815 7343 7891 8363 8768 9102 9368 1.5 1.5 1.1 0.7Carbon intensity (t of CO2/toe of GIC) 2.32 2.23 2.15 2.11 2.07 2.04 2.03 2.07 2.06 -0.8 -0.3 -0.2 0.1CO2 Emissions/Capita (t of CO2/inhabitant) 8.39 8.14 8.27 8.43 8.42 8.36 8.31 8.33 8.30 -0.1 0.2 -0.1 0.0CO2 Emissions to GDP (t of CO2/MEUR'00) 439.5 405.3 364.8 350.1 316.7 283.8 257.2 237.2 221.5 -1.8 -1.4 -2.1 -1.5Import Dependency % 47.5 46.6 49.5 52.7 56.6 62.7 65.4 66.2 66.8 0.0 0.0 0.0 0.0
Energy intensity indicators (1990=100)Industry (Energy on Value added) 100.0 95.3 90.9 90.5 85.3 79.2 73.3 68.0 64.1 -1.0 -0.6 -1.5 -1.3Residential (Energy on Private Income) 100.0 100.0 88.8 87.9 83.1 77.9 72.5 67.6 63.9 -1.2 -0.7 -1.4 -1.3Tertiary (Energy on Value added) 100.0 97.1 88.7 87.9 83.0 77.3 72.4 67.5 64.1 -1.2 -0.7 -1.3 -1.2Transport (Energy on GDP) 100.0 101.4 100.0 99.3 92.9 84.6 79.2 72.3 66.6 0.0 -0.7 -1.6 -1.7
Carbon Intensity indicatorsElectricity and Steam production (t of CO2/MWh) 0.39 0.28 0.27 0.26 0.24 0.23 0.21 0.22 0.22 -3.5 -1.1 -1.3 0.3Final energy demand (t of CO2/toe) 2.22 2.13 2.05 2.01 1.95 1.90 1.87 1.83 1.79 -0.8 -0.5 -0.4 -0.4
Industry 2.00 1.85 1.66 1.63 1.55 1.52 1.49 1.43 1.38 -1.9 -0.7 -0.4 -0.7Residential 1.91 1.77 1.68 1.62 1.59 1.55 1.52 1.48 1.45 -1.2 -0.6 -0.5 -0.4Tertiary 1.82 1.66 1.51 1.45 1.40 1.35 1.32 1.28 1.26 -1.8 -0.8 -0.6 -0.4Transport 2.91 2.91 2.92 2.88 2.82 2.79 2.75 2.73 2.72 0.0 -0.3 -0.2 -0.1
Electricity and steam generationGeneration Capacity in MWe 588083 648770 724169 766570 828090 885326 929554 2.1 1.4 1.2
Nuclear 131758 127430 127644 116682 106198 83716 84668 -0.3 -1.8 -2.2Hydro (pumping excluded) 90794 93107 97113 99718 101267 103256 104396 0.7 0.4 0.3Wind 12769 37585 76132 98538 121331 153508 166810 19.5 4.8 3.2Solar 176 773 1645 2857 4712 6999 9827 25.0 11.1 7.6Thermal 352586 389875 421635 448774 494581 537846 563853 1.8 1.6 1.3
of which cogeneration units 88543 110680 124698 142437 175549 188724 194014 3.5 3.5 1.0Solids fired 144882 143186 116521 104284 117149 139702 154185 -2.2 0.1 2.8Gas fired 125804 162839 227952 261796 289622 302593 315380 6.1 2.4 0.9Oil fired 67470 67773 58980 52785 41729 35176 29416 -1.3 -3.4 -3.4Biomass-waste fired 13407 14731 16825 28511 44564 58774 63229 2.3 10.2 3.6Fuel Cells 0 0 0 0 0 0 0Geothermal heat 1022 1346 1356 1398 1517 1602 1643 2.9 1.1 0.8
IndicatorsEfficiency for thermal electricity production (%) 36.9 38.5 40.5 43.2 46.3 47.3 47.9 0.0 0.0 0.0 0.0Load factor for gross electric capacities (%) 50.0 49.7 48.6 49.2 48.0 46.8 45.9 0.0 0.0 0.0 0.0CHP indicator (% of electricity from CHP) 13.4 15.3 16.7 18.4 20.4 21.3 21.6 0.0 0.0 0.0 0.0Non fossil fuels in electricity generation (%) 49.4 48.6 48.5 48.0 47.8 47.7 47.7 0.0 0.0 0.0 0.0 - nuclear 33.5 32.0 29.1 26.3 23.0 19.1 18.4 0.0 0.0 0.0 0.0 - renewable energy forms 15.9 16.6 19.4 21.7 24.8 28.6 29.3 0.0 0.0 0.0 0.0
Transport sectorPassenger transport activity (Gpkm) 4130.1 4515.4 4997.7 5351.6 5832.0 6249.0 6645.9 6965.8 7228.8 1.9 1.6 1.3 0.8
Public road transport 369.0 377.4 401.8 409.0 422.4 418.2 414.0 409.9 404.5 0.9 0.5 -0.2 -0.2Private cars and motorcycles 3265.7 3590.1 3928.0 4184.0 4545.9 4869.1 5174.4 5416.0 5611.7 1.9 1.5 1.3 0.8Rail 309.8 315.0 351.3 371.1 396.3 413.1 429.6 444.8 457.1 1.3 1.2 0.8 0.6Aviation 157.3 201.5 283.6 351.6 428.4 506.6 583.1 648.0 706.8 6.1 4.2 3.1 1.9Inland navigation 28.4 31.5 33.0 35.8 39.1 41.9 44.8 47.1 48.7 1.5 1.7 1.4 0.8
Travel per person (km per capita) 11292 12108 13219 13906 14929 15831 16721 17468 18129 1.6 1.2 1.1 0.8
Freight transport activity (Gtkm) 1419.2 1583.7 1825.6 1959.7 2143.1 2318.2 2491.4 2646.0 2776.2 2.5 1.6 1.5 1.1Trucks 914.2 1102.0 1309.3 1428.3 1590.3 1743.8 1899.7 2038.6 2156.5 3.7 2.0 1.8 1.3Rail 254.9 221.6 249.5 257.1 268.1 275.7 280.7 285.0 288.7 -0.2 0.7 0.5 0.3Inland navigation 250.1 260.1 266.8 274.3 284.7 298.7 311.1 322.4 331.0 0.6 0.7 0.9 0.6
Freight activity per unit of GDP (tkm/000 Euro'00) 203 211 213 211 206 199 194 189 186 0.5 -0.3 -0.6 -0.4
Energy demand in transport (ktoe) 252606 274825 310102 332892 349224 355763 367832 366353 360190 2.1 1.2 0.5 -0.2Public road transport 6250 5907 5860 5902 5956 5713 5357 4948 4554 -0.6 0.2 -1.1 -1.6Private cars and motorcycles 129911 136622 146708 155299 155182 149077 152169 148625 140735 1.2 0.6 -0.2 -0.8Trucks 75351 85778 100615 110316 123185 133741 140491 144888 145713 2.9 2.0 1.3 0.4Rail 6970 7385 7579 7588 7113 6173 5545 5248 5133 0.8 -0.6 -2.5 -0.8Aviation 27742 32468 44025 48270 52036 55070 58127 56407 57766 4.7 1.7 1.1 -0.1Inland navigation 6383 6665 5314 5516 5751 5989 6144 6238 6289 -1.8 0.8 0.7 0.2
Efficiency indicator (activity related)Passenger transport (toe/Mpkm) 41.2 40.3 40.7 40.4 37.7 34.5 33.3 30.9 28.8 -0.1 -0.8 -1.2 -1.4Freight transport (toe/Mtkm) 58.0 58.7 58.5 59.5 60.5 60.4 58.9 57.1 54.7 0.1 0.3 -0.3 -0.7
77
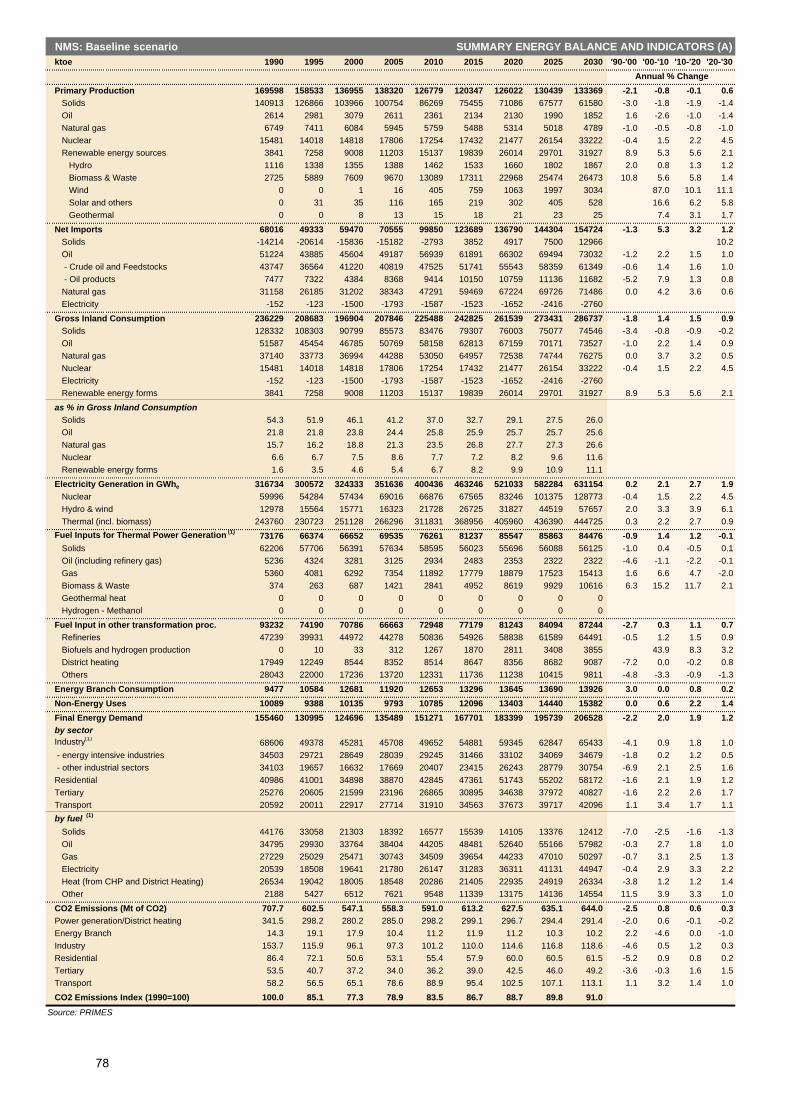
NMS: Baseline scenario SUMMARY ENERGY BALANCE AND INDICATORS (A) ktoe 1990 1995 2000 2005 2010 2015 2020 2025 2030 '90-'00 '00-'10 '10-'20 '20-'30
Annual % ChangePrimary Production 169598 158533 136955 138320 126779 120347 126022 130439 133369 -2.1 -0.8 -0.1 0.6
Solids 140913 126866 103966 100754 86269 75455 71086 67577 61580 -3.0 -1.8 -1.9 -1.4Oil 2614 2981 3079 2611 2361 2134 2130 1990 1852 1.6 -2.6 -1.0 -1.4Natural gas 6749 7411 6084 5945 5759 5488 5314 5018 4789 -1.0 -0.5 -0.8 -1.0Nuclear 15481 14018 14818 17806 17254 17432 21477 26154 33222 -0.4 1.5 2.2 4.5Renewable energy sources 3841 7258 9008 11203 15137 19839 26014 29701 31927 8.9 5.3 5.6 2.1
Hydro 1116 1338 1355 1388 1462 1533 1660 1802 1867 2.0 0.8 1.3 1.2Biomass & Waste 2725 5889 7609 9670 13089 17311 22968 25474 26473 10.8 5.6 5.8 1.4Wind 0 0 1 16 405 759 1063 1997 3034 87.0 10.1 11.1Solar and others 0 31 35 116 165 219 302 405 528 16.6 6.2 5.8Geothermal 0 0 8 13 15 18 21 23 25 7.4 3.1 1.7
Net Imports 68016 49333 59470 70555 99850 123689 136790 144304 154724 -1.3 5.3 3.2 1.2Solids -14214 -20614 -15836 -15182 -2793 3852 4917 7500 12966 10.2Oil 51224 43885 45604 49187 56939 61891 66302 69494 73032 -1.2 2.2 1.5 1.0 - Crude oil and Feedstocks 43747 36564 41220 40819 47525 51741 55543 58359 61349 -0.6 1.4 1.6 1.0 - Oil products 7477 7322 4384 8368 9414 10150 10759 11136 11682 -5.2 7.9 1.3 0.8Natural gas 31158 26185 31202 38343 47291 59469 67224 69726 71486 0.0 4.2 3.6 0.6Electricity -152 -123 -1500 -1793 -1587 -1523 -1652 -2416 -2760
Gross Inland Consumption 236229 208683 196904 207846 225488 242825 261539 273431 286737 -1.8 1.4 1.5 0.9Solids 128332 108303 90799 85573 83476 79307 76003 75077 74546 -3.4 -0.8 -0.9 -0.2Oil 51587 45454 46785 50769 58158 62813 67159 70171 73527 -1.0 2.2 1.4 0.9Natural gas 37140 33773 36994 44288 53050 64957 72538 74744 76275 0.0 3.7 3.2 0.5Nuclear 15481 14018 14818 17806 17254 17432 21477 26154 33222 -0.4 1.5 2.2 4.5Electricity -152 -123 -1500 -1793 -1587 -1523 -1652 -2416 -2760Renewable energy forms 3841 7258 9008 11203 15137 19839 26014 29701 31927 8.9 5.3 5.6 2.1
as % in Gross Inland ConsumptionSolids 54.3 51.9 46.1 41.2 37.0 32.7 29.1 27.5 26.0Oil 21.8 21.8 23.8 24.4 25.8 25.9 25.7 25.7 25.6Natural gas 15.7 16.2 18.8 21.3 23.5 26.8 27.7 27.3 26.6Nuclear 6.6 6.7 7.5 8.6 7.7 7.2 8.2 9.6 11.6Renewable energy forms 1.6 3.5 4.6 5.4 6.7 8.2 9.9 10.9 11.1
Electricity Generation in GWhe 316734 300572 324333 351636 400436 463246 521033 582284 631154 0.2 2.1 2.7 1.9Nuclear 59996 54284 57434 69016 66876 67565 83246 101375 128773 -0.4 1.5 2.2 4.5Hydro & wind 12978 15564 15771 16323 21728 26725 31827 44519 57657 2.0 3.3 3.9 6.1Thermal (incl. biomass) 243760 230723 251128 266296 311831 368956 405960 436390 444725 0.3 2.2 2.7 0.9
Fuel Inputs for Thermal Power Generation (1) 73176 66374 66652 69535 76261 81237 85547 85863 84476 -0.9 1.4 1.2 -0.1Solids 62206 57706 56391 57634 58595 56023 55696 56088 56125 -1.0 0.4 -0.5 0.1Oil (including refinery gas) 5236 4324 3281 3125 2934 2483 2353 2322 2322 -4.6 -1.1 -2.2 -0.1Gas 5360 4081 6292 7354 11892 17779 18879 17523 15413 1.6 6.6 4.7 -2.0Biomass & Waste 374 263 687 1421 2841 4952 8619 9929 10616 6.3 15.2 11.7 2.1Geothermal heat 0 0 0 0 0 0 0 0 0Hydrogen - Methanol 0 0 0 0 0 0 0 0 0
Fuel Input in other transformation proc. 93232 74190 70786 66663 72948 77179 81243 84094 87244 -2.7 0.3 1.1 0.7Refineries 47239 39931 44972 44278 50836 54926 58838 61589 64491 -0.5 1.2 1.5 0.9Biofuels and hydrogen production 0 10 33 312 1267 1870 2811 3408 3855 43.9 8.3 3.2District heating 17949 12249 8544 8352 8514 8647 8356 8682 9087 -7.2 0.0 -0.2 0.8Others 28043 22000 17236 13720 12331 11736 11238 10415 9811 -4.8 -3.3 -0.9 -1.3
Energy Branch Consumption 9477 10584 12681 11920 12653 13296 13645 13690 13926 3.0 0.0 0.8 0.2Non-Energy Uses 10089 9388 10135 9793 10785 12096 13403 14440 15382 0.0 0.6 2.2 1.4Final Energy Demand 155460 130995 124696 135489 151271 167701 183399 195739 206528 -2.2 2.0 1.9 1.2by sectorIndustry(1) 68606 49378 45281 45708 49652 54881 59345 62847 65433 -4.1 0.9 1.8 1.0 - energy intensive industries 34503 29721 28649 28039 29245 31466 33102 34069 34679 -1.8 0.2 1.2 0.5 - other industrial sectors 34103 19657 16632 17669 20407 23415 26243 28779 30754 -6.9 2.1 2.5 1.6Residential 40986 41001 34898 38870 42845 47361 51743 55202 58172 -1.6 2.1 1.9 1.2Tertiary 25276 20605 21599 23196 26865 30895 34638 37972 40827 -1.6 2.2 2.6 1.7Transport 20592 20011 22917 27714 31910 34563 37673 39717 42096 1.1 3.4 1.7 1.1by fuel (1)
Solids 44176 33058 21303 18392 16577 15539 14105 13376 12412 -7.0 -2.5 -1.6 -1.3Oil 34795 29930 33764 38404 44205 48481 52640 55166 57982 -0.3 2.7 1.8 1.0Gas 27229 25029 25471 30743 34509 39654 44233 47010 50297 -0.7 3.1 2.5 1.3Electricity 20539 18508 19641 21780 26147 31283 36311 41131 44947 -0.4 2.9 3.3 2.2Heat (from CHP and District Heating) 26534 19042 18005 18548 20286 21405 22935 24919 26334 -3.8 1.2 1.2 1.4Other 2188 5427 6512 7621 9548 11339 13175 14136 14554 11.5 3.9 3.3 1.0
CO2 Emissions (Mt of CO2) 707.7 602.5 547.1 558.3 591.0 613.2 627.5 635.1 644.0 -2.5 0.8 0.6 0.3Power generation/District heating 341.5 298.2 280.2 285.0 298.2 299.1 296.7 294.4 291.4 -2.0 0.6 -0.1 -0.2Energy Branch 14.3 19.1 17.9 10.4 11.2 11.9 11.2 10.3 10.2 2.2 -4.6 0.0 -1.0Industry 153.7 115.9 96.1 97.3 101.2 110.0 114.6 116.8 118.6 -4.6 0.5 1.2 0.3Residential 86.4 72.1 50.6 53.1 55.4 57.9 60.0 60.5 61.5 -5.2 0.9 0.8 0.2Tertiary 53.5 40.7 37.2 34.0 36.2 39.0 42.5 46.0 49.2 -3.6 -0.3 1.6 1.5Transport 58.2 56.5 65.1 78.6 88.9 95.4 102.5 107.1 113.1 1.1 3.2 1.4 1.0
CO2 Emissions Index (1990=100) 100.0 85.1 77.3 78.9 83.5 86.7 88.7 89.8 91.0
Source: PRIMES
78

NMS: Baseline scenario SUMMARY ENERGY BALANCE AND INDICATORS (B)1990 1995 2000 2005 2010 2015 2020 2025 2030 '90-'00 '00-'10 '10-'20 '20-'30
Annual % ChangeMain Energy System IndicatorsPopulation (Million) 75.039 75.204 74.853 74.017 73.401 72.580 71.813 71.278 70.628 0.0 -0.2 -0.2 -0.2GDP (in 000 MEUR'00) 312.8 306.0 374.8 447.4 555.3 681.0 820.6 966.1 1102.7 1.8 4.0 4.0 3.0Gross Inl. Cons./GDP (toe/MEUR'00) 755.2 682.0 525.3 464.6 406.1 356.6 318.7 283.0 260.0 -3.6 -2.5 -2.4 -2.0Gross Inl. Cons./Capita (toe/inhabitant) 3.15 2.77 2.63 2.81 3.07 3.35 3.64 3.84 4.06 -1.8 1.6 1.7 1.1Electricity Generated/Capita (kWh/inhabitant) 4221 3997 4333 4751 5455 6383 7255 8169 8936 0.3 2.3 2.9 2.1Carbon intensity (t of CO2/toe of GIC) 3.00 2.89 2.78 2.69 2.62 2.53 2.40 2.32 2.25 -0.8 -0.6 -0.9 -0.7CO2 Emissions/Capita (t of CO2/inhabitant) 9.43 8.01 7.31 7.54 8.05 8.45 8.74 8.91 9.12 -2.5 1.0 0.8 0.4CO2 Emissions to GDP (t of CO2/MEUR'00) 2262.2 1969.1 1459.6 1248.0 1064.3 900.5 764.7 657.5 584.0 -4.3 -3.1 -3.3 -2.7Import Dependency % 28.7 23.6 30.1 33.8 44.1 50.7 52.0 52.5 53.7 0.0 0.0 0.0 0.0
Energy intensity indicators (1990=100)Industry (Energy on Value added) 100.0 81.2 52.9 41.2 35.2 31.5 28.3 25.7 24.0 -6.2 -4.0 -2.2 -1.6Residential (Energy on Private Income) 100.0 102.6 70.0 64.7 57.1 51.1 46.1 41.7 38.4 -3.5 -2.0 -2.1 -1.8Tertiary (Energy on Value added) 100.0 75.8 65.9 59.4 55.1 51.3 47.2 43.3 40.1 -4.1 -1.8 -1.5 -1.6Transport (Energy on GDP) 100.0 99.4 92.9 94.1 87.3 77.1 69.7 62.5 58.0 -0.7 -0.6 -2.2 -1.8
Carbon Intensity indicatorsElectricity and Steam production (t of CO2/MWh) 0.50 0.49 0.46 0.43 0.41 0.37 0.33 0.30 0.28 -0.8 -1.2 -2.1 -1.8Final energy demand (t of CO2/toe) 2.26 2.18 2.00 1.94 1.86 1.80 1.74 1.69 1.66 -1.2 -0.7 -0.7 -0.5
Industry 2.24 2.35 2.12 2.13 2.04 2.00 1.93 1.86 1.81 -0.5 -0.4 -0.5 -0.6Residential 2.11 1.76 1.45 1.37 1.29 1.22 1.16 1.10 1.06 -3.7 -1.1 -1.1 -0.9Tertiary 2.12 1.98 1.72 1.47 1.35 1.26 1.23 1.21 1.21 -2.0 -2.4 -0.9 -0.2Transport 2.83 2.82 2.84 2.84 2.78 2.76 2.72 2.70 2.69 0.1 -0.2 -0.2 -0.1
Electricity and steam generationGeneration Capacity in MWe 73667 76947 86338 99720 114490 143877 166738 1.6 2.9 3.8
Nuclear 9324 10036 8786 8786 10738 13046 16548 -0.6 2.0 4.4Hydro (pumping excluded) 6374 6583 6820 7074 7350 7649 7805 0.7 0.8 0.6Wind 16 126 2259 4468 6292 10833 16121 64.0 10.8 9.9Solar 0 0 13 61 138 279 537 26.6 14.6Thermal 57953 60201 68459 79332 89973 112070 125726 1.7 2.8 3.4
of which cogeneration units 24415 24622 26172 32389 33412 46071 53985 0.7 2.5 4.9Solids fired 43996 43551 40016 38902 39657 48234 57050 -0.9 -0.1 3.7Gas fired 6071 8079 17486 25497 31585 41763 44754 11.2 6.1 3.5Oil fired 6832 7212 7069 6863 6201 5910 5550 0.3 -1.3 -1.1Biomass-waste fired 1055 1360 3888 8070 12530 16163 18372 13.9 12.4 3.9Fuel Cells 0 0 0 0 0 0 0Geothermal heat 0 0 0 0 0 0 0
IndicatorsEfficiency for thermal electricity production (%) 32.4 32.9 35.2 39.1 40.8 43.7 45.3 0.0 0.0 0.0 0.0Load factor for gross electric capacities (%) 50.3 52.2 52.9 53.0 52.0 46.2 43.2 0.0 0.0 0.0 0.0CHP indicator (% of electricity from CHP) 23.5 25.4 26.7 30.6 31.0 37.8 39.9 0.0 0.0 0.0 0.0Non fossil fuels in electricity generation (%) 23.3 25.6 24.8 25.3 30.3 33.4 37.8 0.0 0.0 0.0 0.0 - nuclear 17.7 19.6 16.7 14.6 16.0 17.4 20.4 0.0 0.0 0.0 0.0 - renewable energy forms 5.6 6.0 8.1 10.7 14.4 16.0 17.4 0.0 0.0 0.0 0.0
Transport sectorPassenger transport activity (Gpkm) 510.7 418.8 468.6 541.4 617.3 686.8 756.2 826.4 901.4 -0.9 2.8 2.0 1.8
Public road transport 135.1 85.6 78.3 75.3 72.6 69.3 66.6 64.5 62.3 -5.3 -0.8 -0.9 -0.7Private cars and motorcycles 263.6 267.4 325.1 396.5 470.7 539.1 606.4 674.1 746.9 2.1 3.8 2.6 2.1Rail 102.1 54.4 51.4 50.8 50.2 49.2 49.0 48.9 48.5 -6.6 -0.2 -0.2 -0.1Aviation 9.0 11.0 13.3 18.1 23.2 28.5 33.5 38.2 42.9 3.9 5.8 3.8 2.5Inland navigation 0.8 0.5 0.6 0.6 0.7 0.7 0.7 0.8 0.8 -3.7 1.4 1.1 1.2
Travel per person (km per capita) 6805 5569 6261 7314 8411 9463 10530 11594 12763 -0.8 3.0 2.3 1.9
Freight transport activity (Gtkm) 334.6 270.6 305.9 361.6 439.1 497.5 557.3 611.9 655.7 -0.9 3.7 2.4 1.6Trucks 119.9 128.4 177.1 227.6 300.9 355.0 412.0 460.8 500.9 4.0 5.4 3.2 2.0Rail 206.8 136.9 124.7 129.8 133.9 138.1 140.8 146.4 150.2 -4.9 0.7 0.5 0.6Inland navigation 7.9 5.3 4.2 4.2 4.3 4.5 4.5 4.6 4.6 -6.1 0.1 0.6 0.2
Freight activity per unit of GDP (tkm/000 Euro'00) 1070 884 816 808 791 731 679 633 595 -2.7 -0.3 -1.5 -1.3
Energy demand in transport (ktoe) 20592 20011 22917 27714 31910 34563 37673 39717 42096 1.1 3.4 1.7 1.1Public road transport 1591 1052 1159 1113 1064 994 917 846 767 -3.1 -0.8 -1.5 -1.8Private cars and motorcycles 8290 9496 11641 13996 14994 15372 16732 17858 19116 3.5 2.6 1.1 1.3Trucks 7093 6579 7453 9508 12463 14633 16340 17557 18672 0.5 5.3 2.7 1.3Rail 2096 1429 1317 1284 1194 1063 973 916 885 -4.5 -1.0 -2.0 -0.9Aviation 1190 1235 1294 1758 2138 2442 2650 2478 2592 0.8 5.1 2.2 -0.2Inland navigation 331 219 54 55 57 59 61 62 63 -16.7 0.6 0.8 0.4
Efficiency indicator (activity related)Passenger transport (toe/Mpkm) 23.9 29.9 31.4 32.2 30.3 28.0 27.3 26.0 25.2 2.8 -0.4 -1.0 -0.8Freight transport (toe/Mtkm) 25.0 27.7 26.7 28.4 30.1 30.8 30.5 29.8 29.5 0.7 1.2 0.1 -0.3
79

EU27: Baseline scenario SUMMARY ENERGY BALANCE AND INDICATORS (A) ktoe 1990 1995 2000 2005 2010 2015 2020 2025 2030 '90-'00 '00-'10 '10-'20 '20-'30
Annual % ChangePrimary Production 928078 938020 937145 925384 878188 785404 751069 737502 732646 0.1 -0.6 -1.6 -0.2
Solids 364706 277576 214324 200799 165876 144497 142989 139456 131524 -5.2 -2.5 -1.5 -0.8Oil 128402 169240 170011 140397 123425 81413 59172 53929 49654 2.8 -3.2 -7.1 -1.7Natural gas 162645 187207 207644 208663 184905 136691 109526 99464 89750 2.5 -1.2 -5.1 -2.0Nuclear 200702 219710 243761 257171 253537 248277 235692 213563 221308 2.0 0.4 -0.7 -0.6Renewable energy sources 71623 84286 101405 118354 150446 174526 203690 231091 240410 3.5 4.0 3.1 1.7
Hydro 25013 27871 30483 30606 31717 33232 34376 35716 36411 2.0 0.4 0.8 0.6Biomass & Waste 43297 52434 65264 76497 97153 113341 134822 151551 155366 4.2 4.1 3.3 1.4Wind 67 351 1913 6493 15835 21151 26401 34464 38131 39.8 23.5 5.2 3.7Solar and others 145 273 417 1053 1514 2104 2873 3740 4621 11.2 13.8 6.6 4.9Geothermal 3101 3357 3329 3705 4226 4697 5218 5619 5882 0.7 2.4 2.1 1.2
Net Imports 749474 728932 817569 923968 1048544 1198619 1271815 1286584 1315329 0.9 2.5 1.9 0.3Solids 81418 79254 98469 120564 137978 137352 137539 163716 184673 1.9 3.4 0.0 3.0Oil 529724 503926 525771 570291 612229 662278 686443 672958 672377 -0.1 1.5 1.2 -0.2 - Crude oil and Feedstocks 503451 488021 507009 533354 577424 630196 657589 648121 651171 0.1 1.3 1.3 -0.1 - Oil products 26273 15905 18762 36938 34805 32082 28854 24837 21206 -3.3 6.4 -1.9 -3.0Natural gas 135011 144366 191643 231213 296722 397437 446247 448264 456537 3.6 4.5 4.2 0.2Electricity 3321 1385 1687 1899 1616 1551 1586 1646 1742 -6.6 -0.4 -0.2 0.9
Gross Inland Consumption 1645474 1640204 1709133 1804134 1878451 1933173 1969846 1969808 1992343 0.4 0.9 0.5 0.1Solids 450795 363877 320708 321363 303853 281849 280529 303172 316196 -3.3 -0.5 -0.8 1.2Oil 624250 641012 648970 665471 687373 692841 692576 672608 666400 0.4 0.6 0.1 -0.4Natural gas 294782 329932 392603 439876 481627 534129 555773 547728 546287 2.9 2.1 1.4 -0.2Nuclear 200702 219710 243761 257171 253537 248277 235692 213563 221308 2.0 0.4 -0.7 -0.6Electricity 3321 1385 1687 1899 1616 1551 1586 1646 1742 -6.6 -0.4 -0.2 0.9Renewable energy forms 71623 84286 101405 118354 150446 174526 203690 231091 240410 3.5 4.0 3.1 1.7
as % in Gross Inland ConsumptionSolids 27.4 22.2 18.8 17.8 16.2 14.6 14.2 15.4 15.9Oil 37.9 39.1 38.0 36.9 36.6 35.8 35.2 34.1 33.4Natural gas 17.9 20.1 23.0 24.4 25.6 27.6 28.2 27.8 27.4Nuclear 12.2 13.4 14.3 14.3 13.5 12.8 12.0 10.8 11.1Renewable energy forms 4.4 5.1 5.9 6.6 8.0 9.0 10.3 11.7 12.1
Electricity Generation in GWhe 2561205 2709317 2993398 3280581 3602166 3903268 4163709 4389940 4564417 1.6 1.9 1.5 0.9Nuclear 794718 881662 944823 996803 982718 962326 913546 827766 857788 1.7 0.4 -0.7 -0.6Hydro & wind 291642 328160 376697 432335 554502 634865 711003 822247 875429 2.6 3.9 2.5 2.1Thermal (incl. biomass) 1474844 1499495 1671878 1851444 2064947 2306078 2539160 2739927 2831200 1.3 2.1 2.1 1.1
Fuel Inputs for Thermal Power Generation (1) 384763 377379 402753 428605 452428 471477 488013 508167 515199 0.5 1.2 0.8 0.5Solids 261342 235033 225135 236712 228093 211023 215547 241799 259237 -1.5 0.1 -0.6 1.9Oil (including refinery gas) 56108 52372 43691 36270 33779 30136 24239 21559 20135 -2.5 -2.5 -3.3 -1.8Gas 54301 72596 109769 126883 157296 188267 189224 172147 160303 7.3 3.7 1.9 -1.6Biomass & Waste 10237 14387 21219 25534 29576 37929 54395 67669 70263 7.6 3.4 6.3 2.6Geothermal heat 2774 2992 2939 3206 3685 4122 4608 4992 5260 0.6 2.3 2.3 1.3Hydrogen - Methanol 0 0 0 0 0 0 0 0 0
Fuel Input in other transformation proc. 840016 811517 818581 807443 838990 849610 854959 837536 832138 -0.3 0.2 0.2 -0.3Refineries 673728 699435 727122 724778 751235 758967 761152 743319 739228 0.8 0.3 0.1 -0.3Biofuels and hydrogen production 2 198 637 5812 16903 23874 31324 35295 37370 81.7 38.8 6.4 1.8District heating 38458 25592 19291 15145 15436 14900 13916 14151 14845 -6.7 -2.2 -1.0 0.6Others 127829 86293 71530 61708 55417 51869 48567 44771 40694 -5.6 -2.5 -1.3 -1.8
Energy Branch Consumption 78427 84509 85834 87372 88586 89251 89354 87688 87066 0.9 0.3 0.1 -0.3Non-Energy Uses 98844 106387 109187 107771 110386 112431 114164 114935 115589 1.0 0.1 0.3 0.1Final Energy Demand 1071205 1072096 1126314 1204719 1281160 1342836 1397188 1425013 1443264 0.5 1.3 0.9 0.3by sectorIndustry(1) 372041 336565 342654 354129 374071 393186 406521 415655 421936 -0.8 0.9 0.8 0.4 - energy intensive industries 239834 217811 220752 225331 233202 240776 244771 245446 245331 -0.8 0.6 0.5 0.0 - other industrial sectors 132206 118754 121902 128797 140869 152411 161750 170210 176605 -0.8 1.5 1.4 0.9Residential 267394 283004 283857 305306 323880 341435 353450 361619 367659 0.6 1.3 0.9 0.4Tertiary 151680 152508 161545 176509 191901 205352 216745 224636 231702 0.6 1.7 1.2 0.7Transport 280091 300019 338258 368776 391309 402862 420473 423103 421967 1.9 1.5 0.7 0.0by fuel (1)
Solids 128087 82530 58191 52735 47320 44410 41610 39700 36490 -7.6 -2.0 -1.3 -1.3Oil 441141 454562 476894 509032 531469 540751 549283 542745 535126 0.8 1.1 0.3 -0.3Gas 219636 238060 259889 278872 290722 310018 326400 334376 342879 1.7 1.1 1.2 0.5Electricity 183815 193410 216343 239627 266586 291321 313482 333253 347894 1.6 2.1 1.6 1.0Heat (from CHP and District Heating) 67635 67360 73194 77688 83923 87726 92529 97050 101232 0.8 1.4 1.0 0.9Other 30892 36175 41802 46766 61141 68610 73884 77890 79643 3.1 3.9 1.9 0.8
CO2 Emissions (Mt of CO2) 4009.9 3804.8 3800.2 3948.5 4042.8 4090.5 4131.6 4164.4 4180.4 -0.5 0.6 0.2 0.1Power generation/District heating 1483.5 1363.5 1359.8 1409.1 1434.1 1423.4 1421.7 1477.0 1514.5 -0.9 0.5 -0.1 0.6Energy Branch 151.1 170.3 154.0 137.2 133.7 130.5 121.8 108.9 103.9 0.2 -1.4 -0.9 -1.6Industry 761.0 649.0 594.1 607.6 611.6 632.3 638.9 631.6 621.5 -2.4 0.3 0.4 -0.3Residential 516.6 492.6 459.7 477.0 493.8 507.1 509.7 505.7 503.5 -1.2 0.7 0.3 -0.1Tertiary 285.7 258.5 247.7 255.0 265.6 274.1 281.2 284.6 288.8 -1.4 0.7 0.6 0.3Transport 812.0 871.0 984.9 1062.6 1103.9 1123.0 1158.4 1156.6 1148.2 1.9 1.1 0.5 -0.1
CO2 Emissions Index (1990=100) 100.0 94.9 94.8 98.5 100.8 102.0 103.0 103.9 104.3
Source: PRIMES
80

EU27: Baseline scenario SUMMARY ENERGY BALANCE AND INDICATORS (B)1990 1995 2000 2005 2010 2015 2020 2025 2030 '90-'00 '00-'10 '10-'20 '20-'30
Annual % ChangeMain Energy System IndicatorsPopulation (Million) 472.712 479.208 483.520 488.141 492.838 495.353 496.408 496.268 494.784 0.2 0.2 0.1 0.0GDP (in 000 MEUR'00) 7358.9 7851.3 9001.0 9786.7 11044.1 12435.4 13825.4 15176.9 16315.6 2.0 2.1 2.3 1.7Gross Inl. Cons./GDP (toe/MEUR'00) 223.6 208.9 189.9 184.3 170.1 155.5 142.5 129.8 122.1 -1.6 -1.1 -1.8 -1.5Gross Inl. Cons./Capita (toe/inhabitant) 3.48 3.42 3.53 3.70 3.81 3.90 3.97 3.97 4.03 0.2 0.8 0.4 0.1Electricity Generated/Capita (kWh/inhabitant) 5418 5654 6191 6721 7309 7880 8388 8846 9225 1.3 1.7 1.4 1.0Carbon intensity (t of CO2/toe of GIC) 2.44 2.32 2.22 2.19 2.15 2.12 2.10 2.11 2.10 -0.9 -0.3 -0.3 0.0CO2 Emissions/Capita (t of CO2/inhabitant) 8.48 7.94 7.86 8.09 8.20 8.26 8.32 8.39 8.45 -0.8 0.4 0.1 0.2CO2 Emissions to GDP (t of CO2/MEUR'00) 544.9 484.6 422.2 403.5 366.1 328.9 298.8 274.4 256.2 -2.5 -1.4 -2.0 -1.5Import Dependency % 44.6 43.5 46.7 50.0 54.4 60.4 62.9 63.6 64.2 0.0 0.0 0.0 0.0
Energy intensity indicators (1990=100)Industry (Energy on Value added) 100.0 88.8 80.2 78.9 74.4 69.5 64.7 60.4 57.2 -2.2 -0.7 -1.4 -1.2Residential (Energy on Private Income) 100.0 100.2 87.2 85.9 81.3 76.6 71.6 66.9 63.3 -1.4 -0.7 -1.3 -1.2Tertiary (Energy on Value added) 100.0 92.2 83.5 82.3 78.2 73.7 69.7 65.6 62.7 -1.8 -0.7 -1.2 -1.1Transport (Energy on GDP) 100.0 100.4 98.7 99.0 93.1 85.1 79.9 73.2 68.0 -0.1 -0.6 -1.5 -1.6
Carbon Intensity indicatorsElectricity and Steam production (t of CO2/MWh) 0.42 0.32 0.30 0.29 0.27 0.25 0.23 0.23 0.23 -3.4 -1.1 -1.3 -0.2Final energy demand (t of CO2/toe) 2.22 2.12 2.03 1.99 1.93 1.89 1.85 1.81 1.78 -0.9 -0.5 -0.4 -0.4
Industry 2.05 1.93 1.73 1.72 1.64 1.61 1.57 1.52 1.47 -1.6 -0.6 -0.4 -0.6Residential 1.93 1.74 1.62 1.56 1.52 1.49 1.44 1.40 1.37 -1.7 -0.6 -0.6 -0.5Tertiary 1.88 1.69 1.53 1.44 1.38 1.33 1.30 1.27 1.25 -2.0 -1.0 -0.6 -0.4Transport 2.90 2.90 2.91 2.88 2.82 2.79 2.76 2.73 2.72 0.0 -0.3 -0.2 -0.1
Electricity and steam generationGeneration Capacity in MWe 697174 761276 849322 904756 983474 1082627 1156317 2.0 1.5 1.6
Nuclear 145542 141046 139130 129300 120769 101344 106437 -0.4 -1.4 -1.3Hydro (pumping excluded) 105185 107708 112376 115565 117881 120580 122169 0.7 0.5 0.4Wind 12786 37721 78806 104167 128956 165782 184504 19.9 5.0 3.6Solar 176 773 1661 2926 4865 7316 10435 25.2 11.3 7.9Thermal 433485 474028 517349 552798 611004 687606 732772 1.8 1.7 1.8
of which cogeneration units 120284 143533 163641 188134 225717 258271 274175 3.1 3.3 2.0Solids fired 203503 201269 170442 155435 172035 207004 231359 -1.8 0.1 3.0Gas fired 135927 176020 254369 296755 329697 359089 379298 6.5 2.6 1.4Oil fired 78309 78993 69886 61947 49151 41779 35330 -1.1 -3.5 -3.2Biomass-waste fired 14723 16400 21295 37264 58603 78132 85141 3.8 10.7 3.8Fuel Cells 0 0 0 0 0 0 0Geothermal heat 1022 1346 1356 1398 1517 1602 1643 2.9 1.1 0.8
IndicatorsEfficiency for thermal electricity production (%) 35.7 37.1 39.3 42.1 44.7 46.4 47.3 0.0 0.0 0.0 0.0Load factor for gross electric capacities (%) 49.0 49.2 48.4 49.2 48.3 46.3 45.1 0.0 0.0 0.0 0.0CHP indicator (% of electricity from CHP) 14.9 16.8 18.6 20.6 22.8 24.9 25.8 0.0 0.0 0.0 0.0Non fossil fuels in electricity generation (%) 46.4 45.9 45.4 44.9 45.2 45.4 45.9 0.0 0.0 0.0 0.0 - nuclear 31.6 30.4 27.3 24.7 21.9 18.9 18.8 0.0 0.0 0.0 0.0 - renewable energy forms 14.9 15.6 18.1 20.3 23.3 26.5 27.2 0.0 0.0 0.0 0.0
Transport sectorPassenger transport activity (Gpkm) 4769.3 5018.9 5568.5 6012.0 6596.0 7118.7 7622.4 8050.7 8424.9 1.6 1.7 1.5 1.0
Public road transport 554.1 486.9 502.3 506.7 517.0 510.1 504.3 499.9 494.1 -1.0 0.3 -0.2 -0.2Private cars and motorcycles 3567.1 3892.5 4316.4 4663.7 5126.4 5550.0 5953.8 6292.8 6587.8 1.9 1.7 1.5 1.0Rail 450.2 393.0 417.8 433.2 457.8 475.3 493.8 511.4 525.9 -0.7 0.9 0.8 0.6Aviation 168.5 214.4 298.4 372.0 455.1 540.7 625.0 698.7 767.6 5.9 4.3 3.2 2.1Inland navigation 29.4 32.1 33.6 36.4 39.8 42.6 45.5 47.9 49.6 1.4 1.7 1.4 0.9
Travel per person (km per capita) 10089 10473 11517 12316 13384 14371 15355 16222 17027 1.3 1.5 1.4 1.0
Freight transport activity (Gtkm) 1861.5 1920.2 2177.1 2401.3 2684.8 2942.2 3201.9 3439.8 3645.7 1.6 2.1 1.8 1.3Trucks 1075.1 1259.8 1507.0 1705.7 1959.0 2188.7 2425.3 2638.3 2824.3 3.4 2.7 2.2 1.5Rail 524.7 391.3 396.1 409.3 426.2 437.8 446.4 457.5 466.3 -2.8 0.7 0.5 0.4Inland navigation 261.8 269.0 274.0 286.4 299.6 315.6 330.2 343.9 355.2 0.5 0.9 1.0 0.7
Freight activity per unit of GDP (tkm/000 Euro'00) 253 245 242 245 243 237 232 227 223 -0.4 0.1 -0.5 -0.4
Energy demand in transport (ktoe) 280091 300019 338258 368776 391309 402862 420473 423103 421967 1.9 1.5 0.7 0.0Public road transport 8685 7391 7514 7490 7472 7149 6705 6217 5744 -1.4 -0.1 -1.1 -1.5Private cars and motorcycles 139578 147445 160719 172431 173934 168809 174088 172337 166303 1.4 0.8 0.0 -0.5Trucks 85770 94640 109568 123331 140448 154712 164460 171191 174680 2.5 2.5 1.6 0.6Rail 9564 9428 9423 9296 8613 7518 6791 6437 6303 -0.1 -0.9 -2.3 -0.7Aviation 29449 34172 45553 50354 54627 58162 61692 60014 61893 4.5 1.8 1.2 0.0Inland navigation 7044 6942 5481 5873 6214 6514 6737 6907 7044 -2.5 1.3 0.8 0.4
Efficiency indicator (activity related)Passenger transport (toe/Mpkm) 38.9 39.3 39.8 39.6 36.9 33.8 32.6 30.3 28.4 0.2 -0.8 -1.2 -1.4Freight transport (toe/Mtkm) 50.8 53.6 53.6 54.5 55.2 55.2 53.7 52.0 50.0 0.5 0.3 -0.3 -0.7
81

EU28: Baseline scenario SUMMARY ENERGY BALANCE AND INDICATORS (A) ktoe 1990 1995 2000 2005 2010 2015 2020 2025 2030 '90-'00 '00-'10 '10-'20 '20-'30
Annual % ChangePrimary Production 961237 971332 963855 949867 904300 814520 785743 779660 778720 0.0 -0.6 -1.4 -0.1
Solids 377116 289659 227617 211133 176410 155640 156642 153922 146412 -4.9 -2.5 -1.2 -0.7Oil 132112 172754 172757 143400 126669 84749 62553 57470 53393 2.7 -3.1 -6.8 -1.6Natural gas 162820 187357 208170 209446 185979 137963 110881 100863 91171 2.5 -1.1 -5.0 -1.9Nuclear 200702 219710 243761 257171 253537 248277 235692 216634 224776 2.0 0.4 -0.7 -0.5Renewable energy sources 88487 101851 111549 128717 161705 187890 219974 250772 262969 2.3 3.8 3.1 1.8
Hydro 27003 30927 33138 33683 34865 36422 37905 39674 40561 2.1 0.5 0.8 0.7Biomass & Waste 57710 66289 71804 82393 103167 119972 142260 159411 164211 2.2 3.7 3.3 1.4Wind 67 351 1916 6496 15990 21836 27141 35711 39431 39.9 23.6 5.4 3.8Solar and others 173 416 679 1490 2308 3702 6049 8780 11240 14.7 13.0 10.1 6.4Geothermal 3534 3868 4012 4656 5374 5957 6618 7197 7526 1.3 3.0 2.1 1.3
Net Imports 776740 765690 868442 982559 1119134 1286206 1379216 1413836 1468801 1.1 2.6 2.1 0.6Solids 85626 83731 107717 132925 150658 151829 153372 181432 205792 2.3 3.4 0.2 3.0Oil 550163 530603 555056 598547 645214 704083 738261 734929 744299 0.1 1.5 1.4 0.1 - Crude oil and Feedstocks 523502 512705 528467 559600 608081 669100 705860 705882 718230 0.1 1.4 1.5 0.2 - Oil products 26661 17897 26589 38947 37133 34983 32402 29047 26069 0.0 3.4 -1.4 -2.2Natural gas 137693 150031 203694 249608 321962 428934 486228 496107 517279 4.0 4.7 4.2 0.6Electricity 3259 1326 1975 1480 1300 1360 1354 1369 1431 -4.9 -4.1 0.4 0.6
Gross Inland Consumption 1704962 1709019 1786487 1886769 1974654 2049308 2111280 2138512 2191112 0.5 1.0 0.7 0.4Solids 467717 380493 343986 344058 327069 307469 310014 335353 352204 -3.0 -0.5 -0.5 1.3Oil 647159 669920 679975 696290 723103 737414 747137 737414 741283 0.5 0.6 0.3 -0.1Natural gas 297637 335719 405241 459054 507941 566897 597110 596969 608450 3.1 2.3 1.6 0.2Nuclear 200702 219710 243761 257171 253537 248277 235692 216634 224776 2.0 0.4 -0.7 -0.5Electricity 3259 1326 1975 1480 1300 1360 1354 1369 1431 -4.9 -4.1 0.4 0.6Renewable energy forms 88487 101851 111549 128717 161705 187890 219974 250772 262969 2.3 3.8 3.1 1.8
as % in Gross Inland ConsumptionSolids 27.4 22.3 19.3 18.2 16.6 15.0 14.7 15.7 16.1Oil 38.0 39.2 38.1 36.9 36.6 36.0 35.4 34.5 33.8Natural gas 17.5 19.6 22.7 24.3 25.7 27.7 28.3 27.9 27.8Nuclear 11.8 12.9 13.6 13.6 12.8 12.1 11.2 10.1 10.3Renewable energy forms 5.2 6.0 6.2 6.8 8.2 9.2 10.4 11.7 12.0
Electricity Generation in GWhe 2618738 2795549 3118298 3430887 3775103 4113380 4422523 4714412 4963897 1.8 1.9 1.6 1.2Nuclear 794718 881662 944823 996803 982718 962326 913546 839673 871232 1.7 0.4 -0.7 -0.5Hydro & wind 314786 363695 407604 468147 592902 679932 760682 882864 938982 2.6 3.8 2.5 2.1Thermal (incl. biomass) 1509233 1550192 1765871 1965937 2199483 2471123 2748295 2991874 3153683 1.6 2.2 2.3 1.4
Fuel Inputs for Thermal Power Generation (1) 393649 390037 424378 452340 480159 504125 527532 552846 568901 0.8 1.2 0.9 0.8Solids 266482 242206 235098 245797 238223 224893 234625 265184 287006 -1.2 0.1 -0.2 2.0Oil (including refinery gas) 57294 54164 46624 38410 35722 31670 25335 22539 21045 -2.0 -2.6 -3.4 -1.8Gas 56793 75937 118348 139224 172262 204504 207199 190673 183397 7.6 3.8 1.9 -1.2Biomass & Waste 10237 14665 21304 25638 30073 38743 55571 69171 71905 7.6 3.5 6.3 2.6Geothermal heat 2842 3066 3004 3271 3878 4315 4801 5279 5547 0.6 2.6 2.2 1.5Hydrogen - Methanol 0 0 0 0 0 0 0 0 0
Fuel Input in other transformation proc. 867592 842853 846345 840284 876250 895026 909900 902234 906641 -0.2 0.3 0.4 0.0Refineries 696742 726784 750941 754026 785135 801205 812804 804621 810026 0.8 0.4 0.3 0.0Biofuels and hydrogen production 2 198 637 5825 16993 24058 31598 35832 38296 81.7 38.9 6.4 1.9District heating 38458 25592 19291 15154 15473 14980 14042 14337 15063 -6.7 -2.2 -1.0 0.7Others 132391 90279 75474 65279 58650 54783 51455 47445 43256 -5.5 -2.5 -1.3 -1.7
Energy Branch Consumption 80396 86970 88538 90136 91565 92661 93313 92184 92090 1.0 0.3 0.2 -0.1Non-Energy Uses 101612 110138 112692 111057 113777 116161 118150 119173 120128 1.0 0.1 0.4 0.2Final Energy Demand 1109885 1116883 1180941 1266305 1355060 1434365 1511283 1563708 1608521 0.6 1.4 1.1 0.6by sectorIndustry(1) 384219 349928 363322 377662 401247 426239 447312 466118 483829 -0.6 1.0 1.1 0.8 - energy intensive industries 245670 223935 228215 233078 241512 249999 255205 257207 258730 -0.7 0.6 0.6 0.1 - other industrial sectors 138549 125993 135107 144584 159735 176240 192107 208911 225100 -0.3 1.7 1.9 1.6Residential 281949 298788 300854 322409 343318 364475 381810 395505 407701 0.7 1.3 1.1 0.7Tertiary 154275 156259 166339 182765 200607 216471 230572 240798 249511 0.8 1.9 1.4 0.8Transport 289441 311908 350426 383468 409888 427181 451588 461287 467480 1.9 1.6 1.0 0.3by fuel (1)
Solids 136126 89200 68674 64555 58766 54660 50566 47178 43484 -6.6 -1.5 -1.5 -1.5Oil 458929 476865 499706 533770 561617 579954 598847 602480 604853 0.9 1.2 0.6 0.1Gas 220792 240696 264489 286517 302714 327127 350309 365416 382020 1.8 1.4 1.5 0.9Electricity 187680 199010 224587 249383 278868 306749 333047 357802 378239 1.8 2.2 1.8 1.3Heat (from CHP and District Heating) 67875 67607 74443 78201 84707 88817 94030 100337 105248 0.9 1.3 1.0 1.1Other 38483 43506 49041 53879 68388 77059 84484 90496 94677 2.5 3.4 2.1 1.1
CO2 Emissions (Mt of CO2) 4136.3 3955.5 3998.9 4164.4 4291.9 4389.6 4494.7 4585.8 4675.9 -0.3 0.7 0.5 0.4Power generation/District heating 1515.0 1407.2 1431.1 1482.5 1517.4 1523.5 1545.7 1619.4 1684.8 -0.6 0.6 0.2 0.9Energy Branch 155.8 176.0 159.9 140.1 135.6 131.8 122.3 109.4 104.4 0.3 -1.6 -1.0 -1.6Industry 796.2 684.6 650.1 673.6 684.3 715.7 735.5 741.6 752.0 -2.0 0.5 0.7 0.2Residential 538.0 515.1 481.6 497.9 519.3 537.9 548.1 552.0 557.1 -1.1 0.8 0.5 0.2Tertiary 291.5 266.2 255.8 264.7 277.5 287.4 295.2 297.8 300.4 -1.3 0.8 0.6 0.2Transport 839.9 906.4 1020.5 1105.5 1157.9 1193.2 1247.9 1265.6 1277.2 2.0 1.3 0.8 0.2
CO2 Emissions Index (1990=100) 100.0 95.6 96.7 100.7 103.8 106.1 108.7 110.9 113.0
Source: PRIMES
82

EU28: Baseline scenario SUMMARY ENERGY BALANCE AND INDICATORS (B)1990 1995 2000 2005 2010 2015 2020 2025 2030 '90-'00 '00-'10 '10-'20 '20-'30
Annual % ChangeMain Energy System IndicatorsPopulation (Million) 528.913 540.852 550.981 561.107 569.992 577.012 582.152 585.758 587.546 0.4 0.3 0.2 0.1GDP (in 000 MEUR'00) 7511.4 8029.9 9217.8 10045.5 11370.5 12870.0 14408.7 15963.1 17374.7 2.1 2.1 2.4 1.9Gross Inl. Cons./GDP (toe/MEUR'00) 227.0 212.8 193.8 187.8 173.7 159.2 146.5 134.0 126.1 -1.6 -1.1 -1.7 -1.5Gross Inl. Cons./Capita (toe/inhabitant) 3.22 3.16 3.24 3.36 3.46 3.55 3.63 3.65 3.73 0.1 0.7 0.5 0.3Electricity Generated/Capita (kWh/inhabitant) 4951 5169 5660 6114 6623 7129 7597 8048 8449 1.3 1.6 1.4 1.1Carbon intensity (t of CO2/toe of GIC) 2.43 2.31 2.24 2.21 2.17 2.14 2.13 2.14 2.13 -0.8 -0.3 -0.2 0.0CO2 Emissions/Capita (t of CO2/inhabitant) 7.82 7.31 7.26 7.42 7.53 7.61 7.72 7.83 7.96 -0.7 0.4 0.3 0.3CO2 Emissions to GDP (t of CO2/MEUR'00) 550.7 492.6 433.8 414.5 377.5 341.1 311.9 287.3 269.1 -2.4 -1.4 -1.9 -1.5Import Dependency % 44.6 43.9 47.5 50.8 55.3 61.2 63.7 64.5 65.4 0.0 0.0 0.0 0.0
Energy intensity indicators (1990=100)Industry (Energy on Value added) 100.0 89.0 81.8 80.5 75.9 71.1 66.5 62.4 59.4 -2.0 -0.7 -1.3 -1.1Residential (Energy on Private Income) 100.0 100.1 87.3 85.6 81.1 76.5 71.8 67.3 63.7 -1.3 -0.7 -1.2 -1.2Tertiary (Energy on Value added) 100.0 92.7 84.3 83.3 79.8 75.4 71.5 67.2 63.8 -1.7 -0.6 -1.1 -1.1Transport (Energy on GDP) 100.0 100.8 98.7 99.1 93.6 86.1 81.3 75.0 69.8 -0.1 -0.5 -1.4 -1.5
Carbon Intensity indicatorsElectricity and Steam production (t of CO2/MWh) 0.42 0.32 0.30 0.29 0.27 0.25 0.24 0.24 0.24 -3.3 -1.1 -1.2 -0.2Final energy demand (t of CO2/toe) 2.22 2.12 2.04 2.01 1.95 1.91 1.87 1.83 1.79 -0.9 -0.5 -0.4 -0.4
Industry 2.07 1.96 1.79 1.78 1.71 1.68 1.64 1.59 1.55 -1.5 -0.5 -0.4 -0.6Residential 1.91 1.72 1.60 1.54 1.51 1.48 1.44 1.40 1.37 -1.7 -0.6 -0.5 -0.5Tertiary 1.89 1.70 1.54 1.45 1.38 1.33 1.28 1.24 1.20 -2.0 -1.0 -0.8 -0.6Transport 2.90 2.91 2.91 2.88 2.82 2.79 2.76 2.74 2.73 0.0 -0.3 -0.2 -0.1
Electricity and steam generationGeneration Capacity in MWe 725459 798968 888823 952097 1038085 1153379 1245126 2.1 1.6 1.8
Nuclear 145542 141046 139130 129300 120769 102863 108151 -0.4 -1.4 -1.1Hydro (pumping excluded) 116592 119140 123933 127232 130164 133679 135818 0.6 0.5 0.4Wind 12806 37742 79419 107210 132281 173143 192255 20.0 5.2 3.8Solar 176 773 1661 2934 4896 7392 10583 25.2 11.4 8.0Thermal 450343 500267 544679 585421 649976 736302 798319 1.9 1.8 2.1
of which cogeneration units 122684 147283 168563 194584 235740 273710 291862 3.2 3.4 2.2Solids fired 210547 211491 180534 166807 184691 225468 257503 -1.5 0.2 3.4Gas fired 143140 188667 267609 314808 352798 385681 414417 6.5 2.8 1.6Oil fired 80801 82201 73455 64378 51245 43909 37297 -0.9 -3.5 -3.1Biomass-waste fired 14814 16544 21657 37962 59658 79549 87367 3.9 10.7 3.9Fuel Cells 0 0 0 0 0 0 0Geothermal heat 1040 1364 1424 1466 1585 1695 1736 3.2 1.1 0.9
IndicatorsEfficiency for thermal electricity production (%) 35.8 37.4 39.4 42.2 44.8 46.5 47.7 0.0 0.0 0.0 0.0Load factor for gross electric capacities (%) 49.1 49.0 48.5 49.3 48.6 46.7 45.5 0.0 0.0 0.0 0.0CHP indicator (% of electricity from CHP) 14.8 16.4 18.2 20.3 22.4 24.8 25.2 0.0 0.0 0.0 0.0Non fossil fuels in electricity generation (%) 45.6 45.0 44.4 43.8 43.8 43.9 44.0 0.0 0.0 0.0 0.0 - nuclear 30.3 29.1 26.0 23.4 20.7 17.8 17.6 0.0 0.0 0.0 0.0 - renewable energy forms 15.3 15.9 18.4 20.4 23.1 26.1 26.4 0.0 0.0 0.0 0.0
Transport sectorPassenger transport activity (Gpkm) 4881.2 5172.8 5752.9 6236.3 6897.2 7572.3 8264.9 8920.2 9494.4 1.7 1.8 1.8 1.4
Public road transport 618.4 572.6 589.7 600.8 618.6 625.8 625.6 621.6 606.3 -0.5 0.5 0.1 -0.3Private cars and motorcycles 3601.6 3945.4 4397.4 4775.2 5300.7 5847.2 6413.0 6950.9 7427.6 2.0 1.9 1.9 1.5Rail 456.6 398.8 423.6 439.6 466.3 488.7 514.3 541.6 565.3 -0.7 1.0 1.0 0.9Aviation 170.7 219.9 304.7 379.9 466.6 560.6 656.6 745.8 832.2 6.0 4.4 3.5 2.4Inland navigation 33.9 36.2 37.4 40.8 45.0 50.1 55.4 60.2 63.2 1.0 1.9 2.1 1.3
Travel per person (km per capita) 9229 9564 10441 11114 12101 13123 14197 15228 16159 1.2 1.5 1.6 1.3
Freight transport activity (Gtkm) 1958.3 2045.6 2352.3 2610.7 2947.4 3272.5 3612.0 3933.3 4231.4 1.8 2.3 2.1 1.6Trucks 1159.5 1372.3 1668.6 1900.5 2204.3 2497.6 2809.2 3100.6 3373.6 3.7 2.8 2.5 1.8Rail 532.6 399.8 405.9 419.6 438.0 452.7 464.8 479.8 492.6 -2.7 0.8 0.6 0.6Inland navigation 266.3 273.4 277.8 290.7 305.0 322.2 338.0 352.9 365.2 0.4 0.9 1.0 0.8
Freight activity per unit of GDP (tkm/000 Euro'00) 261 255 255 260 259 254 251 246 244 -0.2 0.2 -0.3 -0.3
Energy demand in transport (ktoe) 289441 311908 350426 383468 409888 427181 451588 461287 467480 1.9 1.6 1.0 0.3Public road transport 9634 8675 8758 8829 8910 8754 8328 7774 7119 -0.9 0.2 -0.7 -1.6Private cars and motorcycles 140266 148596 162549 174947 177484 174201 182335 183985 180977 1.5 0.9 0.3 -0.1Trucks 92511 102453 116941 132219 151618 168592 181004 190256 196719 2.4 2.6 1.8 0.8Rail 9807 9704 9691 9562 8882 7786 7084 6794 6741 -0.1 -0.9 -2.2 -0.5Aviation 29928 35322 46814 51820 56512 60982 65656 65041 68301 4.6 1.9 1.5 0.4Inland navigation 7295 7157 5673 6091 6483 6866 7181 7437 7623 -2.5 1.3 1.0 0.6
Efficiency indicator (activity related)Passenger transport (toe/Mpkm) 38.5 38.9 39.3 39.1 36.3 33.1 31.8 29.5 27.7 0.2 -0.8 -1.3 -1.4Freight transport (toe/Mtkm) 51.8 54.2 52.8 53.6 54.1 53.9 52.3 50.4 48.4 0.2 0.2 -0.3 -0.8
83
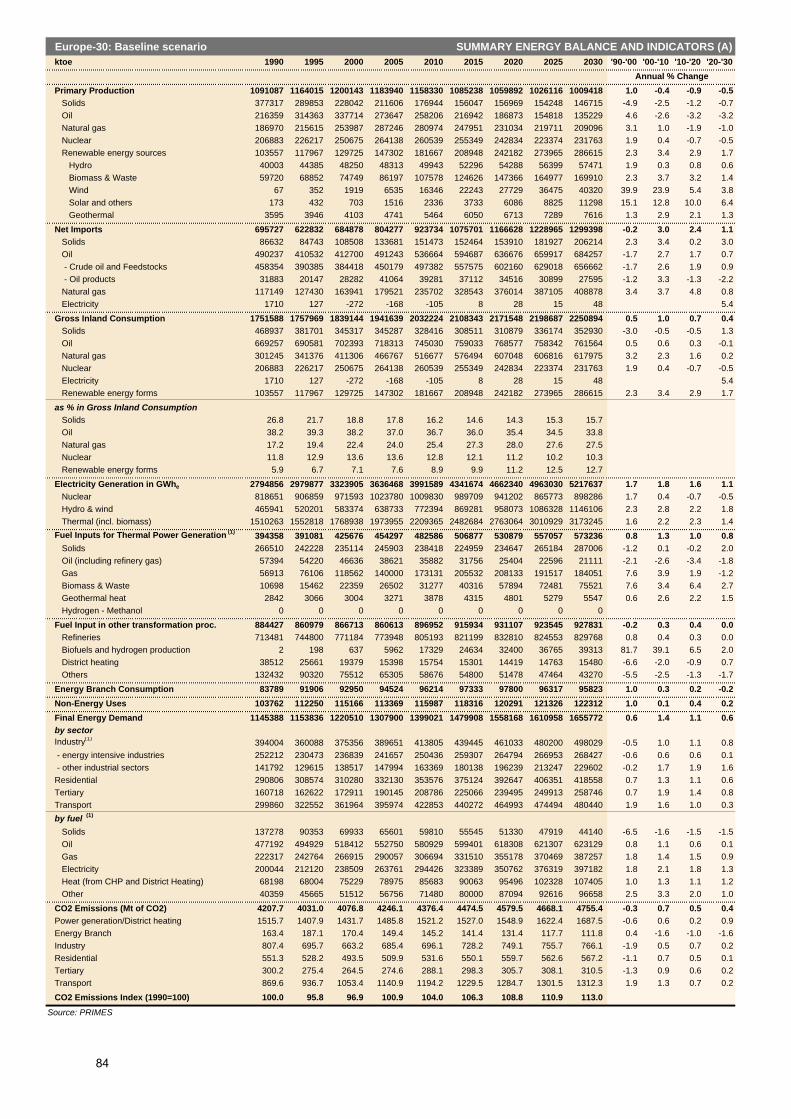
Europe-30: Baseline scenario SUMMARY ENERGY BALANCE AND INDICATORS (A) ktoe 1990 1995 2000 2005 2010 2015 2020 2025 2030 '90-'00 '00-'10 '10-'20 '20-'30
Annual % ChangePrimary Production 1091087 1164015 1200143 1183940 1158330 1085238 1059892 1026116 1009418 1.0 -0.4 -0.9 -0.5
Solids 377317 289853 228042 211606 176944 156047 156969 154248 146715 -4.9 -2.5 -1.2 -0.7Oil 216359 314363 337714 273647 258206 216942 186873 154818 135229 4.6 -2.6 -3.2 -3.2Natural gas 186970 215615 253987 287246 280974 247951 231034 219711 209096 3.1 1.0 -1.9 -1.0Nuclear 206883 226217 250675 264138 260539 255349 242834 223374 231763 1.9 0.4 -0.7 -0.5Renewable energy sources 103557 117967 129725 147302 181667 208948 242182 273965 286615 2.3 3.4 2.9 1.7
Hydro 40003 44385 48250 48313 49943 52296 54288 56399 57471 1.9 0.3 0.8 0.6Biomass & Waste 59720 68852 74749 86197 107578 124626 147366 164977 169910 2.3 3.7 3.2 1.4Wind 67 352 1919 6535 16346 22243 27729 36475 40320 39.9 23.9 5.4 3.8Solar and others 173 432 703 1516 2336 3733 6086 8825 11298 15.1 12.8 10.0 6.4Geothermal 3595 3946 4103 4741 5464 6050 6713 7289 7616 1.3 2.9 2.1 1.3
Net Imports 695727 622832 684878 804277 923734 1075701 1166628 1228965 1299398 -0.2 3.0 2.4 1.1Solids 86632 84743 108508 133681 151473 152464 153910 181927 206214 2.3 3.4 0.2 3.0Oil 490237 410532 412700 491243 536664 594687 636676 659917 684257 -1.7 2.7 1.7 0.7 - Crude oil and Feedstocks 458354 390385 384418 450179 497382 557575 602160 629018 656662 -1.7 2.6 1.9 0.9 - Oil products 31883 20147 28282 41064 39281 37112 34516 30899 27595 -1.2 3.3 -1.3 -2.2Natural gas 117149 127430 163941 179521 235702 328543 376014 387105 408878 3.4 3.7 4.8 0.8Electricity 1710 127 -272 -168 -105 8 28 15 48 5.4
Gross Inland Consumption 1751588 1757969 1839144 1941639 2032224 2108343 2171548 2198687 2250894 0.5 1.0 0.7 0.4Solids 468937 381701 345317 345287 328416 308511 310879 336174 352930 -3.0 -0.5 -0.5 1.3Oil 669257 690581 702393 718313 745030 759033 768577 758342 761564 0.5 0.6 0.3 -0.1Natural gas 301245 341376 411306 466767 516677 576494 607048 606816 617975 3.2 2.3 1.6 0.2Nuclear 206883 226217 250675 264138 260539 255349 242834 223374 231763 1.9 0.4 -0.7 -0.5Electricity 1710 127 -272 -168 -105 8 28 15 48 5.4Renewable energy forms 103557 117967 129725 147302 181667 208948 242182 273965 286615 2.3 3.4 2.9 1.7
as % in Gross Inland ConsumptionSolids 26.8 21.7 18.8 17.8 16.2 14.6 14.3 15.3 15.7Oil 38.2 39.3 38.2 37.0 36.7 36.0 35.4 34.5 33.8Natural gas 17.2 19.4 22.4 24.0 25.4 27.3 28.0 27.6 27.5Nuclear 11.8 12.9 13.6 13.6 12.8 12.1 11.2 10.2 10.3Renewable energy forms 5.9 6.7 7.1 7.6 8.9 9.9 11.2 12.5 12.7
Electricity Generation in GWhe 2794856 2979877 3323905 3636468 3991589 4341674 4662340 4963030 5217637 1.7 1.8 1.6 1.1Nuclear 818651 906859 971593 1023780 1009830 989709 941202 865773 898286 1.7 0.4 -0.7 -0.5Hydro & wind 465941 520201 583374 638733 772394 869281 958073 1086328 1146106 2.3 2.8 2.2 1.8Thermal (incl. biomass) 1510263 1552818 1768938 1973955 2209365 2482684 2763064 3010929 3173245 1.6 2.2 2.3 1.4
Fuel Inputs for Thermal Power Generation (1) 394358 391081 425676 454297 482586 506877 530879 557057 573236 0.8 1.3 1.0 0.8Solids 266510 242228 235114 245903 238418 224959 234647 265184 287006 -1.2 0.1 -0.2 2.0Oil (including refinery gas) 57394 54220 46636 38621 35882 31756 25404 22596 21111 -2.1 -2.6 -3.4 -1.8Gas 56913 76106 118562 140000 173131 205532 208133 191517 184051 7.6 3.9 1.9 -1.2Biomass & Waste 10698 15462 22359 26502 31277 40316 57894 72481 75521 7.6 3.4 6.4 2.7Geothermal heat 2842 3066 3004 3271 3878 4315 4801 5279 5547 0.6 2.6 2.2 1.5Hydrogen - Methanol 0 0 0 0 0 0 0 0 0
Fuel Input in other transformation proc. 884427 860979 866713 860613 896952 915934 931107 923545 927831 -0.2 0.3 0.4 0.0Refineries 713481 744800 771184 773948 805193 821199 832810 824553 829768 0.8 0.4 0.3 0.0Biofuels and hydrogen production 2 198 637 5962 17329 24634 32400 36765 39313 81.7 39.1 6.5 2.0District heating 38512 25661 19379 15398 15754 15301 14419 14763 15480 -6.6 -2.0 -0.9 0.7Others 132432 90320 75512 65305 58676 54800 51478 47464 43270 -5.5 -2.5 -1.3 -1.7
Energy Branch Consumption 83789 91906 92950 94524 96214 97333 97800 96317 95823 1.0 0.3 0.2 -0.2Non-Energy Uses 103762 112250 115166 113369 115987 118316 120291 121326 122312 1.0 0.1 0.4 0.2Final Energy Demand 1145388 1153836 1220510 1307900 1399021 1479908 1558168 1610958 1655772 0.6 1.4 1.1 0.6by sectorIndustry(1) 394004 360088 375356 389651 413805 439445 461033 480200 498029 -0.5 1.0 1.1 0.8 - energy intensive industries 252212 230473 236839 241657 250436 259307 264794 266953 268427 -0.6 0.6 0.6 0.1 - other industrial sectors 141792 129615 138517 147994 163369 180138 196239 213247 229602 -0.2 1.7 1.9 1.6Residential 290806 308574 310280 332130 353576 375124 392647 406351 418558 0.7 1.3 1.1 0.6Tertiary 160718 162622 172911 190145 208786 225066 239495 249913 258746 0.7 1.9 1.4 0.8Transport 299860 322552 361964 395974 422853 440272 464993 474494 480440 1.9 1.6 1.0 0.3by fuel (1)
Solids 137278 90353 69933 65601 59810 55545 51330 47919 44140 -6.5 -1.6 -1.5 -1.5Oil 477192 494929 518412 552750 580929 599401 618308 621307 623129 0.8 1.1 0.6 0.1Gas 222317 242764 266915 290057 306694 331510 355178 370469 387257 1.8 1.4 1.5 0.9Electricity 200044 212120 238509 263761 294426 323389 350762 376319 397182 1.8 2.1 1.8 1.3Heat (from CHP and District Heating) 68198 68004 75229 78975 85683 90063 95496 102328 107405 1.0 1.3 1.1 1.2Other 40359 45665 51512 56756 71480 80000 87094 92616 96658 2.5 3.3 2.0 1.0
CO2 Emissions (Mt of CO2) 4207.7 4031.0 4076.8 4246.1 4376.4 4474.5 4579.5 4668.1 4755.4 -0.3 0.7 0.5 0.4Power generation/District heating 1515.7 1407.9 1431.7 1485.8 1521.2 1527.0 1548.9 1622.4 1687.5 -0.6 0.6 0.2 0.9Energy Branch 163.4 187.1 170.4 149.4 145.2 141.4 131.4 117.7 111.8 0.4 -1.6 -1.0 -1.6Industry 807.4 695.7 663.2 685.4 696.1 728.2 749.1 755.7 766.1 -1.9 0.5 0.7 0.2Residential 551.3 528.2 493.5 509.9 531.6 550.1 559.7 562.6 567.2 -1.1 0.7 0.5 0.1Tertiary 300.2 275.4 264.5 274.6 288.1 298.3 305.7 308.1 310.5 -1.3 0.9 0.6 0.2Transport 869.6 936.7 1053.4 1140.9 1194.2 1229.5 1284.7 1301.5 1312.3 1.9 1.3 0.7 0.2
CO2 Emissions Index (1990=100) 100.0 95.8 96.9 100.9 104.0 106.3 108.8 110.9 113.0
Source: PRIMES
84
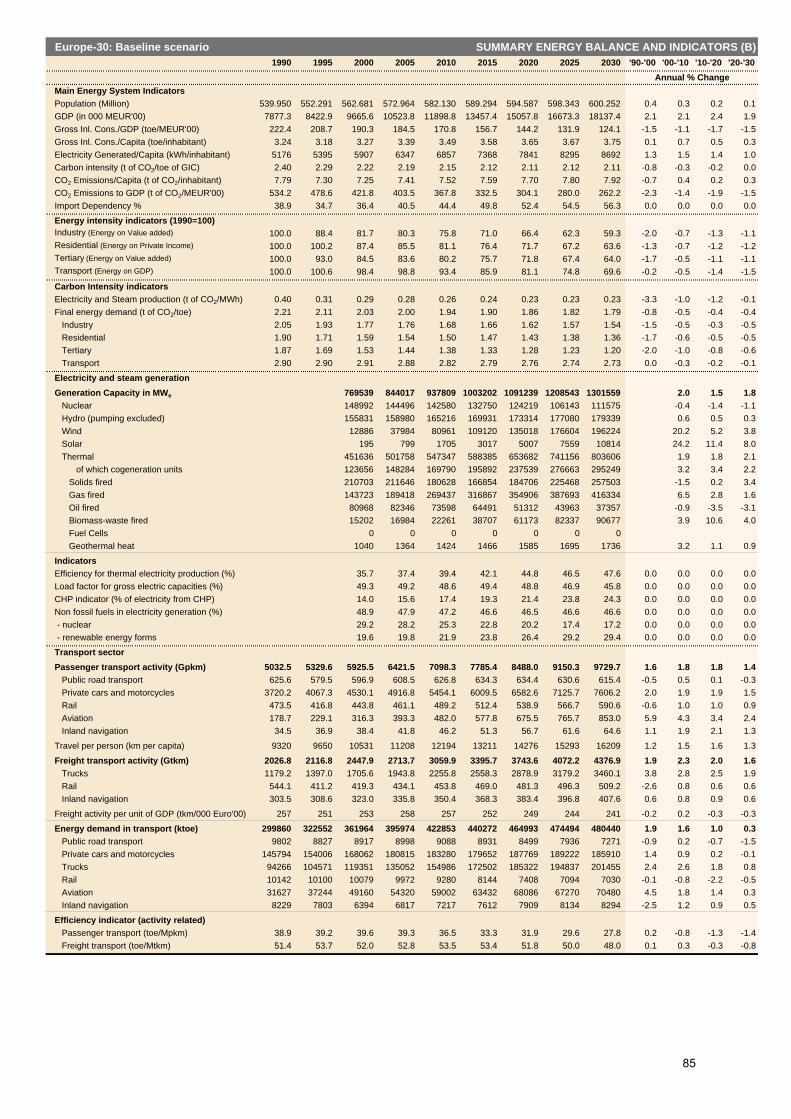
Europe-30: Baseline scenario SUMMARY ENERGY BALANCE AND INDICATORS (B)1990 1995 2000 2005 2010 2015 2020 2025 2030 '90-'00 '00-'10 '10-'20 '20-'30
Annual % ChangeMain Energy System IndicatorsPopulation (Million) 539.950 552.291 562.681 572.964 582.130 589.294 594.587 598.343 600.252 0.4 0.3 0.2 0.1GDP (in 000 MEUR'00) 7877.3 8422.9 9665.6 10523.8 11898.8 13457.4 15057.8 16673.3 18137.4 2.1 2.1 2.4 1.9Gross Inl. Cons./GDP (toe/MEUR'00) 222.4 208.7 190.3 184.5 170.8 156.7 144.2 131.9 124.1 -1.5 -1.1 -1.7 -1.5Gross Inl. Cons./Capita (toe/inhabitant) 3.24 3.18 3.27 3.39 3.49 3.58 3.65 3.67 3.75 0.1 0.7 0.5 0.3Electricity Generated/Capita (kWh/inhabitant) 5176 5395 5907 6347 6857 7368 7841 8295 8692 1.3 1.5 1.4 1.0Carbon intensity (t of CO2/toe of GIC) 2.40 2.29 2.22 2.19 2.15 2.12 2.11 2.12 2.11 -0.8 -0.3 -0.2 0.0CO2 Emissions/Capita (t of CO2/inhabitant) 7.79 7.30 7.25 7.41 7.52 7.59 7.70 7.80 7.92 -0.7 0.4 0.2 0.3CO2 Emissions to GDP (t of CO2/MEUR'00) 534.2 478.6 421.8 403.5 367.8 332.5 304.1 280.0 262.2 -2.3 -1.4 -1.9 -1.5Import Dependency % 38.9 34.7 36.4 40.5 44.4 49.8 52.4 54.5 56.3 0.0 0.0 0.0 0.0
Energy intensity indicators (1990=100)Industry (Energy on Value added) 100.0 88.4 81.7 80.3 75.8 71.0 66.4 62.3 59.3 -2.0 -0.7 -1.3 -1.1Residential (Energy on Private Income) 100.0 100.2 87.4 85.5 81.1 76.4 71.7 67.2 63.6 -1.3 -0.7 -1.2 -1.2Tertiary (Energy on Value added) 100.0 93.0 84.5 83.6 80.2 75.7 71.8 67.4 64.0 -1.7 -0.5 -1.1 -1.1Transport (Energy on GDP) 100.0 100.6 98.4 98.8 93.4 85.9 81.1 74.8 69.6 -0.2 -0.5 -1.4 -1.5
Carbon Intensity indicatorsElectricity and Steam production (t of CO2/MWh) 0.40 0.31 0.29 0.28 0.26 0.24 0.23 0.23 0.23 -3.3 -1.0 -1.2 -0.1Final energy demand (t of CO2/toe) 2.21 2.11 2.03 2.00 1.94 1.90 1.86 1.82 1.79 -0.8 -0.5 -0.4 -0.4
Industry 2.05 1.93 1.77 1.76 1.68 1.66 1.62 1.57 1.54 -1.5 -0.5 -0.3 -0.5Residential 1.90 1.71 1.59 1.54 1.50 1.47 1.43 1.38 1.36 -1.7 -0.6 -0.5 -0.5Tertiary 1.87 1.69 1.53 1.44 1.38 1.33 1.28 1.23 1.20 -2.0 -1.0 -0.8 -0.6Transport 2.90 2.90 2.91 2.88 2.82 2.79 2.76 2.74 2.73 0.0 -0.3 -0.2 -0.1
Electricity and steam generationGeneration Capacity in MWe 769539 844017 937809 1003202 1091239 1208543 1301559 2.0 1.5 1.8
Nuclear 148992 144496 142580 132750 124219 106143 111575 -0.4 -1.4 -1.1Hydro (pumping excluded) 155831 158980 165216 169931 173314 177080 179339 0.6 0.5 0.3Wind 12886 37984 80961 109120 135018 176604 196224 20.2 5.2 3.8Solar 195 799 1705 3017 5007 7559 10814 24.2 11.4 8.0Thermal 451636 501758 547347 588385 653682 741156 803606 1.9 1.8 2.1
of which cogeneration units 123656 148284 169790 195892 237539 276663 295249 3.2 3.4 2.2Solids fired 210703 211646 180628 166854 184706 225468 257503 -1.5 0.2 3.4Gas fired 143723 189418 269437 316867 354906 387693 416334 6.5 2.8 1.6Oil fired 80968 82346 73598 64491 51312 43963 37357 -0.9 -3.5 -3.1Biomass-waste fired 15202 16984 22261 38707 61173 82337 90677 3.9 10.6 4.0Fuel Cells 0 0 0 0 0 0 0Geothermal heat 1040 1364 1424 1466 1585 1695 1736 3.2 1.1 0.9
IndicatorsEfficiency for thermal electricity production (%) 35.7 37.4 39.4 42.1 44.8 46.5 47.6 0.0 0.0 0.0 0.0Load factor for gross electric capacities (%) 49.3 49.2 48.6 49.4 48.8 46.9 45.8 0.0 0.0 0.0 0.0CHP indicator (% of electricity from CHP) 14.0 15.6 17.4 19.3 21.4 23.8 24.3 0.0 0.0 0.0 0.0Non fossil fuels in electricity generation (%) 48.9 47.9 47.2 46.6 46.5 46.6 46.6 0.0 0.0 0.0 0.0 - nuclear 29.2 28.2 25.3 22.8 20.2 17.4 17.2 0.0 0.0 0.0 0.0 - renewable energy forms 19.6 19.8 21.9 23.8 26.4 29.2 29.4 0.0 0.0 0.0 0.0
Transport sectorPassenger transport activity (Gpkm) 5032.5 5329.6 5925.5 6421.5 7098.3 7785.4 8488.0 9150.3 9729.7 1.6 1.8 1.8 1.4
Public road transport 625.6 579.5 596.9 608.5 626.8 634.3 634.4 630.6 615.4 -0.5 0.5 0.1 -0.3Private cars and motorcycles 3720.2 4067.3 4530.1 4916.8 5454.1 6009.5 6582.6 7125.7 7606.2 2.0 1.9 1.9 1.5Rail 473.5 416.8 443.8 461.1 489.2 512.4 538.9 566.7 590.6 -0.6 1.0 1.0 0.9Aviation 178.7 229.1 316.3 393.3 482.0 577.8 675.5 765.7 853.0 5.9 4.3 3.4 2.4Inland navigation 34.5 36.9 38.4 41.8 46.2 51.3 56.7 61.6 64.6 1.1 1.9 2.1 1.3
Travel per person (km per capita) 9320 9650 10531 11208 12194 13211 14276 15293 16209 1.2 1.5 1.6 1.3
Freight transport activity (Gtkm) 2026.8 2116.8 2447.9 2713.7 3059.9 3395.7 3743.6 4072.2 4376.9 1.9 2.3 2.0 1.6Trucks 1179.2 1397.0 1705.6 1943.8 2255.8 2558.3 2878.9 3179.2 3460.1 3.8 2.8 2.5 1.9Rail 544.1 411.2 419.3 434.1 453.8 469.0 481.3 496.3 509.2 -2.6 0.8 0.6 0.6Inland navigation 303.5 308.6 323.0 335.8 350.4 368.3 383.4 396.8 407.6 0.6 0.8 0.9 0.6
Freight activity per unit of GDP (tkm/000 Euro'00) 257 251 253 258 257 252 249 244 241 -0.2 0.2 -0.3 -0.3
Energy demand in transport (ktoe) 299860 322552 361964 395974 422853 440272 464993 474494 480440 1.9 1.6 1.0 0.3Public road transport 9802 8827 8917 8998 9088 8931 8499 7936 7271 -0.9 0.2 -0.7 -1.5Private cars and motorcycles 145794 154006 168062 180815 183280 179652 187769 189222 185910 1.4 0.9 0.2 -0.1Trucks 94266 104571 119351 135052 154986 172502 185322 194837 201455 2.4 2.6 1.8 0.8Rail 10142 10100 10079 9972 9280 8144 7408 7094 7030 -0.1 -0.8 -2.2 -0.5Aviation 31627 37244 49160 54320 59002 63432 68086 67270 70480 4.5 1.8 1.4 0.3Inland navigation 8229 7803 6394 6817 7217 7612 7909 8134 8294 -2.5 1.2 0.9 0.5
Efficiency indicator (activity related)Passenger transport (toe/Mpkm) 38.9 39.2 39.6 39.3 36.5 33.3 31.9 29.6 27.8 0.2 -0.8 -1.3 -1.4Freight transport (toe/Mtkm) 51.4 53.7 52.0 52.8 53.5 53.4 51.8 50.0 48.0 0.1 0.3 -0.3 -0.8
85
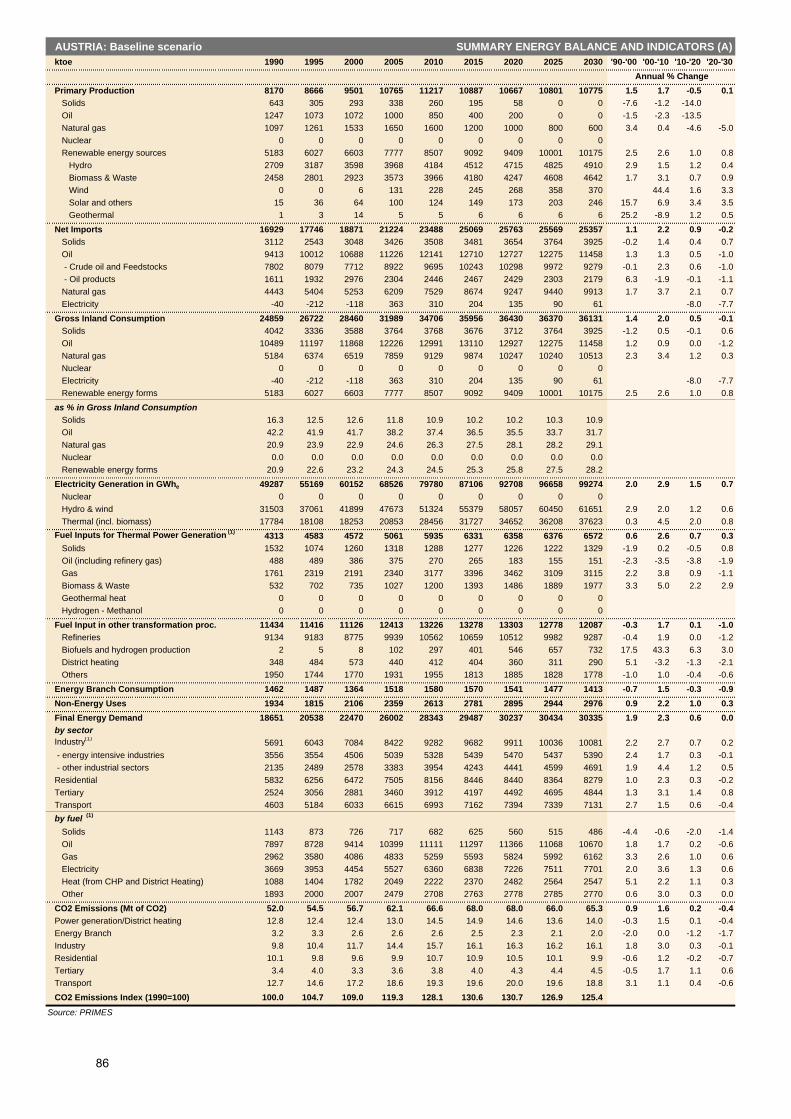
AUSTRIA: Baseline scenario SUMMARY ENERGY BALANCE AND INDICATORS (A) ktoe 1990 1995 2000 2005 2010 2015 2020 2025 2030 '90-'00 '00-'10 '10-'20 '20-'30
Annual % ChangePrimary Production 8170 8666 9501 10765 11217 10887 10667 10801 10775 1.5 1.7 -0.5 0.1
Solids 643 305 293 338 260 195 58 0 0 -7.6 -1.2 -14.0Oil 1247 1073 1072 1000 850 400 200 0 0 -1.5 -2.3 -13.5Natural gas 1097 1261 1533 1650 1600 1200 1000 800 600 3.4 0.4 -4.6 -5.0Nuclear 0 0 0 0 0 0 0 0 0Renewable energy sources 5183 6027 6603 7777 8507 9092 9409 10001 10175 2.5 2.6 1.0 0.8
Hydro 2709 3187 3598 3968 4184 4512 4715 4825 4910 2.9 1.5 1.2 0.4Biomass & Waste 2458 2801 2923 3573 3966 4180 4247 4608 4642 1.7 3.1 0.7 0.9Wind 0 0 6 131 228 245 268 358 370 44.4 1.6 3.3Solar and others 15 36 64 100 124 149 173 203 246 15.7 6.9 3.4 3.5Geothermal 1 3 14 5 5 6 6 6 6 25.2 -8.9 1.2 0.5
Net Imports 16929 17746 18871 21224 23488 25069 25763 25569 25357 1.1 2.2 0.9 -0.2Solids 3112 2543 3048 3426 3508 3481 3654 3764 3925 -0.2 1.4 0.4 0.7Oil 9413 10012 10688 11226 12141 12710 12727 12275 11458 1.3 1.3 0.5 -1.0 - Crude oil and Feedstocks 7802 8079 7712 8922 9695 10243 10298 9972 9279 -0.1 2.3 0.6 -1.0 - Oil products 1611 1932 2976 2304 2446 2467 2429 2303 2179 6.3 -1.9 -0.1 -1.1Natural gas 4443 5404 5253 6209 7529 8674 9247 9440 9913 1.7 3.7 2.1 0.7Electricity -40 -212 -118 363 310 204 135 90 61 -8.0 -7.7
Gross Inland Consumption 24859 26722 28460 31989 34706 35956 36430 36370 36131 1.4 2.0 0.5 -0.1Solids 4042 3336 3588 3764 3768 3676 3712 3764 3925 -1.2 0.5 -0.1 0.6Oil 10489 11197 11868 12226 12991 13110 12927 12275 11458 1.2 0.9 0.0 -1.2Natural gas 5184 6374 6519 7859 9129 9874 10247 10240 10513 2.3 3.4 1.2 0.3Nuclear 0 0 0 0 0 0 0 0 0Electricity -40 -212 -118 363 310 204 135 90 61 -8.0 -7.7Renewable energy forms 5183 6027 6603 7777 8507 9092 9409 10001 10175 2.5 2.6 1.0 0.8
as % in Gross Inland ConsumptionSolids 16.3 12.5 12.6 11.8 10.9 10.2 10.2 10.3 10.9Oil 42.2 41.9 41.7 38.2 37.4 36.5 35.5 33.7 31.7Natural gas 20.9 23.9 22.9 24.6 26.3 27.5 28.1 28.2 29.1Nuclear 0.0 0.0 0.0 0.0 0.0 0.0 0.0 0.0 0.0Renewable energy forms 20.9 22.6 23.2 24.3 24.5 25.3 25.8 27.5 28.2
Electricity Generation in GWhe 49287 55169 60152 68526 79780 87106 92708 96658 99274 2.0 2.9 1.5 0.7Nuclear 0 0 0 0 0 0 0 0 0Hydro & wind 31503 37061 41899 47673 51324 55379 58057 60450 61651 2.9 2.0 1.2 0.6Thermal (incl. biomass) 17784 18108 18253 20853 28456 31727 34652 36208 37623 0.3 4.5 2.0 0.8
Fuel Inputs for Thermal Power Generation (1) 4313 4583 4572 5061 5935 6331 6358 6376 6572 0.6 2.6 0.7 0.3Solids 1532 1074 1260 1318 1288 1277 1226 1222 1329 -1.9 0.2 -0.5 0.8Oil (including refinery gas) 488 489 386 375 270 265 183 155 151 -2.3 -3.5 -3.8 -1.9Gas 1761 2319 2191 2340 3177 3396 3462 3109 3115 2.2 3.8 0.9 -1.1Biomass & Waste 532 702 735 1027 1200 1393 1486 1889 1977 3.3 5.0 2.2 2.9Geothermal heat 0 0 0 0 0 0 0 0 0Hydrogen - Methanol 0 0 0 0 0 0 0 0 0
Fuel Input in other transformation proc. 11434 11416 11126 12413 13226 13278 13303 12778 12087 -0.3 1.7 0.1 -1.0Refineries 9134 9183 8775 9939 10562 10659 10512 9982 9287 -0.4 1.9 0.0 -1.2Biofuels and hydrogen production 2 5 8 102 297 401 546 657 732 17.5 43.3 6.3 3.0District heating 348 484 573 440 412 404 360 311 290 5.1 -3.2 -1.3 -2.1Others 1950 1744 1770 1931 1955 1813 1885 1828 1778 -1.0 1.0 -0.4 -0.6
Energy Branch Consumption 1462 1487 1364 1518 1580 1570 1541 1477 1413 -0.7 1.5 -0.3 -0.9Non-Energy Uses 1934 1815 2106 2359 2613 2781 2895 2944 2976 0.9 2.2 1.0 0.3Final Energy Demand 18651 20538 22470 26002 28343 29487 30237 30434 30335 1.9 2.3 0.6 0.0by sectorIndustry(1) 5691 6043 7084 8422 9282 9682 9911 10036 10081 2.2 2.7 0.7 0.2 - energy intensive industries 3556 3554 4506 5039 5328 5439 5470 5437 5390 2.4 1.7 0.3 -0.1 - other industrial sectors 2135 2489 2578 3383 3954 4243 4441 4599 4691 1.9 4.4 1.2 0.5Residential 5832 6256 6472 7505 8156 8446 8440 8364 8279 1.0 2.3 0.3 -0.2Tertiary 2524 3056 2881 3460 3912 4197 4492 4695 4844 1.3 3.1 1.4 0.8Transport 4603 5184 6033 6615 6993 7162 7394 7339 7131 2.7 1.5 0.6 -0.4by fuel (1)
Solids 1143 873 726 717 682 625 560 515 486 -4.4 -0.6 -2.0 -1.4Oil 7897 8728 9414 10399 11111 11297 11366 11068 10670 1.8 1.7 0.2 -0.6Gas 2962 3580 4086 4833 5259 5593 5824 5992 6162 3.3 2.6 1.0 0.6Electricity 3669 3953 4454 5527 6360 6838 7226 7511 7701 2.0 3.6 1.3 0.6Heat (from CHP and District Heating) 1088 1404 1782 2049 2222 2370 2482 2564 2547 5.1 2.2 1.1 0.3Other 1893 2000 2007 2479 2708 2763 2778 2785 2770 0.6 3.0 0.3 0.0
CO2 Emissions (Mt of CO2) 52.0 54.5 56.7 62.1 66.6 68.0 68.0 66.0 65.3 0.9 1.6 0.2 -0.4Power generation/District heating 12.8 12.4 12.4 13.0 14.5 14.9 14.6 13.6 14.0 -0.3 1.5 0.1 -0.4Energy Branch 3.2 3.3 2.6 2.6 2.6 2.5 2.3 2.1 2.0 -2.0 0.0 -1.2 -1.7Industry 9.8 10.4 11.7 14.4 15.7 16.1 16.3 16.2 16.1 1.8 3.0 0.3 -0.1Residential 10.1 9.8 9.6 9.9 10.7 10.9 10.5 10.1 9.9 -0.6 1.2 -0.2 -0.7Tertiary 3.4 4.0 3.3 3.6 3.8 4.0 4.3 4.4 4.5 -0.5 1.7 1.1 0.6Transport 12.7 14.6 17.2 18.6 19.3 19.6 20.0 19.6 18.8 3.1 1.1 0.4 -0.6
CO2 Emissions Index (1990=100) 100.0 104.7 109.0 119.3 128.1 130.6 130.7 126.9 125.4
Source: PRIMES
86

AUSTRIA: Baseline scenario SUMMARY ENERGY BALANCE AND INDICATORS (B)1990 1995 2000 2005 2010 2015 2020 2025 2030 '90-'00 '00-'10 '10-'20 '20-'30
Annual % ChangeMain Energy System IndicatorsPopulation (Million) 7.678 7.948 8.012 8.174 8.256 8.358 8.441 8.501 8.520 0.4 0.3 0.2 0.1GDP (in 000 MEUR'00) 163.5 182.0 210.4 225.0 254.6 282.3 309.0 334.6 353.9 2.6 1.9 2.0 1.4Gross Inl. Cons./GDP (toe/MEUR'00) 152.0 146.8 135.3 142.2 136.3 127.4 117.9 108.7 102.1 -1.2 0.1 -1.4 -1.4Gross Inl. Cons./Capita (toe/inhabitant) 3.24 3.36 3.55 3.91 4.20 4.30 4.32 4.28 4.24 0.9 1.7 0.3 -0.2Electricity Generated/Capita (kWh/inhabitant) 6419 6941 7508 8383 9664 10422 10983 11371 11652 1.6 2.6 1.3 0.6Carbon intensity (t of CO2/toe of GIC) 2.09 2.04 1.99 1.94 1.92 1.89 1.87 1.82 1.81 -0.5 -0.4 -0.3 -0.3CO2 Emissions/Capita (t of CO2/inhabitant) 6.78 6.86 7.08 7.59 8.07 8.13 8.06 7.77 7.66 0.4 1.3 0.0 -0.5CO2 Emissions to GDP (t of CO2/MEUR'00) 318.1 299.3 269.5 275.8 261.7 240.7 220.1 197.3 184.4 -1.6 -0.3 -1.7 -1.8Import Dependency % 68.1 66.4 66.3 66.3 67.7 69.7 70.7 70.3 70.2 0.0 0.0 0.0 0.0
Energy intensity indicators (1990=100)Industry (Energy on Value added) 100.0 101.1 95.2 101.3 96.8 90.5 84.3 78.6 74.5 -0.5 0.2 -1.4 -1.2Residential (Energy on Private Income) 100.0 96.7 89.8 99.4 95.7 89.6 82.0 75.2 70.5 -1.1 0.6 -1.5 -1.5Tertiary (Energy on Value added) 100.0 107.4 89.2 101.5 101.3 97.6 95.2 91.7 89.3 -1.1 1.3 -0.6 -0.6Transport (Energy on GDP) 100.0 101.2 101.9 104.5 97.6 90.1 85.0 77.9 71.6 0.2 -0.4 -1.4 -1.7
Carbon Intensity indicatorsElectricity and Steam production (t of CO2/MWh) 0.20 0.17 0.15 0.14 0.13 0.13 0.12 0.11 0.11 -3.1 -1.1 -1.3 -1.0Final energy demand (t of CO2/toe) 1.93 1.89 1.85 1.79 1.75 1.72 1.69 1.65 1.63 -0.4 -0.6 -0.3 -0.4
Industry 1.71 1.72 1.65 1.71 1.69 1.67 1.64 1.61 1.60 -0.4 0.3 -0.3 -0.3Residential 1.74 1.56 1.48 1.32 1.32 1.29 1.25 1.21 1.19 -1.6 -1.1 -0.5 -0.5Tertiary 1.35 1.32 1.13 1.03 0.98 0.96 0.95 0.94 0.94 -1.8 -1.4 -0.3 -0.1Transport 2.75 2.82 2.85 2.81 2.75 2.73 2.70 2.67 2.63 0.3 -0.3 -0.2 -0.3
Electricity and steam generationGeneration Capacity in MWe 18995 21359 24393 24006 25470 28265 29250 2.5 0.4 1.4
Nuclear 0 0 0 0 0 0 0Hydro (pumping excluded) 10867 11737 12344 13114 13574 13759 13894 1.3 1.0 0.2Wind 77 745 1372 1465 1622 2323 2385 33.4 1.7 3.9Solar 7 14 51 128 250 396 560 22.4 17.3 8.4Thermal 8044 8864 10627 9299 10024 11787 12411 2.8 -0.6 2.2
of which cogeneration units 4157 4658 6010 5814 6600 6883 6675 3.8 0.9 0.1Solids fired 4170 4170 4170 2919 1076 1312 1425 0.0 -12.7 2.9Gas fired 2800 3566 5329 5138 6853 7625 7932 6.6 2.5 1.5Oil fired 684 684 648 419 194 168 168 -0.5 -11.4 -1.4Biomass-waste fired 390 443 480 823 1901 2682 2887 2.1 14.7 4.3Fuel Cells 0 0 0 0 0 0 0Geothermal heat 0 0 0 0 0 0 0
IndicatorsEfficiency for thermal electricity production (%) 34.3 35.4 41.2 43.1 46.9 48.8 49.2 0.0 0.0 0.0 0.0Load factor for gross electric capacities (%) 36.1 36.6 37.3 41.4 41.6 39.0 38.7 0.0 0.0 0.0 0.0CHP indicator (% of electricity from CHP) 24.1 26.8 26.7 26.7 30.6 31.9 31.0 0.0 0.0 0.0 0.0Non fossil fuels in electricity generation (%) 72.6 72.4 67.8 68.8 69.8 73.2 73.1 0.0 0.0 0.0 0.0 - nuclear 0.0 0.0 0.0 0.0 0.0 0.0 0.0 0.0 0.0 0.0 0.0 - renewable energy forms 72.6 72.4 67.8 68.8 69.8 73.2 73.1 0.0 0.0 0.0 0.0
Transport sectorPassenger transport activity (Gpkm) 86.1 95.7 99.5 108.4 117.0 125.3 133.2 140.1 145.5 1.5 1.6 1.3 0.9
Public road transport 8.7 10.5 13.1 13.4 13.5 13.6 13.8 14.0 14.0 4.2 0.3 0.3 0.2Private cars and motorcycles 63.9 69.3 70.9 76.9 83.0 89.1 94.9 99.9 103.7 1.0 1.6 1.4 0.9Rail 10.8 12.2 11.0 12.2 13.3 13.8 14.2 14.6 14.8 0.1 2.0 0.7 0.4Aviation 2.6 3.7 4.6 5.9 7.3 8.8 10.2 11.7 12.9 5.9 4.7 3.5 2.4Inland navigation 0.0 0.0 0.0 0.0 0.0 0.0 0.0 0.0 0.0 0.0 0.9 0.6 0.5
Travel per person (km per capita) 11213 12041 12425 13267 14172 14996 15780 16480 17080 1.0 1.3 1.1 0.8
Freight transport activity (Gtkm) 34.1 41.7 54.2 58.1 65.3 70.6 75.5 79.8 83.1 4.7 1.9 1.5 1.0Trucks 20.3 26.5 35.1 37.8 42.6 46.9 51.0 54.7 57.6 5.6 2.0 1.8 1.2Rail 12.2 13.2 16.6 17.8 19.9 20.6 20.9 21.1 21.2 3.2 1.8 0.5 0.1Inland navigation 1.7 2.0 2.4 2.6 2.8 3.2 3.6 4.0 4.3 3.9 1.4 2.4 1.8
Freight activity per unit of GDP (tkm/000 Euro'00) 209 229 257 258 257 250 244 238 235 2.1 0.0 -0.5 -0.4
Energy demand in transport (ktoe) 4603 5184 6033 6615 6993 7162 7394 7339 7131 2.7 1.5 0.6 -0.4Public road transport 45 47 48 49 49 48 46 43 39 0.7 0.2 -0.5 -1.6Private cars and motorcycles 2536 2705 2901 3155 3125 3013 3086 3082 2933 1.4 0.7 -0.1 -0.5Trucks 1349 1672 2163 2323 2617 2843 2974 3052 3016 4.8 1.9 1.3 0.1Rail 357 292 328 354 359 327 298 280 271 -0.8 0.9 -1.9 -0.9Aviation 310 461 586 727 835 924 982 872 862 6.6 3.6 1.6 -1.3Inland navigation 7 6 6 6 7 8 9 9 10 -1.5 1.4 2.2 1.6
Efficiency indicator (activity related)Passenger transport (toe/Mpkm) 36.8 36.0 38.0 38.8 36.6 33.8 32.6 30.1 27.8 0.3 -0.4 -1.2 -1.6Freight transport (toe/Mtkm) 42.2 41.6 41.5 41.5 41.5 41.5 40.4 39.2 37.1 -0.2 0.0 -0.3 -0.8
87

BELGIUM: Baseline scenario SUMMARY ENERGY BALANCE AND INDICATORS (A) ktoe 1990 1995 2000 2005 2010 2015 2020 2025 2030 '90-'00 '00-'10 '10-'20 '20-'30
Annual % ChangePrimary Production 12528 11421 13471 13716 14461 13495 11267 5408 2895 0.7 0.7 -2.5 -12.7
Solids 1085 269 191 0 0 0 0 0 0 -16.0Oil 0 0 0 0 0 0 0 0 0Natural gas 10 0 2 0 0 0 0 0 0 -14.3Nuclear 10707 10340 12422 12673 12926 11582 8914 2621 0 1.5 0.4 -3.6Renewable energy sources 727 812 856 1042 1534 1914 2353 2788 2895 1.6 6.0 4.4 2.1
Hydro 23 29 39 39 39 39 39 39 39 5.6 0.0 0.0 0.0Biomass & Waste 701 780 810 975 1252 1576 1945 2250 2279 1.4 4.4 4.5 1.6Wind 1 1 1 16 221 259 312 423 483 7.9 67.3 3.5 4.5Solar and others 1 1 1 7 16 31 47 65 83 2.1 31.5 11.5 5.9Geothermal 1 1 4 5 6 9 10 10 10 14.0 5.3 4.4 0.2
Net Imports 38857 43690 48547 51075 51785 52364 53288 57040 58971 2.3 0.6 0.3 1.0Solids 9492 9343 7566 7018 6390 5119 5267 9228 11227 -2.2 -1.7 -1.9 7.9Oil 21468 23579 27331 28658 29230 29171 28733 28214 27822 2.4 0.7 -0.2 -0.3 - Crude oil and Feedstocks 26116 25674 32658 31208 32082 32234 31991 31641 31317 2.3 -0.2 0.0 -0.2 - Oil products -4648 -2096 -5328 -2550 -2853 -3063 -3258 -3427 -3495Natural gas 8217 10418 13278 14752 15547 17549 18840 19216 19598 4.9 1.6 1.9 0.4Electricity -320 350 372 647 618 526 448 381 325 5.2 -3.2 -3.2
Gross Inland Consumption 47257 50459 57168 59213 60367 59740 58253 56056 55336 1.9 0.5 -0.4 -0.5Solids 10244 8551 8200 7018 6390 5119 5267 9228 11227 -2.2 -2.5 -1.9 7.9Oil 17730 19794 21949 23080 23351 23052 22430 21822 21291 2.2 0.6 -0.4 -0.5Natural gas 8169 10611 13369 14752 15547 17549 18840 19216 19598 5.0 1.5 1.9 0.4Nuclear 10707 10340 12422 12673 12926 11582 8914 2621 0 1.5 0.4 -3.6Electricity -320 350 372 647 618 526 448 381 325 5.2 -3.2 -3.2Renewable energy forms 727 812 856 1042 1534 1914 2353 2788 2895 1.6 6.0 4.4 2.1
as % in Gross Inland ConsumptionSolids 21.7 16.9 14.3 11.9 10.6 8.6 9.0 16.5 20.3Oil 37.5 39.2 38.4 39.0 38.7 38.6 38.5 38.9 38.5Natural gas 17.3 21.0 23.4 24.9 25.8 29.4 32.3 34.3 35.4Nuclear 22.7 20.5 21.7 21.4 21.4 19.4 15.3 4.7 0.0Renewable energy forms 1.5 1.6 1.5 1.8 2.5 3.2 4.0 5.0 5.2
Electricity Generation in GWhe 70202 73524 82639 85931 93963 99557 104617 108396 111713 1.6 1.3 1.1 0.7Nuclear 42714 41349 48148 49120 50103 44891 34551 10158 0 1.2 0.4 -3.6Hydro & wind 274 347 474 649 3035 3489 4114 5416 6128 5.6 20.4 3.1 4.1Thermal (incl. biomass) 27214 31828 34017 36161 40825 51177 65952 92822 105585 2.3 1.8 4.9 4.8
Fuel Inputs for Thermal Power Generation (1) 6839 7438 7876 8186 8371 8972 10301 14897 17205 1.4 0.6 2.1 5.3Solids 3879 3767 3030 2826 2781 1820 2219 6421 8639 -2.4 -0.9 -2.2 14.6Oil (including refinery gas) 318 222 172 272 144 144 136 129 123 -6.0 -1.7 -0.6 -1.0Gas 2239 2967 4186 4495 4753 6210 6983 7140 7215 6.5 1.3 3.9 0.3Biomass & Waste 403 482 488 592 693 798 964 1206 1228 1.9 3.6 3.4 2.4Geothermal heat 0 0 0 0 0 0 0 0 0Hydrogen - Methanol 0 0 0 0 0 0 0 0 0
Fuel Input in other transformation proc. 35153 32956 40739 36868 37284 37213 36721 35990 35365 1.5 -0.9 -0.2 -0.4Refineries 29036 28632 37085 33627 34298 34230 33717 33110 32650 2.5 -0.8 -0.2 -0.3Biofuels and hydrogen production 0 0 0 44 255 515 778 904 953 11.8 2.1District heating 8 5 41 0 0 2 3 2 3 17.9 -50.6 58.1 -2.1Others 6109 4320 3612 3197 2731 2466 2222 1975 1760 -5.1 -2.8 -2.0 -2.3
Energy Branch Consumption 2310 2273 2370 2349 2337 2277 2219 2188 2158 0.3 -0.1 -0.5 -0.3Non-Energy Uses 2739 3289 5814 5326 5337 5203 5097 5044 5044 7.8 -0.9 -0.5 -0.1Final Energy Demand 31355 34576 37055 38640 39971 40757 41208 41079 40942 1.7 0.8 0.3 -0.1by sectorIndustry(1) 11944 12197 13769 13765 13991 14150 14093 13939 13833 1.4 0.2 0.1 -0.2 - energy intensive industries 9288 9255 10195 9767 9627 9563 9365 9071 8811 0.9 -0.6 -0.3 -0.6 - other industrial sectors 2656 2942 3573 3998 4364 4587 4728 4868 5021 3.0 2.0 0.8 0.6Residential 8337 9295 9465 9963 10314 10456 10324 10151 10018 1.3 0.9 0.0 -0.3Tertiary 3370 4604 4158 4468 4850 5150 5455 5607 5782 2.1 1.5 1.2 0.6Transport 7704 8480 9662 10444 10817 11001 11336 11382 11309 2.3 1.1 0.5 0.0by fuel (1)
Solids 3783 3303 3373 2839 2454 2267 2145 2029 1913 -1.1 -3.1 -1.3 -1.1Oil 14734 16248 16038 17202 17517 17343 17012 16549 16102 0.9 0.9 -0.3 -0.5Gas 6993 8272 9615 9798 10266 10747 11013 11080 11266 3.2 0.7 0.7 0.2Electricity 4986 5885 6667 7187 7825 8231 8606 8845 9052 2.9 1.6 1.0 0.5Heat (from CHP and District Heating) 566 573 1046 1230 1387 1466 1556 1623 1634 6.3 2.9 1.2 0.5Other 293 295 316 385 521 702 876 952 975 0.8 5.1 5.3 1.1
CO2 Emissions (Mt of CO2) 105.9 112.0 114.7 115.6 115.9 115.2 117.3 132.2 139.4 0.8 0.1 0.1 1.7Power generation/District heating 22.4 23.6 23.5 23.5 23.4 22.9 26.2 43.0 51.8 0.5 0.0 1.1 7.1Energy Branch 5.3 5.1 5.3 4.7 4.7 4.7 4.5 4.4 4.2 0.0 -1.1 -0.5 -0.7Industry 29.3 27.9 29.1 27.1 26.0 25.6 24.9 24.0 23.5 -0.1 -1.1 -0.4 -0.6Residential 18.7 20.1 20.0 20.4 20.8 20.7 19.8 18.9 18.3 0.7 0.4 -0.5 -0.8Tertiary 7.5 10.4 8.2 9.0 9.4 9.8 10.1 10.1 10.3 0.9 1.5 0.7 0.2Transport 22.6 24.9 28.6 30.8 31.5 31.5 31.9 31.7 31.3 2.4 1.0 0.1 -0.2
CO2 Emissions Index (1990=100) 100.0 105.8 108.3 109.2 109.5 108.8 110.8 124.8 131.6
Source: PRIMES
88
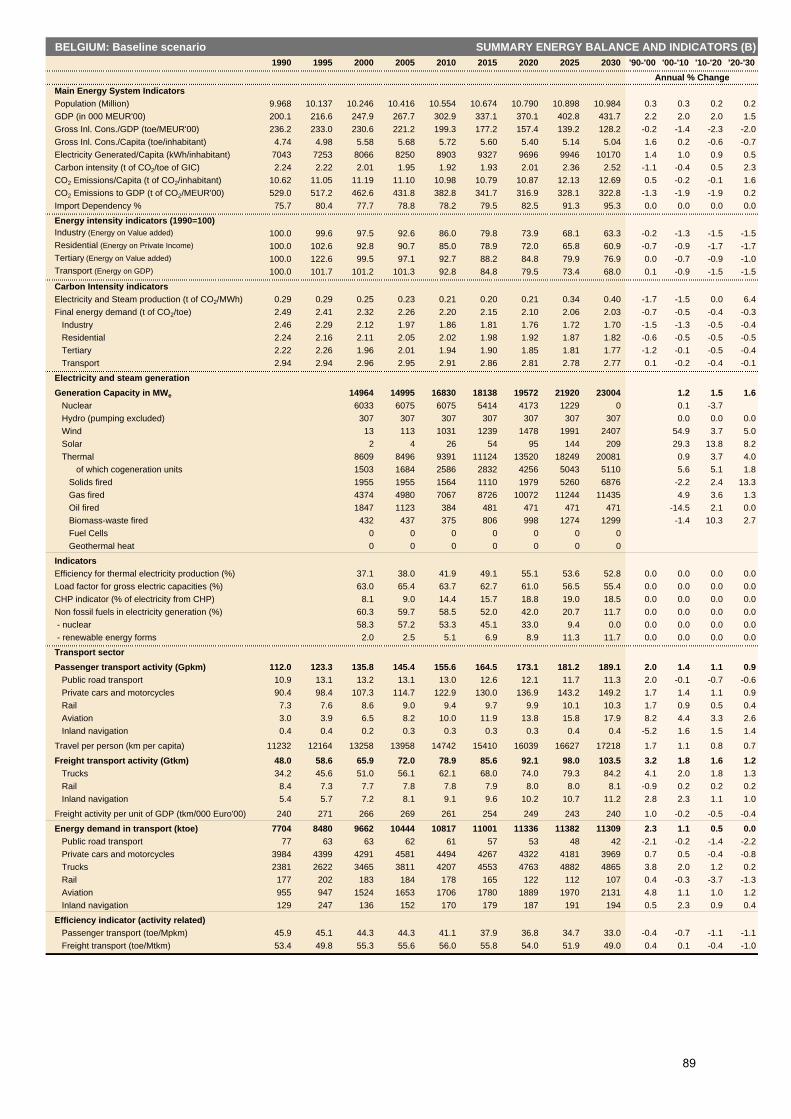
BELGIUM: Baseline scenario SUMMARY ENERGY BALANCE AND INDICATORS (B)1990 1995 2000 2005 2010 2015 2020 2025 2030 '90-'00 '00-'10 '10-'20 '20-'30
Annual % ChangeMain Energy System IndicatorsPopulation (Million) 9.968 10.137 10.246 10.416 10.554 10.674 10.790 10.898 10.984 0.3 0.3 0.2 0.2GDP (in 000 MEUR'00) 200.1 216.6 247.9 267.7 302.9 337.1 370.1 402.8 431.7 2.2 2.0 2.0 1.5Gross Inl. Cons./GDP (toe/MEUR'00) 236.2 233.0 230.6 221.2 199.3 177.2 157.4 139.2 128.2 -0.2 -1.4 -2.3 -2.0Gross Inl. Cons./Capita (toe/inhabitant) 4.74 4.98 5.58 5.68 5.72 5.60 5.40 5.14 5.04 1.6 0.2 -0.6 -0.7Electricity Generated/Capita (kWh/inhabitant) 7043 7253 8066 8250 8903 9327 9696 9946 10170 1.4 1.0 0.9 0.5Carbon intensity (t of CO2/toe of GIC) 2.24 2.22 2.01 1.95 1.92 1.93 2.01 2.36 2.52 -1.1 -0.4 0.5 2.3CO2 Emissions/Capita (t of CO2/inhabitant) 10.62 11.05 11.19 11.10 10.98 10.79 10.87 12.13 12.69 0.5 -0.2 -0.1 1.6CO2 Emissions to GDP (t of CO2/MEUR'00) 529.0 517.2 462.6 431.8 382.8 341.7 316.9 328.1 322.8 -1.3 -1.9 -1.9 0.2Import Dependency % 75.7 80.4 77.7 78.8 78.2 79.5 82.5 91.3 95.3 0.0 0.0 0.0 0.0
Energy intensity indicators (1990=100)Industry (Energy on Value added) 100.0 99.6 97.5 92.6 86.0 79.8 73.9 68.1 63.3 -0.2 -1.3 -1.5 -1.5Residential (Energy on Private Income) 100.0 102.6 92.8 90.7 85.0 78.9 72.0 65.8 60.9 -0.7 -0.9 -1.7 -1.7Tertiary (Energy on Value added) 100.0 122.6 99.5 97.1 92.7 88.2 84.8 79.9 76.9 0.0 -0.7 -0.9 -1.0Transport (Energy on GDP) 100.0 101.7 101.2 101.3 92.8 84.8 79.5 73.4 68.0 0.1 -0.9 -1.5 -1.5
Carbon Intensity indicatorsElectricity and Steam production (t of CO2/MWh) 0.29 0.29 0.25 0.23 0.21 0.20 0.21 0.34 0.40 -1.7 -1.5 0.0 6.4Final energy demand (t of CO2/toe) 2.49 2.41 2.32 2.26 2.20 2.15 2.10 2.06 2.03 -0.7 -0.5 -0.4 -0.3
Industry 2.46 2.29 2.12 1.97 1.86 1.81 1.76 1.72 1.70 -1.5 -1.3 -0.5 -0.4Residential 2.24 2.16 2.11 2.05 2.02 1.98 1.92 1.87 1.82 -0.6 -0.5 -0.5 -0.5Tertiary 2.22 2.26 1.96 2.01 1.94 1.90 1.85 1.81 1.77 -1.2 -0.1 -0.5 -0.4Transport 2.94 2.94 2.96 2.95 2.91 2.86 2.81 2.78 2.77 0.1 -0.2 -0.4 -0.1
Electricity and steam generationGeneration Capacity in MWe 14964 14995 16830 18138 19572 21920 23004 1.2 1.5 1.6
Nuclear 6033 6075 6075 5414 4173 1229 0 0.1 -3.7Hydro (pumping excluded) 307 307 307 307 307 307 307 0.0 0.0 0.0Wind 13 113 1031 1239 1478 1991 2407 54.9 3.7 5.0Solar 2 4 26 54 95 144 209 29.3 13.8 8.2Thermal 8609 8496 9391 11124 13520 18249 20081 0.9 3.7 4.0
of which cogeneration units 1503 1684 2586 2832 4256 5043 5110 5.6 5.1 1.8Solids fired 1955 1955 1564 1110 1979 5260 6876 -2.2 2.4 13.3Gas fired 4374 4980 7067 8726 10072 11244 11435 4.9 3.6 1.3Oil fired 1847 1123 384 481 471 471 471 -14.5 2.1 0.0Biomass-waste fired 432 437 375 806 998 1274 1299 -1.4 10.3 2.7Fuel Cells 0 0 0 0 0 0 0Geothermal heat 0 0 0 0 0 0 0
IndicatorsEfficiency for thermal electricity production (%) 37.1 38.0 41.9 49.1 55.1 53.6 52.8 0.0 0.0 0.0 0.0Load factor for gross electric capacities (%) 63.0 65.4 63.7 62.7 61.0 56.5 55.4 0.0 0.0 0.0 0.0CHP indicator (% of electricity from CHP) 8.1 9.0 14.4 15.7 18.8 19.0 18.5 0.0 0.0 0.0 0.0Non fossil fuels in electricity generation (%) 60.3 59.7 58.5 52.0 42.0 20.7 11.7 0.0 0.0 0.0 0.0 - nuclear 58.3 57.2 53.3 45.1 33.0 9.4 0.0 0.0 0.0 0.0 0.0 - renewable energy forms 2.0 2.5 5.1 6.9 8.9 11.3 11.7 0.0 0.0 0.0 0.0
Transport sectorPassenger transport activity (Gpkm) 112.0 123.3 135.8 145.4 155.6 164.5 173.1 181.2 189.1 2.0 1.4 1.1 0.9
Public road transport 10.9 13.1 13.2 13.1 13.0 12.6 12.1 11.7 11.3 2.0 -0.1 -0.7 -0.6Private cars and motorcycles 90.4 98.4 107.3 114.7 122.9 130.0 136.9 143.2 149.2 1.7 1.4 1.1 0.9Rail 7.3 7.6 8.6 9.0 9.4 9.7 9.9 10.1 10.3 1.7 0.9 0.5 0.4Aviation 3.0 3.9 6.5 8.2 10.0 11.9 13.8 15.8 17.9 8.2 4.4 3.3 2.6Inland navigation 0.4 0.4 0.2 0.3 0.3 0.3 0.3 0.4 0.4 -5.2 1.6 1.5 1.4
Travel per person (km per capita) 11232 12164 13258 13958 14742 15410 16039 16627 17218 1.7 1.1 0.8 0.7
Freight transport activity (Gtkm) 48.0 58.6 65.9 72.0 78.9 85.6 92.1 98.0 103.5 3.2 1.8 1.6 1.2Trucks 34.2 45.6 51.0 56.1 62.1 68.0 74.0 79.3 84.2 4.1 2.0 1.8 1.3Rail 8.4 7.3 7.7 7.8 7.8 7.9 8.0 8.0 8.1 -0.9 0.2 0.2 0.2Inland navigation 5.4 5.7 7.2 8.1 9.1 9.6 10.2 10.7 11.2 2.8 2.3 1.1 1.0
Freight activity per unit of GDP (tkm/000 Euro'00) 240 271 266 269 261 254 249 243 240 1.0 -0.2 -0.5 -0.4
Energy demand in transport (ktoe) 7704 8480 9662 10444 10817 11001 11336 11382 11309 2.3 1.1 0.5 0.0Public road transport 77 63 63 62 61 57 53 48 42 -2.1 -0.2 -1.4 -2.2Private cars and motorcycles 3984 4399 4291 4581 4494 4267 4322 4181 3969 0.7 0.5 -0.4 -0.8Trucks 2381 2622 3465 3811 4207 4553 4763 4882 4865 3.8 2.0 1.2 0.2Rail 177 202 183 184 178 165 122 112 107 0.4 -0.3 -3.7 -1.3Aviation 955 947 1524 1653 1706 1780 1889 1970 2131 4.8 1.1 1.0 1.2Inland navigation 129 247 136 152 170 179 187 191 194 0.5 2.3 0.9 0.4
Efficiency indicator (activity related)Passenger transport (toe/Mpkm) 45.9 45.1 44.3 44.3 41.1 37.9 36.8 34.7 33.0 -0.4 -0.7 -1.1 -1.1Freight transport (toe/Mtkm) 53.4 49.8 55.3 55.6 56.0 55.8 54.0 51.9 49.0 0.4 0.1 -0.4 -1.0
89

CYPRUS: Baseline scenario SUMMARY ENERGY BALANCE AND INDICATORS (A) ktoe 1990 1995 2000 2005 2010 2015 2020 2025 2030 '90-'00 '00-'10 '10-'20 '20-'30
Annual % ChangePrimary Production 6 42 45 90 112 142 177 198 213 23.1 9.6 4.6 1.9
Solids 0 0 0 0 0 0 0 0 0Oil 0 0 0 0 0 0 0 0 0Natural gas 0 0 0 0 0 0 0 0 0Nuclear 0 0 0 0 0 0 0 0 0Renewable energy sources 6 42 45 90 112 142 177 198 213 23.1 9.6 4.6 1.9
Hydro 0 0 0 0 0 0 0 0 0Biomass & Waste 6 11 9 35 46 63 85 89 98 5.3 17.1 6.4 1.5Wind 0 0 0 1 6 15 25 39 46 15.6 6.4Solar and others 0 31 35 54 61 65 67 70 69 5.6 1.0 0.3Geothermal 0 0 0 0 0 0 0 0 0
Net Imports 1927 2017 2537 2693 3009 3198 3269 3177 3149 2.8 1.7 0.8 -0.4Solids 68 17 36 34 22 20 16 16 15 -6.3 -4.6 -3.1 -0.9Oil 1859 2000 2502 2658 2986 3178 3253 3160 3134 3.0 1.8 0.9 -0.4 - Crude oil and Feedstocks 756 794 1149 1107 1243 1323 1354 1316 1305 4.3 0.8 0.9 -0.4 - Oil products 1103 1207 1353 1552 1743 1855 1899 1845 1830 2.1 2.6 0.9 -0.4Natural gas 0 0 0 0 0 0 0 0 0 5.7Electricity 0 0 0 0 0 0 0 0 0
Gross Inland Consumption 1816 1970 2382 2596 2932 3151 3256 3185 3172 2.7 2.1 1.1 -0.3Solids 60 13 35 34 22 20 16 16 15 -5.3 -4.4 -3.1 -0.9Oil 1750 1914 2302 2471 2798 2989 3063 2971 2944 2.8 2.0 0.9 -0.4Natural gas 0 0 0 0 0 0 0 0 0 5.7Nuclear 0 0 0 0 0 0 0 0 0Electricity 0 0 0 0 0 0 0 0 0Renewable energy forms 6 42 45 90 112 142 177 198 213 23.1 9.6 4.6 1.9
as % in Gross Inland ConsumptionSolids 3.3 0.7 1.5 1.3 0.8 0.6 0.5 0.5 0.5Oil 96.4 97.2 96.6 95.2 95.4 94.9 94.1 93.3 92.8Natural gas 0.0 0.0 0.0 0.0 0.0 0.0 0.0 0.0 0.0Nuclear 0.0 0.0 0.0 0.0 0.0 0.0 0.0 0.0 0.0Renewable energy forms 0.3 2.2 1.9 3.5 3.8 4.5 5.4 6.2 6.7
Electricity Generation in GWhe 1974 2473 3369 4456 5519 6246 6724 7095 7371 5.5 5.1 2.0 0.9Nuclear 0 0 0 0 0 0 0 0 0Hydro & wind 0 0 0 12 67 171 286 449 531 15.6 6.4Thermal (incl. biomass) 1974 2473 3369 4443 5452 6075 6438 6646 6840 5.5 4.9 1.7 0.6
Fuel Inputs for Thermal Power Generation (1) 606 641 862 960 1152 1264 1325 1355 1376 3.6 2.9 1.4 0.4Solids 0 0 0 0 0 0 0 0 0Oil (including refinery gas) 606 641 862 938 1119 1217 1260 1288 1305 3.6 2.6 1.2 0.3Gas 0 0 0 0 0 0 0 0 0Biomass & Waste 0 0 0 22 33 47 66 67 71 7.2 0.8Geothermal heat 0 0 0 0 0 0 0 0 0Hydrogen - Methanol 0 0 0 0 0 0 0 0 0
Fuel Input in other transformation proc. 756 824 1167 1107 1245 1330 1366 1332 1327 4.4 0.7 0.9 -0.3Refineries 756 824 1167 1107 1243 1323 1354 1316 1305 4.4 0.6 0.9 -0.4Biofuels and hydrogen production 0 0 0 0 2 7 12 17 22 17.9 6.4District heating 0 0 0 0 0 0 0 0 0Others 0 0 0 0 0 0 0 0 0
Energy Branch Consumption 37 43 54 78 88 93 96 98 99 3.8 5.0 1.0 0.3Non-Energy Uses 59 61 82 105 139 164 178 185 190 3.3 5.4 2.5 0.7Final Energy Demand 1264 1409 1634 1814 1994 2118 2168 2071 2041 2.6 2.0 0.8 -0.6by sectorIndustry(1) 417 388 437 438 480 508 514 518 521 0.5 0.9 0.7 0.1 - energy intensive industries 220 218 220 209 216 218 205 192 185 0.0 -0.2 -0.5 -1.0 - other industrial sectors 197 170 217 229 264 290 309 326 336 1.0 2.0 1.6 0.9Residential 120 181 219 254 290 322 340 348 357 6.2 2.9 1.6 0.5Tertiary 82 89 127 175 219 239 250 258 258 4.5 5.6 1.3 0.3Transport 645 750 852 946 1005 1049 1065 947 904 2.8 1.7 0.6 -1.6by fuel (1)
Solids 76 13 35 34 22 20 16 16 15 -7.5 -4.4 -3.1 -0.9Oil 1032 1162 1296 1370 1475 1541 1557 1430 1381 2.3 1.3 0.5 -1.2Gas 0 0 0 0 0 0 0 0 0Electricity 151 191 258 340 419 472 505 529 546 5.5 5.0 1.9 0.8Heat (from CHP and District Heating) 0 0 0 3 4 6 6 6 6 3.8 0.2Other 6 42 45 67 73 79 84 89 92 23.1 5.0 1.3 1.0
CO2 Emissions (Mt of CO2) 5.4 5.7 6.9 7.4 8.3 8.8 9.0 8.7 8.6 2.4 1.8 0.8 -0.4Power generation/District heating 1.9 2.1 2.8 3.0 3.6 3.9 4.0 4.1 4.2 3.6 2.6 1.2 0.3Energy Branch 0.1 0.1 0.1 0.2 0.2 0.2 0.2 0.2 0.2 3.1 5.0 0.5 0.0Industry 1.3 1.1 1.3 1.2 1.3 1.4 1.4 1.4 1.4 -0.1 0.6 0.6 0.0Residential 0.2 0.2 0.2 0.2 0.2 0.2 0.2 0.2 0.2 1.0 -1.6 -0.1 -1.6Tertiary 0.0 0.0 0.0 0.0 0.0 0.0 0.0 0.0 0.0Transport 1.9 2.2 2.5 2.8 3.0 3.1 3.1 2.8 2.6 2.8 1.6 0.5 -1.7
CO2 Emissions Index (1990=100) 100.0 104.9 127.3 136.9 152.9 162.4 165.6 160.4 158.6
Source: PRIMES
90

CYPRUS: Baseline scenario SUMMARY ENERGY BALANCE AND INDICATORS (B)1990 1995 2000 2005 2010 2015 2020 2025 2030 '90-'00 '00-'10 '10-'20 '20-'30
Annual % ChangeMain Energy System IndicatorsPopulation (Million) 0.580 0.656 0.698 0.743 0.784 0.828 0.866 0.897 0.921 1.9 1.2 1.0 0.6GDP (in 000 MEUR'00) 6.3 8.2 9.9 11.5 14.2 17.1 19.9 22.6 24.9 4.5 3.7 3.5 2.3Gross Inl. Cons./GDP (toe/MEUR'00) 286.1 239.5 240.7 224.8 206.9 184.3 163.7 141.2 127.1 -1.7 -1.5 -2.3 -2.5Gross Inl. Cons./Capita (toe/inhabitant) 3.13 3.00 3.41 3.49 3.74 3.81 3.76 3.55 3.44 0.9 0.9 0.1 -0.9Electricity Generated/Capita (kWh/inhabitant) 3403 3769 4827 5997 7042 7546 7769 7911 7999 3.6 3.8 1.0 0.3Carbon intensity (t of CO2/toe of GIC) 2.98 2.89 2.89 2.86 2.82 2.79 2.75 2.73 2.71 -0.3 -0.2 -0.2 -0.2CO2 Emissions/Capita (t of CO2/inhabitant) 9.34 8.66 9.88 9.98 10.57 10.62 10.36 9.69 9.32 0.6 0.7 -0.2 -1.1CO2 Emissions to GDP (t of CO2/MEUR'00) 853.1 691.1 696.8 641.8 584.4 514.4 450.8 385.2 344.3 -2.0 -1.7 -2.6 -2.7Import Dependency % 103.1 99.1 98.7 96.8 96.4 95.7 94.9 94.1 93.7 0.0 0.0 0.0 0.0
Energy intensity indicators (1990=100)Industry (Energy on Value added) 100.0 68.2 73.7 69.7 64.1 57.3 50.0 44.5 40.8 -3.0 -1.4 -2.4 -2.0Residential (Energy on Private Income) 100.0 103.3 101.4 100.7 91.9 83.2 75.2 68.2 63.8 0.1 -1.0 -2.0 -1.6Tertiary (Energy on Value added) 100.0 76.9 87.3 103.4 105.0 94.4 84.5 76.6 69.0 -1.4 1.9 -2.2 -2.0Transport (Energy on GDP) 100.0 89.8 84.7 80.6 69.8 60.4 52.7 41.3 35.7 -1.6 -1.9 -2.8 -3.8
Carbon Intensity indicatorsElectricity and Steam production (t of CO2/MWh) 0.98 0.83 0.82 0.67 0.64 0.62 0.59 0.58 0.56 -1.8 -2.4 -0.8 -0.6Final energy demand (t of CO2/toe) 2.68 2.51 2.46 2.34 2.26 2.22 2.19 2.11 2.07 -0.9 -0.8 -0.3 -0.6
Industry 3.05 2.85 2.88 2.84 2.78 2.76 2.75 2.73 2.72 -0.6 -0.4 -0.1 -0.1Residential 1.69 1.09 1.03 0.71 0.66 0.60 0.56 0.49 0.45 -4.8 -4.4 -1.7 -2.1Tertiary 0.00 0.00 0.00 0.00 0.00 0.00 0.00 0.00 0.00Transport 2.97 2.97 2.98 2.98 2.97 2.96 2.95 2.93 2.92 0.0 0.0 -0.1 -0.1
Electricity and steam generationGeneration Capacity in MWe 1005 1190 1446 1692 2018 2264 2451 3.7 3.4 2.0
Nuclear 0 0 0 0 0 0 0Hydro (pumping excluded) 0 0 0 0 0 0 0Wind 0 5 24 62 104 163 192 15.6 6.4Solar 0 0 0 0 0 0 0Thermal 1005 1185 1421 1630 1914 2101 2258 3.5 3.0 1.7
of which cogeneration units 0 4 6 9 9 89 90 3.8 25.4Solids fired 0 0 0 0 0 0 0Gas fired 0 0 0 0 0 0 0Oil fired 1005 1173 1403 1603 1874 2060 2214 3.4 2.9 1.7Biomass-waste fired 0 12 19 27 39 41 45 7.8 1.3Fuel Cells 0 0 0 0 0 0 0Geothermal heat 0 0 0 0 0 0 0
IndicatorsEfficiency for thermal electricity production (%) 33.6 39.8 40.7 41.3 41.8 42.2 42.8 0.0 0.0 0.0 0.0Load factor for gross electric capacities (%) 38.3 42.8 43.6 42.1 38.0 35.8 34.3 0.0 0.0 0.0 0.0CHP indicator (% of electricity from CHP) 0.0 0.6 0.8 1.0 1.0 0.9 0.9 0.0 0.0 0.0 0.0Non fossil fuels in electricity generation (%) 0.0 2.2 3.6 5.8 8.4 10.4 11.5 0.0 0.0 0.0 0.0 - nuclear 0.0 0.0 0.0 0.0 0.0 0.0 0.0 0.0 0.0 0.0 0.0 - renewable energy forms 0.0 2.2 3.6 5.8 8.4 10.4 11.5 0.0 0.0 0.0 0.0
Transport sectorPassenger transport activity (Gpkm) 6.6 7.7 9.7 11.4 13.1 14.9 16.2 17.1 17.7 3.9 3.1 2.1 0.9
Public road transport 0.4 0.5 0.6 0.6 0.6 0.6 0.6 0.6 0.6 3.2 0.5 0.4 0.4Private cars and motorcycles 2.3 2.5 3.5 3.8 4.1 4.5 4.7 4.9 5.0 4.4 1.6 1.4 0.6Rail 0.0 0.0 0.0 0.0 0.0 0.0 0.0 0.0 0.0Aviation 3.9 4.8 5.6 7.0 8.4 9.8 10.9 11.5 12.0 3.7 4.1 2.6 1.0Inland navigation 0.0 0.0 0.0 0.0 0.0 0.0 0.0 0.0 0.0
Travel per person (km per capita) 11416 11808 13918 15385 16762 17957 18741 19012 19192 2.0 1.9 1.1 0.2
Freight transport activity (Gtkm) 1.0 1.1 1.2 1.2 1.2 1.2 1.3 1.3 1.3 1.8 0.1 0.5 0.6Trucks 1.0 1.1 1.2 1.2 1.2 1.2 1.3 1.3 1.3 1.8 0.1 0.5 0.6Rail 0.0 0.0 0.0 0.0 0.0 0.0 0.0 0.0 0.0Inland navigation 0.0 0.0 0.0 0.0 0.0 0.0 0.0 0.0 0.0
Freight activity per unit of GDP (tkm/000 Euro'00) 159 134 121 105 85 72 64 58 54 -2.7 -3.5 -2.9 -1.7
Energy demand in transport (ktoe) 645 750 852 946 1005 1049 1065 947 904 2.8 1.7 0.6 -1.6Public road transport 6 7 10 10 10 10 10 9 9 5.2 0.5 -0.2 -0.6Private cars and motorcycles 134 147 242 267 265 261 265 263 260 6.1 0.9 0.0 -0.2Trucks 274 326 308 312 311 318 315 311 313 1.2 0.1 0.1 -0.1Rail 2 3 2 0 0 0 0 0 0 0.5Aviation 229 267 290 357 419 460 475 364 322 2.4 3.8 1.3 -3.8Inland navigation 0 0 0 0 0 0 0 0 0
Efficiency indicator (activity related)Passenger transport (toe/Mpkm) 55.7 54.4 55.7 55.4 52.8 49.2 46.2 37.3 33.5 0.0 -0.5 -1.3 -3.2Freight transport (toe/Mtkm) 272.1 296.4 257.0 257.6 257.7 256.6 247.9 237.9 231.9 -0.6 0.0 -0.4 -0.7
91

CZECH REPUBLIC: Baseline scenario SUMMARY ENERGY BALANCE AND INDICATORS (A) ktoe 1990 1995 2000 2005 2010 2015 2020 2025 2030 '90-'00 '00-'10 '10-'20 '20-'30
Annual % ChangePrimary Production 38321 31610 29636 32061 31132 28441 26794 26933 25706 -2.5 0.5 -1.5 -0.4
Solids 34700 27491 25001 23371 21319 18254 16088 14704 12397 -3.2 -1.6 -2.8 -2.6Oil 50 140 179 217 200 200 200 200 200 13.6 1.1 0.0 0.0Natural gas 201 198 169 193 200 228 244 250 200 -1.7 1.7 2.0 -2.0Nuclear 3246 3155 3506 7013 7481 7594 7722 8947 9966 0.8 7.9 0.3 2.6Renewable energy sources 124 626 781 1266 1933 2166 2540 2832 2943 20.2 9.5 2.8 1.5
Hydro 124 172 151 146 153 155 158 161 163 2.0 0.1 0.3 0.3Biomass & Waste 0 454 630 1110 1751 1942 2279 2532 2597 10.8 2.7 1.3Wind 0 0 0 2 12 44 63 76 94 17.7 4.1Solar and others 0 0 0 9 16 25 39 63 89 9.1 8.6Geothermal 0 0 0 0 0 0 0 0 0
Net Imports 7674 8432 9297 10703 15558 19107 20876 22422 26042 1.9 5.3 3.0 2.2Solids -5641 -5774 -4751 -4111 -1615 -216 -202 950 2969Oil 8589 7746 7428 7879 8939 9621 10399 10919 11570 -1.4 1.9 1.5 1.1 - Crude oil and Feedstocks 7382 6798 5492 7039 7990 8598 9296 9763 10348 -2.9 3.8 1.5 1.1 - Oil products 1207 948 1936 840 949 1022 1103 1156 1221 4.8 -6.9 1.5 1.0Natural gas 4786 6424 7482 8368 9638 10967 11779 12029 13201 4.6 2.6 2.0 1.1Electricity -60 36 -861 -1433 -1404 -1264 -1100 -1476 -1698
Gross Inland Consumption 47247 40693 40155 42764 46690 47548 47670 49355 51749 -1.6 1.5 0.2 0.8Solids 29897 22577 21644 19260 19704 18037 15886 15655 15367 -3.2 -0.9 -2.1 -0.3Oil 8791 7748 7585 8096 9139 9821 10599 11119 11770 -1.5 1.9 1.5 1.1Natural gas 5248 6552 7500 8561 9838 11195 12023 12279 13401 3.6 2.8 2.0 1.1Nuclear 3246 3155 3506 7013 7481 7594 7722 8947 9966 0.8 7.9 0.3 2.6Electricity -60 36 -861 -1433 -1404 -1264 -1100 -1476 -1698Renewable energy forms 124 626 781 1266 1933 2166 2540 2832 2943 20.2 9.5 2.8 1.5
as % in Gross Inland ConsumptionSolids 63.3 55.5 53.9 45.0 42.2 37.9 33.3 31.7 29.7Oil 18.6 19.0 18.9 18.9 19.6 20.7 22.2 22.5 22.7Natural gas 11.1 16.1 18.7 20.0 21.1 23.5 25.2 24.9 25.9Nuclear 6.9 7.8 8.7 16.4 16.0 16.0 16.2 18.1 19.3Renewable energy forms 0.3 1.5 1.9 3.0 4.1 4.6 5.3 5.7 5.7
Electricity Generation in GWhe 62548 60564 72898 83281 92338 97101 100100 110873 119123 1.5 2.4 0.8 1.8Nuclear 12583 12228 13588 27182 28995 29433 29930 34676 38628 0.8 7.9 0.3 2.6Hydro & wind 1445 2002 1758 1720 1923 2317 2588 2797 3047 2.0 0.9 3.0 1.6Thermal (incl. biomass) 48520 46335 57553 54379 61420 65351 67582 73401 77448 1.7 0.7 1.0 1.4
Fuel Inputs for Thermal Power Generation (1) 10989 14643 15890 15020 16650 15309 13981 14065 14766 3.8 0.5 -1.7 0.5Solids 9947 13576 14029 13569 14448 12587 10970 11274 12044 3.5 0.3 -2.7 0.9Oil (including refinery gas) 741 311 203 10 162 8 5 4 4 -12.2 -2.2 -29.3 -2.6Gas 300 637 1262 1089 1319 1959 2037 1616 1538 15.4 0.4 4.4 -2.8Biomass & Waste 0 119 397 352 721 756 969 1170 1180 6.2 3.0 2.0Geothermal heat 0 0 0 0 0 0 0 0 0Hydrogen - Methanol 0 0 0 0 0 0 0 0 0
Fuel Input in other transformation proc. 18660 14703 11363 12180 13077 13643 14158 14432 14927 -4.8 1.4 0.8 0.5Refineries 7946 7026 6047 7286 8225 8838 9538 10006 10592 -2.7 3.1 1.5 1.1Biofuels and hydrogen production 0 10 33 81 330 429 575 661 734 25.8 5.7 2.5District heating 2138 1404 963 1096 1170 1288 1167 1148 1216 -7.7 2.0 0.0 0.4Others 8576 6263 4319 3716 3352 3088 2877 2617 2386 -6.6 -2.5 -1.5 -1.9
Energy Branch Consumption 1652 1294 1943 1809 1883 1843 1802 1827 1889 1.6 -0.3 -0.4 0.5Non-Energy Uses 2033 2132 1941 1917 2152 2387 2585 2725 2848 -0.5 1.0 1.9 1.0Final Energy Demand 36678 25405 25375 26642 29243 31549 33214 34565 35791 -3.6 1.4 1.3 0.8by sectorIndustry(1) 20058 12906 11848 11446 12215 13152 13603 14058 14329 -5.1 0.3 1.1 0.5 - energy intensive industries 8719 7233 6999 7083 7338 7650 7754 7859 7861 -2.2 0.5 0.6 0.1 - other industrial sectors 11339 5673 4849 4364 4877 5502 5849 6199 6468 -8.1 0.1 1.8 1.0Residential 8254 5608 5260 6022 6637 7022 7271 7470 7716 -4.4 2.4 0.9 0.6Tertiary 5561 4052 4134 4209 4667 5114 5505 5859 6243 -2.9 1.2 1.7 1.3Transport 2804 2839 4133 4964 5723 6261 6835 7178 7503 4.0 3.3 1.8 0.9by fuel (1)
Solids 17841 6443 5238 4128 3905 3746 3341 2981 2024 -11.5 -2.9 -1.5 -4.9Oil 5876 5018 5345 5885 6659 7294 7914 8328 8858 -0.9 2.2 1.7 1.1Gas 5146 6048 6442 7436 8129 9037 9758 10245 11285 2.3 2.4 1.8 1.5Electricity 4142 4129 4243 4586 5337 5978 6499 7080 7545 0.2 2.3 2.0 1.5Heat (from CHP and District Heating) 3672 3458 3885 3977 4290 4444 4510 4645 4710 0.6 1.0 0.5 0.4Other 0 308 220 631 922 1050 1192 1286 1371 15.4 2.6 1.4
CO2 Emissions (Mt of CO2) 154.0 118.4 117.2 112.9 120.3 118.2 113.4 114.3 117.4 -2.7 0.3 -0.6 0.3Power generation/District heating 48.8 60.5 62.0 59.3 64.0 58.6 52.1 52.2 55.1 2.4 0.3 -2.0 0.6Energy Branch 2.3 1.5 2.2 1.1 0.9 0.9 0.7 0.7 0.6 -0.5 -9.0 -1.8 -2.0Industry 57.3 29.9 27.0 25.5 26.3 27.8 28.1 28.2 27.4 -7.3 -0.3 0.7 -0.2Residential 24.0 10.4 7.9 8.7 9.1 9.1 9.1 8.8 8.6 -10.5 1.4 0.0 -0.6Tertiary 14.1 8.4 6.5 4.3 4.4 4.8 5.1 5.3 5.6 -7.4 -3.8 1.4 1.0Transport 7.5 7.7 11.5 13.9 15.6 17.0 18.4 19.2 20.0 4.4 3.1 1.7 0.9
CO2 Emissions Index (1990=100) 100.0 76.9 76.1 73.3 78.1 76.7 73.7 74.3 76.2
Source: PRIMES
92

CZECH REPUBLIC: Baseline scenario SUMMARY ENERGY BALANCE AND INDICATORS (B)1990 1995 2000 2005 2010 2015 2020 2025 2030 '90-'00 '00-'10 '10-'20 '20-'30
Annual % ChangeMain Energy System IndicatorsPopulation (Million) 10.363 10.331 10.273 10.186 10.122 10.012 9.902 9.812 9.693 -0.1 -0.1 -0.2 -0.2GDP (in 000 MEUR'00) 59.0 56.2 60.4 70.6 84.3 100.9 117.1 133.4 147.3 0.2 3.4 3.3 2.3Gross Inl. Cons./GDP (toe/MEUR'00) 801.1 724.1 664.9 605.9 553.7 471.3 407.0 370.0 351.2 -1.8 -1.8 -3.0 -1.5Gross Inl. Cons./Capita (toe/inhabitant) 4.56 3.94 3.91 4.20 4.61 4.75 4.81 5.03 5.34 -1.5 1.7 0.4 1.0Electricity Generated/Capita (kWh/inhabitant) 6036 5862 7096 8176 9122 9698 10109 11300 12290 1.6 2.5 1.0 2.0Carbon intensity (t of CO2/toe of GIC) 3.26 2.91 2.92 2.64 2.58 2.49 2.38 2.32 2.27 -1.1 -1.2 -0.8 -0.5CO2 Emissions/Capita (t of CO2/inhabitant) 14.86 11.46 11.41 11.08 11.88 11.80 11.45 11.65 12.11 -2.6 0.4 -0.4 0.6CO2 Emissions to GDP (t of CO2/MEUR'00) 2611.0 2106.7 1939.9 1599.7 1426.2 1171.3 968.3 857.1 796.9 -2.9 -3.0 -3.8 -1.9Import Dependency % 16.2 20.7 23.2 25.0 33.3 40.2 43.8 45.4 50.3 0.0 0.0 0.0 0.0
Energy intensity indicators (1990=100)Industry (Energy on Value added) 100.0 69.7 51.1 38.4 33.4 30.0 27.3 25.0 23.3 -6.5 -4.2 -2.0 -1.6Residential (Energy on Private Income) 100.0 73.3 60.3 59.0 53.4 46.3 40.7 36.3 33.8 -4.9 -1.2 -2.7 -1.8Tertiary (Energy on Value added) 100.0 59.8 56.0 50.1 47.3 43.6 40.5 37.9 36.6 -5.6 -1.7 -1.5 -1.0Transport (Energy on GDP) 100.0 106.2 143.9 147.9 142.7 130.5 122.7 113.2 107.1 3.7 -0.1 -1.5 -1.4
Carbon Intensity indicatorsElectricity and Steam production (t of CO2/MWh) 0.45 0.59 0.49 0.43 0.42 0.36 0.32 0.29 0.29 1.0 -1.6 -2.7 -0.7Final energy demand (t of CO2/toe) 2.80 2.22 2.09 1.97 1.89 1.86 1.83 1.78 1.72 -2.9 -1.0 -0.4 -0.6
Industry 2.86 2.31 2.27 2.23 2.15 2.12 2.06 2.00 1.91 -2.2 -0.6 -0.4 -0.8Residential 2.90 1.85 1.50 1.45 1.37 1.30 1.25 1.17 1.11 -6.4 -0.9 -0.9 -1.2Tertiary 2.54 2.07 1.58 1.02 0.95 0.94 0.92 0.91 0.90 -4.6 -5.0 -0.3 -0.2Transport 2.68 2.71 2.79 2.80 2.72 2.71 2.69 2.68 2.67 0.4 -0.2 -0.1 -0.1
Electricity and steam generationGeneration Capacity in MWe 12670 14887 14880 17250 21132 24385 25812 1.6 3.6 2.0
Nuclear 1760 3722 3722 3722 3722 4322 4831 7.8 0.0 2.6Hydro (pumping excluded) 1147 1149 1154 1159 1168 1176 1182 0.1 0.1 0.1Wind 7 20 107 382 538 648 795 31.7 17.6 4.0Solar 0 0 2 5 17 32 49 27.1 11.4Thermal 9757 9997 9896 11981 15687 18207 18955 0.1 4.7 1.9
of which cogeneration units 4262 4172 4613 6677 8554 9982 10289 0.8 6.4 1.9Solids fired 8005 8245 7724 8304 9288 10728 11346 -0.4 1.9 2.0Gas fired 803 803 1188 2534 4916 5719 5808 4.0 15.3 1.7Oil fired 271 271 271 13 13 5 5 0.0 -26.2 -10.0Biomass-waste fired 678 678 713 1131 1469 1756 1796 0.5 7.5 2.0Fuel Cells 0 0 0 0 0 0 0Geothermal heat 0 0 0 0 0 0 0
IndicatorsEfficiency for thermal electricity production (%) 31.1 31.1 31.7 36.7 41.6 44.9 45.1 0.0 0.0 0.0 0.0Load factor for gross electric capacities (%) 65.7 63.9 70.8 64.3 54.1 51.9 52.7 0.0 0.0 0.0 0.0CHP indicator (% of electricity from CHP) 31.4 28.5 28.1 35.7 41.7 42.7 40.9 0.0 0.0 0.0 0.0Non fossil fuels in electricity generation (%) 22.6 35.8 35.6 36.9 37.5 39.4 40.2 0.0 0.0 0.0 0.0 - nuclear 18.6 32.6 31.4 30.3 29.9 31.3 32.4 0.0 0.0 0.0 0.0 - renewable energy forms 4.0 3.2 4.2 6.6 7.6 8.1 7.8 0.0 0.0 0.0 0.0
Transport sectorPassenger transport activity (Gpkm) 108.0 83.7 90.7 104.5 118.9 133.0 145.3 155.5 163.2 -1.7 2.7 2.0 1.2
Public road transport 23.6 11.8 9.4 9.0 8.7 8.5 8.2 8.0 7.8 -8.8 -0.7 -0.6 -0.5Private cars and motorcycles 62.6 54.5 63.9 77.3 91.2 104.1 115.4 124.6 131.6 0.2 3.6 2.4 1.3Rail 19.9 15.7 15.4 15.3 15.1 15.4 15.6 15.8 15.9 -2.6 -0.2 0.3 0.2Aviation 1.8 1.7 2.0 2.9 3.8 5.0 6.1 7.1 7.9 1.0 6.5 4.8 2.6Inland navigation 0.0 0.0 0.0 0.0 0.0 0.0 0.0 0.0 0.0
Travel per person (km per capita) 10421 8097 8826 10259 11742 13284 14676 15848 16840 -1.6 2.9 2.3 1.4
Freight transport activity (Gtkm) 66.8 55.3 55.6 64.9 77.5 88.7 100.3 112.5 122.9 -1.8 3.4 2.6 2.1Trucks 26.3 31.3 37.3 47.1 60.7 72.0 84.4 96.4 106.5 3.6 5.0 3.4 2.3Rail 38.0 22.6 17.5 17.1 16.4 16.3 15.5 15.7 16.0 -7.5 -0.7 -0.5 0.3Inland navigation 2.6 1.3 0.8 0.6 0.4 0.4 0.4 0.4 0.4 -11.4 -5.4 -0.7 -0.6
Freight activity per unit of GDP (tkm/000 Euro'00) 1133 984 920 919 919 879 857 844 834 -2.1 0.0 -0.7 -0.3
Energy demand in transport (ktoe) 2804 2839 4133 4964 5723 6261 6835 7178 7503 4.0 3.3 1.8 0.9Public road transport 227 125 103 99 95 91 85 79 73 -7.6 -0.7 -1.2 -1.5Private cars and motorcycles 1131 1184 1970 2340 2513 2573 2757 2853 2916 5.7 2.5 0.9 0.6Trucks 937 1132 1559 1970 2532 2977 3349 3655 3932 5.2 5.0 2.8 1.6Rail 272 200 295 278 246 216 193 178 171 0.8 -1.8 -2.4 -1.2Aviation 221 189 200 274 335 402 449 411 409 -1.0 5.3 3.0 -0.9Inland navigation 16 8 5 4 3 3 3 2 2 -11.7 -5.4 -0.8 -0.6
Efficiency indicator (activity related)Passenger transport (toe/Mpkm) 15.7 19.0 26.7 27.3 25.7 23.8 23.2 22.0 21.2 5.4 -0.4 -1.0 -0.9Freight transport (toe/Mtkm) 16.5 22.6 30.8 32.6 34.4 34.9 34.5 33.4 32.8 6.4 1.1 0.0 -0.5
93

DENMARK: Baseline scenario SUMMARY ENERGY BALANCE AND INDICATORS (A) ktoe 1990 1995 2000 2005 2010 2015 2020 2025 2030 '90-'00 '00-'10 '10-'20 '20-'30
Annual % ChangePrimary Production 10082 15566 27656 28943 30587 30145 28914 25824 22759 10.6 1.0 -0.6 -2.4
Solids 0 0 0 0 0 0 0 0 0Oil 6114 9326 18142 18932 19070 18682 17751 15502 13252 11.5 0.5 -0.7 -2.9Natural gas 2770 4702 7411 7293 8276 8000 7035 6070 5105 10.3 1.1 -1.6 -3.2Nuclear 0 0 0 0 0 0 0 0 0Renewable energy sources 1198 1538 2103 2719 3241 3463 4129 4252 4402 5.8 4.4 2.4 0.6
Hydro 2 3 2 2 2 2 2 2 2 0.7 0.0 0.0 0.0Biomass & Waste 1140 1428 1727 2044 2291 2461 2801 2837 2845 4.2 2.9 2.0 0.2Wind 52 101 365 656 917 943 1247 1312 1438 21.4 9.7 3.1 1.4Solar and others 2 5 7 16 31 56 79 102 116 12.5 15.4 9.9 4.0Geothermal 1 1 1 0 0 0 0 0 0 1.9
Net Imports 8626 7529 -7139 -8094 -9299 -8522 -7311 -4547 -1627Solids 6215 7664 3784 4175 3357 3036 2796 2443 2297 -4.8 -1.2 -1.8 -1.9Oil 2733 1429 -8097 -9189 -9253 -9053 -8088 -5962 -3862 - Crude oil and Feedstocks 2012 802 -9607 -10091 -10163 -9947 -8985 -6849 -4735 - Oil products 721 627 1509 901 910 893 898 887 873 7.7 -4.9 -0.1 -0.3Natural gas -928 -1496 -2882 -2915 -3308 -2312 -1727 -642 418Electricity 606 -68 57 -165 -94 -193 -292 -386 -481 -21.0
Gross Inland Consumption 17933 20243 19666 19484 19848 20131 20068 19704 19516 0.9 0.1 0.1 -0.3Solids 6100 6498 4013 4175 3357 3036 2796 2443 2297 -4.1 -1.8 -1.8 -1.9Oil 8212 9105 9044 8378 8376 8137 8127 7967 7774 1.0 -0.8 -0.3 -0.4Natural gas 1818 3170 4449 4378 4968 5688 5308 5428 5523 9.4 1.1 0.7 0.4Nuclear 0 0 0 0 0 0 0 0 0Electricity 606 -68 57 -165 -94 -193 -292 -386 -481 -21.0Renewable energy forms 1198 1538 2103 2719 3241 3463 4129 4252 4402 5.8 4.4 2.4 0.6
as % in Gross Inland ConsumptionSolids 34.0 32.1 20.4 21.4 16.9 15.1 13.9 12.4 11.8Oil 45.8 45.0 46.0 43.0 42.2 40.4 40.5 40.4 39.8Natural gas 10.1 15.7 22.6 22.5 25.0 28.3 26.4 27.5 28.3Nuclear 0.0 0.0 0.0 0.0 0.0 0.0 0.0 0.0 0.0Renewable energy forms 6.7 7.6 10.7 14.0 16.3 17.2 20.6 21.6 22.6
Electricity Generation in GWhe 25753 36783 36029 38740 39365 42452 45276 46542 48814 3.4 0.9 1.4 0.8Nuclear 0 0 0 0 0 0 0 0 0Hydro & wind 657 1207 4270 7658 10703 11011 14550 15314 16793 20.6 9.6 3.1 1.4Thermal (incl. biomass) 25096 35577 31758 31083 28662 31441 30725 31228 32021 2.4 -1.0 0.7 0.4
Fuel Inputs for Thermal Power Generation (1) 6016 8423 7924 7317 6752 6856 6739 6666 6572 2.8 -1.6 0.0 -0.3Solids 5541 6061 3667 4016 3242 2946 2725 2388 2263 -4.0 -1.2 -1.7 -1.8Oil (including refinery gas) 237 1008 1371 650 520 342 280 279 278 19.2 -9.2 -6.0 -0.1Gas 174 975 2112 1851 2151 2436 2136 2201 2161 28.4 0.2 -0.1 0.1Biomass & Waste 65 378 775 801 839 1132 1599 1798 1870 28.2 0.8 6.7 1.6Geothermal heat 0 0 0 0 0 0 0 0 0Hydrogen - Methanol 0 0 0 0 0 0 0 0 0
Fuel Input in other transformation proc. 9035 10721 8965 9603 10175 10247 10321 10177 10023 -0.1 1.3 0.1 -0.3Refineries 8027 9958 8452 8805 8874 8705 8737 8627 8493 0.5 0.5 -0.2 -0.3Biofuels and hydrogen production 0 0 0 107 252 328 444 481 499 5.8 1.2District heating 1004 760 513 690 1050 1214 1139 1070 1032 -6.5 7.4 0.8 -1.0Others 4 2 0 0 0 0 0 0 0
Energy Branch Consumption 726 970 1386 1426 1383 1347 1241 1168 1107 6.7 0.0 -1.1 -1.1Non-Energy Uses 289 291 280 296 318 333 341 345 351 -0.3 1.3 0.7 0.3Final Energy Demand 13797 14736 14876 15397 15934 16284 16497 16366 16413 0.8 0.7 0.3 -0.1by sectorIndustry(1) 2714 3026 3215 3129 3109 3082 3044 3037 3061 1.7 -0.3 -0.2 0.1 - energy intensive industries 1045 1154 1266 1101 1056 1028 994 967 948 1.9 -1.8 -0.6 -0.5 - other industrial sectors 1669 1872 1949 2028 2053 2054 2050 2071 2113 1.6 0.5 0.0 0.3Residential 4043 4472 4141 4293 4443 4604 4700 4621 4665 0.2 0.7 0.6 -0.1Tertiary 3066 2790 2800 2967 3201 3390 3509 3580 3637 -0.9 1.3 0.9 0.4Transport 3974 4448 4720 5008 5181 5207 5244 5127 5051 1.7 0.9 0.1 -0.4by fuel (1)
Solids 402 405 307 150 107 85 68 54 34 -2.7 -10.0 -4.5 -6.6Oil 7056 7132 6950 7139 7186 7136 7029 6827 6706 -0.2 0.3 -0.2 -0.5Gas 1159 1691 1676 1696 1766 1878 1934 1991 2084 3.8 0.5 0.9 0.8Electricity 2517 2686 2791 2827 2980 3152 3309 3343 3447 1.0 0.7 1.1 0.4Heat (from CHP and District Heating) 2098 2227 2590 2865 3061 3154 3197 3158 3136 2.1 1.7 0.4 -0.2Other 566 595 563 719 834 880 960 992 1005 -0.1 4.0 1.4 0.5
CO2 Emissions (Mt of CO2) 51.5 59.2 52.3 50.9 49.0 48.6 46.8 45.2 44.3 0.2 -0.7 -0.5 -0.5Power generation/District heating 24.4 30.2 24.1 22.6 20.6 20.2 18.8 17.9 17.4 -0.2 -1.6 -0.9 -0.8Energy Branch 1.5 2.0 2.3 2.3 2.3 2.2 2.0 1.9 1.7 4.5 0.1 -1.3 -1.5Industry 5.4 5.9 5.3 4.6 4.6 4.6 4.5 4.5 4.5 -0.2 -1.3 -0.3 -0.1Residential 4.9 4.9 3.9 3.5 3.3 3.3 3.3 3.2 3.3 -2.3 -1.7 0.1 0.0Tertiary 3.6 3.1 2.9 3.3 3.5 3.6 3.7 3.7 3.7 -2.0 1.9 0.5 0.1Transport 11.8 13.1 13.9 14.5 14.7 14.7 14.5 14.0 13.7 1.7 0.6 -0.2 -0.5
CO2 Emissions Index (1990=100) 100.0 114.9 101.6 98.9 95.2 94.5 90.9 87.8 86.0
Source: PRIMES
94

DENMARK: Baseline scenario SUMMARY ENERGY BALANCE AND INDICATORS (B)1990 1995 2000 2005 2010 2015 2020 2025 2030 '90-'00 '00-'10 '10-'20 '20-'30
Annual % ChangeMain Energy System IndicatorsPopulation (Million) 5.140 5.230 5.338 5.412 5.465 5.498 5.526 5.557 5.577 0.4 0.2 0.1 0.1GDP (in 000 MEUR'00) 136.3 150.3 171.6 184.6 202.2 218.7 235.2 252.5 269.2 2.3 1.7 1.5 1.4Gross Inl. Cons./GDP (toe/MEUR'00) 131.5 134.7 114.6 105.6 98.1 92.0 85.3 78.0 72.5 -1.4 -1.5 -1.4 -1.6Gross Inl. Cons./Capita (toe/inhabitant) 3.49 3.87 3.68 3.60 3.63 3.66 3.63 3.55 3.50 0.5 -0.1 0.0 -0.4Electricity Generated/Capita (kWh/inhabitant) 5010 7033 6749 7158 7203 7721 8193 8376 8752 3.0 0.7 1.3 0.7Carbon intensity (t of CO2/toe of GIC) 2.87 2.92 2.66 2.61 2.47 2.42 2.33 2.29 2.27 -0.8 -0.7 -0.6 -0.3CO2 Emissions/Capita (t of CO2/inhabitant) 10.01 11.31 9.80 9.41 8.96 8.85 8.46 8.13 7.94 -0.2 -0.9 -0.6 -0.6CO2 Emissions to GDP (t of CO2/MEUR'00) 377.6 393.6 304.9 275.8 242.3 222.3 198.8 178.9 164.4 -2.1 -2.3 -2.0 -1.9Import Dependency % 45.7 34.5 -34.0 -38.8 -43.7 -39.4 -33.8 -21.4 -7.7 0.0 0.0 0.0 0.0
Energy intensity indicators (1990=100)Industry (Energy on Value added) 100.0 102.5 100.5 99.2 91.9 85.0 78.7 73.8 70.2 0.0 -0.9 -1.5 -1.1Residential (Energy on Private Income) 100.0 98.6 84.8 80.1 76.2 73.3 69.8 64.2 60.9 -1.6 -1.1 -0.9 -1.4Tertiary (Energy on Value added) 100.0 84.6 73.6 71.0 69.5 67.9 65.2 61.8 58.7 -3.0 -0.6 -0.6 -1.0Transport (Energy on GDP) 100.0 101.5 94.4 93.1 87.9 81.7 76.5 69.6 64.3 -0.6 -0.7 -1.4 -1.7
Carbon Intensity indicatorsElectricity and Steam production (t of CO2/MWh) 0.44 0.44 0.32 0.28 0.24 0.23 0.20 0.19 0.18 -3.2 -2.7 -1.7 -1.1Final energy demand (t of CO2/toe) 1.85 1.83 1.75 1.69 1.64 1.61 1.57 1.55 1.53 -0.6 -0.6 -0.4 -0.2
Industry 1.98 1.95 1.64 1.48 1.49 1.50 1.48 1.47 1.46 -1.9 -1.0 -0.1 -0.2Residential 1.21 1.09 0.94 0.82 0.73 0.71 0.70 0.70 0.70 -2.5 -2.4 -0.5 0.0Tertiary 1.16 1.11 1.04 1.11 1.09 1.06 1.04 1.03 1.02 -1.1 0.5 -0.5 -0.2Transport 2.96 2.95 2.95 2.90 2.84 2.81 2.76 2.73 2.72 0.0 -0.4 -0.3 -0.1
Electricity and steam generationGeneration Capacity in MWe 11417 12145 12408 12167 13768 14693 15871 0.8 1.0 1.4
Nuclear 0 0 0 0 0 0 0Hydro (pumping excluded) 10 10 10 10 10 10 10 0.0 0.0 0.0Wind 2300 3594 4657 4758 5943 6196 6457 7.3 2.5 0.8Solar 2 3 17 38 69 97 121 25.6 15.3 5.7Thermal 9106 8538 7725 7362 7747 8390 9284 -1.6 0.0 1.8
of which cogeneration units 6968 6961 6450 6524 6773 6563 6408 -0.8 0.5 -0.6Solids fired 5452 4527 3954 3649 3398 2967 2795 -3.2 -1.5 -1.9Gas fired 1857 1844 1870 2239 2239 3086 4061 0.1 1.8 6.1Oil fired 1227 1464 1149 406 365 320 283 -0.7 -10.8 -2.5Biomass-waste fired 570 703 751 1069 1744 2017 2145 2.8 8.8 2.1Fuel Cells 0 0 0 0 0 0 0Geothermal heat 0 0 0 0 0 0 0
IndicatorsEfficiency for thermal electricity production (%) 34.5 36.5 36.5 39.4 39.2 40.3 41.9 0.0 0.0 0.0 0.0Load factor for gross electric capacities (%) 36.0 36.4 36.2 39.8 37.5 36.2 35.1 0.0 0.0 0.0 0.0CHP indicator (% of electricity from CHP) 76.5 74.7 71.5 69.3 66.9 66.0 63.8 0.0 0.0 0.0 0.0Non fossil fuels in electricity generation (%) 21.9 29.4 37.0 38.1 48.1 50.2 51.5 0.0 0.0 0.0 0.0 - nuclear 0.0 0.0 0.0 0.0 0.0 0.0 0.0 0.0 0.0 0.0 0.0 - renewable energy forms 21.9 29.4 37.0 38.1 48.1 50.2 51.5 0.0 0.0 0.0 0.0
Transport sectorPassenger transport activity (Gpkm) 68.6 77.3 83.2 86.3 90.6 94.2 97.6 100.6 103.6 2.0 0.9 0.7 0.6
Public road transport 9.3 10.6 9.1 9.1 9.2 9.1 9.0 9.0 8.9 -0.2 0.1 -0.2 -0.1Private cars and motorcycles 48.2 54.7 59.8 61.4 64.0 65.8 67.5 68.8 70.0 2.2 0.7 0.5 0.4Rail 4.9 4.8 5.3 5.5 5.6 5.7 5.9 6.0 6.1 0.9 0.5 0.4 0.4Aviation 3.5 4.5 6.3 7.5 8.9 10.6 12.2 13.8 15.5 5.9 3.5 3.2 2.4Inland navigation 2.7 2.7 2.6 2.8 2.9 2.9 3.0 3.0 3.1 -0.2 0.9 0.3 0.3
Travel per person (km per capita) 13346 14778 15591 15942 16581 17137 17654 18100 18570 1.6 0.6 0.6 0.5
Freight transport activity (Gtkm) 21.7 26.7 27.5 29.8 33.1 35.8 38.5 41.1 43.8 2.4 1.9 1.5 1.3Trucks 18.1 22.4 24.0 25.9 28.8 31.2 33.5 35.8 38.0 2.9 1.9 1.5 1.3Rail 1.7 2.0 2.0 2.1 2.2 2.4 2.5 2.6 2.8 1.6 1.0 1.0 1.1Inland navigation 1.9 2.3 1.5 1.7 2.0 2.3 2.5 2.8 3.0 -2.4 3.2 2.1 1.9
Freight activity per unit of GDP (tkm/000 Euro'00) 159 177 160 161 164 164 164 163 163 0.1 0.2 0.0 -0.1
Energy demand in transport (ktoe) 3974 4448 4720 5008 5181 5207 5244 5127 5051 1.7 0.9 0.1 -0.4Public road transport 131 140 134 134 132 126 118 108 100 0.2 -0.1 -1.2 -1.7Private cars and motorcycles 1589 1820 1972 2017 1921 1761 1724 1646 1547 2.2 -0.3 -1.1 -1.1Trucks 1343 1511 1574 1700 1886 2016 2083 2128 2122 1.6 1.8 1.0 0.2Rail 113 118 103 101 98 90 62 58 58 -1.0 -0.5 -4.5 -0.6Aviation 648 678 822 931 1004 1067 1103 1026 1058 2.4 2.0 0.9 -0.4Inland navigation 150 181 115 126 140 147 155 161 166 -2.6 1.9 1.0 0.7
Efficiency indicator (activity related)Passenger transport (toe/Mpkm) 36.6 36.7 37.0 37.5 35.4 32.9 31.4 28.8 27.3 0.1 -0.4 -1.2 -1.4Freight transport (toe/Mtkm) 67.5 60.4 59.5 59.5 59.4 58.8 56.6 54.2 50.9 -1.3 0.0 -0.5 -1.1
95

ESTONIA: Baseline scenario SUMMARY ENERGY BALANCE AND INDICATORS (A) ktoe 1990 1995 2000 2005 2010 2015 2020 2025 2030 '90-'00 '00-'10 '10-'20 '20-'30
Annual % ChangePrimary Production 5480 3344 3170 3192 2685 2878 2710 2799 2917 -5.3 -1.6 0.1 0.7
Solids 5020 2863 2667 2691 2096 2236 2005 2015 1897 -6.1 -2.4 -0.4 -0.6Oil 0 0 2 0 0 0 0 0 0Natural gas 0 0 0 0 0 0 0 0 0Nuclear 0 0 0 0 0 0 0 0 0Renewable energy sources 460 481 501 502 589 641 705 784 1019 0.9 1.6 1.8 3.8
Hydro 0 0 0 1 2 4 5 8 8 17.6 9.5 4.4Biomass & Waste 460 481 501 497 543 582 626 696 833 0.8 0.8 1.4 2.9Wind 0 0 0 1 40 47 62 66 160 4.6 9.9Solar and others 0 0 0 2 4 8 12 14 18 10.1 4.2Geothermal 0 0 0 0 0 0 0 0 0
Net Imports 4463 1934 1490 1944 2434 2638 3098 3391 3498 -10.4 5.0 2.4 1.2Solids 697 293 282 110 132 146 148 168 103 -8.6 -7.3 1.2 -3.6Oil 3146 1182 626 1233 1365 1506 1649 1752 1957 -14.9 8.1 1.9 1.7 - Crude oil and Feedstocks 0 0 0 1 1 1 1 2 2 1.9 1.7 - Oil products 3146 1182 626 1231 1364 1504 1647 1751 1955 -14.9 8.1 1.9 1.7Natural gas 1222 524 662 701 1026 1067 1332 1474 1440 -5.9 4.5 2.6 0.8Electricity -602 -65 -80 -100 -90 -80 -31 -4 -3
Gross Inland Consumption 9883 5280 4572 5017 4986 5363 5635 5997 6203 -7.4 0.9 1.2 1.0Solids 5938 3305 2979 2801 2228 2383 2153 2183 2000 -6.7 -2.9 -0.3 -0.7Oil 2865 1035 510 1113 1233 1353 1476 1560 1746 -15.9 9.2 1.8 1.7Natural gas 1222 524 662 701 1026 1067 1332 1474 1440 -5.9 4.5 2.6 0.8Nuclear 0 0 0 0 0 0 0 0 0Electricity -602 -65 -80 -100 -90 -80 -31 -4 -3Renewable energy forms 460 481 501 502 589 641 705 784 1019 0.9 1.6 1.8 3.8
as % in Gross Inland ConsumptionSolids 60.1 62.6 65.2 55.8 44.7 44.4 38.2 36.4 32.2Oil 29.0 19.6 11.2 22.2 24.7 25.2 26.2 26.0 28.1Natural gas 12.4 9.9 14.5 14.0 20.6 19.9 23.6 24.6 23.2Nuclear 0.0 0.0 0.0 0.0 0.0 0.0 0.0 0.0 0.0Renewable energy forms 4.7 9.1 11.0 10.0 11.8 12.0 12.5 13.1 16.4
Electricity Generation in GWhe 17178 8691 8511 10144 10870 11943 12495 13407 14376 -6.8 2.5 1.4 1.4Nuclear 0 0 0 0 0 0 0 0 0Hydro & wind 0 2 6 26 492 596 799 868 1978 55.4 5.0 9.5Thermal (incl. biomass) 17178 8689 8505 10118 10378 11347 11697 12539 12397 -6.8 2.0 1.2 0.6
Fuel Inputs for Thermal Power Generation (1) 5654 2666 2445 2699 2353 2438 2391 2543 2533 -8.0 -0.4 0.2 0.6Solids 5085 2491 2199 2641 2054 2206 1985 2002 1887 -8.0 -0.7 -0.3 -0.5Oil (including refinery gas) 210 80 12 17 9 8 7 6 6 -25.2 -2.0 -3.1 -1.5Gas 357 93 226 21 276 209 331 381 360 -4.5 2.0 1.8 0.8Biomass & Waste 2 2 9 21 13 15 68 153 280 15.9 3.7 17.6 15.2Geothermal heat 0 0 0 0 0 0 0 0 0Hydrogen - Methanol 0 0 0 0 0 0 0 0 0
Fuel Input in other transformation proc. 1899 767 662 534 584 602 626 629 585 -10.0 -1.2 0.7 -0.7Refineries 1 1 1 1 1 1 1 2 2 0.0 2.1 1.9 1.7Biofuels and hydrogen production 0 0 0 14 46 63 84 101 119 6.2 3.5District heating 1608 479 455 490 510 518 524 513 452 -11.9 1.2 0.3 -1.5Others 290 286 206 30 26 21 16 15 12 -3.4 -18.8 -4.5 -3.4
Energy Branch Consumption 295 148 179 155 133 131 123 124 120 -4.9 -3.0 -0.7 -0.3Non-Energy Uses 76 212 219 218 259 301 338 365 381 11.2 1.7 2.7 1.2Final Energy Demand 6002 2648 2368 2828 3201 3552 3904 4203 4495 -8.9 3.1 2.0 1.4by sectorIndustry(1) 2733 778 535 644 733 832 921 1005 1076 -15.1 3.2 2.3 1.6 - energy intensive industries 737 430 208 225 251 280 309 333 350 -11.9 1.9 2.1 1.3 - other industrial sectors 1996 348 326 418 483 552 612 671 726 -16.6 4.0 2.4 1.7Residential 1271 1118 928 1001 1100 1172 1240 1296 1341 -3.1 1.7 1.2 0.8Tertiary 1159 262 328 480 580 637 709 770 825 -11.8 5.9 2.0 1.5Transport 839 490 577 703 788 911 1033 1133 1253 -3.7 3.2 2.7 1.9by fuel (1)
Solids 691 193 117 97 96 92 83 80 71 -16.3 -1.9 -1.5 -1.5Oil 1803 855 748 920 1028 1149 1269 1368 1488 -8.4 3.2 2.1 1.6Gas 439 189 134 268 311 375 442 494 529 -11.2 8.7 3.6 1.8Electricity 585 386 427 558 677 791 909 1018 1105 -3.1 4.7 3.0 2.0Heat (from CHP and District Heating) 2086 593 525 584 642 657 685 715 753 -12.9 2.0 0.7 0.9Other 397 432 417 401 448 489 515 527 549 0.5 0.7 1.4 0.6
CO2 Emissions (Mt of CO2) 37.1 15.9 13.9 16.0 14.5 15.5 15.4 16.0 15.7 -9.4 0.5 0.6 0.2Power generation/District heating 27.3 12.1 10.7 12.2 10.3 10.8 10.2 10.4 9.8 -8.9 -0.4 -0.1 -0.5Energy Branch 0.4 0.0 0.2 0.0 0.0 0.0 0.0 0.0 0.0 -9.8 -14.6 1.3 -5.0Industry 4.5 1.7 0.8 1.0 1.1 1.2 1.3 1.4 1.4 -16.1 3.5 1.7 0.6Residential 1.2 0.5 0.3 0.2 0.3 0.3 0.3 0.3 0.3 -13.3 -0.2 1.4 0.8Tertiary 1.2 0.3 0.3 0.5 0.6 0.7 0.7 0.8 0.9 -14.0 8.6 2.0 1.4Transport 2.4 1.4 1.7 2.0 2.2 2.5 2.8 3.1 3.4 -3.6 2.7 2.4 1.9
CO2 Emissions Index (1990=100) 100.0 42.9 37.5 43.0 39.2 41.8 41.6 43.2 42.5
Source: PRIMES
96

ESTONIA: Baseline scenario SUMMARY ENERGY BALANCE AND INDICATORS (B)1990 1995 2000 2005 2010 2015 2020 2025 2030 '90-'00 '00-'10 '10-'20 '20-'30
Annual % ChangeMain Energy System IndicatorsPopulation (Million) 1.571 1.448 1.372 1.345 1.314 1.279 1.248 1.224 1.202 -1.3 -0.4 -0.5 -0.4GDP (in 000 MEUR'00) 6.6 4.5 5.9 8.0 10.3 12.8 15.4 18.3 20.9 -1.1 5.6 4.2 3.1Gross Inl. Cons./GDP (toe/MEUR'00) 1492.8 1166.4 771.5 627.3 485.9 419.1 365.3 328.4 297.1 -6.4 -4.5 -2.8 -2.0Gross Inl. Cons./Capita (toe/inhabitant) 6.29 3.65 3.33 3.73 3.79 4.19 4.52 4.90 5.16 -6.2 1.3 1.8 1.3Electricity Generated/Capita (kWh/inhabitant) 10934 6002 6204 7542 8272 9338 10014 10953 11955 -5.5 2.9 1.9 1.8Carbon intensity (t of CO2/toe of GIC) 3.75 3.01 3.04 3.18 2.92 2.89 2.74 2.67 2.54 -2.1 -0.4 -0.6 -0.7CO2 Emissions/Capita (t of CO2/inhabitant) 23.61 10.98 10.12 11.86 11.07 12.12 12.35 13.08 13.10 -8.1 0.9 1.1 0.6CO2 Emissions to GDP (t of CO2/MEUR'00) 5601.3 3513.2 2344.1 1995.3 1417.8 1211.3 999.1 876.9 754.5 -8.3 -4.9 -3.4 -2.8Import Dependency % 44.4 36.0 31.9 37.8 47.5 47.8 53.3 54.8 54.5 0.0 0.0 0.0 0.0
Energy intensity indicators (1990=100)Industry (Energy on Value added) 100.0 56.6 28.0 20.5 17.5 15.6 14.2 13.0 12.1 -11.9 -4.6 -2.1 -1.6Residential (Energy on Private Income) 100.0 125.3 76.7 60.2 51.2 43.5 38.0 33.4 30.2 -2.6 -4.0 -2.9 -2.3Tertiary (Energy on Value added) 100.0 28.8 27.8 32.8 31.7 28.2 26.1 24.0 22.3 -12.0 1.3 -1.9 -1.6Transport (Energy on GDP) 100.0 85.5 76.9 69.4 60.6 56.2 52.8 49.0 47.4 -2.6 -2.4 -1.4 -1.1
Carbon Intensity indicatorsElectricity and Steam production (t of CO2/MWh) 0.64 0.70 0.67 0.66 0.52 0.50 0.46 0.44 0.39 0.4 -2.6 -1.2 -1.7Final energy demand (t of CO2/toe) 1.56 1.44 1.28 1.33 1.31 1.32 1.32 1.33 1.33 -2.0 0.2 0.1 0.0
Industry 1.66 2.18 1.48 1.59 1.52 1.48 1.43 1.39 1.31 -1.2 0.3 -0.6 -0.9Residential 0.92 0.41 0.30 0.25 0.25 0.26 0.26 0.25 0.26 -10.5 -1.9 0.2 0.0Tertiary 1.04 0.96 0.81 0.99 1.05 1.06 1.04 1.03 1.03 -2.4 2.6 -0.1 -0.1Transport 2.89 2.90 2.92 2.87 2.78 2.73 2.70 2.70 2.70 0.1 -0.5 -0.3 0.0
Electricity and steam generationGeneration Capacity in MWe 2707 2597 3312 2724 2840 3152 3780 2.0 -1.5 2.9
Nuclear 0 0 0 0 0 0 0Hydro (pumping excluded) 1 2 3 5 7 10 11 10.1 9.5 4.4Wind 0 7 159 187 269 285 704 95.0 5.4 10.1Solar 0 0 2 5 8 11 13 18.2 5.2Thermal 2706 2588 3148 2527 2555 2846 3052 1.5 -2.1 1.8
of which cogeneration units 358 758 882 1013 883 967 1128 9.4 0.0 2.5Solids fired 2498 2380 2730 2090 1690 1690 1690 0.9 -4.7 0.0Gas fired 190 190 400 423 430 519 519 7.7 0.7 1.9Oil fired 10 10 10 5 5 7 9 0.0 -7.7 7.0Biomass-waste fired 8 8 8 9 431 630 834 0.0 49.0 6.8Fuel Cells 0 0 0 0 0 0 0Geothermal heat 0 0 0 0 0 0 0
IndicatorsEfficiency for thermal electricity production (%) 29.9 32.2 37.9 40.0 42.1 42.4 42.1 0.0 0.0 0.0 0.0Load factor for gross electric capacities (%) 35.9 44.6 37.5 50.1 50.2 48.6 43.4 0.0 0.0 0.0 0.0CHP indicator (% of electricity from CHP) 19.5 20.7 34.6 31.5 34.7 34.8 36.8 0.0 0.0 0.0 0.0Non fossil fuels in electricity generation (%) 0.4 0.8 4.9 5.6 9.3 12.1 22.9 0.0 0.0 0.0 0.0 - nuclear 0.0 0.0 0.0 0.0 0.0 0.0 0.0 0.0 0.0 0.0 0.0 - renewable energy forms 0.4 0.8 4.9 5.6 9.3 12.1 22.9 0.0 0.0 0.0 0.0
Transport sectorPassenger transport activity (Gpkm) 11.6 7.5 7.7 8.6 9.3 10.2 11.2 12.1 13.2 -3.9 1.9 1.8 1.7
Public road transport 4.5 2.1 2.6 2.5 2.4 2.3 2.2 2.2 2.1 -5.1 -0.7 -0.9 -0.6Private cars and motorcycles 5.1 4.7 4.3 5.1 5.9 6.8 7.7 8.6 9.6 -1.7 3.2 2.7 2.2Rail 1.5 0.4 0.3 0.3 0.2 0.2 0.2 0.3 0.3 -16.0 -0.7 0.1 0.3Aviation 0.2 0.1 0.2 0.3 0.4 0.5 0.6 0.7 0.8 2.8 5.3 4.1 3.3Inland navigation 0.3 0.2 0.3 0.3 0.4 0.4 0.4 0.4 0.5 0.7 1.7 1.1 1.1
Travel per person (km per capita) 7353 5179 5648 6371 7105 7996 8941 9906 10983 -2.6 2.3 2.3 2.1
Freight transport activity (Gtkm) 11.5 5.4 11.8 15.0 17.9 20.7 23.3 25.6 27.7 0.3 4.3 2.7 1.7Trucks 4.5 1.5 3.7 4.7 5.6 7.3 9.2 11.3 13.4 -2.0 4.3 5.1 3.8Rail 7.0 3.8 8.1 10.3 12.3 13.5 14.1 14.3 14.3 1.5 4.3 1.4 0.2Inland navigation 0.0 0.0 0.0 0.0 0.0 0.0 0.0 0.0 0.0
Freight activity per unit of GDP (tkm/000 Euro'00) 1735 1192 1990 1876 1745 1620 1511 1401 1327 1.4 -1.3 -1.4 -1.3
Energy demand in transport (ktoe) 839 490 577 703 788 911 1033 1133 1253 -3.7 3.2 2.7 1.9Public road transport 82 41 42 40 39 36 34 31 28 -6.5 -0.7 -1.4 -1.8Private cars and motorcycles 234 243 228 271 284 295 323 345 373 -0.3 2.2 1.3 1.5Trucks 414 139 227 291 346 446 539 627 725 -5.8 4.3 4.5 3.0Rail 65 44 51 65 76 83 84 78 76 -2.4 4.1 0.9 -0.9Aviation 36 18 22 28 35 41 45 41 40 -5.0 4.9 2.7 -1.2Inland navigation 7 4 7 8 8 9 9 10 10 0.0 1.7 1.1 0.9
Efficiency indicator (activity related)Passenger transport (toe/Mpkm) 35.4 41.9 39.0 41.0 39.5 37.5 37.0 35.4 34.3 1.0 0.1 -0.6 -0.8Freight transport (toe/Mtkm) 37.4 32.6 23.3 23.5 23.4 25.4 26.6 27.5 28.9 -4.6 0.0 1.3 0.8
97

FINLAND: Baseline scenario SUMMARY ENERGY BALANCE AND INDICATORS (A) ktoe 1990 1995 2000 2005 2010 2015 2020 2025 2030 '90-'00 '00-'10 '10-'20 '20-'30
Annual % ChangePrimary Production 11970 13162 15016 16556 19409 19734 20457 22607 22896 2.3 2.6 0.5 1.1
Solids 1459 2061 1207 1935 1560 1500 1073 1000 1000 -1.9 2.6 -3.7 -0.7Oil 0 0 0 0 0 0 0 0 0Natural gas 0 0 0 0 0 0 0 0 0Nuclear 5006 4957 5799 5916 8873 8882 8927 10593 10649 1.5 4.3 0.1 1.8Renewable energy sources 5505 6144 8010 8705 8976 9351 10458 11014 11248 3.8 1.1 1.5 0.7
Hydro 934 1110 1261 1169 1188 1194 1202 1220 1234 3.0 -0.6 0.1 0.3Biomass & Waste 4571 5033 6743 7507 7700 8002 8999 9321 9287 4.0 1.3 1.6 0.3Wind 0 1 7 24 75 129 203 401 637 27.4 10.4 12.1Solar and others 0 0 0 5 13 27 54 72 90 50.3 15.6 5.3Geothermal 0 0 0 0 0 0 0 0 0
Net Imports 18031 15418 18542 20788 20974 21283 20813 18637 17621 0.3 1.2 -0.1 -1.7Solids 4378 3773 3533 5112 4787 4181 3281 2155 1312 -2.1 3.1 -3.7 -8.8Oil 10477 8205 10566 11104 11467 11493 11532 10883 10485 0.1 0.8 0.1 -0.9 - Crude oil and Feedstocks 8890 8548 12146 11735 12065 12079 12169 11519 11137 3.2 -0.1 0.1 -0.9 - Oil products 1587 -343 -1580 -630 -598 -586 -637 -636 -652Natural gas 2261 2839 3422 4042 4297 5086 5656 5317 5552 4.2 2.3 2.8 -0.2Electricity 915 600 1021 530 422 523 343 283 272 1.1 -8.5 -2.0 -2.3
Gross Inland Consumption 28699 28834 32508 36676 39699 40336 40596 40582 39862 1.3 2.0 0.2 -0.2Solids 5073 5949 5047 7047 6347 5681 4354 3155 2312 -0.1 2.3 -3.7 -6.1Oil 9939 8344 9209 10436 10783 10812 10858 10221 9830 -0.8 1.6 0.1 -1.0Natural gas 2261 2839 3422 4042 4297 5086 5656 5317 5552 4.2 2.3 2.8 -0.2Nuclear 5006 4957 5799 5916 8873 8882 8927 10593 10649 1.5 4.3 0.1 1.8Electricity 915 600 1021 530 422 523 343 283 272 1.1 -8.5 -2.0 -2.3Renewable energy forms 5505 6144 8010 8705 8976 9351 10458 11014 11248 3.8 1.1 1.5 0.7
as % in Gross Inland ConsumptionSolids 17.7 20.6 15.5 19.2 16.0 14.1 10.7 7.8 5.8Oil 34.6 28.9 28.3 28.5 27.2 26.8 26.7 25.2 24.7Natural gas 7.9 9.8 10.5 11.0 10.8 12.6 13.9 13.1 13.9Nuclear 17.4 17.2 17.8 16.1 22.4 22.0 22.0 26.1 26.7Renewable energy forms 19.2 21.3 24.6 23.7 22.6 23.2 25.8 27.1 28.2
Electricity Generation in GWhe 54367 63874 69976 85267 93913 98070 104318 108037 109530 2.6 3.0 1.1 0.5Nuclear 19213 19213 22475 22929 34393 34427 34599 41059 41274 1.6 4.3 0.1 1.8Hydro & wind 10857 12923 14735 13878 14693 15386 16345 18852 21758 3.1 0.0 1.1 2.9Thermal (incl. biomass) 24298 31738 32766 48460 44827 48256 53373 48126 46498 3.0 3.2 1.8 -1.4
Fuel Inputs for Thermal Power Generation (1) 7734 9476 10914 13992 13376 13460 13603 12116 11527 3.5 2.1 0.2 -1.6Solids 3149 4003 3222 5489 4995 4471 3242 2159 1421 0.2 4.5 -4.2 -7.9Oil (including refinery gas) 294 257 315 355 788 725 516 679 723 0.7 9.6 -4.1 3.4Gas 1214 1697 2415 2775 2695 3563 4279 4152 4416 7.1 1.1 4.7 0.3Biomass & Waste 3077 3519 4962 5373 4898 4700 5566 5125 4966 4.9 -0.1 1.3 -1.1Geothermal heat 0 0 0 0 0 0 0 0 0Hydrogen - Methanol 0 0 0 0 0 0 0 0 0
Fuel Input in other transformation proc. 12061 14005 15350 15866 16363 16495 16553 15897 15385 2.4 0.6 0.1 -0.7Refineries 10689 12029 13231 13487 13928 13959 14007 13218 12734 2.2 0.5 0.1 -0.9Biofuels and hydrogen production 0 0 0 15 69 149 200 229 245 11.2 2.0District heating 573 548 792 1162 1277 1386 1391 1585 1626 3.3 4.9 0.9 1.6Others 799 1428 1327 1203 1088 1001 956 865 781 5.2 -2.0 -1.3 -2.0
Energy Branch Consumption 781 946 1119 1249 1324 1349 1348 1176 1101 3.7 1.7 0.2 -2.0Non-Energy Uses 1408 831 843 989 1070 1076 1066 1049 1034 -5.0 2.4 0.0 -0.3Final Energy Demand 21464 22068 24473 26235 27367 27964 28242 27953 27527 1.3 1.1 0.3 -0.3by sectorIndustry(1) 9401 10017 12073 12509 12625 12478 12265 12099 11879 2.5 0.4 -0.3 -0.3 - energy intensive industries 7726 8123 10380 10596 10575 10355 10086 9866 9622 3.0 0.2 -0.5 -0.5 - other industrial sectors 1675 1893 1694 1913 2050 2122 2179 2233 2257 0.1 1.9 0.6 0.4Residential 5319 5460 4922 5260 5635 5901 6009 6054 6078 -0.8 1.4 0.6 0.1Tertiary 2479 2486 3086 3846 4445 4966 5329 5483 5571 2.2 3.7 1.8 0.4Transport 4265 4106 4391 4621 4662 4620 4639 4317 3999 0.3 0.6 0.0 -1.5by fuel (1)
Solids 1428 1178 1022 873 732 648 595 536 483 -3.3 -3.3 -2.1 -2.1Oil 8056 7732 7834 8564 8927 9026 8973 8513 8098 -0.3 1.3 0.1 -1.0Gas 1307 1393 1073 1079 1107 1164 1342 1380 1423 -2.0 0.3 1.9 0.6Electricity 5068 5615 6487 7243 7847 8293 8654 8912 9042 2.5 1.9 1.0 0.4Heat (from CHP and District Heating) 4236 4728 6494 7011 7059 6900 6610 5962 5736 4.4 0.8 -0.7 -1.4Other 1369 1420 1563 1466 1695 1932 2068 2651 2745 1.3 0.8 2.0 2.9
CO2 Emissions (Mt of CO2) 53.1 56.1 54.4 65.8 64.5 63.9 60.0 52.7 48.8 0.2 1.7 -0.7 -2.0Power generation/District heating 18.0 22.5 21.6 31.3 29.6 28.9 24.9 20.8 18.6 1.9 3.2 -1.7 -2.9Energy Branch 1.4 1.7 1.8 2.0 1.9 1.8 1.9 0.3 0.0 2.8 0.6 0.1 -32.6Industry 12.8 12.0 11.7 11.9 11.6 11.2 10.8 10.4 9.9 -0.9 -0.1 -0.7 -0.9Residential 6.4 6.1 3.5 3.1 3.4 3.6 3.7 3.6 3.6 -5.8 -0.3 0.8 -0.4Tertiary 2.1 1.8 2.9 3.9 4.5 5.1 5.4 5.4 5.5 3.3 4.5 1.8 0.1Transport 12.5 12.0 12.9 13.5 13.5 13.2 13.1 12.1 11.1 0.3 0.5 -0.3 -1.6
CO2 Emissions Index (1990=100) 100.0 105.6 102.4 123.8 121.5 120.2 112.9 99.1 91.8
Source: PRIMES
98

FINLAND: Baseline scenario SUMMARY ENERGY BALANCE AND INDICATORS (B)1990 1995 2000 2005 2010 2015 2020 2025 2030 '90-'00 '00-'10 '10-'20 '20-'30
Annual % ChangeMain Energy System IndicatorsPopulation (Million) 4.986 5.108 5.176 5.236 5.294 5.353 5.405 5.439 5.443 0.4 0.2 0.2 0.1GDP (in 000 MEUR'00) 108.1 103.3 130.1 147.4 163.9 180.3 197.4 214.1 227.6 1.9 2.3 1.9 1.4Gross Inl. Cons./GDP (toe/MEUR'00) 265.6 279.0 249.8 248.9 242.1 223.7 205.6 189.5 175.2 -0.6 -0.3 -1.6 -1.6Gross Inl. Cons./Capita (toe/inhabitant) 5.76 5.64 6.28 7.00 7.50 7.53 7.51 7.46 7.32 0.9 1.8 0.0 -0.3Electricity Generated/Capita (kWh/inhabitant) 10904 12505 13519 16285 17738 18319 19301 19864 20122 2.2 2.8 0.8 0.4Carbon intensity (t of CO2/toe of GIC) 1.85 1.95 1.67 1.79 1.63 1.58 1.48 1.30 1.22 -1.0 -0.3 -1.0 -1.9CO2 Emissions/Capita (t of CO2/inhabitant) 10.65 10.98 10.51 12.56 12.19 11.93 11.10 9.68 8.96 -0.1 1.5 -0.9 -2.1CO2 Emissions to GDP (t of CO2/MEUR'00) 491.5 543.0 418.1 446.3 393.6 354.1 303.8 246.0 214.4 -1.6 -0.6 -2.6 -3.4Import Dependency % 61.6 52.9 55.9 55.7 51.9 51.9 50.4 45.2 43.5 0.0 0.0 0.0 0.0
Energy intensity indicators (1990=100)Industry (Energy on Value added) 100.0 101.1 85.6 78.2 70.8 63.5 56.9 52.0 48.4 -1.5 -1.9 -2.2 -1.6Residential (Energy on Private Income) 100.0 108.4 81.9 76.6 74.7 71.7 67.3 62.9 59.6 -2.0 -0.9 -1.0 -1.2Tertiary (Energy on Value added) 100.0 105.4 107.0 116.9 120.4 121.2 117.9 110.9 105.1 0.7 1.2 -0.2 -1.1Transport (Energy on GDP) 100.0 100.7 85.5 79.5 72.0 64.9 59.5 51.1 44.5 -1.6 -1.7 -1.9 -2.9
Carbon Intensity indicatorsElectricity and Steam production (t of CO2/MWh) 0.17 0.19 0.14 0.18 0.16 0.16 0.13 0.11 0.10 -1.6 1.3 -2.0 -2.9Final energy demand (t of CO2/toe) 1.57 1.45 1.27 1.24 1.21 1.18 1.17 1.13 1.09 -2.1 -0.5 -0.3 -0.7
Industry 1.36 1.20 0.97 0.95 0.92 0.90 0.88 0.86 0.84 -3.3 -0.5 -0.4 -0.6Residential 1.20 1.11 0.72 0.59 0.61 0.62 0.62 0.60 0.59 -5.0 -1.6 0.2 -0.5Tertiary 0.84 0.71 0.93 1.02 1.01 1.02 1.01 0.98 0.98 1.1 0.8 0.0 -0.3Transport 2.94 2.93 2.94 2.93 2.90 2.86 2.83 2.81 2.79 0.0 -0.1 -0.2 -0.2
Electricity and steam generationGeneration Capacity in MWe 15403 16950 19654 22229 24058 25679 27058 2.5 2.0 1.2
Nuclear 2760 2760 4360 4360 4360 5116 4996 4.7 0.0 1.4Hydro (pumping excluded) 3059 3068 3103 3120 3148 3176 3194 0.1 0.1 0.1Wind 38 108 307 515 805 1786 3070 23.2 10.1 14.3Solar 3 5 9 15 24 35 45 14.0 10.1 6.5Thermal 9543 11009 11875 14219 15720 15566 15753 2.2 2.8 0.0
of which cogeneration units 5596 5810 6158 7093 7986 7391 7816 1.0 2.6 -0.2Solids fired 5286 4965 4873 3924 3105 2375 1771 -0.8 -4.4 -5.5Gas fired 1869 3177 3726 5561 6514 6293 6705 7.1 5.7 0.3Oil fired 605 673 586 976 976 976 1211 -0.3 5.2 2.2Biomass-waste fired 1783 2194 2690 3759 5125 5922 6067 4.2 6.7 1.7Fuel Cells 0 0 0 0 0 0 0Geothermal heat 0 0 0 0 0 0 0
IndicatorsEfficiency for thermal electricity production (%) 25.8 29.8 28.8 30.8 33.7 34.2 34.7 0.0 0.0 0.0 0.0Load factor for gross electric capacities (%) 51.9 57.4 54.5 50.4 49.5 48.0 46.2 0.0 0.0 0.0 0.0CHP indicator (% of electricity from CHP) 38.5 32.1 32.3 32.2 31.3 29.0 28.6 0.0 0.0 0.0 0.0Non fossil fuels in electricity generation (%) 66.8 55.2 64.1 62.6 65.0 70.7 71.8 0.0 0.0 0.0 0.0 - nuclear 32.1 26.9 36.6 35.1 33.2 38.0 37.7 0.0 0.0 0.0 0.0 - renewable energy forms 34.7 28.3 27.5 27.5 31.9 32.7 34.2 0.0 0.0 0.0 0.0
Transport sectorPassenger transport activity (Gpkm) 70.7 69.6 77.3 81.6 87.2 94.3 101.2 103.8 104.5 0.9 1.2 1.5 0.3
Public road transport 8.5 8.0 7.7 7.6 7.5 7.3 7.2 7.2 7.1 -1.0 -0.3 -0.4 0.0Private cars and motorcycles 52.0 50.9 56.6 59.4 63.2 68.6 73.9 75.8 76.3 0.9 1.1 1.6 0.3Rail 3.7 3.6 3.9 4.1 4.3 4.5 4.6 4.7 4.7 0.6 1.0 0.6 0.2Aviation 3.7 3.9 5.7 7.0 8.5 10.0 11.6 12.1 12.3 4.3 4.1 3.1 0.6Inland navigation 2.8 3.3 3.4 3.5 3.7 3.9 4.0 4.1 4.1 1.9 1.0 0.8 0.3
Travel per person (km per capita) 14176 13626 14929 15581 16474 17622 18727 19081 19199 0.5 1.0 1.3 0.2
Freight transport activity (Gtkm) 35.8 34.5 42.4 44.0 45.6 46.0 46.2 46.3 46.4 1.7 0.7 0.1 0.0Trucks 26.3 24.5 32.0 33.3 34.8 35.1 35.2 35.2 35.2 2.0 0.9 0.1 0.0Rail 8.4 9.6 10.1 10.4 10.7 10.8 11.0 11.1 11.2 1.9 0.5 0.3 0.2Inland navigation 1.1 0.4 0.3 0.2 0.1 0.1 0.0 0.0 0.0 -12.2 -8.2 -10.0 -3.8
Freight activity per unit of GDP (tkm/000 Euro'00) 331 334 326 298 278 255 234 216 204 -0.2 -1.6 -1.7 -1.4
Energy demand in transport (ktoe) 4265 4106 4391 4621 4662 4620 4639 4317 3999 0.3 0.6 0.0 -1.5Public road transport 175 153 119 116 113 107 99 91 84 -3.8 -0.4 -1.3 -1.7Private cars and motorcycles 2303 2204 2295 2403 2337 2262 2330 2224 2054 0.0 0.2 0.0 -1.3Trucks 1153 1148 1257 1308 1365 1362 1321 1266 1195 0.9 0.8 -0.3 -1.0Rail 99 105 94 91 86 77 52 47 44 -0.6 -0.8 -4.8 -1.7Aviation 463 411 508 607 692 754 793 648 583 0.9 3.1 1.4 -3.0Inland navigation 71 85 118 96 68 57 44 41 39 5.2 -5.5 -4.2 -1.1
Efficiency indicator (activity related)Passenger transport (toe/Mpkm) 42.7 40.9 38.8 39.3 36.9 33.9 32.5 29.1 26.6 -1.0 -0.5 -1.3 -2.0Freight transport (toe/Mtkm) 34.8 36.5 32.9 32.3 31.7 31.0 29.3 27.9 26.3 -0.6 -0.4 -0.8 -1.1
99

FRANCE: Baseline scenario SUMMARY ENERGY BALANCE AND INDICATORS (A) ktoe 1990 1995 2000 2005 2010 2015 2020 2025 2030 '90-'00 '00-'10 '10-'20 '20-'30
Annual % ChangePrimary Production 108419 123325 131318 136453 137199 148050 150830 144615 138097 1.9 0.4 1.0 -0.9
Solids 7625 5359 2704 500 400 200 0 0 0 -9.8 -17.4Oil 3491 3287 2472 1700 0 0 0 0 0 -3.4Natural gas 2516 2793 1505 1400 0 0 0 0 0 -5.0Nuclear 79131 93990 107093 113753 113764 122470 122593 111867 103709 3.1 0.6 0.8 -1.7Renewable energy sources 15656 17896 17545 19101 23034 25380 28238 32748 34388 1.1 2.8 2.1 2.0
Hydro 4636 6315 5805 5935 6119 6604 6778 7201 7415 2.3 0.5 1.0 0.9Biomass & Waste 10897 11434 11584 12886 15417 16235 18337 20874 21367 0.6 2.9 1.8 1.5Wind 0 1 7 62 1232 2206 2684 4094 4874 68.6 8.1 6.1Solar and others 12 15 25 84 127 194 299 442 598 7.7 17.5 8.9 7.2Geothermal 110 132 124 133 139 140 138 137 134 1.2 1.1 0.0 -0.3
Net Imports 120027 115917 133458 144766 148658 143522 143532 143155 148012 1.1 1.1 -0.4 0.3Solids 13004 9010 13201 16396 16633 10035 9454 9577 11506 0.2 2.3 -5.5 2.0Oil 86558 85419 90452 97225 98076 97155 96022 93460 94225 0.4 0.8 -0.2 -0.2 - Crude oil and Feedstocks 76007 78819 84375 86990 88079 87524 86776 84540 85568 1.0 0.4 -0.1 -0.1 - Oil products 10551 6600 6077 10235 9997 9631 9246 8920 8657 -5.4 5.1 -0.8 -0.7Natural gas 24371 27493 35778 36571 39206 41423 42308 42662 43541 3.9 0.9 0.8 0.3Electricity -3907 -6005 -5974 -5426 -5257 -5090 -4252 -2543 -1260
Gross Inland Consumption 224541 236245 258493 278126 282539 288090 290735 284034 282245 1.4 0.9 0.3 -0.3Solids 19955 15287 15677 16896 17033 10235 9454 9577 11506 -2.4 0.8 -5.7 2.0Oil 87673 85500 88385 95832 94759 93673 92394 89724 90361 0.1 0.7 -0.3 -0.2Natural gas 26032 29577 35766 37971 39206 41423 42308 42662 43541 3.2 0.9 0.8 0.3Nuclear 79131 93990 107093 113753 113764 122470 122593 111867 103709 3.1 0.6 0.8 -1.7Electricity -3907 -6005 -5974 -5426 -5257 -5090 -4252 -2543 -1260Renewable energy forms 15656 17896 17545 19101 23034 25380 28238 32748 34388 1.1 2.8 2.1 2.0
as % in Gross Inland ConsumptionSolids 8.9 6.5 6.1 6.1 6.0 3.6 3.3 3.4 4.1Oil 39.0 36.2 34.2 34.5 33.5 32.5 31.8 31.6 32.0Natural gas 11.6 12.5 13.8 13.7 13.9 14.4 14.6 15.0 15.4Nuclear 35.2 39.8 41.4 40.9 40.3 42.5 42.2 39.4 36.7Renewable energy forms 7.0 7.6 6.8 6.9 8.2 8.8 9.7 11.5 12.2
Electricity Generation in GWhe 416078 490051 535680 575120 604177 628459 643312 643232 641932 2.6 1.2 0.6 0.0Nuclear 314024 377163 415087 440902 440946 474691 475165 433593 401972 2.8 0.6 0.8 -1.7Hydro & wind 53909 73439 67576 70193 85970 102962 110620 132011 143731 2.3 2.4 2.6 2.7Thermal (incl. biomass) 48144 39449 53016 64025 77261 50806 57528 77627 96228 1.0 3.8 -2.9 5.3
Fuel Inputs for Thermal Power Generation (1) 11444 9080 14981 17891 18938 11763 12385 15899 19371 2.7 2.4 -4.2 4.6Solids 7482 5577 6968 8981 9622 3231 3126 3378 5790 -0.7 3.3 -10.6 6.4Oil (including refinery gas) 1845 605 2254 2235 2033 1256 749 600 536 2.0 -1.0 -9.5 -3.3Gas 1592 1361 3893 3396 5768 5673 4165 5217 5649 9.4 4.0 -3.2 3.1Biomass & Waste 525 1537 1866 3279 1515 1603 4345 6704 7395 13.5 -2.1 11.1 5.5Geothermal heat 0 0 0 0 0 0 0 0 0Hydrogen - Methanol 0 0 0 0 0 0 0 0 0
Fuel Input in other transformation proc. 89596 91010 97423 100798 101355 101110 99800 98184 98799 0.8 0.4 -0.2 -0.1Refineries 79634 83171 90084 93765 92892 92021 90953 88460 89263 1.2 0.3 -0.2 -0.2Biofuels and hydrogen production 0 155 328 855 2695 3670 4544 5205 5465 23.4 5.4 1.9District heating 1066 605 342 0 0 0 0 0 0 -10.7 -55.5 -2.6 0.7Others 8896 7079 6668 6178 5768 5418 4303 4520 4072 -2.8 -1.4 -2.9 -0.5
Energy Branch Consumption 9227 10334 10360 10584 10717 10719 10642 10355 10148 1.2 0.3 -0.1 -0.5Non-Energy Uses 13077 16593 15672 14441 14117 14028 13919 13800 13699 1.8 -1.0 -0.1 -0.2Final Energy Demand 137033 142563 154320 164960 171619 175861 179349 181137 181979 1.2 1.1 0.4 0.1by sectorIndustry(1) 37914 38369 38763 40215 41453 42208 42691 42953 43155 0.2 0.7 0.3 0.1 - energy intensive industries 24208 21473 23158 25583 26802 27224 27223 26964 26693 -0.4 1.5 0.2 -0.2 - other industrial sectors 13706 16896 15605 14632 14651 14984 15468 15989 16462 1.3 -0.6 0.5 0.6Residential 35753 36086 38425 41352 43461 44585 44927 45198 45231 0.7 1.2 0.3 0.1Tertiary 21458 23983 25533 27783 28731 29661 30187 30756 31320 1.8 1.2 0.5 0.4Transport 41908 44125 51599 55609 57973 59408 61544 62231 62273 2.1 1.2 0.6 0.1by fuel (1)
Solids 8935 6761 5476 5197 4955 4710 4673 4403 4132 -4.8 -1.0 -0.6 -1.2Oil 67571 68032 71428 76257 76961 77059 77150 76539 75675 0.6 0.7 0.0 -0.2Gas 23232 26953 31083 32422 31708 33625 34900 34468 34740 3.0 0.2 1.0 0.0Electricity 25960 29457 33114 36623 39298 41553 43751 45823 47178 2.5 1.7 1.1 0.8Heat (from CHP and District Heating) 1907 1920 3695 4880 5206 4805 5427 6158 6563 6.8 3.5 0.4 1.9Other 9428 9439 9525 9581 13491 14110 13447 13747 13690 0.1 3.5 0.0 0.2
CO2 Emissions (Mt of CO2) 352.1 343.1 371.6 392.7 399.9 375.7 370.9 370.2 376.9 0.5 0.7 -0.8 0.2Power generation/District heating 40.9 28.4 44.9 51.9 59.3 31.3 24.7 28.4 38.6 0.9 2.8 -8.4 4.6Energy Branch 16.3 18.2 15.8 13.4 13.6 13.5 12.3 12.1 11.7 -0.3 -1.5 -0.9 -0.5Industry 78.3 74.4 64.9 67.9 62.0 63.7 64.2 61.1 59.0 -1.9 -0.5 0.4 -0.9Residential 55.2 52.2 54.0 55.0 57.6 57.5 56.0 54.6 53.6 -0.2 0.7 -0.3 -0.4Tertiary 39.2 40.9 41.5 43.3 43.6 43.6 43.0 42.8 43.3 0.6 0.5 -0.2 0.1Transport 122.1 129.0 150.6 161.1 163.8 166.1 170.6 171.2 170.7 2.1 0.8 0.4 0.0
CO2 Emissions Index (1990=100) 100.0 97.5 105.6 111.5 113.6 106.7 105.4 105.2 107.1
Source: PRIMES
100

FRANCE: Baseline scenario SUMMARY ENERGY BALANCE AND INDICATORS (B)1990 1995 2000 2005 2010 2015 2020 2025 2030 '90-'00 '00-'10 '10-'20 '20-'30
Annual % ChangeMain Energy System IndicatorsPopulation (Million) 58.171 59.419 60.594 61.909 61.486 62.616 63.571 64.392 65.118 0.4 0.1 0.3 0.2GDP (in 000 MEUR'00) 1180.3 1244.4 1420.1 1541.0 1723.1 1920.4 2113.3 2316.9 2505.3 1.9 2.0 2.1 1.7Gross Inl. Cons./GDP (toe/MEUR'00) 190.2 189.9 182.0 180.5 164.0 150.0 137.6 122.6 112.7 -0.4 -1.0 -1.7 -2.0Gross Inl. Cons./Capita (toe/inhabitant) 3.86 3.98 4.27 4.49 4.60 4.60 4.57 4.41 4.33 1.0 0.7 0.0 -0.5Electricity Generated/Capita (kWh/inhabitant) 7153 8247 8840 9290 9826 10037 10120 9989 9858 2.1 1.1 0.3 -0.3Carbon intensity (t of CO2/toe of GIC) 1.57 1.45 1.44 1.41 1.42 1.30 1.28 1.30 1.34 -0.9 -0.2 -1.0 0.5CO2 Emissions/Capita (t of CO2/inhabitant) 6.05 5.77 6.13 6.34 6.50 6.00 5.83 5.75 5.79 0.1 0.6 -1.1 -0.1CO2 Emissions to GDP (t of CO2/MEUR'00) 298.3 275.8 261.7 254.8 232.1 195.6 175.5 159.8 150.5 -1.3 -1.2 -2.8 -1.5Import Dependency % 52.9 48.6 51.0 51.5 52.0 49.2 48.8 49.7 51.7 0.0 0.0 0.0 0.0
Energy intensity indicators (1990=100)Industry (Energy on Value added) 100.0 95.8 83.3 80.3 74.0 67.8 62.3 57.3 53.5 -1.8 -1.2 -1.7 -1.5Residential (Energy on Private Income) 100.0 97.3 93.3 90.8 86.7 81.0 75.1 69.6 64.9 -0.7 -0.7 -1.4 -1.4Tertiary (Energy on Value added) 100.0 106.5 99.6 99.7 92.4 85.9 79.6 74.1 69.7 0.0 -0.7 -1.5 -1.3Transport (Energy on GDP) 100.0 99.9 102.3 101.6 94.8 87.1 82.0 75.6 70.0 0.2 -0.8 -1.4 -1.6
Carbon Intensity indicatorsElectricity and Steam production (t of CO2/MWh) 0.09 0.06 0.08 0.08 0.09 0.05 0.03 0.04 0.05 -2.0 1.4 -8.9 4.3Final energy demand (t of CO2/toe) 2.15 2.08 2.01 1.98 1.91 1.88 1.86 1.82 1.79 -0.7 -0.6 -0.2 -0.4
Industry 2.07 1.94 1.67 1.69 1.50 1.51 1.50 1.42 1.37 -2.1 -1.1 0.1 -1.0Residential 1.55 1.45 1.40 1.33 1.33 1.29 1.25 1.21 1.19 -0.9 -0.6 -0.6 -0.5Tertiary 1.83 1.70 1.62 1.56 1.52 1.47 1.42 1.39 1.38 -1.2 -0.7 -0.6 -0.3Transport 2.91 2.92 2.92 2.90 2.82 2.80 2.77 2.75 2.74 0.0 -0.3 -0.2 -0.1
Electricity and steam generationGeneration Capacity in MWe 114308 117545 122962 123359 129617 137956 143628 0.7 0.5 1.0
Nuclear 66919 65677 65677 67277 63563 51362 49126 -0.2 -0.3 -2.5Hydro (pumping excluded) 21273 21846 22253 22798 23026 23984 24421 0.5 0.3 0.6Wind 66 615 5606 9846 11713 17205 20465 55.9 7.6 5.7Solar 11 22 57 106 196 318 531 18.3 13.2 10.5Thermal 26039 29384 29369 23333 31120 45087 49084 1.2 0.6 4.7
of which cogeneration units 3379 7190 10232 9932 13610 17498 19920 11.7 2.9 3.9Solids fired 11399 13769 11055 7918 6133 6133 7290 -0.3 -5.7 1.7Gas fired 4510 5593 9094 9067 18745 30251 32028 7.3 7.5 5.5Oil fired 8570 8522 7811 4850 1165 1075 1079 -0.9 -17.3 -0.8Biomass-waste fired 1561 1500 1409 1498 5077 7627 8688 -1.0 13.7 5.5Fuel Cells 0 0 0 0 0 0 0Geothermal heat 0 0 0 0 0 0 0
IndicatorsEfficiency for thermal electricity production (%) 30.4 30.8 35.1 37.1 39.9 42.0 42.7 0.0 0.0 0.0 0.0Load factor for gross electric capacities (%) 53.5 55.9 56.1 58.2 56.7 53.2 51.0 0.0 0.0 0.0 0.0CHP indicator (% of electricity from CHP) 4.7 6.1 8.0 7.5 8.7 9.4 10.5 0.0 0.0 0.0 0.0Non fossil fuels in electricity generation (%) 91.4 90.8 88.2 92.9 93.9 92.5 90.1 0.0 0.0 0.0 0.0 - nuclear 77.5 76.7 73.0 75.5 73.9 67.4 62.6 0.0 0.0 0.0 0.0 - renewable energy forms 13.9 14.2 15.2 17.4 20.0 25.0 27.5 0.0 0.0 0.0 0.0
Transport sectorPassenger transport activity (Gpkm) 735.1 781.9 864.9 935.5 1004.8 1067.1 1125.8 1181.6 1240.7 1.6 1.5 1.1 1.0
Public road transport 41.3 41.6 43.0 43.5 43.7 42.1 40.3 38.7 37.1 0.4 0.2 -0.8 -0.8Private cars and motorcycles 599.8 652.5 711.9 766.1 820.6 871.9 919.7 964.2 1011.3 1.7 1.4 1.1 1.0Rail 73.5 63.6 80.0 89.6 97.7 102.3 107.1 111.8 115.8 0.9 2.0 0.9 0.8Aviation 18.0 21.2 27.2 33.5 39.9 47.6 55.1 63.1 72.3 4.2 3.9 3.3 2.7Inland navigation 2.5 3.0 2.8 2.9 2.9 3.2 3.5 3.8 4.2 1.0 0.5 1.8 1.6
Travel per person (km per capita) 12637 13159 14273 15111 16341 17042 17709 18351 19053 1.2 1.4 0.8 0.7
Freight transport activity (Gtkm) 211.8 233.0 268.5 284.2 311.3 338.5 366.4 394.6 421.6 2.4 1.5 1.6 1.4Trucks 153.5 178.2 204.0 222.7 252.6 280.5 310.1 339.4 367.7 2.9 2.2 2.1 1.7Rail 50.7 48.1 55.4 52.6 49.9 48.9 47.1 45.9 44.6 0.9 -1.0 -0.6 -0.5Inland navigation 7.6 6.6 9.1 8.9 8.9 9.1 9.2 9.3 9.3 1.8 -0.2 0.3 0.2
Freight activity per unit of GDP (tkm/000 Euro'00) 179 187 189 184 181 176 173 170 168 0.5 -0.5 -0.4 -0.3
Energy demand in transport (ktoe) 41908 44125 51599 55609 57973 59408 61544 62231 62273 2.1 1.2 0.6 0.1Public road transport 780 776 803 809 803 748 679 603 530 0.3 0.0 -1.7 -2.4Private cars and motorcycles 19969 20358 22699 24124 23637 22531 22848 22102 21100 1.3 0.4 -0.3 -0.8Trucks 15422 16322 19236 20977 23742 26029 27633 28962 29386 2.2 2.1 1.5 0.6Rail 1150 1220 1373 1420 1319 1232 1081 1009 979 1.8 -0.4 -2.0 -1.0Aviation 3870 4716 6712 7519 7717 8098 8532 8787 9509 5.7 1.4 1.0 1.1Inland navigation 718 733 775 759 756 769 769 769 768 0.8 -0.2 0.2 0.0
Efficiency indicator (activity related)Passenger transport (toe/Mpkm) 34.7 34.3 36.2 35.9 33.1 30.4 29.3 27.4 25.8 0.4 -0.9 -1.2 -1.3Freight transport (toe/Mtkm) 77.3 74.1 75.6 77.4 79.4 79.8 77.9 75.6 71.7 -0.2 0.5 -0.2 -0.8
101
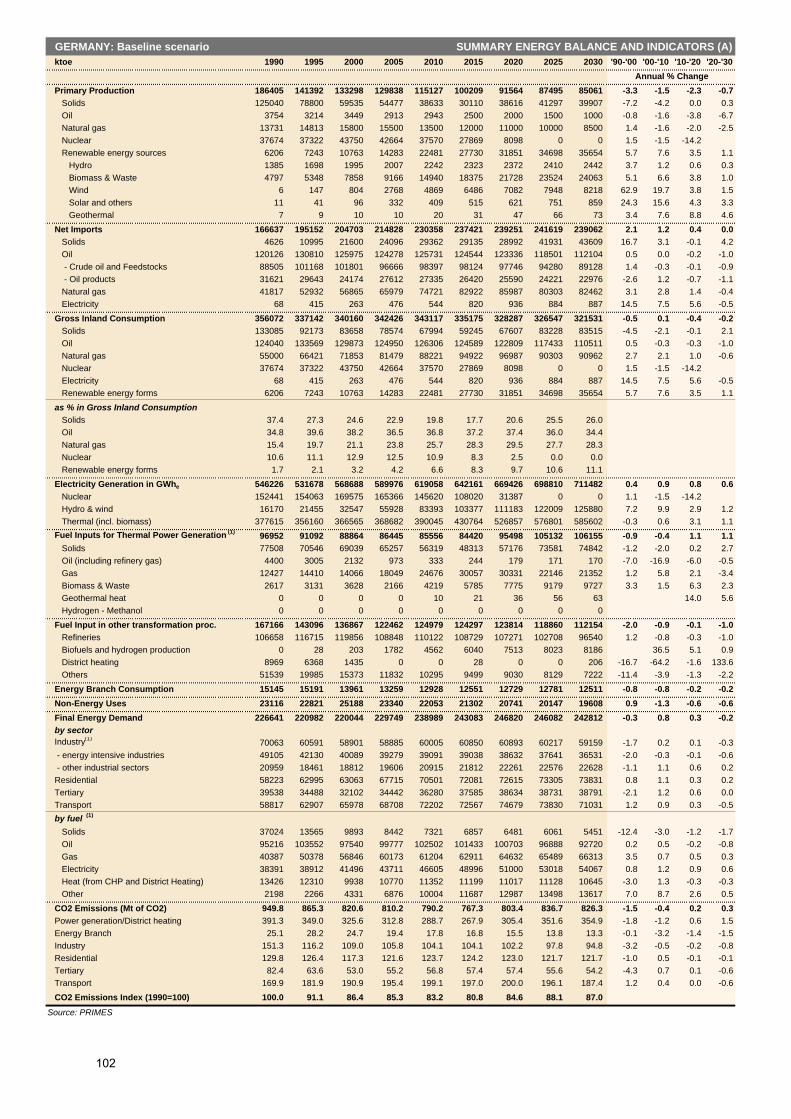
GERMANY: Baseline scenario SUMMARY ENERGY BALANCE AND INDICATORS (A) ktoe 1990 1995 2000 2005 2010 2015 2020 2025 2030 '90-'00 '00-'10 '10-'20 '20-'30
Annual % ChangePrimary Production 186405 141392 133298 129838 115127 100209 91564 87495 85061 -3.3 -1.5 -2.3 -0.7
Solids 125040 78800 59535 54477 38633 30110 38616 41297 39907 -7.2 -4.2 0.0 0.3Oil 3754 3214 3449 2913 2943 2500 2000 1500 1000 -0.8 -1.6 -3.8 -6.7Natural gas 13731 14813 15800 15500 13500 12000 11000 10000 8500 1.4 -1.6 -2.0 -2.5Nuclear 37674 37322 43750 42664 37570 27869 8098 0 0 1.5 -1.5 -14.2Renewable energy sources 6206 7243 10763 14283 22481 27730 31851 34698 35654 5.7 7.6 3.5 1.1
Hydro 1385 1698 1995 2007 2242 2323 2372 2410 2442 3.7 1.2 0.6 0.3Biomass & Waste 4797 5348 7858 9166 14940 18375 21728 23524 24063 5.1 6.6 3.8 1.0Wind 6 147 804 2768 4869 6486 7082 7948 8218 62.9 19.7 3.8 1.5Solar and others 11 41 96 332 409 515 621 751 859 24.3 15.6 4.3 3.3Geothermal 7 9 10 10 20 31 47 66 73 3.4 7.6 8.8 4.6
Net Imports 166637 195152 204703 214828 230358 237421 239251 241619 239062 2.1 1.2 0.4 0.0Solids 4626 10995 21600 24096 29362 29135 28992 41931 43609 16.7 3.1 -0.1 4.2Oil 120126 130810 125975 124278 125731 124544 123336 118501 112104 0.5 0.0 -0.2 -1.0 - Crude oil and Feedstocks 88505 101168 101801 96666 98397 98124 97746 94280 89128 1.4 -0.3 -0.1 -0.9 - Oil products 31621 29643 24174 27612 27335 26420 25590 24221 22976 -2.6 1.2 -0.7 -1.1Natural gas 41817 52932 56865 65979 74721 82922 85987 80303 82462 3.1 2.8 1.4 -0.4Electricity 68 415 263 476 544 820 936 884 887 14.5 7.5 5.6 -0.5
Gross Inland Consumption 356072 337142 340160 342426 343117 335175 328287 326547 321531 -0.5 0.1 -0.4 -0.2Solids 133085 92173 83658 78574 67994 59245 67607 83228 83515 -4.5 -2.1 -0.1 2.1Oil 124040 133569 129873 124950 126306 124589 122809 117433 110511 0.5 -0.3 -0.3 -1.0Natural gas 55000 66421 71853 81479 88221 94922 96987 90303 90962 2.7 2.1 1.0 -0.6Nuclear 37674 37322 43750 42664 37570 27869 8098 0 0 1.5 -1.5 -14.2Electricity 68 415 263 476 544 820 936 884 887 14.5 7.5 5.6 -0.5Renewable energy forms 6206 7243 10763 14283 22481 27730 31851 34698 35654 5.7 7.6 3.5 1.1
as % in Gross Inland ConsumptionSolids 37.4 27.3 24.6 22.9 19.8 17.7 20.6 25.5 26.0Oil 34.8 39.6 38.2 36.5 36.8 37.2 37.4 36.0 34.4Natural gas 15.4 19.7 21.1 23.8 25.7 28.3 29.5 27.7 28.3Nuclear 10.6 11.1 12.9 12.5 10.9 8.3 2.5 0.0 0.0Renewable energy forms 1.7 2.1 3.2 4.2 6.6 8.3 9.7 10.6 11.1
Electricity Generation in GWhe 546226 531678 568688 589976 619058 642161 669426 698810 711482 0.4 0.9 0.8 0.6Nuclear 152441 154063 169575 165366 145620 108020 31387 0 0 1.1 -1.5 -14.2Hydro & wind 16170 21455 32547 55928 83393 103377 111183 122009 125880 7.2 9.9 2.9 1.2Thermal (incl. biomass) 377615 356160 366565 368682 390045 430764 526857 576801 585602 -0.3 0.6 3.1 1.1
Fuel Inputs for Thermal Power Generation (1) 96952 91092 88864 86445 85556 84420 95498 105132 106155 -0.9 -0.4 1.1 1.1Solids 77508 70546 69039 65257 56319 48313 57176 73581 74842 -1.2 -2.0 0.2 2.7Oil (including refinery gas) 4400 3005 2132 973 333 244 179 171 170 -7.0 -16.9 -6.0 -0.5Gas 12427 14410 14066 18049 24676 30057 30331 22146 21352 1.2 5.8 2.1 -3.4Biomass & Waste 2617 3131 3628 2166 4219 5785 7775 9179 9727 3.3 1.5 6.3 2.3Geothermal heat 0 0 0 0 10 21 36 56 63 14.0 5.6Hydrogen - Methanol 0 0 0 0 0 0 0 0 0
Fuel Input in other transformation proc. 167166 143096 136867 122462 124979 124297 123814 118860 112154 -2.0 -0.9 -0.1 -1.0Refineries 106658 116715 119856 108848 110122 108729 107271 102708 96540 1.2 -0.8 -0.3 -1.0Biofuels and hydrogen production 0 28 203 1782 4562 6040 7513 8023 8186 36.5 5.1 0.9District heating 8969 6368 1435 0 0 28 0 0 206 -16.7 -64.2 -1.6 133.6Others 51539 19985 15373 11832 10295 9499 9030 8129 7222 -11.4 -3.9 -1.3 -2.2
Energy Branch Consumption 15145 15191 13961 13259 12928 12551 12729 12781 12511 -0.8 -0.8 -0.2 -0.2Non-Energy Uses 23116 22821 25188 23340 22053 21302 20741 20147 19608 0.9 -1.3 -0.6 -0.6Final Energy Demand 226641 220982 220044 229749 238989 243083 246820 246082 242812 -0.3 0.8 0.3 -0.2by sectorIndustry(1) 70063 60591 58901 58885 60005 60850 60893 60217 59159 -1.7 0.2 0.1 -0.3 - energy intensive industries 49105 42130 40089 39279 39091 39038 38632 37641 36531 -2.0 -0.3 -0.1 -0.6 - other industrial sectors 20959 18461 18812 19606 20915 21812 22261 22576 22628 -1.1 1.1 0.6 0.2Residential 58223 62995 63063 67715 70501 72081 72615 73305 73831 0.8 1.1 0.3 0.2Tertiary 39538 34488 32102 34442 36280 37585 38634 38731 38791 -2.1 1.2 0.6 0.0Transport 58817 62907 65978 68708 72202 72567 74679 73830 71031 1.2 0.9 0.3 -0.5by fuel (1)
Solids 37024 13565 9893 8442 7321 6857 6481 6061 5451 -12.4 -3.0 -1.2 -1.7Oil 95216 103552 97540 99777 102502 101433 100703 96888 92720 0.2 0.5 -0.2 -0.8Gas 40387 50378 56846 60173 61204 62911 64632 65489 66313 3.5 0.7 0.5 0.3Electricity 38391 38912 41496 43711 46605 48996 51000 53018 54067 0.8 1.2 0.9 0.6Heat (from CHP and District Heating) 13426 12310 9938 10770 11352 11199 11017 11128 10645 -3.0 1.3 -0.3 -0.3Other 2198 2266 4331 6876 10004 11687 12987 13498 13617 7.0 8.7 2.6 0.5
CO2 Emissions (Mt of CO2) 949.8 865.3 820.6 810.2 790.2 767.3 803.4 836.7 826.3 -1.5 -0.4 0.2 0.3Power generation/District heating 391.3 349.0 325.6 312.8 288.7 267.9 305.4 351.6 354.9 -1.8 -1.2 0.6 1.5Energy Branch 25.1 28.2 24.7 19.4 17.8 16.8 15.5 13.8 13.3 -0.1 -3.2 -1.4 -1.5Industry 151.3 116.2 109.0 105.8 104.1 104.1 102.2 97.8 94.8 -3.2 -0.5 -0.2 -0.8Residential 129.8 126.4 117.3 121.6 123.7 124.2 123.0 121.7 121.7 -1.0 0.5 -0.1 -0.1Tertiary 82.4 63.6 53.0 55.2 56.8 57.4 57.4 55.6 54.2 -4.3 0.7 0.1 -0.6Transport 169.9 181.9 190.9 195.4 199.1 197.0 200.0 196.1 187.4 1.2 0.4 0.0 -0.6
CO2 Emissions Index (1990=100) 100.0 91.1 86.4 85.3 83.2 80.8 84.6 88.1 87.0
Source: PRIMES
102

GERMANY: Baseline scenario SUMMARY ENERGY BALANCE AND INDICATORS (B)1990 1995 2000 2005 2010 2015 2020 2025 2030 '90-'00 '00-'10 '10-'20 '20-'30
Annual % ChangeMain Energy System IndicatorsPopulation (Million) 79.433 81.661 82.188 82.541 82.824 82.864 82.676 82.108 81.146 0.3 0.1 0.0 -0.2GDP (in 000 MEUR'00) 1736.6 1856.6 2030.0 2094.4 2295.8 2511.7 2714.9 2893.3 3007.3 1.6 1.2 1.7 1.0Gross Inl. Cons./GDP (toe/MEUR'00) 205.0 181.6 167.6 163.5 149.5 133.4 120.9 112.9 106.9 -2.0 -1.1 -2.1 -1.2Gross Inl. Cons./Capita (toe/inhabitant) 4.48 4.13 4.14 4.15 4.14 4.04 3.97 3.98 3.96 -0.8 0.0 -0.4 0.0Electricity Generated/Capita (kWh/inhabitant) 6877 6511 6919 7148 7474 7750 8097 8511 8768 0.1 0.8 0.8 0.8Carbon intensity (t of CO2/toe of GIC) 2.67 2.57 2.41 2.37 2.30 2.29 2.45 2.56 2.57 -1.0 -0.5 0.6 0.5CO2 Emissions/Capita (t of CO2/inhabitant) 11.96 10.60 9.98 9.82 9.54 9.26 9.72 10.19 10.18 -1.8 -0.5 0.2 0.5CO2 Emissions to GDP (t of CO2/MEUR'00) 546.9 466.0 404.2 386.8 344.2 305.5 295.9 289.2 274.8 -3.0 -1.6 -1.5 -0.7Import Dependency % 46.5 57.5 59.8 62.3 66.7 70.3 72.3 73.4 73.8 0.0 0.0 0.0 0.0
Energy intensity indicators (1990=100)Industry (Energy on Value added) 100.0 90.5 83.9 81.3 74.7 69.3 64.0 59.3 55.9 -1.7 -1.1 -1.5 -1.4Residential (Energy on Private Income) 100.0 100.5 91.9 97.4 93.5 88.3 82.9 78.8 76.1 -0.8 0.2 -1.2 -0.8Tertiary (Energy on Value added) 100.0 77.4 62.0 62.6 58.5 54.1 51.4 48.3 46.5 -4.7 -0.6 -1.3 -1.0Transport (Energy on GDP) 100.0 100.0 96.0 96.9 92.9 85.3 81.2 75.3 69.7 -0.4 -0.3 -1.3 -1.5
Carbon Intensity indicatorsElectricity and Steam production (t of CO2/MWh) 0.54 0.51 0.47 0.43 0.38 0.34 0.37 0.41 0.41 -1.5 -2.2 -0.1 1.0Final energy demand (t of CO2/toe) 2.35 2.21 2.14 2.08 2.02 1.99 1.96 1.92 1.89 -1.0 -0.5 -0.3 -0.4
Industry 2.16 1.92 1.85 1.80 1.74 1.71 1.68 1.62 1.60 -1.5 -0.6 -0.3 -0.5Residential 2.23 2.01 1.86 1.80 1.75 1.72 1.69 1.66 1.65 -1.8 -0.6 -0.4 -0.3Tertiary 2.08 1.84 1.65 1.60 1.57 1.53 1.49 1.44 1.40 -2.3 -0.5 -0.5 -0.6Transport 2.89 2.89 2.89 2.84 2.76 2.71 2.68 2.66 2.64 0.0 -0.5 -0.3 -0.1
Electricity and steam generationGeneration Capacity in MWe 122463 126647 133891 149166 160881 170372 175132 0.9 1.9 0.9
Nuclear 23667 20959 19733 13668 5523 0 0 -1.8 -12.0Hydro (pumping excluded) 3455 3647 3885 4023 4107 4172 4226 1.2 0.6 0.3Wind 6113 17047 24604 32933 35666 39643 40988 14.9 3.8 1.4Solar 90 606 1052 1422 1875 2353 2899 27.9 6.0 4.5Thermal 89137 84388 84617 97120 113709 124203 127019 -0.5 3.0 1.1
of which cogeneration units 25905 28727 27954 33766 42781 41610 38702 0.8 4.3 -1.0Solids fired 52348 47507 34590 32732 47333 58513 58557 -4.1 3.2 2.2Gas fired 25363 27749 44041 55173 55343 53737 55980 5.7 2.3 0.1Oil fired 8921 6575 2708 2509 1986 1986 1871 -11.2 -3.1 -0.6Biomass-waste fired 2506 2557 3276 6702 9040 9956 10598 2.7 10.7 1.6Fuel Cells 0 0 0 0 0 0 0Geothermal heat 0 0 2 5 8 12 14 14.0 5.6
IndicatorsEfficiency for thermal electricity production (%) 35.5 36.7 39.2 43.9 47.4 47.2 47.4 0.0 0.0 0.0 0.0Load factor for gross electric capacities (%) 53.0 53.2 52.8 49.1 47.5 46.8 46.4 0.0 0.0 0.0 0.0CHP indicator (% of electricity from CHP) 8.3 11.7 13.7 16.3 21.5 23.0 22.3 0.0 0.0 0.0 0.0Non fossil fuels in electricity generation (%) 37.4 38.6 39.2 37.3 27.7 24.7 25.4 0.0 0.0 0.0 0.0 - nuclear 29.8 28.0 23.5 16.8 4.7 0.0 0.0 0.0 0.0 0.0 0.0 - renewable energy forms 7.6 10.5 15.7 20.4 23.0 24.7 25.4 0.0 0.0 0.0 0.0
Transport sectorPassenger transport activity (Gpkm) 863.9 925.4 922.6 954.8 1072.1 1158.7 1239.2 1305.6 1347.4 0.7 1.5 1.5 0.8
Public road transport 73.1 68.5 69.0 72.3 81.8 83.9 85.8 87.3 87.7 -0.6 1.7 0.5 0.2Private cars and motorcycles 698.4 742.8 731.2 755.7 848.1 917.7 982.4 1034.7 1067.4 0.5 1.5 1.5 0.8Rail 69.6 83.5 82.3 80.7 86.0 91.0 95.6 99.8 102.1 1.7 0.4 1.1 0.7Aviation 20.9 28.7 38.3 44.3 54.2 63.7 72.8 81.1 87.2 6.2 3.5 3.0 1.8Inland navigation 2.0 2.0 1.8 1.9 2.1 2.3 2.6 2.8 3.0 -0.9 1.4 2.2 1.4
Travel per person (km per capita) 10876 11333 11226 11568 12945 13983 14989 15902 16604 0.3 1.4 1.5 1.0
Freight transport activity (Gtkm) 333.4 371.3 424.0 452.6 496.4 539.1 580.7 616.1 638.9 2.4 1.6 1.6 1.0Trucks 176.9 237.8 280.7 301.7 333.7 366.4 398.7 426.6 444.3 4.7 1.7 1.8 1.1Rail 101.7 69.5 76.8 82.6 90.9 95.2 98.8 101.2 103.1 -2.8 1.7 0.8 0.4Inland navigation 54.8 64.0 66.5 68.4 71.7 77.5 83.3 88.3 91.5 1.9 0.8 1.5 0.9
Freight activity per unit of GDP (tkm/000 Euro'00) 192 200 209 216 216 215 214 213 212 0.8 0.3 -0.1 -0.1
Energy demand in transport (ktoe) 58817 62907 65978 68708 72202 72567 74679 73830 71031 1.2 0.9 0.3 -0.5Public road transport 798 875 802 828 924 917 881 817 742 0.1 1.4 -0.5 -1.7Private cars and motorcycles 36324 36324 37601 38599 39768 38430 39380 38175 35763 0.3 0.6 -0.1 -1.0Trucks 13296 17041 17987 19313 21309 23017 24033 24645 24171 3.1 1.7 1.2 0.1Rail 2116 2126 1946 1866 1743 1550 1444 1377 1342 -0.8 -1.1 -1.9 -0.7Aviation 5627 5988 7362 7814 8158 8331 8599 8455 8643 2.7 1.0 0.5 0.1Inland navigation 656 554 279 287 301 322 343 361 372 -8.2 0.8 1.3 0.8
Efficiency indicator (activity related)Passenger transport (toe/Mpkm) 51.6 48.6 51.3 51.1 46.8 42.2 40.4 37.2 34.3 0.0 -0.9 -1.5 -1.6Freight transport (toe/Mtkm) 42.8 48.3 43.9 44.1 44.3 43.9 42.5 41.0 38.8 0.3 0.1 -0.4 -0.9
103

GREECE: Baseline scenario SUMMARY ENERGY BALANCE AND INDICATORS (A) ktoe 1990 1995 2000 2005 2010 2015 2020 2025 2030 '90-'00 '00-'10 '10-'20 '20-'30
Annual % ChangePrimary Production 9152 9702 9946 10677 10660 11162 10784 10162 11121 0.8 0.7 0.1 0.3
Solids 7077 7911 8222 9023 8679 8971 8010 7237 8101 1.5 0.5 -0.8 0.1Oil 832 459 280 200 150 100 100 0 0 -10.3 -6.0 -4.0Natural gas 138 44 42 50 40 0 0 0 0 -11.1 -0.6Nuclear 0 0 0 0 0 0 0 0 0Renewable energy sources 1105 1289 1403 1404 1791 2091 2673 2925 3020 2.4 2.5 4.1 1.2
Hydro 152 303 318 336 363 384 390 394 397 7.6 1.3 0.7 0.2Biomass & Waste 893 898 946 817 783 893 1094 1251 1287 0.6 -1.9 3.4 1.6Wind 0 3 39 121 478 631 938 994 1004 74.7 28.6 7.0 0.7Solar and others 56 82 99 128 148 164 188 223 271 5.8 4.1 2.5 3.7Geothermal 3 3 2 2 19 19 62 62 62 -4.7 28.4 12.4 0.0
Net Imports 15374 18207 21982 26106 29019 31252 32874 32915 32216 3.6 2.8 1.3 -0.2Solids 988 925 768 634 452 375 792 1158 1257 -2.5 -5.2 5.8 4.7Oil 14325 17214 19527 22832 24242 25249 25896 25212 24548 3.1 2.2 0.7 -0.5 - Crude oil and Feedstocks 14711 16955 20439 21276 22506 23524 24269 23759 23267 3.3 1.0 0.8 -0.4 - Oil products -387 259 -912 1556 1735 1725 1628 1453 1281 -0.6 -2.4Natural gas 0 0 1689 2336 4051 5379 5961 6342 6228 9.1 3.9 0.4Electricity 61 69 -1 304 274 249 225 203 183 -2.0 -2.0
Gross Inland Consumption 22245 24137 28076 32893 35434 37866 38870 38122 38232 2.4 2.4 0.9 -0.2Solids 8091 8783 9040 9657 9131 9345 8802 8395 9358 1.1 0.1 -0.4 0.6Oil 12851 13952 15929 19142 20147 20802 21208 20257 19443 2.2 2.4 0.5 -0.9Natural gas 138 44 1705 2386 4091 5379 5961 6342 6228 28.6 9.1 3.8 0.4Nuclear 0 0 0 0 0 0 0 0 0Electricity 61 69 -1 304 274 249 225 203 183 -2.0 -2.0Renewable energy forms 1105 1289 1403 1404 1791 2091 2673 2925 3020 2.4 2.5 4.1 1.2
as % in Gross Inland ConsumptionSolids 36.4 36.4 32.2 29.4 25.8 24.7 22.6 22.0 24.5Oil 57.8 57.8 56.7 58.2 56.9 54.9 54.6 53.1 50.9Natural gas 0.6 0.2 6.1 7.3 11.5 14.2 15.3 16.6 16.3Nuclear 0.0 0.0 0.0 0.0 0.0 0.0 0.0 0.0 0.0Renewable energy forms 5.0 5.3 5.0 4.3 5.1 5.5 6.9 7.7 7.9
Electricity Generation in GWhe 34767 41291 53415 61503 70442 78579 83671 87050 90867 4.4 2.8 1.7 0.8Nuclear 0 0 0 0 0 0 0 0 0Hydro & wind 1769 3562 4143 5314 9788 11820 15502 16232 16435 8.9 9.0 4.7 0.6Thermal (incl. biomass) 32998 37728 49272 56189 60654 66758 68169 70817 74433 4.1 2.1 1.2 0.9
Fuel Inputs for Thermal Power Generation (1) 8822 9985 11726 13087 13264 14258 14134 13777 14167 2.9 1.2 0.6 0.0Solids 6889 7790 8226 8958 8629 8934 8493 8142 9169 1.8 0.5 -0.2 0.8Oil (including refinery gas) 1798 2075 2036 2375 2190 1638 1587 1507 1379 1.2 0.7 -3.2 -1.4Gas 31 14 1334 1540 2369 3470 3753 3606 3037 45.6 5.9 4.7 -2.1Biomass & Waste 103 106 130 213 59 199 240 462 522 2.3 -7.6 15.1 8.1Geothermal heat 0 0 0 0 17 17 60 60 60 13.3 0.0Hydrogen - Methanol 0 0 0 0 0 0 0 0 0
Fuel Input in other transformation proc. 16694 17913 22435 23566 25143 26246 27026 26302 25665 3.0 1.1 0.7 -0.5Refineries 16617 17860 22404 23492 24879 25856 26517 25718 25041 3.0 1.1 0.6 -0.6Biofuels and hydrogen production 0 0 0 51 248 378 501 579 622 7.3 2.2District heating 0 0 0 0 0 0 0 0 0 0.7 -1.5Others 77 52 30 23 16 12 8 5 2 -8.8 -6.3 -7.1 -14.7
Energy Branch Consumption 1042 1174 1637 1785 1923 2026 2048 1946 1891 4.6 1.6 0.6 -0.8Non-Energy Uses 636 441 652 922 1127 1259 1355 1397 1415 0.2 5.6 1.9 0.4Final Energy Demand 14563 15846 18626 21899 24406 26153 27350 27315 27409 2.5 2.7 1.1 0.0by sectorIndustry(1) 3982 4148 4550 4926 5282 5572 5781 5844 5897 1.3 1.5 0.9 0.2 - energy intensive industries 2585 2538 2835 2838 2839 2852 2851 2811 2767 0.9 0.0 0.0 -0.3 - other industrial sectors 1397 1610 1715 2088 2443 2721 2931 3033 3130 2.1 3.6 1.8 0.7Residential 3054 3327 4470 5647 6509 7010 7281 7340 7447 3.9 3.8 1.1 0.2Tertiary 1711 1940 2410 3119 3750 4112 4306 4448 4600 3.5 4.5 1.4 0.7Transport 5816 6431 7196 8206 8865 9459 9982 9683 9466 2.2 2.1 1.2 -0.5by fuel (1)
Solids 1070 1085 888 698 502 411 309 253 189 -1.8 -5.6 -4.7 -4.8Oil 10049 10799 12584 14924 16338 17340 17810 17237 16799 2.3 2.6 0.9 -0.6Gas 15 14 252 513 868 1076 1239 1501 1746 32.7 13.2 3.6 3.5Electricity 2448 2931 3710 4601 5356 5895 6331 6654 6962 4.2 3.7 1.7 1.0Heat (from CHP and District Heating) 132 140 276 440 528 655 720 771 798 7.6 6.7 3.2 1.0Other 849 877 916 722 815 776 941 900 915 0.8 -1.2 1.5 -0.3
CO2 Emissions (Mt of CO2) 70.9 77.9 88.9 100.4 104.8 110.2 110.1 106.3 107.5 2.3 1.7 0.5 -0.2Power generation/District heating 34.3 38.9 43.8 48.3 48.4 50.4 49.0 46.8 49.3 2.5 1.0 0.1 0.1Energy Branch 2.0 2.2 3.3 3.5 3.4 3.6 3.6 3.2 3.0 5.0 0.3 0.6 -1.8Industry 9.4 9.8 9.8 10.2 10.2 10.4 10.1 10.1 10.0 0.5 0.3 -0.1 -0.1Residential 4.6 4.8 7.4 10.3 12.4 13.4 13.7 13.4 13.2 4.8 5.3 1.0 -0.4Tertiary 3.3 3.2 3.4 4.2 4.9 5.3 5.5 5.5 5.6 0.1 3.8 1.1 0.2Transport 17.2 19.0 21.2 24.1 25.6 27.1 28.3 27.2 26.5 2.1 1.9 1.0 -0.7
CO2 Emissions Index (1990=100) 100.0 109.8 125.4 141.7 147.8 155.4 155.3 149.9 151.7
Source: PRIMES
104

GREECE: Baseline scenario SUMMARY ENERGY BALANCE AND INDICATORS (B)1990 1995 2000 2005 2010 2015 2020 2025 2030 '90-'00 '00-'10 '10-'20 '20-'30
Annual % ChangeMain Energy System IndicatorsPopulation (Million) 10.161 10.634 10.917 11.063 11.269 11.390 11.427 11.394 11.316 0.7 0.3 0.1 -0.1GDP (in 000 MEUR'00) 97.7 104.0 123.2 149.5 178.7 210.8 241.4 269.5 291.8 2.3 3.8 3.0 1.9Gross Inl. Cons./GDP (toe/MEUR'00) 227.6 232.2 227.9 220.0 198.3 179.7 161.0 141.5 131.0 0.0 -1.4 -2.1 -2.0Gross Inl. Cons./Capita (toe/inhabitant) 2.19 2.27 2.57 2.97 3.14 3.32 3.40 3.35 3.38 1.6 2.0 0.8 -0.1Electricity Generated/Capita (kWh/inhabitant) 3422 3883 4893 5559 6251 6899 7322 7640 8030 3.6 2.5 1.6 0.9Carbon intensity (t of CO2/toe of GIC) 3.19 3.23 3.17 3.05 2.96 2.91 2.83 2.79 2.81 -0.1 -0.7 -0.4 -0.1CO2 Emissions/Capita (t of CO2/inhabitant) 6.98 7.32 8.14 9.08 9.30 9.67 9.64 9.33 9.50 1.6 1.3 0.4 -0.1CO2 Emissions to GDP (t of CO2/MEUR'00) 725.5 749.1 721.6 671.7 586.2 522.8 456.3 394.4 368.5 -0.1 -2.1 -2.5 -2.1Import Dependency % 62.1 65.8 69.5 71.0 73.1 73.7 75.3 76.4 74.3 0.0 0.0 0.0 0.0
Energy intensity indicators (1990=100)Industry (Energy on Value added) 100.0 89.7 90.7 92.2 87.0 79.8 73.8 69.1 65.6 -1.0 -0.4 -1.6 -1.2Residential (Energy on Private Income) 100.0 99.4 117.4 126.2 124.8 116.4 106.9 97.1 90.8 1.6 0.6 -1.5 -1.6Tertiary (Energy on Value added) 100.0 110.2 117.4 124.4 124.1 114.6 104.2 95.5 90.6 1.6 0.6 -1.7 -1.4Transport (Energy on GDP) 100.0 103.9 98.2 92.2 83.3 75.4 69.5 60.4 54.5 -0.2 -1.6 -1.8 -2.4
Carbon Intensity indicatorsElectricity and Steam production (t of CO2/MWh) 0.95 0.91 0.77 0.72 0.63 0.58 0.53 0.49 0.49 -2.0 -2.0 -1.7 -0.8Final energy demand (t of CO2/toe) 2.37 2.32 2.25 2.22 2.17 2.15 2.10 2.06 2.02 -0.5 -0.3 -0.3 -0.4
Industry 2.35 2.35 2.16 2.07 1.92 1.87 1.74 1.73 1.69 -0.8 -1.2 -1.0 -0.3Residential 1.51 1.43 1.66 1.82 1.91 1.91 1.88 1.82 1.77 0.9 1.4 -0.1 -0.6Tertiary 1.96 1.65 1.40 1.33 1.31 1.30 1.27 1.24 1.21 -3.3 -0.7 -0.3 -0.4Transport 2.96 2.96 2.95 2.94 2.89 2.86 2.84 2.81 2.80 0.0 -0.2 -0.2 -0.1
Electricity and steam generationGeneration Capacity in MWe 11485 13734 18019 20536 21867 23640 24641 4.6 2.0 1.2
Nuclear 0 0 0 0 0 0 0Hydro (pumping excluded) 3061 3111 3615 3847 3922 3977 4012 1.7 0.8 0.2Wind 189 588 2180 2822 4102 4337 4390 27.7 6.5 0.7Solar 1 2 6 21 41 75 123 17.5 20.3 11.7Thermal 8234 10032 12218 13847 13802 15251 16116 4.0 1.2 1.6
of which cogeneration units 511 666 1467 1557 1842 2172 2140 11.1 2.3 1.5Solids fired 4908 5286 5286 5318 5042 5211 6211 0.7 -0.5 2.1Gas fired 1150 1896 3444 5044 5710 7165 7165 11.6 5.2 2.3Oil fired 2114 2738 3318 3304 2828 2372 2211 4.6 -1.6 -2.4Biomass-waste fired 63 113 163 173 194 475 501 10.0 1.8 10.0Fuel Cells 0 0 0 0 0 0 0Geothermal heat 0 0 8 8 28 28 28 13.3 0.0
IndicatorsEfficiency for thermal electricity production (%) 36.1 36.9 39.3 40.3 41.5 44.2 45.2 0.0 0.0 0.0 0.0Load factor for gross electric capacities (%) 53.1 51.1 44.6 43.7 43.7 42.0 42.1 0.0 0.0 0.0 0.0CHP indicator (% of electricity from CHP) 5.8 5.4 8.4 8.4 9.8 11.3 10.3 0.0 0.0 0.0 0.0Non fossil fuels in electricity generation (%) 8.6 9.4 14.2 15.7 19.6 21.9 21.6 0.0 0.0 0.0 0.0 - nuclear 0.0 0.0 0.0 0.0 0.0 0.0 0.0 0.0 0.0 0.0 0.0 - renewable energy forms 8.6 9.4 14.2 15.7 19.6 21.9 21.6 0.0 0.0 0.0 0.0
Transport sectorPassenger transport activity (Gpkm) 91.5 115.1 148.3 161.6 175.3 189.8 204.5 210.1 212.1 5.0 1.7 1.6 0.4
Public road transport 17.7 20.2 21.7 21.4 21.0 20.5 20.1 19.9 19.7 2.0 -0.3 -0.4 -0.2Private cars and motorcycles 55.4 72.0 96.3 103.9 112.0 120.8 129.7 132.9 133.9 5.7 1.5 1.5 0.3Rail 2.8 2.3 3.1 3.3 3.6 3.8 4.0 4.1 4.2 0.9 1.5 1.3 0.3Aviation 11.9 16.1 21.4 26.6 31.5 36.9 42.3 44.5 45.6 6.0 3.9 3.0 0.8Inland navigation 3.6 4.6 5.9 6.5 7.3 7.8 8.3 8.6 8.7 5.0 2.1 1.4 0.4
Travel per person (km per capita) 9002 10828 13588 14611 15556 16666 17897 18440 18744 4.2 1.4 1.4 0.5
Freight transport activity (Gtkm) 19.8 20.6 30.6 36.1 41.2 46.9 52.4 57.3 61.2 4.5 3.0 2.4 1.6Trucks 12.5 13.2 21.5 25.5 29.1 33.4 37.4 41.0 44.0 5.5 3.1 2.5 1.7Rail 0.6 0.3 0.4 0.5 0.6 0.6 0.6 0.7 0.7 -3.5 3.3 0.9 1.0Inland navigation 6.6 7.1 8.7 10.1 11.5 13.0 14.3 15.6 16.5 2.8 2.8 2.2 1.4
Freight activity per unit of GDP (tkm/000 Euro'00) 202 198 249 241 230 223 217 213 210 2.1 -0.8 -0.6 -0.3
Energy demand in transport (ktoe) 5816 6431 7196 8206 8865 9459 9982 9683 9466 2.2 2.1 1.2 -0.5Public road transport 120 141 99 97 95 91 85 79 71 -1.9 -0.4 -1.1 -1.8Private cars and motorcycles 1894 2264 2793 3013 2993 2925 3013 2928 2697 4.0 0.7 0.1 -1.1Trucks 1889 2179 2428 2870 3276 3721 4001 4196 4389 2.5 3.0 2.0 0.9Rail 75 57 60 57 39 31 28 26 25 -2.2 -4.1 -3.5 -0.9Aviation 1273 1246 1325 1613 1837 2010 2122 1685 1495 0.4 3.3 1.5 -3.4Inland navigation 566 544 491 555 625 682 734 769 789 -1.4 2.4 1.6 0.7
Efficiency indicator (activity related)Passenger transport (toe/Mpkm) 39.1 34.4 30.4 31.2 30.0 28.3 27.3 24.1 21.8 -2.5 -0.1 -0.9 -2.2Freight transport (toe/Mtkm) 113.2 119.8 87.5 87.7 87.7 87.1 84.0 80.7 79.1 -2.5 0.0 -0.4 -0.6
105

HUNGARY: Baseline scenario SUMMARY ENERGY BALANCE AND INDICATORS (A) ktoe 1990 1995 2000 2005 2010 2015 2020 2025 2030 '90-'00 '00-'10 '10-'20 '20-'30
Annual % ChangePrimary Production 13638 12844 11127 10686 10189 9260 10075 11767 12492 -2.0 -0.9 -0.1 2.2
Solids 3948 3095 2893 2646 1956 901 1208 1106 1005 -3.1 -3.8 -4.7 -1.8Oil 2320 2329 1665 1500 1200 1000 1000 900 800 -3.3 -3.2 -1.8 -2.2Natural gas 3812 3788 2475 2220 2200 2000 1900 1789 1700 -4.2 -1.2 -1.5 -1.1Nuclear 3544 3618 3658 3615 3606 3597 3587 5282 6229 0.3 -0.1 -0.1 5.7Renewable energy sources 15 14 436 704 1227 1762 2380 2690 2759 39.8 10.9 6.8 1.5
Hydro 15 14 15 20 31 47 68 91 102 0.0 7.2 8.3 4.1Biomass & Waste 0 0 416 663 1166 1677 2251 2508 2529 10.9 6.8 1.2Wind 0 0 0 0 1 3 13 27 46 26.3 13.8Solar and others 0 0 0 16 25 30 44 59 77 5.9 5.8Geothermal 0 0 5 5 5 5 5 5 5 0.2 0.9 -0.1
Net Imports 14436 12629 14011 15895 18490 21155 22131 21798 22074 -0.3 2.8 1.8 0.0Solids 1686 1395 1081 1127 1177 1296 1749 2044 2104 -4.3 0.9 4.0 1.9Oil 6621 5496 5352 5172 6204 6772 7060 7281 7608 -2.1 1.5 1.3 0.8 - Crude oil and Feedstocks 6475 5937 5866 5684 6781 7384 7708 7944 8308 -1.0 1.5 1.3 0.8 - Oil products 146 -441 -514 -512 -577 -612 -648 -663 -701Natural gas 5170 5532 7283 8949 10556 12722 13081 12316 12259 3.5 3.8 2.2 -0.6Electricity 958 207 296 647 554 365 240 156 104 -11.1 6.5 -8.0 -8.0
Gross Inland Consumption 28134 25252 24941 26581 28680 30416 32205 33565 34566 -1.2 1.4 1.2 0.7Solids 5969 4549 3967 3773 3133 2197 2957 3150 3109 -4.0 -2.3 -0.6 0.5Oil 8734 7689 6927 6672 7404 7772 8060 8181 8408 -2.3 0.7 0.9 0.4Natural gas 8913 9175 9657 11169 12756 14722 14981 14105 13959 0.8 2.8 1.6 -0.7Nuclear 3544 3618 3658 3615 3606 3597 3587 5282 6229 0.3 -0.1 -0.1 5.7Electricity 958 207 296 647 554 365 240 156 104 -11.1 6.5 -8.0 -8.0Renewable energy forms 15 14 436 704 1227 1762 2380 2690 2759 39.8 10.9 6.8 1.5
as % in Gross Inland ConsumptionSolids 21.2 18.0 15.9 14.2 10.9 7.2 9.2 9.4 9.0Oil 31.0 30.4 27.8 25.1 25.8 25.6 25.0 24.4 24.3Natural gas 31.7 36.3 38.7 42.0 44.5 48.4 46.5 42.0 40.4Nuclear 12.6 14.3 14.7 13.6 12.6 11.8 11.1 15.7 18.0Renewable energy forms 0.1 0.1 1.7 2.6 4.3 5.8 7.4 8.0 8.0
Electricity Generation in GWhe 28431 34011 35185 35624 47772 60584 69402 73582 77380 2.2 3.1 3.8 1.1Nuclear 13729 14023 14177 14012 13977 13940 13903 20473 24142 0.3 -0.1 -0.1 5.7Hydro & wind 178 163 178 234 374 595 973 1440 1842 0.0 7.7 10.0 6.6Thermal (incl. biomass) 14524 19824 20829 21378 33421 46049 54526 51669 51396 3.7 4.8 5.0 -0.6
Fuel Inputs for Thermal Power Generation (1) 4943 6058 6011 5893 6951 7953 9191 8689 8507 2.0 1.5 2.8 -0.8Solids 2869 2977 2731 2738 2143 1326 2185 2443 2460 -0.5 -2.4 0.2 1.2Oil (including refinery gas) 439 1447 1052 685 663 430 360 298 253 9.1 -4.5 -5.9 -3.4Gas 1636 1634 2168 2403 3935 5622 5660 4707 4522 2.9 6.1 3.7 -2.2Biomass & Waste 0 0 60 67 210 575 986 1241 1271 13.3 16.7 2.6Geothermal heat 0 0 0 0 0 0 0 0 0Hydrogen - Methanol 0 0 0 0 0 0 0 0 0
Fuel Input in other transformation proc. 11672 10668 9196 8742 9664 10090 10423 10562 10757 -2.4 0.5 0.8 0.3Refineries 8831 8500 7588 7303 8104 8507 8823 8957 9205 -1.5 0.7 0.9 0.4Biofuels and hydrogen production 0 0 0 17 186 234 330 390 437 5.9 2.9District heating 1138 776 441 482 534 581 536 532 480 -9.0 1.9 0.0 -1.1Others 1704 1392 1167 940 840 767 735 682 635 -3.7 -3.2 -1.3 -1.5
Energy Branch Consumption 1229 1140 1162 1390 1594 1709 1828 1782 1832 -0.6 3.2 1.4 0.0Non-Energy Uses 1711 1602 1577 1290 1359 1480 1560 1594 1622 -0.8 -1.5 1.4 0.4Final Energy Demand 18751 15155 15846 17889 19728 21314 22518 23232 23801 -1.7 2.2 1.3 0.6by sectorIndustry(1) 6520 3805 3538 3635 3952 4210 4379 4517 4587 -5.9 1.1 1.0 0.5 - energy intensive industries 4160 2691 2536 2372 2421 2513 2552 2553 2505 -4.8 -0.5 0.5 -0.2 - other industrial sectors 2361 1114 1002 1263 1531 1697 1827 1964 2082 -8.2 4.3 1.8 1.3Residential 5992 5449 5281 6563 7333 8044 8463 8715 8813 -1.3 3.3 1.4 0.4Tertiary 3223 3246 3776 3895 4223 4553 4799 4868 4945 1.6 1.1 1.3 0.3Transport 3015 2653 3251 3796 4220 4506 4876 5131 5457 0.8 2.6 1.5 1.1by fuel (1)
Solids 2502 965 792 716 672 584 512 473 429 -10.9 -1.6 -2.7 -1.7Oil 6000 4147 4174 4803 5345 5703 6042 6234 6492 -3.6 2.5 1.2 0.7Gas 5941 6370 6503 7405 7464 7722 7874 7914 7966 0.9 1.4 0.5 0.1Electricity 2717 2385 2531 2815 3598 4381 4992 5422 5701 -0.7 3.6 3.3 1.3Heat (from CHP and District Heating) 1591 1287 1488 1537 1709 1841 1857 1940 1962 -0.7 1.4 0.8 0.6Other 0 0 358 613 939 1083 1240 1250 1250 10.1 2.8 0.1
CO2 Emissions (Mt of CO2) 65.5 56.8 53.5 56.7 59.6 61.0 65.3 64.3 64.5 -2.0 1.1 0.9 -0.1Power generation/District heating 20.5 23.0 21.0 20.5 21.7 21.6 24.8 23.3 22.7 0.2 0.3 1.3 -0.9Energy Branch 2.5 2.2 1.4 1.5 1.7 1.9 1.9 2.0 2.0 -5.2 1.9 1.1 0.3Industry 14.7 8.7 6.4 6.4 6.6 6.9 7.0 7.0 6.9 -7.9 0.3 0.5 -0.2Residential 13.6 9.9 8.8 10.7 11.0 11.3 11.4 11.4 11.3 -4.3 2.3 0.3 0.0Tertiary 5.7 5.5 6.4 6.6 6.6 6.7 6.7 6.6 6.6 1.2 0.3 0.1 -0.2Transport 8.6 7.6 9.4 11.0 11.8 12.6 13.5 14.1 15.0 0.9 2.3 1.3 1.1
CO2 Emissions Index (1990=100) 100.0 86.8 81.7 86.5 91.1 93.1 99.7 98.3 98.4
Source: PRIMES
106

HUNGARY: Baseline scenario SUMMARY ENERGY BALANCE AND INDICATORS (B)1990 1995 2000 2005 2010 2015 2020 2025 2030 '90-'00 '00-'10 '10-'20 '20-'30
Annual % ChangeMain Energy System IndicatorsPopulation (Million) 10.374 10.329 10.211 10.079 9.982 9.834 9.693 9.588 9.484 -0.2 -0.2 -0.3 -0.2GDP (in 000 MEUR'00) 46.5 41.6 50.7 60.6 72.7 86.2 100.0 113.9 127.2 0.9 3.7 3.2 2.4Gross Inl. Cons./GDP (toe/MEUR'00) 605.5 606.8 492.4 438.4 394.4 352.8 321.9 294.6 271.9 -2.0 -2.2 -2.0 -1.7Gross Inl. Cons./Capita (toe/inhabitant) 2.71 2.44 2.44 2.64 2.87 3.09 3.32 3.50 3.64 -1.0 1.6 1.5 0.9Electricity Generated/Capita (kWh/inhabitant) 2741 3293 3446 3534 4786 6161 7160 7674 8159 2.3 3.3 4.1 1.3Carbon intensity (t of CO2/toe of GIC) 2.33 2.25 2.15 2.13 2.08 2.00 2.03 1.92 1.86 -0.8 -0.3 -0.3 -0.8CO2 Emissions/Capita (t of CO2/inhabitant) 6.31 5.50 5.24 5.62 5.97 6.20 6.74 6.71 6.80 -1.8 1.3 1.2 0.1CO2 Emissions to GDP (t of CO2/MEUR'00) 1409.3 1365.7 1056.8 934.7 820.0 707.0 652.8 564.7 506.9 -2.8 -2.5 -2.3 -2.5Import Dependency % 51.3 50.0 56.2 59.8 64.5 69.6 68.7 64.9 63.9 0.0 0.0 0.0 0.0
Energy intensity indicators (1990=100)Industry (Energy on Value added) 100.0 56.0 32.7 27.8 25.8 23.8 21.8 20.0 18.6 -10.6 -2.3 -1.7 -1.6Residential (Energy on Private Income) 100.0 102.5 86.6 80.4 74.1 67.9 61.1 54.9 49.5 -1.4 -1.5 -1.9 -2.1Tertiary (Energy on Value added) 100.0 118.9 120.6 103.0 92.2 83.7 75.4 66.7 60.2 1.9 -2.6 -2.0 -2.2Transport (Energy on GDP) 100.0 98.3 98.9 96.5 89.4 80.6 75.1 69.4 66.1 -0.1 -1.0 -1.7 -1.3
Carbon Intensity indicatorsElectricity and Steam production (t of CO2/MWh) 0.44 0.47 0.38 0.37 0.31 0.25 0.26 0.23 0.22 -1.3 -2.2 -1.6 -1.9Final energy demand (t of CO2/toe) 2.27 2.09 1.96 1.93 1.83 1.76 1.71 1.68 1.67 -1.4 -0.7 -0.7 -0.2
Industry 2.25 2.28 1.82 1.75 1.68 1.63 1.60 1.55 1.51 -2.1 -0.8 -0.5 -0.6Residential 2.26 1.82 1.66 1.63 1.50 1.40 1.34 1.30 1.28 -3.1 -1.0 -1.1 -0.5Tertiary 1.77 1.69 1.70 1.69 1.57 1.47 1.39 1.35 1.33 -0.4 -0.8 -1.2 -0.5Transport 2.84 2.85 2.89 2.89 2.81 2.79 2.77 2.75 2.75 0.2 -0.3 -0.1 -0.1
Electricity and steam generationGeneration Capacity in MWe 8320 8642 10559 11227 12860 14586 15594 2.4 2.0 1.9
Nuclear 1760 1760 1760 1760 1760 2593 3051 0.0 0.0 5.7Hydro (pumping excluded) 48 62 96 146 213 285 335 7.2 8.3 4.6Wind 1 6 16 41 166 361 606 33.3 26.4 13.8Solar 0 0 3 14 30 55 102 28.0 13.2Thermal 6511 6814 8684 9266 10692 11293 11501 2.9 2.1 0.7
of which cogeneration units 2821 2857 3574 3828 3754 4201 4663 2.4 0.5 2.2Solids fired 1872 1790 1699 1115 1442 1911 2311 -1.0 -1.6 4.8Gas fired 2340 2720 5105 6847 7525 7477 7224 8.1 4.0 -0.4Oil fired 2246 2249 1727 805 805 789 775 -2.6 -7.4 -0.4Biomass-waste fired 53 56 152 500 920 1117 1191 11.1 19.7 2.6Fuel Cells 0 0 0 0 0 0 0Geothermal heat 0 0 0 0 0 0 0
IndicatorsEfficiency for thermal electricity production (%) 29.8 31.2 41.3 49.8 51.0 51.1 52.0 0.0 0.0 0.0 0.0Load factor for gross electric capacities (%) 48.3 47.1 51.6 61.6 61.6 57.6 56.6 0.0 0.0 0.0 0.0CHP indicator (% of electricity from CHP) 23.1 25.8 23.5 24.9 20.8 21.3 21.8 0.0 0.0 0.0 0.0Non fossil fuels in electricity generation (%) 41.4 40.7 31.6 28.6 28.9 38.9 42.4 0.0 0.0 0.0 0.0 - nuclear 40.3 39.3 29.3 23.0 20.0 27.8 31.2 0.0 0.0 0.0 0.0 - renewable energy forms 1.1 1.3 2.3 5.6 8.9 11.1 11.2 0.0 0.0 0.0 0.0
Transport sectorPassenger transport activity (Gpkm) 79.2 72.5 77.0 84.3 92.2 99.3 106.3 113.3 121.0 -0.3 1.8 1.4 1.3
Public road transport 19.3 16.6 18.7 18.0 17.3 16.3 15.5 14.9 14.3 -0.3 -0.8 -1.1 -0.8Private cars and motorcycles 47.0 45.8 46.6 53.7 61.3 68.4 75.2 81.8 88.8 -0.1 2.8 2.1 1.7Rail 12.0 9.0 10.3 10.1 9.9 9.7 9.6 9.4 9.3 -1.5 -0.4 -0.4 -0.3Aviation 1.0 1.1 1.4 2.5 3.6 4.8 6.0 7.2 8.6 4.0 9.8 5.1 3.8Inland navigation 0.0 0.0 0.0 0.0 0.0 0.0 0.0 0.0 0.0
Travel per person (km per capita) 7637 7023 7545 8360 9233 10092 10962 11819 12755 -0.1 2.0 1.7 1.5
Freight transport activity (Gtkm) 34.0 23.4 28.8 32.7 38.2 43.3 48.7 54.0 59.0 -1.6 2.9 2.5 1.9Trucks 15.2 13.8 19.1 22.6 27.7 32.4 37.8 43.0 48.0 2.4 3.8 3.2 2.4Rail 16.8 8.4 8.8 9.1 9.4 9.6 9.6 9.6 9.6 -6.3 0.7 0.2 0.0Inland navigation 2.0 1.2 0.9 1.0 1.1 1.2 1.3 1.4 1.4 -7.9 2.3 1.5 1.1
Freight activity per unit of GDP (tkm/000 Euro'00) 732 563 569 540 526 502 487 474 464 -2.5 -0.8 -0.8 -0.5
Energy demand in transport (ktoe) 3015 2653 3251 3796 4220 4506 4876 5131 5457 0.8 2.6 1.5 1.1Public road transport 119 111 177 170 162 150 137 126 114 4.0 -0.9 -1.7 -1.8Private cars and motorcycles 1504 1295 1646 1893 1971 1972 2095 2185 2284 0.9 1.8 0.6 0.9Trucks 934 863 1023 1210 1479 1716 1924 2093 2271 0.9 3.8 2.7 1.7Rail 270 190 174 157 133 108 95 84 78 -4.3 -2.7 -3.3 -1.9Aviation 164 182 223 357 464 549 613 630 696 3.1 7.6 2.8 1.3Inland navigation 23 12 9 10 11 12 12 13 14 -9.2 2.2 1.3 1.0
Efficiency indicator (activity related)Passenger transport (toe/Mpkm) 24.9 23.9 28.3 30.2 29.2 27.7 27.4 26.4 26.0 1.3 0.3 -0.7 -0.5Freight transport (toe/Mtkm) 30.5 39.2 37.1 38.3 39.9 40.7 40.4 39.6 39.2 2.0 0.7 0.1 -0.3
107

IRELAND: Baseline scenario SUMMARY ENERGY BALANCE AND INDICATORS (A) ktoe 1990 1995 2000 2005 2010 2015 2020 2025 2030 '90-'00 '00-'10 '10-'20 '20-'30
Annual % ChangePrimary Production 3495 4256 2111 1779 2130 2403 2620 2802 2766 -4.9 0.1 2.1 0.5
Solids 1454 1783 894 698 538 473 290 226 310 -4.7 -5.0 -6.0 0.7Oil 0 0 0 0 0 0 0 0 0Natural gas 1873 2249 958 700 874 998 1000 800 500 -6.5 -0.9 1.4 -6.7Nuclear 0 0 0 0 0 0 0 0 0Renewable energy sources 168 224 258 381 719 932 1330 1777 1956 4.4 10.8 6.3 3.9
Hydro 60 61 73 73 73 74 75 75 75 2.0 0.0 0.3 0.0Biomass & Waste 108 161 164 182 377 581 854 998 1064 4.3 8.7 8.5 2.2Wind 0 1 21 108 245 245 357 641 735 27.9 3.8 7.5Solar and others 0 0 0 18 24 31 44 62 82 14.9 62.0 6.4 6.5Geothermal 0 0 0 0 1 1 1 1 1 14.7 2.7 0.9
Net Imports 7110 7608 12141 13690 14964 15988 16731 16530 16603 5.5 2.1 1.1 -0.1Solids 2100 1827 1696 1805 1765 1730 1686 1536 1395 -2.1 0.4 -0.5 -1.9Oil 5010 5698 7959 8891 9470 10007 10474 10340 10143 4.7 1.8 1.0 -0.3 - Crude oil and Feedstocks 2018 2260 3002 3531 3714 3878 4156 4053 3930 4.1 2.2 1.1 -0.6 - Oil products 2992 3438 4957 5360 5756 6129 6318 6288 6213 5.2 1.5 0.9 -0.2Natural gas 0 85 2478 2918 3643 4160 4471 4543 4946 3.9 2.1 1.0Electricity 0 -1 8 76 85 90 100 110 119 26.0 1.6 1.7
Gross Inland Consumption 10398 11025 14173 15297 16898 18183 19132 19102 19131 3.1 1.8 1.2 0.0Solids 3590 2897 2565 2503 2303 2203 1976 1762 1705 -3.3 -1.1 -1.5 -1.5Oil 4768 5571 7906 8719 9274 9799 10254 10111 9905 5.2 1.6 1.0 -0.3Natural gas 1873 2334 3436 3618 4517 5158 5471 5343 5446 6.3 2.8 1.9 0.0Nuclear 0 0 0 0 0 0 0 0 0Electricity 0 -1 8 76 85 90 100 110 119 26.0 1.6 1.7Renewable energy forms 168 224 258 381 719 932 1330 1777 1956 4.4 10.8 6.3 3.9
as % in Gross Inland ConsumptionSolids 34.5 26.3 18.1 16.4 13.6 12.1 10.3 9.2 8.9Oil 45.9 50.5 55.8 57.0 54.9 53.9 53.6 52.9 51.8Natural gas 18.0 21.2 24.2 23.7 26.7 28.4 28.6 28.0 28.5Nuclear 0.0 0.0 0.0 0.0 0.0 0.0 0.0 0.0 0.0Renewable energy forms 1.6 2.0 1.8 2.5 4.3 5.1 7.0 9.3 10.2
Electricity Generation in GWhe 14226 17601 23669 26706 30760 34462 37506 39427 40597 5.2 2.7 2.0 0.8Nuclear 0 0 0 0 0 0 0 0 0Hydro & wind 697 729 1090 2099 3700 3723 5036 8352 9451 4.6 13.0 3.1 6.5Thermal (incl. biomass) 13530 16872 22579 24607 27060 30739 32470 31075 31145 5.3 1.8 1.8 -0.4
Fuel Inputs for Thermal Power Generation (1) 3028 3849 4799 4865 5101 5637 5543 4983 4921 4.7 0.6 0.8 -1.2Solids 1842 2167 1930 2076 1925 1867 1685 1320 1134 0.5 0.0 -1.3 -3.9Oil (including refinery gas) 337 612 1006 621 280 310 179 151 143 11.6 -12.0 -4.4 -2.2Gas 850 1071 1839 2043 2782 3246 3315 3057 3146 8.0 4.2 1.8 -0.5Biomass & Waste 0 0 24 125 115 214 363 455 498 113.4 17.2 12.2 3.2Geothermal heat 0 0 0 0 0 0 0 0 0Hydrogen - Methanol 0 0 0 0 0 0 0 0 0
Fuel Input in other transformation proc. 1926 2422 3437 3643 3936 4208 4623 4598 4505 6.0 1.4 1.6 -0.3Refineries 1742 2263 3310 3535 3720 3885 4164 4061 3939 6.6 1.2 1.1 -0.6Biofuels and hydrogen production 0 0 0 8 132 251 401 484 519 11.8 2.6District heating 0 0 0 0 0 0 0 0 0 -3.7 -0.5Others 184 160 126 100 85 71 57 53 47 -3.7 -3.9 -3.8 -2.0
Energy Branch Consumption 167 186 246 258 274 289 286 266 261 3.9 1.1 0.4 -0.9Non-Energy Uses 617 545 546 211 257 281 302 317 328 -1.2 -7.3 1.6 0.8Final Energy Demand 7287 7936 10596 11982 13545 14643 15678 16218 16447 3.8 2.5 1.5 0.5by sectorIndustry(1) 1765 1937 2351 2164 2305 2479 2666 2831 2945 2.9 -0.2 1.5 1.0 - energy intensive industries 898 896 1120 735 740 782 837 878 901 2.2 -4.1 1.2 0.7 - other industrial sectors 867 1041 1232 1429 1565 1697 1829 1953 2044 3.6 2.4 1.6 1.1Residential 2323 2198 2475 2821 3154 3406 3609 3813 3964 0.6 2.5 1.4 0.9Tertiary 1214 1459 1764 2158 2490 2742 2918 3006 3056 3.8 3.5 1.6 0.5Transport 1985 2343 4005 4839 5595 6015 6485 6567 6482 7.3 3.4 1.5 0.0by fuel (1)
Solids 1678 863 530 422 374 333 288 439 569 -10.9 -3.4 -2.6 7.0Oil 3874 4796 6894 7820 8736 9272 9690 9644 9482 5.9 2.4 1.0 -0.2Gas 560 785 1186 1488 1635 1816 2041 2159 2196 7.8 3.3 2.2 0.7Electricity 1020 1276 1737 2053 2392 2706 2996 3213 3334 5.5 3.3 2.3 1.1Heat (from CHP and District Heating) 46 55 108 125 152 174 211 245 307 8.8 3.4 3.3 3.8Other 108 161 141 74 255 343 453 518 558 2.7 6.1 5.9 2.1
CO2 Emissions (Mt of CO2) 30.4 33.2 41.2 44.0 47.0 49.8 50.4 49.1 48.7 3.1 1.3 0.7 -0.4Power generation/District heating 10.4 13.1 15.2 15.1 15.1 16.0 15.0 12.9 12.3 3.8 -0.1 0.0 -2.0Energy Branch 0.2 0.2 0.3 0.3 0.3 0.4 0.4 0.4 0.4 4.2 0.6 1.2 1.2Industry 3.9 3.7 4.3 3.9 3.9 4.2 4.4 4.8 5.1 0.9 -0.9 1.3 1.4Residential 7.0 5.7 5.7 6.1 6.7 7.0 7.3 7.7 7.9 -2.1 1.7 0.8 0.8Tertiary 3.0 3.4 3.8 4.2 4.6 4.9 5.0 4.9 4.9 2.4 2.0 0.9 -0.1Transport 5.9 6.9 11.9 14.4 16.4 17.3 18.4 18.4 18.0 7.3 3.2 1.2 -0.2
CO2 Emissions Index (1990=100) 100.0 109.1 135.5 144.9 154.7 164.1 166.1 161.5 160.2
Source: PRIMES
108

IRELAND: Baseline scenario SUMMARY ENERGY BALANCE AND INDICATORS (B)1990 1995 2000 2005 2010 2015 2020 2025 2030 '90-'00 '00-'10 '10-'20 '20-'30
Annual % ChangeMain Energy System IndicatorsPopulation (Million) 3.506 3.601 3.800 4.113 4.323 4.555 4.756 4.922 5.066 0.8 1.3 1.0 0.6GDP (in 000 MEUR'00) 51.5 64.7 103.1 132.9 168.5 202.5 238.6 273.6 301.9 7.2 5.0 3.5 2.4Gross Inl. Cons./GDP (toe/MEUR'00) 201.9 170.4 137.5 115.1 100.3 89.8 80.2 69.8 63.4 -3.8 -3.1 -2.2 -2.3Gross Inl. Cons./Capita (toe/inhabitant) 2.97 3.06 3.73 3.72 3.91 3.99 4.02 3.88 3.78 2.3 0.5 0.3 -0.6Electricity Generated/Capita (kWh/inhabitant) 4058 4888 6229 6493 7116 7566 7886 8010 8014 4.4 1.3 1.0 0.2Carbon intensity (t of CO2/toe of GIC) 2.92 3.01 2.90 2.88 2.78 2.74 2.64 2.57 2.54 -0.1 -0.4 -0.5 -0.4CO2 Emissions/Capita (t of CO2/inhabitant) 8.66 9.21 10.83 10.70 10.87 10.94 10.61 9.97 9.61 2.3 0.0 -0.2 -1.0CO2 Emissions to GDP (t of CO2/MEUR'00) 589.9 512.5 399.4 331.0 278.9 246.1 211.4 179.3 161.3 -3.8 -3.5 -2.7 -2.7Import Dependency % 68.3 68.3 84.8 88.5 87.5 86.9 86.5 85.5 85.7 0.0 0.0 0.0 0.0
Energy intensity indicators (1990=100)Industry (Energy on Value added) 100.0 75.4 47.6 33.1 28.0 25.0 22.9 21.4 20.4 -7.2 -5.2 -2.0 -1.2Residential (Energy on Private Income) 100.0 81.3 63.1 60.7 55.7 51.4 47.2 44.1 41.8 -4.5 -1.2 -1.6 -1.2Tertiary (Energy on Value added) 100.0 105.3 94.2 91.5 84.5 78.1 70.8 63.4 58.2 -0.6 -1.1 -1.8 -2.0Transport (Energy on GDP) 100.0 94.0 100.8 94.5 86.2 77.1 70.5 62.3 55.7 0.1 -1.6 -2.0 -2.3
Carbon Intensity indicatorsElectricity and Steam production (t of CO2/MWh) 0.71 0.72 0.61 0.54 0.46 0.44 0.38 0.30 0.28 -1.5 -2.7 -2.1 -2.9Final energy demand (t of CO2/toe) 2.71 2.49 2.42 2.39 2.33 2.28 2.24 2.21 2.18 -1.1 -0.4 -0.4 -0.2
Industry 2.20 1.91 1.81 1.82 1.68 1.68 1.65 1.70 1.72 -1.9 -0.7 -0.2 0.4Residential 3.00 2.61 2.29 2.18 2.13 2.07 2.02 2.01 1.99 -2.7 -0.7 -0.6 -0.2Tertiary 2.45 2.34 2.14 1.93 1.84 1.78 1.71 1.64 1.61 -1.4 -1.5 -0.7 -0.6Transport 2.96 2.96 2.97 2.97 2.92 2.88 2.83 2.80 2.78 0.1 -0.2 -0.3 -0.2
Electricity and steam generationGeneration Capacity in MWe 5304 6503 8020 8110 8927 9968 10438 4.2 1.1 1.6
Nuclear 0 0 0 0 0 0 0Hydro (pumping excluded) 225 225 225 229 230 230 230 0.0 0.2 0.0Wind 118 461 986 986 1422 2426 2850 23.7 3.7 7.2Solar 2 4 15 31 50 73 102 21.9 12.6 7.5Thermal 4958 5812 6793 6863 7225 7239 7255 3.2 0.6 0.0
of which cogeneration units 143 161 178 297 485 581 686 2.2 10.5 3.5Solids fired 1269 1229 1172 1172 1042 858 835 -0.8 -1.2 -2.2Gas fired 2380 3198 4133 4171 4876 5342 5411 5.7 1.7 1.0Oil fired 1237 1237 1282 1282 903 408 408 0.4 -3.4 -7.6Biomass-waste fired 72 148 207 238 403 631 601 11.2 6.9 4.1Fuel Cells 0 0 0 0 0 0 0Geothermal heat 0 0 0 0 0 0 0
IndicatorsEfficiency for thermal electricity production (%) 40.5 43.5 45.6 46.9 50.4 53.6 54.4 0.0 0.0 0.0 0.0Load factor for gross electric capacities (%) 50.9 46.9 43.8 48.5 48.0 45.2 44.4 0.0 0.0 0.0 0.0CHP indicator (% of electricity from CHP) 2.4 2.8 3.0 4.3 5.2 6.4 8.2 0.0 0.0 0.0 0.0Non fossil fuels in electricity generation (%) 5.0 9.8 13.6 13.4 17.6 27.4 29.7 0.0 0.0 0.0 0.0 - nuclear 0.0 0.0 0.0 0.0 0.0 0.0 0.0 0.0 0.0 0.0 0.0 - renewable energy forms 5.0 9.8 13.6 13.4 17.6 27.4 29.7 0.0 0.0 0.0 0.0
Transport sectorPassenger transport activity (Gpkm) 25.9 33.4 47.0 54.0 62.2 71.1 80.9 88.9 94.0 6.1 2.8 2.7 1.5
Public road transport 3.9 5.2 6.1 6.4 6.7 6.8 6.9 7.1 7.3 4.7 0.9 0.4 0.5Private cars and motorcycles 18.4 23.5 33.7 38.4 43.9 50.1 57.0 62.5 65.9 6.3 2.7 2.6 1.5Rail 1.2 1.3 1.4 1.5 1.7 1.8 1.9 2.1 2.1 1.3 2.0 1.4 1.0Aviation 2.0 2.8 5.1 6.8 8.9 11.2 13.6 15.6 16.9 10.1 5.8 4.3 2.2Inland navigation 0.6 0.7 0.7 0.9 1.1 1.3 1.5 1.7 1.8 2.9 3.8 3.3 1.9
Travel per person (km per capita) 7401 9286 12380 13137 14394 15602 17014 18068 18562 5.3 1.5 1.7 0.9
Freight transport activity (Gtkm) 6.3 5.6 13.4 16.7 20.8 23.2 25.8 28.3 30.5 7.8 4.5 2.2 1.7Trucks 5.5 4.7 12.3 15.7 19.8 22.2 24.8 27.2 29.4 8.4 4.9 2.3 1.7Rail 0.6 0.6 0.5 0.4 0.3 0.3 0.3 0.3 0.3 -1.9 -3.5 -1.5 -0.1Inland navigation 0.2 0.3 0.6 0.6 0.6 0.7 0.7 0.8 0.8 9.3 0.7 1.5 1.3
Freight activity per unit of GDP (tkm/000 Euro'00) 123 87 130 126 123 115 108 103 101 0.5 -0.5 -1.3 -0.7
Energy demand in transport (ktoe) 1985 2343 4005 4839 5595 6015 6485 6567 6482 7.3 3.4 1.5 0.0Public road transport 25 37 108 112 115 112 107 101 95 15.9 0.6 -0.7 -1.2Private cars and motorcycles 928 1156 1607 1824 1891 1916 2089 2110 2035 5.6 1.6 1.0 -0.3Trucks 593 681 1610 2052 2584 2860 3058 3203 3229 10.5 4.8 1.7 0.5Rail 48 50 42 41 34 29 24 19 19 -1.4 -1.9 -3.7 -2.4Aviation 365 391 614 784 944 1070 1177 1102 1071 5.4 4.4 2.2 -0.9Inland navigation 26 28 25 27 27 29 31 32 33 -0.5 0.7 1.3 0.8
Efficiency indicator (activity related)Passenger transport (toe/Mpkm) 52.0 48.4 50.0 50.8 47.8 43.9 41.9 37.4 34.2 -0.4 -0.5 -1.3 -2.0Freight transport (toe/Mtkm) 100.3 129.7 123.7 125.0 126.3 124.9 119.9 114.7 107.3 2.1 0.2 -0.5 -1.1
109

ITALY: Baseline scenario SUMMARY ENERGY BALANCE AND INDICATORS (A) ktoe 1990 1995 2000 2005 2010 2015 2020 2025 2030 '90-'00 '00-'10 '10-'20 '20-'30
Annual % ChangePrimary Production 25566 29428 27399 27346 30652 29639 29829 32910 33188 0.7 1.1 -0.3 1.1
Solids 218 44 4 0 0 0 0 0 0 -33.8Oil 4704 5290 4606 3997 3910 3824 3677 3432 3345 -0.2 -1.6 -0.6 -0.9Natural gas 14030 16347 13622 13000 13000 10000 8000 8000 7774 -0.3 -0.5 -4.7 -0.3Nuclear 0 0 0 0 0 0 0 0 0Renewable energy sources 6614 7748 9167 10349 13741 15816 18151 21478 22069 3.3 4.1 2.8 2.0
Hydro 2719 3249 3812 3962 4176 4411 4689 4991 5107 3.4 0.9 1.2 0.9Biomass & Waste 919 1322 2191 2661 4839 6008 7537 10065 10023 9.1 8.2 4.5 2.9Wind 0 1 48 178 651 843 892 949 1142 73.3 29.7 3.2 2.5Solar and others 5 8 12 95 153 218 292 375 446 9.0 28.9 6.7 4.3Geothermal 2971 3167 3103 3455 3922 4336 4741 5097 5350 0.4 2.4 1.9 1.2
Net Imports 131949 134693 152587 156430 158797 168847 174169 173119 173415 1.5 0.4 0.9 0.0Solids 13792 12987 13188 14551 15702 18823 21358 24541 28843 -0.4 1.8 3.1 3.0Oil 89881 89957 88578 88204 86682 85168 82464 77912 76293 -0.1 -0.2 -0.5 -0.8 - Crude oil and Feedstocks 84279 82831 90363 76117 75216 74192 72113 68281 67204 0.7 -1.8 -0.4 -0.7 - Oil products 5602 7126 -1786 12087 11466 10976 10352 9631 9089 -1.0 -1.3Natural gas 25296 28530 47008 49406 52591 61323 67118 67846 65930 6.4 1.1 2.5 -0.2Electricity 2980 3218 3813 4269 3822 3532 3228 2821 2349 2.5 0.0 -1.7 -3.1
Gross Inland Consumption 153032 161323 172477 180988 186530 195464 200894 202882 203407 1.2 0.8 0.7 0.1Solids 14621 12272 12659 14551 15702 18823 21358 24541 28843 -1.4 2.2 3.1 3.0Oil 89816 93432 88898 89413 87674 85970 83038 78197 76442 -0.1 -0.1 -0.5 -0.8Natural gas 39001 44652 57940 62406 65591 71323 75118 75846 73704 4.0 1.2 1.4 -0.2Nuclear 0 0 0 0 0 0 0 0 0Electricity 2980 3218 3813 4269 3822 3532 3228 2821 2349 2.5 0.0 -1.7 -3.1Renewable energy forms 6614 7748 9167 10349 13741 15816 18151 21478 22069 3.3 4.1 2.8 2.0
as % in Gross Inland ConsumptionSolids 9.6 7.6 7.3 8.0 8.4 9.6 10.6 12.1 14.2Oil 58.7 57.9 51.5 49.4 47.0 44.0 41.3 38.5 37.6Natural gas 25.5 27.7 33.6 34.5 35.2 36.5 37.4 37.4 36.2Nuclear 0.0 0.0 0.0 0.0 0.0 0.0 0.0 0.0 0.0Renewable energy forms 4.3 4.8 5.3 5.7 7.4 8.1 9.0 10.6 10.8
Electricity Generation in GWhe 213400 237312 270016 298835 343721 391464 436580 477658 510692 2.4 2.4 2.4 1.6Nuclear 0 0 0 0 0 0 0 0 0Hydro & wind 31620 37784 44891 48160 56191 61248 65170 69534 73407 3.6 2.3 1.5 1.2Thermal (incl. biomass) 181779 199528 225125 250674 287531 330216 371410 408124 437285 2.2 2.5 2.6 1.6
Fuel Inputs for Thermal Power Generation (1) 41362 44974 48946 52296 56358 64513 68935 74279 76379 1.7 1.4 2.0 1.0Solids 7019 5290 5843 8444 10535 14091 16695 20278 25034 -1.8 6.1 4.7 4.1Oil (including refinery gas) 21528 25009 18728 16249 15015 13686 11811 10383 9448 -1.4 -2.2 -2.4 -2.2Gas 10027 11682 21077 23661 25855 30503 32971 33476 31487 7.7 2.1 2.5 -0.5Biomass & Waste 17 38 408 785 1344 2200 3016 5334 5341 37.4 12.7 8.4 5.9Geothermal heat 2770 2954 2890 3157 3608 4034 4443 4808 5069 0.4 2.2 2.1 1.3Hydrogen - Methanol 0 0 0 0 0 0 0 0 0
Fuel Input in other transformation proc. 99591 99282 103116 90254 89311 87763 85933 81377 79513 0.3 -1.4 -0.4 -0.8Refineries 91903 92773 96874 84056 82597 81145 78553 74081 72636 0.5 -1.6 -0.5 -0.8Biofuels and hydrogen production 0 0 0 558 2039 2448 3316 3688 3744 5.0 1.2District heating 0 0 0 0 0 0 0 0 0 -4.2 -3.0Others 7688 6509 6242 5640 4675 4170 4064 3608 3133 -2.1 -2.8 -1.4 -2.6
Energy Branch Consumption 7241 7550 7389 8487 8596 8713 8749 8630 8598 0.2 1.5 0.2 -0.2Non-Energy Uses 9844 13882 11043 11026 10802 10580 10440 10096 9784 1.2 -0.2 -0.3 -0.6Final Energy Demand 110195 117576 126874 132648 137666 142706 147738 150071 150820 1.4 0.8 0.7 0.2by sectorIndustry(1) 39256 40297 43109 43133 44649 46923 48465 49762 50862 0.9 0.4 0.8 0.5 - energy intensive industries 26838 26680 26213 25590 25584 26092 26363 26264 26196 -0.2 -0.2 0.3 -0.1 - other industrial sectors 12418 13617 16895 17543 19065 20831 22102 23499 24666 3.1 1.2 1.5 1.1Residential 30494 31692 28766 29410 30336 32583 35141 37419 39074 -0.6 0.5 1.5 1.1Tertiary 7041 7952 13737 16663 18580 19563 20318 20223 19941 6.9 3.1 0.9 -0.2Transport 33403 37636 41263 43441 44101 43637 43814 42666 40942 2.1 0.7 -0.1 -0.7by fuel (1)
Solids 4205 3990 3470 3404 2946 2801 2863 2706 2488 -1.9 -1.6 -0.3 -1.4Oil 53623 53099 56146 58557 58141 57779 57003 55372 53120 0.5 0.3 -0.2 -0.7Gas 28569 33145 36667 37178 38179 39439 40697 41092 41318 2.5 0.4 0.6 0.2Electricity 18408 20442 23435 25953 29088 32574 35922 38876 41010 2.4 2.2 2.1 1.3Heat (from CHP and District Heating) 4282 5396 5150 5421 5836 6343 6844 7344 8191 1.9 1.3 1.6 1.8Other 1107 1505 2007 2134 3475 3771 4408 4682 4693 6.1 5.6 2.4 0.6
CO2 Emissions (Mt of CO2) 384.1 399.5 417.5 435.7 443.9 465.5 476.0 481.4 484.9 0.8 0.6 0.7 0.2Power generation/District heating 121.2 129.5 133.4 142.2 151.4 171.8 181.8 192.5 203.5 1.0 1.3 1.8 1.1Energy Branch 16.9 17.3 16.3 17.5 17.2 17.0 16.6 16.0 15.6 -0.3 0.6 -0.4 -0.6Industry 74.2 69.9 71.3 70.5 69.4 71.2 71.8 71.2 69.4 -0.4 -0.3 0.3 -0.3Residential 65.4 64.5 55.7 55.3 55.7 57.9 59.7 60.8 61.5 -1.6 0.0 0.7 0.3Tertiary 9.2 9.4 21.0 25.1 26.2 25.8 25.6 24.9 24.0 8.5 2.3 -0.2 -0.7Transport 97.1 108.9 119.7 125.0 123.9 121.8 120.4 116.1 110.9 2.1 0.3 -0.3 -0.8
CO2 Emissions Index (1990=100) 100.0 104.0 108.7 113.4 115.6 121.2 123.9 125.3 126.3
Source: PRIMES
110

ITALY: Baseline scenario SUMMARY ENERGY BALANCE AND INDICATORS (B)1990 1995 2000 2005 2010 2015 2020 2025 2030 '90-'00 '00-'10 '10-'20 '20-'30
Annual % ChangeMain Energy System IndicatorsPopulation (Million) 56.719 57.301 57.762 58.029 58.631 58.630 58.300 57.751 57.071 0.2 0.1 -0.1 -0.2GDP (in 000 MEUR'00) 995.9 1060.8 1166.5 1223.5 1313.2 1462.0 1604.2 1736.6 1846.2 1.6 1.2 2.0 1.4Gross Inl. Cons./GDP (toe/MEUR'00) 153.7 152.1 147.9 147.9 142.0 133.7 125.2 116.8 110.2 -0.4 -0.4 -1.3 -1.3Gross Inl. Cons./Capita (toe/inhabitant) 2.70 2.82 2.99 3.12 3.18 3.33 3.45 3.51 3.56 1.0 0.6 0.8 0.3Electricity Generated/Capita (kWh/inhabitant) 3762 4142 4675 5150 5862 6677 7489 8271 8948 2.2 2.3 2.5 1.8Carbon intensity (t of CO2/toe of GIC) 2.51 2.48 2.42 2.41 2.38 2.38 2.37 2.37 2.38 -0.4 -0.2 0.0 0.1CO2 Emissions/Capita (t of CO2/inhabitant) 6.77 6.97 7.23 7.51 7.57 7.94 8.16 8.34 8.50 0.7 0.5 0.8 0.4CO2 Emissions to GDP (t of CO2/MEUR'00) 385.7 376.6 357.9 356.1 338.0 318.4 296.7 277.2 262.6 -0.7 -0.6 -1.3 -1.2Import Dependency % 84.8 82.3 87.1 85.1 83.8 85.1 85.4 84.0 83.9 0.0 0.0 0.0 0.0
Energy intensity indicators (1990=100)Industry (Energy on Value added) 100.0 95.7 94.9 98.1 94.4 87.0 80.3 74.0 69.5 -0.5 -0.1 -1.6 -1.4Residential (Energy on Private Income) 100.0 99.6 79.5 77.3 74.3 71.4 70.0 68.7 67.6 -2.3 -0.7 -0.6 -0.3Tertiary (Energy on Value added) 100.0 105.2 162.5 184.2 190.6 179.1 168.7 155.0 143.8 5.0 1.6 -1.2 -1.6Transport (Energy on GDP) 100.0 105.8 105.5 105.9 100.1 89.0 81.4 73.2 66.1 0.5 -0.5 -2.0 -2.1
Carbon Intensity indicatorsElectricity and Steam production (t of CO2/MWh) 0.46 0.43 0.40 0.39 0.37 0.37 0.35 0.34 0.34 -1.3 -0.9 -0.4 -0.5Final energy demand (t of CO2/toe) 2.23 2.15 2.11 2.08 2.00 1.94 1.88 1.82 1.76 -0.6 -0.5 -0.6 -0.6
Industry 1.89 1.73 1.65 1.63 1.55 1.52 1.48 1.43 1.36 -1.3 -0.6 -0.5 -0.8Residential 2.15 2.04 1.94 1.88 1.84 1.78 1.70 1.62 1.57 -1.0 -0.5 -0.8 -0.8Tertiary 1.31 1.19 1.53 1.51 1.41 1.32 1.26 1.23 1.20 1.5 -0.8 -1.1 -0.5Transport 2.91 2.89 2.90 2.88 2.81 2.79 2.75 2.72 2.71 0.0 -0.3 -0.2 -0.1
Electricity and steam generationGeneration Capacity in MWe 73379 84589 106288 105177 108133 110020 121593 3.8 0.2 1.2
Nuclear 0 0 0 0 0 0 0Hydro (pumping excluded) 14323 14727 15430 16028 16469 16987 17335 0.7 0.7 0.5Wind 427 1291 3908 5255 5527 5843 7309 24.8 3.5 2.8Solar 26 46 102 252 440 741 1199 14.6 15.8 10.5Thermal 58603 68525 86848 83641 85697 86449 95749 4.0 -0.1 1.1
of which cogeneration units 11298 17479 22030 21855 23840 24996 27730 6.9 0.8 1.5Solids fired 7850 9596 11117 10957 12274 15615 20476 3.5 1.0 5.3Gas fired 26549 33459 48308 45033 48795 48639 56968 6.2 0.1 1.6Oil fired 22494 23406 25230 24537 20741 16242 12102 1.2 -1.9 -5.2Biomass-waste fired 700 731 861 1741 2424 4408 4619 2.1 10.9 6.7Fuel Cells 0 0 0 0 0 0 0Geothermal heat 1009 1333 1333 1373 1463 1544 1583 2.8 0.9 0.8
IndicatorsEfficiency for thermal electricity production (%) 39.6 41.2 43.9 44.0 46.3 47.3 49.2 0.0 0.0 0.0 0.0Load factor for gross electric capacities (%) 42.0 40.3 36.9 42.5 46.1 49.6 47.9 0.0 0.0 0.0 0.0CHP indicator (% of electricity from CHP) 21.7 21.0 19.8 18.9 18.1 17.3 17.9 0.0 0.0 0.0 0.0Non fossil fuels in electricity generation (%) 18.9 19.1 20.0 20.2 20.3 22.6 22.0 0.0 0.0 0.0 0.0 - nuclear 0.0 0.0 0.0 0.0 0.0 0.0 0.0 0.0 0.0 0.0 0.0 - renewable energy forms 18.9 19.1 20.0 20.2 20.3 22.6 22.0 0.0 0.0 0.0 0.0
Transport sectorPassenger transport activity (Gpkm) 733.6 832.5 971.2 1002.0 1041.7 1072.8 1101.3 1120.7 1137.4 2.8 0.7 0.6 0.3
Public road transport 84.0 87.1 94.0 94.6 95.4 94.1 93.1 92.0 90.5 1.1 0.1 -0.2 -0.3Private cars and motorcycles 582.7 674.6 793.5 818.4 851.9 878.8 903.2 919.4 933.0 3.1 0.7 0.6 0.3Rail 49.3 49.1 52.5 51.7 50.5 49.9 49.5 48.8 48.0 0.6 -0.4 -0.2 -0.3Aviation 14.4 18.1 27.2 32.9 39.1 45.0 50.6 55.6 60.8 6.6 3.7 2.6 1.9Inland navigation 3.3 3.5 4.0 4.3 4.7 4.8 4.9 5.0 5.0 2.0 1.7 0.4 0.2
Travel per person (km per capita) 12934 14528 16813 17267 17767 18297 18890 19406 19930 2.7 0.6 0.6 0.5
Freight transport activity (Gtkm) 186.1 220.1 237.7 249.1 264.3 280.7 295.2 307.7 319.3 2.5 1.1 1.1 0.8Trucks 130.9 163.0 184.7 198.6 217.0 234.5 251.1 265.1 277.3 3.5 1.6 1.5 1.0Rail 19.4 21.7 22.8 22.5 21.9 22.7 23.3 23.8 24.3 1.7 -0.4 0.6 0.4Inland navigation 35.8 35.4 30.2 27.9 25.4 23.5 20.9 18.8 17.7 -1.7 -1.7 -1.9 -1.6
Freight activity per unit of GDP (tkm/000 Euro'00) 187 208 204 204 201 192 184 177 173 0.9 -0.1 -0.9 -0.6
Energy demand in transport (ktoe) 33403 37636 41263 43441 44101 43637 43814 42666 40942 2.1 0.7 -0.1 -0.7Public road transport 759 671 743 745 742 709 664 606 546 -0.2 0.0 -1.1 -1.9Private cars and motorcycles 18222 21383 22562 23245 22307 20742 20450 19705 18385 2.2 -0.1 -0.9 -1.1Trucks 11411 11891 13425 14423 15727 16767 17293 17483 17193 1.6 1.6 1.0 -0.1Rail 738 819 834 795 715 629 557 508 477 1.2 -1.5 -2.5 -1.6Aviation 1884 2424 3497 4030 4405 4589 4657 4178 4160 6.4 2.3 0.6 -1.1Inland navigation 389 448 202 204 205 200 193 186 181 -6.3 0.2 -0.6 -0.6
Efficiency indicator (activity related)Passenger transport (toe/Mpkm) 29.5 30.5 28.4 28.7 27.0 24.9 23.9 22.3 20.7 -0.4 -0.5 -1.2 -1.4Freight transport (toe/Mtkm) 63.1 55.8 57.6 58.9 60.3 60.5 59.2 57.4 54.3 -0.9 0.5 -0.2 -0.9
111

LATVIA: Baseline scenario SUMMARY ENERGY BALANCE AND INDICATORS (A) ktoe 1990 1995 2000 2005 2010 2015 2020 2025 2030 '90-'00 '00-'10 '10-'20 '20-'30
Annual % ChangePrimary Production 437 318 1079 1166 1690 1970 2166 2288 2288 9.5 4.6 2.5 0.6
Solids 51 65 18 19 18 17 27 29 30 -9.9 0.0 4.2 1.2Oil 0 0 0 0 0 0 0 0 0Natural gas 0 0 0 0 0 0 0 0 0Nuclear 0 0 0 0 0 0 0 0 0Renewable energy sources 387 253 1061 1147 1672 1953 2139 2259 2258 10.6 4.7 2.5 0.5
Hydro 387 253 242 237 261 269 275 295 308 -4.6 0.8 0.5 1.2Biomass & Waste 0 0 818 906 1388 1643 1800 1883 1843 5.4 2.6 0.2Wind 0 0 0 1 14 26 44 58 83 44.9 12.2 6.4Solar and others 0 0 0 3 9 15 19 22 25 8.5 2.4Geothermal 0 0 0 0 0 0 0 0 0
Net Imports 5915 3394 2473 3242 3740 4301 4748 5092 5560 -8.4 4.2 2.4 1.6Solids 904 155 63 77 68 69 80 276 503 -23.4 0.8 1.5 20.2Oil 2396 2046 1143 1304 1504 1617 1708 1789 1942 -7.1 2.8 1.3 1.3 - Crude oil and Feedstocks 1 1 60 1 1 1 1 1 1 49.1 -35.4 1.3 1.3 - Oil products 2395 2044 1083 1303 1503 1616 1707 1788 1941 -7.6 3.3 1.3 1.3Natural gas 2308 999 1113 1687 1992 2430 2765 2822 2899 -7.0 6.0 3.3 0.5Electricity 308 194 154 174 176 185 195 205 216 -6.7 1.4 1.0 1.0
Gross Inland Consumption 6169 3718 3669 4408 5429 6272 6914 7380 7849 -5.1 4.0 2.4 1.3Solids 934 259 159 96 86 86 106 304 533 -16.2 -5.9 2.1 17.5Oil 2396 2003 1203 1304 1504 1617 1708 1789 1942 -6.7 2.3 1.3 1.3Natural gas 2145 1010 1092 1687 1992 2430 2765 2822 2899 -6.5 6.2 3.3 0.5Nuclear 0 0 0 0 0 0 0 0 0Electricity 308 194 154 174 176 185 195 205 216 -6.7 1.4 1.0 1.0Renewable energy forms 387 253 1061 1147 1672 1953 2139 2259 2258 10.6 4.7 2.5 0.5
as % in Gross Inland ConsumptionSolids 15.1 7.0 4.3 2.2 1.6 1.4 1.5 4.1 6.8Oil 38.8 53.9 32.8 29.6 27.7 25.8 24.7 24.2 24.7Natural gas 34.8 27.2 29.8 38.3 36.7 38.7 40.0 38.2 36.9Nuclear 0.0 0.0 0.0 0.0 0.0 0.0 0.0 0.0 0.0Renewable energy forms 6.3 6.8 28.9 26.0 30.8 31.1 30.9 30.6 28.8
Electricity Generation in GWhe 6646 3978 4135 5367 7618 10436 13116 15593 17527 -4.6 6.3 5.6 2.9Nuclear 0 0 0 0 0 0 0 0 0Hydro & wind 4495 2936 2822 2769 3205 3433 3720 4129 4567 -4.5 1.3 1.5 2.1Thermal (incl. biomass) 2151 1042 1313 2597 4413 7003 9396 11465 12960 -4.8 12.9 7.8 3.3
Fuel Inputs for Thermal Power Generation (1) 925 585 513 735 1031 1461 1824 2064 2292 -5.7 7.2 5.9 2.3Solids 3 54 40 15 15 15 26 216 488 28.7 -9.3 5.5 34.2Oil (including refinery gas) 310 242 70 44 16 16 18 18 14 -13.9 -13.9 1.4 -2.5Gas 612 289 388 568 864 1148 1412 1262 1217 -4.4 8.3 5.0 -1.5Biomass & Waste 0 0 15 107 136 281 369 569 573 24.7 10.5 4.5Geothermal heat 0 0 0 0 0 0 0 0 0Hydrogen - Methanol 0 0 0 0 0 0 0 0 0
Fuel Input in other transformation proc. 1214 836 617 596 670 611 583 551 521 -6.5 0.8 -1.4 -1.1Refineries 1 1 1 1 1 1 1 1 1 0.0 -3.6 1.3 1.3Biofuels and hydrogen production 0 0 0 16 45 59 86 103 121 6.6 3.4District heating 1196 827 614 578 624 551 496 446 400 -6.4 0.2 -2.3 -2.1Others 17 8 1 1 1 0 0 0 0 -21.6 -8.4 -8.4 -8.4
Energy Branch Consumption 46 145 141 136 158 179 198 217 234 11.8 1.2 2.3 1.7Non-Energy Uses 0 6 75 122 179 229 269 297 318 9.1 4.1 1.7Final Energy Demand 4798 2845 2898 3697 4580 5317 5871 6292 6667 -4.9 4.7 2.5 1.3by sectorIndustry(1) 868 545 656 739 925 1120 1269 1401 1530 -2.8 3.5 3.2 1.9 - energy intensive industries 305 185 216 237 282 320 343 361 376 -3.4 2.7 2.0 0.9 - other industrial sectors 563 359 440 502 643 800 926 1040 1154 -2.4 3.9 3.7 2.2Residential 2240 883 965 1368 1773 2102 2341 2516 2621 -8.1 6.3 2.8 1.1Tertiary 554 556 585 733 905 1028 1093 1117 1138 0.6 4.5 1.9 0.4Transport 1136 860 691 858 977 1066 1168 1259 1378 -4.8 3.5 1.8 1.7by fuel (1)
Solids 610 114 58 53 45 38 30 24 17 -21.0 -2.5 -4.0 -5.5Oil 2084 1176 939 1089 1253 1347 1428 1505 1615 -7.7 2.9 1.3 1.2Gas 579 292 329 605 705 864 970 1123 1253 -5.5 7.9 3.2 2.6Electricity 749 385 382 495 682 913 1141 1342 1498 -6.5 6.0 5.3 2.8Heat (from CHP and District Heating) 776 878 590 695 817 922 996 1015 1013 -2.7 3.3 2.0 0.2Other 0 0 600 761 1079 1232 1304 1283 1271 6.0 1.9 -0.3
CO2 Emissions (Mt of CO2) 15.8 9.0 6.3 7.8 8.9 10.1 11.1 12.1 13.6 -8.7 3.4 2.2 2.1Power generation/District heating 5.7 4.1 2.3 2.9 3.3 3.8 4.4 4.9 5.8 -8.6 3.4 2.9 2.8Energy Branch 0.1 0.3 0.2 0.1 0.1 0.1 0.1 0.0 0.0 12.4 -12.3 -0.5 -2.7Industry 1.6 0.9 1.0 1.4 1.7 2.0 2.2 2.5 2.8 -4.6 5.5 2.7 2.5Residential 4.4 0.5 0.3 0.4 0.5 0.6 0.7 0.7 0.7 -24.2 7.1 2.4 0.6Tertiary 0.7 0.8 0.5 0.6 0.6 0.7 0.7 0.6 0.6 -3.1 1.6 0.4 -0.1Transport 3.3 2.5 2.0 2.5 2.7 2.9 3.1 3.4 3.7 -4.9 3.1 1.4 1.6
CO2 Emissions Index (1990=100) 100.0 57.1 40.1 49.3 56.2 63.7 69.9 76.6 86.1
Source: PRIMES
112

LATVIA: Baseline scenario SUMMARY ENERGY BALANCE AND INDICATORS (B)1990 1995 2000 2005 2010 2015 2020 2025 2030 '90-'00 '00-'10 '10-'20 '20-'30
Annual % ChangeMain Energy System IndicatorsPopulation (Million) 2.671 2.485 2.373 2.310 2.240 2.174 2.115 2.068 2.022 -1.2 -0.6 -0.6 -0.4GDP (in 000 MEUR'00) 12.1 6.4 8.4 12.0 17.0 22.4 27.9 33.8 39.1 -3.6 7.4 5.1 3.4Gross Inl. Cons./GDP (toe/MEUR'00) 509.5 576.6 437.9 366.0 318.7 279.6 247.9 218.4 200.5 -1.5 -3.1 -2.5 -2.1Gross Inl. Cons./Capita (toe/inhabitant) 2.31 1.50 1.55 1.91 2.42 2.88 3.27 3.57 3.88 -3.9 4.6 3.0 1.7Electricity Generated/Capita (kWh/inhabitant) 2488 1601 1743 2323 3401 4800 6200 7540 8666 -3.5 6.9 6.2 3.4Carbon intensity (t of CO2/toe of GIC) 2.56 2.43 1.73 1.77 1.64 1.61 1.60 1.64 1.73 -3.9 -0.6 -0.2 0.8CO2 Emissions/Capita (t of CO2/inhabitant) 5.92 3.63 2.68 3.38 3.97 4.63 5.23 5.86 6.73 -7.6 4.0 2.8 2.6CO2 Emissions to GDP (t of CO2/MEUR'00) 1306.0 1399.8 757.7 647.4 521.5 449.0 396.4 358.5 347.8 -5.3 -3.7 -2.7 -1.3Import Dependency % 95.9 91.3 67.4 73.5 68.9 68.6 68.7 69.0 70.8 0.0 0.0 0.0 0.0
Energy intensity indicators (1990=100)Industry (Energy on Value added) 100.0 195.6 180.3 131.4 106.7 93.1 83.4 75.5 71.1 6.1 -5.1 -2.4 -1.6Residential (Energy on Private Income) 100.0 71.9 60.6 58.7 53.6 48.2 43.1 38.2 34.3 -4.9 -1.2 -2.2 -2.3Tertiary (Energy on Value added) 100.0 126.0 99.5 88.6 78.8 68.7 58.8 49.5 43.3 0.0 -2.3 -2.9 -3.0Transport (Energy on GDP) 100.0 142.2 88.0 75.9 61.1 50.7 44.6 39.7 37.5 -1.3 -3.6 -3.1 -1.7
Carbon Intensity indicatorsElectricity and Steam production (t of CO2/MWh) 0.37 0.26 0.18 0.18 0.17 0.16 0.16 0.16 0.18 -6.8 -0.9 -0.6 1.2Final energy demand (t of CO2/toe) 2.09 1.64 1.31 1.32 1.22 1.16 1.13 1.15 1.17 -4.5 -0.8 -0.7 0.3
Industry 1.81 1.59 1.49 1.95 1.80 1.77 1.71 1.79 1.81 -1.9 1.9 -0.5 0.6Residential 1.95 0.58 0.28 0.30 0.31 0.30 0.29 0.28 0.28 -17.6 0.8 -0.4 -0.6Tertiary 1.32 1.39 0.92 0.77 0.70 0.64 0.60 0.58 0.57 -3.6 -2.7 -1.5 -0.5Transport 2.94 2.94 2.92 2.87 2.79 2.74 2.68 2.67 2.66 -0.1 -0.4 -0.4 -0.1
Electricity and steam generationGeneration Capacity in MWe 2119 2382 2841 3400 3960 4409 4637 3.0 3.4 1.6
Nuclear 0 0 0 0 0 0 0Hydro (pumping excluded) 1533 1576 1684 1694 1719 1747 1766 0.9 0.2 0.3Wind 2 5 93 157 244 310 423 46.9 10.1 5.6Solar 0 0 1 4 7 13 16 21.5 8.6Thermal 583 801 1063 1546 1990 2339 2432 6.2 6.5 2.0
of which cogeneration units 513 729 984 1463 1916 2280 2328 6.7 6.9 2.0Solids fired 30 30 30 30 35 234 488 0.0 1.6 30.0Gas fired 359 499 718 1032 1409 1376 1287 7.2 7.0 -0.9Oil fired 185 185 202 198 151 118 43 0.9 -2.9 -11.8Biomass-waste fired 9 86 112 286 394 611 614 28.4 13.4 4.5Fuel Cells 0 0 0 0 0 0 0Geothermal heat 0 0 0 0 0 0 0
IndicatorsEfficiency for thermal electricity production (%) 22.0 30.4 36.8 41.2 44.3 47.8 48.6 0.0 0.0 0.0 0.0Load factor for gross electric capacities (%) 22.3 25.7 30.6 35.0 37.8 40.4 43.1 0.0 0.0 0.0 0.0CHP indicator (% of electricity from CHP) 30.3 47.0 56.5 65.5 70.4 72.1 70.9 0.0 0.0 0.0 0.0Non fossil fuels in electricity generation (%) 69.6 60.8 50.5 47.2 42.8 44.5 42.2 0.0 0.0 0.0 0.0 - nuclear 0.0 0.0 0.0 0.0 0.0 0.0 0.0 0.0 0.0 0.0 0.0 - renewable energy forms 69.6 60.8 50.5 47.2 42.8 44.5 42.2 0.0 0.0 0.0 0.0
Transport sectorPassenger transport activity (Gpkm) 19.9 11.1 10.5 11.9 13.2 14.7 16.3 18.1 20.3 -6.2 2.4 2.1 2.2
Public road transport 5.9 1.8 2.3 2.2 2.1 2.0 2.0 2.0 1.9 -8.7 -1.0 -0.6 -0.3Private cars and motorcycles 7.6 7.1 6.6 8.2 9.6 11.2 12.9 14.7 17.0 -1.4 3.8 2.9 2.8Rail 6.0 1.9 1.3 1.3 1.2 1.2 1.2 1.2 1.2 -14.0 -0.6 -0.5 -0.2Aviation 0.3 0.2 0.2 0.2 0.2 0.2 0.2 0.2 0.2 -6.2 3.2 0.8 0.9Inland navigation 0.1 0.1 0.0 0.0 0.0 0.0 0.0 0.0 0.0 -12.0 -2.9 -1.7 -1.5
Travel per person (km per capita) 7435 4462 4414 5152 5912 6769 7700 8740 10052 -5.1 3.0 2.7 2.7
Freight transport activity (Gtkm) 24.8 12.0 18.1 23.2 29.2 34.6 39.0 42.8 45.2 -3.1 4.9 2.9 1.5Trucks 5.9 1.8 4.8 6.6 8.7 10.9 13.0 15.1 16.9 -2.0 6.2 4.1 2.6Rail 18.5 9.8 13.3 16.6 20.5 23.6 25.9 27.7 28.4 -3.3 4.4 2.4 0.9Inland navigation 0.4 0.4 0.0 0.0 0.0 0.0 0.0 0.0 0.0
Freight activity per unit of GDP (tkm/000 Euro'00) 2051 1859 2160 1928 1714 1540 1397 1267 1156 0.5 -2.3 -2.0 -1.9
Energy demand in transport (ktoe) 1136 860 691 858 977 1066 1168 1259 1378 -4.8 3.5 1.8 1.7Public road transport 34 24 30 29 27 26 24 23 21 -1.2 -1.0 -1.2 -1.3Private cars and motorcycles 537 447 388 482 515 543 604 662 743 -3.2 2.9 1.6 2.1Trucks 175 127 162 222 296 367 420 462 503 -0.8 6.2 3.6 1.8Rail 129 90 76 88 99 93 85 85 84 -5.2 2.8 -1.6 0.0Aviation 102 26 27 30 33 32 31 23 22 -12.6 2.2 -0.8 -3.3Inland navigation 158 148 8 7 6 5 5 5 4 -25.7 -2.9 -1.8 -1.6
Efficiency indicator (activity related)Passenger transport (toe/Mpkm) 40.4 51.9 44.6 47.0 44.7 41.6 41.0 39.6 39.0 1.0 0.0 -0.9 -0.5Freight transport (toe/Mtkm) 13.4 23.8 12.4 12.8 13.2 13.1 12.8 12.7 12.9 -0.8 0.6 -0.3 0.1
113

LITHUANIA: Baseline scenario SUMMARY ENERGY BALANCE AND INDICATORS (A) ktoe 1990 1995 2000 2005 2010 2015 2020 2025 2030 '90-'00 '00-'10 '10-'20 '20-'30
Annual % ChangePrimary Production 4455 3249 3169 2051 961 1169 2351 2745 3334 -3.3 -11.2 9.4 3.6
Solids 14 14 12 5 4 4 3 3 4 -1.6 -9.7 -2.7 1.0Oil 12 153 337 158 161 184 180 190 202 39.6 -7.1 1.2 1.1Natural gas 0 0 0 0 0 0 0 0 0Nuclear 4394 3050 2172 1177 0 0 906 1094 1544 -6.8 5.5Renewable energy sources 36 32 649 711 796 981 1261 1458 1584 33.7 2.1 4.7 2.3
Hydro 36 32 29 34 38 47 63 71 74 -2.0 2.7 5.1 1.7Biomass & Waste 0 0 619 674 752 925 1139 1301 1402 2.0 4.2 2.1Wind 0 0 0 1 1 1 46 65 77 48.1 5.4Solar and others 0 0 0 2 5 9 14 21 30 11.5 7.9Geothermal 0 0 0 0 0 0 0 0 0
Net Imports 11936 5668 4360 5720 6232 6973 7170 7632 7992 -9.6 3.6 1.4 1.1Solids 885 184 87 61 47 39 36 38 349 -20.7 -6.0 -2.6 25.4Oil 7257 3686 2297 2332 2369 2681 2634 2770 2946 -10.9 0.3 1.1 1.1 - Crude oil and Feedstocks 9528 3609 4827 2366 2411 2744 2665 2783 2939 -6.6 -6.7 1.0 1.0 - Oil products -2271 77 -2530 -34 -42 -63 -31 -12 7Natural gas 4824 2029 2090 3463 3787 4319 4835 5210 5089 -8.0 6.1 2.5 0.5Electricity -1030 -230 -115 -136 29 -66 -335 -386 -392
Gross Inland Consumption 16025 8276 7226 7661 7065 7996 9360 10204 11141 -7.7 -0.2 2.9 1.8Solids 927 284 99 66 51 43 39 42 352 -20.1 -6.4 -2.6 24.5Oil 6875 3112 2331 2381 2401 2719 2653 2787 2963 -10.2 0.3 1.0 1.1Natural gas 4824 2029 2090 3463 3787 4319 4835 5210 5089 -8.0 6.1 2.5 0.5Nuclear 4394 3050 2172 1177 0 0 906 1094 1544 -6.8 5.5Electricity -1030 -230 -115 -136 29 -66 -335 -386 -392Renewable energy forms 36 32 649 711 796 981 1261 1458 1584 33.7 2.1 4.7 2.3
as % in Gross Inland ConsumptionSolids 5.8 3.4 1.4 0.9 0.7 0.5 0.4 0.4 3.2Oil 42.9 37.6 32.3 31.1 34.0 34.0 28.3 27.3 26.6Natural gas 30.1 24.5 28.9 45.2 53.6 54.0 51.7 51.1 45.7Nuclear 27.4 36.8 30.1 15.4 0.0 0.0 9.7 10.7 13.9Renewable energy forms 0.2 0.4 9.0 9.3 11.3 12.3 13.5 14.3 14.2
Electricity Generation in GWhe 28400 13518 11118 13626 12343 15854 21433 24207 26711 -9.0 1.1 5.7 2.2Nuclear 17030 11820 8417 4561 0 0 3513 4240 5985 -6.8 5.5Hydro & wind 414 373 339 400 455 557 1267 1596 1786 -2.0 3.0 10.8 3.5Thermal (incl. biomass) 10956 1325 2362 8665 11888 15297 16653 18371 18940 -14.2 17.5 3.4 1.3
Fuel Inputs for Thermal Power Generation (1) 2610 926 901 2132 2063 2538 2754 3047 3261 -10.1 8.6 2.9 1.7Solids 0 0 0 0 0 0 1 5 319 87.4Oil (including refinery gas) 1067 493 175 642 218 63 36 34 44 -16.5 2.2 -16.6 2.1Gas 1543 433 726 1382 1744 2348 2495 2705 2559 -7.3 9.2 3.7 0.3Biomass & Waste 0 0 0 108 101 126 222 303 338 8.2 4.3Geothermal heat 0 0 0 0 0 0 0 0 0Hydrogen - Methanol 0 0 0 0 0 0 0 0 0
Fuel Input in other transformation proc. 11459 4484 5747 3247 3351 3758 3795 3957 4071 -6.7 -5.3 1.3 0.7Refineries 9618 3391 5086 2621 2662 3015 2962 3116 3313 -6.2 -6.3 1.1 1.1Biofuels and hydrogen production 0 0 0 10 20 53 137 168 194 21.4 3.6District heating 1833 1088 658 614 667 689 696 672 563 -9.7 0.1 0.4 -2.1Others 8 5 4 2 2 1 1 1 1 -7.0 -7.6 -5.0 -0.7
Energy Branch Consumption 788 484 653 908 891 957 1017 1062 1131 -1.9 3.2 1.3 1.1Non-Energy Uses 852 563 662 654 665 701 729 753 788 -2.5 0.0 0.9 0.8Final Energy Demand 9423 4097 3639 4165 4809 5540 6229 6854 7516 -9.1 2.8 2.6 1.9by sectorIndustry(1) 3229 940 678 755 940 1156 1328 1484 1669 -14.4 3.3 3.5 2.3 - energy intensive industries 1574 410 253 255 302 365 408 440 483 -16.7 1.8 3.0 1.7 - other industrial sectors 1656 530 426 500 637 791 920 1044 1187 -12.7 4.1 3.7 2.6Residential 1662 1248 1345 1425 1582 1796 2026 2251 2454 -2.1 1.6 2.5 1.9Tertiary 2541 872 568 659 777 912 1023 1123 1215 -13.9 3.2 2.8 1.7Transport 1990 1037 1048 1326 1510 1677 1852 1996 2177 -6.2 3.7 2.1 1.6by fuel (1)
Solids 852 236 88 58 44 37 36 35 33 -20.3 -6.7 -2.1 -0.7Oil 4055 1666 1348 1526 1763 1955 2055 2176 2336 -10.4 2.7 1.5 1.3Gas 1483 510 367 458 545 672 833 970 1092 -13.0 4.0 4.3 2.7Electricity 1033 546 531 681 848 1059 1257 1435 1618 -6.4 4.8 4.0 2.6Heat (from CHP and District Heating) 2000 1140 725 876 992 1082 1188 1263 1380 -9.7 3.2 1.8 1.5Other 0 0 579 566 617 736 859 974 1057 0.6 3.4 2.1
CO2 Emissions (Mt of CO2) 32.9 13.5 10.2 13.8 14.4 16.4 17.3 18.4 19.8 -11.0 3.5 1.8 1.4Power generation/District heating 12.1 5.6 3.9 6.7 6.3 7.3 7.5 8.0 8.7 -10.7 5.0 1.8 1.5Energy Branch 1.6 0.8 1.1 1.3 1.4 1.6 1.5 1.5 1.5 -3.3 2.3 0.8 -0.4Industry 6.0 1.7 1.1 1.0 1.3 1.5 1.7 1.9 1.9 -15.9 1.6 3.1 1.3Residential 2.5 0.8 0.5 0.5 0.6 0.7 0.9 1.0 1.2 -14.0 0.8 3.7 3.0Tertiary 4.8 1.6 0.5 0.4 0.4 0.5 0.5 0.6 0.6 -20.2 -1.6 1.8 1.3Transport 5.8 3.0 3.1 3.9 4.4 4.8 5.1 5.5 5.9 -6.2 3.6 1.5 1.5
CO2 Emissions Index (1990=100) 100.0 41.1 31.1 42.0 43.9 50.0 52.5 56.1 60.3
Source: PRIMES
114

LITHUANIA: Baseline scenario SUMMARY ENERGY BALANCE AND INDICATORS (B)1990 1995 2000 2005 2010 2015 2020 2025 2030 '90-'00 '00-'10 '10-'20 '20-'30
Annual % ChangeMain Energy System IndicatorsPopulation (Million) 3.698 3.629 3.500 3.447 3.345 3.258 3.182 3.134 3.092 -0.5 -0.5 -0.5 -0.3GDP (in 000 MEUR'00) 17.3 10.0 12.3 17.4 23.1 29.9 37.2 45.5 54.3 -3.3 6.5 4.9 3.8Gross Inl. Cons./GDP (toe/MEUR'00) 925.9 824.6 586.5 439.6 305.4 267.8 251.6 224.3 205.3 -4.5 -6.3 -1.9 -2.0Gross Inl. Cons./Capita (toe/inhabitant) 4.33 2.28 2.06 2.22 2.11 2.45 2.94 3.26 3.60 -7.1 0.2 3.4 2.1Electricity Generated/Capita (kWh/inhabitant) 7680 3725 3177 3953 3690 4867 6735 7725 8639 -8.4 1.5 6.2 2.5Carbon intensity (t of CO2/toe of GIC) 2.05 1.63 1.41 1.80 2.04 2.05 1.84 1.81 1.78 -3.6 3.7 -1.0 -0.4CO2 Emissions/Capita (t of CO2/inhabitant) 8.88 3.72 2.92 4.00 4.31 5.04 5.42 5.88 6.40 -10.5 4.0 2.3 1.7CO2 Emissions to GDP (t of CO2/MEUR'00) 1898.4 1346.1 829.5 791.2 623.2 550.1 463.8 405.2 364.9 -7.9 -2.8 -2.9 -2.4Import Dependency % 74.1 67.4 59.6 73.6 86.6 85.6 75.3 73.5 70.6 0.0 0.0 0.0 0.0
Energy intensity indicators (1990=100)Industry (Energy on Value added) 100.0 68.4 36.3 25.7 23.1 21.3 19.4 17.7 16.7 -9.6 -4.4 -1.7 -1.5Residential (Energy on Private Income) 100.0 129.5 107.5 79.2 65.9 57.7 52.0 47.1 42.9 0.7 -4.8 -2.3 -1.9Tertiary (Energy on Value added) 100.0 41.8 21.7 19.9 17.9 16.4 14.8 13.2 11.9 -14.2 -1.9 -1.9 -2.2Transport (Energy on GDP) 100.0 89.9 73.9 66.2 56.8 48.8 43.3 38.1 34.9 -3.0 -2.6 -2.7 -2.1
Carbon Intensity indicatorsElectricity and Steam production (t of CO2/MWh) 0.23 0.19 0.17 0.25 0.23 0.23 0.19 0.18 0.18 -2.7 3.1 -2.0 -0.6Final energy demand (t of CO2/toe) 2.03 1.73 1.43 1.39 1.39 1.36 1.31 1.29 1.28 -3.5 -0.3 -0.5 -0.3
Industry 1.87 1.81 1.58 1.35 1.34 1.33 1.28 1.25 1.17 -1.7 -1.7 -0.4 -1.0Residential 1.50 0.64 0.41 0.36 0.38 0.40 0.43 0.44 0.47 -12.2 -0.8 1.2 1.0Tertiary 1.89 1.81 0.89 0.62 0.55 0.52 0.50 0.49 0.48 -7.3 -4.6 -0.9 -0.5Transport 2.93 2.91 2.93 2.92 2.90 2.85 2.75 2.73 2.72 0.0 -0.1 -0.5 -0.1
Electricity and steam generationGeneration Capacity in MWe 5206 4445 4814 5553 5707 5713 6777 -0.8 1.7 1.7
Nuclear 2500 1250 0 0 452 545 768 5.4Hydro (pumping excluded) 101 116 132 161 217 245 258 2.7 5.1 1.7Wind 0 7 7 7 276 370 431 43.9 4.5Solar 0 0 1 4 7 13 16 21.5 8.6Thermal 2605 3072 4674 5381 4755 4540 5305 6.0 0.2 1.1
of which cogeneration units 1195 1585 2972 3508 3245 3445 4106 9.5 0.9 2.4Solids fired 0 0 0 0 1 5 342 90.1Gas fired 470 860 2147 2836 2940 3171 4181 16.4 3.2 3.6Oil fired 2000 2075 2390 2390 1578 1037 427 1.8 -4.1 -12.2Biomass-waste fired 135 137 137 155 237 327 354 0.1 5.6 4.1Fuel Cells 0 0 0 0 0 0 0Geothermal heat 0 0 0 0 0 0 0
IndicatorsEfficiency for thermal electricity production (%) 22.5 34.9 49.6 51.8 52.0 51.9 50.0 0.0 0.0 0.0 0.0Load factor for gross electric capacities (%) 24.4 35.0 29.3 32.6 42.9 48.4 45.0 0.0 0.0 0.0 0.0CHP indicator (% of electricity from CHP) 22.9 58.8 80.0 76.1 61.1 61.0 69.7 0.0 0.0 0.0 0.0Non fossil fuels in electricity generation (%) 82.0 39.4 6.8 6.7 26.9 29.8 34.9 0.0 0.0 0.0 0.0 - nuclear 75.7 33.5 0.0 0.0 16.4 17.5 22.4 0.0 0.0 0.0 0.0 - renewable energy forms 6.3 5.9 6.8 6.7 10.6 12.3 12.5 0.0 0.0 0.0 0.0
Transport sectorPassenger transport activity (Gpkm) 24.3 17.2 17.3 20.4 23.0 25.2 27.4 29.8 32.8 -3.4 2.9 1.8 1.8
Public road transport 7.9 4.2 2.2 2.1 2.0 1.9 1.8 1.8 1.7 -12.2 -0.8 -0.9 -0.7Private cars and motorcycles 12.3 11.7 14.3 17.4 20.1 22.4 24.6 27.0 30.1 1.5 3.5 2.1 2.0Rail 3.6 1.1 0.6 0.6 0.6 0.6 0.6 0.6 0.6 -16.3 -0.3 -0.4 -0.1Aviation 0.3 0.2 0.2 0.2 0.3 0.3 0.3 0.3 0.4 -5.0 3.0 1.5 1.5Inland navigation 0.2 0.0 0.1 0.1 0.1 0.1 0.1 0.1 0.1 -10.8 2.7 0.9 1.1
Travel per person (km per capita) 6584 4742 4942 5921 6870 7750 8600 9496 10604 -2.8 3.3 2.3 2.1
Freight transport activity (Gtkm) 26.6 12.4 16.7 22.0 26.9 32.7 38.1 43.5 48.4 -4.6 4.9 3.6 2.4Trucks 7.3 5.2 7.8 10.8 13.7 17.2 20.8 24.3 27.5 0.6 5.8 4.2 2.9Rail 19.3 7.2 8.9 11.3 13.2 15.5 17.4 19.2 20.9 -7.4 4.0 2.8 1.9Inland navigation 0.0 0.0 0.0 0.0 0.0 0.0 0.0 0.0 0.0
Freight activity per unit of GDP (tkm/000 Euro'00) 1537 1236 1355 1265 1162 1094 1025 956 893 -1.3 -1.5 -1.2 -1.4
Energy demand in transport (ktoe) 1990 1037 1048 1326 1510 1677 1852 1996 2177 -6.2 3.7 2.1 1.6Public road transport 157 50 38 37 35 33 30 28 26 -13.2 -0.8 -1.4 -1.6Private cars and motorcycles 553 477 534 651 684 691 740 787 854 -0.3 2.5 0.8 1.4Trucks 1009 382 371 514 655 817 943 1046 1157 -9.5 5.8 3.7 2.1Rail 132 86 75 90 99 98 99 105 110 -5.5 2.9 0.0 1.0Aviation 135 41 27 31 34 34 34 26 25 -14.9 2.3 0.0 -3.1Inland navigation 5 1 3 4 4 4 5 5 5 -5.0 2.5 1.9 1.1
Efficiency indicator (activity related)Passenger transport (toe/Mpkm) 37.8 34.3 35.4 35.9 33.3 30.4 29.6 28.4 27.7 -0.6 -0.6 -1.2 -0.6Freight transport (toe/Mtkm) 40.2 36.0 26.1 26.9 27.7 27.8 27.3 26.4 26.2 -4.3 0.6 -0.2 -0.4
115

LUXEMBURG: Baseline scenario SUMMARY ENERGY BALANCE AND INDICATORS (A) ktoe 1990 1995 2000 2005 2010 2015 2020 2025 2030 '90-'00 '00-'10 '10-'20 '20-'30
Annual % ChangePrimary Production 47 47 57 49 92 144 233 271 286 1.9 5.0 9.7 2.1
Solids 0 0 0 0 0 0 0 0 0Oil 0 0 0 0 0 0 0 0 0Natural gas 0 0 0 0 0 0 0 0 0Nuclear 0 0 0 0 0 0 0 0 0Renewable energy sources 47 47 57 49 92 144 233 271 286 1.9 5.0 9.7 2.1
Hydro 6 7 10 10 10 10 10 10 10 5.8 0.0 0.0 0.0Biomass & Waste 41 39 44 31 72 123 206 243 258 0.7 5.0 11.1 2.3Wind 0 0 2 6 7 8 14 14 13 12.3 6.2 -0.3Solar and others 0 0 0 2 2 2 3 4 4 2.8 3.0Geothermal 0 0 0 0 0 0 0 0 0 0.1 1.8
Net Imports 3516 3257 3619 4018 4328 4609 4820 4921 4948 0.3 1.8 1.1 0.3Solids 1130 514 125 43 37 37 36 32 25 -19.7 -11.5 -0.3 -3.7Oil 1620 1756 2332 2529 2686 2745 2794 2758 2707 3.7 1.4 0.4 -0.3 - Crude oil and Feedstocks 0 0 0 0 0 0 0 0 0 - Oil products 1620 1756 2332 2529 2686 2745 2794 2758 2707 3.7 1.4 0.4 -0.3Natural gas 430 557 669 1069 1180 1306 1443 1555 1611 4.5 5.8 2.0 1.1Electricity 336 430 492 378 424 521 548 576 605 3.9 -1.5 2.6 1.0
Gross Inland Consumption 3551 3335 3627 4067 4420 4753 5054 5192 5234 0.2 2.0 1.3 0.4Solids 1130 514 125 43 37 37 36 32 25 -19.7 -11.5 -0.3 -3.7Oil 1609 1788 2283 2529 2686 2745 2794 2758 2707 3.6 1.6 0.4 -0.3Natural gas 430 557 669 1069 1180 1306 1443 1555 1611 4.5 5.8 2.0 1.1Nuclear 0 0 0 0 0 0 0 0 0Electricity 336 430 492 378 424 521 548 576 605 3.9 -1.5 2.6 1.0Renewable energy forms 47 47 57 49 92 144 233 271 286 1.9 5.0 9.7 2.1
as % in Gross Inland ConsumptionSolids 31.8 15.4 3.5 1.0 0.8 0.8 0.7 0.6 0.5Oil 45.3 53.6 63.0 62.2 60.8 57.7 55.3 53.1 51.7Natural gas 12.1 16.7 18.5 26.3 26.7 27.5 28.6 29.9 30.8Nuclear 0.0 0.0 0.0 0.0 0.0 0.0 0.0 0.0 0.0Renewable energy forms 1.3 1.4 1.6 1.2 2.1 3.0 4.6 5.2 5.5
Electricity Generation in GWhe 627 498 433 2133 2236 2050 2457 2784 2853 -3.6 17.8 1.0 1.5Nuclear 0 0 0 0 0 0 0 0 0Hydro & wind 68 84 147 194 207 210 279 282 275 8.0 3.5 3.0 -0.1Thermal (incl. biomass) 559 414 286 1939 2029 1840 2179 2502 2578 -6.5 21.6 0.7 1.7
Fuel Inputs for Thermal Power Generation (1) 195 130 85 341 359 325 380 428 441 -8.0 15.5 0.6 1.5Solids 0 0 0 0 0 0 0 0 0Oil (including refinery gas) 7 0 0 0 0 0 0 0 0 -28.9 -4.4 -2.0 -4.1Gas 163 106 57 332 348 316 347 383 393 -10.0 19.9 0.0 1.2Biomass & Waste 25 24 28 9 10 9 33 45 48 1.0 -9.6 12.4 3.8Geothermal heat 0 0 0 0 0 0 0 0 0Hydrogen - Methanol 0 0 0 0 0 0 0 0 0
Fuel Input in other transformation proc. 378 144 0 19 63 117 178 204 215 11.0 1.9Refineries 0 0 0 0 0 0 0 0 0Biofuels and hydrogen production 0 0 0 9 54 110 174 202 215 12.5 2.2District heating 0 0 0 9 9 7 4 2 0 -7.7Others 378 144 0 0 0 0 0 0 0
Energy Branch Consumption 31 30 26 22 22 22 22 22 22 -1.8 -1.4 0.0 0.0Non-Energy Uses 20 23 14 18 23 28 31 33 34 -3.9 5.3 3.1 1.0Final Energy Demand 3325 3148 3534 3877 4208 4547 4811 4929 4968 0.6 1.8 1.3 0.3by sectorIndustry(1) 1725 1180 944 983 1126 1359 1512 1620 1676 -5.9 1.8 3.0 1.0 - energy intensive industries 1521 883 484 463 491 522 530 533 524 -10.8 0.1 0.8 -0.1 - other industrial sectors 204 296 459 520 635 837 983 1087 1152 8.5 3.3 4.5 1.6Residential 519 559 596 643 669 679 672 669 670 1.4 1.2 0.0 0.0Tertiary 74 103 118 154 168 185 209 230 249 4.7 3.6 2.3 1.8Transport 1007 1307 1877 2097 2245 2325 2418 2410 2373 6.4 1.8 0.7 -0.2by fuel (1)
Solids 752 367 121 43 37 37 36 32 25 -16.7 -11.1 -0.3 -3.7Oil 1581 1752 2266 2511 2663 2717 2763 2725 2673 3.7 1.6 0.4 -0.3Gas 622 585 612 726 822 980 1086 1162 1209 -0.2 3.0 2.8 1.1Electricity 355 430 491 527 582 662 724 781 816 3.3 1.7 2.2 1.2Heat (from CHP and District Heating) 0 0 28 49 52 56 59 62 66 6.5 1.2 1.1Other 15 15 16 22 52 93 143 167 180 0.4 12.5 10.7 2.3
CO2 Emissions (Mt of CO2) 10.6 8.7 8.8 10.2 10.9 11.4 11.8 11.9 11.9 -1.8 2.1 0.8 0.1Power generation/District heating 0.7 0.4 0.1 0.8 0.8 0.8 0.8 0.9 0.9 -15.5 20.1 -0.2 1.1Energy Branch 0.0 0.0 0.0 0.0 0.0 0.0 0.0 0.0 0.0 4.3Industry 5.7 3.1 1.6 1.6 1.8 2.2 2.5 2.7 2.7 -11.7 1.2 3.1 0.9Residential 1.3 1.3 1.4 1.5 1.5 1.5 1.5 1.5 1.4 1.1 0.7 -0.2 -0.3Tertiary 0.0 0.1 0.1 0.1 0.1 0.1 0.2 0.2 0.2 17.3 5.9 2.7 1.7Transport 3.0 3.9 5.6 6.2 6.6 6.7 6.8 6.7 6.6 6.5 1.6 0.4 -0.4
CO2 Emissions Index (1990=100) 100.0 81.8 83.0 95.8 102.4 106.8 111.0 112.3 111.8
Source: PRIMES
116

LUXEMBURG: Baseline scenario SUMMARY ENERGY BALANCE AND INDICATORS (B)1990 1995 2000 2005 2010 2015 2020 2025 2030 '90-'00 '00-'10 '10-'20 '20-'30
Annual % ChangeMain Energy System IndicatorsPopulation (Million) 0.382 0.410 0.439 0.458 0.477 0.499 0.521 0.544 0.567 1.4 0.8 0.9 0.9GDP (in 000 MEUR'00) 12.5 15.1 21.3 24.6 31.7 41.7 50.7 58.7 64.4 5.5 4.1 4.8 2.4Gross Inl. Cons./GDP (toe/MEUR'00) 284.9 220.4 170.4 165.0 139.6 114.1 99.6 88.4 81.3 -5.0 -2.0 -3.3 -2.0Gross Inl. Cons./Capita (toe/inhabitant) 9.30 8.13 8.26 8.88 9.26 9.53 9.70 9.54 9.23 -1.2 1.1 0.5 -0.5Electricity Generated/Capita (kWh/inhabitant) 1641 1214 986 4657 4683 4112 4718 5118 5031 -5.0 16.9 0.1 0.6Carbon intensity (t of CO2/toe of GIC) 3.00 2.61 2.43 2.51 2.46 2.39 2.34 2.30 2.27 -2.1 0.1 -0.5 -0.3CO2 Emissions/Capita (t of CO2/inhabitant) 27.85 21.23 20.11 22.25 22.81 22.77 22.67 21.96 20.97 -3.2 1.3 -0.1 -0.8CO2 Emissions to GDP (t of CO2/MEUR'00) 853.3 575.2 414.9 413.5 344.1 272.6 232.8 203.4 184.6 -7.0 -1.9 -3.8 -2.3Import Dependency % 99.0 97.7 99.8 98.8 97.9 97.0 95.4 94.8 94.5 0.0 0.0 0.0 0.0
Energy intensity indicators (1990=100)Industry (Energy on Value added) 100.0 60.3 41.1 37.7 35.0 32.1 29.5 27.5 26.1 -8.5 -1.6 -1.7 -1.2Residential (Energy on Private Income) 100.0 95.2 82.0 76.9 64.2 51.4 42.6 36.8 33.4 -2.0 -2.4 -4.0 -2.4Tertiary (Energy on Value added) 100.0 106.9 87.7 98.5 83.0 69.4 64.5 61.0 60.4 -1.3 -0.5 -2.5 -0.6Transport (Energy on GDP) 100.0 106.9 109.2 105.3 87.8 69.1 59.0 50.8 45.6 0.9 -2.2 -3.9 -2.5
Carbon Intensity indicatorsElectricity and Steam production (t of CO2/MWh) 1.15 0.77 0.18 0.30 0.29 0.28 0.26 0.26 0.25 -17.1 5.2 -1.2 -0.3Final energy demand (t of CO2/toe) 2.98 2.64 2.46 2.42 2.39 2.33 2.28 2.24 2.21 -1.9 -0.3 -0.5 -0.3
Industry 3.28 2.60 1.72 1.61 1.63 1.65 1.65 1.64 1.63 -6.2 -0.6 0.1 -0.2Residential 2.45 2.39 2.37 2.27 2.27 2.25 2.22 2.19 2.16 -0.3 -0.4 -0.2 -0.3Tertiary 0.21 0.51 0.65 0.84 0.81 0.80 0.84 0.83 0.84 12.0 2.2 0.4 0.0Transport 2.95 2.96 2.97 2.97 2.92 2.87 2.82 2.79 2.77 0.1 -0.2 -0.4 -0.2
Electricity and steam generationGeneration Capacity in MWe 304 695 709 711 773 821 815 8.8 0.9 0.5
Nuclear 0 0 0 0 0 0 0Hydro (pumping excluded) 157 157 157 157 157 157 157 0.0 0.0 0.0Wind 10 34 44 47 74 77 70 16.0 5.3 -0.5Solar 2 4 6 9 11 14 14 12.2 5.8 2.6Thermal 135 500 502 499 531 574 574 14.0 0.6 0.8
of which cogeneration units 125 125 125 131 160 196 193 0.0 2.5 1.9Solids fired 0 0 0 0 0 0 0Gas fired 124 489 489 490 493 525 522 14.7 0.1 0.6Oil fired 1 1 1 0 0 0 0 0.0 -20.0 0.0Biomass-waste fired 10 10 12 9 38 49 52 1.6 12.5 3.1Fuel Cells 0 0 0 0 0 0 0Geothermal heat 0 0 0 0 0 0 0
IndicatorsEfficiency for thermal electricity production (%) 28.9 48.9 48.6 48.7 49.3 50.3 50.3 0.0 0.0 0.0 0.0Load factor for gross electric capacities (%) 16.3 35.0 36.0 32.9 36.3 38.7 39.9 0.0 0.0 0.0 0.0CHP indicator (% of electricity from CHP) 54.1 14.6 15.3 19.7 18.0 20.3 22.8 0.0 0.0 0.0 0.0Non fossil fuels in electricity generation (%) 45.9 9.9 10.2 12.6 17.5 17.8 17.6 0.0 0.0 0.0 0.0 - nuclear 0.0 0.0 0.0 0.0 0.0 0.0 0.0 0.0 0.0 0.0 0.0 - renewable energy forms 45.9 9.9 10.2 12.6 17.5 17.8 17.6 0.0 0.0 0.0 0.0
Transport sectorPassenger transport activity (Gpkm) 5.4 6.3 6.9 7.4 8.1 8.5 8.9 9.3 9.6 2.4 1.6 1.0 0.8
Public road transport 0.9 0.9 0.9 0.9 0.9 0.9 0.9 0.9 0.9 0.0 0.3 -0.3 0.4Private cars and motorcycles 4.0 4.8 5.1 5.5 6.0 6.3 6.6 6.8 7.1 2.5 1.5 0.9 0.7Rail 0.2 0.3 0.3 0.3 0.3 0.3 0.3 0.3 0.3 4.8 -0.3 0.0 0.6Aviation 0.3 0.4 0.5 0.7 0.8 1.0 1.1 1.2 1.3 5.3 5.2 2.9 1.3Inland navigation 0.0 0.0 0.0 0.0 0.0 0.0 0.0 0.0 0.0
Travel per person (km per capita) 14228 15420 15654 16232 16878 17090 17084 17013 16973 1.0 0.8 0.1 -0.1
Freight transport activity (Gtkm) 4.2 6.4 8.6 9.6 10.8 12.2 13.8 15.0 15.8 7.6 2.3 2.5 1.4Trucks 3.2 5.5 7.6 8.6 9.9 11.3 12.8 14.0 14.8 9.0 2.6 2.6 1.5Rail 0.6 0.5 0.6 0.6 0.6 0.6 0.6 0.6 0.7 0.3 -0.9 0.6 0.7Inland navigation 0.3 0.3 0.4 0.4 0.4 0.4 0.4 0.4 0.4 1.2 -0.4 0.0 0.3
Freight activity per unit of GDP (tkm/000 Euro'00) 333 421 405 389 341 293 271 255 246 2.0 -1.7 -2.3 -1.0
Energy demand in transport (ktoe) 1007 1307 1877 2097 2245 2325 2418 2410 2373 6.4 1.8 0.7 -0.2Public road transport 18 18 24 24 24 23 21 19 18 3.0 0.1 -1.3 -1.3Private cars and motorcycles 499 608 759 812 797 746 743 717 689 4.3 0.5 -0.7 -0.8Trucks 342 479 754 853 974 1095 1188 1242 1236 8.2 2.6 2.0 0.4Rail 13 9 15 15 13 12 9 8 8 2.0 -1.3 -4.2 -0.6Aviation 131 189 320 388 432 445 453 420 418 9.3 3.0 0.5 -0.8Inland navigation 4 4 4 4 4 4 4 4 4 -0.1 -0.4 -0.1 0.1
Efficiency indicator (activity related)Passenger transport (toe/Mpkm) 120.7 130.1 162.3 166.3 156.9 143.5 137.6 125.7 117.6 3.0 -0.3 -1.3 -1.6Freight transport (toe/Mtkm) 84.5 76.1 88.5 89.7 90.9 90.2 86.7 83.3 78.5 0.5 0.3 -0.5 -1.0
117

MALTA: Baseline scenario SUMMARY ENERGY BALANCE AND INDICATORS (A) ktoe 1990 1995 2000 2005 2010 2015 2020 2025 2030 '90-'00 '00-'10 '10-'20 '20-'30
Annual % ChangePrimary Production 0 0 0 0 6 23 25 26 38 14.8 4.4
Solids 0 0 0 0 0 0 0 0 0Oil 0 0 0 0 0 0 0 0 0Natural gas 0 0 0 0 0 0 0 0 0Nuclear 0 0 0 0 0 0 0 0 0Renewable energy sources 0 0 0 0 6 23 25 26 38 14.8 4.4
Hydro 0 0 0 0 0 0 0 0 0Biomass & Waste 0 0 0 0 6 22 24 25 27 14.7 1.2Wind 0 0 0 0 0 0 1 1 11 19.1 30.3Solar and others 0 0 0 0 0 0 0 0 0Geothermal 0 0 0 0 0 0 0 0 0
Net Imports 611 877 1231 1240 1352 1419 1361 1308 1313 7.3 0.9 0.1 -0.4Solids 0 0 0 3 3 3 4 5 5 2.5 2.4Oil 611 877 1231 1237 1349 1416 1357 1304 1308 7.3 0.9 0.1 -0.4 - Crude oil and Feedstocks 0 0 0 0 0 0 0 0 0 - Oil products 611 877 1231 1237 1349 1416 1357 1304 1308 7.3 0.9 0.1 -0.4Natural gas 0 0 0 0 0 0 0 0 0Electricity 0 0 0 0 0 0 0 0 0
Gross Inland Consumption 581 795 940 958 1075 1164 1115 1075 1096 4.9 1.4 0.4 -0.2Solids 0 0 0 3 3 3 4 5 5 2.5 2.4Oil 581 795 940 955 1066 1138 1086 1045 1052 4.9 1.3 0.2 -0.3Natural gas 0 0 0 0 0 0 0 0 0Nuclear 0 0 0 0 0 0 0 0 0Electricity 0 0 0 0 0 0 0 0 0Renewable energy forms 0 0 0 0 6 23 25 26 38 14.8 4.4
as % in Gross Inland ConsumptionSolids 0.0 0.0 0.0 0.3 0.3 0.3 0.4 0.4 0.5Oil 100.0 100.0 100.0 99.7 99.1 97.8 97.4 97.1 96.1Natural gas 0.0 0.0 0.0 0.0 0.0 0.0 0.0 0.0 0.0Nuclear 0.0 0.0 0.0 0.0 0.0 0.0 0.0 0.0 0.0Renewable energy forms 0.0 0.0 0.0 0.0 0.6 1.9 2.2 2.4 3.5
Electricity Generation in GWhe 1100 1632 1917 2194 2508 2795 2969 3202 3456 5.7 2.7 1.7 1.5Nuclear 0 0 0 0 0 0 0 0 0Hydro & wind 0 0 0 0 2 6 9 15 128 19.1 30.3Thermal (incl. biomass) 1100 1632 1917 2194 2506 2789 2960 3187 3328 5.7 2.7 1.7 1.2
Fuel Inputs for Thermal Power Generation (1) 321 468 519 548 629 700 642 652 675 4.9 2.0 0.2 0.5Solids 0 0 0 0 0 0 0 0 0Oil (including refinery gas) 321 468 519 548 624 680 621 629 651 4.9 1.9 0.0 0.5Gas 0 0 0 0 0 0 0 0 0Biomass & Waste 0 0 0 0 6 21 22 22 24 14.2 0.9Geothermal heat 0 0 0 0 0 0 0 0 0Hydrogen - Methanol 0 0 0 0 0 0 0 0 0
Fuel Input in other transformation proc. 0 0 0 0 0 2 2 2 3 22.4 4.4Refineries 0 0 0 0 0 0 0 0 0Biofuels and hydrogen production 0 0 0 0 0 2 2 2 3 22.4 4.4District heating 0 0 0 0 0 0 0 0 0Others 0 0 0 0 0 0 0 0 0
Energy Branch Consumption 8 19 10 11 12 14 14 14 15 2.5 2.3 0.9 0.9Non-Energy Uses 6 0 0 13 15 16 18 19 21 1.7 1.6Final Energy Demand 332 435 522 573 631 671 692 660 666 4.6 1.9 0.9 -0.4by sectorIndustry(1) 0 42 69 72 77 83 89 97 106 1.1 1.4 1.8 - energy intensive industries 0 0 0 0 0 0 0 0 0 - other industrial sectors 0 42 69 72 77 83 89 97 106 1.1 1.4 1.8Residential 55 70 82 94 109 121 130 135 141 4.0 2.8 1.8 0.8Tertiary 56 32 52 57 65 72 72 75 80 -0.8 2.4 1.0 1.1Transport 221 291 319 350 380 395 402 352 339 3.7 1.8 0.5 -1.7by fuel (1)
Solids 0 0 0 0 0 0 0 0 0Oil 254 327 367 398 431 446 452 401 386 3.7 1.6 0.5 -1.6Gas 0 0 0 0 0 0 0 0 0Electricity 78 108 155 175 200 223 238 257 278 7.1 2.6 1.7 1.6Heat (from CHP and District Heating) 0 0 0 0 0 0 0 0 0Other 0 0 0 0 0 1 2 2 3 22.7 4.6
CO2 Emissions (Mt of CO2) 1.8 2.5 2.7 2.9 3.3 3.5 3.3 3.2 3.2 4.4 1.8 0.2 -0.3Power generation/District heating 1.0 1.5 1.7 1.7 2.0 2.2 2.0 2.0 2.1 4.9 1.9 0.0 0.5Energy Branch 0.0 0.0 0.0 0.0 0.0 0.0 0.0 0.0 0.0Industry 0.0 0.0 0.0 0.0 0.0 0.0 0.0 0.0 0.0Residential 0.1 0.1 0.1 0.1 0.1 0.1 0.1 0.1 0.1 1.8 0.8 0.6 -0.6Tertiary 0.0 0.0 0.0 0.0 0.0 0.0 0.0 0.0 0.0 0.7 -0.2 0.4Transport 0.7 0.9 1.0 1.0 1.1 1.2 1.2 1.0 1.0 3.8 1.7 0.5 -1.7
CO2 Emissions Index (1990=100) 100.0 138.8 154.4 164.7 184.0 196.7 187.1 180.2 181.6
Source: PRIMES
118

MALTA: Baseline scenario SUMMARY ENERGY BALANCE AND INDICATORS (B)1990 1995 2000 2005 2010 2015 2020 2025 2030 '90-'00 '00-'10 '10-'20 '20-'30
Annual % ChangeMain Energy System IndicatorsPopulation (Million) 0.360 0.378 0.390 0.402 0.423 0.439 0.454 0.468 0.479 0.8 0.8 0.7 0.5GDP (in 000 MEUR'00) 2.6 3.3 4.1 4.2 4.7 5.5 6.6 7.7 8.7 4.9 1.3 3.4 2.8Gross Inl. Cons./GDP (toe/MEUR'00) 226.3 242.5 227.6 227.9 228.4 210.1 169.1 140.0 126.0 0.1 0.0 -3.0 -2.9Gross Inl. Cons./Capita (toe/inhabitant) 1.61 2.10 2.41 2.38 2.54 2.65 2.46 2.30 2.29 4.1 0.5 -0.4 -0.7Electricity Generated/Capita (kWh/inhabitant) 3055 4317 4914 5459 5935 6369 6540 6845 7214 4.9 1.9 1.0 1.0Carbon intensity (t of CO2/toe of GIC) 3.06 3.10 2.92 3.05 3.04 3.00 2.98 2.98 2.94 -0.5 0.4 -0.2 -0.1CO2 Emissions/Capita (t of CO2/inhabitant) 4.93 6.52 7.03 7.28 7.73 7.96 7.32 6.84 6.73 3.6 1.0 -0.5 -0.8CO2 Emissions to GDP (t of CO2/MEUR'00) 692.1 751.8 664.3 696.3 694.3 630.5 504.3 416.9 370.9 -0.4 0.4 -3.1 -3.0Import Dependency % 100.0 104.5 100.5 100.0 99.5 98.4 98.2 98.0 97.2 0.0 0.0 0.0 0.0
Energy intensity indicators (1990=100)Industry (Energy on Value added)
Residential (Energy on Private Income) 100.0 96.3 91.7 101.8 105.9 102.4 94.5 86.1 80.4 -0.9 1.4 -1.1 -1.6Tertiary (Energy on Value added) 100.0 42.0 54.2 61.7 63.7 58.7 48.5 43.5 40.8 -5.9 1.6 -2.7 -1.7Transport (Energy on GDP) 100.0 103.0 89.7 96.6 93.8 82.8 70.8 53.3 45.2 -1.1 0.4 -2.8 -4.4
Carbon Intensity indicatorsElectricity and Steam production (t of CO2/MWh) 0.93 0.92 0.86 0.80 0.79 0.78 0.67 0.63 0.60 -0.8 -0.8 -1.7 -1.0Final energy demand (t of CO2/toe) 2.26 2.22 2.09 2.06 2.02 1.98 1.94 1.81 1.72 -0.8 -0.3 -0.4 -1.2
Industry 0.00 0.00 0.00 0.00 0.00 0.00 0.00 0.00Residential 1.66 1.43 1.34 1.18 1.10 1.03 0.97 0.90 0.84 -2.1 -2.0 -1.2 -1.5Tertiary 0.00 0.00 0.51 0.48 0.43 0.40 0.38 0.37 0.36 -1.6 -1.2 -0.7Transport 2.97 2.98 2.99 2.98 2.97 2.97 2.96 2.96 2.95 0.0 0.0 0.0 0.0
Electricity and steam generationGeneration Capacity in MWe 552 687 615 626 724 900 1132 1.1 1.7 4.6
Nuclear 0 0 0 0 0 0 0Hydro (pumping excluded) 0 0 0 0 0 0 0Wind 0 0 1 2 4 6 53 19.1 30.0Solar 0 0 0 0 0 0 0Thermal 552 687 614 624 721 894 1078 1.1 1.6 4.1
of which cogeneration units 0 0 0 0 0 0 0Solids fired 0 0 0 0 0 0 0Gas fired 0 0 0 0 0 0 0Oil fired 552 687 611 611 707 879 1063 1.0 1.5 4.2Biomass-waste fired 0 0 4 13 14 15 16 14.5 1.3Fuel Cells 0 0 0 0 0 0 0Geothermal heat 0 0 0 0 0 0 0
IndicatorsEfficiency for thermal electricity production (%) 31.8 34.5 34.3 34.3 39.6 42.1 42.4 0.0 0.0 0.0 0.0Load factor for gross electric capacities (%) 39.7 36.5 46.6 51.0 46.8 40.6 34.9 0.0 0.0 0.0 0.0CHP indicator (% of electricity from CHP) 0.0 0.0 0.0 0.0 0.0 0.0 0.0 0.0 0.0 0.0 0.0Non fossil fuels in electricity generation (%) 0.0 0.0 1.1 3.5 3.6 3.7 6.9 0.0 0.0 0.0 0.0 - nuclear 0.0 0.0 0.0 0.0 0.0 0.0 0.0 0.0 0.0 0.0 0.0 - renewable energy forms 0.0 0.0 1.1 3.5 3.6 3.7 6.9 0.0 0.0 0.0 0.0
Transport sectorPassenger transport activity (Gpkm) 2.8 3.6 4.1 4.6 5.3 5.9 6.5 7.0 7.4 4.0 2.8 1.9 1.4
Public road transport 0.1 0.1 0.1 0.1 0.1 0.1 0.1 0.1 0.1 -2.6 0.8 0.6 0.5Private cars and motorcycles 2.0 2.0 2.2 2.2 2.4 2.5 2.6 2.7 2.8 1.1 1.1 0.8 0.5Rail 0.0 0.0 0.0 0.0 0.0 0.0 0.0 0.0 0.0Aviation 0.7 1.4 1.8 2.3 2.8 3.3 3.7 4.1 4.5 10.5 4.6 2.8 2.0Inland navigation 0.0 0.0 0.0 0.0 0.0 0.0 0.0 0.0 0.0
Travel per person (km per capita) 7644 9432 10451 11465 12656 13469 14228 14865 15464 3.2 1.9 1.2 0.8
Freight transport activity (Gtkm) 2.8 3.2 3.7 3.7 3.7 3.8 3.8 3.9 3.9 2.9 0.0 0.3 0.3Trucks 2.8 3.2 3.7 3.7 3.7 3.8 3.8 3.9 3.9 2.9 0.0 0.3 0.3Rail 0.0 0.0 0.0 0.0 0.0 0.0 0.0 0.0 0.0Inland navigation 0.0 0.0 0.0 0.0 0.0 0.0 0.0 0.0 0.0
Freight activity per unit of GDP (tkm/000 Euro'00) 1078 976 896 885 787 678 581 506 452 -1.8 -1.3 -3.0 -2.5
Energy demand in transport (ktoe) 221 291 319 350 380 395 402 352 339 3.7 1.8 0.5 -1.7Public road transport 1 1 1 1 1 1 1 1 1 1.8 0.7 0.0 -0.5Private cars and motorcycles 42 46 78 80 80 76 76 75 74 6.3 0.3 -0.5 -0.3Trucks 106 130 130 131 130 131 130 127 125 2.1 0.0 0.0 -0.4Rail 0 0 0 0 0 0 0 0 0Aviation 72 114 110 137 169 186 195 149 139 4.3 4.4 1.4 -3.3Inland navigation 0 0 0 0 0 0 0 0 0
Efficiency indicator (activity related)Passenger transport (toe/Mpkm) 41.8 45.0 46.3 47.5 46.8 44.6 42.0 32.4 28.8 1.0 0.1 -1.1 -3.7Freight transport (toe/Mtkm) 38.3 40.7 35.1 35.1 35.1 35.0 33.9 32.6 31.8 -0.9 0.0 -0.3 -0.7
119

THE NETHERLANDS: Baseline scenario SUMMARY ENERGY BALANCE AND INDICATORS (A) ktoe 1990 1995 2000 2005 2010 2015 2020 2025 2030 '90-'00 '00-'10 '10-'20 '20-'30
Annual % ChangePrimary Production 60288 65988 57172 63249 65844 64492 58086 52939 49419 -0.5 1.4 -1.2 -1.6
Solids 0 0 0 0 0 0 0 0 0Oil 4029 3562 2423 2487 2645 2400 2000 1500 1000 -5.0 0.9 -2.8 -6.7Natural gas 54613 60456 51904 57465 59000 57000 50000 44000 39000 -0.5 1.3 -1.6 -2.5Nuclear 881 1036 1013 1023 1044 1064 1086 1626 3451 1.4 0.3 0.4 12.3Renewable energy sources 766 933 1831 2274 3156 4028 5001 5813 5968 9.1 5.6 4.7 1.8
Hydro 7 8 12 12 12 12 12 12 12 5.3 0.0 0.0 0.0Biomass & Waste 752 894 1739 1970 2450 3169 3948 4413 4455 8.7 3.5 4.9 1.2Wind 5 27 71 268 650 778 943 1255 1335 30.9 24.7 3.8 3.5Solar and others 2 4 9 24 44 69 98 132 165 18.3 17.1 8.4 5.4Geothermal 0 0 0 0 0 0 0 0 0
Net Imports 17415 16340 34275 29024 30911 35884 43728 48421 52811 7.0 -1.0 3.5 1.9Solids 9546 8902 8166 8320 8240 8838 8730 9765 10169 -1.5 0.1 0.6 1.5Oil 30876 32829 41673 38351 40415 40642 41422 41974 42494 3.0 -0.3 0.2 0.3 - Crude oil and Feedstocks 47956 59277 60955 63339 67806 69298 71252 72485 73888 2.4 1.1 0.5 0.4 - Oil products -17080 -26448 -19282 -24988 -27391 -28655 -29831 -30511 -31394Natural gas -23799 -26370 -17191 -19036 -19090 -14809 -7533 -4286 -653Electricity 792 980 1626 1389 1346 1213 1110 967 801 7.5 -1.9 -1.9 -3.2
Gross Inland Consumption 66841 73355 75655 78505 82163 84865 85527 84726 85189 1.2 0.8 0.4 0.0Solids 9178 9079 7979 8320 8240 8838 8730 9765 10169 -1.4 0.3 0.6 1.5Oil 24415 27242 28496 27070 28468 27531 27134 26841 26453 1.6 0.0 -0.5 -0.3Natural gas 30810 34085 34711 38429 39910 42191 42467 39714 38347 1.2 1.4 0.6 -1.0Nuclear 881 1036 1013 1023 1044 1064 1086 1626 3451 1.4 0.3 0.4 12.3Electricity 792 980 1626 1389 1346 1213 1110 967 801 7.5 -1.9 -1.9 -3.2Renewable energy forms 766 933 1831 2274 3156 4028 5001 5813 5968 9.1 5.6 4.7 1.8
as % in Gross Inland ConsumptionSolids 13.7 12.4 10.5 10.6 10.0 10.4 10.2 11.5 11.9Oil 36.5 37.1 37.7 34.5 34.6 32.4 31.7 31.7 31.1Natural gas 46.1 46.5 45.9 49.0 48.6 49.7 49.7 46.9 45.0Nuclear 1.3 1.4 1.3 1.3 1.3 1.3 1.3 1.9 4.1Renewable energy forms 1.1 1.3 2.4 2.9 3.8 4.7 5.8 6.9 7.0
Electricity Generation in GWhe 71824 81054 89599 102417 112615 125787 136994 146105 153407 2.2 2.3 2.0 1.1Nuclear 3501 4017 3925 3965 4045 4125 4208 6302 13376 1.1 0.3 0.4 12.3Hydro & wind 141 405 971 3279 7781 9365 11425 15234 16381 21.3 23.1 3.9 3.7Thermal (incl. biomass) 68182 76632 84703 95173 100789 112296 121360 124569 123649 2.2 1.8 1.9 0.2
Fuel Inputs for Thermal Power Generation (1) 15062 17369 20121 21096 22516 24456 24406 23138 22412 2.9 1.1 0.8 -0.8Solids 5698 5900 5114 5266 5390 6144 6196 7419 8033 -1.1 0.5 1.4 2.6Oil (including refinery gas) 753 963 1283 905 904 628 367 326 325 5.5 -3.4 -8.6 -1.2Gas 8150 9902 12289 13402 14467 15504 15228 12789 11816 4.2 1.6 0.5 -2.5Biomass & Waste 461 605 1436 1524 1755 2180 2614 2604 2238 12.0 2.0 4.1 -1.5Geothermal heat 0 0 0 0 0 0 0 0 0Hydrogen - Methanol 0 0 0 0 0 0 0 0 0
Fuel Input in other transformation proc. 72281 83698 85058 88909 93611 93772 94738 94766 94668 1.6 1.0 0.1 0.0Refineries 68767 80009 82188 85682 90349 90317 91118 91232 91279 1.8 1.0 0.1 0.0Biofuels and hydrogen production 0 0 0 54 316 655 1020 1176 1249 12.4 2.0District heating 0 0 0 1 0 29 14 0 0 75.7 -43.9Others 3514 3689 2870 3173 2946 2772 2586 2357 2141 -2.0 0.3 -1.3 -1.9
Energy Branch Consumption 5410 6247 4970 5439 5533 5575 5616 5539 5539 -0.8 1.1 0.1 -0.1Non-Energy Uses 9486 9394 9579 10382 10785 10728 10585 10412 10249 0.1 1.2 -0.2 -0.3Final Energy Demand 43946 48699 51198 54086 57060 59202 61131 62120 62715 1.5 1.1 0.7 0.3by sectorIndustry(1) 14171 13934 15207 16578 17867 18306 18402 18395 18252 0.7 1.6 0.3 -0.1 - energy intensive industries 10511 9540 10503 11718 12592 12800 12756 12603 12354 0.0 1.8 0.1 -0.3 - other industrial sectors 3659 4393 4703 4861 5275 5506 5647 5791 5899 2.5 1.2 0.7 0.4Residential 9772 11124 10286 10615 11115 11623 12042 12163 12181 0.5 0.8 0.8 0.1Tertiary 9647 11237 11885 12206 12622 13160 13600 13910 14201 2.1 0.6 0.7 0.4Transport 10356 12404 13820 14687 15456 16113 17087 17652 18081 2.9 1.1 1.0 0.6by fuel (1)
Solids 1709 1414 1294 1441 1401 1359 1309 1248 1169 -2.7 0.8 -0.7 -1.1Oil 12739 14598 16419 17097 17988 18000 18327 18366 18310 2.6 0.9 0.2 0.0Gas 20745 22080 20527 21140 21755 22415 22633 22260 21773 -0.1 0.6 0.4 -0.4Electricity 6322 7143 8421 9121 9852 10747 11568 12210 12646 2.9 1.6 1.6 0.9Heat (from CHP and District Heating) 2138 3171 4225 4829 5405 5784 6098 6350 6711 7.0 2.5 1.2 1.0Other 293 293 312 457 659 898 1195 1687 2106 0.6 7.8 6.1 5.8
CO2 Emissions (Mt of CO2) 152.0 167.2 165.5 172.0 178.3 183.9 183.6 181.1 179.1 0.9 0.7 0.3 -0.2Power generation/District heating 44.6 50.3 53.7 56.3 59.2 63.8 62.4 61.3 61.3 1.9 1.0 0.5 -0.2Energy Branch 13.6 15.8 9.6 9.4 9.0 8.5 8.3 7.9 7.4 -3.5 -0.6 -0.8 -1.1Industry 25.5 23.6 23.3 24.9 26.7 26.4 25.6 23.7 21.5 -0.9 1.4 -0.4 -1.7Residential 19.2 20.6 18.9 19.1 19.4 19.7 19.8 19.4 19.0 -0.2 0.3 0.2 -0.4Tertiary 18.9 20.7 19.5 19.3 19.4 19.5 19.6 19.6 19.6 0.3 -0.1 0.1 0.0Transport 30.1 36.2 40.5 42.9 44.6 45.9 48.0 49.2 50.3 3.0 1.0 0.7 0.5
CO2 Emissions Index (1990=100) 100.0 110.0 108.9 113.2 117.3 121.0 120.8 119.2 117.9
Source: PRIMES
120

THE NETHERLANDS: Baseline scenario SUMMARY ENERGY BALANCE AND INDICATORS (B)1990 1995 2000 2005 2010 2015 2020 2025 2030 '90-'00 '00-'10 '10-'20 '20-'30
Annual % ChangeMain Energy System IndicatorsPopulation (Million) 14.947 15.460 15.922 16.338 16.672 16.957 17.209 17.429 17.589 0.6 0.5 0.3 0.2GDP (in 000 MEUR'00) 302.0 334.9 402.3 416.6 463.3 509.7 555.6 601.4 641.9 2.9 1.4 1.8 1.5Gross Inl. Cons./GDP (toe/MEUR'00) 221.3 219.1 188.1 188.4 177.4 166.5 153.9 140.9 132.7 -1.6 -0.6 -1.4 -1.5Gross Inl. Cons./Capita (toe/inhabitant) 4.47 4.74 4.75 4.81 4.93 5.00 4.97 4.86 4.84 0.6 0.4 0.1 -0.3Electricity Generated/Capita (kWh/inhabitant) 4805 5243 5627 6269 6755 7418 7960 8383 8722 1.6 1.8 1.7 0.9Carbon intensity (t of CO2/toe of GIC) 2.27 2.28 2.19 2.19 2.17 2.17 2.15 2.14 2.10 -0.4 -0.1 -0.1 -0.2CO2 Emissions/Capita (t of CO2/inhabitant) 10.17 10.81 10.40 10.53 10.69 10.84 10.67 10.39 10.18 0.2 0.3 0.0 -0.5CO2 Emissions to GDP (t of CO2/MEUR'00) 503.1 499.2 411.5 412.8 384.9 360.8 330.4 301.1 279.0 -2.0 -0.7 -1.5 -1.7Import Dependency % 22.4 19.3 38.5 31.5 31.9 35.7 42.9 47.8 51.7 0.0 0.0 0.0 0.0
Energy intensity indicators (1990=100)Industry (Energy on Value added) 100.0 90.5 86.1 97.2 98.2 93.1 87.3 81.7 76.9 -1.5 1.3 -1.2 -1.3Residential (Energy on Private Income) 100.0 105.3 80.0 82.6 77.4 73.4 69.7 65.0 61.1 -2.2 -0.3 -1.1 -1.3Tertiary (Energy on Value added) 100.0 103.9 89.1 86.6 79.7 75.1 70.8 66.6 63.4 -1.2 -1.1 -1.2 -1.1Transport (Energy on GDP) 100.0 108.0 100.2 102.8 97.3 92.2 89.7 85.6 82.2 0.0 -0.3 -0.8 -0.9
Carbon Intensity indicatorsElectricity and Steam production (t of CO2/MWh) 0.46 0.42 0.35 0.33 0.31 0.30 0.27 0.25 0.24 -2.7 -1.3 -1.1 -1.3Final energy demand (t of CO2/toe) 2.13 2.08 2.00 1.96 1.93 1.88 1.85 1.80 1.76 -0.7 -0.3 -0.4 -0.5
Industry 1.80 1.69 1.53 1.50 1.49 1.44 1.39 1.29 1.18 -1.6 -0.3 -0.7 -1.6Residential 1.96 1.85 1.84 1.80 1.74 1.70 1.64 1.59 1.56 -0.7 -0.5 -0.6 -0.5Tertiary 1.96 1.84 1.64 1.58 1.54 1.48 1.44 1.41 1.38 -1.8 -0.7 -0.6 -0.4Transport 2.91 2.92 2.93 2.92 2.89 2.85 2.81 2.79 2.78 0.1 -0.1 -0.3 -0.1
Electricity and steam generationGeneration Capacity in MWe 20648 24314 26712 28845 33383 37834 39887 2.6 2.3 1.8
Nuclear 535 535 535 535 535 803 1700 0.0 0.0 12.3Hydro (pumping excluded) 37 37 37 37 37 37 37 0.0 0.0 0.0Wind 446 1216 2798 3354 4068 5585 6060 20.2 3.8 4.1Solar 12 25 119 275 497 762 1105 25.5 15.3 8.3Thermal 19618 22501 23223 24644 28246 30648 30985 1.7 2.0 0.9
of which cogeneration units 9117 10005 10811 12289 17299 20317 19460 1.7 4.8 1.2Solids fired 4140 4140 4140 4140 5348 7962 8573 0.0 2.6 4.8Gas fired 13264 16130 16853 17985 20649 19665 18582 2.4 2.1 -1.0Oil fired 1237 1237 1153 726 327 359 359 -0.7 -11.8 0.9Biomass-waste fired 977 995 1076 1794 1921 2662 3472 1.0 6.0 6.1Fuel Cells 0 0 0 0 0 0 0Geothermal heat 0 0 0 0 0 0 0
IndicatorsEfficiency for thermal electricity production (%) 36.2 38.8 38.5 39.5 42.8 46.3 47.4 0.0 0.0 0.0 0.0Load factor for gross electric capacities (%) 49.5 48.1 48.1 49.8 46.8 44.1 43.9 0.0 0.0 0.0 0.0CHP indicator (% of electricity from CHP) 52.5 52.1 53.7 54.0 62.6 63.3 64.6 0.0 0.0 0.0 0.0Non fossil fuels in electricity generation (%) 10.4 11.4 15.1 17.0 19.0 22.7 26.9 0.0 0.0 0.0 0.0 - nuclear 4.4 3.9 3.6 3.3 3.1 4.3 8.7 0.0 0.0 0.0 0.0 - renewable energy forms 6.0 7.5 11.5 13.8 16.0 18.3 18.2 0.0 0.0 0.0 0.0
Transport sectorPassenger transport activity (Gpkm) 168.8 162.3 176.0 191.2 209.6 227.3 245.7 264.5 284.5 0.4 1.8 1.6 1.5
Public road transport 13.0 8.0 7.5 7.4 7.2 6.8 6.4 6.0 5.7 -5.4 -0.3 -1.2 -1.2Private cars and motorcycles 138.6 132.4 142.1 153.0 166.6 180.0 193.9 207.7 222.2 0.2 1.6 1.5 1.4Rail 12.3 15.4 16.2 18.0 19.9 21.5 23.2 25.0 27.0 2.8 2.1 1.6 1.5Aviation 4.1 5.8 9.6 12.2 15.1 18.2 21.2 24.6 28.6 8.9 4.6 3.5 3.0Inland navigation 0.8 0.7 0.6 0.7 0.7 0.8 0.9 1.0 1.2 -2.8 2.3 2.4 2.3
Travel per person (km per capita) 11291 10497 11051 11704 12572 13404 14275 15174 16178 -0.2 1.3 1.3 1.3
Freight transport activity (Gtkm) 94.8 105.7 125.5 135.7 149.7 167.3 184.7 198.9 211.8 2.8 1.8 2.1 1.4Trucks 56.1 67.1 79.6 86.4 96.1 108.7 121.2 130.4 138.9 3.6 1.9 2.4 1.4Rail 3.1 3.1 4.6 4.9 5.2 5.4 5.5 5.7 5.8 4.1 1.2 0.6 0.5Inland navigation 35.7 35.5 41.3 44.4 48.5 53.3 58.0 62.9 67.1 1.5 1.6 1.8 1.5
Freight activity per unit of GDP (tkm/000 Euro'00) 314 316 312 326 323 328 333 331 330 -0.1 0.4 0.3 -0.1
Energy demand in transport (ktoe) 10356 12404 13820 14687 15456 16113 17087 17652 18081 2.9 1.1 1.0 0.6Public road transport 104 71 86 84 82 74 66 58 51 -1.8 -0.5 -2.1 -2.7Private cars and motorcycles 5037 5552 5289 5682 5655 5459 5644 5662 5568 0.5 0.7 0.0 -0.1Trucks 2899 3325 4254 4614 5120 5720 6135 6312 6300 3.9 1.9 1.8 0.3Rail 147 162 176 188 175 152 142 143 149 1.8 0.0 -2.0 0.4Aviation 1614 2595 3348 3402 3644 3859 4185 4514 5015 7.6 0.8 1.4 1.8Inland navigation 556 697 667 717 780 849 914 962 998 1.8 1.6 1.6 0.9
Efficiency indicator (activity related)Passenger transport (toe/Mpkm) 40.8 51.6 50.5 48.9 45.6 42.0 40.9 39.3 37.9 2.2 -1.0 -1.1 -0.7Freight transport (toe/Mtkm) 36.5 38.1 39.3 39.3 39.4 39.3 38.1 36.5 34.4 0.7 0.0 -0.3 -1.0
121

POLAND: Baseline scenario SUMMARY ENERGY BALANCE AND INDICATORS (A) ktoe 1990 1995 2000 2005 2010 2015 2020 2025 2030 '90-'00 '00-'10 '10-'20 '20-'30
Annual % ChangePrimary Production 99228 99328 79700 79406 70163 66100 70748 72356 74687 -2.2 -1.3 0.1 0.5
Solids 94459 91104 71297 69961 59036 52243 50253 48292 45000 -2.8 -1.9 -1.6 -1.1Oil 159 290 841 685 750 700 700 650 600 18.1 -1.1 -0.7 -1.5Natural gas 2378 3169 3313 3400 3200 3100 3000 2800 2700 3.4 -0.3 -0.6 -1.0Nuclear 0 0 0 0 0 0 2983 4654 8977 11.6Renewable energy sources 2232 4765 4250 5360 7177 10057 13812 15960 17409 6.7 5.4 6.8 2.3
Hydro 139 162 181 182 183 192 194 201 203 2.7 0.1 0.6 0.4Biomass & Waste 2093 4602 4065 5157 6647 9276 12834 14107 14677 6.9 5.0 6.8 1.4Wind 0 0 0 9 330 563 742 1588 2431 94.3 8.4 12.6Solar and others 0 0 0 2 6 14 26 46 78 16.4 11.9Geothermal 0 0 3 9 11 13 16 18 20 13.7 4.0 2.2
Net Imports 2238 -152 10134 13497 30782 44518 51931 56031 60263 16.3 11.8 5.4 1.5Solids -18913 -21202 -16309 -16070 -6818 -1311 -1264 -965 1282Oil 14468 15481 20384 21549 25834 28407 31223 33355 35237 3.5 2.4 1.9 1.2 - Crude oil and Feedstocks 13085 13984 18827 19300 23134 25383 27882 29804 31512 3.7 2.1 1.9 1.2 - Oil products 1383 1498 1558 2249 2700 3024 3341 3551 3725 1.2 5.7 2.2 1.1Natural gas 6773 5810 6607 8844 12555 17961 22459 24413 24587 -0.2 6.6 6.0 0.9Electricity -90 -241 -548 -826 -790 -540 -487 -771 -843
Gross Inland Consumption 99866 99947 90192 92572 100537 110172 122200 127889 134435 -1.0 1.1 2.0 1.0Solids 75405 70500 56357 53891 52219 50932 48989 47327 46282 -2.9 -0.8 -0.6 -0.6Oil 13380 15929 20174 21904 26176 28661 31444 33506 35323 4.2 2.6 1.9 1.2Natural gas 8938 8995 9960 12244 15755 21061 25459 27213 27287 1.1 4.7 4.9 0.7Nuclear 0 0 0 0 0 0 2983 4654 8977 11.6Electricity -90 -241 -548 -826 -790 -540 -487 -771 -843Renewable energy forms 2232 4765 4250 5360 7177 10057 13812 15960 17409 6.7 5.4 6.8 2.3
as % in Gross Inland ConsumptionSolids 75.5 70.5 62.5 58.2 51.9 46.2 40.1 37.0 34.4Oil 13.4 15.9 22.4 23.7 26.0 26.0 25.7 26.2 26.3Natural gas 8.9 9.0 11.0 13.2 15.7 19.1 20.8 21.3 20.3Nuclear 0.0 0.0 0.0 0.0 0.0 0.0 2.4 3.6 6.7Renewable energy forms 2.2 4.8 4.7 5.8 7.1 9.1 11.3 12.5 12.9
Electricity Generation in GWhe 134591 137017 143147 148648 167079 195090 224104 257308 281834 0.6 1.6 3.0 2.3Nuclear 0 0 0 0 0 0 11566 18043 34803 11.6Hydro & wind 1617 1888 2110 2225 5973 8796 10941 20936 30955 2.7 11.0 6.2 11.0Thermal (incl. biomass) 132974 135130 141038 146422 161106 186294 201597 218329 216076 0.6 1.3 2.3 0.7
Fuel Inputs for Thermal Power Generation (1) 43418 36907 36160 37767 40765 43853 46730 45993 42995 -1.8 1.2 1.4 -0.8Solids 41138 35842 34792 35704 36618 37257 37456 36340 34520 -1.7 0.5 0.2 -0.8Oil (including refinery gas) 1236 405 334 227 114 56 41 39 39 -12.3 -10.2 -9.6 -0.7Gas 673 547 877 1213 2584 3840 4443 4720 3220 2.7 11.4 5.6 -3.2Biomass & Waste 372 114 157 624 1449 2700 4789 4894 5217 -8.3 24.9 12.7 0.9Geothermal heat 0 0 0 0 0 0 0 0 0Hydrogen - Methanol 0 0 0 0 0 0 0 0 0
Fuel Input in other transformation proc. 37831 32933 33890 32243 35358 37543 40242 42432 44630 -1.1 0.4 1.3 1.0Refineries 13160 14929 19949 20589 24586 26885 29472 31395 33089 4.2 2.1 1.8 1.2Biofuels and hydrogen production 0 0 0 145 541 856 1336 1665 1874 9.5 3.4District heating 9949 5985 4320 4308 4134 4077 3953 4319 4858 -8.0 -0.4 -0.4 2.1Others 14722 12019 9622 7201 6097 5725 5481 5052 4809 -4.2 -4.5 -1.1 -1.3
Energy Branch Consumption 4583 6496 7530 6649 7090 7560 7761 7795 7837 5.1 -0.6 0.9 0.1Non-Energy Uses 4193 3646 4218 4048 4355 4945 5611 6251 6812 0.1 0.3 2.6 2.0Final Energy Demand 59574 65355 57984 60616 67641 76100 85323 92850 99007 -0.3 1.6 2.3 1.5by sectorIndustry(1) 25252 24661 21297 20178 21390 23771 26253 28067 29264 -1.7 0.0 2.1 1.1 - energy intensive industries 16249 16054 14332 13055 13230 14484 15704 16453 16958 -1.2 -0.8 1.7 0.8 - other industrial sectors 9003 8607 6965 7124 8160 9288 10549 11614 12306 -2.5 1.6 2.6 1.6Residential 18126 23284 17516 17950 19188 21388 24090 26282 28159 -0.3 0.9 2.3 1.6Tertiary 8858 9154 9986 10931 13174 15746 18260 20641 22498 1.2 2.8 3.3 2.1Transport 7338 8256 9185 11556 13889 15194 16720 17860 19086 2.3 4.2 1.9 1.3by fuel (1)
Solids 17066 23299 13728 11642 10080 9176 8309 8060 8191 -2.2 -3.0 -1.9 -0.1Oil 9107 11582 15436 18032 21552 24260 27013 28798 30467 5.4 3.4 2.3 1.2Gas 7987 7547 7220 8889 10775 13495 15902 17104 18442 -1.0 4.1 4.0 1.5Electricity 8233 7703 8317 8745 10428 12825 15486 18185 20261 0.1 2.3 4.0 2.7Heat (from CHP and District Heating) 15563 10817 9391 9217 9924 10354 11381 12773 13511 -4.9 0.6 1.4 1.7Other 1619 4408 3890 4090 4883 5989 7232 7930 8135 9.2 2.3 4.0 1.2
CO2 Emissions (Mt of CO2) 332.2 330.8 290.3 290.3 305.3 319.5 329.0 331.0 330.9 -1.3 0.5 0.8 0.1Power generation/District heating 209.3 170.0 159.4 162.4 168.1 171.0 170.6 166.3 157.7 -2.7 0.5 0.1 -0.8Energy Branch 5.8 13.0 11.4 5.7 6.4 6.8 6.4 5.7 5.7 6.9 -5.7 0.1 -1.2Industry 44.0 59.8 46.1 44.9 45.3 49.5 52.1 53.1 55.2 0.5 -0.2 1.4 0.6Residential 33.1 44.4 27.9 25.9 26.2 27.4 28.8 29.2 29.8 -1.7 -0.6 0.9 0.3Tertiary 19.4 20.4 19.7 19.1 20.9 23.1 26.1 29.2 31.8 0.2 0.6 2.3 2.0Transport 20.5 23.1 25.8 32.4 38.4 41.6 45.0 47.6 50.6 2.3 4.1 1.6 1.2
CO2 Emissions Index (1990=100) 100.0 99.6 87.4 87.4 91.9 96.2 99.1 99.6 99.6
Source: PRIMES
122

POLAND: Baseline scenario SUMMARY ENERGY BALANCE AND INDICATORS (B)1990 1995 2000 2005 2010 2015 2020 2025 2030 '90-'00 '00-'10 '10-'20 '20-'30
Annual % ChangeMain Energy System IndicatorsPopulation (Million) 38.127 38.596 38.646 38.128 37.830 37.428 37.065 36.836 36.542 0.1 -0.2 -0.2 -0.1GDP (in 000 MEUR'00) 126.2 140.7 180.6 211.1 265.4 330.2 406.9 487.8 564.6 3.7 3.9 4.4 3.3Gross Inl. Cons./GDP (toe/MEUR'00) 791.5 710.5 499.4 438.4 378.9 333.6 300.3 262.2 238.1 -4.5 -2.7 -2.3 -2.3Gross Inl. Cons./Capita (toe/inhabitant) 2.62 2.59 2.33 2.43 2.66 2.94 3.30 3.47 3.68 -1.1 1.3 2.2 1.1Electricity Generated/Capita (kWh/inhabitant) 3530 3550 3704 3899 4417 5212 6046 6985 7713 0.5 1.8 3.2 2.5Carbon intensity (t of CO2/toe of GIC) 3.33 3.31 3.22 3.14 3.04 2.90 2.69 2.59 2.46 -0.3 -0.6 -1.2 -0.9CO2 Emissions/Capita (t of CO2/inhabitant) 8.71 8.57 7.51 7.61 8.07 8.54 8.88 8.99 9.05 -1.5 0.7 1.0 0.2CO2 Emissions to GDP (t of CO2/MEUR'00) 2632.8 2351.3 1607.2 1374.9 1150.4 967.5 808.7 678.5 586.1 -4.8 -3.3 -3.5 -3.2Import Dependency % 2.2 -0.2 11.2 14.5 30.5 40.2 42.3 43.6 44.7 0.0 0.0 0.0 0.0
Energy intensity indicators (1990=100)Industry (Energy on Value added) 100.0 98.2 55.3 40.4 32.7 28.7 25.5 23.2 21.7 -5.8 -5.1 -2.4 -1.6Residential (Energy on Private Income) 100.0 115.2 65.9 58.0 49.2 44.0 40.2 36.5 33.7 -4.1 -2.9 -2.0 -1.7Tertiary (Energy on Value added) 100.0 88.0 79.0 73.0 69.7 66.6 62.3 57.8 53.2 -2.3 -1.2 -1.1 -1.6Transport (Energy on GDP) 100.0 100.9 87.4 94.1 90.0 79.1 70.7 63.0 58.1 -1.3 0.3 -2.4 -1.9
Carbon Intensity indicatorsElectricity and Steam production (t of CO2/MWh) 0.66 0.65 0.60 0.58 0.54 0.49 0.43 0.37 0.33 -1.1 -1.0 -2.1 -2.8Final energy demand (t of CO2/toe) 1.96 2.26 2.06 2.02 1.93 1.86 1.78 1.71 1.69 0.5 -0.6 -0.8 -0.5
Industry 1.74 2.42 2.16 2.22 2.12 2.08 1.98 1.89 1.88 2.2 -0.2 -0.6 -0.5Residential 1.83 1.90 1.59 1.45 1.37 1.28 1.20 1.11 1.06 -1.4 -1.5 -1.3 -1.2Tertiary 2.19 2.23 1.98 1.75 1.59 1.47 1.43 1.41 1.42 -1.0 -2.2 -1.0 -0.1Transport 2.80 2.80 2.81 2.80 2.76 2.74 2.69 2.66 2.65 0.0 -0.1 -0.3 -0.1
Electricity and steam generationGeneration Capacity in MWe 31055 31314 36742 45842 52473 74143 90141 1.7 3.6 5.6
Nuclear 0 0 0 0 1500 2340 4500 11.6Hydro (pumping excluded) 828 833 839 889 889 917 927 0.1 0.6 0.4Wind 5 75 1844 3130 4122 8050 12186 79.9 8.4 11.4Solar 0 0 3 18 44 109 266 33.1 19.8Thermal 30222 30406 34057 41806 45919 62727 72262 1.2 3.0 4.6
of which cogeneration units 11857 11051 9438 12512 10974 20546 26113 -2.3 1.5 9.1Solids fired 29089 28660 25188 25358 24745 30421 36708 -1.4 -0.2 4.0Gas fired 692 1117 5930 9664 12066 21136 23434 24.0 7.4 6.9Oil fired 293 293 313 1229 1064 1009 1009 0.7 13.0 -0.5Biomass-waste fired 148 336 2626 5555 8044 10161 11111 33.3 11.8 3.3Fuel Cells 0 0 0 0 0 0 0Geothermal heat 0 0 0 0 0 0 0
IndicatorsEfficiency for thermal electricity production (%) 33.5 33.3 34.0 36.5 37.1 40.8 43.2 0.0 0.0 0.0 0.0Load factor for gross electric capacities (%) 52.6 54.2 51.9 48.6 48.8 39.6 35.7 0.0 0.0 0.0 0.0CHP indicator (% of electricity from CHP) 17.6 17.8 19.0 23.1 22.7 38.0 42.1 0.0 0.0 0.0 0.0Non fossil fuels in electricity generation (%) 1.9 3.1 7.2 10.3 20.3 23.9 31.9 0.0 0.0 0.0 0.0 - nuclear 0.0 0.0 0.0 0.0 5.2 7.0 12.3 0.0 0.0 0.0 0.0 - renewable energy forms 1.9 3.1 7.2 10.3 15.1 16.9 19.5 0.0 0.0 0.0 0.0
Transport sectorPassenger transport activity (Gpkm) 201.8 167.3 203.0 243.6 286.3 323.1 361.7 402.9 448.9 0.1 3.5 2.4 2.2
Public road transport 46.3 34.0 31.7 30.8 29.8 28.5 27.5 26.7 25.9 -3.7 -0.6 -0.8 -0.6Private cars and motorcycles 104.1 110.7 149.7 190.6 233.5 271.7 310.7 351.9 397.9 3.7 4.5 2.9 2.5Rail 50.4 21.0 19.7 19.7 19.5 18.5 18.2 18.0 17.5 -9.0 -0.1 -0.7 -0.4Aviation 0.7 1.4 1.6 2.4 3.2 4.1 5.0 6.1 7.3 9.0 6.9 4.7 3.8Inland navigation 0.3 0.2 0.2 0.2 0.2 0.2 0.2 0.3 0.3 -4.2 1.2 1.5 1.5
Travel per person (km per capita) 5292 4334 5252 6389 7568 8632 9757 10938 12284 -0.1 3.7 2.6 2.3
Freight transport activity (Gtkm) 122.9 120.3 128.0 149.5 185.6 209.4 236.9 260.0 276.6 0.4 3.8 2.5 1.6Trucks 40.3 51.2 72.8 97.2 136.1 161.4 187.9 210.1 226.3 6.1 6.5 3.3 1.9Rail 81.6 68.2 54.0 51.2 48.5 47.1 48.2 49.2 49.5 -4.0 -1.1 -0.1 0.3Inland navigation 1.0 0.9 1.2 1.1 1.0 1.0 0.9 0.8 0.7 1.3 -1.3 -1.8 -2.2
Freight activity per unit of GDP (tkm/000 Euro'00) 974 855 709 708 700 634 582 533 490 -3.1 -0.1 -1.8 -1.7
Energy demand in transport (ktoe) 7338 8256 9185 11556 13889 15194 16720 17860 19086 2.3 4.2 1.9 1.3Public road transport 603 453 550 535 517 483 446 413 373 -0.9 -0.6 -1.5 -1.8Private cars and motorcycles 3002 3883 4541 5778 6417 6689 7413 8065 8845 4.2 3.5 1.5 1.8Trucks 2334 2846 3177 4241 5929 6986 7791 8311 8717 3.1 6.4 2.8 1.1Rail 1095 667 539 502 441 375 343 317 299 -6.8 -2.0 -2.5 -1.4Aviation 205 377 372 494 579 657 720 750 847 6.2 4.5 2.2 1.6Inland navigation 99 29 6 6 6 6 5 5 5 -24.4 -0.6 -0.8 -0.9
Efficiency indicator (activity related)Passenger transport (toe/Mpkm) 21.5 30.0 28.2 29.0 27.0 24.8 24.1 23.2 22.7 2.8 -0.5 -1.1 -0.6Freight transport (toe/Mtkm) 24.4 26.9 27.0 30.1 33.2 34.3 33.7 32.7 32.2 1.0 2.1 0.2 -0.5
123

PORTUGAL: Baseline scenario SUMMARY ENERGY BALANCE AND INDICATORS (A) ktoe 1990 1995 2000 2005 2010 2015 2020 2025 2030 '90-'00 '00-'10 '10-'20 '20-'30
Annual % ChangePrimary Production 2808 2602 3109 3231 3827 4043 4551 4958 5295 1.0 2.1 1.7 1.5
Solids 115 0 0 0 0 0 0 0 0Oil 0 0 0 0 0 0 0 0 0Natural gas 0 0 0 0 0 0 0 0 0Nuclear 0 0 0 0 0 0 0 0 0Renewable energy sources 2692 2602 3109 3231 3827 4043 4551 4958 5295 1.4 2.1 1.7 1.5
Hydro 787 717 974 1006 1091 1175 1213 1230 1257 2.1 1.1 1.1 0.4Biomass & Waste 1891 1831 2053 2023 2202 2254 2500 2737 2830 0.8 0.7 1.3 1.3Wind 0 1 14 115 420 484 673 806 997 66.9 40.1 4.8 4.0Solar and others 11 15 18 38 64 80 97 118 142 5.4 13.2 4.3 3.8Geothermal 3 37 49 49 49 49 68 68 68 31.4 0.0 3.3 0.0
Net Imports 15160 17876 21588 23244 24725 26256 27115 26990 27539 3.6 1.4 0.9 0.2Solids 2789 3797 3913 3355 3328 3352 3325 4495 4934 3.4 -1.6 0.0 4.0Oil 12367 14001 15556 15872 16308 16654 16916 15983 16279 2.3 0.5 0.4 -0.4 - Crude oil and Feedstocks 11360 13547 12022 15321 15746 16080 16336 15430 15720 0.6 2.7 0.4 -0.4 - Oil products 1007 454 3534 551 563 573 581 552 559 13.4 -16.8 0.3 -0.4Natural gas 0 0 2039 3792 4978 6151 6782 6429 6251 9.3 3.1 -0.8Electricity 3 79 80 225 110 100 91 83 75 38.1 3.2 -1.8 -1.9
Gross Inland Consumption 16890 19611 24108 25794 27833 29546 30872 31119 31967 3.6 1.4 1.0 0.3Solids 2580 3493 3803 3355 3328 3352 3325 4495 4934 4.0 -1.3 0.0 4.0Oil 11614 13437 15083 15191 15589 15900 16122 15154 15412 2.6 0.3 0.3 -0.4Natural gas 0 0 2034 3792 4978 6151 6782 6429 6251 9.4 3.1 -0.8Nuclear 0 0 0 0 0 0 0 0 0Electricity 3 79 80 225 110 100 91 83 75 38.1 3.2 -1.8 -1.9Renewable energy forms 2692 2602 3109 3231 3827 4043 4551 4958 5295 1.4 2.1 1.7 1.5
as % in Gross Inland ConsumptionSolids 15.3 17.8 15.8 13.0 12.0 11.3 10.8 14.4 15.4Oil 68.8 68.5 62.6 58.9 56.0 53.8 52.2 48.7 48.2Natural gas 0.0 0.0 8.4 14.7 17.9 20.8 22.0 20.7 19.6Nuclear 0.0 0.0 0.0 0.0 0.0 0.0 0.0 0.0 0.0Renewable energy forms 15.9 13.3 12.9 12.5 13.7 13.7 14.7 15.9 16.6
Electricity Generation in GWhe 28350 33148 43364 50351 61646 72397 81174 88208 92428 4.3 3.6 2.8 1.3Nuclear 0 0 0 0 0 0 0 0 0Hydro & wind 9156 8357 11489 13029 17589 19334 22010 23829 26483 2.3 4.4 2.3 1.9Thermal (incl. biomass) 19194 24791 31875 37322 44057 53063 59164 64379 65946 5.2 3.3 3.0 1.1
Fuel Inputs for Thermal Power Generation (1) 4505 5663 7467 8269 9345 10380 10943 11305 11481 5.2 2.3 1.6 0.5Solids 2027 2918 3198 3212 3257 3298 3285 4461 4909 4.7 0.2 0.1 4.1Oil (including refinery gas) 2105 2371 2194 1614 1470 1386 1291 783 670 0.4 -3.9 -1.3 -6.3Gas 19 18 1234 2427 3431 4366 4733 4197 3947 51.6 10.8 3.3 -1.8Biomass & Waste 351 319 791 966 1139 1282 1567 1797 1887 8.5 3.7 3.2 1.9Geothermal heat 3 37 49 49 49 49 68 68 68 31.4 0.0 3.3 0.0Hydrogen - Methanol 0 0 0 0 0 0 0 0 0
Fuel Input in other transformation proc. 11484 14055 12700 15424 16006 16447 16833 16041 16386 1.0 2.3 0.5 -0.3Refineries 11152 13579 12251 15375 15801 16137 16394 15489 15780 0.9 2.6 0.4 -0.4Biofuels and hydrogen production 0 0 0 19 177 283 416 531 589 8.9 3.5District heating 0 16 0 20 23 23 22 20 18 -0.3 -2.0Others 332 460 449 9 6 4 2 1 0 3.1 -34.8 -9.9 -22.7
Energy Branch Consumption 658 870 796 881 936 970 993 988 1004 1.9 1.6 0.6 0.1Non-Energy Uses 2103 1875 2330 2130 2115 2112 2123 2128 2135 1.0 -1.0 0.0 0.1Final Energy Demand 11650 13475 17258 18701 20168 21617 22958 23691 24281 4.0 1.6 1.3 0.6by sectorIndustry(1) 4580 4680 5839 5649 5593 5777 6054 6275 6468 2.5 -0.4 0.8 0.7 - energy intensive industries 2667 2837 3365 3305 3328 3411 3538 3618 3684 2.4 -0.1 0.6 0.4 - other industrial sectors 1914 1843 2474 2344 2264 2366 2516 2656 2784 2.6 -0.9 1.1 1.0Residential 2290 2569 2804 3271 3942 4479 4905 5234 5386 2.0 3.5 2.2 0.9Tertiary 1052 1373 2098 2727 3329 3784 4045 4173 4246 7.2 4.7 2.0 0.5Transport 3728 4853 6517 7055 7305 7576 7955 8009 8180 5.7 1.1 0.9 0.3by fuel (1)
Solids 617 546 465 142 71 54 40 34 25 -2.8 -17.2 -5.7 -4.5Oil 6683 8187 10276 10993 11535 11933 12243 12119 12167 4.4 1.2 0.6 -0.1Gas 103 97 853 1351 1524 1756 2016 2194 2266 23.6 6.0 2.8 1.2Electricity 2024 2477 3299 3982 4788 5650 6374 6948 7284 5.0 3.8 2.9 1.3Heat (from CHP and District Heating) 672 640 1084 1141 1165 1237 1344 1451 1582 4.9 0.7 1.4 1.6Other 1551 1527 1280 1092 1085 988 942 945 957 -1.9 -1.6 -1.4 0.2
CO2 Emissions (Mt of CO2) 39.0 48.2 58.2 61.2 65.0 68.7 70.7 72.4 73.5 4.1 1.1 0.8 0.4Power generation/District heating 14.8 19.2 22.6 23.6 25.6 27.7 28.2 29.9 30.8 4.3 1.3 1.0 0.9Energy Branch 1.5 2.2 1.0 1.2 1.3 1.3 1.3 1.2 1.2 -3.6 2.1 0.1 -0.4Industry 8.2 8.3 10.0 8.7 8.3 8.3 8.3 8.3 8.2 2.0 -1.8 0.0 -0.2Residential 1.6 1.9 2.0 2.8 3.9 4.6 5.0 5.2 5.3 2.0 6.9 2.6 0.6Tertiary 1.9 2.2 3.2 3.9 4.5 4.9 5.2 5.2 5.1 5.4 3.7 1.3 0.0Transport 11.0 14.4 19.4 20.9 21.3 21.9 22.7 22.5 22.9 5.8 1.0 0.6 0.1
CO2 Emissions Index (1990=100) 100.0 123.5 149.0 156.7 166.4 176.0 181.0 185.4 188.3
Source: PRIMES
124

PORTUGAL: Baseline scenario SUMMARY ENERGY BALANCE AND INDICATORS (B)1990 1995 2000 2005 2010 2015 2020 2025 2030 '90-'00 '00-'10 '10-'20 '20-'30
Annual % ChangeMain Energy System IndicatorsPopulation (Million) 10.012 10.030 10.226 10.571 10.686 10.762 10.771 10.730 10.660 0.2 0.4 0.1 -0.1GDP (in 000 MEUR'00) 87.9 95.6 115.5 119.1 131.2 149.0 172.2 197.2 221.3 2.8 1.3 2.8 2.5Gross Inl. Cons./GDP (toe/MEUR'00) 192.1 205.0 208.6 216.5 212.1 198.2 179.3 157.8 144.5 0.8 0.2 -1.7 -2.1Gross Inl. Cons./Capita (toe/inhabitant) 1.69 1.96 2.36 2.44 2.60 2.75 2.87 2.90 3.00 3.4 1.0 1.0 0.5Electricity Generated/Capita (kWh/inhabitant) 2832 3305 4241 4763 5769 6727 7537 8221 8671 4.1 3.1 2.7 1.4Carbon intensity (t of CO2/toe of GIC) 2.31 2.46 2.41 2.37 2.33 2.33 2.29 2.33 2.30 0.4 -0.3 -0.2 0.0CO2 Emissions/Capita (t of CO2/inhabitant) 3.90 4.81 5.69 5.79 6.08 6.38 6.56 6.75 6.90 3.8 0.7 0.8 0.5CO2 Emissions to GDP (t of CO2/MEUR'00) 444.1 504.1 503.4 513.5 495.1 461.0 410.5 367.1 332.3 1.3 -0.2 -1.9 -2.1Import Dependency % 86.7 89.0 87.2 87.8 86.6 86.7 85.6 84.5 83.9 0.0 0.0 0.0 0.0
Energy intensity indicators (1990=100)Industry (Energy on Value added) 100.0 104.2 106.9 103.8 100.3 93.2 86.0 79.6 74.8 0.7 -0.6 -1.5 -1.4Residential (Energy on Private Income) 100.0 100.0 90.3 99.3 107.9 107.8 102.5 95.5 87.4 -1.0 1.8 -0.5 -1.6Tertiary (Energy on Value added) 100.0 117.2 146.4 176.3 189.6 186.2 169.4 150.1 134.3 3.9 2.6 -1.1 -2.3Transport (Energy on GDP) 100.0 119.6 133.0 139.6 131.3 119.9 109.0 95.8 87.2 2.9 -0.1 -1.8 -2.2
Carbon Intensity indicatorsElectricity and Steam production (t of CO2/MWh) 0.41 0.47 0.38 0.35 0.33 0.31 0.28 0.28 0.27 -0.7 -1.6 -1.5 -0.4Final energy demand (t of CO2/toe) 1.95 1.99 2.00 1.95 1.89 1.84 1.79 1.74 1.71 0.3 -0.6 -0.5 -0.5
Industry 1.79 1.78 1.72 1.55 1.49 1.44 1.38 1.32 1.26 -0.4 -1.4 -0.8 -0.9Residential 0.71 0.74 0.71 0.86 0.98 1.03 1.03 1.00 0.99 0.0 3.3 0.4 -0.4Tertiary 1.77 1.61 1.50 1.44 1.36 1.30 1.28 1.24 1.21 -1.6 -1.0 -0.6 -0.5Transport 2.95 2.96 2.97 2.96 2.92 2.89 2.85 2.81 2.80 0.1 -0.2 -0.2 -0.2
Electricity and steam generationGeneration Capacity in MWe 9833 11912 14536 17221 20846 23958 26092 4.0 3.7 2.3
Nuclear 0 0 0 0 0 0 0Hydro (pumping excluded) 4005 4155 4503 4707 4809 4847 4907 1.2 0.7 0.2Wind 100 700 2855 3205 4228 5145 6578 39.8 4.0 4.5Solar 1 1 8 20 40 78 136 31.3 18.0 13.1Thermal 5728 7056 7171 9288 11769 13888 14470 2.3 5.1 2.1
of which cogeneration units 969 1128 1447 1677 2211 3871 4258 4.1 4.3 6.8Solids fired 1984 1984 1984 1984 1984 3236 3837 0.0 0.0 6.8Gas fired 1192 2514 2808 4921 7362 7362 7362 8.9 10.1 0.0Oil fired 2223 2223 2018 1793 1173 1358 1199 -1.0 -5.3 0.2Biomass-waste fired 315 321 347 577 1232 1914 2054 1.0 13.5 5.2Fuel Cells 0 0 0 0 0 0 0Geothermal heat 13 13 13 13 18 18 18 0.0 3.3 0.0
IndicatorsEfficiency for thermal electricity production (%) 36.7 38.8 40.5 44.0 46.5 49.0 49.4 0.0 0.0 0.0 0.0Load factor for gross electric capacities (%) 50.3 48.3 48.4 48.0 44.5 42.0 40.4 0.0 0.0 0.0 0.0CHP indicator (% of electricity from CHP) 11.2 10.8 10.6 10.7 11.6 19.1 21.6 0.0 0.0 0.0 0.0Non fossil fuels in electricity generation (%) 30.4 29.7 32.1 31.2 34.3 37.6 39.9 0.0 0.0 0.0 0.0 - nuclear 0.0 0.0 0.0 0.0 0.0 0.0 0.0 0.0 0.0 0.0 0.0 - renewable energy forms 30.4 29.7 32.1 31.2 34.3 37.6 39.9 0.0 0.0 0.0 0.0
Transport sectorPassenger transport activity (Gpkm) 68.4 90.1 118.7 125.9 131.5 140.1 150.4 160.5 170.6 5.7 1.0 1.4 1.3
Public road transport 10.3 11.3 11.8 12.4 12.7 11.9 11.4 10.8 10.3 1.4 0.7 -1.1 -1.0Private cars and motorcycles 46.3 66.5 93.5 97.6 100.5 107.3 115.3 123.0 130.5 7.3 0.7 1.4 1.2Rail 6.3 5.3 4.3 4.4 4.5 4.5 4.6 4.7 4.7 -3.9 0.5 0.2 0.2Aviation 5.2 6.8 8.8 11.2 13.5 16.0 18.7 21.6 24.7 5.3 4.3 3.3 2.8Inland navigation 0.2 0.2 0.2 0.3 0.3 0.4 0.4 0.4 0.5 2.5 3.8 2.1 1.9
Travel per person (km per capita) 6827 8985 11604 11905 12305 13020 13965 14960 16009 5.4 0.6 1.3 1.4
Freight transport activity (Gtkm) 23.9 22.2 29.9 32.6 35.8 39.3 43.7 48.3 53.1 2.2 1.8 2.0 2.0Trucks 20.6 18.8 26.8 29.2 32.0 35.3 39.5 43.8 48.1 2.7 1.8 2.1 2.0Rail 1.5 2.0 2.2 2.4 2.7 2.8 3.0 3.2 3.6 4.1 2.2 0.9 1.9Inland navigation 1.9 1.4 0.8 1.0 1.1 1.2 1.2 1.3 1.4 -7.9 2.8 1.3 1.1
Freight activity per unit of GDP (tkm/000 Euro'00) 272 233 258 273 273 264 254 245 240 -0.5 0.5 -0.7 -0.6
Energy demand in transport (ktoe) 3728 4853 6517 7055 7305 7576 7955 8009 8180 5.7 1.1 0.9 0.3Public road transport 67 90 100 105 107 98 89 78 67 4.2 0.6 -1.8 -2.8Private cars and motorcycles 1572 2297 2942 3061 2902 2789 2867 2889 2789 6.5 -0.1 -0.1 -0.3Trucks 1387 1717 2551 2770 3030 3318 3565 3781 4052 6.3 1.7 1.6 1.3Rail 82 80 88 89 86 78 50 46 45 0.6 -0.2 -5.3 -1.0Aviation 576 622 793 978 1121 1230 1315 1140 1149 3.2 3.5 1.6 -1.3Inland navigation 43 46 43 51 60 64 69 74 78 0.0 3.2 1.4 1.2
Efficiency indicator (activity related)Passenger transport (toe/Mpkm) 33.6 34.3 33.1 33.6 32.1 30.0 28.9 26.0 23.9 -0.2 -0.3 -1.1 -1.9Freight transport (toe/Mtkm) 59.7 79.1 86.9 86.6 86.3 85.9 82.7 79.3 77.3 3.8 -0.1 -0.4 -0.7
125

SLOVAKIA: Baseline scenario SUMMARY ENERGY BALANCE AND INDICATORS (A) ktoe 1990 1995 2000 2005 2010 2015 2020 2025 2030 '90-'00 '00-'10 '10-'20 '20-'30
Annual % ChangePrimary Production 5130 4778 5945 6343 6618 7192 7948 8274 8462 1.5 1.1 1.8 0.6
Solids 1289 1017 1018 852 815 920 828 767 711 -2.3 -2.2 0.2 -1.5Oil 70 66 54 50 50 50 50 50 50 -2.6 -0.7 0.0 0.0Natural gas 338 240 121 125 150 160 170 179 189 -9.8 2.2 1.3 1.1Nuclear 3105 2950 4255 4681 4834 4881 4891 4900 4905 3.2 1.3 0.1 0.0Renewable energy sources 328 504 498 635 770 1181 2010 2378 2606 4.3 4.5 10.1 2.6
Hydro 162 427 406 434 449 464 518 573 598 9.7 1.0 1.4 1.4Biomass & Waste 166 78 91 186 298 629 1385 1676 1853 -5.8 12.5 16.6 3.0Wind 0 0 0 0 1 59 66 74 84 56.9 2.5Solar and others 0 0 0 15 22 29 41 54 72 6.4 5.6Geothermal 0 0 0 0 0 0 0 0 0
Net Imports 16250 11495 10620 11753 13890 15582 16896 17983 19343 -4.2 2.7 2.0 1.4Solids 5970 4131 3430 3335 3967 3590 3746 4239 4913 -5.4 1.5 -0.6 2.7Oil 4481 3128 2233 3289 3714 3942 4155 4218 4354 -6.7 5.2 1.1 0.5 - Crude oil and Feedstocks 5925 4842 4843 4655 5260 5582 5883 5972 6163 -2.0 0.8 1.1 0.5 - Oil products -1445 -1714 -2610 -1366 -1546 -1640 -1728 -1754 -1809Natural gas 5353 4117 5188 5312 6456 8330 9264 9781 10318 -0.3 2.2 3.7 1.1Electricity 447 119 -232 -183 -247 -281 -269 -255 -242
Gross Inland Consumption 20992 16665 16462 18096 20508 22774 24845 26257 27805 -2.4 2.2 1.9 1.1Solids 7556 5415 4254 4187 4781 4510 4574 5005 5624 -5.6 1.2 -0.4 2.1Oil 4468 2934 2436 3339 3764 3992 4205 4268 4404 -5.9 4.4 1.1 0.5Natural gas 5088 4743 5251 5437 6606 8490 9434 9961 10508 0.3 2.3 3.6 1.1Nuclear 3105 2950 4255 4681 4834 4881 4891 4900 4905 3.2 1.3 0.1 0.0Electricity 447 119 -232 -183 -247 -281 -269 -255 -242Renewable energy forms 328 504 498 635 770 1181 2010 2378 2606 4.3 4.5 10.1 2.6
as % in Gross Inland ConsumptionSolids 36.0 32.5 25.8 23.1 23.3 19.8 18.4 19.1 20.2Oil 21.3 17.6 14.8 18.5 18.4 17.5 16.9 16.3 15.8Natural gas 24.2 28.5 31.9 30.0 32.2 37.3 38.0 37.9 37.8Nuclear 14.8 17.7 25.8 25.9 23.6 21.4 19.7 18.7 17.6Renewable energy forms 1.6 3.0 3.0 3.5 3.8 5.2 8.1 9.1 9.4
Electricity Generation in GWhe 23428 26036 30431 33338 38651 45521 51192 56346 61587 2.6 2.4 2.8 1.9Nuclear 12034 11435 16491 18143 18735 18919 18956 18994 19012 3.2 1.3 0.1 0.0Hydro & wind 1880 4960 4725 5046 5232 6089 6803 7557 7974 9.7 1.0 2.7 1.6Thermal (incl. biomass) 9514 9641 9214 10149 14684 20513 25432 29795 34601 -0.3 4.8 5.6 3.1
Fuel Inputs for Thermal Power Generation (1) 2176 1930 1948 2136 3018 3888 4714 5301 6134 -1.1 4.5 4.6 2.7Solids 1887 1452 1347 1549 2097 1561 1812 2429 3153 -3.3 4.5 -1.5 5.7Oil (including refinery gas) 142 119 36 5 4 4 4 4 4 -12.8 -19.3 -0.7 -0.1Gas 147 359 565 563 889 2080 1975 1693 1608 14.4 4.6 8.3 -2.0Biomass & Waste 0 0 0 19 28 243 924 1175 1369 41.8 4.0Geothermal heat 0 0 0 0 0 0 0 0 0Hydrogen - Methanol 0 0 0 0 0 0 0 0 0
Fuel Input in other transformation proc. 9101 8283 7890 7278 8194 8738 9118 9223 9435 -1.4 0.4 1.1 0.3Refineries 6341 4643 4960 4705 5310 5632 5933 6022 6213 -2.4 0.7 1.1 0.5Biofuels and hydrogen production 0 0 0 25 64 103 150 177 204 8.8 3.1District heating 34 1614 1013 718 805 869 907 977 1049 40.3 -2.3 1.2 1.5Others 2726 2026 1917 1830 2014 2133 2128 2047 1969 -3.5 0.5 0.6 -0.8
Energy Branch Consumption 737 715 911 666 686 686 676 641 644 2.1 -2.8 -0.1 -0.5Non-Energy Uses 1153 1046 1234 1204 1396 1582 1817 1959 2113 0.7 1.2 2.7 1.5Final Energy Demand 15263 9711 9771 12086 13826 15596 17199 18481 19798 -4.4 3.5 2.2 1.4by sectorIndustry(1) 8052 4137 4665 6011 6924 7908 8778 9453 10078 -5.3 4.0 2.4 1.4 - energy intensive industries 1806 1901 2990 3577 4064 4427 4590 4638 4722 5.2 3.1 1.2 0.3 - other industrial sectors 6246 2236 1676 2433 2860 3481 4188 4815 5356 -12.3 5.5 3.9 2.5Residential 2416 1983 2186 2930 3440 3903 4280 4587 4916 -1.0 4.6 2.2 1.4Tertiary 3119 2082 1371 1371 1517 1794 2068 2350 2656 -7.9 1.0 3.1 2.5Transport 1676 1509 1549 1774 1944 1992 2072 2092 2148 -0.8 2.3 0.6 0.4by fuel (1)
Solids 4296 1680 1152 1622 1683 1823 1764 1696 1628 -12.3 3.9 0.5 -0.8Oil 3090 1900 1872 2070 2286 2318 2333 2266 2249 -4.9 2.0 0.2 -0.4Gas 5050 3605 3846 4865 5672 6486 7375 8028 8533 -2.7 4.0 2.7 1.5Electricity 2013 1868 1893 2205 2589 3135 3642 4129 4578 -0.6 3.2 3.5 2.3Heat (from CHP and District Heating) 648 654 1008 1182 1368 1518 1693 1919 2345 4.5 3.1 2.2 3.3Other 166 4 1 142 227 315 393 443 464 -42.8 80.4 5.6 1.7
CO2 Emissions (Mt of CO2) 50.0 35.9 31.9 35.2 41.1 44.6 46.9 49.6 53.2 -4.4 2.6 1.3 1.3Power generation/District heating 8.6 13.2 10.8 9.9 13.0 13.9 14.6 16.4 19.2 2.3 1.9 1.2 2.8Energy Branch 1.5 1.1 1.3 0.6 0.5 0.4 0.3 0.1 0.1 -1.5 -8.4 -6.3 -8.5Industry 21.9 10.4 10.2 13.4 15.1 16.9 18.2 18.8 19.0 -7.3 3.9 1.9 0.4Residential 5.8 3.3 3.3 4.7 5.6 6.1 6.5 6.7 7.0 -5.5 5.4 1.6 0.8Tertiary 7.6 3.8 2.0 1.6 1.5 1.6 1.7 1.9 2.1 -12.5 -2.5 1.1 1.9Transport 4.7 4.2 4.4 5.0 5.5 5.5 5.7 5.7 5.8 -0.8 2.2 0.5 0.2
CO2 Emissions Index (1990=100) 100.0 71.8 63.8 70.5 82.3 89.2 93.8 99.2 106.5
Source: PRIMES
126

SLOVAKIA: Baseline scenario SUMMARY ENERGY BALANCE AND INDICATORS (B)1990 1995 2000 2005 2010 2015 2020 2025 2030 '90-'00 '00-'10 '10-'20 '20-'30
Annual % ChangeMain Energy System IndicatorsPopulation (Million) 5.297 5.363 5.401 5.380 5.347 5.309 5.271 5.237 5.186 0.2 -0.1 -0.1 -0.2GDP (in 000 MEUR'00) 19.1 18.3 21.9 27.5 34.4 42.6 52.5 62.4 71.9 1.4 4.6 4.3 3.2Gross Inl. Cons./GDP (toe/MEUR'00) 1101.2 910.6 750.8 657.4 596.7 535.1 473.6 420.7 386.9 -3.8 -2.3 -2.3 -2.0Gross Inl. Cons./Capita (toe/inhabitant) 3.96 3.11 3.05 3.36 3.84 4.29 4.71 5.01 5.36 -2.6 2.3 2.1 1.3Electricity Generated/Capita (kWh/inhabitant) 4422 4855 5634 6197 7229 8574 9713 10760 11876 2.5 2.5 3.0 2.0Carbon intensity (t of CO2/toe of GIC) 2.38 2.15 1.94 1.95 2.01 1.96 1.89 1.89 1.91 -2.0 0.4 -0.6 0.1CO2 Emissions/Capita (t of CO2/inhabitant) 9.44 6.69 5.90 6.55 7.69 8.40 8.90 9.47 10.27 -4.6 2.7 1.5 1.4CO2 Emissions to GDP (t of CO2/MEUR'00) 2622.6 1961.3 1453.6 1280.5 1196.5 1047.4 894.2 794.5 740.7 -5.7 -1.9 -2.9 -1.9Import Dependency % 77.4 69.0 64.5 64.9 67.7 68.4 68.0 68.5 69.6 0.0 0.0 0.0 0.0
Energy intensity indicators (1990=100)Industry (Energy on Value added) 100.0 59.7 58.6 54.3 48.6 44.0 39.0 34.9 32.3 -5.2 -1.9 -2.2 -1.9Residential (Energy on Private Income) 100.0 100.5 89.2 100.6 96.2 89.6 81.0 73.8 69.3 -1.1 0.8 -1.7 -1.5Tertiary (Energy on Value added) 100.0 73.8 38.9 30.3 26.9 25.8 24.3 23.1 22.6 -9.0 -3.6 -1.0 -0.7Transport (Energy on GDP) 100.0 93.8 80.4 73.3 64.4 53.2 44.9 38.1 34.0 -2.2 -2.2 -3.5 -2.7
Carbon Intensity indicatorsElectricity and Steam production (t of CO2/MWh) 0.27 0.39 0.24 0.20 0.23 0.21 0.19 0.20 0.21 -1.1 -0.8 -1.5 0.6Final energy demand (t of CO2/toe) 2.62 2.22 2.03 2.05 2.00 1.94 1.86 1.79 1.71 -2.5 -0.2 -0.7 -0.9
Industry 2.72 2.52 2.19 2.23 2.18 2.14 2.07 1.99 1.88 -2.1 -0.1 -0.5 -0.9Residential 2.39 1.64 1.50 1.61 1.62 1.57 1.52 1.46 1.43 -4.5 0.8 -0.6 -0.6Tertiary 2.42 1.80 1.44 1.18 1.01 0.90 0.83 0.79 0.78 -5.0 -3.5 -2.0 -0.6Transport 2.83 2.76 2.82 2.82 2.81 2.78 2.75 2.73 2.70 0.0 -0.1 -0.2 -0.2
Electricity and steam generationGeneration Capacity in MWe 7148 7608 7770 7972 9154 10505 12391 0.8 1.7 3.1
Nuclear 2640 2640 2640 2640 2640 2640 2640 0.0 0.0 0.0Hydro (pumping excluded) 1735 1855 1905 1958 2041 2128 2164 0.9 0.7 0.6Wind 1 1 6 492 547 612 697 19.6 57.0 2.5Solar 0 0 2 7 15 26 39 25.5 10.5Thermal 2773 3113 3218 2875 3911 5099 6851 1.5 2.0 5.8
of which cogeneration units 2301 2302 2401 1938 2512 3061 3765 0.4 0.5 4.1Solids fired 1519 1462 1661 1001 1321 2138 3047 0.9 -2.3 8.7Gas fired 1151 1536 1536 1632 1770 1716 1657 2.9 1.4 -0.7Oil fired 103 103 4 4 4 4 4 -28.6 0.0 2.2Biomass-waste fired 0 12 18 239 817 1240 2142 46.7 10.1Fuel Cells 0 0 0 0 0 0 0Geothermal heat 0 0 0 0 0 0 0
IndicatorsEfficiency for thermal electricity production (%) 40.7 40.9 41.8 45.4 46.4 48.3 48.5 0.0 0.0 0.0 0.0Load factor for gross electric capacities (%) 48.6 50.0 56.8 65.2 63.8 61.2 56.7 0.0 0.0 0.0 0.0CHP indicator (% of electricity from CHP) 24.7 26.3 26.8 30.3 31.9 29.8 31.1 0.0 0.0 0.0 0.0Non fossil fuels in electricity generation (%) 69.7 69.8 62.3 57.9 60.7 58.4 56.1 0.0 0.0 0.0 0.0 - nuclear 54.2 54.4 48.5 41.6 37.0 33.7 30.9 0.0 0.0 0.0 0.0 - renewable energy forms 15.5 15.4 13.9 16.3 23.6 24.7 25.2 0.0 0.0 0.0 0.0
Transport sectorPassenger transport activity (Gpkm) 40.6 33.9 35.5 38.3 41.2 44.1 46.7 49.6 53.1 -1.3 1.5 1.3 1.3
Public road transport 19.8 11.2 8.4 8.2 8.0 7.6 7.2 6.9 6.5 -8.2 -0.5 -1.0 -1.1Private cars and motorcycles 13.5 18.0 23.9 27.1 30.5 33.8 36.9 40.1 44.0 5.9 2.4 1.9 1.8Rail 7.3 4.7 3.2 2.9 2.5 2.5 2.4 2.3 2.2 -7.9 -2.2 -0.8 -0.7Aviation 0.0 0.0 0.0 0.1 0.2 0.2 0.3 0.3 0.4 4.4 3.9Inland navigation 0.0 0.0 0.0 0.0 0.0 0.0 0.0 0.0 0.0
Travel per person (km per capita) 7670 6315 6579 7110 7710 8299 8864 9467 10236 -1.5 1.6 1.4 1.4
Freight transport activity (Gtkm) 35.1 31.2 34.0 39.7 47.7 50.6 51.9 53.0 54.0 -0.3 3.4 0.9 0.4Trucks 11.8 15.9 21.4 27.4 36.3 40.7 44.9 45.8 46.6 6.1 5.4 2.2 0.4Rail 21.4 13.8 11.2 10.9 9.7 8.1 5.0 5.1 5.3 -6.2 -1.4 -6.5 0.7Inland navigation 1.8 1.5 1.4 1.5 1.7 1.8 2.0 2.0 2.1 -2.7 1.9 1.6 0.6
Freight activity per unit of GDP (tkm/000 Euro'00) 1839 1703 1550 1443 1387 1188 989 848 752 -1.7 -1.1 -3.3 -2.7
Energy demand in transport (ktoe) 1676 1509 1549 1774 1944 1992 2072 2092 2148 -0.8 2.3 0.6 0.4Public road transport 239 179 151 146 142 131 119 108 95 -4.5 -0.6 -1.7 -2.2Private cars and motorcycles 735 749 962 1087 1118 1114 1178 1231 1306 2.7 1.5 0.5 1.0Trucks 579 445 338 432 572 638 677 662 655 -5.2 5.4 1.7 -0.3Rail 100 119 83 78 68 58 43 39 37 -1.9 -1.9 -4.4 -1.6Aviation 0 0 0 14 26 30 33 30 33 2.5 0.0Inland navigation 23 17 16 17 19 21 22 23 23 -3.5 1.8 1.4 0.4
Efficiency indicator (activity related)Passenger transport (toe/Mpkm) 25.1 29.2 32.5 33.6 32.0 29.6 29.0 28.0 27.4 2.6 -0.2 -1.0 -0.6Freight transport (toe/Mtkm) 18.7 16.7 11.6 12.3 13.2 13.6 13.8 13.3 12.9 -4.7 1.2 0.5 -0.7
127

SLOVENIA: Baseline scenario SUMMARY ENERGY BALANCE AND INDICATORS (A) ktoe 1990 1995 2000 2005 2010 2015 2020 2025 2030 '90-'00 '00-'10 '10-'20 '20-'30
Annual % ChangePrimary Production 2902 3020 3084 3325 3222 3174 3029 3054 3232 0.6 0.4 -0.6 0.7
Solids 1432 1216 1062 1210 1025 880 676 660 535 -2.9 -0.4 -4.1 -2.3Oil 3 2 1 0 0 0 0 0 0 -10.4Natural gas 20 16 5 7 9 0 0 0 0 -12.7 5.1Nuclear 1192 1245 1228 1320 1334 1360 1388 1277 1600 0.3 0.8 0.4 1.4Renewable energy sources 254 542 788 788 855 934 966 1117 1097 12.0 0.8 1.2 1.3
Hydro 254 279 330 335 344 357 379 402 410 2.7 0.4 1.0 0.8Biomass & Waste 0 263 458 441 493 551 547 657 614 0.7 1.0 1.2Wind 0 0 0 0 0 1 2 2 3 27.1 4.4Solar and others 0 0 0 12 17 25 39 56 70 8.5 6.1Geothermal 0 0 0 0 0 0 0 0 0
Net Imports 2565 3038 3317 3869 4364 4796 5311 5469 5491 2.6 2.8 2.0 0.3Solids 130 187 245 252 223 215 602 729 723 6.5 -0.9 10.4 1.8Oil 1797 2243 2409 2533 2675 2751 2866 2945 2977 3.0 1.1 0.7 0.4 - Crude oil and Feedstocks 595 599 156 666 704 724 754 775 772 -12.5 16.3 0.7 0.2 - Oil products 1202 1644 2253 1867 1971 2027 2112 2170 2205 6.5 -1.3 0.7 0.4Natural gas 723 750 776 1021 1281 1672 1709 1681 1693 0.7 5.1 2.9 -0.1Electricity -85 -142 -114 63 185 157 134 115 98 -3.1 -3.1
Gross Inland Consumption 5516 6087 6367 7193 7586 7970 8340 8523 8723 1.4 1.8 1.0 0.5Solids 1645 1402 1306 1462 1248 1095 1278 1389 1259 -2.3 -0.4 0.2 -0.1Oil 1747 2294 2377 2533 2675 2751 2866 2945 2977 3.1 1.2 0.7 0.4Natural gas 763 746 782 1028 1289 1672 1709 1681 1693 0.2 5.1 2.9 -0.1Nuclear 1192 1245 1228 1320 1334 1360 1388 1277 1600 0.3 0.8 0.4 1.4Electricity -85 -142 -114 63 185 157 134 115 98 -3.1 -3.1Renewable energy forms 254 542 788 788 855 934 966 1117 1097 12.0 0.8 1.2 1.3
as % in Gross Inland ConsumptionSolids 29.8 23.0 20.5 20.3 16.5 13.7 15.3 16.3 14.4Oil 31.7 37.7 37.3 35.2 35.3 34.5 34.4 34.6 34.1Natural gas 13.8 12.3 12.3 14.3 17.0 21.0 20.5 19.7 19.4Nuclear 21.6 20.5 19.3 18.4 17.6 17.1 16.6 15.0 18.3Renewable energy forms 4.6 8.9 12.4 10.9 11.3 11.7 11.6 13.1 12.6
Electricity Generation in GWhe 12440 12652 13622 14959 15738 17676 19497 20669 21788 0.9 1.5 2.2 1.1Nuclear 4621 4778 4760 5118 5169 5273 5378 4950 6201 0.3 0.8 0.4 1.4Hydro & wind 2949 3240 3833 3890 4006 4165 4441 4732 4849 2.7 0.4 1.0 0.9Thermal (incl. biomass) 4869 4633 5028 5951 6563 8238 9678 10987 10738 0.3 2.7 4.0 1.0
Fuel Inputs for Thermal Power Generation (1) 1532 1551 1403 1645 1648 1834 1995 2155 1939 -0.9 1.6 1.9 -0.3Solids 1277 1314 1254 1419 1218 1072 1263 1379 1254 -0.2 -0.3 0.4 -0.1Oil (including refinery gas) 163 119 20 9 5 3 2 2 2 -19.0 -13.3 -8.6 0.0Gas 92 90 80 115 282 572 525 440 389 -1.4 13.4 6.4 -2.9Biomass & Waste 0 28 49 102 143 188 205 334 293 11.3 3.7 3.6Geothermal heat 0 0 0 0 0 0 0 0 0Hydrogen - Methanol 0 0 0 0 0 0 0 0 0
Fuel Input in other transformation proc. 638 692 253 737 805 863 930 974 986 -8.8 12.2 1.5 0.6Refineries 585 615 174 666 704 724 754 775 772 -11.4 15.0 0.7 0.2Biofuels and hydrogen production 0 0 0 4 32 65 99 124 146 11.8 4.0District heating 53 76 80 66 69 75 78 75 68 4.2 -1.5 1.3 -1.3Others 1 1 0 0 0 0 0 0 0
Energy Branch Consumption 101 100 98 120 119 122 129 129 126 -0.3 2.0 0.8 -0.2Non-Energy Uses 6 121 127 222 267 292 297 292 291 35.1 7.7 1.1 -0.2Final Energy Demand 3375 3936 4660 5179 5618 5943 6283 6530 6746 3.3 1.9 1.1 0.7by sectorIndustry(1) 1475 1176 1559 1789 2015 2142 2211 2248 2271 0.6 2.6 0.9 0.3 - energy intensive industries 733 598 896 1025 1142 1211 1237 1239 1238 2.0 2.5 0.8 0.0 - other industrial sectors 742 578 664 764 873 931 974 1008 1033 -1.1 2.8 1.1 0.6Residential 850 1176 1116 1263 1393 1491 1561 1602 1652 2.8 2.2 1.1 0.6Tertiary 122 259 671 687 738 799 859 912 971 18.6 0.9 1.5 1.2Transport 928 1326 1313 1441 1472 1512 1652 1769 1852 3.5 1.2 1.2 1.2by fuel (1)
Solids 243 115 96 42 30 23 15 10 5 -8.9 -10.9 -6.8 -11.2Oil 1495 2098 2238 2312 2413 2466 2576 2659 2710 4.1 0.8 0.7 0.5Gas 603 468 629 817 908 1003 1078 1132 1198 0.4 3.7 1.7 1.1Electricity 837 807 905 1179 1367 1507 1642 1733 1817 0.8 4.2 1.8 1.0Heat (from CHP and District Heating) 196 215 391 478 540 580 619 644 655 7.2 3.3 1.4 0.6Other 0 233 401 350 360 364 353 352 362 -1.1 -0.2 0.3
CO2 Emissions (Mt of CO2) 13.1 14.1 14.1 15.3 15.3 15.8 16.8 17.4 17.1 0.8 0.8 0.9 0.1Power generation/District heating 6.1 6.2 5.6 6.3 5.9 5.9 6.5 6.8 6.1 -0.9 0.5 1.1 -0.6Energy Branch 0.1 0.1 0.0 0.0 0.1 0.1 0.1 0.1 0.1 -16.4 15.1 1.0 1.2Industry 2.5 1.8 2.3 2.4 2.6 2.7 2.6 2.6 2.6 -0.8 1.2 0.3 -0.3Residential 1.7 2.1 1.3 1.5 1.7 1.9 2.1 2.2 2.3 -2.6 3.0 1.8 0.8Tertiary 0.0 0.0 1.2 1.0 1.0 1.0 1.0 1.0 1.0 49.9 -1.9 0.3 0.4Transport 2.7 3.9 3.8 4.1 4.2 4.2 4.5 4.8 5.0 3.6 0.9 0.9 1.0
CO2 Emissions Index (1990=100) 100.0 107.6 108.3 117.2 117.4 120.6 128.8 133.5 130.7
Source: PRIMES
128

SLOVENIA: Baseline scenario SUMMARY ENERGY BALANCE AND INDICATORS (B)1990 1995 2000 2005 2010 2015 2020 2025 2030 '90-'00 '00-'10 '10-'20 '20-'30
Annual % ChangeMain Energy System IndicatorsPopulation (Million) 1.998 1.989 1.989 1.997 2.015 2.019 2.017 2.014 2.006 0.0 0.1 0.0 -0.1GDP (in 000 MEUR'00) 17.2 16.7 20.6 24.3 29.2 33.3 37.1 40.7 43.8 1.8 3.6 2.4 1.7Gross Inl. Cons./GDP (toe/MEUR'00) 321.0 364.7 309.3 296.4 259.6 239.1 224.9 209.4 199.0 -0.4 -1.7 -1.4 -1.2Gross Inl. Cons./Capita (toe/inhabitant) 2.76 3.06 3.20 3.60 3.76 3.95 4.14 4.23 4.35 1.5 1.6 0.9 0.5Electricity Generated/Capita (kWh/inhabitant) 6226 6361 6848 7491 7811 8756 9668 10262 10861 1.0 1.3 2.2 1.2Carbon intensity (t of CO2/toe of GIC) 2.37 2.31 2.22 2.13 2.02 1.98 2.02 2.05 1.96 -0.6 -0.9 0.0 -0.3CO2 Emissions/Capita (t of CO2/inhabitant) 6.54 7.07 7.11 7.67 7.61 7.80 8.35 8.66 8.51 0.8 0.7 0.9 0.2CO2 Emissions to GDP (t of CO2/MEUR'00) 760.4 842.1 687.4 631.1 524.8 472.6 453.9 428.7 389.6 -1.0 -2.7 -1.4 -1.5Import Dependency % 46.5 49.9 52.1 53.8 57.5 60.2 63.7 64.2 62.9 0.0 0.0 0.0 0.0
Energy intensity indicators (1990=100)Industry (Energy on Value added) 100.0 98.7 99.0 89.1 82.7 77.4 71.7 66.5 62.8 -0.1 -1.8 -1.4 -1.3Residential (Energy on Private Income) 100.0 124.7 102.8 102.9 94.5 88.9 83.8 78.5 75.3 0.3 -0.8 -1.2 -1.1Tertiary (Energy on Value added) 100.0 201.9 441.8 388.9 349.1 331.9 320.9 309.1 304.0 16.0 -2.3 -0.8 -0.5Transport (Energy on GDP) 100.0 147.1 118.2 110.0 93.3 84.0 82.5 80.5 78.3 1.7 -2.3 -1.2 -0.5
Carbon Intensity indicatorsElectricity and Steam production (t of CO2/MWh) 0.42 0.41 0.30 0.30 0.26 0.24 0.24 0.24 0.20 -3.2 -1.5 -0.8 -1.6Final energy demand (t of CO2/toe) 2.03 1.99 1.83 1.73 1.68 1.65 1.63 1.62 1.61 -1.0 -0.9 -0.3 -0.1
Industry 1.69 1.56 1.47 1.31 1.27 1.24 1.20 1.16 1.13 -1.4 -1.4 -0.6 -0.5Residential 1.98 1.80 1.16 1.20 1.25 1.30 1.33 1.35 1.37 -5.2 0.8 0.6 0.3Tertiary 0.17 0.13 1.74 1.39 1.30 1.24 1.16 1.11 1.07 26.4 -2.8 -1.2 -0.8Transport 2.88 2.91 2.89 2.87 2.82 2.78 2.74 2.72 2.70 0.0 -0.2 -0.3 -0.2
Electricity and steam generationGeneration Capacity in MWe 2885 3195 3359 3433 3623 3821 4022 1.5 0.8 1.1
Nuclear 664 664 664 664 664 606 758 0.0 0.0 1.3Hydro (pumping excluded) 981 992 1008 1062 1096 1140 1162 0.3 0.8 0.6Wind 0 0 2 7 22 29 34 27.1 4.4Solar 0 0 2 5 12 23 38 22.6 12.5Thermal 1240 1539 1683 1696 1830 2024 2030 3.1 0.8 1.0
of which cogeneration units 1108 1165 1301 1440 1567 1500 1503 1.6 1.9 -0.4Solids fired 984 984 984 1005 1135 1107 1117 0.0 1.4 -0.2Gas fired 65 353 461 529 529 650 643 21.7 1.4 2.0Oil fired 168 168 138 6 2 2 2 -1.9 -35.3 0.0Biomass-waste fired 24 34 100 156 164 266 269 15.4 5.1 5.0Fuel Cells 0 0 0 0 0 0 0Geothermal heat 0 0 0 0 0 0 0
IndicatorsEfficiency for thermal electricity production (%) 30.8 31.1 34.3 38.6 41.7 43.8 47.6 0.0 0.0 0.0 0.0Load factor for gross electric capacities (%) 53.9 53.5 53.5 58.8 61.4 61.7 61.8 0.0 0.0 0.0 0.0CHP indicator (% of electricity from CHP) 36.9 39.7 38.5 35.4 38.6 40.4 38.5 0.0 0.0 0.0 0.0Non fossil fuels in electricity generation (%) 63.6 61.5 61.8 58.0 54.9 55.0 58.3 0.0 0.0 0.0 0.0 - nuclear 34.9 34.2 32.8 29.8 27.6 23.9 28.5 0.0 0.0 0.0 0.0 - renewable energy forms 28.7 27.3 28.9 28.1 27.3 31.0 29.8 0.0 0.0 0.0 0.0
Transport sectorPassenger transport activity (Gpkm) 15.9 14.4 13.1 13.9 14.8 16.5 18.7 21.1 23.8 -1.9 1.2 2.4 2.4
Public road transport 7.4 3.3 2.2 1.8 1.4 1.3 1.3 1.3 1.2 -11.3 -4.4 -0.8 -0.5Private cars and motorcycles 6.9 10.4 10.0 11.0 12.0 13.6 15.6 17.8 20.2 3.8 1.8 2.6 2.6Rail 1.4 0.6 0.7 0.9 1.0 1.1 1.3 1.5 1.7 -6.8 3.6 2.6 2.7Aviation 0.2 0.1 0.1 0.2 0.3 0.4 0.5 0.6 0.7 -1.1 7.8 4.4 4.0Inland navigation 0.0 0.0 0.0 0.0 0.0 0.0 0.0 0.0 0.0
Travel per person (km per capita) 7950 7244 6596 6949 7329 8149 9273 10482 11871 -1.8 1.1 2.4 2.5
Freight transport activity (Gtkm) 9.1 6.4 8.1 9.6 11.2 12.6 14.0 15.3 16.5 -1.2 3.3 2.3 1.6Trucks 4.9 3.3 5.3 6.2 7.2 8.1 8.9 9.7 10.4 0.8 3.2 2.1 1.6Rail 4.2 3.1 2.8 3.4 4.0 4.5 5.1 5.6 6.0 -4.0 3.5 2.6 1.7Inland navigation 0.0 0.0 0.0 0.0 0.0 0.0 0.0 0.0 0.0
Freight activity per unit of GDP (tkm/000 Euro'00) 530 383 394 396 383 378 378 376 376 -2.9 -0.3 -0.1 0.0
Energy demand in transport (ktoe) 928 1326 1313 1441 1472 1512 1652 1769 1852 3.5 1.2 1.2 1.2Public road transport 123 62 57 47 36 33 30 28 26 -7.4 -4.6 -1.6 -1.7Private cars and motorcycles 418 1025 1052 1147 1147 1159 1281 1393 1461 9.7 0.9 1.1 1.3Trucks 330 189 157 184 213 237 252 263 274 -7.2 3.1 1.7 0.9Rail 29 29 23 27 31 32 32 30 30 -2.5 3.0 0.3 -0.5Aviation 27 21 25 36 45 51 57 54 60 -0.8 6.2 2.3 0.6Inland navigation 0 0 0 0 0 0 0 0 0
Efficiency indicator (activity related)Passenger transport (toe/Mpkm) 36.7 77.5 86.6 88.8 83.4 75.7 73.3 70.0 65.1 9.0 -0.4 -1.3 -1.2Freight transport (toe/Mtkm) 37.9 32.6 21.9 21.8 21.6 21.1 20.1 18.9 18.3 -5.3 -0.1 -0.7 -0.9
129

SPAIN: Baseline scenario SUMMARY ENERGY BALANCE AND INDICATORS (A) ktoe 1990 1995 2000 2005 2010 2015 2020 2025 2030 '90-'00 '00-'10 '10-'20 '20-'30
Annual % ChangePrimary Production 33780 31503 32359 34565 36609 36775 44834 46178 50740 -0.4 1.2 2.0 1.2
Solids 11679 10170 8306 7075 4869 3674 1949 1800 1300 -3.4 -5.2 -8.7 -4.0Oil 794 779 225 267 250 150 100 0 0 -11.8 1.0 -8.8Natural gas 1273 379 148 200 130 100 0 0 0 -19.4 -1.3Nuclear 13701 14305 16046 16370 16207 15194 20931 19144 23187 1.6 0.1 2.6 1.0Renewable energy sources 6332 5870 7634 10652 15153 17656 21854 25234 26253 1.9 7.1 3.7 1.9
Hydro 2184 1987 2534 2493 2745 2769 2801 2843 2860 1.5 0.8 0.2 0.2Biomass & Waste 4123 3831 4654 6463 8701 10089 12426 15080 15674 1.2 6.5 3.6 2.3Wind 1 23 406 1628 3578 4590 6305 6865 7150 79.0 24.3 5.8 1.3Solar and others 21 25 32 53 116 196 308 434 556 4.3 13.6 10.3 6.1Geothermal 2 3 8 16 14 13 13 13 13 12.3 6.0 -0.6 -0.2
Net Imports 59857 75415 98351 114105 127285 136365 134475 133759 134992 5.1 2.6 0.6 0.0Solids 7038 9146 12636 15436 12179 10987 6464 6942 9478 6.0 -0.4 -6.1 3.9Oil 49166 58363 69866 73266 79906 83393 85667 83623 84249 3.6 1.4 0.7 -0.2 - Crude oil and Feedstocks 53256 55362 58393 68610 74749 78083 80435 78707 79598 0.9 2.5 0.7 -0.1 - Oil products -4091 3001 11473 4656 5157 5310 5232 4916 4651 -7.7 0.1 -1.2Natural gas 3690 7521 15467 24966 34901 41710 42085 42966 41057 15.4 8.5 1.9 -0.2Electricity -36 386 382 437 298 275 259 228 208 -2.4 -1.4 -2.2
Gross Inland Consumption 89457 102354 123712 142261 156853 165624 171361 171722 177267 3.3 2.4 0.9 0.3Solids 18942 19515 21208 22511 17048 14661 8413 8742 10778 1.1 -2.2 -6.8 2.5Oil 45547 54556 63223 67124 73115 76028 77819 75408 75784 3.3 1.5 0.6 -0.3Natural gas 4971 7722 15219 25166 35031 41810 42085 42966 41057 11.8 8.7 1.9 -0.2Nuclear 13701 14305 16046 16370 16207 15194 20931 19144 23187 1.6 0.1 2.6 1.0Electricity -36 386 382 437 298 275 259 228 208 -2.4 -1.4 -2.2Renewable energy forms 6332 5870 7634 10652 15153 17656 21854 25234 26253 1.9 7.1 3.7 1.9
as % in Gross Inland ConsumptionSolids 21.2 19.1 17.1 15.8 10.9 8.9 4.9 5.1 6.1Oil 50.9 53.3 51.1 47.2 46.6 45.9 45.4 43.9 42.8Natural gas 5.6 7.5 12.3 17.7 22.3 25.2 24.6 25.0 23.2Nuclear 15.3 14.0 13.0 11.5 10.3 9.2 12.2 11.1 13.1Renewable energy forms 7.1 5.7 6.2 7.5 9.7 10.7 12.8 14.7 14.8
Electricity Generation in GWhe 150944 165582 222771 282609 335758 370638 392371 409229 425191 4.0 4.2 1.6 0.8Nuclear 54258 55445 62195 63450 62819 58892 81129 74202 89872 1.4 0.1 2.6 1.0Hydro & wind 25409 23378 34188 47937 73678 85987 106879 114556 118780 3.0 8.0 3.8 1.1Thermal (incl. biomass) 71276 86759 126388 171222 199261 225759 204362 220471 216539 5.9 4.7 0.3 0.6
Fuel Inputs for Thermal Power Generation (1) 17836 20392 30903 36121 39669 42332 36408 38855 38268 5.7 2.5 -0.9 0.5Solids 13768 13590 18889 19525 14412 12224 6133 6716 9048 3.2 -2.7 -8.2 4.0Oil (including refinery gas) 2170 3654 4947 3216 3477 3636 3381 3323 3312 8.6 -3.5 -0.3 -0.2Gas 915 2097 5333 11239 19065 23266 21414 20595 16938 19.3 13.6 1.2 -2.3Biomass & Waste 983 1051 1735 2141 2714 3206 5480 8221 8970 5.8 4.6 7.3 5.1Geothermal heat 0 0 0 0 0 0 0 0 0Hydrogen - Methanol 0 0 0 0 0 0 0 0 0
Fuel Input in other transformation proc. 57883 58965 63144 75487 82670 86672 89187 87059 87551 0.9 2.7 0.8 -0.2Refineries 53753 56041 60048 70712 77086 80347 82491 80389 81040 1.1 2.5 0.7 -0.2Biofuels and hydrogen production 0 0 65 1711 2984 3965 4481 4768 4916 46.6 4.2 0.9District heating 0 0 0 0 0 0 0 0 0 -2.2 -1.4Others 4131 2924 3031 3063 2600 2359 2215 1902 1596 -3.0 -1.5 -1.6 -3.2
Energy Branch Consumption 4757 5473 5821 6855 7420 7729 7814 7769 7789 2.0 2.5 0.5 0.0Non-Energy Uses 5847 8011 9101 10532 11670 12507 13191 13697 14034 4.5 2.5 1.2 0.6Final Energy Demand 57010 63954 80118 94716 106958 115095 120922 122985 124486 3.5 2.9 1.2 0.3by sectorIndustry(1) 20377 20893 26180 32084 37023 40133 42192 43351 44061 2.5 3.5 1.3 0.4 - energy intensive industries 13415 13875 17515 21257 23859 25566 26452 26741 26804 2.7 3.1 1.0 0.1 - other industrial sectors 6961 7018 8665 10827 13164 14567 15740 16611 17257 2.2 4.3 1.8 0.9Residential 9266 9986 11881 14208 16075 17523 17728 17180 16588 2.5 3.1 1.0 -0.7Tertiary 5041 7007 9210 10576 11828 12713 13448 14055 14652 6.2 2.5 1.3 0.9Transport 22326 26069 32848 37847 42032 44726 47554 48399 49186 3.9 2.5 1.2 0.3by fuel (1)
Solids 3519 2230 1597 1794 1658 1590 1530 1397 1201 -7.6 0.4 -0.8 -2.4Oil 33488 38971 45773 50290 54904 57374 59464 59008 58323 3.2 1.8 0.8 -0.2Gas 4443 5731 9873 12823 14257 15995 17289 18231 19148 8.3 3.7 1.9 1.0Electricity 10817 12116 16205 20939 25141 27851 29708 31109 32358 4.1 4.5 1.7 0.9Heat (from CHP and District Heating) 1578 2099 3713 4901 5603 6115 6677 7007 7292 8.9 4.2 1.8 0.9Other 3164 2808 2958 3968 5395 6170 6254 6232 6164 -0.7 6.2 1.5 -0.1
CO2 Emissions (Mt of CO2) 201.5 224.0 282.7 315.9 332.1 344.7 324.1 323.7 323.1 3.4 1.6 -0.2 0.0Power generation/District heating 64.2 70.8 103.4 114.2 113.0 114.5 85.3 85.4 85.9 4.9 0.9 -2.8 0.1Energy Branch 11.5 13.0 11.9 13.0 13.7 13.5 13.1 12.4 11.8 0.4 1.4 -0.4 -1.0Industry 39.5 39.2 40.7 47.9 52.6 56.3 58.1 58.1 57.1 0.3 2.6 1.0 -0.2Residential 12.9 13.6 16.4 19.3 21.0 22.2 21.8 20.0 18.1 2.5 2.5 0.4 -1.8Tertiary 7.7 10.5 12.9 13.4 14.2 15.1 15.5 15.8 16.1 5.3 1.0 0.9 0.4Transport 65.6 76.9 97.3 108.2 117.5 123.1 130.3 132.0 133.9 4.0 1.9 1.0 0.3
CO2 Emissions Index (1990=100) 100.0 111.2 140.3 156.8 164.8 171.1 160.9 160.7 160.3
Source: PRIMES
130

SPAIN: Baseline scenario SUMMARY ENERGY BALANCE AND INDICATORS (B)1990 1995 2000 2005 2010 2015 2020 2025 2030 '90-'00 '00-'10 '10-'20 '20-'30
Annual % ChangeMain Energy System IndicatorsPopulation (Million) 38.850 39.223 39.927 41.273 44.603 45.264 45.559 45.556 45.379 0.3 1.1 0.2 0.0GDP (in 000 MEUR'00) 468.3 504.6 610.5 693.4 801.8 921.8 1040.2 1150.3 1240.4 2.7 2.8 2.6 1.8Gross Inl. Cons./GDP (toe/MEUR'00) 191.0 202.8 202.6 205.2 195.6 179.7 164.7 149.3 142.9 0.6 -0.4 -1.7 -1.4Gross Inl. Cons./Capita (toe/inhabitant) 2.30 2.61 3.10 3.45 3.52 3.66 3.76 3.77 3.91 3.0 1.3 0.7 0.4Electricity Generated/Capita (kWh/inhabitant) 3885 4222 5579 6847 7528 8188 8612 8983 9370 3.7 3.0 1.4 0.8Carbon intensity (t of CO2/toe of GIC) 2.25 2.19 2.28 2.22 2.12 2.08 1.89 1.89 1.82 0.1 -0.8 -1.1 -0.4CO2 Emissions/Capita (t of CO2/inhabitant) 5.19 5.71 7.08 7.65 7.45 7.62 7.11 7.11 7.12 3.2 0.5 -0.5 0.0CO2 Emissions to GDP (t of CO2/MEUR'00) 430.3 443.9 463.0 455.6 414.2 373.9 311.6 281.4 260.4 0.7 -1.1 -2.8 -1.8Import Dependency % 64.2 71.5 75.9 76.8 77.7 78.8 75.0 74.3 72.7 0.0 0.0 0.0 0.0
Energy intensity indicators (1990=100)Industry (Energy on Value added) 100.0 102.9 104.8 119.6 118.9 111.4 103.1 95.8 90.5 0.5 1.3 -1.4 -1.3Residential (Energy on Private Income) 100.0 101.6 100.9 103.9 101.9 96.9 87.1 76.4 68.5 0.1 0.1 -1.6 -2.4Tertiary (Energy on Value added) 100.0 130.3 146.0 149.3 145.2 135.6 126.9 119.4 114.4 3.9 -0.1 -1.3 -1.0Transport (Energy on GDP) 100.0 108.4 112.8 114.5 109.9 101.8 95.9 88.2 83.2 1.2 -0.3 -1.4 -1.4
Carbon Intensity indicatorsElectricity and Steam production (t of CO2/MWh) 0.38 0.37 0.38 0.33 0.28 0.26 0.18 0.17 0.17 0.2 -3.2 -4.3 -0.7Final energy demand (t of CO2/toe) 2.21 2.19 2.09 1.99 1.92 1.88 1.87 1.84 1.81 -0.5 -0.8 -0.3 -0.3
Industry 1.94 1.88 1.55 1.49 1.42 1.40 1.38 1.34 1.30 -2.2 -0.9 -0.3 -0.6Residential 1.39 1.36 1.38 1.36 1.31 1.27 1.23 1.17 1.09 0.0 -0.6 -0.6 -1.2Tertiary 1.53 1.50 1.40 1.27 1.20 1.18 1.15 1.13 1.10 -0.8 -1.5 -0.4 -0.5Transport 2.94 2.95 2.96 2.86 2.80 2.75 2.74 2.73 2.72 0.1 -0.6 -0.2 -0.1
Electricity and steam generationGeneration Capacity in MWe 48457 67370 87094 96268 108646 114392 120787 6.0 2.2 1.1
Nuclear 7807 7807 7647 7181 9844 8943 10782 -0.2 2.6 0.9Hydro (pumping excluded) 12867 12908 14049 14132 14249 14372 14409 0.9 0.1 0.1Wind 2235 9183 18307 22429 31472 34327 35912 23.4 5.6 1.3Solar 14 26 160 438 1027 1722 2451 28.0 20.5 9.1Thermal 25535 37446 46931 52088 52054 55028 57234 6.3 1.0 1.0
of which cogeneration units 4961 11318 10655 14732 16559 17817 18629 7.9 4.5 1.2Solids fired 11587 12392 9518 7312 3702 4655 6855 -1.9 -9.0 6.4Gas fired 4227 16014 31725 37725 37725 37624 37047 22.3 1.7 -0.2Oil fired 8353 7540 4112 4142 5669 5547 5522 -6.8 3.3 -0.3Biomass-waste fired 1368 1500 1576 2909 4958 7202 7810 1.4 12.1 4.6Fuel Cells 0 0 0 0 0 0 0Geothermal heat 0 0 0 0 0 0 0
IndicatorsEfficiency for thermal electricity production (%) 35.2 40.8 43.2 45.9 48.3 48.8 48.7 0.0 0.0 0.0 0.0Load factor for gross electric capacities (%) 52.5 47.9 44.0 44.0 41.2 40.8 40.2 0.0 0.0 0.0 0.0CHP indicator (% of electricity from CHP) 12.2 21.0 20.5 25.2 24.7 24.9 25.0 0.0 0.0 0.0 0.0Non fossil fuels in electricity generation (%) 47.4 42.5 44.1 43.7 56.0 58.0 61.7 0.0 0.0 0.0 0.0 - nuclear 27.9 22.5 18.7 15.9 20.7 18.1 21.1 0.0 0.0 0.0 0.0 - renewable energy forms 19.5 20.0 25.4 27.8 35.4 39.9 40.5 0.0 0.0 0.0 0.0
Transport sectorPassenger transport activity (Gpkm) 271.4 365.7 451.5 518.3 591.0 651.0 712.8 769.0 820.8 5.2 2.7 1.9 1.4
Public road transport 33.4 39.6 50.3 52.4 53.9 51.3 48.8 46.5 44.3 4.2 0.7 -1.0 -1.0Private cars and motorcycles 186.8 264.0 315.2 358.8 406.9 449.9 494.2 533.7 569.3 5.4 2.6 2.0 1.4Rail 19.9 20.8 25.4 30.1 34.8 37.9 41.2 44.4 47.3 2.5 3.2 1.7 1.4Aviation 30.3 40.1 59.3 75.5 93.5 109.8 126.3 141.9 157.2 6.9 4.7 3.1 2.2Inland navigation 1.1 1.2 1.3 1.6 1.9 2.1 2.3 2.5 2.7 2.1 3.7 2.1 1.6
Travel per person (km per capita) 6986 9324 11309 12558 13250 14383 15646 16880 18088 4.9 1.6 1.7 1.5
Freight transport activity (Gtkm) 128.0 150.5 191.3 217.3 246.5 275.5 306.3 333.5 356.0 4.1 2.6 2.2 1.5Trucks 83.8 101.6 148.7 173.4 201.5 228.5 257.6 283.4 304.8 5.9 3.1 2.5 1.7Rail 11.2 11.0 11.6 11.9 11.9 12.5 13.0 13.6 14.2 0.4 0.2 0.9 0.8Inland navigation 33.0 38.0 31.0 32.0 33.1 34.5 35.7 36.5 37.0 -0.6 0.7 0.7 0.4
Freight activity per unit of GDP (tkm/000 Euro'00) 273 298 313 313 307 299 294 290 287 1.4 -0.2 -0.4 -0.3
Energy demand in transport (ktoe) 22326 26069 32848 37847 42032 44726 47554 48399 49186 3.9 2.5 1.2 0.3Public road transport 297 278 351 364 372 345 312 274 237 1.7 0.6 -1.7 -2.7Private cars and motorcycles 7748 8788 10412 11760 12179 12061 12715 13066 12714 3.0 1.6 0.4 0.0Trucks 9631 11400 15364 17892 20764 23281 25162 26502 27752 4.8 3.1 1.9 1.0Rail 528 626 847 879 837 608 584 584 603 4.8 -0.1 -3.5 0.3Aviation 2467 3105 4497 5514 6387 6881 7209 6396 6304 6.2 3.6 1.2 -1.3Inland navigation 1655 1871 1378 1437 1493 1551 1571 1577 1576 -1.8 0.8 0.5 0.0
Efficiency indicator (activity related)Passenger transport (toe/Mpkm) 40.6 35.0 35.5 35.6 33.4 30.6 29.3 26.5 24.3 -1.3 -0.6 -1.3 -1.9Freight transport (toe/Mtkm) 88.4 88.3 88.0 89.3 90.5 90.0 87.1 84.0 82.2 0.0 0.3 -0.4 -0.6
131

SWEDEN: Baseline scenario SUMMARY ENERGY BALANCE AND INDICATORS (A) ktoe 1990 1995 2000 2005 2010 2015 2020 2025 2030 '90-'00 '00-'10 '10-'20 '20-'30
Annual % ChangePrimary Production 29728 31613 30530 34989 35005 31286 27885 20941 19735 0.3 1.4 -2.2 -3.4
Solids 216 321 230 350 320 270 0 0 0 0.6 3.3Oil 3 4 0 0 0 0 0 0 0Natural gas 0 0 0 0 0 0 0 0 0Nuclear 17764 18040 14781 18715 18663 14099 10101 1251 0 -1.8 2.4 -6.0Renewable energy sources 11745 13248 15519 15924 16022 16917 17784 19690 19735 2.8 0.3 1.0 1.0
Hydro 6234 5856 6757 6091 5723 5774 5779 5778 5777 0.8 -1.6 0.1 0.0Biomass & Waste 5507 7378 8717 9725 10118 10704 11418 12230 12137 4.7 1.5 1.2 0.6Wind 1 9 39 100 161 405 541 1623 1742 54.2 15.2 12.9 12.4Solar and others 3 5 5 9 19 33 46 58 79 5.3 13.8 9.0 5.6Geothermal 0 0 0 0 0 0 0 0 0
Net Imports 17866 19206 19096 20224 22147 24735 26312 28555 28625 0.7 1.5 1.7 0.8Solids 2329 2657 2342 2698 2759 4203 6239 8065 8031 0.1 1.7 8.5 2.6Oil 15169 16014 15654 16703 17402 17243 16968 16540 16089 0.3 1.1 -0.3 -0.5 - Crude oil and Feedstocks 16989 17815 20372 17299 17820 17703 17480 17073 16638 1.8 -1.3 -0.2 -0.5 - Oil products -1820 -1801 -4718 -596 -419 -460 -512 -533 -549Natural gas 519 679 698 948 1951 3166 2894 3639 4135 3.0 10.8 4.0 3.6Electricity -152 -145 402 -124 35 122 210 310 370 -21.7 19.8 5.8
Gross Inland Consumption 47108 50470 48225 53806 55630 54419 52531 47793 46624 0.2 1.4 -0.6 -1.2Solids 2677 2893 2443 3048 3079 4473 6239 8065 8031 -0.9 2.3 7.3 2.6Oil 14555 15754 14382 15295 15880 15641 15303 14837 14353 -0.1 1.0 -0.4 -0.6Natural gas 519 679 698 948 1951 3166 2894 3639 4135 3.0 10.8 4.0 3.6Nuclear 17764 18040 14781 18715 18663 14099 10101 1251 0 -1.8 2.4 -6.0Electricity -152 -145 402 -124 35 122 210 310 370 -21.7 19.8 5.8Renewable energy forms 11745 13248 15519 15924 16022 16917 17784 19690 19735 2.8 0.3 1.0 1.0
as % in Gross Inland ConsumptionSolids 5.7 5.7 5.1 5.7 5.5 8.2 11.9 16.9 17.2Oil 30.9 31.2 29.8 28.4 28.5 28.7 29.1 31.0 30.8Natural gas 1.1 1.3 1.4 1.8 3.5 5.8 5.5 7.6 8.9Nuclear 37.7 35.7 30.7 34.8 33.5 25.9 19.2 2.6 0.0Renewable energy forms 24.9 26.2 32.2 29.6 28.8 31.1 33.9 41.2 42.3
Electricity Generation in GWhe 145952 148271 145524 154003 155870 161057 165162 166375 167355 0.0 0.7 0.6 0.1Nuclear 68173 69922 57306 72556 72356 54660 39160 4849 0 -1.7 2.4 -6.0Hydro & wind 72496 68196 79027 71981 68425 71862 73490 86074 87436 0.9 -1.4 0.7 1.8Thermal (incl. biomass) 5283 10153 9191 9466 15089 34536 52512 75453 79919 5.7 5.1 13.3 4.3
Fuel Inputs for Thermal Power Generation (1) 1524 3382 3389 3790 5357 9288 11380 15067 15282 8.3 4.7 7.8 3.0Solids 558 705 468 127 284 1844 3913 5845 6348 -1.7 -4.9 30.0 5.0Oil (including refinery gas) 268 766 434 556 461 845 41 126 37 4.9 0.6 -21.5 -0.9Gas 251 393 402 293 1255 2427 2120 2855 3055 4.8 12.0 5.4 3.7Biomass & Waste 447 1518 2085 2815 3357 4172 5305 6241 5841 16.7 4.9 4.7 1.0Geothermal heat 0 0 0 0 0 0 0 0 0Hydrogen - Methanol 0 0 0 0 0 0 0 0 0
Fuel Input in other transformation proc. 20574 22365 24830 23812 24329 23248 22440 21625 21239 1.9 -0.2 -0.8 -0.5Refineries 18041 19475 21618 19204 20008 19825 19510 19017 18499 1.8 -0.8 -0.3 -0.5Biofuels and hydrogen production 0 0 0 87 221 434 601 705 789 10.5 2.7District heating 1118 1275 1509 2704 2391 1353 851 573 762 3.0 4.7 -9.8 -1.1Others 1415 1615 1704 1817 1708 1637 1478 1330 1190 1.9 0.0 -1.4 -2.1
Energy Branch Consumption 1761 1629 1528 1493 1453 1380 1259 1122 1054 -1.4 -0.5 -1.4 -1.8Non-Energy Uses 1769 1772 1458 1995 2330 2428 2478 2484 2474 -1.9 4.8 0.6 0.0Final Energy Demand 30522 33708 34554 34957 36234 37485 38467 38371 37977 1.2 0.5 0.6 -0.1by sectorIndustry(1) 11869 12639 13631 12661 12885 13406 13760 13784 13646 1.4 -0.6 0.7 -0.1 - energy intensive industries 8593 8949 10909 10188 10276 10627 10866 10825 10670 2.4 -0.6 0.6 -0.2 - other industrial sectors 3275 3690 2722 2473 2609 2780 2894 2958 2975 -1.8 -0.4 1.0 0.3Residential 6838 8029 7539 7660 7821 8049 8144 8166 8179 1.0 0.4 0.4 0.0Tertiary 4553 5375 5256 5779 6198 6537 6813 6946 7019 1.4 1.7 1.0 0.3Transport 7263 7666 8127 8857 9330 9492 9750 9476 9134 1.1 1.4 0.4 -0.7by fuel (1)
Solids 1231 1192 1141 1697 1667 1642 1520 1512 1087 -0.8 3.9 -0.9 -3.3Oil 11988 12538 12505 12220 12554 12324 12533 12048 11684 0.4 0.0 0.0 -0.7Gas 570 593 651 758 814 719 892 856 1068 1.3 2.3 0.9 1.8Electricity 10348 10711 11068 11378 11823 12399 12947 13267 13442 0.7 0.7 0.9 0.4Heat (from CHP and District Heating) 1765 3620 3747 4163 4550 5132 5264 5267 5133 7.8 2.0 1.5 -0.3Other 4620 5054 5442 4742 4825 5267 5311 5421 5562 1.7 -1.2 1.0 0.5
CO2 Emissions (Mt of CO2) 50.4 53.9 51.4 52.6 56.0 63.4 68.6 76.3 76.1 0.2 0.9 2.1 1.0Power generation/District heating 6.3 8.0 5.6 5.3 7.6 16.6 21.2 30.6 32.7 -1.1 3.1 10.8 4.4Energy Branch 1.5 1.8 1.9 1.8 1.9 1.3 1.4 1.3 1.2 2.2 -0.3 -2.9 -1.3Industry 11.5 12.4 11.5 12.3 12.2 10.9 10.9 10.4 9.4 0.0 0.6 -1.1 -1.5Residential 4.8 4.5 3.7 2.6 2.4 2.2 2.0 1.9 1.7 -2.6 -4.3 -1.6 -1.5Tertiary 5.6 5.4 5.6 5.5 5.7 6.0 6.3 6.4 6.5 0.0 0.2 1.0 0.3Transport 20.7 21.8 23.2 25.1 26.3 26.4 26.8 25.8 24.6 1.1 1.3 0.2 -0.9
CO2 Emissions Index (1990=100) 100.0 107.0 102.0 104.5 111.1 125.8 136.2 151.5 151.0
Source: PRIMES
132

SWEDEN: Baseline scenario SUMMARY ENERGY BALANCE AND INDICATORS (B)1990 1995 2000 2005 2010 2015 2020 2025 2030 '90-'00 '00-'10 '10-'20 '20-'30
Annual % ChangeMain Energy System IndicatorsPopulation (Million) 8.559 8.827 8.872 9.038 9.187 9.373 9.575 9.769 9.911 0.4 0.4 0.4 0.3GDP (in 000 MEUR'00) 213.3 221.5 259.9 289.8 329.1 370.9 414.0 454.8 484.3 2.0 2.4 2.3 1.6Gross Inl. Cons./GDP (toe/MEUR'00) 220.8 227.8 185.5 185.7 169.0 146.7 126.9 105.1 96.3 -1.7 -0.9 -2.8 -2.7Gross Inl. Cons./Capita (toe/inhabitant) 5.50 5.72 5.44 5.95 6.06 5.81 5.49 4.89 4.70 -0.1 1.1 -1.0 -1.5Electricity Generated/Capita (kWh/inhabitant) 17052 16797 16403 17039 16965 17183 17248 17032 16885 -0.4 0.3 0.2 -0.2Carbon intensity (t of CO2/toe of GIC) 1.07 1.07 1.07 0.98 1.01 1.16 1.31 1.60 1.63 0.0 -0.6 2.6 2.2CO2 Emissions/Capita (t of CO2/inhabitant) 5.89 6.11 5.80 5.82 6.10 6.76 7.17 7.81 7.68 -0.2 0.5 1.6 0.7CO2 Emissions to GDP (t of CO2/MEUR'00) 236.2 243.4 197.8 181.7 170.2 170.8 165.8 167.8 157.1 -1.8 -1.5 -0.3 -0.5Import Dependency % 37.4 37.3 38.5 36.6 38.8 44.2 48.5 57.7 59.2 0.0 0.0 0.0 0.0
Energy intensity indicators (1990=100)Industry (Energy on Value added) 100.0 85.3 66.1 51.4 44.5 40.1 36.3 32.9 30.7 -4.1 -3.9 -2.0 -1.7Residential (Energy on Private Income) 100.0 118.6 95.1 89.5 81.5 75.4 69.1 63.5 59.8 -0.5 -1.5 -1.6 -1.4Tertiary (Energy on Value added) 100.0 113.7 98.2 99.0 93.5 87.2 81.1 74.7 70.4 -0.2 -0.5 -1.4 -1.4Transport (Energy on GDP) 100.0 101.7 91.9 89.8 83.3 75.2 69.2 61.2 55.4 -0.8 -1.0 -1.8 -2.2
Carbon Intensity indicatorsElectricity and Steam production (t of CO2/MWh) 0.04 0.04 0.03 0.03 0.04 0.07 0.09 0.13 0.14 -2.4 2.1 9.8 4.4Final energy demand (t of CO2/toe) 1.39 1.31 1.27 1.30 1.28 1.21 1.20 1.16 1.11 -0.9 0.1 -0.7 -0.7
Industry 0.97 0.98 0.84 0.97 0.95 0.81 0.79 0.75 0.69 -1.4 1.2 -1.8 -1.5Residential 0.70 0.57 0.49 0.34 0.30 0.27 0.25 0.23 0.21 -3.6 -4.7 -2.0 -1.5Tertiary 1.22 1.00 1.06 0.95 0.92 0.92 0.92 0.92 0.92 -1.5 -1.4 0.0 0.0Transport 2.85 2.85 2.85 2.83 2.82 2.78 2.75 2.72 2.69 0.0 -0.1 -0.2 -0.2
Electricity and steam generationGeneration Capacity in MWe 32268 34663 37101 39118 43011 45201 45767 1.4 1.5 0.6
Nuclear 9824 9824 9824 6933 4967 615 0 0.0 -6.6Hydro (pumping excluded) 15777 15777 15777 15777 15777 15777 15777 0.0 0.0 0.0Wind 231 524 958 1814 2342 7209 7743 15.3 9.3 12.7Solar 3 6 12 23 33 47 60 15.5 10.9 6.0Thermal 6433 8532 10530 14571 19892 21554 22188 5.1 6.6 1.1
of which cogeneration units 3640 4097 4215 5610 9282 10255 10583 1.5 8.2 1.3Solids fired 838 838 838 1659 4988 5961 6460 0.0 19.5 2.6Gas fired 470 1070 4171 6936 8086 8086 8086 24.4 6.8 0.0Oil fired 3478 4960 3495 2739 1792 1792 1620 0.1 -6.5 -1.0Biomass-waste fired 1647 1665 2026 3236 5026 5715 6022 2.1 9.5 1.8Fuel Cells 0 0 0 0 0 0 0Geothermal heat 0 0 0 0 0 0 0
IndicatorsEfficiency for thermal electricity production (%) 23.3 21.5 24.2 32.0 39.7 43.1 45.0 0.0 0.0 0.0 0.0Load factor for gross electric capacities (%) 51.5 50.7 48.0 47.0 43.8 42.0 41.7 0.0 0.0 0.0 0.0CHP indicator (% of electricity from CHP) 5.5 5.2 7.1 14.9 21.8 26.6 27.0 0.0 0.0 0.0 0.0Non fossil fuels in electricity generation (%) 97.5 97.8 95.1 85.6 78.9 69.1 67.0 0.0 0.0 0.0 0.0 - nuclear 39.4 47.1 46.4 33.9 23.7 2.9 0.0 0.0 0.0 0.0 0.0 - renewable energy forms 58.1 50.7 48.6 51.6 55.1 66.2 67.0 0.0 0.0 0.0 0.0
Transport sectorPassenger transport activity (Gpkm) 116.4 117.7 129.1 139.8 152.8 164.7 175.2 183.5 188.9 1.0 1.7 1.4 0.8
Public road transport 8.0 8.5 9.3 9.4 9.5 9.6 9.6 9.7 9.7 1.5 0.2 0.1 0.1Private cars and motorcycles 86.9 87.4 91.9 98.0 106.0 114.9 122.8 128.9 132.8 0.6 1.4 1.5 0.8Rail 8.4 8.3 10.4 11.5 12.6 12.7 12.7 12.8 12.8 2.2 2.0 0.1 0.1Aviation 8.8 9.0 12.6 15.6 18.9 21.3 23.6 25.4 26.6 3.6 4.1 2.3 1.2Inland navigation 4.3 4.4 4.9 5.4 5.8 6.2 6.5 6.8 6.9 1.4 1.7 1.1 0.7
Travel per person (km per capita) 13596 13329 14550 15464 16636 17575 18298 18783 19057 0.7 1.3 1.0 0.4
Freight transport activity (Gtkm) 53.9 58.9 62.6 67.0 73.2 79.8 85.8 91.0 95.2 1.5 1.6 1.6 1.0Trucks 26.5 31.6 35.6 39.4 45.0 49.8 54.4 58.4 61.5 3.0 2.4 1.9 1.2Rail 19.1 19.4 20.1 20.5 20.9 21.8 22.4 22.8 23.2 0.5 0.4 0.7 0.4Inland navigation 8.3 7.9 6.9 7.0 7.3 8.1 9.0 9.9 10.5 -1.8 0.5 2.2 1.5
Freight activity per unit of GDP (tkm/000 Euro'00) 253 266 241 231 222 215 207 200 197 -0.5 -0.8 -0.7 -0.5
Energy demand in transport (ktoe) 7263 7666 8127 8857 9330 9492 9750 9476 9134 1.1 1.4 0.4 -0.7Public road transport 230 275 189 189 188 181 170 159 149 -2.0 0.0 -1.0 -1.3Private cars and motorcycles 4001 4094 4081 4335 4273 4119 4208 4122 3912 0.2 0.5 -0.2 -0.7Trucks 1872 2066 2471 2734 3111 3386 3550 3654 3621 2.8 2.3 1.3 0.2Rail 252 273 299 309 288 251 226 215 210 1.7 -0.4 -2.4 -0.7Aviation 764 856 934 1131 1306 1374 1400 1117 1027 2.0 3.4 0.7 -3.0Inland navigation 143 103 154 158 163 180 197 209 215 0.8 0.6 1.9 0.9
Efficiency indicator (activity related)Passenger transport (toe/Mpkm) 44.6 46.1 42.0 42.1 39.2 35.6 34.0 30.3 27.8 -0.6 -0.7 -1.4 -2.0Freight transport (toe/Mtkm) 38.5 38.0 43.2 44.3 45.7 45.5 44.3 42.9 40.8 1.2 0.6 -0.3 -0.8
133

UNITED KINGDOM: Baseline scenario SUMMARY ENERGY BALANCE AND INDICATORS (A) ktoe 1990 1995 2000 2005 2010 2015 2020 2025 2030 '90-'00 '00-'10 '10-'20 '20-'30
Annual % ChangePrimary Production 205508 249731 268701 234558 196817 118276 87976 93360 96700 2.7 -3.1 -7.7 0.9
Solids 54125 30516 18588 14500 13000 12000 10000 9000 8000 -10.1 -3.5 -2.6 -2.2Oil 92813 132256 127882 100000 85000 45000 25000 23798 23000 3.3 -4.0 -11.5 -0.8Natural gas 40925 63715 97654 94000 70000 30000 15000 14250 13538 9.1 -3.3 -14.3 -1.0Nuclear 16574 21249 21942 22429 22474 22632 26513 31453 36591 2.8 0.2 1.7 3.3Renewable energy sources 1070 1996 2635 3629 6344 8644 11464 14860 15572 9.4 9.2 6.1 3.1
Hydro 436 416 437 410 447 455 462 471 476 0.0 0.2 0.3 0.3Biomass & Waste 627 1539 2104 2901 4213 6134 8184 9658 10195 12.9 7.2 6.9 2.2Wind 1 34 81 294 1646 2002 2720 4612 4772 59.3 35.1 5.2 5.8Solar and others 5 6 11 22 36 52 94 116 128 8.1 12.3 10.1 3.1Geothermal 1 1 1 1 2 2 2 3 3 0.0 8.6 3.3 0.9
Net Imports 5932 -36021 -39031 1675 46285 127851 159341 152456 152296 13.2 -0.5Solids 9122 10493 14576 23504 26581 24778 21404 19612 21945 4.8 6.2 -2.1 0.2Oil -10396 -48554 -45515 -18907 -1745 38156 56700 54195 54383 -0.4 - Crude oil and Feedstocks -4537 -36357 -39025 -11515 6119 46306 65096 62769 62961 26.7 -0.3 - Oil products -5858 -12196 -6490 -7391 -7863 -8150 -8397 -8574 -8578Natural gas 6178 637 -9310 -3853 20564 64158 80553 78096 75522 14.6 -0.6Electricity 1027 1403 1219 931 885 759 684 552 447 1.7 -3.1 -2.5 -4.2
Gross Inland Consumption 211082 218011 230427 234202 241009 244018 245189 243673 246829 0.9 0.5 0.2 0.1Solids 64305 45866 35733 38004 39581 36778 31404 28612 29945 -5.7 1.0 -2.3 -0.5Oil 80903 82378 81399 79063 81161 81047 79571 75850 75216 0.1 0.0 -0.2 -0.6Natural gas 47203 65119 87500 90147 90564 94158 95553 92346 89059 6.4 0.3 0.5 -0.7Nuclear 16574 21249 21942 22429 22474 22632 26513 31453 36591 2.8 0.2 1.7 3.3Electricity 1027 1403 1219 931 885 759 684 552 447 1.7 -3.1 -2.5 -4.2Renewable energy forms 1070 1996 2635 3629 6344 8644 11464 14860 15572 9.4 9.2 6.1 3.1
as % in Gross Inland ConsumptionSolids 30.5 21.0 15.5 16.2 16.4 15.1 12.8 11.7 12.1Oil 38.3 37.8 35.3 33.8 33.7 33.2 32.5 31.1 30.5Natural gas 22.4 29.9 38.0 38.5 37.6 38.6 39.0 37.9 36.1Nuclear 7.9 9.7 9.5 9.6 9.3 9.3 10.8 12.9 14.8Renewable energy forms 0.5 0.9 1.1 1.5 2.6 3.5 4.7 6.1 6.3
Electricity Generation in GWhe 316937 332435 374548 403594 439445 467024 489171 511267 529311 1.7 1.6 1.1 0.8Nuclear 65735 88948 85048 86934 87108 87719 102762 121909 141824 2.6 0.2 1.7 3.3Hydro & wind 5083 5228 6031 8188 24339 28575 37364 59499 61478 1.7 15.0 4.4 5.1Thermal (incl. biomass) 246119 238259 283469 308472 327998 350729 349044 329859 326009 1.4 1.5 0.6 -0.7
Fuel Inputs for Thermal Power Generation (1) 56554 50141 56769 61982 65085 65563 60211 55333 54810 0.0 1.4 -0.8 -0.9Solids 47277 33862 27245 31183 33678 31368 26690 24510 26226 -5.4 2.1 -2.3 -0.2Oil (including refinery gas) 7172 3403 1330 935 813 666 257 233 176 -15.5 -4.8 -10.9 -3.7Gas 1884 12198 26760 27698 28143 29988 28615 24745 22110 30.4 0.5 0.2 -2.5Biomass & Waste 222 678 1434 2166 2450 3540 4648 5844 6299 20.5 5.5 6.6 3.1Geothermal heat 0 0 0 0 0 0 0 0 0Hydrogen - Methanol 0 0 0 0 0 0 0 0 0
Fuel Input in other transformation proc. 99145 102334 100475 98379 101498 102219 101384 97387 96264 0.1 0.1 0.0 -0.5Refineries 89882 94255 89299 90555 92973 92866 91245 87330 86432 -0.1 0.4 -0.2 -0.5Biofuels and hydrogen production 0 0 0 87 1224 2152 3258 3677 3800 10.3 1.6District heating 0 0 3511 1538 1573 1651 1677 1691 1711 -7.7 0.6 0.2Others 9263 8079 7665 6199 5728 5550 5205 4690 4321 -1.9 -2.9 -1.0 -1.8
Energy Branch Consumption 12836 14458 14723 13171 12419 11711 11013 10196 9612 1.4 -1.7 -1.2 -1.4Non-Energy Uses 11502 12550 11192 11473 12447 12943 13229 13411 13619 -0.3 1.1 0.6 0.3Final Energy Demand 139016 144706 154668 158793 164268 169087 173697 175091 174815 1.1 0.6 0.6 0.1by sectorIndustry(1) 37031 37410 39166 38401 39573 40905 41328 41462 41158 0.6 0.1 0.4 0.0 - energy intensive industries 20349 21497 20429 19010 19327 19562 19328 18863 18358 0.0 -0.6 0.0 -0.5 - other industrial sectors 16682 15913 18736 19391 20246 21343 22000 22600 22800 1.2 0.8 0.8 0.4Residential 37957 39573 43099 45378 46990 49163 50461 51148 51524 1.3 0.9 0.7 0.2Tertiary 18578 20856 20338 20155 21238 22566 23955 25216 26581 0.9 0.4 1.2 1.0Transport 45451 46867 52066 54859 56467 56453 57953 57265 55552 1.4 0.8 0.3 -0.4by fuel (1)
Solids 12266 8891 5029 4350 3716 3372 2899 2567 2359 -8.5 -3.0 -2.5 -2.0Oil 58770 60197 62480 65016 66073 65355 65189 63660 61327 0.6 0.6 -0.1 -0.6Gas 41348 46918 51415 52663 53500 55954 57955 58593 58387 2.2 0.4 0.8 0.1Electricity 23597 25274 28335 30316 33227 35513 37490 39395 40758 1.8 1.6 1.2 0.8Heat (from CHP and District Heating) 2623 2557 6833 5794 6312 6776 7249 7652 8649 10.0 -0.8 1.4 1.8Other 412 868 577 653 1440 2118 2915 3225 3335 3.4 9.6 7.3 1.4
CO2 Emissions (Mt of CO2) 565.3 532.0 542.6 555.7 566.8 562.5 539.4 515.0 505.3 -0.4 0.4 -0.5 -0.6Power generation/District heating 214.6 173.3 184.8 196.0 206.5 201.4 178.2 160.3 160.6 -1.5 1.1 -1.5 -1.0Energy Branch 27.2 31.4 30.2 25.0 22.9 21.5 19.4 17.4 15.7 1.1 -2.7 -1.7 -2.1Industry 80.5 78.3 67.4 67.4 66.6 67.5 66.0 64.0 60.3 -1.8 -0.1 -0.1 -0.9Residential 77.8 77.3 82.0 84.0 84.7 87.3 87.7 87.1 86.7 0.5 0.3 0.3 -0.1Tertiary 32.9 35.2 26.4 23.8 24.3 25.4 26.7 27.9 29.1 -2.2 -0.8 1.0 0.9Transport 132.4 136.5 151.8 159.6 161.8 159.5 161.4 158.3 153.0 1.4 0.6 0.0 -0.5
CO2 Emissions Index (1990=100) 100.0 94.1 96.0 98.3 100.3 99.5 95.4 91.1 89.4
Source: PRIMES
134

UNITED KINGDOM: Baseline scenario SUMMARY ENERGY BALANCE AND INDICATORS (B)1990 1995 2000 2005 2010 2015 2020 2025 2030 '90-'00 '00-'10 '10-'20 '20-'30
Annual % ChangeMain Energy System IndicatorsPopulation (Million) 57.237 57.928 58.643 60.254 60.924 61.934 62.930 63.792 64.388 0.2 0.4 0.3 0.2GDP (in 000 MEUR'00) 1227.8 1333.6 1559.6 1758.5 2031.5 2304.9 2578.9 2841.5 3061.6 2.4 2.7 2.4 1.7Gross Inl. Cons./GDP (toe/MEUR'00) 171.9 163.5 147.7 133.2 118.6 105.9 95.1 85.8 80.6 -1.5 -2.2 -2.2 -1.6Gross Inl. Cons./Capita (toe/inhabitant) 3.69 3.76 3.93 3.89 3.96 3.94 3.90 3.82 3.83 0.6 0.1 -0.2 -0.2Electricity Generated/Capita (kWh/inhabitant) 5537 5739 6387 6698 7213 7541 7773 8015 8221 1.4 1.2 0.8 0.6Carbon intensity (t of CO2/toe of GIC) 2.68 2.44 2.35 2.37 2.35 2.31 2.20 2.11 2.05 -1.3 0.0 -0.7 -0.7CO2 Emissions/Capita (t of CO2/inhabitant) 9.88 9.18 9.25 9.22 9.30 9.08 8.57 8.07 7.85 -0.7 0.1 -0.8 -0.9CO2 Emissions to GDP (t of CO2/MEUR'00) 460.4 398.9 347.9 316.0 279.0 244.0 209.1 181.2 165.1 -2.8 -2.2 -2.8 -2.3Import Dependency % 2.8 -16.3 -16.8 0.7 19.0 51.9 64.4 62.0 61.2 0.0 0.0 0.0 0.0
Energy intensity indicators (1990=100)Industry (Energy on Value added) 100.0 98.1 99.5 102.2 99.0 93.4 87.6 82.2 78.2 -0.1 0.0 -1.2 -1.1Residential (Energy on Private Income) 100.0 97.6 87.3 80.1 72.1 66.8 61.5 56.7 53.1 -1.4 -1.9 -1.6 -1.5Tertiary (Energy on Value added) 100.0 101.3 81.3 68.2 60.7 56.1 52.5 49.7 48.2 -2.1 -2.9 -1.4 -0.9Transport (Energy on GDP) 100.0 94.9 90.2 84.3 75.1 66.2 60.7 54.4 49.0 -1.0 -1.8 -2.1 -2.1
Carbon Intensity indicatorsElectricity and Steam production (t of CO2/MWh) 0.62 0.48 0.40 0.41 0.40 0.37 0.31 0.26 0.25 -4.2 -0.1 -2.6 -2.0Final energy demand (t of CO2/toe) 2.33 2.26 2.12 2.11 2.05 2.01 1.97 1.93 1.88 -0.9 -0.3 -0.4 -0.4
Industry 2.17 2.09 1.72 1.76 1.68 1.65 1.60 1.54 1.46 -2.3 -0.2 -0.5 -0.9Residential 2.05 1.95 1.90 1.85 1.80 1.78 1.74 1.70 1.68 -0.7 -0.5 -0.4 -0.3Tertiary 1.77 1.69 1.30 1.18 1.14 1.13 1.12 1.10 1.09 -3.0 -1.3 -0.2 -0.2Transport 2.91 2.91 2.92 2.91 2.86 2.83 2.79 2.77 2.75 0.0 -0.2 -0.3 -0.1
Electricity and steam generationGeneration Capacity in MWe 88855 95349 95552 101518 109139 120608 125590 0.7 1.3 1.4
Nuclear 14213 13793 13793 11314 13233 15649 18065 -0.3 -0.4 3.2Hydro (pumping excluded) 1371 1396 1418 1433 1446 1464 1480 0.3 0.2 0.2Wind 406 1366 6520 7870 10870 19416 20125 32.0 5.2 6.4Solar 2 4 6 24 63 145 271 11.5 27.3 15.7Thermal 72863 78791 73815 80877 83527 83934 85648 0.1 1.2 0.3
of which cogeneration units 10272 10670 14381 18326 21863 23533 25704 3.4 4.3 1.6Solids fired 31696 30826 22261 19490 19743 19645 22223 -3.5 -1.2 1.2Gas fired 35673 41160 44892 53587 56161 55948 56097 2.3 2.3 0.0Oil fired 4480 5392 5085 4623 3139 2101 912 1.3 -4.7 -11.6Biomass-waste fired 1014 1413 1576 3178 4484 6240 6416 4.5 11.0 3.6Fuel Cells 0 0 0 0 0 0 0Geothermal heat 0 0 0 0 0 0 0
IndicatorsEfficiency for thermal electricity production (%) 42.9 42.8 43.3 46.0 49.9 51.3 51.2 0.0 0.0 0.0 0.0Load factor for gross electric capacities (%) 48.1 48.3 52.5 52.5 51.2 48.4 48.1 0.0 0.0 0.0 0.0CHP indicator (% of electricity from CHP) 12.6 12.6 15.1 17.3 17.1 16.9 17.5 0.0 0.0 0.0 0.0Non fossil fuels in electricity generation (%) 25.5 25.2 27.1 28.0 33.4 41.6 44.8 0.0 0.0 0.0 0.0 - nuclear 22.7 21.5 19.8 18.8 21.0 23.8 26.8 0.0 0.0 0.0 0.0 - renewable energy forms 2.8 3.7 7.3 9.2 12.4 17.7 18.0 0.0 0.0 0.0 0.0
Transport sectorPassenger transport activity (Gpkm) 712.4 719.1 765.7 839.3 932.5 1019.5 1096.1 1146.4 1179.9 0.7 2.0 1.6 0.7
Public road transport 46.2 44.3 45.0 45.3 46.4 47.6 48.4 49.2 49.8 -0.3 0.3 0.4 0.3Private cars and motorcycles 593.9 596.3 619.0 676.4 750.4 817.9 876.7 914.6 939.3 0.4 1.9 1.6 0.7Rail 39.7 37.0 46.7 49.1 52.1 53.6 54.7 55.7 56.6 1.6 1.1 0.5 0.3Aviation 28.4 36.6 50.5 63.7 78.4 94.6 109.8 120.1 127.1 5.9 4.5 3.4 1.5Inland navigation 4.2 4.8 4.5 4.8 5.3 5.9 6.4 6.9 7.1 0.7 1.7 2.0 1.0
Travel per person (km per capita) 12446 12413 13056 13930 15306 16461 17418 17971 18325 0.5 1.6 1.3 0.5
Freight transport activity (Gtkm) 217.5 227.9 243.7 255.1 270.2 277.7 284.3 290.1 296.1 1.1 1.0 0.5 0.4Trucks 145.7 161.5 165.6 174.0 185.4 192.1 198.5 204.4 210.7 1.3 1.1 0.7 0.6Rail 16.0 13.3 18.1 20.1 22.6 23.2 23.7 24.3 25.0 1.2 2.2 0.5 0.5Inland navigation 55.8 53.1 60.0 61.0 62.3 62.4 62.1 61.3 60.3 0.7 0.4 0.0 -0.3
Freight activity per unit of GDP (tkm/000 Euro'00) 177 171 156 145 133 120 110 102 97 -1.2 -1.6 -1.9 -1.3
Energy demand in transport (ktoe) 45451 46867 52066 54859 56467 56453 57953 57265 55552 1.4 0.8 0.3 -0.4Public road transport 2626 2273 2192 2183 2150 2076 1966 1864 1782 -1.8 -0.2 -0.9 -1.0Private cars and motorcycles 23302 22670 24503 26687 26903 26056 26750 26015 24579 0.5 0.9 -0.1 -0.8Trucks 10384 11724 12077 12676 13472 13773 13733 13580 13187 1.5 1.1 0.2 -0.4Rail 1076 1246 1192 1199 1142 943 866 815 796 1.0 -0.4 -2.7 -0.8Aviation 6794 7838 11182 11179 11849 12658 13711 14096 14341 5.1 0.6 1.5 0.5Inland navigation 1269 1117 920 936 952 949 926 895 867 -3.2 0.3 -0.3 -0.7
Efficiency indicator (activity related)Passenger transport (toe/Mpkm) 47.3 47.2 50.9 49.1 45.0 40.9 39.5 37.3 35.1 0.8 -1.2 -1.3 -1.2Freight transport (toe/Mtkm) 54.1 56.7 53.6 53.7 53.7 53.2 51.7 50.0 47.6 -0.1 0.0 -0.4 -0.8
135

BULGARIA: Baseline scenario SUMMARY ENERGY BALANCE AND INDICATORS (A) ktoe 1990 1995 2000 2005 2010 2015 2020 2025 2030 '90-'00 '00-'10 '10-'20 '20-'30
Annual % ChangePrimary Production 9136 10185 9840 9942 9228 10402 10218 11275 12398 0.7 -0.6 1.0 2.0
Solids 5121 5287 4310 4317 4392 4583 4272 3480 3372 -1.7 0.2 -0.3 -2.3Oil 60 43 42 42 41 41 41 41 41 -3.5 -0.3 0.0 0.0Natural gas 11 40 11 270 237 200 169 143 122 0.3 35.8 -3.3 -3.2Nuclear 3783 4453 4689 4362 3286 4104 4072 5877 6945 2.2 -3.5 2.2 5.5Renewable energy sources 161 363 788 952 1273 1475 1664 1734 1918 17.2 4.9 2.7 1.4
Hydro 161 151 230 286 301 308 313 327 359 3.6 2.7 0.4 1.4Biomass & Waste 0 212 558 662 911 1068 1218 1254 1383 5.0 2.9 1.3Wind 0 0 0 0 45 59 68 75 80 4.2 1.7Solar and others 0 0 0 4 16 40 65 78 96 14.9 3.9Geothermal 0 0 0 0 0 0 0 0 0
Net Imports 17823 13484 8409 8950 10034 11496 13515 14114 15252 -7.2 1.8 3.0 1.2Solids 3527 2424 2258 2535 2787 2147 3097 3228 3133 -4.4 2.1 1.1 0.1Oil 8540 6511 4081 4863 5508 6268 7027 7515 8173 -7.1 3.0 2.5 1.5 - Crude oil and Feedstocks 8247 8003 5346 6147 6983 7946 8906 9523 10357 -4.2 2.7 2.5 1.5 - Oil products 292 -1492 -1265 -1284 -1475 -1677 -1879 -2008 -2184Natural gas 5430 4563 2468 2085 2285 3589 3864 3812 4355 -7.6 -0.8 5.4 1.2Electricity 326 -14 -397 -534 -546 -508 -473 -440 -409
Gross Inland Consumption 27961 23304 18296 18795 19141 21755 23570 25209 27452 -4.2 0.5 2.1 1.5Solids 8706 7673 6417 6852 7178 6730 7369 6708 6505 -3.0 1.1 0.3 -1.2Oil 9589 6245 4160 4807 5428 6166 6905 7375 8016 -8.0 2.7 2.4 1.5Natural gas 5395 4584 2639 2355 2521 3788 4033 3955 4477 -6.9 -0.5 4.8 1.0Nuclear 3783 4453 4689 4362 3286 4104 4072 5877 6945 2.2 -3.5 2.2 5.5Electricity 326 -14 -397 -534 -546 -508 -473 -440 -409Renewable energy forms 161 363 788 952 1273 1475 1664 1734 1918 17.2 4.9 2.7 1.4
as % in Gross Inland ConsumptionSolids 31.1 32.9 35.1 36.5 37.5 30.9 31.3 26.6 23.7Oil 34.3 26.8 22.7 25.6 28.4 28.3 29.3 29.3 29.2Natural gas 19.3 19.7 14.4 12.5 13.2 17.4 17.1 15.7 16.3Nuclear 13.5 19.1 25.6 23.2 17.2 18.9 17.3 23.3 25.3Renewable energy forms 0.6 1.6 4.3 5.1 6.6 6.8 7.1 6.9 7.0
Electricity Generation in GWhe 42133 41219 40639 40748 42628 46922 50557 55160 60424 -0.4 0.5 1.7 1.8Nuclear 14662 17258 18175 16906 12737 15905 15781 22779 26917 2.2 -3.5 2.2 5.5Hydro & wind 1878 1751 2673 3326 4020 4275 4444 4686 5137 3.6 4.2 1.0 1.5Thermal (incl. biomass) 25593 22210 19791 20517 25871 26741 30332 27695 28370 -2.5 2.7 1.6 -0.7
Fuel Inputs for Thermal Power Generation (1) 10103 9151 6192 6382 6900 6980 7431 6130 5994 -4.8 1.1 0.7 -2.1Solids 6800 6725 5245 5356 5782 5391 5911 4923 4838 -2.6 1.0 0.2 -2.0Oil (including refinery gas) 951 613 160 344 191 61 61 61 61 -16.3 1.8 -10.7 0.0Gas 2352 1813 783 662 784 1311 1110 825 809 -10.4 0.0 3.5 -3.1Biomass & Waste 0 0 3 20 144 217 349 321 286 45.9 9.2 -1.9Geothermal heat 0 0 0 0 0 0 0 0 0Hydrogen - Methanol 0 0 0 0 0 0 0 0 0
Fuel Input in other transformation proc. 13079 11644 7584 7709 8408 9313 10182 10853 11602 -5.3 1.0 1.9 1.3Refineries 8341 8023 5406 6188 7024 7987 8947 9564 10398 -4.2 2.7 2.4 1.5Biofuels and hydrogen production 0 0 0 3 31 62 87 159 266 10.7 11.9District heating 2779 1544 296 146 123 155 98 216 111 -20.1 -8.4 -2.2 1.2Others 1960 2078 1882 1372 1229 1109 1050 914 827 -0.4 -4.2 -1.6 -2.4
Energy Branch Consumption 1106 1101 1122 1229 1318 1467 1585 1542 1610 0.1 1.6 1.9 0.2Non-Energy Uses 1427 1236 1179 888 750 820 904 1003 1080 -1.9 -4.4 1.9 1.8Final Energy Demand 16041 11402 8519 9518 10890 12883 14773 16368 18154 -6.1 2.5 3.1 2.1by sectorIndustry(1) 8966 6032 3580 3609 3926 4618 5298 6008 6760 -8.8 0.9 3.0 2.5 - energy intensive industries 5579 4837 2767 2755 2910 3337 3746 4141 4527 -6.8 0.5 2.6 1.9 - other industrial sectors 3387 1195 813 854 1016 1280 1552 1867 2232 -13.3 2.3 4.3 3.7Residential 2228 2257 2165 2189 2369 2707 3014 3246 3471 -0.3 0.9 2.4 1.4Tertiary 2372 1137 957 994 1187 1423 1633 1819 2032 -8.7 2.2 3.2 2.2Transport 2476 1976 1817 2725 3407 4135 4828 5296 5892 -3.0 6.5 3.5 2.0by fuel (1)
Solids 1477 1280 860 902 862 844 945 1199 1227 -5.3 0.0 0.9 2.6Oil 4923 2893 2980 3710 4518 5426 6197 6685 7314 -4.9 4.2 3.2 1.7Gas 2066 1787 1137 1136 1289 1756 2139 2520 2981 -5.8 1.3 5.2 3.4Electricity 3033 2467 2075 2136 2382 2795 3192 3629 4087 -3.7 1.4 3.0 2.5Heat (from CHP and District Heating) 4543 2798 912 993 1063 1189 1383 1363 1414 -14.8 1.5 2.7 0.2Other 0 178 555 642 776 873 916 973 1132 3.4 1.7 2.1
CO2 Emissions (Mt of CO2) 72.3 58.0 41.5 44.2 48.4 51.7 56.8 55.1 57.2 -5.4 1.6 1.6 0.1Power generation/District heating 44.8 38.1 24.6 25.1 26.6 25.9 27.4 23.1 22.3 -5.8 0.8 0.3 -2.0Energy Branch 1.6 1.4 1.2 1.3 1.5 1.7 1.8 1.0 1.0 -2.5 2.1 1.5 -5.6Industry 11.2 9.3 8.0 7.6 8.1 9.3 10.5 12.2 13.3 -3.3 0.1 2.6 2.4Residential 3.0 2.2 1.2 1.1 1.1 1.3 1.6 1.8 2.2 -8.9 -1.1 4.0 3.3Tertiary 4.7 1.4 1.2 1.1 1.4 1.6 1.8 1.9 2.0 -13.0 1.5 2.8 1.3Transport 6.9 5.6 5.2 7.9 9.8 11.9 13.8 15.0 16.5 -2.8 6.5 3.5 1.8
CO2 Emissions Index (1990=100) 100.0 80.2 57.3 61.1 66.9 71.5 78.5 76.1 79.1
Source: PRIMES
136

BULGARIA: Baseline scenario SUMMARY ENERGY BALANCE AND INDICATORS (B)1990 1995 2000 2005 2010 2015 2020 2025 2030 '90-'00 '00-'10 '10-'20 '20-'30
Annual % ChangeMain Energy System IndicatorsPopulation (Million) 8.718 8.406 8.170 7.759 7.439 7.130 6.796 6.465 6.175 -0.6 -0.9 -0.9 -1.0GDP (in 000 MEUR'00) 16.3 14.3 13.7 17.5 23.4 31.0 39.8 49.8 61.1 -1.7 5.5 5.5 4.4Gross Inl. Cons./GDP (toe/MEUR'00) 1717.5 1633.8 1335.0 1075.2 819.6 701.5 592.2 506.5 449.3 -2.5 -4.8 -3.2 -2.7Gross Inl. Cons./Capita (toe/inhabitant) 3.21 2.77 2.24 2.42 2.57 3.05 3.47 3.90 4.45 -3.5 1.4 3.0 2.5Electricity Generated/Capita (kWh/inhabitant) 4833 4903 4974 5252 5730 6581 7439 8532 9786 0.3 1.4 2.6 2.8Carbon intensity (t of CO2/toe of GIC) 2.59 2.49 2.27 2.35 2.53 2.38 2.41 2.18 2.08 -1.3 1.1 -0.5 -1.4CO2 Emissions/Capita (t of CO2/inhabitant) 8.29 6.90 5.07 5.69 6.51 7.25 8.35 8.52 9.27 -4.8 2.5 2.5 1.0CO2 Emissions to GDP (t of CO2/MEUR'00) 4441.8 4065.2 3025.2 2526.1 2073.0 1666.8 1426.2 1106.3 936.6 -3.8 -3.7 -3.7 -4.1Import Dependency % 63.6 57.2 45.8 47.4 52.1 52.5 56.9 55.6 55.2 0.0 0.0 0.0 0.0
Energy intensity indicators (1990=100)Industry (Energy on Value added) 100.0 91.0 70.6 54.3 43.8 37.4 32.4 28.5 25.4 -3.4 -4.7 -3.0 -2.4Residential (Energy on Private Income) 100.0 113.9 108.2 84.1 69.6 61.2 54.0 47.2 41.6 0.8 -4.3 -2.5 -2.6Tertiary (Energy on Value added) 100.0 65.3 61.6 50.6 45.3 41.5 37.7 34.0 31.3 -4.7 -3.0 -1.8 -1.8Transport (Energy on GDP) 100.0 91.1 87.2 102.5 95.9 87.7 79.8 70.0 63.4 -1.4 1.0 -1.8 -2.3
Carbon Intensity indicatorsElectricity and Steam production (t of CO2/MWh) 0.46 0.51 0.45 0.45 0.45 0.40 0.38 0.29 0.26 -0.3 0.1 -1.7 -3.9Final energy demand (t of CO2/toe) 1.61 1.62 1.83 1.87 1.87 1.87 1.87 1.89 1.87 1.3 0.2 0.0 0.0
Industry 1.25 1.55 2.25 2.12 2.07 2.01 1.98 2.03 1.96 6.0 -0.8 -0.5 -0.1Residential 1.35 0.97 0.55 0.52 0.45 0.47 0.52 0.56 0.62 -8.7 -2.0 1.5 1.8Tertiary 1.99 1.21 1.23 1.12 1.15 1.15 1.10 1.05 1.00 -4.7 -0.7 -0.5 -0.9Transport 2.80 2.84 2.87 2.89 2.88 2.87 2.86 2.84 2.80 0.2 0.0 0.0 -0.2
Electricity and steam generationGeneration Capacity in MWe 12723 11772 12168 11065 11646 13243 15041 -0.4 -0.4 2.6
Nuclear 3760 2880 2000 2432 2432 3182 3530 -6.1 2.0 3.8Hydro (pumping excluded) 1998 1998 2173 2198 2213 2268 2418 0.8 0.2 0.9Wind 0 4 373 492 565 621 667 4.2 1.7Solar 0 0 2 4 8 15 27 17.5 13.5Thermal 6965 6890 7620 5938 6428 7157 8399 0.9 -1.7 2.7
of which cogeneration units 1588 1701 3068 2466 3413 4149 4688 6.8 1.1 3.2Solids fired 5453 5361 5334 4203 4829 4556 4606 -0.2 -1.0 -0.5Gas fired 511 511 1283 1283 1180 1670 2818 9.6 -0.8 9.1Oil fired 780 780 696 86 63 63 63 -1.1 -21.3 0.0Biomass-waste fired 221 238 307 365 356 868 912 3.3 1.5 9.9Fuel Cells 0 0 0 0 0 0 0Geothermal heat 0 0 0 0 0 0 0
IndicatorsEfficiency for thermal electricity production (%) 27.5 27.6 32.2 32.9 35.1 38.9 40.7 0.0 0.0 0.0 0.0Load factor for gross electric capacities (%) 36.5 39.5 40.0 48.4 49.6 47.5 45.9 0.0 0.0 0.0 0.0CHP indicator (% of electricity from CHP) 14.9 15.7 26.2 24.1 31.7 35.1 36.7 0.0 0.0 0.0 0.0Non fossil fuels in electricity generation (%) 51.3 49.8 40.6 44.8 42.5 51.9 54.7 0.0 0.0 0.0 0.0 - nuclear 44.7 41.5 29.9 33.9 31.2 41.3 44.5 0.0 0.0 0.0 0.0 - renewable energy forms 6.6 8.3 10.7 10.9 11.3 10.6 10.2 0.0 0.0 0.0 0.0
Transport sectorPassenger transport activity (Gpkm) 40.6 24.0 34.6 40.5 47.1 54.8 62.7 70.4 76.9 -1.6 3.1 2.9 2.1
Public road transport 26.0 11.6 14.6 12.9 11.3 10.0 9.1 8.4 7.9 -5.6 -2.5 -2.1 -1.4Private cars and motorcycles 5.6 6.6 15.7 23.4 30.4 37.8 45.1 52.2 57.9 10.9 6.8 4.0 2.5Rail 7.8 4.7 3.5 2.7 3.0 3.4 3.9 4.5 4.9 -7.8 -1.5 2.7 2.4Aviation 1.1 1.0 0.8 1.6 2.4 3.5 4.5 5.3 6.1 -2.7 11.1 6.6 3.1Inland navigation 0.2 0.2 0.0 0.0 0.0 0.0 0.0 0.0 0.0 -20.9 2.6 2.2 1.6
Travel per person (km per capita) 4654 2857 4231 5215 6327 7680 9221 10895 12450 -0.9 4.1 3.8 3.0
Freight transport activity (Gtkm) 27.8 18.9 12.3 18.2 23.7 30.3 37.2 44.2 51.6 -7.9 6.8 4.6 3.3Trucks 12.0 9.7 6.4 12.3 17.3 23.1 29.1 35.1 41.4 -6.1 10.4 5.4 3.6Rail 14.1 8.6 5.5 5.3 5.4 5.9 6.4 7.0 7.8 -8.9 -0.3 1.7 1.9Inland navigation 1.6 0.5 0.3 0.7 1.0 1.3 1.6 2.0 2.4 -15.1 12.3 5.0 4.2
Freight activity per unit of GDP (tkm/000 Euro'00) 1705 1322 894 1044 1013 976 934 887 844 -6.3 1.3 -0.8 -1.0
Energy demand in transport (ktoe) 2476 1976 1817 2725 3407 4135 4828 5296 5892 -3.0 6.5 3.5 2.0Public road transport 473 251 377 332 292 257 227 202 183 -2.2 -2.5 -2.5 -2.1Private cars and motorcycles 228 298 653 983 1152 1289 1511 1700 1850 11.1 5.8 2.8 2.0Trucks 1257 999 608 1164 1641 2180 2619 2987 3444 -7.0 10.4 4.8 2.8Rail 216 144 77 63 58 52 50 50 52 -9.8 -2.8 -1.6 0.3Aviation 284 278 101 182 261 353 417 352 356 -9.8 10.0 4.8 -1.6Inland navigation 18 6 1 2 3 4 4 5 7 -25.5 11.5 4.6 3.9
Efficiency indicator (activity related)Passenger transport (toe/Mpkm) 27.8 38.2 34.3 38.0 37.0 35.3 34.8 32.4 31.5 2.1 0.8 -0.6 -1.0Freight transport (toe/Mtkm) 48.6 56.2 51.7 65.1 70.4 72.8 71.2 68.3 67.4 0.6 3.1 0.1 -0.5
137

ROMANIA: Baseline scenario SUMMARY ENERGY BALANCE AND INDICATORS (A) ktoe 1990 1995 2000 2005 2010 2015 2020 2025 2030 '90-'00 '00-'10 '10-'20 '20-'30
Annual % ChangePrimary Production 41398 30900 28707 30408 32543 33914 34331 34517 35144 -3.6 1.3 0.5 0.2
Solids 7935 7886 5875 6832 6957 7065 7635 7840 7954 -3.0 1.7 0.9 0.4Oil 7946 6965 6338 6249 6205 6183 6172 6167 6164 -2.2 -0.2 -0.1 0.0Natural gas 22911 12999 10968 11190 12490 11706 11008 10383 9822 -7.1 1.3 -1.3 -1.1Nuclear 0 0 1407 1460 1475 2949 2982 2977 3555 0.5 7.3 1.8Renewable energy sources 2606 3049 4118 4677 5417 6011 6534 7150 7649 4.7 2.8 1.9 1.6
Hydro 1460 1435 1271 1420 1538 1651 1860 2083 2172 -1.4 1.9 1.9 1.6Biomass & Waste 1146 1614 2840 3240 3835 4180 4412 4734 5103 9.5 3.0 1.4 1.5Wind 0 0 0 1 4 80 92 98 109 35.3 1.7Solar and others 0 0 0 2 8 28 61 102 131 22.6 7.9Geothermal 0 0 7 14 32 72 108 132 136 16.9 12.9 2.3
Net Imports 20352 14084 8099 11358 14235 20510 26609 29027 34509 -8.8 5.8 6.5 2.6Solids 2442 2870 1904 2642 2903 3242 6048 7744 8620 -2.5 4.3 7.6 3.6Oil 11167 6799 3543 5199 7023 8844 9550 10040 11754 -10.8 7.1 3.1 2.1 - Crude oil and Feedstocks 16092 8675 4837 6980 9084 11189 12008 12578 14564 -11.3 6.5 2.8 1.9 - Oil products -4925 -1876 -1294 -1781 -2061 -2345 -2458 -2537 -2810Natural gas 5928 4390 2712 3600 4384 8493 11073 11300 14186 -7.5 4.9 9.7 2.5Electricity 815 26 -60 -82 -75 -69 -62 -57 -51
Gross Inland Consumption 61319 44951 36996 41766 46779 54425 60939 63544 69654 -4.9 2.4 2.7 1.3Solids 10145 10793 7752 9474 9860 10307 13683 15584 16575 -2.7 2.4 3.3 1.9Oil 18914 13694 10099 11448 13227 15027 15722 16207 17918 -6.1 2.7 1.7 1.3Natural gas 28838 17389 13680 14790 16874 20200 22081 21683 24008 -7.2 2.1 2.7 0.8Nuclear 0 0 1407 1460 1475 2949 2982 2977 3555 0.5 7.3 1.8Electricity 815 26 -60 -82 -75 -69 -62 -57 -51Renewable energy forms 2606 3049 4118 4677 5417 6011 6534 7150 7649 4.7 2.8 1.9 1.6
as % in Gross Inland ConsumptionSolids 16.5 24.0 21.0 22.7 21.1 18.9 22.5 24.5 23.8Oil 30.8 30.5 27.3 27.4 28.3 27.6 25.8 25.5 25.7Natural gas 47.0 38.7 37.0 35.4 36.1 37.1 36.2 34.1 34.5Nuclear 0.0 0.0 3.8 3.5 3.2 5.4 4.9 4.7 5.1Renewable energy forms 4.3 6.8 11.1 11.2 11.6 11.0 10.7 11.3 11.0
Electricity Generation in GWhe 63398 59255 51925 62487 76353 91839 107376 122719 137394 -2.0 3.9 3.5 2.5Nuclear 0 0 5455 5659 5715 11431 11558 11540 13779 0.5 7.3 1.8Hydro & wind 16977 16690 14775 16525 17938 20136 22708 25398 26569 -1.4 2.0 2.4 1.6Thermal (incl. biomass) 46421 42565 31694 40303 52700 60272 73110 85780 97046 -3.7 5.2 3.3 2.9
Fuel Inputs for Thermal Power Generation (1) 19297 15876 10574 11947 13287 14706 17811 17923 19166 -5.8 2.3 3.0 0.7Solids 8166 7352 5401 7043 7361 7780 11135 12947 14088 -4.0 3.1 4.2 2.4Oil (including refinery gas) 6202 2997 1661 1469 1955 1822 866 330 279 -12.3 1.6 -7.8 -10.7Gas 4893 5491 3507 3325 3686 4756 5383 4131 4246 -3.3 0.5 3.9 -2.3Biomass & Waste 36 37 4 111 285 348 427 515 553 -19.0 51.9 4.1 2.6Geothermal heat 0 0 0 0 0 0 0 0 0Hydrogen - Methanol 0 0 0 0 0 0 0 0 0
Fuel Input in other transformation proc. 29303 21301 14547 15568 17686 19786 20682 21344 23471 -6.8 2.0 1.6 1.3Refineries 23112 15539 11268 13229 15289 17372 18180 18744 20728 -6.9 3.1 1.7 1.3Biofuels and hydrogen production 0 0 0 6 79 162 233 420 729 11.4 12.1District heating 4644 1738 1735 83 63 0 0 0 0 -9.4 -28.2 -55.1 1.8Others 1547 4024 1544 2250 2255 2252 2269 2179 2014 0.0 3.9 0.1 -1.2
Energy Branch Consumption 4289 4007 4335 5445 5770 6259 6603 6833 7322 0.1 2.9 1.4 1.0Non-Energy Uses 2940 1630 2058 1650 1788 1927 2061 2188 2344 -3.5 -1.4 1.4 1.3Final Energy Demand 33251 25187 22436 27072 32264 38280 43911 49064 54657 -3.9 3.7 3.1 2.2by sectorIndustry(1) 21988 13795 9012 11306 13724 16378 18820 21195 23611 -8.5 4.3 3.2 2.3 - energy intensive industries 17446 9866 6368 8067 9533 11112 12633 14155 15872 -9.6 4.1 2.9 2.3 - other industrial sectors 4542 3929 2644 3239 4192 5266 6188 7040 7739 -5.3 4.7 4.0 2.3Residential 4160 6127 8390 8505 9545 10778 11695 12347 12903 7.3 1.3 2.1 1.0Tertiary 2686 2058 1612 1817 2226 2723 3256 3786 4354 -5.0 3.3 3.9 2.9Transport 4417 3207 3421 5444 6768 8401 10140 11737 13789 -2.5 7.1 4.1 3.1by fuel (1)
Solids 2673 1528 698 1231 1256 1235 1245 1339 1240 -12.6 6.1 -0.1 0.0Oil 8098 5379 5603 8155 9609 11457 13191 14331 15976 -3.6 5.5 3.2 1.9Gas 17328 9029 6867 8351 10259 12540 14535 16400 18500 -8.8 4.1 3.5 2.4Electricity 4314 3126 2916 3724 4894 6182 7372 8589 9763 -3.8 5.3 4.2 2.8Heat (from CHP and District Heating) 0 4679 3570 2479 2683 2966 3454 4028 4494 -2.8 2.6 2.7Other 839 1446 2782 3133 3563 3900 4114 4377 4685 12.7 2.5 1.4 1.3
CO2 Emissions (Mt of CO2) 161.4 109.6 84.6 101.1 112.5 126.9 146.3 154.1 168.2 -6.3 2.9 2.7 1.4Power generation/District heating 76.1 57.4 40.3 42.0 45.7 49.3 61.0 63.5 68.2 -6.2 1.3 2.9 1.1Energy Branch 8.0 7.5 7.9 9.4 8.3 8.3 6.1 3.2 3.3 -0.1 0.5 -3.1 -5.9Industry 50.9 28.6 18.3 23.5 26.5 30.4 33.2 35.5 38.4 -9.7 3.8 2.3 1.5Residential 7.5 4.8 6.5 8.2 10.1 11.9 13.3 14.2 14.6 -1.4 4.5 2.8 1.0Tertiary 6.7 2.4 1.9 2.1 2.4 2.9 3.5 4.2 4.9 -11.8 2.4 3.8 3.3Transport 12.3 8.9 9.7 15.8 19.5 24.1 29.2 33.5 38.8 -2.3 7.2 4.1 2.9
CO2 Emissions Index (1990=100) 100.0 67.9 52.4 62.6 69.7 78.6 90.6 95.5 104.2
Source: PRIMES
138

ROMANIA: Baseline scenario SUMMARY ENERGY BALANCE AND INDICATORS (B)1990 1995 2000 2005 2010 2015 2020 2025 2030 '90-'00 '00-'10 '10-'20 '20-'30
Annual % ChangeMain Energy System IndicatorsPopulation (Million) 23.206 22.681 22.435 21.540 21.345 20.917 20.342 19.746 19.244 -0.3 -0.5 -0.5 -0.6GDP (in 000 MEUR'00) 47.9 43.0 40.3 53.6 74.0 99.6 129.3 163.4 203.1 -1.7 6.3 5.7 4.6Gross Inl. Cons./GDP (toe/MEUR'00) 1279.4 1045.7 917.0 778.5 632.2 546.5 471.3 388.9 343.0 -3.3 -3.7 -2.9 -3.1Gross Inl. Cons./Capita (toe/inhabitant) 2.64 1.98 1.65 1.94 2.19 2.60 3.00 3.22 3.62 -4.6 2.9 3.2 1.9Electricity Generated/Capita (kWh/inhabitant) 2732 2613 2314 2901 3577 4391 5279 6215 7139 -1.6 4.4 4.0 3.1Carbon intensity (t of CO2/toe of GIC) 2.63 2.44 2.29 2.42 2.40 2.33 2.40 2.42 2.41 -1.4 0.5 0.0 0.1CO2 Emissions/Capita (t of CO2/inhabitant) 6.96 4.83 3.77 4.69 5.27 6.07 7.19 7.80 8.74 -5.9 3.4 3.2 2.0CO2 Emissions to GDP (t of CO2/MEUR'00) 3368.0 2549.7 2097.8 1884.1 1520.3 1274.3 1131.4 942.9 828.3 -4.6 -3.2 -2.9 -3.1Import Dependency % 33.2 31.3 21.9 27.2 30.4 37.7 43.7 45.7 49.5 0.0 0.0 0.0 0.0
Energy intensity indicators (1990=100)Industry (Energy on Value added) 100.0 87.6 52.7 50.8 45.7 40.8 36.2 32.3 28.8 -6.2 -1.4 -2.3 -2.3Residential (Energy on Private Income) 100.0 163.1 217.7 153.6 133.0 118.2 104.0 91.0 80.0 8.1 -4.8 -2.4 -2.6Tertiary (Energy on Value added) 100.0 79.3 68.7 59.7 54.3 50.5 47.3 44.2 41.5 -3.7 -2.3 -1.4 -1.3Transport (Energy on GDP) 100.0 81.0 92.0 110.1 99.3 91.6 85.1 77.9 73.7 -0.8 0.8 -1.5 -1.4
Carbon Intensity indicatorsElectricity and Steam production (t of CO2/MWh) 1.20 0.46 0.38 0.42 0.36 0.33 0.33 0.28 0.27 -10.8 -0.6 -1.0 -1.8Final energy demand (t of CO2/toe) 2.33 1.78 1.63 1.83 1.81 1.81 1.80 1.78 1.77 -3.5 1.1 -0.1 -0.2
Industry 2.31 2.08 2.04 2.08 1.93 1.85 1.77 1.67 1.63 -1.3 -0.5 -0.9 -0.8Residential 1.80 0.78 0.77 0.97 1.06 1.10 1.13 1.15 1.13 -8.1 3.2 0.7 0.0Tertiary 2.51 1.18 1.19 1.16 1.09 1.07 1.09 1.11 1.13 -7.2 -0.8 0.0 0.3Transport 2.78 2.78 2.84 2.91 2.88 2.87 2.88 2.85 2.82 0.2 0.1 0.0 -0.2
Electricity and steam generationGeneration Capacity in MWe 22702 23788 26647 27402 29247 40181 44984 1.6 0.9 4.4
Nuclear 700 700 700 1400 1400 1400 1690 0.0 7.2 1.9Hydro (pumping excluded) 6020 6020 6270 6575 7051 7406 7551 0.4 1.2 0.7Wind 1 6 41 668 767 819 905 45.0 34.0 1.7Solar 0 0 2 4 8 23 45 18.0 19.1Thermal 15981 17062 19635 18755 20021 30532 34793 2.1 0.2 5.7
of which cogeneration units 5739 6530 9702 10842 13342 19326 21488 5.4 3.2 4.9Solids fired 9172 9172 8572 8046 10400 14511 15518 -0.7 2.0 4.1Gas fired 3541 4590 7648 8178 7310 13063 16346 8.0 -0.5 8.4Oil fired 3228 3228 3141 2213 1158 629 301 -0.3 -9.5 -12.6Biomass-waste fired 40 72 275 318 1153 2328 2628 21.1 15.4 8.6Fuel Cells 0 0 0 0 0 0 0Geothermal heat 0 0 0 0 0 0 0
IndicatorsEfficiency for thermal electricity production (%) 25.8 29.0 34.1 35.2 35.3 41.2 43.5 0.0 0.0 0.0 0.0Load factor for gross electric capacities (%) 26.1 30.0 32.7 38.3 41.9 34.9 34.9 0.0 0.0 0.0 0.0CHP indicator (% of electricity from CHP) 38.1 36.6 46.9 49.0 53.5 68.1 68.9 0.0 0.0 0.0 0.0Non fossil fuels in electricity generation (%) 39.5 36.1 32.3 35.7 33.3 31.6 30.8 0.0 0.0 0.0 0.0 - nuclear 10.5 9.1 7.5 12.4 10.8 9.4 10.0 0.0 0.0 0.0 0.0 - renewable energy forms 28.9 27.1 24.8 23.2 22.5 22.2 20.8 0.0 0.0 0.0 0.0
Transport sectorPassenger transport activity (Gpkm) 88.0 60.6 67.6 78.5 99.5 128.2 157.7 188.1 217.8 -2.6 3.9 4.7 3.3
Public road transport 24.0 12.3 7.7 9.5 10.6 12.5 14.6 17.0 19.4 -10.7 3.3 3.3 2.9Private cars and motorcycles 32.3 28.4 47.6 59.8 79.4 104.0 128.0 150.5 171.3 4.0 5.3 4.9 3.0Rail 30.6 18.9 11.6 8.6 8.3 9.6 11.3 13.3 15.3 -9.2 -3.3 3.1 3.1Aviation 1.1 0.9 0.7 0.7 1.1 2.0 3.8 7.2 11.8 -5.1 5.5 13.0 12.0Inland navigation 0.0 0.0 0.0 0.0 0.0 0.0 0.0 0.0 0.0 -4.5 -0.6 2.7 1.9
Travel per person (km per capita) 3791 2672 3013 3647 4663 6129 7754 9523 11320 -2.3 4.5 5.2 3.9
Freight transport activity (Gtkm) 79.9 47.0 33.3 61.8 79.0 96.2 116.0 137.7 162.2 -8.4 9.0 3.9 3.4Trucks 29.0 19.7 14.3 37.5 50.6 66.8 84.5 103.7 125.6 -6.8 13.5 5.3 4.0Rail 48.8 24.2 16.4 17.2 18.8 18.2 18.5 19.1 19.6 -10.3 1.4 -0.1 0.6Inland navigation 2.1 3.1 2.6 7.1 9.6 11.2 12.9 14.9 17.1 2.3 13.8 3.0 2.8
Freight activity per unit of GDP (tkm/000 Euro'00) 1667 1094 826 1152 1067 966 897 843 799 -6.8 2.6 -1.7 -1.2
Energy demand in transport (ktoe) 4417 3207 3421 5444 6768 8401 10140 11737 13789 -2.5 7.1 4.1 3.1Public road transport 371 181 119 143 160 184 204 222 240 -10.8 3.0 2.5 1.6Private cars and motorcycles 1148 1029 1717 2153 2606 3071 3676 4153 4602 4.1 4.3 3.5 2.3Trucks 2070 1284 892 2344 3159 4158 5011 5759 6851 -8.1 13.5 4.7 3.2Rail 282 471 449 361 247 230 223 223 233 4.8 -5.8 -1.0 0.4Aviation 233 191 133 143 192 297 498 778 1178 -5.5 3.7 10.0 9.0Inland navigation 312 52 112 300 404 462 527 601 685 -9.8 13.7 2.7 2.7
Efficiency indicator (activity related)Passenger transport (toe/Mpkm) 22.3 28.9 34.1 34.2 31.0 28.7 28.6 28.1 28.3 4.3 -0.9 -0.8 -0.1Freight transport (toe/Mtkm) 30.8 31.0 33.6 44.6 46.6 49.1 48.6 46.9 47.0 0.9 3.3 0.4 -0.3
139

TURKEY: Baseline scenario SUMMARY ENERGY BALANCE AND INDICATORS (A) ktoe 1990 1995 2000 2005 2010 2015 2020 2025 2030 '90-'00 '00-'10 '10-'20 '20-'30
Annual % ChangePrimary Production 33159 33312 26710 24483 26112 29116 34674 42158 46075 -2.1 -0.2 2.9 2.9
Solids 12410 12083 13293 10334 10534 11144 13653 14465 14888 0.7 -2.3 2.6 0.9Oil 3710 3515 2746 3002 3244 3335 3382 3541 3739 -3.0 1.7 0.4 1.0Natural gas 175 150 526 783 1075 1272 1355 1398 1421 11.7 7.4 2.3 0.5Nuclear 0 0 0 0 0 0 0 3071 3468Renewable energy sources 16865 17565 10144 10363 11259 13364 16284 19682 22559 -5.0 1.0 3.8 3.3
Hydro 1990 3056 2655 3077 3148 3190 3529 3958 4150 2.9 1.7 1.1 1.6Biomass & Waste 14413 13855 6541 5896 6014 6632 7439 7859 8846 -7.6 -0.8 2.1 1.7Wind 0 0 3 3 155 685 740 1247 1300 49.2 16.9 5.8Solar and others 28 143 262 437 794 1598 3176 5039 6619 25.1 11.7 14.9 7.6Geothermal 433 511 684 951 1149 1260 1400 1578 1644 4.7 5.3 2.0 1.6
Net Imports 27266 36758 50873 58591 70590 87587 107401 127253 153473 6.4 3.3 4.3 3.6Solids 4208 4476 9248 12361 12681 14477 15833 17716 21119 8.2 3.2 2.2 2.9Oil 20439 26677 29285 28255 32985 41805 51819 61971 71922 3.7 1.2 4.6 3.3 - Crude oil and Feedstocks 20051 24685 21458 26246 30657 38904 48271 57761 67059 0.7 3.6 4.6 3.3 - Oil products 388 1992 7827 2009 2329 2901 3548 4211 4863 35.0 -11.4 4.3 3.2Natural gas 2682 5665 12051 18394 25240 31496 39982 47843 60742 16.2 7.7 4.7 4.3Electricity -63 -60 288 -420 -316 -191 -232 -278 -311
Gross Inland Consumption 59487 68816 77354 82635 96202 116135 141435 168704 198769 2.7 2.2 3.9 3.5Solids 16922 16616 23278 22695 23215 25620 29486 32182 36008 3.2 0.0 2.4 2.0Oil 22909 28908 31005 30819 35730 44572 54560 64806 74883 3.1 1.4 4.3 3.2Natural gas 2855 5787 12639 19178 26314 32768 41336 49241 62163 16.0 7.6 4.6 4.2Nuclear 0 0 0 0 0 0 0 3071 3468Electricity -63 -60 288 -420 -316 -191 -232 -278 -311Renewable energy forms 16865 17565 10144 10363 11259 13364 16284 19682 22559 -5.0 1.0 3.8 3.3
as % in Gross Inland ConsumptionSolids 28.4 24.1 30.1 27.5 24.1 22.1 20.8 19.1 18.1Oil 38.5 42.0 40.1 37.3 37.1 38.4 38.6 38.4 37.7Natural gas 4.8 8.4 16.3 23.2 27.4 28.2 29.2 29.2 31.3Nuclear 0.0 0.0 0.0 0.0 0.0 0.0 0.0 1.8 1.7Renewable energy forms 28.3 25.5 13.1 12.5 11.7 11.5 11.5 11.7 11.3
Electricity Generation in GWhe 57533 86231 124900 150306 172936 210112 258814 324472 399480 8.1 3.3 4.1 4.4Nuclear 0 0 0 0 0 0 0 11907 13444Hydro & wind 23144 35535 30906 35813 38400 45067 49678 60617 63553 2.9 2.2 2.6 2.5Thermal (incl. biomass) 34389 50697 93993 114494 134536 165045 209136 251948 322483 10.6 3.7 4.5 4.4
Fuel Inputs for Thermal Power Generation (1) 8886 12658 21625 23736 27730 32648 39519 44680 53702 9.3 2.5 3.6 3.1Solids 5139 7173 9963 9086 10130 13870 19078 23385 27769 6.8 0.2 6.5 3.8Oil (including refinery gas) 1187 1792 2933 2140 1943 1534 1096 980 909 9.5 -4.0 -5.6 -1.9Gas 2492 3341 8579 12341 14966 16237 17975 18527 23095 13.2 5.7 1.8 2.5Biomass & Waste 0 278 85 104 498 814 1177 1502 1642 19.3 9.0 3.4Geothermal heat 69 74 65 65 193 193 193 287 287 -0.5 11.5 0.0 4.0Hydrogen - Methanol 0 0 0 0 0 0 0 0 0
Fuel Input in other transformation proc. 27576 31335 27764 32842 37260 45416 54941 64698 74503 0.1 3.0 4.0 3.1Refineries 23014 27349 23819 29248 33901 42239 51653 61302 70798 0.3 3.6 4.3 3.2Biofuels and hydrogen production 0 0 0 14 90 184 274 537 925 11.8 12.9District heating 0 0 0 9 37 80 126 185 218 13.1 5.6Others 4562 3986 3945 3570 3233 2914 2888 2674 2561 -1.4 -2.0 -1.1 -1.2
Energy Branch Consumption 1969 2461 2704 2764 2979 3410 3959 4497 5024 3.2 1.0 2.9 2.4Non-Energy Uses 2768 3751 3505 3286 3391 3730 3986 4238 4539 2.4 -0.3 1.6 1.3Final Energy Demand 38680 44787 54627 61585 73900 91530 114094 138695 165257 3.5 3.1 4.4 3.8by sectorIndustry(1) 12179 13363 20668 23534 27176 33053 40792 50463 61893 5.4 2.8 4.1 4.3 - energy intensive industries 5836 6125 7464 7747 8310 9224 10434 11762 13398 2.5 1.1 2.3 2.5 - other industrial sectors 6343 7239 13205 15786 18866 23829 30357 38701 48495 7.6 3.6 4.9 4.8Residential 14556 15784 16996 17103 19438 23040 28360 33886 40042 1.6 1.4 3.8 3.5Tertiary 2595 3751 4795 6256 8706 11118 13827 16163 17809 6.3 6.1 4.7 2.6Transport 9351 11889 12167 14692 18579 24319 31116 38184 45513 2.7 4.3 5.3 3.9by fuel (1)
Solids 8040 6670 10483 11820 11446 10250 8956 7478 6993 2.7 0.9 -2.4 -2.4Oil 17788 22303 22812 24738 30148 39204 49565 59735 69726 2.5 2.8 5.1 3.5Gas 1156 2635 4600 7646 11991 17109 23909 31040 39141 14.8 10.1 7.1 5.1Electricity 3865 5600 8244 9757 12282 15427 19565 24549 30346 7.9 4.1 4.8 4.5Heat (from CHP and District Heating) 240 247 1249 512 784 1091 1501 3287 4016 17.9 -4.5 6.7 10.3Other 7591 7331 7239 7113 7247 8449 10600 12607 15034 -0.5 0.0 3.9 3.6
CO2 Emissions (Mt of CO2) 126.4 150.7 198.7 215.9 249.1 299.1 363.0 421.4 495.5 4.6 2.3 3.8 3.2Power generation/District heating 31.5 43.7 71.2 73.5 83.3 100.1 124.1 142.4 170.3 8.5 1.6 4.1 3.2Energy Branch 4.7 5.8 5.9 2.9 1.8 1.3 0.5 0.5 0.5 2.4 -11.0 -11.7 -1.3Industry 35.2 35.6 56.0 66.0 72.6 83.3 96.6 110.0 130.5 4.8 2.6 2.9 3.0Residential 21.4 22.5 21.9 20.9 25.5 30.9 38.4 46.4 53.6 0.2 1.5 4.2 3.4Tertiary 5.8 7.7 8.1 9.7 11.9 13.3 14.0 13.2 11.6 3.4 4.0 1.6 -1.9Transport 27.9 35.4 35.6 42.9 53.9 70.2 89.4 108.9 129.0 2.5 4.2 5.2 3.7
CO2 Emissions Index (1990=100) 100.0 119.2 157.1 170.7 197.0 236.5 287.1 333.3 391.9
Source: PRIMES
140

TURKEY: Baseline scenario SUMMARY ENERGY BALANCE AND INDICATORS (B)1990 1995 2000 2005 2010 2015 2020 2025 2030 '90-'00 '00-'10 '10-'20 '20-'30
Annual % ChangeMain Energy System IndicatorsPopulation (Million) 56.201 61.644 67.461 72.966 77.154 81.659 85.744 89.490 92.761 1.8 1.4 1.1 0.8GDP (in 000 MEUR'00) 152.5 178.6 216.7 258.8 326.4 434.6 583.3 786.2 1059.1 3.6 4.2 6.0 6.1Gross Inl. Cons./GDP (toe/MEUR'00) 390.1 385.3 356.9 319.2 294.8 267.2 242.5 214.6 187.7 -0.9 -1.9 -1.9 -2.5Gross Inl. Cons./Capita (toe/inhabitant) 1.06 1.12 1.15 1.13 1.25 1.42 1.65 1.89 2.14 0.8 0.8 2.8 2.7Electricity Generated/Capita (kWh/inhabitant) 1024 1399 1851 2060 2241 2573 3018 3626 4307 6.1 1.9 3.0 3.6Carbon intensity (t of CO2/toe of GIC) 2.13 2.19 2.57 2.61 2.59 2.58 2.57 2.50 2.49 1.9 0.1 -0.1 -0.3CO2 Emissions/Capita (t of CO2/inhabitant) 2.25 2.44 2.95 2.96 3.23 3.66 4.23 4.71 5.34 2.7 0.9 2.7 2.4CO2 Emissions to GDP (t of CO2/MEUR'00) 829.2 843.8 916.7 834.0 763.2 688.2 622.4 536.0 467.8 1.0 -1.8 -2.0 -2.8Import Dependency % 45.7 53.3 65.4 70.5 73.0 75.1 75.6 75.1 76.9 0.0 0.0 0.0 0.0
Energy intensity indicators (1990=100)Industry (Energy on Value added) 100.0 87.3 111.3 99.2 88.9 80.2 72.4 65.3 58.7 1.1 -2.2 -2.0 -2.1Residential (Energy on Private Income) 100.0 95.0 83.6 71.9 67.4 61.2 57.0 51.1 45.2 -1.8 -2.1 -1.7 -2.3Tertiary (Energy on Value added) 100.0 126.4 131.6 146.1 160.6 153.9 143.3 125.1 102.8 2.8 2.0 -1.1 -3.3Transport (Energy on GDP) 100.0 108.6 91.6 92.6 92.8 91.3 87.0 79.2 70.1 -0.9 0.1 -0.6 -2.1
Carbon Intensity indicatorsElectricity and Steam production (t of CO2/MWh) 0.52 0.49 0.51 0.44 0.42 0.41 0.41 0.36 0.35 -0.2 -1.9 -0.3 -1.4Final energy demand (t of CO2/toe) 2.33 2.26 2.22 2.27 2.22 2.16 2.09 2.01 1.96 -0.5 0.0 -0.6 -0.6
Industry 2.89 2.67 2.71 2.81 2.67 2.52 2.37 2.18 2.11 -0.6 -0.1 -1.2 -1.2Residential 1.47 1.43 1.29 1.22 1.31 1.34 1.35 1.37 1.34 -1.3 0.2 0.3 -0.1Tertiary 2.23 2.05 1.69 1.55 1.37 1.20 1.01 0.82 0.65 -2.8 -2.0 -3.0 -4.3Transport 2.98 2.98 2.93 2.92 2.90 2.89 2.87 2.85 2.83 -0.2 -0.1 -0.1 -0.1
Electricity and steam generationGeneration Capacity in MWe 28285 37692 39500 47341 54611 70752 88808 3.4 3.3 5.0
Nuclear 0 0 0 0 0 1519 1714Hydro (pumping excluded) 11407 11432 11557 11667 12283 13099 13649 0.1 0.6 1.1Wind 20 21 613 3044 3325 7361 7751 40.8 18.4 8.8Solar 0 0 0 8 31 77 148 16.9Thermal 16858 26238 27330 32623 38972 48696 65547 5.0 3.6 5.3
of which cogeneration units 2400 3750 4921 6450 10023 15439 17686 7.4 7.4 5.8Solids fired 7044 10222 10092 11372 12656 18464 26143 3.7 2.3 7.5Gas fired 7213 12648 13239 18053 23100 26592 35119 6.3 5.7 4.3Oil fired 2492 3207 3569 2431 2093 2130 1966 3.7 -5.2 -0.6Biomass-waste fired 91 144 362 698 1055 1417 2226 14.8 11.3 7.8Fuel Cells 0 0 0 0 0 0 0Geothermal heat 18 18 68 68 68 93 93 14.5 0.0 3.2
IndicatorsEfficiency for thermal electricity production (%) 37.4 41.5 41.7 43.5 45.5 48.5 51.6 0.0 0.0 0.0 0.0Load factor for gross electric capacities (%) 50.4 45.5 50.0 50.7 54.1 52.4 51.3 0.0 0.0 0.0 0.0CHP indicator (% of electricity from CHP) 11.0 9.0 11.5 13.3 17.1 22.2 19.1 0.0 0.0 0.0 0.0Non fossil fuels in electricity generation (%) 25.0 24.1 23.2 22.9 21.1 24.4 21.2 0.0 0.0 0.0 0.0 - nuclear 0.0 0.0 0.0 0.0 0.0 3.7 3.4 0.0 0.0 0.0 0.0 - renewable energy forms 25.0 24.1 23.2 22.9 21.1 20.8 17.8 0.0 0.0 0.0 0.0
Transport sectorPassenger transport activity (Gpkm) 111.9 153.9 184.4 224.3 301.2 453.5 642.5 869.5 1069.5 5.1 5.0 7.9 5.2
Public road transport 64.3 85.7 87.4 94.1 101.6 115.7 121.3 121.8 112.2 3.1 1.5 1.8 -0.8Private cars and motorcycles 34.5 52.9 81.0 111.5 174.3 297.1 459.2 658.2 839.8 8.9 8.0 10.2 6.2Rail 6.4 5.8 5.8 6.4 8.6 13.4 20.6 30.2 39.4 -0.9 3.9 9.2 6.7Aviation 2.2 5.5 6.4 7.9 11.5 19.9 31.6 47.1 64.6 11.2 6.1 10.6 7.4Inland navigation 4.5 4.1 3.8 4.3 5.3 7.4 9.9 12.3 13.6 -1.7 3.4 6.4 3.2
Travel per person (km per capita) 1990 2497 2734 3074 3904 5554 7493 9717 11530 3.2 3.6 6.7 4.4
Freight transport activity (Gtkm) 96.8 125.4 175.2 209.4 262.6 330.3 410.2 493.5 585.7 6.1 4.1 4.6 3.6Trucks 84.4 112.5 161.6 194.8 245.3 308.9 383.8 462.3 549.3 6.7 4.3 4.6 3.6Rail 7.9 8.5 9.8 10.3 11.9 14.9 18.5 22.2 26.4 2.1 2.0 4.5 3.6Inland navigation 4.5 4.4 3.8 4.3 5.4 6.6 7.8 9.0 10.1 -1.6 3.4 3.8 2.5
Freight activity per unit of GDP (tkm/000 Euro'00) 635 702 808 809 805 760 703 628 553 2.4 0.0 -1.3 -2.4
Energy demand in transport (ktoe) 9351 11889 12167 14692 18579 24319 31116 38184 45513 2.7 4.3 5.3 3.9Public road transport 949 1284 1244 1339 1438 1606 1623 1557 1376 2.7 1.5 1.2 -1.6Private cars and motorcycles 688 1151 1830 2515 3549 5392 8247 11649 14674 10.3 6.9 8.8 5.9Trucks 6740 7812 7373 8888 11171 13880 16544 19065 22039 0.9 4.2 4.0 2.9Rail 243 276 268 266 269 269 293 357 437 1.0 0.0 0.9 4.1Aviation 480 1150 1261 1466 1885 2820 3964 5027 6408 10.2 4.1 7.7 4.9Inland navigation 250 216 192 218 268 353 444 530 579 -2.6 3.4 5.2 2.7
Efficiency indicator (activity related)Passenger transport (toe/Mpkm) 21.8 25.3 25.1 25.1 23.9 22.5 22.3 21.7 21.6 1.4 -0.5 -0.7 -0.3Freight transport (toe/Mtkm) 71.5 63.8 43.0 43.3 43.3 42.7 41.0 39.2 38.2 -4.9 0.1 -0.6 -0.7
141

NORWAY: Baseline scenario SUMMARY ENERGY BALANCE AND INDICATORS (A) ktoe 1990 1995 2000 2005 2010 2015 2020 2025 2030 '90-'00 '00-'10 '10-'20 '20-'30
Annual % ChangePrimary Production 120053 181635 224497 221524 240769 257053 259830 232011 215853 6.5 0.7 0.8 -1.8
Solids 201 194 425 474 534 407 327 326 303 7.8 2.3 -4.8 -0.8Oil 84248 141609 164957 130247 131537 132194 124319 97348 81836 7.0 -2.2 -0.6 -4.1Natural gas 24148 28258 45817 77800 94995 109988 120153 118848 117926 6.6 7.6 2.4 -0.2Nuclear 0 0 0 0 0 0 0 0 0Renewable energy sources 11456 11574 13297 13003 13703 14465 15031 15489 15788 1.5 0.3 0.9 0.5
Hydro 10437 10434 11945 11467 11697 12291 12643 12873 13006 1.4 -0.2 0.8 0.3Biomass & Waste 1019 1140 1350 1497 1662 1812 1867 1921 1959 2.8 2.1 1.2 0.5Wind 0 1 3 38 341 356 512 680 800 62.5 4.1 4.6Solar and others 0 0 0 2 3 5 9 14 24 11.3 9.7Geothermal 0 0 0 0 0 0 0 0 0
Net Imports -96177 -156762 -197840 -194685 -212231 -227596 -229793 -201778 -185646Solids 668 853 602 532 609 452 366 332 282 -1.0 0.1 -5.0 -2.6Oil -73306 -132245 -154618 -120251 -121433 -122027 -114069 -87129 -71551 - Crude oil and Feedstocks -68375 -127128 -148847 -114431 -115685 -116355 -108417 -81553 -65969 - Oil products -4931 -5117 -5770 -5820 -5748 -5672 -5652 -5575 -5582Natural gas -22172 -24797 -42185 -73987 -90664 -105323 -115413 -114270 -113631Electricity -1368 -573 -1638 -979 -742 -697 -677 -711 -747
Gross Inland Consumption 21568 23684 26061 25930 27492 28292 28758 28839 28710 1.9 0.5 0.5 0.0Solids 860 1015 1079 1006 1142 858 693 658 585 2.3 0.6 -4.9 -1.7Oil 8643 8206 9691 9087 9058 9002 8971 8826 8788 1.2 -0.7 -0.1 -0.2Natural gas 1976 3461 3632 3813 4331 4665 4740 4578 4295 6.3 1.8 0.9 -1.0Nuclear 0 0 0 0 0 0 0 0 0Electricity -1368 -573 -1638 -979 -742 -697 -677 -711 -747Renewable energy forms 11456 11574 13297 13003 13703 14465 15031 15489 15788 1.5 0.3 0.9 0.5
as % in Gross Inland ConsumptionSolids 4.0 4.3 4.1 3.9 4.2 3.0 2.4 2.3 2.0Oil 40.1 34.6 37.2 35.0 32.9 31.8 31.2 30.6 30.6Natural gas 9.2 14.6 13.9 14.7 15.8 16.5 16.5 15.9 15.0Nuclear 0.0 0.0 0.0 0.0 0.0 0.0 0.0 0.0 0.0Renewable energy forms 53.1 48.9 51.0 50.1 49.8 51.1 52.3 53.7 55.0
Electricity Generation in GWhe 121501 122033 139653 136691 142710 148580 154463 159450 162457 1.4 0.2 0.8 0.5Nuclear 0 0 0 0 0 0 0 0 0Hydro & wind 121360 121331 138922 133776 139991 147083 152978 157628 160564 1.4 0.1 0.9 0.5Thermal (incl. biomass) 141 702 731 2915 2719 1497 1485 1822 1892 17.9 14.0 -5.9 2.5
Fuel Inputs for Thermal Power Generation (1) 99 150 260 655 625 510 490 561 577 10.2 9.2 -2.4 1.6Solids 14 21 16 106 195 66 22 0 0 1.1 28.8 -19.7Oil (including refinery gas) 0 0 0 81 74 58 43 34 37 -5.2 -1.6Gas 18 42 35 306 242 0 7 8 8 7.0 21.2 -29.3 0.2Biomass & Waste 67 87 210 162 114 386 418 519 533 12.1 -5.9 13.9 2.5Geothermal heat 0 0 0 0 0 0 0 0 0Hydrogen - Methanol 0 0 0 0 0 0 0 0 0
Fuel Input in other transformation proc. 13660 13295 15562 15132 15407 15652 15882 15903 16067 1.3 -0.1 0.3 0.1Refineries 13572 13191 15440 14913 15073 15166 15291 15245 15343 1.3 -0.2 0.1 0.0Biofuels and hydrogen production 0 0 0 12 69 209 301 365 434 15.9 3.7District heating 55 69 87 180 239 260 266 273 275 4.8 10.6 1.1 0.3Others 33 35 35 26 26 18 23 19 15 0.6 -3.0 -1.1 -4.6
Energy Branch Consumption 3063 4465 3952 3966 4220 4231 4036 3684 3287 2.6 0.7 -0.4 -2.0Non-Energy Uses 1591 1594 1906 1728 1592 1509 1476 1481 1503 1.8 -1.8 -0.8 0.2Final Energy Demand 16087 16854 18076 18974 20483 21459 22205 22687 22942 1.2 1.3 0.8 0.3by sectorIndustry(1) 6097 6143 6977 6780 7002 7279 7530 7739 7734 1.4 0.0 0.7 0.3 - energy intensive industries 4537 4779 5928 5810 5995 6208 6370 6495 6421 2.7 0.1 0.6 0.1 - other industrial sectors 1560 1364 1049 970 1007 1071 1160 1245 1313 -3.9 -0.4 1.4 1.3Residential 3570 3860 3824 3923 4227 4441 4496 4570 4644 0.7 1.0 0.6 0.3Tertiary 2294 2649 2798 3304 3889 4113 4277 4400 4526 2.0 3.3 1.0 0.6Transport 4126 4202 4478 4968 5365 5627 5901 5977 6038 0.8 1.8 1.0 0.2by fuel (1)
Solids 808 964 1007 822 838 701 592 579 516 2.2 -1.8 -3.4 -1.4Oil 5971 5860 6147 6800 7158 7421 7515 7444 7416 0.3 1.5 0.5 -0.1Gas 10 15 192 145 243 525 685 787 852 33.8 2.4 10.9 2.2Electricity 8324 8922 9418 9642 10409 10989 11575 12035 12276 1.2 1.0 1.1 0.6Heat (from CHP and District Heating) 74 105 241 309 410 515 513 557 569 12.5 5.5 2.3 1.0Other 899 987 1072 1256 1425 1308 1325 1285 1312 1.8 2.9 -0.7 -0.1
CO2 Emissions (Mt of CO2) 28.7 32.2 33.0 35.0 37.0 36.8 36.3 35.4 34.3 1.4 1.1 -0.2 -0.6Power generation/District heating 0.1 0.2 0.2 1.7 2.0 1.0 0.8 0.7 0.7 4.5 25.0 -8.7 -0.8Energy Branch 7.2 10.4 9.8 9.3 9.7 9.6 9.1 8.3 7.3 3.1 -0.2 -0.6 -2.1Industry 6.2 6.0 6.8 5.6 5.3 5.5 5.5 5.6 5.5 1.0 -2.5 0.4 0.0Residential 1.4 0.8 0.7 0.7 0.9 0.9 0.8 0.8 0.7 -5.9 1.3 -0.5 -0.9Tertiary 1.7 2.7 2.5 3.3 3.7 3.9 3.5 3.4 3.3 3.9 4.2 -0.6 -0.9Transport 12.0 12.1 12.9 14.4 15.4 15.9 16.6 16.7 16.7 0.7 1.8 0.7 0.1
CO2 Emissions Index (1990=100) 100.0 112.4 115.3 122.2 129.2 128.4 126.8 123.4 119.5
Source: PRIMES
142

NORWAY: Baseline scenario SUMMARY ENERGY BALANCE AND INDICATORS (B)1990 1995 2000 2005 2010 2015 2020 2025 2030 '90-'00 '00-'10 '10-'20 '20-'30
Annual % ChangeMain Energy System IndicatorsPopulation (Million) 4.241 4.358 4.491 4.597 4.710 4.821 4.939 5.059 5.168 0.6 0.5 0.5 0.5GDP (in 000 MEUR'00) 125.6 151.7 181.1 200.7 225.8 254.8 285.0 315.7 343.5 3.7 2.2 2.4 1.9Gross Inl. Cons./GDP (toe/MEUR'00) 171.7 156.1 143.9 129.2 121.8 111.0 100.9 91.4 83.6 -1.7 -1.7 -1.9 -1.9Gross Inl. Cons./Capita (toe/inhabitant) 5.09 5.43 5.80 5.64 5.84 5.87 5.82 5.70 5.56 1.3 0.1 0.0 -0.5Electricity Generated/Capita (kWh/inhabitant) 28649 28002 31096 29735 30299 30822 31274 31521 31435 0.8 -0.3 0.3 0.1Carbon intensity (t of CO2/toe of GIC) 1.33 1.36 1.27 1.35 1.35 1.30 1.26 1.23 1.19 -0.5 0.6 -0.6 -0.6CO2 Emissions/Capita (t of CO2/inhabitant) 6.76 7.39 7.36 7.62 7.86 7.63 7.36 6.99 6.63 0.9 0.7 -0.7 -1.0CO2 Emissions to GDP (t of CO2/MEUR'00) 228.2 212.4 182.5 174.4 164.0 144.4 127.5 112.1 99.7 -2.2 -1.1 -2.5 -2.4Import Dependency % -437.0 -643.0 -736.1 -725.4 -743.7 -772.6 -765.0 -667.4 -614.6 0.0 0.0 0.0 0.0
Energy intensity indicators (1990=100)Industry (Energy on Value added) 100.0 88.5 97.1 93.9 88.7 82.2 75.2 69.0 63.0 -0.3 -0.9 -1.6 -1.8Residential (Energy on Private Income) 100.0 94.3 77.1 67.6 67.0 62.2 56.2 51.4 47.9 -2.6 -1.4 -1.8 -1.6Tertiary (Energy on Value added) 100.0 98.4 84.3 87.0 90.0 83.9 78.0 72.5 68.6 -1.7 0.7 -1.4 -1.3Transport (Energy on GDP) 100.0 84.3 75.3 75.4 72.3 67.3 63.1 57.7 53.5 -2.8 -0.4 -1.4 -1.6
Carbon Intensity indicatorsElectricity and Steam production (t of CO2/MWh) 0.00 0.00 0.00 0.01 0.01 0.01 0.01 0.00 0.00Final energy demand (t of CO2/toe) 1.33 1.28 1.27 1.27 1.24 1.22 1.19 1.16 1.14 -0.4 -0.3 -0.4 -0.4
Industry 1.02 0.97 0.98 0.83 0.76 0.75 0.73 0.72 0.71 -0.4 -2.6 -0.4 -0.3Residential 0.39 0.22 0.20 0.19 0.20 0.20 0.18 0.17 0.16 -6.6 0.3 -1.1 -1.3Tertiary 0.74 1.03 0.89 0.99 0.96 0.95 0.83 0.76 0.72 1.9 0.8 -1.5 -1.4Transport 2.92 2.87 2.89 2.89 2.88 2.83 2.81 2.79 2.76 -0.1 0.0 -0.2 -0.2
Electricity and steam generationGeneration Capacity in MWe 27583 28174 31151 32218 32854 33535 33932 1.2 0.5 0.3
Nuclear 0 0 0 0 0 0 0Hydro (pumping excluded) 26688 27135 28135 29135 29135 29135 29135 0.5 0.3 0.0Wind 77 227 1419 1484 2097 2757 3212 33.8 4.0 4.4Solar 7 14 29 52 68 89 110 15.6 9.1 4.9Thermal 812 799 1570 1548 1554 1554 1476 6.8 -0.1 -0.5
of which cogeneration units 490 477 575 576 595 601 523 1.6 0.3 -1.3Solids fired 156 156 93 47 16 0 0 -5.0 -16.4Gas fired 392 392 1192 1192 1200 1104 1008 11.8 0.1 -1.7Oil fired 69 47 45 44 38 33 33 -4.1 -1.8 -1.2Biomass-waste fired 196 205 240 265 301 416 435 2.0 2.3 3.8Fuel Cells 0 0 0 0 0 0 0Geothermal heat 0 0 0 0 0 0 0
IndicatorsEfficiency for thermal electricity production (%) 24.1 38.3 37.4 25.3 26.1 27.9 28.2 0.0 0.0 0.0 0.0Load factor for gross electric capacities (%) 57.8 55.4 52.3 52.6 53.7 54.3 54.7 0.0 0.0 0.0 0.0CHP indicator (% of electricity from CHP) 0.5 1.0 1.2 1.0 1.0 1.1 1.2 0.0 0.0 0.0 0.0Non fossil fuels in electricity generation (%) 100.0 98.3 98.3 99.7 99.8 99.9 99.9 0.0 0.0 0.0 0.0 - nuclear 0.0 0.0 0.0 0.0 0.0 0.0 0.0 0.0 0.0 0.0 0.0 - renewable energy forms 100.0 98.3 98.3 99.7 99.8 99.9 99.9 0.0 0.0 0.0 0.0
Transport sectorPassenger transport activity (Gpkm) 53.3 55.4 61.1 66.1 72.7 79.0 84.2 88.9 93.0 1.4 1.7 1.5 1.0
Public road transport 3.9 3.8 4.1 4.2 4.3 4.4 4.4 4.4 4.5 0.6 0.4 0.2 0.2Private cars and motorcycles 43.2 44.4 47.9 51.6 56.7 61.9 66.3 70.2 73.5 1.0 1.7 1.6 1.0Rail 2.2 2.5 3.1 3.3 3.6 3.7 3.7 3.7 3.7 3.6 1.4 0.2 0.2Aviation 3.6 4.1 5.2 6.0 7.1 8.0 8.8 9.5 10.1 3.8 3.2 2.1 1.4Inland navigation 0.5 0.6 0.8 0.9 1.0 1.0 1.1 1.2 1.2 4.9 1.8 1.3 1.0
Travel per person (km per capita) 12577 12707 13615 14368 15425 16390 17048 17580 17997 0.8 1.3 1.0 0.5
Freight transport activity (Gtkm) 47.8 47.4 63.1 67.0 72.6 78.7 83.5 87.7 91.8 2.8 1.4 1.4 1.0Trucks 8.2 9.7 15.1 19.0 24.2 29.3 34.7 40.4 45.9 6.3 4.8 3.7 2.8Rail 2.6 2.7 3.0 3.1 3.2 3.4 3.6 3.6 3.7 1.4 0.8 0.9 0.5Inland navigation 37.0 35.0 45.0 45.0 45.2 46.0 45.2 43.6 42.2 2.0 0.0 0.0 -0.7
Freight activity per unit of GDP (tkm/000 Euro'00) 380 312 349 334 322 309 293 278 267 -0.9 -0.8 -0.9 -0.9
Energy demand in transport (ktoe) 4126 4202 4478 4968 5365 5627 5901 5977 6038 0.8 1.8 1.0 0.2Public road transport 64 61 82 82 81 78 73 69 66 2.5 -0.1 -1.0 -1.0Private cars and motorcycles 1747 1817 1786 1920 1919 1864 1908 1899 1844 0.2 0.7 -0.1 -0.3Trucks 779 948 1090 1368 1733 2061 2330 2507 2663 3.4 4.7 3.0 1.3Rail 104 176 150 160 151 131 119 112 109 3.7 0.1 -2.3 -0.8Aviation 505 561 658 722 757 761 756 706 697 2.7 1.4 0.0 -0.8Inland navigation 926 640 711 716 724 734 716 685 658 -2.6 0.2 -0.1 -0.8
Efficiency indicator (activity related)Passenger transport (toe/Mpkm) 46.4 47.4 44.2 44.2 40.6 36.4 34.5 32.0 29.9 -0.5 -0.9 -1.6 -1.4Freight transport (toe/Mtkm) 34.6 33.3 28.1 30.6 33.3 34.9 35.9 35.7 35.5 -2.1 1.7 0.7 -0.1
143

SWITZERLAND: Baseline scenario SUMMARY ENERGY BALANCE AND INDICATORS (A) ktoe 1990 1995 2000 2005 2010 2015 2020 2025 2030 '90-'00 '00-'10 '10-'20 '20-'30
Annual % ChangePrimary Production 9797 11048 11792 12549 13261 13665 14319 14444 14845 1.9 1.2 0.8 0.4
Solids 0 0 0 0 0 0 0 0 0Oil 0 0 0 0 0 0 0 0 0Natural gas 3 0 0 0 0 0 0 0 0Nuclear 6181 6507 6914 6967 7002 7072 7143 6740 6987 1.1 0.1 0.2 -0.2Renewable energy sources 3613 4541 4878 5582 6259 6593 7176 7704 7858 3.0 2.5 1.4 0.9
Hydro 2562 3025 3168 3163 3382 3582 3740 3852 3904 2.1 0.7 1.0 0.4Biomass & Waste 990 1423 1595 2307 2749 2841 3238 3645 3739 4.9 5.6 1.7 1.4Wind 0 0 0 2 14 50 76 84 90 49.3 18.3 1.7Solar and others 0 16 24 24 25 26 28 31 35 0.1 1.3 2.2Geothermal 61 78 91 85 90 93 94 92 90 4.1 -0.1 0.5 -0.4
Net Imports 15164 13903 14276 16403 16830 17092 17205 16906 16243 -0.6 1.7 0.2 -0.6Solids 338 159 189 224 205 184 172 163 140 -5.6 0.8 -1.8 -2.0Oil 13379 12174 12262 12948 12882 12631 12484 12117 11509 -0.9 0.5 -0.3 -0.8 - Crude oil and Feedstocks 3226 4808 4798 5011 4987 4830 4718 4690 4400 4.0 0.4 -0.6 -0.7 - Oil products 10153 7366 7464 7937 7896 7800 7766 7427 7108 -3.0 0.6 -0.2 -0.9Natural gas 1628 2195 2433 3900 4405 4932 5198 5269 5229 4.1 6.1 1.7 0.1Electricity -181 -625 -608 -668 -662 -655 -649 -642 -636
Gross Inland Consumption 25059 25265 26597 28940 30079 30743 31510 31336 31072 0.6 1.2 0.5 -0.1Solids 359 193 252 224 205 184 172 163 140 -3.5 -2.0 -1.8 -2.0Oil 13456 12455 12728 12936 12870 12617 12469 12102 11493 -0.6 0.1 -0.3 -0.8Natural gas 1631 2195 2433 3900 4405 4932 5198 5269 5229 4.1 6.1 1.7 0.1Nuclear 6181 6507 6914 6967 7002 7072 7143 6740 6987 1.1 0.1 0.2 -0.2Electricity -181 -625 -608 -668 -662 -655 -649 -642 -636Renewable energy forms 3613 4541 4878 5582 6259 6593 7176 7704 7858 3.0 2.5 1.4 0.9
as % in Gross Inland ConsumptionSolids 1.4 0.8 0.9 0.8 0.7 0.6 0.5 0.5 0.5Oil 53.7 49.3 47.9 44.7 42.8 41.0 39.6 38.6 37.0Natural gas 6.5 8.7 9.1 13.5 14.6 16.0 16.5 16.8 16.8Nuclear 24.7 25.8 26.0 24.1 23.3 23.0 22.7 21.5 22.5Renewable energy forms 14.4 18.0 18.3 19.3 20.8 21.4 22.8 24.6 25.3
Electricity Generation in GWhe 54617 62295 65955 68890 73776 79713 85354 89168 91283 1.9 1.1 1.5 0.7Nuclear 23933 25196 26771 26977 27112 27383 27657 26100 27054 1.1 0.1 0.2 -0.2Hydro & wind 29795 35175 36848 36810 39502 42267 44414 45836 46559 2.1 0.7 1.2 0.5Thermal (incl. biomass) 889 1924 2336 5103 7163 10064 13284 17233 17670 10.1 11.9 6.4 2.9
Fuel Inputs for Thermal Power Generation (1) 610 895 1037 1302 1802 2242 2857 3650 3758 5.5 5.7 4.7 2.8Solids 14 1 0 0 0 0 0 0 0Oil (including refinery gas) 100 56 12 130 85 28 25 22 29 -18.8 21.2 -11.5 1.6Gas 102 127 179 470 628 1028 927 837 646 5.8 13.4 4.0 -3.5Biomass & Waste 394 710 846 701 1090 1187 1905 2791 3083 7.9 2.6 5.7 4.9Geothermal heat 0 0 0 0 0 0 0 0 0Hydrogen - Methanol 0 0 0 0 0 0 0 0 0
Fuel Input in other transformation proc. 3175 4832 4805 5197 5295 5255 5325 5408 5123 4.2 1.0 0.1 -0.4Refineries 3168 4826 4803 5009 4984 4827 4715 4688 4398 4.3 0.4 -0.6 -0.7Biofuels and hydrogen production 0 0 0 124 268 367 501 568 583 6.5 1.5District heating 0 0 0 64 43 61 110 153 142 9.8 2.6Others 8 6 2 0 0 0 0 0 0 -11.8
Energy Branch Consumption 331 471 460 422 429 441 450 449 446 3.4 -0.7 0.5 -0.1Non-Energy Uses 559 518 568 584 618 645 665 673 681 0.2 0.9 0.7 0.2Final Energy Demand 19416 20098 21494 22621 23478 24083 24681 24563 24310 1.0 0.9 0.5 -0.2by sectorIndustry(1) 3687 4017 5056 5209 5556 5928 6191 6343 6466 3.2 0.9 1.1 0.4 - energy intensive industries 2006 1758 2695 2769 2929 3100 3218 3252 3277 3.0 0.8 0.9 0.2 - other industrial sectors 1682 2258 2362 2440 2627 2828 2973 3091 3189 3.5 1.1 1.2 0.7Residential 5286 5927 5603 5798 6031 6209 6341 6276 6213 0.6 0.7 0.5 -0.2Tertiary 4150 3714 3774 4076 4290 4483 4645 4715 4709 -0.9 1.3 0.8 0.1Transport 6293 6441 7061 7537 7600 7464 7504 7229 6922 1.2 0.7 -0.1 -0.8by fuel (1)
Solids 343 189 252 224 205 184 172 163 140 -3.0 -2.0 -1.8 -2.0Oil 12292 12205 12560 12180 12153 12026 11946 11384 10860 0.2 -0.3 -0.2 -0.9Gas 1515 2053 2234 3394 3738 3858 4184 4266 4385 4.0 5.3 1.1 0.5Electricity 4039 4188 4504 4736 5149 5651 6140 6482 6666 1.1 1.3 1.8 0.8Heat (from CHP and District Heating) 249 292 545 465 566 730 953 1434 1588 8.2 0.4 5.3 5.2Other 978 1172 1399 1621 1667 1634 1286 834 670 3.7 1.8 -2.6 -6.3
CO2 Emissions (Mt of CO2) 42.7 43.3 44.8 46.7 47.5 48.1 48.5 46.9 45.2 0.5 0.6 0.2 -0.7Power generation/District heating 0.6 0.5 0.5 1.5 1.7 2.5 2.4 2.3 1.9 -2.9 14.2 3.1 -1.9Energy Branch 0.4 0.7 0.7 0.1 0.0 0.0 0.0 0.0 0.0 5.5 5.8Industry 5.1 5.2 6.3 6.2 6.6 7.1 8.1 8.5 8.6 2.2 0.4 2.1 0.7Residential 11.9 12.2 11.2 11.2 11.5 11.3 10.8 9.8 9.4 -0.6 0.3 -0.6 -1.4Tertiary 7.1 6.5 6.3 6.6 6.8 6.9 7.0 7.0 6.9 -1.2 0.8 0.3 -0.2Transport 17.7 18.2 20.0 21.1 20.9 20.4 20.3 19.3 18.4 1.2 0.5 -0.3 -1.0
CO2 Emissions Index (1990=100) 100.0 101.3 104.9 109.2 111.2 112.6 113.4 109.8 105.8
Source: PRIMES
144
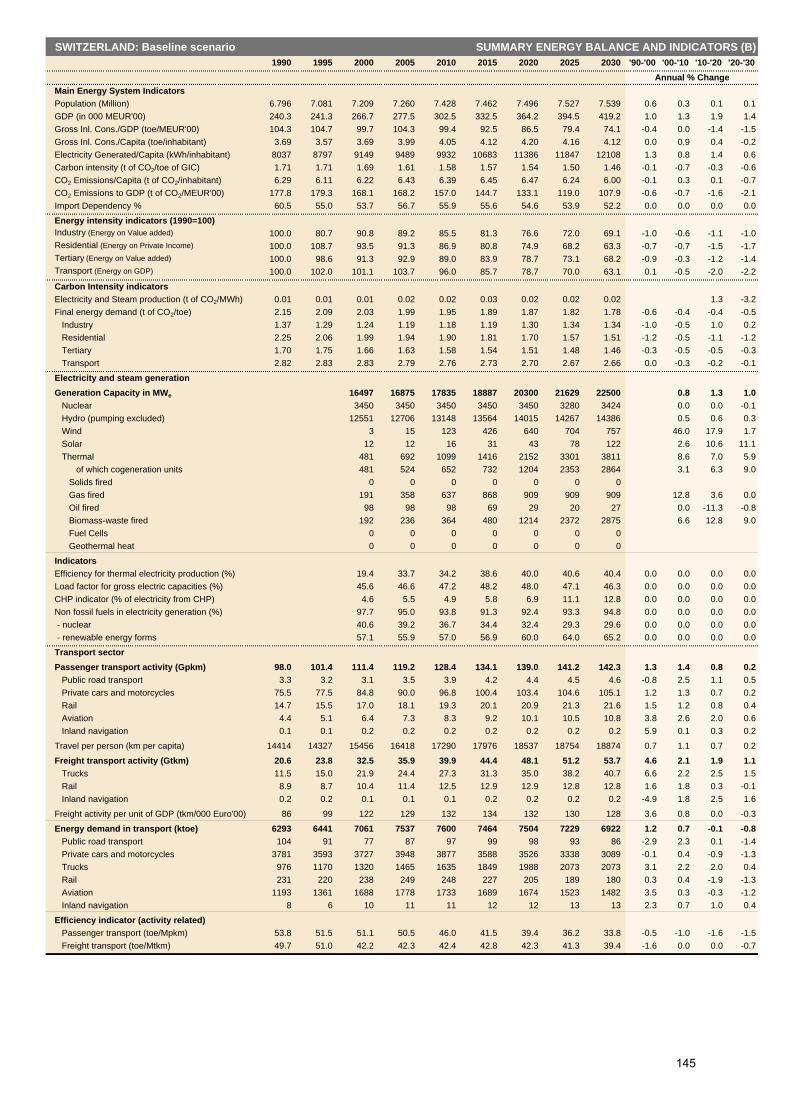
SWITZERLAND: Baseline scenario SUMMARY ENERGY BALANCE AND INDICATORS (B)1990 1995 2000 2005 2010 2015 2020 2025 2030 '90-'00 '00-'10 '10-'20 '20-'30
Annual % ChangeMain Energy System IndicatorsPopulation (Million) 6.796 7.081 7.209 7.260 7.428 7.462 7.496 7.527 7.539 0.6 0.3 0.1 0.1GDP (in 000 MEUR'00) 240.3 241.3 266.7 277.5 302.5 332.5 364.2 394.5 419.2 1.0 1.3 1.9 1.4Gross Inl. Cons./GDP (toe/MEUR'00) 104.3 104.7 99.7 104.3 99.4 92.5 86.5 79.4 74.1 -0.4 0.0 -1.4 -1.5Gross Inl. Cons./Capita (toe/inhabitant) 3.69 3.57 3.69 3.99 4.05 4.12 4.20 4.16 4.12 0.0 0.9 0.4 -0.2Electricity Generated/Capita (kWh/inhabitant) 8037 8797 9149 9489 9932 10683 11386 11847 12108 1.3 0.8 1.4 0.6Carbon intensity (t of CO2/toe of GIC) 1.71 1.71 1.69 1.61 1.58 1.57 1.54 1.50 1.46 -0.1 -0.7 -0.3 -0.6CO2 Emissions/Capita (t of CO2/inhabitant) 6.29 6.11 6.22 6.43 6.39 6.45 6.47 6.24 6.00 -0.1 0.3 0.1 -0.7CO2 Emissions to GDP (t of CO2/MEUR'00) 177.8 179.3 168.1 168.2 157.0 144.7 133.1 119.0 107.9 -0.6 -0.7 -1.6 -2.1Import Dependency % 60.5 55.0 53.7 56.7 55.9 55.6 54.6 53.9 52.2 0.0 0.0 0.0 0.0
Energy intensity indicators (1990=100)Industry (Energy on Value added) 100.0 80.7 90.8 89.2 85.5 81.3 76.6 72.0 69.1 -1.0 -0.6 -1.1 -1.0Residential (Energy on Private Income) 100.0 108.7 93.5 91.3 86.9 80.8 74.9 68.2 63.3 -0.7 -0.7 -1.5 -1.7Tertiary (Energy on Value added) 100.0 98.6 91.3 92.9 89.0 83.9 78.7 73.1 68.2 -0.9 -0.3 -1.2 -1.4Transport (Energy on GDP) 100.0 102.0 101.1 103.7 96.0 85.7 78.7 70.0 63.1 0.1 -0.5 -2.0 -2.2
Carbon Intensity indicatorsElectricity and Steam production (t of CO2/MWh) 0.01 0.01 0.01 0.02 0.02 0.03 0.02 0.02 0.02 1.3 -3.2Final energy demand (t of CO2/toe) 2.15 2.09 2.03 1.99 1.95 1.89 1.87 1.82 1.78 -0.6 -0.4 -0.4 -0.5
Industry 1.37 1.29 1.24 1.19 1.18 1.19 1.30 1.34 1.34 -1.0 -0.5 1.0 0.2Residential 2.25 2.06 1.99 1.94 1.90 1.81 1.70 1.57 1.51 -1.2 -0.5 -1.1 -1.2Tertiary 1.70 1.75 1.66 1.63 1.58 1.54 1.51 1.48 1.46 -0.3 -0.5 -0.5 -0.3Transport 2.82 2.83 2.83 2.79 2.76 2.73 2.70 2.67 2.66 0.0 -0.3 -0.2 -0.1
Electricity and steam generationGeneration Capacity in MWe 16497 16875 17835 18887 20300 21629 22500 0.8 1.3 1.0
Nuclear 3450 3450 3450 3450 3450 3280 3424 0.0 0.0 -0.1Hydro (pumping excluded) 12551 12706 13148 13564 14015 14267 14386 0.5 0.6 0.3Wind 3 15 123 426 640 704 757 46.0 17.9 1.7Solar 12 12 16 31 43 78 122 2.6 10.6 11.1Thermal 481 692 1099 1416 2152 3301 3811 8.6 7.0 5.9
of which cogeneration units 481 524 652 732 1204 2353 2864 3.1 6.3 9.0Solids fired 0 0 0 0 0 0 0Gas fired 191 358 637 868 909 909 909 12.8 3.6 0.0Oil fired 98 98 98 69 29 20 27 0.0 -11.3 -0.8Biomass-waste fired 192 236 364 480 1214 2372 2875 6.6 12.8 9.0Fuel Cells 0 0 0 0 0 0 0Geothermal heat 0 0 0 0 0 0 0
IndicatorsEfficiency for thermal electricity production (%) 19.4 33.7 34.2 38.6 40.0 40.6 40.4 0.0 0.0 0.0 0.0Load factor for gross electric capacities (%) 45.6 46.6 47.2 48.2 48.0 47.1 46.3 0.0 0.0 0.0 0.0CHP indicator (% of electricity from CHP) 4.6 5.5 4.9 5.8 6.9 11.1 12.8 0.0 0.0 0.0 0.0Non fossil fuels in electricity generation (%) 97.7 95.0 93.8 91.3 92.4 93.3 94.8 0.0 0.0 0.0 0.0 - nuclear 40.6 39.2 36.7 34.4 32.4 29.3 29.6 0.0 0.0 0.0 0.0 - renewable energy forms 57.1 55.9 57.0 56.9 60.0 64.0 65.2 0.0 0.0 0.0 0.0
Transport sectorPassenger transport activity (Gpkm) 98.0 101.4 111.4 119.2 128.4 134.1 139.0 141.2 142.3 1.3 1.4 0.8 0.2
Public road transport 3.3 3.2 3.1 3.5 3.9 4.2 4.4 4.5 4.6 -0.8 2.5 1.1 0.5Private cars and motorcycles 75.5 77.5 84.8 90.0 96.8 100.4 103.4 104.6 105.1 1.2 1.3 0.7 0.2Rail 14.7 15.5 17.0 18.1 19.3 20.1 20.9 21.3 21.6 1.5 1.2 0.8 0.4Aviation 4.4 5.1 6.4 7.3 8.3 9.2 10.1 10.5 10.8 3.8 2.6 2.0 0.6Inland navigation 0.1 0.1 0.2 0.2 0.2 0.2 0.2 0.2 0.2 5.9 0.1 0.3 0.2
Travel per person (km per capita) 14414 14327 15456 16418 17290 17976 18537 18754 18874 0.7 1.1 0.7 0.2
Freight transport activity (Gtkm) 20.6 23.8 32.5 35.9 39.9 44.4 48.1 51.2 53.7 4.6 2.1 1.9 1.1Trucks 11.5 15.0 21.9 24.4 27.3 31.3 35.0 38.2 40.7 6.6 2.2 2.5 1.5Rail 8.9 8.7 10.4 11.4 12.5 12.9 12.9 12.8 12.8 1.6 1.8 0.3 -0.1Inland navigation 0.2 0.2 0.1 0.1 0.1 0.2 0.2 0.2 0.2 -4.9 1.8 2.5 1.6
Freight activity per unit of GDP (tkm/000 Euro'00) 86 99 122 129 132 134 132 130 128 3.6 0.8 0.0 -0.3
Energy demand in transport (ktoe) 6293 6441 7061 7537 7600 7464 7504 7229 6922 1.2 0.7 -0.1 -0.8Public road transport 104 91 77 87 97 99 98 93 86 -2.9 2.3 0.1 -1.4Private cars and motorcycles 3781 3593 3727 3948 3877 3588 3526 3338 3089 -0.1 0.4 -0.9 -1.3Trucks 976 1170 1320 1465 1635 1849 1988 2073 2073 3.1 2.2 2.0 0.4Rail 231 220 238 249 248 227 205 189 180 0.3 0.4 -1.9 -1.3Aviation 1193 1361 1688 1778 1733 1689 1674 1523 1482 3.5 0.3 -0.3 -1.2Inland navigation 8 6 10 11 11 12 12 13 13 2.3 0.7 1.0 0.4
Efficiency indicator (activity related)Passenger transport (toe/Mpkm) 53.8 51.5 51.1 50.5 46.0 41.5 39.4 36.2 33.8 -0.5 -1.0 -1.6 -1.5Freight transport (toe/Mtkm) 49.7 51.0 42.2 42.3 42.4 42.8 42.3 41.3 39.4 -1.6 0.0 0.0 -0.7
145

Disclaimer: Energy and transport statistics reported in this publication and used for the modelling are taken mainly from EUROSTAT and from the publication “EU Energy and Transport in Figures” of the Directorate General for Energy and Transport. Energy and transport statistical concepts have developed differently in the past according to their
GIC: Gross Inland ConsumptionCHP: combined heat and power
Geographical regionsEU15: EU15 Member StatesEU25: EU15 Member States + New Member StatesNMS: New Member States (Cyprus, Czech Republic, Estonia, Hungary, Latvia, Lithuania, Malta, Poland, Slovakia, Slovenia)EU27: EU25 Member States + Bulgaria + RomaniaEU28: EU27 + TurkeyEurope 30: EU28 + Norway + Switzerland
Unitstoe: tonne of oil equivalent, or 107 kilocalories, or 41.86 GJ (Gigajoule)Mtoe: million toe
GW: Gigawatt or 109 wattkWh: kilowatt-hour or 103 watt-hourMWh: megawatt-hour or 106 watt-hourTWh: Terawatt-hour or 1012 watt-hour
t: metric tonnes, or 1000 kilogrammesMt: Million metric tonnes
km: kilometrepkm: passenger-kilometre (one passenger transported a distance of one kilometre)tkm: tonne-kilometre (one tonne transported a distance of one kilometre)Gpkm: Giga passenger-kilometre, or 109 passenger-kilometreGtkm: Giga tonne-kilometre, or 109 tonne-kilometre
which is measured in tonnes of oil equivalent per million tonne-km.
(1) EUROSTAT Energy Balances do not take into account non-marketed steam, i.e. steam generated - either in boilers or in CHP plants - and used on site by industrial consumers.Using statistical information provided by EUROSTAT on CHP, the non-marketed steam generated in CHP units as well as the corresponding fuel input have been estimated forthis study. In the PRIMES model, steam has been attributed to the demand side and the fuel input to the supply side. This approach ensures a better comparability of historical figures with the projections. However, slight differences exist for certain figures related to steam generation - both in terms of final energy demand and transformation input - in this report compared to EUROSTAT energy balances.
Abbreviations
individual purposes. Energy demand in transport reflects usually sales of fuels at the point of refuelling, which can differ from the region of consumption. This is particularly relevant for airplanes and trucks. Transport statistics deal with the transport activity within a country but may not always fully include transit shipments. These differences should be borne in mind when comparing energy and transport figures. This applies in particular to transport activity ratios, such as energy efficiency in freight transport,
146

KO-AC-06-001-EN
-C
Copyright © 2022 FDOKUMEN