
FIJI: Energy and Transport Data Audit and Data Management ...
57
FIJI: Energy and Transport Data Audit and Data Management Assessment for Electrification of the Transport Sector Final Report September 2019
-
Upload
khangminh22 -
Category
Documents
-
view
3 -
download
0
Transcript of FIJI: Energy and Transport Data Audit and Data Management ...

FIJI: Energy and Transport Data Audit and Data Management Assessment for Electrification of the Transport Sector Final Report September 2019

Energy and Transport Data Audit for Electrification of the Fiji Transport Sector 2
Contents
Illustrations ................................................................................................................... 3
Abbreviations ............................................................................................................... 4
EXECUTIVE SUMMARY ............................................................................................ 5
1. BACKGROUND TO THE PROJECT .................................................................... 7
Project Phases ............................................................................................................... 8
Research Undertaken .................................................................................................... 9
2. BENEFITS AND COSTS OF ELECTRIFIED TRANSPORT ........................... 10
Potential Positive Impacts .......................................................................................... 10
Lower greenhouse gas emissions ........................................................................... 10
Reduced air pollution ............................................................................................. 13
More pedestrian-friendly mixed traffic zones ........................................................ 13
Source of “second life” batteries for PV systems ................................................... 14
Consistency with “sustainability” objectives and branding ................................... 14
Changes in vehicle import and operating costs ...................................................... 15
Impact on national balance of payments ................................................................ 17
Potential Negatives ..................................................................................................... 18
Higher greenhouse gas emissions ........................................................................... 18
Vehicle costs ........................................................................................................... 18
Cost of charging infrastructure ............................................................................... 19
Battery costs (including end-of-life disposal) ........................................................ 19
3. CATEGORIES OF INFORMATION REQUIRED ............................................. 21
Vehicles ...................................................................................................................... 21
Number and types of Vehicles................................................................................ 21
Market Conditions .................................................................................................. 27
Technology and Efficiency ..................................................................................... 28
Maritime ................................................................................................................. 29
Travel .......................................................................................................................... 30
Vehicle Usage ......................................................................................................... 30
Fuels ........................................................................................................................... 31
4. ORGANISING AND FACILITATING INFORMATION FLOWS .................. 33
Agency Roles .............................................................................................................. 33
Constraints, bottlenecks and gaps ............................................................................... 35
Constraints .............................................................................................................. 35
Bottlenecks ............................................................................................................. 36
Gaps ........................................................................................................................ 37
International Data ....................................................................................................... 37
5. DATA FRAMEWORK AND STRATEGY (DFS) ................................................ 39
A. Organisational arrangements ................................................................................. 39
B. Policy studies and modelling ................................................................................. 41
C. Analyses of existing and expected data ................................................................. 44
D. Planning and delivering new data acquisitions ...................................................... 46
Conclusions ................................................................................................................ 47
REFERENCES ............................................................................................................. 49

Energy and Transport Data Audit for Electrification of the Fiji Transport Sector 3
Documents .............................................................................................................. 49
Websites ................................................................................................................. 49
APPENDIX 1. STAKEHOLDERS CONSULTED ................................................... 50
APPENDIX 2. FIRST STAKEHOLDER WORKSHOP, 28 JUNE 2019 ............... 52
APPENDIX 3. SECOND STAKEHOLDER WORKSHOP, 6 AUGUST 2019 ...... 54
APPENDIX 4. VEHICLE ADDITIONS AND RETIREMENTS ............................ 56
Illustrations
Figure 1 Transition from current situation to LEDS ........................................................ 7
Figure 2 Main Data Categories and Collection Agencies .............................................. 22
Figure 3 Total vehicle registrations, 2001 - 2018 ........................................................... 26
Figure 4 New registrations each year, 2001 – 2018 ...................................................... 26
Figure 5 The “Information Pyramid” ............................................................................. 34
Figure 6 Annual retirements from the motor vehicle register ........................................ 56
Figure 7 Trend in total registrations ............................................................................... 56
Figure 8 Trend in annual retirements ............................................................................. 57
Table 1 Emissions-intensities of an ICV, HV and EV of comparable size .................... 12
Table 2 Emissions intensities of vehicles under different generation fuel mixes .......... 12
Table 3 Example of annual revenue contribution calculations....................................... 16
Table 4 Example of 10-year revenue calculation (new vehicle, CIF value $30,000) .... 17
Table 5 Example of 10-year revenue calculation (used vehicle, CIF value $12,000) .... 17
Table 6 Summary of major data collections reviewed to date ....................................... 23
Table 7 Extract from LTA registration database (2015) ................................................ 24
Table 8 Extract from FRCS Motor Vehicle Landing Costs (Jul-Sept 2018) ................. 24
Table 9 Total Vehicle Registrations by New/Used, 2015 .............................................. 27
Table 10 Summary and indicative timeline of tasks and projects .................................. 48

Energy and Transport Data Audit for Electrification of the Fiji Transport Sector 4
Abbreviations
BAU Business as Usual
CEO Chief Executive Officer
DFS Data Framework and Strategy
DOE Department of Energy
EFL Energy Fiji Limited
EV Electric vehicle
FBOS Fiji Bureau of Statistics
FRCS Fiji Revenue and Customs Service
GGGI Global Green Growth Institute
LEDS Low-emissions development strategy
HIES Household Income and Expenditure Survey
HTS Household Travel Survey
HV Hybrid vehicle
ICV Internal Combustion Vehicle
LHD Left Hand Drive (i.e. steering wheel on the left of the vehicle)
LTA Land Transport Authority
MOIT Ministry of Infrastructure and transport
MOU Memorandum of Understanding
MSAF Maritime Safety Authority of Fiji
NMT Non-motorized transport
NTPD National Transport Planning Database
PHV Plug hybrid vehicle
PT Public transport
PV Photovoltaic
RHD Right Hand Drive (as in Fiji)
TPU Transport Planning Unit
TOU Time of use
UNESCAP United Nations Economic and Social Commission for Asia and the
Pacific
VAT Value added tax
VKT Vehicle-kilometres travelled
Energy and Transport Data Audit for Electrification of the Fiji Transport Sector 5
Executive Summary
This is the final report on an Energy and Transport Data Audit and Data Collection
Strategy to support planning for the electrification of the transport sector in Fiji (The
Strategy is also called the Data Framework and Strategy, or DFS). The project was
undertaken with the kind co-operation and assistance of the Ministry of Infrastructure
and Transport (MOIT), and in particular the Transport Planning Unit (TPU) and the
Department of Energy (DOE) of MOIT.
Adoption of electric vehicles (EVs) for land transport was one of the main strategies for
reducing emissions identified in the Low Energy Development Strategy 2018-2050.
Electrification may also have a more limited role in reducing maritime emissions. The
aim of the project is to help provide a policy and planning bridge between the present
situation and the first stage of the LEDS strategy.
The project proceeded in four stages: commencement, research and preparation of a
data audit (followed by a first stakeholder workshop), development of a draft strategy
and action plan (followed by a second stakeholder workshop), and completion (this
report, together with other materials).
All public policies have both benefits and costs. Policy makers are not able to assess
these realistically unless they have the necessary information, and they cannot be sure
they have the necessary information without a preliminary assessment of the likely
positive and negative outcomes of the policy. Then they will be in a position to collect
the information required, calculate the cost and benefits and make an informed decision.
Chapter 2 describes the main impacts of likely positive outcomes (benefits) and
negative outcomes (costs) from the introduction of electric vehicles and vessels to Fiji.
In many cases potential positive impacts could turn out negative, and vice versa. It gives
several worked examples of impact calculations that could be carried out once the
necessary information becomes available.
Chapter 3 summaries the specific categories of data required to undertake the policy
studies and evaluations, and the agencies responsible for acquiring and managing it. The
data categories are been grouped into three inter-related clusters:
• Fuels (transport and generation)
• Vehicles (transport equipment); and
• Travel and mobility.
For fuels and transport equipment, information is required for all stages from import
(and before import in some cases) to distribution, use and disposal. The travel behaviour
relevant to this project takes place within Fiji. The chapter analyses the content,
structure and accessibility of the main collections, and suggests how thee could be made
more useful with greater co-ordination.
Chapter 4 identifies legal constraints and administrative bottlenecks in the flow of
information between agencies and presents the data framework in terms of an
Energy and Transport Data Audit for Electrification of the Fiji Transport Sector 6
“information pyramid.” The development of transport electrification policy (the apex of
the pyramid) needs to be solidly based on actual data.
As it happens, the base of the pyramid is well established already, although some gaps
are identified in the chapter. Several agencies routinely collect relevant data, although
they do not necessarily make it all public, or not in a consistent and accessible form.
The chapter also reviews the use of data from international sources.
Chapter 5 presents the recommended Data Framework and Strategy (DFS). The
objective of the DFS is to enable MOIT to prepare well-founded advice on the costs and
benefits of transport electrification from a national perspective.
The DFS is divided into Tasks and Projects. Tasks are on-going activities, including
managing information flows, data collections and access, planning data acquisitions,
combining existing data sets, analysing new data sets as they become available and
reporting progress and problems. Projects are distinct studies needed to support the
higher levels in the information pyramid. Some may only need to be done once, and
others repeated occasionally as data improves.
Chapter 5 identifies 24 distinct activities (on-going tasks and projects) and presents an
indicative 3-year timeline (further detail is given in a separate report to MOIT). It is
recognised that the work will depend on the time and financial resources available, and
projects are staggered to spread the load. There are 7 high priority activities, involved
with establishing the DFS and informing two of the threshold issues that policy-makers
will need to address:
• What will be the impact of transport electrification on national emissions?; and
• What will be the impact on government revenues and the national economy?
There are 6 activities rated medium-high priority and 11 rated as medium. All are
considered necessary to build a sound basis for developing transport electrification, and
in many cases will also support the general planning work of MOIT, and the TPU in
particular.
*****
Energy and Transport Data Audit for Electrification of the Fiji Transport Sector 7
1. Background to the Project
This is the final report on an Energy and Transport Data Audit and Data Collection
Strategy to support planning for the electrification of the transport sector in Fiji.
Adoption of electric vehicles (EVs) for land transport was one of the main strategies for
reducing emissions identified in the Low Energy Development Strategy 2018-2050
(LEDS), along with
• Adoption of hybrid vehicles (HVs)1;
• Promotion of public transport (PT);
• Promotion of non-motorized transport (NMT), including cycling;
• Promotion of vehicle renewal and scrapping;
• Promotion of biofuels;
• Adoption of efficient new vehicles; and
• Efficiency improvements in operating vehicles.
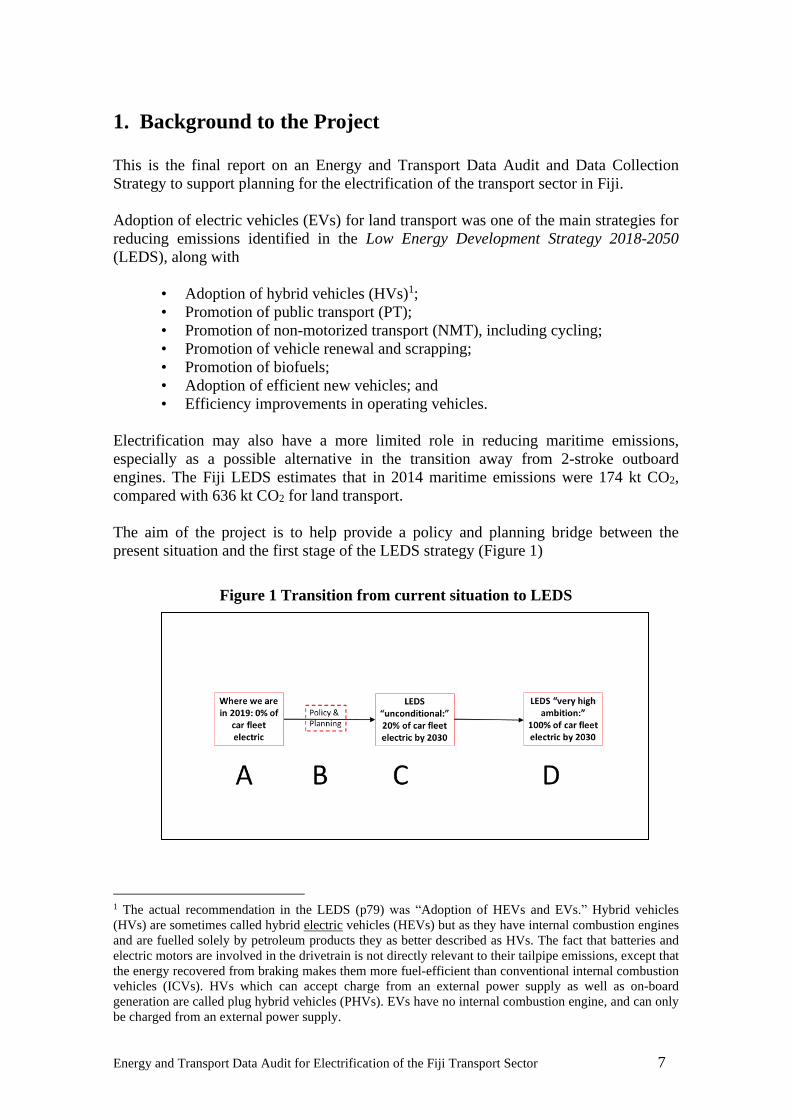
Electrification may also have a more limited role in reducing maritime emissions,
especially as a possible alternative in the transition away from 2-stroke outboard
engines. The Fiji LEDS estimates that in 2014 maritime emissions were 174 kt CO2,
compared with 636 kt CO2 for land transport.
The aim of the project is to help provide a policy and planning bridge between the
present situation and the first stage of the LEDS strategy (Figure 1)
Figure 1 Transition from current situation to LEDS
1 The actual recommendation in the LEDS (p79) was “Adoption of HEVs and EVs.” Hybrid vehicles
(HVs) are sometimes called hybrid electric vehicles (HEVs) but as they have internal combustion engines
and are fuelled solely by petroleum products they as better described as HVs. The fact that batteries and
electric motors are involved in the drivetrain is not directly relevant to their tailpipe emissions, except that
the energy recovered from braking makes them more fuel-efficient than conventional internal combustion
vehicles (ICVs). HVs which can accept charge from an external power supply as well as on-board
generation are called plug hybrid vehicles (PHVs). EVs have no internal combustion engine, and can only
be charged from an external power supply.
Energy and Transport Data Audit for Electrification of the Fiji Transport Sector 8
Further policy development and implementation will rely on comprehensive and
reliable information on a wide range of topics relevant to transport sector electrification.
Some of this information already exists, but is not fully co-ordinated, as set out in
Chapter 3 of this report. In other cases, initial data collections have been done, but need
to be repeated at regular intervals to build up a reliable time series.
The first part of the project focussed on identifying, assessing, and applying existing
information for policymaking, within the framework of the Sustainable Development
Goal (SDG) on clean energy. It examined existing data collection, management,
utilisation and sharing systems particularly in the context of electrification opportunities
in land and maritime transport.
The second part of the project covered the next steps needed to create an enabling
environment in terms of data for planning the transition to electric vehicles, immediate
next studies needed, future energy data needs and how to obtain such data, initial
mapping of roles of different agencies now and in future.
This report covers the entire project and includes recommendations.
Project Phases
The project proceeded in the following phases:
1. Commencement: clarify objectives, initial contact with main stakeholders,
develop workplan, prepare inception report.2
2. Research and analysis: interview stakeholders, identify and acquire existing data
collections, investigate patterns of data use. Summarise in a briefing paper,
present results and obtain feedback from first workshop of stakeholders.
3. Strategy and action plan: Prepare energy data audit report, strategy action plan
and recommendations in draft final report. Present to and obtain feedback from
second workshop of stakeholders.
4. Completion: Final report (this document).
A draft report covering phase 2 was presented to a workshop of invited stakeholders in
Suva on 28 June 2019.3 The findings of the draft report were validated during the
workshop, the details of which are at Appendix 2.
A draft Data Management Strategy and Action Plan was presented to stakeholders for
comment and feedback, at a second stakeholder workshop to in Suva on 6 August 2019.
Details of the workshop are at Appendix 3. This report embodies the outcomes of both
workshops.
This project is running in parallel with a detailed study of the electricity infrastructure
requirements needed to support transport electrification on the island of Viti Levu.
2 FIJI: Energy and Transport Data Audit for Electrification of Transport; Inception Report to GGGI AND
ESCAP April 2019 3 FIJI: Energy and Transport Data Audit for Electrification of Transport; Briefing Paper Prepared for the
Ministry of Infrastructure and Transport of Fiji under a technical assistance project supported by the
Global Green Growth Institute and funded by UNESCAP, June 2019

Energy and Transport Data Audit for Electrification of the Fiji Transport Sector 9
Research Undertaken
The information in this report was compiled from a number of sources:
• The LEDS and documents compiled for the LEDS;
• Interviews with stakeholders carried out by the author and GGGI during a
mission to Suva in March 2019, and additional interviews in the days before and
after each workshop;
• Published and unpublished documents and data collections identified during
research and discussions; and
• Internet research.
The References list the most relevant documents and websites of interest (in addition to
those in footnotes) and Appendix 1 lists the organisations and stakeholders interviewed.
Energy and Transport Data Audit for Electrification of the Fiji Transport Sector 10
2. Benefits and Costs of Electrified Transport
All public policies have both benefits and costs. Policy makers are not able to assess
these realistically unless they have the necessary information, and they cannot be sure
they have the necessary information without a preliminary assessment of the likely
positive and negative outcomes of the policy. Then they will be in a position to collect
the information required, calculate the cost and benefits and make an informed decision.
This section describes the main impacts and likely positive outcomes (benefits) and
negative outcomes (costs) from the introduction of electric vehicles and vessels to Fiji.
In many cases potential positive impacts could turn out negative, and vice versa.
Potential Positive Impacts
Lower greenhouse gas emissions
Conventional vehicles combust liquid fuels in their engines. The combustion products
are mainly carbon dioxide (CO2), with traces of other gases with a global warming
potential: methane (CH4) and nitrous oxide (N2O). Oxides of nitrogen (mainly NO2) and
sulphur (SO2), non-methane volatile organic compounds (NMVOC) and solid
particulates are also emitted during combustion.
The amount of combustion products emitted per vehicle-km travelled (VKT) depends
on the quantity of fuel consumed, the type of fuel (petrol, diesel or biofuels), the grade
of fuel (e.g. the sulphur content of diesel) and the design and condition of the engine.
Many countries set fuel consumption standards for new vehicles, expressed as
maximum litres consumed per 100km travelled (or in the case of the USA, minimum
miles travelled per US gallon consumed). These impose a limit on the amount of CO2
emitted per km or mile travelled. For compliance purposes the values are determined in
laboratory testing; on-road fuel consumption tends to be significantly higher.
Many countries also set limits on other (non-CO2) emissions for new vehicles, and these
have become more stringent over time. The European Union standards (termed Euro 1,
Euro 2 etc.) have been adopted in many other countries, although more slowly than in
the EU itself.4 One of the reasons why countries such as Fiji lag behind is fuel quality –
the latest (Euro 6) standards for diesel powered vehicles can only be met by low-sulphur
diesel fuel, which may not be available.5
Information required to make an informed judgement
The greenhouse gas emissions per VKT can be calculated by multiplying the emission
factor of the fuel by the number of litres consumed per km. There are usually two
emissions factors: one based on the chemical composition of the fuel itself (the Scope 1
4https://en.wikipedia.org/wiki/European_emission_standards 5 In August 2017 the Fiji Government noted that the average tested sulphur content of diesel fuel
available in Fiji between 2014 and 2016 was 290 ppm, and approved a timetable for transition to setting
maximum levels of 10 ppm (equivalent to Euro 5) by January 2018 – later changed to 1 January 2019.
https://www.reinfofiji.com.fj/wp-content/uploads/2017/11/Memo-to-DoE.pdf. Interviewees were not able
to confirm that this standard has been met, and several expressed the view that it has not.
Energy and Transport Data Audit for Electrification of the Fiji Transport Sector 11
factor) and the other (Scope 3) on the energy used to extract, refine and transport the
fuel to the point where it is transferred to the vehicle. Scope 3 factors typically add
about 5% to the Scope 1 factors but could be higher in island countries such as Fiji,
where fuels have to be transported over longer distances.
For example, the Scope 1 emission factor for petrol is 2,313 g CO2-e6 per litre, and the
Scope 3 factor is 123 g CO2-e per litre giving total emissions of 2,436 g CO2-e per litre.
The Scope 1 emission factor for diesel is 2,722 g CO2-e per litre, and the Scope 3 factor
is 139 g CO2-e per litre, giving total emissions of 2,911 g CO2-e per litre.7
Therefore a conventional petrol-powered internal combustion vehicle (ICV) with an on-
road fuel consumption of 7.5 litres/100 km (0.075 litres per km) would emit 0.075 x
2,436 = 183 g CO2-e per km (Table 1).
Electric vehicles have no tailpipe emissions, but will create emissions from power
generation, unless they are charged from a 100% renewable power supply. At present
about half the energy generated by the Energy Fiji Limited (EFL) grid is from hydro
and half from diesel.8
The Pacific Power Association reports that EFL has a thermal generation fuel use of 4.7
kWh/kg, or 3.9 kWh/litre (0.26 litres per kWh)9 giving emissions of 0.26 x 2,911 = 844
g CO2-e per kWh generated from fuel. However, only half the energy EFL sends out to
its network is generated from fuel, and the rest is generated from renewable sources
(mainly hydro) without emissions. Therefore, the average is 822/2 = 422 g CO2-e per
kWh sent out.
The Pacific Power Association reports that EFL network losses are about 12% of the
energy sent out. Therefore, the electricity supplied to EV chargers is (422/0.88) = 480 g
CO2-e per kWh.
The electrical energy consumption of a Nissan Leaf EV, for example, is given as 16.5
kWh per 100 km, or 0.165 kWh/km when tested.10 It is assumed that the on-road energy
use would be 50% higher, as is the case for ICVs and HVs (24.8 kWh/100 km). If all
the energy were supplied from the EFL grid, using its current fuel mix, the emissions
attributable to a Nissan Leaf would be 0.248 x 480 = 119 g CO2-e per km.
With the current generation mix, and EV would lead to about 35% less emissions than a
conventional ICV of a similar size and annual mileage. However, substituting an EV for
a HV would produce a much lower emissions benefit of only about 4% (Table 1).
If the generation mix were 100% renewable, then EVs would have a large emissions
advantage (last column in Table 2). Until that point, however, the output of renewable
generation on the system is constrained by the capacity (MW) of renewables installed
6 CO2-e (or CO2-equivalent) is a single value that sums the volume-weighted global warming potential of
the mass of CO2, CH4 and N2O present in the combustion products. 7http://www.environment.gov.au/system/files/resources/80f603e7-175b-4f97-8a9b-
2d207f46594a/files/national-greenhouse-accounts-factors-july-2018.pdf 8 EFL Annual Report 2018. For the 5 years 2014-2018 the average thermal share of generation was 49%. 9 https://www.ppa.org.fj/wp-content/uploads/2019/09/2018-FY-Benchmarking-Report_update_220719-
FINAL.pdf, p 10 https://ev-database.org/car/1106/Nissan-Leaf
Energy and Transport Data Audit for Electrification of the Fiji Transport Sector 12
and the natural variability of water, wind and sun. Whatever renewable generation is in
place will be used to its maximum output, and any additional demand must be met by
dispatchable fossil fuel sources, in this case diesel. Therefore, diesel will almost
certainly remain the “marginal” generation fuel until the system is 100% renewable.
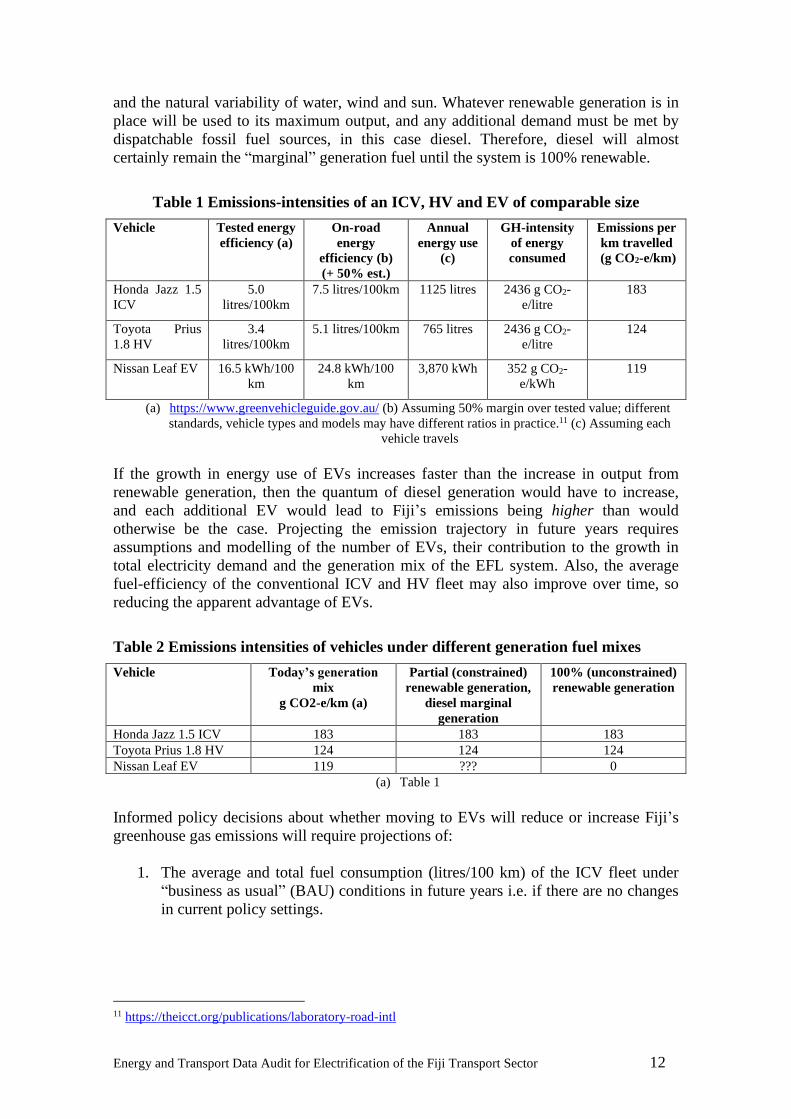
Table 1 Emissions-intensities of an ICV, HV and EV of comparable size
Vehicle Tested energy
efficiency (a)
On-road
energy
efficiency (b)
(+ 50% est.)
Annual
energy use
(c)
GH-intensity
of energy
consumed
Emissions per
km travelled
(g CO2-e/km)
Honda Jazz 1.5
ICV
5.0
litres/100km
7.5 litres/100km 1125 litres 2436 g CO2-
e/litre
183
Toyota Prius
1.8 HV
3.4
litres/100km
5.1 litres/100km 765 litres 2436 g CO2-
e/litre
124
Nissan Leaf EV 16.5 kWh/100
km
24.8 kWh/100
km
3,870 kWh 352 g CO2-
e/kWh
119
(a) https://www.greenvehicleguide.gov.au/ (b) Assuming 50% margin over tested value; different
standards, vehicle types and models may have different ratios in practice.11 (c) Assuming each
vehicle travels
If the growth in energy use of EVs increases faster than the increase in output from
renewable generation, then the quantum of diesel generation would have to increase,
and each additional EV would lead to Fiji’s emissions being higher than would
otherwise be the case. Projecting the emission trajectory in future years requires
assumptions and modelling of the number of EVs, their contribution to the growth in
total electricity demand and the generation mix of the EFL system. Also, the average
fuel-efficiency of the conventional ICV and HV fleet may also improve over time, so
reducing the apparent advantage of EVs.
Table 2 Emissions intensities of vehicles under different generation fuel mixes
Vehicle Today’s generation
mix
g CO2-e/km (a)
Partial (constrained)
renewable generation,
diesel marginal
generation
100% (unconstrained)
renewable generation
Honda Jazz 1.5 ICV 183 183 183
Toyota Prius 1.8 HV 124 124 124
Nissan Leaf EV 119 ??? 0
(a) Table 1
Informed policy decisions about whether moving to EVs will reduce or increase Fiji’s
greenhouse gas emissions will require projections of:
1. The average and total fuel consumption (litres/100 km) of the ICV fleet under
“business as usual” (BAU) conditions in future years i.e. if there are no changes
in current policy settings.
11 https://theicct.org/publications/laboratory-road-intl
Energy and Transport Data Audit for Electrification of the Fiji Transport Sector 13
2. The average energy efficiency (kWh/100 km) of the EVs that would be imported
to Fiji under policy settings promoting EVs, and the total MWh that would be
added to annual electricity demand on the grid.
3. The average and total fuel consumption (litres/100 km) of the non-electric ICV
vehicle fleet under policy settings promoting EVs.
4. The total emissions from the electricity generation in each year under BAU and
under the EV policy settings.
Reduced air pollution
The fact that EVs have no tailpipe emissions means that they will not contribute to local
air pollution (SOx, NOx, NMVOCs and particulates). NMVOCs are also precursors of
low-level ozone.
Replacing a poorly-maintained diesel vehicles with EVs carrying out the same task
would be particularly beneficial.12 There may also be opportunities to introduce
electrified modes when new bus, rail or ferry routes are planned.
Information required to make an informed judgement
It should be possible to project vehicle pollutant loads in Fiji’s main urban areas under
both BAU and EV-supportive policy settings.
The TPU should be mindful of transport electrification benefits and opportunities early
in the process of assessing new transport routes and corridors.
More pedestrian-friendly mixed traffic zones
EVs are particularly well suited to mixed traffic zones where pedestrians interact with
vehicles. EVs are non-polluting and quiet (in fact, many EVs emit a warning noise at
low speeds to alert pedestrians). Furthermore, electric propulsion is suited to a wide
range of vehicle types and designs, so lighter purpose-built EVs could be used to
transport passengers and local delivery freight within a designated zone.
The Central Suva area, which currently has high congestion and pollution from vehicle
traffic, and vehicle-pedestrian conflicts, could be developed into an EV-intensive ICV-
free zone. This could support a concentration of public charging stations, and so act as a
nucleus or test-bed for the next phase of electrification.
Information required to make an informed judgement
The information required is not so much routine data collection or analysis but ensuring
that traffic and urban planning agencies (e.g. Fiji Roads Authority, municipal councils)
are aware of transport electrification benefits and opportunities early enough in the
planning process. This will require better coordination between agencies.
12 https://ecsdev.org/ojs/index.php/ejsd/article/download/401/398
Energy and Transport Data Audit for Electrification of the Fiji Transport Sector 14
Source of “second life” batteries for PV systems
A small EV like a Nissan Leaf has about 200 kg of lithium-ion batteries.13 These are
subjected to heavy usage and rapid charge-discharge cycles during use, and will
eventually need to be replaced, possibly more than once, during the EV’s service life.
The EV market is too recent for average service lives to determined and in any case the
average EV service life in Fiji will depend on whether the vehicles are imported new or
used.
Reconditioned EV batteries are still capable of lighter duties such as storage for PV
systems, where charge and discharge rates are much lower, and less of the total battery
capacity is drawn off in each cycle. “Second Life” facilities for reconditioning and
repurposing EV batteries have recently been established in Japan.14
As Fiji has an extensive program of off—grid rural electrification, there could well be a
local demand for reconditioned EV batteries for that purpose. It may be feasible to set
up a battery reconditioning industry in Fiji once there is a steady supply of EV batteries.
A facility of this kind would also help with the problem of dealing with the worn-out
batteries of the present generation of hybrid vehicles.
Information required to make an informed judgement
A predictive model is required incorporating battery imports (in HVs and EVs and as
separate units), service lives, reconditioning and disposal. The existing HV service
industry in Fiji can give useful information in actual experience. Research will also be
necessary on the battery loads and service lives of the types of EVs likely to be
imported in future (whether as new or used vehicles). The model should yield the
number of batteries available for reconditioning or scrapping in future years under both
BAU and with-EVs scenarios. This information is essential to evaluating whether
battery reconditioning or scrapping services would be viable, and the level of
investment that would be needed to build this capability in Fiji.
Consistency with “sustainability” objectives and branding
EVs are certainly associated in the public mind with progress, environmental benefits
and sustainability. As a country where international tourism is a major part of the
economy, Fiji could derive marketing advantages from the visible presence of EVs.
Furthermore, about two thirds of international visitors are from Australia or New
Zealand15, countries where there is a high level of interest in EVs. If the car rental fleets
included EVs, and there were charging stations along the King’s Road and Queen’s
Road, visitors could rent EVs as part of their holiday, and as a low-risk “test drive” with
a view to buying an EV at home. The ports of call for cruise ships (Suva and Lautoka)
could also offer business opportunities for visitors to rent EVs during post visits.
13 https://pushevs.com/2018/01/29/2018-nissan-leaf-battery-real-specs/ 14 https://www.japantimes.co.jp/news/2018/07/04/business/retired-electric-vehicle-batteries-find-second-
life-chilling-beer-grilling-sausages/#.XQiGMEl7m70 15 Fiji Bureau of Statistics, Statistical News, 14 January 2019.

Energy and Transport Data Audit for Electrification of the Fiji Transport Sector 15
In the pacific region, at least one New Zealand rental company offers EVs.16 Australian
rental car companies do not at present rent EVs, possibly due to the long drive distances
and lack of public charging infrastructure between the main cities. 17 The rental car
companies y started to rent hybrid cars about a decade ago (and still do), with a similar
objective of offering an eco-friendly alternative and enabling prospective buyers to try
new technologies at low risk.
The tourism sector also presents one of the best opportunities to introduce electrically-
powered vessels. Many resorts operate small fleets of pleasure craft and fleet viewing
craft. These may travel relatively short distances each day and tend to be berthed
together overnight, favourable conditions for the operational constraints and charging
requirements of electric outboards.
Information required to make an informed judgement
As this is a marketing benefit rather than a technical benefit and relies on knowing the
attitudes and likely behaviour of a target group (visitors renting cars), special market
surveys would be required. However, data on the number of rentals, the average driving
distances and preferred routes by target groups would be necessary to plan an effective
investigation.
In terms of electrically powered vessels, research is necessary on the numbers and
operating patterns of tourism sector fleets in such specific segments.
Changes in vehicle import and operating costs
It is often stated that EVs are cheaper to operate than ICVs, but this depends on the
relative taxation regimes for electricity and transport fuels, which are in the control of
Government. While the Government may choose to permit early adopters of EVs to
benefit from lower import duties and energy costs, if numbers build up as intended then
the losses in revenue would greatly increase.
An EV contributes as much as an ICV or a HV of equal mass to the costs of traffic
congestion and wear on the roads. It does not contribute directly to raising revenue from
excise and value-added tax (VAT) on transport fuel but may contribute indirectly
through the fuel consumed in generating the electricity it uses. If it is intended that
transport electrification should be revenue-neutral it may be necessary to recover
revenue from EVs in different ways, through special charges for road use or through the
pricing of the electricity consumed for charging and/or the type of charging.
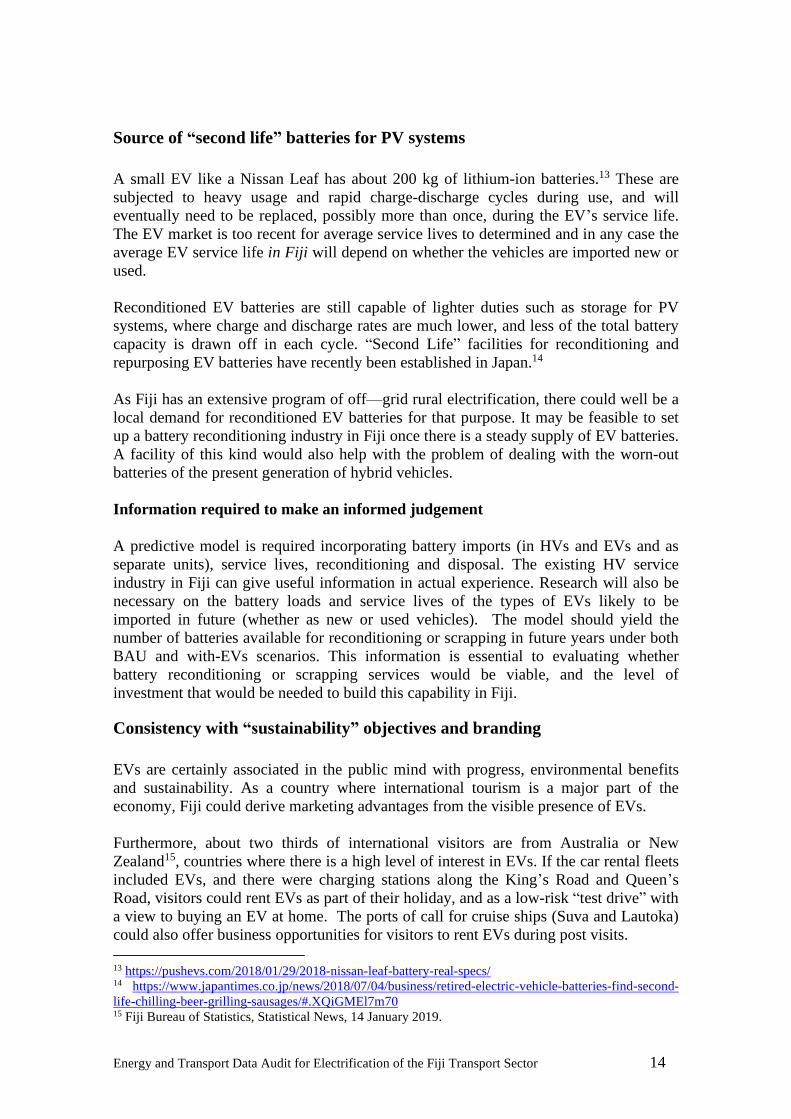
Table 3 shows an example of calculating the contribution of various vehicle types to
annual government revenues, assuming current levels of import fiscal duty and VAT on
fuels, and VAT on electricity. Under these assumptions an EV would contribute about
$570 less to revenue annually than an ICV, and about $280 less than a HV.
16 https://www.europcar.co.nz/electric-vehicles 17 Despite the lack of commercial EV rentals in Australia there are peer-to-peer rentals available from
private EV owners https://www.evee.com.au/
Energy and Transport Data Audit for Electrification of the Fiji Transport Sector 16
Table 3 Example of annual revenue contribution calculations
On-road
Litres/
100km
(a)
On-road
kWh/
100km
(a)
Annual
km
Litres/
year
kWh/
year
Fuel
Revenu
e $/lt
(c)
Govt
Fuel
Reven
ue $/yr
Electric-
ity VAT
Revenue
$/yr (d)
Total
Govt
Revenu
e $/yr
Honda Jazz
7.5
0 15,000 1,125 0
0.80
900
0
900
Toyota Prius
5.1
0 15,000
765
0
0.80
612
0
612
Nissan Leaf 0 24.8 15,000
656(b)
3,720
0.34
223
111
334 (a)Table 1 (b) Indirect consumption of diesel fuel assuming 50% of generation from renewable sources.
(c) From 2018 Fiscal Duty and VAT values for gasoline and diesel fuel, supplied by FRCS. (d) Based on
home charging at $0.331/kWh plus 9% VAT.
EVs could be levied a higher registration fee to recover the value of fuel taxes foregone.
This could be calculated from the average annual travel and typical fuel consumption of
the current vehicle fleet, as determined by checking the odometer at the annual
registration inspections. (In fact, it would in theory be possible to levy a different annual
charge for each actual EV based on its travel during the year, but this could only be
determined after it is inspected and would set up a further incentive to wind back the
odometer).
The electricity used by public or commercial EV chargers can be readily identified and
charged accordingly through fully cost-recovering time of use (TOU) and maximum
demand tariffs, if so desired. The electricity used by home chargers is more difficult to
identify, although the presence of chargers, which could draw up to 10kW, will be
known to EFL, since consumers and electricians must report significant changes in
connected loads. EV charger owners can therefore be asked to take TOU or maximum
demand tariffs, to recover the costs they impose on the network. They might also be
required to install chargers with demand response capability, so EFL can interrupt or
delay charging at times of network congestion or generation stress.18 Alternatively, it
could be a matter of policy not to recover these costs from EVs, as part of the public
subsidy that would almost certainly be required to encourage their uptake.
Information required to make an informed judgement
Operating revenue modelling could be combined with estimate of the landed costs of
EVs compared with ICVs and the import revenue raised. Table 4 illustrates the
differences in revenue at the point of import and over a 10-year operating life from new
vehicles of similar sizes but different propulsion types (although new EVs will probably
have higher landed costs than other types of similar size). As tariff and duties for EVs
have not yet been set, two estimates are given – if EVs were assessed at lower duties (at
the same rates as HVs) and at higher duties (at the same rate as ICVs). Table 5 shows a
similar calculation for used vehicle imports.
18 The Australian and New Zealand governments are considering a requirement that all residential EV
charging points must have demand response capabilities.
http://www.energyrating.gov.au/document/consultation-paper-smart-demand-response-capabilities-
selected-appliances

Energy and Transport Data Audit for Electrification of the Fiji Transport Sector 17
If vehicles of different types have different landed costs this will influence their retail
market price. The relationship is complex – retailers can generally charge higher
margins for higher price vehicles newly purchased by government and corporate fleets
than for used vehicles more likely to be purchased by income-constrained private
buyers. The retail purchase price estimates together with the retail fuel and energy price
projections and maintenance costs (which should be lower for EVs) will indicate the
purchase and operating costs to vehicle owners.
If the annual electricity consumption of EVs is projected, with an estimate of the share
supplied by public and home charging, the value of the electricity that would be sold
under current commercial and residential tariff structures (and possible alternative
structures) could also be calculated.
Table 4 Example of 10-year revenue calculation (new vehicle, CIF value $30,000)
Total
Import
Revenue(a)
10-yr
Energy
Revenue(b)
Import +
10yr
Revenue
Honda Jazz 1490 cc ICV 9000 9000 18000
Toyota Prius 1490 cc HV 4500 6120 10620
Nissan Leaf EV (low duties) (c) 9000 3340 12340
Nissan Leaf EV (high duties) (d) 4500 3340 7840 (a) based on Fiji tariffs and duties rates applying from 1 July 2019 (b) from Table 3 (c) Tariff
and duties as for HV. (d) Tariff and duties as for ICV
Table 5 Example of 10-year revenue calculation (used vehicle, CIF value $12,000)
Total
Import
Revenue(a)
10-yr
Energy
Revenue(b)
Import +
10yr
revenue
Honda Jazz 1490cc ICV 6240 9000 15240
Toyota Prius 1490cc HV 8600 6120 14720
Nissan Leaf EV (low duties) (c) 6240 3340 9580
Nissan Leaf EV (high duties) (d) 8600 3340 11940
(a) based on Fiji tariffs and duties rates applying from 1 July 2019 (b) from Table 3 (c) Tariff and duties
as for HV. (d) Tariff and duties as for ICV
Impact on national balance of payments
If the introduction of EVs leads to a net reduction of fuel imports, by displacing more
transport fuels than it adds to the demand for electricity generation fuels, this should
assist Fiji’s balance of payments. On the other hand, there would be an increase in the
value of vehicle imports if EVs cost more than the current mix of ICVs and HVs.
Information required to make an informed judgement
The operating costs modelling described in the preceding section previous should
contain all of the data required to project fuel imports and vehicle imports, in both
physical quantity and value terms.

Energy and Transport Data Audit for Electrification of the Fiji Transport Sector 18
Potential Negatives
Higher greenhouse gas emissions
If EVs simply transfer fuel combustion from vehicle engines to diesel generators, Fiji’s
greenhouse gas emissions could be higher compared with a BAU (no electrification)
scenario. This assessment requires consideration of the emissions-intensity of the
marginal source of generation on the grid, not the average generation. For example,
once existing hydro and other renewable capacity is fully utilised, it cannot be readily
expanded to meet future rises in electricity demand in Fiji.
Any daily and yearly shortfall between demand and supply will continue to be made up
by diesel. The output of new renewable capacity will be fully utilised as soon as it is
built, but diesel will almost certainly remain the marginal fuel when demand exceeds
renewable supply.
Information required to make an informed judgement
Careful projection of load growth with and without EVs, and the phasing of renewable
and non-renewable generation increments under both scenarios, will be necessary to
determine whether emissions will be higher or lower with EVs. Essentially, there will
be a “Business as Usual” (BAU) case with few, or minimal EVs, and a range of cases
where EVs are introduced at various rates (say 100 new EVs/yr, 1,000 and up to 10,000
– i.e. the rate achieved by HVs in the period 2015-2019).
In each scenario the change in generation output and fuel/renewables mix will be
influenced by the rate of EV growth, so the scenarios must be matched. The higher the
rate of EV growth the lower the rate of increase in emissions from transport fuels but
the higher the emissions from electricity generation. If a scenario shows that electricity
sector emissions growing faster than transport fuel emissions falling, it indicates that
national emissions from transport electrification will rise.
Vehicle costs
The take-up of vehicles (of any type) is a complex function of household incomes, the
absolute and relative price of vehicles and their fuel and other operating costs. Vehicle
price is a function of CIF price, taxes and duties and reseller margins. Government
policy will influence the relative prices of different vehicle types and fuel types though
excise and taxation.
Based on price differentials in other markets, it is likely that EVs will be significantly
more expensive than ICVs or HVs, especially as used models will be relatively scarce
for some years and there are competing markets for Japanese used EVs (e.g. New
Zealand).19 The cost of maintenance and servicing may also be different.
19 The cheapest new EV available in Australia, for example, costs about 25% more than an equivalent size
ICV. https://www.qld.gov.au/transport/projects/electricvehicles/about/compare

Energy and Transport Data Audit for Electrification of the Fiji Transport Sector 19
Higher vehicle prices may have some public policy benefits if they slow the growth rate
of car ownership and traffic congestion and encourage walking and cycling. However,
public transport may need to be strengthened to meet the demand for motorised
mobility. Conversely, if it is government policy to encourage EVs, then knowing the
price differentials will be necessary to calculate the amount of subsidy (as lower duty
and taxation rates or direct bounties) required to make them cost-competitive.
Information required to make an informed judgement
The Fiji vehicle market has responded strongly to the availability of HVs. The Fiji
automotive industry will be well aware of the price factors and other conditions that
brought this about and analysing the reasons will help with understanding likely EV
costs and their impact on the market. Market segments such as fleets may be less price-
sensitive.
Maintenance also affects vehicle ownership costs. The Fiji automotive industry has
considerable expertise in servicing conventional petrol and diesel engines, but EV
maintenance requires different skills and equipment. Some of these may already be
developing to service the growing fleet of hybrid vehicles, but other skills may only be
available in Fiji once the rate of EV introduction reaches certain thresholds. For
example, local firms will not be able to afford to send technicians to the EV-exporting
countries for training unless they are assured of a certain volume of work. The initial
feedback from Fiji car retailers is that the minimum sales volume to support this
investment is about 100 EVs per year.
Cost of charging infrastructure
There will need to be investment in charging infrastructure ahead of the growth in EV
numbers. The first public charging stations will be lightly used for some time, so may
need to be publicly owned or supported until they become commercially viable.
Depending on their location and capacity (kVA) in relation to the network, they may
also require network augmentation.
Information required to make an informed judgement
The costs of charging infrastructure (including any network augmentation) will be
significant, and the return on the investment will depend on the location and power of
the chargers, the rate of EV development, and the balance of public vs home charging
on the network. This is subject to a separate research project.
Battery costs (including end-of-life disposal)
There will be significant costs in replacing and disposing of lithium propulsion battery
packs, whether through a formal collection system or the environmental costs of
dumping. The costs could be reduced if a battery collection system is first set up for
hybrid vehicles.
Information required to make an informed judgement

Energy and Transport Data Audit for Electrification of the Fiji Transport Sector 20
The existing patterns of disposal of HV batteries will provide a useful case study, but
new research is necessary. The widespread use (and disposal) of automotive lithium ion
battery packs is relatively new in Fiji. The Fiji National Solid Waste Management
Strategy 2011-2014, published in 2011, refers to recycling of lead-acid batteries, but not
lithium ion.

Energy and Transport Data Audit for Electrification of the Fiji Transport Sector 21
3. Categories of Information Required
This section summaries the specific categories of data required to undertake the policy
studies and evaluations detailed in the preceding section.
The data categories have been grouped into three inter-related clusters:
• Fuels (transport and generation)
• Vehicles (transport equipment); and
• Travel and mobility.
For fuels and transport equipment, information is required for all stages from import
(and before import in some cases) to distribution, use and disposal. The travel behaviour
relevant to this project takes place within Fiji.
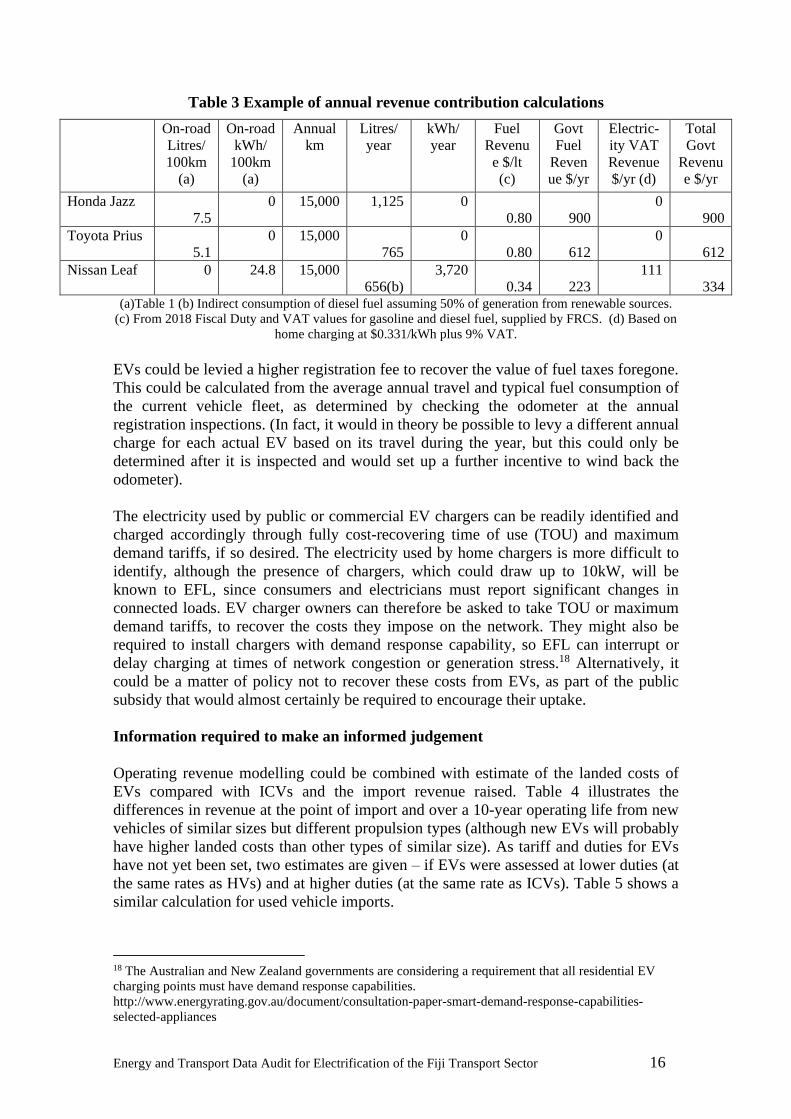
The clusters and stages are illustrated in Figure 1, along with the agencies broadly
responsible for collecting data at each stage. The main collections and publications of
data so far identified are listed in Table 6. The following section discusses the data
already collected (although not always available in the right form) and how it can be
used to support transport electrification planning and cost-benefit analysis.
Vehicles
Number and types of Vehicles
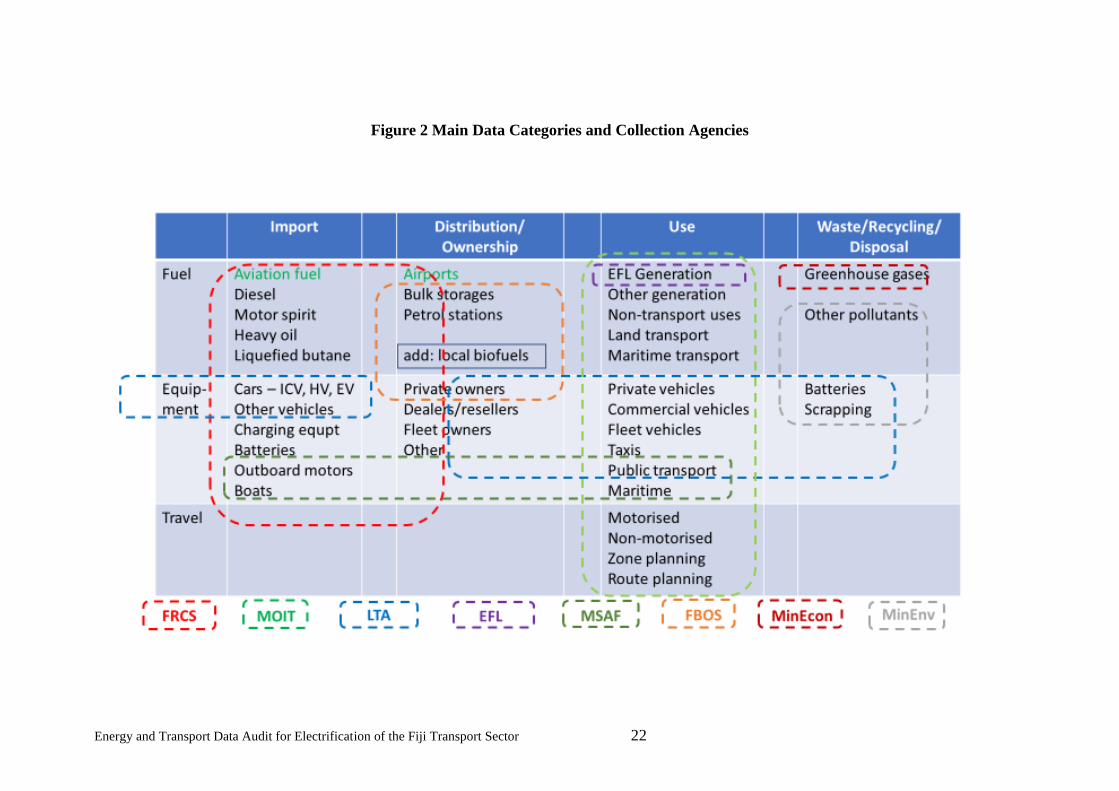
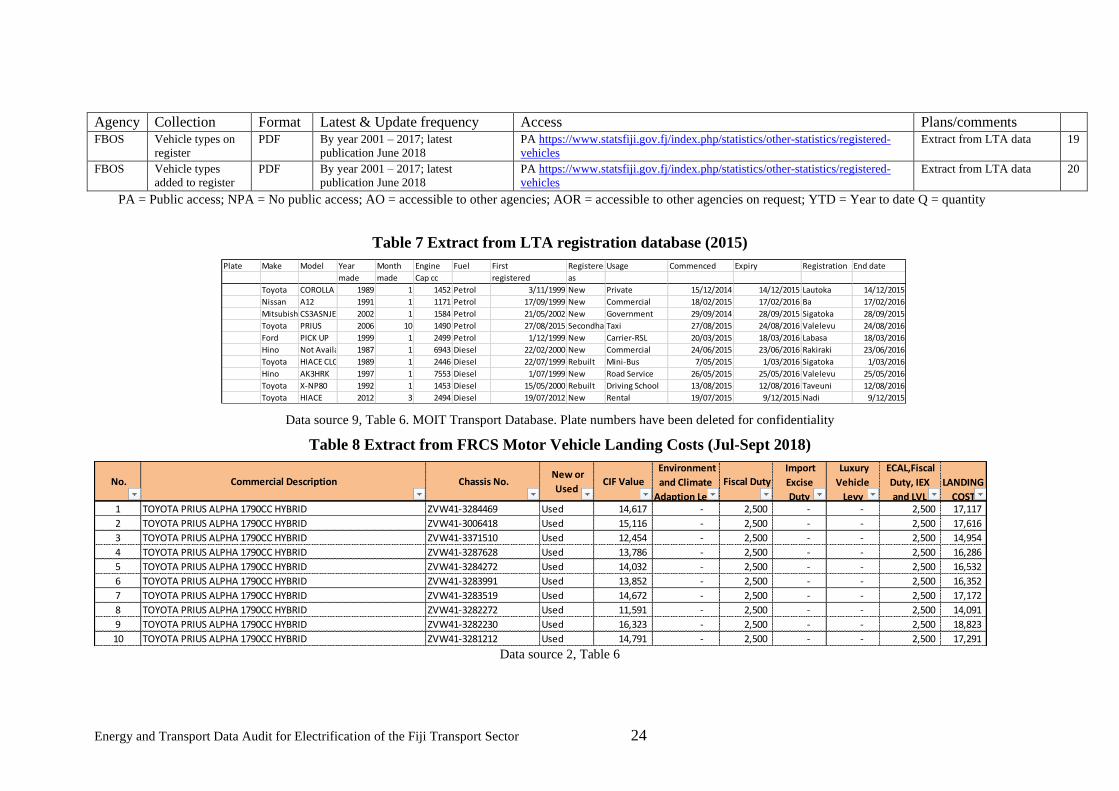
FRCS has published reports of imports of vehicles in a consistent format since July
2016, but the series may go back further. Some reports have been published as PDF and
some as XLS, but it is assumed that the underlying data are all held as XLS. An extract
is shown at Table 8.
The series identifies HVs because under Government policy they pay a concessional
duty. ICVs are not differentiated by type of fuel used (petrol or diesel). While this
information could possibly be reconstructed by (laboriously) matching models, it is
more easily recovered from the LTA registration database.
The trends in landed costs of different vehicle categories over time could be used (with
suitable multipliers for local wholesale and retail on-costs) as a proxy for retail prices.
The retail price trends could then be used to build and test a predictive model of vehicle
numbers (combined with projections of GDP, household income and other explanatory
factors).
The FRCS data series could also be used to calculate the revenue forgone through
concessional duty rates, and so inform the testing of revenue impacts of various duty
concession scenarios for EVs.
FRCS data may also help clarify the “distribution/ownership” stage of vehicle life,
because the custom clearance documentation could reveal the number of imports by
private owners, by fleet owners and by dealers/resellers.
Energy and Transport Data Audit for Electrification of the Fiji Transport Sector 22
Figure 2 Main Data Categories and Collection Agencies

Energy and Transport Data Audit for Electrification of the Fiji Transport Sector 23
Table 6 Summary of major data collections reviewed to date
Agency Collection Format Latest & Update frequency Access Plans/comments FRCS Fuel imports $ Regular NPA; AOR; passed to FBOS 1
FRCS Motor vehicle
landing costs (and
numbers)
Excel,
PDF $, Q
Mar 2019; approx quarterly since Jul
2016
https://www.frcs.org.fj/our-services/customs/doing-business-in-fiji/motor-
vehicles/
2
FBOS Mineral fuel
imports
Excel; $ 2019 YTD; Annual since 2005 https://www.statsfiji.gov.fj/index.php/statistics/economic-
statistics/merchandise-trade-statistics; AOR
Broken down to 5 types re-
exports significant
3
FBOS Road vehicle
imports
Excel; $ 2019 YTD; Annual since 2005 As above Not further broken down 4
FBOS Census PDF 2017; every 10 years Some PA; AOR Plan future questions 5
MOIT Fiji Household
Travel Survey
PDF 2015 (several reports);
NPA, AOR (registered users only) https://www.transportfiji.info/wp-
login.php?redirect_to=https%3A%2F%2Fwww.transportfiji.info%2F&reauth=1
2017 completed but not
uploaded; 2020 planned
6
MOIT Cruise calls XLS 2014-15; not updated since As above 7
MOIT Vehicle Licence
Data
? ? As above Restricted even to
registered users
8
MOIT Vehicle
registrations
XLS 2015; not updated since As above 102,000 records; obviously
from LTA
9
MOIT Bus routes &
timetables
XLS 2015; not updated since As above 10
MOIT Uneconomic
Maritime routes
XLS 2015; not updated since As above Includes CO2 estimates 11
MOIT Economic
Maritime routes
XLS 2015; not updated since As above Includes CO2 estimates 12
MOIT Domestic air
routes
XLS 2015; not updated since As above Includes litres fuel and
CO2 estimates
13
LTA Vehicle
registrations
PDF 2018; annual since 2000 PA https://lta.com.fj/docs/default-source/lta-publications/lta-
factsheets/factsheet-1-total-vehicle-registrations-final.pdf?sfvrsn=6
Summary by registration
class, not vehicle type
14
LTA Vehicle
registrations
PDF July 2017; occasional fact sheet PA https://lta.com.fj/docs/default-source/lta-publications/lta-
factsheets/factsheet-5--valid-vehicles-july2017.pdf?sfvrsn=2
Summary by registration
and vehicle type
15
LTA License holder PDF July 2017; occasional fact sheet PA https://lta.com.fj/docs/default-source/lta-publications/lta-
factsheets/factsheet-6--valid-license-holders-july2017.pdf?sfvrsn=2
16
LTA Monthly regs,
2017 cf 2016.
PDF July 2017; occasional fact sheet PA https://lta.com.fj/docs/default-source/lta-publications/lta-
factsheets/factsheet-7--vehicle-registration-comparison16v17.pdf?sfvrsn=2
Shows surge in 2016 – can
match with FCAS data
17
LTA Age profile of
buses and taxis
XLS This version created by LTA 4 April
2019
AO 18
Energy and Transport Data Audit for Electrification of the Fiji Transport Sector 24
Agency Collection Format Latest & Update frequency Access Plans/comments FBOS Vehicle types on
register
PDF By year 2001 – 2017; latest
publication June 2018
PA https://www.statsfiji.gov.fj/index.php/statistics/other-statistics/registered-
vehicles
Extract from LTA data 19
FBOS Vehicle types
added to register
PDF By year 2001 – 2017; latest
publication June 2018
PA https://www.statsfiji.gov.fj/index.php/statistics/other-statistics/registered-
vehicles
Extract from LTA data 20
PA = Public access; NPA = No public access; AO = accessible to other agencies; AOR = accessible to other agencies on request; YTD = Year to date Q = quantity
Table 7 Extract from LTA registration database (2015)
Plate Make Model Year Month Engine Fuel First RegisteredUsage Commenced Expiry Registration End date
made made Cap cc registered as
Toyota COROLLA AE70 1989 1 1452 Petrol 3/11/1999 New Private 15/12/2014 14/12/2015 Lautoka 14/12/2015
Nissan A12 1991 1 1171 Petrol 17/09/1999 New Commercial 18/02/2015 17/02/2016 Ba 17/02/2016
MitsubishiCS3ASNJER 2002 1 1584 Petrol 21/05/2002 New Government 29/09/2014 28/09/2015 Sigatoka 28/09/2015
Toyota PRIUS 2006 10 1490 Petrol 27/08/2015 SecondhandTaxi 27/08/2015 24/08/2016 Valelevu 24/08/2016
Ford PICK UP 1999 1 2499 Petrol 1/12/1999 New Carrier-RSL 20/03/2015 18/03/2016 Labasa 18/03/2016
Hino Not Available 1987 1 6943 Diesel 22/02/2000 New Commercial 24/06/2015 23/06/2016 Rakiraki 23/06/2016
Toyota HIACE CLOSE VAN1989 1 2446 Diesel 22/07/1999 Rebuilt Mini-Bus 7/05/2015 1/03/2016 Sigatoka 1/03/2016
Hino AK3HRK 1997 1 7553 Diesel 1/07/1999 New Road Service 26/05/2015 25/05/2016 Valelevu 25/05/2016
Toyota X-NP80 1992 1 1453 Diesel 15/05/2000 Rebuilt Driving School 13/08/2015 12/08/2016 Taveuni 12/08/2016
Toyota HIACE 2012 3 2494 Diesel 19/07/2012 New Rental 19/07/2015 9/12/2015 Nadi 9/12/2015
Data source 9, Table 6. MOIT Transport Database. Plate numbers have been deleted for confidentiality
Table 8 Extract from FRCS Motor Vehicle Landing Costs (Jul-Sept 2018)
No. Commercial Description Chassis No. New or
Used CIF Value
Environment
and Climate
Adaption Levy
Fiscal Duty
Import
Excise
Duty
Luxury
Vehicle
Levy
ECAL,Fiscal
Duty, IEX
and LVL
LANDING
COST 1 TOYOTA PRIUS ALPHA 1790CC HYBRID ZVW41-3284469 Used 14,617 - 2,500 - - 2,500 17,117
2 TOYOTA PRIUS ALPHA 1790CC HYBRID ZVW41-3006418 Used 15,116 - 2,500 - - 2,500 17,616
3 TOYOTA PRIUS ALPHA 1790CC HYBRID ZVW41-3371510 Used 12,454 - 2,500 - - 2,500 14,954
4 TOYOTA PRIUS ALPHA 1790CC HYBRID ZVW41-3287628 Used 13,786 - 2,500 - - 2,500 16,286
5 TOYOTA PRIUS ALPHA 1790CC HYBRID ZVW41-3284272 Used 14,032 - 2,500 - - 2,500 16,532
6 TOYOTA PRIUS ALPHA 1790CC HYBRID ZVW41-3283991 Used 13,852 - 2,500 - - 2,500 16,352
7 TOYOTA PRIUS ALPHA 1790CC HYBRID ZVW41-3283519 Used 14,672 - 2,500 - - 2,500 17,172
8 TOYOTA PRIUS ALPHA 1790CC HYBRID ZVW41-3282272 Used 11,591 - 2,500 - - 2,500 14,091
9 TOYOTA PRIUS ALPHA 1790CC HYBRID ZVW41-3282230 Used 16,323 - 2,500 - - 2,500 18,823
10 TOYOTA PRIUS ALPHA 1790CC HYBRID ZVW41-3281212 Used 14,791 - 2,500 - - 2,500 17,291 Data source 2, Table 6

Energy and Transport Data Audit for Electrification of the Fiji Transport Sector 25
The Final Fiji National Transport Planning Database (data source 6 in Table 6) reports
that 24% of urban households and 12% of rural households in Fiji own a car.20
Matching vehicle ownership to household income is best done with current and future
surveys by The Fiji Bureau of Statistics (FBOS). The upcoming Household Income and
Expenditure Survey (HIES) could ask questions not just about the number of vehicles
(if any) owned or used by the household but the broad technology type of each: whether
HV, diesel ICV or petrol ICV. In the longer term, as vehicle types are introduced, the
same categories should be used in FBOS surveys as in the LTA database (see below).
The most complete data on the vehicle fleet is of course the LTA’s registration
database, which is updated continuously as vehicles are registered, re-registered, or
removed. No vehicle register is perfect: there are always some unregistered vehicles,
and some vehicles still on register may have been scrapped, retired or stolen. However,
the need for annual re-registration means that these do not stay on register indefinitely.
Figure 3 illustrates the total number of vehicles on the register at the end of each year,
and Figure 4 the number added to the register each year. One of the limits on the rate at
which EVs can enter the fleet is the rate of new registrations – e.g. for cars it is about
9,000 per year. Combining the two data sets will give the notional number of annual
retirements and test the internal consistency of the data (see Appendix 4).
Table 7 shows an extract from the 2015 LTA register. It is understood that a number of
enhancements are planned for the LTA database which will increase its value to all
users, including transport policy makers:
• It will show vehicle type (car, bus, motorcycle, trailer etc); so, this will not need
to be inferred from ‘usage’ registration;
• It will include “propulsion” type (petrol, diesel, HV, PHV, EV, Hydrogen); and
• It will show the emissions tier of the vehicle (Pre-euro, Euro 1-7 etc);
• There will be a follow-up procedure to check what happens to vehicles whose
registration is not renewed; and
• The ability of the database to produce reports will be improved.21
It is assumed that this information will be collected for new registrations after June
2019, but it is not clear how much can be recovered for previously registered vehicles.
In the meantime, it is possible to estimate HV numbers from the model designations. In
2015 there were 966 Toyota Prius’ on the register. (There are also other models of HV,
but the Prius was and remains the most common). This was just before the surge in HV
imports.22
The LTA database indicates the size of the vehicle fleets that might be leaders for
electrification, but the distribution of vehicle types within those fleets varies. For
example, it is understood that only about 10% of the government fleet is cars - the rest
are 4-wheel drives and light good vehicles (LGVs). Most of the taxi, hire and rental
fleets are cars. Conversely, a number of private cars operate as informal taxis
20 Fiji National Transport Database Final Report April 2016, p26. Cars for private use only; excludes
other registered vehicles such as buses, trucks and taxis). 21 Information from CEO of LTA at workshop on 28 June 2019. 22 Industry sources in Fiji estimate that 11,500 HVs were imported in 2016 alone, and another 4,600 have
been imported since. The FRCS data could provide a more accurate number.

Energy and Transport Data Audit for Electrification of the Fiji Transport Sector 26
Figure 3 Total vehicle registrations, 2001 - 2018
Source: Author analysis of FBOS data sources 19 and 20, Table 6 and information direct from LTA on
registrations for the years 2014-2018. FBOS data are sourced from LTA and agree completely the
separately supplied LTA data up to 2016. However, there is a small (0.3%) discrepancy between the two
sources for a 2017 and a 5.3% discrepancy for 2018. It is assumed that the data provided directly by LTA
are accurate and have been used to produce the graph above.
Figure 4 New registrations each year, 2001 – 2018
Source: Author analysis of FBOS data sources 19 and 20, Table 6.

Energy and Transport Data Audit for Electrification of the Fiji Transport Sector 27
Market Conditions
Fiji
The LTA database indicates whether vehicles were first registered as new, second-hand
or rebuilt. The 2015 breakdown shown in Table 9 indicates that vehicles imported new
accounted for 47% of the register.23 It is likely that this share is rapidly falling – of the
2394 vehicles landed in the first quarter of 2019, nearly two-third were used HVs (Data
source 2, Table 6). Fully 90% of all cars imported in that period were used HVs from
Japan. To fully understand the circumstances that led to this it is necessary to analyse
the source market.
Table 9 Total Vehicle Registrations by New/Used, 2015
New 47813 47.0%
Second-hand 45299 44.6%
Rebuilt 8404 8.3%
Unknown 140 0.1%
TOTAL 101656 100.0% Source: Author analysis of Data sources 2, Table 6
Source Markets
At present used HVs are price-advantaged in a number of ways:
• the Japanese second-hand vehicle market is over-supplied with used HVs,
and it is costly to scrap these in Japan due to high environmental standards.
Under the Automobile Recycling Law of 2005, vehicles must be sent to
licensed recycling facilities, and refrigerants and air bags removed before the
rest is scrapped;24
• The market value of used vehicles in Japan is low, and about 20% of end of
life vehicles are available for export cheaply and in large quantities to right-
hand-drive (RHD) markets like Fiji; and
• due to Fiji government policy, new and used HVs attract lower rates of
excise and import duty than other vehicle types.
The conditions of the EV market in Japan are quite different. In 2017 there were less
than 100,000 EVs registered in Japan, compared with 7.5 million HVs. In 2018 only
32,000 pure EVs and 20,000 plug-in hybrid vehicles (PHVs) were sold new in Japan.
compared with 570,000 HVs.25 This indicates that used Japanese EVs are not likely to
be available in quantity for many years.
Of the other possible Asian source countries, China has by far the largest EV fleet (2.5
million) but the South Korea EV fleet is even lower than Japan. In any case, they are
unlikely to become sources of second-hand vehicles for Fiji because they are left-hand-
23 It is not known whether “rebuilt” vehicles were imported already rebuilt or rebuilt in Fiji. 24 https://www.japanfs.org/en/news/archives/news_id027816.html 25 About 18,000 units in 2018. https://wattev2buy.com/global-ev-sales/

Energy and Transport Data Audit for Electrification of the Fiji Transport Sector 28
drive (LHD) countries whereas Fiji is a RHD country. The LTA does not permit the
registration in Fiji of LHD cars, for road safety reasons.
The Chinese EV industry is currently focussed on supplying local demand, but over
time it very likely that it will begin exports to both LHD and RHD markets. These will
probably be much cheaper than US, European, and Japanese-made EVs, and this may
eventually result in significant imports of new Chinese EVs to Fiji.26
Monitoring of the EV markets in Japan and China with regard to trends in technology
and price is therefore advisable. The LTA may be well placed to monitor the Japanese
market, through its existing contracts with vehicle inspection agencies there.
Other Pacific Markets
Fiji will not be the only market in the region for used RHD EVs. A majority of the
15,000 EVs registered in New Zealand, a RHD country like Fiji, are second-hand
Nissan Leafs from Japan.27 Australia has more restrictions on used car imports, so only
new EVs can be imported.28 This greatly increases the price of EVs in Australia which,
together with a lack of government incentives and a low density of public charging
stations, has meant that the Australia has only about 10,000 EVs out of a vehicle fleet of
about 19.5 million.
While the Australian market will not be competing with Fiji for used EVs, the New
Zealand market will. This means that at first the most likely types of EVs available in
Fiji will be very expensive new vehicles or poor-quality used vehicles. In due course
China may enter the RHD EV export market and lead to a drop in new EV prices.
Technology and Efficiency
The fuel use and emission impacts of vehicle electrification depend partly on the
relative energy-efficiency of the EVs and the probable alternatives, whether ICVs or
HVs. The comparison example in the previous chapter was based on the reported
efficiencies of 16.5 kWh per 100 km for a Nissan Leaf and 3.4 litres/100 km for a
Toyota Prius.
In-use fuel consumption is almost always higher than the values reported from standard
dynameter tests. Prasad & Raturi (2018) report about 5.1 litres/100 km (19.8 km/litre)
based on their own survey of a sample of Fiji HV owners – about 50% higher than the
reported test value.29 It is likely that the on-road consumption of EVs would also be
higher than reported test values. However, while there is a long history of reliable
information on the actual efficiency and fuel use of ICVs and HVs, there is little
reported yet on the actual efficiency of EVs.30 This should be a focus for research with
the first EVs imported to Fiji.
26 https://theconversation.com/the-electric-vehicle-revolution-will-come-from-china-not-the-us-116102 27 https://theconversation.com/new-zealand-poised-to-introduce-clean-car-standards-and-incentives-to-
cut-emissions-120896 28 https://www.carsales.com.au/editorial/details/new-grey-import-laws-the-facts-108526/ 29 For HV taxis, Prasad & Raturi report 3.7 litres/100km and an average VKT of 69,400. 30 https://www.hindawi.com/journals/jat/2017/4695975/ provides a useful list of references.
Energy and Transport Data Audit for Electrification of the Fiji Transport Sector 29
The energy use of Plug-in hybrid vehicles (PHVs) is even more difficult to establish.
EVs, HVs and ICVs each use only a singly form of energy (electricity or fuel) whereas
PHVs can be topped up either by the fuel tank or the plug, so it is necessary to monitor
the consumption of both energy forms. The manufacturer-reported fuel and electricity
consumption values of PHVs need to be treated with special caution, because under
some standards the test may start with a fully charged battery that is depleted during the
test, but the energy that would be required for recharging it (whether from the plug or
by running the engine) is not added to the reported fuel consumption.31
Maritime
The prospects for electrification in maritime transport are limited compared with land
transport, but there may be some opportunities with outboard motors in small craft, and
with ferries on selected short routes. Electric outboard motors rated up to 42kW
(equivalent to 70 HP) and inboard marine motors of up to 50 kW are now available.32
According to analysis of MSAF data by Prasad and Raturi (2019) there are about 1,800
registered small craft (<15m) in Fiji. About a quarter of these are owned by resorts and
tourism operators, with fleets of up to 8 craft per resort. Electric outboard motors have
advantages from the viewpoint of noise, air and water pollution, which would make
them attractive for resort use. Electrifying resort fleets also has comparable “eco-
marketing” attractions to including EVs in rental car fleets.
There may also be opportunities for small craft operating out of the main urban centres
on Viti Levu to use electric outboards. However, practicality and safety issues would
limit electrification of small craft on the outer islands. Carrying spare fuel for longer
trips is a routine matter (and verifiable by inspection) but ensuring that batteries are
sufficiently charged is more complex. Furthermore, many of the outer island villages
have limited electricity supply or none at all, so there is no capacity for recharging
unless the vessel also carries enough PV panels.
The information needed to investigate these options includes:
• The number of resorts owning and operating small craft powered by outboards;
• The size of each fleet, the type of outboards used (2-stroke or 4-stoke) and the
patterns of use (number of trips, routes and time available for charging between
trips);
• Electricity supply and recharging capability; and
• Whether the resort owners/managers have considered or would be prepared to
consider.
This type of information is best collected by a targeted survey, with sample groups
based on MSAF registration data.
31
http://www.google.com/url?sa=t&rct=j&q=&esrc=s&source=web&cd=15&ved=2ahUKEwj7iqfE0_ziAh
UOb30KHYB2Af4QFjAOegQICBAC&url=http%3A%2F%2Fwww.mdpi.com%2F2032-
6653%2F5%2F1%2F196%2Fpdf&usg=AOvVaw0j4beTtjdFnbk535t8FF35 32 http://www.aquawatt.at/GB/elektro_aussenbordmotoren_14_GB.html

Energy and Transport Data Audit for Electrification of the Fiji Transport Sector 30
Short-haul ferries may provide an opportunity for electrification. At present the shortest
inter-island routes may be impractical, but if new commuter routes are established in
and around Suva harbour – to Lami and Nausori, example – then electric ferries may be
practical.
Travel
The demand for motorised transport is a subset of the demand for travel (moving
people) and the demand for freight (moving goods). The 2015 National Household
Travel Survey (HTS 2015) reported that walking is by far the most common mode of
travel in rural and maritime areas.
In urban areas, 36% of trips were by walking, 27% by private vehicles, 25% by buses
and 12% by taxis (12%). As the number of passenger vehicles has increased faster than
population since 2015 (for reasons still to be fully analysed), it is likely that the
motorised share of urban transport is rising. Nevertheless, walking is probably still the
dominant mode even in urban areas, and needs to be catered for in transport planning.
Vehicle Usage
The length of vehicle trips undertaken for various purposes, especially to/from work, is
a key input into assessing the prospects for electrification. The 2015 HTS reports trip
lengths for all modes (Table 34) but does not cross-tabulate with mode or purpose. This
information should be extracted from the base data, which is apparently available at
source 6 in Table 6, but is not currently accessible to researchers. The Fiji National
Transport Planning Database Final Report reports the average length per car trip as 9.3
km in urban areas but does not report the average daily VKT.
The best available published data on annual vehicle use is from a March 2017 survey of
320 randomly selected drivers, undertaken by Prasad and Raturi (2018). On the basis of
responses, they estimate an average usage of 14,800 km/yr for private cars, 69,400
km/yr for taxis, rental and hire cars, 89,800 km/yr for mini vans and 142,800 km/yr for
buses. On this basis the average daily VKT for private vehicles would be 40.5 km (well
within the range of even a partially charged EV) and for taxis 190km (possibly
requiring some recharge during a working day).
The LTA should be in a position to collect reliable annual usage figures from all
120,000 registered vehicles. It is understood that the vehicle odometer reading is
recorded at the time of annual inspection, but that this information is not entered against
the vehicle on the registration database. If paper records have been retained, then these
could be analysed. Alternatively, the LTA might consider making a change to its data
management systems to start recording this information.
At present there is no survey comparable to the HTS covering freight transport. Short-
haul urban delivery vehicles are another target segment for electrification, so an urban
freight survey on the number, type and operations of such vehicles and their average
loading would be required. At the first workshop it was reported that:

Energy and Transport Data Audit for Electrification of the Fiji Transport Sector 31
• the Fiji Road Haulage Association is undertaking a survey which should help the
assessment of the scope for electrified urban delivery vehicles;
• the Fiji Bus Operators Association is undertaking a survey which should yield
information on bus routes and overnight garaging, which should help identify
the most likely routes and charging options for electrification of bus services.
A larger survey of commercial taxi and hire car operators could also be undertaken, to
verify the findings of Prasad and Raturi (2018). Confidentiality would have to be
guaranteed so that informal taxi operators would also feel able to participate.
Fuels
Calculating the emissions from the use of fuels requires information on the physical
quantity of each type of fuel used. The FRCS and FBOS publicly report imports of the
main fuel types by revenue, but not by physical quantity. Physical quantities can be
obtained from FRCS and FBOS on request. Prasad and Raturi (2018) have published an
estimate of litres of retained fuel imports (imports less exports) for each fuel type from
2010 to 2017, which they attribute to a personal communication from FBOS. This type
of information is routinely published in other countries, and it is unusual that it should
be subject to a special request.
Annual quantities vary considerably, but mainly due to large fluctuations in aviation
fuel retained imports. However, as all aviation fuel is used in aviation these values can
be subtracted to yield a much smoother trend in the other fuels: ADO, LPG, gasoline
and residual/heavy fuel oil.
However, annual retained imports do not necessarily equate to annual fuel consumption
because:
• There are several points of storage along the supply chain, including dockside
bulk storages and the tanks of petrol stations. If the volumes held in storage
fluctuate significantly between periods, this would impact on estimates of
consumption; and
• Locally products biofuels (ethanol and biodiesel) may be added to the fuel
stream.
The three main categories of use for non-aviation fuels use are land transport, maritime
transport and electricity generation, along with minor use for other purposes such as
LPG for cooking and water heating.
It is possible to estimate the fuel used by each of these sectors by either “bottom-up” or
“top-down” methods.
Bottom-up methods involve estimating the annual usage (VKT) of each type of vehicle
or vessel and multiplying by an estimate fuel consumption value (litres/km). Electricity
generation comprises three main components: large EFL diesel generators, smaller EFL
plant and private generators of various sizes. Again, fuel use can be inferred “bottom-
up” for the largest generators, by multiplying the GWh generation values in EFL’s
annual reports by typical litres/kWh values for large plant.
Energy and Transport Data Audit for Electrification of the Fiji Transport Sector 32
However, small errors in assumptions of values such as litres/km, annual VKT and
litres/kWh generated will lead to large errors in overall fuel estimates. Therefore, it is
necessary to reconcile with top-down data:
• actual fuel consumption values from the largest commercial fuel users who keep
centralised purchasing records, such as bus, taxi and hire car fleet operators,
shipping companies, EFL and large private generators; and
• storage and distribution data from fuel distributors.
Much of this data will be commercial-in-confidence and the entities concerned will be
reluctant to provide it. However, it is understood that FBOS has the statutory right to
require such information, as well as the obligation not to disclose it in a way that
compromises confidentiality. For example, if there are too few companies operating in a
particular sector, publication of amalgamated data could allow companies to infer the
data for their competitors.

Energy and Transport Data Audit for Electrification of the Fiji Transport Sector 33
4. Organising and Facilitating Information Flows
The electrification of the transport sector is clearly a matter of great interest to the Fiji
Government, as indicated by Ministerial statements and some budget tax concessions
and incentives.33 It would be a development with very significant environmental,
economic and social implications, both positive and negative, as indicated in Chapter 2.
Estimating and projecting the outcomes with sufficient confidence to make judgements
of the balance of costs and benefits needs to be grounded in reliable information on
transport fuel use, vehicle efficiency and technology and travel and mobility. The
existing collections of information on these subjects identified during this project are
presented in Chapter 3. This chapter relates the roles of the various agencies and
identifies some gaps, bottlenecks and opportunities.
Agency Roles
The general area of responsibility of each agency with respect to the data categories
needed for transport electrification planning is illustrated in Figure 2. Another way to
map the roles of the various agencies is shown in Figure 5. The policy development at
the apex of the pyramid needs to be solidly based on actual data readily available for
decision-making.
As it happens, the base of the pyramid is well established already. Several agencies
routinely collect relevant data, although they do not necessarily make it all public, or
not in a consistent and accessible form. The FRCS collects data on all imports, by value
as well as by physical quantity. Some of this is published, in a great deal of detail for
some collections, such as vehicle imports, and all of it is available to FBOS.
FRCS categorisation of import data is constrained by two major sets of factors: the
international ASCUYDA classification system34 and the rates of duty and excise applied
to different products and commodities under Fiji law and government policy – for HVs,
for example. It will be necessary to ensure that the classification and data systems are
consistent with product categories expected from transport electrification: EVs suitable
for road registration,35 spare parts such as propulsion battery packs and traction motors,
commercial charging stations and domestic charging stations.
FBOS receives primary data from FRCS and other data collecting agencies (LTA and
MSAF) and also undertakes its own data collections, including key surveys such as the
Census and the Household Income and Expenditure Surveys. For completeness, it also
33 See for example speech by Minister for Transport July 3 2019
https://www.youtube.com/watch?v=YQv_p5VQY4E Incentives in the 2018-19 budget included a 55 per
cent capital deduction for any purchase of an electric vehicle, and a seven-year income tax exemption for
any business setting up EV charging stations, provided they invest more than $500,000. There has been
no take-up. The only measure in the 2019-2020 budget to support the policy is a VAT exemption for
“Hybrid and electric ships”. 34 https://asycuda.org/en/about/ ASYCUDA is a computerised customs management system which covers
most foreign trade procedures. The system handles manifests and customs declarations, accounting
procedures, transit and suspense procedures. It generates trade data that can be used for statistical
economic analysis. The ASYCUDA software is developed in Geneva by UNCTAD. 35 As distinct from electric golf buggies, of which there are over 2,300 in Fiji already, according to LTA.
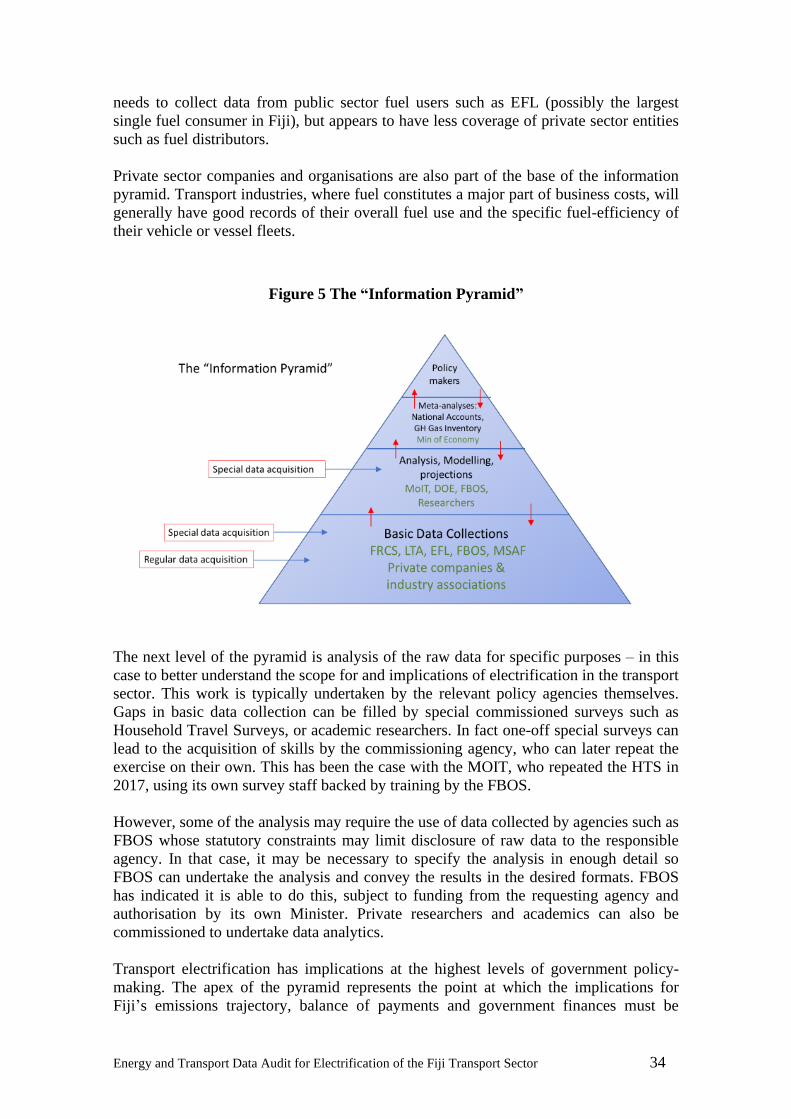
Energy and Transport Data Audit for Electrification of the Fiji Transport Sector 34
needs to collect data from public sector fuel users such as EFL (possibly the largest
single fuel consumer in Fiji), but appears to have less coverage of private sector entities
such as fuel distributors.
Private sector companies and organisations are also part of the base of the information
pyramid. Transport industries, where fuel constitutes a major part of business costs, will
generally have good records of their overall fuel use and the specific fuel-efficiency of
their vehicle or vessel fleets.
Figure 5 The “Information Pyramid”
The next level of the pyramid is analysis of the raw data for specific purposes – in this
case to better understand the scope for and implications of electrification in the transport
sector. This work is typically undertaken by the relevant policy agencies themselves.
Gaps in basic data collection can be filled by special commissioned surveys such as
Household Travel Surveys, or academic researchers. In fact one-off special surveys can
lead to the acquisition of skills by the commissioning agency, who can later repeat the
exercise on their own. This has been the case with the MOIT, who repeated the HTS in
2017, using its own survey staff backed by training by the FBOS.
However, some of the analysis may require the use of data collected by agencies such as
FBOS whose statutory constraints may limit disclosure of raw data to the responsible
agency. In that case, it may be necessary to specify the analysis in enough detail so
FBOS can undertake the analysis and convey the results in the desired formats. FBOS
has indicated it is able to do this, subject to funding from the requesting agency and
authorisation by its own Minister. Private researchers and academics can also be
commissioned to undertake data analytics.
Transport electrification has implications at the highest levels of government policy-
making. The apex of the pyramid represents the point at which the implications for
Fiji’s emissions trajectory, balance of payments and government finances must be

Energy and Transport Data Audit for Electrification of the Fiji Transport Sector 35
assessed. The relevant agencies, including Treasury and the Climate Change and
International Cooperation division are within the Ministry of Economy.
Constraints, bottlenecks and gaps
While much of the information required for informed policy-making regarding the
electrification of transport in Fiji is already being collected, or could be collected at
relatively low cost, there are still constraints and bottlenecks.
Constraints
Constraints are legal restrictions on information flow, often for good public policy
reasons. Some agencies are limited by their legislation in what they can release to the
public, or even to other agencies. For example, FBOS is restricted by commercial
confidentiality rules. Even though data publication is always anonymous – stripped of
names – if there are only a few companies operating in a sector then each company may
be able to infer the data for the others by subtracting its own data. This may be the case
for petroleum product sales, for example, where there are relatively few large
companies operating in Fiji.
Personal privacy is another constraint. Collections of data relating to individuals or
households should not be transferred to other agencies (let alone published) in a form
that permits data records to be directly or indirectly linked to named individuals. For
most surveys, names must sometimes be retained for a while to permit re-survey of a
small proportion of the total sample to ensure quality control.36 Once verification is
complete, the data set should be anonymised by permanently removing names.
Legal constraints do not necessarily prevent one agency supplying information to
another, provided that the receiving agency is aware of the legal constraints, undertakes
to observe them and has the internal data management procedures and systems to
maintain confidentiality. Rather than decide this on a case by case basis, these matters
should be covered in written agreements between the agencies.
It could be argued that some data does not need to be made public, so long as it is made
available to the agencies responsible for formulating policy, and (with the appropriate
safeguards) to their agents (e.g. consultants and researchers). However, making data
public increases the likelihood that academics and other researchers will use it for
independent analyses, which would reinforce the diversity and robustness of policy
inputs at low cost to the government. It would also create a group of regular users, who
could check for internal inconsistencies and act as a form of quality control.
Making data public where possible also makes it easier for agencies to know of and
access each other’s holdings. The present project found some instances where people
were unaware that the data they were interested in, was published on the website of
another agency. Making data public also saves time, since agencies do not need to
36 Some data collections require repeat survey of the same cohort of individuals at intervals over several
years, but these are generally restricted to health studies and should not be required for transport and
energy data.
Energy and Transport Data Audit for Electrification of the Fiji Transport Sector 36
respond to and consider special data requests. The default position should be that all
information that is not subject to legal, commercial confidentiality or privacy
constraints should be made public at a periodic manner.
Bottlenecks
Bottlenecks are administrative rather than legislated limitations on the flow of the
information necessary to support transport electrification. They include:
• Unnecessarily high levels of seniority required to initiate data requests to other
agencies, to authorise that requests be granted and classify and clear material for
upload to data repositories
• Slight differences in what is acquired/recorded; e.g. FRCS records whether a
vehicle is a HV (because of excise treatment) but not type of fuel (diesel,
gasoline). Until now, LTA has done the opposite (but this is to be rectified in
future data acquisitions);
• Maintaining data in hard-to-access media or formats; e.g. keeping annual
odometer readings on paper forms but not entering them into the LTA database.
In general, agencies coming under the same Ministry can exchange information more
freely than agencies in different Ministries. For example, the TPU should be able to
obtain data on request from DOE, LTA, MSAF, although as a statutory body with
commercial interests, EFL is in a different category.
Data exchange between ministries appears to be a bottleneck. If MOIT wishes to have
regular access to key data, it should consider developing MOUs with FRCS and FBOS
for that purpose. FBOS for example has two levels of agreement with agencies –
Memorandum of Understanding (MOU) and Agreements.37 MOIT has an Agreement
only. At present all data requests to FRCS must be referred to the FRCS CEO. Again,
there is the possibility of MOUs with other agencies, and there are some with agencies
that require data from FRCS to meet their own regulatory obligations.
Among matters such as confidentiality, MOUs could cover the frequency of data
reporting and useability issues such as availability in Excel rather than PDF, and
provision of physical quantities as well as monetary values.
The availability of MOIT’s own information could also be improved. The National
Transport Planning Database (NTPD) is a good repository of relevant data, surveys and
policy studies. However, it does not appear to have been updated since it was set up in
2015. It is understood that later information is waiting to be uploaded, including the
2017 HTS. However, only a small number of senior officers can give clearance to
upload information.
Access to the NTPD is restricted, in that users must apply and be cleared for access by
MOIT. There appears to be a higher level of access, in that some data sets listed are not
37 At present FBOS has only three MOUs – with FRCS (https://www.frcs.org.fj/news/2018-2/frcs-and-
fbos-sign-mou/), the Fiji National Provident Fund FMPF and Investment Fiji.
Energy and Transport Data Audit for Electrification of the Fiji Transport Sector 37
accessible even to approved users.38 Other material is clearly non-sensitive, and there is
no reason for it not to be in the public domain.
The NTPD would be more useful if there were three levels of access: public, low-level
restricted and high-level restricted. MOIT could then then develop guidelines for data
classification, so that only material that meets the highest level of sensitivity needs to be
referred to senior officers for approval to upload. Information that has been published
elsewhere or compiled from published sources should automatically be classified as
public and given unrestricted access on the NTPD.
Gaps
There are gaps in analysis, which can be addressed using existing data, and there are
gaps in data availability. One example of a gap in analysis is the recent surge in the
hybrid share of vehicles imported to Fiji. This provides an ideal case study to inform the
development of electrification policy - how was the HV policy developed, what factors
helped its implementation and what have been the consequences, both positive and
negative?
It is obvious that the safe disposal of batteries is already a major issue with HVs and
would be an even greater issue with EVs. This makes it urgent to understand the
numbers and lifecycle of lithium ion vehicle batteries in Fiji, and to develop a plan for
their management and safe disposal.
Although there is much data already being collected, gaps include:
• A road freight survey, to complement the Household Travel Survey (some gaps
may be filled by data being collected by the Fiji Road Haulage Association);
• Surveys of car fleet operators and drivers, to assess their travel patterns and the
scope for accommodating EV use and recharging (by time and location);
• Tourism industry EV research: surveys of small boat operations at resorts and
tourist car rentals, to assess usage patterns, tourist attitudes to EVs and electric
outboards and the scope for recharging; and
• VKT data – this could be collected through the LTA registration system.
Further details of activities to address these and other gaps are given in Chapter 5.
International Data
There are three relevant categories of data from international sources:
1. General information related to EVs and transport electrification, that would
enable an initial assessment of environmental and other impacts for any country;
38 For example, clicking on the Raw Dataset for the 2015 HTS returns the message “Sorry, but you do not
have permission to view this content.”
Energy and Transport Data Audit for Electrification of the Fiji Transport Sector 38
2. Information directly relevant to the development of transport electrification
policy in Fiji (and in other countries); and
3. Comparative information on EV statistics, programs and policies across several
countries and regions, particularly for countries in the region that are at a similar
stage of development as Fiji.
Information of the first type can be used as a starting point when no other data are
available. For example, the estimates of maritime CO2-e emissions used in the Fiji
LEDS were based on default CO2-e/vessel-km values obtained from broad international
averages. These are temporary gap-fillers, in that the default values can be over-written
and replaced once actual data for Fiji is acquired.
An example of the second type is up-to-date data on the costs, technology and energy-
efficiency of EVs or PHVs of the type likely to be imported to Fiji, and the cost of
charging stations. This type of data can only be obtained by regularly monitoring
manufacturer and industry news sites and research publications.
An example of the third type is the UNESCAP Asia Pacific Energy Portal, the
objectives of which are to:
• Provide open access to DATA and POLICY information on energy and
sustainable development.
• Enable identification of trends and rapid analysis of data through data
visualization and policy cross-sections.
• Support informed decision-making among Asia-Pacific energy policy makers.
• Support data and policy tracking, research and analysis for regional and global
initiatives. 39
The data on such sites tend to lag by several years, since they rely on obtaining
government and corporate reports and publications, which themselves usually lag by a
year or two, and then introduce a further sorting and uploading delay. In some cases,
they assemble data that are compiled by other NGOs annually (at best) rather than
continuously. Therefore, they are a “trailing” rather than a leading data source. They
tend to be more useful as a repository of policy documents.
39 https://asiapacificenergy.org/
Energy and Transport Data Audit for Electrification of the Fiji Transport Sector 39
5. Data Framework and Strategy (DFS)
The objective of the strategy is to enable MOIT to prepare well-founded advice on the
costs and benefits of transport electrification from a national perspective. Based on the
preceding analysis, this chapter presents a number of tasks and projects which together
make up a comprehensive data acquisition and management strategy, or Data
Framework and Strategy (DFS) for short.
It is divided into Tasks and Projects. Tasks are on-going activities, including managing
information flows, data collections and access, planning data acquisitions, combining
existing data sets, analysing new data sets as they become available and reporting
progress and problems.
Projects are distinct studies need to support the higher levels in the information
pyramid. Some may only need to be done once, and others repeated occasionally as data
improves. Apart from the outputs, which are necessary for policy development,
undertaking projects will test data the availability and quality of the available data. If it
turns out that projects cannot be completed due to inadequate data, this will be a guide
for planning future data acquisitions.
Activities are categorised as:
• Organisational arrangements: setting up the framework, maintaining it and
reporting on it;
• Policy studies and modelling; higher-level analyses that inform the detailed
tasks
• Analyses of existing and expected data; extracting the most value from what
is/will be available; and
• Planning and delivering new data acquisitions, making use of scheduled/regular
activities, planning new ones if there are gaps.
The following sections give a general description of each activity, the recommended
lead agency and the priority. Additional details, including timing and estimated
resources for each activity (including additional agencies to be involved) are given in a
separate report to MOIT.
A. Organisational arrangements
A1 Overall DFS management, co-ordination and reporting
Description: Developing the DFS workplan, obtaining resources to carry it out, planning
each of the 22 detailed activities, reviewing outputs and reporting regularly to policy-
makers on progress, achievements and obstacles.
Recommended lead agency: MOIT should have overall responsibility, with this task
included in the duty statement of a specific senior position.40 The task should also be
40 In this section “MOIT” covers the Transport and Energy Divisions of the Ministry including the TPU,
but it is not currently possible to be more specific. It is understood that the Ministry is in a state of

Energy and Transport Data Audit for Electrification of the Fiji Transport Sector 40
formally included in the three-yearly updates of the MOIT’s Strategic Development
Plan as well as the annual Corporate Plan, so ensuring that it is covered in annual
corporate planning reviews and workshops. Progress should also be covered in the
MOIT Annual Report.
Timing: High priority. Commence immediately.
A2 Develop internal data management protocols
Description: MOIT already holds a number of data collections and is constantly
acquiring new data related to transport and energy in Fiji (extending well beyond the
scope of electrification studies). It does not appear to have a written data management
manual or protocol in a form that can be referred to by its own staff or other agencies, or
by external actors providing, requesting or using its data.
The protocol should be a document (or set of documents, whether electronic or hard
copy) covering, at the least:
• Cyber-security (protection against data theft or compromise);
• Rules for data sharing within MOIT (including with LTA);
• Guidelines for classification of data (see Task A4);
• Who has authority to classify data;
• Rules for responding to external data requests; and
• Succession planning (e.g. ensuring that data or access to it are not lost if a staff
member leaves or changes jobs).
Recommended lead agency: MOIT should have responsibility with regards to managing
the transport and energy data collections of the TPU and the DOE and should be aware
of the data management protocols of related agencies such as LTA and EFL. (While
EFL is technically an “internal” agency under the same Minister, it became apparent
during this project that MOIT cannot obtain data from EFL in the same way as it can
obtain data from LTA).
Timing: High priority. Commence immediately
A3 Make external data sharing arrangements with other Ministries
Description: Review current inter-agency data sharing arrangements (if any) between
MOIT and other agencies and private data providers, particularly with FBOS and
FRCS, and establish formal MOUs or other arrangements to streamline future data
sharing. Ensure these are consistent with high-level guidelines (if any) applying across
the Fiji Government. Private providers would include transport industry associations.
Agreements should also cover technical issues such as field structure and terminology
for data acquisitions and collections related to transport electrification (e.g. FRCS to
create a separate import category for EV chargers of various kVA capacities).
Recommended lead agency: MOIT
reorganisation, and the structure at http://www.moit.gov.fj/images/2018/2018%20Org%20Structure.jpg
(accessed September 2019) is no longer accurate.
Energy and Transport Data Audit for Electrification of the Fiji Transport Sector 41
Timing: High priority. Commence immediately.
A4 Develop consistent cross-agency data classification & access rules
Description: Inconsistent classification of data with regard to its level of confidentiality
inhibits its sharing between agencies, and its publication. This task is to develop
classification & access rules, initially within MOIT departments and agencies. Once
these are settled and adopted within MOIT (as part of Task A2) the same rules could be
proposed to the other agencies with which MOIT has data sharing agreements (Tasks
A3).
As a starting point, a three-level classification could be used:
• Public (anyone can access, and ideally should be placed on website))
• Restricted (user registration & log-in required, as with the National
Transport Planning Database, although most of the material currently on the
NTPD could be reclassified as public); and
• Confidential (both log-in and higher clearance required).
Recommended lead agency: MOIT
Timing: Medium - High priority. Immediate application to Tasks A3, A5.
A5 Update and maintain National Transport Planning Database (NTPD)
Description: The NTPD has a large amount of data that is useful for general transport
policy and planning, as well as for studies of electrification. However, the content has
not been updated since it was established in 2015, and access is unnecessarily restricted.
This task consists of
• Reviewing the existing content of the NTPD, to remove obsolete material
and reclassifying all remaining material as public, restricted or confidential.
• Uploading new content where available, such as the 2017 HTS
• Classifying all new content as public, restricted or confidential
• Moving the public content to a publicly accessible part of the NTPD and
setting up two levels of access (restricted and confidential) for the rest (see
Task A4).
Recommended lead agency: MOIT
Timing: High priority. Immediate application to Task A4.
B. Policy studies and modelling
B1 Emission scenarios with/without EVs
Description: To test the hypothesis that electrification of transport will in fact reduce
Fiji’s greenhouse gas emissions, this project will develop a number of scenarios,
combining various rates of EV introduction with various rates of investment in

Energy and Transport Data Audit for Electrification of the Fiji Transport Sector 42
renewable energy generation. Low, medium and high scenarios of each will give 9
combinations (more, if overlaid on different rates of growth in general non-transport
electricity demand).
Transport sector emissions will chance gradually in each scenario, but electric-related
emissions will most likely change in steps according to assumptions about the nature
and timing of generation increments. Transport and electricity emissions will need to be
added for each future year (say 2020-2040) to give total emissions impacts and enable
the scenarios to be compared. Emissions of other pollutants (NMVOC, SOx, NOx etc.)
should be calculated in addition to CO2-e.
The scenarios developed for this project can be used in other projects as well, to
establish consistency and comparability.
Recommended lead agency: MOIT
Timing: Highest priority, to begin immediately. A realistic assessment of the emissions
impact of transport electrification is necessary to inform policy-making.
B2 Fuel consumption, energy-efficiency, charging, range
Description: Determining the impacts of transport electrification by comparing the
performance of EVs with their HV and ICV equivalents in each of the market segments
where substitution is feasible. After identifying each of these segments, report on:
• The tested energy- and fuel-efficiency values for typical models of each type
(EV, HV and ICV, similar to Table 1);
• The on-road energy- and fuel-efficiency values;
• EV range;
• Charging behaviour of EV owners (share of charging expected at home and
at public stations);
• Estimate of annual fuel consumption and electricity use of comparable EV,
HV and ICVs.
Recommended lead agency: LTA
Timing: Medium-High priority. To commence once Fiji policy-makers decide to
develop an electrification strategy.
B3 Travel projection scenarios
Description: Project B1 can be undertaken using the same average VKT for all vehicle
types within the EV-substitutable sectors. In reality, EVs are likely to be used in
different ways and travel different annual distances than similar HVs and ICVs. This
project will try to establish realistic usage and travel patterns for EVs, within the context
of overall demand for motorised and non-motorised travel. Fleet-owned EVs may be
constrained in their VKT by off-road charging time requirements. Alternatively,
operating cost advantages may lead to EVs being used in preference to fuel vehicles,
Recommended lead agency: MOIT
Energy and Transport Data Audit for Electrification of the Fiji Transport Sector 43
Timing: Medium-High priority. To commence once Fiji policy-makers decide to
develop an electrification strategy.
B4 EV market & supply chain study
Description: Investigate likely source countries, landed prices for new and second-hand
imports (at various duty, VAT, ECAL rates). Also investigate the supply chains for EVs
and spare parts in Fiji, and possible non-price barriers to adoption (lack of local
maintenance skills and capacity, road conditions etc.)
Recommended lead agency: LTA
Timing: Medium priority.
B5 Vehicle ownership costs
Description: To estimate the ownership costs for people purchasing EVs in Fiji,
compared with HV and ICV alternatives. Include including capital costs (from Project
B4) fuel and maintenance costs (from Project B2) and registration charges. Among
other matters this will clarify the extent of financial subsidies that may be required to
make EVs cost-competitive.
Recommended lead agency: LTA
Timing: Medium priority.
B6 Battery life-cycle, refurbishment and disposal model
Description: The growing number of HV batteries is already an issue for Fiji, and the
larger battery packs of EVs will add to the disposal and environmental burden. On the
other hand refurbished “second life” battery packs could become a resource for stand-
alone PV systems. This project develops a quantified model of the life-cycle of EV
propulsion batteries, using the same rang of EV takeup scenarios as in Project B1.
Recommended lead agency: DOE
Timing: Medium priority.
B7 Vehicle purchase econometric model
Description: The projection of vehicle numbers is fundamental to planning for all forms
of transportation and is the baseline for testing different EV take-up scenarios. The
project is to construct a model integrating the best available data on GDP, incomes,
vehicle prices and annual vehicle ownership operating costs from Projects B4 and B5.
Once the model had been validated against historical trends it will be used predictively.
Recommended lead agency: University of South Pacific or Fiji National University
Timing: Medium priority, to proceed after or in parallel with Projects B4 and B5.
Energy and Transport Data Audit for Electrification of the Fiji Transport Sector 44
B8 Impact on government revenues and national accounts
Description: To estimate the total impact on government revenues under a range of EV
duty, excise, VAT rates and other taxes, charges and revenue streams (e.g. from EFL
electricity sales). This will be necessary to inform policy-makers about the national
financial as well as the environmental impacts of EV-supporting policies.
Recommended lead agency: Ministry of Economy
Timing: High priority.
B9 Impact of EVs on grid stability
Description: To model the impacts of various levels of EV ownership, charging patterns
and charging locations on the ability of the EFL electricity grid to meet specifications
for voltage, frequency and reliability of supply.
Recommended lead agency: EFL
Timing: Medium-high priority (see parallel project on the ability of Viti Levu grid to
support the electrification of transport).
B10 Impact of EVs on utility revenues and costs
Description: To model the impacts of various levels of EV ownership, charging patterns
and charging locations on the capital cost program of EFL and on revenues (under
various EV charging tariff scenarios), to assess the magnitude of financial subsidies
required (if any) to maintain financial viability.
Recommended lead agency: EFL
Timing: Medium-high priority (see parallel project on the ability of Viti Levu grid to
support the electrification of transport).
C. Analyses of existing and expected data
C1 Vehicle ownership, usage and expenditures
Description: Combine and cross-tabulate data from existing collections to determine
trends in ownership of private vehicles, expenditures on vehicle operation (fuel and
maintenance), vehicle usage (VKT/household), garaging, travel by vehicle as a share of
all travel and expenditure on electricity by vehicle-owning households (to enable
calculations of likely change in bills from shifts to EVs). The data collections include:
• Census 2017 (FBOS)
• Household Income and Expenditure Survey 2017 (FBOS)
• Household Travel Survey 2015, 2017 (MOIT)
Recommended lead agency: FBOS

Energy and Transport Data Audit for Electrification of the Fiji Transport Sector 45
Timing: Medium Priority – commence after 2017 HTS is tabulated
C2 Public transport usage and expenditures
Description: Identify main public transport routes currently served by buses where
electric buses could be introduced. For those routes, calculate patronage and estimate
revenues using electronic ticket data (held by Vodafone). Also analyses daily passenger
and bus movements and peaks to assess number of electric buses (or alternative EVs –
ferries on some routes?) and how charging can be scheduled.
Recommended lead agency: MOIT
Timing: Medium Priority
C3 Recurring vehicle fleet trend analysis
Description: As LTA registration database changes, run annual queries to track the
following values (cover last 5 years in first iteration, then repeat annually – previous
data structures may not yield all values of interest):
• Number of new/used and average age of new registrations in each EV-
substitutable vehicle category
• Number, average age and average VKT of re-registrations in each EV-
substitutable vehicle category
• Number of retirements, average age at retirement and average years on register
at retirement in each EV-substitutable vehicle category
• Location (by street address, if possible) of registrants of registered vehicles in in
each EV-substitutable vehicle category (as an anonymised map)
Recommended lead agency: LTA
Timing: Medium-High Priority: First iteration end of 2019 (covering 2015-2019 data)
then annual repeats to build up trends.
C4 National energy flow diagrams (last 5 years, then annual)
Description: To describe Fiji’s annual energy consumption and use as a flow diagram
(sometimes called a Sankey diagram).41 This will give a visual illustration of the
balance between fuels used in electricity generation and in transport (as well as the
balance between fuel imports, exports and local biofuel production). It can also be used
to illustrate monetary flows.
Recommended lead agency: DOE
Timing: Medium-High Priority: First iteration end of 2019 (covering 2015-2019 data)
then annual repeats to build up trends
41 https://www.iea.org/Sankey/
Energy and Transport Data Audit for Electrification of the Fiji Transport Sector 46
D. Planning and delivering new data acquisitions
D1 Freight transport study
Description: Identify urban area freight tonnages, vehicles and routes suitable for
electric delivery vehicles. Complement the Household Travel Survey (some gaps may
be filled by data being collected by the Fiji Road Haulage Association).
Recommended lead agency: MOIT
Timing: Medium Priority: Start planning in early 2020, conduct survey 2020-21.
D2 Surveys of Government, taxi & car fleet operators and drivers
Description: To collect data on both behaviour (by drivers and fleet owners) that could
affect the scope for electrification, and attitudes to introduction of EVs. Needs different
survey techniques for fleet owners/managers (in-depth interviews?) and drivers
(standardised surveys). To cover practices such as private use and home vs central
garaging of fleet-owned vehicles.
Recommended lead agency: MOIT
Timing: Medium priority. Start planning 2020, carry out surveys in 2021.
D3 Survey of tourism & car rental operators
Description: Similar to D2 but focus on attitudes of rental car fleet owners/managers to
including EVs in rental fleets, and attitudes of resort owner/operators to including EVs
and electrically-powered vessels in resort operations.
Recommended lead agency: MOIT
Timing: Medium priority. Start planning 2021, carry out surveys in 2021
D4 Survey of tourists, visitors
Description: To complement D3, by gathering information about whether visitors would
prefer rental EVs if available, and attitudes to electric cars and small vessels at resorts
(e.g. would it make them more inclined or less to select that resort). Aim is to gather
consumer information that could help influence fleet and resort owners/operators.
Recommended lead agency: MOIT
Timing: Medium priority. Start planning 2020, carry out surveys in 2021
Energy and Transport Data Audit for Electrification of the Fiji Transport Sector 47
D5 Monitoring upcoming surveys for data acquisition
Description: Monitoring planned and upcoming surveys and studies in Fiji (by FBOS,
other government agencies, industry associations and others) to ensure that information
can be collected relevant to transport electrification policy, where appropriate.
Recommended lead agency: MOIT
Timing: Medium priority. Start immediately.
Conclusions
The 24 identified activities (on-going tasks and projects) are summarised in Table 10,
along with an indicative 3-year timeline. It is recognised that the work will depend on
the staff expertise, staff time and financial resources available, and projects are
staggered to spread the load. There are 7 high priority activities, mostly involved with
establishing the data framework and strategy, and informing two of the threshold issues
that policy-makers will need to address:
• What will be the impact of transport electrification on national emissions?; and
• What will be the impact on government revenues and the national economy?
There are 6 activities rated medium-high priority and 11 rated as medium. All are
considered necessary to build a sound basis for developing transport electrification, and
in many cases will also support the general planning work of MOIT, and the TPU in
particular.
Furthermore, a framework of consistent data terminology and classification, better
internal data management practices in the transport and energy portfolio and formal
agreements on data exchange with other ministries could provide a model for other Fiji
Ministries and public agencies.
*****

Energy and Transport Data Audit for Electrification of the Fiji Transport Sector 48
Table 10 Summary and indicative timeline of tasks and projects
Task or
Project
Description Priority Lead
agency
2019 2020 2021 2022
Q4 Q1,2 Q3.4 Q1,2 Q3,4 Q1,2 Q3.4
A1 DFS management, coordination etc H MOIT
A2 Internal data management protocols H MOIT
A3 Data sharing MOUs with other Ministries H MOIT
A4 Consistent classification and access rules H MOIT
A5 Update & Maintain NTPD H MOIT
B1 Emission scenarios with/without EVs H MOIT
B2 Fuel consumption, EV energy-efficiency etc M – H LTA
B3 Travel projection scenarios M – H MOIT
B4 EV market & supply chain study M LTA
B5 Vehicle ownership costs M LTA
B6 Battery life-cycle model M DOE
B7 Vehicle purchase econometric model M USP/FNU
B8 Impact of EVs on government revenues H M Econ
B9 Impact of EVs on grid stability M – H EFL
B10 Impact of EVs on utility revenues and costs M – H EFL
C1 Vehicle ownership, usage and expenditures M FBOS
C2 Public transport usage and expenditures M MOIT
C3 Recurring vehicle fleet trend analysis M – H LTA
C4 National energy flow diagrams M – H DOE
D1 Freight transport study M MOIT
D2 Government, taxi & car fleets study M MOIT
D3 Car rental and tourism – EVs and small boats M MOIT
D4 Visitor and tourist attitudes M MOIT
D5 Monitor upcoming surveys M MOIT
Planning or period between repeat activities Implementation or active period

Energy and Transport Data Audit for Electrification of the Fiji Transport Sector 49
References
Documents
Bell (2016) Review of Fiji Maritime and Freight Sector, Final Report, Michael Bell for
Predict Consulting, April 2016
NTPD (23016) Fiji National Transport Planning Database; Final Report April 2016
HTS (2015) National Household Travel Survey, Fiji 2015; Technical Report, Kate
Mackay Consulting for Predict Consulting. Prepared for: The Transport Planning Unit,
Ministry of Infrastructure and Transport, April 2016
Prasad & Raturi (2018) Low-carbon measures for Fiji’s land transport energy system,
Ravita D. Prasad, Atul Raturi, Utilities Policy 54, 2018
Prasad & Raturi (2019) Fuel demand and emissions for maritime sector in Fiji: Current
status and low-carbon strategies. Ravita D. Prasad, Atul Raturi, Marine Policy 102,
2019
Websites
https://www.frcs.org.fj/
http://www.economy.gov.fj/sections/financial-and-asset-management/treasury.html
https://www.statsfiji.gov.fj/
http://www.moit.gov.fj/
https://www.abc.net.au/news/2019-07-04/fact-check3a-is-it-correct-that-driving-from-
sydney-to-melbour/11267090
https://theicct.org/sites/default/files/publications/Lab-to-road-intl_ICCT-white-
paper_06112017_vF.pdf
https://theconversation.com/new-zealand-poised-to-introduce-clean-car-standards-and-
incentives-to-cut-emissions-120896
https://www.youtube.com/watch?v=YQv_p5VQY4E
http://global.chinadaily.com.cn/a/201903/04/WS5c7cb83fa3106c65c34ec994.html
https://oppositelock.kinja.com/owning-a-car-in-japan-myths-and-reality-1770442115
https://www.carsales.com.au/editorial/details/new-grey-import-laws-the-facts-108526/
https://www.japanfs.org/en/news/archives/news_id027816.html
https://www.abc.net.au/radio-australia/programs/pacificbeat/are-electric-cars-feasible-
in-the-pacific/11002594
https://www.unescap.org/sites/default/files/Asia%20Pacific%20Energy%20Portal.pdf
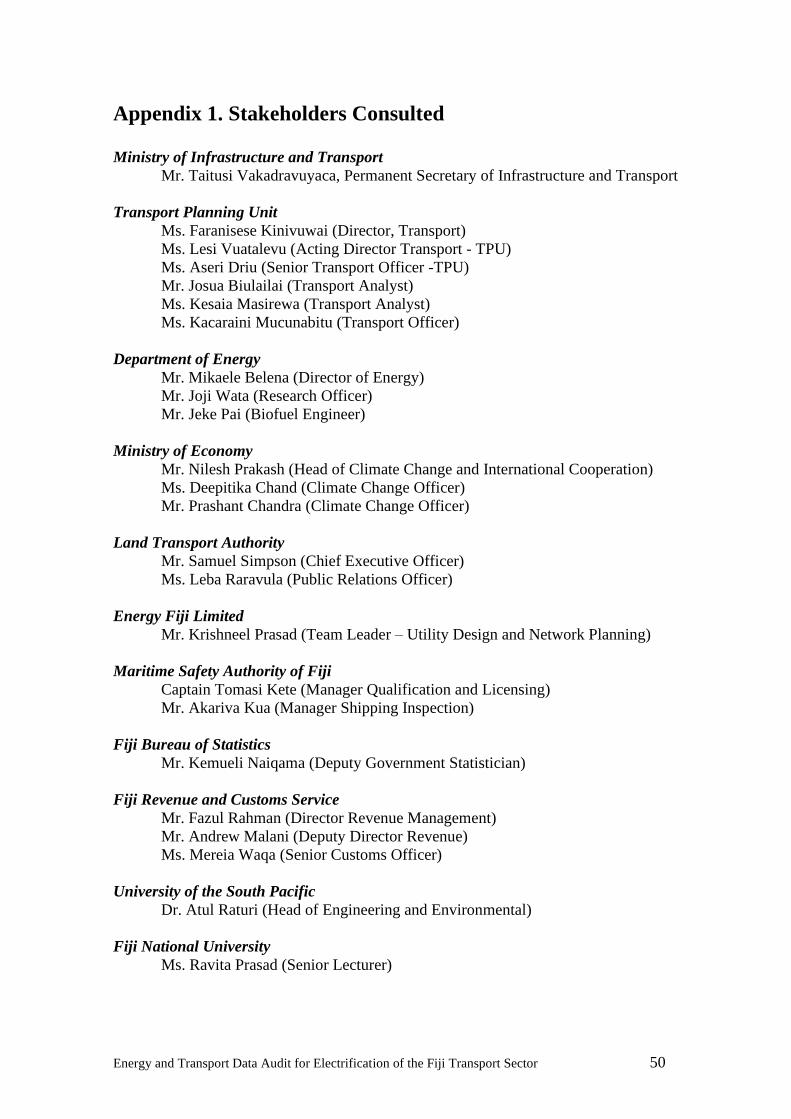
Energy and Transport Data Audit for Electrification of the Fiji Transport Sector 50
Appendix 1. Stakeholders Consulted
Ministry of Infrastructure and Transport
Mr. Taitusi Vakadravuyaca, Permanent Secretary of Infrastructure and Transport
Transport Planning Unit
Ms. Faranisese Kinivuwai (Director, Transport)
Ms. Lesi Vuatalevu (Acting Director Transport - TPU)
Ms. Aseri Driu (Senior Transport Officer -TPU)
Mr. Josua Biulailai (Transport Analyst)
Ms. Kesaia Masirewa (Transport Analyst)
Ms. Kacaraini Mucunabitu (Transport Officer)
Department of Energy
Mr. Mikaele Belena (Director of Energy)
Mr. Joji Wata (Research Officer)
Mr. Jeke Pai (Biofuel Engineer)
Ministry of Economy
Mr. Nilesh Prakash (Head of Climate Change and International Cooperation)
Ms. Deepitika Chand (Climate Change Officer)
Mr. Prashant Chandra (Climate Change Officer)
Land Transport Authority
Mr. Samuel Simpson (Chief Executive Officer)
Ms. Leba Raravula (Public Relations Officer)
Energy Fiji Limited
Mr. Krishneel Prasad (Team Leader – Utility Design and Network Planning)
Maritime Safety Authority of Fiji
Captain Tomasi Kete (Manager Qualification and Licensing)
Mr. Akariva Kua (Manager Shipping Inspection)
Fiji Bureau of Statistics
Mr. Kemueli Naiqama (Deputy Government Statistician)
Fiji Revenue and Customs Service
Mr. Fazul Rahman (Director Revenue Management)
Mr. Andrew Malani (Deputy Director Revenue)
Ms. Mereia Waqa (Senior Customs Officer)
University of the South Pacific
Dr. Atul Raturi (Head of Engineering and Environmental)
Fiji National University
Ms. Ravita Prasad (Senior Lecturer)

Energy and Transport Data Audit for Electrification of the Fiji Transport Sector 51
Micronesian Centre for Sustainable Transport
Mr. Andrew Irvin (Transport Researcher/Consultant)
Asco Motors Fiji (Toyota)
Mr. Craig Sims (Chief Executive Officer)
Mr. Seiji Tokito (General Manager Sales)
Fiji Bus Owners Association
Mr. Richard Lal (President)
Mr. Rohit Latchan (General Secretary)
Fiji Roads Authority
Mr. Michael Dale (Head of Design and Procurement)
Fiji Motor Traders Association
Mr. Suresh Singh (President)
Shreedhar Motors
Mr Jagdish Chand (National Manager Sales and Marketing)
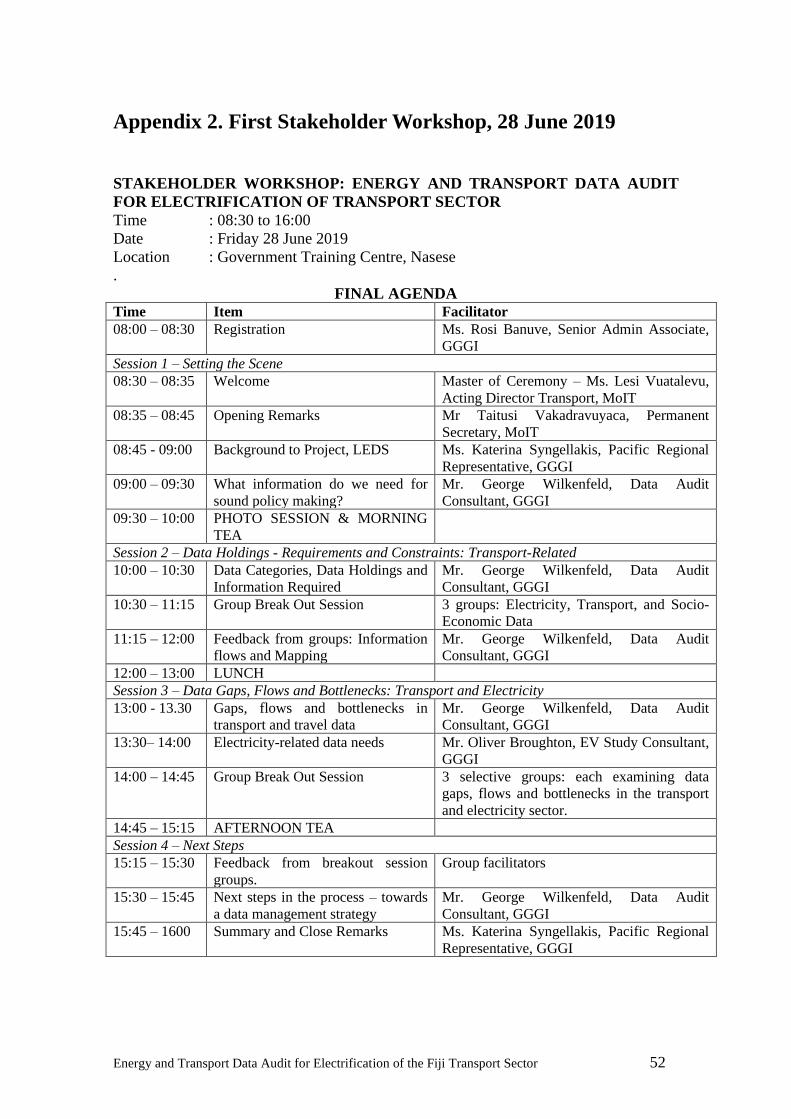
Energy and Transport Data Audit for Electrification of the Fiji Transport Sector 52
Appendix 2. First Stakeholder Workshop, 28 June 2019
STAKEHOLDER WORKSHOP: ENERGY AND TRANSPORT DATA AUDIT
FOR ELECTRIFICATION OF TRANSPORT SECTOR
Time : 08:30 to 16:00
Date : Friday 28 June 2019
Location : Government Training Centre, Nasese
.
FINAL AGENDA Time Item Facilitator
08:00 – 08:30 Registration Ms. Rosi Banuve, Senior Admin Associate,
GGGI
Session 1 – Setting the Scene
08:30 – 08:35 Welcome Master of Ceremony – Ms. Lesi Vuatalevu,
Acting Director Transport, MoIT
08:35 – 08:45 Opening Remarks Mr Taitusi Vakadravuyaca, Permanent
Secretary, MoIT
08:45 - 09:00 Background to Project, LEDS Ms. Katerina Syngellakis, Pacific Regional
Representative, GGGI
09:00 – 09:30 What information do we need for
sound policy making?
Mr. George Wilkenfeld, Data Audit
Consultant, GGGI
09:30 – 10:00 PHOTO SESSION & MORNING
TEA
Session 2 – Data Holdings - Requirements and Constraints: Transport-Related
10:00 – 10:30 Data Categories, Data Holdings and
Information Required
Mr. George Wilkenfeld, Data Audit
Consultant, GGGI
10:30 – 11:15 Group Break Out Session 3 groups: Electricity, Transport, and Socio-
Economic Data
11:15 – 12:00 Feedback from groups: Information
flows and Mapping
Mr. George Wilkenfeld, Data Audit
Consultant, GGGI
12:00 – 13:00 LUNCH
Session 3 – Data Gaps, Flows and Bottlenecks: Transport and Electricity
13:00 - 13.30 Gaps, flows and bottlenecks in
transport and travel data
Mr. George Wilkenfeld, Data Audit
Consultant, GGGI
13:30– 14:00 Electricity-related data needs Mr. Oliver Broughton, EV Study Consultant,
GGGI
14:00 – 14:45 Group Break Out Session 3 selective groups: each examining data
gaps, flows and bottlenecks in the transport
and electricity sector.
14:45 – 15:15 AFTERNOON TEA
Session 4 – Next Steps
15:15 – 15:30 Feedback from breakout session
groups.
Group facilitators
15:30 – 15:45 Next steps in the process – towards
a data management strategy
Mr. George Wilkenfeld, Data Audit
Consultant, GGGI
15:45 – 1600 Summary and Close Remarks Ms. Katerina Syngellakis, Pacific Regional
Representative, GGGI
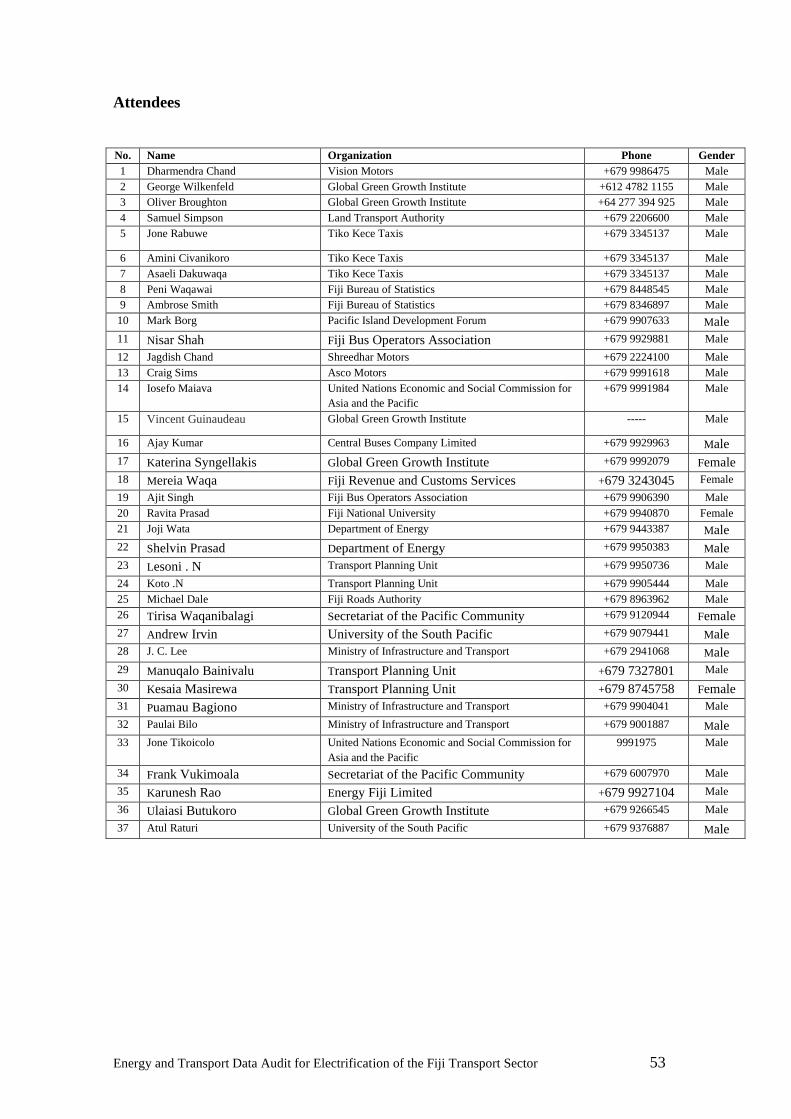
Energy and Transport Data Audit for Electrification of the Fiji Transport Sector 53
Attendees
No. Name Organization Phone Gender
1 Dharmendra Chand Vision Motors +679 9986475 Male
2 George Wilkenfeld Global Green Growth Institute +612 4782 1155 Male
3 Oliver Broughton Global Green Growth Institute +64 277 394 925 Male
4 Samuel Simpson Land Transport Authority +679 2206600 Male
5 Jone Rabuwe Tiko Kece Taxis +679 3345137 Male
6 Amini Civanikoro Tiko Kece Taxis +679 3345137 Male
7 Asaeli Dakuwaqa Tiko Kece Taxis +679 3345137 Male
8 Peni Waqawai Fiji Bureau of Statistics +679 8448545 Male
9 Ambrose Smith Fiji Bureau of Statistics +679 8346897 Male
10 Mark Borg Pacific Island Development Forum +679 9907633 Male
11 Nisar Shah Fiji Bus Operators Association +679 9929881 Male
12 Jagdish Chand Shreedhar Motors +679 2224100 Male
13 Craig Sims Asco Motors +679 9991618 Male
14 Iosefo Maiava United Nations Economic and Social Commission for
Asia and the Pacific
+679 9991984 Male
15 Vincent Guinaudeau Global Green Growth Institute ----- Male
16 Ajay Kumar Central Buses Company Limited +679 9929963 Male
17 Katerina Syngellakis Global Green Growth Institute +679 9992079 Female
18 Mereia Waqa Fiji Revenue and Customs Services +679 3243045 Female
19 Ajit Singh Fiji Bus Operators Association +679 9906390 Male
20 Ravita Prasad Fiji National University +679 9940870 Female
21 Joji Wata Department of Energy +679 9443387 Male
22 Shelvin Prasad Department of Energy +679 9950383 Male
23 Lesoni . N Transport Planning Unit +679 9950736 Male
24 Koto .N Transport Planning Unit +679 9905444 Male
25 Michael Dale Fiji Roads Authority +679 8963962 Male
26 Tirisa Waqanibalagi Secretariat of the Pacific Community +679 9120944 Female
27 Andrew Irvin University of the South Pacific +679 9079441 Male
28 J. C. Lee Ministry of Infrastructure and Transport +679 2941068 Male
29 Manuqalo Bainivalu Transport Planning Unit +679 7327801 Male
30 Kesaia Masirewa Transport Planning Unit +679 8745758 Female
31 Puamau Bagiono Ministry of Infrastructure and Transport +679 9904041 Male
32 Paulai Bilo Ministry of Infrastructure and Transport +679 9001887 Male
33 Jone Tikoicolo United Nations Economic and Social Commission for
Asia and the Pacific
9991975 Male
34 Frank Vukimoala Secretariat of the Pacific Community +679 6007970 Male
35 Karunesh Rao Energy Fiji Limited +679 9927104 Male
36 Ulaiasi Butukoro Global Green Growth Institute +679 9266545 Male
37 Atul Raturi University of the South Pacific +679 9376887 Male
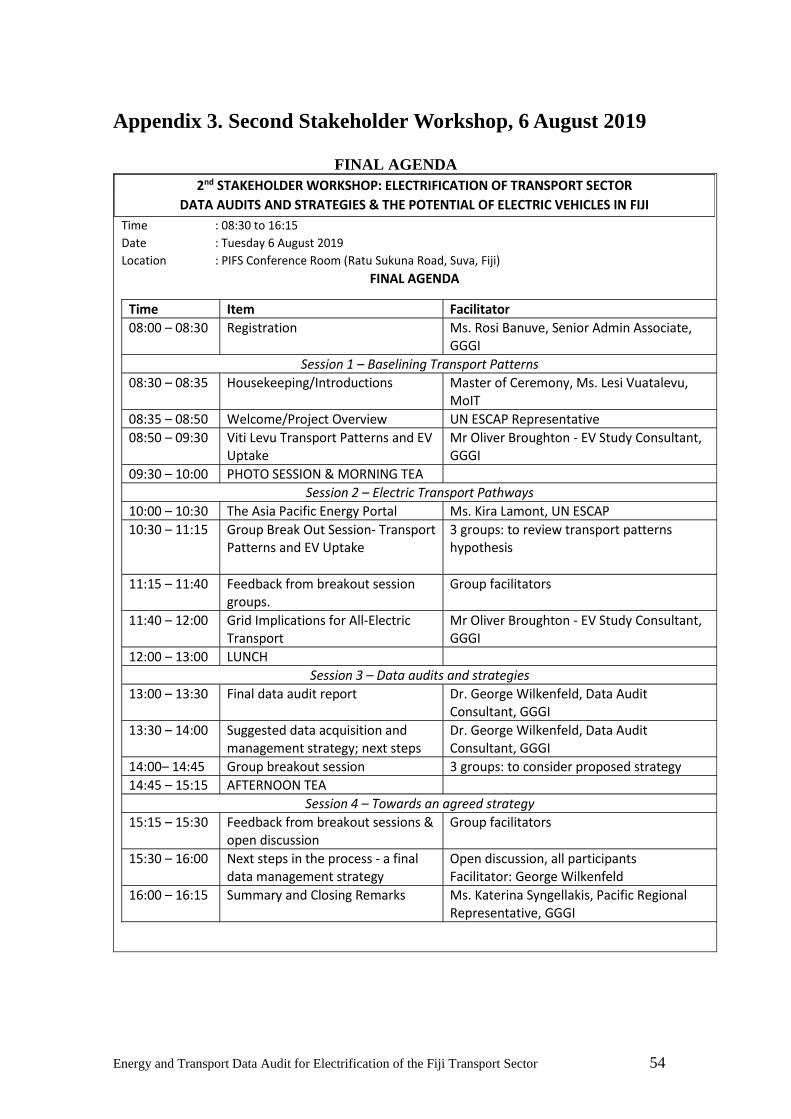
Energy and Transport Data Audit for Electrification of the Fiji Transport Sector 54
Appendix 3. Second Stakeholder Workshop, 6 August 2019
FINAL AGENDA
2nd STAKEHOLDER WORKSHOP: ELECTRIFICATION OF TRANSPORT SECTOR
DATA AUDITS AND STRATEGIES & THE POTENTIAL OF ELECTRIC VEHICLES IN FIJI
Time : 08:30 to 16:15
Date : Tuesday 6 August 2019
Location : PIFS Conference Room (Ratu Sukuna Road, Suva, Fiji)
FINAL AGENDA
Time Item Facilitator
08:00 – 08:30 Registration Ms. Rosi Banuve, Senior Admin Associate, GGGI
Session 1 – Baselining Transport Patterns
08:30 – 08:35 Housekeeping/Introductions Master of Ceremony, Ms. Lesi Vuatalevu, MoIT
08:35 – 08:50 Welcome/Project Overview UN ESCAP Representative
08:50 – 09:30 Viti Levu Transport Patterns and EV Uptake
Mr Oliver Broughton - EV Study Consultant, GGGI
09:30 – 10:00 PHOTO SESSION & MORNING TEA
Session 2 – Electric Transport Pathways
10:00 – 10:30 The Asia Pacific Energy Portal Ms. Kira Lamont, UN ESCAP
10:30 – 11:15 Group Break Out Session- Transport Patterns and EV Uptake
3 groups: to review transport patterns hypothesis
11:15 – 11:40 Feedback from breakout session groups.
Group facilitators
11:40 – 12:00 Grid Implications for All-Electric Transport
Mr Oliver Broughton - EV Study Consultant, GGGI
12:00 – 13:00 LUNCH
Session 3 – Data audits and strategies
13:00 – 13:30 Final data audit report Dr. George Wilkenfeld, Data Audit Consultant, GGGI
13:30 – 14:00 Suggested data acquisition and management strategy; next steps
Dr. George Wilkenfeld, Data Audit Consultant, GGGI
14:00– 14:45 Group breakout session 3 groups: to consider proposed strategy
14:45 – 15:15 AFTERNOON TEA
Session 4 – Towards an agreed strategy
15:15 – 15:30 Feedback from breakout sessions & open discussion
Group facilitators
15:30 – 16:00 Next steps in the process - a final data management strategy
Open discussion, all participants Facilitator: George Wilkenfeld
16:00 – 16:15 Summary and Closing Remarks Ms. Katerina Syngellakis, Pacific Regional Representative, GGGI
Energy and Transport Data Audit for Electrification of the Fiji Transport Sector 55
Attendees
No
.
Name Organization Phone Gender
1 Shirnay Ram Carpenters Motors +679 9996351 Male
2 Penaia Votadroka Maritime Safety Authority of Fiji +679 8916817 Male
3 George Wilkenfeld Global Green Growth Institute +612 4782 1155 Male
4 Oliver Broughton Global Green Growth Institute +64 277 394 925 Male
5 Deepitika Chand Climate Change and International Cooperation
Division, Ministry of Economy
+679 9359036 Female
6 Deepak Chand Department of Energy +679 9982728 Male
7 Shelvin Prasad Department of Energy +679 9950383 Male
8 Sanjesh Naidu United Nations Economic and Social Commission
for Asia and the Pacific
------ Male
9 Kacaraini Mucunabitu Transport Planning Unit, Ministry of Infrastructure
and Transport
+679 3389509 Female
10 Ravita Prasad Fiji National University +679 9940870 Female
11 Manuqalo Bainivalu Transport Planning Unit, Ministry of Infrastructure
and Transport
+679 7327801 Male
12 Jagdish Chand Shreedhar Motors +679 2224100 Male
13 Bimlesh Krishna Fiji Bureau of Statistics +679 3315822 Male
14 Nikhil Lal Pacific Island Development Forum +679 9236043 Male
15 Ajay Kumar Central Transport Company Limited +679 9929963 Male
16 Tirisa Wainibalagi Secretariat of the Pacific Community +679 9120944 Female
17 Ponijasi Saulekaleka Tiko Kece Taxis +679 9331772 Male
18 Aminiasi Cinanikoro Tiko Kece Taxis +679 9064628 Male
19 Michael Dale Fiji Roads Authority +679 8936962 Male
20 Karunesh Rao Energy Fiji Limited +679 9927104 Male
21 Faranisese Kinivuwai Transport Planning Unit, Ministry of Infrastructure
and Transport
+679 9904889 Female
22 Ritika Kumar Fiji Bus Operators Association +679 9991243 Female
23 Mereia Waqa Fiji Revenue and Customs Services +679 3243045 Female
24 Ankeet Prasad Ministry of Economy +679 8636574 Male
25 Tevita Tuibau Ministry of Economy +679 3221298 Male
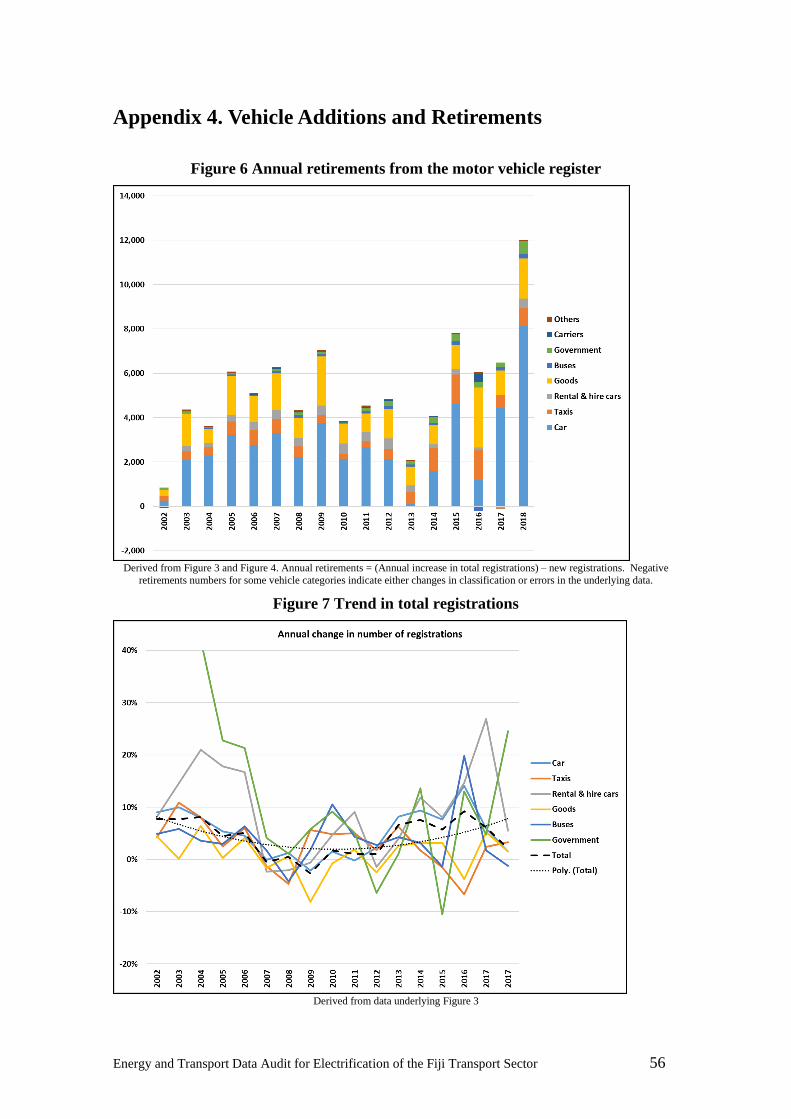
Energy and Transport Data Audit for Electrification of the Fiji Transport Sector 56
Appendix 4. Vehicle Additions and Retirements
Figure 6 Annual retirements from the motor vehicle register
Derived from Figure 3 and Figure 4. Annual retirements = (Annual increase in total registrations) – new registrations. Negative
retirements numbers for some vehicle categories indicate either changes in classification or errors in the underlying data.
Figure 7 Trend in total registrations
Derived from data underlying Figure 3

Energy and Transport Data Audit for Electrification of the Fiji Transport Sector 57
Figure 8 Trend in annual retirements
Derived from data underlying Figure 4