
Modification of a fire drought index for tropical wetland ecosystems by including water table depth

ECOSYSTEMS RESEARCH REPORT 18
ISSN 1018-5593
Functional analyses of European wetland ecosystems — Phase I (FAEWE)
EUR 16132
/ / / / / / / / /
EUROPEAN COMMISSION

European Commission
ECOSYSTEMS RESEARCH REPORT No 18
Functional analysis of European wetland ecosystems
Phase 1 (FAEWE)
The function of river marginal wetland ecosystems
Improving the science base for the development of procedures of functional analysis
Final report EC DG XII CT90-0084
Edited and compiled by
E. Maltby, D.V. Hogan, R.J. Mclnnes
Directorate-General Science, Research and Development
1996 EUR 16132 EN

Published by the EUROPEAN COMMISSION
Directorate-General XII Science, Research and Development
LEGAL NOTICE
Neither the European Commission nor any person acting on behalf of the Commission is responsible for the use which might be made of the following information
Cataloguing data can be found at the end of this publication
Luxembourg : Office for Official Publications of the European Communities, 1996
ISBN 92-827-6606-3
© ECSC-EC-EAEC, Brussels · Luxembourg, 1996
Reproduction is authorized, except for commercial purposes, provided the source is acknowledged
Printed in Belgium

COORDINATOR'S PREFACE
The development of this international, inter-disciplinary project represents something of a milestone in the detailed arrangement of scientific collaboration. In general, the sub-projects of previous research topics have been more or less separate and the teams from different member states have worked sometimes exclusively on their own field site. The FAEWE project has required a fundamentally integrated approach, frequently involving teams working on sites remote from their own laboratory. It has required the close collaboration of different disciplines from different countries. There has been the over-riding requirement to meet a common final goal.
Implementation has been an organisational as well as a scientific challenge. The overall synthesis and interpretation of the work of the sub-projects has been complicated. We hope that this distillation helps to define the way by which new science can help the development of procedures which will assist in better utilisation, management and protection of Europe's wetland resources.
Thanks are expressed to all the scientists who have contributed their material to this final report and who have coped courteously with a regular bombardment of challenges and demands. Special thanks are extended to Dr Hartmut Barth (DG XII/D-I) for his constant support and advice, to Reinhart Klein (DG XI) for encouragement and to the many landowners and farmers who have unselfishly enabled us to work on their land, sometimes at considerable inconvenience. The Institute of Grassland and Environmental Research provided the loan of experimental cages. Final thanks go to David Hogan and Rob Mclnnes who have worked tirelessly to transform and harmonise the initial texts from contributors to ensure as far as possible the production of a fully integrated report.
We deeply regret that during the FAEWE project the untimely death of Professor Gonzalez Bernaldez deprived the Phase II activity of not only a great wealth of ecological knowledge, but of a respected and erudite scientist. Our sympathies are duly extended to his family and friends.
Edward Maltby Professor of Environmental and Physical Geography FAEWE Co-ordinator

CONTRIBUTING RESEARCH PERSONNEL
Wetland Ecosystems Research Group *
University of Exeter
Principal Investigator: E. Maltby
Research personnel: D. V. Hogan C. J. Baker
C. P. Immirzi M. J. Everington
E. C. Jewkes N. J. Mockler
R. J. Mclnnes M. A. Russell
G. A. Oliver M. S. A. Blackwell
J. N. Kellen
Free University of Amsterdam
Principal Investigator: A. Hooyer
& Research personnel
University of Birmingham
Principal Investigator: J. W. Lloyd
Research personnel: J. H. Tellam K. Papatolios
University of Glasgow
Principal Investigator: K. J. Murphy
Research personnel: T. H. Flowers
1. D. Pulford
J. M. Hills
V. Abernethy
C. Allan
University of Madrid
Principal Investigator:
(Complutense)
Research personnel:
(Autonoma)
Research personnel:
J. J. Sanz Donaire
M. R. Llamas Madurga
J. Cruces de Abia
J. Fornés Azcoiti
C. Montes del Olmo
F. G. Bernaldez'
C Levassor
D. Díaz Alvarez
A. Sánchez Pérez de Evora
M. García Rodríguez
C. Guerrero
M. Florín Beltrán
University of Rennes
Principal Investigator:
Research personnel:
Β. Clément
Ι. Gilles
University of Utrecht
Principal Investigator:
Research personnel:
J. T. A. Verhoeven
M. A. van Oorschol
M. J. van der Peijl
A. Spink
E. Robbemonl
Κ. Drosl
J. W. de Bruin
A. van Beek
M. Boerstal
N. van Gaaien
C. Hayes
Κ. Helling
M. van der Hoorn
E. Kerkhof
L. Koster
R. van Logtestijn
I. van Strien
M. van Kerkhoven-Schmitz
Now at Royal Holloway. University of London. Geography Department and Institute for Environmental Research (RHIER)

Auen Institute, Rastatt Principal Investigator: P. Obrdlik Research personnel: E. Castella E. Schneider
The National Parks and Wildlife Service, Office of Public Works, Dublin Principal Investigator: J. B. Ryan Research personnel: M. C. D. Speight B. Healy
P. Galvin
Other support personnel
The following personnel provided invaluable technical, administrative or other support and assistance during the FAEWE project:
C. Alcubier, M. Allan, A. Ames, J. Andrews, P. Ascaso, T. Bacon, T. Beier, A. Baker, C. Barge, S. Belbin, L. Bradby, P. Broom, C. Castella, V. Chesterton, J. Clark, J-L. Clavier, C. Collins, A. Dean, G. Faulkner, C. Faribault, M. Feehan, P. Giannoulopoulos, S. Gladitsch, D. Hackett, T. Hampton, J. Harris, S. Heery, F. Hieke, R. D. Hunter, M. Kotiert, A. Lemihän, R. Livescy, A. Maddison, A. Maltby, W. Marggi, Y. Marmatsouris, C. E. Mclnnes, A.Mills, S. Milward, F. Moya, P. Mugridge, D. Norris, C. Priebe, F. Rueda, H. Rodda, M. Seger, J. Small, L. Smith, J. Stokes, A. Teed, L. Viikna, S. Watson, J. Wilson, J. P. Zaballos.
- VI -

TABLE OF CONTENTS
Co-ordinator's preface i Contributing research personnel iii
Table of contents ν List of figures viii List of tables xiv
EXECUTIVE SUMMARY xvii
1 INTRODUCTION 1 1.1 Knowledge gaps and research questions 1 1.2 Objectives of the project 1 1.3 Concepts of wetland ecosystem dynamics 5 1.4 A review of river marginal wetland functions and functional assessment 5
1.4.1 River marginal wetland functions and values 5 1.4.2 Assessing the functions of wetlands 9
1.5 The hydrogeomorphic concept 13 1.5.1 Wetland classification 13 1.5.2 The hydrogeomorphic classification of wetlands 16 1.5.3 The hydrogeomorphic approach proposed by the FAEWE project 18
1.6 FAEWE Project design 18 1.6.1 Conceptual overview 18 1.6.2 Project design - Establishment of field sites 22 1.6.3 Project design - Field and laboratory investigations 22 1.6.4 Project design - Modelling 24 1.6.5 Project design - Organisation and co-ordination 25
1.7 Integration of Potential Users Groups (PUGs) 25 1.7.1 Background rationale 25 1.7.2 Potential User Group meetings 26 1.7.3 The benefits of Potential User Groups 26
1.8 Integration with broader wetland issues 27 1.8.1 EC Directives 28 1.8.2 Application beyond the EU - Eastern Europe 29 1.8.3 Implementation of FAEWE results 29
2 STUDY AREAS 33 2.1 Rationale for site selection 33 2.2 Climatic gradient 35 2.3 Site descriptions 37
2.3.1 Shannon 37 2.3.2 Torridge 44 2.3.3 Loire/Allier 52 2.3.4 Guadiana 60
2.4 Soil hydrologicai status 68
3 METHODS 73 3.1 Sampling design 73 3.2 Summary of the Methods Manual 73 3.3 Hydrological/hydrogeochemical methods 74
3.3.1 Objectives 75 3.3.2 Desk studies 75 3.3.3 Field studies 76 3.3.4 Laboratory analyses 77 3.3.5 Hydrologicai modelling 77
VII
3.4 Biogeochemical methods 85 3.4.1 Characterisation of the soil environment 85 3.4.2 Investigations of nutrient dynamics functions 90 3.4.3 Investigation of the C dynamics function 101 3.4.4 Investigation of the sediment retention function 102 3.4.5 Modelling of spatial patterns and nutrient dynamic processes 103
3.5 Phytosociological methods 115 3.5.1 Field data 115 3.5.2 Classification and ordination of vegetation 115
3.6 Statistical analysis of plant traits 117 3.6.1 Measurement of plant population traits 117 3.6.2 Measurement of state variables 118 3.6.3 Statistical analysis 119
3.7 Invertebrate studies 120 3.7.1 The data base set up 120
3.8 Ornithological methods 124 3.8.1 Shannon studies 124 3.8.2 Guadiana studies 124
4 RESULTS 125 4.1 Characterisation of physical processes 125
4.1.1 Characterisation of the physical environment 125 4.1.2 Flow regimes and mechanisms 135 4.1.3 Flooding regime 148 4.1.4 Solute transport 157 4.1.5 Erosion rates and sedimentation balance 159 4.1.6 Sedimentation 161 4.1.7 Desiccation and salinisation processes 161
4.2 Characterisation of biogeochemical processes 174 4.2.1 Soil water quality 174 4.2.2 Denitrification 181 4.2.3 Phosphorus retention 187 4.2.4 Decomposition 204 4.2.5 Nutrient speciation under semi-arid conditions 224 4.2.6 Primary productivity under semi-arid conditions 224
4.3 Characterisation of ecological relationships 224 4.3.1 Plant community analysis and ecological factors 228 4.3.2 Functional vegetation types as predictors of habitat stress 247 4.3.3 Invertebrate databases 250 4.3.4 Impacts of desiccation and salinisation on vegetation 263 4.3.5 Primary production strategics 274 4.3.6 Assessment of habitat support from the aquatic subsystem of Mediterranean
type semi-arid wetlands 278 4.3.7 Ornithological studies on the Irish floodplain sites 278 4.3.8 Waterfowl and environmental conditions in La Mancha 285
4.4 Investigation of impacts 285 4.4.1 The impact of nutrient additions on nutrient-related processes at the Torridgc
sites 286 4.4.2 The impact of increased sedimentation on nutrient related processes at the
Shannon site 292 4.4.3 Fertilizer enhancement 296 4.4.4 Hydrological regimes using mesocosms 305 4.4.5 Hydrogeological regimes 308 4.4.6 The impact of different flooding regimes on plant production, nutrient uptake
and soil nutrient dynamics 312 4.4.7 Microcosm simulation results 318
VIII

5 DISCUSSION 325 5.1 Physical process studies 325
5.1.1 Hydrogeomorphic processes 326
5.2 Biogeochemical process studies 332 5.2.1 Denitrification 332 5.2.2 Phosphorus dynamics 333 5.2.3 Decomposition 335 5.2.4 Nutrient speciation under semi-arid conditions 336 5.2.5 Primary productivity under semi-arid conditions 337 5.2.6 The effects of impacts on biogeochemical processes 337
5.3 Ecological processes 339 5.3.1 Plant community analysis 339 5.3.2 Reed performance and hydrological stress 340 5.3.3 Primary production strategies 340 5.3.4 The role of the aquatic component in habitat support 340 5.3.5 Waterfowl and environmental conditions 341
5.4 Predictors of functioning 342 5.4.1 Predictors of hydrological functioning 342 5.4.2 Soil characteristics as a predictor of biogeochemical functioning 344 5.4.3 Vegetation as a predictor of functioning 346 5.4.4 Vegetation as a bioindicator of perturbation and wetland functions 354 5.4.5 Assessment of Phragmites australis as a predictor of habitat stress 359 5.4.6 Bioindicators of ecosystem organisation in the aquatic subsystem 361 5.4.7 Invertebrates as predictors of functioning 362
6 DEVELOPMENTS 365 6.1 Computer simulation modelling 365
6.1.1 Interactions between the carbon, nitrogen and phosphorus cycle 365 6.2 Stress and perturbation measurements 368 6.3 Invertebrate databases and their use in site evaluation 371 6.4 Concept of hydrogeomorphic landscape units 373
6.4.1 The hydrogeomorphic unit (HGMU) 373 6.4.2 Validation of the HGMU concept 374
6.5 Summary of preliminary functional assessment procedures 376 6.5.1 Development of the functional assessment procedures 376
6.5.2 Summary of the FAEWE procedures 377
7 CONCLUSIONS 385
REFERENCES 393
- IX

LIST OF FIGURES
1.1 FAEWE project organisational structure and participating partners 2 1.2 Conceptual model that shows the direct and indirect effects of hydrology on wetlands 6 1.3 Conceptual diagram of the relationships between river marginal wetland functions, 8
processes, structure, attributes, goods, services, and values, and the resultant economic, ecological and environmental webs that functions support
1.4 A hydromorphological classification of wetlands 14 1.5 Four major hydrologie types of wetland in Wisconsin 15 1.6 The proposed classification for East Anglian wetlands 17 1.7 Principal sources of water 20 1.8 Hydrodynamic categories based on dominant flow pattern 20 1.9 Outline conceptual process-response model for wetland ecosystems 21 1.10 Location of FAEWE study sites 23
2.1 Climatic variations between the study sites 34 2.2 Soil moisture and soil temperature regions 36 2.3 Location of the Irish study sites in relation to the river Shannon catchment 38 2.4 Soil maps of the Irish study sites: (a) Clonmacnoise; (b) Little Brosna 39 2.5 Vegetation maps of the Irish study sites: (a) Clonmacnoise; (b) Little Brosna 41 2.6 Schematic cross-section of the Irish study sites: (a) Clonmacnoise; (b) Little Brosna 42 2.7 Hydrogeomorphic unit maps of the Irish study sites: (a) Clonmacnoise; (b) Little Brosna 43 2.8 Location of the UK study sites in relation to the river Torridge catchment 45 2.9 Geological maps of the Torridge study sites: (a) Kismeldon; (b) Bradford Mill 46 2.10 Soil maps of the Torridge study sites: (a) Kismeldon; (b) Bradford Mill 47 2.11 Vegetation maps of the Torridge study sites: (a) Kismeldon; (b) Bradford Mill 49 2.12 Schematic cross-sections of the Torridge study sites: (a) Kismeldon; (b) Bradford Mill 50 2.13 Hydrogeomorphic unit maps of the Torridge study sites: (a) Kismeldon; (b) Bradford
Mill 51 2.14 Location of the French study sites in relation to the river Loire catchment 53 2.15 Soil maps of the French study sites: (a) Apremont; (b) Decize 55 2.16 Vegetation maps of the French study sites: (a) Apremont; (b) Decize 56 2.17 Schematic cross-sections of the French study sites: (a) Apremont; (b) Decize 58 2.18 Hydrogeomorphic unit maps of the French study sites: (a) Apremont; (b) Decize 59 2.19 Location of the Spanish study sites in relation to the river Guadiana catchment 61 2.20 Geomorphological map of the Guadiana headwaters 62 2.21 Soil map of the Spanish study sites. El Masegar and Molino del Abogado 63 2.22 Vegetation map of the Spanish study sites, El Masegar and Molino del Abogado 65 2.23 Schematic cross-sections of the Spanish study sites: (a) El Masegar; (b) Molino
del Abogado 66 2.24 Hydrogeomorphic unit maps of the Spanish study sites: (a) El Masegar: (b) Molino
del Abogado 67
3.1 The standard set up for permanently installed monitoring equipment at the study stations 73
3.2 Location of the instrumentation at the Torridge study sites 78 3.3 Transient modelling results: groundwater head distribution at Kismeldon 80 3.4 Bradford Mill steady state simulated groundwater head distribution 81 3.5 Layout of the fertilizer field experiment. Kismeldon Meadows 94 3.6 Soil mesocosm design 96 3.7 Prototype microcosm design (Mk III) 100 3.8 Integration of the various research results with the dynamic model, which in turn
provides input to the functional assessment procedures 104 3.9 A tentative modelling procedure 106 3.10 The three linked sub-models. Carbon. Nitrogen and Phosphorus 106
3.11 Structure of the Carbon sub-model 107 3.12 Structure of the Nitrogen sub-model 108 3.13 Structure of the Phosphorus sub-model 109 3.14 The factor limita!sN has a Michaelis Menten relationship with the concentration of
nitrogen in the plant 112 3.15 The combined implementation of limitassN and limitassP 112 3.16 Curve fit of asine function with long term meteorological data 114 3.17 The effect of soil depth on temperature fluctuations 114 3.18 The relationship between relative process rate and temperature (K) 115 3.19 Water level, redox potential and oxygen percentage with time, Kismeldon slope 116 3.20 The factor 'mode', calculated from data in Fig. 3.19 as described in the text 116
4.1 Soil water status for Clonmacnoise 126 4.2 Soil water status for Little Brosna 127 4.3 Soil water status for Kismeldon 128 4.4 Soil water status for Bradford Mill 129 4.5 Soil water status for Apremont 130 4.6 Soil water status for Decize 131 4.7 Soil water status for (a) El Masegar, (b) Molino del Abogado 132 4.8 Groundwater flow along the Clonmacnoise transect, as modelled for the 23/7/93
summer situation 136 4.9 Modelled seepage rates along the Clonmacnoise transect, for a wet- (spring), a dry-
(summer) and an intermediate situation 136 4.10 Water budgets (21 day moving averages) for soil station no.4 (well no.5) on the
elevated dome unit at the Clonmacnoise site 136 Permeability histograms for different formations in NW Devon 137 Groundwater head distribution in the SD and WZ (Kismeldon, January 1992) 137 Groundwater flow directions in section K0 - K6 at Kismeldon 139 Example piezometer hydrographs (Kismeldon) 140 Kismeldon surface wetness map (30/08/91) 141 Hydrogeological boundaries and features at Kismeldon 141 Conceptual model of recharge 142 Groundwater head distribution in the AL and WZ (Bradford Mill, March 1992) 143 Bradford Mill surface wetness map (August 1991) 143 Bradford Mill generalised subsurface structure and groundwater flow directions 145 Bradford Mill site topography 146 General conceptual hydrological model of Apremont area 147 General conceptual hydrological model of Decize area 147 Hydrogeological profile of the Guadiana headwaters (after Fornes, 1994) 149 Maps of the upper limits of the saturated zone, (a) January 1992, (b) September 1992, (after Fornes, 1994) 150 Digital model of groundwater flow (after Fornes, 1994) 151 Groundwater flow lines and isochrones (time in year) (after Fornes, 1994) 152 River levels at the Shannon sites, in relation to topographic levels 153 Seasonal flood duration, in % of season-duration, at two Clonmacnoise units, representing the lower- and upper topographic limits along the transect 153 Topography of the Clonmacnoise site 155 Flood extent for maximum summer floods (May to July) at Clonmacnoise 155 Flooding regimes for the Allier 156 Particle tracking results from the Kismeldon numerical model 158 Soil profiles from the Shannon sites 162 Soil characteristics at the stations LB(2), LB(3), Cl(4) and LB(5) 163 Major ionic concentrations at MASE1 165 Major ionic concentrations at MASE2 166 Major ionic concentrations at MASE3 167 Major ionic concentrations at MASE4 168 Major ionic concentrations at MOL11 169
4.11 4.12 4.13 4.14 4.15 4.16 4.17 4.18 4.19 4.20 4.21 4.22 4.23 4.24 4.25
4.26 4.27 4.28 4.29
4.30 4.31 4.32 4.33 4.34 4.35 4.36 4.37 4.38 4.39 4.40
4.41 Major ionic concentrations at MOL12 170 4.42 Major ionic concentrations at MOLI3 171 4.43 Major ionic concentrations at MOLI4 172 4.44 Negative correlation between redox potential and bicarbonate ions at MASE4 173 4.45 Piezometric water N03-N and NH4-N content Clonmacnoise 175 4.46 Interstitial water NO3-N and NHj-N content Clonmacnoise 3-5 176 4.47 Interstitial water N03-N and NHj-N content Little Brosna 1. 4 and 5 176 4.48 Piezometric water NO,-N and NH4-N content Little Brosna 177 4.49 Piezometric water ΝΟ,-Ν and NHj-N content Kismeldon 178 4.50 Interstitial water NO3-N and NH4-N content Kismeldon 179 4.51 Interstitial water NO,-N and NH4-N content Bradford Mill 180 4.52 Piezometric water NO rN and NH4-N content Bradford Mill stations 2 - 3 180 4.53 Denitrification rates at the Torridge sites 182 4.54 Location of study sites, weirs and surface drainage network at Kismeldon 183 4.55 Nitrate concentrations at five weirs at Kismeldon. 28th November - 4th December 1992 184 4.56 Yearly average phosphorus concentrations at Kismeldon 188 4.57 Phosphorus concentration at K1SM5 188 4.58 Downslope gradient of easily extractable Ρ upslope of KISM5 188 4.59 Schematic location map of Ρ experiment at Kismeldon 189 4.60 Soluble Ρ input over two day period 190 4.61 Observed and predicted Ρ concentrations 190 4.62 Water depth, redox potential and oxygen concentration at KISM3 192 4.63a Relationship between manganese concentration and soluble Ρ concentration 193 4.63b Association between soluble Ρ and soil oxygen concentrations 194 4.64a Phosphorus concentrations at K1SM2 and KISM4 (7-12 cm) 196 4.64b Phosphorus concentrations at KISM2 and KISM4 (30 - 40 cm) 197 4.65 Relationships between slope of phosphorus adsorption isotherm and (a-c) particle size
class and (d) pH 198 4.66 Relationships between slope of phosphorus adsorption isotherm and extractable forms
ofiron(a-d) 199 4.67 Relationships between slope of phosphorus adsorption isotherm and (a) easily oxidisable
carbon, (b) total carbon and (c) total phosphorus 200 4.68 Correlation of PAI(130ppm) with total extractable Al 203 4.69 Correlation of PAI( 130ppm) with total extractable Fe 204 4.70 Decomposition rates of litter incubated at different stations versus (a) initial C/P ratios
or (b) initial C/N ratios of incubated litter material 205 4.71 Nutrient concentrations during the 2 year litter bag experiment of litter incubated at
several stations of the Torridge study area: (a) N-concentrations for Xismeldon Meadows; (b) N-concentrations for Bradford Mill; (c) P-concentrations for Kismeldon Meadows; (d) P-concentrations for Bradford Mill 206
4.72 Theoretical relationship between remaining biomass c.q. nutrients and litter nutrient concentrations, according to Aber and Melillo ( 1982) 208
4.73 Remaining biomass and total nutrient content versus litter concentrations: (a) N-relation-ships for Kismeldon Meadows: (b) N-relationships for Bradford Mill; (c) P-relationships for Kismeldon Meadows: (d) P-relationships for Bradford Mill 209
4.74 Mean CTSL variations with depth at KISM3 (1991-1992) 212 4.75 Mean CTSL values. 0-2. 3-5 and 6-8cm depth, with water table depth, temperature and
pH:(a)BRADl;(b)CLON4 213 4.76 Mean CTSL plotted against mean annual temperature/wetness class. Plotted points given
as wetness class 215 4.77 Site cross-section with mean seasonal CTSL and temperature and mean pH per station:
(a) Clonmacnoise; (b) Little Brosna; (c) Kismeldon; (d) Bradford Mill; (e) Apremont; (f) Decize: (g) El Masegar: (h) Molino del Abogado 219
4.78 Solid phase dynamics and speciation of bio-available and unavailable inorganic carbon in Laguna de El Masegar aquatic subsystem 225
4.79 Solid phase dynamics and speciation of silica in the Laguna de El Masegar aquatic subsystem 226
- XII -

4.80
4.81
4.82
4.83
4.84
4.85
4.86
4.87
4.88
4.89
4.90A
4.90B
4.90C
4.91
4.92
4.93
4.94
4.95
4.96
4.97
4.98
4.99
4.100
4.101
4.102
4.103
4.104
4.105
4.106
4.107
4.108
4.109
4.110
4.111
4.112
4.113
Solid phase dynamics and speciation of bio-available and unavailable orthophosphate in
the Laguna de El Masegar aquatic sub-system 227
Classification of 50 relevés from Bradford Mill (1 - 25) and Kismeldon (26 - 50) by
TWINSPAN analysis (Phytosociological Units A. B, C, D. E) 231
Ordination of Torridge relevés, K Kismeldon, Β Bradford Mill, in factorial diagram
A l x A 2 232
Ordination of Torridge relevés. Κ Kismeldon, Β Bradford Mill, in factorial diagram
A1XA3 234
Ordination of Torridge relevés, Κ Kismeldon. Β Bradford Mill, on the Axe 1 - Axe 2
plane, showing separation of four main phytosociological units 235
Ordination of Β Torridge species on the Axe 1 - Axe 2 plane, showing the relationship
between plant species differentials and phytosociological units 236
Natural dynamics and flood perturbation impact on vegetation in hydrogeomorphic unit
"lit mineur" Loire and Allier rivers 244
Human impact on vegetation in hydrogeomorphic unit "lit majeur" River Loire 245
Human impact on vegetation in hydrogeomorphic unit "lit majeur" River Allier 246
Potential use of the comparison between predicted and observed lists of species in a site
assessment procedure 253
Representation of species-pool for central France on Decize site: forest habitats 256
Representation of species-pool for central France on Decize site: wetland habitats 256
Representation of species-pool for central France on Decize site: open ground habitats 257
Representation of central France unimproved pasture syrphids associated with different
larval microhabitats on the Decize site 257
Occupancy of forest habitats on the Apremont and Decize sites 258
The proportion of observed and predicted species of molluscs 262
The proportion of the number of observed species which were actually predicted and the
number of predicted species of molluscs 262
First factorial plane of inter-battery analysis 265
Test of significance of the inter-battery analysis 266
Canonical Correspondence Analysis, Axis 1 and Axis 2 268
Canonical Correspondence Analysis, Axis 1 and Axis 3 269
Frequency histograms of reed shoot length (month of maximum biomass and/or
floration) 271
Summary of some performance variables of reed 272
Variation of Ρ and some soil variables in August 1993 273
Hydroperiod of La Mancha wetlands 275
Time series analysis of surface water level. La Mancha wetlands 276
Box and whisker plots showing the variability of sediment features across wetland
types in the La Mancha region 277
Total number of widgeon wintering on the callows of the Little Brosna and at
Clonmacnoise 281
Above ground plant production in the Torridge sites versus N-mineralisation during a
15 week period from May-August 1991 288
Above ground plant production in the Torridge sites versus P-release during a 15 week
period May-August 1991 288
Relative N-mineralisation during a 15 week period from May-August 1991 in the
Torridge sites versus the soil C/N ratio 289
Relative N-mineralisation during a 15 week period from May-August 1991 in the
Torridge sites versus the soil C/P ratio 289
Means and standard errors for several parameters describing soil structure and
environmental conditions at the Irish study sites 293
Means and standard errors for several parameters describing soil nutrient pools at the
Irish study sites 294
Means and standard errors for several parameters describing soil nutrient availability at
the Irish study sites 296
Means and standard errors for several parameters describing biomass processes at the
Irish study sites 298
- XIII
4.114 Results of the field experiment in the Torridge study area: a) biomass response;
b) Nconcentration of grasses; c) Pconcentration of grasses; d) N/P ratios of living
grasses 300
4.115 Results of the phytometer experiment in the Torridge study area: a) biomass
response; b) Nconcentration of grasses: c) Pconcentrations of grasses: d) N/P ratios
of living grasses 301
4.116 Results of the field experiment in the Shannon study area: a) biomass response; b) N
concentration of grasses; c) Pconcentration of grasses; d) N/P ratios 303
4.117 Plant N and Ρ concentrations in several control treatments from fertilizer experiments in
grassland, fen and heathland ecosystems 304
4.118 Soil redox potential at 5cm depth versus soil pF values 307
4.119 Simulated effects of a hypothetical drought (75% recharge) on wetland groundwater
levels 309
4.120 Simulated effects of a hypothetical abstraction (15m/d) on wetland groundwater
levels 310
4.121 Simulated effects of a hypothetical drought and abstraction on the Kismeldon
groundwater head distribution (steady state model) 311
4.122 Soil pF values of the grassland units of the Allier and Loire rivers for 1991 313
4.123 Results of a principal components analysis on the soil parameters listed in Table 4.47.
for the grassland units of the French sites 313
4.124 Ratio of litter formation (death) and average plant production per unit, versus soil pF 314
4.125 Microcosm results for redox potential and pH for B2. a) Cell I; b) Cell 2; c) Cell 3 320
4.126 Microcosm results for redox potential and pH for F2. a) Cell 4; b) Cell 5; c) Cell 6 321
5.1 Relationships among hydrogeomorphic processes, terrestrial plant succession, and
aquatic ecosystems in riparian zones 325
5.2 Hydrological functioning of the Las Tablas de Daimiel National Park: (a) undisturbed;
(b) disturbed (after Garcia and Llamas. 1993) 328
5.3 Water chemistry of the Shannon and Little Brosna Rivers 330
5.4 Schematic flow diagram representing the interactions between management, climate, soil
characteristics and denitrification 334
5.5 Interpretative maps of the hydrological functions and major physicochemical functions
related to plant communities as bioindicators: (a) Bradford Mill, (b) Kismeldon 348
5.6 Relationships between topography, hydrodynamics and zonation of different humid
grasslands: (a) Bradford Mill, (b) Kismeldon 349
5.7 Relationships between ecosociological groups of species in three grassland types within
the Kismeldon gentle slope HGMU 351
5.8 Biodiversity and environmental factors within grassland communities 352
5.9 Relationship between biodiversity and degree of anthropogenic impacts 353
5.10 Diagnosis of reed status (Phragmites australis) for the study area and the relationship, in
general terms, to water stress 360
6.1 Seasonal dynamics of five state variables (gC/m2) in the Carbon submodel: a 4year run 366
6.2 Seasonal dynamics of NNH4, ammonium in the soil (gN/m"): a 1year run 366
6.3 Seasonal dynamics of NNŒ, in the soil and denitrification: a 1year run 367
6.4 Seasonal dynamics of the same five state variables shown in Fig. 6.1 in a run with longer
'wet' periods and shorter 'dry' periods 367
6.5 Illustration of flows connecting HGMUs 369
6.6 Schematic representation of the procedures for assessing wetland stress and perturbation 372
6.7 Water tableredox relationships for Kismeldon Meadows instrumentation stations 375
6.8 Diagrammatic representation of the internal pathways through the Functional Assessment
procedures 378
6.9 Internal structure of the Desk Study section of the functional assessment procedures 381
6.10 Internal structure of the HGMU delineation section of the functional assessment
procedures 381
XIV

7.1 Proposed scheme for catchment mapping and zonation 390
XV -
LIST OF TABLES
1.1 Functions addressed by the FAEWE procedures, including the process(es) that maintain them and their definition 10
1.2 Major hydrodynamic characteristics of fresh water marshes 13 1.3 Examples of geomorphic setting as a property of the hydrogeomorphic classification 19 1.4 Impacts studied at FAEWE field sites 22 1.5 Venues of FAEWE workshops 25 1.6 Original anticipated users of the FAEWE Procedures 27 1.7 EC Directives that will benefit from the FAEWE project 28
2.1 Mean monthly air temperature categories (°C) 35 2.2 Mean monthly rainfall (mm) 35 2.3 Summary of the climatic regimes at the study sites 37 2.4 Monthly long term rainfall for the Torridge (1941-70) 48 2.5 Long term climatic data for the Loire 54 2.6 Classification of soils at the study sites 69 2.7 Soil properties at the study sites 70 2.8 Summary of the hydrological status of the study site soils 71
3.1 Summary of the contents of the Methods Manual 74 3.2 Laboratory analyses of water samples 77 3.3 Kismeldon simulated monthly groundwater balance (m/d) 82 3.4 Monthly water balances at Kismeldon (mm/month) (May 1992-April 1993) 84 3.5 Soil analytical determinations and methods used in biogeochemical investigations 87 3.6 Soil moisture regime classes (from Hodgson. 1981) 88 3.7 Nutrient application levels and codes used in the fertilisation experiments 93 3.8 Materials used for the litter-bag decomposition study 102 3.9 A list of all the state variables used in the model 105 3.10 Fit for study sites 113 3.11 Nine variables and their categories used in the trait base for Syrphidae 121 3.12 The 66 categories used in the habitat database for Syrphidae 122 3.13 Six variables and their categories used in the range and status database for Syrphidae 123
4.1 Percentage of recorded water levels in different wetness classes 133 4.2 Percentage of redox categories in different wetness classes 134 4.3 Monthly totals (mm) of daily recharge estimates 144 4.4 Annual and seasonal flood duration for two units at Clonmacnoise. see Fig. 4.29 154 4.5 Sedimentation balance average rates at the French sites 159 4.6 Sedimentation balance average rates at the Spanish sites 160 4.7 Denitrification rates with soil characteristics 186 4.8 Regression equations explaining the phosphorus isotherms 201 4.9 Correlation coefficients (r) between 130 ppm Index and the soil properties listed for
the Loire and Shannon sites 202 4.10 Mean (with standard errors in brackets) of initial N- and P-concentrations and
significant decomposition constants (k) for the litter-bag experiment performed at the Torridge site 204
4.11 Seasonal Averages in CTSL per day for upper floodplain sites 21 1 4.12 Spearman's Rank correlation coefficients for CTSL with EOC and total N 216 4.13a The R1 values for each regression equation 217 4.13b R: values for El Masegar and Molino del Abogado, using CE as a variable 217 4.14 Environmental background for primary producer activity and characterisation of dici
primary productivity and ecosystem metabolism of the Laguna de El Masegar aquatic subsystem 228
XVI
4.15 Synoptic table of phytosociological analysis - Torridge 237 4.16 Synoptic table summarising results of phytosociological analysis of vegetation data
from Kismeldon and Bradford Mill, showing division into four phytosociological units 239 4.17 Grasslands on the Loire and Allier floodplains 240 4.18 Sedge bed communities at Apremont 241 4.19 Semi-permanent fresh water communities at Decize 243 4.20 Habitat data-file categories for molluscs 259 4.21 Mollusc traits data-file categories 260 4.22 The mollusc range and status data-file categories 261 4.23 Carabid habitat data-file categories 263 4.24 Carabid traits data-file categories 264 4.25 Production rates and species composition at the Spanish study sites 267 4.26 Influence of the alteration of flooding and dry periods on the variation of the various
parameters related to trophic dynamics in the Laguna de Albardiosa 278 4.27 Maximum numbers of all wetland birds seen at the Little Brosna callows 279 4.28 Maximum numbers of all wetland birds seen at Clonmacnoise callows 280 4.29 The total number of bird hours spent throughout the winter by the dominant wildfowl
and waders on each of the vegetation types within the Little Brosna callows 282 4.30 As Table 4.29 but with Hunter's index of preference applied to allow the relative areas
of the different vegetation types to be taken into account 283 4.31 The total number of bird hours spent throughout the winter by the dominant wildfowl
and waders at each of the sites within the Little Brosna callows 283 4.32 As 4.30 but with occupancy expressed as preference indices weighted to take account of
the proportion of each vegetation type occurring outside the Little Brosna Wildfowl Sanctuary 284
4.33 Preference indices weighted to take account of the effects of flooding on the availability of different vegetation types on the Little Brosna callows 284
4.34 Duration of flooding October 1992-April 1993 inclusive - Little Brosna and Clonmacnoise callows 284
4.35 General soil parameters (means and standard errors) for the impacted and non-impacted floodplains and slopes 286
4.36 Above ground biomass production, nitrogen and phosphorus uptake (means and standard errors) from May-August 1991, for the impacted and non-impacted floodplains and slopes 287
4.37 Summer rates during 15 weeks for N-mineralisation and P-release for the impacted and non-impacted floodplains and slopes (means and standard errors) expressed on an areal basis and relative to the soil nutrient pools 287
4.38 Some correlations between process rates and possible controlling factors 290 4.39 N/P ratios for the impacted and non-impacted floodplains and slopes (all as gN/gP;
means and standard errors) for the variables: soil bound nutrients; aboveground plant uptake (during 15 weeks) and nutrient concentrations in living biomass and litter 290
4.40 Results for two-way ANOVAs with rivers and classes as factors for several parameters describing soil structure, soil nutrient contents and environmental conditions for the Shannon site 295
4.41 Results for two-way ANOVAs with rivers and classes as factors for several parameters describing soil nutrient availability for the Irish study area 295
4.42 Significant multiple regressions for several parameters describing nutrient availability in the Irish study area 297
4.43 Results for two-way ANOVAs with rivers and classes as factors for several biomass parameters for the Irish study area 297
4.44 Significant multiple regressions for several biomass parameters in the Irish study area 299 4.45 Means and standard errors for several parameters describing soil environmental
conditions in the turf experiment on soil moisture 306 4.46 Means and standard errors for several process rates for turf experiment 306 4.47 Means and standard errors for several parameters describing soil structure, soil nutrient
contents and environmental conditions for the French grassland study areas 315
XVII
4.48 Means and standard errors for several process rates and P-availability for the French grassland study areas 316
4.49 Significant multiple regressions for several biomass parameters in the French study sites 317 4.50 Major changes in Eh and pH exhibited by microcosm cells 322
5.1 The relationships between identifiable soil characteristics and wetland functions 345 5.2 Plant communities as bioindicators of some major ecological factors in river marginal
wetlands 355 5.3 Perturbation bands as predictors of wetland functions 359 5.4 Predictors of functional processes and ecological properties for semi-arid RMWs 361
6.1 HGMU descriptions associated with the instrumentation stations at Kismeldon Meadows 374 6.2 Perception of priorities - summary of results from an institutional inquiry of potential
users 379 6.3 Detail from the list of synonyms and alternative terminology provided in the FAEWE
procedures 380 6.4 Controlling variables for N export (denitrification) function 382
XVIII -
EXECUTIVE SUMMARY
INTRODUCTION 1. The need in Europe for a functional approach to wetland assessment and the requirement for a better science base to improve the understanding and quantification of dynamic processes results from the failure of traditional nature conservation criteria to protect wetlands against loss and degradation. The rationale behind the development of the functional assessment procedures is built on the possibilities of predicting wetland ecosystem functioning by characterisation of distinctive ecosystem/landscape complexes called hydrogeomorphic units (HGMUs). The final goal of this project is the development of science-based assessment procedures for the functional analysis of European wetland ecosystems - procedures that are as rapid and simple to use as possible by professionals who may not have in-depth knowledge of wetland ecosystems or functioning. The objectives of Phase I of the project Functional Analysis of European Wetland Ecosystems (FAEWE) have been:
i. To identify, assess and measure the key processes operating in river marginal wetland ecosystems;
ii. To assess the resilience to and the effects of ecosystem disturbance which result from a range of human activities. Impacts include altered hydrological regime, sedimentation and fertilizer application;
iii. To link dynamic models and evaluations of the effects of anthropogenic disturbance into an overall system of functional analysis.
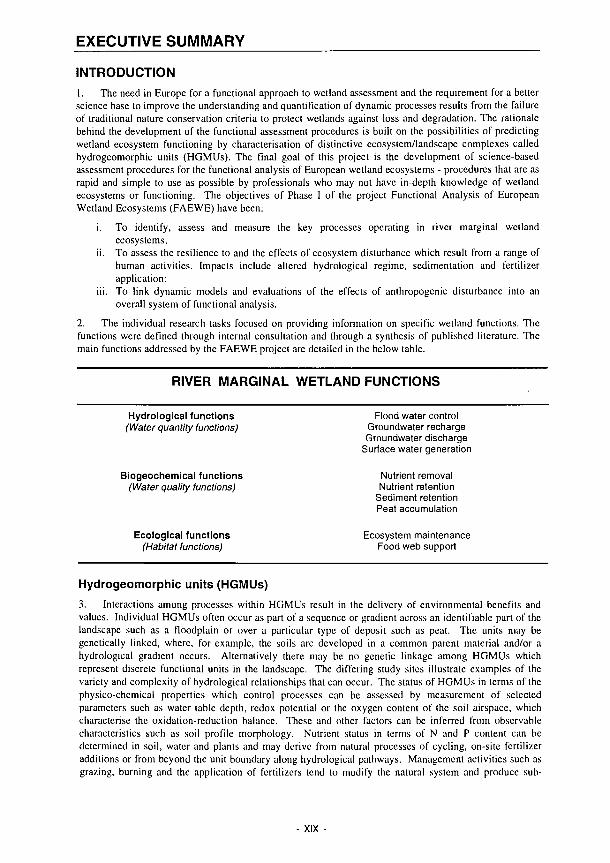
2. The individual research tasks focused on providing information on specific wetland functions. The functions were defined through internal consultation and through a synthesis of published literature. The main functions addressed by the FAEWE project are detailed in the below table.
RIVER MARGINAL WETLAND FUNCTIONS
Hydrological functions Flood water control (Water quantity functions) Groundwater recharge
Groundwater discharge Surface water generation
Biogeochemical functions Nutrient removal (Water quality functions) Nutrient retention
Sediment retention Peat accumulation
Ecological functions Ecosystem maintenance (Habitat functions) Food web support
Hydrogeomorphic units (HGMUs) 3. Interactions among processes within HGMUs result in the delivery of environmental benefits and values. Individual HGMUs often occur as part of a sequence or gradient across an identifiable part of the landscape such as a floodplain or over a particular type of deposit such as peat. The units may be genetically linked, where, for example, the soils arc developed in a common parent material and/or a hydrological gradient occurs. Alternatively there may be no genetic linkage among HGMUs which represent discrete functional units in the landscape. The differing study sites illustrate examples of the variety and complexity of hydrological relationships that can occur. The status of HGMUs in terms of the physico-chemical properties which control processes can be assessed by measurement of selected parameters such as water table depth, redox potential or the oxygen content of the soil airspace, which characterise the oxidation-reduction balance. These and other factors can be inferred from observable characteristics such as soil profile morphology. Nutrient status in terms of N and Ρ content can be determined in soil, water and plants and may derive from natural processes of cycling, on-site fertilizer additions or from beyond the unit boundary along hydrological pathways. Management activities such as grazing, burning and the application of fertilizers tend to modify the natural system and produce sub-
XIX

divisions of HGMUs, distinguishable in terms of distinctive vegetation types and/or variations in hydrological or biogeochemical processes.
DEFINITIONS
River Marginal Wetlands include all currently active and historical Iloodplain ecosystems in which inundation by surface water and/or the prevalence of an elevated water table are regular phenomena. Also included may be adjacent valley slopes which are regularly affected by overland flow, groundwater seepage, or otherwise have an elevated water table. Waterlogging normally should be of sufficient duration to support hydrophytic vegetation and to enable the development of hydromorphic soils. There may or may not be hydrological connection between the floodplain and the valley slopes.
Hydrogeomorphic Units are areas of homogeneous geomorphology and hydrology/hydrogeology, (HGMUs) and under normal conditions homogeneous soil.
Processes are changes or reactions which occur naturally within wetland ecosystems. They may be physical, chemical or biological.
Functions are activities or actions which occur naturally in wetlands as a product of the interactions between the ecosystem structure and processes. Functions include actions such as flood water control, nutrient retention and food web support.
Values are the perceived benefits to society, either direct or indirect, that result from wetland functions. These values include human welfare, environmental quality and wildlife support.
SELECTION AND CHARACTERISATION OF THE STUDY SITES 4. Four study areas were selected along a climatic and environmental gradient, from the oceanic conditions of Ireland through the cuoccanicity of south west England to the continental regime of central France and the highly seasonal, semi-arid regime of central Spain. Paired sites were selected to measure the relative effects of a specific anthropogenic impact. The study sites were characterised in terms of hydrology, geomorphology, soil and vegetation properties, that control or contribute to functioning.
5. During initial reconnaissance surveys, operational hydrogeomorphic units (HGMUs) were identified at each site on the basis of broad field observations of landform and vegetation. One or more permanent stations were instrumented at each unit to enable regular measurements to be made of the soil/substrate environment including groundwater dynamics, soil water regime, redox potential and gaseous oxygen content. Correlations have been made between these properties and other observable characteristics such as soil profile morphology and vegetation, which could be used for predictive purposes in the procedures for functional assessment. Background levels for nutrient loadings (N and P) have been established from laboratory analysis of water samples collected on a regular basis at the stations.
6. A number of patterns and trends are apparent for various properties and processes including soil wetness class, redox/water table relationships, decomposition rates, phosphorus adsorption and functional vegetation types, both within and between individual sites. At each individual site hydrological gradients have been identified across floodplains and in places incorporating footslopcs. A range of soil water regimes (from wetness class I at KISMl', BRADI and DECZ3 to wetness class VI at CLON3, KISM4 and KISM5) and associated flooding categories were found, which together with surveys of slope/landform, soils and plant species/communities have enabled a scries of maps to be produced including HGMUs, soils and vegetation.
7. Trends which occur across the climatic gradient arc also apparent. Thus there is a wide range of flooding and soil water regimes within the study sites: the proportion of wet soils and the intensity of
Instrumentation station abbreviations explained in full in main text (2.3).
- XX
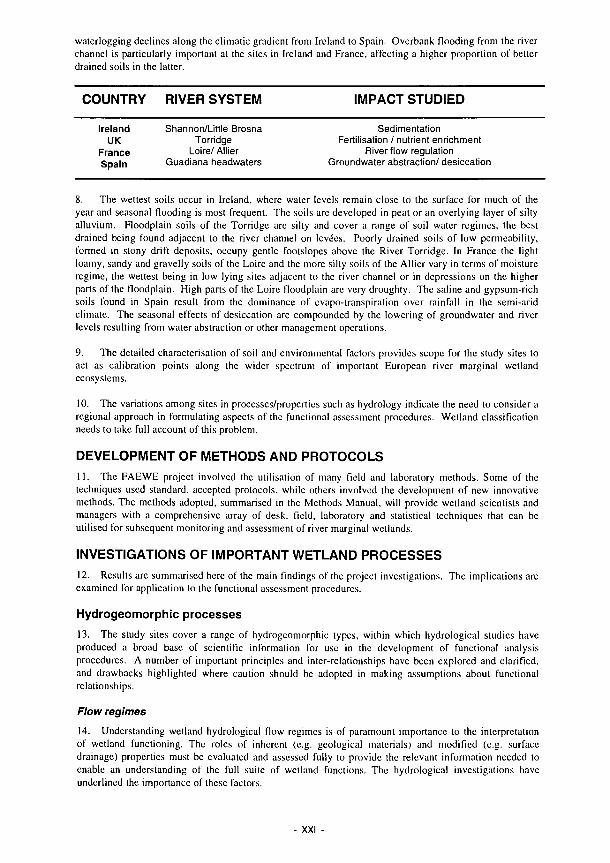
waterlogging declines along the climatic gradient from Ireland to Spain. Overbank flooding from the river channel is particularly important at the sites in Ireland and France, affecting a higher proportion of better drained soils in the latter.
COUNTRY RIVER SYSTEM IMPACT STUDIED
Ireland UK
France Spain
Shannon/Little Brosna Torridge
Loire/ Allier Guadiana headwaters
Sedimentation Fertilisation / nutrient enrichment
River flow regulation Groundwater abstraction/ desiccation
8. The wettest soils occur in Ireland, where water levels remain close to the surface for much of the year and seasonal flooding is most frequent. The soils are developed in peat or an overlying layer of silty alluvium. Floodplain soils of the Torridge are silty and cover a range of soil water regimes, the best drained being found adjacent to the river channel on levées. Poorly drained soils of low permeability, formed in stony drift deposits, occupy gentle footslopes above the River Torridge. In France the light loamy, sandy and gravelly soils of the Loire and the more silty soils of the Allier vary in terms of moisture regime, the wettest being in low lying sites adjacent to the river channel or in depressions on the higher parts of the floodplain. High parts of the Loire floodplain are very droughty. The saline and gypsum-rich soils found in Spain result from the dominance of evapo-transpiration over rainfall in the semi-arid climate. The seasonal effects of desiccation are compounded by the lowering of groundwater and river levels resulting from water abstraction or other management operations.
9. The detailed characterisation of soil and environmental factors provides scope for the study sites to act as calibration points along the wider spectrum of important European river marginal wetland ecosystems.
10. The variations among sites in processes/properties such as hydrology indicate the need to consider a regional approach in formulating aspects of the functional assessment procedures. Wetland classification needs to take full account of this problem.
DEVELOPMENT OF METHODS AND PROTOCOLS 11. The FAEWE project involved the utilisation of many field and laboratory methods. Some of the techniques used standard, accepted protocols, while others involved the development of new innovative methods. The methods adopted, summarised in the Methods Manual, will provide wetland scientists and managers with a comprehensive array of desk, field, laboratory and statistical techniques that can be utilised for subsequent monitoring and assessment of river marginal wetlands.
INVESTIGATIONS OF IMPORTANT WETLAND PROCESSES 12. Results are summarised here of the main findings of the project investigations examined for application to the functional assessment procedures.
The implications arc
Hydrogeomorphic processes 13. The study sites cover a range of hydrogeomorphic types, within which hydrological studies have produced a broad base of scientific information for use in the development of functional analysis procedures. A number of important principles and inter-relationships have been explored and clarified, and drawbacks highlighted where caution should be adopted in making assumptions about functional relationships.
Flow regimes 14. Understanding wetland hydrological flow regimes is of paramount importance to the interpretation of wetland functioning. The roles of inherent (e.g. geological materials) and modified (e.g. surface drainage) properties must be evaluated and assessed fully to provide the relevant information needed to enable an understanding of the full suite of wetland functions. The hydrological investigations have underlined the importance of these factors.
XXI

The role of geology 15. Studies at the Shannon have indicated the importance of having detailed geological information in order to predict groundwater flows. Impermeable clays underlying the floodplain sediments effectively isolate local flows, separating the ecosystem's functional interactions from the regional aquifer. The system here is fed and maintained largely by rainfall.
16. Geological formations at the Torridge site produce discrete flow regimes, which operale only at a localised level. Small areas of distinct vegetation and soil, especially tussock sedge fen growing on peat, are a prominent expression of groundwater seepage, which is controlled by the structural configuration and lithological characteristics of the bedrock and the nature of lhe superficial deposits.
17. In the case of the Loire/Allier systems oscillations in the levels of groundwater in the river marginal wetlands relate directly to changes in the level of the river with hydrological linkage operating through permeable alluvial deposits and being generally unconnected to regional aquifers.
The effects of human impacts 18. At both the Shannon and Torridge sites ditches have been constructed for agricultural drainage improvement. They carry away surface water (and possibly also intercept some groundwater), and thereby alter hydrological flows, affecting the functioning of the ecosystem.
19. In the Loire any regulation of flows upstream which may affect lhe pattern of river discharge and stage will also affect water tables on the floodplain.
20. In Spain excessive groundwater abstraction has resulled in a substantial depletion of aquifers and lowering of water tables, cessation of flows in the River Guadiana and reductions in the River Cigiicla. The important wetlands of the Tablas de Daimiel National Park, flooded areas of which have now become reduced from 15 to 0.5km" in extent, are now maintained by pumping from groundwater wells and by water transfer via the Cigiicla from the River Tagus 160km away. The character of the Cigiicla has been altered as a result of operations to straighten and deepen the channel. This has resulted in the loss of lhe natural functioning of former river marginal wetlands. Up to 90 percent of flow in the River Cigiicla is losl by évapotranspiration.
Flooding regimes
21. Studies on the Shannon and the Loire/Allier have provided important information on the role of flooding in maintaining functions such as floodwatcr control, sediment and nutrient retention, nutrienl removal and ecosystem maintenance.
22. In Ireland historical records have been used to interpret the significance of pasl flood events in terms of functioning. Major events, such as those of 1954 and 1990, inundated some 6000ha of the middle Shannon floodplain. Assuming an average flooding depth of I metre, flood storage equates lo about 2 days detention of discharge at maximum rates, which represents a considerable attenuation of the flood peak and reduction of flood risk on a river of this size.
23. Flood timing studies, based on river level archives, indicate recent increases in the duration of flooding in both spring and summer.
24. It is commonly held that wetlands function as fillers for the removal of pollutants and sediments. In the case of the Shannon sites, however, there is little opportunity for floodwatcr to infiltrate as the soils are more or less saturated by rainfall. Solute diffusion rales indicate that the process of diffusion into saturated sediments of low permeability is negligible.
25. Some reduction in the nutrienl concentration of floodwatcr may lake place as a result of algal growth. Algae have been observed to develop in the standing water left in depressions following flooding. On drying out the decomposition of the algae provides nutrients for plant uplake. As a means of nutrient removal it becomes enhanced in spring and summer as temperatures rise, although its efficiency is reduced as maximum nutrient loadings in floodwaters are more likely to occur in the autumn and winler periods.
XXII -
Sedimentation and erosion
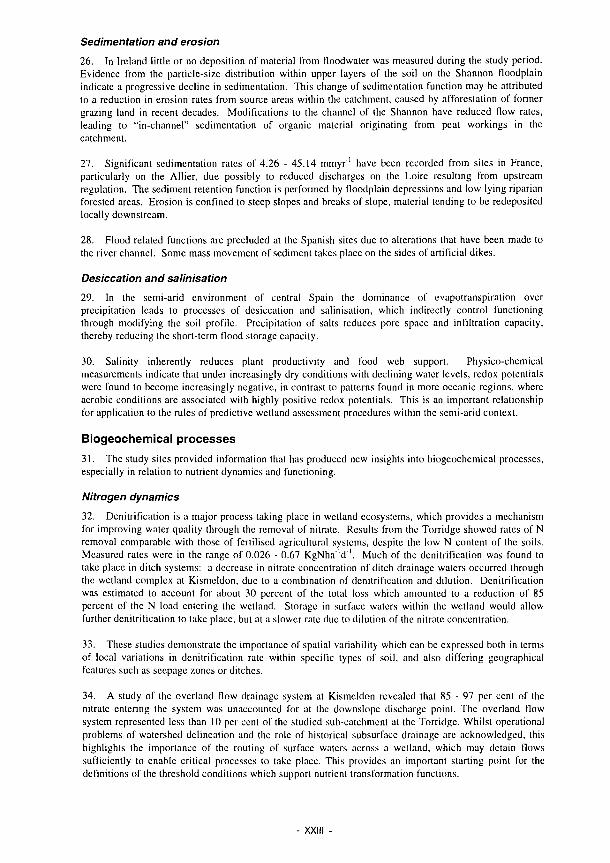
26. In Ireland little or no deposition of material from floodwatcr was measured during the study period. Evidence from the particle-size distribution within upper layers of the soil on the Shannon floodplain indicate a progressive decline in sedimentation. This change of sedimentation function may be attributed to a reduction in erosion rates from source areas within the catchment, caused by afforestation of former grazing land in recent decades. Modifications to the channel of the Shannon have reduced flow rates, leading to "in-channel" sedimentation of organic material originating from peal workings in the catchment.
27. Significant sedimentation rates of 4.26 - 45.14 rnmyr'1 have been recorded from sites in France, particularly on the Allier, due possibly to reduced discharges on the Loire resulting from upstream regulation. The sediment retention function is performed by floodplain depressions and low lying riparian forested areas. Erosion is confined to steep slopes and breaks of slope, material tending to be redeposited locally downstream.
28. Flood related functions are precluded at the Spanish sites due to alterations that have been made to the river channel. Some mass movement of sediment takes place on the sides of artificial dikes.
Desiccation and salinisation
29. In the semi-arid environment of central Spain the dominance of évapotranspiration over precipitation leads to processes of desiccation and salinisation, which indirectly control functioning through modifying the soil profile. Precipitation of salts reduces pore space and infiltration capacity, thereby reducing the short-term flood storage capacity.
30. Salinity inherently reduces plant productivity and food web support. Physico-chemical measurements indicate that under increasingly dry conditions with declining water levels, redox potentials were found to become increasingly negative, in contrast to patterns found in more oceanic regions, where aerobic conditions are associated with highly positive redox potentials. This is an importam relationship for application to the rules of predictive wetland assessment procedures within the semi-arid context.
Biogeochemical processes
31. The study sites provided information that has produced new insights into biogeochemical processes, especially in relation to nutrient dynamics and functioning.
Nitrogen dynamics
32. Denitrification is a major process taking place in wetland ecosystems, which provides a mechanism for improving water quality through the removal of nitrate. Results from the Torridge showed rates of N removal comparable with those of fertilised agricultural systems, despite the low N content of the soils. Measured rates were in the range of 0.026 - 0.67 KgNha'd'. Much of the denitrification was found to take place in ditch systems: a decrease in nitrate concentration of ditch drainage waters occurred through the wetland complex at Kismeldon, due to a combination of denitrification and dilution. Denitrification was estimated to account for about 30 percent of the total loss which amounted to a reduction of 85 percent of the N load entering the wetland. Storage in surface waters within the wetland would allow further denitrification to take place, but at a slower rate due to dilution of the nitrate concentration.
33. These studies demonstrate the importance of spatial variability which can be expressed both in terms of local variations in denitrification rate within specific types of soil, and also differing geographical features such as seepage zones or ditches.
34. A study of the overland flow drainage system at Kismeldon revealed that 85 - 97 per cent of the nitrate entering the system was unaccounted for at the downslope discharge point. The overland flow system represented less than 10 per cent of the studied sub-catchment at the Torridge. Whilst operational problems of watershed delineation and the role of historical subsurface drainage are acknowledged, this highlights the importance of the routing of surface waters across a wetland, which may detain flows sufficiently to enable critical processes to take place. This provides an important starling point for the definitions of the threshold conditions which support nutrient transformation functions.
XXIII
35. Results from the Shannon and Loire require further investigation to clarify interpretations. In
general the denitrification rates measured on these sites were found to be lower than those of the Torridge.
This would be consistent with the fundamental differences in soil profile and environmental conditions.
36. In Ireland, where many of the soils are peaty, nitrate supply may be limited due to low rates of
mineralisation in organic soils. Intense waterlogging is also a factor in reducing rates.
37. In France some limitation in denitrification rates may be a result of low organic mailer contents, with
coarse texture and seasonal droughtiness factors on some sites.
38. Statistical analysis of relationships between process rates, soil and environmental factors indicates
the importance of antecedent rainfall in providing conditions conducive to enhanced rates.
Phosphorus dynamics
39. Detailed investigations were carried out at the Torridge site to determine the amounts and flows of
phosphorus in soil and water and associated physicochemical parameters in order lo identify variables
controlling Ρ behaviour in wetland ecosystems. Statistical models have been developed to investigate
relationships and assess predictive capacity for use in functional assessment procedures.
40. A discriminant analysis model was used to examine processes responsible for Prclease, i.e.
mineralisation of organic material, reduction of iron and manganese phosphates and the role of pH on
phosphate stability. The model requires data on many variables, and a detailed database requiring
accurate, specific information. The approach therefore is not appropriate for use in a rapid assessment
scheme.
4 1 . Regression models are under development for use in predicting Padsorption. Single linear
regression models have identified key controlling variables accounting for much of the variation within
the database. These models are better suited for use in rapid assessment procedures since:
• Highly significant correlations were found, giving high predictive capacity.
• Only a few independent variables are needed requiring limited data collection; these include soil
texture, organic carbon and pyrophosphateexlraclablc iron.
• Measurements are required only once or twice a year.
42. There are differences in phosphorus dynamics both vertically, between horizons of a particular soil
profile, and horizontally along the wetland catena. Soil phosphorus concentrations were found to be
higher on the floodplain HGMUs than those of the slope HGMUs. A gradienl of soluble phosphorus
concentration in soil water downslope al Kismeldon was identified in upper soil horizons, where some
hydrological throughflow occurs. There is evidence also of a phosphorus gradient down the slope away
from the source of agricultural inputs, indicating a retention of agricultural inputs from throughflow.
43. Within lower subsoils soluble phosphorus is positively correlated with soluble iron and manganese.
The relationship was not found in topsoils possibly due to the influence of organic material. The amount
of soluble reactive phosphorus present in soil water increases with the duration of waterlogging.
44. Soluble phosphorus is removed from surface water in wetland flush zones. On average about 759Í
of the Ρ entering the wetland via a ditch system is removed from the surface water on entering the
floodplain at the base of the slope.
45. Mineralisation is important in the release of soluble phosphorus during the autumnal soil welling up
period while oxygen concentrations are still relatively high. Organic phosphorus in topsoils is mineralised
during the summer with immobilisation taking place during the winter period.
46. Phosphorus adsorption characteristics of soil materials from the study sites were invcstigalcd by
means of phosphorus adsorption isotherms. These were used to calculate a scries of indices, which were
correlated with a range of soil properties.
XXIV

47. There is a strong relationship between adsorption capacity and texture, sandy soils being low in capacity while silty soils are considerably higher, particularly those with high organic matter contents. Relationships with organic carbon indicate a peak of adsorption capacity in the range 20-30 percent of easily oxidisable organic carbon. At higher levels capacity declines probably due to large amounts of poorly humified material of low adsorption capacity.
48. Amorphous forms of iron extractable by potassium pyrophosphate or oxalate appear to be a particularly good predictor of high phosphorus adsorption capacity.
The role of vegetation in nutrient and carbon cycling
49. Vegetation interacts with soil in the cycling of nutrients and carbon to determine a range of important wetland functions.
50. The maintenance of ecosystem structures and food web support depends on the productivity of plants, a major control of which is soil fertility, primarily the availability of the nutrients N and P. This is strongly influenced by the quality of litter and the translocation of nutrients from dying biomass. Soil organic matter formation is controlled by the balance between plant litter production and decomposition and is influenced strongly by nutrient effects.
51. On the unimpacted site at the Torridge N was found to be the primary limiting factor in plant production. The vegetation is adapted to low P-availability. Ρ is efficiently recycled and litter of low quality (high C/N and C/P ratios) is produced maintaining low nutrient availability with consequent low rates of N-mineralisation. The low rates of decomposition and mineralisation promote the accumulation of soil organic matter.
52. Comparative studies at the Torridge site (Bradford Mill), which had formerly received fertilizer additions and been used for pig rearing, showed raised Ρ levels which enhanced the processes of plant productivity, nutrient uptake and N-mineralisation. This underlines the importance of accounting for historical land use in understanding nutrient dynamics and vegetation patterns.
53. Experiments confirmed that comparing N/P ratios in living biomass with critical ratios was of value in predicting the response of vegetation to fertilizer additions. In this way nutrient shortages can be evaluated at any time during the growing season, whereas to determine growth limitation by comparing nutrient concentrations with critical concentrations requires measurements of plant nutrients at the time of peak biomass.
54. Studies on the Shannon and Little Brosna have indicated gradients across both floodplains giving substantial differences in a range of parameters though differences between the two river systems are small. High C and Ν pools were found in peaty soils, which occur away from the river channels and do not relate to sedimentation. Plant production and nutrient uptake were similar for most soils at the sites and are not controlled by nutrient availability but by climatic limitations of low light intensity and low temperatures in the growing season.
Moisture effects 55. Studies in France have highlighted the effects that a lowering of moisture levels have on nutrient and carbon cycling processes. Reduced flooding on the Loire, compared with the Allier, re-inforced by the lower moisture-holding capacity of the coarser Loire soils and sediments, have imposed moisture stresses. Experimental results indicated that with increasing droughtiness dynamic processes involving soil Ν and C are reduced, leading to low plant productivity, nutrient uptake and N-mineralisation.
56. Changes in flooding regimes, such as may result from river regulation, have important implications for biogeochemical functioning in river marginal wetlands. Reduction or removal of flooding will tend to create moisture stress, thereby reducing N-mineralisation rates. Plant production is reduced together with the soil nutrient storage function as organic inputs to the soil decline. This lower input reduces N-availability via mineralisation, thereby limiting rates of denitrification and, as a consequence the nutrient transformer function, of floodplains.
XXV

Effects of the climatic gradient 57. The climatic range encompassed by the study sites together with the specific flooding regimes of the river systems give rise to distinct differences in soil type and hydrological regime. Soil nutrient pools differed between the impacted and unimpacted locations at each site.
58. In Ireland plant production is low and controlled by climatic limitations. In England the nutrienl impact was more important than the climatic effect. N-mineralisation rates increase in low nutrient sites from Ireland to France indicating temperature effects. P-availability, and lhe consequent effect on N-mineralisation and plant production, is determined by soil type and moisture regime and varied mainly between countries. Summer droughliness on the Loire site was also a limitation on plant production.
Decomposition and carbon cycling 59. The cotton strip technique, as a relative measure of cellulose decomposition, has been used lo investigate decomposition rates in the main soils of the study sites on a seasonal basis. The controls on lhe rates of cotton strip decomposition are temperature and moisture (expressed in terms of climate, seasonality and water table dynamics) and soil type. Results overall have been analysed for the Shannon, Torridge and Loire sites which encompass a climate range from euooceanic to continental within the temperate region.
60. Two basic patterns in cotton strip decomposition have emerged:
i. where the water table remains low and does not generally affect the soil, temperature is lhe main controlling factor, higher rates of decomposition coinciding with higher temperatures;
ii. where the water table is frequently high, increased decomposition rates coincide with a fall in lhe water table, further enhanced when temperatures are high (provided soils remain sufficiently moist).
61 . Optimal conditions occur in soils of wetness class II and III with mean annual temperature of about 12°C.
62. There was found to be little relationship between decomposition rales and soil nutrienl levels. Temperature and water regime appear to be overriding controls.
63. The value of cotton strip decomposition measures is in giving a relative indication of organic matter turnover rates, crucial in determining processes such as denitrification, plani uptake and primary production, nutrient retention, peat accumulation and habitai development.
64. An experiment measured rates of litter decomposition on the Torridge sites and found lhe highest rates on the nutrient impacted floodplain at Bradford Mill and the lowest on the unimpacted slopes at Kismeldon. Litter decomposition rates arc negatively correlated to the initial C/P ratio, which is determined by plant nutrient retranslocation from dying biomass. Lilcralure values for the C/N and C/P ratio, that indicate the threshold between net mineralisation and immobilisation, could not be confirmed. No loss of nutrients was found to take place during the first experimental year from litter with initial C/N and C/P ratios up to 60 and 1500. respectively. Litter with higher initial ratios did not lose nutrients during the entire experimental period.
Ecological processes 65. These are the various processes, including interactions between those which support hydrological and biogeochemical functions, that enable habitats and dependent faunal species to be maintained. Vegetation structure provides important microsites for niche occupancy by fauna for feeding and breeding. The primary production of biomass and its export downslrcam or through harvesting arc vital to the support of food webs both within individual wetlands and beyond their boundaries. Ecological studies have aimed to characterise the sites in terms of plant communities and to identify ways in which plants and selected faunal groups can act as bioindicators of the performance of ecological functions and the "general health" of the wetland ecosystem.
XXVI
Plant Community analysis
66. Data from the vegetation surveys carried out at each site were analysed and grouped into units
corresponding to discrete soil and environmental conditions and subsequently interpreted in terms of land
use history and present management.
67. At the Torridge contrasting grassland units can be identified which are characteristic of oligotrophic
(rain fed) and eutrophic (groundwater fed) systems. The seminatural grasslands which predominate at the
Torridge contrast with reclaimed pasture and woodland sites found on equivalent landscape units adjacent
to the study sites, enabling the effects of differing land use histories to be assessed and quantified for
predictive purposes within the functional assessment procedures.
68. Studies on the Loire/AIlier systems in France have indicated how the differing impacts of
hydrological regime and agricultural management interrelate to influence the vegetation. Low lying sites,
both adjacent to the river channel and in depressions on the higher parts of the floodplain, are mainly
hydrologically controlled, while elsewhere vegetation types and patterns result from impacts of grassland
farming, modified by the effects of summer droughtiness on the light permeable soils of the Loire
floodplain.
69. On the floodplain haymeadows (callows) of the Shannon and Little Brosna minor variations in
height of the surface and the kind of soil material (peat or mineral) are major factors affecting plant
community composition. A low dome developed on the peatland of the Shannon floodplain is sufficiently
raised to be dominantly rainfed and to enable the vegetation to be characlcrised by plani species
indicative of oligotrophic conditions. Adjacent peatland is of a higher trophic status and lower species
diversity. Mineral soils developed on the levée nearer the river channel carry vegetation dominated by
nutrientdemanding species and of lowest biodiversity.
Characteristics and adaptations in a semi-arid environment
70. In a region where évapotranspiration exceeds rainfall, changes in the hydrological balance (resulting
from lhe lowering of the water table and the removal of the possibilities of flooding from lhe river
channel) have led to longer and more intense periods of desiccation with enhancement of salinisation. As a
result this has favoured the development of halophylic vegetation, as on the impacted site of Molino del
Abogado. This involves the substitution of highly productive plant communities with dense, tall
vegetation by those of lower productivity, giving rise to a more open landscape of shorter vegetation
which has lower transpiration rates.
71 . An investigation was made into the use of lhe morphological characteristics of Phragmites as a
means of identifying ecological status in relation to hydrological stress, to determine the applicability of
the technique in functional assessment procedures. Using this species has the advantage of wide
geographical applicability, given its broad range of moisture and salinity tolerance and widespread
occurrence, and its ease of recognition and measurement. Characteristics of flood regime, salinity
fluctuations and chemical changes affecting nutrienl availability are identified which control primary
productivity and consequential habitat and food web support.
72. Studies at El Masegar have shown that changing salinities affect the forms and consequent
availabilities of phosphorus and carbon (though not nitrogen) and as a result process rates and the
dependent ecological functions. Ρ is precipitated at salinities below 5mgl" , when it becomes available to
macrophytes but not phyloplankton. Under these conditions the wetland acts as a sink for P, although re
solution of unavailable Ρ can occur as salinity rises.
73. Increasing salinity causes loss of inorganic carbon, an important control on nutrient related
processes such as denitrification, decomposition and nitrification. By this means, Ndynamics are
indirectly affected by salinity changes. It was also found to correspond to reductions in productivity and
respiration, caused by the decline in mineralisation resulting from organic matter loss, and reduction in
nutrients.
74. The relative durations of periods of flooding and desiccation and the kinds of substrate control the
differing strategics adapted by the primary producers (submerged macrophytes, phyloplankton and
microphytoplankton), which support the food webs of these weiland ecosystems.
XXVII

75. The hydrological requirements of macrophytes are determined by large changes in water levels, between which the alternating periods of flooding and desiccation can be long and intense, while increasingly shorter periods of flooding characterise microbenthos and phytoplankton dominated communities respectively.
76. The organic matter contents of the sediments was found to decrease with desiccation in phytoplankton-dominated systems, while conversely it increased in systems characterised by the other groups.
77. Mineralisation and recycling of organic matter in lake sediments, in relation to wetting and drying cycles, controls the development of algal beds which support higher components of lhe food web. Studies have drawn attention to the importance of the aquatic component, which may be of very short duration in some wetlands of the semi-arid environment, though considerable variation can take place from year to year. For full interpretation of the dynamic processes, investigations to account for the longer term fluctuations in the cycles of wetting and drying need to be taken.
Bird community analysis 78. In assessing bird observations in relation to environmental conditions it is important to be aware of time lag problems in correlating the opportunistic presence of birds and the timing of wetting/drying cycles and measurements of physico-chemical conditions. Investigation at the Spanish sites indicated thai waders were feeding largely on carabid beetles, seeds and Salicornia plants, rather than soil invertebrates, during dry conditions when water levels fell and lake beds became exposed. This exemplifies the importance of dry cycles in supporting overall wetland ecosystem functioning.
79. In Ireland the wildfowl exhibited no overall dependence on any one lype of vegetation, however the presence or absence of flooded ground was identified as being of paramount importance to their feeding habits.
PREDICTORS OF FUNCTIONING 80. The results of the process studies are being applied to lhe development of functional assessment procedures. They provide the scientific basis for qualitative and, where possible, quantitative evaluations of individual functions or for the assessment of the overall performance of a wetland based on all lhe functions performed. Development of a rapid assessment technique requires the identification of those properties or characteristics which can provide a direct or indirect measure of process dynamics and consequent functioning. Examples are given from the process investigations undertaken in FAEWE Phase I.
Predictors of hydrological functioning 81 . Work has shown that there are substantial problems in making predictions about the hydrology and hydrogeology of an area. Results from detailed studies such as these can be used together with information from published sources, including accepted theories, to predict the hydrological functioning of a wetland with reasonable precision. Without the opportunity for detailed on-site field investigations only generalised qualitative predictions are possible.
Groundwater recharge and discharge 82. In order to identify and quantify these functions il is necessary lo obtain two measures of water levels from piezometers set at different depths in order to determine head gradients (characterising recharge or discharge), the relationships of which may vary from one lime of year to another.
83. Significant recharge may not be dependent on the establishment of a measurable head gradient in the case of permeable material in which the water table is not close to the surface, such as on floodplains with coarse-textured alluvium.
84. A number of factors are identified which are important for the purpose of predicting functioning: horizontal and vertical head gradients, extent and depth of recharge area, rainfall, geological and soil characteristics.
XXVIII

85. Flooding can lead to recharge. Maximum effectiveness depends on a long duration of the flood events, rapid permeabilities of soils and substrates controlling infiltration rates and a low water table.
86. Qualitative indicators of discharge are: springs, the presence of hydrophytic vegetation, electrical conductivily/hydrochemistry of the surface water being close to that of groundwater and exceeding that of rainfall.
87. Estimates of recharge can be quantified by a number of standard hydrological methods. These include the use of archive meteorological and river flow data, measured site-specific hydrological characteristics, use of a flow model and use of regionally tested empirical relationships.
Surface water generation 88. Qualitative predictions on the likelihood of surface flow taking place can be made using a variety of rapid field observations such as the presence of surface water/seepage during dry spells and periods of snow cover. Information on soil permeability, slope and vegetation roughness in relation to rainfall enables estimates of the likelihood of run-off to be made. Delay time in observing run-off following heavy rainfall is a further guide, though much is likely to move in ditches and drains. Quantification of run-off in these features can be achieved readily by means of a range of standard hydrological methods. Measurement of overland flow requires more specialised flow traps and reservoirs to be set up.
Use of vegetation as a predictor of hydrological functioning 89. An example is given using results of studies carried out at the Torridge site. Comparison of vegetation maps with hydrological data shows a number of relationships between hydrological processes, dependent geochemical characteristics and plant communities, viz.:
90. At Bradford Mill a slope unit of humid oligotrophic grassland is a bio-indicator of that part of the wetland complex maintained by the interaction of rainfall with slowly permeable soils. Nutrient availability is low and maintained mostly by internal recycling. In contrast elsewhere eutrophic plant communities are found which receive nutrients from groundwater discharge or river flooding sources.
91. At Kismeldon similar oligotrophic grassland communities are punctuated by discrete patches of peat with tussock sedge, which correspond with areas of groundwater discharge. Directly downslope tall herb fen and grassland communities are supported by the flush of oxygenated water. Plant productivity here is 2 or 3 times that of the oligotrophic type due, not lo a high concentration of nutrients, but rather a continuous flux of low nutrient waters.
92. Care should be taken in interpreting plant communities as bio-indicators of processes and functioning since factors such as human impact from land management may have overriding effects.
Predictors of ecological functioning 93. Phytosociological studies carried out under the FAEWE project have enabled factors to be identified which determine the diversity of plant communities and thereby the habitat structure at a variety of scales and its support of food webs. This is illustrated at the level of the individual plant community at contrasting wet and dry ends of the hydrological spectrum.
94. Within humid grassland categories, the biodiversity expressed in terms of the number of plant species found relates directly to the level of trophism or availability of N and Ρ as shown in the haymeadows of the Shannon callows. Under the contrasting hydrological conditions of the higher parts of the Loire/Allier floodplains, greater biodiversity in mesic grassland communities is found on sites experiencing greatest water stress due to low available water capacities i.e. the xero-mesic grassland on the coarsely textured Loire alluvium compared with the mesic grassland of the silty Allier system.
95. The level of biodiversity can also depend upon the degree of human impact, for example, grazing, the effects of which vary depending upon the vegetation type. The highest diversity of plants in grazed grassland communities was found on the most intensely grazed mesic types and less intensively grazed humid types. Stress factors such as droughtiness in the growing season or low availability of nutrients reduces the vigour of plant competition in time and space, allowing more species to co-exisl and
XXIX
preventing dominance by a few competitive species. Land management through grazing or mowing also has a similar effect by reducing biomass, in particular of competitive species.
Plants as bioindicators of impacts
Human activities 96. Studies at the Torridge have enabled the effect of past reclamation and field drainage to be assessed. Plant diversity on drained compared with analogous undrained land is reduced from 32 lo 10 species recorded. On reclaimed areas where drainage has not been effectively carried out, 23 species were found but here the effects of fertilizer additions have led to a substantial change in plant community composition, the favouring of eutrophic at the expense of oligotrophic species, and the loss of the latter types which characterise wel oligotrophic areas (the extern of which continues to decline leading to reductions in biodiversity when considered in the broader geographical context).
Environmental conditions 97. Correlation of plant community types identified at the FAEWE study sites with those used in the CORINE biotopes project offers the opportunity for extrapolation of findings from FAEWE site specific process studies to the wider catchment and elsewhere in the European context. An attempt has been made to relate CORINE categories to degrees of disturbance (natural or anthropogenic), soil characteristics and hydrological regime. The degree and confidence with which predictions of functioning can be made from the interpretation of vegetation types and patterns are to be tested as pari of the further research under FAEWE Phase II.
Plant survival strategy analysis
98. This work has enabled links to be established between easily measured morphological characteristics of selected plant species and wetland functions, as a means of assessing the capability of a weiland to perform specific functions under identifiable levels of disturbance, which have been calibrated. FAEWE research in semi-arid wetlands has confirmed the importance of the aquatic component, which needs to be addressed in functional analysis procedures. Slight alternations in water level can trigger important changes in the ecosystem dynamics. Processes taking place in both the wet and dry parts of the cycle are interdependent and critical to ecosystem maintenance and food web support functions.
99. Predictors suitable for functional assessment purposes arc identified as: temporal patterns of the wel and dry periods; lake sediment characteristics; controls on nutrient availability by hydrochemical fluctuations; and productivity changes in response to environmental changes in a perturbation index. Individual HGMUs can be placed in a predefined perturbation band wilhin this index as a means of predicting the current operation of functions and any changes likely to result from alterations to disturbance. Further developments, testing and refinements will take place under Phase II.
Reed performance as an indicator of water stress
100. A study was made of the morphological characteristics of Phragmites auslralis in order lo determine their use as a means of assessing the impact of desiccation within the contcxl of a semi-arid environment. Diagnostic categories of reed performance have been identified, based on plant height, shoot density and flower head production. With increasing water stress, reed height declines, stem density increases, floration ceases and monospecific stands become invaded by other species. Work to date has established general relationships between reed performance and water stress, and as such il can provide some qualitative assessment of hydrological controls on plant production. Further work under Phase II will enable its more precise application as a predictor for functional assessment in the semi-arid context.
The use of invertebrate databases
101. A methodology is developed describing the use of invertebrate assemblages for habitai assessment, focusing on the faunal groups of molluscs, carabid beetles and hovcrflies, which cover a wide range of life strategies, dispersal abilities and feeding modes. It describes how regional lists can be used in conjunction with species and habitat information recorded on site to make an assessment of the ecological slatus and nature conservation function.
102. The approach can be applied al a range of scales. Comparisons can be made between sites, between comparable habitats on different sites or between regions.
XXX -

DEVELOPMENTS 103. The interdisciplinary approach of the FAEWE project has produced significant developments in the interpretation and assessment of river marginal wetland ecosystems. The outputs from computer simulation models, the information held in lhe databases and the interpretation of field results have been combined to provide the heuristic rules used in the functional assessment procedures.
Modelling 104. Modelling of spatial patterns and dynamic processes has been carried out using the results of hydrological and biogeochemical process studies. Developments begun here, to be refined and applied under Phase II, are designed to improve the predictive capacity of the functional assessment procedures and to better anticipate the effects on process dynamics and consequent functional capacity of altering specified parameters (for example, through changes in wetland management or impacts).
Hydrological modelling
105. Under the FAEWE project three types of hydrological modelling have been used:
Groundwater flows 106. At the Shannon the finite difference model FLOWNET has been used to assess the groundwater flow of the floodplains, the extent to which there is a contribution from regional systems, and the degree to which the floodplain acts as a recharge area for groundwater flow towards the river. Results indicate floodplain groundwater systems operate independently from deeper regional groundwater. Groundwater flows to the river largely bypass the wetlands via underlying gravel deposits.
107. At the Torridge the finite difference code MODFLOW has been used to construct three dimensional steady state and unsteady state models of the groundwater system, as a check on the development of qualitative conceptual models, and to assess the vulnerability of water systems to stress. The wetlands are recharged in the upslope areas with some discharge occurring at seepage areas downslope. Surface water moves across the surface before infiltrating or being intercepted by ditches. More or less all of the water in the systems is finally discharged to the river. Numerical investigations of groundwater abstraction and droughts indicate the wetlands to be robust and capable of self-maintenance.
108. Qualitative conceptual models only have been applied in hydrological studies of the Loire/Allicr sites. In the case of the Allier system the underlying Jurassic aquifer discharges into the bottom of the alluvial aquifer, which is also maintained by direct precipitation and from river flooding. The much lower permeability of geological deposits underlying the Loire system precludes any significant contribution into the alluvial aquifer from below. Water table fluctuations in the floodplain deposits relate to variations in lhe height of the river.
109. In Spain numerical groundwater flow models have been used to interpret the role of groundwater in the Cigiiela system. In order to check and validate conceptual models, 2-dimensional steady stale models were adopted, PLASMA for groundwater flow and WATEQF for solute transport. In general groundwater flow is towards the topographic lowlands, including the headwater rivers of lhe Guadiana. The flow net obtained, consistent with the conceptual models, indicated that one of the closed basin wetlands (Tirez) received a significant groundwater input at one margin, compared with that found in other systems. In most cases groundwater flow is slow, the long residence time in evaporite rocks explaining the high salinities found in discharge areas.
Water budgets 110. Water budgets have been calculated for flooded and non-flooded periods on the Shannon. In non-flooded conditions the information used to calculate the annual budget is: inputs: precipitation entering the soil, groundwater inflow and infiltration of river water; outputs: actual évapotranspiration, groundwater outflow and run-off of excess precipitation.
111. The procedures applied were: • During flooding ground surface inputs were considered as zero.
XXXI

• Modelling period began from when soils were waterlogged in winter/spring and all rainfall wits
considered as runoff.
• Water table falls when évapotranspiration exceeds rainfall and pore space becomes available for
storage. Rainfall is given priority over flooding in considering lhe filling of water storage capacity.
112. In the case of the Torridge study sites, separate water balances were calculated for the recharge,
saturated and discharge areas. Runoff generalion is especially high in wel areas in winter. Much of lhe
upslope runoff is channelled away in ditch systems. Groundwater seepage, thought to be small, is lhe
only continuous input to the wetland and as such plays an important part in maintaining wel conditions
during dry spells.
113. The calculated generalised water balance provides the best basis for understanding chemical inputs.
Solute transport modelling indicates slow movement in lhe saturated zone.
Water table fluctuations
114. This has been applied in lhe Shannon sites to simulale longterm patterns of water level movements,
based on records available for shorter periods. Daily levels were modelled using meteorological and
hydrometric data and soil water storage capacity. Levels during flooding were obtained from river storage
data.
115. Determination of the extent of flooding requires topographic information for the floodplain. Digital
elevation models were constructed in a GIS and overlays produced to indicate the extent of flooding for
given river heights.
Biogeochemical modelling
116. Nutrient dynamics modelling has consisted of the development of three submodels for Ν. Ρ and C
cycling using STELLA. For each HGMU in a wetland, separale models have been developed and linked
via the submodels to provide a site unit model.
117. Direct linkage between the nutrient and carbon submodels occurs through plani growth and
decomposition, grazing and manuring, and harvesting of animals and plants. Denitrification affects
factors in the Ν and C submodels. In some cases the submodels operate ¡ndependcnlly of each other, for
example nitrification (N submodel), Padsorplion (P submodel) and plant/herbivore respiration and
methane production (C submodel).
118. In the nutrient model 27 state variables are considered, 7 in the C submodel and 10 in each of the
nutrient submodels. These variables are in the main calcgorics of plant, soil and herbivores. Process
controlling factors are temperature and 'mode', a cumulative term for the closely related variables of soil
water level, redox potential and soil gaseous oxygen content.
119. The unit model for the slope unit at Kismeldon, Torridge, was tested with two 4ycar runs assuming
(i) present conditions, and (ii) adjusting the mode to lengthen the anaerobic period al the expense of the
aerobic i.e. the simulation of wetter conditions.
120. Results demonstrated the strong interactions between the C and nutrient submodels and the
sensitivity of the model to changes in mode.
Present conditions
121. After 20 weeks more aerobic conditions arc established and ammonium decreases. This is a result
of a change in the population of microorganisms operating to decompose organic matter. Under more
aerobic conditions more nitrogen is required for decomposition.
Wetter scenario
122. Nutrient immobilisation is reduced making more nutrients available for plant growth. Willi
increased growth organic matter production is greater bul decomposition is reduced due lo the wetter
conditions. Beyond 4 years this would lead to nutrient accumulation in the soil organic matter and
consequently lower nutrient availability and a decrease in produclivity.
XXXII

123. Unit models were then linked to represent a catenary sequence as might be found within an ecosystem complex. Connections between units are by means of water flows carrying nutrient and by grazing.
Functional Assessment Procedures 124. The final goal of the FAEWE project has been the development of procedures for assessing the functioning of river marginal wetlands.
125. The development focused on producing a modular and flexible package, to accommodate the wide range of potential users and uses, that should ideally fulfil the following (Maltby et al., 1994):
• provide a synthetic (and where necessary rapid assessment) tool to assist planners to resolve decisionmaking dilemmas with regard to land use allocation, permitting of activities and catchment planning;
• in doing so provide some guidance on the optimum (or perhaps minimum) conditions necessary for the support of wetland functioning;
• identify levels of impact which alter functioning; • provide indications of ecosystem stability, levels of tolerance and resistance to change.
126. The development of this structure has been shaped by three approaches. Firstly, through the establishment of, and consultation with, the UK Potential Users Group, composed of NGOs and GOs which have been identified as possessing a possible application of, or requirement for, an FA procedure. Secondly, the structure of the FA procedures evolved through an assessment of similar projects in North America, for instance the Wetland Evaluation Technique (WET) of Adamus et al (1987). Many wetland assessment procedures and manuals were consulted to synthesise the published concepts and structures into the format most appropriate for the European context. Thirdly, the science base which underpinned the FAEWE project had to be utilised to its full potential to allow for maximum efficiency in applying the results of the research programme. Thus lhe structure of the procedure needed to be moulded to suit the strengths in the science, and not to become over ambitious causing the scientific developments and findings to be undermined, resulting in the inevitable loss of information and increase in uncertainly in the assessment.
127. The final structure reflects a division of the procedure into sections that develop successively the detail and accuracy of the assessment, allowing different users to undertake different pathways through the package, and to arrive at different end points. The following sections comprise the functional assessment procedures:
• Introduction Outlines the scope of the project, the partners involved, the concepts addressed, and the sources of funding;
• User guidelines Details which function lo assess, which type of assessment to use, the level of detail required, and the internal structure of the procedures;
• Desk Study Directs user to information sources and produces an initial assessment of lhe wetland; • HGMU delineation Field procedures for delineating hydrogeomorphic units; • Assessment procedures Different levels of assessment are available depending on the user
requirements, including qualitative, quantitative and long term modelling and monitoring procedures;
128. The assessments are based on the identification of controlling variables that control, indicate or predict wetland functions. The procedures have undergone partial field lesling to calibrate and validate the assumptions and inferences. This process is on-going.
CONCLUSIONS 129. The investigations carried out under Phase I, establishing links between processes and functions, have highlighted some important inter-relationships among factors needing to be considered when selecting options for the management of wetlands within the context of environmental change.
Process inter-reactions 130. Studies have not only improved understanding of individual process dynamics but also the ways in which processes inter-rcacl in their delivery of functions. Examples can be drawn from the results of
XXXIII -
investigations into hydrological processes which not only provide the water resource, bul through the
supply of solutes, regulate the trophic or nutrient status of wellands. The differing study siles illustrate
some of the variation and complexity in hydrological support that can occur.
• Floodplain wetlands of the Shannon are maintained largely by rainfall inputs: a clayey substrale seals
the system from an underlying regional aquifer which might otherwise contribute groundwater to the
system; there is little infiltration and mixing into the saturated floodplain soils from floodwaters
when inundation from the river channel takes place.
• At Kismeldon on the Torridge, wetlands are maintained both by surface water, lhe flow of which is
regulated largely by a system of drainage ditches, and by groundwater, which moves at shallow depth
through superficial drift deposits and reaches the surface in discrete seepage zones in response lo
characteristics and configurations of the local geology. The discharge of the Torridge is spaley in
character and flooding, which occurs only very sporadically, is of short duration and limited to low
lying parts of the floodplain, levées adjacent to the river channel rarely becoming inundated.
• In contrast water levels in the river marginal wetlands developed on lhe very permeable alluvial
materials of the Loire are controlled by the level of water in the river channel. Waler table
fluctuations occur in response to variations in river discharge and consequent changes in stage.
• In the semi-arid conditions of central Spain hydrological alterations resulting from excessive
groundwater abstractions and river channel modifications have had the effect thai in many cases
wetlands are no longer able to carry out hydrological functions and the streams are maintained only
artificially by the pumping of groundwater or inter-basin transfer of surface water supplies.
Spatial variability
131. Studies have indicated areas in which the nature and exlenl of spatial variability is likely to have a
significant bearing on the overall process dynamics which result in functioning. Some examples include:
• Local variations in geology and geomorphology at the Torridge control groundwater discharge, which
leads to the variations in soil and vegetation which help to create and maintain habitat diversity.
• Varying patterns of surface water flow determine lhe effective areas for nutrient removal and
retention functions. Investigations at the Torridge have indicated lhe potential of relatively small
areas of a wetland to be responsible for processing most of lhe nitrate thai is removed by
denitrification. An important part in lhe development of the predictive system of functional analysis
is the selection of criteria which will enable identification of areas of enhanced denitrification. Il
highlights the importance of site selection in the creation of buffer zones to protect and enhance lhe
quality of riverine environments.
• Spatial variations in the capacity of soils for phosphate adsorption have been demonstrated to occur
both vertically down the soil profile and laterally through the use of P-adsorption isotherms.
Differences have been related to observable or measurable soil characteristics, enabling predictions of
Ρ dynamics to be made based on soil properties.
• The position of a particular HGMU within a sequence or gradient can determine characteristics such
as water regime which control processes such as decomposition and sedimentation.
• Wetland ecosystems can support a complex variety of habitats with differing and specialised
hydrological requirements and can form a mosaic supporting considerable biological diversity.
• Variations in the hydrology and vegetation of a weiland are important lo the feeding activities of
birds. In Ireland the presence of flooding was found to exercise a more important control for many
species than vegetation types. In Spain strongly seasonal wetlands frequently dry out in the summer.
During these conditions birds were found to be opportunistic feeders on beetles, which invade dried
out lake beds as waters recede, together with seeds and Salicornia plants.
Temporal variability
132. The work of Phase I has shown how seasonal variations in temperature and moisture interact to
control process rates. Decomposition results indicate some broad patterns. In dry sites unaffected by
waterlogging variations relate to temperature changes. Where waterlogging occurs for much of the lime
rates increase when waler levels drop, particularly in summer when accompanied by a rise in temperature.
However there were found to be optimal levels for both temperature and intensity of waterlogging, above
and below which rates of decomposition declined.
XXXIV -
133. Denitrification rates were generally found to be low due to the study sites being nitrate limited. However a seasonal pattern did emerge in Ireland, where the highest rates coincided with the maximum temperatures which occurred in summer.
134. Contrasting seasonal patterns in Ρ dynamics were apparent between topsoils and subsoils studied at the Torridge. In summer biological processes in topsoils lead to mineralisation of organic Ρ together with enhanced uptake by plants leading to a reduction in Ρ content. In subsoils Ρ levels decline in winter when organo-mineral complexes are reduced under anaerobic waterlogged conditions, releasing inorganic P.
135. Rapid changes in environmental conditions can affect processes and consequent functioning at differing rates. For example the flooding of a site can lead to an immediate change in the feeding patterns of bird populations, though the effect on biogeochemical processes such as denitrification will be delayed awaiting the establishment of more reduced conditions.
Climatic variations 136. The study of sites along a climatic gradient has indicated how seasonal variability is reinforced by climatic differences, when comparisons are made between geographically separated locations. The degree of seasonal variation occurring at any one site increases southwards from the cool, moist climate of Ireland to the semi-arid environment of Spain, where major changes in conditions and process responses lead to the adoption of specialised survival strategies by primary producers. It is important that such relationships are well understood as a basis for predicting the effects of climatic change on wetland functioning.
Historical and anthropogenic effects 137. Historical impacts including recent human activities have had major effects on the development of wetland ecosystems, as has been demonstrated in research carried out at the paired study sites with their contrasting levels of impact. An accurate assessment of present functioning depends upon a detailed knowledge of past activities. Two examples may be taken by way of illustration:
• At the Torridge the site at Bradford Mill was formerly more intensively farmed, leaving a legacy of enhanced soil phosphorus content compared with that found at the unimpacted site at Kismeldon. Biogeochemical process studies have indicated enhanced rates of plant productivity, Ν mineralisation and denitrification at Bradford Mill compared with Kismeldon.
• A trend of declining sedimentation on the Shannon floodplain has been related to land use changes that have taken place within the Middle Shannon catchment.
138. An understanding of the implications for present functioning of past activities is critical in any undertaking to restore degraded wetlands or create new sites as part of any initiative to increase functional capacity.
Compatibility among ecosystem functions 139. In the development of functional assessment procedures it has been important to consider interactions not only among processes but also the ways in which functions affect each other. What may be considered as the optimal use for a particular wetland to achieve the maximum benefits from one function may be detrimental to another. For example at the Torridge the routing of surface waters across the wetland in order to maximise the opportunities of enhancing water quality through nutrient removal functions could result in a decline in biodiversity and loss of conservation interest through the impact of eutrophication.
Factors controlling biodiversity 140. Studies of plant survival strategies in response to stress and disturbance have emphasised the value of identifying factors such as low nutrient levels, limited soil available water capacity and intensity of waterlogging which are important in maintaining biodiversity. The work also provides procedures for the early warning of fundamental ecological changes taking place in response to stress before they become evident in plant community composition. The stress effects of desiccation under semi-arid conditions can be readily assessed from the performance of Phragmites stands.
- XXXV

141. Work using invertebrate databases provides guidance on optimal management for habitai and biodiversity maintenance and can be linked to the pattern of HGMUs. The developments reaffirm that maximum biodiversity occurs under moderate or low levels of human impact.
Questions of scale 142. Initial studies have focused on processes taking place at specific siles and the inter-relationships between them and the controlling factors. The importance of small scale variability has been demonstrated as in the change from recharge to discharge zones for groundwaler over small distances at the Torridge. However some studies have highlighted the significance of lhe wider scale as in the distant source of water feeding into the regional aquifers of La Mancha or the impact of land use changes within the catchment on rates of sedimentation along lhe Middle Shannon.
143. Though process investigation at the study sites have been used in the characterisation of HGMUs the need has been recognised to consider the inter-relationships between these units in assessing the functional capacity of a wetland. For example:
• The diverse habitat requirements of hoverflies, depending on the species and the life-cycle stage of an individual. Only mobile forms are able to utilise sites subject lo rapid changes such as inundation by floodwater.
• Birds using the seasonal wetlands of central Spain include opportunistic feeders, which exploit both wet and dry phases using different food supplies.
• In Ireland some wading birds move off the floodplain units for feeding, using the callows for roosting. Feeding patterns on the callows are partially rcgulaled by the exlcnl and occurrence of flooding.
144. Further work in the development of the functional assessment procedures in Phase II will extend the site-based studies to the catchment scale. This will include the production of catchment zonation maps, identifying the location of wetlands together with their capacity to perform one or more specific functions. The information will provide guidance for catchment management planners in the conservation of existing wetlands and the opportunities thai exist for the creation of new sites.
145. The work programme undertaken during the FAEWE Project has identified a number of gaps within our understanding of the dynamic processes operating in river marginal wetlands, and exposed limitations in our knowledge of the predictive relationships belween process and function. The proposed research programme for FAEWE Phase II will provide additional scientific information to improve substantially the already advanced science-base and the ability to predict functioning through the use of the functional assessment procedures. Specific objectives will focus on:
nutrient interactions between floodwater and hydromorphic/floodplain soils;
plant trait responses to chemical stresses;
identification of vegetation sub-sets which can be used as bio-indicators of stress;
integration of the hydrological and nutrient dynamic computer simulation models;
refinement of the controlling variables of functions and the identification of threshold values;
extension of the invertebrate group diagnostic potential to the wider calchmcnl scale;
the development and integration of socio-economic valuations of river marginal weiland functions;
the development of more operational approaches to catchment management, through the integration of the computer models, the GIS and the functional assessmcnl procedures;
146. The scientific findings and the innovations of FAEWE will extend beyond the work programme of Phase II through future applied research and development programmes and collaborative opportunities.
XXXVI
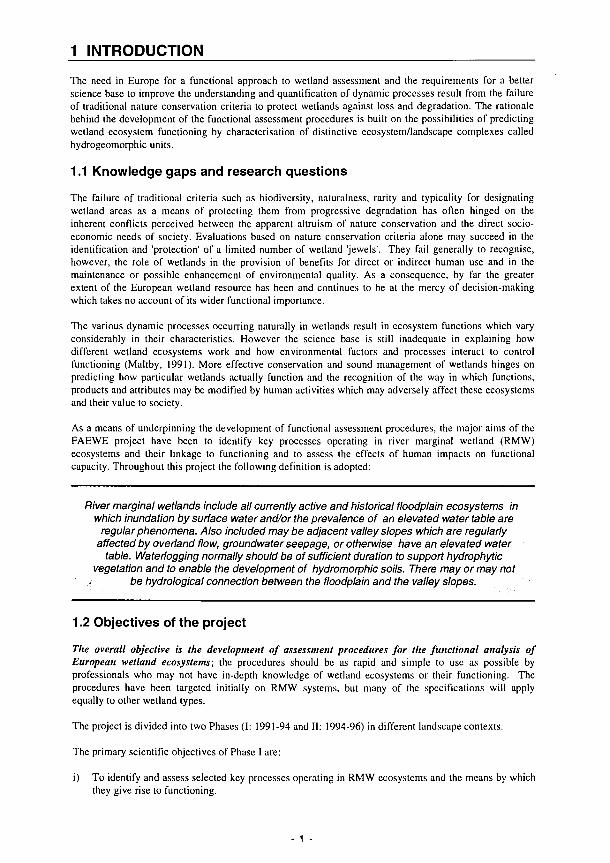
1 INTRODUCTION The need in Europe for a functional approach to wetland assessment and the requirements for a better science base to improve the understanding and quantification of dynamic processes result from the failure of traditional nature conservation criteria to protect wetlands against loss and degradation. The rationale behind the development of the functional assessment procedures is built on the possibilities of predicting wetland ecosystem functioning by characterisation of distinctive ecosystem/landscape complexes called hydrogeomorphic units.
1.1 Knowledge gaps and research questions
The failure of traditional criteria such as biodiversity, naturalness, rarity and typicality for designating wetland areas as a means of protecting them from progressive degradation has often hinged on the inherent conflicts perceived between the apparent altruism of nature conservation and the direct socioeconomic needs of society. Evaluations based on nature conservation criteria alone may succeed in the identification and 'protection' of a limited number of wetland 'jewels'. They fail generally to recognise, however, the role of wetlands in the provision of benefits for direct or indirect human use and in the maintenance or possible enhancement of environmental quality. As a consequence, by far the greater extent of the European wetland resource has been and continues to be at the mercy of decision-making which takes no account of its wider functional importance.
The various dynamic processes occurring naturally in wetlands result in ecosystem functions which vary considerably in their characteristics. However the science base is still inadequate in explaining how different wetland ecosystems work and how environmental factors and processes interact to control functioning (Maltby, 1991). More effective conservation and sound management of wetlands hinges on predicting how particular wetlands actually function and the recognition of the way in which functions, products and attributes may be modified by human activities which may adversely affect these ecosystems and their value to society.
As a means of underpinning the development of functional assessment procedures, the major aims of the FAEWE project have been to identify key processes operating in river marginal wetland (RMW) ecosystems and their linkage to functioning and to assess lhe effects of human impacts on functional capacity. Throughout this project the following definition is adopted:
River marginal wetlands include all currently active and historical floodplain ecosystems in which inundation by surface water and/or the prevalence of an elevated water table are
regular phenomena. Also included may be adjacent valley slopes which are regularly affected by overland flow, groundwater seepage, or otherwise have an elevated water
table. Waterlogging normally should be of sufficient duration to support hydrophytic vegetation and to enable the development of hydromorphic soils. There may or may not
be hydrological connection between the floodplain and the valley slopes.
1.2 Objectives of the project
The overall objective is the development of assessment procedures for the functional analysis of European wetland ecosystems; the procedures should be as rapid and simple to use as possible by professionals who may not have in-depth knowledge of wetland ecosystems or their functioning. The procedures have been targeted initially on RMW systems, but many of the specifications will apply equally to other wetland types.
The project is divided into two Phases (I: 1991-94 and II: 1994-96) in different landscape contexts.
The primary scientific objectives of Phase I are:
i) To identify and assess selected key processes operating in RMW ecosystems and the means by which they give rise to functioning.
- 1
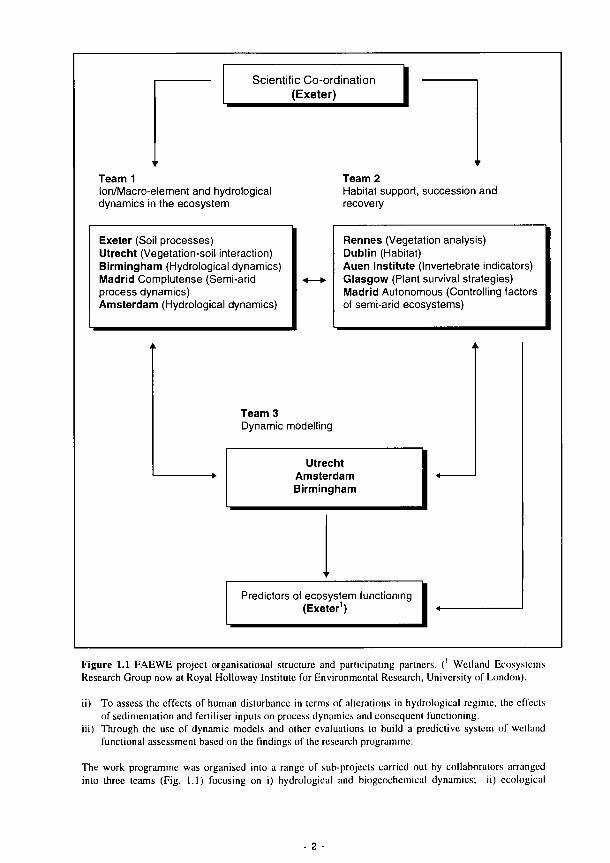
Scientific Co-ordination (Exeter)
Team 1 lon/Macro-element and hydrological dynamics in the ecosystem
Team 2 Habitat support, succession and recovery
Exeter (Soil processes) Utrecht (Vegetation-soil interaction) Birmingham (Hydrological dynamics) Madrid Complutense (Semi-arid process dynamics) Amsterdam (Hydrological dynamics)
Rennes (Vegetation analysis) Dublin (Habitat) Auen Institute (Invertebrate indicators) Glasgow (Plant survival strategies) Madrid Autonomous (Controlling factors of semi-arid ecosystems)
Team 3 Dynamic modelling
Utrecht Amsterdam Birmingham
Predictors of ecosystem functioning (Exeter1)
Figure 1.1 FAEWE project organisational structure and participating partners. ( Wetland Ecosystems Research Group now at Royal Holloway Institute for Environmental Research, University of London).
ii) To assess the effects of human disturbance in terms of alterations in hydrological regime, the effects of sedimentation and fertiliser inputs on process dynamics and consequent functioning.
iii) Through the use of dynamic models and other evaluations to build a predictive system of weiland functional assessment based on the findings of the research programme.
The work programme was organised into a range of sub-projects carried out by collaborators arranged into three teams (Fig. 1.1) focusing on i) hydrological and biogeochemical dynamics; ii) ecological
- 2
relationships; and iii) dynamic modelling. More specifically the objectives of the sub-projects were as
follows:
1 Development of a predictive system for wetland functional analysis (University of Exeter).
Process data have been obtained from scientific investigations and expert evaluation. Dynamic
models were employed to maximise the predictive capacity of the methodology through the
selection of appropriate predictors of functioning in terms of observable or measurable
characteristics. The work to date has focused on the development and evaluation of a
hydromorphic approach to lhe definition of functional units in the river marginal environment.
Validation of preliminary proposals has involved field testing with modifications made to the
techniques as appropriate.
2 Investigation of the role of soil and sediment in determining nutrient behaviour in wetlands
(University of Exeter).
The status of a range of soil/sediment types in RMWs was determined by the investigation of
intrinsic soil/sediment properties (e.g. profile morphology, soil texture and colour) and related
environmental characteristics particularly as they reíale lo the development of hydromorphic
properties (e.g. water table depth and associated redox potential). These data are related to
studies of Ν, Ρ and C dynamics in order to delermine the factors controlling Ν and Ρ flux and
organic water decomposition and thereby evaluate (i) the conditions under which wetland
processes can regulate the functions important in the control of environmental quality; (ii) the
identifiable predictors of these conditions and (ih) data for input to the predictive system for
functional analysis.
3 The role of vegetation in carbon and nutrient dynamics (University of Utrecht).
The major objective was lo determine the impact of nutrient enrichment, sediment deposition and
alterations in hydrological regime on biomass production and nutrient uptake by vegetation as a
result of human disturbance. The quality and quantity of plant litter was assessed to determine
the effects of these impacts on organic matter decomposition and nutrient cycling. Impacts were
assessed both by comparison of the results from paired sites representing differing degrees of
impact, and by experimentally altering the nutrient status and hydrology. This work provides
input data for the predictive assessment scheme in linking the functioning of soil and vegetation
systems (including implications for habitat support) together with assessment of the effects of
human impacts on these relationships.
4 Modelling of spatial patterns and dynamic processes (University of Utrecht).
The development and validation of models was carried out to integrate the results of a wide range
of field studies for use in the diagnostic and predictive components of the functional assessment
procedures. This enables the dynamic relationships among key environmental factors such as
nutrient availability and soil water regime and ecological factors such as plani species
composition to be described and the effect of human impacts to be predicted as a component of
[he functional assessment scheme.
5 The hydrological and hydrogeological functioning of wetland ecosystems (University of
Birmingham)
Investigations determined the overall hydrological functioning of wetland ecosystems by
quantifying the surface water and hydrogeological controls determining N and Ρ transfers and
evaluating the resilience of the functioning to hydrological changes in terms of the quality and
quantity of water supplied. Mathematical models were developed for layered groundwater flow
and solute transport to assist development of the predictive system.
- 3
6 Characterisation of vegetation in relation to major ecological parameters (University of Rennes).
Wetland plant assemblages were identified and characterised at a range of scales and relationships established with parameters such as hydrological regime, soil type and sedimentation dynamics in order lo determine links between vegetation and wetland processes and thereby assess the capability of vegetation characteristics to be used as predictors of wetland functioning in the assessment procedures under development.
7 Relationships between habitat functioning (for selected birds and invertebrates) and major wetland processes (Irish Wildlife Service).
Selected groups of birds and invertebrates were studied lo determine relationships between their distribution/abundance on a range of wetland sites and environmental variables. This determined which environmental characteristics (such as hydrological status) could he used as predictors of wildlife habitat support functioning and explored the use of faunal records as bioindicators of processes and functioning carried out in wetlands. Possible thresholds of human disturbance were investigated at which critical changes in species composition occur.
8 Invertebrate analysis as a predictor of wetland processes and stress from human impacts (Auen Institute, Rastatt).
Selected invertebrate assemblages (carabid beetles, hoverflics and molluscs) have been analysed from studies on sites representing various stages of floodplain development in order lo determine their effectiveness as predictors of wetland ecosystem functioning and in the assessment of human impacts, affecting in particular hydrological regime.
9 Vegetation survival strategies in RMWs (University of Glasgow).
This sub-project investigated the application of vegetation survival stralegies in assessing environmental stress and disturbance. Selected key plant species were studied to identify key functional plant types, morphological characteristics of which could be measured in order to predict the degree and extent of stress and dislurbance pressures resulting from human impacts. The methodology was developed for incorporation within the functional analysis procedures.
10 Water and sediment system analysis in river corridor ecosystems (Free University of Amsterdam).
Hydrological functioning was investigated in the Shannon Basin focusing on flow systems of water including solute transport and relationships wilh processes of sedimentation. Modelling and the use of a GIS were employed to predict functioning of RMW types subject to significam flooding and to relate flood and sedimentation charactcrislics to land use practices in the wider catchment.
11 The impact on hydrological functioning of wetlands due to alterations in hydrological regime (Complutense University, Madrid).
Studies have investigated the effects which groundwater abstraction (in Spain) and river regulation (in France) have had on the functioning of RMWs. Modelling of water budgets and solute transport has provided inputs to the predictive system of functional analysis to enable lhe impact of changes in hydrological regime to be assessed in terms of the effects on ecosystem functioning.
12 The impact of welting and drying cycles on ecosystem functioning (Autonomous University. Madrid).
A study was made of the factors controlling food webs and habitat support including the dynamics of waler regime and chemistry in cycles of welling and drying, decomposition of organic matter and nutrient cycling, within lhe context of a semi-arid environment. Models were

developed to enable the functional assessment procedures to deal with predicting the effects of desiccation on functioning.
13 Geomorphological processes and functioning (Complutense University, Madrid).
An evaluation was made of the significance of geomorphological processes including erosion and deposition, and soil forming processes in determining the functioning of RMWs with special reference to semi-arid environments.
A unique organisational framework was adopted in this project in which individual research groups have not been restricted to a single field area or country of study and disciplines have worked in close collaboration throughout (including fieldwork), not just at the final stages of data synthesis.
1.3 Concepts of wetland ecosystem dynamics
Wetlands occupy the transitional zone between aquatic and terrestrial environments. The very nature of their position in the landscape conspires to produce a plethora of wetland types. Due to the enormous variety of wetland types and the dynamism of their character, defining and classifying wetlands can be both problematical and controversial. In spite of the academic, political and semantic conflicts most definitions will include the following three main components which are integral to wetland ecosystem dynamics (after Mitsch and Gosselink, 1993):
1 Wetlands are distinguished by the presence of water, either at the surface or within the root zone.
2 Wetlands often have unique soil conditions that differ from adjacent non-wetland areas.
3 Wetlands support vegetation adapted to permanently or seasonally wet conditions (termed hydrophytic vegetation).
The prevailing hydrological conditions provide the overriding control on wetland ecosystem dynamics, and even minor alterations to the hydrologie regime can produce many changes in wetland abiotic and biotic features. Changes in the hydrology affect features such as the balance between soil oxidation or reduction, nutrient status, soil salinity, sediment properties and pH, which control processes and result in alterations in the overall functioning of the wetland ecosystem. The direct and indirect effects of hydrology on wetland dynamics have been summarised in a conceptual model, Fig. 1.2. Hydrology modifies and determines the physico-chemical properties of the substrate, which, in turn, control the biotic responses. The resultant abiotic and biotic properties may then feed back intothe system to modify lhe wetland as it develops, or as it responds to changes in the prevailing environmental conditions.
The biogeochemical and ecological features of a wetland are a mutual product of the predominant hydrologie conditions of a system that shares the characteristics of both aquatic and terrestrial ecosystems, but which also retains the unique characteristics and dynamics associated with wetland ecosystems. These dynamics underpin the functions performed by the wetland.
1.4 A review of RMW functions and functional assessment
RMW ecosystems perform functions that result in a variety of products and services that may be beneficial to society. Not all RMWs perform all functions equally, each wetland being dependent on the ecosystem structure and the occurrence of key natural processes. Assessing the functions that a RMW performs, and the subsequent value of those functions, is important for society as well as for maintenance of the stability and health of the ecosystem.
1.4.1 RMW functions and values
Physical, biological, and chemical processes occurring naturally in RMWs result in ecosystem functions. Anomalies in the performance of functions between one RMW and another may result from differential operational rates of key processes and process interactions, and variations in ecosystem structure. RMW functions can be divided broadly into hydrological, biogeochemical and ecological funclions.
- 5
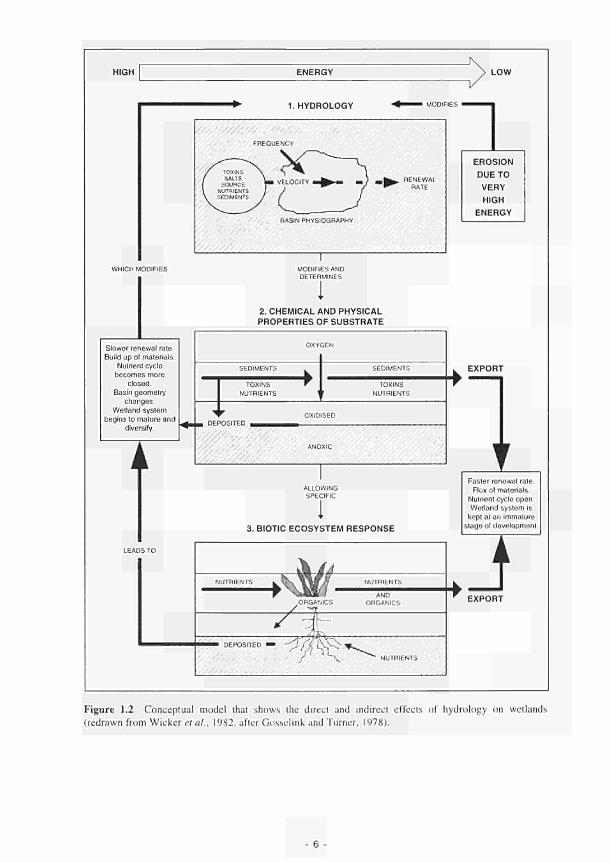
HIGH ENERGY LOW
1. HYDROLOGY
fc _ ) « , ^ . RENEWAL ^ RATE
BASIN PHYSIOGRAPHY
EROSION DUETO VERY HIGH
ENERGY
WHICH MODIFIES MODIFIES AND DETERMINES
2. CHEMICAL AND PHYSICAL PROPERTIES OF SUBSTRATE
Slower renewal rate. Build up of materials.
Nutrient cycle becomes more
closed. Basin geometry
changes. Wetland system
begins to mature and diversify.
TOXINS NUTRIENTS
TOXINS NUTRIENTS
ν EXPORT
ALLOWING SPECIFIC
Faster renewal rate. Flux of materials.
Nutrient cycle open. Wetland system is
kept at an immature stage ol development.
Figure 1.2 Conceptual model that shows the direct and indirect effects of hydrology on wetlands (redrawn from Wicker et al., 1982, after Gosselink and Turner, 1978).

For example, the hydrological function of a wetland may be flood control, the biogeochemical function may be the removal of nutrients from the soil water through the process of denitrification, and the ecological function may be support to the food web. Each function in turn results in a variety of environmental/ecological services and products. The services include water quality and water quantity maintenance, and the protection of endangered species or habitats. The ecosystem generates products such as trees, birds and fish. Both services and products provide benefits, and are of use, to both human and wildlife populations. The three aspects of ecosystem interactions and dynamics may result in values, Fig. 1.3. The functions performed by RMWs can be of value to society, but it is also worth recognising the fact that functions exist in the absence of society and are normally part of the self sustaining properties of an ecosystem (Brinson, 1993). Until recently, the inadequacies of the available science base made detailed assessment of the different key processes and environmental controls that govern wetland functioning a distant, though not unachievable goal. The FAEWE project has filled some of these gaps by providing information from studies of these key processes and integrating results into a procedure for assessing the functioning of RMWs.
A number of examples illustrate the environmental importance of wetland ecosystem functioning.
Wetlands detain precipitation and run-off and can therefore reduce river flood discharge peaks. Natural storage can obviate the need for expensive dams or flood defence engineering. In Wisconsin, for example, it was estimated that catchments with 15 percent wetlands coverage had flood peaks 60-65 percent lower than would be without them (Adamus and Stockwell, 1983). This not only has a direct value to society, but, by utilising naturally occurring systems, there is also an economic benefit. In the Charles River study the US Army Corps of Engineers determined that a loss of 40 percent of the wetlands within the catchment would increase flood damage by at least $3,193,000 per annum (Sather and Smith, 1984).
Various biological, chemical and physical processes, many still imperfectly understood, result in biogeochemical wetland functions that immobilise and transform a wide range of compounds including plant nutrients, which in excess cause major ecological problems. Wetlands may also remove heavy metals, pesticides or industrial residues and other toxicants generally in forms more or less tightly bound to sediments or soil particles (Gambrell and Patrick. 1978). Large amounts of phosphorus, including fertilizer run-off, can be inactivated by chemical bonding to inorganic ions (Richardson, 1985) thus preventing harmful eutrophication of adjacent open water.
Wetlands can reduce nitrate leakage into freshwalers naturally at no direct cost. Their destruction removes this benefit, a fact realised increasingly as nitrate concentrations in streams and groundwaters have increased generally throughout Europe and North America. An environment rich in wetlands can at least reduce the potentially harmful impacts of current and/or past fertiliser use in the landscape. Recent estimates from Sweden indicated that a wetland area of 2km· can reduce nitrogen inputs to adjacent waters by nearly 2000 tonnes a year (Fleischer, 1990). Much of this estimate, however, may be attributable to only short term retention or storage of nitrate through plant uptake and increased productivity, eventually releasing a large proportion of the N store unless lhe vegetation is harvested and removed. Denitrification is the only process taking place in wetlands which can completely remove nitrate from ground- or surface waters. Work in Devon. UK, suggests that denitrification may remove more than 30 kg/ha'/yf' NO3 in some RMW and estuarine sediments (Mallby et al., 1991, Koch et al, 1992). The full economic as well as ecological significance of this has yet to be applied to the decision making affecting wetland ecosystem management.
The underlying factor influencing the functional role RMWs play in the support of the food web is the quantity of net primary production (NPP) produced that results in a nel biomass accumulation (Sather and Smith, 1984). In comparison with other types of ecosystems, wetlands support relatively high levels of NPP (Whittaker and Likens, 1975). High levels of NPP are indicative of high potential food web support. A number of studies have estimated the primary production for various wetlands (Spence et al., (1971), Good et ai., (1978), Brinson et al., (1981) and Adamus (1983 a and b)), and whilst gaps in the literature still exist, the value of the functional role of wetlands in biomass accumulation and export is indisputable.
Each function has a relative value to society. In economic terms the benefit may represent a large financial saving, as in the case of an expensive flood control engineering scheme, or the saving may be small, such as in the protection of a threatened biological resource lhal has a difficult to define monetary price but a
- 7
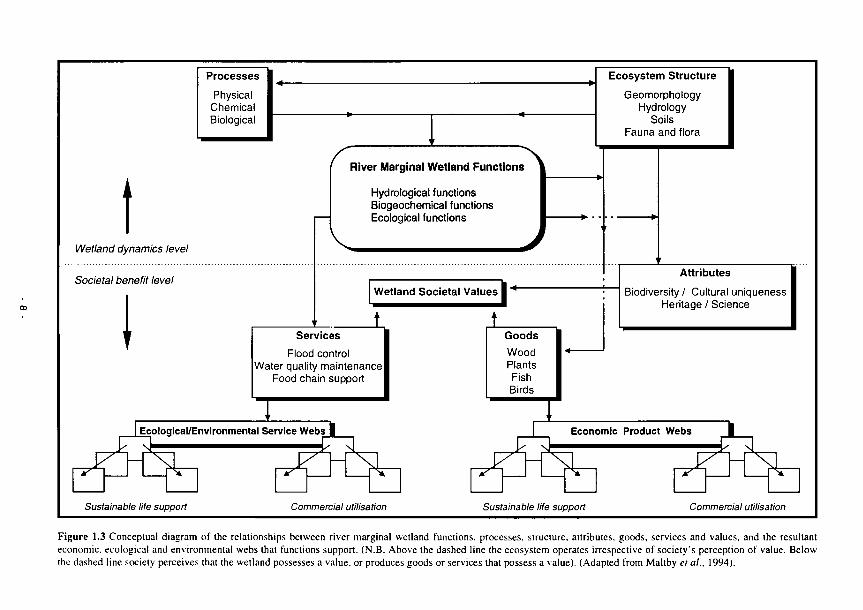
Processes
Physical Chemical Biological
Ecosystem Structure
Geomorphology Hydrology
Soils Fauna and flora
i
Wetland dynamics level
Societal benefit level
River Marginal Wetland Functions
Hydrological functions Biogeochemical functions Ecological functions
Wetland Societal Values
Attributes
Biodiversity / Cultural uniqueness Heritage / Science
Services Flood control
Water quality maintenance Food chain support
Τ 7 ,
Ecological/Environmental Service Webs I
FH-TX -?
X
Sustainable life support Commercial utilisation Sustainable life support Commercial utilisation
Figure 1.3 Conceptual diagram of the relationships between river marginal wetland functions, processes, structure, attributes, goods, services and values, and the resultant economic, ecological and environmental webs that functions support. (N.B. Above the dashed line the ecosystem operates irrespective of society's perception of value. Below lhe dashed line society perceives that the wetland possesses a value, or produces goods or services that possess a value). (Adapted from Maltby et al., 1994).

high aesthetic value. Elaboration of these aspects will form a key part of Phase II targets with extension of site specific studies to the catchment scale.
Semantic and academic debate surrounds the precise definition and terminology to describe each wetland function. This problem has also been in evidence within the FAEWE project. Following a series of meetings and numerous discussion documents unanimity was achieved on the adopted terminology, Table 1.1. Definitions and information on the processes that support the functions is provided yo clarify and highlight the processes that maintain the functions, and also to help focus the scientific research. The numbering adopted in Table 1.1 is used consistently throughout this report.
1.4.2 Assessing the functions of wetlands
The fact that RMWs perform functions that are beneficial to society increasingly has been acknowledged, though a mechanism for recognising and measuring this is generally lacking, especially in decisionmaking affecting the conservation of wetland ecosystems. The problem has at least two aspects: (i) determining the ability of a wetland to perform a certain function and (ii) quantifying the rate at which a function performs over time. As the pressure on wetland resources increases and the demand for more rational wetland protection and management intensifies, the need to be able to assess the functions performed by wetlands increases in significance.
Methods of assessing wetlands are high on the agenda of regulators and planners in North America where most of the pioneering work has been undertaken. A plethora of evaluation systems has been developed since the mid-seventies. Federal and slate, private and academic consultants have produced numerous products to identify a wide spectrum of wetland functions and values. By I981 there were over 40 such methodologies. Abstracts of 25 were presented in a review by Lonard and Clairain, 1985. The sheer range of methodologies is in part testimony to the importance attached to wetland evaluation in North America and in part a need to meet specific but variably interpreted requirements of the wetland regulatory programme. Not least it reflects differences in agency expertise and requirements (such as federal vs. state) and the range of typical applications (for example ecological and functional classification, permitting of specific activities such as landfill, impact analysis and restoration) across a variety of disciplines and concerns such as conservation, ecology, environmental pollution, economics, aesthetics and other human interests and cultural values, not to mention obvious regional differences in the nature of wetland resources.
The methodologies vary considerably not only in the level of detail and time required to complete the assessment, but also the various weighting procedures applied and in the contrasting nature of the output. Some methodologies, such as Brown et al. (1974), are very specific and are based firmly in ecological science, exploiting formal quantitative and numerical approaches, whilst others are very general in application and execution (qualitative and ranking), such as the Wetland Evaluation Technique (WET) (Adamus et al., 1987).
The Wetland Evaluation Technique represented a landmark in the development of assessment methodologies and merits more detailed scrutiny. WET evolved out of attempts in the US to assess the impacts of highway construction on wetland functions, and was intended to support a well developed regulatory programme administered by the US Army Corps of Engineers and the US Environmental Protection Agency. It is intended for use by persons who do not have access to a multi-disciplinary team of technical experts on a routine basis, 'to alert planners and regulators' of the probability that a particular wetland performs certain functions. Ratings generated by the procedure, however, merely provide one of many inputs into a decision making process and do not replace quantitative and more sensitive or discriminatory methods (Adamus et al., 1991 ). Subject to various caveats and other precautions WET has been demonstrated to be useful in handling a whole range of other wetland questions and evaluations beyond routine permit applications. Maltby et al. (1988) used WET to evaluate functioning in the Rhône and Evros deltas but were critical of the outcome largely because of the paucity and lack of sensitivity of the data in predicting the hydrological function. Hogan and Maltby (1990a) employed WET by examining 'before and after' scenarios on West Scdgemoor on the Somerset Levels, UK, to show that, with extensification of management, a general improvement in environmental functioning would occur. The functional analysis techniques developed in lhe US cannot be transferred easily to Europe for a number of reasons:
- 9 -
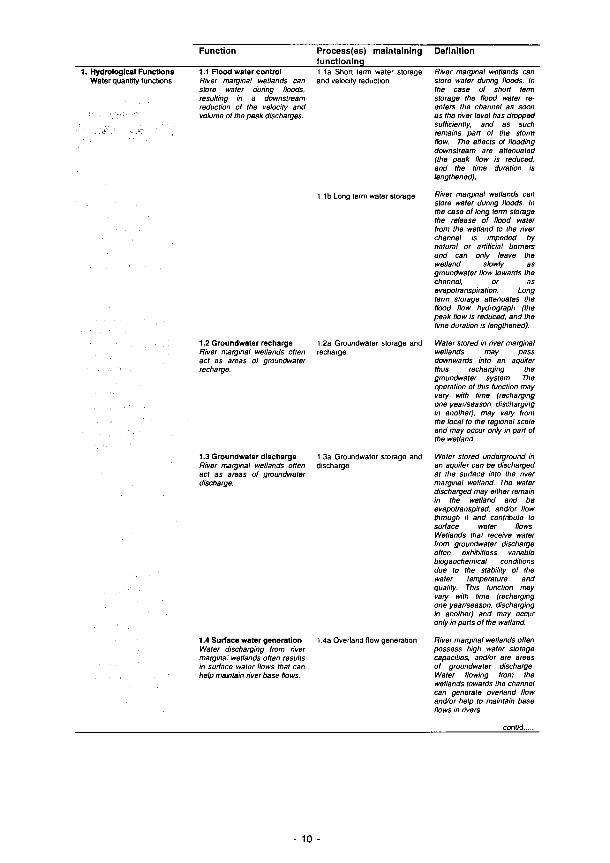
Function Process(es) maintaining functioning
Definition
1. Hydrological Functions Water quantity functions
1.1 Flood water control River marginal wetlands can store water during floods, resulting in a downstream reduction of the velocity and volume of the peak discharges.
1.1a Short term water storage and velocity reduction
1.1b Long term water storage
1.2 Groundwater recharge River marginal wetlands often act as areas of groundwater recharge.
1.2a Groundwaler storage and recharge
1.3 Groundwater discharge River marginal wetlands often act as areas of groundwater discharge.
1.3a Groundwater storage and discharge
1.4 Surface water generation Water discharging from river marginai wetlands often results in surface water flows that can help maintain river base flows.
1 4a Overland flow generation
River marginal wetlands can store water during floods. In the case of short term storage the flood water reenters the channel as soon as the river level has dropped sufficiently, and as such remains part of the storm flow. The effects of flooding downstream are attenuated (the peak flow is reduced, and the time duration is lengthened).
River marginal wetlands can store water during floods. In the case of long temi storage the release of flood water from the wetland to the river channel is impeded by natural or artificial barriers and can only leave the wetland slowly as groundwater flow towards the channel. or as évapotranspiration. Long term storage attenuates the flood flow hydrograph (the peak flow is reduced, and the time duration is lengthened).
Water stored in river marginal wetlands may pass downwards into an aquifer thus recharging the groundwater system. The operation of this function may vary with time (recharging one year/season, discharging in another), may vary from the local to the regional scale and may occur only in part of the wetland
Water stored underground in an aquifer can be discharged at the surface into the river marginal wetland. The water discharged may either remain in the wetland and be evapotranspired, and/or flow through it and contribute to surface water flows. Wetlands that receive water from groundwater discharge often exhibitless variable biogeochemical conditions due to the stability of the water temperature and quality. This function may vary with time (recharging one year/season, discharging in another) and may occur only in parts of the wetland.
River marginal wetlands often possess high water storage capacities, and/or are areas of groundwater discharge. Water flowing from the wetlands towards the channel can generate overland flow and/or help to maintain base flows in rivers.
cont/d..
- 10 -
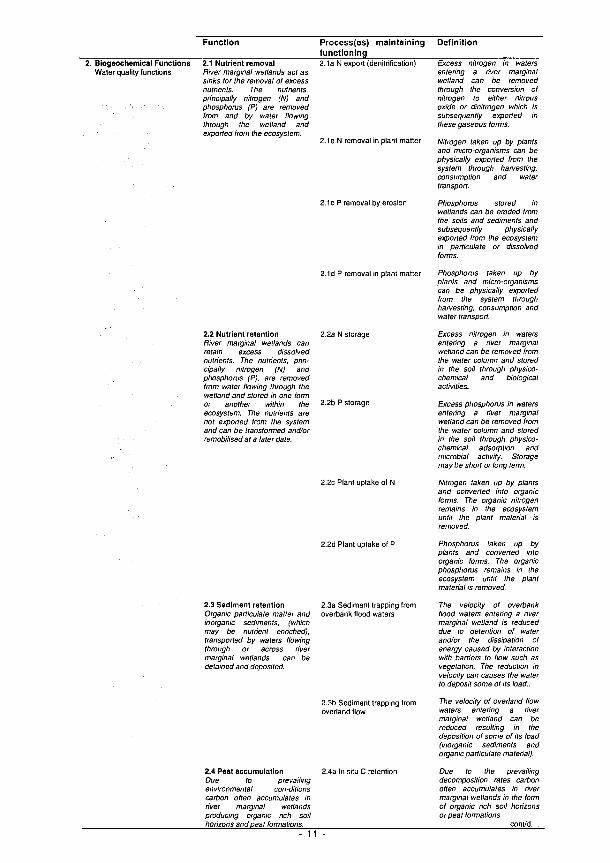
Function Process(es) maintaining functioning
Definition
2. Biogeochemical Functions 2.1 Nutrient removal Water quality (unctions River marginal wetlands act as
sinks for the removal of excess nutrients. The nutrients, principally nitrogen (N) and phosphorus (P) are removed from and by water flowing through the wetland and exported from the ecosystem.
2.1a N export (denitrification)
2.1b N removal in plant matter
2.1c Ρ removal by erosion
Excess nitrogen in waters entering a river marginal wetland can be removed through the conversion of nitrogen to either nitrous oxide or dinitrogen which is subsequently exported in these gaseous forms.
Nitrogen taken up by plants and micro-organisms can be physically exported from the system through harvesting, consumption and water transport.
Phosphorus stored in wetlands can be eroded from the soils and sediments and subsequently physically exported from the ecosystem in particulate or dissolved forms.
2.2 Nutrient retention River marginal wetlands can retain excess dissolved nutrients. The nutrients, principally nitrogen (N) and phosphorus (P), are removed from water flowing through the wetland and stored in one form or another within the ecosystem. The nutrients are not exported from the system and can be transformed and/or remobilised at a later date.
2.1d Ρ removal in plant matter
2.2a Ν storage
2.2b Ρ storage
2.2c Plant uptake of Ν
Phosphorus taken up by plants and micro-organisms can be physically exported from the system through harvesting, consumption and water transport.
Excess nitrogen in waters entering a river marginal wetland can be removed from the water column and stored in the soil through physico-chemical and biological activities.
Excess phosphorus in waters entering a river marginal wetland can be removed from the water column and stored in the soil through physico-chemical adsorption and microbial activity. Storage may be short or long term.
Nitrogen taken up by plants and converted into organic forms. The organic nitrogen remains in the ecosystem until the plant material is removed.
2.2d Plant uptake of Ρ Phosphorus taken up by plants and converted into organic forms. The organic phosphorus remains in the ecosystem until the plant material is removed.
2.3 Sediment retention Organic particulate matter and inorganic sediments, (which may be nutrient enriched), transported by waters flowing through or across river marginal wetlands can be detained and deposited.
2.3a Sediment trapping from overbank flood waters
2.4 Peat accumulation Due to prevailing environmental con-ditions carbon often accumulates in river marginal wetlands producing organic rich soil horizons and peat formations.
2.3b Sediment trapping from overland flow
2.4a In situ C retention
The velocity of overbank flood waters entering a river marginal wetland is reduced due to detention of water and/or the dissipation of energy caused by interaction with barriers to flow such as vegetation. The reduction in velocity can causes the water to deposit some of its load..
The velocity of overland (low waters entering a river marginal wetland can be reduced resulting in the deposition of some of its load (inorganic sediments and organic particulate material).
Due to the prevailing decomposition rates carbon often accumulates in river marginal wetlands in the form of organic rich soil horizons or peat formations.
cont/d.... 11
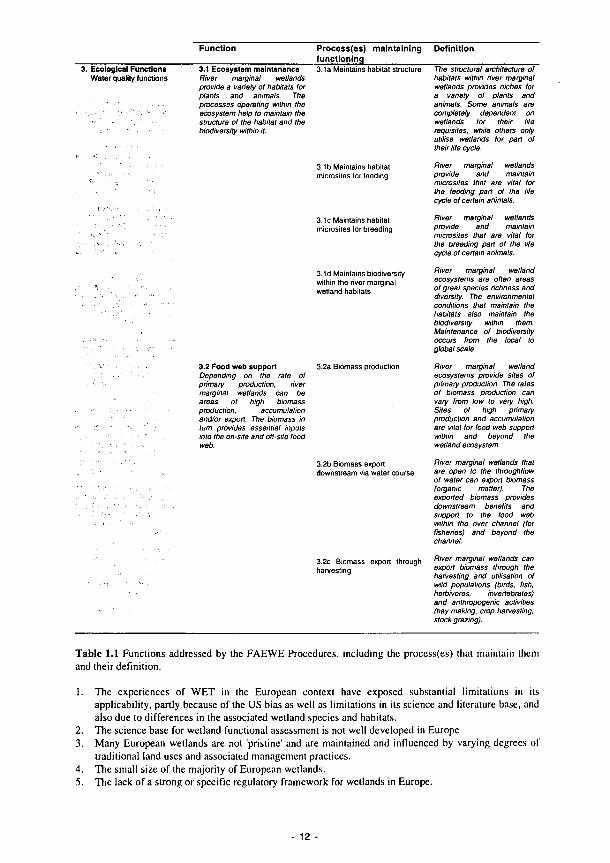
Function Process(es) maintaining functioning
Definition
3. Ecological Functions Water quality functions
3.1 Ecosystem maintenance 3.1a Maintains habitat structure River marginal wetlands provide a variety of habitats for plants and animals. The processes operating within the ecosystem help to maintain the structure of the habitat and the biodiversity within it.
3.1b Maintains habitat microsites for feeding
3.1c Maintains habitat microsites for breeding
3.1 d Maintains biodiversity within the river marginal wetland habitats
3.2 Food web support Depending on the rate of primary production, river marginai wetlands can be areas of high biomass production. accumulation and/or export. The biomass in turn provides essential inputs into the on-site and off-site food web.
3.2a Biomass production
3.2b Biomass export downstream via water course
3.2c Biomass export through harvesting
The structural architecture of habitats within river marginal wetlands provides niches for a variety of plants and animals. Some animals are completely dependent on wetlands for their life requisites, while others only utilise wetlands for part of their life cycle.
River marginal wetlands provide and maintain microsites that are vital for the feeding part of the lite cycle of certain animals.
River marginal wetlands provide and maintain microsites that are vital for the breeding part of the lile cycle of certain animals.
River marginal wetland ecosystems are often areas of great species richness and diversity. The environmental conditions that maintain the habitats also maintain the biodiversity within them. Maintenance of biodiversity occurs from the local to global scale.
River marginal wetland ecosystems provide sites of primary production. The rates of biomass production can vary from low to very high. Sites of high primary production and accumulation are vital for food web support within and beyond the wetland ecosystem.
River marginal wetlands that are open to the throughflow of water can export biomass (organic matter). The exported biomass provides downstream benefits and support to the food web within the river channel (for fisheries) and beyond the channel.
River marginal wetlands can export biomass through the harvesting and utilisation of wild populations (birds, fish, herbivores, invertebrates) and anthropogenic activities (hay making, crop harvesting, stock grazing).
Table 1.1 Functions addressed by the FAEWE Procedures, including the process(es) that maintain them and their definition.
1. The experiences of WET in the European context have exposed substantial limitations in its applicability, partly because of the US bias as well as limitations in its science and literature base, and also due to differences in the associated wetland species and habitats.
2. The science base for wetland functional assessment is not well developed in Europe 3. Many European wetlands are not 'pristine' and are maintained and influenced by varying degrees of
traditional land uses and associated management practices. 4. The small size of the majority of European wetlands. 5. The lack of a strong or specific regulatory framework for wetlands in Europe.
12

In Europe, over recent years, the attraction of linking environmental benefits of natural systems functioning to viable and practical forms of assessment has received considerable support through the European Commission's DGXI and DGXII. The FAEWE project was designed to produce relevant, applicable and operable functional assessment (FA) procedures for use in the European context.
1.5 The hydrogeomorphic concept
Numerous attempts have been made at classifying wetlands. A variety of criteria have been adopted, and a range of purposes have been addressed. Many classifications are based on purely physical, genetic or ecological criteria and do not facilitate the assessment of wetland functioning. The hydrogeomorphic concept has evolved out of this need to assess the relationship between ecosystem structure and function. A brief review of wetland classifications is provided below. This is by no means an exhaustive summary, but provides an insight into the ontogeny of the hydrogeomorphic concept.
1.5.1 Wetland classification
Most wetland classifications have tended to assess sites in terms of their shape and situation and, either directly or by implication, their hydrological or other functional controls. The result has been a number of hydrotopographical or hydromorphological systems that distinguish wetland classes due to their shape, situation and water supply.
One of the most influential hydrotopographical classifications was proposed by Goode (1977), which combined water source, topography and nutrient status to produce a variety of classes, Fig l .4. Certain inconsistencies, however, are present within this approach. Some categories are characterised by the topography within which the wetland occurs, and others represent topographical elements within wetland sites. Hydrological deficiencies are exposed through the lack of detail and specification of hydrogeological controls, for instance in the case of the spring fen class.
A broad hydrodynamic, rather than hydrotopographical, classification was proposed by Gosselink and Turner (1978). The major hydrodynamic controls on a wetland were identified as water inputs, water outputs, type of water flow and hydropulses (i.e. seasonality). Fresh water marshes were characterised in terms of their hydrodynamics, Table 1.2. The authors argued that the hydrological component of wetlands was pivotal in influencing four ecosystem characteristics: species composition of the plant community, primary production, carbon cycling (deposition and flux), and nutrient cycling. This represents an initial attempt at linking classification to wetland functioning.
Raised-convex Meadow
Sunken-convex Lotie Tidal Lentie
Water Inputs Capillary Precipitation Upstream Downstream
+ +
+ + Little
+ +
+ +
+ + +
+ +
Type of water flow Capillary Subsurface Surface Overbank
+ + + +
Slow + + +
+ + +
+ + +
Water Outputs Percolation Evapotranspiration Downstream
Hydropulses
+ +
Seasonal
+ + Little
Seasonal
+
Seasonal
+ +
Seasonal
+ +
Tidal
+ +
Variable
Table 1.2 Major hydrodynamic characteristics of fresh water marshes (from Gosselink and Turner, 1978).
- 13

Lotie fens
Open water t ransi t ion fen (ond non- f luc tuat ing mere)
Schwingmoor
Basin fen
ι Drained fen
F lood-p la in fen
Lentic fens
Valley fen
Spring fen
Flush fen
Key Fen vegetat ion
Peot Open Γ~Π s water I I f
Direction of surface-water
low
Figure 1.4 A hydromorphological classification of wetlands (from Goode. 1977).
14

% = 3 ^ ^ '
Water t a b i , usually
below wetland lavai
GROUNDWATER
INFLOW
a. Surlaco water depression c. Groundwater slope
ζ o Ρ
i , ^^^Sj^ß^f^T^·
GROUNDWATER
INFLOW
b. Groundwater depression
LAKE OR RIVER
FLOODWATER
Water table usually
below wetland level
d. Surface water slope
Figure 1.5 Four major hydrologie types of wetland in Wisconsin (from Novitzki, 1979).
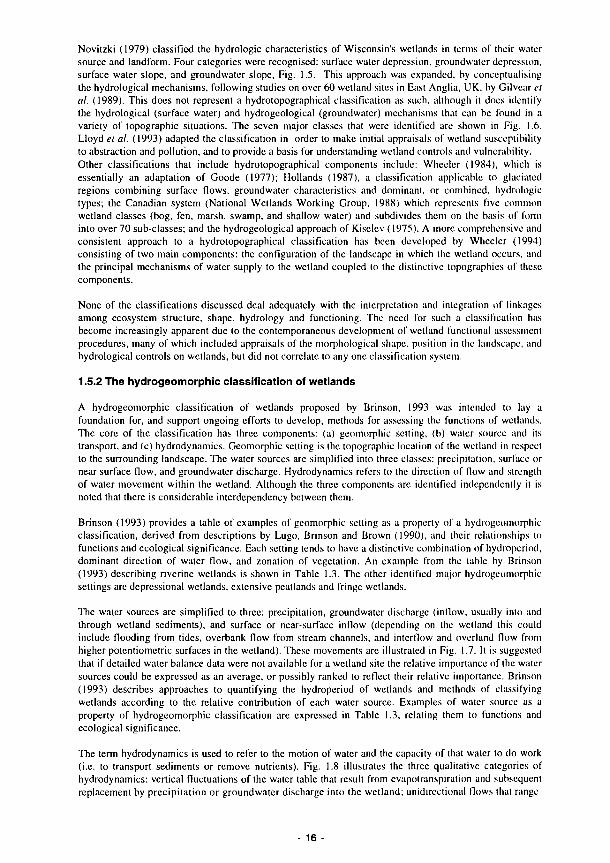
Novitzki (1979) classified the hydrologie characteristics of Wisconsin's wetlands in terms of their waler source and landform. Four categories were recognised: surface water depression, groundwater depression, surface water slope, and groundwater slope. Fig. 1.5. This approach was expanded, by conceptualising the hydrological mechanisms, following studies on over 60 wetland sites in East Anglia, UK, by Gilvear et al. (1989). This does not represent a hydrotopographical classification as such, although it docs identify the hydrological (surface water) and hydrogeological (groundwater) mechanisms that can be found in a variety of topographic situations. The seven major classes that were identified are shown in Fig. 1.6. Lloyd et al. (1993) adapted the classification in order to make initial appraisals of wetland susceptibility to abstraction and pollution, and to provide a basis for understanding wetland controls and vulnerability. Other classifications that include hydrotopographical components include: Wheeler (1984), which is essentially an adaptation of Goode (1977); Hollands (1987), a classification applicable to glaciated regions combining surface flows, groundwater characteristics and dominant, or combined, hydrologie types; the Canadian system (National Wetlands Working Group, 1988) which represents five common wetland classes (bog, fen, marsh, swamp, and shallow water) and subdivides them on the basis of form into over 70 sub-classes; and the hydrogeological approach of Kiselev (1975). A more comprehensive and consistent approach to a hydrotopographical classification has been developed by Wheeler (1994) consisting of two main components: the configuration of the landscape in which the wetland occurs, and the principal mechanisms of water supply to the wetland coupled to the distinctive topographies of these components.
None of the classifications discussed deal adequately with the interpretation and integration of linkages among ecosystem structure, shape, hydrology and functioning. The need for such a classification has become increasingly apparent due to the contemporaneous development of wetland functional assessment procedures, many of which included appraisals of the morphological shape, position in the landscape, and hydrological controls on wetlands, but did not correlate to any one classification system.
1.5.2 The hydrogeomorphic classification of wetlands
A hydrogeomorphic classification of wetlands proposed by Brinson, 1993 was intended to lay a foundation for, and support ongoing efforts to develop, methods for assessing the functions of wetlands. The core of the classification has three components: (a) geomorphic setting, (b) waler source and its transport, and (c) hydrodynamics. Geomorphic setting is the topographic location of the wetland in respect to the surrounding landscape. The water sources are simplified into three classes: precipitation, surface or near surface flow, and groundwater discharge. Hydrodynamics refers to the direction of flow and strength of water movement within the wetland. Although the three componcnls are identified independently it is noted that there is considerable interdependence between them.
Brinson (1993) provides a table of examples of geomorphic setting as a property of a hydrogeomorphic classification, derived from descriptions by Lugo, Brinson and Brown (1990), and their relationships to functions and ecological significance. Each setting tends to have a distinctive combination of hydropcriod, dominant direction of water flow, and zonation of vegetation. An example from the tabic by Brinson (1993) describing riverine wetlands is shown in Table 1.3. The other identified major hydrogeomorphic settings are depressional wetlands, extensive peatlands and fringe wetlands.
The water sources are simplified to three: precipitation, groundwater discharge (inflow, usually into and through wetland sediments), and surface or near-surface inflow (depending on the wetland this could include flooding from tides, overbank flow from stream channels, and interflow and overland flow from higher Potentiometrie surfaces in the wetland). These movements are illustrated in Fig. 1.7. It is suggested that if detailed water balance data were not available for a wetland site the relative importance of the water sources could be expressed as an average, or possibly ranked to reflect their relative importance. Brinson (1993) describes approaches to quantifying the hydropcriod of wetlands and methods of classifying wetlands according to the relative contribution of each water source. Examples of water source as a property of hydrogeomorphic classification are expressed in Table 1.3, relating Ihcm to functions and ecological significance.
The term hydrodynamics is used to refer to the motion of water and the capacity of that water to do work (i.e. to transport sediments or remove nutrients). Fig. 1.8 illustrates the three qualitative categories of hydrodynamics: vertical fluctuations of the water table that result from évapotranspiration and subsequent replacement by precipitation or groundwater discharge into the wetland; unidirectional Hows that range
16
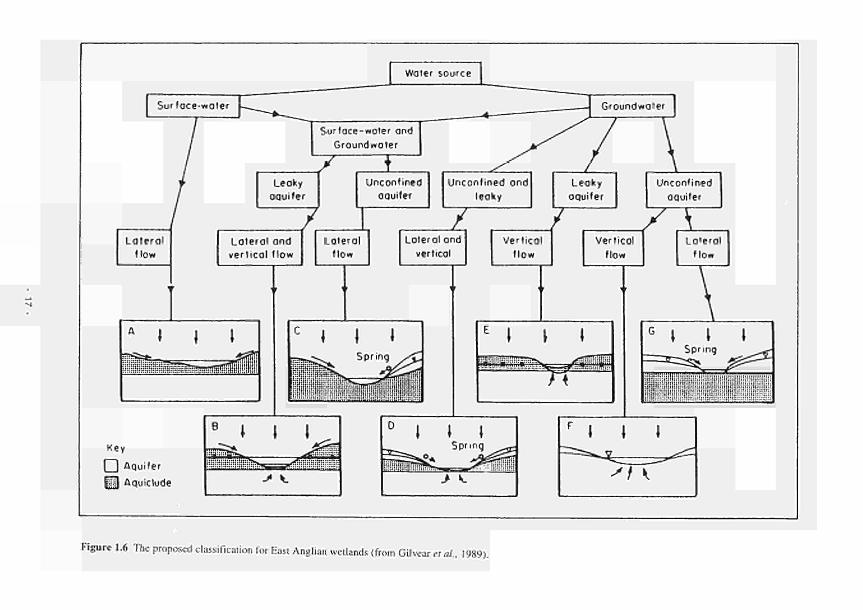
Water source
Surface-water
Surface-water and
Groundwater
Leaky
aquifer
Unconfined
aquifer
Lolerol
flow
Loterol ond
vertical flow
A I \ \
Key
I | Aquifer
IJU Aquiclude
Groundwater
Unconfined ond
leaky
Lolerol
flow
7
Leoky
aquifer
Unconfined
aquifer
Lateral and
vertical
i l * .Hilf ■ ■ ■ : ■ " : ■ . : : ■
\ i i
> V.
Vertical
flow
X3 Vertical
flow
i \ 1
7T
> K-
Lateral
flow
ϋΤΓΓίτππτπττ: Ι!::::::;::::ι::::::::::::::
:;; " ::::: |
J ^
F \ \ \
> / Κ
Figure 1.6 The proposed classification for East Anglian wetlands (from Gilvear et al., 1989).
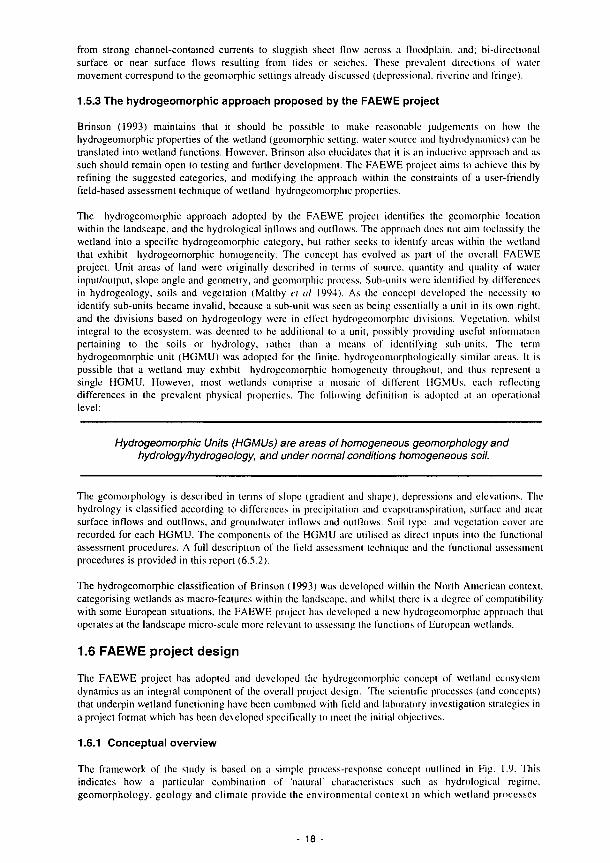
from strong channel-contained currents to sluggish sheet How across a floodplain, and; bi-directional surface or near surface flows resulting from tides or seiches. These prevalent directions of water movement correspond to the geomorphic settings already discussed (depressional, riverine and fringe).
1.5.3 The hydrogeomorphic approach proposed by the FAEWE project
Brinson (1993) maintains that it should be possible to make reasonable judgements on how the hydrogeomorphic properties of the wetland (geomorphic setting, water source and hydrodynamics) can be translated into wetland functions. However, Brinson also elucídales that it is an inductive approach and as such should remain open to testing and further development. The FAEWE project aims to achieve ihis by refining the suggested categories, and modifying the approach within the constraints of a user-friendly field-based assessment technique of wetland hydrogeomorphic properties.
The hydrogeomorphic approach adopted by lhe FAEWE project identifies the geomorphic location within the landscape, and the hydrological inflows and outflows. The approach does not aim toclassify the wetland into a specific hydrogeomorphic category, but rather seeks to identify areas within the wetland that exhibit hydrogeomorphic homogeneity. The concept has evolved as part of the overall FAEWE project. Unit areas of land were originally described in terms of source, quantity and quality of water inputyoutput, slope angle and geometry, and geomorphic process. Sub-units were identified by differences in hydrogeology, soils and vegetation (Maltby et al 1994). As the concept developed the necessily lo identify sub-units became invalid, because a sub-unil was seen as being essenlially a unit in its own right, and the divisions based on hydrogeology were in effect hydrogeomorphic divisions. Vegetation, whilst integral to the ecosystem, was deemed to be additional to a unii, possibly providing useful information pertaining to the soils or hydrology, rather than a means of identifying sub-units. The term hydrogeomorphic unit (HGMU) was adopled for the finite, hydrogeomorphologically similar areas. It is possible that a wetland may exhibit hydrogeomorphic homogeneity throughout, and thus represent a single HGMU. However, most wetlands comprise a mosaic of different HGMUs, each reflecting differences in the prevalent physical properties. The following definition is adopled at an operational level:
Hydrogeomorphic Units (HGMUs) are areas of homogeneous geomorphology and hydrology/hydrogeology, and under normal conditions homogeneous soil.
The geomorphology is described in terms of slope (gradient and shape), depressions and elevations. The hydrology is classified according lo differences in precipitation and évapotranspiration, surface and near surface inflows and outflows, and groundwater inflows and outflows. Soil lype and vegetation cover are recorded for each HGMU. The components of the HGMU are utilised as direct inputs into the functional assessment procedures. A full description of the field assessment technique and the functional assessment procedures is provided in this report (6.5.2).
The hydrogeomorphic classification of Brinson (1993) was developed wilhin lhe North American context, categorising wetlands as macro-features within the landscape, and whilst there is a degree of compatibility with some European situations, the FAEWE projeel has developed a new hydrogeomorphic approach that operates at the landscape micro-scale more relevam to assessing the functions of European wetlands.
1.6 FAEWE project design
The FAEWE project has adopted and developed the hydrogeomorphic concept of wetland ecosystem dynamics as an integral component of the overall project design. The scientific processes (and concepts) that underpin wetland functioning have been combined with field and laboratory investigation slrategies in a project format which has been developed specifically to meet the initial objectives.
1.6.1 Conceptual overview
The framework of the study is based on a simple process-response concepì outlined in Fig. 1.9. This indicates how a particular combination of 'natural' characteristics such as hydrological regime, geomorphology, geology and climate provide lhe environmental context in which wetland processes
18

Examples of Geomorphic setting Qualitative Evidence Quantitative Evidence Functions Ecological Significance
Riverine Wetlands (floodplain, not channel)
Streamside zones of intermittent streams.
High-gradient: downcutting portions.
aggrading portions.
Middle-gradient landform.
Low-gradient alluvial. Floodplain of bottomland hardwood
Headwater position: first order streams.
Bedrock controlled channel.
Substrate controlled by fluvial processes.
Channelised flow, evidence of oxbows, meander scrolls, etc., consistent with fluvial processes.
As above, but in low-gradient landform.
Flows not continuous; How lacks headwater flooding and overbank properties.
Substrate lacks alluvium (soil maps). Flow may be continuous but likely flashy.
Stratigraphy shows interbedding and coarse particle size (gravel and larger).
Flow likely continuous with moderate to high base flows.
Flow continuous with cool season flooding. High suspended sediments in streams.
Interface of landscape where groundwater and surface water sources change phases to fluvial environment.
Scour precludes extensive wetland development. Unvegetated reaches allow light penetration to support aquatic production.
Wetland on coarse substrate maintained by upslope groundwater source.
Channel processes establish variation in topography, hydroperiod, and habitat interspersion on floodplain. Flood storage; conserves groundwater discharge.
Riparian zone critical to maintaining buffer between upland and stream flow.
May impede wildlife movement if corridor too narrow. Maintains important in-stream riffle habitat.
Unstable substrate in high energy environment colonised by pioneer species. Streamside vegetation contributes to allochthonous organic supply.
Alluvium is renewed by surface accretion and point bar deposition; interspersion of plant communities to beta diversity. Major habitat for wildlife and biodiversity; strong biogeochemical activity and nutrient retention.
Table 1.3 Examples of geomorphic setting as a properly of the Hydrogeomorphic classification (from Brinson, 1993).
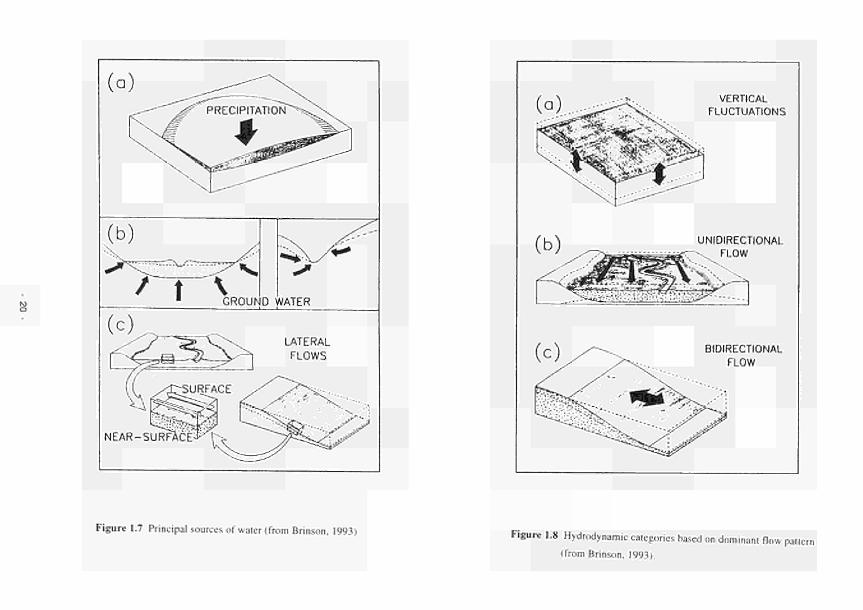
(b)
GROUND WATER
LATERAL FLOWS
NEAR-SURFACE
Figure 1.7 Principal sources of water (from Brinson, 1993)
VERTICAL FLUCTUATIONS
UNIDIRECTIONAL FLOW
BIDIRECTIONAL FLOW
Figure 1.8 Hydrodynamic categories based on dominant Π (from Brinson, 1993).
ow pattern

Natural e.g. hydrological regime environmental ^ ^ ^ ^ " " " ^ characteristics climate
Ï S S ^
'Natural' wetland
ecosystem N1
; Value 1 »ÒCy Value 2 e.g. waler quality e.g. habitai
elements properties
onl eract ons
Environmental change temperature rainfall runoH groundwater con I a m in. in I s
Ecosystem variables water table hydrological regime nutrienl dynamics plant/animal commun il íes
Ecosystem Functioning
e g. lood web support ' , "
Direct anthropogenic impacts e g drainage
flooding regime f ertili ers grazing
Increasing stress level
Wetland \
domain J
1 Threshold 2
X Threshold 3
Altered wetland
ecosystem W1
W2
W3
Figure 1.9 Outline conceptual process-response model for wetland ecosystems. Key: O, process domain; O, wetland ecosystem; »· , elements, properties, interactions; ► , transition from one process domain to another; cross-hatched area, ecosystem functions with associated values.
operate. This comprises the wetland process "domain" which encompasses hydrological, chemical and biological processes and influences hydrological flow pathways, ion dynamics and food chain dynamics as well as patterns of plant community succession and stress. The result is the development of a natural wetland ecosystem (Nl). Interactions among the various elements and properties of Nl give rise to a
21

particular pattern of functioning which in lurn results in particular services and products such as improved water quality, habitat provision and food chain support, all of which have values. These values may be significant for human communities and/or wildlife.
The natural wetland ecosystem Nl may be subject to a variety of both anthropogenic as well as natural environmental change impacts. These may be apparent as alterations in hydrological regime, nutrientdynamics and composition of plant and animal communities. This will result in the development of a modified process domain with altered magnitudes and frequencies of important characteristics such as water routing, chemical transformations and patterns of ecological stress. An altered wetland ecosystem (Wl) forms and will develop distinctive structural features, given sufficient time and magnitude of modification. Alteration of the process domain changes the precise nature of functioning with implications for any resulting ecosystem values. For example following drainage a reduction in waler quality may result from a decline in the rate of denitrification. as a result of which N removal by this process fails to counteract nitrate inputs or generation in a wetland.
It is hypothesised that a sequence of altered wetland ecosystems can exist (Wl, W2, W3 ... Wn), reflecting a change in environmental characteristics, leading to an altered process domain, which can result in turn in an increase in ecosystem stress levels. The extent to which altered wetland ecosystem types can be related to particular stress thresholds is as yet uncertain. However, given the significance to functioning and the maintenance of particular values of' ecosystem alteration, it is clearly important to attempt to recognise these threshold conditions. This requirement is an important component of the predictive wetland functional assessment procedures (Maltby et al. 1994).
1.6.2 Project design - Establishment of field sites
The research programme has investigated four RMW areas: Middle Shannon (Ireland), Torridge (UK), Loire-Allier confluence (France), Cigiiela-Zancara head waters of the Guadiana (Spain), Fig. 1.10. The sites provide a distinct climatic and environmental gradient from the oceanic conditions of Ireland through the lower rainfall euoceanicity of south west England and the continental regime of the middle Loire to the highly seasonal, semi-arid regime of central Spain. At each locality a pair of sites has been selected, one to provide relatively natural or less impacted conditions and the other to demonstrate a particular impact. Table 1.4. The impacts were assessed on preliminary field reconnaissance. Results from the various sub-project studies would subsequently verify or contradict these initial observations.
The sites serve as reference or calibration points enabling comparisons to be made with sites for which scientific data may be absent or limited. In addition they provide initial testing sites for the development of the functional assessment procedures. Depending on the degree of impact the sites may be close together or well separated along a functional gradient. No attempt was made to standardise the relative positions of sites selected at this initial stage.
River System
Torridqe (UK)
Loire/Allier (France)
Shannon (Ireland)
Guadiana (Spain)
Paired Sites
Kismeldon Bradford Mill Apremont Decize Little Brosna Clonmacnoise El Maseqar Molino del Abogado
Impact
Nutrient enrichment
River regulation
Sedimentation
Groundwater abstraction
Relative level of Impact
Low High Low High Low High Low High
Table 1.4 Impacts studied at FAEWE field sites
1.6.3 Project design - Field and laboratory investigations
Initial reconnaissance at all the paired sites identified hydrogeomorphic units based on broad field observations and interpretations. Instrumentation stations were established at strategic locations within the HGMUs along transects at each of the paired sites. The arrangement of equipment was standardised for all the stations unless precluded by local environmental conditions (e.g. localised flooding). Physical information was collected as far as possible at two weekly intervals from the permanently installed
- 22
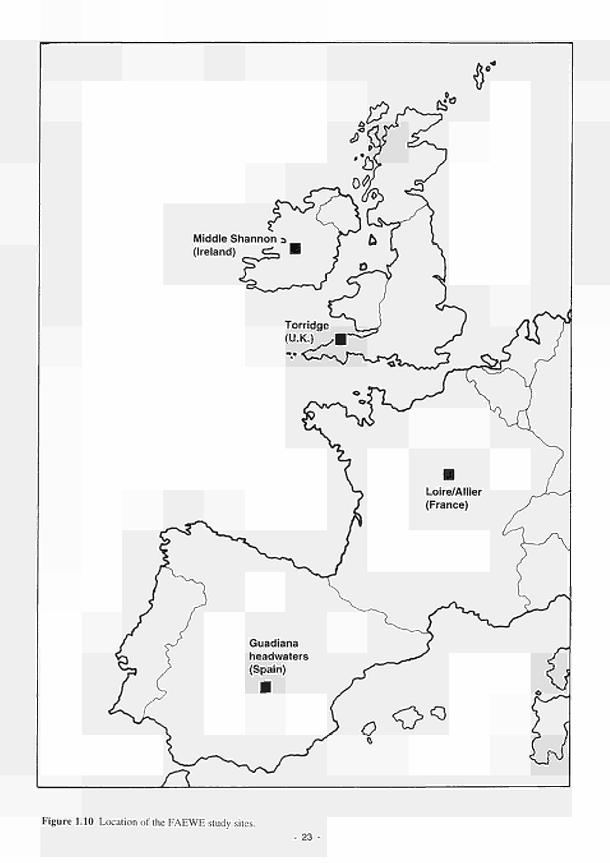
Middle Shannon ¡j (Ireland)
Figure 1.10 Location of the FAEWE study sites. 23 -

equipment. Water samples for chemical analysis were taken on a monthly basis from interstitial sampler cups. The vegetation and soil at the field sites was mapped, using standard techniques, to provide reference data for the research projects.
Sub-projects established field experiments and instrumentation at the sites to identify precisely the processes that control and maintain functioning as outlined in the objectives. For instance, studies on the impact of nutrient enrichment, sedimentation and alteration in the hydrological regime on biomass production and nutrienl uptake by vegetation utilised the standard field data and also established specific field and laboratory based experiments to supplement the knowledge base. Similarly some sub-projects have incorporated information provided by the routine measurements as well as developing integrated field, laboratory and analytical investigation techniques. The invertebrale studies have adopted this approach through the study of mollusc, carabid and hoverfly groups at various stages of floodplain habitat development in relation to a range of hydrological conditions in order to assess their value as predictors of man-induced alterations to floodplain hydrology.
Routine laboratory analysis of soil and water samples from the Torridge, Loire/Allier and Shannon sites was undertaken at the University of Exeter. The monthly waler samples were analysed for nitrate, ammonium, potassium, sodium, magnesium, calcium, pH, conductivity, chloride and sulphate. Contemporaneous laboratory analysis was undertaken for specific sub-projects such as investigations into N and Ρ nutrient dynamics, other water chemistry, factors controlling food webs and habitai support in the semi-arid context, and assessment of the characteristics of key plant species which indicated the degree and extent of stress and disturbance resulting from human impacts. Full melhodolical delails have been drawn together in a separate manual (Maltby & Hogan, in prep).
Field and laboratory investigations combined to provide lhe information required for specific research into aspects of RMW functioning. The analytical information was freely available for transfer between lhe groups to produce an integrated investigational approach across the sub-project boundaries.
1.6.4 Project design - Modelling
Mathematical modelling helps the researcher to undersland the mechanisms of studied physical, chemical and biological phenomena and, possibly, to check any hypothesis relating to il (Cungc, 1983). A model is thus a simplified structuring of reality which presents (supposedly) significant features or relationships in a generalised form (Chorley and Haggett, 1967). The modelling of lhe natural wetland mechanisms provides an insight into the relationships between key processes and functions.
Computer models form integral components of the FAEWE project. Dynamic models were developed to investigale nutrient fluxes in terms of both transport and reaction; distributed parameter groundwater flow models have been utilised to provide detailed information on the hydrological characteristics of the field sites; flooding, solute transport and sedimentation have been modelled to relate hydrological functioning characteristics to land use in the wider catchment.
All the models have provided information and inputs into the development of procedures for assessing the functioning of wetlands. The models were designed within the framework of the overall project as tools to predict and verify the role of key processes in wetland functioning.
1.6.5 Project design - Organisation and co-ordination
The work programme was organised into a series of sub-projects carried out by collaborators arranged in a series of teams, Fig. 1.1. The overall structure allowed for maximum collaboration between teams in terms of monitoring, experimentation and dissemination of results. Smaller group meetings of principal investigators were held less frequently and were called to address specific aspecls of the project.
Researchers undertook joint campaigns involving work at one or more institution or country. Wider collaborative groups took the form of workshops. These were held annually and all FAEWE participants attended. The venues varied to allow the researchers to visit the field sites in otherwise unfamiliar locations, Table 1.5.
24

The workshops acted as foci for discussion and presentation of results. Operational problems were discussed and resolved, allowing overall project management and co-ordination to be maintained. Field visits allowed the participants to familiarise themselves with aspects of wetland ecosystem functioning in differing study sites.
Year
1990 1992 1993 1994
Venue
Zeist, Netherlands ' Birr, Eire Nevers, France Miraflores de la Sierra, Spain
Table 1.5 Venues of FAEWE Workshops (* Inaugural meeting held at Zeist to facilitate the integration and co-operation in the initial phase of the FAEWE project)
Results and findings from the project were disseminated, and continue to be so, through the normal channels of scientific journals and publications. Their presentation figured prominently in the INTECOL IV Wetlands Conference (Ohio, 1994). Given the time required for the consolidation of research results and preparation for publication in journals it is only now that findings are coming on stream in the public domain. All publications emanating from the FAEWE project are included in the reference list.
1.7 Integration of Potential User Groups (PUGs)
The FAEWE project has extended beyond the range of its specific scientific research to liaise with the wider wetland scientific and management community. The aim was to: 1. Facilitate facilitate a truly integrated approach to functional analysis. 2. Engage the constituency of potential users at an early stage to ensure full and on-going support. 3. Initiate the first preparatory stages for necessary policy changes.
1.7.1 Background rationale
From the outset, the FAEWE project, in developing procedures to assess the functioning of RMWs, also needed to establish a constituency of users with confidence in the procedures being developed. This poses two important questions concerning the assessment of wetlands in Europe:
(a) the identification of user - who needs to assess wetlands'? (b) the identification of use - what forms of assessment are necessary'?
The problem is compounded by the lack of current definitive legislation requiring wetland functional analysis. However, EC DG XI has called for the development of an instrument of functional analysis in order to improve the decision-making process affecting wetlands. In a report to DG XI the conclusions staled that there is an urgent need for the development of a scientific methodology which assesses wetlands in terms of functions, thus alerting the scientific community, government, planners and local inhabitants to the role wetlands perform in providing important goods and services (Maltby et al., 1988).
In principle, it could be argued that resolving question (a) would elucidate an answer to question (b). To facilitate this goal institutional questionnaires on functional analysis were circulated to a variety of governmental (local and national) and non-governmental organisations, in the UK, the Netherlands and the Republic of Ireland. The purposes behind the involvement of outside agencies are:
• to identify the duties required (o be performed by the user to optimise wetland management; • to identify the desired applications of the user; • to identify the constraints on the user such as time, financial, expertise, data; • to help tailor the development of the functional analysis procedure to fit the requirements of the user;
and • to increase the level of awareness in the user of lhe operational scope of wetland functional analysis
procedures.
25 -
The institutional enquiries uncovered many areas where a wetlands assessment procedure could have a practical value. Nevertheless, no single organisation seemed particularly well suited for deploying a functional analysis scheme, and there was lillle consensus on its day-to-day applications, emphasising the need to develop modular, integrated procedures that allow some users to hy-pass sections that are irrelevant to particular assessment tasks or are beyond the level of expertise of the user.
In general current practices appear biased towards evaluations based largely upon meeting habitai or species criteria, or monitoring. Individuals within organisations tend to use ad hoc evaluation approaches to assessment and do not follow any fixed methodologies, unless for specific site designations (e.g. Sites of Special Scientific Interest guidelines in the UK). Monitoring, on the other hand, is seen as a short to medium term solution to the problem of prescribing management where functional and aulecological information is sparse. This shows the inherent need for guidance on monitoring and interpretation of data.
Whilst there were differences in detailed responses from the Netherlands in comparison to lhe UK and the Republic of Ireland, although the overriding needs were similar. General agreement was expressed on the need for the procedures to be accurate, meet planning and policy regulations, allow for a multitude of possible applications and be user-friendly within lhe personnel constraints of the organisation.
Many other issues were exposed through the institutional enquiry, of which several merited more detailed fact finding missions. To expedite this integration process an initial potential user group was established in the UK, and participants were inviled to attend an introductory meeting at the University of Exeter, UK. Subsequent groups will be established for other EU member states during Phase II of the FAEWE Project.
1.7.2 Potential User Group meetings
The first UK functional analysis consultative PUG meeting was held in December 1992 at the University of Exeter, UK. The meeting was attended by personnel from local authorilies, national stalutory bodies and a variety of local and national non-governmental organisations, all concerned with issues of environmental and habitat protection and conservation.
Following an introductory session aimed at familiarising the participants with the concept of functional assessment the meeting focused on addressing developmental, utilisation and operational questions. Many of the concepts, such as the hydrogeomorphic unit and wetland functioning, were new and as a consequence received with some caution, and may have caused a degree of confusion. Resistance to new terminology was evident, and a lack of appreciation of the operational possibilities that functional assessment procedures could offer also pervaded the meeting. Despite the lack of conviction expressed by some of those present, the meeting was seen as beneficial by both the participants and the co-ordinator.
A second PUG meeting was held at the University of Exeter in November 1993. During the intervening period the previous participants had been informed of the progress of the project. The meeting focused on more tangible products than were previously available, such as the structure of the functional assessment procedures, possible approaches adopted by the user and potential application scenarios. Specific wetland functions were discussed, and possible impacts upon them outlined. Emphasis was placed on lhe applicability of the functional assessment procedures within the outlined conceptual framework. Response from the group was much more favourable and productive. General agreement was reached on the conceptual structure of the procedures, and potential applications within the participating organisations were foreseen, although not unanimously. The overall response was one of greater familiarity and acceptance of the concepts (such as wetland functions, functional assessment, hydrogeomorphic units) and an increased willingness to be involved in the interactive consultative process.
1.7.3 The benefits of Potential User Groups
Integrating and liaising with the organisations that represent a possible market place for the product has its obvious benefits. Allowing the user to have an input to the developmental process ensures a more accurately targeted product, which can only be mutually beneficial. Educating the user in the value of wetlands and their functioning has an intrinsic benefit. Awakening the user to methods of assessing that value, within the assessment framework of their organisation or not (i.e. whether the FAEWE procedures are utilised or not), will be beneficial to the protection and wise use of wetlands.
- 26 -

Continued consultation is maintained with the potential user group. Field testing of the procedures has been undertaken with one of the major participating parties (NRA). This 'hands-on' approach has ensured operational compatibility and has helped to highlight potential deficiencies in the system.
The benefits are clearly mutual. The FAEWE project has educated and informed potential users of the possibilities available, whilst the potential users have provided 'real world' constraints and exposed 'sharp end' practicalities in the development of the functional assessment procedures. The PUG model will be expanded in Phase II of the project to include groups in France, Spain, the Netherlands and Ireland.
1.8 Integration with broader wetland issues
A wide range of national as well as EU and other initiatives have further advanced the cause of wetland conservation and improved management. The FAEWE project from the outset however has aimed at filling important gaps in the scientific knowledge which is available to underpin these initiatives. Table 1.6 identifies the original anticipated groups of users. This list will be modified as experience is gained from Phase II.
Anticipated user
EC DGXI
Planning authorities
Government agencies
Non-government organisations
OECD
Possible application / use
Where there has been an expressed need within European Community Environmental Policy for an instrument of functional assessment to enable progress to be made in the integrated management and conservation of wetland ecosystems
National or regional level authorities who lack teams of interdisciplinary environmental experts and the necessary funds to analyse and assess wetlands prior to decision making which currently often requires a time-scale inappropriate for full scientific investigation
Concerns with implementation of Directive 85/337/EEC (Environmental Impact Assessment) and associated legislation to improve environmental protection
Concerns with implementation of the Convention of Wetlands of International Importance (Ramsar) and the requirements of 'wise use' of all wetlands within their terrestrial limits
To aid in the project initiated for examination of the economics of wetland maintenance versus alteration or loss. A means of scientific analysis of ecological and environmental functioning is a prime requirement for full social and economic analysis. Collaboration with economists will enable translation of the science base of ecosystem functioning into social and economic values.
Table 1.6 Original anticipated users of the FAEWE procedures.
Examples demonstrate the synergy between FAEWE and these other initiatives. The Nature Protection Act in Denmark protects all salt marshes, fresh meadows, fens, bogs, and moors larger than 0.25ha, all lakes and ponds larger than 0.01 ha and most streams and water courses. In the case of single important wetlands specific conservation orders give detailed rules for land use and nature management. Despite this high level of physical protection a major challenge exists to improve the quality of water and ecological conditions which have deteriorated in most of the remaining Danish wetlands (Møller, 1992). The policy for wetland restoration depends heavily on the environmental benefits such as reduction of nitrogen pollution or protection of groundwater resources. It is anticipated that the scientific results and procedures developed in FAEWE will assist in the selection of priority areas for restoration and in the prediction of benefits to be obtained. The Danish case is symptomatic of a general trend throughout Europe in which there is high potential for practical applications.
The worsening conditions of Mediterranean wetlands has become well known to many authorities (such as Ramsar Convention Bureau, OECD, UNEP and the EC). The deterioration of these wetlands was dramatically highlighted in the presentations made al the Managing Mediterranean Wetlands And Their Birds For The Year 2000 And Beyond symposium in February 1991. The realisation of this situation led to the unanimous approval of the declaration which sei a goal "...to stop and reverse wetland loss and degradation in the Mediterranean basin...' To achieve this goal the McdWet project recommended thai
27

research that is directly relevant to the stoppage and reversal of wetland degradation and loss be undertaken. Further, the need to increase the public appreciation of wetland functions and their value to society was identified as essential for the effective conservation of these resources (Papayannis, 1993). The synergy between the MedWcl initiative and the FAEWE project is obvious.
National and international institutions within Europe and beyond are directing increasing attention to lhe maintenance of wetland ecosystem functional integrity to provide benefit lo human society as well as being the most effective means of conserving habitai and species diversity. This approach is linked inexorably with the formulation and implementation of policies of sustainable development and integrated management of natural resources. Apart from the work of national and local governments, notable international organisations with a clear wetland mandale include IUCN. WWF, IWRB. RSPB, Wildfowl and Wetlands Trust (WWT) and the Ramsar Bureau. All of these bodies arc dependent on the input of best scientific information to enable them to discharge their missions. None are separately engaged in fundamental or experimental scientific research. The FAEWE project has enhanced the level of detailed knowledge about wetland functioning which will support the wider aims of the wetland programmes of all these organisations.
1.8.1 EC Directives
The effective application of EC Directives (Table 1.7 gives a selection of lhe most relevant) will be improved from the results of the FAEWE project. Once consistent procedures of functional assessment are in place it is anticipated that they can be used as effective tools to support such Directives and other national or supranational actions.
Initial legislation aimed at controlling nitrate levels, such as EC Directive 80/778, tended to focus upon waters for human consumption. The second major piece of legislation regarding nitrates imposed by the EC, Directive 91/676, addressed the problems of eulrophication in addition to drinking water quality. The Directive refers to '...waters affected by pollution and waters which could be affected by pollution...' Once these waters have been identified, areas thai drain into affected waters and conlribute to lhe nitrate problem (termed vulnerable zones) must be designated. Within lhe designated vulnerable zones codes of agricultural practice must be drawn up, referring among other recommendations to
Directive Number
EEC/2078/92
75/400/EEC
76/464/EEC
78/659/EEC
79/409/EEC
80/778/EEC
82/72/EEC
85/337/EEC
91/676/EEC
92/43/EEC
Directive description
Regulation on agricultural production methods compatible with the requirements of the protection of the countryside (known as "Agr. Env. Reg.").
Directive concerning the quality required of surface water intended for the abstraction of drinking water in the member states.
Directive on pollution caused by certain substances discharged in the aquatic environment of the community.
Directive on the quality of freshwater needing protecting or improving in order to support fish life.
Conservation of wild birds
Nitrate Directive
On the conclusion of the Convention on the conservation of European Wildlife and natural habitats (known as the "Berne Convention")
Directive on the assessment of the effects of certain public and private projects on the environment.
Nitrate Directive
Conservation of natural habitats and of wild fauna and flora
Table 1.7 EC Directives that will benefit from lhe FAEWE project.
- 28 -
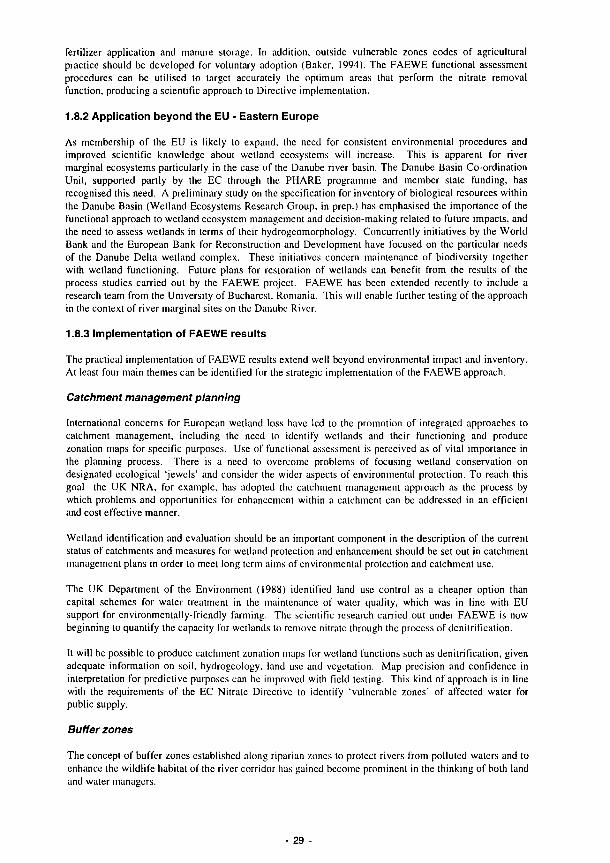
fertilizer application and manure storage. In addition, outside vulnerable zones codes of agricultural practice should be developed for voluntary adoption (Baker, 1994). The FAEWE functional assessment procedures can be utilised to target accurately the optimum areas that perform the nitrate removal function, producing a scientific approach to Directive implementation.
1.8.2 Application beyond the EU - Eastern Europe
As membership of the EU is likely to expand, the need for consistent environmental procedures and improved scientific knowledge about wetland ecosystems will increase. This is apparent for river marginal ecosystems particularly in the case of the Danube river basin. The Danube Basin Co-ordination Unit, supported partly by the EC through the PHARE programme and member state funding, has recognised this need. A preliminary study on the specification for inventory of biological resources within the Danube Basin (Wetland Ecosystems Research Group, in prep.) has emphasised the importance of the functional approach to wetland ecosystem management and decision-making related to future impacts, and the need to assess wetlands in terms of their hydrogeomorphology. Concurrently initiatives by the World Bank and the European Bank for Reconstruction and Development have focused on the particular needs of the Danube Delta wetland complex. These initiatives concern maintenance of biodiversity together with wetland functioning. Future plans for restoration of wetlands can benefit from the results of the process studies carried out by the FAEWE project. FAEWE has been extended recently to include a research team from the University of Bucharest. Romania. This will enable further testing of the approach in the context of river marginal sites on the Danube River.
1.8.3 Implementation of FAEWE results
The practical implementation of FAEWE results extend well beyond environmental impact and inventory. At least four main themes can be identified for the strategic implementation of the FAEWE approach.
Catchment management planning
International concerns for European wetland loss have led to the promotion of integrated approaches to catchment management, including the need to identify wetlands and their functioning and produce zonation maps for specific purposes. Use of functional assessment is perceived as of vital importance in the planning process. There is a need to overcome problems of focusing wetland conservation on designated ecological 'jewels' and consider the wider aspects of environmental protection. To reach this goal the UK NRA, for example, has adopted the catchment management approach as the process by which problems and opportunities for enhancement within a catchment can be addressed in an efficient and cost effective manner.
Wetland identification and evaluation should be an important component in the description of the current status of catchments and measures for wetland protection and enhancement should be set out in catchment management plans in order to meet long term aims of environmental protection and catchment use.
The UK Department of the Environment (I988) identified land use control as a cheaper option than capital schemes for water treatment in the maintenance of water quality, which was in line with EU support for environmentally-friendly farming. The scientific research carried out under FAEWE is now beginning to quantify the capacity for wetlands to remove nitrate through the process of denitrification.
It will be possible to produce catchment zonation maps for wetland functions such as denitrification, given adequate information on soil, hydrogeology, land use and vegetation. Map precision and confidence in interpretation for predictive purposes can be improved with field testing. This kind of approach is in line with the requirements of the EC Nitrate Directive to identify 'vulnerable zones' of affected water for public supply.
Buffer zones
The concept of buffer zones established along riparian zones to protect rivers from polluted waters and to enhance the wildlife habitat of the river corridor has gained become prominent in the thinking of both land and water managers.
29
The requirements for optimal denitrification in terms of soil/sediment type and location are reviewed by Haycock and Burt (1993). Evidence indicates the need for organic-rich soils to be saturated by nutrienl loaded waters moving through lhe wetland prior to reaching a watercourse. Backlands and footslopes more often meel these requirements than levées adjacent to the river channel.
Locations in catchment headwaters are generally more effective in maintaining waler quality of a river basin, but lower in the catchment the flooding of alluvial wetlands offers a significam opportunity for nutrient removal such as by denitrification.
In order to determine the effectiveness of buffer zones in carrying oui denitrification it is important to identify groundwater flow patterns as well as water and soil characteristics. In rapid surveys where measured values are lacking use can be made of characteristic vegetation and other features such as old oxbows, footslope seepage areas and artificial features such as ditches to identify significant buffer zones. The importance of these landscape units has been highlighted in Phase I of the FAEWE Project. Readily identifiable features of importance for functional assessment arc described in the functional assessment methodology.
Riparian wetlands, intermediate in character between lerrestrial and aquatic ecosystems, have been considered as ecotones (Naiman and Decamps, 1990; Risser. 1990), the geographical exlcnt of which should be maximised, maintaining appropriale characteristics to enable functional capacity to be optimised. This should include opportunities, not only for the enhancement of present wetlands but also for the restoration of former wetlands, in which functional capacity may have been reduced or lost by past management. This has often been lhe result of agricultural intensification involving land drainage and nutrient enhancement for maximising crop production. Techniques for site restoration have been reviewed by Treweek et al. (1991) and these include a wide range of engineering approaches such as river channel enhancement which aim to retain water longer wilhin lhe river corridor ecosystems.
Biodiversity
The new treaty by the European Union signed by member stales on 7 February 1992 has a principal objective: the promotion of sustainable growth respecting the environment. This includes an environmental policy which aims at a high level of environmental protection, the requirements of which need to be integrated throughout Community policies. There is an implicit involvement also in world wide issues. In June 1992 the Community and its member stales jointly signed the Convention on Biological Diversity, negotiated under the auspices of the United Nations Environment Programme. The EC views wetland loss and degradation as a global scale environmental problem, not least because these habitals are of particular significance for genetic, species and ecosystem diversity. Much of lhe biodiversity importance of wetlands comes from their high productivity (Verhoeven, 1992). This productivily base is enhanced inter alia by (i) alternate wet/dry sequences, which also increase nutrient and organic mailer turnover; (ii) the passage of water, either constantly or intermittently, which provides a good supply of nutrients and removes dead tissue, keeping plani communities healthy and vigorous; and (iii) physiological adaptations by wetland plant species which enable them to use and slorc nutrients effectively, such as larger leaf areas to allow maximum photosynthesis, or survival in anaerobic conditions and the resumption of normal growth when the oxygen supply is restored as shown by Phragmites australis (Crawford, 1989).
Wetlands, as natural bridges between lerrestrial and aquatic environments, provide complex mosaics of habitats which are capable of supporting a high diversity of species, the existence of which can depend entirely upon their specific hydrological requirements. Of these wetland species a fair proportion is listed as threatened or endangered (Gopal and Masing. 1990). The existence of biodiversity at different levels of biological organisation as well as spatial scales is significam, since actions taken to conserve biodiversily at one level, for example lhe genetic, may achieve their aims but a consequence may be reduclion of biodiversity at one or both of the other levels (species or community/ecosystem). Clearly, the maintenance of different facets of biodiversity will require different management slrategics and resources. Improved knowledge of the actual functioning of wetland ecosystems and, in particular, lhe ways in which ihey are altered by humans as well as by natural environmental factors at different scales, can help considerably in the formulation of more appropriate actions lo support the maintenance of biological diversity.
30

Restoration and creation
Wetland restoration usually deals with lhe rehabilitation of wetlands that have been degraded or hydrologically altered. Wetland creation refers to the construction of a wetland where one did not previously exist. Restored or created wetlands can, and often do, fulfil specific objectives, such as wildlife enhancement, domestic waste water treatment, (lood control or aesthetic appeal. A growing number of wetland creation and restoration projects have benefited from an increasing commitment on the pari of industry to nature conservation and environmental improvement in general. Many national standards (e.g. British Standard 7750, Specification for environmental management systems) have required industrial companies to set measurable targets for minimising their "...effects on specific parts of the environment including ecosystems..." and also for providing environmental benefits. The use of similar standards should help companies prepare for the introduction of the EC Eco-management Audit System (EMAS) due to be introduced in May 1995.
For a created or restored wetland to achieve a specific objective lhe design criteria must be science based, otherwise the ecosystem may fail to fulfil its desired function. The results of the FAEWE research programme can be utilised lo support the design criteria selection process. Post-creation or restoration assessment can be achieved using the functional assessment procedures and where design inadequacies are highlighted recommendations for modification can be made.
31


2 STUDY AREAS
The sludy sites form the essential reference or calibration points which enable comparisons to be made with sites for which scientific data may be limited or absent. The investigation and interpretation of in situ processes provided the fundamental inputs to the science base.
2.1 Rationale for site selection
Site selection played a crucial part in maximising opportunities to research key processes which support functioning within river marginal wetland ecosystems. Sites were located which would encapsulate a range of climatic and olher environmental variables in addition to a number of important types of parent material, soil and vegetation. For each site (associated with a particular river basin, viz. Shannon, Torridge, Loire and Guadiana) a pair of subsites were selected, one of which was considered to be significantly impacted by a specific anthropogenic activity while the other remained relatively pristine. This would enable study of the effects of disturbance on the operation of dynamic processes and consequent functioning. The specific perturbations examined were those that lead to sedimcntalion, alteration of hydrological regime and nutrient enrichment. The location of the sites chosen for detailed field investigation are shown in Fig LIO.
The sites encompass a climatic gradient from the hypcr-occanic conditions of Ireland through the euoceanicity of south west England and the continental regime of central France to the highly seasonal semi-arid regime of central Spain.
In Ireland the Shannon floodplain al Clonmacnoise, County Offaly, was chosen as an example of land thought to be impacted by silt and peat deposition resulting from the activities associated with commercial peat extraction from bogs within the catchment. The unimpacted companion subsite selected was on the floodplain of the Little Brosna, a downstream tributary of the Shannon, draining westwards from the Slieve Bloom mountains.
The wintering wildfowl and waders of this section of the Shannon have long been recognised as of international importance (Hutchinson, 1979; Scoti, 1980) with the Little Brosna Callows holding particularly large concentrations of birds between October and April. The Shannon Callows hold one of the three largest concentrations of lowland wet grassland breeding waders in Ireland and Britain. Due to the extensive nature of the callows they hold the highest population for any single area. Redshank (Tringa totanus) numbers and densities are the highest recorded for inland wet grassland in Ireland and Britain. The hay meadows on the callows hold one of the largest remaining concentrations of corncrake (Cre.v crex) in Ireland and Britain and the only regular breeding site for black-tailed godwit (Limosa limosa) in Ireland. Nationally important numbers of breeding shoveller (Spatula clypeata) occur. The numbers of whimbrel (Numenius phaeopus) recorded passing through the callows on spring migration arc likely to be of international importance. The key areas of the callows exhibiting the most diversity arc those near Bannagher, Clonmacnoise and along the Little Brosna, although it is only the callows taken as a whole which exhibit the full range of diversity and nature conservation value.
In the UK concern has been expressed in recent years over the environmental decline of the river Torridge, a major factor in which has been nutrient enrichment of the waters, due at least in part lo agricultural intensification within the catchment. The subsite chosen for the study of the impaci of nutrients from fertilisers was al Bradford Mill, at the confluence of the Torridge with a major tributary, the Walden. The land had been formerly more intensively farmed but subsequently has been allowed to revert to semi-natural vegetation with use only as rough grazing. The surrounding land is mostly under intensive grassland management with only a narrow, steep wooded backslopc acting as a buffer to the wetland. The control subsite is at Kismeldon Meadows, a Site of Special Scientific Interest, designated for lhe nature conservation value of its complex of humid grassland, heath, mire and fen communities and associated faunal species. The Kismeldon subsite is located some 10km upstream of Bradford Mill on a section of the Torridge floodplain less than 100m in width.
The site located in central France was chosen to enable a study to be made of the effects of hydrological modification through river regulation operating on the Loire, in contrast to the unregulated Allier, ils main
33

...
SHANNON
i #AuP I Uti
I 1 Λ
I 1«.
UNFALL
I ».r
II ¿l'ci:
I •o.
I DEC
SHANNON TEMPERATURE
TORRIDGE RAINFALL
XüSSvcctSvñc
LOIRE RAINFALL LOIRE TEMPERATURE
Loire/Allier sites
Figure 2.1 Climatic variations between study sites. (Key: ▲ Study site location; Mean monthly rainfall
categories (mm), I. 0 25; 2. 25 50; 3. 50 75; 4. 75 100; Mean monthly air temperature categories
(°C), 1 . 2 . 5 5 . 0 , 2 . 5 . 0 7 . 5 , 3 . 7 . 5 10.0,4. 10.0 12.5.5. 12.5 15.0,6. 15.0 17.5,7. 17.520 0 8
20.0 22.5, 9. 22.5 25.0, 10. 25.0 27.5.
34
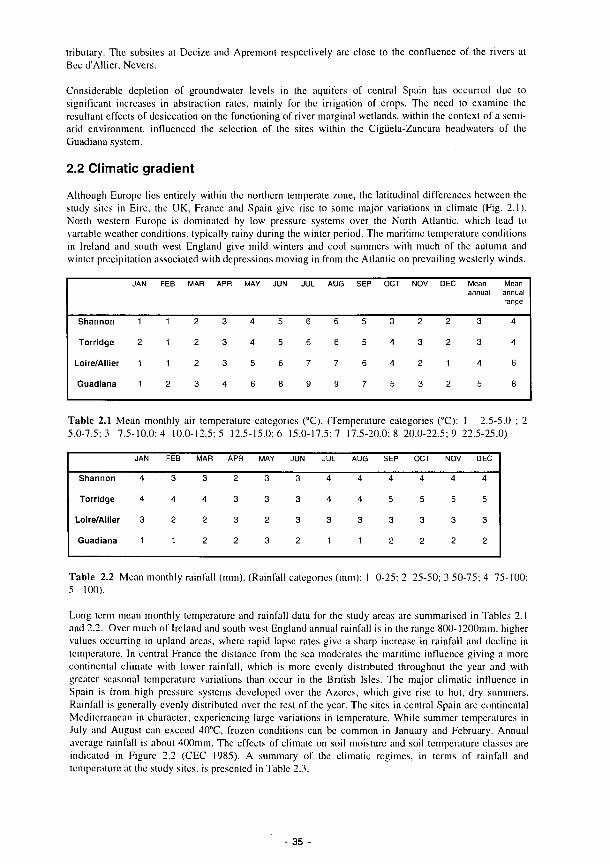
tributary. The subsites al Decize and Apremont respectively are close to the confluence of the rivers at Bec d'Allier, Nevers.
Considerable depletion of groundwater levels in the aquifers of central Spain has occurred due to significant increases in abstraction rates, mainly for the irrigation of crops. The need to examine the resultant effects of desiccation on the functioning of river marginal wetlands, within the context of a semi-arid environment, influenced the selection of the sites within the Cigiiela-Zancara headwaters of the Guadiana system.
2.2 Climatic gradient
Although Europe lies entirely within the northern temperate zone, the latitudinal differences between the study sites in Eire, the UK, France and Spain give rise to some major variations in climate (Fig. 2.1). North western Europe is dominated by low pressure systems over the North Atlantic, which lead to variable weather conditions, typically rainy during the winter period. The maritime temperature conditions in Ireland and south west England give mild winters and cool summers with much of the autumn and winter precipitation associated with depressions moving in from the Atlantic on prevailing westerly winds.
Shannon
Torridge
Loire/Allier
Guadiana
JAN
1
2
1
1
FEB
1
1
1
2
MAR
2
2
2
3
APR
3
3
3
4
MAY
4
4
5
6
JUN
5
5
6
8
JUL
6
6
7
9
AUG
6
6
7
9
SEP
5
5
6
7
OCT
3
4
4
5
NOV
2
3
2
3
DEC
2
2
1
2
Mean annual
3
3
4
5
Moan annual range
4
4
6
8
Table 2.1 Mean monthly air temperature categories (°C). (Temperature categories (°C): 1 2.5-5.0 ; 2 5.0-7.5; 3 7.5-10.0; 4 10.0-12.5; 5 12.5-15.0; 6 15.0-17.5; 7 17.5-20.0; 8 20.0-22.5; 9 22.5-25.0)
Shannon
Torridge
Loire/Allier
Guadiana
JAN
4
4
3
1
FEB
3
4
2
1
MAR
3
4
2
2
APR
2
3
3
2
MAY
3
3
2
3
JUN
3
3
3
2
JUL
4
4
3
1
AUG
4
4
3
1
SEP
4
5
3
2
OCT
4
5
3
2
NOV
4
5
3
2
DEC
4
5
3
2
Table 2.2 Mean monthly rainfall (mm). (Rainfall categories (mm): 1 0-25:2 25-50; 3 50-75; 4 75-100; 5 100).
Long term mean monthly temperature and rainfall data for the study areas are summarised in Tables 2.1 and 2.2. Over much of Ireland and south west England annual rainfall is in the range 800-1200mm, higher values occurring in upland areas, where rapid lapse rates give a sharp increase in rainfall and decline in temperature. In central France the distance from the sea moderates the maritime influence giving a more continental climate with lower rainfall, which is more evenly distributed throughout the year and with greater seasonal temperature variations than occur in the British Isles. The major climatic influence in Spain is from high pressure systems developed over the Azores, which give rise to hot, dry summers. Rainfall is generally evenly distributed over the rest of the year. The sites in central Spain arc continental Mediterranean in character, experiencing large variations in temperature. While summer temperatures in July and August can exceed 40°C, frozen conditions can be common in January and February. Annual average rainfall is about 400mm. The effects of climate on soil moisture and soil temperature classes are indicated in Figure 2.2 (CEC 1985). A summary of the climatic regimes, in terms of rainfall and temperature at the study sites, is presented in Table 2.3.
35
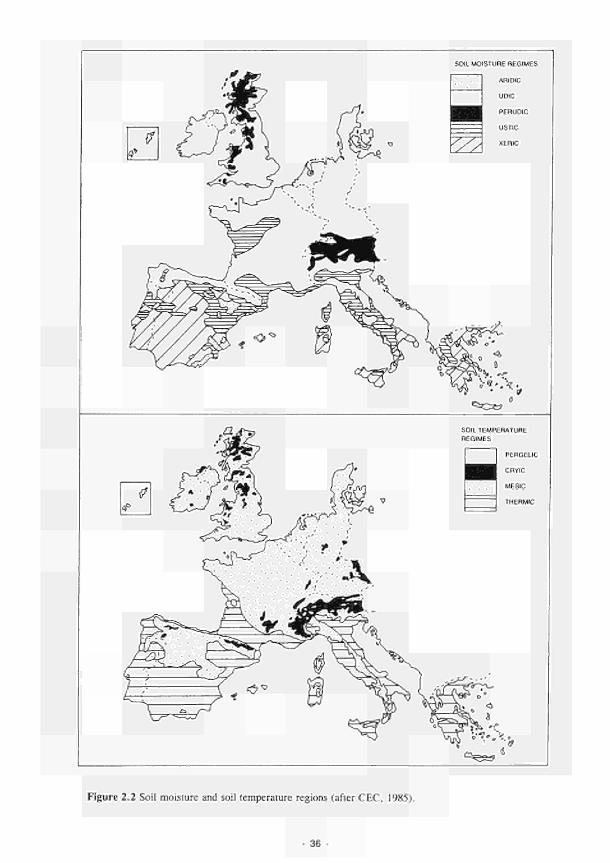
SOIL MOISTURE REGIMES
V/
ARIDIC
UDIC
PERUDIC
XERIC
*<X>
y SOIL TEMPERATURE REGIMES
PERGELIC
CRYIC
MESIC
THERMIC
Figure 2.2 Soil moisture and soil temperature regions (after CEC, 1985).
36

Location Climate
Shannon Moderate rainfall, cool summers, mild winters
Torridge High rainfall, cool summers, mild winters
Loire Moderate rainfall, hot summers, cool winters
Guadiana Low rainfall, hot dry summers, cool winters
Table 2.3 Summary of the climatic regimes at the study sites.
2.3 Site descriptions
The area selected for study at each location was between the river channel and one edge of the floodplain, usually on the wider side, but including the adjacent footslopes in the case of the Torridge, where they form an integral part of the wetland ecosystem complex. Instrumented stations were arranged along a transect perpendicular to the river channel and extending across the floodplain. For the purposes of the study the instrumentation stations were coded as follows:
Shannon
Torridge
Loire
Guadiana
Clonmacnoise Little Brosna Kismeldon Bradford Mill Apremont Decize El Masegar Molino del Abogado
CLON 1-5 LTBRl-5 KISM1-5 BRAD 1-3 APRE 1-4 DECZ1-4 MASE 1-4 MOLI 1-4
2.3.1 Shannon
The 14,100 km- of the Shannon catchment, which includes the estuary, is substantially the largest drainage basin in Ireland. The main river is 359km long and drains southwards from its headwaters located to the north of the central lowlands. Fig. 2.3. Annual average rainfall for the catchment is 1.024mm, with a maximum of l,750-2,250mm occurring in the uplands of the headwaters. The underlying geology is predominantly Carboniferous limestone with sandstones and shales found in the upper catchment. Acidic rocks are overlain by glacial drift (till), comprising oulwash sands and gravels. Peats and peaty gleys are the main soils of the headwater areas while peats of raised bogs are found in the upper and central parts of the basin with gleys and podzolic soils the main mineral types. The soil parent materials of the floodplain comprise both alluvium and peat. To the south of Clonmacnoise and to the north of Little Brosna the study sites are bordered by an esker composed of sands and gravels. Within the catchment grassland farming is the main land use with permanent pasture and rough grazing in the uplands and increasingly intensive agricultural management being employed in the lowlands, mainly of ley pasture, tillage land occupying less than 10 percent.
The Shannon Callows comprise about 3400 ha of semi-natural floodplain grassland alongside the 57 km stretch of the River Shannon between the towns of Athlone and Potumna, Central Ireland. Winter and early spring flooding occur annually, with occasional summer flooding. The term callow is derived from the Irish word cala meaning a marshy meadow along a river. The present, largely treeless, landscape of the callows has developed as a result of farming practices which have changed little over the centuries. The low intensity grazing and hay-making have produced a mosaic of semi-natural vegetation, some of which is very species-rich.
The study area of the Middle Shannon has low relief, the river meandering considerably. From its source at 140m OD it drops to 30m OD where its flow is between Loch Ree (Athlone) and Loch Dcrg (Portumna). There is a drop of 18m in 230km in the stretch of the Shannon from L. Allen to L. Dcrg. In the middle section from Athlone to Purtumna. a distance of 40km, there is a 12m fall. The climate is typically oceanic with rain falling on average one day in two and evenly distributed throughout most of the
- 37
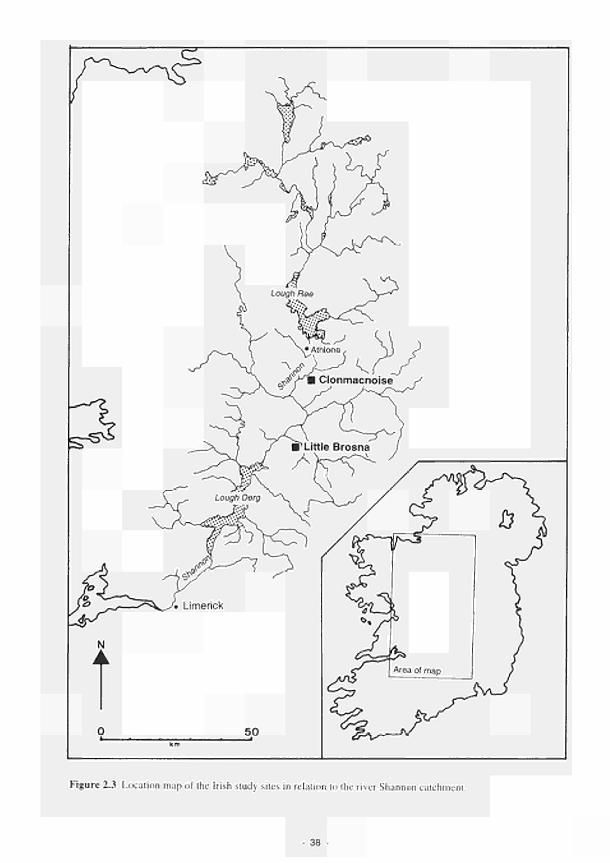
Figure 2.3 Location map of the Irish study sites in relation to the river Shannon catchmen
38 -

Fluvisols ( poorly drained ) in river alluvium
HHHJ Hlstosols ( peat ) with thin lli.H H ( <40cm ) silty top soil
Histosols ( peat )
Dystric cambisols ( well drained ) on esker slopes
Field boundary
River
Boundaries between soil units
5 Δ Location of stations
Figure 2.4 Soil maps of the Irish study sites: (a) Clonmacnoise; (b) Little Brosna.
- 39
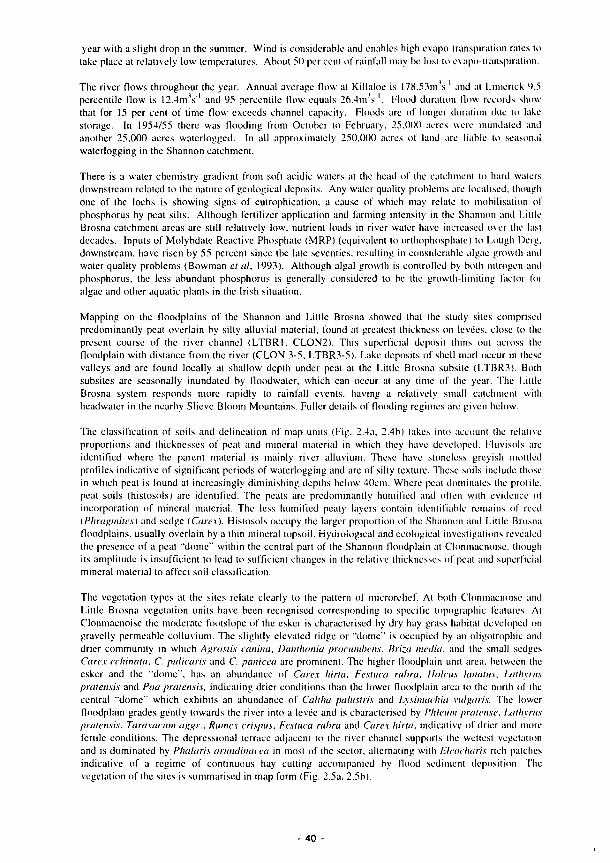
year with a slight drop in the summer. Wind is considerable and enables high evapo-transpiration rates to take place at relatively low temperatures. About 50 per cent of rainfall may be lost to evapo-transpiration.
The river flows throughout the year. Annual average flow at Killaloe is 178.53m s ' and at Limerick 9.5 percentile flow is 12.4mV' and 95 percentile flow equals 26.4ms' . Flood duration How records show that for 15 per cent of time flow exceeds channel capacity. Floods are of longer duration due to lake storage. In 1954/55 there was flooding from October to February. 25.000 acres were inundated and another 25.000 acres waterlogged. In all approximately 250,000 acres of land arc liable lo seasonal waterlogging in the Shannon catchment.
There is a water chemistry gradient from soft acidic waters at the head of lhe catchment to hard waters downstream related to the nature of geological deposits. Any water quality problems are localised, though one of lhe lochs is showing signs of eutrophication, a cause of which may reíale lo mobilisation of phosphorus by peal sills. Although fertilizer application and farming intensity in the Shannon and Little Brosna catchment areas arc still relatively low. nutrient loads in river waler have increased over the lasi decades. Inputs of Molybdate Reactive Phosphate (MRP) (equivalent to orthophosphate) to Lough Derg, downstream, have risen by 55 percent since the lale seventies, resulting in considerable algae growth and water quality problems (Bowman et al. 1993). Although algal growth is controlled by bolli nitrogen and phosphorus, the less abundant phosphorus is generally considered to be the growth-limiting factor for algae and other aquatic plants in the Irish situation.
Mapping on the floodplains of the Shannon and Little Brosna showed that the study sites comprised predominantly peat overlain by silty alluvial material, found at greatest thickness on levees, close to the present course of the river channel (LTBRI. CLON2). This superficial deposit thins out across the floodplain with distance from the river (CLON 3-5. LTBR3-5). Lake deposits of shell marl occur in these valleys and arc found locally al shallow depth under peat at lhe Linie Brosna subsite (LTBR3). Both subsites arc seasonally inundated by floodwater, which can occur al any time of the year. The Little Brosna system responds more rapidly lo rainfall events, having a relatively small catchment with headwater in the nearby Slieve Bloom Mountains. Fuller details of Hooding regimes are given below.
The classification of soils and delineation of map units (Fig. 2.4a, 2.4b) takes into account the relative proportions and thicknesses of peat and mineral material in which they have developed. Fluvisols arc identified where the parent material is mainly river alluvium. These have stonelcss greyish mottled profiles indicative of significant periods of waterlogging and are of silty texture. These soils include those in which peat is found at increasingly diminishing depths helow 40cm. Where peal dominates the profile, peat soils (histosols) are identified. The peats are predominantly humified and often with evidence of incorporation of mineral material. The less humified peaty layers contain identifiable remains of reed (Phragmites) and sedge (Carex). Histosols occupy lhe larger proportion of the Shannon and Lillle Brosna floodplains. usually overlain by a thin mineral lopsoil. Hydrological and ecological investigations revealed the presence of a peat "dome" within the central pari of lhe Shannon floodplain al Clonmacnoise, though its amplitude is insufficient to lead to sufficient changes in the relative thicknesses of peat and superficial mineral material to affect soil classification.
The vegetalion types al the siles relate clearly to the pattern of microrelief. At both Clonmacnoise and Little Brosna vegetation units have been recognised corresponding to specific topographic features. Al Clonmacnoise the moderate footslope of the esker is characterised by dry hay grass habitat developed on gravelly permeable colluvium. The slightly elevated ridge or "dome" is occupied by an oligotrophic and drier community in which Agrostis canina, Danthonia procumbens, Briza media, and the small sedges Carex echinala. C. pulicaris and C. punicea arc prominent. The higher floodplain unit area, between the esker and the "dome", has an abundance of Carex hirta. Festuca rubra. Hokus lanalus, Lathyrus pratensis and Poa pratensis, indicating drier conditions than lhe lower floodplain area to the north of the central "dome" which exhibits an abundance of Caltha palustris and Lysimachia vulgaris. The lower floodplain grades gently towards the river into a levée and is characterised by Phleum pratense. Lathyrus pratensis. Taraxacum aggr.. Rumex crispus. Festuca rubra and Carex hirta, indicative of drier and more fertile conditions. The depressional lerrace adjacent to lhe river channel supports (he wctlcsl vegetation and is dominated by Phalaris arundinacea in most of the sector, alternating wilh Eleocharis rich patches indicative of a regime of continuous hay culling accompanied by flood sediment deposition. The vegetation of lhe sites is summarised in map form (Fig. 2.5a, 2.5b).
40
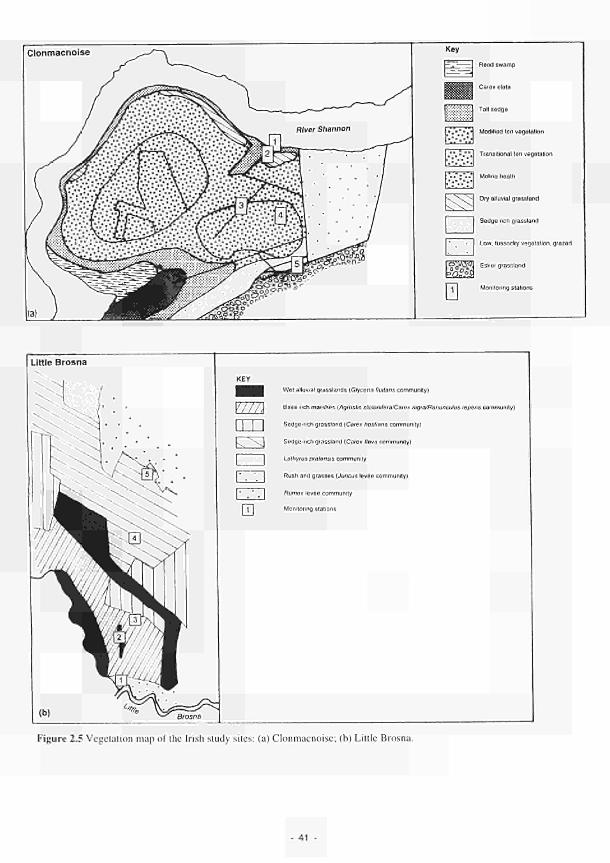
Clonmacnoise Key
Reed swamp
Carex elata
Tall sedge
Modified fen vegetation
Transitional fen vege talion
Molina healh
Dry alluvial grassland
Sedge rich grassland
Low, tussocky vegetation, grazed
I Ç V O ^ j Esker grassland
Monitoring stations
Little Brosna
Wet alluvial grasslands (Glycena flintans community)
Y / / / J Base-rich marshes {Agrostis stoIomfera/Carex nigra/Ranunculus repens community)
Sedge-rich grassland (Carex hostiana community)
L " \ J Sedge-rich grassland {Carex flava community)
Lathyrus pratensis community
Rush and grasses {Juncus levée community)
Rutnex levée community
I 1 1 Monitoring stations
Figure 2.5 Vegetation map of the Irish study sites: (a) Clonmacnoise; (b) Little Brosna.
41

(a) SHANNON SITES Clonmacnoise (Impacted by Sedimentation)
Moderate Seepage - < Slope ► - < Zone > - - < - ■ Floodplain -
■ ^ Dry ► - ^ Juncus ► - ^ -Grassland
• Haymeadow habitats · - ^ · -^—Phalaris-
Station 2 Station 1
\ ν > · ν ^
Esker sands \ ^ and gravels . >.
; ■
Peat
_1^^L À
¿^^^'.V. AUi/tfjjiïrrrrrrr 1
1
iiLiii[jììTrrì
Cambisols
< ► < - -►*<- ■ Fluvisols ■
(b)SHANNON SITES Little Brosna (Unimpacted by Sedimentation)
Moderate Seepage ■ ^ Slope - ^ Zone ► - ^ - ■ Floodplain -
- ^ Dry ► · ^ Juncus > - ^ ~ G rassland
- Haymeadow habitals ■
Esker sands and gravels
Cambisols
-><<-
-1.000 m -
Figure 2.6 Schematic cross-scclions of lhe Irish study sites: (a) Clonmacnoise; (b) Little Brosna.
- 42 -
Clonmacnoise Key to hydrogeomorphic map
*" *— Hydrogeomorphic boundaries
■ 1 Monitoring stations
. . . . Field boundaries
^ - Direction of river flow
~ ~ ~ Roads / tracks
Hydrogeomorph
FP
D
E
Dw
Sb
Sc
c Units
Floodplain
Depression on floodplain
Elevation on floodplain
Depression with water {ditches)
Slope 2 · 5°
Slope 5-15°
N
A
0
Key to hydrogeomorphic map
Hydrogeomorphic boundaries
■ 1 Monitoring stations
Field boundaries
^ " Direction of river flow
" " - Roads / tracks
Hydrogeomorphic Units
FP Floodplain
D Depression on floodplain
Ow Depression wilh water (ditches)
Sb Slope 2 - 5°
Figure 2.7 Hydrogeomorphic unit maps of the Irish study sites: (a) Clonmacnoise; (b) Little Brosna.
- 43

The esker slopes were not included in the vegetational transects at Little Brosna. The gentle slope at the north of the site is characterised by Cynosurus cristatus and Luzula campestris. indicating a non-flooded, well drained area. The floodplain below to the south slopes very gently and reflects a gradation from well lo poorly drained conditions. The drier conditions arc indicated by Agrostis capillaris, Anthoxanthum odoratimi and Holcus lanatus. and the more oligotrophic conditions arc indicated by the increase of Briza media, Galium uliginosum, Luzula campestris. Polenlilla erecta. Carex pulicaris and the decrease of Festuca pratensis. A depressional area in the lower callow corresponds to more humid conditions indicated by the abundance of Caltha palustris, Eleocharis palustris. Eiptisetum palustre. Phalaris arundinacea, Senecio aquatints and Triglochin palustris. This depressional area grades lo the south into a levee, where the vegetation reflects drier conditions and is also characterized by both a higher nutrient level and greater biodiversity than the rest of lhe transect. Species characterising this area include Bromus commutants, Carex hirta, Cerastium fontanili», Dactylorhìza incarnata, Holcus lanatus and Junius articúlalas.
The soil and vegetation information for both the Shannon study sites is summarised in a schematic cross-section in Fig. 2.6a and 2.6b. The different hydrogeomorphic units identified at the sites are shown in Fig. 2.7a and 2.7b. The units delineated reflect the differences in geomorphology, topography, vegetation and soil described above. Delineation was based on field reconnaissance work combined with available soil and vegetation information.
The main current and future threats to the callows' bird and plani communities are major drainage works on the river, continuing land drainage for agricultural improvement, peat silt deposition from neighbouring bog exploitation, water pollution and direct human disturbance.
2.3.2 Torridge
The Torridge subsites are close to the headwaters of a system which is relatively small compared with the other major rivers of this study (Fig. 2.8). The floodplain is confined to a widlh of less than 100m. (he greater part of the river marginal wetland occurring on adjacent footslopes. The catchment of the River Torridge lies in north-west Devon, a county occupying a central position in the peninsula of South West England. The headwaters are located close to the Atlantic coast with drainage in a south-easterly direction for about 30km before the river turns northwards near Halherleigh to Mow a further 25km in a series of deeply increased meanders to enter the Torridge Estuary at Bide f ord. The total area of the catchment is 857km:. The upper Torridge drainage network is established on a Pleistocene planation surface now represented by a gently undulating plain with convex ridges at 120-180m O.D., separated by broad basins with moderale slopes confined lo valley sides. It is predominantly a pastoral area of dairy farming with scattered farms, hamlets and villages and serviced by small market towns.
Most of the upper Torridge catchment is in grassland use because of the limitations of moderately high rainfall, frequently coupled with the presence of soils of low permeability. Some forestry has been established on peaty topped clayey soils at the catchment head and in subcatchmcnls south of the Torridge corridor between Holsworthy and Okehampton. The area has a long history of livestock farming which in recent years has seen intensification of dairying cnlerprises. This has involved considerable expenditure on farm infrastructure, enlargement of herds, land drainage work and increased use of nitrogen fertiliser.
The Kismeldon site lies only 7 km from the sea at 125-170m above sea level wilh average annual rainfall of around 1200 mm. Relative humidity is usually in excess of 80 per ceni. In a bioclimatic classification (Bendelow and Harlnup, 1980), the upper Torridge catchment is termed cuoceanic, slightly cool (accumulated day-degrees above 5.6°C 1650-1925), exposed (approximate annual average windspced 4.8-6.6ms ' ) and moderately moisl. The mild wet conditions are typical of western Britain. The strong maritime influence restricts the seasonal range of temperature, giving mild winters, cool summers and a long growing season averaging 284 days.
Long term meteorological data (1941-70) taken from Mclbury Reservoir (SS387202) indicates mean annual rainfall for the area of 1353mm with local variations depending upon altitude and distance from the coast. Melbury Reservoir lies some 4km north casi of Kismeldon and has rainfall very similar to the study site (below). It is 10km north of Bradford Mill, where rainfall is likely to be slightly lower. Rainfall data from Highamplon (SS499048), 7km south east of Bradford Mill has long term mean annual rainfall of 1 133mm. Long lerm average rainfall has a strongly seasonal paliem wilh 577mm (42.6 percent of lhe
44
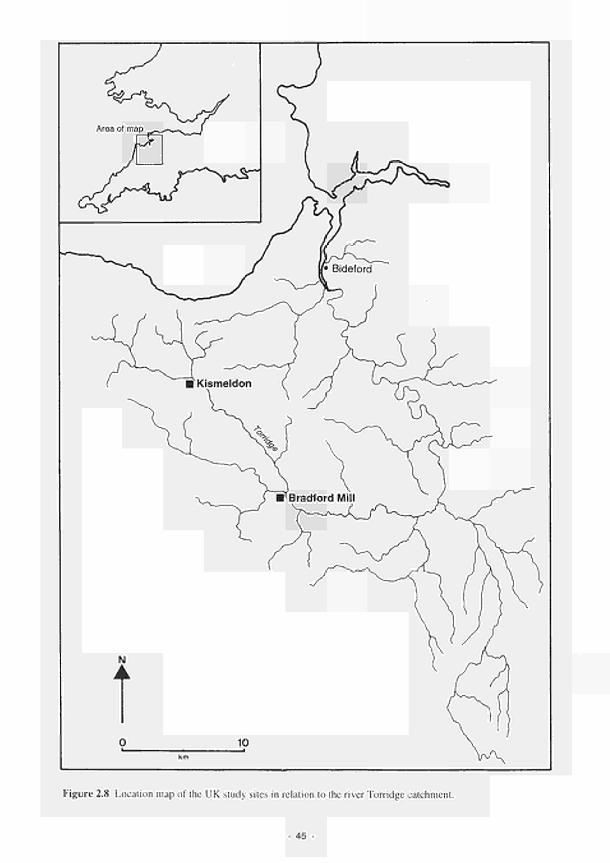
Figure 2.8 Location map of the UK study sites in relation to the river Torridge catchment.
45
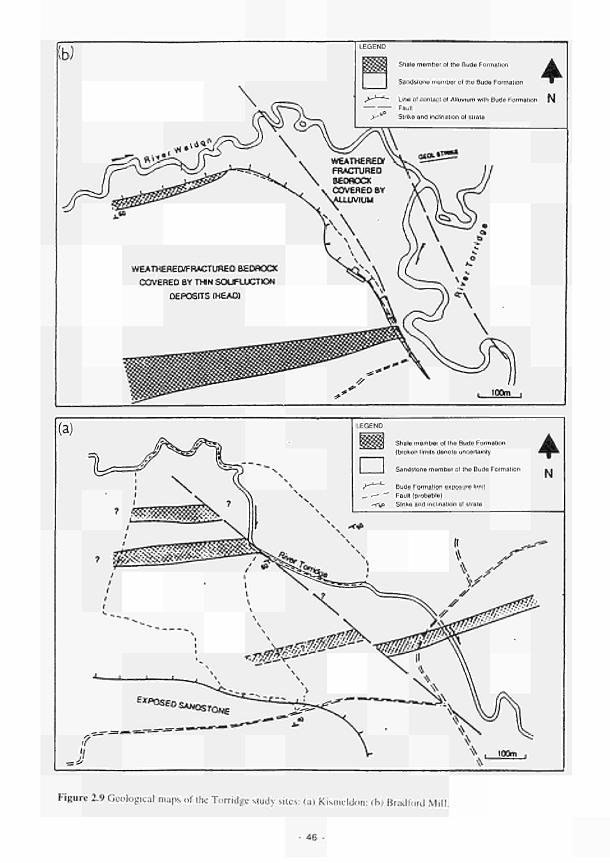
ìtì
\
Stiate member ot the Bude Formation ^ k
Sandstone member ot the Bude Formalion W^
Line of contact of Alluvium with Bude Formation N
Fault
Strike and inclination of strata
(a) Shale member ot the Bude Formation
(broken limits denole uncertainty
Sandstone member of the Bude Formation
" Bude Formation exposure limit
. ■— "" Fautt (probable)
-rV> Strike and inclination ol strata
N
* /
— \
Figure 2.9 Geological maps of the Torridge study sites: (a) Kismeldon; (h) Bradford Mill.
46 -

\ì)
-^ o>
Dystric cambisols (well drained), in river alluvium
Fluvisols (poorly drained), in river alluvium
! 1111 Dystric gleysols (poorly drained), on footslopes
; ; ; ; ; Histosols (poorly drained peat)
Field boundary
Boundaries between soil units
River
5 Location of stations
o Oxbow <-
Figure 2.10 Soil maps of the Torridge study sites: (a) Kismeldon; (b) Bradford Mill.
- 47 -
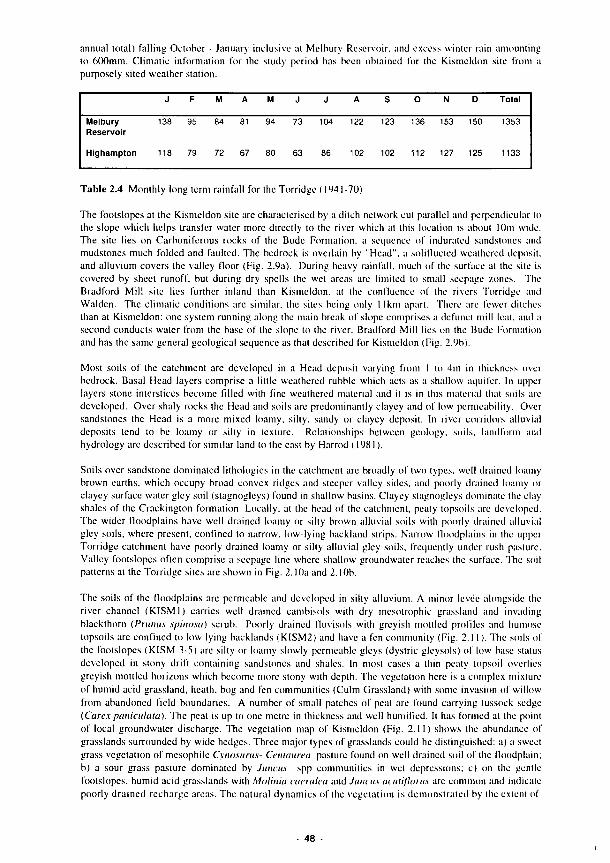
annual total) falling October - January inclusive at Melbury Reservoir, and excess winter rain amounting to 600mm. Climatic information for the study period has been obtained for the Kismeldon site from a purposely sited weather station.
Melbury Reservoir
Highampton
J
138
118
F
95
79
M
84
72
A
81
67
M
94
80
J
73
63
J
104
8 fi
A
122
102
S
123
102
0
136
112
N
153
127
D
150
12S
Total
1353
1133
Table 2.4 Monthly long term rainfall for the Torridge ( 1941-70)
The foolslopes at the Kismeldon site are characterised by a ditch network cut parallel and perpendicular lo the slope which helps transfer water more directly to the river which at this location is about 10m wide. The site lies on Carboniferous rocks of the Bude Formation, a sequence of indurated sandstones and mudstones much folded and faulted. The bedrock is overlain by "Head", a soliflucted weathered deposit, and alluvium covers the valley floor (Fig. 2.9a). During heavy rainfall, much of the surface at the site is covered by sheet runoff, but during dry spells the wet areas arc limited lo small seepage /.ones. The Bradford Mill site lies further inland than Kismeldon. at the confluence of the rivers Torridge and Walden. The climatic conditions are similar, the sites being only 1 lkm apart. There arc fewer ditches than at Kismeldon: one system running along the main break of slope comprises a defunct mill leal, and a second conducts water from the base of the slope to the river. Bradford Mill lies on the Bude Formation and has the same general geological sequence as that described for Kismeldon (Fig. 2.9b).
Most soils of the catchment are developed in a Head deposit varying from I lo 4m in thickness over bedrock. Basal Head layers comprise a little wealhcrcd rubble which acts as a shallow aquifer. In upper layers stone interstices become filled with fine weathered material and it is in this material that soils arc developed. Over shaly rocks the Head and soils arc predominantly clayey and of low permeability. Over sandstones the Head is a more mixed loamy, silly, sandy or clayey deposil. In river corridors alluvial deposits lend to be loamy or silty in lexturc. Relationships between geology, soils, landform and hydrology arc described for similar land to the casi by Harrod (1981).
Soils over sandstone dominated lithologies in the catchment are broadly of two lypes. well drained loamy brown earths, which occupy broad convex ridges and steeper valley sides, and poorly drained loamy or clayey surface water gley soil (stagnoglcys) found in shallow basins. Clayey stagnogleys dominate the clay shales of the Crackington formation. Locally, at the head of the catchment, peaty topsoils arc developed. The wider floodplains have well drained loamy or silly brown alluvial soils wilh poorly drained alluvial gley soils, where present, confined to narrow, low-lying backland strips. Narrow floodplains in the upper Torridge catchment have poorly drained loamy or silly alluvial gley soils, frequently under rush pasture. Valley footslopcs often comprise a seepage line where shallow groundwater reaches the surface. The soil patterns at the Torridge sites arc shown in Fig. 2.10a and 2.10b.
The soils of the floodplains are permeable and developed in silty alluvium. A minor levée alongside the river channel (KISM1) carries well drained cambisols with dry mesotrophic grassland and invading blackthorn (Prunus spinosa) scrub. Poorly drained fluvisols with greyish mottled profiles and humóse topsoils arc confined to low lying backlands (KISM2) and have a fen community (Fig. 2.1 I). The soils of the footslopcs (KISM 3-5) are silty or loamy slowly permeable gleys (dystric glcysols) of low base status developed in stony drift containing sandstones and shales. In most cases a thin peaty lopsoil overlies greyish mottled horizons which become more stony wilh depth. The vegetation here is a complex mixture of humid acid grassland, heath, bog and fen communities (Culm Grassland) with some invasion of willow from abandoned field boundaries. A number of small patches of peat are found carrying tussock sedge (Carex paniculata). The peal is up lo one metre in thickness and well humified. Il has formed ai lhe point of local groundwater discharge. The vegetation map of Kismeldon (Fig. 2.11 ) shows the abundance of grasslands surrounded by wide hedges. Three major lypes of grasslands could be distinguished: a) a sweet grass vegetation of mesophile Cynosurus- Centaurea pasture found on well drained soil of the floodplain; b) a sour grass pasture dominated by Junius spp communities in wcl depressions; c) on the genlle foolslopes. humid acid grasslands with Malinia caerulea and Junius aculiflorus arc common and indicate poorly drained recharge areas. The natural dynamics of the vegetation is demonstrated by the extent of
48

SMÌ
Ξ
m
□
LU
m El [HD
m m Esa
Legend
Heath rush meadow and humid matgrass sward
Subcommunity with megaphorbes
Acid purple moorgrass meadow
Neglected purple moorgrass meadow
Subcommunity with sharpflowered rush dominant
Great tussock sedge hummocks
Meadowsweet stands and tall herb fen
Marsh ragwort meadow and flooded lall herb
Tall rush pasture
Mesophile Cynosurus ■ Centaurea pastures
Subcommunity wilh sharp flowered rush
Ryegrass pasture
Mesophile deciduous thicket ami brush
Humid grey willow scrub
Mesophile woodland (Oak and beech dominant)
Mesohygrophile woodland (Oak and Holcus mollis)
Flooded woodland (Alder dominant)
Subcommunity less Hooded
Hygrophile rich woodland (Ash and Beech dominant)
Figure 2.11 Vegetation maps of the Torridge study sites: (a) Kismeldon; (b) Bradford Mi'
49

(a) Kismeldon Meadows
Hydrogeomorphic Unit
, Moderate ι | Slope 1 I Improved 1
Grassland
Gentle Slope Unit
Gentle Slope
- Wet Heath -
S = Soil A = Alluvium and Head WZ = Heavily Weathered Rock FB = Fractured Rock
— 400m
Floodplain Unit Floodplain Unit
I I ' ι Floodplain 1
Humid — 1 | — Dry — | Grassland Grassland
1 -5 = Instrumented Siles _ ^ ~ = Groundwater Flow
(b) Bradford Mill Gentle Slope Unit Floodplain Unit Hydrogoomorpliic
Unit
- Steep Slope-
I H I Woodland -
Gentle Foolslope
Humid Grassland
Seepage area 1
S = Soil A = Alluvium and Head WZ = Heavily Weathered Rock FB = Fractured Rock
200m
— Floodplain — |
_ Dry ι Grassland
1-3= Instrumented Sites _ ► = Groundwater Flow
Piezometric 2 Surface «
1 o
Gleysols (Well drained, loamy) {Poorly drained, silty)
\ |—Fluvisols — | (Well drained, silty)
Figure 2.12 Schematic cross-sections of the Torridge study sites: (a) Kismeldon; (b) Bradford Mill.
50 -
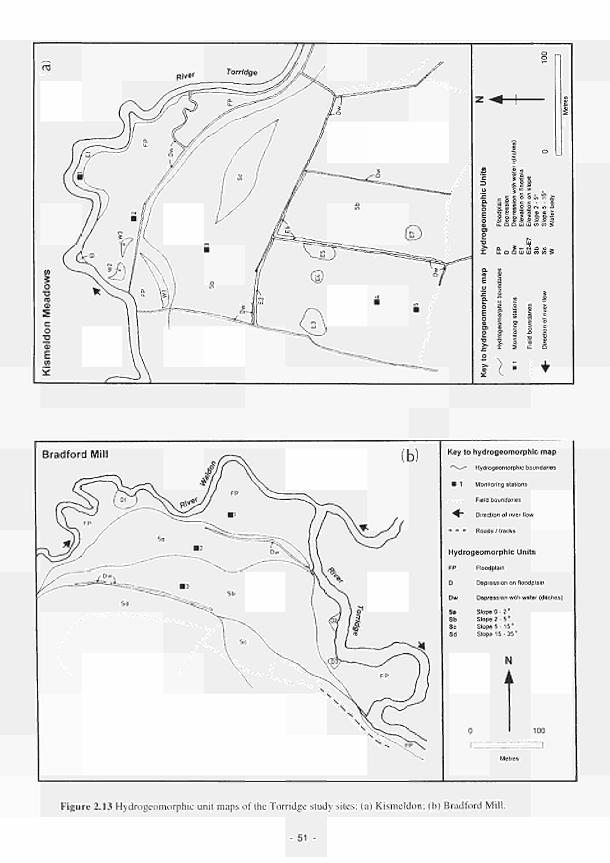
Π3
¡η
5 ο ■α ra Ο)
c ο
ω Ε (Λ
5
¡α
3
Γ
& Ο
F ο
χ
* π
Iff c ¿ n g ^ >
od
pla
ir
iressio
iressio
vatio
n
vatio
n
pe
2
pe
5
terb
oc
o m υ ^ u o o η I L Û Û U I U J W W S
Ψ 0. ϊ ι - r ü í u j , U.OOUJUJlO(0>
Key to hydrogeomorphic map
*"N_*- Hydrogeomoφhic boundaries
■ 1 Monitoring stations
. . . . Field boundaries
^ ~ Direction ot river flow
- " ■ Roads /tracks
Hydrogeomorphic Units
FP Floodplain
D Depression on floodplain
Dw Depression with water (ditches)
Slope 0 · 2 ° Slope 2- 5° Slope 5-15° Slope 15-35°
100
""""I
Figure 2.13 Hydrogeomorphic unit maps of the Torridge study sites: (a) Kismeldon; (b) Bradford Mill.
- 51 -
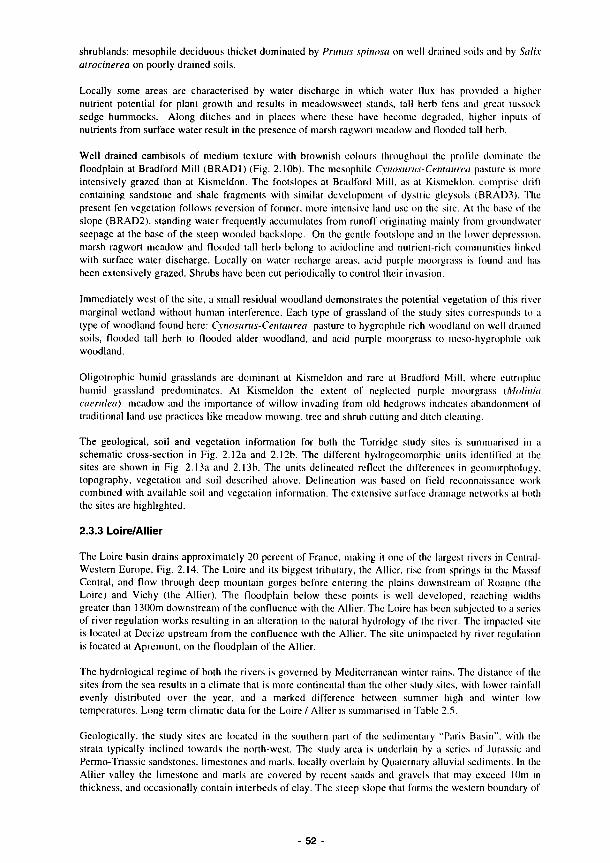
shrublands: mesophile deciduous thicket dominated by Prunus spinosa on well drained soils and hy Salix atrocinerea on poorly drained soils.
Locally some areas are characterised by water discharge in which water flux has provided a higher nutrient potential for plant growth and results in meadowsweet stands, tall herb fens and great tussock sedge hummocks. Along ditches and in places where these have become degraded, higher inputs of nutrients from surface water result in the presence of marsh ragwort meadow and Hooded tall herb.
Well drained cambisols of medium texture with brownish colours throughout the profile dominate the floodplain at Bradford Mill (BRADI) (Fig. 2.10b). The mesophile Cynosurus-Centaurea pasture is more intensively grazed than at Kismeldon. The footslopes at Bradford Mill, as at Kismeldon, comprise drift containing sandstone and shale fragments wilh similar development of dyslric gleysols (BRAD3). The present fen vegetation follows reversion of former, more intensive land use on the site. At the base of lhe slope (BRAD2), standing waler frequently accumulates from runoff originating mainly from groundwater seepage at the base of the steep wooded backslope. On the gentle footslope and in the lower depression, marsh ragwort meadow and flooded lall herb belong to acidocline and nutrient-rich communities linked with surface water discharge. Locally on water recharge areas, acid purple moorgrass is found and has been extensively grazed. Shrubs have been cut periodically to control their invasion.
Immediately west of the site, a small residual woodland demonstrates the potential vegetation of this river marginal wetland without human interference. Each type of grassland of the study sites corresponds to a type of woodland found here: Cynosurus-Centaurea pasture to hygrophile rich woodland on well drained soils, flooded tall herb to flooded alder woodland, and acid purple moorgrass to meso-hygrophile oak woodland.
Oligotrophic humid grasslands arc dominant at Kismeldon and rare at Bradford Mill, where eutrophic humid grassland predominates. At Kismeldon the extent of neglected purple moorgrass (Molinia caerulea) meadow and the importance of willow invading from old hedgrows indicates abandonment of traditional land use practices like meadow mowing, tree and shrub cutting and ditch cleaning.
The geological, soil and vegetation information for both the Torridge sludy sites is summarised in a schematic cross-section in Fig. 2.12a and 2 12b. The different hydrogeomorphic units identified at the sites are shown in Fig. 2.13a and 2.13b. The units delineated reflect the differences in geomorphology, topography, vegetation and soil described above. Delineation was based on Held reconnaissance work combined with available soil and vegetation information. The extensive surface drainage networks at both the sites are highlighted.
2.3.3 Loire/Allier
The Loire basin drains approximately 20 percent of France, making it one of the largest rivers in Central-Western Europe, Fig. 2.14. The Loire and its biggest tributary, lhe Allier, rise from springs in the Massif Central, and flow through deep mountain gorges before entering the plains downstream of Roanne (the Loire) and Vichy (the Allier). The floodplain below these points is well developed, reaching widths greater than 1300m downstream of the confluence with the Allier. The Loire has been subjected lo a series of river regulation works resulting in an alteration to the natural hydrology of the river. The impacted site is located at Decize upstream from the confluence with the Allier. The site unimpacted by river regulation is located at Apremont, on the floodplain of the Allier.
The hydrological regime of both the rivers is governed by Mediterranean winter rains. The distance of the sites from the sea results in a climate that is more continental than the other study siles, wilh lower rainfall evenly distributed over the year, and a marked difference between summer high and winter low temperatures. Long term climatic data for the Loire / Allier is summarised in Tabic 2.5.
Geologically, the study siles are located in the southern part of the sedimenlary "Paris Basin", wilh the strata typically inclined towards the north-west. The sludy area is underlain by a series of Jurassic and Permo-Triassic sandstones, limestones and marls, locally overlain by Quaternary alluvial sediments. In the Allier valley lhe limeslone and marls arc covered by recent sands and gravels thai may exceed I (Im in thickness, and occasionally contain ¡nterbeds of clay. The steep slope thai forms the western boundary of
- 52
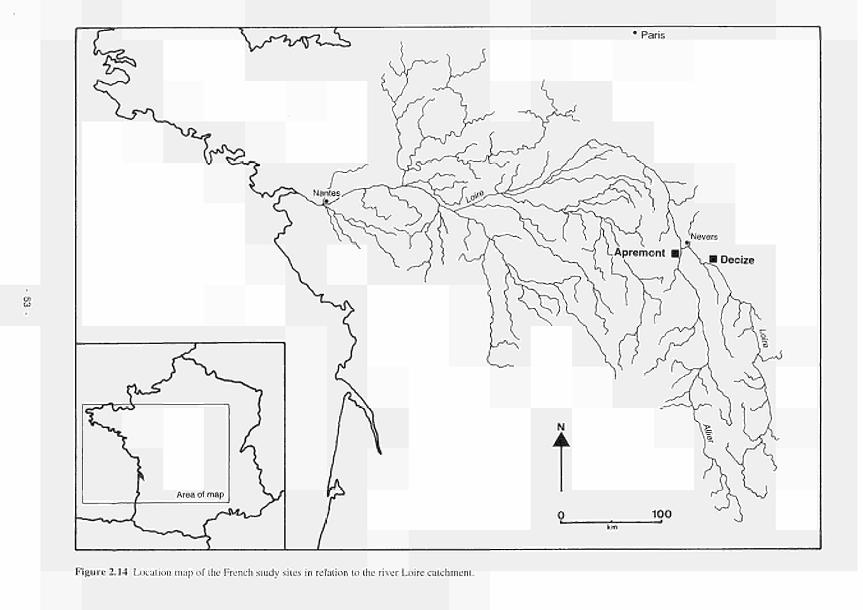
Figure 2.14 Location map of the French study sites in relation to the river Loire catchment.

the Apremont site is composed of Jurassic limestones. Miocene sandstones arc found on the west bank of the Loire at Decize.
Mean daily temp. C (1946-1993) Max. Min Mean
Mean monthly rainfall mm (1946-1993)
Mean days of frost
Mean dally solar radiation (hrs) (1952-1993)
Relative humidity % (1958-1991)
J
6.1 -0.4
2.8
64
16
60
71
F
8.0 -0.1
3.9
59
14
90
69
M
11.9 1.7 6.8
59
12
•44
64
A
15.1 3.8 9.4
52
5
181
61
M
18.7 7.4
13.1
85
1
212
63
J
22.0 10.5 16.2
68
0
229
63
J
24.8 12.1 18.5
53
0
262
61
A
243 118 180
68
0
238
63
S
21.5 9.4
15 5
69
12
193
66
0
16.1 6.1
111
67
4
132
70
N
10.0 2.6 6.3
67
9
74
71
D
6.8 0.5 3.7
70
14
59
71
Yr.
15.4 5.4
10.4
782
75
66
Station: Nevers Altitude: 174 m Table 2.5. Long term climatic data for the Loire
The floodplain at Apremont is characterised by a swale and ridge topography, reflecting an original pool and riffle system in a meandering stream, of insufficient discharge to transport the coarse materials found in its channel and banks. Shallow depressions (swales) along lhe river margins and on the floodplain exhibit a degree of continuity with each other, indicating a fluvial origin. A number of the depressions arc deeper and more circular in plan, suggesting a combined fluvial and karstic origin. These sinkholes or dolines may form on a covering of debris or alluvial sediment if limestones lie underneath, as is the case with the Jurassic limestones at Apremont.
The topography of the subsite at Decize is more uneven than that at Apremont, and lhe microrelief is much more undulating. A large depression on the floodplain in which DECZ4 is located is likely lo have been man-made since the flooding regimes would not produce the Iraclive forces required to deepen such a hollow. This major depression has an outlet downstream to the river, which, during floods, allows water to enter unnaturally upstream.
The soil parent material is silty river alluvium, in which lhe groundwater table has remained sufficiently high to lead to the development of hydromorphic soils (fluvisols) on the lower lying parts. These include the most active part of the floodplain alongside the river channel (APREI), where the deposition of silty sediment has been recorded on a number of occasions during the period of lhe sludy. The soil profile is greyish and mottled throughout and of medium texture overlying a coarse, stony substrate found within lm depth. The vegetation is of patchy Phalaris under Salix scrub. At a slightly higher level (APRE2) similar, though deeper, mottled soils are found under Salix forest with a field layer of stinging nettle (Urtica dioica). The highest level of the floodplain is under permanent pasture used for cattle grazing (APRE3). The soils are well drained loamy dystric cambisols characterised by brownish colours throughout and medium texture within the top 50cm, becoming coarser below. A number of depressions marking the position of old channels (APRE4) contain gley soils and hydrophytic vegetation. An oxbow lake occupies the back of the floodplain at the base of a steep backslope. Observations here have indicated that that there is little fluctuation in the water levelof the lake in contrast to variations measured in lhe depth of groundwater and the river channel, suggesting either some additional source of water to the lake, the bottom of the lake having become scaled (naturally or artificially) or some combination of the two explanations. The Loire Valley contains coarser textured alluvium than that of the Allier, though a similar arrangement of physiographic features occurs. A frequently flooded Phalaris zone bordering lhe main channel (DECZI) carries poorly drained fluvisols. The soil profiles are greyish and mottled throughout and of medium texture overlying coarse material below 60cm depth. Well drained cambisols occupy a higher bench-like feature (DECZ2) which is only intermittently flooded (once during the study period). Upper parts of the soil profile are brownish in colour and are developed in alternating fine and coarse
54 -
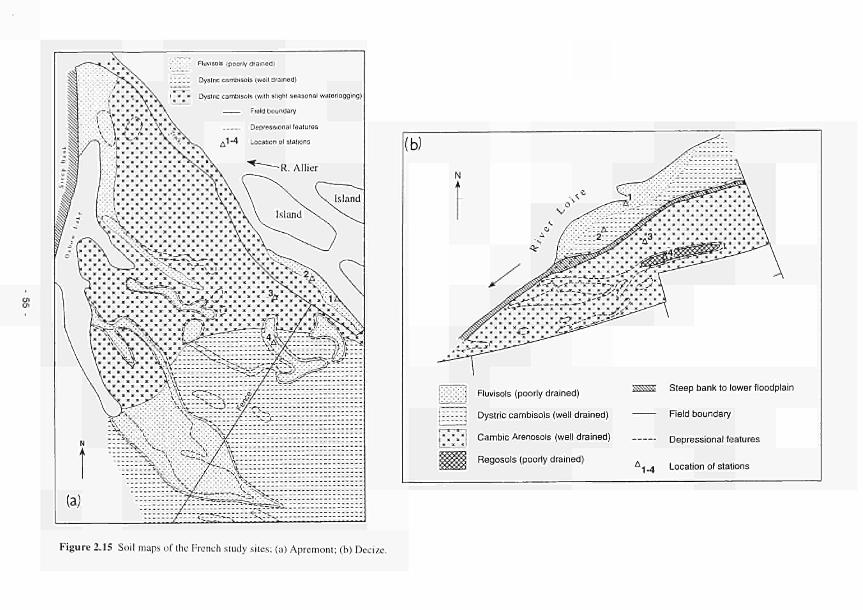
.;.;.;. Fluvisols (poorly drained)
11 " Dystnc cambisols (well drained)
» * Dystnc cambisols (with slight seasonal waterlogging)
Field boundary
Depressional teatures
^ 1 - 4 Location of stations
R. Allier
Island
(b)
Fluvisols (poorly drained)
\ i
nana Steep bank to lower floodplain
j Dystnc cambisols (well drained) Field boundary
Depressional features Cambie Arenosols (well drained)
Regosols (poorly drained) ^ _4 Location of stations
Figure 2.15 Soil maps of the French sludy sites; (a) Apremont; (b) Decize.
|g^¡
[ m
m fw^mü
[WUUVVj
ÜI I
m pei
■i 1 1
tø;*H
NN
1 1
Legend
Main (iver channel
Talus between lit minor ht
Sandbank or mudbank locally
Standing water in sand quarry
Permanent water with aquatic
White willow gallery forest
majeur
plants
Blackthorn bramble scrub thickels and hedges
Dry false acacia scrub
Large sedge communities
Reed beds
Semidry grassland
Dry siliceous communities
Lowland derelict hay meadow
Mesic flood swards
Man made areas and cultivatec fields
Figure 2.16 Vegetation maps of the French study sites; (a) Apremont; (b) Decize. 56

textured bands in which earthworm burrows are prominent. Gleying is confined to below 80cm depth. The vegetation is riparian Salix forest with Urtica. The highest level of the valley floor (DECZ3) is under permanent pasture and gives no indication of having been flooded in recent years. The soils are well drained, very permeable and coarse textured (arenosols). The large depression within the field contains greyish mottled very shallow soils over sand (DECZ4). It is frequently flooded by standing water (groundwater) and carries hydromorphic vegetation. The soils at the sites arc summarised in the maps in Fig. 2.15a and 2.15b.
The vegetation within river marginal wetlands of large French rivers such as the Loire and the Allier is usually identified as one of two major complexes termed lit mineur and /// majeur.
Lit mineur is the lower part of the river valley including the river channels, islands and lateral elevations. All //'/ mineur areas arc submerged each year, mainly during winter and spring. Annual plants can invade sandbanks and mudbanks during summer if waler levels are low. On higher islands and lateral elevation perennial plants can grow, mainly as willow scrub and softwood forest. No direct human impact affects this vegetation.
Deposition of silt and clay has given rise to substrata and soils which are nutrient-rich.. Under the riparian willow formation, two main vegetation types can be distinguished according to mesotopography. On slight elevations, humid tall herb fringes (Glechometalia hederaceae) are dominated by Urtica dioica and Galium aparine; in wet depressions, rich reed canary-grass beds are dominated by Phalaris arundinacea, associated with Urtica dioica, Solanum dulcamara and many other nutrient-rich species. The vegetation of the Loire/Aller sites is shown in Fig. 2.16a and 2.16b.
Between lit mineur and //'/ majeur a steeply sloping "talus" separates these two major hydrogeomorphic units. The lit majeur area, at higher elevation, is sometimes flooded for a short period, but with no seasonality; the last major flood on the Allier took place in mid June 1992. Human impact, past and present, is, after hydrology, the main ecological factor explaining vegetation formation. Alluvial forest is absent, except for little fragments. Patches of scrub are linked by hedges and neglected land. The main pan of the area is occupied by sweetgrass pastures on well drained soils. These grasslands are managed for cattle or sheep grazing through the year and are sometimes mowed in late spring. At Decize, sandy soils support semi-dry grasslands and lowland hay-meadows. At Apremont, the pasture corresponds to mesic flood swards because of greater silt content in the soil and consequent higher soil water retention capacity.
In depressions, where surface water is retained until May or June, sedges and reed canary grass are the dominant species. Grazing is often extensive in sourgrass pasture and is noi a target ecological factor except at Decize where only opportunistic species arc found, like Alopecurus geniculatus and Glyceria fluitans, associated with annual plants or weeds on soil poached by cattle.
At Apremont, the oxbow is characterised by eutrophic fresh water and many hydrophytes including Myriophyllum spicatum, Potamogetón crispus, and P. nodosus. Between the oxbow and the road, reed canary-grass beds indicate the vegetation potential in the absence of disturbance factors such as grazing or mowing.
On the lit mineur, there are no clear differences between the sites on the Loire and the Allier in terms of their vegetation. In lit majeur, differences arc found in terms of the vegetation between the pastures and depressions, even though groups of species are common to these two habitats. Soil characteristics determining drainage may be the main determinant ecological factors which explain these differences.
The geological, soil and vegetation information for the Loirc/Allicr sludy sites is summarised in schematic cross-sections, Fig. 2.17a, 2.17b. The different hydrogeomorphic units identified al the sites arc shown in Fig. 2.18a, 2.18b. The units delineated reflect the lluvial influences on the geomorphology and microrelief, combined wilh information gained from the vegetation and soil. The linear fluvially-dctermined depressions and lhe more circular karstic features at Apremont are clearly defined. The deep man-made depression at Decize is also clearly identified by hydrogeomorphic mapping.
57

LOIRE SITES (a) Apremont (Unimpacted by River Regulation)
^ Steep w ^ _ ^ Backslope ~—
- Floodplain -Island
< >
■ ^ O x - ^ - ^ Semi-dry grassland -
Bow Lake Salix Salix Urtica Phalaris
Station 4 Station 3 Station 2 Station 1
Cambisols
< ><- ■ Fluvisols -
- 300 m —
LOIRE SITES (b) Decize (Impacted by River Regulation)
- Floodplain -
■^ Carex ► ^ Semi-dry grassland ^ - ^ Salix Forest ^ " ^ Phalaris ^
(Depression, Artificial feature ?)
Backland Station 2 Channel
— ^ - ^ Cambisols ^ - ^ Fluvisols ^ >
-150 m ►
Figure 2.17 Schematic cross-sections of the French study sites; (a) Apremont; (b) Decize.
58
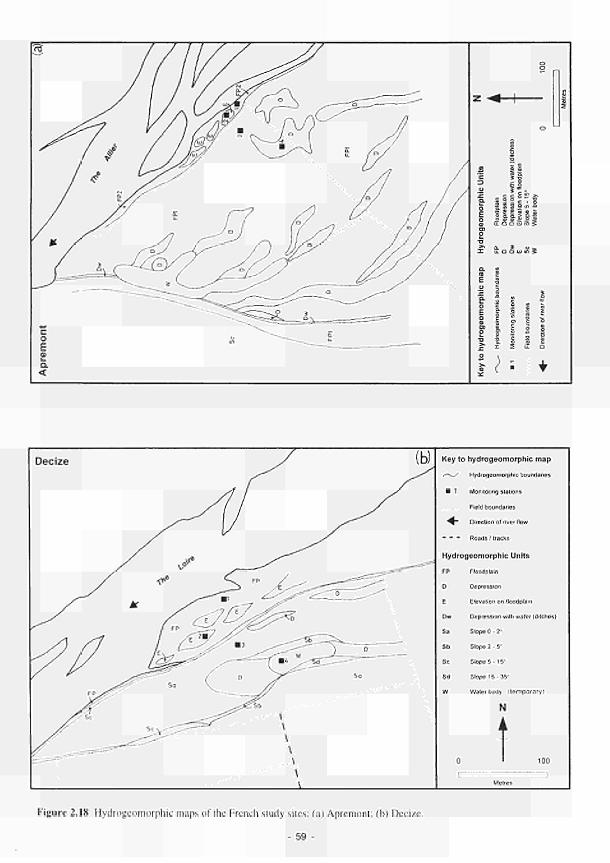
Key to hydrogeomorphic map
s~^S Hydrogeomorphic boundaries
■ 1 Monitoring stations
. . Field boundaries
^ " Direction of river flow
Roads /tracks
Hydrogeomorphic Units
FP Floodplain
D Depression
E Elevation on floodplain
Dw Depression wilh water (ditches)
Slope 0 - 2°
Slope 2 - 5°
Slope 5 -15"
Slope 15 - 35°
Water body (temporary)
N
Sa
Sd
t 100
Figure 2.18 Hydrogeomorphic maps of the French study sites; (a) Apremont; (b) Decize.
- 59 -
2.3.4 Guadiana
The Cigüela river rises from springs near Puerto de Cabrejas (1,150m above sea level) and joins the Zancara a few kilometers downstream of Las Tablas de Daimiel National Park (LTDNP). The Guadiana, from its confluence with the Zancara in La Mancha, flows west-south-west to its mouth in the Atlantic on the Spain-Portugal border. The study sites of El Masegar and Molino del Abogado are located near the confluence of the Cigiicla and the Riansares upstream from the Zancara, Fig. 2.19.
The regional climate of La Mancha exhibits high diurnal and seasonal thermal fluctuations. The mean annual temperature is I4"C and lhe range of temperature is between -I2"C and 45°C. The annual mean rainfall is 400-500mm. with maxima in spring and autumn. The potential évapotranspiration ranges from 800 to 900mm yr"1, and the evaporation rate of a free water body varies between 1,100-1,400 mm yr' , with a summer maximum. The climate of this region is classified as mediterranean with a moderate continental tendency to be extreme, semi-arid, with long summers and winters and short springs and autumns.
The region is of low amplitude relief, wilh modest hills between 650m and 800m. The higher elevation of upper La Mancha is detached from the sludy areas by the Montes de Toledo ridge to the west and the Sierra de Altomira to the east. The low relief of the region has produced low drainage density. The landforms of the region have been classified genetically, based on the major controls on their evolution and development into: 1) fluvial landforms; 2) structurally controlled landforms. Fluvial landforms include wetlands, the river channel and floodplain, levees and oxbow lakes. The most important structural landform is the fault scarp south west of the study sile of El Masegar. The various landforms presen! arc shown on the geomorphological map. Fig. 2.20.
The sediments of La Mancha arc of continental origin. The lithologics are dominated by marls, clays and limestones. The oldest rocks, forming the highest relief, arc Palaeozoic quartziles and shales. Mcsozoic sediments are represented by Triassic marls, gypsums and cvaporite sequences. The presence of evaporiles can strongly inflence the chemistry of the groundwater. Tertiary sediments present arc-principally marls and clays, with some locally important gypsums and limestones. Quaternary sediments comprise alluvial deposits and debris slope materials. The major La Mancha aquifer is composed mainly of karstic Tertiary limestones. In the upper Cigiicla area ihrcc main aquifer units can be identified: 1) Triassic sandstones; 2) Tertiary marls and gypsiferous sediments; and 3) Tertiary limestones.
Natural recharge of the groundwaters is mainly from infiltration of rainfall below the root zone. Estímales of average recharge vary between 10 and 50 mm yr'1, amounting to approximately 10 percent of rainfall.
The lluvial regime is characterised by a regular hydrograph, wilh peak discharges occurring in March (approximately 10m s" ) and a great reduction in flow in summer. Mean annual discharge can reach 2.016 m s" at Villafranca de los Caballeros, the nearest gauging station close to (he confluence wilh the Guadiana.
According to Florin et al. (1993). in the Cigiicla and Zancara watershed thirty years ago, 83 lagunas (lakes) existed, covering a lotal of 29km2, including the wetlands in lhe LTDNP and its vicinity which covered an even greater surface area. Human activities such as arterial or surface drainage, waler pollution by industrial and urban waste and. in some cases, natural infilling, have caused the degradation or disappearance of up to 60 percent of those wetlands. The La Mancha wetlands are frequently referred to as "La Mancha Húmeda" and they were included in the Spanish Ramsar list in 1981. These wetlands were also declared a Biosphere Reserve within lhe MAB Program of UNESCO in 1981.
Over the centuries these wetlands were considered wastelands and different projects were designed lo convert them into arable land. All of these projects were unsuccessful until the 1960s. During that decade the Ministry of Agriculture funded a project to carry out arterial or surface drainage of the floodplains of the main streams. Many stream stretches had already been "reclaimed" at the beginning of the 1970s by the time conservation groups succeeded in halting the agricultural improvement project. The main weiland zone. "Las Tablas dc Daimiel", was subsequently declared a National Park, resulting in lhe infilling of some of the drainage ditches.
60

Madrid
Molino del Abogado
Figure 2.19 Location map of the Spanish sludy sites in relation to the river Guadiana catchment..
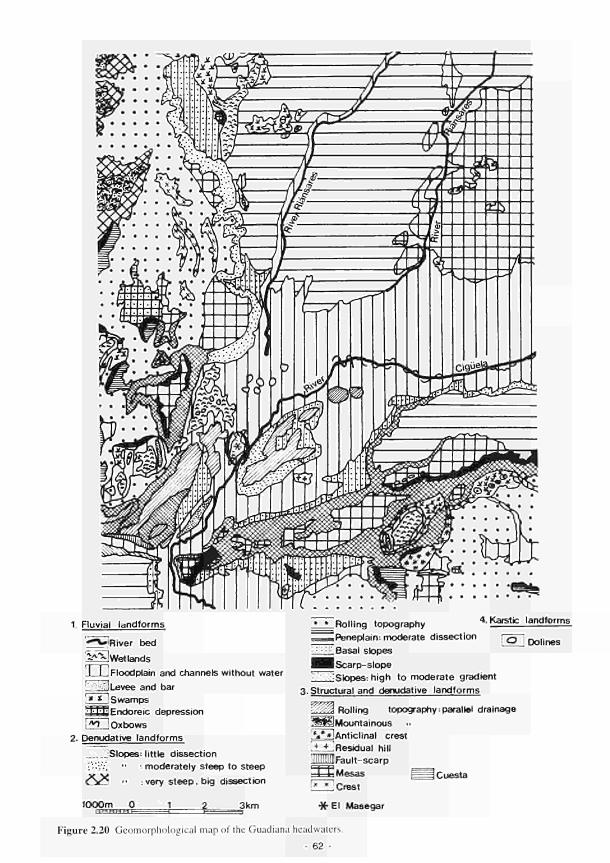
1. Fluvial landforms
^»iRiver bed
|¿5]Wet lands
_L_U Floodplain and channels without water
ιίϊΜ Levee and bar '» * ! Swamps iLUjEndoreic depression ¡"O ! Oxbows
2. Denudative landforms
^2._jSlopes: little dissection
Ï'-'ÏL. " '· moderately steep to steep
c S i ^ ·· : very steep, big dissection
1000m 0 -i Μ Η Μ Μ I— i 3 km
3
= ■ Peneplain: moderate dissection
i l l i l Basal slopes
H I Scarpslope
l_^SIopes: high to moderate gradient
3. Structural and denudative landforms
P H I Rolling topography;parallel drainage
B l a Mountainous
5*«JAnticllnal crest
JuJLjResidual hill
üMUFaultscarp
=t4= Mesas r ^ = j Cuesta
!" x
'Crest
•X El Masegar
O ! Dolines
Figure 2.20 Geomorphological map of the Guadiana headwaters.
62
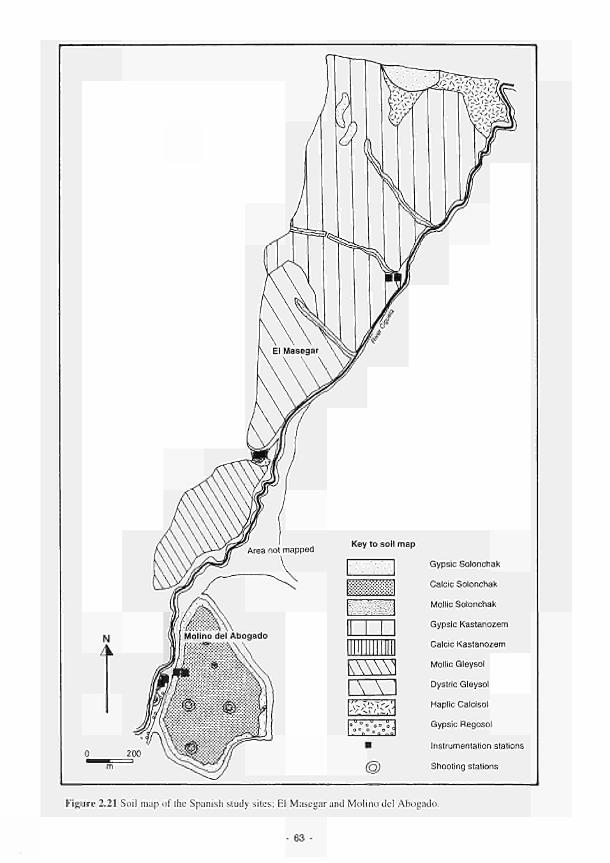
Gypsic Solonchak
Calcic Solonchak
Molile Solonchak
Gypsic Kastanozem
Calcic Kastanozem
Mollic Gleysol
Dystric Gleysol
Haplic Calcisol
Gypsic Regosol
Instrumentation stations
Shooting stations
Figure 2.21 Soil map of the Spanish study siles; El Masegar and Molino del Abogado.
63
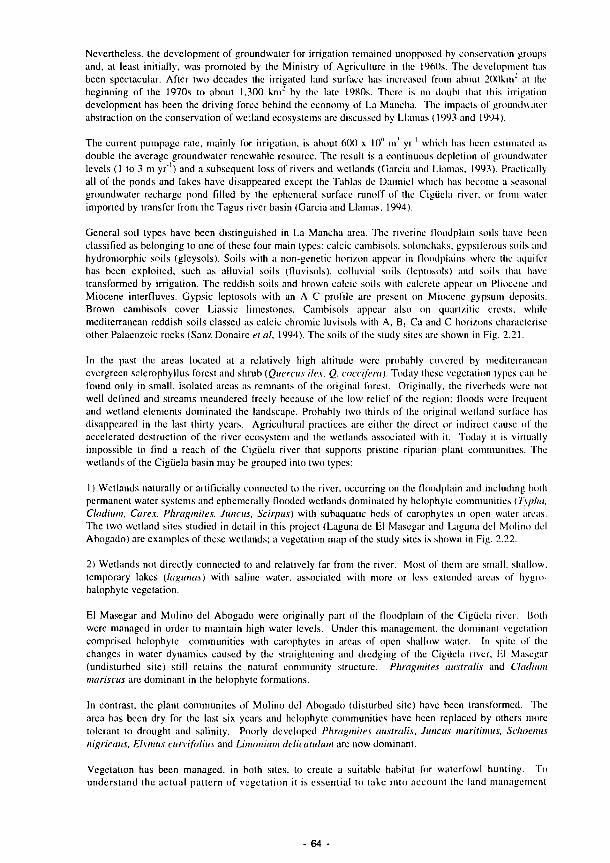
Nevertheless, the development of groundwater for irrigation remained unopposed by conservation groups
and, at least initially, was promoted by the Ministry of Agriculture in the 1960s. The development has
been spectacular. After two decades the irrigated land surface has increased from about 200km" at the
beginning of the 1970s to about 1,300 km" by the late 1980s. There is no doubl that (his irrigation
development has been the driving force behind the economy of La Mancha. The impacts of groundwater
abstraction on the conservation of wetland ecosystems arc discussed by Llamas (1993 and 1994).
The current pumpage rate, mainly for irrigation, is aboul 600 χ K)" m yr which has been estimated as
double the average groundwater renewable resource. The result is a continuous depletion of groundwater
levels (1 to 3 m yr"1) and a subsequent loss of rivers and wetlands (Garcia and Llamas, 1993). Practically
all of the ponds and lakes have disappeared except the Tablas de Daimiel which has become a seasonal
groundwater recharge pond filled by the ephemeral surface runoff of the Cigiicla river, or from water
imported by transfer from the Tagus river basin (Garcia and Llamas, 1994).
General soil lypes have been distinguished in La Mancha arca. The riverine floodplain soils have been
classified as belonging to one of these four main types: calcic cambisols, solonchaks, gypsiferous soils and
hydromorphic soils (gleysols). Soils wilh a non-genetic horizon appear in floodplains where lhe aquifer
has been exploited, such as alluvial soils (fluvisols), colluvial soils (leptosols) and soils that have
iransformed by irrigation. The reddish soils and brown calcic soils wilh calerete appear on Pliocene and
Miocene interfluvcs. Gypsic leptosols with an A C profile are present on Miocene gypsum deposits.
Brown cambisols cover Liassic limestones. Cambisols appear also on quartzilic crests, while
mediterranean reddish soils classed as calcic chromic luvisols with A, B, Ca and C horizons characterise
other Palaeozoic rocks (Sanz Donaire et al. 1994). The soils of the study sites are shown in Fig. 2.21.
In lhe past the areas located at a relatively high altitude were probably covered by mediterranean
evergreen sclcrophyllus forest and shrub (Queráis ilex, Q. coccifera). Today these vegetation lypes can be
found only in small, isolated areas as remnants of the original forest. Originally, the riverbeds were not
well defined and streams meandered freely because of the low relief of the region; Hoods were frequent
and wetland elements dominated the landscape. Probably two thirds of the original weiland surface has
disappeared in the last thirty years. Agricultural practices arc either the direct or indirect cause of the
accelerated destruction of the river ecosystem and the wetlands associated wilh it. Today it is virtually
impossible lo find a reach of the Cigiicla river that supports pristine riparian plant communities. The
wetlands of the Cigiiela basin may be grouped into two types:
1 ) Wetlands naturally or artificially connected to the river, occurring on the floodplain and including bolli
permanent water systems and ephemerally flooded wetlands dominated by helophytc communities (Typha,
Cladium, Carex. Phragmites. Juncus, Scirpus) with subaquatic beds of carophytes in open water areas.
The two wetland sites studied in detail in this project (Laguna de El Masegar and Laguna del Molino del
Abogado) are examples of these wetlands; a vegetation map of the sludy sites is shown in Fig. 2.22.
2) Wetlands not directly connected to and relatively far from the river. Most of them are small, shallow,
temporary lakes (lagunas) with saline water, associated with more or less extended areas of hygro-
halophyte vegetation.
El Masegar and Molino del Abogado were originally pan of lhe floodplain of lhe Cigiiela river. Bolli
were managed in order to maintain high water levels. Under this management, the dominant vegetation
comprised hclophyle communities with carophytes in areas of open shallow waler. In spite of the
changes in water dynamics caused by the straightening and dredging of the Cigiiela river, lil Masegar
(undisturbed site) still retains the natural community structure. Phragmites australis and Cladium
mariscas are dominan! in the hclophyle formations.
In contrast, the plant communites of Molino del Abogado (disturbed site) have been transformed. The
area has been dry for the last six years and helophytc communities have been replaced by others more
tolerant to drought and salinity. Poorly developed Phragmites australis. Junius maritimus, Schoenus
nigricans, Elymus curvifolius and Limonium delicalulum are now dominant.
Vegetation has been managed, in both siles, to create a suitable habilat for waterfowl hunting. To
understand the actual pattern of vegetation il is essential to take inlo account the land management
64

Key to vegetation map
open water
¿,''■■:y··'·'· '·■·'■.■; Scirpusformation
Phragmites australis dominant
i':·'·':-^'Λ:
:'"^Λ Cladium mariscus dominant
¡ ^ C ^ Í ^ > ^ Juncus formation
,.':
:.·.'·.·'.".'··.'·.' 1 Suaeda vera - Limonium saltmarsh
[·;·*;v'iVT.%'yV^ Schoenus nigricans - Elymus formation
j.y;' '"'■' ' I>1 H/y/T7t7s formation
main ditches, small channels and old inflows
elevated embankments
(§)= shooting stations
■ 14 Instrumentation stations
o 200
m
Figure 2.22 Vegetation map of the Spanish study sites; El Masegar and Molino del Abogado.
65
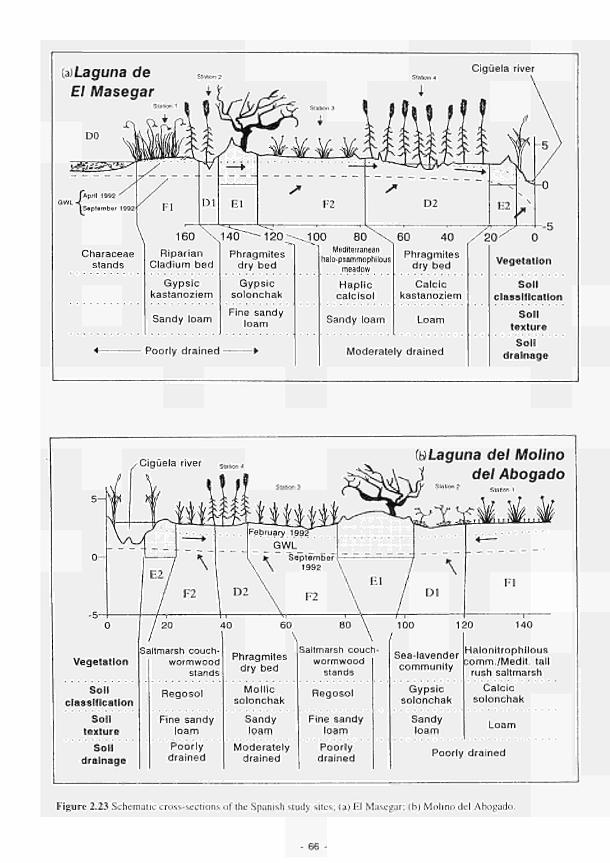
(a) Laguna de
El Masegar
Cigüela river
Characeae stands
160 \14(Γ"~· 120
Ripar ian
Cladium bed Phragmites
dry bed
J 0 0 8 0 \ 6 0
Mediterranean halopsammophilous
meadow
40
Phragmites dry bed
2 0 ^ 0
Vegetation
Gypsic
kastanozlem
Gyps ic
solonchak Haplic
calcisol Calcic
kastanoziem Soil
classification
Sandy loam Fine sandy
loam Sandy loam Loam Soil
texture
Soil
drainage Poorly dra ined Moderately drained
, Cigüela river s ,a„o n 4
(ti) Laguna del Molino
del Abogado
Vegetation Saltmarsh couch
wormwood
stands
Phragmites
dry bed
Saltmarsh couchwormwood
stands
Sealavender
communi ty
Haloni t rophi lous
Domm./Médit, tall
rush saltmarsh
Soil
classification Regosol Mol l ic
solonchak Regosol Gypsic
solonchak
Calcic
solonchak
Soil
texture
Fine sandy
loam
Sandy
loam
Fine sandy
loam
Sandy
loam Loam
Soil
drainage
Poor ly drained
Moderately
drained
Poor ly
drained Poorly drained
Figure 2.23 Schematic crosssections of the Spanish study sites; (a) El Masegar; (b) Molino del Abogado.
66
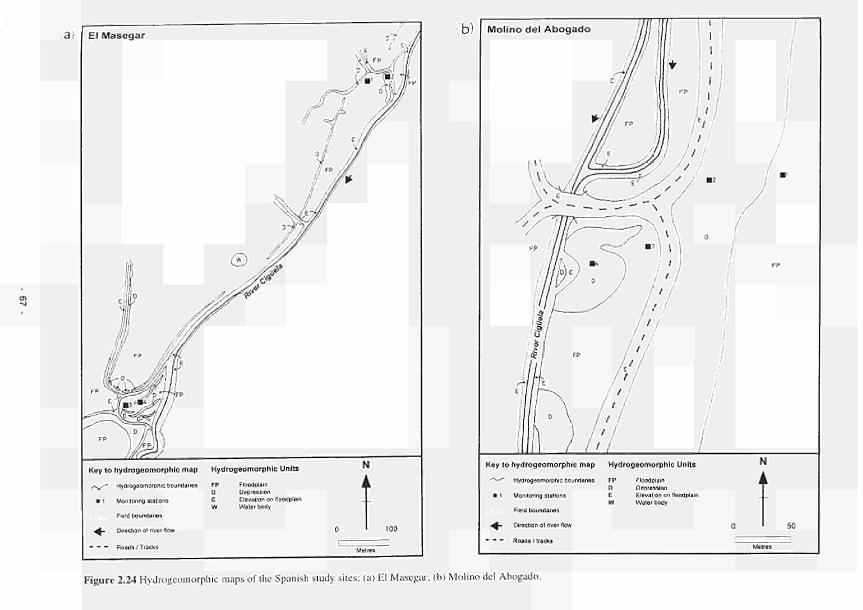
Key to hydrogeomorphic map Hydrogeomorphic Units
r>^s~ Hydrogeomorphic boundaries F C
■ 1 Monitoring stations E
V
Field boundaries
^L. Direction of nver flow
- ~ ~ Roads/ Tracks
Floodplain Depression Elevation on floodplain Water body
N
A
b)
Key to hyd rogeomorph i c map Hydrogeomorphic Units
/"*-"" Hydrogeomorphic boundaries F E
■ 1 Monitoring stations E V
Field boundaries
■^L. Direction of river flow
- - - Roads /tracks
Floodplain Depression Elevation on floodplain Water body
N
i
Figure 2.24 Hydrogeomorphic maps of the Spanish study sites; (a) El Masegar; (b) Molino del Abogado.
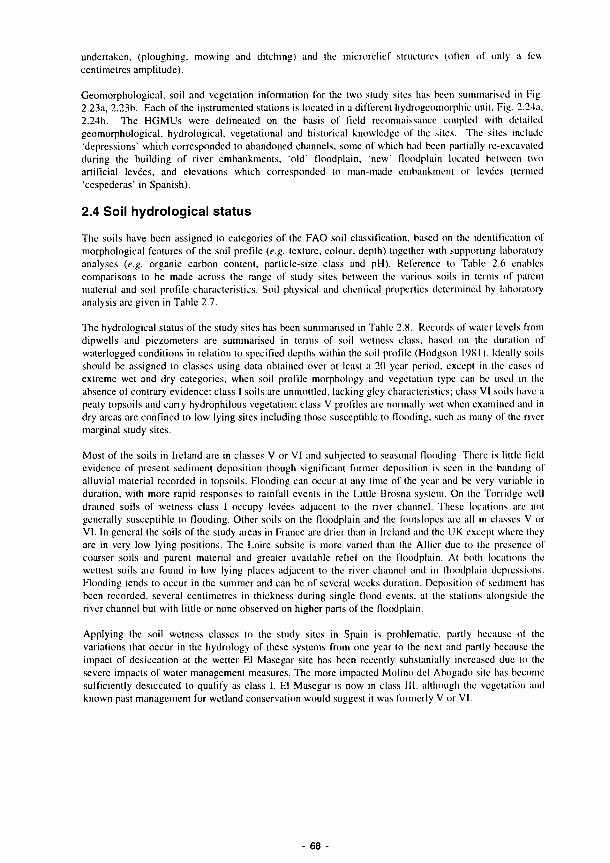
undertaken, (ploughing, mowing and ditching) and the microrelief structures (often of only a few centimetres amplitude).
Geomorphological. soil and vegetation infonnalion for the two sludy sites has been summarised in Fig. 2.23a, 2.23b. Each of the instrumented stations is located in a different hydrogeomorphic unit, Fig. 2.24a. 2.24b. The HGMUs were delineated on the basis of field reconnaissance coupled with detailed geomorphological. hydrological, vegetational and historical knowledge of the sites. The siles include 'depressions' which corresponded to abandoned channels, some of which had been partially re-excavated during the building of river embankments, 'old' floodplain, 'new' floodplain located between two artificial levées, and elevations which corresponded to man-made embankment or levees (termed 'cespederas' in Spanish).
2.4 Soil hydrological status
The soils have been assigned to categories of the FAO soil classification, based on the identification of morphological features of the soil profile (e.g. texture, colour, depth) together with supporting laboratory analyses (e.g. organic carbon content, particle-size class and pH). Reference to Table 2.6 enables comparisons to be made across the range of study sites between the various soils in terms of parent material and soil profile characteristics. Soil physical and chemical properties determined by laboratory analysis are given in Table 2.7.
The hydrological status of' the study sites has been summarised in Table 2.S. Records of water levels from dipwells and piezometers are summarised in terms of soil wetness class, based on the duration of waterlogged conditions in relation to specified depths within the soil profile (Hodgson 19X1 ). Ideally soils should be assigned to classes using data obtained over al least a 20 year period, except in the cases of extreme wet and dry categories, when soil profile morphology and vegetation type can be used in the absence of contrary evidence: class I soils are unmoltled, lacking gley characteristics; class VI soils have a peaty topsoils and carry hydrophilous vegetation; class V profiles are normally wet when examined and in dry areas are confined to low lying sites including those susceptible lo flooding, such as many of the river marginal sludy sites.
Most of the soils in Ireland arc in classes V or VI and subjected lo seasonal Hooding. There is little field evidence of present sedimenl deposition though significant former deposition is seen in the banding of alluvial material recorded in topsoils. Flooding can occur at any lime of the year and be very variable in duration, wilh more rapid responses to rainfall events in the Little Brosna system. On the Torridge well drained soils of wetness class I occupy levées adjacent to the river channel. These locations are not generally susceptible to flooding. Other soils on the floodplain and lhe footslopcs are all in classes V or VI. In general the soils of the sludy areas in France arc drier than in Ireland and lhe UK except where they are in very low lying positions. The Loire subsite is more varied than the Allier due lo lhe presence of coarser soils and parent material and greater available relief on lhe floodplain. Al bolli locations the wettest soils are found in low lying places adjacent to the river channel and in floodplain depressions. Flooding lends lo occur in lhe summer and can be of several weeks duration. Deposition of sediment has been recorded, several centimetres in thickness during single flood events, at the stations alongside the river channel but with little or none observed on higher parts of the floodplain.
Applying lhe soil wetness classes to the study sites in Spain is problematic, partly because of the variations that occur in the hydrology of' these systems from one year to the next and partly because the impact of desiccation at the wetter El Masegar sile has been recently subslanially increased due to the severe impacts of water management measures. The more impacted Molino del Abogado site has become sufficiently desiccated to qualify as class I. El Masegar is now in class III, although the vegetation and known past management for weiland conservation would suggest il was formerly V or VI.
- 68 -

Categories (FAO)
Regosols
Arenosols
Cambisols
Gleysols
Fluvisols
Histosols
Solonchaks
Kastanozems
Calcisols
Parent Material
River alluvium
Stony drift
River alluvium
River alluvium over peat
Peat
River alluvium
Soil Profile Characteristics
Poorly drained; Medium texture:
Shallow over sand Poorly drained; medium texture; rich in qypsum
Well drained; coarse texture. Well-drained;
medium texture
Well drained; medium fine texture
Poorly drained; medium texture;
slowly permeable
Poorly drained; medium fine texture;
slowly permeable
Poorly drained; medium texture
Poorly drained; medium fine texture
Poorly drained; medium texture
Poorly drained; medium fine texture.
Poorly drained; organic
Poorly drained; saline and calcareous
Poorly drained; saline rich in gypsum
Moderately drained; brownish, structured
topsoil; saline Poorly drained;
topoil developed; rich in qypsum
Moderately drained; topsoil developed;
calcareous Moderately drained;
calcareous
Topsoil Texture
Humóse sandy silt loam
Sandy loam
Sandy loam
Sandy loam Silt loam
Sandy silt loam Humóse silty clay loam
Silt loam
Humóse silt loam
Loamy peat Silty clay loam
Silt loam
Humóse silt loam
Silty clay loam Loamy peat
Silt loam
Peat
Peat
Sandy silt loam
Fine sandy loam Loamy sand
Sandy loam
Sandy loam
Sandy silt loam
Sandy clay loam
Location
DECZ4
MOLI3
DECZ3
DECZ2 BRAD1
APRE3 KISM1
BRAD3
BRAD2 KISM3,5
KISM4 DECZ1
APRE1.2
KISM2, APRE4 CLON2
LTBR1
CLON1
LTBR2
LTBR3
CLON4
LTBR4.5 CLON3.5
MOLI1
MASE2 MOLI2
MOLI4
MASE1
MASE4
MASE3
Table 2.6. Classification of soils at the sludy sites
- 69
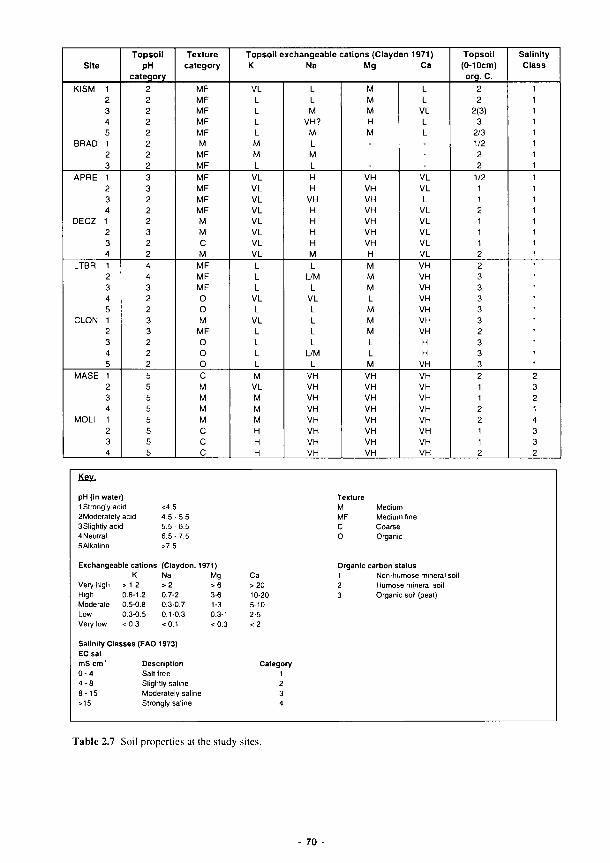
Si te
K I S M 1 2 3 4 5
B R A D 1 2 3
A P R E 1 2 3 4
D E C Z 1 2 3 4
LTBR 1 2 3 4 5
C L O N 1 2 3 4 5
M A S E 1 2 3 4
M O L I 1 2 3 4
T o p s o l l p H
c a t e g o r y
2 2 2 2 2 2 2 2
3 3 2 2 2 3 2 2 4 4 3 2 2 3 3 2 2 2
5 5 5 5 5 5 5 5
T e x t u r e c a t e g o r y
M F M F M F M F M F M
M F M F
M F M F M F M F M M C M
M F M F M F 0 0 M
M F 0 0 0 C M M M M C C C
T o p s o i l e x c h a n g e a b l e c a t i o n s ( C l a y d K N a
VL L L L L M M L
V L VL V L VL VL VL VL V L L L L
V L L
V L L L L L M
V L M M M H H H
L L M
V H ? M L M L
H H
V H H H H H M L
L/M L
V L L L L L
L/M L
V H V H V H V H V H V H V H V H
M g
M M M H M
V H V H V H V H V H V H V H H
M M M L M M M L L M
V H V H V H V H V H VH V H VH
en 1971 ) C a
L L
VL L L
-VL V L L
VL VL V L VL V L V H V H V H V H V H V H V H H H
V H
V H V H V H V H V H V H V H V I I
T o p s o l l (0-1 Oem)
o r g . C.
2 2
2(3) 3
2 /3 1/2 2 2
1/2 1 1 2 1 1 1 2 2 3 3 3 3 3 2 3 3 3
2 1 1 2 2 1 1 2
Sal in i ty C lass
2 3 2 1 4 3 3 2
Key .
pH (in water) 1 Strongly acid 2 Moderately acid 3Slightly acid 4 Neutral 5 Alkaline
<4.5 4 . 5 - 5 . 5 5 .5 -6 .5 6.5 - 7.5 >7.5
Exchangeable cations (Claydon K
Very high > 1.2 Na > 2
High 0.8-1.2 0.7-2 Moderate 0.5-0.8 0.3-0.7 Low 0.3-0.5 0.1-0.3 Very low < 0.3 <0.1
Salinity Classes (FAO 1973) EC sat mS c m ' 0 - 4 4 - 8 8 - 15 >15
Description Sail Iree Slightly saline
1971) Mg > 6 3-6 1-3 0 3-1 < 0 . 3
Moderately saline Strongly saline
Ca > 2 0 10-20 5-10 2-5 <2
Category 1 2 3 4
Texture M Medium MF Medium fine C Coarse 0 Organic
Organic carbon status 1 Non-humose mineral soil 2 Humóse mineral soil 3 Organic soil (peat)
Table 2.7 Soil properlies at the sludy sites.
70

Wetness class
Flood frequency
and water
reqime
Hydrophytic
vegetation
Sedimentation
class
Shannon
C1
VI
5
SPF
Y
3
C2
IV
2
IF
Y
1
C3
VI
4
SF
Y
2
C4
VI
4
SF
Y
2
C5
V
4
SF
Y
1
LB1
V
2
IF
Y
1
LB2
VI
4
SF
Y
2
LB3
V
4
SF
Y
2
LB4
V
4
SF
Y
2
LB5
V
2
S
Y
1
Torridge
K1
I
2
IF
Ν
0
1
K2
V
3
S
Y
1
K3
V
Ν
Y
Ν
K4
VI
Ν
Y
Ν
Κ5
Vt
Ν
Υ
Ν
Β1
Ι
2
IF
Ν
0
1
Β2
V
Ν
Υ
0
Β3
V
Ν
Υ
Ν
Wetness class
Flood regime
Hydrophytic
vegetation
Sedimentation
class
Loire/Allier
A1
III
5
SF
Y
3
A2
II
3
IF
Ν
1
A3
1
3
IF
Ν
1
A4
IV
4 SF
GW
Y
1
D1
V
5
SF
Y
3
D2
I
2
IF
Ν
1
D3
I
1
IF
Ν
0
D4
VI
4 SF
GW
Y
0
Guadiana
MA1
III
Ν
Y
Ν
ΜΑ2
111
Ν
Y
Ν
ΜΑ3
III
Ν
Y
Ν
ΜΑ4
lil
Ν
Y
Ν
Μ01
I
Ν
Y
Ν
Μ02
I
Ν
•
Ν
Μ03
Ι
Ν
•
Ν
Μ04
Ι
Ν
Υ
Ν
Key
Flood frequency categories 1 Rare (>20 year return) 2 Occasional (5 20 year return) 3 Common (floods most years; single event and/or short duration) 4 Frequent (floods every year; multiple events and/or moderate duration) 5 Very frequent (floods every year; multiple events and/or long duration) Ν Nonflooding
Sedimentation classes evidence for deposition 0 None 1 Surface debris only, strand lines etc.
2 Recent sediment deposition evident ¡n soil profile; little or none seen on surface 3 Prominent deposition of sedimentation on surface Ν Not appropriate
Water regimes (from Cowardin ef al. 1979) IF Intermediately Hooded
S Saturated
SF Seasonally flooded SPF Semipermanently flooded
GW Groundwater source of flooding
Vegetation
Saltmarsh communities recently developed
Table 2.8 Summary of the hydrological status of the soils at the study sites.
71

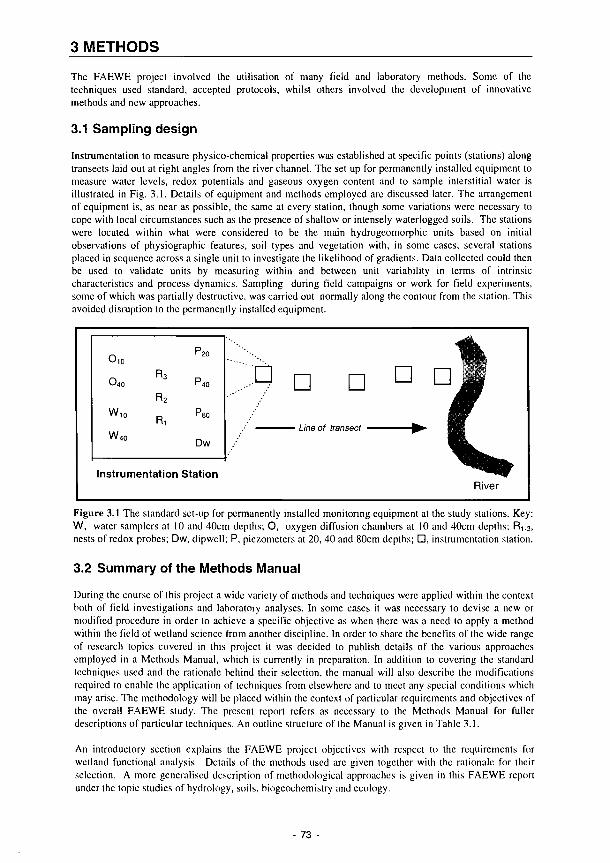
3 METHODS The FAEWE project involved the utilisation of many field and laboratory methods. Some of the techniques used standard, accepted protocols, whilst others involved the development of innovative methods and new approaches.
3.1 Sampling design
Instrumentation to measure physico-chemical properties was established at specific points (stations) along transects laid out at right angles from the river channel. The set up for permanently installed equipment to measure water levels, redox potentials and gaseous oxygen content and to sample interstitial water is illustrated in Fig. 3.1. Details of equipment and methods employed are discussed later. The arrangement of equipment is, as near as possible, the same at every station, though some variations were necessary to cope with local circumstances such as the presence of shallow or intensely waterlogged soils. The stations were located within what were considered to be the main hydrogeomorphic units based on initial observations of physiographic features, soil types and vegetation with, in some cases, several stations placed in sequence across a single unit to investigate the likelihood of gradients. Data collected could then be used to validate units by measuring within and between unit variability in terms of intrinsic characteristics and process dynamics. Sampling during field campaigns or work for field experiments, some of which was partially destructive, was carried out normally along the contour from the station. This avoided disruption to the permanently installed equipment.
O,o
O4o
W10
w40
R3
R2
R i
P20
P40
Peo
Dw
Û D D ü D
Line of transect
Instrumentation Station River
Figure 3.1 The standard set-up for permanently installed monitoring equipment at the study stations. Key: W, water samplers at 10 and 40cm depths; O, oxygen diffusion chambers at 10 and 40cm depths; R,.3, nests of redox probes; Dw, dipwcll; P, pie/.ometers at 20, 40 and 80cm depths; D, instrumentation station.
3.2 Summary of the Methods Manual
During the course of this project a wide variety of methods and techniques were applied within the context both of field investigations and laboratory analyses. In some cases it was necessary to devise a new or modified procedure in order to achieve a specific objective as when there was a need to apply a method within the field of wetland science from another discipline. In order to share the benefits of the wide range of research topics covered in this project it was decided to publish details of the various approaches employed in a Methods Manual, which is currently in preparation. In addition to covering the standard techniques used and the rationale behind their selection, the manual will also describe the modifications required to enable the application of techniques from elsewhere and to meet any special conditions which may arise. The methodology will be placed within the context of particular requirements and objectives of the overall FAEWE study. The present report refers as necessary to the Methods Manual for fuller descriptions of particular techniques. An outline structure of the Manual is given in Tabic 3.1.
An introductory section explains the FAEWE project objectives with respect to the requirements for wetland functional analysis. Details of the methods used arc given together with the rationale for their selection. A more generalised description of methodological approaches is given in this FAEWE report under the topic studies of hydrology, soils, biogcochcmislry and ecology.
73

1 Preface
2 Summary
3 Introduction
4 Hydrological studies
5 Soil studies
6 Biological studies
7 Geomorphological studies
3.1 Process studies in functional assessment, site descriptions and impacts, structure of project management, data requirements, modelling, assessment procedures.
4.1 Background Inputs to functional assessment. 4.2 Field methods Experimental set-ups, equipment, surveys, data collection, sampling; Groundwater measurements, surface water measurements. 4.3 Laboratory methods Analyses of water samples, list of determinations, rationale lor selection equipment, materials, methods. 4.4 Data handling Data storage and retrieval, numerical methods. 4.5 Modelling Groundwater; Surface water.
5.1 Background Inputs to functional analysis, data requirements. 5.2 Field methods and process studies Soil Surveys; Soil identification, description, classification, mapping; Soil water regime; Equipment, instrumentation, measurements; Redox potential; Probe construction, installation, measurements, logger; Gaseous oxygen content; Soil reaction; Mineralisation of soil organic matter; Decomposition of soil organic matter; Cotton strips; Denitrification; Sampling methods; Interstitial water, soil cores, bulk samples. 5.3 Laboratory methods Physical analysis; Soil water content; Particle-size analysis; Chemical analysis; Phosphorus-phosphate forms; Nitrogen - ammonium, nitrate; Cation exchange properties; Soil reaction (pH), calcium, magnesium, potassium, sodium; Pyrophosphate-extractable iron, aluminium and carbon; Oxalate extractable iron and aluminium; Mineralisation of organic matter; Salinity.
6.1 Background Inputs to functional assessment. 6.2 Field methods and process studies Phytosociological surveys; Rationale, techniques, mapping; Plant productivity; Biomass, decomposition of litter; Plant Survival Strategies; Species selection criteria, rationale, measurements, sampling; Invertebrate studies, rationale, methodologies; Bird studies, rationale, methodologies. 6.3 Laboratory methods Total Ν, Ρ and K; Total C. 6.4 Data handling
Geomorphological mapping; Erosion and deposition measurement.
Table 3.1 Summary of the contents of the Methods Manual.
A range of potential users of the Methods Manual has been identified. Within the field of weiland research there are those who are already working in the same general area of invcsligalion or those who may wish to start up a related project and are considering appropriate approaches. The Manual will offer planners and land managers, who are likely to be using the final wetland assessment methodology, the opportunity to clarify the underlying scientific principles, records and measurements which form the basis for lhe structure of the methodology. Specialists in particular subject areas and advanced stage students developing project and practical work wil l also benefit from the hands-on emphasis of the publication.
3.3 Hydrological/hydrogeochemical methods
A variety of field, desk and laboratory based methods were utilised to assess, monitor and inlerprel the hydrological/hydrogeological component of wetland functioning.
- 74
3.3.1 Objectives
The studies were aimed at understanding, and as far as possible, quantifying, hydrological functioning (Table l. I ) of river marginal wetland ecosystems in terms of flood water control through flood response mechanisms, groundwater recharge and/or discharge and surface water generation. In addition to the quantitative support of wetlands in determining hydrological regimes, hydrological processes and other characteristics such as water sources, flow velocities, quantities and flow paths dictate much of the nutrient movement which is critical in controlling the ecosystem dynamics. Modelling results have been used to predict the vulnerability of systems to hydrological impacts in terms of impairment of functioning.
Varied approaches have been taken to the hydrological investigations at the study sites depending upon the system characteristics and the target impact identified for study (2.1). On the broad floodplains of the Shannon/Little Brosna in Ireland, subject to frequent inundation from the river, interest focused on the characteristics of the soils and sediments of the alluvial deposits, the differing chemical characteristics of rainwater, groundwater and river water, and the relationships between flooding regime and land use in the wider catchment. On the Torridge emphasis was given to understanding the hydrogeological and hydrological characteristics of the bedrock and overlying drift of the valley slopes and their hydrological relationships with the floodplain deposits in routing water to the river channel. The hydrological study of the Loire site was more of a desk exercise with visits limited to three field campaigns and water levels monitored regularly by other teams. Numerical modelling was not possible here because of the limited field data available. In the semi-arid systems of central Spain site information was based on the present status and recent changes in levels of regional aquifers impacted by abstractions and modified surface flows in river channels.
3.3.2 Desk studies
These studies identified the sources of available regional geological and hydrogeological data. At lhe Shannon very little information was available on lhe Quaternary geology of the callows, geological descriptions and interpretations being based on the results of FAEWE project field investigations. At the Torridge geological maps of the sites were available at scales of 1/50000 and l/lOOOO. The smaller scale map had a limited resolution while the larger scale maps arc based on the mapping of surface features and geological reasoning only. Additional geological information is contained in the published literature. Examination of engineering project reports provided both geological and hydrogeological data and was supplemented with personal contacts. Important hydrogeological information is contained in a few published papers in the case of the Torridge and private abstraction well records. Geological maps of the French sites are supplemented by data from drilling logs in the floodplain sediments, where sands and gravels are exploited by the extractive industry. The hydrogeological study in Spain involved an area of interest of 300km" over the La Mancha aquifer. Interpretations were made through utilisation of an inventory of 150 wells.
River discharge data were available for the major rivers of the study. Discharge data for the River Torridge (at Torrington) and low flow survey data were available from NRA (Exeter), which also provided daily climatic data for a local reservoir station (until May I993) and precipitation data for some additional stations. Weekly MORECS data for square 177 (rain, sunshine duration, temperature, vapour pressure, wind run, potential and actual évapotranspiration, soil moisture deficit and effective precipitation) were obtained from the Meteorological Office.
In Spain hydrological data from appropriate Waler Authorities were used to supplement those collected daily by local people, and those of the fortnightly field visits. All these data are stage (height) values, which were converted into discharge data, where calibration curves existed (French sites). A statistical analysis has been carried out to predict flooding patterns in the sludy sites and predictions were checked when the study sites were flooded. River stage measurements were used, correlated with archive hydrological data available over a 30 year period, enabling extrapolations to be made on the hydrological history of the sites. In particular the sludy focused on recurrence lime of different flooding categories according to their duration.
75
3.3.3 Field studies
Prior to the project where no site-specific hydrogeological dala existed, it was necessary for site investigation and instrumentation programmes to be undertaken. These involved slandard techniques including geological mapping, geophysical surveying, drilling and permeability tesling. topographical surveying, manual and automatic monitoring and hydrochemical sampling. Instruments installed included piezometers, weirs, stilling wells and an automatic monitoring system (AMS). Fuller details of equipment and installation techniques are given in the Methods Manual.
Surveys
The field investigation programme comprised site characterisation activities and application of dala acquisition techniques. At the Torridge preliminary work included detailed mapping of ditches and flow directions and simple "wetness mapping". A well survey was carried out also to identify local wells and interviews were held with land owners and local farmers to obtain anecdotal hydrological information. Geological mapping was done by hand augering throughout the site lo a depth of up to 1.5m. Rivet section mapping was carried out together with examination of exposures upslope from the site. Geophysical surveys included electromagnetics, resistivity soundings and electrical resistivity imaging.
Instrumentation and Measurement
In Ireland five transects were established, two along the lines of the main stations, at which nests of piezometers set at differing depths (up to 20m) were established at 100 m intervals. The levels in the piezometers were measured bi-weekly at the monitoring stations and at up to 2 month intervals elsewhere. At the Shannon sites phreatic heads and piezometric heads along lhe transecis were measured from wells al 70m intervals which were visited at two week intervals.
At the Torridge (on the basis of preliminary information) a groundwater monitoring network was designed. Drilling for piezometer installation provided further geological evidence although this was somewhat limited because a solid stem power auger was used. Eighteen shallow (0.3-1.2m) and seventeen deep (2-4.5m) piezometers were installed at Kismeldon with thirteen shallow (0.3-1.4m) and seven deep (l.6-4.5m) piezometers at Bradford Mill (Fig 3.2). Piezometers were set at different depths (in nests) and most were installed in transects along the expected flow lines although a few of them were located elsewhere. The sampling rationale required piezometers established near the river to investigate hydraulic relationships, within the wetland for the determination of both horizontal and vertical hydraulic gradients and the recharge - discharge functioning, and in the uphill area. Falling head permeability tests were carried out and results were analysed with the Hvorslev (1951) method. The low permeability of lhe sile meant that some tests had to be run over several days but as the early time data are most important all of the tests were completed successfully.
Six permanent weirs were installed al Kismeldon and one at Bradford Mill (Fig 3.2) to measure surface flows in ditches, although temporary weirs were used in other locations. A staff gauge was installed to monitor the river waler level at both sites and a stilling well was constructed at Kismeldon (Fig 3.2).
Continuous monitoring of site-specific hydrological and hydrometeorological variables al Kismeldon was achieved by installation of an automatic monitoring system (AMS). The dala logger monitors at 10 minute intervals and recorded hourly averages. Data acquisition started early in April 1992 and downloading took place every two months via a portable computer for further processing.
A weather station was part of this system and comprised a lipping-bucket rain gauge, a relative humidity and air temperature sensor, an anemometer and an incoming solar radiation sensor. A pressure transmitter (4-20 mA) was installed in one of the deep piezometers to monitor continuously the waler level and another was accommodated in the river stilling well although it later failed due to Hooding damage. A stilling well was also constructed in one of the weir locations (Fig 3.2). A transmitter was installed and connected to the AMS.
At the Torridge additional site characterisation activities included infiltromelcr tests, excavation of a shallow (0.7 m) trial pit, a single well tracer test (Kismeldon), and soil moisture block installation (Watson, 1992; Hampton. 1992) and monitoring. The limited regional work involved visits to coastal
76

bedrock exposures, permeability testing (pumping and slug tests) and hydrochemical sampling of a few wells.
Instrumentation at the Loire sites was limited to the drilling of six wells and the setting of stage boards in the river Allier, the oxbow lake on the adjacent floodplain and in the major depression of the Loire floodplain, to enable waler level records to be made by teams visiting the site for other purposes.
In order to assess the hydrological functioning of the wetland study site in Spain, a regional hydrogeological survey had been conducted in order to set the local hydrological system within the broader regional context. The area under study covered about 300km-, About 150 watcrwclls were inventoried. Water levels were measured monthly or quarterly and about one third were sampled for chemical analysis. At the instrumentation stations water levels were measured in deep piezometers (2.0m) in addition to those of depths standardised at the other study sites (0.2, 0.4 and 0.8m). Eleven gauges were installed in the Cigiiela River, the lake and in some of the gypsiferous dolines to measure the water level fluctuations of the river, lake and water table.
Sampling
A programme of groundwater sampling from piezometers was carried out for laboratory determination of major ion species to characterise nutrient loadings and as inputs to solute transport models. Selective sampling and analyses were carried out monthly (Shannon) and bi-monthly (Torridge) wilh full hydrochemical sampling every six months. Results were supplemented by analyses of monthly samples from shallow groundwater (soil waler determined for biogeochemical investigations 3.4). In Spain sampling from 32 wells was carried out over a period of 18 months. In France the sampling programme was integrated with that of the soil hydrological studies.
3.3.4 Laboratory Analyses
The range of analyses carried out and techniques adopted for determination of hydrochemistry arc given in Table 3.2.
Method
Segmented flow autoanalyser (colorimetrie method) or Dionex
Flame AAS or flame photometer
pH probe
Conductivity probe
Determination
N03", N H i \ CI", S O / ' , PO.»3" Cä", Mg ¿ \ Na*, K*
pH
Electrical conductivity (EC)
Table 3.2 Laboratory analyses of waler samples
3.3.5 Hydrological modelling
Three general types of modelling have been used by the Amsterdam group for the study of hydrology of the Shannon callows: (1) numerical modelling of groundwater fluxes, (2) water budget modelling using water balance analyses, and (3) modelling of groundwater tabic fluctuations. Methods and concepts used during this project are illustrated with results for the Clonmacnoise site. Most are existing methods, modified to meet the specific conditions encountered in floodplains.
Modelling was undertaken at the Torridge using the finite difference code MODFLOW (McDonald and Harbaugh. 1988). Three dimensional steady-state models were constructed for bolh the Kismeldon and Bradford Mill sites, and a transient version was also developed for Kismeldon. The recharge/surface drainage systems were modelled using a specially written code.
In order to check the conceptual model of the Spanish site lwo 2-D vertical steady state numerical models were tcslcd by Fornés (1994). The numerical code used in this modelling was the classical PLASM model (Prickcttand Lonquist, 1971).
77
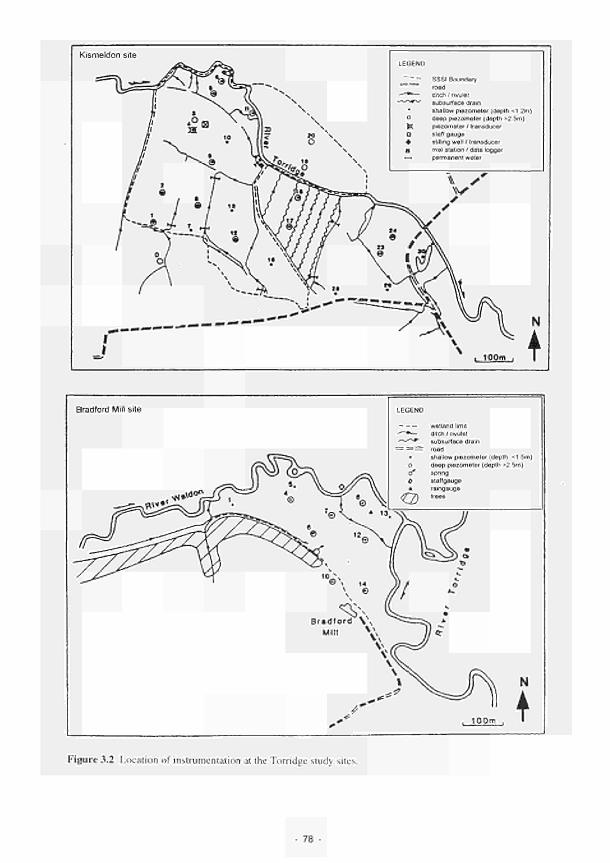
Kismeldon site
sgs=^ * J \ l r H ^ IUr Xf i ' 1 ■_
si»T)
1 ^ N . U
ti » V ^ Ì / «
B \
/' ""v. · \ /' ^^
ί ^ " ^ e *fi^^
e · / f / 1 / / II" W\« / Λ ^ ( / *
ι i
"■* V
Ν
¡\ ^ I l \ il< »?
v
; ° \ l i Ν
4 ς 7 ^ ^ . '
Il / ¿ίίΤ^Ξ^-βί; >\ r / f / f l r ^ \\ f viii Ü )} ì v< S ( t i/ \ r / \ \ / 1 J J/ ^ N .
' \ \ j r r Ï \ '· Xi t >\ r/
» 7 ^ ι >■ ·
LEGEND
*—
^ • O
*t 0
♦ B
t H
9 /
η 1 N· l g
V\
SSSI Boundary
road ditch / rivulet
subsurface dram shallow piezometer (depth <1,2m)
deep piezometer (depth >2 5m) piezometer / transducer
staff gauge stilling well / transducer met station / data logger permanent water
\ y ν •
• /
\ ^ \ N
> τ ■ 100m ι I
Bradford Mill site LEGEND
*_ ν -*■
= =:zr :
• o
d* 6
* <LD
wetland limit ditch / rivulet
subsurface dram road shallow piezometer (depth <1 5m)
deep piezometer (depth >2.5m) spring
staffgauge
ramgauge trees
, 100m ,
N
!
Figure 3.2 Location of instrumentation at the Torridge study sites.
78
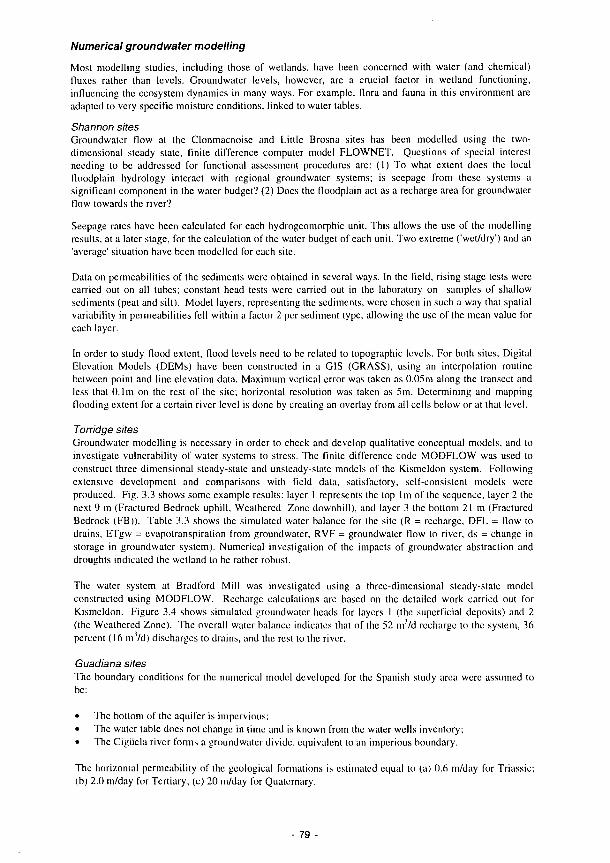
Numerical groundwater modelling
Most modelling studies, including those of wetlands, have been concerned with water (and chemical) fluxes rather than levels. Groundwater levels, however, are a crucial factor in wetland functioning, influencing the ecosystem dynamics in many ways. For example, flora and fauna in this cnvironmenl are adapted to very specific moisture conditions, linked to water tables.
Shannon sites Groundwater flow at the Clonmacnoise and Little Brosna sites has been modelled using the two-dimensional steady state, finite difference computer model FLOWNET. Questions of special interest needing to be addressed for functional assessment procedures are: (1) To what extent does the local floodplain hydrology interact with regional groundwater systems; is seepage from these systems a significant component in the water budget? (2) Does the floodplain act as a recharge area for groundwater flow towards the river?
Seepage rates have been calculated for each hydrogeomorphic unit. This allows the use of the modelling results, at a later stage, for the calculation of the water budget of each unit. Two extreme ('wet/dry') and an 'average' situation have been modelled for each site.
Data on permeabilities of the sediments were obtained in several ways. In the field, rising stage tests were carried out on all tubes; constant head tests were carried out in the laboratory on samples of shallow sediments (peat and silt). Model layers, representing the sediments, were chosen in such a way that spatial variability in permeabilities fell within a factor 2 per sediment type, allowing the use of the mean value for each layer.
In order to study flood extent, flood levels need to be related to topographic levels. For both sites, Digital Elevation Models (DEMs) have been constructed in a GIS (GRASS), using an interpolation routine between point and line elevation data. Maximum vertical error was taken as 0.05m along the transect and less that 0.1m on the rest of the site; horizontal resolution was taken as 5m. Determining and mapping flooding extent for a certain river level is done by creating an overlay from all cells below or at thai level.
Torridge sites Groundwater modelling is necessary in order to check and develop qualitative conceptual models, and to investigate vulnerability of water systems to stress. The finite difference code MODFLOW was used to construct three dimensional steady-state and unsteady-state models of the Kismeldon system. Following extensive development and comparisons with field data, satisfactory, sclf-consistenl models were produced. Fig. 3.3 shows some example results: layer 1 represents the top lm of the sequence, layer 2 the next 9 m (Fractured Bedrock uphill. Weathered Zone downhill), and layer 3 the bottom 21 m (Fractured Bedrock (FB)). Table 3.3 shows the simulated water balance for the site (R = recharge, DFL = flow to drains, ETgw = évapotranspiration from groundwater, RVF = groundwater flow to river, ds = change in storage in groundwater system). Numerical investigation of the impacts of groundwater abstraction and droughts indicated the wetland to be rather robust.
The water system at Bradford Mill was investigated using a three-dimensional steady-stale model constructed using MODFLOW. Recharge calculations are based on the detailed work carried out for Kismeldon. Figure 3.4 shows simulated groundwater heads for layers 1 (the superficial deposits) and 2 (the Weathered Zone). The overall water balance indicates that of the 52 nrVd recharge lo the system, 36 percent (16 m'/d) discharges to drains, and the rest to the river.
Guadiana sites The boundary conditions for the numerical model developed for the Spanish study area were assumed to he:
• The bottom of the aquifer is impervious: • The water table docs not change in time and is known from lhe water wells invcnlory; • The Cigiicla river forms a groundwater divide, equivalent to an imperious boundary.
The horizontal permeability of the geological formalions is estimated equal lo (a) 0.6 m/day for Triassic; (b) 2.0 in/day for Tertiary; (c) 20 m/day for Quaternary.
79
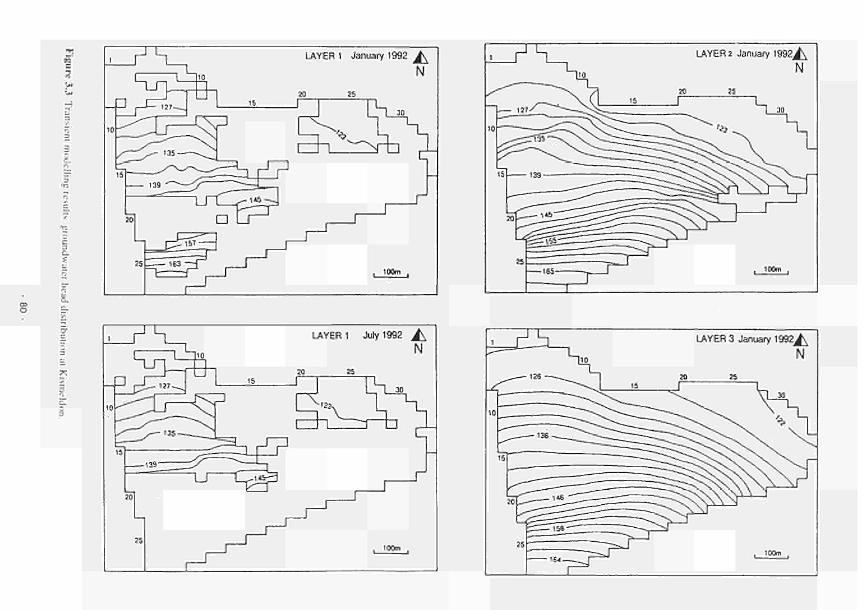
-
Ξ 8.
7 tre
LAYER 2 January 1 9 9 2 ^
Ν
LAYER 1 July 1992 J^ Ν
τ. J-
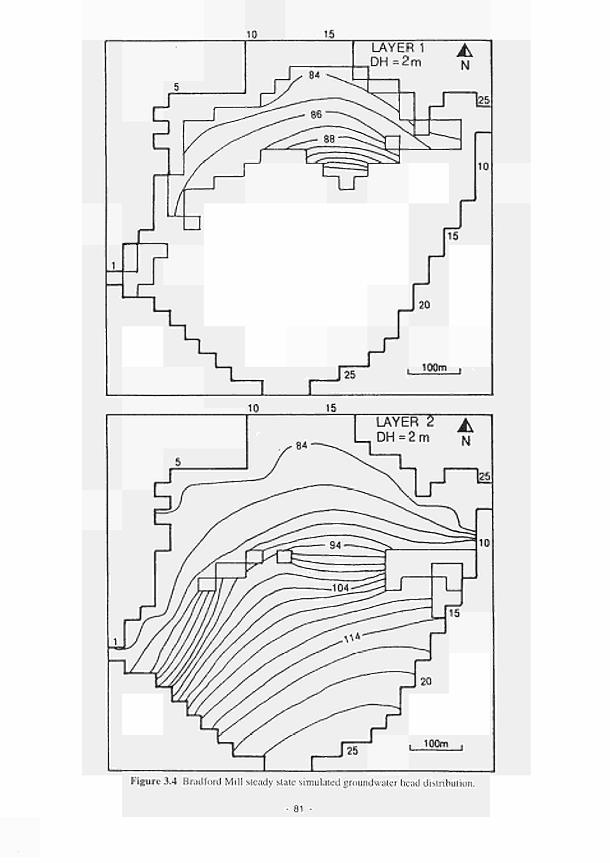
Figure 3.4 Bradford Mill steady state simulated groundwater head distribution.
- 81 -
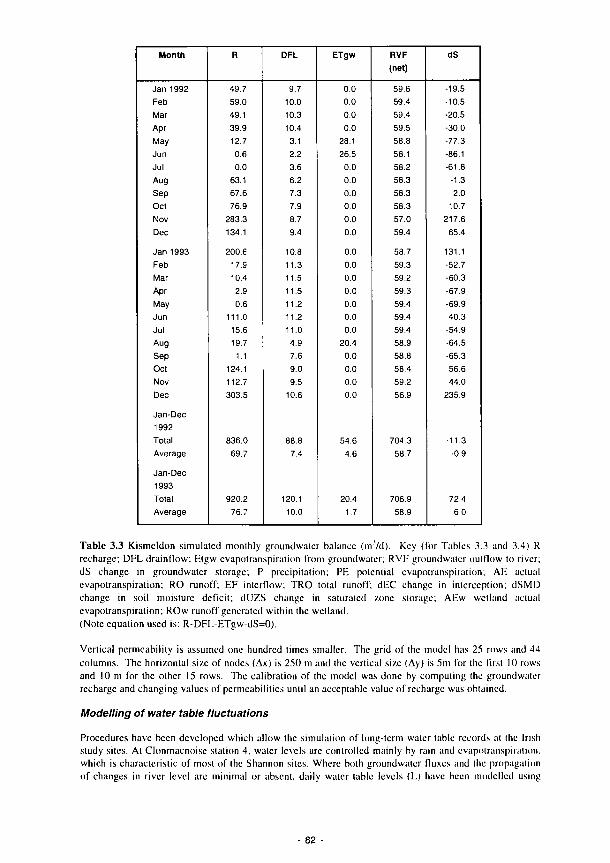
Month
Jan 1992
Feb
Mar
Apr
May
Jun
Jul
Aug
Sep
Oct
Nov
Dec
Jan 1993
Feb
Mar
Apr
May
Jun
Jul
Aug
Sep
Oct
Nov
Dec
Jan-Dec
1992
Total
Average
Jan-Dec
1993
Total
Average
R
49.7
59.0
49.1
39.9
12.7
0.6
0.0
63.1
67.6
76.9
283.3
134.1
200.6
17.9
10.4
2.6
0.6
111.0
15.6
19.7
1.1
124.1
112.7
303.5
836.0
69.7
920.2
76.7
DFL
9.7
10.0
10.3
10.4
3.1
2.2
3.6
6.2
7.3
7.9
8.7
9.4
10.8
11.3
11.5
11.5
11.2
11.2
11.0
4.9
7.6
9.0
9.5
10.6
88.8
7.4
120.1
10.0
ETgw
0.0
0.0
0.0
0.0
28.1
26.5
0.0
0.0
0.0
0.0
0.0
0.0
0.0
0.0
0.0
0.0
0.0
0.0
0.0
20.4
0.0
0.0
0.0
0.0
54.6
4.6
20.4
1.7
RVF
(net)
59.6
59.4
59.4
59.5
58.8
58.1
58.2
58.3
58.3
58.3
57.0
59.4
58.7
59.3
59.2
59.3
59.4
59.4
59.4
58.9
58.8
58.4
59.2
56.9
704.3
58.7
706.9
58.9
dS
-19.5
-10.5
-20.5
-30.0
-77.3
-86.1
-61.8
-1.3
2.0
10.7
217.6
65.4
131.1
-52.7
-60.3
-67.9
-69.9
40.3
-54.9
-64.5
-65.3
56.6
44.0
235.9
-11.3
-0.9
72.4
6.0
Table 3.3 Kismeldon simulated monthly groundwater balance (m7d). Key (for Tables 3.3 and 3.4) R
recharge; DFL drainflow; Etgw évapotranspiration from groundwater; RVF groundwater outflow to river;
dS change in groundwater storage; Ρ precipitation; PE potenlial évapotranspiration; AE aclual
évapotranspiration; RO runoff; EF interflow; TRO total runoff', dEC change in interception; dSMD
change in soil moisture deficit; dUZS change in saturated zone storage; AEw wetland aclual
évapotranspiration; ROw runoff generated within the wetland.
(Note equation used is: R-DFL-ETgw-dS=0).
Vertical permeability is assumed one hundred times smaller. The grid of the model has 25 rows and 44
columns. The horizontal size of nodes (Δχ) is 250 m and the vertical size (Ay) is 5m for the first II) rows
and I0 m for the other 15 rows. The calibration of the model was done by computing the groundwater
recharge and changing values of permeabilities until an acceptable value of recharge was obtained.
Modelling of water table fluctuations
Procedures have been developed which allow the simulation of long-term water tabic records at the Irish
study sites. At Clonmacnoise station 4. water levels are controlled mainly by rain and évapotranspiration,
which is characteristic of most of the Shannon sites. Where both groundwater fluxes and the propagation
of changes in river level are minimal or absent, daily water table levels (L) have been modelled using
- 82

meteorological/hydrometric data, and values for specific storalivity Ss of the soils determined in field and laboratory experiments:
Lt = L M + S s ( P - f E r )
where, of course, water levels above the soil surface are reduced to zero. Levels during floods are determined from river levels. The duration of ponding after river levels have fallen, which is highly variable in space (depending on local morphology) and hard to model independently, has been used as an optimisation variable.
Water Balances
Based on the recharge and groundwater models, the water balances for the Torridge sites shown in Table 3.4 have been calculated for the uphill recharge area, the saturated groundwater system, and the discharging wetland area (all in mm/month). The corresponding equalions are:
(i) P-R-AE-TRO-dEC-dSMD-dUZS=0. where: P=precipilation, R=recharge, AE=actual évapotranspiration, TRO=total runoff (including interflow), dEC=change in interception storage, dSMD=changc in soil moisture and dUZS=change in unsaturated zone storage.
(ii) R-DFL-ETgw-RVF-dS=0 where: DFL=drainflow. ETgw=cvapotranspiration from groundwater, RVF=outflow to the river (net) and dS=change in groundwater storage.
(iii) P+ETgw+DFL-ROw-AEw=0 where: ROw=surface runoff in the discharge area.
Although simplistic the waler balances in Table 3.4 can still provide valuable information. It is clear that RO generation in the wet areas is high especially in the winter when the ET demand is low. Runoff from the uphill area flows downhill towards the wetland but most is intercepted by drainage ditches. Table 3.4 shows that groundwater seepage (part of DFL) is very small. However, it is the only continuous inpul to the wetland and so if the groundwater levels remain sufficiently high it can help the maintenance of wet conditions throughout the year, especially during short term periods with no precipitation.
Using the information in Table 3.4, a generalised total water balance can be formulated for the discharge area. According to the groundwater model the change in storage over the May 1992 - April 1993 period is insignificant and can therefore be ignored. A yearly steady-state water balance would then be as follows:
P+GWI+SWl=AEw+GWO+SWO 922+72+356=417+60+873 m3/d
where: GWI groundwater inflow; SWI surface water inflow; GWO groundwater outflow; SWO surface water outflow.
The generalised water balances presented in Table 3.4 provide the best basis for understanding the chemical inputs to the system. In addition, some groundwater solute transport modelling has been undertaken: as expected, the results show slow movement in the saturated zone.
Water budget analysis
When the boundary of a floodplain unii for which the water budget is calculated is taken at the soil surface, it is possible to calculate annual water budgets of the Shannon sites from only inpuls and outputs during non-flooded periods. The water budget over these periods becomes:
83
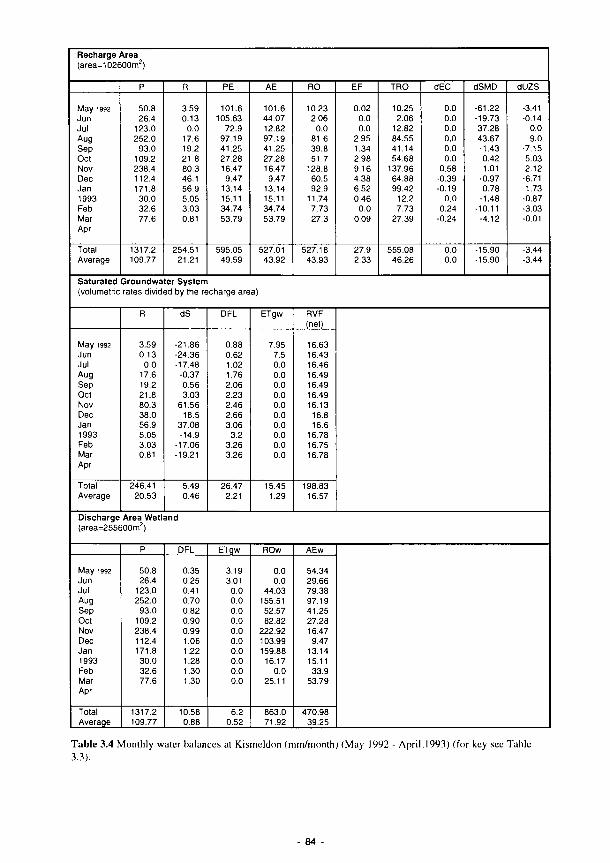
Recharge Area (area=102600m2)
May 1992 Jun Jul Aug Sep Oct Nov Dec Jan 1993 Feb Mar Apr
Total Average
Ρ
50.8 26.4
123.0 252.0
93.0 109.2 238.4 112.4 171.8 30.0 32.6 77.6
1317.2 109.77
Saturated Groundwa (volumetric rates divid
May 1992 Jun Jul Aug Sep Oct Nov Dec Jan 1993 Feb Mar Apr
Total Average
R
3.59 0.13
0.0 17.6 19.2 21.8 80.3 38.0 56.9 5.05 3.03 0.81
24641 20.53
Discharge Area Wetl (area=255600m2)
May 1992 Jun Jul Aug Sep Oct Nov Dec Jan 1993 Feb Mar Apr
Total Average
Ρ
50.8 26.4
123.0 252.0
93.0 109.2 238.4 112.4 171.8 30.0 32.6 77.6
1317.2 109.77
R
3.59 0.13
0.0 17.6 19.2 21.8 80.3 46.1 56.9 5.05 3.03 0.81
254.51 21.21
ter System 2d by the r{
dS
-21.86 -24.36 -17.48
-0.37 0.56 3.03
61.56 18.5
37.08 -14.9
-17.06 -19.21
5.49 0.46
and
DFL
0.35 0.25 0.41 0.70 0.82 0.90 0.99 1.06 1.22 1.28 1.30 1.30
10.58 0 88
PE
101.6 105.63
72.9 97.19 41.25 27.28 16.47
9.47 13.14 15.11 34.74 53.79
595.05 49.59
charge are
DFL
0.88 0.62 1.02 1.76 2.06 2.23 2.46 2.66 3.06
3.2 3.26 3.26
26.47 2.21
ETgw
3.19 3.01
0.0 0.0 0.0 0.0 0.0 0.0 0.0 0.0 0.0 0.0
6.2 0.52
AE
101.6 44.07 12.82 97.19 41.25 27.28 16.47 9.47
13.14 15.11 34.74 53.79
527 01 43.92
a)
ETgw
7.95 7.5 0.0 0.0 0.0 0.0 0.0 0.0 0.0 0.0 0.0 0.0
15.45 1.29
ROw
0.0 0.0
44.03 155.51 52.57 82.82
222.92 103.99 159.88
16.17 0.0
25.11
863.0 71.92
RO
10.23 2.06
0.0 81.6 39.8 51.7
128.8 60.5 92.9
11.74 7.73 27.3
527.18 43.93
RVF (net)
16.63 16.43 16.46 16.49 16.49 16.49 16.13
16.8 16.6
16.78 16.75 16.78
198.83 16.57
AEw
54.34 29.66 79.38 97.19 41.25 27.28 16.47 9.47
13.14 15.11 33.9
53.79
470.98 39.25
EF
0.02 0.0 0.0
2.95 1.34 2.98 9.16 4.38 6.52 0.46
0.0 0.09
27.9 2.33
TRO
10.25 2.06
12.82 84.55 41.14 54.68
137.96 64.88 99.42
12.2 7.73
27.39
555.08 46.26
dEC
0.0 0.0 0.0 0.0 0.0 0.0
0.58 -0.39 -0.19
0.0 0.24
-0.24
0.0 0.0
dSMD
-61.22 -19.73 37 28 43.67 -1.43 0.42 1.01
-0.97 0.78
-1.48 -10.11
-4.12
-15.90 -15.90
dUZS
-3.41 -0.14
0.0 9.0
-7.15 5.03 2.12
-6.71 1.73
-0.87 -3.03 -0.01
-3.44 -3.44
Table 3.4 Monthly water balances at Kismeldon (mm/month) (May 1992 - April.1993) (for key see Tabic 3.3).
84

?inf + GI + RI = E„ + GO +RO + dS
Where: />,·„ƒ■ is the amount of precipitation that actually enters the soil, Gi = groundwater inflow,
Ä/=infiltration of river water during the early stages of floods and through bankinfiltration, Ea = actual
évapotranspiration, GO = groundwater outflow and ÄO=runoff of excess precipitation, towards the river.
Meteorological dala: Ρ has been measured directly. A cropfactor (/) has been determined to relate
potential évapotranspiration (Er, calculated with the Makkink equation) to actual ET (Ea=f Er). Highly
consistent values for ƒ (between 0.85 and 0.92) were found for different units at both sites using several mass-balance methods developed specifically for floodplain conditions.
Modelling procedures: Daily water fluxes were calculated from February '91. The actual model determined the water budget and water level fluctuations at the same time, since they are mutually dependent. The following procedures are applied:
1. During floods all water inputs and outputs through the soil surface are considered zero. 2. The modelling period starts in winter/spring, at a point where soils are completely waterlogged. All rainfall now runs off laterally, as RO. 3. Once Ea exceeds P, the water tabic (L) falls (becomes < 0) and pore space becomes available to store (part of) the rainfall (Plnf). If Ρ exceeds this maximum P;nt, excess rainfall runoff RO is generated. Rainfall infiltration has priority over flooding, meaning that on days when the callows are flooded, rain enters the soil first and only the remaining storage capacity is available for river water infiltration.
3.4 Biogeochemical methods
A variety of methods were utilised to assess and monitor the soil environment and to investigate the nutrienl dynamic functions. Field based, laboratory based and computer simulation techniques were all included in the biogeochemical methods.
3.4.1 Characterisation of the soil environment
Soil studies have aimed to establish relationships between observable (or inferable) soil morphological characteristics, which may be summarised in terms of profile class, and measurable hydrological and physico-chemical properties.
Soil hydrological status is assessed by measuring the depth of the water tabic below the ground surface on a regular basis over at least an annual cycle by means of piezometers and dipwclls. The dynamics of water table fluctuations control the degree and extent to which aerobic or anaerobic conditions prevail and govern important processes such as denitrification. The status of the landscape unit, in terms of the degree and duration of aerobic or anaerobic conditions established at each subsitc in relation to water table fluctuations, has been determined through the measurement of redox potentials, supported by records of the oxygen content in the pore space of topsoils and subsoils. Other important factors affecting the types and rates of biochemical processes in nutrient dynamics are temperature, soil reaction (pH) and rates of organic matter decomposition. Each of these parameters has been measured throughout the fieldwork period.
So/7 Surveys
Soil surveys were carried oui at each site at a preliminary stage once the general locations and research requirements had been agreed by collaborators. A free survey approach was adopted to produce a general purpose soil map for each area (Avery 1987). The work involved the identification and description of the main classes of soils found, mapping their distribution and obtaining some indication of spatial variability within map units. The resultant maps enabled permanent monitoring/sampling stations to be located on soils and land representative of broader geographical areas and as often as possible associated with readily identifiable surface features such as a particular kind of landform or vegetation. The soil survey also enabled each station to be described in terms of soil characteristics relevant to the subsequent scientific research.
- 85 -

Soil profiles were described in terms of a limited number of readily identifiable and consistent profile characteristics including particle-size class (texture), depth, colour/mottling, organic matter status and type of parent material, which could be cither measured or reasonably accurately estimated or inferred in the field. Particular attention was paid to those features related to hydrological status (e.g. depth to mottling, identification of brownish or greyish soil colours, presence of peaty horizons). Field descriptions followed the methods of Hodgson (1981). Soil surveys for each subsile were carried out by sampling using a hand auger to examine soil profiles. A free survey method was adopted, whereby purposive sampling locations were chosen to check boundary locations between map units provisionally established from patterns observed on aerial photographs and observable surface features such as landform or vegetation. In some locations, as for example on parts of the Shannon floodplain. the pattern of superficial alluvial deposition over peat could only be determined by auger observations. At locations finally selected for instrumentation, soils from the main horizons were sampled for laboratory analysis to confirm field estimates of particle-size distribution and organic matter status, and lo determine soil chemistry for the purpose of characterising profiles prior to studies of a range of ecosystem processes. Laboratory methods used arc given in Table 3.5 with fuller descriptions in the Methods Manual. In addition to auger sampling, which is destructive of some observable features, small pits were dug with a spade to enable topsoil characteristics such as soil structure, stoniness, porosity and rooting lo be described. Soil properties which can be readily identified, measured or estimated with reasonable accuracy in the field by non-specialists are particularly valuable in the recognition of hydrogeomorphological units (6.4.1 ), which are key building blocks in the wetland functional assessment procedures under development in this project.
At each of the study sites the soil survey was extended to include land beyond the immediate vicinity of study interest in order to obtain some idea of the spatial variability occurring in soil profile characteristics, thereby enabling chosen study sites to be representative of geographically important types and lo avoid particularly unusual soils from which extrapolation of research results would be of limited value.
Soil Water Regime
At each of the study sites it was of paramount importance to determine the degree and duration of waterlogging of the main soils. Water levels were measured on a regular (usually biweekly) basis over a period of at least two and a half years. The succession of soil waler stales determines the soil water regime, to which a Wetness Class (Table 3.6) can be assigned as an aid to soil characterisation (Hodgson 1981).
Piezometers and dipwclls were used to determine water levels. Piezometers are narrow tubes sei in lite soil which measure hydrostatic head at the posilion of the tube base, while dipwclls are open holes of larger diameter. For practical purposes in permeable material with a freely fluctuating groundwater table, the results from both methods should be the same. However if a layer of lower permeable material is present within or above the base of the piezometer tube, then results of the two methods may differ. Bolli piezometers (installed to a range of depths) and dipwclls were used, the latter also being available for drawdown permeability testing. Full details of construction and installation arc given in lhe Methods Manual.
Redox Potential
Redox potential gives an indication of the intensity of oxidation or reduction (Gambrcll and Palrick 1978) and was measured at specific points using permanently installed platinum electrodes and a portable voltmeter. At each station three replicate probes were installed at (in most cases) depths of 5, 40 and 80 cm to measure the response of redox potential to fluctuations of the water table within lhe topsoil, subsoil and substrate.
Field measurements of redox potential were made on regular site visits, using a portable battery powered pH/mV meter and reference electrode. A saturated calomel half cell was used for reference in the UK, France and Eire, while a silver chloride electrode was used in Spain. The half cell is inserted into the ground surface to make a good contact, moistening the topsoil if dry wilh distilled waler. Meter readings may drift when the system is first connected up. but this usually declines within about two minutes.
86 -
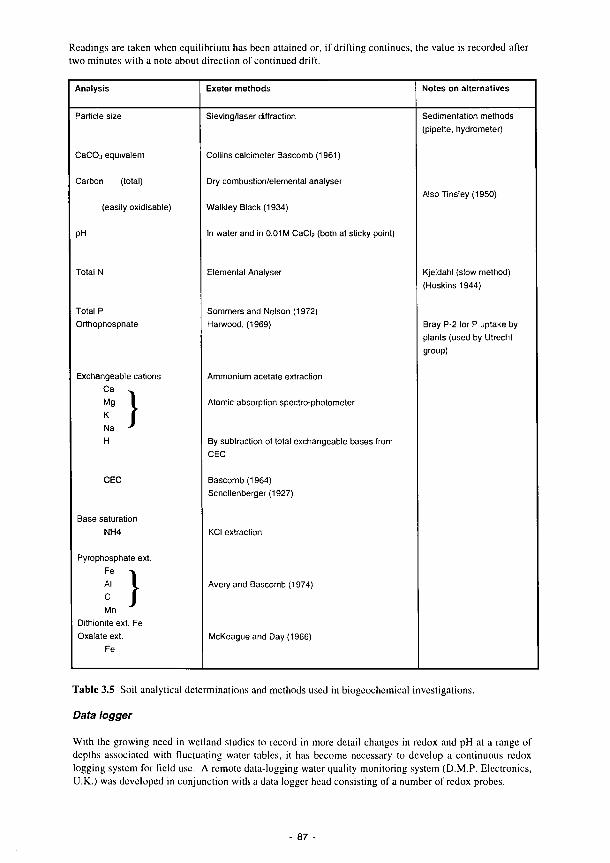
Readings are taken when equilibrium has been attained or, if drifting continues, the value is recorded after
two minutes with a note about direction of continued drift.
Analysis
Particle size
CaC03 equivalent
Carbon (total)
(easily oxidisable)
pH
Total N
Total Ρ
Orthophosphate
Exchangeable cations
Ca , .
Mg
κ I κ Na ■*
Η
CEC
Base Saturation
NH4
Pyrophosphate ext.
Fe ^
c ) J
Μη Dithionite ext. Fe
Oxalate ext.
Fe
Exeter methods
Sieving/laser diffraction
Collins calcimeter Bascomb (1961)
Dry combustion/elemental analyser
Walkley Black (1934)
In water and in 0.01 M CaCl2 (both at sticky point)
Elemental Analyser
Sommers and Nelson (1972)
Harwood, (1969)
Ammonium acetate extraction
Atomic absorption spectro-photometer
By subtraction of total exchangeable bases from
CEC
Bascomb (1964)
Schonenberger (1927)
KCl extraction
Avery and Bascomb (1974)
McKeague and Day (1966)
Notes on alternatives
Sedimentation methods
(pipette, hydrometer)
Also Tinsley (1950)
Kjeldahl (slow method)
(Hoskins 1944)
Bray P-2 for Ρ uptake by
plants (used by Utrecht
group)
Table 3.5 Soil analytical determinations and methods used in biogeochemical investigations.
Data logger
With the growing need in wetland studies to record in more detail changes in redox and pH at a range of
depths associated with fluctuating water tables, it has become necessary to develop a continuous redox
logging system for field use. A remote data-logging water quality monitoring system (D.M.P. Electronics,
U.K.) was developed in conjunction wilh a data logger head consisting of a number of redox probes.
- 87

Class Description
I
II
III
I V
ν
VI
The soil profile is not wet within 70cm depth for more than 30 days' in most years2. The soil profile is wet within 70cm depth for 30-90 days in most years. The soil profile is wet within 70cm depth for 90-180 days in most years. The soil profile is wet within 70cm depth for more than 180 days, but not wet within 40cm depth for more than 180 days in most years. The soil profile is wet within 40cm depth for more than 180 days, and is usually wet within 70cm for more than 335 days in most years. The soil profile is wet within 40cm depth for more than 335 days in most years.
' The number of days specified is not necessarily a continuous period. 2 'In most years' is defined as more than 10 out of 20 years.
Table 3.6 Soil moisture regime classes (from Hodgson, I981 ).
The waterproof housing and logger head was designed and constructed in the Department of Geography, University of Exeter. It is also intended thai the data logging system will aid studies conducted in laboratory microcosms into nutrient cycling in wetland soil systems. The logger enables in situ studies to be undertaken of soil redox. pH and temperature under natural environmental conditions, and provides a cost effective way of assessing wetland field sites in respect to their physico-chemical status.
The system consists of three main parts. The logger head comprises thirty platinum redox probes (encased in stainless steel) all of which can be adjusted in length, three 'free' probes comprising a calomel reference cell, a temperature and a pH probe. A collar is attached to the base of the logger head to act as a support when housed on unstable and/or uneven ground in the field. The loggerhead is attached to a waterproof monitoring box by a 25m multi-core cable. A water-tight lid to the box allows access to the connection sockets within for attachment to a battery recharger and lo a portable Amstrad PC. Whilst in the field the logger is powered by a rechargeable I2v lead-acid battery. The portable Amstrad PPC5I2 is a single disk drive PC and is used to set experiment parameters, arm the logger and down-load finished data cither in the laboratory or in the field. The modified CMOS micro-processor of (he logger stores data in the RAM (Random Access Memory) with a capacity to accept up to 500,000 readings.
Before field installation, the logger must be calibrated and experimental parameters set. Calibration of the redox probes is carried out using a standard solution of potassium hydrogen phthalale, saturated with quinhydrone (pH 4.00, 218 mV) at 25°C. (Handbook of Chemical and Physical Standards, CRC Press), The pH probe is also calibrated, using pH buffers 7.00 and 4.00. Depending on the experimental requirements the redox probes can be adjusted in length at this stage. The lime interval between data logging can be set from minutes to hours. The reading of all (he probe channels takes three minutes in total.
At the end of each experimental session data were down-loaded from the monitoring box to the Amstrad either directly in the field or back in the laboratory. The correction for the calomel half-cell (+244 mv) and individual probe error was done during the down-loading process by the Amstrad. No automatic correction of redox to pH 7 was carried out by the Amstrad.
The data logging system had been used previously for cstuarinc surveys (Koch et al, 1990) and for monitoring a freshwater fen system (Hogan and Maltby, 1990b). Initial results from the logger had been used to measure variations occurring between weekly readings of permanent redox probes in the fen, taken over a period of eighteen months. Often there is considerable noise during the initial period of logging, but the readings become generally stable after 3-4 days.
Gaseous Oxygen Content
Oxygen content of the air-filled soil pore spaces is measured in diffusion chambers, using the method described by Faulkner and Richardson (1989) with some minor modifications. The chamber comprises a
88 -
PVC cup of 5cm internal and 6cm external diameter. Flexible plastic tubing is attached to the cup by means of a screw top connector, which is fixed firmly through a hole drilled in the base of the cup. The tubing should be cut to a length a little longer than the intended depth of the top of the cup when installed in the soil. A stopcock valve is then fixed to the end of the tubing. It is important that the whole assembly should be airtight.
The chambers were installed in dry conditions when soils were unsaturated at convenient opportunities during the summer of 1991. At most of the field stations the chambers were set at 10cm and 40cm depth.
The oxygen content of the soil atmosphere is measured with a portable oxygen meter, as explained by Faulkner and Richardson (1989). In summary a sample of the air trapped in the chamber is drawn off across the sensor head of an oxygen probe using a 50ml plastic syringe. After recording the measurement from the meter the air is returned to the chamber by expelling the contents of the syringe.
So/7 samples
Bulk soil samples were taken during the period of soil survey for laboratory analyses of particle-size, organic matter content and the following chemical parameters: nitrate, ammonium, phosphates, potassium, sodium, magnesium and calcium. At this stage the selection of material to sample is of great importance as it should be representative of the main profile characteristics of interest required to characterise the study sites. Loose disturbed samples are taken from shallow pits for upper horizons using a spade or trowel, and by a Dutch auger for deeper subsoil material. Care is required with the latter method to ensure that the auger is cleared of other soil material immediately prior to sampling at the required depth. Bulk soil samples are collected in polythene bags, tied at the neck, for transportation to the laboratory for analysis.
For more detailed study and associated sampling of upper horizons, as required for the investigations of past flood deposits on the Shannon floodplain, undisturbed monolith samples were collected in metal trays (30cm long χ 10cm wide χ 5cm deep). The field technique was to excavate a hole with a spade a little deeper than the required monolith tray which was then placed vertically in the hole with the edges of the tray sides against the pitface and the top of the tray level with the ground surface. The tray was then carefully pushed into the pit face, tapping gently with a soft-headed mallet if necessary, until filled completely with soil material. The tray was then carefully dug out with a generous surplus of soil to minimise the risk of disturbance. The tray and contents were removed from the hole, and excess soil material pared from the sample with a sharp knife until the monolith face was flush with the edges of the tray, i.e. the tray is completely full of undisturbed soil material. The monolith was then protected by winding a length of fabric material such as a medical bandage around the sample to prevent disturbance during transport. The complete monolith was enclosed in a polythene bag and sealed with tape to exclude air and prevent drying out prior to description and sampling.
Water samples
Water samples were collected monthly during field visits to the sludy sites. Laboratory determination of pH, electrical conductivity and the following chemical analyses: nitrate, ammonium, potassium, sodium, magnesium, calcium, chloride, sulphate and phosphate, were carried out as part of the nutrient dynamics investigations. Surface water samples were collected directly into polythene bottles from rivers, ditches and ponds.
Soil water held within drainablc pores (>2mm diameter) was sampled from piezometer lubes. The method was to pump out waler standing in the lubes after recording the levels for the regular monitoring of soil waler regime. Water recharging the lubes is sampled using a small hand pump connected via a polythene sampling bottle.
In order to be able to sample soil water held at higher tension (pores < 2mm diameter), porous ceramic suction cups were installed permanently in the soil for the duration of the project. At each station water samplers were set at 10cm and 40cm depth unless precluded by adverse hydrological conditions.
- 89 -
To sample water a vacuum is created within the cup using a hand pump which causes moisture to he
drawn from the soil through the porous ceramic material into the cup. The rate of sample collection
depends upon the capillary conductivity of the soil, the tension under which the soil waler is held (which
depends on pore-size distribution), and the vacuum created in lhe sampler. The type of hand pump used
in this project, creating a tension in the range 60-70cm of mercury, enabled adequale sample to be
collected from most soils within an hour or two. and frequently considerably quicker. On some occasions.
such as during dry periods on soils of low available water capacity, it was not possible lo collect an
adequate volume of water for laboratory analysis, even after maintaining the vacuum for 24 hours.
3.4.2 Investigations of nutrient dynamics functions
A series of field and laboratory investigations was carried out to determine the conditions and controls
which regúlale the capacity of river marginal wetland ecosystems to remove, retain or release nutrients (N
and P) and to assess process rates in order to enable environmental benefits to be quantified.
The impact of nutrient additions due to former land use on nutrient related processes
The objective of this sludy was to compare the role of the vegetation in two river corridor wetland siles
along the Torridge river differing in nutrient history. The impact was examined in terms of soil nutrient
pools, biomass produclion. nutrient uptake, N-mineralisation and P-releasc. Simultaneously, the possible
use of easily measured indicators for these pools and processes was investigated.
Additions of nitrogen (N) or phosphorus (P) have been found to increase plani production and to decrease
species diversity in a range of ecosystems, for example dry and wet heathlands (Aerts and Berendse,
1988), fens (Verhoeven et al, 1983; Verhoeven and Schmitz, 1991) and wet grasslands (Vermeer, 1986).
Nutrient additions increase plant production directly by increasing the amount of nutrients available for
plant uptake. Whether plant production is stimulated by addition of a particular nutrienl depends upon the
nutrient that is in limiting supply. The most common way to determine the limitation is to conduct a
fertilisation experiment (Chapin et al. 1986). A possible, more easy assessment of nutrient limitation is the
measurement of the N/P ratio in living biomass. At an N/P ratio of 14-16 it is thought thai both nutrients
are equally limiting. N is limiting when the N/P ratio is below 14 and Ρ when this ralio exceeds 16
(Verhoeven et al, 1994).
In addition to directly increasing soil nutrient availability, nutrienl additions may also stimulate
mineralisation of soil organic matter (Verhoeven and Arts, 1987; Berendse et al. 1989; van Vuuren et al,
1992). An increase of mineralisation after nutrient additions can be brought aboul by a larger pool of soil
organic matter, built up during a gradual succession towards more productive vegetation types (Berendse,
1990). It can also result from the effeel of a change in the chemical composition of plant litter during
succession, through which the quality of soil organic matter changes (van Vuuren and Berendse, 1992).
The quality of soil organic matter can be expressed by C/N and C/P ratios. The critical C/N and C/P
ratios, below which net mineralisation occurs, are 20 and 200 respectively (Black and Goring, 1953;
Parnas, 1975; Brinson, I977;Haynes. 1986).
The above described direct and indirect effects of nutrienl additions suggest thai the vegetation is not only
dependent on nutrient availability, but also determines nutrient availability through influences on the
quantity and quality of soil organic matter.
Soil analyses
Net soil mineralisation was measured in the field using of in situ soil core incubations (Binklcy and Hart,
1989). Two identical soil cores arc taken at the start. One core is immediately returned to the laboratory
for analysis of nutrienl availability, while the other is returned to the soil and incubated for a
predetermined period of time after which it also is analysed for nutrienl availability. The difference in
inorganic nutrient availability is a measure of net mineralisation. Measurement of P-mincralisation is
problematic due to numerous transformations between available and bound P-pools, which mask nel
microbial mineralisation of Ρ (Walbridge and Vitousek, 1987). Therefore, the term P-relcasc is used here
lo refer to the total effect of microbial and chemical transformations on soil P-availability. The
mineralisation study started at the beginning of May 1991 and incubations lasted for 8 weeks. At each of
90 -

the 4 studied sub-sites replicate (n=5 at minimum) soil core incubations were carried out, using capped PVC-tubes that were drilled at the top for gas exchange. After collection, soil samples were stored at 4°C and extracted within 3 days for nitrogen (KCl extradant) and phosphorus availability (Bray-P2 method, Bray and Kurtz, 1945). Soil moisture content of soil samples was determined by drying soil for 48 hours at 105°C. Dried soil samples were stored for later analyses of total N and Ρ and organic matter content (by acid digestion and loss on ignition (LOI) respectively).
Several variables were calculated from the data: organic C by multiplying LOI by 0.58 (Grewal et al, 1991); organic bound Ν by subtracting available inorganic Ν from total N; soil bound Ρ by subtracting available inorganic Ρ from total P; C/N ratio of soil organic matter by dividing organic C by organic bound N; C/P ratio of soil by dividing organic C by soil bound P; net mineralisation or release rales per gram dry soil were converted to area (to a depth of 10 cm) by multiplying with the bulk density. Net relative N-mineralisation or P-release rates are obtained by dividing rates per gram dry soil by soil organic Ν and soil bound Ρ contents respectively. For each incubation period soil samples were taken near the area that was used for the previous period, thus giving replicated time series. By adding all net mineralisation or release rates of each period for each replicate, summer values with standard errors were obtained.
Plant analyses Replicate above ground biomass samples (at a minimum of n=5) were collected at each sub-site using 40x40cm sample frames. On the impacted slope, the ground cover of vegetation tussocks was estimated, and the tussocks were sampled using the same 40x40cm frames. Between sampling dates the vegetation was protected from grazing by the use of cattle exclosures if necessary. After each sampling period cages were removed and a formerly unprotected area was excluded from grazing for the next period. Above ground biomass was harvested inside and outside the cages at each sampling date, at intervals of 8 weeks. Biomass samples were stored at -20°C before they were sorted into live (green) and dead (brown) fractions. Fractions were dried for 48 hours at 70°C, weighed and analysed for Ν, Ρ and Κ content (acid digestion).
Above ground production was calculated by the increase of live and/or dead biomass between sampling dates, and nutrient uptake by the increase of nutrient contents of live and/or dead biomass between sampling dates (Aerts et al, 1989 according to McClaugherty et al, 1982).
Statistics Means, standard errors and statistical differences were calculated using the software package SAS for MS-DOS computers (SAS, 1985). Statistical differences were obtained by using t-tests in which impacted and non-impacted sub-sites were compared. This was done for floodplains and slopes separately because of the different nature of the soils. In case of unequal variances data were logarithmically transformed. Correlations between process rates and possible controlling factors were calculated with the curve-fit option in the Cricket-Graph package for Apple-Macintosh computers.
The impact of increased sedimentation on nutrient-related processes
Many nutrienl inputs to ecosystems have been enhanced by human activities such as atmospheric deposition (Heil and Bobbink, 1993) fertilisation and inputs of polluted ground- or surface waler (Verhoeven et al., 1988; Verhoeven and van der Toorn, 1990). The general purpose of the study described here is to analyse whether increased inputs through river sedimentation have a stimulating effect on nutrient-related processes. From May to July 1993, field-work was carried out on two Irish floodplains along the rivers Shannon and the Little Brosna. The starting point for comparing these two rivers was the assumption that the Little Brosna shows higher amounts of sedimentation of nutrient- carrying mineral and/or organic material, as a consequence of human activities higher up in the catchment (such as peat mining or agricultural activities on floodplains). The Shannon at Clonmacnoise on the other hand, does not carry large amounts of sediment, principally because Lough Ree functions as a sink (Hooycr 1991), although recent changes in land use within the catchment may have had some effects. Many soil profiles are developed in peat overlain by bands of silty river alluvium, indicating former depositiona! events.
From May to July 1993 several processes were measured. At the beginning and the end of' this period, vegetation was sampled by clipping biomass in 40x40 cm quadrants. Vegetation was sorted into living and
91
dead biomass. Different fractions were weighed and analysed for Ν, Ρ and Κ contents by acid digestion. At the beginning, duplicate soil cores were taken wilh PVC-tubcs to determine N-mineralisation. One of each pair was analysed immediately for extractable P04 ' (Bray P-2 extradant), NO, and NH4. (KCl extradant). The second core of each pair was capped and placed back into the field. These cores were collected at the end of the sampling period and analysed for extractable Ν again. Changes in biomass, plant nutrient contents and extractable Ν throughout this period were calculated (i.e. plant production, nutrient uptake. N-mineralisation). The extractable Ρ at the beginning was used as an index of the amount of P-pools present in the soil that can deliver P04 ' for plant uptake. Soils were also analysed for their water content (W), pH, bulk density (Pb), organic matter content (LOI) and total nutrient content. More details on the methods used are given in the Methods Manual and Bakker et al, (1993).
Analytical approach The following statistical and analytical techniques were used in analysing the data-set:
1. Initially comparable stations between river study sites were identified along established transects. These paired locations, named "classes" hereafter, to prevent confusion with the term stations, were used in further ANOVAs;
2. In order to carry out impact analysis, two-way ANOVAs were performed wilh classes (A to E) and rivers (CM for Clonmacnoise; LB for Little Brosna) as main factors. This was done for parameters describing soil structure and soil nutrient pools, for soil-processes contributing to nutrient availability and for parameters describing vegetation-processes;
3. To find the relationships between processes and their controlling factors, multiple regressions were performed for the following nutrient-related processes:
• N-mineralisation per m2 and per gram soil organic-N; • Bray extractable P0 4 ' , both per m2 and per gram soil bound-P; • Production of biomass; • N-and P-uptakc of vegetation.
4. To determine whether differences between sites are caused by the sedimentation impact, rather than by other factors that vary between the rivers and between stations, analysis of covariance was performed with the main controlling factors (found in the multiple regressions) as covariates.
Nutrient-limited plant production as assessed by field and phytometer-experiments
Limitation of plant production by nutrients is usually assessed in a fertilisation experiment although phytometer studies can also be used for this purpose. Phytomctcrs indicate the fertility of soils (Wheeler et ai, 1992) and in a fertilisation experiment they can also assess which nutrient is in short supply for their growth. Knowledge about the limiting factor is very useful for impact assessment and habitat restoration. In impact assessment, knowledge about limitations is used to predict whether plant production will increase as nutrient inputs are enhanced. Furthermore, as productivity increases, species diversity will also change. For restoration of valuable, low-productive communities it has been proposed to reduce inpuls or increase outputs of the limiting nutrient, as that would give the quickest effect (Koersclman and Verhoeven, 1993). Thus, there is a need for easily measured indicators for assessing nutrient limitations. Using the critical plant-concentrations, below which plants experience shortages (derived by dc Wit et al, 1963), a critical N/P ratio can be defined. For N. the critical concentration is 14 mgN/g, for Ρ 0.7 mgP/g and for Κ 8 mgK/g. When Ν and Ρ are equally limiting, the N/P ratio should theorcticlly be about 20. Recently Verhoeven et al (1994) reviewed a number of fertilisation experiments in types of wet grassland vegetation and concluded that N/P rations between 14 and 16 indicate a limitation of both Ν and P. Rations higher than 16 indicate a P-limitation. while those lower than 14 indicate a N-limitation.
The aim of the studies described here is to assess experimentally the impact of nutrient additions on plant production in the unimpacted sites of the Torridge and Shannon study areas, and to determine which particular nutrient is limiting plant production at these sites. Information is gathered on the usefulness of critical nutrient concentrations and ratios for assessing nutrient limitations. Furthermore, the use of
- 92
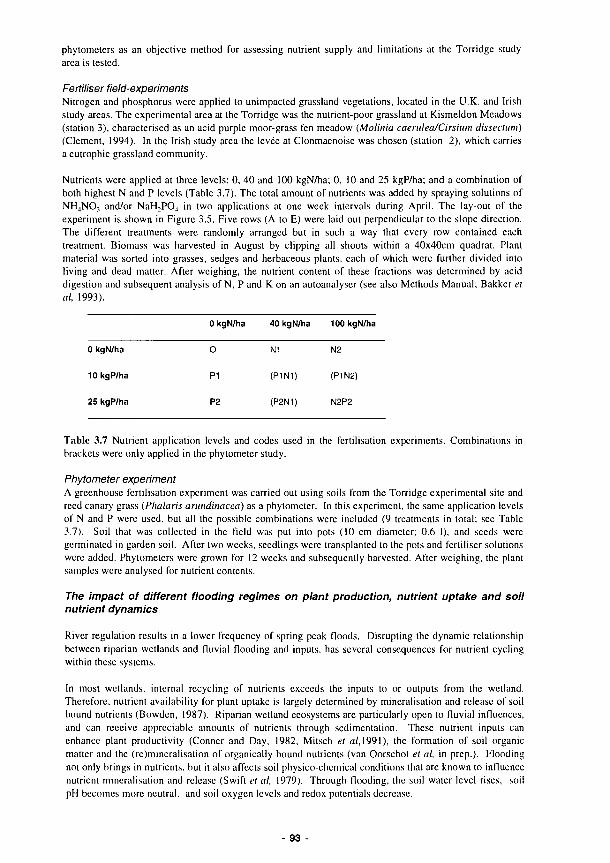
phytometers as an objective method for assessing nutrient supply and limitations at the Torridge study
area is tested.
Fertiliser field-experiments
Nitrogen and phosphorus were applied to unimpacted grassland vegetations, located in the U.K. and Irish
sludy areas. The experimental area at the Torridge was the nutrient-poor grassland at Kismeldon Meadows
(station 3), characterised as an acid purple moor-grass fen meadow (Molinia caerulea/Cirsium dissecami)
(Clement, 1994). In the Irish study area the levée at Clonmacnoise was chosen (station 2), which carries
a eutrophic grassland community.
Nutrients were applied at three levels: 0, 40 and 100 kgN/ha; 0, 10 and 25 kgP/ha; and a combination of
both highest N and Ρ levels (Table 3.7). The total amount of nutrients was added by spraying solutions of
NHjNO, and/or NaH ;P04 in two applications at one week intervals during April. The lay-out of the
experiment is shown in Figure 3.5. Five rows (A to E) were laid out perpendicular to the slope direction.
The different treatments were randomly arranged but in such a way that every row contained each
treatment. Biomass was harvested in August by clipping all shoots within a 40x40cm quadrat. Plant
material was sorted into grasses, sedges and herbaceous plants, each of which were further divided into
living and dead matter. After weighing, the nutrient content of these fractions was determined by acid
digestion and subsequent analysis of Ν, Ρ and Κ on an autoanalyser (see also Methods Manual; Bakker et
al. 1993).
0 kgN/ha 40 kgN/ha 100 kgN/ha
0 kgN/ha O N1 N2
10kgP/ha P1 (P1N1) (P1N2)
25kgP/ha P2 (P2N1) N2P2
Table 3.7 Nutrient application levels and codes used in the fertilisation experiments. Combinations in
brackets were only applied in the phylometer sludy.
Phytometer experiment
A greenhouse fertilisation experiment was carried out using soils from the Torridge experimental site and
reed canary grass (Phalaris arundinacea) as a phytometer. In this experiment, the same application levels
of Ν and Ρ were used, but all the possible combinations were included (9 treatments in total; see Table
3.7). Soil that was collected in the field was put into pots (10 cm diameter; 0.6 I), and seeds were
germinated in garden soil. After two weeks, seedlings were transplanted to the pots and fertiliser solutions
were added. Phytometers were grown for 12 weeks and subsequently harvested. After weighing, the plant
samples were analysed for nutrient contents.
The impact of different flooding regimes on plant production, nutrient uptake and soil
nutrient dynamics
River regulation results in a lower frequency of spring peak floods. Disrupting the dynamic relationship
between riparian wetlands and fluvial flooding and inputs, has several consequences for nutrient cycling
within these systems.
In most wetlands, internal recycling of nutrients exceeds the inputs to or outputs from the wetland.
Therefore, nutrient availability for plant uptake is largely determined by mineralisation and release of soil
bound nutrients (Bowden, 1987). Riparian wetland ecosystems are particularly open to fluvial influences,
and can receive appreciable amounts of nutrients through sedimentation. These nutrient inputs can
enhance plant productivity (Conner and Day, 1982, Mitsch et al, 1991), the formation of soil organic
matter and the (rc)mineralisation of organically bound nutrients (van Oorschot ef al, in prep.). Flooding
not only brings in nutrients, but it also affects soil physico-chemical conditions that arc known to influence
nutrient mineralisation and release (Swift et al, 1979). Through flooding, the soil water level rises, soil
pH becomes more neutral, and soil oxygen levels and redox potentials decrease.
93 -
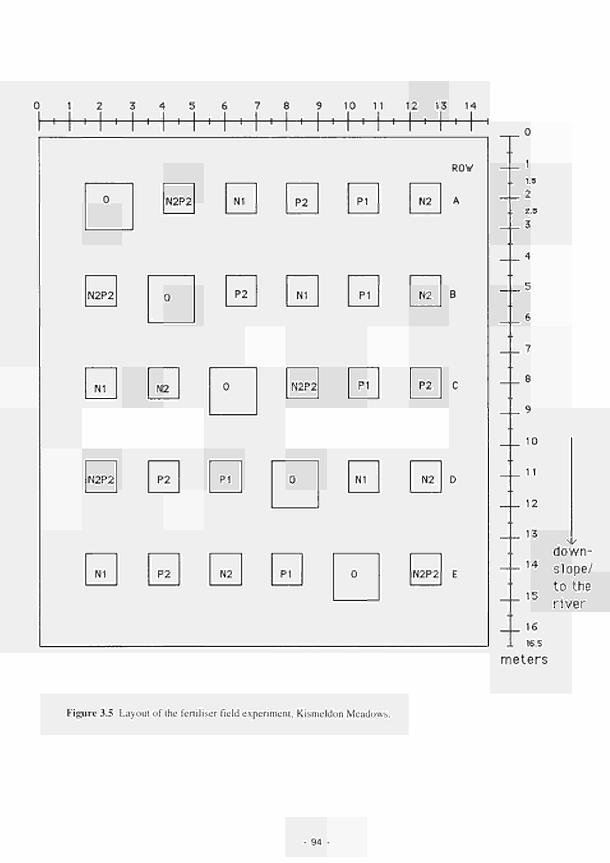
i.a 2 2.3
3
4
5
6
7
8
9
IO
1 1
12
13
14
15
16 16.5
meters
down-slope/ to the river
Figure 3.5 Layout of the fertiliser field experiment, Kismeldon Meadows.
94
The purpose of this study was to analyse the effects of an altered flooding regime on nutrient mineralisation and availability, and plant production and nutrient uptake.
In 1991, comparative field-work was done in the French study sites at Decize and Apremont focusing on the grassland units. At both sites grasslands are divided into parts with relatively low and relatively high elevation (swales and ridges). These differences in elevation can lead to variations in soil moisture levels unrelated to the different flooding regimes of the rivers at each site. Semi-dry grassland on the elevated parts of the floodplain at Decize contrasts with mesic flood swales on similar sites at Apremont.
Biomass production was measured by sequential sampling of above ground biomass throughout the season. Biomass was sorted into living and dead material, dried, weighed and analysed for Ν, Ρ and Κ content (acid digestion). Plant production and death was calculated according to McClaugherty et al (1982). To protect the vegetation against grazing by cattle exclosure cages were used and moved after each sampling date. Grazing was quantified by sampling biomass and comparing plant production inside and outside exclosures.
N-mineralisation and nutrient availability were determined by sequential soil core incubation as described above (soil analysis). The incubation period was about 6 weeks. Soil samples were also used to determine waler content, bulk density, soil pH ( IM KCl), organic matter content (loss on ignition at 530°C) and soil nutrient content (acid digestion). Additional soil samples were taken for determination of pF-curves. Further details of methods are given in the Methods Manual and by van Oorschot (1994). Because the period from May to July is crucial for plant production and for reasons of comparison with results from the other study areas, a detailed comparison is presented for this period only.
The effect of different soil moisture levels on Nitrogen mineralisation and Phosphorus availability
River regulation has several consequences. Dams arc construcled to reduce the risk of high peaks in spring discharge (Purseglovc, 1991). This causes a reduced flooding frequency in floodplain ecosystems. Water levels are further reduced due to gravel extraction from river beds. These impacts lead to a reduction in fluvial inputs of nutrients, and to a decline in soil moisture of floodplain ecosystems. Reduced soil moisture conditions can influence plant production directly during dry periods, and indirectly by reducing soil nutrient availability.
Soil moisture control on nitrogen mineralisation and phosphorus availability was difficult to investigate in lhe field study. Therefore, an experiment was designed in which water levels could be manipulated in containers with intact turfs taken from the French study area.
In November 1992, 15 soil turfs were collected from both ridges in the two French floodplain grasslands of the Allier and Loire. Turfs (50 χ 50 χ 20 cm) were transported to a greenhouse in Utrecht, where they were transferred to containers about 1.2 m high that were filled with 100 cm of river sand. At the beginning of April 1993, three different water levels were established by drilling holes in the containers at different depths from the soil surface (0, 20 and 120 cm: wet, control and dry treatment respectively; Figure 3.6). Thus, a balanced set-up was obtained (2 areas χ 3 treatments χ 5 replicates - 30 turfs). Waler with a composition resembling groundwater was applied through a piezometer, to simulate different groundwater levels. At regular intervals water was also sprayed over the vegetation to mimic rainfall.
Each turf was inslrumented with redox probes and oxygen cups to monitor redox potentials and soil oxygen concentrations at two-weekly intervals. In addition, the soil water content was determined by sampling and drying fresh soil samples. Soil moisture tension was calculated using pF-curves that were determined for these soils. Cotton strips were inserted on two occasions for two week periods to measure tensile strength loss. Temperature readings were taken at 5cm below the soil surface.
After the water levels were set, and conditions had become stable, two replicate soil cores were taken from each container. One was used for immediate measurement of denitrification, extractable Ν (0.2 Μ Κ Cl) and P (Bray -Ρ2) and pH (0.01 M CaCl2). The second core was kept in a controlled climate chamber (20°C) and water was added to compensate for weight loss through evaporation. During a six week period, C-mineralisation was determined by incubating the soil cores for 24 hours in glass tubes, and
95
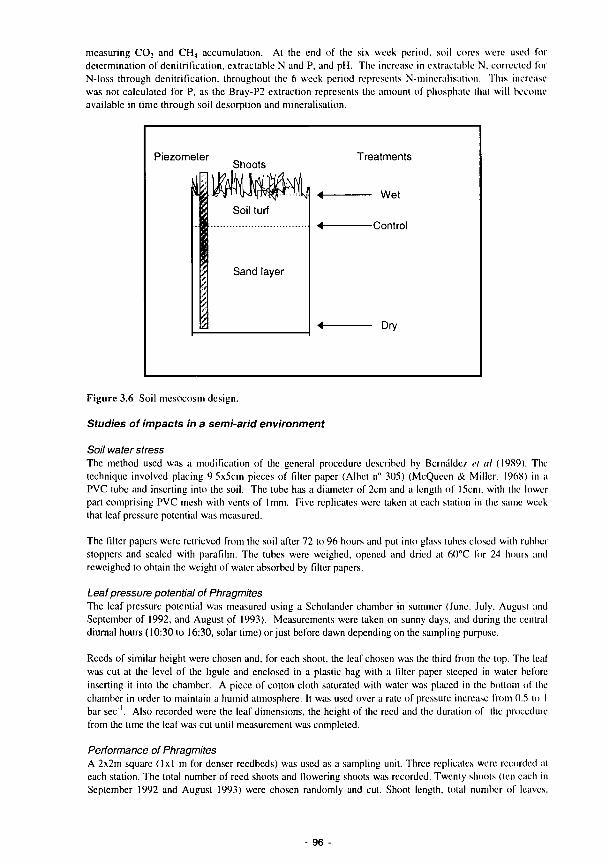
measuring C02 and CH4 accumulation. At the end of the six week period, soil cores were used for determination of denitrification, extractable N and P, and pH. The increase in extractable N, corrected for N-loss through denitrification. throughout the 6 week period represents N-mineralisation. This increase was not calculated for P, as the Bray-P2 extraction represents the amount of phosphate thai will become available in time through soil desorption and mineralisation.
Piezometer Shoots
Treatments
- Wet
-Control
Dry
Figure 3.6 Soil mesocosm design.
Studies of impacts in a semi-arid environment
Soil water stress The method used was a modification of the general procedure described by Bernaldez et al (1989). The technique involved placing 9 5x5cm pieces of filter paper (Albet n° 305) (McQueen & Miller, 1968) in a PVC tube and inserting into the soil. The tube has a diameter of 2cm and a length of 15cm, with lhe lower part comprising PVC mesh with vents of 1mm. Five replicates were taken at each station in the same week that leaf pressure potential was measured.
The filter papers were retrieved from the soil after 72 to 96 hours and put into glass tubes closed wilh rubber stoppers and sealed with parafilm. The tubes were weighed, opened and dried al 60°C for 24 hours and rcweighed to obtain the weight of water absorbed by filter papers.
Leaf pressure potential of Phragmites The leaf pressure potential was measured using a Scholander chamber in summer (June, July. August and September of 1992, and August of 1993). Measurements were taken on sunny days, and during the cenital diurnal hours (10:30 to 16:30, solar time) orjusl before dawn depending on the sampling purpose.
Reeds of similar height were chosen and, for each shoot, the leaf chosen was the third from lhe lop. The leaf was cut at the level of the ligule and enclosed in a plastic bag with a filler paper steeped in water before inserting it into the chamber. A piece of cotton cloth saturated with water was placed in the bottom of the chamber in order to maintain a humid atmosphere. It was used over a rale of pressure increase from 0.5 lo I bar sec'. Also recorded were the leaf dimensions, the height of the reed and the duration of the procedure from the time the leaf was cut until measurement was completed.
Performance of Phragmites A 2x2m square (lxl m for denser reedbeds) was used as a sampling unit. Three replicates were recorded at each station. The total number of reed shoots and flowering shoots was recorded. Twenty shoots (ten each in September 1992 and August 1993) were chosen randomly and cut. Shoot length, lotal number of leaves,
- 96
diameter of shoot base, length of inflorescence and of the two lower internodes were measured in each selected shoot, together with the length and width of the blade of the third leaf of each shoot. After measurement, shoots were dried in an oven at 60°C for 48 hours and weighed for determination of biomass.
Plant production A destructive method was adopted for the estimate of plant production, biomass sampling being carried out in January, May, July, August and September of 1993. Three squares of Ixl m (0.5x0.5 m in stations wilh denser and homogeneous vegetation) were placed at each station and all above ground biomass was cut. The plant material was separated into live and dead culms and into main species. Only live plant material was dried at 60°C and weighed. For estimation of production the previous biomass (January) was subtracted from the maximum biomass for each perennial species. Directly measured maximum biomass was used for annual species.
Denitrification studies
Denitrification is the process by which oxides of nitrogen, principally NO, and N02, are reduced to di-nitrogen gases N2 and N20. Its importance as a biogeochemical process lies in its role in the nitrogen cycle as a means of removing nitrate from soil/water systems, by conversion to gaseous products which can be lost to the atmosphere, thereby maintaining or enhancing environmental quality. In river marginal wetlands this process can be of particular benefit in enabling the land to act as a buffer to protect the river against nitrate enrichment from agricultural sources. Measurements of denitrification were carried out on a monthly basis at all stations in Ireland, UK and France, flooding and other conditions permitting. The sites studied represented a wide range of soil and hydrological conditions, enabling conditions to be identified under which maximum rates of denitrification arc likely to take place. Replicated sampling enabled assessments of spatial variability to be made.
The method used was the acetylene inhibition technique (Yoshinari and Knowles., 1976), which measures the reduction of NO, and N02 to N20 by blocking further reduction to N2 with acetylene gas and determining the final N20 concentration on a gas Chromatograph. At each station five replicate soil cores at 0 - 10 cm depth were collected in perforated plastic tubes, each of which was transferred to a Kilncr jar. Cores were taken from random locations around each station. 50 ml of acetylene gas were injected into the headspaee of each jar, which was then incubated for 24 hours in a trench excavated at the study site. After incubation a 5 ml sample was drawn from the headspaee and transferred to a small glass botile for transport lo lhe laboratory where samples were stored, preferably at low temperature in a refrigerator. Analysis for N20 concentration was carried out using a healed electron capture gas Chromatograph. Each sample was standardised to 100 ppm (voLvol) N20 standard. The moisture content of the soil was determined to calculate the dissolved N20 using solubility coefficient and Henry's Law (Moraghan and Burcsh, 1977).
Phosphorus experimental procedures
Soil phosphorus Soil phosphorus fractions were determined using the Mchta et α/.(1954) technique wilh the Anderson (1960) prc-trcatment. This method for calculating total, inorganic and organic fractions is based on sequential extractions of dilute acid and alkali with the organic fraction determined by perchloric digestion. The Anderson pre-treatmenl of very dilute alkali is conducted to extract the organic phosphorus lo prevent hydrolysis in the following acidic extractions.
Soluble reactive phosphorus (SRP) The SRP was determined using the molybdate blue technique (Murphy and Riley, 1962) with tin chloride as the reducing agent. The molybdate blue was assessed by segmentation flow analysis.
Bioavailable phosphorus Bioavailablc phosphorus was determined using an anion exchange resin bag technique developed at the University of Exeter. Chloride dominated anion exchange resin was placed within an 8 χ 5cm polyester bag. The bags were placed within the top 10cm of the soil and retrieved alter two weeks. The phosphate ions adsorbed onto the resin matrix were removed using dilute hydrochloric acid. The resulting solution was determined for SRP by the molybdate blue technique.
- 97
Phosphorus adsorption indices
The capacity of soil for short-term adsorption of phosphate from solution is an important component of lhe nutrient retention function (P storage) of wetlands and was estimated in the laboratory by measuring phosphate adsorption by soil from solutions of various Ρ concentrations to derive phosphate adsorption curves or isotherms (PAI).
To measure soil phosphate adsorption a measured amount of phosphate is added in solution to a finely divided soil. After shaking, the phosphate remaining in solution is determined by the colour change of Molybdenum Blue (ammonium molybdate and ascorbic acid solution) and the loss of Ρ calculated by subtraction from the initial concentration represents phosphate adsorbed into the soil matrix.
Calculation of the PAI In order to understand the mechanisms operating during this short-term transformation, the data from the laboratory determinations and thus the phosphate isotherm must be suitably modelled.
The mathematical representation of this relationship is hest described by lhe empirical formula, the Freudlich equation;
x = kcb
χ = phosphate adsorbed c = equilibrium concentration (in solution) where k and b are coefficients
The equation has been used by the Wetland Ecosystems Research Group at Exeter to evaluate the P-adsorption characteristics of a wide range of soil lypes (Maltby et al, 1991 ).
Using the linearized form of the Freudlich equation:
log χ = log k + b log c
it is possible (o linearize the original adsorption data from the laboratory determinations. The linearized form is not always straight, and may produce a slight rising curve.
Using this modelling technique it is possible to interpolate the values of phosphate adsorption for any given concentration. Values for PAI (130 ppm) an PAI (100 ppm) were calculated from the double log form of lhe Freudlich equation and a value for the slope of the isotherm was obtained from the antilog of the intercept.
Phosphorus dynamics in prototype microcosm units
In order to study wetland soil interactions in detail, particularly phosphate retention as influenced by pH and redox, a closely controlled environment is essential. Prototype microcosm units were developed al Exeter for this purpose and consisted of a system of cells whose conditions were controlled, altered and logged via a microcomputer.
Prototype Microcosm Design (Mark I) The prototype microcosm setup comprised three modules, each consisting of two litre glass beakers, wilh air tight lids (Gallenkamp FBL-195) controlled by an Apple microcomputer. Each module could be interconnected to share common nitrogen, oxygen, acid and alkali supply lines. Each individual microcosm cell had an inlet for oxygen and nitrogen gas and for IM HCl and IM NaOH solutions. The soil was kept in suspension using a magnetic stirrer (Gallenkamp FBL-270). The redox potential, pH and temperature were determined using a platinum elcclrodc and calomel reference electrode (Russell), a combination pH electrode (Russell) and two temperature probes. Each module was connected to an Apple HE which had been expanded with four pH meter boards (Flyde Scientific) a scicnlific control board (U-Microcompulers Ltd.. digital interface and timer), a diskdrive board and either a parallel printer or super serial communication board. The pH-boards were used to monitor the pH and redox potential. In the case of the pH electrode, the software calculated the pH from the buffer dala and also automatically
- 98
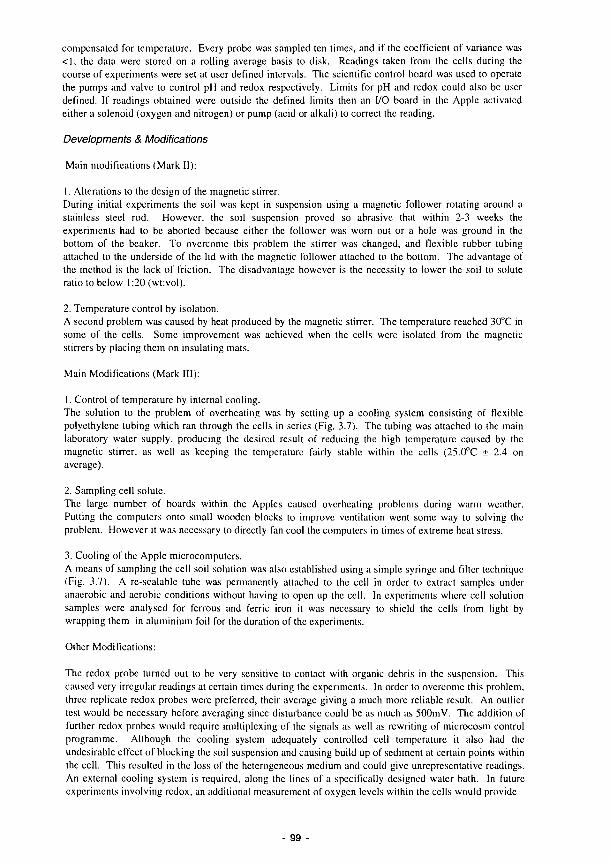
compensated for temperature. Every probe was sampled ten times, and if the coefficient of variance was <1, the data were stored on a rolling average basis to disk. Readings taken from the cells during the course of experiments were set at user defined intervals. The scientific control board was used to operate the pumps and valve to control pH and redox respectively. Limits for pH and redox could also be user defined. If readings obtained were outside the defined limits then an I/O board in the Apple activated either a solenoid (oxygen and nitrogen) or pump (acid or alkali) to correct the reading.
Developments & Modifications
Main modifications (Mark II):
1. Alterations to the design of the magnetic stirrer. During initial experiments the soil was kept in suspension using a magnetic follower Totaling around a stainless steel rod. However, the soil suspension proved so abrasive that within 2-3 weeks the experiments had to be aborted because either the follower was worn out or a hole was ground in the bottom of the beaker. To overcome this problem the stirrer was changed, and flexible rubber tubing attached to the underside of the lid with the magnetic follower attached to the bottom. The advantage of the method is the lack of friction. The disadvantage however is the necessity to lower the soil to solute ratio to below 1:20 (wt:vol).
2. Temperature control by isolation. A second problem was caused by heat produced by the magnetic stirrer. The temperature reached 30"C in some of the cells. Some improvement was achieved when the cells were isolated from the magnetic stirrers by placing them on insulating mats.
Main Modifications (Mark III):
1. Control of temperature by internal cooling. The solution to the problem of overheating was by setting up a cooling system consisting of flexible polyethylene tubing which ran through the cells in series (Fig. 3.7). The tubing was attached to the main laboratory water supply, producing the desired result of reducing the high temperature caused by the magnetic stirrer, as well as keeping the temperature fairly stable within the cells (25.0°C ± 2.4 on average).
2. Sampling cell solute. The large number of boards within the Apples caused overheating problems during warm weather. Putting the computers onto small wooden blocks to improve ventilation went some way to solving the problem. However it was necessary to directly fan cool the computers in times of extreme heat stress.
3. Cooling of the Apple microcomputers. A means of sampling the cell soil solution was also established using a simple syringe and filter technique (Fig. 3.7). A re-sealable tube was permanently attached to the cell in order to extract samples under anaerobic and aerobic conditions without having to open up the cell. In experiments where cell solution samples were analysed for ferrous and ferric iron it was necessary to shield the cells from light by wrapping them in aluminium foil for the duration of the experiments.
Other Modifications:
The redox probe turned out to be very sensitive to contact with organic debris in the suspension. This caused very irregular readings at certain times during the experiments. In order to overcome this problem, three replicate redox probes were preferred, their average giving a much more reliable result. An outlier test would be necessary before averaging since disturbance could be as much as 500mV. The addition of further redox probes would require multiplexing of the signals as well as rewriting of microcosm control programme. Although the cooling system adequately controlled cell temperature it also had the undesirable effect of blocking the soil suspension and causing build up of sediment at certain points within the cell. This resulted in the loss of the heterogeneous medium and could give unrepresentative readings. An external cooling system is required, along the lines of a specifically designed water bath. In future experiments involving redox, an additional measurement of oxygen levels within the cells would provide
99

MICROCOSM DESIGN MARK m
alkaline J solution
c
! acidic c
solution
stirrer
■
Appi« computer« parameter control and recording system
\
redox probe
electron,c
SWItCíl
/
o
ö
temp
oxygen
= i inlet
^ nitrogen,
inlet
4-^Ks—r :~-------¡
Filter Syringe
Air trap
(_) magnetic stirrer
Figure 3.7 Prototype microcosm design (Mk III).

an independent check on the degree of anaerobisin in operation. New designs are currently under
development at the Royal Holloway Institute for Environmental Research.
3.4.3 Investigation of the C dynamics function
Decomposition studies - Cotton strip assay
Decomposition of dead plant material is an important process in relation to ecosystem functioning. It has
important effects on the development of soil structure, and it resupplies the soil with available nutrients. It
is influenced by soil environmental parameters such as wetness, redox potential, pH, temperature and
nutrient availability (Swift et α,Ι 1979) and parameters indicating litter quality such as C/N, C/P ratio and
the lignin content (Parnas, 1975, Brinson, 1977, Berendse et al, 1987).
The method of cotton strip assay has been used at the study sites to compare the effects of environmental
variables on the rates of organic matter (cellulose) decomposition in the range of soils found in contrasting
wetlands. The application of the method to wetland research is favoured by Maltby (1988) for a number
of reasons.
i. The methodology is extremely simple and does not rely on sophisticated equipment in the field.
It is ideal for use in remote and often extreme environments (in terms of temperature and
waterlogging), where risk of failure with mechanical, electronic or chemical methods can be
high.
ii. Insertion, retrieval and preparation for analysis of the strips can be carried out by nonspecialist
operators with a minimum of training.
¡ii. Cotton strips are light and can be airmailed from remote places for standardised laboratory
analysis at relatively low cost.
iv. The flexible uniform cellulose material is highly appropriate for investigation of cellulose
decomposition across aquaticsoil/sediment interfaces.
v. Relatively large numbers of strips can be set out to incorporate the extreme spatial variability and
environmental complexity of wetlands.
vi. There is no necessity for continuous monitoring. Periodic sampling can coincide with other field
activities in a relatively lowcost experimental design. This point is particularly important in
remote sites, where a large proportion of project costs are associated with making field visits.
In order to investigate the relative rates of cellulose decomposition down a soil profile, strips are inserted
vertically in the soil using a spade. Folding the lower 23 cm of strip over the blade of a small straight
spade, the strip is pushed vertically into the soil, leaving approximately 4 cm protruding above the surface.
The cotton strips were inserted on a seasonal basis in each January (winter), April (spring), July (summer)
and October (autumn) of the study period. The strips remained in the ground for an average of four weeks
or until the tensile strength loss had reached approximately 50 percent, but did not exceed 85 percent.
Field controls were inserted and removed at the time of retrieval of the main batch. They were washed and
tested along with the exposed strips, thus mimicking all aspects of treatment except for exposure to
decomposition.
To provide a decay profile, strips were cut horizontal to give 2cm wide samples at 02 cm, 35 cm, 68
cm, 911 cm, 12 18 cm, 1921 cm, 2224 cm, 2527 cm.
Tensile strength loss was used as the measure of decomposition and is measured in the warp direction on a
tcnsometer (Monsanto Type) with motor drive. Results were expressed as a percentage loss of tensile
strength per day.
101
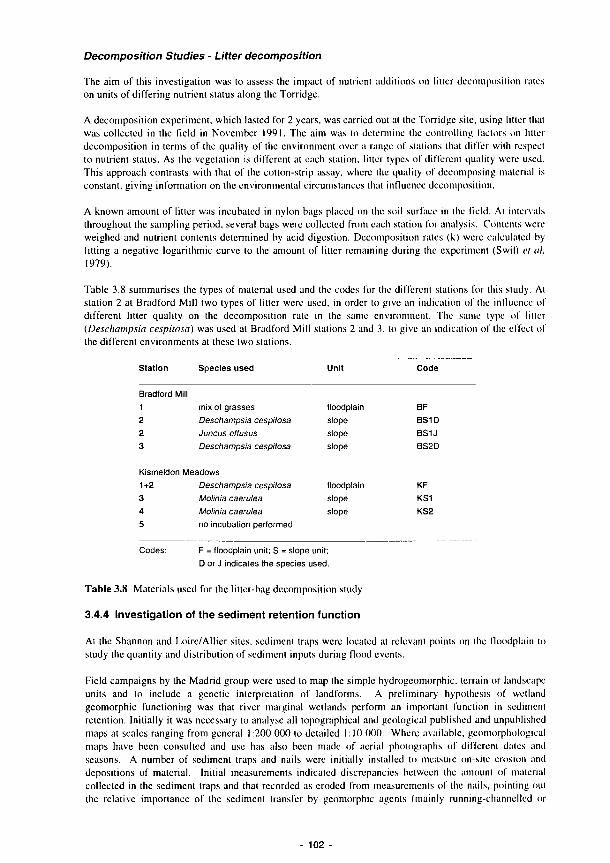
Decomposition Studies - Litter decomposition
The aim of this investigation was to assess the impact of nutrient additions on litter decomposition rales on units of differing nutrient status along the Torridge.
A decomposition experiment, which lasted for 2 years, was carried out at the Torridge site, using litter that was collected in the field in November 1991. The aim was to determine the controlling factors on litter decomposition in terms of the quality of the environment over a range of stations that differ with respect to nutrient status. As the vegetation is different at each station, litter types of different quality were used. This approach contrasts with that of the cotton-strip assay, where the quality of decomposing material is constant, giving information on the environmental circumstances that influence decomposition.
A known amount of litter was incubated in nylon bags placed on the soil surface in the field. At intervals throughout the sampling period, several bags were collected from each station for analysis. Contents were weighed and nutrient contents determined by acid digestion. Decomposition rates (k) were calculated by fitting a negative logarithmic curve to the amount of litter remaining during the experiment (Swift et al, 1979).
Table 3.8 summarises the types of material used and the codes for the different stations for this study. Al station 2 at Bradford Mill two types of litter were used, in order to give an indication of the influence of different litter quality on the decomposition rate in the same environment. The same type of litter (Deschampsia cespitosa) was used at Bradford Mill stations 2 and 3, to give an indication of the effect of the different environments at these two stations.
Station Species used Unit Code
Bradford Mill 1 mix of grasses 2 Deschampsia cespitosa 2 Juncus effusus 3 Deschampsia cespitosa
Kismeldon Meadows 1 +2 Deschampsia cespitosa 3 Molinia caerulea 4 Molinia caerulea 5 no incubation performed
Codes: F = floodplain unit; S = slope unit;
D or J indicates the species used.
Table 3.8 Materials used for the litter-bag decomposition study
3.4.4 Investigation of the sediment retention function Al the Shannon and Loire/Allier sites, sediment traps were located at relevant points on lhe floodplain to study the quantity and distribution of sediment inputs during flood events.
Field campaigns by the Madrid group were used to map the simple hydrogeomorphic. terrain or landscape units and to include a genetic interpretation of landforms. A preliminary hypothesis of wetland geomorphic functioning was that river marginal wetlands perform an important function in sediment retention. Initially it was necessary to analyse all topographical and geological published and unpublished maps at scales ranging from general 1:200 000 to detailed 1:10 000. Where available, geomorphological maps have been consulted and use has also been made of aerial photographs of different dales and seasons. A number of sediment traps and nails were initially installed to measure on-site erosion and depositions of material. Initial measurements indicated discrepancies between the amount of material collected in the sediment traps and that recorded as eroded from measurements of the nails, pointing out the relative importance of the sediment transfer by geomorphic agents (mainly running-channelled or
102
f l oodp la in
s l ope
s l ope
s l ope
f l oodp la in
s l ope
s l ope
B F
B S 1 D
B S 1 J
B S 2 D
KF KS1
KS2
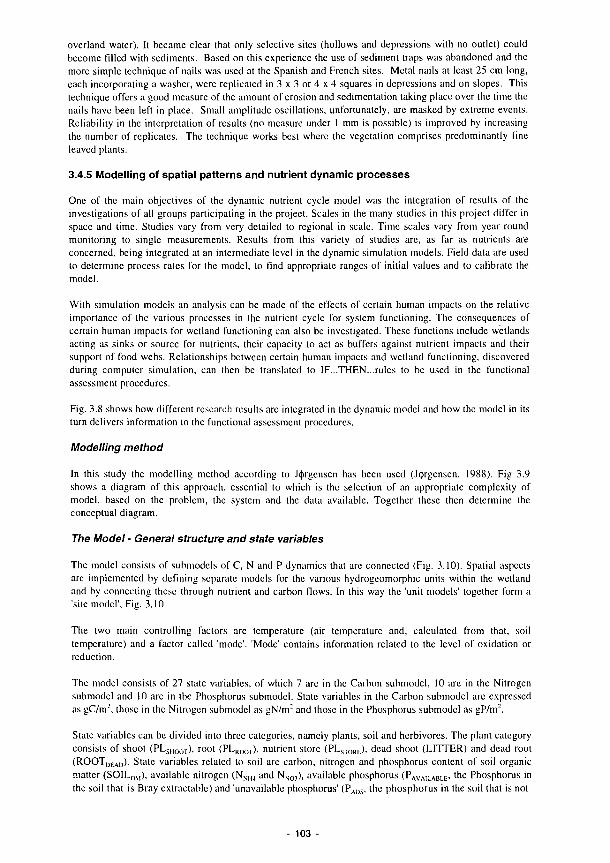
overland waler). It became clear that only selective sites (hollows and depressions with no outlet) could become filled with sediments. Based on this experience the use of sediment traps was abandoned and the more simple technique of nails was used at the Spanish and French sites. Metal nails at least 25 cm long, each incorporating a washer, were replicated in 3 χ 3 or 4 χ 4 squares in depressions and on slopes. This technique offers a good measure of the amount of erosion and sedimentation taking place over the time the nails have been left in place. Small amplitude oscillations, unfortunately, are masked by extreme events. Reliability in the interpretation of results (no measure under 1 mm is possible) is improved by increasing the number of replicates. The technique works best where the vegetation comprises predominantly fine leaved plants.
3.4.5 Modelling of spatial patterns and nutrient dynamic processes
One of the main objectives of the dynamic nutrienl cycle model was the integration of results of the investigations of all groups participating in the project. Scales in the many studies in this project differ in space and time. Studies vary from very detailed to regional in scale. Time scales vary from year round monitoring to single measurements. Results from this variety of studies are, as far as nutrients arc concerned, being integrated at an intermediate level in the dynamic simulation models. Field data are used to determine process rates for the model, to find appropriate ranges of initial values and to calibrate the model.
With simulation models an analysis can be made of the effects of certain human impacts on the relative importance of the various processes in the nutrient cycle for system functioning. The consequences of certain human impacts for wetland functioning can also be investigated. These functions include wetlands acting as sinks or source for nutrients, their capacity to act as buffers against nutrient impacts and their support of food webs. Relationships between certain human impacts and wetland functioning, discovered during computer simulation, can then be translated to IF...THEN...rules to be used in the functional assessment procedures.
Fig. 3.8 shows how different research results arc integrated in the dynamic model and how lhe model in its turn delivers information to the functional assessment procedures.
Modelling method
In this study the modelling method according to Jijirgensen has been used (J(|>rgcnsen, 1988). Fig 3.9 shows a diagram of this approach, essential to which is the selection of an appropriate complexity of model, based on the problem, the system and the data available. Together these then determine the conceptual diagram.
The Model - General structure and state variables
The model consists of submodels of C, Ν and Ρ dynamics that are connected (Fig. 3.10). Spatial aspects are implemented by defining separate models for the various hydrogeomorphic units within the wetland and by connecting these through nutrient and carbon flows. In this way the 'unii models' together form a 'site model'. Fig. 3.10.
The two main controlling factors are temperature (air temperature and, calculated from that, soil temperature) and a factor called 'mode'. 'Mode' contains information related to the level of oxidation or reduction.
The model consists of 27 state variables, of which 7 arc in the Carbon submodel, 10 arc in the Nitrogen submodel and 10 are in the Phosphorus submodel. State variables in the Carbon submodel are expressed as gC/nr, those in the Nitrogen submodel as gN/nr and those in the Phosphorus submodel as gP/nr.
State variables can be divided into three categories, namely plants, soil and herbivores. The plant category consists of shoot (PLslIOOT), root (PLROOT), nutrient store (PLsrolir), dead shoot (LITTER) and dead root (ROOTDEAD). Slate variables related to soil are carbon, nitrogen and phosphorus content of soil organic matter (SOILOM), available nitrogen (NNH4 and NN01), available phosphorus (PAV,MLABLE' 'he Phosphorus in the soil that is Bray extractable) and 'unavailable phosphorus' (PA[)S, lhe phosphorus in the soil that is not
103

Exeter Ox, Redox
Information, if available
- H -
Utrecht Dynamic model
0
as
1
Ox Redox (mV)
O H <-100
1 - 5 « -100/*1SO
20 H >*150
Water level
>2 cm
-5 / *2 cm
<-S cm
Birmingham, Amsterdam, Madrid
y s
- ..
relative height of unit
+ river level
Rain + evaporation or groundwater
discharge
\ \
Utre Renr
Information to calibrate the dynamic model
cht (subproject 3), es
\ predictors, ι thresholds,
limits, ι IF...THEN... ι
Exeter I 1
Functional Assessment Procedure
Figure 3.8 Integralion of the various research results with the Ihc dynamic model, which in turn provides
input to the functional assessment procedures.
104 -

organic and not Bray extractable). Herbivores can be either in the field (HERB) or in an area outside the
site (HERBST0RK). A full list of the state variables is given in Table 3.9.
Flows (processes)
The state variables as described in the previous paragraph arc connected through flows of carbon, nitrogen
or phosphorus. Figs. 3.11, 3.12 and 3.13 show the structure of the three submodels, wilh their state
variables and flows. Flows (or processes) are expressed as grams of C, N or Ρ per m2 per week.
The total number of flows in the model is 72 of which 28 are inputs and outputs. The flows, with their
controlling factors, are further described separately for processes related to the plants, to the soil, to the
herbivores and to the hydrology of the system.
Plants: CPLSHOOT
CPLROOT
NPLsHOOT NPLROOT
PPLSHOOT PPLROOT
CUTTER CROOTDEAD
NLITTER NROOTDEAD NPLSTORE
PUTTER PROOTDEAD PPLSTORE
Soil: CSOILOM
NSOILOM
PSOILQM
NNH4
pAVAILABLE
NN03
PADS
Herbivores: CHERB
NHERB
PHERB
CHERBsTORE
NHERBsTORE
PHERBSTORE
Table 3.9 A list of all the state variables used in the model.
Plant processes
Carbon and nutrient uptake
Nutrient uptake and carbon uptake (or assimilation) are both dependent on the nutrient content of the plant
itself. Carbon uptake is dependent on 'maximum' relative growth rate, maximum biomass, temperature, Ν
and Ρ concentration in the plant (limit.L„N and limitJssP), mode, and size of the plant. In Fig. 3.14 the
Michaelis Menlen relationship between plant Nitrogen content and a factor (limit„sN) thai affects plant
growth is shown. LimiL,„p is similar. Fig. 3.15 shows the combined implementation of limity,,, and
limit,„p.
The equation in the model for assimilation (C uptake) is thus:
(shootmm - CSHOOT) netass = cam¡a * rtemp * limit,,
shoots.
: limit,,,,,, * mod„,„„„ * CSHOOT
Nitrogen uptake by the plant is dependent not only on the nitrogen concentration in the plant, but also on
NNH4 and NNOV Firstly, a calculation is made of the amount that the plant could potentially take up
depending on the difference between its optimal nutrient concentration and the actual nutrienl
concentration. This is then compared with the amount of nutrients available in the soil. The smaller of the
two then determines the size of the flow.
Shoot-root exchange
Carbon, nitrogen and phosphorus are transported from root to shoot and in the reverse direction,
according to the difference between optimal and actual shoot/root ratio.
Retranslocation and remobilisation
When shoots or roots die, a proportion of their nutrients is retranslocatcd lo a part of the plant called plant
nutrient store (NPLSTORI.; and PPLSTORE). At the beginning of the growing season these nutrients arc
remobilized from the plant nutrient store to the roots (and from there to shoot), whenever they arc needed
(according to the optimal plant nutrient concentration). As a result of this a lesser amount of nutrients is
laken up from the soil nutrient pools.
105
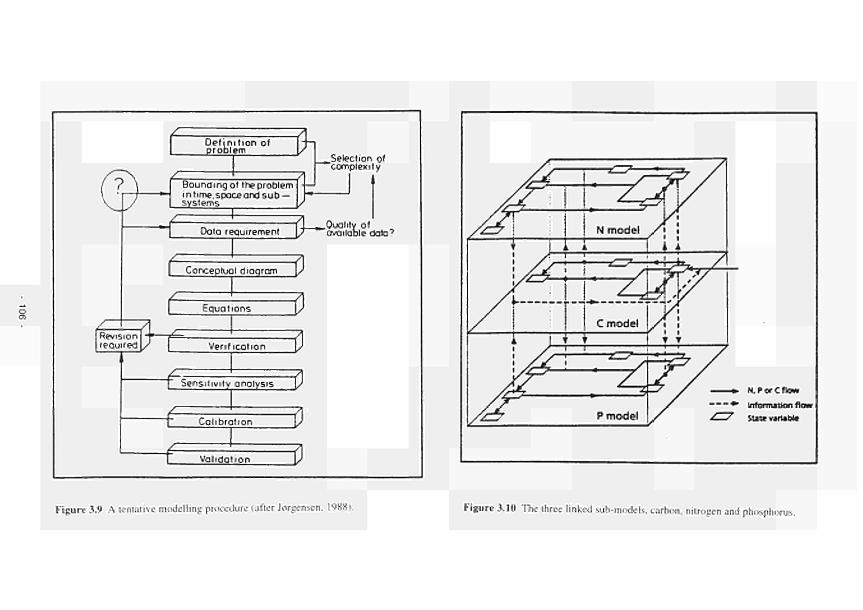
Definition of — ί τ η problem y
Bounding ot the problem i η time, space and sub — systems
. Selection of complexity
7Γ. : ; f. _^Qual i ty of Data requirement / available data9
f Conceptual diogrom Ρ Equations
l> Revision ^ — ■ " required Verification
t 5
Sensitivity onolysis
■e
5 Calibration
ff
5 Validation 5
Figure 3.9 A tentative modelling procedure (after Jorgensen. 1988).
áLa. ^-zk&~A
P model
N.PorCflow
Information flow
Suur ν a nabla
Figure 3.10 The three linked sub-models, carbon, nitrogen and phosphorus.
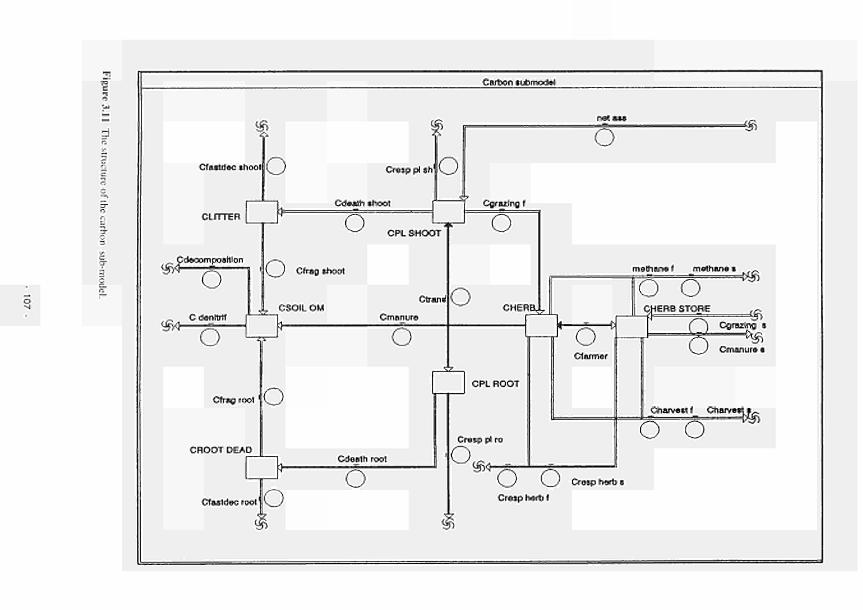
-r ■Β' e
Carbon lubmodel
Cresp pi sh
CLfTTER
<£)<* Cdecom position
O
ί$<Γ-C denltrtf
O
Cdealh shoot
O
o
CPL SHOOT
O Cfrag shoot
CSOIL OM Ctrans1
Cmanure
O
o =®
Cgrazlng I
O
o CHERBJ^
methane ( methane ■
Cfrag root
CROOT DEÃO
O
Cdeath root
Cfastdec root Ρ o
CPL ROOT
Cresp pi ro
o Cf armer
O o CHERB STORE
« $
·& Cgrazlng s
Cmanure s
Charvest f Charv
O o m
V ) \ / Cresp herb s
Cresp herb f

τΞ' c
Nitrogen submodel
Nharvest s Ν harvest f Ngrazing f
O Ν atm d^p NH4 dis nilr red atmdepNCO
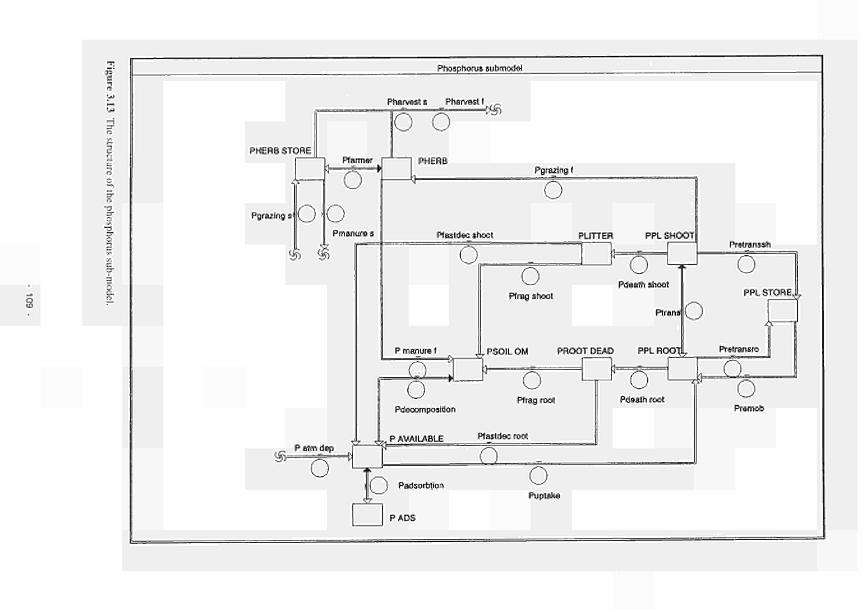
y. S
Phosphorus submodel
Pharvest s Pharvest f
P H E R B STORE
Pgrazing s1 O
Planner
O o
Pmanure s
O o «Si
PHERB Pgrazing f
O Pfastdec shoot PUTTER PPL SHOOT
O
Ρ manure f
O (frag shoot
O Pdeath shoot
Pretranssh
Ptrana1
PSOILOM PROOT DEAD PPL ROOTjL. Pretransro
O PPL STORE
O
o Pfrag root
O Pdeath root
<Sr P atm dep
O Ρ AVAILABLE Pfastdec root
£1 ( J Padsorbtion
SZ
PADS
O Puptake
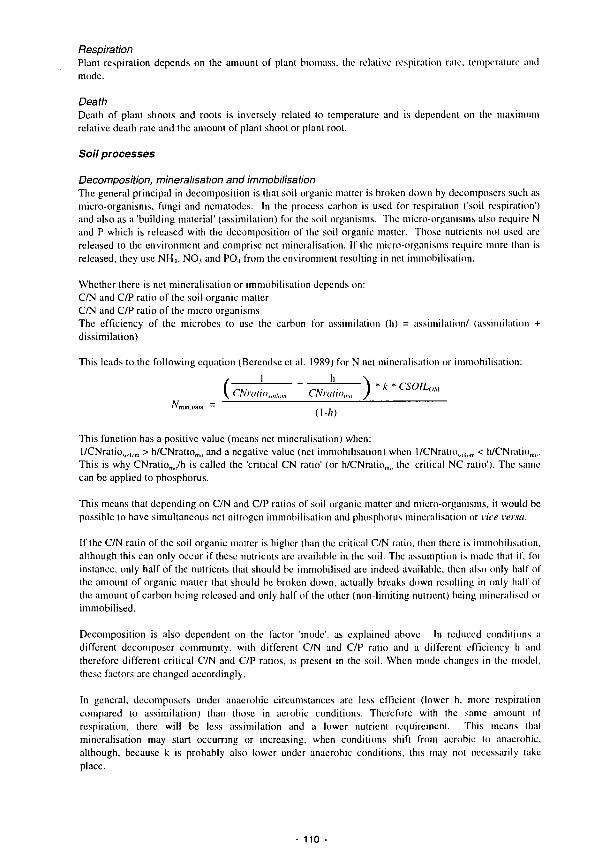
Respiration
Plant respiration depends on the amount of plant biomass. the relative respiration rate, temperature and
mode.
Deaf/7
Death of plant shoots and roots is inversely related to temperature and is dependent on the maximum
relative death rate and the amount of plant shoot or plant root.
Soil processes
Decomposition, mineralisation and immobilisation
The general principal in decomposition is that soil organic matter is broken down by decomposers such as
microorganisms, fungi and nematodes. In the process carbon is used for respiration ('soil respiration')
and also as a 'building material' (assimilation) for the soil organisms. The microorganisms also require N
and Ρ which is released with the decomposition of the soil organic matter. Those nutrients not used are
released to the environment and comprise net mineralisation. If the microorganisms require more than is
released, they use NH4, NOj and P04 from the environment resulting in nel immobilisation.
Whether there is net mineralisation or immobilisation depends on:
C/N and C/P ratio of the soil organic matter
C/N and C/P ratio of the micro organisms
The efficiency of the microbes to use the carbon for assimilation (h) = assimilation/ (assimilation +
dissimilation)
This leads to the following equation (Berendse et al. 1989) for Ν net mineralisation or immobilisation:
/ 1 h _h \ ~~ ) *k atio„„, j
* CSOILo \ CNratio„„i„„ CNn
N ■ =
/νη ,„ , ( 1 A )
This function has a positive value (means net mineralisation) when:
l/CNratioM„|„m > h/CNratiomi, and a negative value (net immobilisation) when l/CNralio,,,,,,,,,, < h/CNratiom„,
This is why CNralionl,/h is called the 'critical CN ratio' (or h/CNratio,,,,, the 'critical NC ratio'). The same
can be applied to phosphorus.
This means that depending on C/N and C/P ratios of soil organic matter and microorganisms, it would be
possible to have simultaneous net nitrogen immobilisation and phosphorus mineralisation or vice versa.
If lhe C/N ratio of the soil organic malter is higher than lhe critical C/N ratio, then there is immobilisation,
although this can only occur if these nutrients arc available in the soil. The assumption is made that if, for
instance, only half of lhe nulricnls that should be immobilised are indeed available, Ihen also only half of
the amount of organic matter that should be broken down, actually breaks down resulting in only half of
the amount of carbon being released and only half of the other (nonlimiting nutrient) being mineralised or
immobilised.
Decomposition is also dependent on the factor 'mode', as explained above. In reduced conditions a
different decomposer community, with different C/N and C/P ratio and a different efficiency h and
therefore different critical C/N and C/P ratios, is present in the soil. When mode changes in the model,
these factors are changed accordingly.
In general, decomposers under anaerobic circumstances arc less efficient (lower h, more respiration
compared to assimilation) than those in aerobic conditions. Therefore wilh the same amount ol
respiration, there will be less assimilation and a lower nutrienl requirement. This means thai
mineralisation may start occurring or increasing, when conditions shift from aerobic to anaerobic,
although, because k is probably also lower under anaerobic conditions, this may not necessarily lake
place.
110

If both N and Ρ are in short supply, it is assumed that the one which is most limiting determines C decomposition ('soil respiration'). The limiting nutrient is determined by calculating how much carbon would be released if each in turn were limiting decomposition. The one that would give the lower carbon release is considered to be the more limiting. This nutrient then determines the amount of carbon release and also the amount of immobilisation of the other nutrient. Other assumptions are that h is independent of the nutrient content of the organic matter and that micro-organisms uptake NH4 preferentially to NO3
Calculation procedure in the model
1. Calculate how much C would be released if no nutrients were limiting decomposition. 2.a. Calculate how much N would be mineralised or immobilised if no nutrients were limiting
decomposition. 2.b. Calculate how much Ρ would be mineralised or immobilised if no nutrients were limiting
decomposition. 3.a. Calculate how much Ν would mineralise or immobilise, taking the amount of NNH4 in the soil
into account. 3.b. Calculate how much Ρ would mineralise or immobilise, taking the amount of PAVAILABLE m t n e
soil into account. 4. Calculate NNO, immobilisation (if there is Ν immobilisation and if NNH4 is in short supply),
taking the amount of NN0, into account. 5. Calculate which nutrient (if any) is limiting decomposition most and decide how much C is
released. 6.a. Calculate total actual Ν mineralisation or immobilisation. 6.b. Calculate total actual Ρ mineralisation or immobilisation. 7. Calculate NN„4 mineralisation or immobilisation. 8. Calculate NNO, immobilisation.
Other soil processes
Fast decomposition (or leaching) and fractionation After plant shoots and roots have died and become litter or dead roots, they are subject to two different processes. They are slowly broken down (fractionated) by animal activity and incorporated into the soil as soil organic matter, while at the same time more rapidly decomposing and losing nutrients by leaching. In the model it is assumed that this fast decomposition is temperature-dependent and not limited by the nutrient content of the material or the soil. Fractionation is described as a first order differential equation with a temperature dependence.
Nitrification and denitrification Nitrification is a function of the amount of NNH4 in the soil and also depends on 'mode', soil temperature and the maximum relative nitrification rate. Denitrification depends on soil temperature, 'mode', the maximum denitrification rate and the amount of NN0! in the soil.
Herbivore processes
Grazing and respiration The amount of grazing per day depends on the number of herbivores and the amount of plant shoot biomass in the field. Herbivore respiration depends on their relative respiration rate and the number of stock present.
Management Whenever the site floods it is assumed that the farmer will have moved his stock away to cither another field or into buildings. When this happens the animals still eat, grow and respire though it is assumed that inputs are not from the site and outputs are not returned. Once a year the farmer 'harvests' his herbivore 'crop' by removing such an amount of stock sufficient to leave an amount remaining equal to that which was there at the start of the previous year.
111
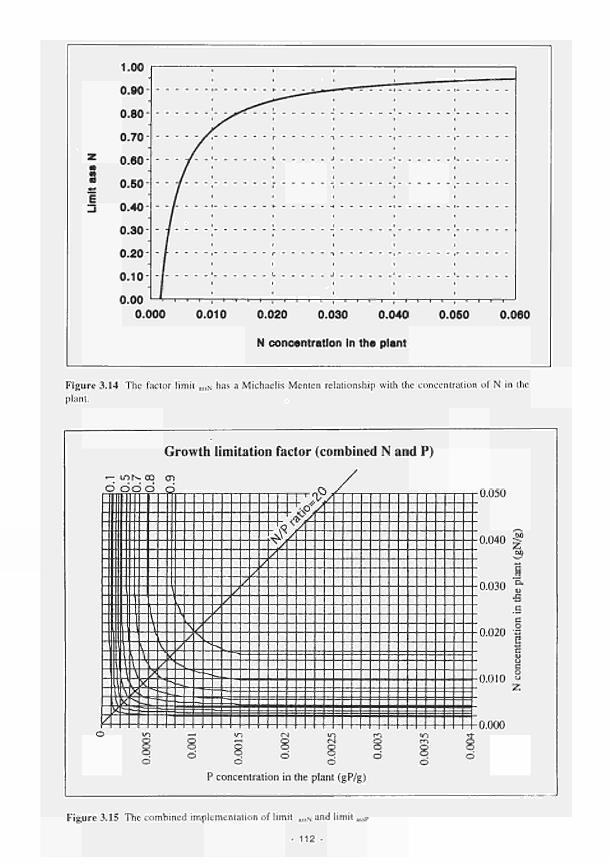
s E
. _ . - X¡- - - - - - Γ - - - _ _ Ί _ . _ _ . _ | . . _ _ _ _ ) _ _ _ _ _ _
. - _ _ -M - _ · _ - _ _ _ _ _ _ _ - _ _ - Ι _ _ _ _ _ _ Ι _ _ _ _ _ _ · _ _ _ _ _ _
■ I · ι r ~ T i ι *
■ I ' . _ _ _ J _ _ _ _ _ _ ' _ _ _ _ _ _ l . _ _ _ _ _
0.020 0.030 0.040 0.050
Ν concentration in the plant
0.060
Figure 3.14 The factor limit assN has a Michaelis Menten relationship with the concentration of Ν in the
plant.
Growth limitation factor (combined Ν and P)
Lor cq σ> / d ò d o o c\ / ΠΛΓΛ
"^o J__w
y ^
~2_ ~2_
¿_
III 11 \ / ~2_
v_ \ ¿_ χ. Ζ
min ι \ ^ / / Ν
i \ ^ /
^ u . \ \ *
\ \ / v
" E ^2'
1^ " " —
= _ = =
Λ 1 1 1 1 1 1 1 1 1 1 1 1 1 1 1 1 1 1 1
j r n ^ w.^u
¿PÀ
¿χ k J
' (\(\AÇ\ ·£?
ob * _ ■
s
•s .Ευ
h H
c
. ζ
Tnnrirv
Q Q — © C M p m © ρ ο ο δ ο ο ρ ο Η ο Ρ ο Η ο Ρ ο o o o o
Ρ concentration in the plant (gP/g)
Figure 3.15 The combined implementation of limit assN and limit alsP
112
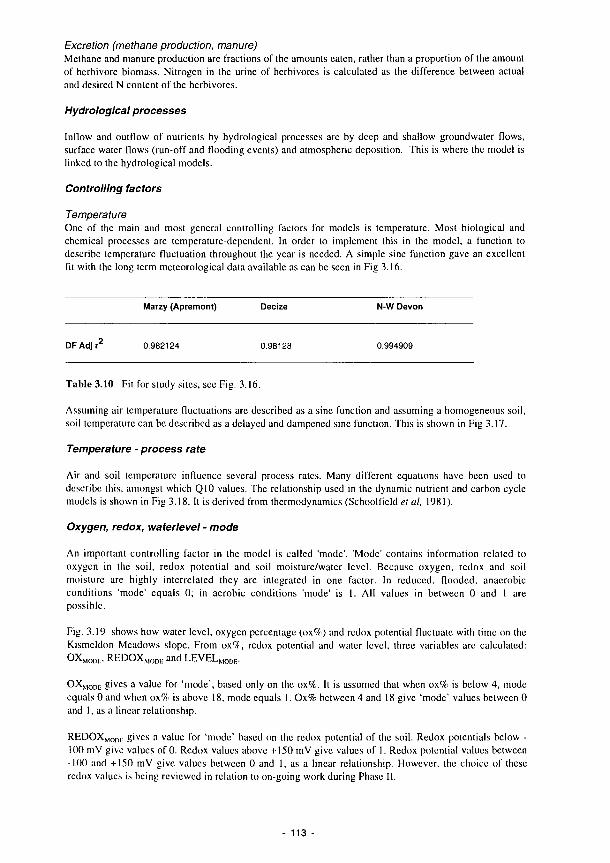
Excretion (methane production, manure) Methane and manure production are fractions of the amounts eaten, rather than a proportion of the amount of herbivore biomass. Nitrogen in the urine of herbivores is calculated as the difference between actual and desired N content of the herbivores.
Hydrological processes
Inflow and outflow of nutrients by hydrological processes are by deep and shallow groundwater flows, surface water flows (run-off and flooding events) and atmospheric deposition. This is where the model is linked to the hydrological models.
Controlling factors
Temperature One of the main and most general controlling factors for models is temperature. Most biological and chemical processes arc temperature-dependent. In order lo implement this in the model, a function to describe temperature fluctuation throughout the year is needed. A simple sine function gave an excellent fit with the long term meteorological data available as can be seen in Fig 3.16.
Marzy (Apremont) Decize N-W Devon
DFAdjr2 0.982124 0.98128 0.994909
Table 3.10 Fit for study sites, see Fig. 3.16.
Assuming air temperature fluctuations are described as a sine function and assuming a homogeneous soil, soil temperature can be described as a delayed and dampened sine function. This is shown in Fig 3.17.
Temperature - process rate
Air and soil temperature influence several process rates. Many different equations have been used to describe this, amongst which Q10 values. The relationship used in the dynamic nutrient and carbon cycle models is shown in Fig 3.18. It is derived from thermodynamics (Schoolfield et al, 1981).
Oxygen, redox, waterlevel - mode
An important controlling factor in the model is called 'mode'. 'Mode' contains information related to oxygen in the soil, redox potential and soil moisture/water level. Because oxygen, redox and soil moisture are highly interrelated they are integrated in one factor. In reduced, flooded, anaerobic conditions 'mode' equals 0; in aerobic conditions 'mode' is 1. All values in between 0 and 1 are possible.
Fig. 3.19 shows how water level, oxygen percentage (ox%) and redox potential fluctuate with time on the Kismeldon Meadows slope. From ox%, redox potential and water level, three variables are calculated: OXMODE, REDOXN1
OXslODE gives a value for 'mode', based only on the ox%. It is assumed that when ox% is below 4, mode equals 0 and when ox% is above 18, mode equals I. Ox% between 4 and 18 give 'mode' values between 0 and 1, as a linear relationship.
REDOXMOD|L gives a value for 'mode' based on the redox potential of the soil. Redox potentials below -100 mV give values of 0. Redox values above +150 mV give values of I. Redox potential values between -100 and +150 mV give values between 0 and 1, as a linear relationship. However, the choice of these redox values is being reviewed in relation to on-going work during Phase II.
113
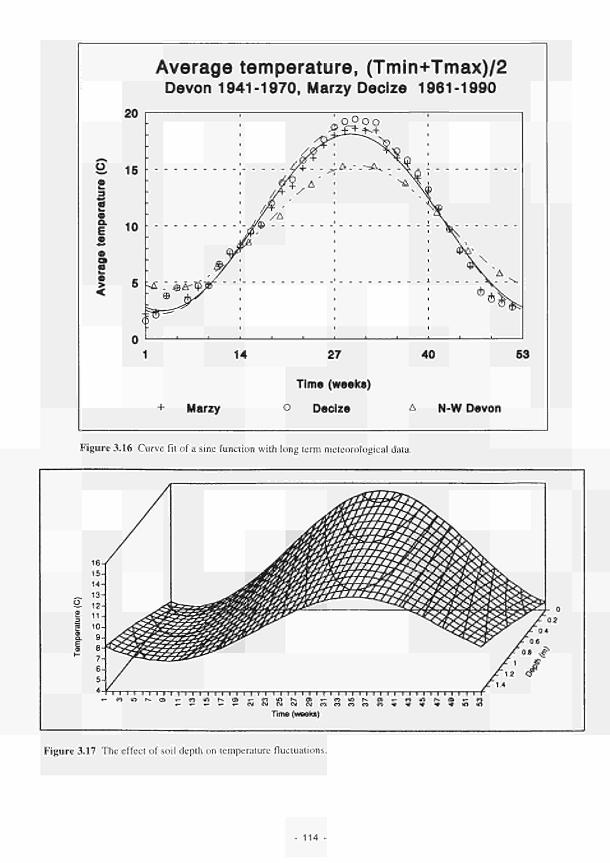
Average temperature, (Tmin+Tmax)/2 Devon 19411970, Marzy Decize 19611990
20
S 15
o
o. E Φ
Φ o « h . φ
10
. . . . . . . . . .
.y
j
. . . .
¿Γ A
¿2ι5ί_ c£*
¿í ^
tA'
.Û.=*V " ^<t Λ "
. .
. . . . . . .
14
Marzy
27
Time (weeks)
Decize
40
Δ NW Devon
53
Figure 3.16 Curve fit of a sine function with long term meteorological data.
O
2 3 S o CL· E β
1 6 / 15
14
13
12111098765
*- Ο ΙΟ Κ 0) T o « N a r n n N n r o n N a . o « i K e . i 5
Time (week»)
íy^ Æ" /Ό.«
y / l 2 CT 1.4
02 4
Λ
Figure 3.17 The effect of soil depth on temperature fluctuations.
- 114 -
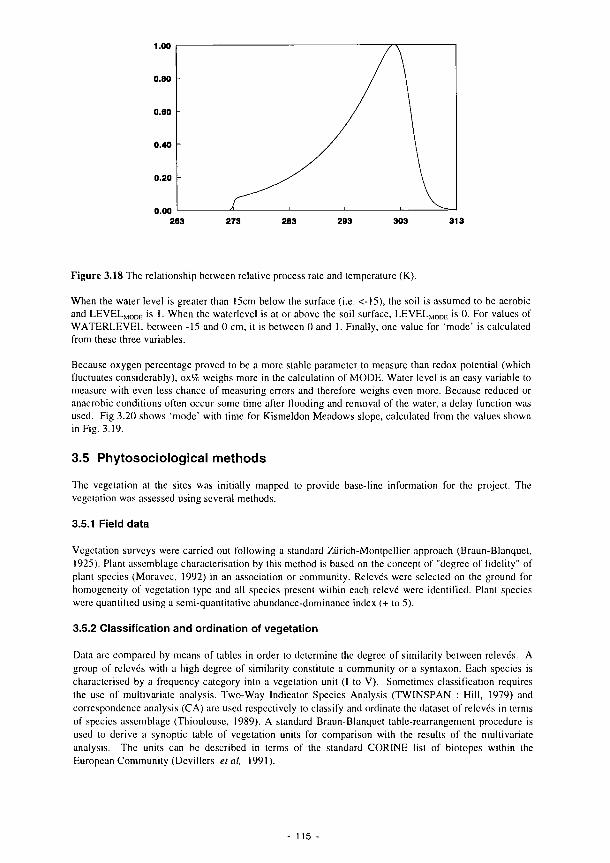
1.00
ο.βο
0.40
263 273 283 293 303 313
Figure 3.18 The relationship between relative process rate and temperature (K).
When the water level is greater than 15cm below the surface (i.e. <-Ι5), the soil is assumed to be aerobic
and LEVELM0DE is 1. When the waterlevel is at or above the soil surface, LEVELM0DE is 0. For values of
WATERLEVEL between -15 and 0 cm, it is between 0 and 1. Finally, one value for 'mode' is calculated
from these three variables.
Because oxygen percentage proved to be a more stable parameter to measure than redox potential (which
fluctuates considerably), ox% weighs more in the calculation of MODE. Water level is an easy variable to
measure with even less chance of measuring errors and therefore weighs even more. Because reduced or
anaerobic conditions often occur some time after flooding and removal of the water, a delay function was
used. Fig 3.20 shows 'mode' with time for Kismeldon Meadows slope, calculated from the values shown
in Fig. 3.19.
3.5 Phytosociological methods
The vegetation at the sites was initially mapped to provide base-line information for the project. The
vegetation was assessed using several methods.
3.5.1 Field data
Vegetation surveys were carried out following a standard Zürich-Montpellier approach (Braun-Blanquet,
1925). Plant assemblage characterisation by this method is based on the concept of "degree of fidelity" of
plant species (Moravec, 1992) in an association or community. Relevés were selected on the ground for
homogeneity of vegetation type and all species present within each relevé were identified. Plant species
were quantified using a semi-quantitalive abundance-dominance index (+ to 5).
3.5.2 Classification and ordination of vegetation
Data are compared by means of tables in order to determine the degree of similarity between relevés. A
group of relevés with a high degree of similarity constitute a community or a syntaxon. Each species is
characterised by a frequency category into a vegetation unit (I to V). Sometimes classification requires
the use of multivariate analysis. Two-Way Indicator Species Analysis (TWINSPAN : Hill, 1979) and
correspondence analysis (CA) are used respectively to classify and ordinate the dataset of relevés in terms
of species assemblage (Thioulouse, 1989). A standard Braun-Blanquet lable-rcarrangemcnl procedure is
used to derive a synoptic table of vegetation units for comparison with the results of the multivariate
analysis. The units can be described in terms of the standard CORINE list of biotopes within lhe
European Community (Devillers et al, 1991).
115 -
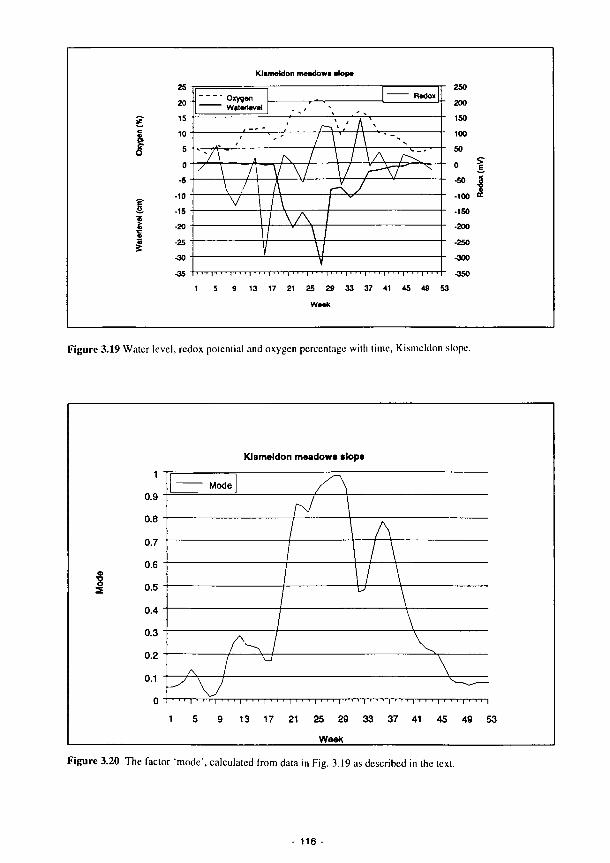
Kismeldon meadow« slope
õ
©
I
Figure 3.19 Water level, redox potential and oxygen percentage with lime, Kismeldon slope.
Figure 3.20 The factor 'mode', calculated from data in Fig. 3.19 as described in the text.
- 116 -

3.6 Statistical analysis of plant traits
Plant population traits were assessed to provide information on the degree and level of perturbation and stress at the field sites. Field, laboratory and statistical methods were employed.
3.6.1 Measurement of plant population traits
In each of 32 ΙΟ χ lOm quadrats within the HGMUs a number (generally 4) of common plant species were selected for trait measurement. If different units had similar species composition, then traits of the populations (i.e. a species at the HGMU level) were measured in each of those units. Traits were measured for a total of 144 plant populations. Data collection was timed to correspond with the reproductive maturity of each plant species. Measurements, based on ten individuals, were taken either in situ or from dried harvested material in the laboratory. All trait data were subsequently normalised by natural log transformation prior to analysis.
Field measurements
Height of plant (HT). The height of the plani was measured in situ using a ruler (± 0.5cm). Care was taken not to disturb the position of the plant in the canopy while the measurement was being taken. A plant that drooped or had a creeping habit would have a height measurement smaller than its total length if the plant were harvested and measured straight along a ruler.
Area of the plant canopy (AREA). A transparent quadrant with 5cm χ 5cm squares was held over the top of the plant. The number of squares in which pieces of stem, leaves or reproductive structures were present, when observed from above, were counted. The structure of the plant canopy was not disturbed during this operation. If other plants obscured the view of the individual being measured, minor adjustments were made to the canopy to permit a complete view.
Number of leaves (LEAVES). Leaves often individual plants were counted. Leaves were considered to be separate wherever any piece of stem was apparently dividing them. Immature leaves and dead or dying leaves were counted provided they contained some green photosynthetic tissue.
Number of seeds (SEEDS). For ten individuals the total number of seeds produced was counted. For plants that produced large numbers of seed, the number of reproductive structures (e.g. number of seed heads) and the number of seeds in each reproductive structure was counted for ten of the structures. The mean number of reproductive structures and the mean number of seeds in (he reproductive structure were multiplied together to give an estimate of the number of seeds.
Laboratory measurements:
Dry weight of leaves (WTLEAF). The leaves from each individual were placed in tissue paper and left in a drying oven at 55°C for one to two weeks. The dry weight of each individual sample was subsequently weighed.
Total leaf area (LEAFAREA). The total area (em2) of the leaves of each individual plani was measured using a calibrated Delta video area meter. Leaf area was measured as found in the natural situation; no attempt was made to flatten leaves that were naturally curved or creased.
Dry weight of Stem (WTSTEM). The stems were placed in tissue paper and dried for one to two weeks. Dry weights were measured.
Dry weight of reproductive structures (WTREPRO). Reproductive structures, including structural tissue for the support of sexual organs, were dried for one to two weeks and the dry weight measured.
117
Seed weight (WTSEED). Between 30 and 50 seeds were removed from the dry reproductive structure and weighed (more seeds were used if the seeds were extremely small). The weight of one seed was calculated.
Nitrogen (NCONC), Phosphorus (PCONC) and Potassium (KCONC) concentrations in the leaf Chemical determinations were undertaken from digests of coarse-ground, dried plant leaf tissue obtained by the Kjeldahl method. A salicylic acid pre-digestion was used to ensure complete recovery of nitrate-N and nitrite-N. A 5ml aliquot of concentrated sulphuric acid and salicylic acid (25g of salicylic acid in 1 litre of H2SO4) was added to a subsample of plant material in a Kjeldahl boiling lube and left to stand for one hour. 0.5g of sodium thiosulphale pentahydrate was added to the mixture, which was gently healed, shaken and lefl to cool. l.Og of a ground mixture of sodium sulphate and copper(II) sulphate (10:1 by weight) was added. Digests were placed in a block digestor for one hour and twenty minutes at 375"C, cooled, made up to 100ml wilh de-ionised water and filtered.
NCONC and PCONC delerminations were made using a Tcchnicon AutoAnalyser II System. Analysis of K (KCONC) was carried out using a flame photometer which had been calibrated up to 100 ppm K.
3.6.2. Measurement of state variables
In total, 26 samples of 11 state variables were measured from FAEWE wetland sites. All slate variables were variables measured for the whole community, rather than trails which were measured for certain constituent populations. Eleven units were measured either twice in a single season, or once in 1992 and once in 1993; the two records for each unit were considered as independent samples, although, for some measures, lhe second value of the pair may be influenced by lhe first.
The eleven state variables measured were:
Species richness (SPP): the mean number of species present in a 30cm χ 30cm quadrai placed randomly ten times in the hydrogeomcrphic unit.
Community dominance (DOM): defined according to Simpson's Index, where DOM = Σ(/>ί) , in which ρ = the proportion of the 36 quadrat subsquarcs (5cm χ 5cm) in which each of i species is present. Subsquares were located using a transparent quadrat. The value of Simpson's index varies from between 0 (high diversity, high evenness) and 1 (low diversity, high dominance).
Stem density (DEN): the mean number of stems in a 10cm χ 10cm quadrat placed randomly ten limes in each major quadrat. A "stem" was considered to be any piece of plani material that was rooted in the soil and had one or more shoots above ground. Where the density of stems was low (<15 per 10 χ 10cm), counts were made on a larger area of ground and scaled to 10 χ 10cm.
Nearest Neighbour Distance (DIS): the mean of ten measurements in each HGMU of the dislance (mm) at ground level from a randomly selected shoot to its nearest neighbour.
Stem cross-sectional area (STA): calculated from measurements of the diameter (mm) of ien randomly selected stems, in which it is assumed that lhe stem is circular.
Canopy height (CAN): the vertical distance between the ground and the highest piece of vegetation touching a randomly positioned metre ruler (cross-section 2.5 χ 0.5cm).
Density of reproductive structures (REPD): the total number of flower buds, flowers and seed-heads recorded in a 30 χ 30cm quadrat.
Vegetation cover; soil surface to <10cm elevation (C0-10): recorded using a Harris pin frame wilh each pin marked al 10cm intervals. The mean number of "hits" per pin was calculated.
Vegetation cover; >10cm to < 20cm above the soil surface (C10-20).
Vegetation cover; >20cm elevation (C20+).
118
Total above-ground living biomass (BIO): values based on a single destructive harvest of all vegetation in a sample plot, expressed as gDWirf-. The size of the harvested plot (lOOcm^ - I600ciri2) depended on the type of vegetation; homogeneous grassland plots were smaller than heterogeneous Urtica or Phragmites dominated communities.
3.6.3 Statistical Analysis
Functional grouping of wetland plant populations using traits
In total 144 established phase plant populations were classified on the basis of morphological traits using a sum of squares non-hierarchical clustering technique. Analyses were undertaken using GENSTAT, version 5.0. Populations were classified into 3-8 groups (g) with the initial partition being either random, in which case groups of equal size were formed, or height dependent.
A centroid dissimilarity algorithm, which maximises the Euclidean distance between group members, was used to classify wetland plants. A classification from the random partitioned sum of squares classification, with g = 8, was used as the starting point of the centroid dissimilarity classification.
Principal Components Analysis (PCA) was carried out for the 144 populations using natural log transformed measurements for the 8 traits to determine the degree of internal cohesion and external isolation in the data set. The dispersal of objects classified by sum of squares and centroid dissimilarity techniques was compared on the first two axes of the PCA ordination to identify differences in group members.
Trait characteristics of groups identified by non-hierarchical clustering were compared to the groups (= collections of traits) proposed by Grime; competitors (C), stress-tolerant (S) and rudcral (D). These groupings arose from the belief that stress and disturbance were the two main forces governing the response of plants to their environment. Grime (1979) defined stress as "any factor which reduces the rate of accumulation of biomass and includes shortage of light, water and minerals" and disturbance as "any factor which actually destroys biomass and includes trampling, grazing and fire damage". Subsequent use of these terms adheres strictly to these definitions. 98 populations of species studied by Grime et al. (1988) were assigned to empirically established strategies. If the strategy was an intermediate one, for example C / C-S-D, the population was scored as 0.5 C and 0.5 C-S-D. jf- tests were then employed to compare the distribution of strategies in individual groups with that of the overall data set.
Classifying European River Marginal Wetland Ecosystems using Functional Vegetation Groups
An α priori designation of 23 studied plant populations with predominantly competitive (7 populations), stress-tolerant (6 populations) and intermediate (C-S-D) strategics (10 populations) was made from the listings in Grime et al. (1988).
Linear discriminam analysis was carried out to describe the major morphological differences between the competitive and stress-tolerant species using the 12 measured traits. A multiple discriminant analysis was applied to the competitive, stress-tolerant and intermediate groups using the 12 measured traits. All analyses were carried out using SPSSX.
The plant populations classed by Grime et al. (1988) as competitors, were arbitrarily given a score of 10 for competitive ability and 0 for stress-tolerance. Stress-tolerant plants were given a score of 10 for stress-tolerance and 0 for competitive ability. Intermediate strategists were given a score of 5 for both stress-tolerance and competitive ability. None of the populations exhibited a predominantly disturbance-tolerant strategy. Multiple regression was then used to determine which of the Iraits importam in distinguishing competitive plants and stress-tolerant plants, identified using discriminant analysis, were the most important in predicting the designated strategy scores of the 23 plant populations. The predictive equations derived from these marker populations were subsequently utilised to calculate C and S values for all 144 plant populations sampled. Negative scores were possible for plant populations if the population had traits which were less competitive or stress-tolerant than the original marker species.
119
Several populations which could not be positively identified to species level were retained in the analysis, the aim being to describe vegetation strategically rather than laxonomically.
Individual plani populations were grouped together into species assemblages for each HGMU. Competitive ability of Functional Vegetation Type (CFVT) and Stress-tolerance of Functional Vegetation Type (SFVT) values for the community were derived from lhe mean of the C and S scores of the constituent species. In monodominant stands, or where the population of only one species was investigated, the CFVT and SFVT values were equal to the C and S scores respectively. This work is described in detail in Hills et al (1994).
The relationship between state variables, FVTs and CORINE biotopes
Canonical Correspondence Analysis (CCA), available as an option on the CANOCO programme (ter Braak, 1987), was used to assess the relaledness of FVT values and stale variables. The ordination axes were constrained to be linear combinations of the CFVT and SFVT scores, wilh the state variables being entered as species data.
To test whether different CORINE biotopes were associated wilh particular slate variables and FVT values, selected biotopes were overlaid on the CCA diagram at the appropriate site co-ordinates. Only CORINE biotopes which were present at four or more sludy sites were used in this analysis. The four biotopes considered were humid grassland (CORINE code 37), water fringe vegetation - reed beds (53.1), waler fringe vegetation - sedge beds (53.2) and mesophile grasslands (38).
To clarify the relationships between FVT and the state variables, and to oblain a predictive equation, a stepwise multiple regression was performed using CFVT as the dependent variable. Since CFVT and SFVT were shown to be strongly inversely correlated, only one needed to be related to the slate variables.
3.7 Invertebrate studies
The invertebrate studies focused on establishing and investigating databases for three groups: Molluscs, Syrphids and Carabids.
3.7.1 The data base set up
The data bases established represent an attempt to transform into numerical information lhe knowledge available about the three groups of invertebrates considered. The range of available information has been subdivided into three sets building up three distinct data bases. Examples are given here of lhe variables (traits) and their categories defined for the Syrphidae. The species included in the data bases are nol solely the species encountered on site during the surveys but also include lhe species thai can be regarded as potentially able to occupy the site, because they arc known lo occur in lhe region in which the site is located. In the case of the two French sites, the species comprising this regional list arc the 204 Syrphid species known to occur in the 10 French "départements" surrounding the lest sites. In the case of the Irish sites, the total Irish species list has been taken as the potential species pool.
A first data base ("trait file") (Table 3.11) comprises nine variables describing biological and ecological traits of the species (concerning both the larval and adult phases). The number of categories per variable ranges from 3 (migratory status of the adults) to 13 (microhabitat of the larvae). A second data base ("habitat file") (Table 3.12) is made up of a single variable divided into 64 categories describing the range of macrohabitats potentially occupied by Syrphids. The third data base ("range and status file") stores more traditional information related to the geographic range and threat status of the species, an example of which is shown for Syrphidae (Tabic 3.13).
In the case of the Syrphidae, many of the necessary data have been provided by Torp (1984), Kormann (1988) and Speight and Lucas (1992). Additional information has been included, based on the experience and previous observations of one of us (M. Speight). For all three data bases, the link between one species and the categories of a variable is coded using four possible values, as proposed by Bounard el al. ( 1992): 0 - no association; 1 - weak association (e.g. a habitat category only occasionally occupied by the species); 2 - significant association (e.g. a habilat category being part of the normal range of a species); 3
120

Variables (traits)
Duration ot the developmental stage
Microhabitat (larvae)
Commensalism (larvae)
Inudation tolerance (larvae)
Food type (larvae)
Reproductive period
Number of reproduction cycles per year
Migratory status (adult)
Overwintering phase
Trait
No.
1
2
3
4
5
6
7
8
9
10
: ι
12
1
2
3
4
1
2
3
1
2
3
4
Category
<2 months
26 months
612 months
>1 year
unknown
tree, tree ot foliage
tree, overmature, senescent
shrubs
on low growing plants, above ground
in low growing plants, above ground
litter / grass root zone, tree
litter / grass root zone, in wood
litter / grass root zone, in bulbs
herbivore dung
watersaturated sediment, debris
aquatic, submerged sediment, debris
aquatic, submerged plants
unknown
none
quasicommensals
within Aculeate Hymenoptera nests
unknown
short respiratory lube, nontolerant
short respiratory tube, tolerant
medium respiratory tube
tong respiratory tube
unknown
microphageous
living plañís
living animals
Mar
Apr
Mav
Jun
Jul
Aug
Sep
Oct
<1
1
2
>2
not known to migrate
recorded migrant
strongly migrant
unknown
larva
puparium
adult
E
1
2
2
1
2
1
3
3
3
1
3
2
1
2
2
'
1
3
3
3
xample
2
3
3
1
3
3
3
3
1
3
2
1
3
3
3
species
7B
3
/
2
2
2
3
3
3
1
3
3
1
3
1
3
1
2
3
102
3
2
2
3
3
3
3
3
2
3
3
3
Table 3.11 Nine variables and their categories used in trait database for Syrphidae. The categories are
numbered for the four variables shown in Fig. 4.95. Species: \-Baccha elongata, 2-Brachyopa
scutellaris, 1%-Eristallis interrupta, \02-Cheilosia ahenea.
- 121
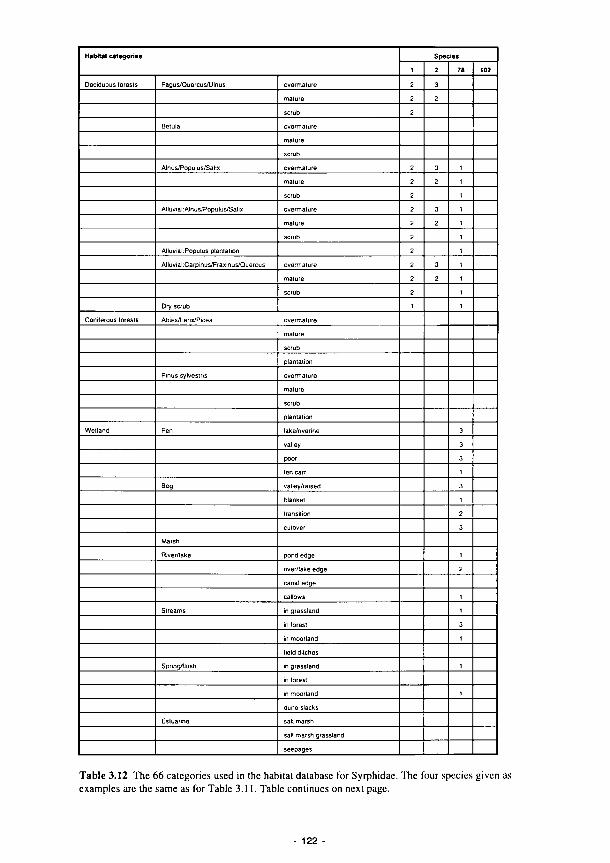
Habitat categories
Deciduous forests
Coniferous forests
Wetland
Fagus/Quercus/Ulnus
Bet ula
Alnus/Populus/Salix
AJIuvia1:Alnus/Populus/Salix
Alluvial:Poputus plantation
AlluvialiCarpinus/Fraxinus/Quercus
Dry scrub
Abies/Lanx/Picea
Pinus sylvestris
Fen
Bog
Marsh
River/lake
Streams
Spring/flush
Estuanne
overmature
mature
scrub
overmature
mature
scrub
overmature
mature
scrub
overmature
mature
scrub
overmature
mature
scrub
overmature
mature
scrub
plantation
overmature
mature
scrub
plantation
lake/riverine
valley
poor
fen carr
valley/raised
blanket
transition
cuïcver
pond edge
nver/iake edge
canal edge
callows
in grassland
in forest
in moorland
field ditches
in grassland
in forest
in moorland
dune slacks
sal! marsh
salt marsh grassland
seepages
Species
1
2
2
2
2
2
2
2
2
2
2
2
?
2
1
2
3
2
3
2
3
2
3
2
78
3
3
3
1
3
1
2
3
1
2
, 1
3
1
1
1
102
Table 3.12 The 66 categories used in the habitat database for Syrphidae. The four species given as examples are the same as for Table 3.11. Table continues on next page.
122 -
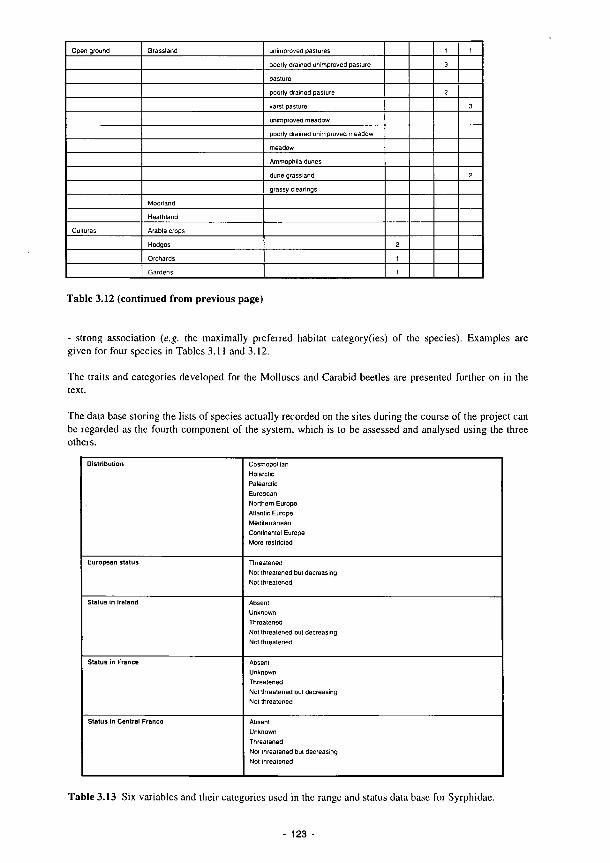
Open ground
Cultures
Grassland
Moorland
Heathland
Arable crops
Hedges
Orchards
Gardens
unimproved pastures
poorly drained unimproved pasture
pasture
poorly drained pasture
karst pasture
unimproved meadow
poorly drained unimproved meadow
meadow
Ammophila dunes
dune grassland
grassy clearings
2
1
1
1
3
2
1
3
2
Table 3.12 (continued from previous page)
- strong association (e.g. the maximally preferred habitat category(ies) of the species). Examples are given for four species in Tables 3.11 and 3.12.
The traits and categories developed for the Molluscs and Carabid beetles are presented further on in the text.
The data base storing the lists of species actually recorded on the sites during the course of the project can be regarded as the fourth component of the system, which is to be assessed and analysed using the three others.
Distribution
European status
Status in Ireland
Status in France
Status in Central France
Cosmopolitan Holarctic Palearctic European Northern Europe Atlantic Europe Mediterranean Continental Europe More restricted
Threatened Not threatened but decreasing Not threatened
Absent Unknown Threatened Not threatened but decreasing Not threatened
Absent Unknown Threatened Not threatened but decreasing Not threatened
Absent Unknown Threatened Not threatened but decreasing Not threatened
Table 3.13 Six variables and their categories used in the range and status data base for Syrphidae.
- 123
3.8 Ornithological methods
The ornithological work was undertaken on the callows of the Middle Shannon, Ireland, and in La Mancha, Spain.
3.8.1 Shannon studies
Counts of wildfowl were made fortnightly (between September 1992 and April 1993) at several sites along the Little Brosna, at Bullock Island and at Clonmacnoise. The counts were repeated over 4/5 days at Little Brosna and over 1/2 days at the other sites, for each fortnightly count. The numbers reported (4.3.7) represent the average number of each species counted during each fortnight. Counts were made from a distance of 300-800m using a 22-60x Optolyth telescope.
For each species the number of bird hours spent at each site was calculated, for each fortnightly count. This allowed seasonal changes in the usage of any areas to be detected. To compare sites over the winter, the average number of bird hours at each site was calculated and expressed as a percentage of the total number of bird hours each species spent at Little Brosna and Clonmacnoise. An identical technique was used to assess the vegetation preferences, where the bird hours related to the different vegetation types. To assess the relationship between waler levels and bird distributions, the total number of each species at each of the callows where water levels were measured, was calculated for each fortnightly count, and then species were plotted against water level.
During the time spent censusing birds on the callows, any disturbance events were monitored and categorised. The time and the place of the disturbance and the effect it had on all waterfowl species was also recorded.
3.8.2 Guadiana studies
The study was carried out in the Upper Guadiana basin from October 1992 to June 1994. Sludy siles were initially selected and instrumented in Laguna del Masegar. However, this lake remained almost completely dry throughout the study period and additional sites had to be located to satisfactorily complete the sludy. Subsequently, study areas were selected in the Laguna del Pcublo, Manjavacas, Dehesilla and Alcahozo. Of these lakes, the former two are seasonal mesosaline lagunas impacted by sewage. Dehesilla (seasonal mesosaline) and Alcahozo (seasonal hypersaline) arc relatively natural lagunas, unaffected by eutrophication but recently impacted by a lowering of the waler table.
A total of 27 stations were eventually included in the study. A dipwcll and redox probes (n=3) at 5cm and 10cm depths were installed at each station. Monthly sediment samples were collected in order to determine pH, conductivity and moisture content. Wetland birds were monitored at each station and redox potentials, water level and temperature were recorded following each bird census. At seasonal intervals, cellulose decomposition rates were measured using the cotton strip technique.
Stations were sampled for macro-invertebrate by hand sorting the sediment from 25x25cm quadrats (n=3) selected randomly at each station to a depth of 25cm. Additional sampling was carried oui using the sediment extracted with a 3cm diameter metal corer to a depth of 7.5cm at each station (n=3), in a modified version of the wet funnel method. This was undertaken in order to sample for smaller invertebrates, particularly Enchytraclds. In April 1994 sedimenl samples (n=10) were collcclcd using 5cm diameter metal soil grab to a depth of 10cm from selected stations, and sieved (0.2mm mesh) to record density and size of chironomid larvae.
124

4 RESULTS
Process studies were undertaken at all of the study sites. The studies focused providing information on the processes that maintain physical, biogeochemical and ecological specific river marginal wetland functions.
4.1 Characterisation of physical processes
This section describes results from the studies of physical processes carried out at the study sites. These include characterisation of the HGMU sequences, establishment of the important mechanisms of hydrological support (which are the storage capacities, pathways and flow rates by which wetlands are supplied and maintained by groundwater reserves resulting in the degree and extent to which they can function as groundwater recharge or discharge areas), the capacity for generation of overland flow from groundwater discharge and characteristics of flooding from the river channel. The latter has important implications, not only for the regulation of downstream flooding through floodplain water storage, but also in water quality regulation functions by way of nutrient removal through sedimentation and by allowing biogeochemical processes such as denitrification to take place, removing nitrate from the water column during flood detention.
The effects of on-site active geomorphological processes controlling the erosion and deposition of materials and soil development has been investigated to examine their role in determining wetland functions, with particular reference to the semi-arid environment.
4.1.1 Characterisation of the physical environment
The assumption is that HGMU delineation separates areas of wetland landscape which differ in hydrology and that this is reflected in the fundamental soil profile characteristics which in turn control a range of important processes.
The data in Figs. 4.1 to 4.7 reveal complex patterns of temporal variation in hydrological regime between stations along the hydrogeomorphic sequence at each study site, including differences in the influence of depth on the redox environment. This information is summarised in Tables 4.1 and 4.2.
A number of key features emerge:
1. There is a remarkable homogeneity of pattern among stations classified a priori in the same HGMU, e.g. CLON3-4 and KISM3-5, which in the latter case illustrates this internal consistency despite cutting across soil wetness classes.
2. The distribution pattern of water level and redox conditions provides evidence for the re-categorisation of stations consistent with HGMU designation. Thus KISM3 (soil wetness class V) clearly matches KISM4-5 (soil wetness class VI) rather than KISM2 (soil wetness class V) (Tabic 4.1,4.2).
3. Separation between HGMUs may be particularly pronounced for certain characteristics or depths. Thus the distinction between LTBR4 and LTBR5 is especially clear in terms of phreatic water level/ flooding frequency even though sites fall into the same wetness class.
4. Rapid changes can occur across HGMU boundaries, such as CLONI and CLON2, LTBR1 and LTBR2.
5. Comparison of water levels between floodplain and slope wetland units reflects fundamental differences in hydrological controls on water input and output. In the example from the Torridge, there is a close correlation between floodplain soil waler table and rainfall (KISMI, BRADI), but in all slope stations the pattern is linked to the seasonal balance between rainfall and évapotranspiration and is little affected by detailed rainfall events.
6. Water table, oxygen and redox values fluctuate sharply in soils formed in permeable material influenced by fluctuating groundwater levels such as the backlands of the Torridge and at Apremont. On soils of lower permeability such as KISM3, there is subdued oscillation particularly in redox at the lowest sampling depths.
- 125 -

CL0N5 CLON4 CL0N3 CL0N2 CLONI
Piezometric
surface
i f
% iVjr^t
0$4u191
VV T Í
w
^
OSS« 91
Oxygen %
y .v** fp 7 Γ r/v
1
Redox 20cm
'WC
V^_
W:
UX us
■ess
Jta/l· i^yi
'KG
^\yv r/u
'SSS
V
Redox 40cm
■mr
vvy γ ]pW~R^ W^v\ \χγ
'«■£
A ig /η
mnr
^Λ"
Redox 80cm
■m
JP* **V
TO
^ψ ^ 7 "
■'«S3
vV> ^ IŒC;
w'■ A/
I0O
ox
200
■200
400
,
'ffiW
y • \.
» r * 3
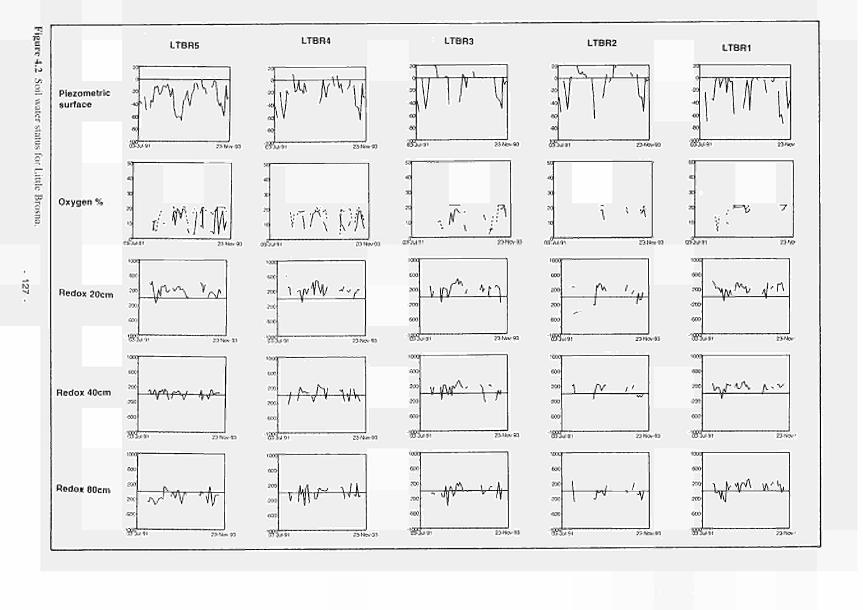
LTBR5 LTBR4 LTBR3 LTBR2 LTBR1
Piezometric surface
20
40
«O
«
./Λ V
«KM-SI
*Λ1ΐ r \f W '
23-No*
ta ^V
'T
«.
κ 7 ^ Wì Oxygen %
Redox 20cm
TO,
ΪΑ
y-Λ
π^ M 23-Νσν-93 CKKJul-91
^Λ
'SS
jp_ U/
03-Jul-9i
tooc —
■ T O
,t »/Π 23Nw93 0301*91
pA ig
'TO
Ρ
. ' = \ û
23Nov93 03Jul9
V^ v n
Redox 40cm w v w TN^MTK νΛ \" j /y_ Y ^ ^
Redox 80cm
'OT
A/^ if
600
200
200
■600
m
iVf\ r^ Λ I ¡\ V n\\l \v
JV
vil 91 23Νσ 'OT
ψ" Hi
•OT
■fK
'OT
V yA y\,vv
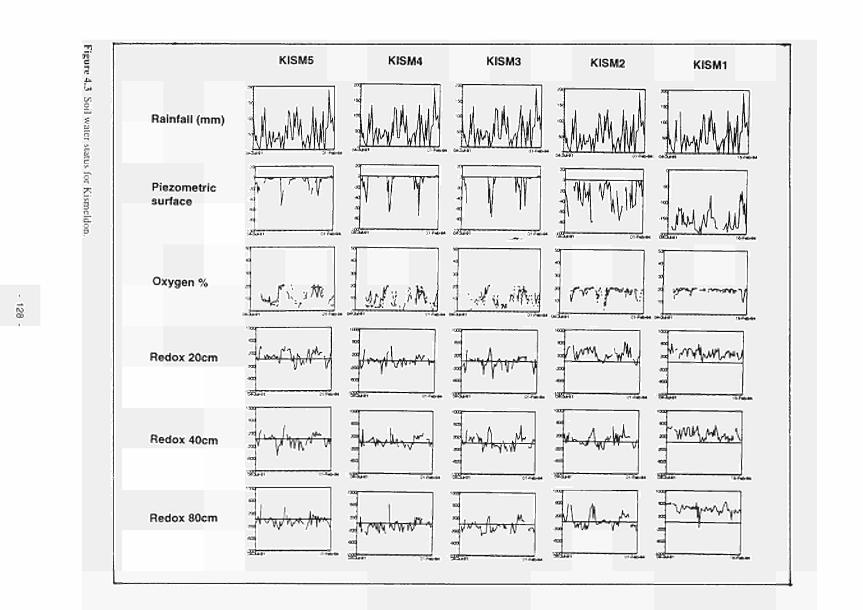
Τ υ' e KISM5 KISM4 KISM3 KISM2 KISM1
ill
J-.
f
Rainfall (mm)
Piezometric surface
Oxygen %
Redox 20cm
Redox 40cm
Redox 80cm
1Γ«>Μ n*Jt*ei
ι · ι r" »' w IBui
SSHs
*S\*mt élí'Ohi Jaßk f^fr*f\j φ~Τ-
ι*4ψι±ϊ :^fU^> ISKÍM
hV r beu«
»MÄ^A A'^rvVvu*^
'iSji
/'Yv^ i wW1
~K*7
W 'utaiM
:M^ 'yW\AA»\
'oESSSì "
i^v^jff *
"■Wui'
^/Λ^Κ^ΛΡ' J V ^ ' I / O :4JM. 'v~wyy
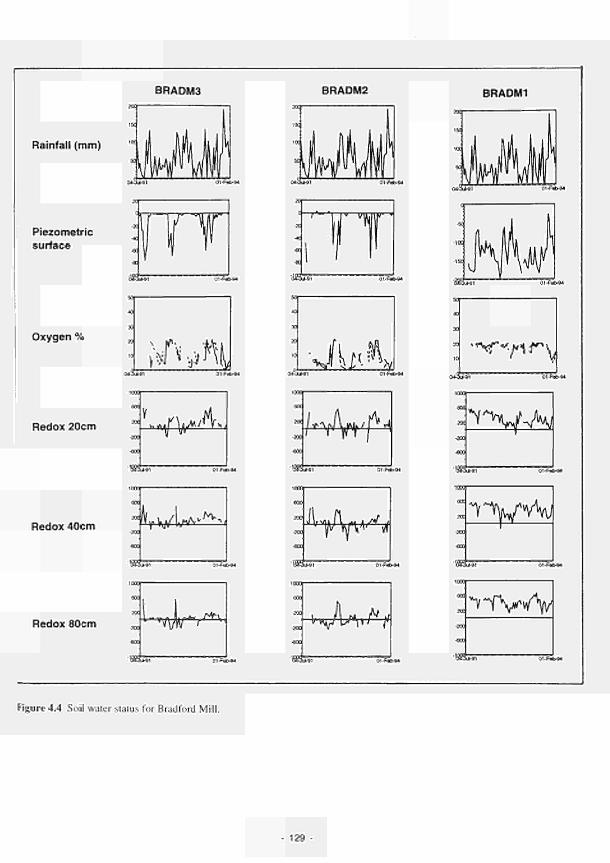
Rainfall (mm)
Piezometric
surface
Oxygen %
Redox 20cm
Redox 40cm
Redox 80cm
BRADM3
20C
ÕCO
■mn-
•ψίΑ A
■-¿χ.
'XJO
ea
v H ,
:.y.
m
Î^4rrm"
BRADM2
■300
ÖOC
rar
/WWf^
ras*
■^Ap s.
■ras?
vU^f
BRADM1
0+SUMT
'*<Γ*/Ίί"^
-zoo
-600
■ras
*VX/-Ai
TO
1 v/vVi
TO
'"■vtVVV
Figure 4.4 Soil water status for Bradford Mill.
129
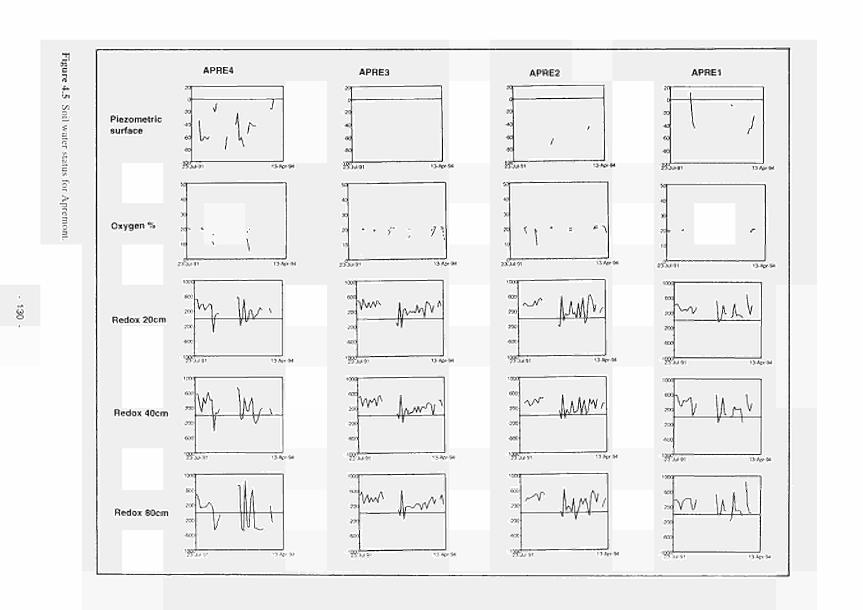
ñ' e
o
>
Piezometric
surface
Oxygen %
APRE4
L ¡V ¡gt
APRE3
JÏ
APRE2
ΙΨ
20 <,
APRE1
W
Redox 20cm
Redox 40cm
Redox 80cm
•'SE
'SE
4k
eoo
20C
200
■600
rV
h I V t u m
f II I
η «τ
U«' "
BOC _
70-
ro:
YW\A
155Í
W^
'SE
vw*
'SE
¡f^P
¡¡υ***
■l yA
^r
5EST
A / ^
r^r
S E 3'
4¿M.
J4Æ
icor.
enr
V>V
B°UT
SÎW"
w
JüÜL
]b¿
Jåjx
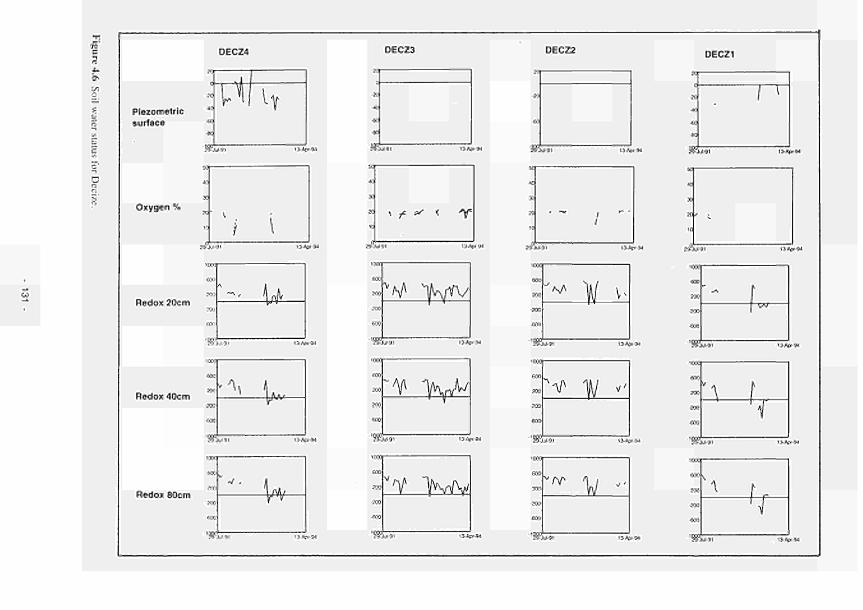
Piezometric
surface
Oxygen %
Redox 20cm
Redox 40cm
Redox 80cm
DECZ4
0
■20
4 C
6C
no
■1
ίΛΙ ΐγ 2§Jul91
·-2'.'.It,
60C
2«
20C
GOT
■1®
60
20C
20
60C
■içg
βα
20
■2«
GOt
■'38
ι.
/ 91
Λ
\
u
13Apr94
ö
■20
40
■Of!
Θ0
DECZ3
¿§3ul91 13Apr94
40
30
20
10
13Apr94
Jul 91 13Af
* \ L·. V™
Jul91 13Ar
""' w r v
Jul 91 13Aj
I D4
r94
>r94
χ ¿c ?S < f
■20
■60
DECZ2
29Jul9l
40
30
20
10
29 Jul91 13Apr94
20C
■20C
ea
M
ea
2a
■2a
■ea
tçg
60
20C
2a
•ea
•'SS
V^ >x í fV
Jul91 13A[
"Ψ >γΛ/ V
Jul91 13Af
VY >wy
Jul 91 13At
»■94
■r94
>r94
29Üul91
GO
2i>
20Γ
•60C
■'S
COC
roc
2a
βα
'S1
6a
2a
20C
"Ά/
/ 1
¥
13-Apr-94
>--
20
C
2 0
■40
(■0
■B'J
DECZ1
I »
"¿KhiMM
5 0
40
30
2 0 /
to
l3Apr94
l·
Jul9t
V 1/
13Apr94
V'
Jul91
νΛΓ V
13Apr94
V '
■'SKkMI 13 Apr 94
l3Apr94
=■
29Üul91
100
βα
2a
2a
■ea
'S
IC"""
ea
2a
■?.(X
■ea
'HS
JOOI
θα
2a
■2a
ea
•'S?
13Apr94
"" Í f~V5 1
Jul91 13Apr94
f w
Jui91
\
13Apr94
Γ .
'1 Jui91 13Apr94
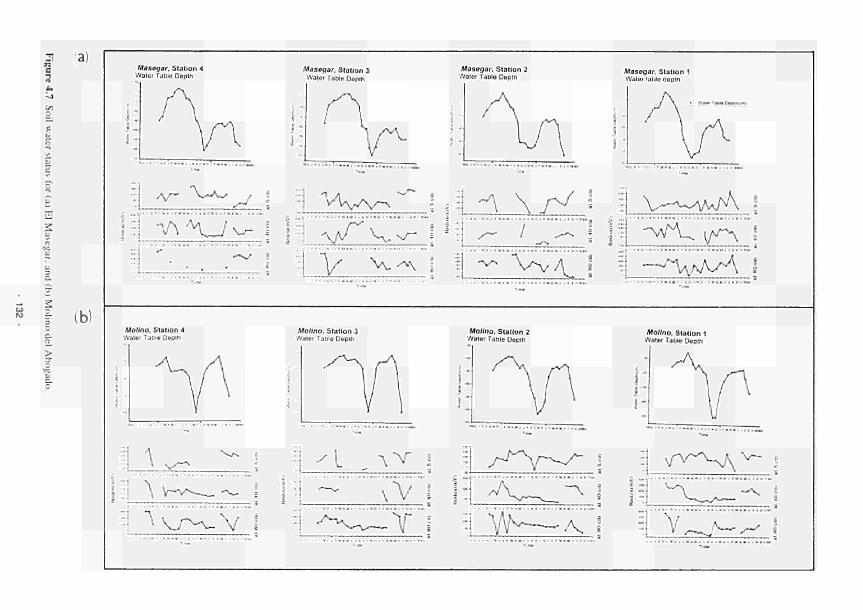
Masegar, Station 4 Water Table Depth
5 m
ΛΓ Ύ~\_,
V\\J v -
Masegar. Stallon 3 Waler Table Depth
Vl^^v^
V. "]/ V>^\
Masegar, Station 2 Water Table Depth
i Λ f"^ :: -*ν%
\yV J ""/ !ΓΊ "VvA^ i
/Vfasegar. Station 1 Water table depth
M M I ■-I "■■ ■·..
••Vv^U. \f^\
j - ^ V A ^ A
I (b) Molino, Station 4
Water Table Depth Molino. Station 3
Water Table Depth Molino, Station 2
Water Table Depth Molino, Station 1
Water Table Depth
ψ—κ ι IV

Water table depth (cm)
Flooded 0 - 2 0
2 0 - 4 0 4 0 - 8 0
> 8 0 Water table depth (cm)
Flooded 0 - 2 0
2 0 - 4 0 4 0 - 8 0
> 8 0 Water table depth (cm)
Flooded 0 - 2 0
2 0 - 4 0 4 0 - 8 0
> 8 0 Water table depth (cm)
Flooded 0 - 2 0
2 0 - 4 0 4 0 - 8 0
> 8 0
Welness Class
1
Welness Class
I I - I V
Wetness Class
V
Welness Class
VI
Shannon stations C1 C2
8 8 14 45 25
C3
9 75 14 2 0
C4
6 72 20 2 0
C5
9 46 32 13 0
LB1
8 41 15 17 19
LB2
52 22 13 13 0
LB3
13 53 13 15 6
LB4
17 41 17 17 8
LB5
0 42 32 26 0
Torrldqe stations K1
0 0 6 5
89
K2
0 33 24 28 15
K3
0 84 3 10 3
K4
0 87 7 6 0
K5
0 83 12 5 0
B1
0 3 3 9
85
B2
0 78 1
to 11
B3
0 76 12 12 0
Water table depth (cm)
Flooded 0 - 2 0
2 0 - 4 0 4 0 - 8 0
>S0 Water table depth (cm)
Flooded 0 - 2 0
2 0 - 4 0 4 0 - 8 0
> 8 0 Water table depth (cm)
Flooded 0 - 2 0
2 0 - 4 0 4 0 - 8 0
> 8 0
Water table depth (cm)
Flooded 0 - 2 0 2 0 - 4 0 4 0 - 8 0
> 8 0
Wetness Class
I
Wetness Class
I I - I V
Wetness Class
V
Wetness Class
VI
Loire/Alller stations A1
32 8 6 16 38
A2
15 0 6 12 67
A3
8 2 0 2
88
A4
25 13 13 36 13
D1
59 10 18 3 0
D2
10 0 0 0
90
03
0 0 0 0
100
D4
50 7
28 11 4
Guadiana stations MA1
2 6 4
20 68
MA2
7 17 8
28 40
MA3
0 0 8
20 72
MA4
3 9 16 4
68
MO 1
0 0 0 0
100
MO 2
0 0 0 0
100
MO 3
0 0 0 0
100
MO 4
0 0 0 0
100
Table 4.1 Percentage of recorded water levels in different wetness classes.
133 -
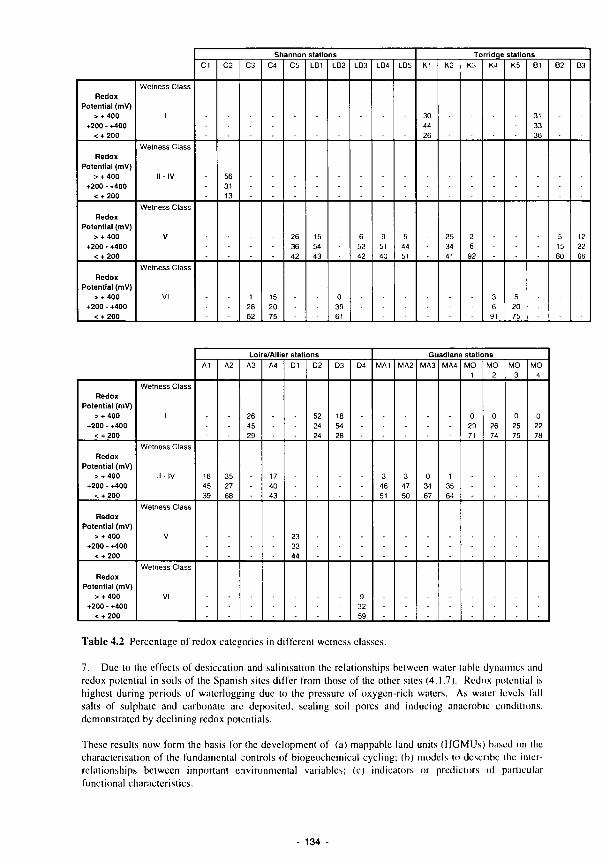
Redox Potential (mV)
> + 400 +200 - +400
< + 200
Redox Potential (mV)
> + 400 +200 - +400
< + 200
Redox Potential (mV)
> + 400 +200 - +400
< + 200
Redox Potential (mV)
> + 400 +200 - +400
< + 200
Wetness Class
1
Wetness Class
I I - I V
Welness Class
V
Wetness Class
VI
Shannon stations C1 C2
56 31 13
C3
1 28 62
C4
15 20 75
CS
26 36 42
LB1
15 54 43
LB2
0 39 61
LD:;
6 52 42
LB-I
9 51 40
LB5
5 44 51
Torridqe stations M
30 44 26
K.'
25 34 41
K3
2 6
92
K4
3 6
Κ5
5 20 75
Β1
31 33 36
Β2
5 15 80
Β3
12
66
Redox Potential (mV)
> + 400 +200 - +400
< + 200
Redox Potential (mV)
> +400 +200 - +400
< + 200
Redox Potential (mV)
> + 400 +200 - +400
< + 200
Redox Potential (mV)
> + 400 +200 - +400
< + 200
Welness Class
1
Welness Class
I I - I V
Wetness Class
V
Wetness Class
VI
Loire/Allier stations A1
16 45 39
A2
35 27 68
A3
26 45 29
A4
17 40 43
01
23 33 44
D2
52 24 24
D3
18 54 28
D4
9 32 59
Guadiana stations MAI
3 46 51
MAL'
3 47 50
MA3
0 34 67
ΜΛ4
1 35 64
MO 1
0 29 71
MO 2
0 26 74
MO 3
0 25 75
MO 4
0 22 78
Table 4.2 Percentage of redox categories in different welness classes.
7. Due to the effects of desiccation and salinisation the relationships between water (able dynamics and redox potential in soils of the Spanish sites differ from those of the other sites (4.1.7). Redox potential is highest during periods of waterlogging due to the pressure of oxygen-rich walers. As waler levels fall salts of sulphate and carbonate are deposited, scaling soil pores and inducing anaerobic conditions, demonstrated by declining redox potentials.
These results now form the basis for the development of (a) mappable land unils (HGMUs) based on the characterisation of the fundamental controls of biogeochemical cycling; (b) models to describe lhe interrelationships between important environmental variables; (c) indicators or predictors of particular functional characteristics.
134

4.1.2 Flow regimes and mechanisms
Studies carried out on the Shannon and Torridge sites were concerned with establishing the flow rates and
patterns by which the wetlands are maintained.
Shannon site
Groundwater flow system
The results of the groundwater modelling of the Clonmacnoise site are shown in Figs. 4.8 and 4.9. Results
from the Little Brosna site show similar flow rates and patterns. The groundwater systems active in the
floodplain function quite separately from the deeper regional groundwater system, due to the intervening
thick clay layer that underlies the callow. Groundwater flow through the gravel mostly passes under the
floodplain and exfiltrates directly to the river, which has cut deep into the clay. The little upward seepage
that does occur through the clay (max. 0.08 mm/d, in the summer model) does not reach the surface but is
diverted to the river through sandlenses. Seepage from the regional 'gravel' system does occur along a
small zone at the upper edge of the callow, the 'lower slope' unit, but is largely diverted towards the deep
drainage ditch constructed at the foot of the esker. Without this drain the 'upper depression' unit would be
far wetter than it is now.
Water budgets The difference between the water budgets (Fig. 4.10) of the soil stations modelled at both sites can be
explained largely by differences in flooding duration. The callow water budget consists largely of direct
infiltration of rainwater ( P¡nf) and évapotranspiration (Ea). No infiltration of river water has occurred on
cither site. Soils at all units were always completely waterlogged by precipitation before flooding started,
in all seasons.
Water tables remain within 0.15m of the surface during 6 months of the year through the soil profiles are
rarely completely waterlogged due to the presence of a permeable topsoil. The water table is rarely below
0.5m, thus maintaining subsoil wetness throughout the year.
Comparison of modelled and observed water levels shows that the results arc in agreement in the summers
of 1992 and 1993, and somewhat less consistent in the summer of 1991, which was characterised by
alternating very dry and wet periods. The simulation of the general pattern of groundwater fluctuation
over the whole 19913 period is considered to be satisfactory.
Torridge sites
Kismeldon
The hydraulic properties at Torridge sites have been assessed. Fig. 4. II shows permeabilily dala from
North Devon for lhe three main geological units. Fractured bedrock (FB) has the highest permeability,
ranging from 10" to I0°m/d. The weathered bedrock zone (WZ) and Head (H) in general have lower
permeabilities, with very low values (10"' m/d) representing the mudstone beds within the sequence.
Al the site, piezometer tesis indicated the permeability of the Head deposits to range from 4 χ IO"' to 0.2
m/d (median = 5 χ IO"4 m/d). The permeability of the bedrock underlying the wetland ranges from I χ IO"2
lo 2m/d (median = 3 χ IO" m/d), and its distribution reflects the presence of low permeability beds. No
boreholes penetrated the fractured bedrock at the site: crude hydraulic tests of nearby wells indicated a
permeability of the order of 0.01 m/d.
Groundwater head distribution
Groundwater head distribution maps were constructed by contouring the water level data collected from
the piezometer network. An example is shown for January 1992 for the superficial deposits (SD) and the
Weathered Zone (WZ) (Fig. 4.12). The same general pattern persisted throughout the sludy period. For
most of the lime alluvium was found to be dry. The data indicate:
(i) groundwater flow from the valley sites towards the river;
(ii) fairly steep hydraulic gradients as expected given the low permeabilities;
(iii) recharge/downward head gradients on lhe higher valley sides;
(iv) upward head gradients and discharge on lhe middle slopes (Fig. 4.13); and
135
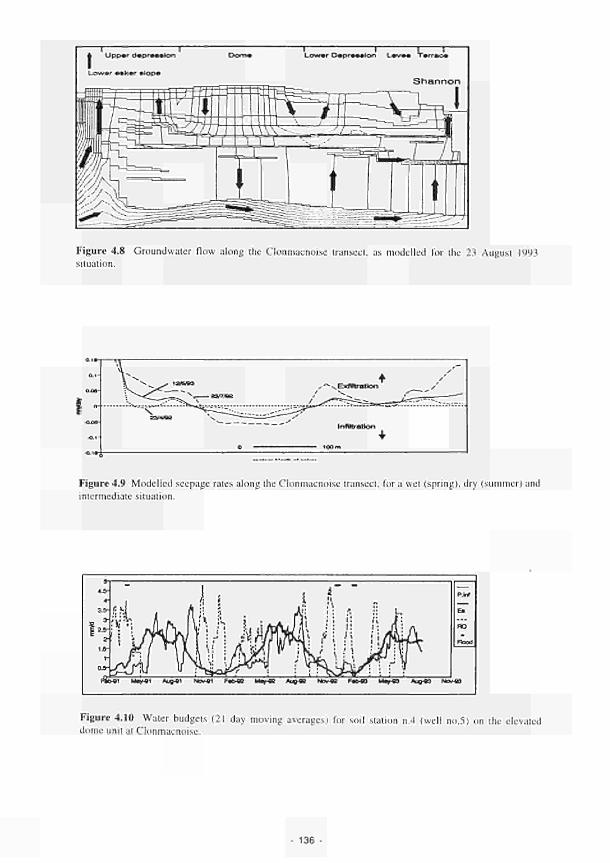
τ Γ Upper d f x — I o n
Lower eeker stop·
ι 1 C Γ
Lower Depression Levee Terrece
Shannon
Figure 4.8 Groundwater flow along the Clonmacnoise transect, as modelled for the 23 August 1993 situation.
0 . 1
0.08
0.1
u...
Λ *Κ 12Λ»3
: ^ ^ ^ ,^—^^ N
v 23/7Ä2
23ΜΛΛ N. ■
0
)
.—¿¿~ X
/
Infi Hr at ton
100m
^y
Figure 4.9 Modelled seepage rates along the Clonmacnoise transect, for a wet (spring), dry (summer) and
intermediate situation.
4.5
* 15
3
Ε 2.5
2
lir
r
ft'! J Ί L/7 Zr~*-Y W
FÎoei Ue/«1 AuQÛl
Y. ft y/tí 1 ! Γ* „S ί n/ri , L \ί ; Aúfi¡\
VJi ¡! ι rlX/\rll
\ ι Λ; i / j J y n ] • Csi04*V ! Nov«l rsM2 Me/«
Ju i
rv
W'ì' ' Ν*
AUQB2
4 " !\ r ;
' ι
¡Μ
to«
¡ι Γ: U ι! /; j : il ι·. rt:
Π ! 'Ά
■ 1 idi/ · > F » « Μ^«3 Auo« NO.
P.W
E·
no
nom
49
Figure 4.10 Water budgets (21 day moving averages) for soil station n.4 (well no,5) on (he elevated dome unit at Clonmacnoise.
136
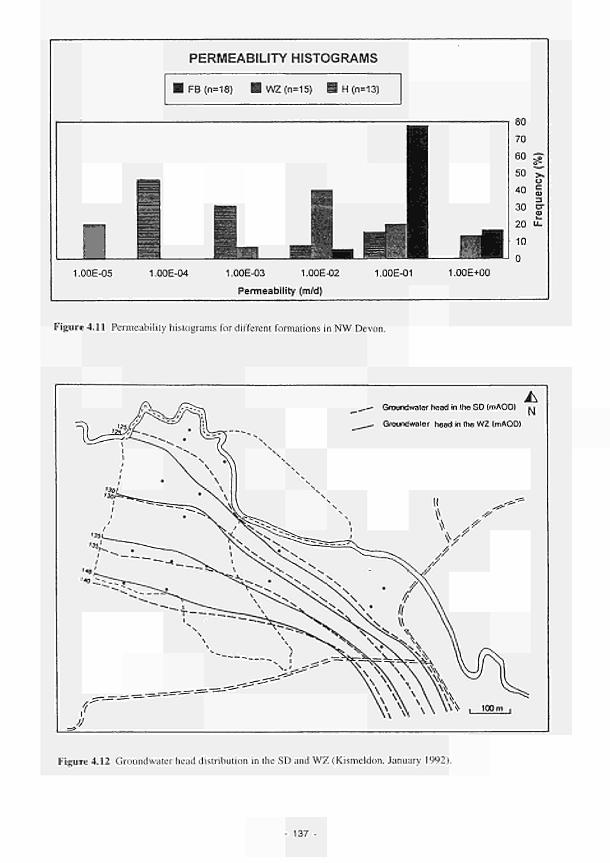
PERMEABILITY HISTOGRAMS
FB (n=18) ■ WZ (n=15) Β Η (n=13)
80
70
60 c? 0 s ·
50 >, υ
40 g 30 σ
Φ
20 ί 10 0
1.00Ε-05 1.00Ε-04 1.00Ε-03 1.00Ε-02 Permeability (m/d)
1.00E-01 1.00E+00
Figure 4.11 Permeability histograms for different formations in NW Devon.
Groundwater head in lhe SD (mAOOl
Groundwaler head in lhe WZ (mAOD)
Figure 4.12 Groundwater head distribution in the SD and WZ (Kismeldon, January 1992).
137
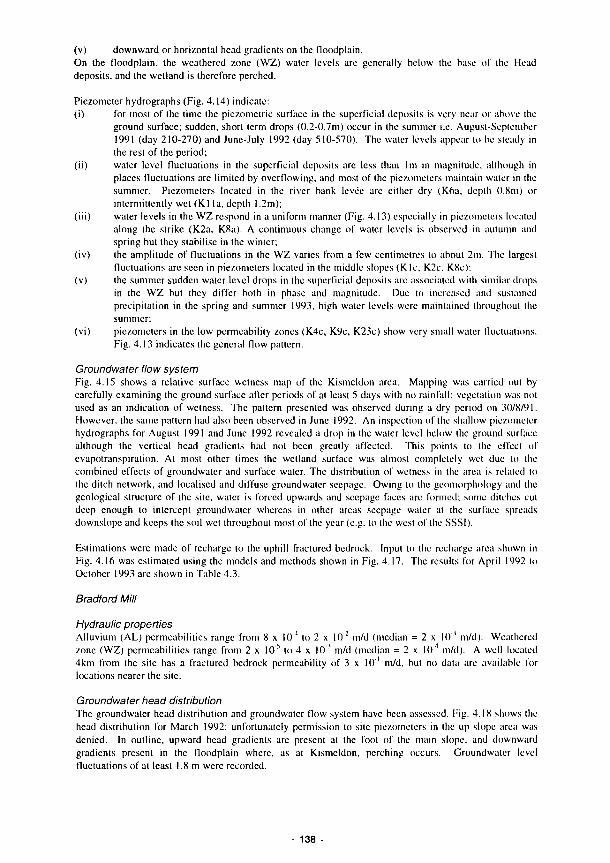
(ν) downward or horizontal head gradients on the floodplain.
On the floodplain. the weathered zone (WZ) water levels are generally below the base of the Head
deposits, and the wetland is therefore perched.
Piezometer hydrographs (Fig. 4.14) indicate:
(i) for most of the time the piezometric surface in the superficial deposits is very near or above the
ground surface; sudden, short term drops (0.20.7m) occur in lhe summer i.e. AugustSeptember
1991 (day 210270) and JuneJuly 1992 (day 510570). The water levels appear to be steady in
the rest of the period;
(ii) water level fluctuations in the superficial deposits are less than Im in magnitude, although in
places fluctuations are limited by overflowing, and most of the piezometers maintain water in the
summer. Piezometers located in the river bank levée are cither dry (K6a, depth 0.8m) or
intermittently wet (Kl la, depth 1.2m);
(iii) water levels in the WZ respond in a uniform manner (Fig. 4.13) especially in piezometers located
along the strike (K2a, K8a). A continuous change of water levels is observed in autumn and
spring but they stabilise in the winter;
(¡v) the amplitude of fluctuations in the WZ varies from a few centimetres to about 2m. The largest
fluctuations are seen in piezometers located in the middle slopes (Klc, K2c, K8c);
(v) the summer sudden water level drops in the superficial deposits are associated with similar drops
in the WZ but they differ both in phase and magnitude. Due to increased and sustained
precipitation in the spring and summer 1993, high water levels were maintained throughout the
summer;
(vi) piezometers in the low permeability zones (K4c, K9c, K23c) show very small water fluctuations.
Fig. 4.13 indicates the general flow pattern.
Groundwater flow system
Fig. 4.15 shows a relative surface wetness map of the Kismeldon area. Mapping was carried out by
carefully examining the ground surface after periods of at lcasl 5 days with no rainfall: vegetation was nol
used as an indication of wetness. The pattern presented was observed during a dry period on 30/8/91.
However, the same pattern had also been observed in June 1992. An inspection of the shallow piezometer
hydrographs for August 1991 and June 1992 revealed a drop in lhe waler level below the ground surface
allhough the vertical head gradients had not been greatly affected. This points to the effect of
évapotranspiration. At most other times the wetland surface was almost completely wet due lo the
combined effects of groundwater and surface water. The distribution of wetness in the area is related lo
the ditch network, and localised and diffuse groundwater seepage. Owing lo the geomorphology and the
geological structure of the site, water is forced upwards and seepage faces are formed; some ditches cui
deep enough to intercept groundwater whereas in oilier areas seepage water at the surface spreads
downslope and keeps (he soil wet throughout most of the year (e.g. to the west of the SSSI).
Estimations were made of recharge to the uphill fractured bedrock. Input to lhe recharge area shown in
Fig. 4.16 was estimated using the models and methods shown in Fig. 4.17. The results for April 1992 lo
October 1993 are shown in Table 4.3.
Bradford Mill
Hydraulic properties
Alluvium (AL) permeabilities range from 8 χ 10 to 2 χ 10' m/d (median = 2 χ 10 m/d). Weathered
zone (WZ) permeabilities range from 2 χ 10"5 to 4 χ IO'3 m/d (median = 2 χ IO"4 m/d). A well located
4km from the site has a fractured bedrock permeability of 3 χ IO'1 m/d, but no data are available for
locations nearer the site.
Groundwater head distribution
The groundwater head distribution and groundwater flow system have been assessed. Fig. 4.18 shows the
head distribution for March 1992: unfortunately permission to site piezometers in the up slope area was
denied. In outline, upward head gradients are present at the fool of the main slope, and downward
gradients present in the floodplain where, as at Kismeldon. perching occurs. Groundwater level
fluctuations of at least 1.8 m were recorded.
138

SSW
n
T.
mAOD 170
160
150-
140
130
120-
110
100
__ Geological boundary NNE — Shaly band limit • · Groundwater head (superficial
^ ~ · — Groundwaler head deposits) (weathered zone ) Groundwater flow direction Ditch location
Piezometer location
V- '-y-
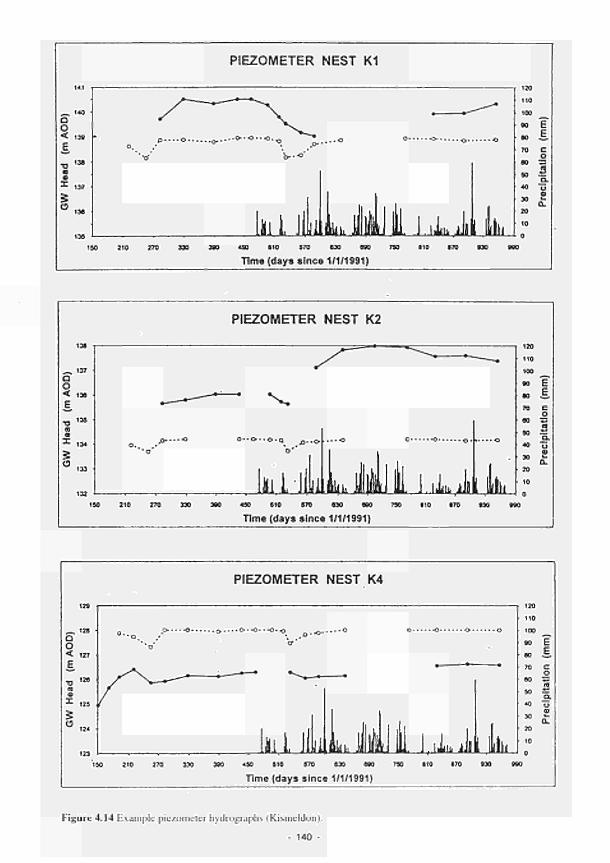
α o < 13»
E.
— I M
PIEZOMETER NEST K1
ii ι. ilÍilL. MI I ι .i. j
120
110
100
•o f
» ë. το e
o η is
3 M U
ISO 210 270 SO 3» «H «10 «70 «30 MO 7S0 110 »70 HO
Time (days since 1/1/1991)
— '37 O O < 13«
ε.
134
133
132
ISO
PIEZOMETER NEST K2
o O o
Xiiklll iti 490 «10 «70 «30 «SO 790 110 «70 «30
120
110
100
00
n 70
00
SO
40
30
20
• 10
0
»o
Time (days since 1/1/1991)
α o < 127
E. τ, '»
PIEZOMETER NEST K4
ρ···~-0·· ~·~ .Q, · 0 · 0 Ο · · ο β .ο.·*·*0
o o o o
• · —·
l. J , I L Í J I
120
110
100
00
M
70
V)
40
τη
20
10
b E.
CI
0
CU
Ai η o αϊ
α.
210 270 330 300 490 »10 970 « Χ «00 790 110 (70 «30
Time (days since 1/1/1991)
Figure 4.14 Example piezometer hydrographs (Kismeldon).
- 140 -

LEGEND |:·:·:-*¥:ί1 Rolalrvaly wel aroa I I Rolairvoly dry area
Figure 4.15 Kismeldon surface wetness map (30/08/91 ).
i-'-A Recharge area \Λ*\Λ Throughrtow lone ^ , — Groundwater AowSne . · · · Groundwater divido
Groundwaler contour ImAOO) U Upward hydraulic gradient D Downward hydrauRc gradiert Η Hoõrcntal hydrauSc g radioni
H
.**'■ * , 100m
• ·" * \
Figure 4.16 Hydrogeological boundaries and features at Kismeldon.
141
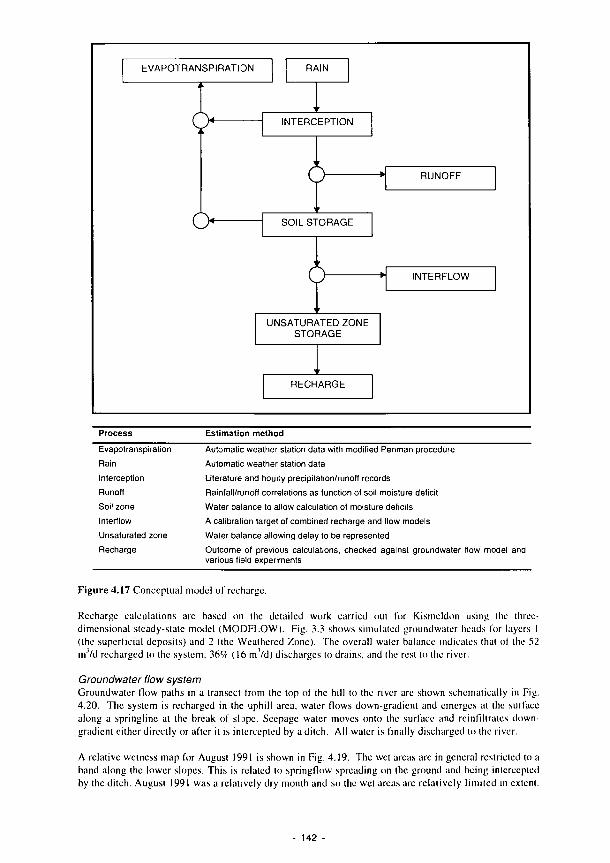
EVAPOTRANSPIRATION
χ
RAIN
O INTERCEPTION
õ
<y
RUNOFF
SOIL STORAGE
O INTERFLOW
UNSATURATED ZONE
STORAGE
RECHARGE
Process Estimation method
Evapotranspiration Automatic weather station data with modified Penman procedure
Rain Automatic weather station data
Interception Literature and hourly precipitation/runoff records
Runoff Rainfall/runoff correlations as function of soil moisture delicil
Soil zone Water balance to allow calculation ol moisture deficits
Interflow A calibration target of combined recharge and flow models
Unsaturated zone Water balance allowing delay to be represented
Recharge Outcome of previous calculations, checked against groundwater flow model and
various field experiments
Figure 4.17 Conceptual model of recharge.
Recharge calculations arc based on the detailed work carried out for Kismeldon using the three
dimensional steadystate model (MODFLOW|. Fig. 3.3 shows simulated groundwater heads for layers I
(the superficial deposits) and 2 (the Weathered Zone). The overall waler balance indicates that of the 52
m/d recharged to the system, 369Í (16 m/d) discharges to drains, and the rest to the river.
Groundwater flow system
Groundwater flow paths in a transect from the top of the hill to the river arc shown schematically in Fig.
4.20. The system is recharged in the uphill area, water flows downgradient and emerges at the surface
along a springline at the break of slope. Seepage water moves onto the surface and reinfillrales down
gradient either directly or after it is intercepted by a ditch. All water is finally discharged to the river.
A relative wetness map for August 1991 is shown in Fig. 4.19. The wet areas arc in general restricted to a
band along the lower slopes. This is related to springflow spreading on the ground and being intercepted
by the ditch. August 1991 was a relatively dry month and so the wet areas are relatively limited in extent.
142
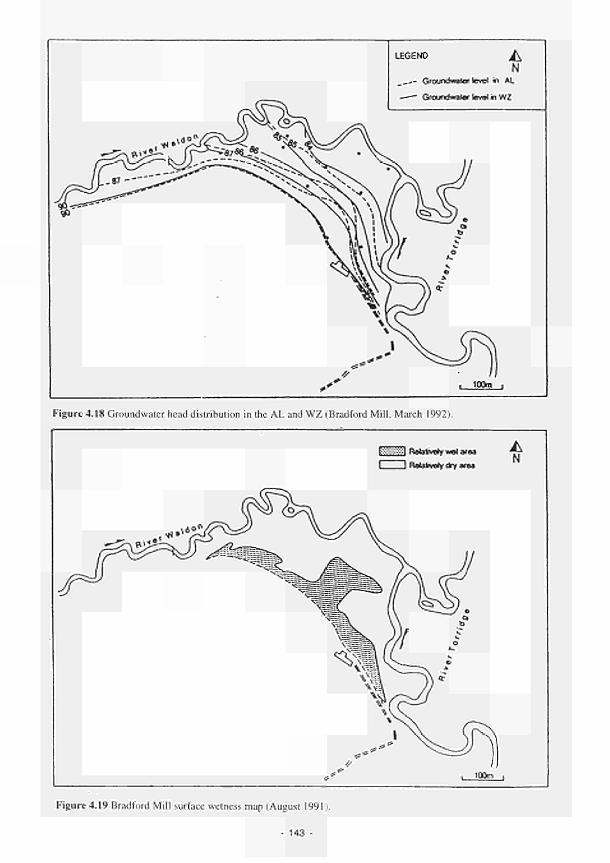
LEGEND jt±
N _,— Groundwater level in AL
—■— Groundwater level in WZ
Figure 4.18 Groundwater head distribution in the AL and WZ (Bradford Mill, March 1992).
Γ*&8$1 Rolativety wel area
I I Rolatrvory dry area
ι 100m
Figure 4.19 Bradford Mill surface wetness map (August 1991)
- 143 -
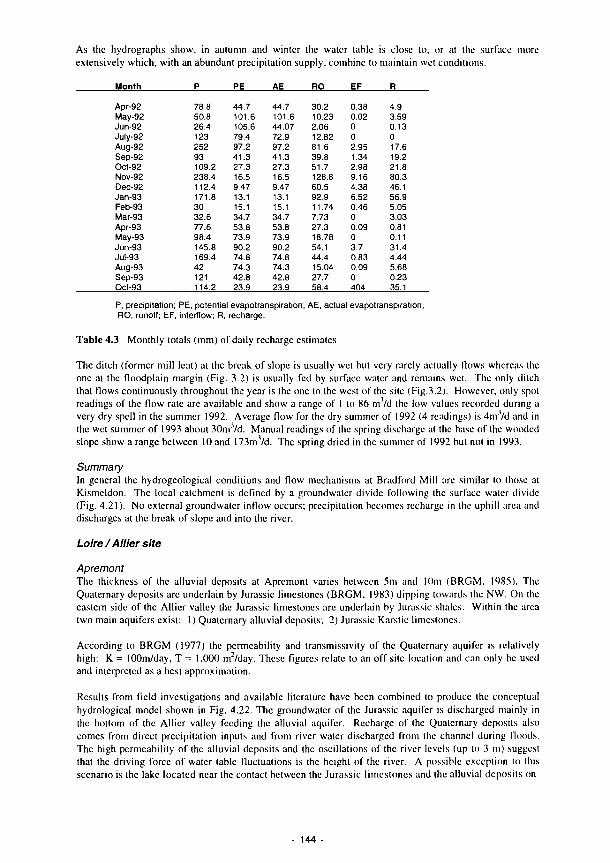
As the hydrographs show, in autumn and winter the water table is close to, or at the surface more
extensively which, with an abundant precipitation supply, combine to maintain wet conditions.
Month Ρ PE AE RO EF
Apr-92
May-92
Jun-92
July-92
Aug-92
Sep-92
Oct-92
Nov-92
Dec-92
Jan-93
Feb-93
Mar-93
Apr-93
May-93
Jun-93
JuI-93
Aug-93
Sep-93
Oct-93
78.8
50.8
26.4
123
252
93
109.2
238.4
112.4
171.8
30
32.6
77.6
98.4
145.8
169.4
42
121
114.2
44.7
101.6
105.6
79.4
97.2
41.3
27.3
165
9 47
13.1
15.1
34.7
53.8
73.9
90.2
74.8
74.3
42.8
23.9
44.7
101.6
44.07
72.9
97.2
41.3
27.3
165
9.47
13 1
15 1
34.7
53.8
73.9
90.2
74.8
74.3
42.8
239
30.2
10.23
2.06
12.82
81.6
39.8
51.7
128.8
60.5
92.9
11.74
7.73
27.3
18.78
54.1
44.4
15.04
27.7
5Θ4
0.38
0.02
0
0
2.95
1.34
2.98
9 16
4.38
652
0.46
0
0.09
0
3.7
0.83
009
0
404
4.9
3.59
0.13
0
17.6
19.2
21.8
80.3
46.1
56.9
5.05
3.03
0.81
0.11
31.4
4.44
5.68
0.23
35.1
P, precipitation; PE, potential évapotranspiration; AE, actual évapotranspiration; RO, runoff; EF, interflow; R, recharge.
Table 4.3 Monthly totals (mm) of daily recharge estimates
The ditch (former mill leat) at the break of slope is usually wet but very rarely actually flows whereas the
one at the floodplain margin (Fig. 3.2) is usually fed by surface water and remains wet. The only ditch
that flows continuously throughout the year is the one to the west of the site (Fig.3.2). However, only spot
readings of the flow rate arc available and show a range of 1 to 86 m/d the low values recorded during a
very dry spell in the summer 1992. Average flow for the dry summer of 1992 (4 readings) is 4m /d and in
the wet summer of 1993 about 30m'/d. Manual readings of the spring discharge at the base of the wooded
slope show a range between 10 and 173m"7d. The spring dried in the summer of 1992 but noi in 1993.
Summary
In general the hydrogeological conditions and flow mechanisms at Bradford Mill arc similar to those at
Kismeldon. The local catchment is defined by a groundwater divide following the surface waler divide
(Fig. 4.21). No external groundwater inflow occurs; precipitation becomes recharge in lhe uphill area and
discharges at the break of slope and into the river.
Loire / Allier site
Apremont
The thickness of the alluvial deposits at Apremont varies between 5m and 10m (BRGM, 1985). The
Quaternary deposits are underlain by Jurassic limestones (BRGM, 1983) dipping towards the NW. On the
eastern side of the Allier valley the Jurassic limestones are underlain by Jurassic shales. Within the area
two main aquifers exist; 1) Quaternary alluvial deposits; 2) Jurassic Karstic limestones.
According to BRGM (1977) the permeability and transmissivity of the Quaternary aquifer is relatively
high: Κ = lOOm/day, Τ = 1,000 m7day. These figures relate to an off site location and can only be used
and interpreted as a best approximation.
Results from field investigations and available literature have been combined to produce the conceptual
hydrological model shown in Fig. 4.22. The groundwater of the Jurassic aquifer is discharged mainly in
the bottom of the Allier valley feeding the alluvial aquifer. Recharge of the Quaternary deposits also
comes from direct precipitation inputs and from river water discharged from the channel during floods.
The high permeability of the alluvial deposits and the oscillations of the river levels (up to 3 m) suggest
thai the driving force of water table fluctuations is the height of the river. A possible exception lo this
scenario is the lake located near the contact between the Jurassic limestones and the alluvial deposits on
- 144 -

2 ie' - i 4 -i~»
3
mAOD 130-
120-
110 —
100-
9 0 -
8 0 -
70-
6 0 -
Geological contact
GW head in SD (average)
GW head in WZ/FB (average)
GW (low direction
ν Ditch location
B7 Piezometer location
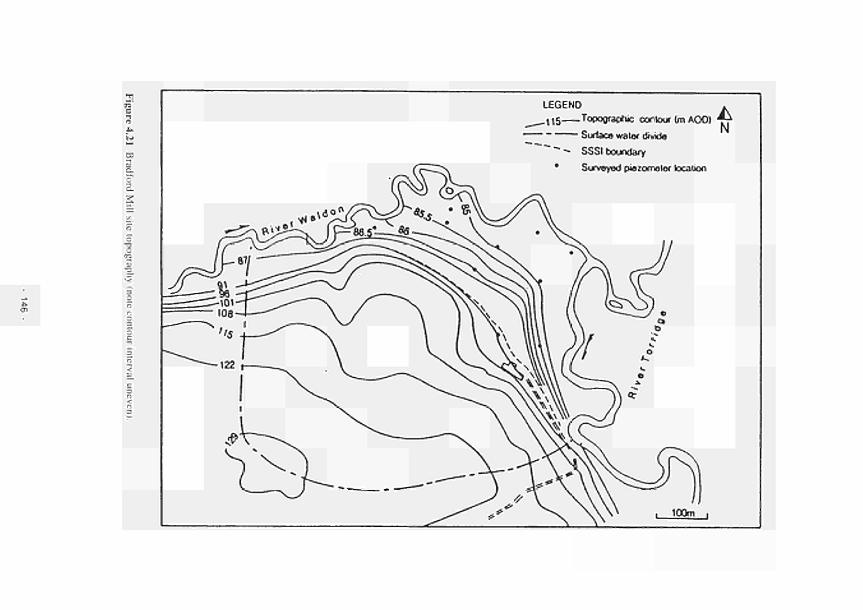
■y. Tí'
B
LEGEND .
- U 5 Topographie contour (m AOOI *γ
M
~ ~ ~*~— Surface water divide
- - - ~ SSSI boundary
* Surveyed piezometer location

1 8 0 -
170^
Γ—. LAKE ALLIER
V^^3%^.^T ^y--
180
170
WNW
—*— WATER TABLE C==í>FL0W LINES
250 m
2 0 0
190
180 ΖΛ
ESE
2 0 0
190 -180
JURASSIC CALCAREOUS
(AQUIFER)
JURASSIC SHALES
(IMPERVIOUS)
APREMONT AREA 0 250 m
Figure 4.22 General conceptual hydrological model of Apremont area.
-J— WATER TABLE
p = ! > F L 0 W LINES
DECIZE AREA
• B i STATION
Figure 4.23 General conceptual hydrological model of Decize area.
147
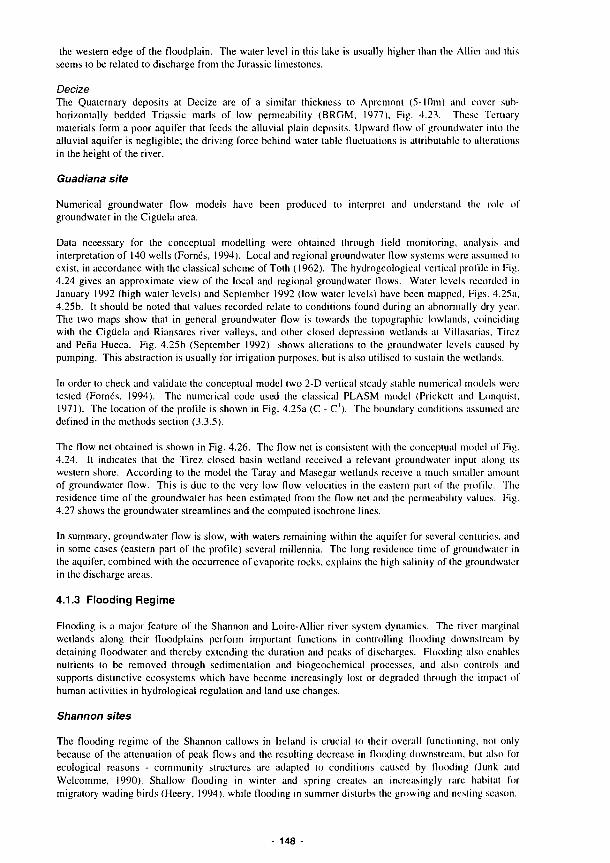
the western edge of the floodplain. The water level in this lake is usually higher than the Allier and this seems to be related to discharge from the Jurassic limestones.
Decize The Quaternary deposits at Decize are of a similar thickness to Apremont (5-l()m) and cover sub-horizontally bedded Triassic marls of low permeability (BRGM, 1977), Fig. 4.23. These Tertiary materials form a poor aquifer that feeds the alluvial plain deposits. Upward flow of groundwater into lhe alluvial aquifer is negligible; the driving force behind water table fluctuations is attributable to alterations in the height of the river.
Guadiana site
Numerical groundwater flow models have been produced to ¡ntcrprel and understand the role of groundwater in the Cigiiela area.
Data necessary for the conceptual modelling were obtained through field monitoring, analysis and interpretation of 140 wells (Fornes, 1994). Local and regional groundwater flow systems were assumed lo exist, in accordance with the classical scheme of Toth (1962). The hydrogeological vertical profile in Fig. 4.24 gives an approximate view of the local and regional groundwater flows. Water levels recorded in January 1992 (high water levels) and September 1992 (low water levels) have been mapped, Figs. 4.25a, 4.25b. It should be noted that values recorded relate to conditions found during an abnormally dry year. The two maps show that in general groundwater flow is towards the topographic lowlands, coinciding with the Cigiiela and Riansares river valleys, and other closed depression wetlands at Villasarias. Tirez and Peña Hueca. Fig. 4.25b (September 1992) shows alterations to the groundwater levels caused by pumping. This abstraction is usually for irrigation purposes, bul is also utilised to sustain the wetlands.
In order to check and validate the conceptual model two 2-D vertical steady stable numerical models were tested (Fornes, 1994). The numerical code used the classical PLASM model (Prickett and Lonquist, 1971). The location of the profile is shown in Fig. 4.25a (C - C ). The boundary conditions assumed are defined in the methods section (3.3.5).
The flow net obtained is shown in Fig. 4.26. The flow net is consistent wilh lhe conceptual model of Fig. 4.24. It indicates that the Tirez closed basin wetland received a relevant groundwater inpul along its western shore. According to the model the Taray and Masegar wetlands receive a much smaller amount of groundwater flow. This is due to the very low flow velocities in the eastern pari of the profile. The residence time of the groundwater has been estimated from the flow net and the permeability values. Fig. 4.27 shows the groundwater streamlines and the computed isochrone lines.
In summary, groundwater flow is slow, with waters remaining within the aquifer for several centuries, and in some cases (eastern part of the profile) several millennia. The long residence lime of groundwater in the aquifer, combined wilh the occurrence of evaporite rocks, explains the high salinity of the groundwater in the discharge areas.
4.1.3 Flooding Regime
Flooding is a major feature of the Shannon and Loire-Allier river system dynamics. The river marginal wetlands along their floodplains perform important functions in controlling flooding downstream by detaining floodwater and thereby extending the duration and peaks of discharges. Flooding also enables nutrients to be removed through sedimentation and biogeochemical processes, and also controls and supports distinctive ecosystems which have become increasingly lost or degraded through the impact of human activities in hydrological regulation and land use changes.
Shannon sites
The flooding regime of the Shannon callows in Ireland is crucial to their overall functioning, nol only because of the attenuation of peak flows and the resulting decrease in flooding downstream, but also for ecological reasons - community structures are adapted lo conditions caused by flooding (Junk and Welcomme, 1990). Shallow flooding in winter and spring creates an increasingly rare habitat for migratory wading birds (Heery. I994). while flooding in summer disturbs the growing and nesting season.
148
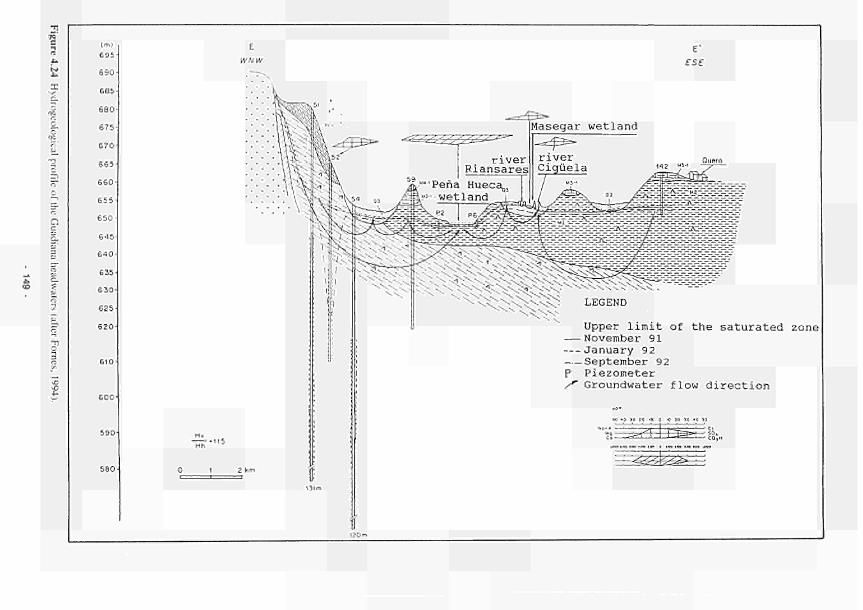
Imi
695-
690-
685·
680-
675-
670-
665-
660-
655-
650-
645-
640-
635-
630-
625·
620-
E
WNW
1 2 km
E'
ESE
Masegar wetland
Upper limit of the saturated zone — November 91
January 92 September 92
Ρ Piezometer
/-*■ Groundwater flow direction
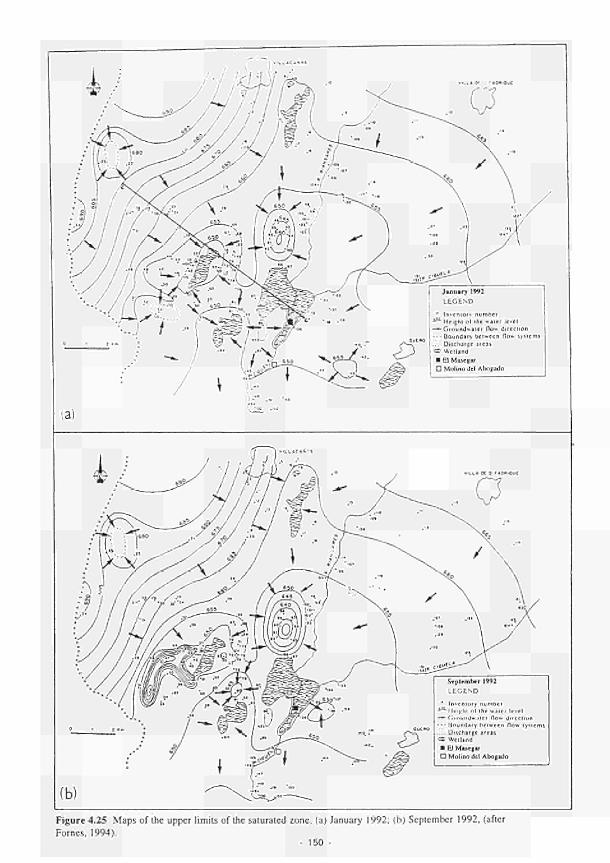
Figure 4.25 Maps of the upper limits of the saturated zone, (a) January 1992; (b) September 1992, (after Fornes, 1994).
- 150 -
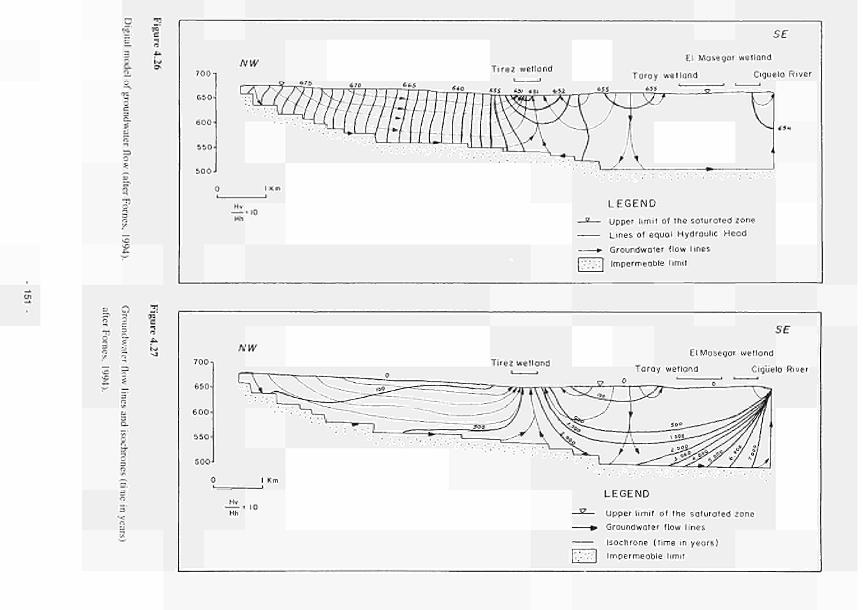
— rs
700
650·
600
550
500
NW T i r e z wetland
S f
El Mosegor wet land
Taray wet land Ciguela River
LEGEND
Upper l imi t of the saturated zone
Lines of equal Hydraulic Head
Groundwater flow lines
Impermeable l imit
[S
—. O
9
Î5
V~
y.
c i
700
650
600
550
500
Λ/ IV
Tirez wet land
SE
El Masegar wet land
Taray wetland Ciguela River
LEGEND
Upper l imit of the saturated zone
Groundwater flow lines
Isochrone ( l ime in years)
Impermeable limit
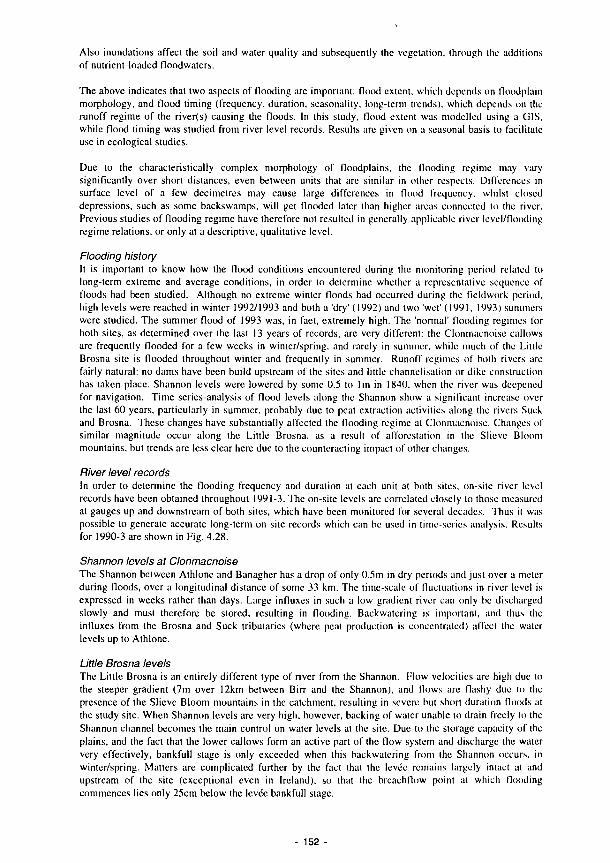
Also inundations affect the soil and water quality and subsequently the vegetation, through the additions of nutrient-loaded floodwaters.
The above indicates that two aspects of flooding are important: flood extent, which depends on floodplain morphology, and flood timing (frequency, duration, seasonality, long-term trends), which depends on the runoff regime of the river(s) causing the floods. In this study, flood extent was modelled using a GIS, while flood timing was studied from river level records. Results are given on a seasonal basis to facilitate use in ecological studies.
Due to the characteristically complex morphology of floodplains, the flooding regime may vary significantly over short distances, even between units that are similar in other respects. Differences in surface level of a few decimetres may cause large differences in flood frequency, whilst closed depressions, such as some backswamps, will get flooded later than higher areas connected to the river. Previous studies of flooding regime have therefore not resulted in generally applicable river level/flooding regime relations, or only at a descriptive, qualitative level.
Flooding history It is important to know how the flood conditions encountered during the monitoring period related to long-term extreme and average conditions, in order to determine whether a representative sequence of floods had been studied. Although no extreme winter floods had occurred during the Fieldwork period, high levels were reached in winter 1992/1993 and both a 'dry' (1992) and two 'wet' (1991, 1993) summers were studied. The summer flood of 1993 was, in fact, extremely high. The 'normal' flooding regimes for both sites, as determined over the last 13 years of records, are very different: the Clonmacnoise callows are frequently flooded for a few weeks in winter/spring, and rarely in summer, while much of the Little Brosna site is flooded throughout winter and frequently in summer. Runoff regimes of both rivers are fairly natural: no dams have been build upstream of the sites and little channelisation or dike construction has taken place. Shannon levels were lowered by some 0.5 to 1m in 1840, when the river was deepened for navigation. Time series-analysis of flood levels along the Shannon show a significant increase over the last 60 years, particularly in summer, probably due to peat extraction activities along the rivers Suck and Brosna. These changes have substantially affected the flooding regime at Clonmacnoise. Changes of similar magnitude occur along the Little Brosna, as a result of afforestation in the Slicve Bloom mountains, but trends arc less clear here due to the counteracting impact of other changes.
River level records In order to determine the flooding frequency and duration at each unit al both sites, on-site river level records have been obtained throughout 1991-3. The on-site levels arc correlated closely to those measured at gauges up and downstream of both sites, which have been monitored for several decades. Thus il was possible to generate accurate long-term on-site records which can be used in time-scries analysis. Results for 1990-3 are shown in Fig. 4.28.
Shannon levels at Clonmacnoise The Shannon between Athlone and Banaghcr has a drop of only 0.5m in dry periods and just over a meter during floods, over a longitudinal distance of some 33 km. The time-scale of fluctuations in river level is expressed in weeks rather than days. Large influxes in such a low gradient river can only be discharged slowly and must therefore be stored, resulting in flooding. Backwatcring is important, and thus the influxes from the Brosna and Suck tributaries (where peat production is concentrated) affect the water levels up to Athlone.
Little Brosna levels The Little Brosna is an entirely different type of river from the Shannon. Flow velocities arc high due to the steeper gradient (7m over 12km between Birr and the Shannon), and flows arc flashy due lo lhe presence of the Slieve Bloom mountains in the catchment, resulting in severe bul short duration floods at the study site. When Shannon levels are very high, however, backing of water unable to drain freely to the Shannon channel becomes the main control on water levels at the site. Due to the storage capacity of lhe plains, and the fact that the lower callows form an active part of the flow system and discharge the water very effectively, bankfull stage is only exceeded when this backwatcring from Ihc Shannon occurs, in winter/spring. Matters are complicated further by the fact that the levee remains largely inlacl al and upstream of the site (exceptional even in Ireland), so that the breachflow point at which flooding commences lies only 25cm below the levée bankfull stage.
152 -
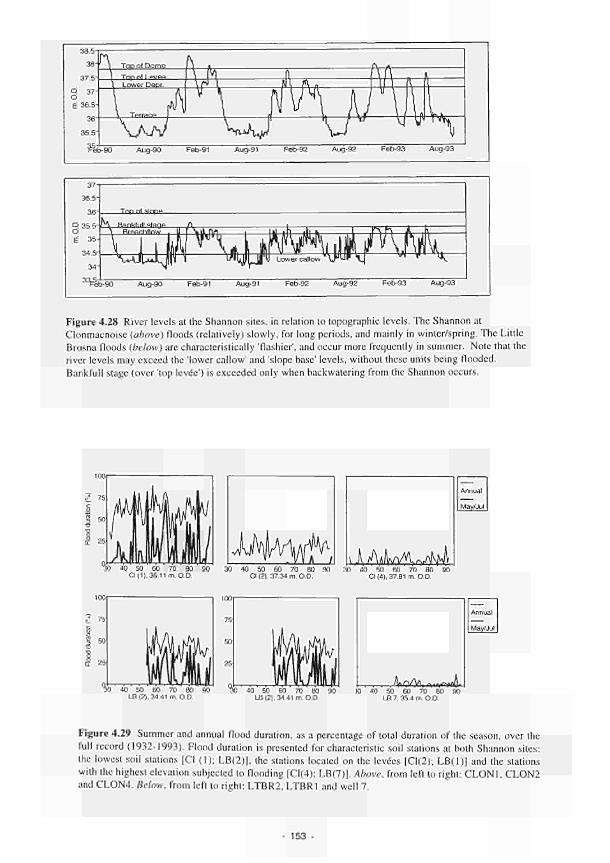
Aug-90 Aug-91 Aug-92 Aug-93
37 36.5
3^ e Aug-90 Aug-91 Aug-92 Aug-93
Figure 4.28 River levels at the Shannon sites, in relation to topographic levels. The Shannon at Clonmacnoise (above) floods (relatively) slowly, for long periods, and mainly in winter/spring. The Little Brosna floods (below) are characteristically 'flashier', and occur more frequently in summer. Note that the river levels may exceed the 'lower callow' and 'slope base' levels, without these units being flooded. Bankfull stage (over 'lop levée') is exceeded only when backwatering from the Shannon occurs.
L—L \,AMvyy\rv/4 30 40 50 60 70 80 90 30 40 50 60 70 80 90 30 40 50 60 70 80 90
CI (1). 36.11 m. O.D. CI (2), 37.34 m. O.D. CI (4). 37.81 m. O.D.
Annual
May/Jul
40 50 60 70 80 90 LB (2), 34.41 m. O.D.
, l\irW\, o.MTfA 40 50 60 70 80 90 10 40 50 60 70 80 90
LB (2), 34.41 m. O.D. LB 7. 35.4 m. O.D.
Annual
May/Jul
Figure 4.29 Summer and annual flood duration, as a percentage of total duration of the season, over the full record (1932-1993). Flood duration is presented for characteristic soil stations at both Shannon sites: the lowest soil stations [CI (1); LB(2)], the stations located on the levées [Cl(2); LB(1)] and the stations with the highest elevation subjected to flooding [Cl(4); LB(7)]. Above, from left to right: CLONI, CLON2 and CLON4. Below, from left to right: LTBR2, LTBR1 and well 7.
153 -

On-site river levels have been derived from levels upstream and in the Shannon at Meelick (close to the confluence with the Little Brosna) using different, non-linear, relations for two 'stage-ranges' i.e. with and withoul backwatcring from the Shannon.
An important factor is that, after flooding starts, the 'lower callow' and 'slope base' units, between 34.4 and 34.6m O.D., flood very rapidly and completely because they are located below the breach level. Only once bank full stage ('top levée') is exceeded will flood levels in the callows be the same as river levels.
Modelling of flooding regimes
Flood timing studies Several temporal aspects of the flooding regimes at the Shannon sites can be observed from Fig. 4.29:
• Year to year variation is large, especially for summer flooding: • Differences between units at each site are large, although units would be geomorphically characterised as 'floodplain'. • Differences between the sites are large. Little Brosna 2 (LB2) represents half the area along the Little Brosna transect, whilst over 75% of the area along the Clonmacnoise transect is situated higher, and therefore floods for shorter durations than Clonmacnoise 2 (C12). • Temporal trends in flooding regime are different for bolli sites: at Clonmacnoise a slight increase in flood duration and frequency can be observed, especially over the summer season. At Little Brosna annual flood duration decreases over time.
Unit (Stat.) Lower
depression unit
(Well 3)
'Dome' elevation
unit (St. 4)
Period Auq/Auq
32-44 80-93 90/91 91/92 92/93 32-44 80-93 90/91 91/92 92/93
Flood duration In % Ann 19.4 28.6 28.5 17.0 27.9 3-1 6.2 9.9 0
7 1
Feb/ 24.8 41.9 71.2 28.5 32 9 0.5 9.3 8.8 0
2.2
May/ 0
3.2 0
3.3 14.2
0 0 0 0 0
Aug/ :t..< 11.7
0 0 0 1 0 0 0 0
Noy/ 49.4 57.6 42.7 36.2 64.7 12.2 15.3 30.4
0 26.3
Table 4.4 Annual and seasonal flood duration for two units at Clonmacnoise, see Fig. 4.29
Building and using Digital Elevation Models An example of the results of using an interpolation routine between point and line elevation data to construct Digital Elevation Models (DEMs) with a GIS (GRASS) are shown in Fig. 4.30. The maximum vertical error is 0.05m along the transect and less than 0.1 m on the rest of the site; horizontal resolution is 5m. Determining and mapping flooding extent for a certain river level is done by creating an overlay from all cells below or at that level (Fig. 4.31 ).
Flooding regime in relation to HGMUs It has been possible to quantify patterns in flooding regime accurately, in a way that maximises lhe potential use of these hydrological data in a multidisciplinary and ecologically focused sludy. Since lhe morphology of the floodplains is largely formed by flood related processes, it is not unexpected that there is a close correlation between flooding regime, hydrogeomorphic units and soils, even though lhe flooding regime has been altered over the last decades. The units mapped as depressions wilhin the context of lhe hydrogeomorphic field mapping, and identified by micro-relief differences, correlate closely with the areas highlighted by the predictive modelling techniques, e.g. for Clonmacnoise, Fig. 2.7a and Fig. 4.31.
Loire/Allier
River levels measured on gauges upstream and downstream of the study site indicate high variability found in the Allier and the Loire. Fig. 4.32 indicates the base level above which flooding at the Apremont site takes place. During the first part of the monitoring period throughout 1991 the Allier at Le Veurdrc 18km upstream of Apremont had a low discharge but rose in summer 1992 to twice its base level. The 1993 period was almost "normal" with seasonal peaks. The river behaviour at Lc Guctin, downstream of the wetlands, showed a distinct reduction in water levels compared with Lc Veurdrc, due at least in part to the flood storage effects of the floodplain wetlands at Apremont.
154
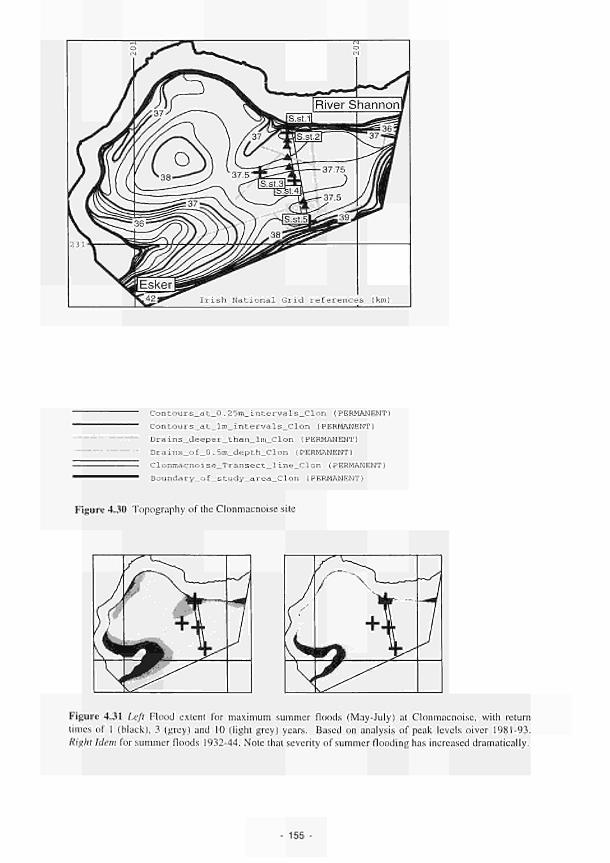
Contours_at_0.25m_intervals_Clon (PERMANENT) Contours_at_lm_intervals_Clon (PERMANENT) Drains_deeper_than_lm_Clon (PERMANENT) Drains_of_0.5m_depth_Clon (PERMANENT) Clonmacnoise_Transect_line_Clon (PERMANENT) Boundary_of_study_area_Clon (PERMANENT)
Figure 4.30 Topography of the Clonmacnoise site
Figure 4.31 Left Flood extent for maximum summer floods (May-July) at Clonmacnoise, with return times of I (black), 3 (grey) and 10 (light grey) years. Based on analysis of peak levels oiver 1981-93. Right Idem for summer floods 1932-44. Note that severity of summer flooding has increased dramatically.
155 -
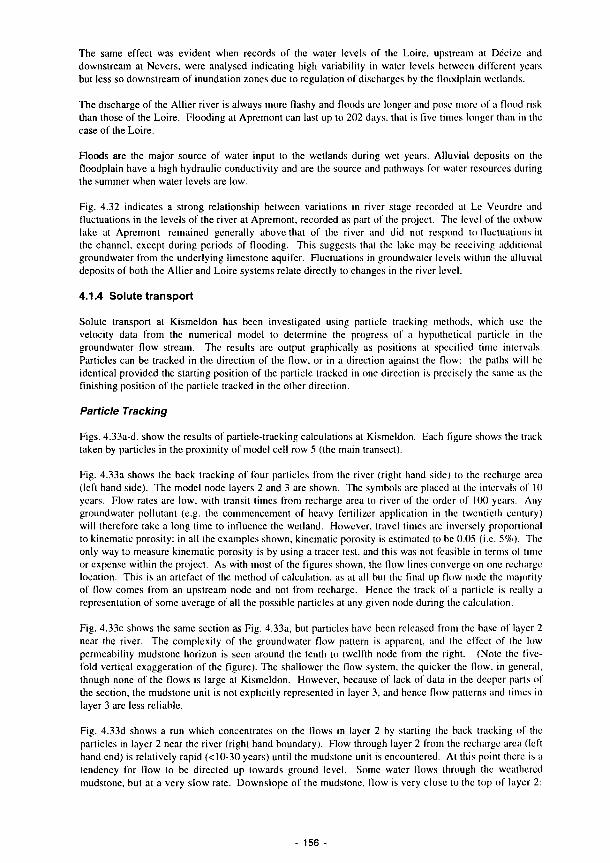
The same effect was evident when records of the water levels of the Loire, upstream at Décize and downstream at Nevers. were analysed indicating high variability in water levels between different years but less so downstream of inundation zones due to regulation of discharges by the floodplain wetlands.
The discharge of the Allier river is always more flashy and floods are longer and pose more of a flood risk lhan those of the Loire. Flooding at Apremont can last up to 202 days, that is five limes longer than in the case of the Loire.
Floods are the major source of waler input to the wetlands during wet years. Alluvial deposits on the floodplain have a high hydraulic conductivity and are the source and pathways for water resources during the summer when water levels are low.
Fig. 4.32 indicates a strong relationship between variations in river stage recorded at Le Veurdrc and fluctuations in the levels of the river at Apremont, recorded as part of the project. The level of the oxbow lake at Apremont remained generally above that of the river and did not respond to fluctuations in the channel, except during periods of flooding. This suggests that the lake may be receiving additional groundwater from the underlying limestone aquifer. Fluctuations in groundwater levels within the alluvial deposits of both the Allier and Loire systems relate directly to changes in the river level.
4.1.4 Solute transport
Solule transport at Kismeldon has been investigated using particle tracking methods, which use the velocity data from the numerical model to determine the progress of a hypothetical particle in lhe groundwater flow stream. The results arc output graphically as positions at specified time intervals. Particles can be tracked in the direction of the flow, or in a direction against the flow: the paths will be identical provided the starting position of the particle tracked in one direction is precisely the same as the finishing position of the particle tracked in the other direction.
Particle Tracking
Figs. 4.33a-d. show the results of particle-tracking calculations at Kismeldon. Each figure shows the track taken by particles in the proximity of model cell row 5 (lhe main transect).
Fig. 4.33a shows the back tracking of four particles from the river (right hand side) to the recharge area (left hand side). The model node layers 2 and 3 are shown. The symbols are placed al the intervals of IO years. Flow rates are low, with transit times from recharge area lo river of the order of 100 years. Any groundwater pollutant (e.g. the commencement of heavy fertilizer application in the twentieth century) will therefore take a long time to influence the wetland. However, travel times are inversely proportional to kinematic porosity: in all the examples shown, kinematic porosity is estimated to be 0.05 (i.e. 5%). The only way to measure kinematic porosity is by using a tracer test, and this was not feasible in terms of lime or expense within the project. As with most of the figures shown, the flow lines converge on one recharge location. This is an artefact of the method of calculation, as at all but the final up flow node the majority of flow comes from an upstream node and not from recharge. Hence the Irack of a particle is really a representation of some average of all the possible particles at any given node during the calculation.
Fig. 4.33c shows the same section as Fig. 4.33a, but particles have been released from the base of layer 2 near the river. The complexity of the groundwater flow pattern is apparent, and the effect of the low permeability mudstone horizon is seen around the tenth to twelfth node from the right. (Note lhe fivefold vertical exaggeration of the figure). The shallower the flow system, the quicker the flow, in general, though none of the flows is large at Kismeldon. However, because of lack of data in lhe deeper parts of the section, the mudstone unit is nol explicitly represented in layer 3, and hence flow patterns and limes in layer 3 are less reliable.
Fig. 4.33d shows a run which concentrates on the flows in layer 2 by starting lhe back tracking of the particles in layer 2 near the river (right hand boundary). Flow through layer 2 from the recharge area (lefl hand end) is relatively rapid (< 10-30 years) until the mudstone unit is encountered. At this poinl there is a tendency for flow to be directed up towards ground level. Some water flows through the weathered mudstone, but at a very slow rate. Downslopc of the mudstone, flow is very close to the top of layer 2:
- 156 -
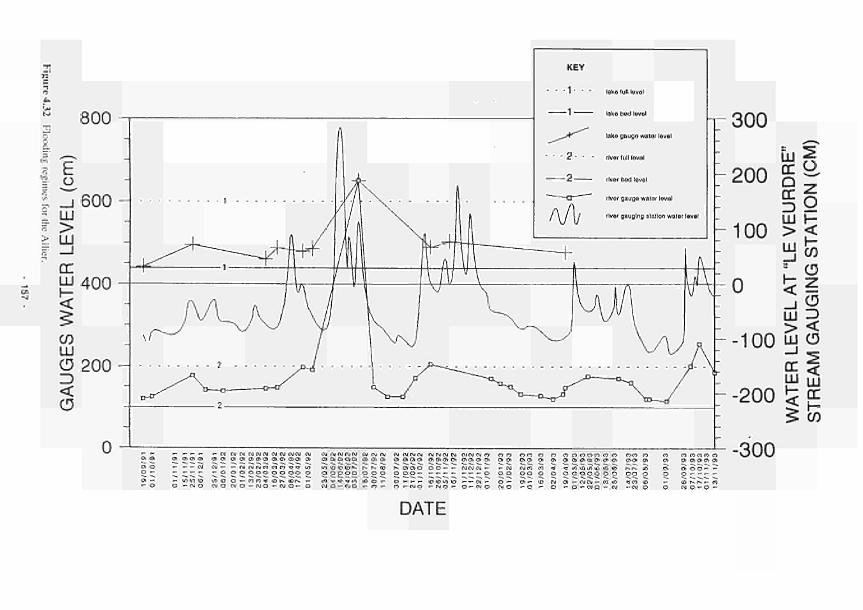
Ρ) CT Ο Γ5 O 300
DATE
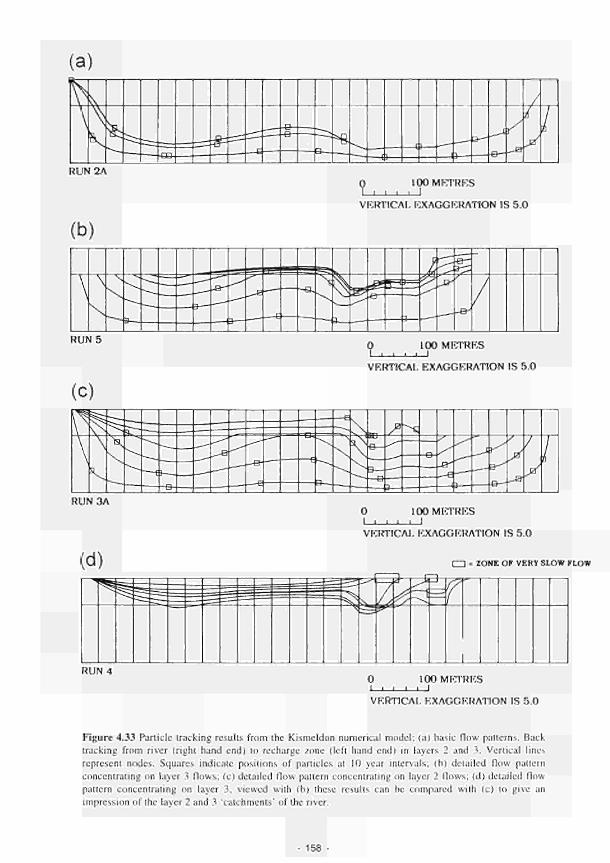
RUN2A ÏOOMRTRKS
I I ι I I
VF.RTICAI, EXAGGERATION IS 5.0
RUN 5 0 100 METRES Ι ι ι ι ι Ι VERTICAL EXAGGERATION IS 5.0
RUN3A
(d)
0 100 METRES I I I ' L _ l
VERTICAL EXAGGERATION IS 5.0
I—1 = ZONE OF VERY SLOW FLOW
RUN 4 100 METRES
ι ι I VERTICAL EXAGGERATION IS 5.0
Figure 4.33 Particle tracking results from the Kismeldon numerical model; (a) basic flow patterns. Back
tracking from river (right hand end) to recharge zone (left hand end) in layers 2 and 3. Vertical lines
represent nodes. Squares indicate positions of particles at 10 year intervals; (b) detailed flow pallern
concentrating on layer 3 flows; (c) detailed flow pattern concentrating on layer 2 flows; (d) detailed flow
pattern concentrating on layer 3. viewed wilh (b) these results can be compared wilh (c) to give an
impression of the layer 2 and 3 'catchments' of the river.
158

the "spike" near the right hand side of the plot appears to be due to the downward head gradient between layer 1 and layer 2.
Fig. 4.33b shows forward tracking of particles from the recharge area. The results are similar to those given in Fig. 4.33c, and by comparison with Fig. 4.33d give an idea of the river's layer 2 and layer 3 "catchments".
Overall the results indicate slow groundwater flow. Deepest flows are slowest in general, but around the main mudstone unit even shallow flows are slow. Residence times, assuming a porosity of 5%, are from <10 years to >100 years giving plenty of opportunity for water/rock interactions. The flow patterns are complicated by the mudstone unit: layers 2 and 3 catchments suggest most groundwater discharge to the river originates from layer 3 (although some groundwater discharges to ditches on the valley sides, and thence to the river).
4.1.5 Erosion Rates and Sedimentation Balance
Studies aimed at understanding the role of erosion and sedimentation in river marginal wetlands focused on the French and Spanish sites.
Loire /Allier sites
In general the rates of erosion and sedimentation recorded at the French site are about four times higher than those in Spain. The sedimentation rates are summarised in Table 4.5. Results indicate:
i) Sedimentation rates at Apremont were higher than Decize, relating to the greater discharge rates and peaks of the Allier in comparison to the Loire.
ii) The highest rale of sedimentation recorded was 45.1 mmyr"1 over an average of 16 recording stations on the lower floodplain adjacent to the marginal channel of the Allier, where to a fallen branch which had reduced the flow velocity of the moving water. An extremely high sample value of 83 mmyr"1 was recorded near the obstruction.
iii) Depressions in the floodplain of the Allier had a mean sedimentation rate of 15.5 mmyr , recorded rales becoming higher towards the bottom of the features.
iv) No erosion processes were recorded in depressions of the Allier floodplain. v) At Decize deposition was found to occur at every location where slope gradient decreased on
bench-like features and at the base of the major depression. Measured deposition rates were almost 25 mmyr', while erosion values of 7 mmyr"1 were recorded on the steepest slopes. There are clear relationships between landform and process. Benches are formed of depositional material which can subsequently provide a source for further erosion and redeposilion downslope.
Site Apremont
Decize
Station Abandoned channel (1) Abandoned channel (2)
Oxbow lake Riparian forest
Bottom trench
Rate (mmyr ') 13.04 7.48
26.01 45.15
4,26
Table 4.5 Sedimentation balance average rates at the French sites (calculated as an average over 1.5 years).
The processes of erosion and deposition can be summarised as follows: • Alluvial deposition is enhanced by factors such as channel margin vegetation which reduce flows and
trap sediments. • Grazing of river marginal wetland can, through poaching, expose surface soil and thereby provide a
source of erodible material. In depressions this will subsequently be rcdeposited downslope in the feature.
159

• Depressions on active floodplains can be generally considered as ephemeral features since they can be rapidly filled with sediment transported by floodwater. At Apremont, where alluvium overlies chalk and limestone, karstic dynamics may cause an increase in the depth of depressions.
• At Decize movement of materials into the depression results from soil creep by freeze-thaw processes, disturbance by burrowing and grazing animals, and slumping and microsliding of vegetated patches.
Ciguela
Measurements were taken monthly during the first year of the recording period but were subsequently reduced to quarterly because of the small variation in values. The average sedimentation rales are summarised in Table 4.6. At both the Masegar and Molino sludy sites rate of erosion were found to be almost always less than those of sedimentation. The sedimentation rates at the Masegar were generally higher than those at the Molino:
Masegar - depressions floodplains
5.4 - 7.3 mmyr 8.2- 12.6 mmyr'1
Molino depressions floodplains
5.2-9.6 mmyr' -0.1*-2.6 mmyr"1
* Erosion exceeds deposition
There have been no opportunities at either site for active alluvial processes to lake place as no overbank flooding of the Cigiiela occurred during the study period, due to artificial deepening of the channel. In addition the old floodplain is separated from lhe river channel by a man-made dyke, which follows the course of an old natural levée.
The magnitude and differences in measured rates of erosion and deposition result from a number of factors:
i) The amount of mass movement is small as the sludy area is relatively flal and experiences only low rainfall, giving little likelihood of peak discharges sufficient to produce flooding.
ii) Measured rales of mass movement were highest on the dykes which were originally constructed to divide the floodplain into fish ponds; processes of erosion predominated where the banksides were unvegetated, with footslopcs receiving maximum deposition. Heavy rainfall is the main agent of mass transport, the main effects of which are seen where human-impact has modified the configuration of the ground surface.
iii) Measured amounts of erosion and deposition also include those salts which have been drawn to the surface and deposited in evaporile crusts. These resemble depositiona! features, and can be subsequently eroded and redeposited. This process is most evident at the Molino site.
iv) Natural channels or pipes within the soil are exploited by crabs, the tunnelling activities of which enhance channels for drainage and mass transport movement.
Site El Masegar
Molino del Abogado
Statlon 1
2 Hillslope 3ottom depression 3 4
1 2 3 4
Rate (mmyr ') 12.60 8.65 5.47 8.18 7.38
2.63 9.61 -0.10 5.23
Table 4.6 years).
Sedimentation balance average rates at the Spanish sites (calculated as an average over 3
160 -
4.1.6 Sedimentation
Shannon
The most recent stage of sedimentation on the Shannon floodplain has been mainly man-induced; when the forests in the catchment were cut and the lands cultivated, erosion and runoff increased. The sediment load in streams and rivers increased, and channel shapes changed from braided to meandering. River levées were formed, consisting mainly of silly loams. The lower parts of what are now the callows were covered with silty sediments, modifying the soils and, subsequently, the vegetation.
Fig. 4.34 illustrates the relationships between silty alluvial deposits and underlying peal based on morphological features of the soil profile described from monolith samples collected at each of the monitoring stations on the Shannon and Little Brosna floodplains.
An important sediment source for the Clonmacnoise callow is probably the esker, only a few hundred metres upstream. The removal of' the thick forest which formerly covered it caused erosion, even landslides, on its over-critical slopes. The coarser fraction was deposited in the channel; the bottom of which is covered with gravel at this point. Little sedimentation occurs on the floodplains upstream of the esker. The sediment load of the Shannon is very low as it leaves Lough Ree, which acts as a sediment sink.
A more recent change in land use was probably responsible for a decrease in sedimentation. When population pressure in Ireland decreased, and agriculture was modernised, grazing areas on the steepest slopes, such as the Slieve Bloom mountains and the eskers, were partly abandoned. Vegetation cover increased and erosion sources disappeared. If sedimentation is still continuing it must be either at a very low rate or only during extreme events.
Results from investigations carried out at the study sites indicated that no sediment was deposited in most sediment traps installed near the soil stations at both sites, for two consecutive winters'. Some sedimentation may have occurred on the traps in the 'terrace' depression unit at Clonmacnoise, and the 'lower callow' depression unit at the Little Brosna site, but the amounts measured varied strongly over only a few meters, and redeposition of disturbed sediment seems likely. No evidence was found, from either the sediment record or site observations, for significant sedimentation during the February 1990 flood, which was the second highest of this century.
Further indications for a recent decrease in sedimentation rates arc found in the upper soil profiles (Fig. 4.35). The decrease in mineral content over the upper 10cm may be attributed to the higher organic matter content in the root layer (although fresh plant material was removed from the samples). The decrease in mean particle size (from 9 to 6.2pm) over that interval, however, indicates a decrease in sediment load during floods. This pattern is repeated for all the sites shown in Fig. 4.35, and is similarly reflected in bulk density values.
4.1.7 Desiccation and salinisation process
Desiccation is considered to be the progressive loss of waler from the soil thai causes originally temporary or permanently flooded areas with high water tables to become transformed into dryland areas devoid of flooding with a continually deep water table. This process can lead lo the formation of saline soils such as solonchaks. The process of salinisation refers to the increase in ionic concentration (l to IO soil to water dilution) usually of sodium, magnesium and chloride. Water moves through the soil by capillary flow and is also evaporated from the surface. Salinisation processes within the study area may not necessarily involve an increase in the total amount of salts, but rather the ionic concentration increases due to the low availability of water. The climatic (low rainfall, high evaporation) and hydrogeological (evaporite deposits and slow transmissivity) conditions combine to lead the process of desiccation inevitably into that of salinisation.
Since completing the sedimentation studies for Phase I. local witnesses have reported that up to 1cm of silt had been deposited at Bullock Island close to lhe Clonmacnoise sile during early spring 1994. These reports have not been substantiated by empirical studies. The extent, depth and residence time of the deposited sediments are unknown, but will be investigated under Phase II.
161 -
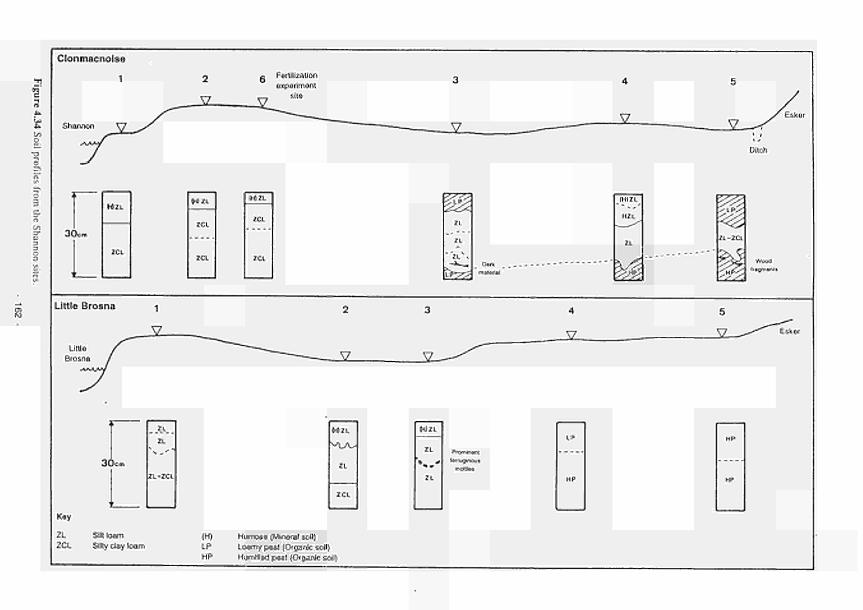
Clonmacnoise
Shannon
30c-
MZL
Little Brosna
30
Key
ZL. ZCL
Fertilization
»II ZL
ZCL
zct
IHIZL
ZCL
ZCL
Utile f Brosna /
1
_2_
Sill loam Silty clay loam
(H) Humosa (Mineral soil) LP Loamy peal (Organic soil) HP Humified peat (Organic soil)
5L
S2£
ì*ZZ Dark
malerlil
M Z L
ZL
ZCL
M Z L
ZL
ZL
Prominent lefruginoul
mollies
_ IHIZL
HZL
4
_S7_
V . Esker
Dilch
i - L P /
Wood Ifagrnentl
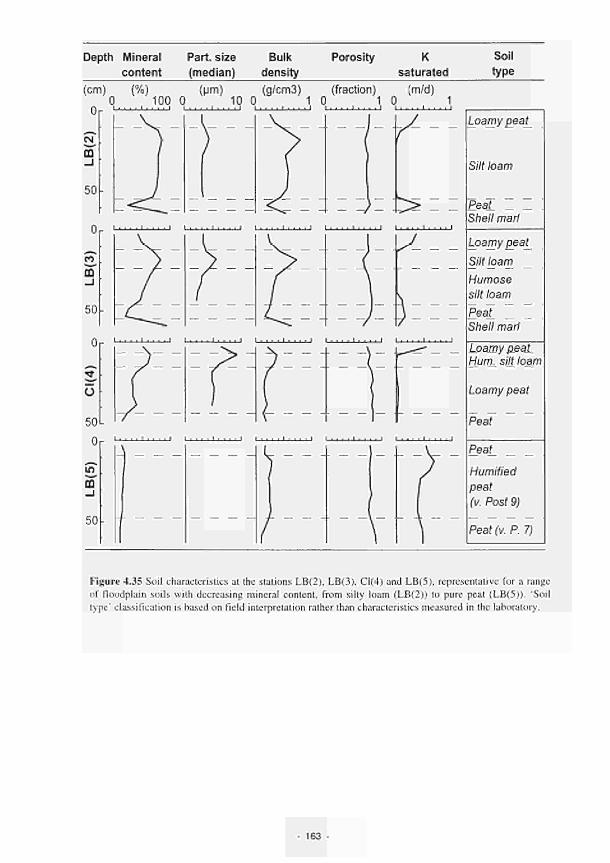
Depth Mineral Part, size Bulk Porosity K Soil content (median) density saturated type
(cm) (%) (μιτι) (g/cm3) (fraction) (m/d) Ό v ΊΟΟ 0 ' 10 0 va Ί ov Ί 0 1
Q I I
50
ro ω _1
50
2, ϋ 50
?=ts Ι ι . ι . I Ι , . , , I Ι Ι ι ι ι ι Ι ι
' ■ ■ . ■ ' ■ ■ ■ ■ ι ι ■ - ■ ■ ' ■ ■ ■ ■ ' ι . . . , ι ι . . . . ι . . . . ι
*1 m _l ' 50- r
Ι ι ι ι ι Ι ι . ι . I ι ι . . . . ι ι . . . . ι
1
Loamy peat^
Silt loam
Peat _ Shell marl
Loamy peat_
Silt bam
Humóse
silt loam
Peat_ _ _
Shell marl
Loamy g_eat_ Hum. silt loam
Loamy peat
Peat
Peat
Humified
peat
(v. Post 9)
Peat (v. P. 7)
Figure 4.35 Soil characteristics at the stations LB(2), LB(3), Cl(4) and LB(5), representative for a range
of floodplain soils with decreasing mineral content, from silty loam (LB(2)) to pure peat (LB(5)). 'Soil
type' classification is based on field interpretation rather than characteristics measured in the laboratory.
163 -

Water availability at the study sites during the 1991-1992 hydrological year was high due to water transfer from the River Tagus to the River Ciguela, and also due to the presence of surface water in the lagoon of El Masegar. Piezometric levels ranged from -25 to +50 cm in El Masegar, with the central lagoon being flooded for eight months until it was deliberately drained in the summer. Piezometric levels reached a maximum of only -199 to -150cm at Molino del Abogado. Water table levels showed a difference of 120 - 150cm between the two study locations during the spring ofthat year.
The highest piezometric readings at El Masegar for the 1992-1993 hydrological year varied between -50 and -200 cm, reflecting the absence of flooding and surface transfer from the River Tagus. This decrease in water level depth of over lm from the previous year was not correspondingly observed at Molino del Abogado, where a maximum lowering of the water table of only 25 to 30cm was observed. No spring variation in water table depth was observed in the HGMUs ncarcsl the river at Molino del Abogado, though in the equivalent HGMUs at El Masegar the water level decreased by 175 cm. The major ion concentrations have been measured for different seasons at all of the sites (Fig. 4.36 - 4.43). The dominant anion is sulphate, and the dominant cation is calcium, with seasonal occurrences of magnesium and sodium.
From the plots of major ion concentrations over time a number of salient results are highlighted:
1 Changes in the concentration of calcium, sulphate and bicarbonate occur simultaneously, and by lhe same magnitude, at all the study sites.
2 Calcium concentrations are slightly higher in El Masegar due to the influence of calcium sulphate-rich water at MASE3 and MASE4.
3 Bicarbonate concentrations are at a maximum during the dry season (approximately 18 meq/l), especially at MASE4, due to higher bicarbonate input from groundwater and a higher soil capacity to retain it.
4 Magnesium, sodium and chloride concentrations are mostly higher at Molino del Abogado, with the exception of relatively high concentrations found in MASE1.
5 MASE1 is the only site presently undergoing a clear process of salinisation.
6 Nitrate (0-0.7 meq/1) and potassium (0.2-1.75 meq/I) concentrations are very low for all the study sites.
7 The study sites at Molino del Abogado are more saline than at El Masegar.
8 The relative positions of the stations on a general gradient of salinisation arc the same at both of the sites. Depressions and old channels of the Cigiicla river have similar values and arc characterised by having the lowest chloride, sodium and magnesium concentrations. However, towards the end of the study period the two channel depressions (MASE4, MOLI4) exhibited increased levels of concentration of the same ions.
9 Previous, now inactive, floodplain sites are the most saline environments.
Comparing changes in major ion concentrations during the study period, strong differences are observable between the two hydrological years. Sulphate, bicarbonate and calcium concentration levels all increased rapidly from January 1993, but began to subside by laic summer 1993, especially al MASE4, MOLI I and MOLI3. Over the same late period of the study sulphate concentrations increased slightly more erratically at the Molino del Abogado. With respect to chloride, magnesium and sodium concentrations, no major changes were observed in relation to the drier hydrological year of 1992-93, although seasonal summer increases and winter decreases were observed. The only exception to this was the former floodplain at MASE I which again registered anomalous results with ionic concentrations continuously increasing from summer 1992 to the end of the 1993 summer. A similar, though not as pronounced, paltcrn is observed ai lhe other former floodplain site at MASE2 in the magnesium concentrations.
164
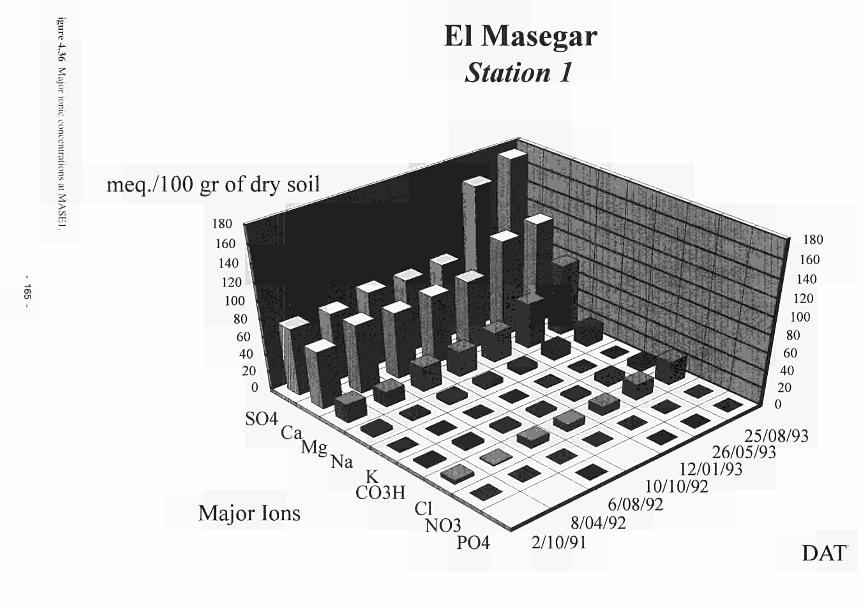
f El Masegar
Station 1
> ■J-. -
meq./100 gr of dry soil
Κ C03H
Major Ions Cl N03
P04
25/08/93 26/05/93
12/01/93 10/10/92
6/08/92 8/04/92
2/10/91 DAT

î El Masegar
Station 2
meq/100 gr of dry soil
>
Major Ions P04
25/08/93 26/05/93
12/01/93 10/10/92
6/08/92 2/10/91 Dates
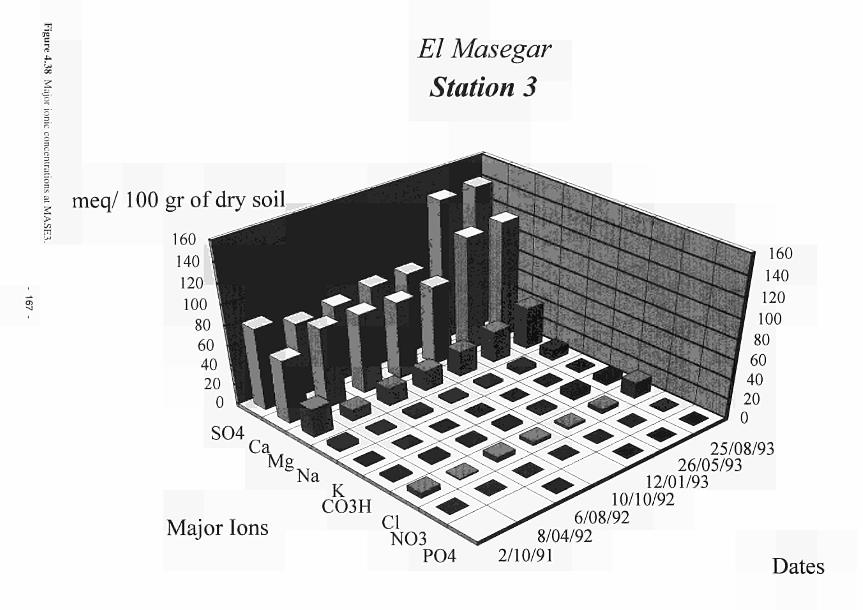
El Masegar Station 3
meq/ 100 gr of dry soil > —
K C03H
Major Ions Cl N03
P04
25/08/93 26/05/93
12/01/93 10/10/92
6/08/92 8/04/92
2/10/91 Dates

-f u 'M
2
El Masegar Station 4
meq/ 100 gr of dry soil
> v¡
K C03H
Major Ions Cl N03
P04
25/08/93 26/05/93
12/01/93 10/10/92
6/08/92 2/10/91 Dates
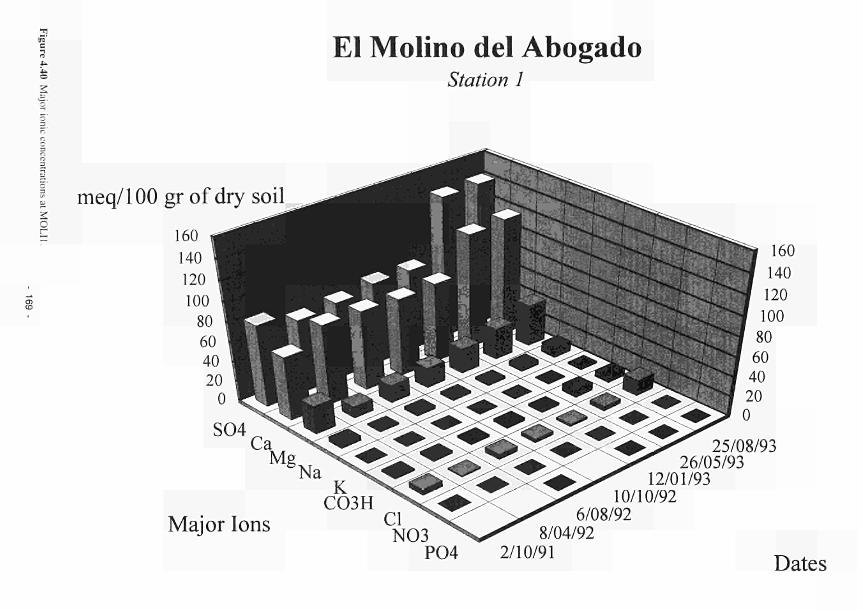
î 4
c'
El Molino del Abogado Station 1
ζ
meq/100 gr of dry soil
Κ C03H
Major Ions Cl N03
P04
25/08/93 26/05/93
12/01/93 10/10/92
6/08/92 8/04/92
2/10/91 Dates
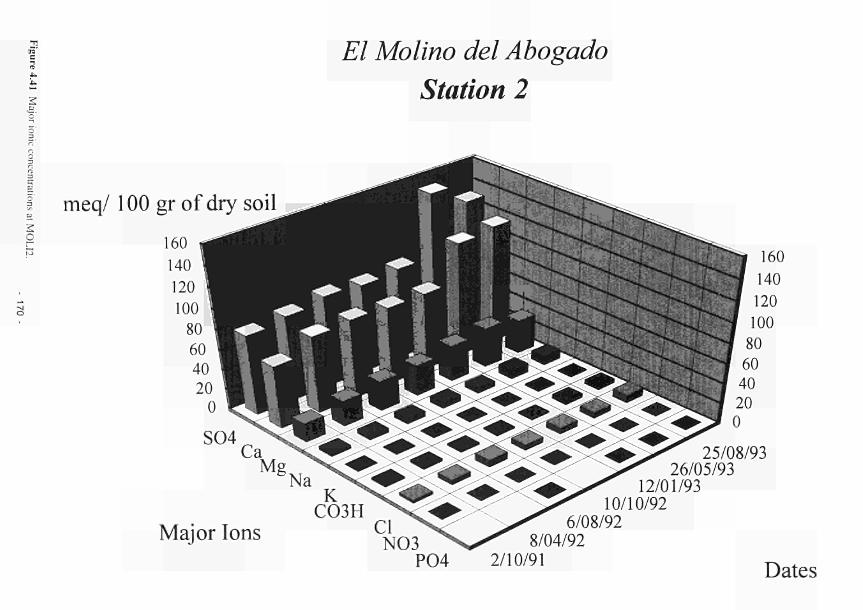
f 3 4 -
i-
El Molino del Abogado Station 2
meq/ 100 gr of dry soil c
κ C03H
Major Ions CI N03
P04
25/08/93 26/05/93
12/01/93 10/10/92
6/08/92 8/04/92
2/10/91 Dates
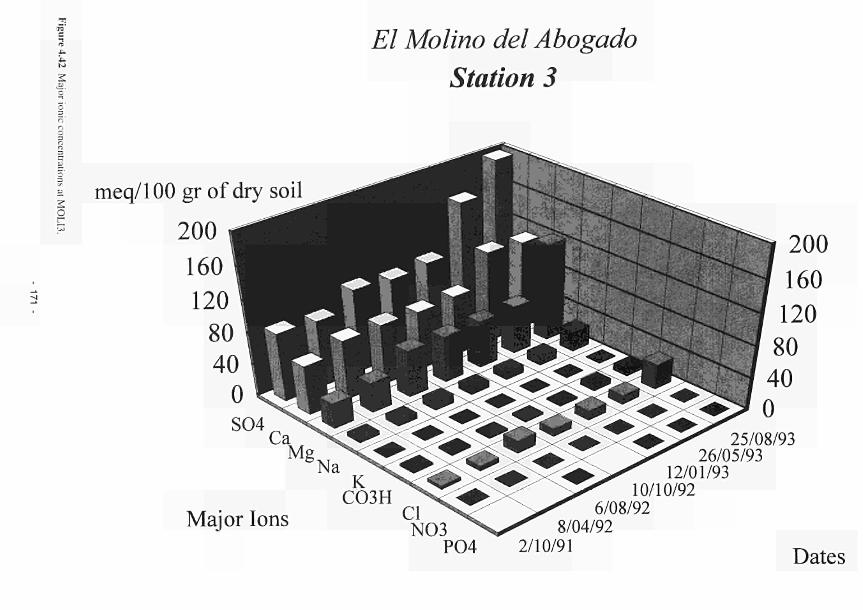
■n
1' -! 4 -
4 -
£7 Molino del Abogado
Station 3
c -
meq/100 gr of dry soil
200 200
K C03H
Major Ions Cl N03
P04
25/08/93 26/05/93
12/01/93 10/10/92
6/08/92 8/04/92
2/10/91 Dates
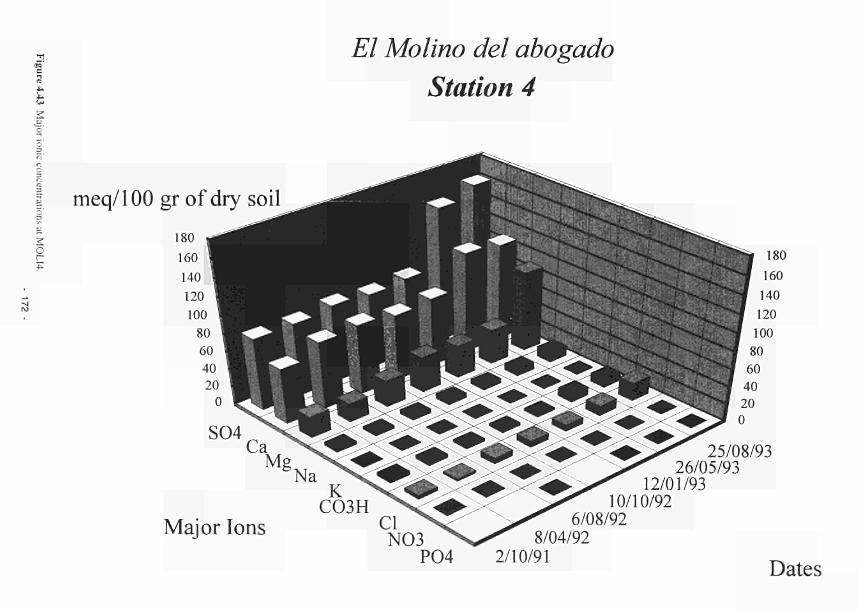
f 3 4 . 4-
El Molino del abogado Station 4
meq/lOO gr of dry soil
-c
K C03E
Major lons Cl N03
P04
25/08/93 26/05/93
12/01/93 10/10/92
6/08/92 8/04/92
2/10/91 Dates

Masegar, Station 4
Ca vs Redox at 5 cm
120-
110-
of
dry
soil)
o
I
σ> 9
° -
meq/1
00
CO
O I
ra O
7 0 -
6 0 -
■
I
\ ■
■ Ca
1 1
■ \ ■ \ ■
1 1 '
\ B
1 ' 1
50 100 150 200 250
Redox at 5cm (mV)
14
1 2 -
S io
S 8
cr Φ
I co O O
6 -
4 -
2 -
Masegar, Station 4
C03H vs Redox at 5 cm
- Γ -
50
C03H
Linear fit
100 150
Redox 5cm (mV)
200 —ι 250

Soil redox potentials are lower in the Molino del Abogado sites, which have been subjected to greater
impacts, than at El Masegar commonly ranging from 0 - 200 mV throughout the sludy period. The lower
redox potentials correlate to the lowering of the water table over the same period of impact. Al tirsi sight this
appears to be an anomalous result. However in semi-arid areas the upward movement of groundwater by
capillarity under high termpratures and évapotranspiration rates results in the precipitation of salts throughout
the soil profile and at the soil surface. This produces an infilling of pores, a compaction of lhe soil and a
resultant increase in soil anaerobic conditions, lhe reverse of what might be expected normally in none-saline
environments.
At El Masegar the water table is occasionally closer to the soil surface, which can resull in the maintenance of
open soil pores by the carbonate water which leaches the salts contained in the soil profile, inducing aeration
and oxidation. When the water table falls salts may again be precipitated, sealing the voids and producing a
decrease in the redox potential at the soil surface and down through the profile (Sanz Donaire and Sanchez
Perez de Evora, 1993). The high negative correlation between · redox potential and calcium and
bicarbonate ions also shows their sealing capacity and subsequent production of anaerobic conditions. This
is shown in an example from MASE4, Fig. 4.44.
4.2 Characterisation of biogeochemical processes
Biogeochemical processes may enable wetlands to maintain and improve the quality of water before or, in
the case of flooding, after reaching the river channel through lhe removal or retention of nutrients. In
certain situations conditions in RMWs are sufficiently wet to enable peat to accumulate, thereby storing
carbon and supporting specialised habitats and species. Studies have aimed to quantify relationships
between N & Ρ dynamics (cycling in vegetation and soils), carbon cycling and environmental parameters
such as hydrological regime and temperature to enable improved predictions to be made in lhe weiland
functional assessment procedures.
4.2.1 Soil water quality
Data are presented showing lhe nitrate (NOi-N) and ammonium (NHj-N) contents of the samples, laken
from piezometer water and interstitial water through the use of suction cups. Only the data from the
Shannon (Figs. 4.45-4.48) and Torridge (Figs. 4.49-4.51) sites are illustrated.
In general terms, the NOrN and NHj-N concentration in the waters are low, mostly below 2ppm.
Ammonium contents are, in the main, higher than NO rN, which is not unexpected, as in a mainly reduced
environment nitrification is hindered.
Clonmacnoise
Limited interstitial water data are available for Clonmacnoise, due to site inaccessibility through flooding,
or clogging of the sample cups with silt. The available data show inorganic Ν concentrations not
exceeding 2ppm, with NOrN levels being mostly < 0. lppm.
Piezometer samples show very low inorganic Ν levels, wilh only one station and one sampling occasion
exceeding 2ppm (CLON3, November I991).
Little Brosna
Concentrations of Ν are very low, with only one site, LTBR5 showing NH4-N levels greater than l.5ppm
at any time. The piezometric water samples differ somewhat; concentrations of inorganic Ν are generally
low, but high NOrN readings are seen at stations 1, 4 & 5 during November 1991, with station l having a
concentration of I I6.56ppm. This is an isolated occurrence and is not easily explained by a flush of
mineralisation, improbable during the winter months, or flooding, as LTBRI is infrequently inundated. Il
is possibly due to pollution from an external source.
Kismeldon
Inorganic Ν contents in the interstitial water samples do not exceed l.2ppm at any point. The NH.rN
concentrations are almost exclusively higher than the NOrN, and are greatest in spring/summer, when
partial mineralisation (ammonification) may occur. The exception to this is at KISMI. where NO(-N
concentrations are slightly higher than NH4-N throughout. This is a result of' the comparatively aerobic
- 174 -

I l l ï i o i » · ) Cbrwrau i
-n O
n H rs
ñ'
fi r.
Ζ o
. r
. r
> * s¿:
1 "
r
. r
.1 ¿J. ' ! i l ' *J**'i, .L ' ^ i»1 :.
1 ' .S.d.« l>
l^wu.Î1ΤΓππ
I .· ζ » o · o «»
s ft Q '! C . ι Ζ!
3 .i ta 4 ·' I M I
a
K l i d t t i a l i .KHI*)
P20 = 20cm piezometer
P40 = 40cm piezometer
P80 = 80cm piezometer
l"
**z¿r* • f y
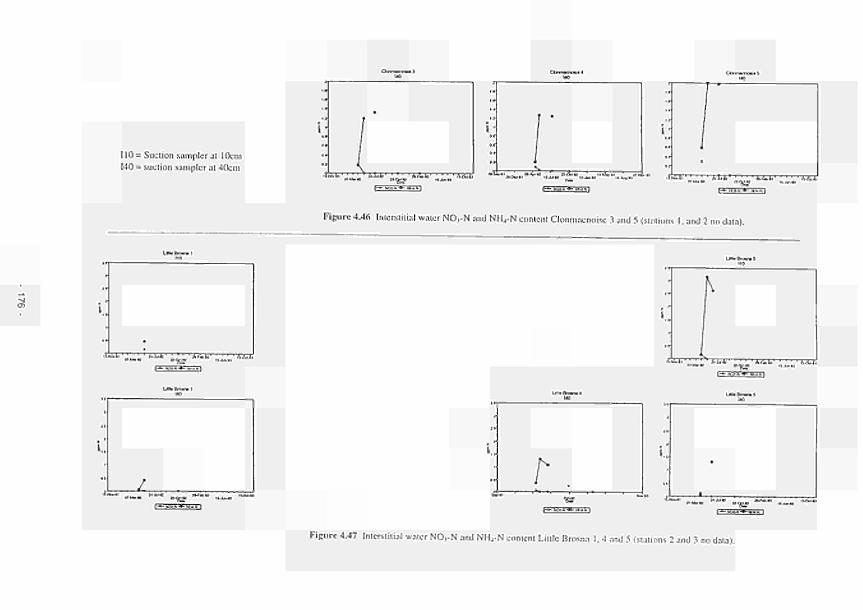
DrnrvKiioa· 3
110 = Suction sampler al 10cm 140 = suction sampler at 40cm
Figure 4.46 Interstitial waler NO,-N and NHj-N eonlcnl Clonmacnoise 3 and 5 (stations I, and 2 no dala).
Figure 4.47 Interstitial waler NO.,-N and NR,-N eonlcnl Little Brosna 1,4 and 5 (stations 2 and 3 no dala).

ι::
•.itti ,! ' " i ',. ' . i : , 'J ' ' ' ' ' i '
I—imh^HOTI ESSSSES
., V
·::
,rtr, I * ku).*M.. »I
¡::
.tli.V.^w. / . ¿ t A.Uk' " B f
l ~ Un,, ■■).,.M
O
ζ
E^açHçg]
JbJ rssgJEBgg ι I J M 1,^1. H t, I ■"sr
|Jk»l i <Ι~1ιΤ
,ttor
i ;
*"Bf τίτ .rtiT-* .«'
J,AÍ';4¿
,J·''·*
1·' ■U .»«.'¡¡Γ AJIÍÍI Xftn?
"■KT E E E E S 5 5 ]
s::
È* ^'•ωΙ . I ¡U. ' ' ; J 1^ '^Í ' ; ■ ■ ' A i t '
κ»»* ni·»'
T i t
N.B. Larger scale for Little Brosna 1, P20.
P20 = 20cm piezometer
P40 = 40cm piczoniclcr
P80 = 80cm piczoniclcr
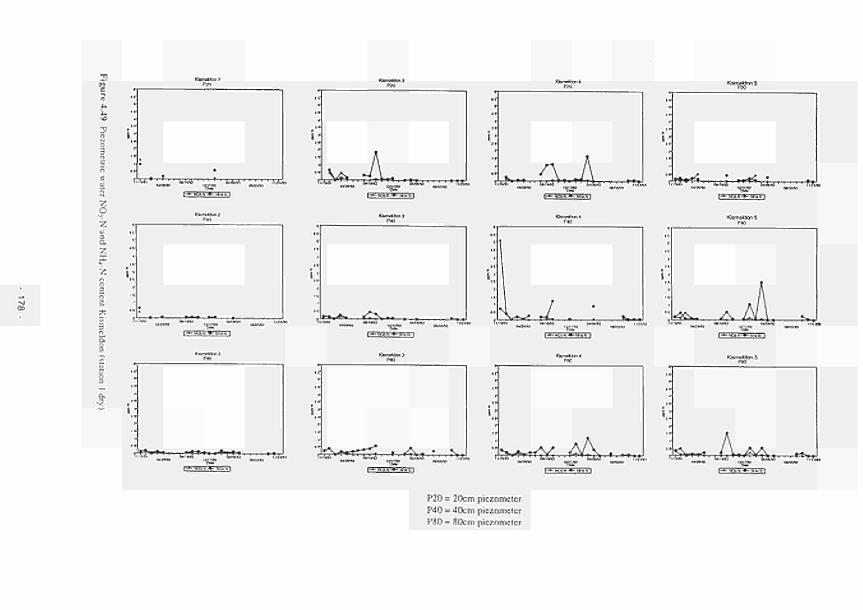
ζ
o
ζ
I
~™" "as' |u ..„■,» ί ί..-ι
3^> ΤΙΛ7
Ρ20 = 20cm piezometer P40 = 40cm piezometer P80 = 80cm piezometer
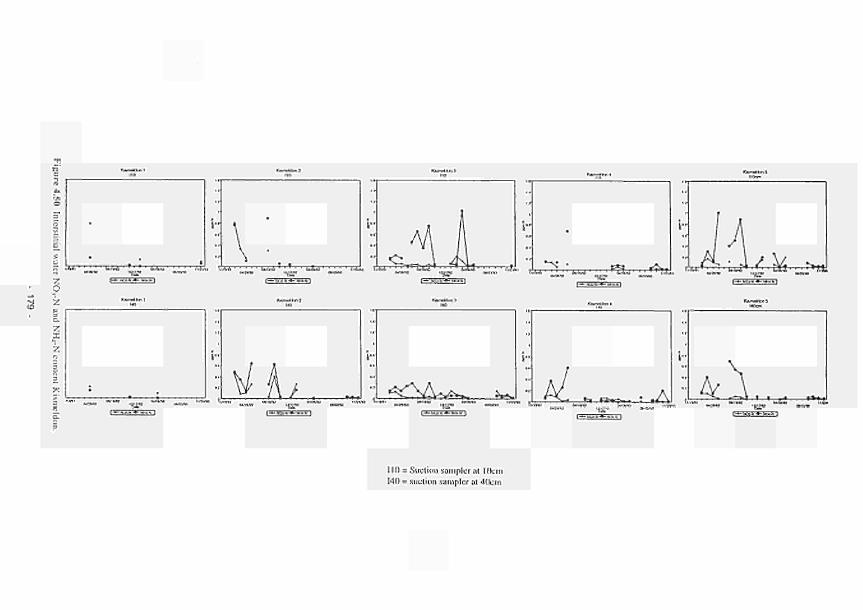
,, • r
ï"
ι Χ
ω, ' ' ■
* rtr* ι h t- 4
•
1 bM ■ ■ ■ ' HÌLl ' A*
EBSEBEB
110 = Suction sampler al I Oem
140 = suction sampler al 40cm
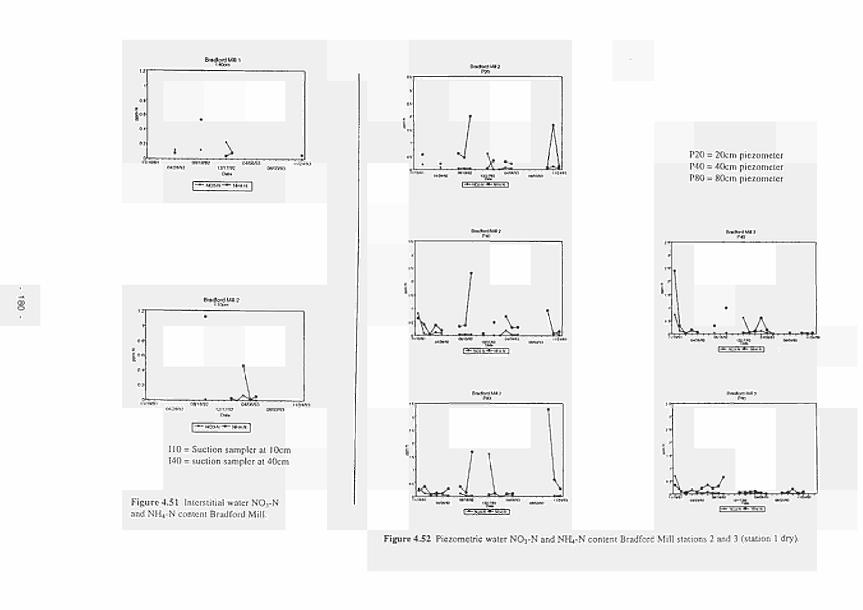
-*- iñü — MUN |
110 = Suction sampler al I Oem 140 = suclion sampler at 40cm
Figure 4.51 Interstitial water NOj-N and NHj-N content Bradford Mill.
P20 = 20cm piezometer P40 = 40cm piezometer P80 = 80cm piczomclcr
ί~*»>.*-α~Ηΐ
Figure 4.52 Piezometric water N03-N and NH4-N content Bradford Mill stations 2 and 3 (station 1 dry).
status of this site, allowing complete mineralisation to nitrate to take place (i.e. ammonification and nitrification), rather than ammonification alone.
The piezometric water samples also show very low N contents, although they are slightly higher than the interstitial waters. Spring/summer NH4-N levels occasionally reach l-3ppm, but are mainly below 0.5ppm. November 1991 recorded an NO3-N level of 5.06ppm in the 40cm piezometer at KISM4, which may represent an inflow from sources upslope of the station.
Bradford Mill Little data is available for interstitial water at Bradford Mill. The interstitial water data presented shows very low N levels, entirely below 1.2ppm. Levels of NO3-N are very low, remaining below 0.1 ppm at all times, whilst the NH4-N levels are higher throughout, particularly in the warmer months, when ammonification is more likely to occur.
Piezometric water samples contained levels of inorganic N of less than 3.5ppm. Again, NH4-N levels are highest, with NOrN concentrations being mostly much below 0.5ppm. This site shows elevated NH4-N during summer months, but also during some winter sampling dates. This is likely to be a last flush of partly mineralised N, but levels are still relatively low. The piezometers at station 1 did not contain sufficient water for analysis on any sampling date.
4.2.2 Denitrification
Results from routine denitrification assays at the Torridge, Loire and Shannon field sites are presented here, together with more detailed discussion from further experimental work at the Torridge sites addressing the N-sink function and the processes involved. It has been assumed that denitrification is favoured by soil environments that are predominantly anaerobic and contain an adequate store of carbon for respiration. Results are presented from field stations and experimental work carried out in the period from March 1993, or October 1992 for the Loire sites, until February 1994. Denitrification was assayed using the acetylene inhibition method (3.4.2).
Torridge sites
The results from the instrumented stations (Fig.4.53) show a variation in denitrification at Kismeldon of between 1.89 (July 1993, KISM5) and 67.28 mgN/nr/d"1 (February 1994, KISM1), and at Bradford Mill of between 3.44 (October 1993, BRADI) and 57.67 mgN/nr/d"1 (February 1994, BRAD3). This equates to a range between 0.019 and 0.67kgN/ha/d"' for the two sites and compares with rates found under optimal denitrification conditions in fertilised agricultural soils (Colbourn & Harper 1987, Ryden, 1983). These rates occur despite consistently low soil nitrate concentrations, typically around 0.25ppm, and low concentrations of nitrate in interstitial and piezometric water samples. Temporal and spatial patterns of denitrification arc discernible in some cases, but often rates between sites of differing characteristics arc similar and show no consistent variation. This creates difficulties in assessing the functioning of the wetlands in terms of nitrate removal.
It has been found that the surface water system at Kismeldon provides the only significant nitrogen inputs to either wetland. A study was carried out at Kismeldon from 28.11.92 - 4.12.92 (Baker, 1994) to examine the role that the ditch system and flush zones were playing in the nutrienl dynamics of the site. Fig. 4.54 shows the location of the ditch system at Kismeldon and the presence of 5 weirs used for ditch water sampling. Two flush zones thought to be important in nitrate removal are also shown. Data arc presented of nitrate content in surface waters at each of the weirs and denitrification rates in the two flush zones.
Fig. 4.55 shows clearly that nitrate concentration decreased downslope during the study period. Concentrations were highest at Wl, up to 4.52 ppm. At W2 concentrations decreased appreciably when compared to Wl but appeared relatively high when compared to lhe 3 weirs discharging into the ox-bow lake. The concentrations at these weirs ranged from zero to 0.24 ppm over the study period, with the highest values delected at W3 and lowest at W5. This reduction in concentration can be attributed to plant uptake, dilution or denitrification (or a combination of one or more of these processes). Plant uptake is unlikely to be significant at this time of year. Therefore reduction of concentration through
181

KjsmeWonS DerKtrfcabon. mr/ t r rC«
BrarJord Mill 1 DentrfcoCiori, πφ4/πι2ίό
I Mill 3 wç/H/m
Í:
Figure 4.53 Denitrification rates at the Torridge sites.
182 -
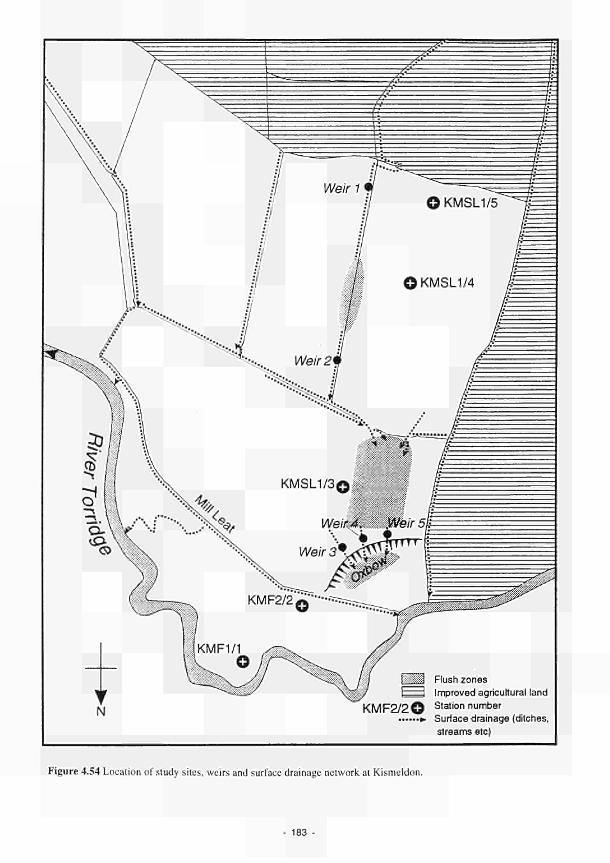
Figure 4.54 Location of study sites, weirs and surface drainage network at Kismeldon.
183 -
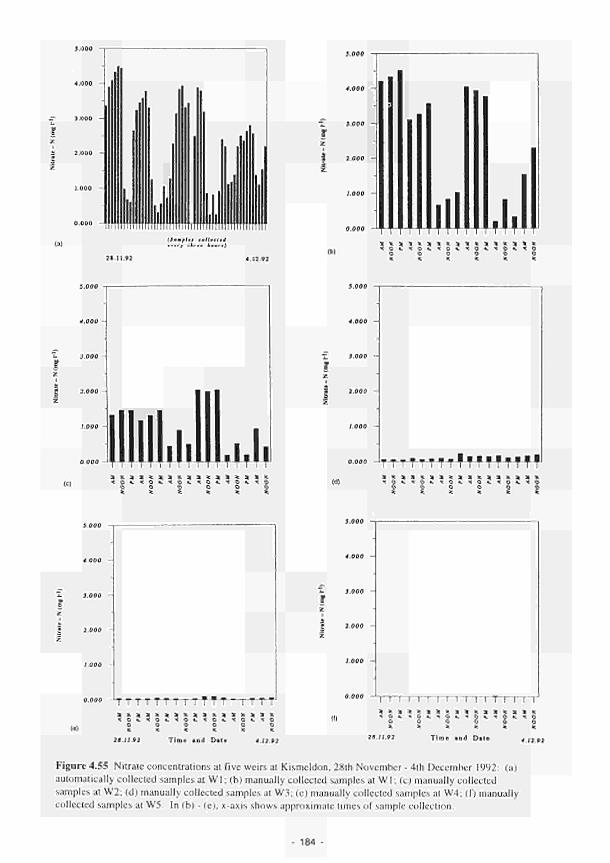
4i (ai
» ι * » * » » * » . . » . * . » . * * * * « .
'τ τ τ Τ τ Τ Τ τ ffîffTTff r O «. -ΐ o Χ o *. ^ o *. o ·. * o (d)
i . ? 1
fl Y
4.000
3.000
2.000
1.000
0.000
~
-
ι ι ι ι ι ι ι ι ι ι ι ι τ I I I I :» ». s * * » * » . » * » . » » » . s » >. » » - » » > . s » » . » » » . s » ». » : » ».
* 0 « . « C O » . T O τ o ». ^ o ^ O a . x O f t . r O ■ < G . . r O « . : 0
Time and Date Time nid Dele
Figure 4.55 Nitrate concentrations at five weirs at Kismeldon, 28th November 4th December 1992: (a)
automatically collected samples at Wl; (b) manually collected samples at Wl; (c) manually collected
samples at W2; (d) manually collected samples at W3; (c) manually collected samples at W4; (f) manually
collected samples at W5. In (b) (e), xaxis shows approximate times of sample collection.
184
denitrification by the soil bacteria and dilution of the load by surface waters of lower N concentration stored at the surface are more likely.
The relative importance of these processes has been investigated through the calculation of a simple "black-box" nitrogen budget from the overland flow ditch system, delineated as a small catchment within a sub-catchment of the Torridge. Nitrate load in at Wl minus nitrate load out at W3, W4 and W5 has been calculated to give a net estimate of the nitrate unaccounted for in the surface flows of' the system over the week of invesligation. The nilrate-N unaccounted for between Wl and the ox-bow lake is between 4.614 and 5.258 kg N over the week of the study. This equates to between 85 and 97 percent of the nitrate load entering the system. The overland flow system through which the surface waters flow (ditches and 'flush zones') has been estimated to occupy less than 10 percent of the'catchment'. If the unaccounted nitrate is explained entirely by denitrification then the estimated rate would be between 78.84 and 87.05 mg N m~2 d"' for the duration of the sludy. However field measurements of both potential and actual denitrification rates could account for only approximately one third of the nitrate removed. Of the remainder it is possible that nitrate has been stored in the surface waters and then removed gradually by denitrification. During the period of study described here the exceptionally wet conditions resulted in a significant increase in the amount of water stored. The mixing of runoff with standing surface water would effectively detain the movement of nitrate bearing waters downslope and also dilute the load effectively limiting the rate of denitrification by reducing the concentration gradient between the water column and soil. Supply of nitrate to the soil would then be reduced causing slower rates of denitrification such as those found during the study period.
Loire and Shannon sites
Denitrification rates in the Loire and Shannon sites are considerably lower than those in the Torridge (Table 4.7). It is possible that these results are a true reflection of the nitrate-reduction potential of the sites, as the stations on the Loire/AIlier are very low in carbon, whilst the Shannon stations arc generally very wet and, being mainly peat soils, have comparatively lower rate of mineralisation (CLON 16.2, LTBR 3.8, APRE 38.0, DECZ 27.5 approximate mean N-mineralisation rates mgN/m7day across the sites). However, the calculated rates of denitrification in the Loire and Shannon sites appear to be anomalously low, particularly given the warm temperatures and higher summer soil nitrate levels, typically 2-2.5ppm, found in the Loire and the high pH and high EOC status of the Shannon soils. This may be a result of the problems associated with remote analysis of the gas samples, as delays prior to analysis, due to transportation from the field sites to the institutional base and the analytical laboratory, allow considerable time for warming of the vials, increasing the gas pressure and enhancing the potential for leakage. A test will be carried out during the Phase II work programme to establish whether delays in analysis result in losses of NiO from the vials.
Rates in the Loire are somewhat erratic and do not always reflect the expected patterns. For example, the December 1993 rales at Apremont 3 and 4 and Decize 2 are considerably higher than those recorded in October 1992 and May 1993. The rates for December 1993 are generally a little higher than other winter rates, when may be due to an unusually high external input of nitrate or it may reflect a shorter delay before analysis than earlier samples. No soil nitrate data are available for this month, but winter nitrate levels are generally around 0.2-0.7 ppm, suggesting that differences in the time delay prior to analysis are likely to be responsible for the higher rates.
The denitrification rates in the Shannon sites are mostly very uniform, both across stations and seasons. Summer peak rates are slightly higher than those in cooler seasons, but the overall range of 0.33 to 2.42mg/m7d is not large compared with the Torridge and Loire. No soil nitrate data arc available for the Shannon sites, but soil waler chemistry data, where obtained, shows consistently low levels of nitrate, suggesting that denitrification may be nitrate-limited. However, both soil and soil water nitrate levels arc low in the Torridge, and denitrification levels are consistently higher. The uniformity of denitrification rates at Clonmacnoise and Little Brosna may also be due to the nitrate source, as much as its concentration; hydrogeological studies of the Shannon sites show that the wetlands arc predominantly rain, rather than flood or groundwater fed. This may mean that a low concentration of nitrate is available for much of the year. Despite this, it would be expected that warmer summer temperatures would cause an increase in mineralisation and hence the available soil nitrate, giving rise to a higher potential denitrification rate in a soil with substantial amounts of easily oxidised carbon.
185
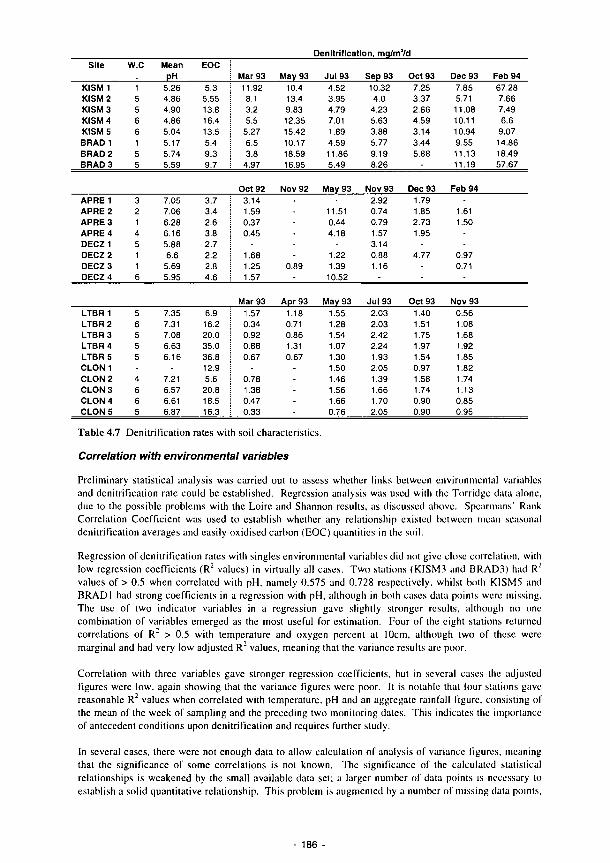
Site
KISM1 KISM2 KISM3 KISM4 KISM 5 B R A D I BRAD 2 BRAD 3
W.C
1 5 5 6 6 1 5 5
Mean pH
5.26 4.86 4.90 4.86 5.04 5.17 5.74 5.59
EOC
5.3 5.55 13.8 16.4 13.5 5.4 9.3 9.7
Mar 93 11.92 8.1 3.2 5.5
5.27 6.5 3.8
4.97
May 93 10.4 13.4 9.83 12.35 15.42 10.17 18.59 16.95
Denitr i f ication, mg/m
Jul 93 4.52 3.95 4.79 7.01 1.89 4.59 11.86 5.49
Sep 93 10.32 4.0
4.23 5.63 3.88 5.77 9.19 8.26
7d
Oct 93 7.25 3.37 2.66 4.59 3.14 3.44 5.88
Dec 93 7.85 5.71 11.08 10.11 10.94 9.55 11.13 11.19
Feb 94 67.28 7.66 7.49 6.6
9.07 14.86 18.49 57.67
APRE1 APRE 2 APRE 3 APRE 4 DECZ1 DECZ2 DECZ3 DECZ4
3 2 1 4 5 1 1 6
7.05 7.06 6.28 6.16 5.88 6.6
5.69 5.95
3.7 3.4 2.6 3.8 2.7 2.2 2.8 4.6
Oct 92 3.14 1.59 0.37 0.45
1.68 1.25 1.57
Nov 92
---
0.89
-
May 93
11.51 0.44 4.18
1.22 1.39
10.52
Nov 93 2.92 0.74 0.79 1.57 3.14 0.88 1.16
-
Dec 93 1.79 1.85 2.73 1.95
4.77
--
Feb 94
-1.61 1.50
0.97 0.71
LTBR1 LTBR2 LTBR3 LTBR4 LTBR5 C L O N I CLON 2 CLON 3 CLON 4 CLON 5
5 6 5 5 5
-4 6 6 5
7.35 7.31 7.0B 6.63 6.16
-7.21 6.57 6.61 6.87
6 9 16.2 20.0 35.0 36.8 12.9 5.6
20.8 18.5 16.3
Mar 93 1.57 0.34 0.92 0.88 0.67
-0.78 1.38 0.47 0.33
Apr 93 1.18 0.71 0.86 1.31 0.67
----
May 93 1.55 1.28 1.54 1.07 1.30 1.50 1.46 1.56 1.66 0.76
Jul 93 2.03 2.03 2.42 2.24 1.93 2.05 1.39 1.66 1.70 2.05
Oct 93 1.40 1.51 1.75 1.97 1.54 0.97 1.58 1.74 0.90 0.90
Nov 93 0.56 1.08 1.68 1.92 1.85 1.82 1.74 1 13 0.85 0.95
Table 4.7 Denitrification rates wilh soil characteristics.
Correlation with environmental variables
Preliminary statistical analysis was carried out to assess whether links between environmental variables and denitrification rate could be established. Regression analysis was used with the Torridge data alone, due to the possible problems with the Loire and Shannon results, as discussed above. Spearmans' Rank Correlation Coefficient was used to establish whether any relationship exislcd between mean seasonal denitrification averages and easily oxidised carbon (EOC) quantities in the soil.
Regression of denitrification rales with singles environmental variables did not give close correlation, wilh low regression coefficients (R" values) in virtually all cases. Two stations (KISM3 and BRAD3) had R values of > 0.5 when correlated with pH, namely 0.575 and 0.728 respectively, whilst both KISM5 and BRADI had strong coefficients in a regression with pH, although in both cases data points were missing. The use of two indicator variables in a regression gave slightly stronger results, although no one combination of variables emerged as the most useful for estimation. Four of the eighl stations returned correlations of R" > 0.5 with temperature and oxygen percent at 10cm, although two of these were marginal and had very low adjusted R" values, meaning that the variance results are poor.
Correlation with three variables gave stronger regression coefficients, but in several cases the adjuslcd figures were low, again showing that the variance figures were poor. It is notable that four stations gave reasonable R" values when correlated with temperature, pH and an aggregate rainfall figure, consisting of the mean of the week of sampling and the preceding two monitoring dates. This indicates the imporlancc of antecedent conditions upon denitrification and requires further study.
In several cases, there were not enough data to allow calculation of analysis of variance figures, meaning that the significance of some correlations is not known. The significance of the calculated statistical relationships is weakened by the small available data sel; a larger number of data points is necessary to establish a solid quantitative relationship. This problem is augmented by a number of missing data points,
186 -
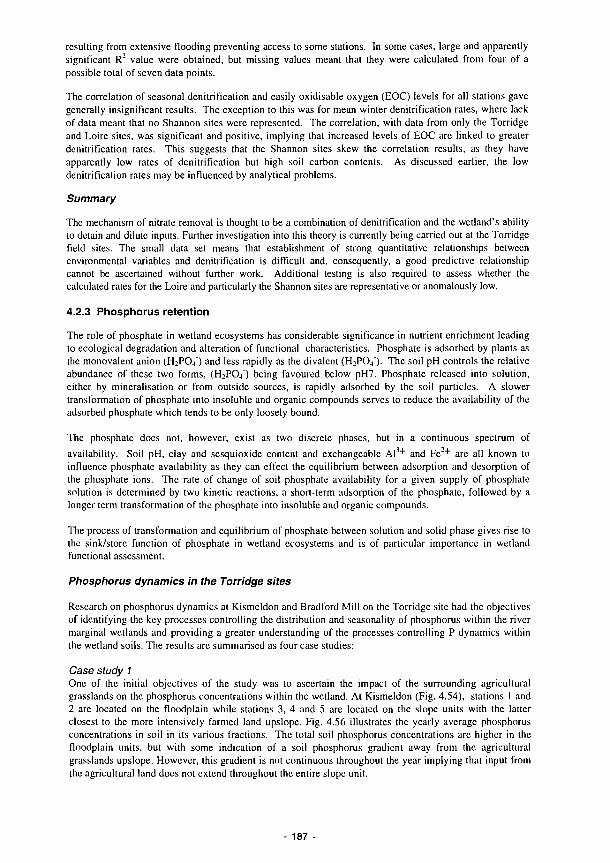
resulting from extensive flooding preventing access to some stations. In some cases, large and apparently significant R2 value were obtained, but missing values meant that they were calculated from four of a possible total of seven data points.
The correlation of seasonal denitrification and easily oxidisable oxygen (EOC) levels for all stations gave generally insignificant results. The exception to this was for mean winter denitrification rates, where lack of data meant that no Shannon sites were represented. The correlation, with data from only the Torridge and Loire sites, was significant and positive, implying that increased levels of EOC are linked to greater denitrification rates. This suggests that the Shannon sites skew the correlation results, as they have apparently low rates of denitrification but high soil carbon contents. As discussed earlier, the low denitrification rates may be influenced by analytical problems.
Summary
The mechanism of nitrate removal is thought to be a combination of denitrification and the wetland's ability to detain and dilute inputs. Further investigation into this theory is currently being carried out at the Torridge field sites. The small data set means that establishment of strong quantitative relationships between environmental variables and denitrification is difficult and, consequently, a good predictive relationship cannot be ascertained without further work. Additional testing is also required to assess whether the calculated rates for the Loire and particularly the Shannon sites are representative or anomalously low.
4.2.3 Phosphorus retention
The role of phosphate in wetland ecosystems has considerable significance in nutrient enrichment leading to ecological degradation and alteration of functional characteristics. Phosphate is adsorbed by plants as the monovalent anion (H2P04) and less rapidly as the divalent (H2P04). The soil pH controls the relative abundance of these two forms, (H2P04) being favoured below pH7. Phosphate released into solution, either by mineralisation or from outside sources, is rapidly adsorbed by the soil particles. A slower transformation of phosphate into insoluble and organic compounds serves to reduce the availability of the adsorbed phosphate which tends to be only loosely bound.
The phosphate does not, however, exist as two discrete phases, but in a continuous spectrum of availability. Soil pH, clay and sesquioxide content and exchangeable Al3+ and Fe2+ are all known to influence phosphate availability as they can effect the equilibrium between adsorption and desorption of the phosphate ions. The rate of change of soil phosphate availability for a given supply of phosphate solution is determined by two kinetic reactions, a short-term adsorption of the phosphate, followed by a longer term transformation of the phosphate into insoluble and organic compounds.
The process of transformation and equilibrium of phosphate between solution and solid phase gives rise to the sink/store function of phosphate in wetland ecosystems and is of particular importance in wetland functional assessment.
Phosphorus dynamics in the Torridge sites
Research on phosphorus dynamics at Kismeldon and Bradford Mill on the Torridge site had the objectives of identifying the key processes controlling the distribution and seasonality of phosphorus within the river marginal wetlands and providing a greater understanding of the processes controlling Ρ dynamics within the wetland soils. The results are summarised as four case studies:
Case study 1 One of the initial objectives of the study was to ascertain the impact of the surrounding agricultural grasslands on the phosphorus concentrations within the wetland. At Kismeldon (Fig. 4.54), stations 1 and 2 are located on the floodplain while stations 3, 4 and 5 are located on the slope units with the latter closest to the more intensively farmed land upslope. Fig. 4.56 illustrates the yearly average phosphorus concentrations in soil in its various fractions. The total soil phosphorus concentrations are higher in the floodplain units, but with some indication of a soil phosphorus gradient away from the agricultural grasslands upslope. However, this gradient is not continuous throughout the year implying that input from the agricultural land docs not extend throughout the entire slope unit.
- 187
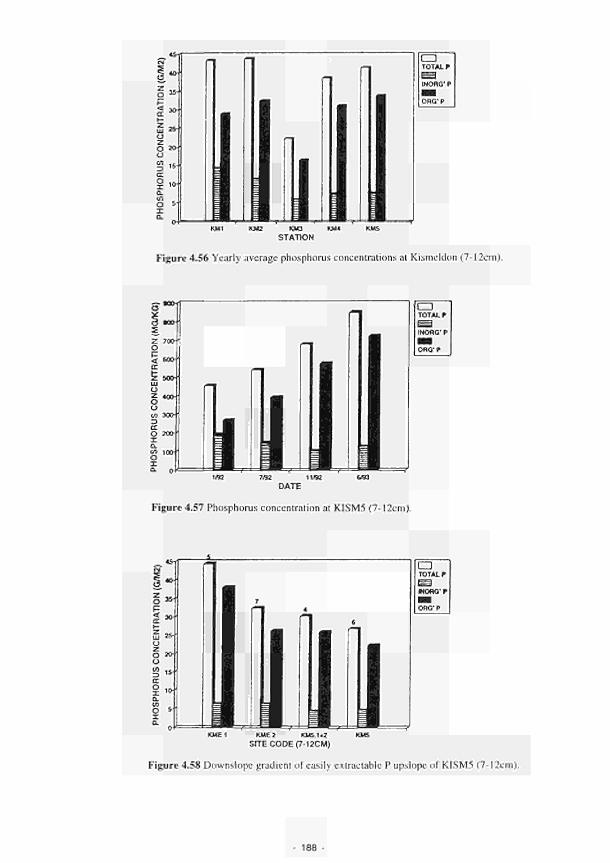
K M KM4 STATION
Figure 4.56 Yearly average phosphorus concentrations at Kismeldon (7-12cm).
7/92 11/92 DATE
Figure 4.57 Phosphorus concentration at KISM5 (7-l2cm).
KME 2 KMS.1.2 SITE CODE (7-12CM)
Figure 4.58 Downslope gradient of easily extractable Ρ upslope of KISM5 (7- I2em).
188 -

Examination of the phosphorus content of the topsoil at station 5 over a period of 18 months shows a
consistent increase in the total concentration suggesting the soil is storing phosphorus received from the
agricultural lands (Fig. 4.57). Increases in total phosphorus are entirely in the organic form, suggesting
that the phosphorus entering the wetland in throughflow is being retained by immobilisation in the soil
organic matter rather than by adsorption.
2m
V
KME1
KME2
KM5.1
KM5.2
KISM5
ownslope
O
O
o
o
■
AGRICULTURAL GRASSLAND
HEDGE tì.
EUTROPHIC ZONE, RYEGRASS
MOLINIA GRASSLAND
Figure 4.59 Schematic location map of Ρ experiment at Kismeldon
These findings prompted a small scale study on the area between the agricultural field boundary and
Station 5 (Fig. 4.59). Analyses of soil samples from these additional sites indicated a phosphorus gradient
downslope from the agricultural fields (Fig. 4.58), the site closest to the field boundary having the highest
phosphorus content, which was mostly in the organic form.
In summary the main results show that phosphorus-rich water is entering the wetland from the agricultural
land upslope. There is a clear phosphorus gradient over 10m from the agricultural land boundary, and
phosphorus retention appears to occur primarily through immobilisation.
Case study 2
Phosphorus can be transported as suspended solids or in dissolved forms via surface runoff. The ability of
wetlands to remove sediment-bound phosphorus geomorphically by sedimentation is well documented.
However, it is the soluble phosphorus in surface runoff which poses the greatest threat to deterioration of
river water quality because it is an immediate source for biological uptake. For this reason this study
concentrated on the soluble phosphorus fraction found in surface water moving through the wetland in the
ditch system. In particular the investigation examined the role of flush zones located along the ditch in
removing nutrients by analysing the ditch nutrient concentrations above and below the flush zone at weirs
1 and 2. Fig. 4.60 represents the soluble phosphorus input into the wetland over a 2 day period. There is a
very good agreement between discharge and the soluble phosphorus concentration (r2 = 0.79), the
phosphorus released by the agricultural soils being partly controlled by the rainfall. To examine the
influence of the flush zones, a predicted phosphorus concentration is calculated by using the C1:P ratio in
the ditch waters, assuming that there are no significant additions or removals of chloride within the
wetland. Fig. 4.61 illustrates the observed and predicted phosphorus concentrations. The minimum
reduction in phosphorus over the study period was 50 percent with an average of 73 percent. The
reductions in soluble phosphorus over the study period represent a worse case scenario because of the
very large discharges. As this is a black box study it is only possible to infer the likely processes
occurring within the flush zone. The reduction in the phosphorus concentrations may have occurred by
dilution or by adsorption by the flush zone soil. It is unlikely that the reduction in phosphorus
concentrations were due to dilution by groundwater because the rate of groundwater discharge is very
slow through the Head material, which has low permeability.
The results of case sludy 2 indicate that there is a significant reduction in the concentration of soluble
phosphorus in agricultural runoff after passing through wetland soils which illustrates clearly the
189
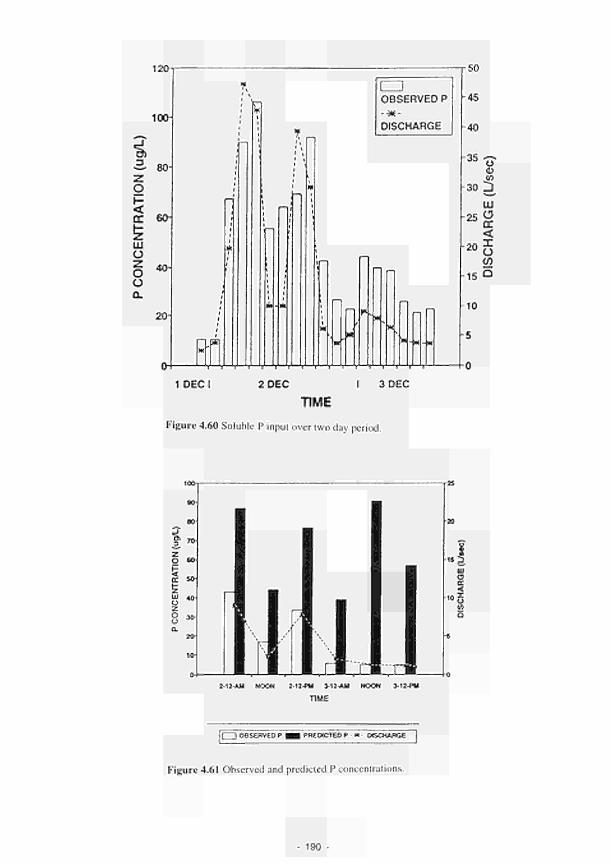
120
100
•2» 80
< CC 60
LU ü
O «H O 0_
20H
1 DECI
Hm
LZD OBSERVED Ρ
■ *
DISCHARGE
f .
τ—τ—ν—τ—τ—τ—Τ—τ
2 DEC Ι 3 DEC
TIME
50
45
40
35
30
?S
20
15
10
5
υ ej (Λ
Ί LU G tr < χ o ω Q
Figure 4.60 Soluble Ρ input over two day period.
2-12AM NOON 2-12-ni 312-AU NOON 3-12-PU
TIME
I 1 OBSERVEO Ρ ■ ■ PREDICTEO Ρ « DBCHABGE
Figure 4.61 Observed and predicted Ρ concentrations.
190

importance of flush zones. This may provide useful management options in terms of creation and maintenance of flush zones specifically for phosphorus retention.
Case study 3 Soluble phosphorus is principally adsorbed by the oxyhydroxides of iron and aluminium and possibly manganese, mainly when in the amorphous form, due to their larger surface area. However, during reduction more phosphate ions were released from an anaerobic soil than an aerobic soil to solution . This may be caused by 3 mechanisms (Patrick et al., 1973):
1. Reduction of highly insoluble ferric phosphate to more soluble non-crystalline ferrous forms.
2. Displacement of phosphate from insoluble ferric and aluminium phosphate by organic anions produced in an anaerobic flooded soil.
3. Hydrolysis of ferric phosphate as a result of pH rise when an acid soil is flooded.
Iron and manganese which are partly responsible for adsorption can be biochemically reduced (mechanism 1). Various researchers have shown a correspondence between soluble iron concentrations and soluble phosphorus concentrations as the redox and pH of a system is reduced, which suggests that the phosphorus and the iron together become more soluble during reduction.
It can be hypothesised that the following sequence of events may occur to release phosphorus:
WATERLOGGING OF THE SOIL -> DECREASE IN Eh -> INCREASE IN SOLUBLE MANGANESE -> INCREASE IN SOLUBLE IRON -> PHOSPHORUS RELEASE TO SOIL SOLUTION
This case study tested this hypothesis over the first 5 months of the wetting up period after summer 1992. Substantial rainfall in July began the wetting up process, causing the water table to rise very sharply and reach the surface in only 6 weeks (Fig. 4.62). This produced anaerobic conditions within the soil as shown by the redox potentials and the oxygen concentrations which also are closely related. The conditions within the soil seem suitable for phosphorus release.
Influence of Manganese The manganese concentrations in solution at each station increase as the flooding period and consequent intensity of reduction of the soil increase. The actual concentrations of soluble manganese tend to be high after only 2 weeks of flooding. This suggests that the soil manganese becomes reduced relatively rapidly in a seasonally waterlogged soil. However, there appears to be no relationship between the manganese concentration and the soluble concentration of phosphorus (Fig. 4.63a).
Influence of Iron The concentration of iron in the soil water tends to be not only erratic but also very low. It appears that reduction of the soil iron is not occurring even when redox potentials are relatively low. However, there does seem to be some relationship between the concentration of the soluble iron and soluble phosphorus. This relationship is exhibited at depths of 40 and 80 cm where the influence of organic processes are minimised. However, the changes in phosphorus concentrations cannot be explained by these small fluctuations in the soluble iron concentrations (Fig. 4.63a).
The major peaks in soluble phosphorus occur at the beginning of the study period in mid-July before reduction processes are operating. A possible explanation is the association between the soluble phosphorus and the soil oxygen concentrations (Fig. 4.63b). Mineralisation of organic matter increases when a dry soil is wetted up as a result of rapid growth of the microbial populations while the soil oxygen concentrations remain sufficient to sustain these aerobic populations. This rapid water potential increase acts as a catalyst for the turnover of carbon as well as phosphorus and other nutrients.
191

KISMELDON MEADOWS STATION 3
1SEPT
DATE
40cm -*■■- 10cm
Figure 4.62 Water depth, redox potential and oxygen concentration al KISM3.
- 192 -
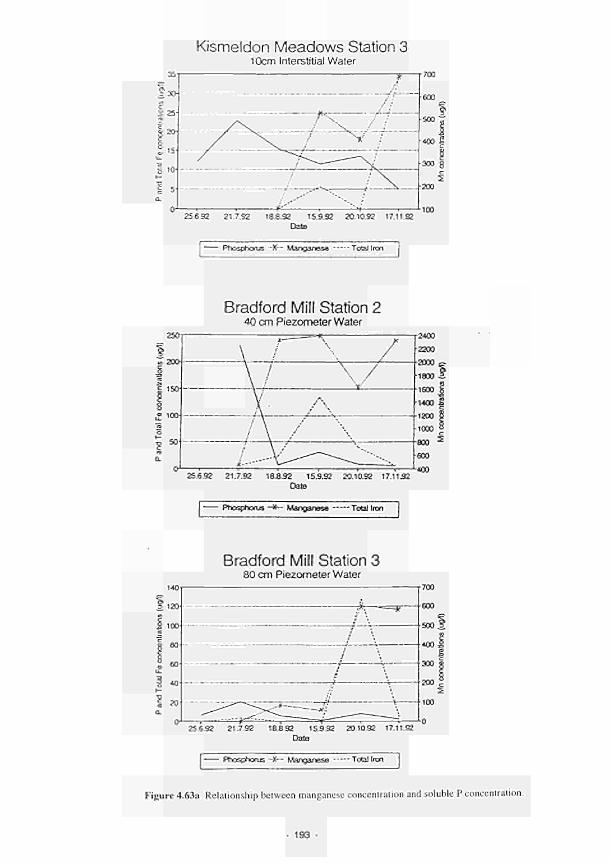
Kismeldon Meadows Station 3 10cm Interstitial Waler
25.6.92 21.7.92 18.8.92 15.9.92 20.10.92 17.11.92
Date
Phosphorus ~X~ Manganese Total Iron
Bradford Mill Station 2 40 cm Piezometer Water
2400
25.6.92 21.7.92 18.8.92 15.9.92 20.10.92 17.1152
Date
Phosphorus ~*~ Manganese ■
140
Ï 120
I ico
« 1 80
Ì 60· LL
1 40· I
I 20 rx
O
Bradford Mill Station 3 80 cm Piezometer Water
700
600
500 S
400 S
ë 300 §
200 i
25692 21.7.92 18.8.92 15S.S2 20.10.92 17.11.92
Date
Phosphorus X—· Manganese Tool Iran
Figure 4.63a Relationship between manganese concentration and soluble Ρ concentration.
193

¿.Ό
* ί2"-3 ' • β · * *
Ζ Ο 15-l·-< CC I-ã 10ο ζ
ο ο _ α 5
ο
■
r2 = 0.82
m
■
Η
, , ,
m
, , 8 10 12 14 16 OXYGEN CONCENTRATION (%)
18 20
Figure 4.63b Association between soluble Ρ and soil oxygen concentrations.
194

Case study 4 This study briefly examines some of the seasonality detected in the various fractions of the soil phosphorus.
In topsoils (7-12cm) the inorganic phosphorus content reached a maximum in the summer while the total and organic fractions were maximal in the winter (Fig. 4.64a). This suggests that mineralisation occurs during the summer due to increased microbial activity which explains the organic phosphorus minimum and inorganic phosphorus maximum in the summer. The overall decrease in the total phosphorus in the summer is due to plant uptake. In the winter plant phosphorus is returned to the organic phosphorus component and immobilisation occurs. Therefore, the seasonality seems to be biologically controlled in the upper part of soil profiles.
However, the seasonality exhibited in subsoils (30-40cm) is in marked contrast (Fig. 4.64b). The inorganic phosphorus fractions have a maximum in the winter and the organic phosphorus fractions have summer maxima. Further analysis of the data is required to explain this. However, more inorganic phosphorus would be expected due to the reduction of the organo-metallic complexes.
The results of case study 4 show that mineralisation of organic phosphorus takes place during the summer and subsequent immobilisation during the winter in topsoils, with an opposite pattern occurring in subsoils due to possible reduction processes. Seasonality seems to be biologically controlled in topsoils and chemically controlled in subsoils.
Phosphorus Adsorption Indices
The research investigated the short term adsorption of phosphate, which can be estimated routinely in the laboratory by the determination of phosphate isotherms.
The objectives of this study were to:
i) determine the feasibility of using Phosphate Adsorption Isotherms for determining the adsorption characteristics of the range of wetland soils in the study sites;
ii) determine if the phosphate isotherms can be summarised satisfactorily in the form of a single index (Phosphorus Adsorption Index, PAI);
iii) correlate this index with a number of soil characteristics to determine the effects of individual soil properties such as particle size class, redox potential and chemical characteristics on the phosphate adsorption capacity of the wetland soil;
iv) to quantify adsorption capacities of soils of the sludy sites.
The phosphate adsorption isotherm Barrow (1978) criticises the use of the term isotherm as it infers a control of the thermal environment which does not necessarily exist. However, the term phosphate isotherm describes the reaction curve that results from the addition of a range of phosphate concentrations in solution to soil suspension or the reaction over time for a single addition of phosphate.
The main reasons for studying phosphate isotherms are to:
i) improve understanding of the processes involved; ii) summarise complex chemical interactions; iii) provide a basis for prediction of the adsorption capacity of wetland soils and sediments which
can be used in the functional assessment procedures.
There is a clear advantage, however, in a single number index (Bache and Williams, 1971) as it is easier to communicate, and provides an easily understandable indicator which docs not require lengthy calculations to determine its significance in the soil environment. The indices used in the amount of Ρ adsorbed form an equilibrium solution of lOOppm or 130ppm P O / .
The main results of the phosphorus adsorption isotherms arc summarised in Figs. 4.65(a-d) to 4.67(a-c):
195
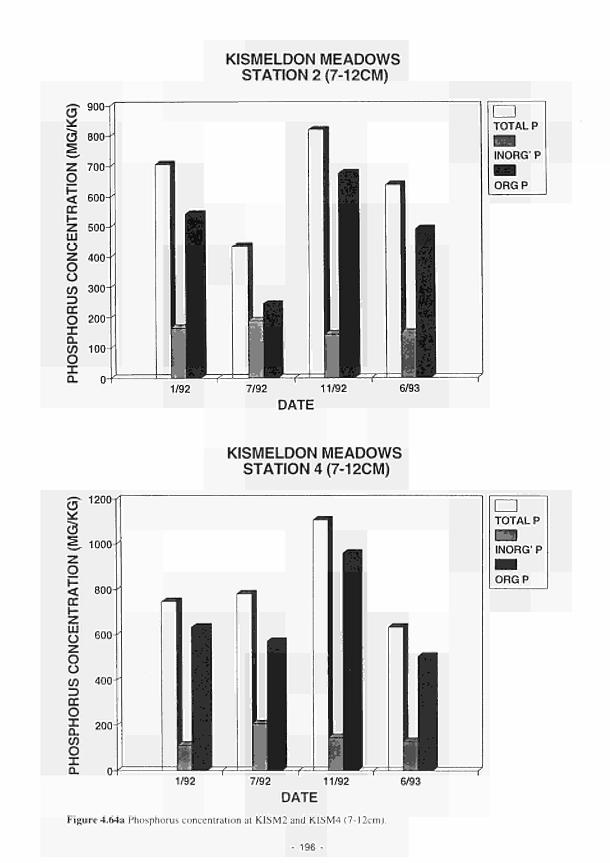
g · 900
$ 12001
KISMELDON MEADOWS STATION 2 (7-12CM)
1/92 7/92 11/92 6/93
DATE
KISMELDON MEADOWS STATION 4 (7-12CM)
1/92 7/92 11/92 DATE
6/93
TOTAL P
INORG' P
ORGP
Figure 4.64a Phosphorus concentration at KISM2 and KISM4 (7-l2cm).
- 196
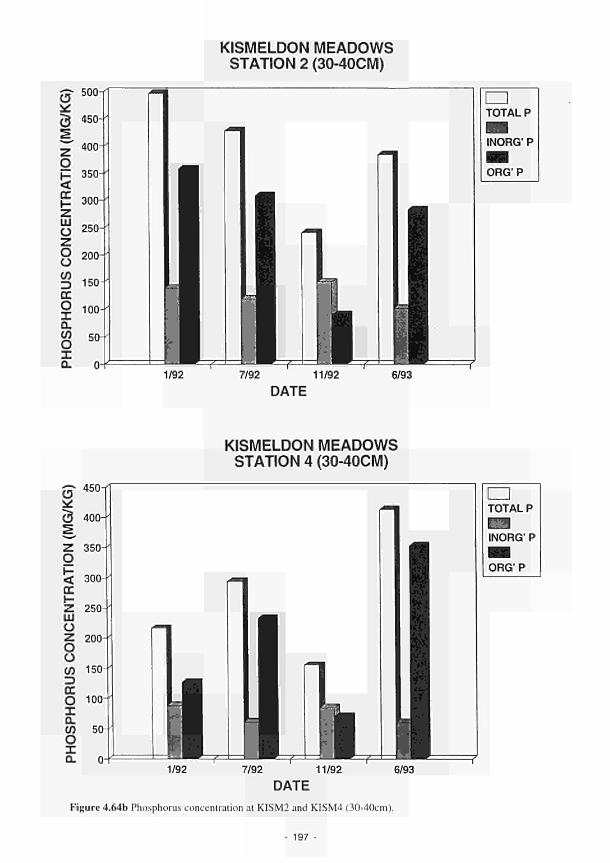
o *: ö Ξ ζ
Ο 1-< cc Ζ LU Ο Ζ
ο υ (Π 3 CC
ο χ α. (Λ Ο Χ Û.
500-
450
400-
350
300
250
?οη
1bU
100
50
0
KISMELDON MEADOWS STATION 2 (3040CM)
1/92 7/92 11/92 6/93
TOTAL Ρ
INORG' Ρ
ORG'Ρ
DATE
5*450
KISMELDON MEADOWS STATION 4 (3040CM)
1/92 7/92 11/92
DATE 6/93
Figure 4.64b Phosphorus concentration at KISM2 and KISM4 (3040cm).
197
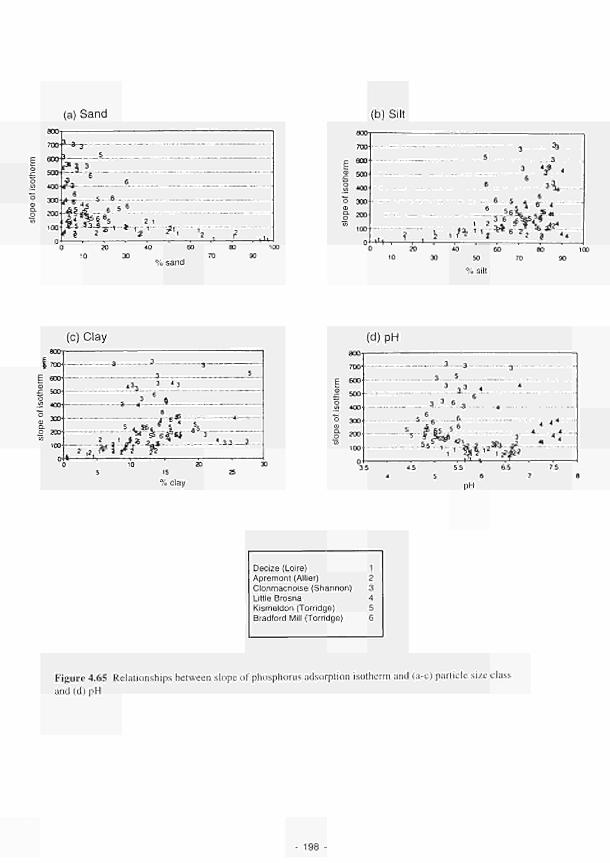
(a) Sand (b) Silt
TOO * - 3 - 3
scoi. r?_î.·
fl s....fi. f AT»·-'-t i 2 * ' ί ?'ϊ
20
% sand BO too
90
(c) Clay βοο-
I 700--E eoo-ω s soo-
Φ 300 Q. O 200
.AJ.3„
- 5 - Λ »
3 4 3
gt^jg i—fr** - *
L » a _ l . .
% clay
(d) pH
Decize (Loire) 1 Apremont (Allier) 2 Clonmacnoise (Shannon) 3 Little Brosna 4 Kismeldon (Torridge) 5 Bradford Mill (Torridge) 6
Figure 4.65 Relationships between slope of phosphorus adsorption isotherm and (a-c) particle size class and (d) pH
198

_ 600
Jj 500
I to°-
(a) Fe0
Λ. _.. 3 * j
3_.
3..
O 300 φ g" 2«) " 100
""<"~V 4.-
:z^-s-
(b) Fep
700
£ 600
| 500
1 *oo o 300 φ f 200 οι
100
-*-* 4 6 .S _«_.5 5 sr_
# 3 Ι ^ 5 6 .
}3ft ί
ι_
% Fe0 % Fep
(c) Fed
700 6O0 500 400 300 200 100
(d) Felc
~3
~ 3 3
4-L
5 5 - J - - 5 - 5
. . 3 _ 6 , 4 5 - -
6.56_44._5-..5,
Ί6"~
.5 „... 5 β
jsiTTsfø 1.5 2.5
% Fe.oi
Decize (Loire) 1 Apremont (Allier) 2 Clonmacnoise (Shannon) 3 Little Brosna 4 Kismeldon (Torridge) 5 Bradford Mill (Torridge) 6
Figure 4.66 Relationships between slope of phosphorus adsorption isotherm and (a - d) extractable forms of iron
199 -
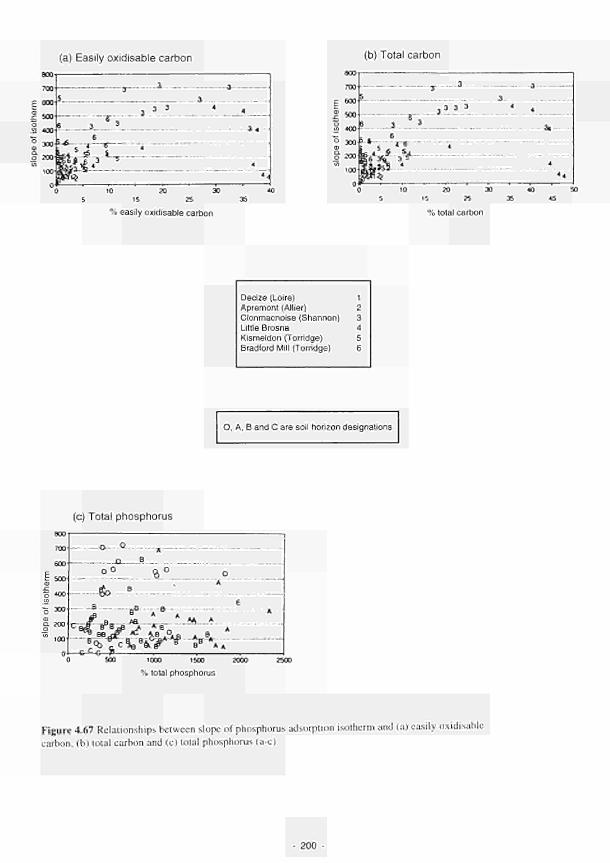
(a) Easily oxidisable carbon
15 25
% easily oxidisable carbon
(b) Total carbon
3 3 3
a,_
15 ?5
% total carbon
40
35 4S
Decize (Loire) 1 Apremont (Allier) 2 Clonmacnoise (Shannon) 3 Little Brosna 4 Kismeldon (Torridge) 5 Bradford Mill (Torridge) 6
Ο, Α, Β and C are soil horizon designations
(c) Total phosphorus
800
700
600
È 500·
ω
f «O to
Õ 30°
φ Q. JOO o " 100
-O--0-.
_o o o
lib.... _SL°
_a
— » a — . :.. A 8,
kf%^^¿ 1000 1500 2000
% total phosphorus
Figure 4.67 Relationships between slope of phosphorus adsorption isotherm and (a) easily oxidisable
carbon, (b) total carbon and (c) total phosphorus (ac)
200
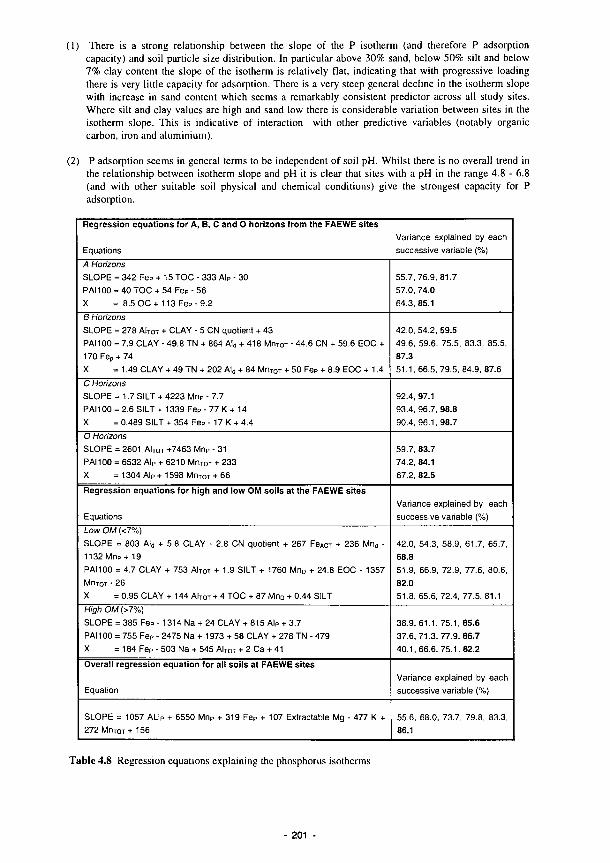
(1) There is a strong relationship between the slope of the Ρ isotherm (and therefore Ρ adsorption capacity) and soil particle size distribution. In particular above 30% sand, below 50% silt and below 7% clay content the slope of the isotherm is relatively flat, indicating that with progressive loading there is very little capacity for adsorption. There is a very steep general decline in the isotherm slope with increase in sand content which seems a remarkably consistent predictor across all study sites. Where silt and clay values are high and sand low there is considerable variation between sites in the isotherm slope. This is indicative of interaction with other predictive variables (notably organic carbon, iron and aluminium).
(2) Ρ adsorption seems in general terms to be independent of soil pH. Whilst there is no overall trend in the relationship between isotherm slope and pH it is clear that sites with a pH in the range 4.8 - 6.8 (and with other suitable soil physical and chemical conditions) give the strongest capacity for Ρ adsorption.
Regression equations for A, B, C and 0 horizons f rom the FAEWE sites Variance explained by each
Equations successive variable (%)
A Horizons SLOPE = 342 FeP + 15 TOC - 333 AIP - 30 PA1100 = 40 TOC + 54 FeP - 56 Χ = 8.5 OC + 113 Fe?-9.2
Β Horizons
SLOPE = 278 ΑΙτοτ + CLAY - 5 CN quotient + 43 PAI100 = 7.9 CLAY - 49.8 TN + 864 Ala + 418 Μητοτ - 44.6 CN + 59.6 EOC + 170 Fe»+ 74 Χ = 1.49 CLAY + 49 TN + 202 Ald + 84 Μητοτ + 50 Fep + 8.9 EOC + 1.4
C Horizons SLOPE = 1.7 SILT + 4223 MnP - 7.7 PAI100 = 2.6 SILT + 1339 FeP - 77 Κ + 14 X = 0.489 SILT + 354 FeP - 17 Κ + 4.4
O Horizons SLOPE = 2601 ΑΙτοτ +7463 MnP - 31 PA1100 = 6532 AIP + 6210 Μητοτ + 233 X = 1304 Alp + 1598 Μητοτ + 66
Regresslon equations for high and low OM soils at the FAEWE sites
Equations
Low OM (<7%)
SLOPE = 803 Ald + 5.8 CLAY - 2.8 CN quotient + 267 FeACT + 236 Mnd -1132 Mn P + 19 PAI100 = 4.7 CLAY + 753 ΑΙτοτ + 1.9 SILT + 1760 MnD + 24.8 EOC - 1357 Μητοτ - 26 X = 0.95 CLAY + 144 ΑΙτοτ + 4 TOC + 87 MnD + 0.44 SILT High OM (>7%)
SLOPE = 385 FeP -1314 Na + 24 CLAY + 815 Alp + 3.7 PA1100 = 755 FeP - 2475 Na + 1973 + 58 CLAY + 278 TN - 479 Χ = 184 Fep-503 N a + 545 ΑΙτοτ+ 2 C a + 41
Overall regression equation for all soi ls at FAEWE sites
Equation
SLOPE = 1057 AL IP + 6550 MnP + 319 FeP + 107 Extractable Mg - 477 Κ +
272 Μητοτ + 156
55.7,76.9,81.7 57.0, 74.0 64.3, 85.1
42.0, 54.2, 59.5 49.6, 59.6, 75.5, 83.3, 85.5, 87.3 51.1,66.5,79.5,84.9,87.6
92.4, 97.1 93.4, 96.7, 98.8 90.4,96.1,98.7
59.7, 83.7 74.2, 84.1 67.2, 82.5
Variance explained by each successive variable (%)
42.0, 54.3, 58.9, 61.7, 65.7, 68.8
51.9, 66.9, 72.9, 77.6, 80.6, 82.0 51.B, 65.6, 72.4, 77.5, 81.1
38.9,61.1,75.1,85.6 37.6,71.3,77.9,86.7 40.1.66.6,75.1,82.2
Variance explained by each successive variable (%)
55.6, 68.0, 73.7, 79.8, 83.3, 86.1
Table 4.8 Regression equations explaining the phosphorus isotherms
- 201
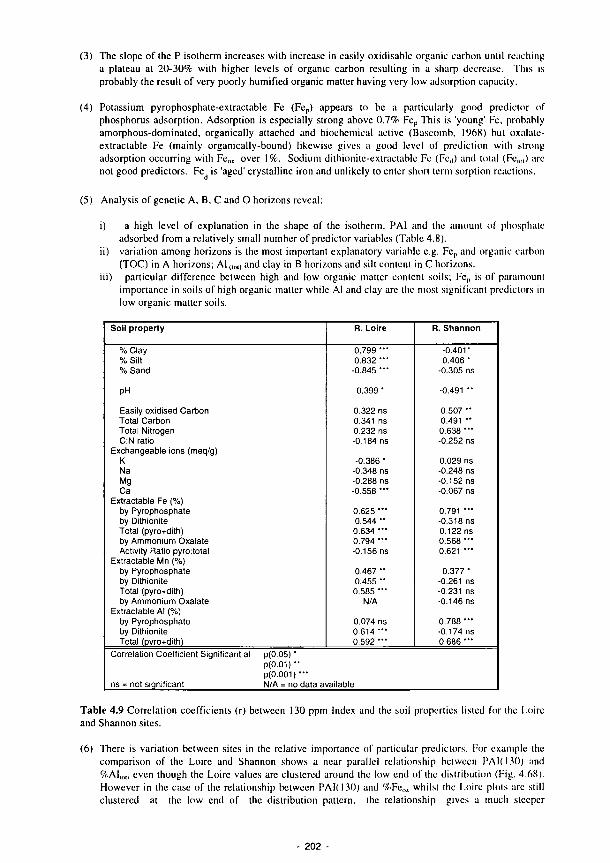
(3) The slope of the Ρ isotherm increases with increase in easily oxidisable organic carbon until reaching
a plateau at 2030% with higher levels of organic carbon resulting in a sharp decrease. This is
probably the result of very poorly humified organic matter having very low adsorption capacity.
(4) Potassium pyrophosphaleextractable Fc (Fer) appears to be a particularly good predictor of
phosphorus adsorption. Adsorption is especially strong above 0.7% Fep This is 'young' Fe, probably
amorphousdominated, organically attached and biochemical active (Bascomb, 1968) but oxalale
extractable Fe (mainly organicallybound) likewise gives a good level of prediction with strong
adsorption occurring with Feox over 1%. Sodium dithioniteextractable Fe (Fe,j) and total (Fe,,„) are
not good predictors. Fe is 'aged' crystalline iron and unlikely to enter short term sorption reactions.
(5) Analysis of genetic A, B, C and O horizons reveal:
¡ii)
a high level of explanation in the shape of the isotherm, PAI and lhe amount of phosphate
adsorbed from a relatively small number of predictor variables (Table 4.8).
variation among horizons is the most important explanatory variable e.g. Fc,, and organic carbon
(TOC) in A horizons; Al,,«, and clay in Β horizons and silt content in C horizons.
particular difference between high and low organic matter content soils; Fc,, is of paramount
importance in soils of high organic matter while Al and clay arc the most significant predictors in
low organic matter soils.
Soil property
% Clay
% Silt
% Sand
PH
Easily oxidised Carbon
Total Carbon
Total Nitrogen
C:N ratio
Exchangeable ions (meq/g)
Κ
Na
Mg
Ca
Extractable Fe (%)
by Pyrophosphate
by Dithionite
Total (pyro+dith)
by Ammonium Oxalate
Activity Ratio pyro:total
Extractable Mn (%)
by Pyrophosphate
by Dithionite
Total (pyro+dith)
by Ammonium Oxalate
Extractable AI (%)
by Pyrophosphate
by Dithionite
Total (pyro+dith)
Correlation Coefficient Significant at p(0.05) "
p(0 .01)"
p(0.001)* "
ns = not significant N/A = no data a
R. Loire
0.799 —
0.832 · "
0.845 " ·
0.399 ·
0.322 ns
0.341 ns
0.232 ns
0.184 ns
0.386 ·
0.348 ns
0.288 ns
0.558 · "
0.625 · "
0.544 "
0.634 —
0.794 "■
0.156 ns
0.467 "
0.455 "
0.585 · "
N/A
0.074 ns
0.614 · "
0.592 " ·
/ailable
R.Shannon
0.401·
0.406 ·
0.305 ns
0.491 "
0.507 "
0.491 "
0.638 · "
0.252 ns
0.029 ns
0.248 ns
0.152 ns
0.067 ns
0.791 ■"
0.318 ns
0.122 ns
0.568 · "
0.621 · "
0.377 ·
0.261 ns
0.231 ns
0.146 ns
0.788 · "
0.174 ns
0.686 " ·
Table 4.9 Correlation coefficients (r) between 130 ppm Index and the soil properties listed for lhe Loire
and Shannon sites.
(6) There is variation between sites in the relative importance of particular predictors. For example [he
comparison of the Loire and Shannon shows a near parallel relationship between PAK 130) and
%AI,0„ even though the Loire values are clustered around the low end of lhe dislribution (Fig. 4.68).
However in the case of the relationship between PAK 130) and %Fc„x whilst the Loire plots are still
clustered at the low end of the distribution pattern, the relationship gives a much sleeper
202
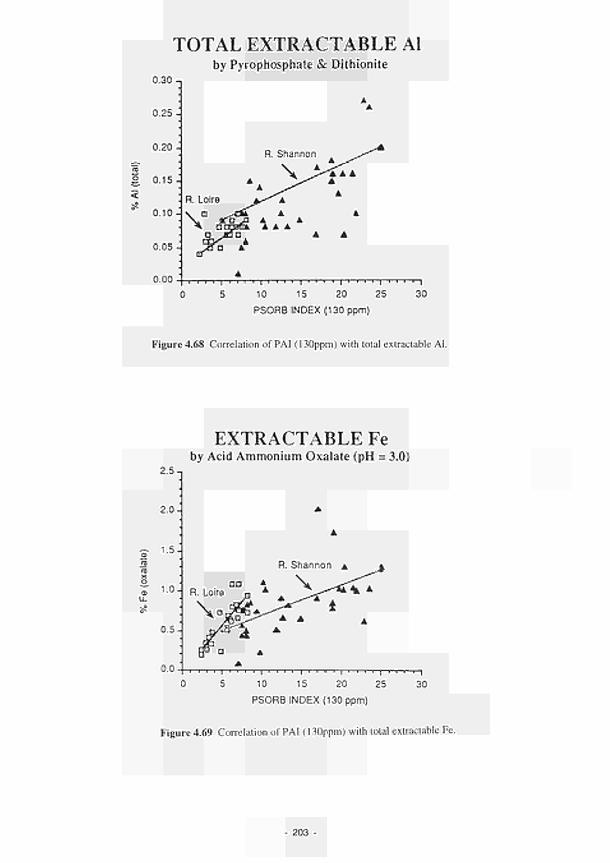
TOTAL EXTRACTABLE Al by Pyrophosphate & Dithionite
0.30
0.25
0.20
"S
S 0 .15
<
0.05
0.00
R. Shannon
• R. Loire
0 . 1 0 K o
α . . ¿rSá l i i
A A
a A
A Ι ι ι ι ι Ι ι ι ι ι Ι ι ι ι ι ι ι—ι ι ι ι I I I — r ]
5 10 15 20 25 30
PSORB INDEX (130 ppm)
Figure 4.68 Correlation of PAI (130ppm) with total extractable Al.
EXTRACTABLE Fe by Acid Ammonium Oxalate (pH = 3.0)
2.5,
2.0
= 1.5
1.0
0.5
0.0
R. Loire
ï — ι — ι — ι — ι — ι — ι — ι — ι — ι — ι ι ι ι | — ι — ι ι ι — r
0 5 10 15 20 25 30
PSORB INDEX (130 ppm)
Figure 4.69 Correlation of PAI (130ppm) with total extractable Fe.
203
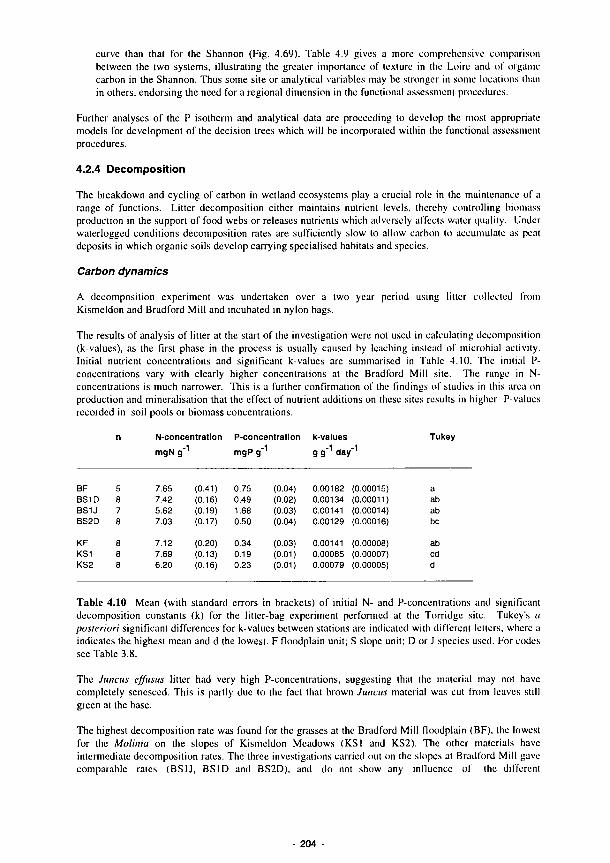
curve than that for the Shannon (Fig. 4.69). Table 4.9 gives a more comprehensive comparison between the two systems, illustrating the greater importance of texture in the Loire and of organic carbon in the Shannon. Thus some site or analytical variables may be stronger in some locations than in others, endorsing the need for a regional dimension in the functional assessment procedures.
Further analyses of the Ρ isotherm and analytical data are proceeding to develop the most appropriate models for development of the decision trees which will be incorporated within the functional assessment procedures.
4.2.4 Decomposition
The breakdown and cycling of carbon in wetland ecosystems play a crucial role in the maintenance of a range of functions. Litter decomposition either maintains nutrient levels, thereby controlling biomass production in the support of food webs or releases nutrients which adversely affects water quality. Under waterlogged conditions decomposition rates are sufficiently slow to allow carbon to accumulate as peal deposits in which organic soils develop carrying specialised habitats and species.
Carbon dynamics
A decomposition experiment was undertaken over a two year period using litter collected from Kismeldon and Bradford Mill and incubated in nylon bags.
The results of analysis of litter at the start of the investigation were not used in calculating decomposition (k-values), as the first phase in the process is usually caused by leaching inslead of microbial activity. Initial nutrient concentrations and significant k-valucs arc summarised in Table 4.10. The initial P-concentrations vary with clearly higher concentrations at the Bradford Mill site. The range in N-concentrations is much narrower. This is a further confirmation of the findings of studies in this area on production and mineralisation that the effect of nutrienl additions on these sites results in higher P-values recorded in soil pools or biomass concentrations.
BF BS1D BS1J BS2D
KF KS1 KS2
η
5 8 7 8
8 8 8
N-concentration
mgN g
7.65 7.42 5.62 7.03
7.12 7.69 6.20
(0.41) (0.16) (0.19) (0.17)
(0.20) (0.13) (0.16)
P-concentration
mgP g
0.75 0.49 1 68 0.50
0.34 0.19 0.23
(0.04) (0.02) (0.03) (0.04)
(0.03) (0.01) (0.01)
k-values
g g day
0.00182 (0.00015) 0.00134 (0.00011) 0.00141 (0.00014) 0.00129 (0.00016)
0.00141 (0.00008) 0.00085 (0.00007) 0.00079 (0.00005)
Tukey
a ab η b bc
ah cd d
Table 4.10 Mean (with standard errors in brackets) of initial N- and P-conccntralions and significant decomposition constants (k) for the litter-bag experiment performed at the Torridge site. Tukey's α posteriori significant differences for k-valucs between stations are indicated with different letters, where a indicates the highest mean and d the lowest. F floodplain unit; S slope unit; D or J species used. For codes see Table 3.8.
The Juncus effusus litter had very high P-concenlralions, suggesting that the material may not have completely senesced. This is partly due to the fact that brown Juncus material was cut from leaves still green at the base.
The highest decomposition rate was found for the grasses at the Bradford Mill floodplain (BF), the lowest for the Molinia on the slopes of Kismeldon Meadows (KSI and KS2). The other materials have intermediate decomposition rates. The three investigations carried out on the slopes at Bradford Mill gave comparable rates (BS1J, BS1D and BS2D), and do not show any influence of the different
- 204

0.0025
0.0020
k (g g· ' day1)
0.0005
R2=0.31 df = 50
• · A *
Λ *■■T. - - -Δ
Ο θ Τ 3Π
0 Π
1000
C/P ratio (gC g P ' )
0.0025 k (g g-
1 day
1)
0.0020 -
0.0015 -
0.0010
0.0005
"
-
-
τ
τ ~ ~ - τ - _
τ
J
Ι Ι
Α
• R-'=0.128 d.t. = 50
• ·Δ
Δ Α Α Δ Δ
- - - - fc
*>^Β D
ι ι ι ι ι ι ι
0 10 20 30 40 50 60 70 80 90 100 110 120
A BF
Δ KF
C/N ratio (gC gN')
• BS1D ▼ BS1J
ο KSI α KS2
Figure 4.70 Decomposition rates of litter incubated at different stations versus (A) initial C/P ratios or
(B) inital C/N ratios of incubated litter material. For codes to the stations see Table 3.8. Note the log x-
axis in (A).
205
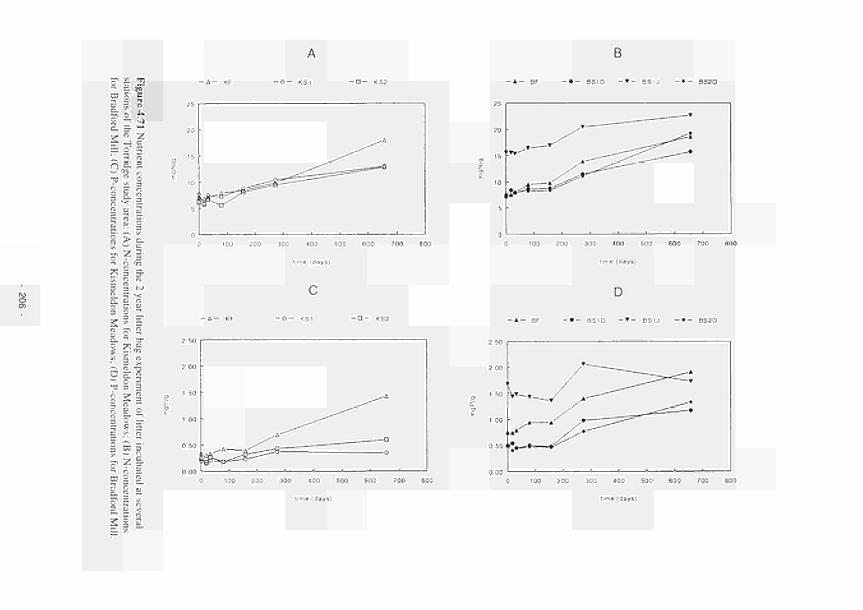
Β
Ε? δ ' = ca 5 «
s o *
BS1D » BS1J ♦ 6S2D
c 5· r. ¡ H f
' q S'
S B.' a . era _
3 " o
¡Is Γ
n S'
ί - Β "■ .— (Λ 100 200 300 400 500 600 700 800
time (days)
Q . pa O
rT f?, ca
BF · BS1D T BS1J — ♦ BS2D
c c
o — r.
~l
E/. Ξ
CL
3
¿
rjq
X
o
c
I i ?
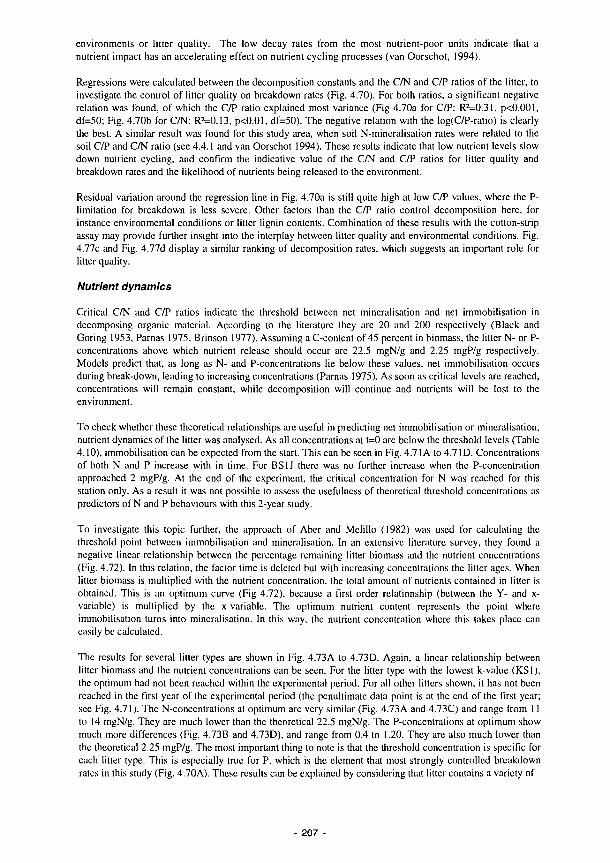
environments or litter quality. The low decay rates from the most nutrient-poor units indicate that a nutrient impact has an accelerating effect on nutrient cycling processes (van Oorschot, 1994).
Regressions were calculated between the decomposition constants and the C/N and C/P ratios of the litter, to investigate the control of litter quality on breakdown rates (Fig. 4.70). For both ratios, a significant negative relation was found, of which the C/P ratio explained most variance (Fig 4.70a for C/P: RMX31, p<0.001, df=50; Fig. 4.70b for C/N: RM).l3, p<0.01, df=50). The negative relation with the log(OP-ratio) is clearly the best. A similar result was found for this study area, when soil N-mineralisation rates were related to the soil C/P and C/N ratio (see 4.4.1 and van Oorschot 1994). These results indicate that low nutrient levels slow down nutrient cycling, and confirm the indicative value of the C/N and C/P ratios for litter quality and breakdown rates and the likelihood of nutrients being released to the environment.
Residual variation around the regression line in Fig. 4.70a is still quite high at low C/P values, where the P-limitation for breakdown is less severe. Other factors than the C/P ratio control decomposition here, for instance environmental conditions or litter lignin contents. Combination of these results with the cotton-strip assay may provide further insight into the interplay between litter quality and environmental conditions. Fig. 4.77c and Fig. 4.77d display a similar ranking of decomposition rates, which suggests an important role for litter quality.
Nutrient dynamics
Critical C/N and C/P ratios indicate the threshold between net mineralisation and net immobilisation in decomposing organic material. According to the literature they are 20 and 200 respectively (Black and Goring 1953, Parnas 1975, Brinson 1977). Assuming a C-content of 45 percent in biomass, the litter N- or P-concentrations above which nutrient release should occur arc 22.5 mgN/g and 2.25 mgP/g respectively. Models predict that, as long as N- and P-concentrations lie below these values, net immobilisation occurs during break-down, leading to increasing concentrations (Parnas 1975). As soon as critical levels are reached, concentrations will remain constant, while decomposition will continue and nutrients will be lost to the environment.
To check whether these theoretical relationships are useful in predicting net immobilisation or mineralisation, nutrient dynamics of the litter was analysed. As all concentrations at t=0 are below the threshold levels (Table 4.10), immobilisation can be expected from the start. This can be seen in Fig. 4.71A to 4.71D. Concentrations of both N and Ρ increase with in time. For BS1J there was no further increase when the P-concentration approached 2 mgP/g. At the end of the experiment, the critical concentralion for Ν was reached for this station only. As a result it was not possible to assess the usefulness of theoretical threshold concentrations as predictors of Ν and Ρ behaviours with this 2-ycar study.
To investigate this topic further, the approach of Aber and Melillo (1982) was used for calculating the threshold point between immobilisation and mineralisation. In an extensive literature survey, they found a negative linear relationship between the percentage remaining litter biomass and the nutrient concentrations (Fig. 4.72). In this relation, the factor time is deleted but with increasing concentrations the litter ages. When litter biomass is multiplied with the nutrient concentration, the total amount of nutrients contained in litter is obtained. This is an optimum curve (Fig 4.72), because a first order relationship (between the Y- and x-variable) is multiplied by the x-variable. The optimum nutrient content represents the point where immobilisation turns into mineralisation. In this way, the nutrient concentration where this lakes place can easily be calculated.
The results for several litter types are shown in Fig. 4.73A to 4.73D. Again, a linear relationship between litter biomass and the nutrient concentrations can be seen. For the litter type with the lowest k-value (KS1), the optimum had not been reached within the experimental period. For all other litters shown, it has not been reached in the first year of the experimental period (the penultimate data point is at the end of the first year; see Fig. 4.71). The N-concentrations at optimum are very similar (Fig. 4.73A and 4.73C) and range from 11 to 14 mgN/g. They are much lower than the theoretical 22.5 mgN/g. The P-concentrations at optimum show much more differences (Fig. 4.73B and 4.73D), and range from 0.4 to 1.20. They are also much lower than the theoretical 2.25 mgP/g. The most important thing to note is that the threshold concentration is specific for each litter type. This is especially true for P, which is the element that most strongly controlled breakdown rates in this study (Fig. 4.70A). These results can be explained by considering that litter contains a variety of
207 -
150
100
50
TOTAL-N
LITTER
\ > _i iL .
10 15
mgN/g
20 25
Figure 4.72 Theoretical relationship between remaining biomass c.q. nutrients and litter nutrient concentrations, according to Aber and Melillo (1982). The negative linear relationship for biomass. multiplied with the N-concentration (.t-variablc) results in the quadratic relationship for total nutrient content.

Β
b(l
uu
50
o
A r ¿ ^
O
or __Í>
^ / Δ
S < Î
o \ KSI
KF
10 15 20 25
mgN/g
2bu
200
150
50
o
o ƒ
" MP * V ^ '
o
KSI KF
ι 1 1
0 00 0.50 1.00 1.50 2 00 2.50
D
50
OU
5C \ ^ ♦ BS2
BF
'¿bu
200
150
100
50
i <r—^>
BS2
A
*BF1
0.00 0 50 1.00 1.50 2.00
mgP/g
Figure 4.73 Remaining biomass and total nutrient content versus litter nutrient concentrations: (A) Nrelationships for Kismeldon Meadows; (B) Nrelationships for Bradford Mill;
(C) Prelationships for Kismeldon Meadows; (D) Prelationships for Bradford Mill.

Compounds, of differing nutrient concentration and breakdown rate. Because of this, one single C/N or C/P ratio is too imprecise, as it neglects the heterogeneity of the different materials involved.
Summary Decomposition proceeded slower on the non-impacted slopes of Kismeldon Meadows than on the Bradford Mill floodplain, where k-values were more lhan twice as high. The other stations were intermediate. This suggests that low nutrient levels reduced the rates of nutrient cycling. Decomposition rates were negatively related to the initial C/P ratios of the litter. Thus, the decomposition rates are clearly related to nutrienl availability, which influences initial litter quality.
The literature values for critical concentrations (e.g. 20 and 200 for C/N and C/P, respectively), which indicate whether net mineralisation or immobilisation will occur were not in line with the findings of this study. General threshold values can, therefore, not be given and this is thought to be related to the heterogeneity of plant litter composition. Litter with initial C/P and C/N ratios up to 1500 and 60 respectively, did not lose nutrients to the environment within one year. Material with higher initial C/P and C/N ratios did not release nutrients during the two years lhe experiment lasted. The use of these ratios offers possibilities for predicting nutrient immobilisation, an important liner function.
Cotton strip assays at the target sites
The cotton strip assay has been used to estimate cellulose decomposition in a wide range of weiland environments (Maltby, 1988). The technique has several advantages such as its simplicity, requirement for little specialised equipment or complex field training, ease of replication as many strips can be set up at one time, and lack of need for continuous monitoring.
Strips were set out on a seasonal basis at all stations along transects at each of the sites, wilh WERG being responsible for the tensile strength testing and calculation of all results, except those from the Spanish data. The salient, preliminary results are summarised here.
Variations with soil profile depth Decomposition rates are generally higher in the upper part of the soil as might be expected from the usual distribution patterns of micro-organisms, nutrients and easily available organic substrates, and level of aeration. Nevertheless the gradient with depth varies significantly among sites and seasons (Fig. 4.74 for KISM3). Thus, al KISM3 whilst there are prominent surface peaks in activity in summer, this is much reduced in spring and autumn and is absent completely in winter. At other sites such as Apremont and Little Brosna inversions of this general pattern have been attributed to warmer soil temperatures at depili. Some inversion of this general pattern is also seen in some of the warmer soil températures at depth. Some inversion of the general pattern is also seen in some of the Guadiana sites, where the samples from the upper part of the profile do not always exhibit the highest rales of decomposition. Total inversion is not seen - i.e. the lowest depth having highest CTSL rate - but surface rates appear to be occasionally depressed. This effect is most evident in Spring and Summer and is probably attributable to desiccation of the upper soil profile and possible cementation by soluble salts, such as calcium carbonate and gypsum. The seasonal effect is more pronounced at El Masegar than at Molino del Abogado. This is likely to be a result of the drier overall conditions at the latter, which prevent impregnation of the strips wilh salts and will depress the within-season variation.
Overall comparison between floodplain sites Mean average values for the top three depths of cotton strip, encompassing 0-8cm, show some seasonal trends in decomposition rate (Table 4.11). Winter rates vary between 0.26% loss of tensile strength per day (CTSL) at KISM5 to 1.48% CTSL at Little Brosna. This order of magnitude difference almost certainly reflects the more oceanic conditions of Ireland, which result in a generally milder winter climate. Within-sitc variation is not significant statistically at Kismeldon and Bradford Mill, nor at Apremont and Decize, but there are significant differences among the Clonmacnoise and Little Brosna stations. The Spanish sites differ quite widely in average winter rates, with a range of 0.008 - 0.245% loss per day at El Masegar and 0.437 - 1.239% loss at Molino del Abogado. This reflects the overall depression of cotton strip decomposition rates at El Masegar, which is the less arid of the two sites and suffers more from cementation.
- 210
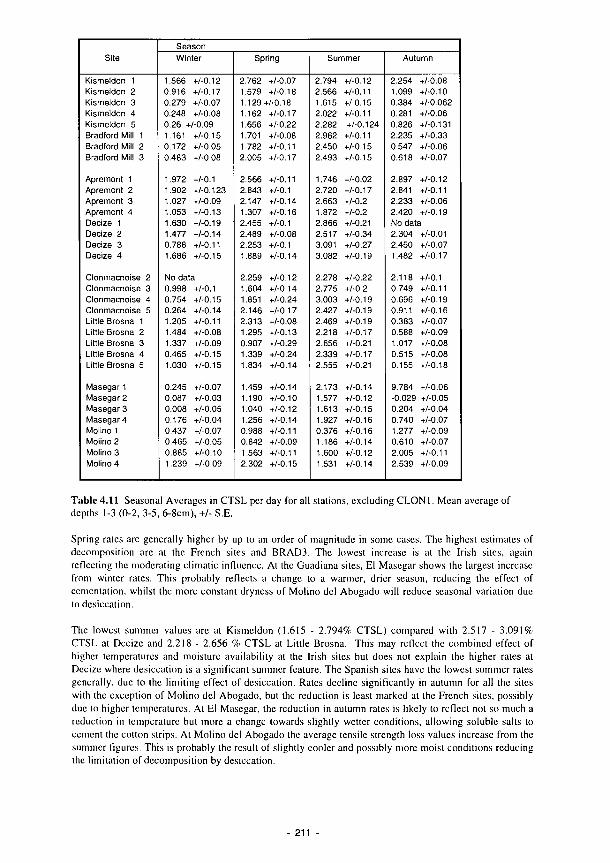
Site
Kismeldon 1 Kismeldon 2 Kismeldon 3 Kismeldon 4 Kismeldon 5 Bradford Mill 1 Bradford Mill 2 Bradford Mill 3
Apremont 1 Apremont 2 Apremont 3 Apremont 4 Decize 1 Decize 2 Decize 3 Decize 4
Clonmacnoise 2 Clonmacnoise 3 Clonmacnoise 4 Clonmacnoise 5 Little Brosna 1 Little Brosna 2 Little Brosna 3 Little Brosna 4 Little Brosna 5
Masegar1 Masegar 2 Masegar 3 Masegar 4 Molino 1 Molino 2 Molino 3 Molino 4
Season Winter
1.566 0.916 0.279 0.248
+/-0.12 +/-0.17 +/-0.07 +/-0.08
0.26 +/-0.09 1.161 0.172 0.483
1.972 1.902 1.027 1.053 1.630 1.477 0.788 1.686
+/-0.15 +/-0.05 +/-0.08
+/-0.1 +/-0.123 +/-0.09 +/-0.13 +/-0.19 +/-0.14 +/-0.11 +/-0.15
No data 0.998 0.754 0.264 1.205 1.484 1.337 0.465 1.030
0.245 0.087 0.008 0.176 0.437 0.465 0.885 1.239
+/-0.1 +/-0.15 +/-0.14 +/-0.11 +/-0.08 +/-0.09 +/-0.15 +/-0.15
+/-0.07 +/-0.03 +/-0.05 +/-0.04 +/-0.07 +/-0.05 +/-0.10 +/-0.09
Spring
2.762 1.579
+/-0.07 +/-0.18
1.129+/-0.18 1.162 1.656 1.701 1.782 2.005
2.566 2.843 2.147 1.307 2.455 2.489 2.253 1.889
2.259 1.604 1.851 2.146 2.313 1.295 0.907 1.339 1.834
1.459 1.190 1.040 1.256 0.988 0.842 1.563 2.302
+/-0.17 +/-0.22 +/-0.08 +/-0.11 +/-0.17
+/-0.11 +/-0.1 +/-0.14 +/-0.16 +/-0.1 +/-0.08 +/-0.1 +/-0.14
+/-0.12 +/-0.14 +/-0.24 +/-0.17 +/-0.08 +/-0.13 +/-0.29 +/-0.24 +/-0.14
+/-0.14 +/-0.10 +/-0.12 +/-0.14 +/-0.11 +/-0.09 +/-0.11 +/-0.15
Summer
2.794 2.566 1.615 2.022 2.282 2.962 2.450 2.493
1.746 2.720 2.663 1.872 2.866 2.517 3.091 3.082
2.278 2.775 3.003 2.427 2.469 2.218 2.656 2.339 2.555
2.173 1.577 1.613 1.927 0.376 1.186 1.600 1.531
+/-0.12 +/-0.11 +/-0.15 +/-0.11 +/-0.124 +/-0.11 +/-0.15 +/-0.15
+/-0.02 +/-0.17 +/-0.2 +/-0.2 +/-0.21 +/-0.34 +/-0.27 +/-0.19
+/-0.22 +/-0.2 +/-0.19 +/-0.19 +/-0.19 +/-0.17 +/-0.21 +/-0.17 +/-0.21
+/-0.14 +/-0.12 +/-0.15 +/-0.16 +/-0.16 +/-0.14 +/-0.12 +/-0.14
Autumn
2.254 1.099 0.384 0.281 0.826 2.235 0.547 0.618
2.897 2.841 2.233 2.420
+/-0.08 +/-0.10 +/-0.062 +/-0.06 +/-0.131 +/-0.33 +/-0.06 +/-0.07
+/-0.12 +/-0.11 +/-0.06 +/-0.19
No data 2.304 2.450 1.482
2.118 0.749 0.696 0.911 0.383 0.588 1.017 0.515 0.155
9.784 -0.029 0.204 0.740 1.277 0.610 2.005 2.539
+/-0.01 +/-0.07 +/-0.17
+/-0.1 +/-0.11 +/-0.19 +/-0.16 +/-0.07 +/-0.09 +/-0.08 +/-0.08 +/-0.18
+/-0.06 +/-0.05 +/-0.04 +/-0.07 +/-0.09 +/-0.07 +/-0.11 +/-0.09
Table 4.11 Seasonal Averages in CTSL per day for all stations, excluding CLONI. Mean average of depths 1-3 (0-2, 3-5, 6-8cm), +/- S.E.
Spring rates are generally higher by up to an order of magnitude in some cases. The highest estimates of decomposition are at the French sites and BRAD3. The lowest increase is at the Irish sites, again reflecting the moderating climatic influence. At the Guadiana sites, El Masegar shows the largest increase from winter rates. This probably reflects a change to a warmer, drier season, reducing the effect of cementation, whilst the more constant dryness of Molino del Abogado will reduce seasonal variation due to desiccation.
The lowest summer values are at Kismeldon (1.615 - 2.794% CTSL) compared with 2.517 - 3.091% CTSL at Decize and 2.218 - 2.656 % CTSL at Little Brosna. This may reflect the combined effect of higher temperatures and moisture availability at the Irish sites but does not explain the higher rates at Decize where desiccation is a significant summer feature. The Spanish siles have the lowest summer rates generally, due to the limiting effect of desiccation. Rates decline significantly in autumn for all the sites with the exception of' Molino del Abogado, but the reduction is least marked at the French sites, possibly due to higher temperatures. At El Masegar, the reduction in autumn rates is likely to reflect not so much a reduction in temperature but more a change towards slightly wetter conditions, allowing soluble salts to cement the cotton strips. At Molino del Abogado the average tensile strength loss values increase from the summer figures. This is probably the result of slightly cooler and possibly more moist conditions reducing the limitation of decomposition by desiccation.
211
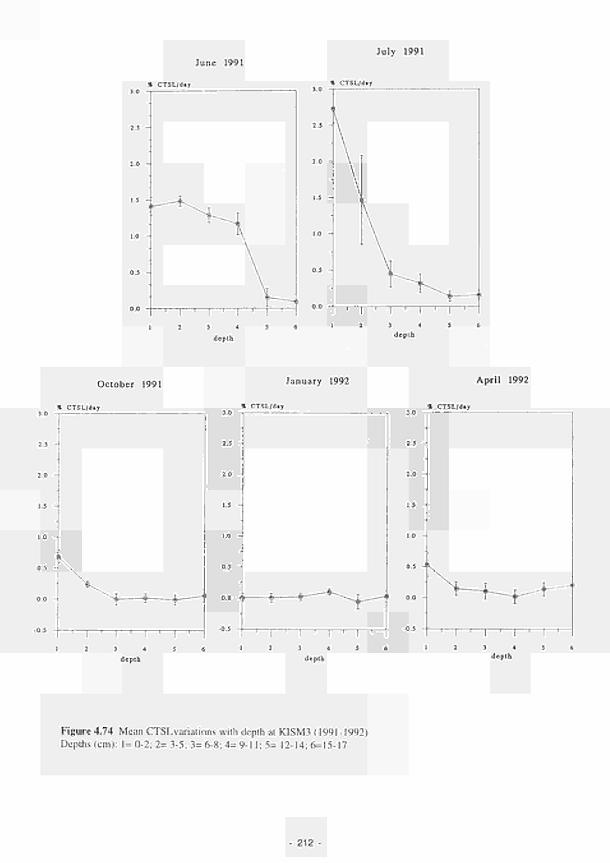
June 1991 July 1991
* CTSL/a«7
depth depth
October 1991
* CTSL/d.y
January 1992
* CTSL/d«y
April 1992
* CTSL/d· /
depth depth depth
Figure 4.74 Mean CTSLvariations with depth at KISM3 ( 1991 -1992) Depths (cm): 1=0-2; 2= 3-5; 3= 6-8; 4= 9-11; 5= 12-14; 6=15-17
212
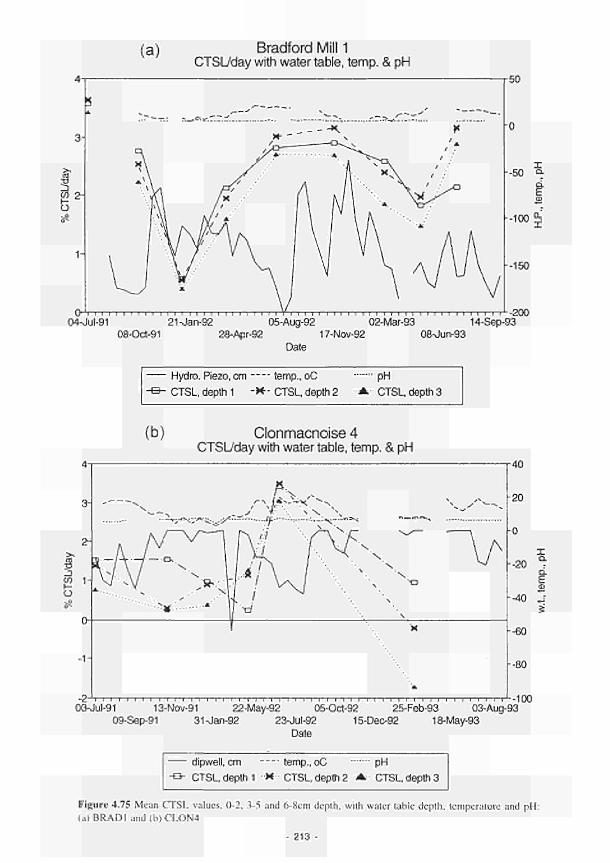
(a) Bradford Mill 1 CTSL/day with water table, temp. & pH
50
04JUI91 21Jan92 05Aug92 02Mar93 14Sep93 08Oct91 28Apr92 17Nov92 08^Jun93
Date
Hydro. Piezo, cm temp., oC pH
CTSL, depth 1 * · CTSL, depth 2 ■■■*■■■ CTSL, depth 3
(b) Clonmacnoise 4 CTSL/day with water table, temp. & pH
3
-V^S"" -ψ- v»·^— Λ — « * » ^
■2 I I 1~TT I 1 I ' l l I I I T I T I — I 1 ι ι ι—π—Γ"ΤΓ ι ι—ι τ ι ι—> I τ ι ι—ΓΤ
40
20
03JUI91 13NOV91 22May92 05Oct92 25Feb93 03Aug93 OgSep91 31Jan92 23Jul92 15Dec92 18May93
Date
100
dipwell, cm temp., oC pH
a CTSL, depth 1 X CTSL, depth 2 A. CTSL, depth 3
Figure 4.75 Mean CTSL values, 02, 35 and 68cm depth, with water table depth, temperature and pH:
(a) BRADI and (b) CLON4
213
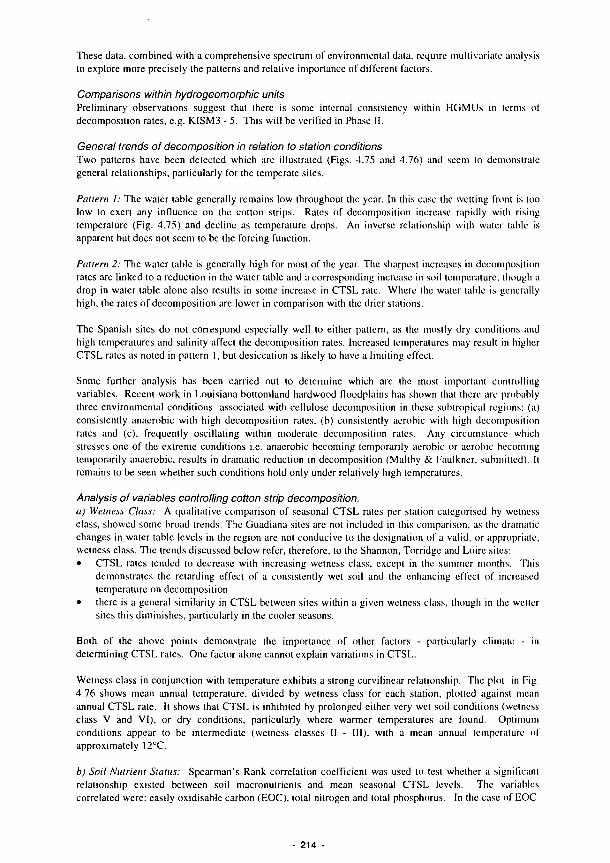
These data, combined with a comprehensive spectrum of environmental data, require multivariate analysis to explore more precisely the patterns and relative importance of different factors.
Comparisons within hydrogeomorphic units Preliminary observations suggest that there is some internal consistency within HGMUs in terms of decomposition rates, e.g. KISM3 - 5. This will be verified in Phase II.
General trends of decomposition in relation to station conditions Two patterns have been detected which are illustrated (Figs. 4.75 and 4.76) and seem to demonstrate general relationships, particularly for the temperate sites.
Pattern I: The water table generally remains low throughout the year. In this case the wetting front is too low to exert any influence on the cotton strips. Rates of decomposition increase rapidly with rising temperature (Fig. 4.75) and decline as temperature drops. An inverse relationship with water tabic is apparent but does not seem to be the forcing function.
Pattern 2: The water table is generally high for most of the year. The sharpest increases in decomposition rates are linked to a reduction in the water table and a corresponding increase in soil temperature, though a drop in water table alone also results in some increase in CTSL rate. Where the water tabic is generally high, the rates of decomposition are lower in comparison with the drier stations.
The Spanish sites do not correspond especially well to either pattern, as the mostly dry conditions and high temperatures and salinity affect the decomposition rales. Increased temperatures may result in higher CTSL rates as noted in pattern 1, but desiccation is likely to have a limiting effect.
Some further analysis has been carried out to determine which are the most important controlling variables. Recent work in Louisiana bottomland hardwood floodplains has shown that there are probably three environmental conditions associated with cellulose decomposition in ihese subtropical regions: (a) consistently anaerobic with high decomposition rates, (b) consistently aerobic with high decomposition rales and (c), frequently oscillating within moderate decomposition rates. Any circumstance which stresses one of the extreme conditions i.e. anaerobic becoming temporarily aerobic or aerobic becoming temporarily anaerobic, results in dramatic reduction in decomposition (Maltby & Faulkner, submitted). It remains to be seen whether such conditions hold only under relatively high temperatures.
Analysis of variables controlling cotton strip decomposition. a) Wetness Class: A qualitative comparison of seasonal CTSL rates per station categorised by wetness class, showed some broad trends. The Guadiana sites are not included in this comparison, as the dramatic changes in water table levels in the region arc not conducive to the designation of a valid, or appropriale, wetness class. The trends discussed below refer, therefore, to the Shannon, Torridge and Loire siles: • CTSL rales tended (o decrease with increasing wetness class, except in lhe summer months. This
demonstrates the retarding effect of a consistently wet soil and the enhancing effect of increased temperature on decomposition
• there is a general similarity in CTSL between sites within a given wetness class, though in the weller sites this diminishes, particularly in the cooler seasons.
Both of the above points demonstrate the importance of other factors - particularly climate - in determining CTSL rates. One factor alone cannot explain variations in CTSL.
Wetness class in conjunction with temperature exhibits a strong curvilinear relationship. The plot in Fig. 4.76 shows mean annual temperature, divided by wetness class for each station, plotted against mean annual CTSL rate. It shows that CTSL is inhibited by prolonged either very wcl soil conditions (wetness class V and VI), or dry conditions, particularly where warmer températures are found. Optimum conditions appear to be intermediate (wetness classes II - III), with a mean annual temperature of approximately 12°C.
b) Soil Nutrient Status: Spearman's Rank correlation coefficient was used to lest whether a significam relationship existed between soil macronutrients and mean seasonal CTSL levels. The variables correlated were: easily oxidisable carbon (EOC), total nitrogen and total phosphorus. In the case of EOC
214 -

Mean CTSL/day vs. temp./wetness class Mean CTSL with mean temp/wet. class
6 8 10 Mean annual Temperature/wetness class
Figure 4.76 Mean CTSL plotted against mean annual temperature/wetness class. Plotted points given as wetness class.
- 215 -
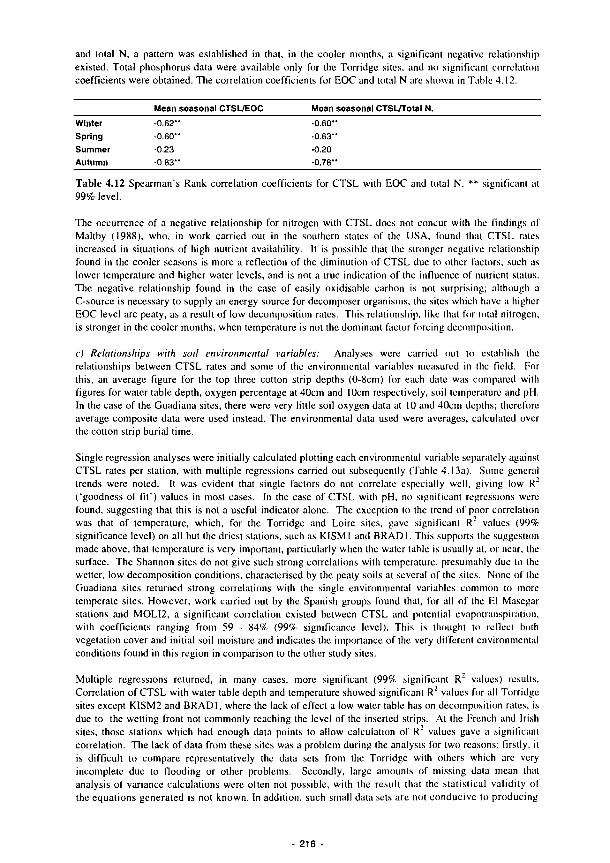
Winter Spring Summer Autumn
-0.62" -0 .60" -0.23 -0.83"
and total N, a pattern was established in that, in lhe cooler months, a significant negative relationship existed. Total phosphorus data were available only for the Torridge sites, and no significant correlation coefficients were obtained. The correlation coefficients for EOC and total N are shown in Table 4.12.
Mean seasonal CTSL/EOC Mean seasonal CTSL/Total N. -0.60" -0.63" -0.20 -0.78"
Table 4.12 Spearman's Rank correlation coefficients for CTSL with EOC and total N. ** significant at 99% level.
The occurrence of a negative relationship for nitrogen with CTSL does not concur with the findings of Maltby (1988), who, in work carried out in the southern states of' the USA, found that CTSL rates increased in situations of high nutrienl availability. It is possible that the stronger negative relationship found in the cooler seasons is more a reflection of the diminution of CTSL due to other factors, such as lower temperature and higher water levels, and is not a true indication of the influence of' nutrient status. The negative relationship found in the case of easily oxidisable carbon is not surprising; although a C-source is necessary to supply an energy source for decomposer organisms, the sites which have a higher EOC level are peaty, as a result of low decomposition rates. This relationship, like Ihat for total nitrogen, is stronger in the cooler months, when temperature is not the dominant factor forcing decomposition.
c) Relationships with soil environmental variables: Analyses were carried out to establish the relationships between CTSL rates and some of the environmental variables measured in the field. For this, an average figure for the top three cotton strip depths (0-8cm) for each date was compared with figures for water table depth, oxygen percentage at 40cm and 10cm respectively, soil lemperalure and pH. In the case of the Guadiana sites, there were very little soil oxygen data at 10 and 40cm depths; therefore average composite data were used instead. The environmental data used were averages, calculated over the cotton strip burial time.
Single regression analyses were initially calculated plotting each environmental variable separately against CTSL rales per station, with multiple regressions carried out subsequently (Table 4.13a). Some general trends were noted. It was evident that single factors do not correlate especially well, giving low R" ('goodness of fit') values in most cases. In the case of CTSL with pH, no significant regressions were found, suggesting that this is not a useful indicator alone. The exception lo lhe trend of poor correlation was that of temperature, which, for the Torridge and Loire sites, gave significant R" values (99% significance level) on all but the driest stations, such as KISMI and BRADI. This supports the suggestion made above, that temperature is very important, particularly when the waler table is usually at, or near, lhe surface. The Shannon sites do not give such strong correlations with temperature, presumably due lo the wetter, low decomposition conditions, characterised by the peaty soils at several of the sites. None of the Guadiana sites returned strong correlations with the single environmental variables common to more temperate sites. However, work carried out by the Spanish groups found that, for all of the El Masegar stations and MOLI2, a significant correlation existed between CTSL and potential cvapotranspiralion, with coefficients ranging from 59 - 84% (99% significance level). This is thought to reflect bolli vegetation cover and initial soil moisture and indicates the importance of the very different environmental conditions found in this region in comparison to the other study sites.
Multiple regressions returned, in many cases, more significant (99%J significant R values) results. Correlation of CTSL with water table depth and temperature showed significant R' values for all Torridge siles except KISM2 and BRADI, where the lack of effect a low water table has on decomposition rates, is due to the wetting front not commonly reaching the level of the inserted strips. At the French and Irish siles, those stations which had enough data points to allow calculation of R" values gave a significan! correlation. The lack of data from these sites was a problem during the analysis for two reasons: firstly, it is difficult to compare representatively the data sets from the Torridge with others which are very incomplete due to flooding or other problems. Secondly, large amounts of missing dala mean thai analysis of variance calculations were often not possible, with the result that the statistical validity of the equations generaled is not known. In addition, such small data sets arc not conducive to producing
216
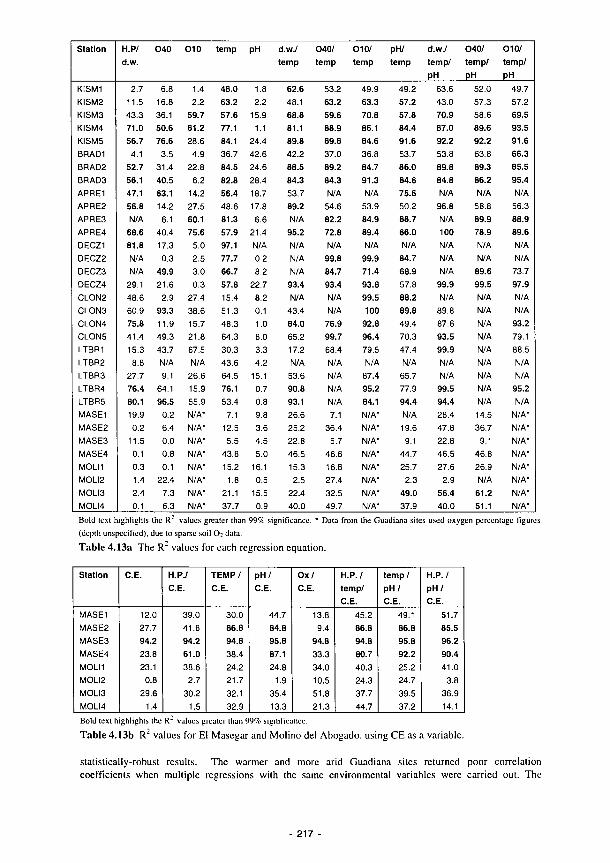
Station
KISM1 KISM2 KISM3 KISM4 KISM5 BRADI BRAD2 BRAD3 APRE1 APRE2 APRE3 APRE4 DECZ1 DECZ2 DECZ3 DECZ4 CLON2 CLON3 CLON4 CLON5 LTBR1 LTBR2 LTBR3 LTBR4 LTBR5 MASE1 MASE2 MASE3 MASE4 MOLI1 MOLI2 MOLI3 MOLI4
H.P/ d.w.
2.7 11.5 43.3 71.0 56.7
4.1
52.7 56.1 47.1 56.8 N/A
68.6 81.8 N/A N/A
29.1
48.6 60.9 75.8 41.4 15.3
8.8 27.7 76.4 80.1 19.9 0.2
11.5 0.1 0.3 1.4 2.4 0.1
O40
6.8 16.8 36.1 50.6 76.6
3.5 31.4 40.5 63.1 14.2 6.1
40.4
17.3 0.3
49.9
21.6 2.9
93.3 11.9 49.3 43.7 N/A 9.1
64.1 96.5
0.2 6.4
0.0 0.8 0.1
22.4 7.3 6.3
010
1.4 2.2
59.7 81.2 28.6
4.9
22.8 6.2
14.2 27.5 60.1 75.6
5.0 2.5 3.0 0.3
27.4
38.6 15.7 21.8 67.5 N/A
26.6 15.9 55.9 N/A-
N/A-
N/A-
N/A-
N/A* N/A' N/A· N/A"
temp
48.0 63.2 57.6 77.1 84.1 36.7 84.5 82.8 56.4 48.6 81.3 57.9 97.1 77.7
66.7 57.8 15.4
51.3 48.3 64.3 30.3 43.6 64.5 76.1 53.4
7.1 12.5
5.5 43.8 15.2
1.8 21.1 37.7
pH
1.8 2.2
15.9 1.1
24.4 42.6 24.6 28.4 18.7
17.8 6.6
21.4 N/A 0.2 8.2
22.7 8.2 0.1 1.0 8.0 3.3 4.2
15.1 0.7
0.8 9.8 3.6 4.5 5.0
16.1 0.5
15.5 0.9
d.w./ temp
62.6 48.1 68.8 81.1 89.8 42.2 88.5 84.3 53.7 89.2 N/A
95.2 N/A N/A N/A
93.4 N/A
43.4 84.0 65.2 17.2 N/A
53.6 90.8 93.1
26.6 25.2 22.8 46.5 15.3 2.5
22.4 40.0
040/ temp
53.2 63.2
59.6 88.9 89.8 37.0 89.2 84.3 N/A
54.6 82.2 72.8 N/A
99.8 84.7 93.4 N/A N/A
76.9 99.7 68.4 N/A N/A N/A N/A 7.1
36.4 5.7
46.6 16.8 27.4 32.5 49.7
010/ temp
49.9 63.3 70.8 86.1 84.6 36.8
84.7 91.3 N/A
53.9 84.9 89.4 N/A
99.9 71.4 93.8 99.5 100
92.8 96.4 79.5 N/A
87.4 95.2 84.1 N/A" N/A-
N/A-
N/A" N/A* N/A' N/A-
N/A'
pH/ temp
49.2 57.2 57.8 84.4 91.6 53.7
86.0 84.6 75.6 50.2 88.7 66.0 N/A
84.7 68.9 57.8 88.2 89.8
49.4 70.3 47.4 N/A
65.7 77.9 94.4 N/A 19.6 9.1
44.7 25.7
2.3 49.0 37.9
d.w./ temp/
PH 63.6 43.0 70.9 87.0 92.2 53.8 89.8 84.8 N/A
96.8 N/A 100 N/A N/A N/A
99.9 N/A
89.8
87.6 93.5 99.9 N/A N/A
99.5 94.4 28.4 47.8 22.8 46.5 27.6
2.9 56.4 40.0
040/ temp/ pH
52.0 57.3 58.6 89.6 92.2 63.8 89.3 86.2 N/A
58.8 89.9 78.9 N/A N/A
89.6 99.5 N/A N/A N/A N/A N/A N/A N/A N/A N/A 14.5 36.7
9.1
46.8 26.9 N/A
61.2 51.1
010/ temp/ pH
49.7 57.2 69.5 93.5 91.6 66.3 85.5 95.4 N/A
56.3 88.9 89.6 N/A N/A
73.7 97.9 N/A N/A
93.2 79.1 88.5 N/A N/A
95.2 N/A
N/A' N/AN/AN/A· N/A' N/A* N/A" N/A"
Bold text highlights the R" values greater than 99% significance. * Data from the Guadiana sites used oxygen percentage figures (depth unspecified), due to sparse soil OT data. Table 4.13a The R~ values for each regression equation.
Station
MASE1 MASE2 MASE3 MASE4
MOLI1 MOLI2 MOLI3 MOLI4
C E .
12.0 27.7 94.2 23.8 23.1
0.8
29.6 1.4
H.P./ C E .
39.0 41.8 94.2 61.0 38.6
2.7
30.2 1.5
T E M P / C E .
30.0 86.8 94.8 38.4 24.2 21.7
32.1 32.9
p H / C E .
44.7 84.8 95.8 87.1 24.8
1.9 35.4
13.3
O x / C E .
13.8 9.4
94.8 33.3 34.0 10.5 51.8 21.3
H.P.I tempi C E .
45.2 86.8 94.8 80.7 40.3 24.3 37.7
44.7
temp/ p H / C E .
49.1 86.8 95.8 92.2 25.2 24.7
39.5 37.2
H.P./ p H / C E .
51.7 85.5 96.2 90.4 41.0
3.8 36.9 14.1
Bold text highlights the R" values greater Ihan 99% significance. Table 4.13b R" values for EI Masegar and Molino del Abogado, using CE as a variable.
statistically-robust results. The warmer and more arid Guadiana sites returned poor correlation coefficients when multiple regressions with the same environmental variables were carried out. The
217

introduction of salinity (CE) as a variable, however, resulted in some stronger correlations. The El Masegar stations produces several strong regression coefficients when CE was used as one of two or three variables (Table 4.13b). This reinforces the suggestion made earlier that cementation of the cotton strips by soluble salts is more important at this slightly wetter site.
Correlation of CTSL against oxygen percentage and temperature gave similar results, in that the R" values were quite significant, with the exception of lhe drier Torridge sites and the near-river, frequently flooded stations of the French and Irish sites. In terms of' the drier stations, this again reflects the lack of influence of the water table upon the cotton strips, whilst on the wetter sites, it may reflect a lack of oxygen dala, due to waterlogging.
Where three variables were regressed against CTSL, lhe fit of the equation (in terms of R") was mainly very good, where there were sufficient data to support calculation of analysis of variance. Correlating water table depth, temperature and pH with CTSL gave acceptable R" values (when enough data existed) for all sites except KISM2. However, some values in the equations generaled were very high, possibly giving rise to some doubt as lo their validity, with the small data sel being considered. Oxygen percentages, temperature and pH were also regressed against CTSL, with 0% at 40cm giving the best overall fit (R") of the two oxygen cup depths. In terms of the regression coefficient (R~), the correlation of water table, temperature and pH with CTSL appears to give the best overall relationship. Only two of the Guadiana sites gave correlation coefficients of greater than 99% significance wilh these two sets of three variables. The correlation of CTSL with water table, pH and CE data from the Spanish sites relumed correlation coefficients of over 99% for all the El Masegar slations, whilst the Molino del Abogado stations strongest correlation was that of CTSL wilh water table, temperature and CE. This suggests that temperature may have slightly more influence upon CTSL at the drier Molino stations, where cementation by soluble salts is unlikely to occur.
The equations generated from the regression analysis did not show any trends of similarity across the stations and sites. For each potential relationship tested, there were some similarities between equations for certain sites, but there was no uniform pattern to this. Hence it was not possible to form an overall equation for the prediction of' CTSL rates for use in a functional assessment package from the work thus far. Separation of lhe data sets into wetness classes also showed little similarity or pallcrn bclween the equations and no trends across the climatic gradient were evident. The lack of strong correlation between the data from the Guadiana sites, in comparison with the more temperate sites, suggests that different parameters are important.
As a consequence, the data from each station from the Shannon, Torridge and Loire were merged, to allow regression analysis of the data set as a whole. This did not produce any significant correlations, wilh lhe data spread across a broad band, giving poor R" values and reinforces the suggestion that an overall equation to predict CTSL cannot be easily formulated.
Overall analysis Broad patterns in CTSL variation are shown in Fig.4.77a to h, which superimposes mean seasonal and annual CTSL rates, mean seasonal and annual temperature wetness class and mean pH for each station on cross sectional maps of the sites.
The Torridge sites show an general cyclical pattern of CTSL with rates increasing from winter to summer and decreasing again in the autumn. At Kismeldon, the driest site, KISM1, has the highest CTSL rates. Here, the soil temperature is much the same as the other stations, but the soil is rarely wcl and lhe pH is >5.0. On the welter sites, CTSL is much reduced by comparison, wilh autumn decomposition levels being more similar to winter than spring. The CTSL rate is noticeably greater for spring, summer and autumn al KISM5 in comparison to KISM3 and 4, with a higher annual average than either of these. The summer autumn and winter temperatures are slightly lower here than al KISM3 or 4, but the pH is higher and this may partially account for the difference - although this obviously does not lake inlo account all of the possible factors.
At Bradford Mill, spring and summer CTSL rates are slightly higher than those at Kismeldon. Soil temperature levels are also slightly higher than at Kismeldon and this probably accounls for most of the
218
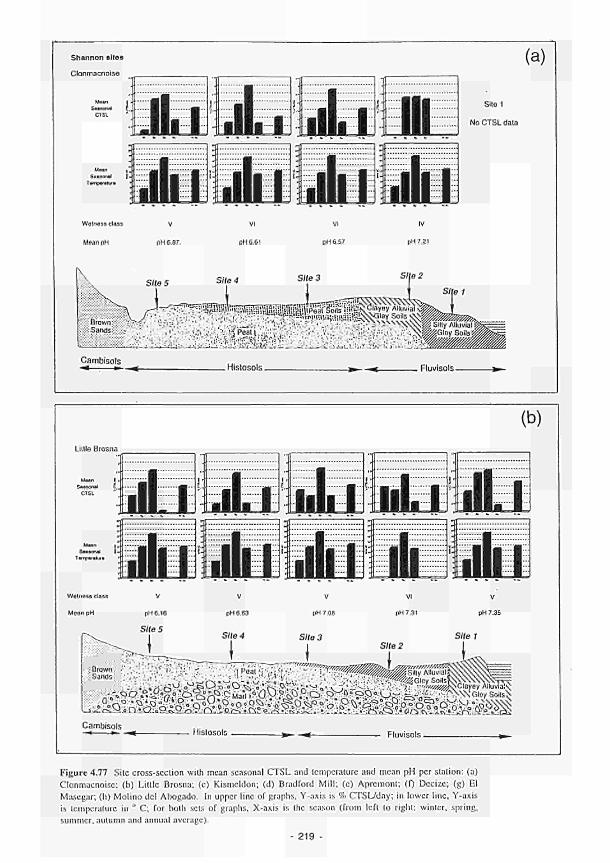
Shannon sites
Clonmacnoise
(a)
Sile 1
No CTSL data
SMionaí j .
TampMatur·
Wetness class
Mean pH
ili ι .ili ι .ili ι .ili ι VI
pH6.6t
VI
pH 6.57
IV
PH7.21
Site 2
xxi: Brown Χ χ ; / ' ^ ^ 'Sandsííí;:;í'
SIteS Site 4 Site 3
, iV: '. .•1.'rr!!aiVMq:.Hii!!!!ii:!:ifee>5CjGleir Soils \ N \ ■ ■ c , f ' : ' · ' · ' ' ! ' " . . . . . ^ : . ' * . " ' ' ' . X N " S V ^ \ S \ \
Sitel
Silly Alluvial i "Gloy Sollst m.?zs?m< .· : ■ <■','·■·■·*.'">'.;■..··<■.'"'¡iPea|i.;i··t,,;';··'·'·'■■.' ■..ϊ·.:··:'ν·ΐ>ι-·.'.ί-!·';ΐ.·.-'-;·:·.'^>^^βΐο/
Cambisols . Hislosols. . Fluvisols-
(b) Lillle Brosna
ill ι .il. ι 1.1. ι ni. ι ill, ι iiluijlu áiljIÜMlii
Wetness class
pH6.16
Site 5
pH 6.63
Site 4 Site 3
" Brown
i: Sands:
S/le 2
i S/'ie I
=·::"? '
;ov
;> ^^r^-r^m^mm
'■ ' . '■ ...', ü a r t > i r s · · > . . ~ ~ v . '. . . · ' i '--:fm
Cambisols Hislosols . Fluvisols.
Figure 4.77 Site crossscclion wilh mean seasonal CTSL and temperature and mean pH per station: (a)
Clonmacnoise; (b) Little Brosna; (c) Kismeldon; (d) Bradford Mill; (c) Apremont; (0 Decize; (g) El
Masegar; (h) Molino dcl Abogado. In upper line of graphs, Yaxis is % CTSL/day; in lower line, Yaxis
is temperature in ° C; for bolli sels of graphs, Xaxis is lhe season (from lefl lo righi: winter, spring,
summer, aulumn and annual average).
219

Torridge Siles
Kismeldon Meadows.
(c)
lilis ■Ha .■I. ι ιΠΐ Ι SMtontf Ι
Welness class
Mean pH
WíBàÃmÊÈm 1
Poorly I ^^Wel l ^
Drained ^ Drained
Silty So l ls t Silly Soils ij
Stony Drift over Sandstones and Shales
> <—Fluv iso ls >
^ < River Alluvium ^ "
(d) Bradlord Mill
Cambisols ■>*- <Fluvisols>
Stony Drift over Sandstones and Shales ^ < River Alluvium ^
220

Loire Sites
Apremont
(e)
dli IIIlliuti liliül SMUTMI I
Welnoss class
Mean pH
.ài Jiijlu Mill II
PH7.06
Site 3 Site 2
Cambisols
-* » · * - Fluvisols
Decize
ÌÉ1 'IME MiMA Β 1 i
Welness class VI
Mean pH pH 5.95
Site 3
Sito 4 ,- . 1 ...
(f)
'M Reaosolr. j Brown Saml .
ι... .
Arenosols .
R.Loire
221
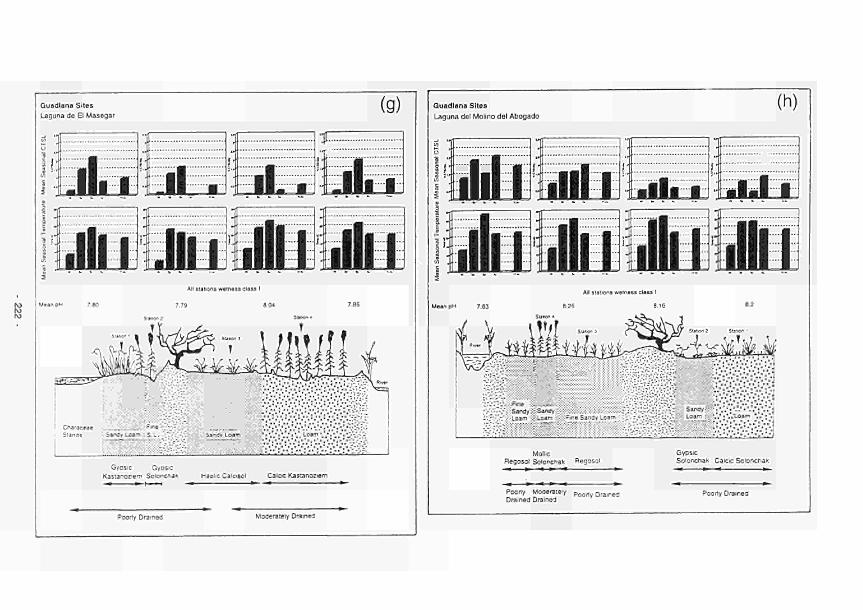
Guadiana Sites
Laguna de El Masegar (g)
Jli j
■111 J
i l iL f
iii
:aÊimsÈÈmï Mean pH 7.80
All stations wetness dass I
7.79 8.04
fifl'¿3*0-
Characeae , .. ... Stands SarOv Loan.:
Gypse Gyosic
Kastanoziem Sokjncna* Haoiic Caicisoi Calcic Kastanoziem
Poorly Drained Moderately Drained
Guadiana Sites
Laguna del Molino del Abogado
(h)
Ii' Éifliuiu Mean pH 7.83
All stations wetness class I
B.26 8.16
Suton 2 SU! — ·
MmmaåMø&i^Måa
MolliC Regosol Solonchak Regosol
Poorly Moderaiely P o o r 1 y D r a i n e d
Drained Drained
Gypsic Solonchak Calcic Solonchak
Poorly Drained
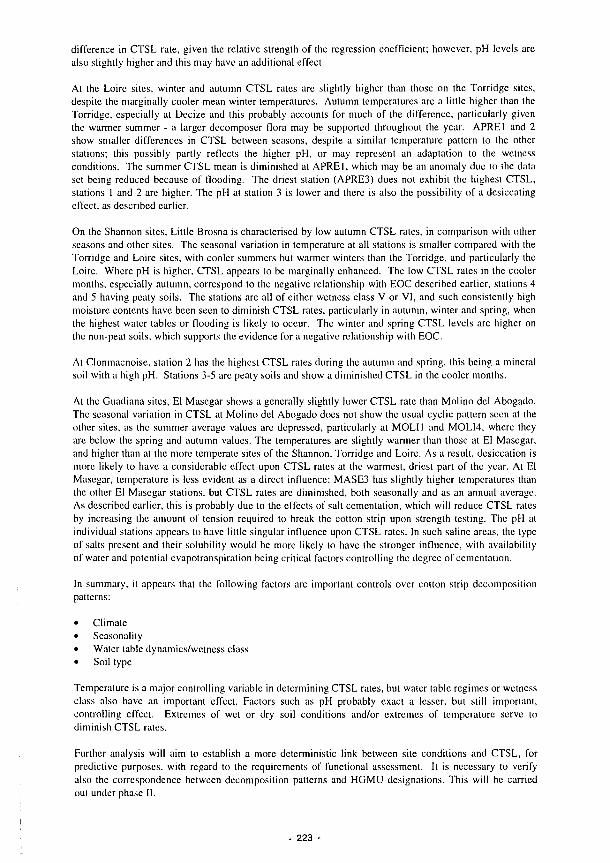
difference in CTSL rate, given the relative strength of the regression coefficient; however, pH levels are also slightly higher and this may have an additional effect.
At the Loire sites, winter and autumn CTSL rates are slightly higher than those on the Torridge sites, despite the marginally cooler mean winter temperatures. Autumn temperatures are a little higher than the Torridge, especially at Decize and this probably accounts for much of the difference, particularly given the warmer summer - a larger decomposer flora may be supported throughout the year. APRE1 and 2 show smaller differences in CTSL between seasons, despite a similar temperature pattern to the other stations; this possibly partly reflects the higher pH, or may represent an adaptation to the wetness conditions. The summer CTSL mean is diminished at APRE I, which may be an anomaly due to the data set being reduced because of flooding. The driest station (APRE3) does not exhibit the highest CTSL; stations 1 and 2 are higher. The pH at station 3 is lower and there is also the possibility of a desiccating effect, as described earlier.
On the Shannon sites, Little Brosna is characterised by low autumn CTSL rates, in comparison with other seasons and other sites. The seasonal variation in temperature at all stations is smaller compared with the Torridge and Loire sites, with cooler summers but warmer winters than the Torridge, and particularly the Loire. Where pH is higher, CTSL appears to be marginally enhanced. The low CTSL rates in the cooler months, especially autumn, correspond to the negative relationship with EOC described earlier, stations 4 and 5 having peaty soils. The stations are all of either wetness class V or VI, and such consistently high moisture contents have been seen to diminish CTSL rates, particularly in autumn, winter and spring, when the highest water tables or flooding is likely to occur. The winter and spring CTSL levels are higher on the non-peat soils, which supports the evidence for a negative relationship with EOC.
At Clonmacnoise, station 2 has the highest CTSL rates during the autumn and spring, this being a mineral soil wilh a high pH. Stations 3-5 are peaty soils and show a diminished CTSL in the cooler months.
At the Guadiana sites, El Masegar shows a generally slightly lower CTSL rate than Molino dcl Abogado. The seasonal variation in CTSL at Molino del Abogado does not show the usual cyclic pattern seen at the other sites, as the summer average values are depressed, particularly at MOLI I and MOLI4, where they are below the spring and autumn values. The temperatures are slightly warmer than those at EI Masegar, and higher than at the more temperate siles of the Shannon, Torridge and Loire. As a result, desiccation is more likely to have a considerable effect upon CTSL rates at the warmest, driest part of the year. At El Masegar, temperature is less evident as a direct influence; MASE3 has slightly higher temperatures than the other El Masegar stations, but CTSL rates arc diminished, bolh seasonally and as an annual average. As described earlier, this is probably due to the effects of salt cementation, which will reduce CTSL rales by increasing the amount of tension required to break the cotton strip upon strength testing. The pH at individual stations appears to have little singular influence upon CTSL rates. In such saline areas, the type of salts present and their solubility would be more likely to have the stronger influence, with availability of water and potential évapotranspiration being critical factors controlling the degree of cementation.
In summary, it appears thai the following factors are important controls over cotton strip decomposition patterns:
• Climate • Seasonably • Water table dynamics/wetness class • Soil lype
Temperature is a major controlling variable in determining CTSL rales, but waler lable regimes or wetness class also have an important effect. Factors such as pH probably exact a lesser, but still important, controlling effect. Extremes of wet or dry soil conditions and/or extremes of temperature serve to diminish CTSL rates.
Further analysis will aim to establish a more deterministic link between site conditions and CTSL, for predictive purposes, with regard to the requirements of functional assessment. It is necessary to verify also the correspondence between decomposition patterns and HGMU designations. This will be carried out under phase II.
223
4.2.5 Nutrient speciation under semi-arid conditions
In a typical cycle of flooding and evaporation the surface water of the Laguna dc El Masegar can change from subsaline (2.80 gl"1) to slightly hyposaline (6.58 gl '), corresponding lo a change of ionic composition from Ca-Mg-(Na)-S04-(Cl)-(HC03+C03) to Ca-Mg-(Na)-S04-(CI). These fluctuations cause drastic changes in the hydrochemical equilibrium and in the pattern of nutrienl speciation. The variation of hydrochemical equilibrium was modelled using the computer program WATEQF (Plummer et al., 1976) using data from different fluctuation stages:
1) 28 March 1991, high water level, low salinity, with phyloplankton dominant, 2) 16 July 1992, intermediate water level and salinity with macrophytes dominant, and 3) 8 August 1992, just before desiccation, low water level and highest salinity, with macrophytes
covered by periphyton.
Inorganic carbon speciation and solid phases dynamics (Fig 4.78) suggest a strong decay of lhe inorganic C available for primary producers, due to the increase in salinity; saturation conditions of Log ionic activity product (IAP)/solubility product (K[)>0 for most carbonate arc reached for salinity values of about 5 gl"'.
Soluble silica shows an opposite trend, wilh the lowest availability in the low salinity stage when phytoplankton is dominant despite saturation conditions not being reached for any solid phase (Fig. 4.79).
Phosphate speciation appears to decline strongly with increasing salinity, probably due to precipitation in form of hydroxyapatite (Fig. 4.80); this occurs as long as saturation conditions for it are reached for salinity values lower than 5gl ' . In this solid phase, phosphate can be used by macrophytes, bul not by phytoplankton.
Nitrogen availability seems to be relatively independent from salinity dynamics, with respect lo N-NO3, N-NO2, and N-NH4 forms.
4.2.6 Primary productivity under semi-arid conditions
Primary productivity of aquatic communities was measured using a modification by Florin (1994) of lhe diel metabolism method (Odum 1956). This procedure involves a 24-hour continuous automatic measurement of several parameters - mainly temperature, dissolved oxygen, and pholosynthelic active radiation. Since the measurements are taken directly in situ (open system), data represent the metabolism of OT (as an indicator of C dynamics) at the ecosystem level, including the activity of other trophic components in addition to primary producers.
Table 4.14 summarises the environmental conditions and the primary productivity measured for Iwo reprcscnlative stages of the fluctuation undergone at El Masegar. Gross productivily and respiration decreased with the increase in salinity and decrease in water level, but net productivily and gross productivity related to the depth of the water column (Sand-Jensen 1989) increased slightly. Photosynthetic active radiation necessary for a positive balance of productivity-respiration (compensation point) is higher at the time of higher salinity. The organic matter content of the sediments decreased, while nutrienl availability increased.
4.3 Characterisation of ecological relationships
The ecological functions performed by wetlands include those widely recognised which provide for specialised habitats, their structure and associated species richness, and those which play a role in maintaining biodiversity at a variety of scales. In addition wetlands, through biomass production, support complex food webs which operate within and beyond the boundaries of individual ecosystems, including fisheries and downstream river marginal ecosystems. Research has aimed to improve the understanding of relationships between ecological and environmental variables as an aid to enhancing the capacity to predict functioning using characteristics such as plant community composition and the resilience and responses of individual key plant species to impacts and stress and the use of invertebrate inventories to predict ecosystem status and functioning.
- 224
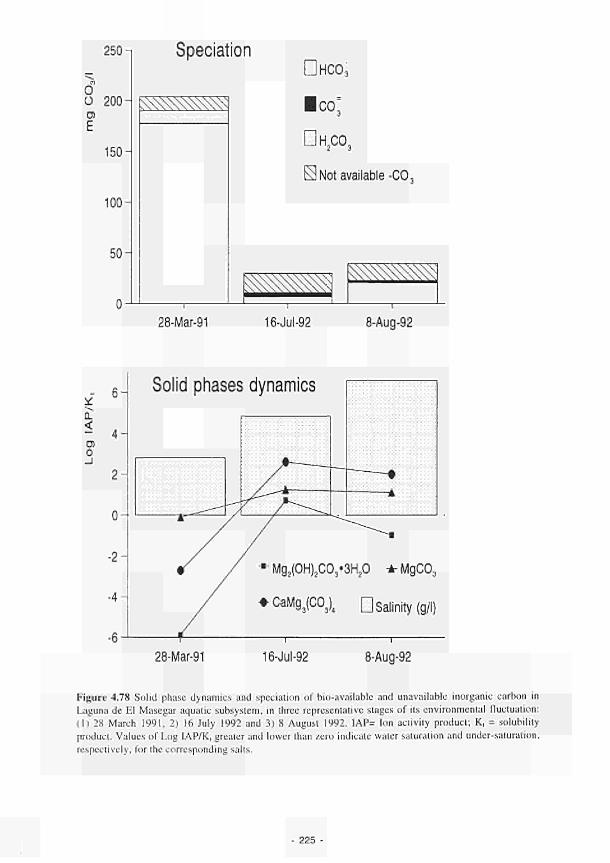
250
O ü 200 O)
E
150-
100
50-
Speciation DHCO3
■ c o ;
DH2CO3
S Not available-CO,
, fessasi
28-Mar-91 16-Jul-92 8-Aug-92
Q.
<
σι o
Solid phases dynamics
28-Mar-91 1 e-Jul-92 8-Aug-92
Figure 4.78 Solid phase dynamics and speciation of bio-available and unavailable inorganic carbon in
Laguna de El Masegar aquatic subsystem, in three representative stages of its environmental fluctuation:
(1) 28 March 1991, 2) 16 July 1992 and 3) 8 August 1992. IAP= Ion activity product; K, = solubility
product. Values of Log IAP/K, greater and lower than zero indicate water saturation and under-saturation,
respectively, for the corresponding salts.
- 225 -

501 Speciation
28Mar91 8Aug92
Solid phases dynamics
30
<20σι o
10
0
10
28Mar91 8Aug92
— Si02 (calced.)
5 S¡02 (quarz)
^CaMgS¡206
eCa2Mg5Si8022(OH)2
*MgS¡0 3
f Mg2S¡04
+ Mg3Si205(OH)4
*Mg3Si4O,0(OH)2
♦ Mg2Si3075(OH)«3H20
+Mg2Si,07.5(OH).3H20(pt)
Figure 4.79 Solid phase dynamics and speciation of silica in the Laguna dc El Masegar aquatic sub
system, in two representative stages of its environmental fluctuation. For key see Fig. 4.78.
226

0,025 η Speciation
28-Mar-91
Ί Not available -P04
ØHPO;· IH2PO4
16-JUI-92 8-Aug-92
Hydroxyapatite dynamics
CD Salinity (g/l)
*Ca5(P04),(OH)
28-Mar-91 16-JUI-92 8-Aug-92
Figure 4.80 Solid phase dynamics and speciation of bio-available and unavailable orthophosphate in the Laguna de El Masegar aquatic sub-system, in two representative stages of its environmental fluctuation. For key see Fig. 4.78.
227
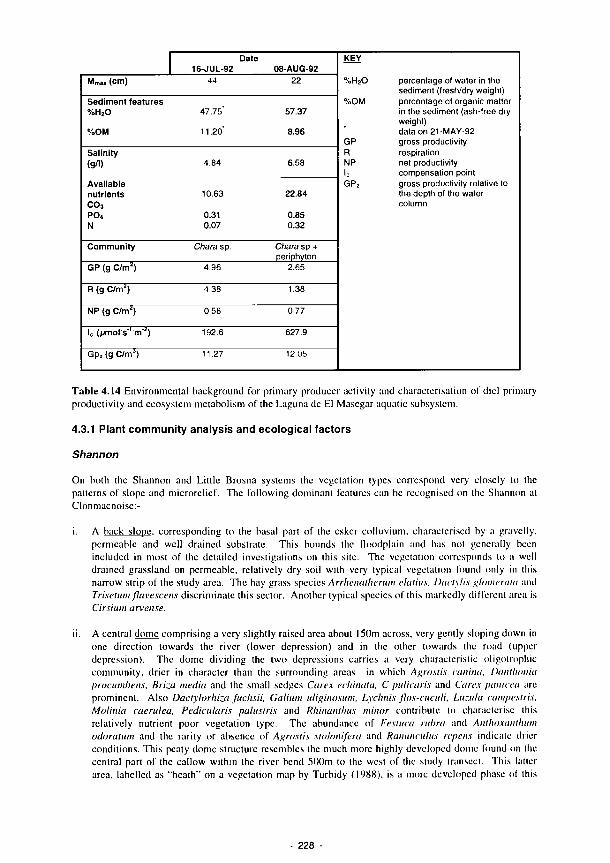
Mm„ (cm)
Sediment features %H 2 0
% 0 M
Salinity (g/i)
Available nutrients C 0 3
PO4 N
Community
GP (g C/m2)
R (g C/m')
NP (g C/m')
le (umols'm"'')
Gpz (g C/mJ)
Date 16-JUL-92
44
47.75"
11.20'
4.84
10.63
0.31 0.07
Cnara sp.
4.96
4.38
0.58
192.6
11.27
08-AUG-92 22
57.37
8.96
6.58
22.84
0.85 0.32
Chara sp + periphyton
2.65
1.38
0.77
627.9
12.05
KEY
%H 2 0
%OM
GP R NP I. GPz
percentage of water in the sediment (fresh/dry weight) percentage of organic matter in the sediment (ash-free dry weight) dataon21-MAY-92 gross productivity respiration net productivity compensation point gross productivity relative to the depth of the water column
Table 4.14 Environmental background for primary producer activity and characterisation of dici primary productivity and ecosystem metabolism of the Laguna dc El Masegar aquatic subsystem.
4.3.1 Plant community analysis and ecological factors
Shannon
On both the Shannon and Little Brosna systems the vcgclation lypes correspond very closely to the patterns of slope and microrelief. The following dominant features can be recognised on the Shannon at Clonmacnoise:-
i. A back slope, corresponding to the basal part of the esker colluvium, characterised by a gravelly, permeable and well drained substrate. This bounds the floodplain and has not generally been included in most of the detailed investigations on this site. The vegetation corresponds to a well drained grassland on permeable, relatively dry soil with very typical vegetation found only in this narrow strip of the study area. The hay grass species Arrhenuiheritm elutius, Dactylis glomerata and Trisetum flavescens discriminale this sector. Another typical species of this markedly different area is C irs i um arvense.
ii. A central dome comprising a very' slightly raised area about 150m across, very gently sloping down in one direction towards the river (lower depression) and in the other towards the road (upper depression). The dome dividing lhe two depressions carries a very characteristic oligotrophic community, drier in character than the surrounding areas in which Agrostis canina. Danthonia priicumbens. Briza media and the small sedges Carex echinala, C pulicaris and Carex punicea are prominent. Also Dactylorhiza fuchsii, Galium uliginosum. Lychnis flos-cuculi, Luzula campestris, Molinia caerulea, Pedicularis palustris and Rhinanlhus minor contribute to characterise this relatively nutrient poor vegetation type. The abundance of Festuca rubra and Anthoxnnthum odoratimi and the rarity or absence of Agrostis stolonifera and Ranunculus repens indicate drier conditions. This peaty dome structure resembles the much more highly developed dome found on the central part of the callow within the river bend 500m to the west of the study transect. This latter area, labelled as "heath" on a vegetation map by Turbidy (1988), is a more developed phase of this
228

oligotrophic vegetation and can be compared to an incipient raised bog or to some bog margins (Heery, 1991). The vegetation of the dome is the most species-rich unit identified in the survey.
iii. A levee about 90m in width, gently sloping down towards the lower depression and abruptly towards the river. The levée vegetation grades into that of the lower depression, from which it differs by both its increased fertility (silt content), indicated by the increase in nutrient-demanding plants such as Phleum pratensis, Taraxacu agr. and Rumex crispus and by its relatively drier status. The latter characteristic can be deduced from the presence of Festuca rubra and Carex hirta. However the abundance of Agrostis stolonifera. Polygonum amphibiiim, Ranunculus repens and Lysimachia vulgaris indicate that the levée is wetter than either the esker slope or dome features.
iv. The lowest terrace, a narrow strip of very low flat land near the river. It carries vegetation indicating the wettest conditions of the Clonmacnoise study site, experiencing the most prolonged periods of flooding. Wetness is indicated by the increased abundance of Caltha palustris, Eleocharis palustris, Equisetum fluviatile, Mentha aquatica, Roripa amphibia, Carex elata and C. vesicaria. The dominance of Phalaris arundinacea over most of the unit, with some Eleocharis-ricU patches, can also correspond to a regime of continuous hay mowing accompanied by siltation. Dominance of Phalaris precludes species diversity.
The vegetation patterns would suggest that the central dome and the levée are local recharge areas, while the depression and the lowest terrace are subject to weak upward flows contributing to their relative dampness and poor drainage. These results support the hydrological studies undertaken on the Clonmacnoise site (4.1.2).
On the Little Brosna floodplain there is also a close relationship between geomorphology and vegetation. The study site can be broadly divided into two parts corresponding to an "upper callow" underlain by peat, sloping gently towards the river, and a "lower callow" on river alluvium consisting of relatively level ground with some micro-relief indicating remnants of old channel systems and also a gently sloping levée.
The upper callow can be broadly divided into three parts according to the vegetation cover.
i. The upper part of the slope, not subject to flooding during the period of study, is observed situated above strand lines. It contains indicators of drier conditions and better drainage than other parts of the floodplain such as Agrostis capillaris, Anthoxantum odoratimi, Hokus lanalus, Cynosurus cristatus and Luzula campestris although the hummocks caused by cattle trampling the soft peat are deep enough to create moist local conditions where patches of Equisetum palustre are found. Moisture related species are present, though not prominent, e.g. Mentha aquatica and Myosotis laxa. Better drainage in peat here coincides with relative desaluration and more oligotrophic conditions indicated by the increase of Briza media, Galium uliginosum, Luzula campestris. Potemilla erecta, Carex pulicaris and the decrease of Festuca pratensis. This slight oligotrophy is reminiscent of the peaty domes of the Clonmacnoise area although the conditions are much less pronounced here. The sedge Carex panicea, which clearly differentiates between the peaty and mineral soil parts of this transect, may have similar significance.
ii. A mid-slope sector of intermediate wetness compared with (i) and (iii). It can be visually differentiated from (i) by its lower growing vegetation and smaller plant biomass.
iii. A slope base characterised by moisture-indicating species and a denser and taller sward than (ii) where Filipendula uimaria is prominent. Also found are moisture indicators such as Cardamine pratensis, Hydrocotoyle vulgaris. Leontodón autumnalis, Mentha aquatica. Myosotis laxa, Ranunculus flagella and R. repens.
Vegetation units (i) and (ii) are subjected to relatively heavy grazing and trampling by cattle, giving rise to hummocky microtopography and very uneven plant cover. Unit (¡ii) is probably used for hay and only occasionally grazed. Trampling and hummock formation here arc less conspicuous.
The lower callow experiences wetter conditions than the upper callow, due mainly lo more prolonged Hooding. It comprises four main units:
- 229
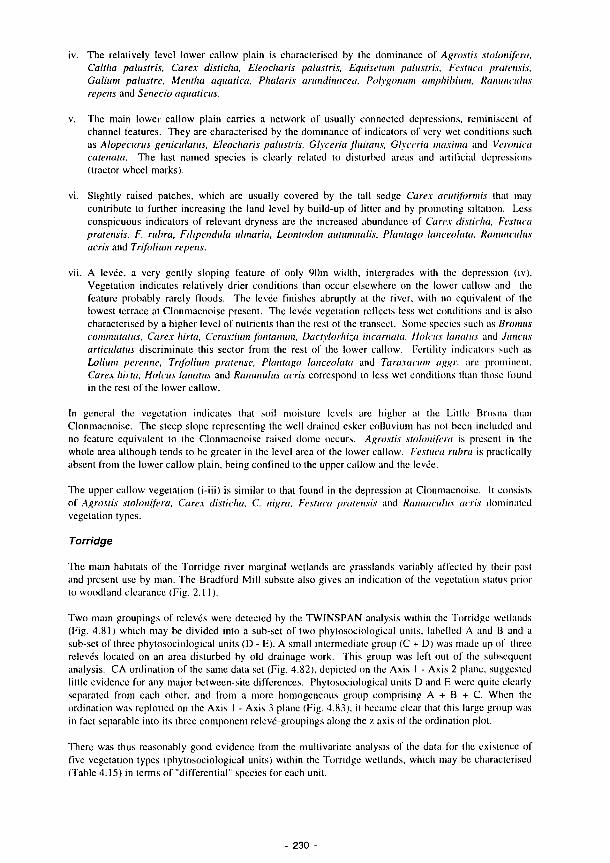
iv. The relatively level lower callow plain is characterised by the dominance of Agrostis stolonifera.
Caltha palustris. Carex disticha, Eleocharis palustris, Equisetum palustris. Festuca pratensis.
Galium palustre. Mentha aquatica. Phalaris arundinacea. Polygonum amphibium, Ranunculus
repens and Senecio aqiiaticus.
v. The main lower callow plain carries a network of usually connected depressions, reminiscent of
channel features. They are characterised by the dominance of' indicators of' very wet conditions such
as Alopecurus geniculatus, Eleocharis palustris, Glyceria fluitans. Glycerin maxima and Veronica
catenata. The last named species is clearly related to disturbed areas and artificial depressions
(tractor wheel marks).
vi. Slightly raised patches, which are usually covered by the tall sedge Carex acutiformis thai may
contribute to further increasing the land level by buildup of litter and by promoting siltation. Less
conspicuous indicators of relevant dryness are the increased abundance of Carex disticha. Festuca
pratensis, F. rubra, Filipendula ulmaria. Leontodón autiimnalis. Piantagli lanceolata. Ranunculus
acris and Trifolium repens.
vii. A levée, a very gently sloping feature of only 90m width, intergrades with the depression (iv).
Vegetation indicates relatively drier conditions than occur elsewhere on the lower callow and lhe
feature probably rarely floods. The levée finishes abruptly at the river, wilh no equivalent of the
lowest terrace at Clonmacnoise present. The levée vegetation reflects less wet conditions and is also
characterised by a higher level of nutrients than the rest of the transect. Some species such as Bromus
commutatus, Carex hirta, Cerasiium fontanum, Dactylorhiza incarnata, Holcus laniitus and Junius
articúlalas discriminate this sector from the rest of the lower callow. Fertility indicators such as
Lolium perenne, Trifolium pratense, Plantago lanceolata and Taraxacum aggi: are prominent.
Carex hirta, Holcus lanatus and Ranunulits acris correspond to less wet conditions than those found
in the rest of the lower callow.
In general the vegetation indicates thai soil moisture levels arc higher ai lhe Lilllc Brosna ihan
Clonmacnoise. The steep slope representing the well drained esker colluviuni has not been included and
no feature equivalent to the Clonmacnoise raised dome occurs. Agrostis stolonifera is present in the
whole area although tends to be greater in the level area of lhe lower callow. Festuca rubra is practically
absent from the lower callow plain, being confined lo the upper callow and the levée.
The upper callow vegetation (iiii) is similar to that found in the depression al Clonmacnoise. It consists
of' Agrostis stolonifera. Carex disticha, C. nigra, Festuca pratensis and Ranunculus acris dominated
vegetation types.
Torridge
The main habitats of' the Torridge river marginal wetlands arc grasslands variably affected by llicir past
and present use by man. The Bradford Mill subsite also gives an indication of' the vegetation stalus prior
to woodland clearance (Fig. 2.11).
Two main groupings of relevés were detected by the TWINSPAN analysis within the Torridge wetlands
(Fig. 4.81) which may be divided into a subset of two phytosociological units, labelled A and B and a
subsel of three phytosociological units (D E). A small intermediate group (C + D) was made up of linee
relevés located on an area disturbed by old drainage work. This group was left out of the subsequent
analysis. CA ordination of the same data set (Fig. 4.82). depicted on the Axis I Axis 2 plane, suggested
little evidence for any major betweensite differences. Phytosociological units D and E were quile clearly
separated from each other, and from a more homogeneous group comprising A + B + C. When lhe
ordination was replotlcd on the Axis 1 Axis 3 plane (Fig. 4.83), ¡I became clear thai Ibis large group was
in fact separable into its three component relevégroupings along the ζ axis of lhe ordination plot.
There was thus reasonably good evidence from the multivariate analysis of the data for the existence of
five vegetation types (phytosociological units) within the Torridge wetlands, which may be characterised
(Table 4.15) in terms of "differential" species for each unit.
230
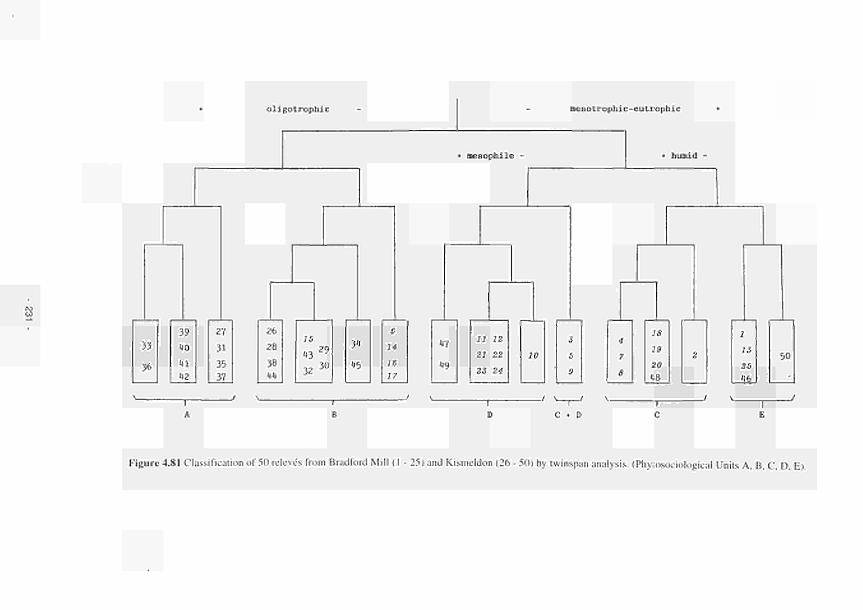
+ oligotrophic
33
36
39 ΊΟ 11 12
- mesotrophic-eutrophic +
+ mesophile -
27 31 35 37
26 28 38 11
25 13 2 9 3 230
31 15
6
14 16 17
+ humid -
17 19
11 12
21 22
23 24
10 3
S
9
4
?
8
18
19
20 18
2 1
13 2b 16
50
C + D
Figure 4.81 Classification of 50 releves from Bradford Mill (1 - 25) and Kismeldon (26-50) by twinspan analysis. (Phytosociological Units A, B, C, D, E).
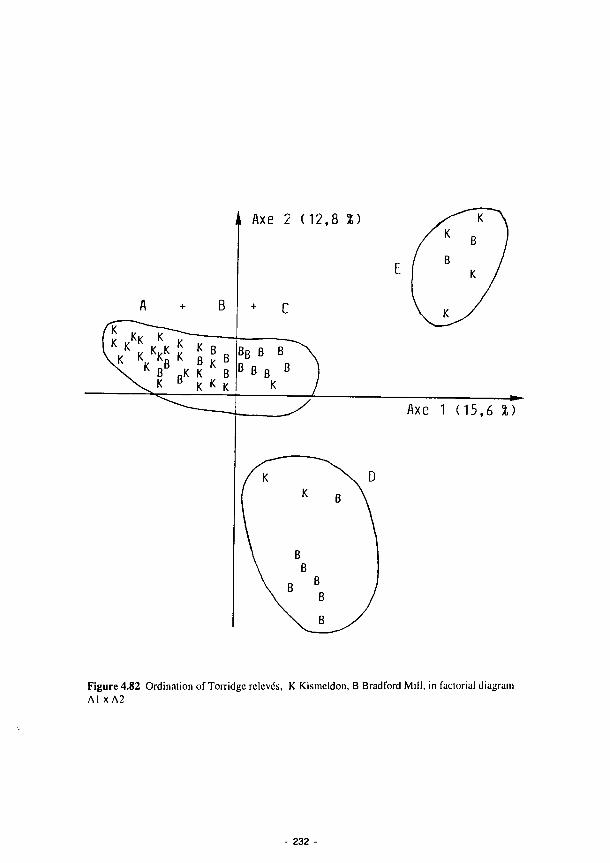
Figure 4.82 Ordination of Torridge relevés, K Kismeldon, B Bradford Mill, in factorial diagram Al xA2
- 232
Units A and Β are typical of oligotrophic humid grasslands. Unit A is a heath rush meadow type found in
oligotrophic acidic mires. Unit Β is related to the purple moor-grass (Molinia caerulea) meadow type,
typically on less oligotrophic and less peaty soils than type A.
The remaining groups were characteristic of more nutrient-rich humid grasslands. Unit C belongs to the
meso-eulrophic humid grasslands, developed on nutrient-rich wet alluvial soils, often inundated (at least in
winter and spring). A variant with Carex paniculata indícales seepage areas, with local base-enrichment
of the substrate. Unit D is a mesophile grassland, regularly grazed, on well-drained alluvial soils. Unit E
is related to humid tall-herb fringes, nitro-hygrophilous, developing along the shaded side of wooded
stands and hedges.
In the group of humid and wet grasslands, a better understanding was obtained by including additional
relevés and excluding well defined communities like mesophile grassland and tall herb fringes.
Another multivariate technique, the correspondence analysis, was used to ordinate the data set of 78
relevés in terms of plant assemblages (Fig. 4.84 for relevés, Fig. 4.85 for species). There was reasonably
good evidence for the existence of four main categories and two sub-units in each principal unit.
The four main units are most closely related to the CORINE biotopes as follows: (the codes A - D are nol
those used above)
• Unit A (rel. 1-14) heath rush meadow and mat-grass sward
• Unit Β (rel. 15-43) acid purple moor-grass meadow and community with sharp-flowered rush
dominant.
• Unit C (rel. 44-54) great tussock sedge hummocks, linked with meadowsweet stands and tall herb fen.
• Unit D (Ref 55-78) marsh ragwort meadow, Hooded herb fen and tall rush pasture.
The synoptic Table 4.16 shows a synthetic view of four main units and eight sub-units with groups of
differential species. In terms of phytosociological data, these groups of species are biotic indicators
mainly of the trophic level of their environment, from the more oligotrophic (unit A type) to the more
eutrophic (unit D type). This gradient may be used to establish correlative relationships, and their
significance, between vegetational gradients, as expressed in Table 4.16, and gradients of environmental
variables studied by other teams of this project.
In summary, the largest differences are between species of grouped units A + B, oligotrophic grasslands
and grouped units C + D, meso-eutrophic grasslands (Table 4.16). At the next level down differences
are between principal units, A , B, C and D. At the lowest level they are shown by sub-units, such as A
and A bis. Phytosociological characteristics can be grouped at different levels and related to relevant
environmental factors.
Loire - Allier
The Loire and Allier are large rivers with wide floodplains, which can be divided into "lit mineur" and "lit
majeur" representing the lower and upper floodplain (2.3.3).
On the "lit majeur", past and present human impacts arc responsible for the existence of grasslands, or
other agricultural crops. At FAEWE sites, the grasslands belong to mesophile and xcro-mesophilc
meadows, dominated by common grasses of hay and grazed meadows (Table 4.17). A group of
differential species of Decize (Col. 1) meadow also grow on dry grasslands and sand dunes. In Apremont
(Col. A), some differentials belong to trampled humid meadows. Differences between the two sites arc
evident from soil characteristics of particle-size class and water retention capacity: sandy soils with low
water retention on the Loire site and silty soils with medium water retention on the Allier site. Sporadic
Hoods have no direct effect on vegetation composition. Other differences between the two sites relate to
plant communities found in low lying sites.
At Apremont on the Allier floodplain, depressions and marginal zones of the oxbow lake arc characterised
by sedge beds (Table 4.18). These communities grow on soils of high wetness class, temporarily
submerged each year during winter and spring. Carex vulpina and C. acutiformis arc characteristic of
neutral substrates; other sedges arc established on a wider range ol' pH. The impact of grazing, mainly
trampling by cattle, is shown by the presence of grasses and other grazed species (rcl. I. 4).
- 233
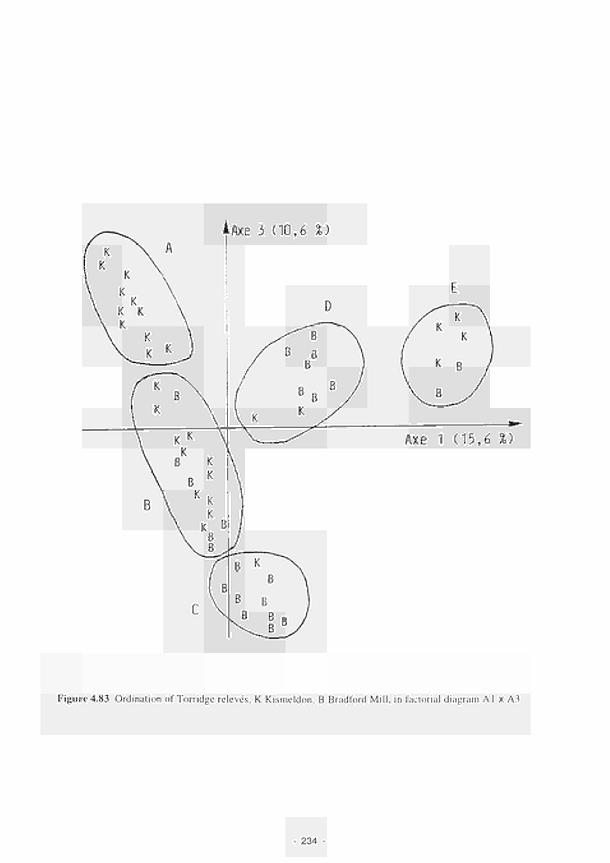
ÀAxe 3 (10,6 %)
Figure 4.83 Ordination of Torridge relevés, K Kismeldon. B Bradford Mi l l , in factorial diagram Α Ι X A3
234
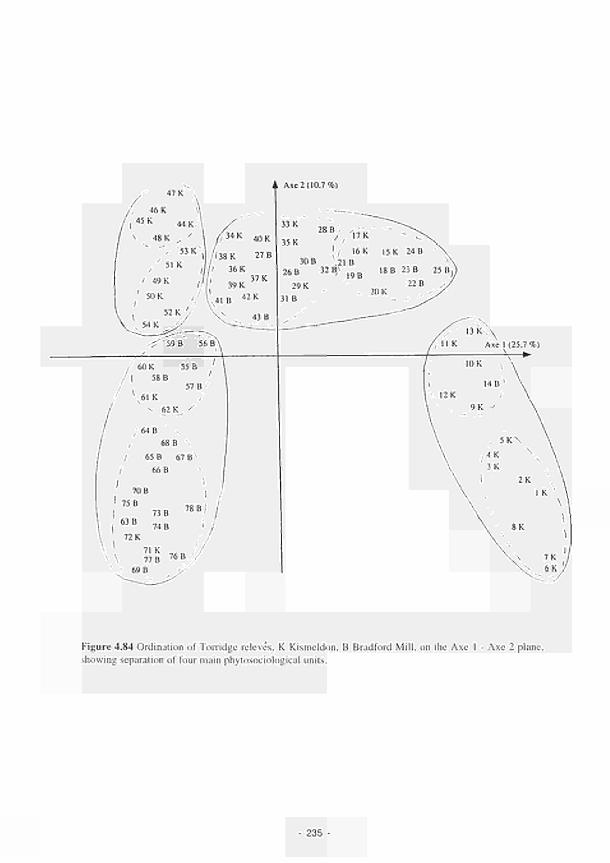
n Axe 2 (10.7%)
Figure 4.84 Ordination of Torridge relevés, K Kismeldon, B Bradford Mill, on the Axe I - Axe 2 plane, showing separation of four main phytosociological units.
- 235
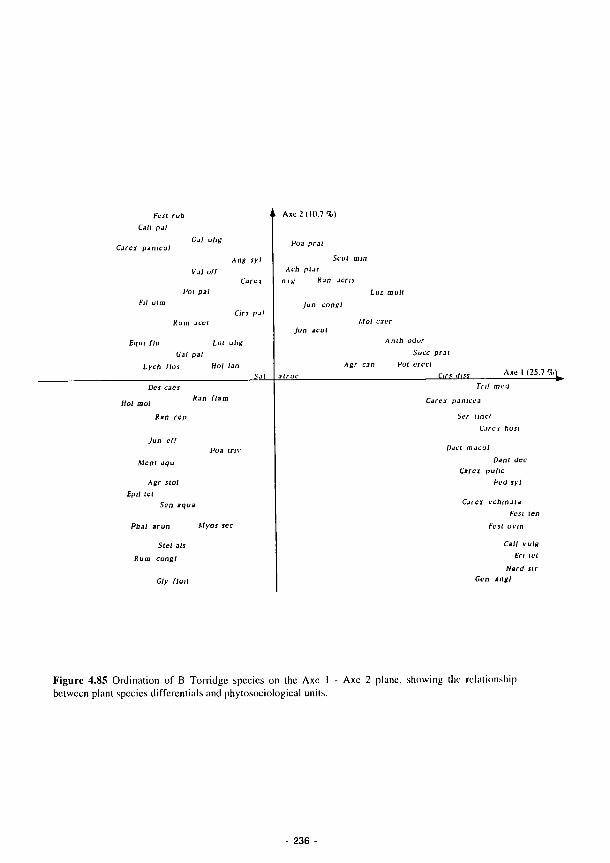
t'est rub Cali pal
Carex panicul Gal υ ƒ n;
a Axe 2 (10,7%)
Po a prat
Pot pai
Rum acci
Ang syl
Cirs pal
Equi flu Lot ulig Gal pal
ly eh flos Hol lan
Des caes Ri Hol ¡nol
Ran rep
Jun eff
Ment aqu
Agr stol
Eptl let
Sen aqua
Phal arun
Stel als
Rum congi
Gty flu ¡t
Myos sec
Scut min
Ach ptar
η tg Ran acris
jun cong I
Mol caer
Jun acut
A ni h odor
Suce prat
Agr can Pot erect
atroe Ors dis? Axe I (25.7 %ì
Tr if m v il
Carex panicea
Ser imet
Carex host
Úact maeul
liant dec
Carex puhe
Ped syl
Carex echinata
tesi ten
test ovin
Call vuig
En iet
Närd str
Gen »ngl
Figure 4.85 Ordination of B Torridge species on the Axe 1 Axe 2 plane, showing (he relationship
between plant species differentials and phytosociological units.
236
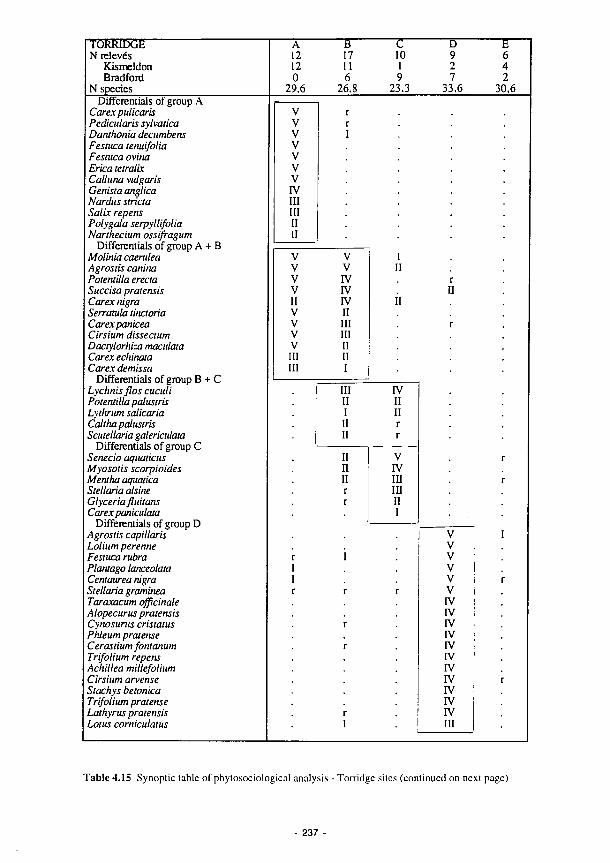
TÖRAIDGE
N relevés Kismeldon Bradford
N species
Differentials of group A Carex pulkans Pedicularis sylvatica Danthonia decumbens Festuca tenuifolia Festuca ovina Erica tetralix Calluna vulgaris Genista anglica Nardus strida Salix repens Polygala serpyllifolia Narthecium ossifragum
Differentials of group A + Β Molinia caerulea Agrostis canina Potemilla erecta Succisa pratensis Carex nigra Serranda tinctoria Carex panicea Cirsium dissectum Dactylorhiza maculata Carex echinata Carex demissa
Differentials of group Β + C Lychnis flos cuculi Potemilla palustris Lythrum salicaria Caitha palustris Scutellaria galericulata
Differentials of group C Senecio aquaiiciis Myosotis scorpioides Memha aquatica Stellaria alsine Glyceriafluitans Carex paniculata
Differentials of group D Agrostis capillaris Lolium perenne Festuca rubra Plamago lanceolata Centaurea nigra Stellaria gramínea Taraxacum officinale Alopecurus pratensis Cynosunis cristatus Phleum pratense Cerastium fomanum Trifolium repens Achillea millefolium Cirsium arvense Stachys betonica Trifolium pratense Lathyrus pratensis Lotus corniculatus
A 12 12 0
29.6
Β 17 11 6
26.8
V r V r V 1
V V V V
rv III III II II
" c
10 1 9
23.3
V V V V II V V V V III III
V V
rv rv rv π III III II II I
HI II I II
π II
π II r r
rv II
π r r
V
rv III
m II I
D
9 2 7
33.6
E
6 4 2
30,6
Table 4.15 Synoptic table of phytosociological analysis Torridge sites (continued on nexl page)
237
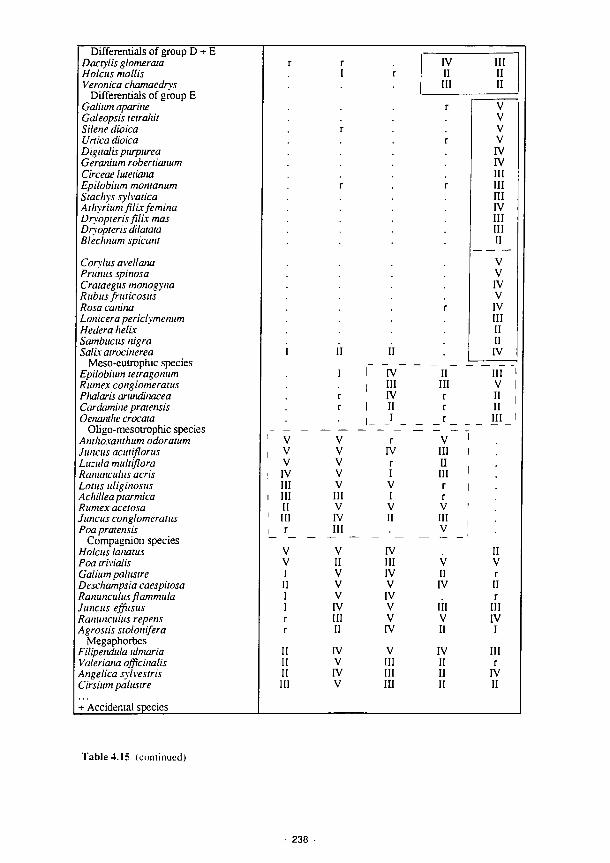
Differentials of group D + E Dacrylis glomerata Holcus mollis Veronica chamaedrys
Differentials of group E Galium aparine
Galeopsis tetraliit Silene dioica Unica dioica Digitalis purpurea Geranium robenianum Circeae lutetiaiia Epilobium montanum
Stachys sylvatica A thyrium fi lix femina Dryopteris fìlix mas Dryopteris dilatata Blecimum spicant
Cory lus avellana Prunus spinosa
Crataegus monogyna Rubus fruticosits Rosa canina Lonicera periclymenum Hederá helix Sambucus nigra Salix atrocinerea
Mesoeutrophic species Epilobium tetragonum
Rumex conglomérants Pltaiaris arundinacea Cardamine pratensis Oenamlte crocata
Oligomesotrophic species Anthoxanthum odoratum Juncus acutiflorus
Luzula mulliflora Ranunculus acris Lotus uliginosas Achillea ptarmica Rumex acetosa Juncus conglomérants
Poa pratensis Compagnion species
Holcus lanatus Poa trivialis Galium palustre
Deschampsia caespitosa Ranunculus flammula Juncus effusus Ranunculus repens Agrostis stolonifera
Megaphorbes Filipendula uimaria Valeriana officinalis Angelica sylvestris Cirsium palustre
+ Accidental species
\
1 ^
\ ! Γ
II ι II
1
ι n ι t
\ \ I
1 I I r r
I 1 I II
r r
I
■
r r
•
1 V
ι ν ι ν / V
I V
I III
V
ι rv III
' V
' II
V
V V IV III II
IV V
rv I V
r
ÍI
rv III
rv II I
_ _ _ r
IV
r I V I V II
IV III IV
V IV V V IV
V III III III
rv II III
r
r
r
r
•
II
III r r r
_ _ _ V '
III 1
II III '
Γ |
r V ι
III V \
V II
IV
III V II
IV II II II
III II II
V
V V V
rv rv m III
ni rv III III II
V V
rv V
rv III II II IV
n i >
ν I 11 1 II '
III ι
II V r
II r
III
rv I
III r
rv II
Table 4.15 (continued)
238
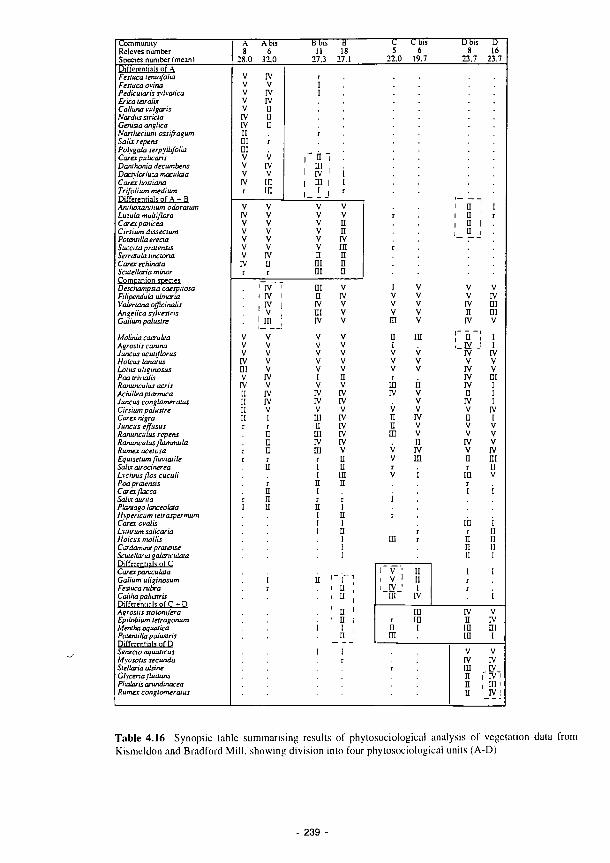
"TOs" Β -
11 18 27.3 27.1
- r : — C H T 5 6
22.0 19.7
ΤΓΈΰ ΓΓ 8 16
23.7 23.7
Community Releves number Species number (mean)
A A bis 8 6
28.0 32.0 Differentials of A Festuca tenui/olia Festuca ovina Pedicularis sylvaiica Erica tetralix Calfuna vulgaris Nardus st riela Genista anglica Nartiiecium ossifragum Salix repens Polygaia serpyUifoüa Carex pulkans Danthonia decumbens Dacrylorliiza maculala Carex liostiana Trifolium medium Differentials of A * B
Artiiioxartilium odoralum Luzula multiflora Carex panicea Cirsium dissectum Potemilla erecta Succisa pratensis Serratula tinctoria Carex echinata Scutellaria minor Companion species Deschampsia caespitosa Filipendula uimaria Valeriana officinalis Angelica sylvestris Galium palustre
Molinia caerulea Agrostis canina Juncus oc ut ι flor us Holcus lanatus Lotus uliginosus Poa trìvialis Ranunculus acris Achillea ptarmica Juncus congloméralas Cirsium palustre Carex nigra Juncus effusus Ranunculus repens Ranunculus flammula Rumex acetosa Equisetum fluviatile Salix atrocinerea Lychnis flos cuculi Poa pratensis Carexflacca Salix our ita Plantago lanceolata Hypericum tetraspermum Carex ovalis Lythrum salicaria Holcus mollis Car damine pratense Scutellaria galenculata Differentials o iC Carex paruculata Galium uliginosum Festuca rubra Caltlia palustris Differentials of C* D Agrostis stolonifera Epilobium tetragonum Mentha aquatica Potemilla palustris Differentialof D Senecio aquaticus Myosotis secunda Stellaria aísine Glyceria fluitans Plutlaris arundinacea Rumex conglomeralus
V V V V V IV IV II III ¡II V V V
rv r
rv v rv rv π π π r
V
rv v in in
Γ
I I
Γ
ι~ii : ΠΙ , .
Ι rv ι : ι π ι ι , Ι ι ·
ν ν ν ν ν ν rv II
1 rv
ι rv 1 ν ι ιπ
V ν ν ν ν IV ν rv IV ν Ι r Π
π II
ν ν ν ν ν ν π III III
ΠΙ II rv UI rv
ν ν ν ν ν r ν rv rv ν II
ν ν π π IV ΙΠ π II π
ν rv ν ν ν
ν ν ν ν ν II ν rv [V ν rv IV rv rv ν π π m π
ν ν rv ΠΙ"
II ΙΠ
Ι
ν ν ν ΠΙ
π
ν ν ν ΙΠ
rv
ν π π III
ν ν
ν ν ν ν ν ΙΠ
ν ν ν ÍI
ν ν ν rv ν ν π rv III
II II
ι rv
m m ι
' n Ι Π 1 S '
, Π ,
V V IV
n IV
n'\ tv 1
IV V
rv IV IV II IV
ν II
ν ν rv ν π r
III
V
rv III ΠΙ
v I I
IV
v v III I I 1
rv 1
v v v IV III 11
v
rv II III III
v IV III
π II II
v IV III I
v IV IV
Γ rv" III IV
Table 4.16 Synoptic table summarising results of phytosociological analysis of vegetation data from
Kismeldon and Bradford Mill, showing division into four phytosociological units (AD)
239
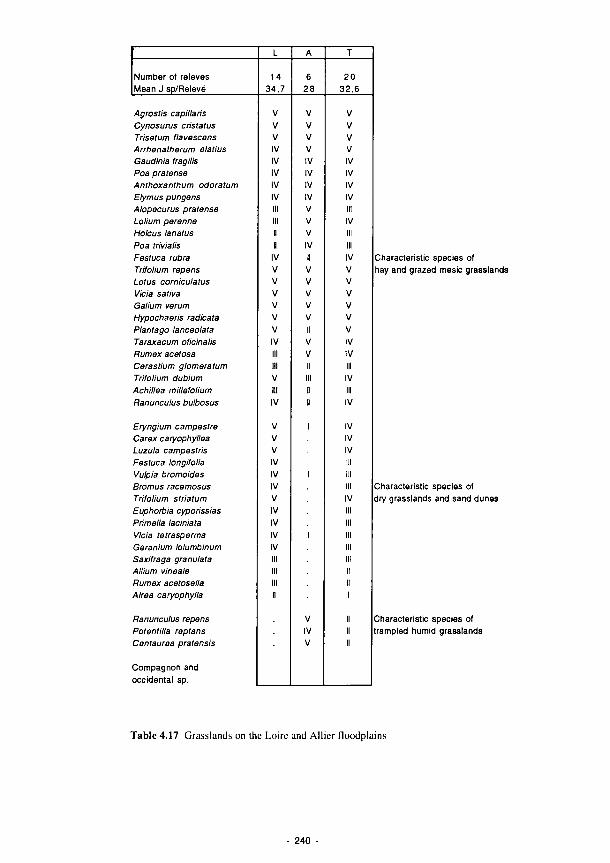
Number of releves Mean J sp/Relevé
Agrostis capillaris Cynosunjs cristatus Trisetum flavescens Arrhenatherum elatius Gaudinia tragilis Poa pratense Anthoxanthum odoratum Elymus pungens Alopecurus pratense Lolium perenne Holcus lanatus Poa trivialis Festuca rubra Trifolium repens Lotus corniculatus Vicia sativa Galium verum Hypochaeris radicata Plantago lanceolata Taraxacum oficinalis Rumex acetosa Cerastium glomeratum Trifolium dubium Achillea millefolium Ranunculus bulbosus
Eryngium campestre Carex caryophyllea Luzula campestris Festuca longitolia Vulpia bromoides Bromus racemosus Trifolium striatum Euphotbia cyporissias Primella laciniata Vicia tetrasperma Geranium lolumbinum Saxi/raga granulata Allium vineale Rumex acetosella Airea caryophylla
Ranunculus repens Potentina reptans Centaurea pratensis
Compagnon and occidental sp.
14 34 ,7
V V V IV IV IV IV IV
IV v v v v V V IV
v III IV
V V V IV IV IV v IV IV IV IV
6 28
V V V V IV IV IV IV V v v IV II v V V V V
V V
V IV V
20 32.6
V v V v IV IV IV IV
IV V v v V V V IV IV III IV III IV
IV IV IV
Characteristic species ol hay and grazed mesic grasslands
Characteristic species of dry grasslands and sand dunes
Characteristic species ot trampled humid grasslands
T a b l e 4.17 Grasslands on the Lo i re and A l l i e r f loodpla ins
240 -
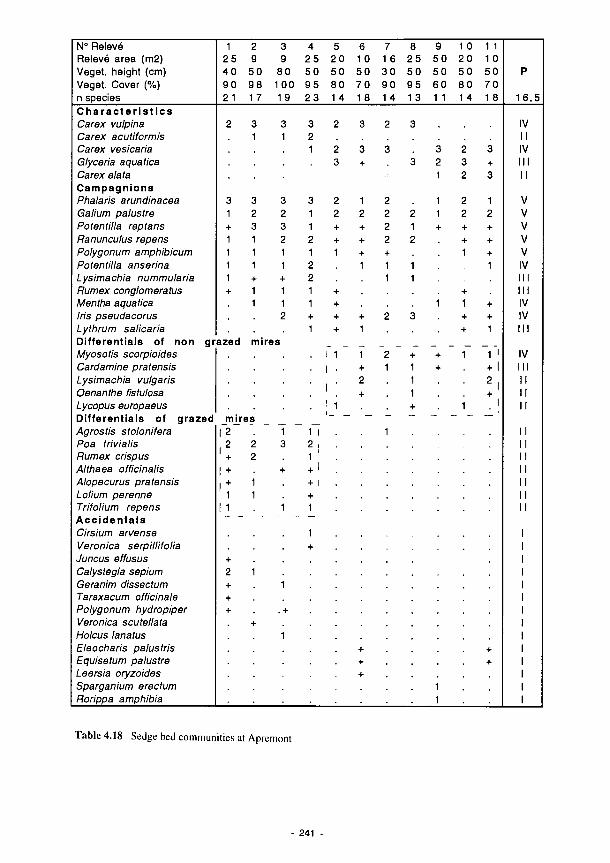
N° Relevé
Relevé area (m2)
Veget, height (cm)
Veget. Cover (%)
n species
C h a r a c t e r i s t i c s
Carex vulpina
Carex acutiformis
Carex vesicaria
Glyceria aquatica
Carex elata
C a m p a g n i o n s
Phalaris arundinacea
Galium palustre
Potentina reptans
Ranunculus repens
Polygonum amphibicum
Potentina anserina
Lysimachia nummularia
Rumex conglomeratus
Mentha aquatica
Iris pseudacorus
Lythrum salicaria
Differentials of non gr
Myosotis scorpioides
Cardamina pratensis
Lysimachia vulgaris
Oenanthe fistulosa
Lycopus europaeus
Different ia ls of grazed
Agrostis stolonifera
Poa trivialis
Rumex crispus
Althaea officinalis
Alopecurus pratensis
Lolium perenne
Trifolium repens
A c c i d e n t a l s
Cirsium arvense
Veronica serplllifolia
Juncus effusus
Calystegia septum
Geranim dissectum
Taraxacum officinale
Polygonum hydropiper
Veronica sculettata
Holcus lanatus
Eleocharis palustris
Equisetum palustre
Leersia oryzoides
Sparganium erectum
Rorippa amphibia
1
2 5
4 0
9 0
2 1
2
3
1
+
1
1
1
1
+
azed
2
9
5 0
98
17
3
1
3
2
3
1
1
1
+
1
1
3
9
80
100
1 9
3
1
3
2
3
2
1
1
+
1
1
2
mires
mires
| 2
, 2
+
I +
| +
1
I 1
+
2
+
+
+
2
2
1
1
1
+
1
3
+
1
1
.+
1
4 5
2 5 2 0
5 0 5 0
9 5 8 0
2 3 14
3 2
2
1 2
3
3 2
1 2
1 +
2 +
1
2
2
1 +
1 +
+ +
1 +
. ι ■
• I
| I
; ι ·
" il 2 ,
1
+ I
+ I
+
1
1
+
6 7 3 1 5 10 11
10 16 2 5 5 0 2 0 10
5 0 3 0 5 0 5 0 5 0 5 0
7 0 9 0 9 5 6 0 8 0 7 0
18 14 13 11 14 18
3 :
3 :
+
>
3
1 2
2 2
+ 2
+ 2 !
+ +
1
.
+ 2 :
1
3
: 3 ;
3 2
.
ι -
ι
3
;
: :
V
-
-
-
2 3
3 +
> 3
ι I 2
y +
ν +
+
l· +
Y +
+
1 2 + +
+ 1
2
+
.
+
+
+
+
+
1
1
1 ι
+ l
2 | +
H
H
I
P
1 6 , 5
IV
I I
IV
I I I
I I
V
V
V
V
V
IV
I I I
m IV
IV
I I I
IV
I I I
I I
I I
I I
I I
I I
I I
I I
I I
I I
I I
I
I
I
I
I
I
I
I
I
I
I
I
I
I
Table 4.18 Sedge bed communities at Apremont
241 -
At Decize on the Loire, the main depression is senii-pernianently submerged hut the soil dries out in the summer. The vegetation (Table 4.19) is dominated by Alopecurus geniculuiiis and Glycerin fluilans and many annual and opportunistic species which grow during summer after the site has dried out.
On the "lit mineur", there is no direct human impact. The main disturbance is the effect seasonal Hooding regimes have in terms of inundation duration and of speed of flow; the vegetation is linked with mesotopography. Following long periods of inundation no perennial species are found with only annuals able to grow on sandbanks or mudbanks. when undisturbed. On sandbanks, plain assemblages correspond to arid vegetation with some species which also occur in tropical habitats. On mudbanks, communities arc dominated by hygro-nitrophile species like Bidens spp, Polygonum spp. When Hood perturbations are less intense, perennials can become established. Large sedge and reed-canary-grass beds characterise such vegetation with pioneer willow species like Salix purpurea, S. alba or S. viminalis. Where softwood forest can establish, poplar and white willow are the dominant species of the canopy. The herb layer is dominated by hygro-nitrophile species such as Urtica dioica, Galium aparine, Calystegia septum, Rubus caesius and Geum urbanum. Swales have Phalaris arundinacea and carry a higher plani diversity than ridges.
On the highest elevation of "lit mineur" a fragmentary hardwood forest is established. The canopy is dominated by Quercus robur, Fraxinus excelsior. Tilia platyphyllos, Acer platanoides and Ulmus spp. The herb layer is not very different from that of the softwood except for the absence of the more hygrophile species like Phalaris arundinacea, Deschampsia caespitosa, and the rarity of pioneer willow species.
Guadiana
Though both study sites in Spain are located on lhe floodplain of lhe Ciguela, historic and recent water management measures have led to substantial differences developing in the vegctalion between the sites. The (until recently) unimpacted El Masegar laguna has maintained a dense cover of Phragmites australis, Cladium mariscas, Phalaris arundinaceae, Carex hispida and Sonchus maritimas, with Lythrum salicaria and Mentha aquatica found in depressions and Schoenus nigricans on elevated areas. Artificial depressions occurring adjacent to and within the dikes are becoming colonised by sparse reed stands. Between the dike and the river, the bed of which has been deepened precluding Hooding from lhe channel, the vegetation of the "new" floodplain shows indicators of desiccation wilh dense formations oí Schoenus nigricans, Dorycnium peniaphylum, Brachypodium phoenicoides, Elymus curvifolius, Phragmites australis and Sonchus maritimas. Tall Phragmites stands are found in small depressions and abandoned channels of the Ciguela.
At the Molino del Abogado site, desiccation effects, accompanied by salinisation, have led to major differences in plant community composition. The main area of the old floodplain carries a mosaic of halophyte communities: the most abundant species are Juncus maritimus. Frankenia pulverulenta, Limonium delicatitliim, Bassia hyssopifolia and Aeluropus littoralis. Patches of bare ground also occur. Depressions adjacent to a dike carry a sea-lavender community of L. deliiiititlum wilh E curvifolius. Suaeda vera and J. maritimus. Phragmites australis occurs in sparse dwarf forms. Oxbows of the old river course contain monospecific stands of P. australis with Galium aparine and Lactuca serriolu found at the margins.
Relationship between plant communities and major ecological factors
Figs. 4.86-4.88 summarise the relationships and dynamics between different plant communities under lhe various impacts of anthropogenic activities, such as cattle grazing or mowing. Plant communities are named according to CORINE Biotopes manual - Habitats of the European Community. The ligures show the potential diversity of sub-site. Some elements such as the mixed Oak - Elm - Ash foresi may be absent or occur as fragments as a result of historic deforestation.
In the "lit mineur" unit (Fig. 4.86), there is no differences bclwcen lhe Loire and Allier systems. Waler regime and water quality are the main factors which influence the structure and the dynamics of lhe plani communities, even though in the detail, some differences were observed. There is likely to be more heterogeneity within either river along its course lhan between the Iwo rivers.
242

N° Relevé Relevó area (m2) Veget, height (cm) Veget. Cover (%) n species Alopecurus geniculatus Glyceria fluitans Mentha pulegium Polygonum persicaria Rorippa sylvestris
Trifolium repens Ranunculus aquatilis Ranunculus sardous Polygonum aviculare Plantago lanceolata Filaginella uliginosa Poa annua Echinochloa crusgalli Rumex crispus Sagina procumbens Poa trivialis Eleocharis palustris Rorippa amphibia Trifolium pratense Agrostis stolonifera Ambrosia artemisiifolia Chenopodium polyspermum
1 25 20 85 21 3 2 3 2 1
1 1 1 2 + 2 2 1 + + + +
2 25 50 95 1 7 4 3 1 2 1
1 1 1 + +
1 + 1 1 +
Table 4.19 Semi-permanent fresh water communities at Decize
- 243 -
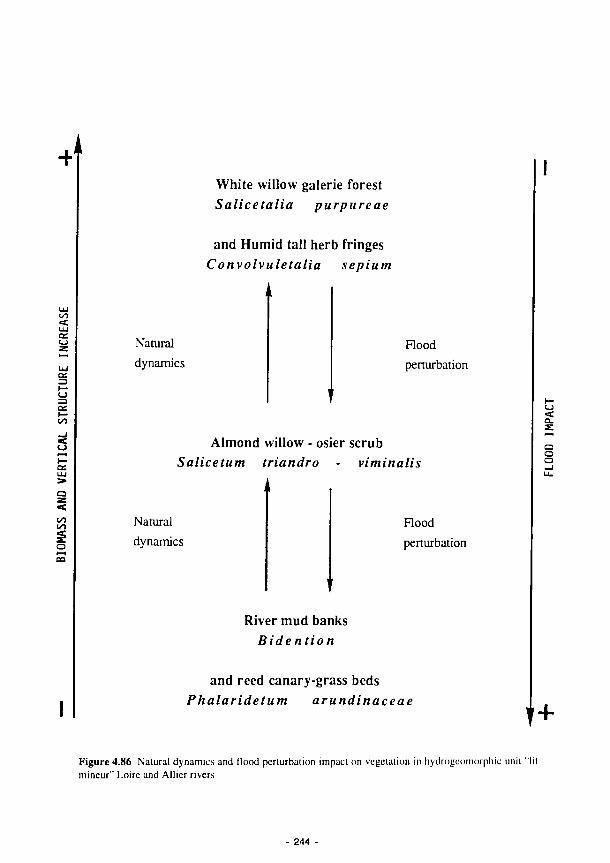
+"
00
*D C£ h-co
<
< υο
I
White willow galerie forest
Salicetalia purpureae
and Humid tall herb fringes
Convolvuletalia sepium
Natural
dynamics
Rood
perturbation
Almond willow - osier scrub
Salicetum triandro - viminalis
Natural
dynamics
Flood
perturbation
River mud banks
Bidention
and reed canary-grass beds
Phalaridetum arundinaceae
■a:
Q o o
!+ Figure 4.86 Natural dynamics and flood perturbation impact on vegelalion in hydrogeomorphic unit "lit
mineur" Loire and Allier rivers
244

Mixed Oak - Elm - Ash forest Querco - Ulmetum minoris
c Σ
Natural dynamics Hardwood exploitation and flood impact
i+
Natural dvnamics
Sub-continental blackthorn bramble scrub - thickets and hedges Prunetalia spinosae
Spatial linkage hem effect
Natural dvn amies
Shady woodland edge communities Glechometalia hederaceae
Semi-dry grassland Mesobromion (Arrhe-natherum d o m i n a n t )
no grazing mowing only
Grazing and trampling effects
Sand sedge grassland Carex arenaria communities
and dwarf annual siliceous grasslands Thero - Airion
no grazing no mo win 2
OO
< ce.
t_3
«C
00 ΟΟ
ο C2
Figure 4.87 Human impact on vegetation in hydrogeomorphic unit "lit majeur" River Loire
- 245
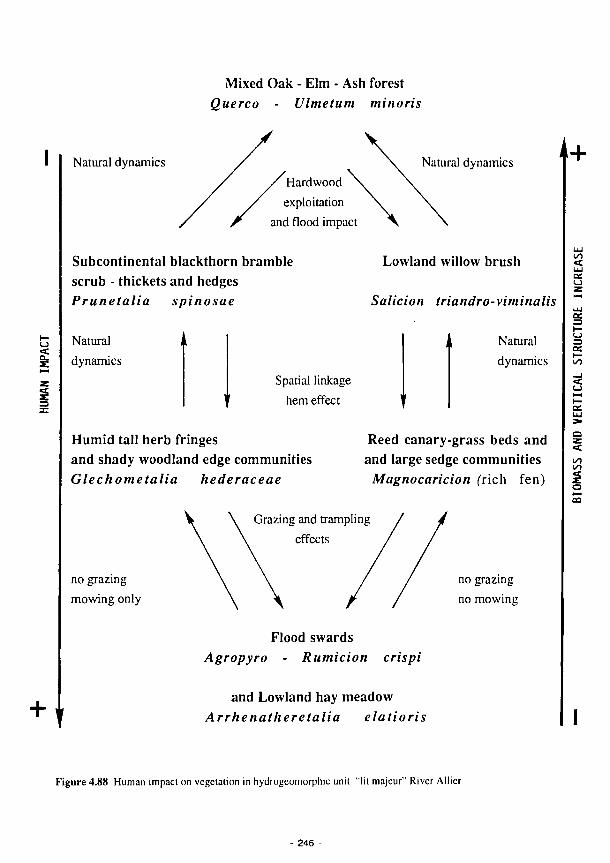
Mixed Oak - Elm - Ash forest Querco - Ulmetum minoris
Natural dynamics Hardwood exploitation
and flood impact
Natural dynamics +
Subcontinental blackthorn bramble scrub - thickets and hedges Prunetalia spinosae
Natural dynamics
Spatial linkage hem effect
Humid tall herb fringes and shady woodland edge communities Glechometalia hederaceae
Lowland willow brush
Salicion triandro-viminalis
Natural dynamics
Reed canary-grass beds and and large sedge communities
Magnocaricion (rich fen)
no grazing mowing only
ng and trampl effects
no grazing no mowing
Flood swards Agropyro - Rumicion crispí
and Lowland hay meadow Arrhenatheretalia elatioris
Figure 4.88 Human impact on vegetation in hydrogeomorphic unit "lit majeur" River Allier
246
When river levels are low seeds can germinate in mud which has been deposited on sand, giving rise to annual plant communities which mature in late autumn. If the level of water rises quickly the mud can be redeposited on perennials where decomposed litter induces enrichment of nutrients like nitrogen and phosphorus. The development of scrub and forest dynamics is directly linked to the dynamics of the river. Along the Loire and Allier willow scrub represents most of' the gallery forest prominent at the landscape scale.
In the "lit majeur" or upper floodplain unit, there are clear differences between the two rivers, especially with respect to plant communities more linked to human impacts, even though these impacts are the same on the two sub-sites. Differences are mainly due to the nature of substratum which is sandy and gravelly on the Loire and silty on the Allier. The plant responses are different and the community type reflects these soil characteristics. The comparison of Figs. 4.87 and 4.88 shows the homology of these grasslands which are generated by the same anthropogenic process of grazing and mowing. During the course of natural development, the differences become indistinct especially in the final step of the successions, represented by hardwood riverine forest. In the early stages of succession, physical and chemical characteristics arc lhe main influence on plani growth. In later stages the vegetation is able to influence its own environment and differences such as soils characteristics can cease to be controlling factors.
4.3.2 Functional vegetation types as predictors of habitat stress
Twelve biological traits of wetland plants were measured quantitatively. Discriminant analysis showed that plants previously categorised as competitive (C), stressed (S) or intermediate (C-S-D) strategists by Grime et al. (1988) exhibited significant differences when compared in terms of statistical analysis of their descriptive biological traits.
Functional grouping of wetland plant populations using traits
Initial partitioning by height was more effective in reducing sum of squares than a random initial partition and therefore bore a better relationship to the final set of group members. Subdivision by height into three groups (en) was the most efficient sum of squares (from the non-hierarchical clustering technique) classification, as assessed from the decay in the difference in the residual sum of squares between successive increases in g. Classifications using a larger number of groups will tend towards subsets of the three group classification.
Centroid dissimilarity classification indicated a strong group fidelity among classified populations. Group sizes at the final step of classification were Gl = 31; G2 = 81 and G3 = 32.
There was a close correspondence between the classifications achieved by sum of' squares and centroid dissimilarity techniques when compared using PCA; only eight objects (5.6% of the total) were classified differently using these techniques. In both cases the 3 groups overlapped little in the ordination, the only grey area of separation being at the interface between groups 2 and 3. Since the clusters produced appear to exhibit internal cohesion and external isolation Ihey should offer a good classification of the studied populations.
An α posteriori assessment of the ecological attributes of the three groups revealed that G1 was separated from other groups by greater mean plant height, plant area, number of leaves and dry weight of stem and leaves. Species in this group included Phragmites australis, Phalaris arundinacea and Urtica dioica. G3 was characterised by plants with a small number of light-weight seeds and low-weight reproductive slructurcs. G3 species included Hydrocotyle vulgaris, Carex arenaria and Cynodon dactylon. G2 populations were morphologically intermediale between G3 and Gl and included Anthoxanthum odoratimi, Agrostis capillari1!, and Holcus lanatus.
Each of the 3 groups, defined on the basis of morphological variables, contained significantly more plants of a certain strategy or mix of strategies, as identified by Grime, than would be expected at random. Over 75% of the plants in Gl were C-stratcgists, the remaining members being from the CS or CD categories. G2 was dominated by intermediates. G3 was a more heterogeneous group consisting of' plants of an intermediate to competitive nature more closely related to G2 than Gl and with a stronger D component than Gl or G2. The close agreement between a classification based solely on morphological
247
traits and that defined from measurements of a more exhaustive collection of variables (Grime et al., 1988) suggests that morphological traits are covariable with life history, phcnological and physiological aspects of the population. For the purposes of classifying the wetland plani populations studied, these aspects appear to be subordinate to the variation in morphology. This implies that easily measured physical attributes of plants can be validly used as the basis fora functional classification of populations.
Classifying European riverine wetland ecosystems using functional vegetation groups
At the start of the linear discriminant analysis between the C and S groups, one variable (KCONC) was selected out because it did not pass the tolerance test (set at P<0.001). Prior to discrimination, the probability that the two α priori groupings of populations were lhe same was P<0.001 (χ- = 33.864. dl' = 12); the C and S populations were thus significantly different using lhe remaining II descriptor variables.
The C and S groups were separated by over 28 units in the linear discriminant function and are thus clearly distinguishable. The main traits that discriminated for competitiveness were dry weight of leaves and height of plant, while the stress tolerant group was separated mainly by the dry weight of reproductive structures. The canonical correlation for the discriminant function was 0.9989. The function hence provides a powerful means of distinguishing between the C and S groups. Retrospective classification of the 13 populations utilised in this analysis, using lhe discriminant function, resulted in correct assignment of all populations to their α priori-defined C or S groups.
At the commencement of a multiple discriminant analysis the C, S and C-S-D groups of plani populations were significantly different (P<0.01, χ -55.1, df = 22). However, after the first discriminant function they were not significantly different (P=0.26. χ-=Ι3.45, df=22). The first discriminant function had a canonical correlation of'0.973 and explained 91.6% of the variance. WTLEAF, HEIGHT and KCONC were the three most important variables that discriminated for competitive plants. The competitive plants were highly distinct from the stress-tolerant plants and plants with an intermediate strategy, being found at the positive end of the first axis. Stress-tolerant plants could not be clearly separated on the first discrimination axis from those with an intermediate strategy. The second axis explained only 8.4% of the variance, had a canonical correlation of 0.778 and was much less powerful in its ability lo discriminale between the three groups of plants. Distinction between S and C-S-D was gained predominantly from this axis. Using the discriminant functions of the first and second axes, all the 23 plant populations were retrospectively classified correctly.
HEIGHT was the first independent variable selected by the stepwise multiple regression to predict competitive ability of the 23 plant populations (P<0.0l, df = 22); this relationship explained 36% of the variation in the strategy score. The second variable to be selected was WTLEAF which improved lhe significance of the relationship (P<0.0001, df = 22). These traits together explained 59% of lhe variation in the C strategy score. The predictive equation was:
Competitive ability = ( HEIGHT x 0.0602) + (WTLEAF x 0.0181 ) + 0.4690
The first variable selected to predict stress tolerance was WTSTEM (P<0.(X)1. df = 22). This relationship explained 49% (r- = 0.49) of the variation in the stress-tolerance scores and was negative (B = -0.01 1) indicating that stress-tolerant plants tend to have a small dry weight of stems. WTSEED was the variable best related to the residual variation of the scores of stress-tolerance. The predictive power of the relationship was improved (P<0.0001, df = 22) and 62% of the variation in lhe stress-tolerance scores was explained in total (r- = 0.62). The equation for the prediction of stress-tolerance was:
Stress-tolerance = (WTSTEM x -0.0101 ) + (WTSEED x 0.0097) + 5.4456
Competitive ability (C-score), calculated for all 144 populations using the above function, varied between 11.4 {Phragmites australis, SMW4) and 0.6 (Aeluropus sp.. SMD2). Stress-tolerance (S-score) varied from 12.3 (Danlhonia decumbens, ILB1) to -3.2 (Urtica dioica, FDC2). Populations of the same species, from different wetland locations tended to have similar strategies. For example, in 1991 Holcus lanatus was measured at eight HGMUs in England, France and Ireland. The C value varied from 3.0 to 5.2 and the S value from 5.3 to 6.5 for these eight populations.
248 -
CFVT values for HGMUs ranged from 18.3 (SMW4) to 1.0 (FDC4, FAPS and SMD2), and SFVT values ranged from 6.9 (ILB1) to -1.8 (SMW4). A highly significant inverse relationship was found between the two independent parameters of CFVT and SFVT (r = -0.73; P<0.001, df = 31). Hence a trade-off is implicit between the competitive ability and stress tolerant ability of' the plant populations within an HGMU.
Further details and a discussion of this approach may be found in Hills et a!. (1994).
Relationship between state variables, FVTs and CORINE biotopes
State variables were found to be significantly interrelated. PCA was therefore used to extract the main axes of variation in the data. Product moment correlation coefficients indicated that the first PCA axis, which explained by far most of the variation in the state variables, was significantly related to BIO (biomass) (P<0.001) and to a lesser extent to DEN (the density of shoots) (P<0.01), while the second axis was related to DIS (distance between shoots) (P<0.001) and SPP (species richness) (P<0.05). The overriding importance of biomass is consistent with previous models of the structural organisation of wetland plant communities, such as the centrifugal model proposed by Keddy (1990).
The eigen values of the CCA ordination were relatively low (axis 1 = 0.128; axis 2 = 0.058), indicating that the majority of variation in the state variables could not be explained by CFVT and SFVT. A Monte Carlo permutation test, however, confirmed the significance of the overall relationship (99 unrestricted random permutations, F ratio = 2.86, Ρ <0.05), although the first axis was not quite significant (99 permutations, F ratio = 3.75, Ρ = 0.06). On a CCA biplot the arrows for CFVT and SFVT pointed in opposite directions, indicative of a strong inverse relationship. The positioning of state variables in the ordination with respect to the biplot arrows indicated that CFVTs were associated with high values for DIS, CAN, STA and DOM. SFVTs were characterised by high DEN, SPP and REPD. Hence there appears to be a set of state variables related to both CFVT and SFVT.
Although biomass could explain much of the variation in the other state variables, when constrained to be related to FVT values it was less important. Even so biomass was still significantly related to CFVT (r = 0.37, P<0.05); plant populations exhibiting strongly competitive strategies tend to have high biomass. One of the main assumptions of Keddy's (1990) centrifugal model was that competition is more intense in sites with greater biomass. A more significant positive relationship was found between the calculated biomass above 20cm (BIO20+) and CFVT (r = 0.56, P<0.001); competitive plants tend to have a greater biomass in the zone above 20cm and should thus have greater potential to outshade their neighbours.
With the exception of sedge beds - a taxonomically diverse biotopc - distinct groupings were obtained in the CCA ordination space for the CORINE biotopes investigated. This means that these biotopes have certain values for measured state variables which can be used to distinguish them from other biotopes. In addition, these biotopes tend to be found in certain regions of the CFVT-SFVT gradient. Humid grasslands were mainly located in the stressed area of this axis, wilh site scores ranging from near the origin to high on the first axis; these scores were related to high values of species richness, reproductive density and plant cover in the three height bands. The reed beds were found at the positive end of the CFVT axis associated with a tall canopy and large, well spaced stems. The 4 mesophile grassland samples were found mid-way along the SFVT biplot; they were associated with a high biomass, density of stems and species richness. These results suggest a strong degree of complementarity between strategy (FVT scores), community-wide descriptors (state variables) and phytosociological units (CORINE biolypes).
The first variable selected in a stepwise multiple regression between CFVT and state variables was the distance between stems (DIS); this variable explained 46% of the variation in the CFVT value (P<0.00001). The second variable was the cover above 20cm (C20+). Together these two variables explained 59% of the variation in CFVT (P<0.00001). The final variable selected was the dominance (DOM), which added a further 7% to the relationship making a total of 66% of the variation in CFVT explained (P<0.00001). The final predictive equation was:
CFVT = (DIS χ 0.0455 ) + (C20+ χ 0.336) + (DOM χ 3.575) + 0.7802
249 -

Evidently there is a highly significant relationship between CFVT and certain state variables. This predictive equation should permit reasonably accurate determination of CFVT using slate variables. More competitive plants tend to be found in communities where stems are widely spaced (high DIS value). However, the degree of accuracy with which DIS could be measured in the field is questionable due to the difficulty of getting the ruler at ground level without disturbing the vegetation, coupled with the requirement to measure the nearest neighbouring shoot, which was not always obvious. The stepwise multiple regression was therefore run without DIS to find the nexl besl equation for predicting CFVT-S. the "-S" denoting that a sub-set of stale variables were used. The first variable selected by the regression was DOM, which explained 28% of the variation in CFVT-S (P<0.00l ). The next variable selected was C20+, which increased the percentage of CFVT-S explained to 41% (P<0.0001). No further variables were significantly related to the remaining variation in CFVT-S. Without DIS, the competitive FVT could be successfully predicted from state variables. The predictive equation for CFVT-S was:
CFVT-S = (DOM χ 6.22) + (C20+ χ 0.352) + 0.75
A strong degree of complementarity was found between the three approaches used to describe vegetational communities; the phytosociological CORINE biotopc units, the community-wide state variables and the mean population competitive and stress-tolerance scores or FVTs. These ihrce methods for describing vegetation represent a hierarchy of approaches from individual populations (strategy), through species abundance within communities (CORINE) to community-wide variables related to size, diversity and architecture.
To improve the relationship between biotopes and FVT values, more sites should be used, particularly from higher biomass areas. A better idea of the biotopc centroid, the range of the biotopc in terms of FVT values and state variables, and the degree of distinction from oilier biotopes could be determined.
Two potential uses of slate variables as indicators and predictors of change in wetlands can be identified:
i. They provide a second, independent and accurate method for lhe determination of CFVT in wetlands. This could be useful as a check, built into the wetland model system, on the CFVT value determined by the measurement of traits from plant populations. Alternatively it could be used as a rapid stand-alone method which does not require the drying of plant samples; CFVT values could be determined on site following a simple calculation using the field-measured slate variables identified in the stepwise multiple regressions.
ii. They provide the potential starting point for an investigation of disturbance, in line wilh lhe model of Grime. In lhe FAEWE wetland sites disturbance was found to be of less importance than either stress-tolerance or competitive ability. It is also likely that the traits which prove to be good indicators ol disturbance tolerance will be related more closely lo reproductive variables and life-form than to morphological features; these trails would be difficult lo measure in the field. However, in many cases, the evidence for historical disturbance may siili bc apparent (e.g. the removal of biomass by grazing or the presence of bare areas at the edge of wave-washed lake shores). State variables related to such observations could be determined and used as predictors of the degree of disturbance at the site and as the basis for a DFVT index.
4.3.3 Invertebrate databases
The main objective in the analysis of invertebrate fauna was the dcvelopmcnl of a procedure i) to assess the nature conservation function of riverine wetland sites and ii) lo predict community changes under different types of impact. This resulted in the sel up of a general assessment procedure, which is tested by means of the site data.
The use of invertebrate assemblages for habitat assessment
Among the already existing procedures developed for such purposes, two types of approach can be recognised:
The first type incorporates the use of models relating the occurrence and/or abundance of species to definite environmental parameters. These models arc then used lo predict lhe fauna thai can be expected at a given site. The assessment procedure is then based on the comparison of the predicted and observed
- 250

faunas. One of the most documented and operational example is the RIVPACS system developed for the assessment of British rivers, whereby the expected aquatic macroinvertebratc fauna of a given river site is predicted by a set of physico-chemical variables (Moss et al., 1987; Wright et al., 1989, 1993). Olhcr recent attempts to base predictive monitoring models of invertebrate fauna on selected environmental variables include Eyre et al. (1993) (water beetles and climatic variables) or Savage (1994) (water bugs and water conductivity).
The second type of approach has a more integrative or holistic nature and relics on the use of biological or ecological traits of the species, or on their habitat preferences. Attempts to use invertebrate traits for conservation or management purposes can be found in the works of Bink and Siepel (1986) and Denis and Shrieve (1991) on butterflies, or Siepel and van de Bund (1986) on grassland microarthropods. The approach has been inserted in a structured and coherent framework by Keddy (1992) for plant communities. He proposed to use species traits to derive sets of rules "to predict which subset of the total species pool for a given region will occur in a specified habitat".
Taking into account the preceding works, an integrative type of approach based on three elements has been adopted: i) the regional list of species for a given invertebrate group is used as the "species pool" from which on-site species are potentially derived. This regional list provides the reference point against which each site can be assessed and from which predictions can be made. ii) the prediction mechanism is triggered by the inventory of habitats actually occurring on site and the habitat preference of the species. iii) data bases are set up, storing the habitat preferences, ecological traits and status of the species from the regional list.
The three faunal groups considered
Speight (1986) proposed criteria for the selection of insects to be used in assessment and conservation procedures. Following some of his guidelines, three invertebrate groups were selected on the basis of their known indicator potential for key processes operating in wetland ecosystems. They cover a wide range of life strategies, dispersal abilities and feeding modes. i) The Mollusca have a low mobility, are highly dependent on micro-habitat characteristics and comprise terrestrial, semi-aquatic and truly aquatic species. Most of them cat fresh or decomposed plant material, although a small number of species can be predatory. ii) The Coleóptera from lhe family Carahidae (ground beetles) comprise both winged and wingless adult species. Both larvae and adults are terrestrial and mostly predatory. iii) The Diptera from the family Syrphidae (hoverflies) have flower feeding adults, which play a prominent role in flower pollination. Their larvae can be found in a wide range of ecological conditions within the soil, on or within plant material, in decaying organic matter or in water. They can be either plant feeders, saprophagous or predatory. Due to their differences in mobility and life cycle, the three groups also have the potential to provide relevant information at complementary spatial and temporal scales. The use of these three groups also aids in integrating analysis of aquatic and terrestrial elements of wetland systems, since the groups selected include both fully terrestrial and aquatic species and many which arc sub-aquatic. This inlegrative function of invertebrates as tools in wetland studies is manifest at its extreme in species which are aquatic/sub-aqualic during one developmental phase and lerrestrial in another.
Development of an assessment procedure based on the prediction of species assemblages
The flow diagram in Fig. 4.89 illustrates, in the case of the Syrphidae, one possible way of coupling the information stored in the dala bases to construct an assessment procedure.
As a central feature of this mechanism it was decided to consider the regional list of species as the reference point against which the lists of species sampled on the sludy sites were to be compared. The How diagram provides an example of how such a regional list can be used i) to link different parts of the data bases and ii) to provide a list of expected species against which to compare the species list recorded on site:
251 -
- 1 - the species associated with the habitats recognised on site arc extracted from the regional list (use of the habitat file); - 2 - the species potentially in flight at the time of the field survey arc extracted from the list obtained in 1. This provides a list of predicted species for a given site and a given sampling period (use of the flight period data from the trait file); - 3 - the list of species actually observed during the field survey is then compared with the list of predicted species obtained in 2. This comparison can be carried out using various criteria such as lhe species numbers, the species composition or a more functional approach using the traits, habitat or status representation of the encountered species. Actual examples of this procedure are provided in the following sections describing the Syrphid and Mollusc databases.
The Syrphid Database (Diptera:Syrphidae)
Establishment of the syrphid database To provide a standard wilh which the site data could be compared, reliable regional species lists for Ireland and central France were compiled. The Irish list essentially existed already (Speight, 1978, 1985) and required only updating by addition of two species (Speight and Nash, 1993). Due to the inadequate state of knowledge of the French syrphid fauna, compilation of the syrphid list for central France had to be subsumed into a revision of the list for France as a whole. The first part of this revision is now published (Speight, 1993), the second is in press (Speight, in press) and the third part is nearing completion. This revision incorporates addition of more than 40 species to the French fauna and includes a provisional categorisation of the 430 French species into status categories for France, an clement required for direct application in the site assessment procedure and not otherwise available. The syrphid list for central France, no equivalent of which existed previously, now comprises more than 200 species and is in course of preparation for publication.
The 286 species which make up the combined list of Syrphidae for Ireland and central France are the sci of species for which the syrphid data base is being developed. Because all of the syrphids occurring in each region are included, the data base can be employed with equal facility in investigation of sites of any type in Ireland or central France, not just those of river marginal wetlands. It is, in any case, unrealistic to attempt functional analysis of wetland systems without regard for the interactions between these systems and other elements of the landscape surrounding them. Data for aJJ syrphid species occurring in the regions studied have thus been deemed necessary to include in the database, to aid in detection and interpretation of such interactions. Addition of the relevant data for the species occurring in another region of Europe would render this approach also useable there, so thai, theoretically at least, the approach allows for extension of the methodology to any part of Europe for which reliable regional lisls are available.
Four major data files have been compiled and are now in use. These files contain entries for each attribute coded, for all of the 286 species. They characterise each species in terms of preferred habitat, biological traits (sensu lato), range and status and they record where each species has been found at regional level and on which target site. The categories coded in each file have been given in the description of the database set up (3.7.1 ).
The syrphid species data-file Recorded in this file is the occurrence of each species in each region and on each site investigated. There is a certain degree of latitude in deciding what constitutes a region. For development of' the assessment procedure, the region has been taken as the area surrounding a site which provides the species pool from which the site fauna has been derived. Defining the region in this way makes it possible to use its fauna as a basis for identifying the potential fauna of a site, for comparison with the observed fauna of that site. A narrow interpretation of this regional concept which took into consideration only the fauna existing in the immediate vicinity of the site at the present time was not regarded as adequately expressing the potential origins of a site fauna and a more all-embracing interpretation has been employed. This allows inclusion in the region of all of the surrounding territory where a similar geology, topography and climate prevail. The entire island of Ireland is thus taken as the region from which the fauna of any Irish site niighl reasonably be derived. The part of France constituting the central France region recognised here comprises the Départements Allier, Cher. Côte d'Or. Indre, Indre-et-Loire. Loiret. Loir-et-Cher, Nièvre,
- 252 -

SaôneetLoire and Yonne. This is then taken as the area from which the fauna of the French sites (in
Cher and Nièvre) has been derived.
( Λ REGIONAL LIST OF
SPECIES
Habitat
preferences of
the species
Ecological
attributes of the
species
I Flight season
HABITAT TYPES OCCURRING ON
SITE
I List of predicted species
List of predicted species for a given
sampling date
I LIST OF OBSERVED "\
SPECIES FOR A GIVEN DATE (field data)
COMPARISON Λ
observed vs. predicted 1. species numbers
2. species composition
3. habitats, traits and status representation
Τ SITE
ASSESSMENT
Figure 4.89 Potential use of the comparison between predicted and observed lists of species in a site
assessment procedure
The syrphid habitats data-file
In compiling the habitat array employed, particular attention has been given to the requirement for
development of a system which nonexperts can use wherever possible. In this context, the objective is to
design a system for the survey of syrphid habitats which can be reliably carried out on a site by non
253

experts as part of the assessment procedure being developed. Syrphidae prove to be a useful tool in this regard, since there is a high correlation between site features recognisable by the human eye and differentiation of syrphid habitats.
The syrphid traits data-file The traits data encoded refer to attributes of" both the adult flies and their developmental stages. Since the developmental stages are relatively immobile and considerably more habitat specific than the adults, for the larvae it is possible to score microhabital/niche information in the traits file. The extent to which different microhabitats are occupied helps to identify components of a habitat which are active or inactive. Similarly, representation of commensal species helps to identify sites which have remained undisturbed for prolonged periods. Generation time also has a bearing on stability of site conditions, only polyvoltine species being able to survive on sites subject to rapid change. Another trait based on larval development is inundation tolerance, determined by reference to morphological characters of the external respiratory processes, which show different characteristics in aquatic, subaquatic and terrestrial syrphid larvae. One trait of the adult flies which has already proved to be of major utility is flight season. Initially, this was scored on a monthly basis, using data for western Europe in general. But its use in this condition threw up anomalies traceable to differences between the flight season of certain species in Ireland and central France, and demonstrated a need to record flight season data over two-weekly intervals, rather than in units of one month. The flight season data in the traits file have been revised accordingly. As use of individual trails in the assessment procedure is more comprehensively explored, it is to be anticipated that a need for similar refinements will be detected, even though expression of other traits is unlikely to vary significantly from region nto region in the way flight season does. Also, the number of Iraits encoded is likely to increase as the potential use of additional types of information becomes evident. Servicing and development of the traits file would seem likely to require progressively more time and expert attention as use of the assessment procedure becomes established.
The syrphid range and status data-file Presence or absence of "threatened" species has become generally employed in assessing sile quality for conservation purposes. But encoding available information about species range and status involves a series of arbitrary decisions which arc unavoidable. This problem is particularly evident in respect of the species status data. Until and unless some general accord is arrived at in Europe, as to the units of geographic area that should be employed in considering the threat categories to which species should be consigned, such decisions must remain arbitrary. For instance, if priority were to be given lo assessment of the significance of a site in a local government context, such as thai of the individual Irish Counly or French Departement, it would be preferable to code each species in terms of' its status in each Counly or Departement. Similarly, it might be regarded as desirable to consider the status of species in each NUTS (nomenclature of territorial units for statistics. Eurostat 1990) region. Some of these exercises would he much more time consuming than others. For instance, available distribution data do not relate to NUTS regions, so species status in NUTS regions could not be coded without first reworking each distribution record to determine from which NUTS region it is derived. It could be anticipated thai fulurc development of the range and status file could well entail rccoding the status of all species in a number of different ways, in addition to those encoded at present.
Use of the syrphid database A central feature of the assessment procedure being developed is comparison between the observed fauna of sites and their potential fauna, the potential fauna being derived from coupling lhe habitats file data with the regional list, to give a list of species occurring in the region that arc potentially capable of occupying the habitats represented on-site. This first step provides cnlry to the process of' use of' the data base in evaluation of the site as it is, in prediction of how the sile might be improved in respect of some specified objective and in prediction of how the site might change in response to some specified impaci. Because subsequent steps in the procedure are to such an extent dependent upon this basic comparison, preliminary work with the syrphid database has focused particularly on ways in which il can be carried oui with maximal efficiency.
A first consideration in comparing observed and predicted site faunas is to take into account the ways in which the biology of syrphids can influence results. One such feature of syrphid biology is the mobility of the adult insects. This ensures thai some of the adult Syrphidae observed on a site will be derived from habitats adjacent to the site. This can be accommodated by recording the habitats predominant in the vicinity of the site and removing syrphids associated with those habitats from the sile list for certain
254

analyses. However, this component of the site list requires to be included in predicting changes in the
constitution of a site fauna, since it provides an indication of which habitats are likely to contribute species
to an altered site via immigration. A second such feature is flight season. With different species on the
wing at different times of the year, comparison of observed and predicted site faunas requires to take into
consideration the time of year that a site survey has been conducted. Coupling the flight season data file
with the regional list and the habitats file can achieve the required effect, by ensuring that only species on
the wing in that region at the time of the survey contribute to the fauna predicted for the site.
Once observed and predicted site faunas are available it becomes possible to consider questions of habitat
occupancy and to bring the traits and status data files into the comparison process. Consideration of
interactions between a great many different species attributes and the extent to which various
combinations are manifest in the observed and predicted faunas is possible. So far, these various
interaclions and their interpretation have not been comprehensively investigated - at this level use of' the
syrphid data base is still largely experimental.
Data from the FAEWE site at Decize, on the Loire (Nièvre, France), can be used to illustrate the progress
made to date, in applying the syrphid database to problems relating to the "nature conservation function"
in a river marginal wetland context. Fig. 4.90, Α-C shows the representalion of the central France species
pool for end May/beginning June among the observed fauna collected end May/beginning June on the
Decize site, the percentage representation of the species pool associated with each habitat type being
given as a separate column. Fig. 4.90 gives an overview of how the syrphid fauna indigenous to the
Decize site reflects the regional fauna and how its ecological balance differs from thai of the regional
fauna. It will be noted (Fig.4.90A) that the alluvial softwood (Altuts, Populas, Salix) forest fauna is much
better represented on the Decize site than is the unimproved pasture fauna (Fig.4.90C). Such information
can be used in consideration of such questions as which parts of a site arc most important to maintain in
their present condition/under existing management regimes. Fig. 4.90 also provides a visual
representation of the ecological amplitude of the existing site fauna, of use in predicting the response of
the site to change. An extreme is indicated by Pinus plantation - none of the syrphids occurring on the site
at present would be expected to survive its conversion inlo a plantation of pines. Results in Fig.4.91 raise
the question of poor representation of unimproved pasture fauna by illustrating the extent of
representation of the unimproved pasture fauna associated with different larval microhabitats. The
contingent with larvae which use animal dung in unimproved pastures is virtually complete on the Decize
site. Since the same species can use decaying vegetable matter in water, they appear also in the "wet
debris" and "submerged debris" categories, even though these particular microhabitats are unlikely to
provide for their larvae on the pasture at Decize with any frequency. By contrast, species with
phytophagous larvae living in bulbs, root bases and stems of non-woody plants are the least well
represented of the microhabitat contingents contributing species to the picture. Entirely absent are species
using the woody parts of trees, or tree foliage. Although it is notoriously difficult to find statistical tools
to test the strength of negative correlations, it would seem reasonable to suggest that lhe absence of
species using the woody parts of trees is due simply to the general absence of this microhabitat from
unimproved pasture. Similarly, since nearly all of the species with larvae using bulbs, stem-bases and
plant stems fall also into the category of poor larval tolerance to flooding (demonslraled by use of the
inundation-tolerance data in the traits datafile), it seems likely that grassland on active floodplains will
everywhere prove to have a depauparate fauna of syrphids with bulb and stem-base inhabiting larvae. If
so, the management implication would be that attempts to improve site quality for such organisms are
unlikely to succeed in active floodplain locations to the extent that they could on sites not subject to
Hooding.
Comparisons between sites, particular habitats on different sites, or regions are also possible. In Fig.4.92
the representation of the end May/beginning June regional species pool on the Decize and Apremont sites
is compared, for forest habitats. This suggests there is little difference between the degree of
representation of alluvial softwood forest fauna on the two sites, but investigation of the traits balance of
the represented species could well demonstrate differences not detected at habitat level. Similarly, the
threat status of these two faunas requires to be assessed before any conclusion could be reached on their
overall similarity. Such interactions between the various elements of the database are still under
investigation. Initial results are reported in Castella et al (in press), Castella and Speight (in press) and
Speight and Castella (in press).
- 255
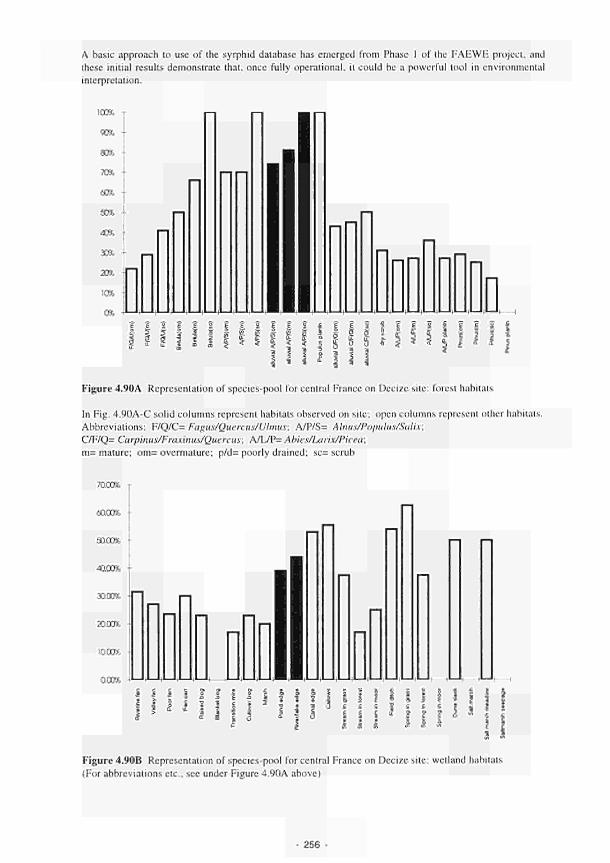
A basic approach to use of the syrphid database has emerged from Phase 1 of' the FAEWE project, and
these initial results demonstrate that, once fully operational, it could be a powerful tool in environmental
interpretation.
ι £ Ι S | ¡¡ f î î | i i S E £ ï I ! ï M M »
1 Ι ι ì ? ι 1
I ί ï I 2 ï ξ I ? f s i
5 s I í i i i« i * I
Figure 4.90A Representation of speciespool for central France on Decize sile: forest habitats
In Fig. 4.90AC solid columns represent habitats observed on site; open columns represent other habitais.
Abbreviations: F/Q/C= Fagus/Quercus/Ulmus; A/P/S= Alnus/Populus/Salix;
C/F/Q= Carpinus/Fraxinus/Quercus; A/L/P= Abies/Larix/Picea;
m= mature; om= overmature; p/d= poorly drained; sc= scrub
Ç Ç Ç fc
ï ΐ I 3 a u. * S ï I
S S d
ï 41 ? 3 s .s s ï t t e ? , j ï I l a ι ι ι
ä ι ι ? á
s I «
I I I I II« ¡1
Figure 4.90B Representation of speciespool for central France on Decize site: wetland habitats
(For abbreviations etc., see under Figure 4.90A above)
256
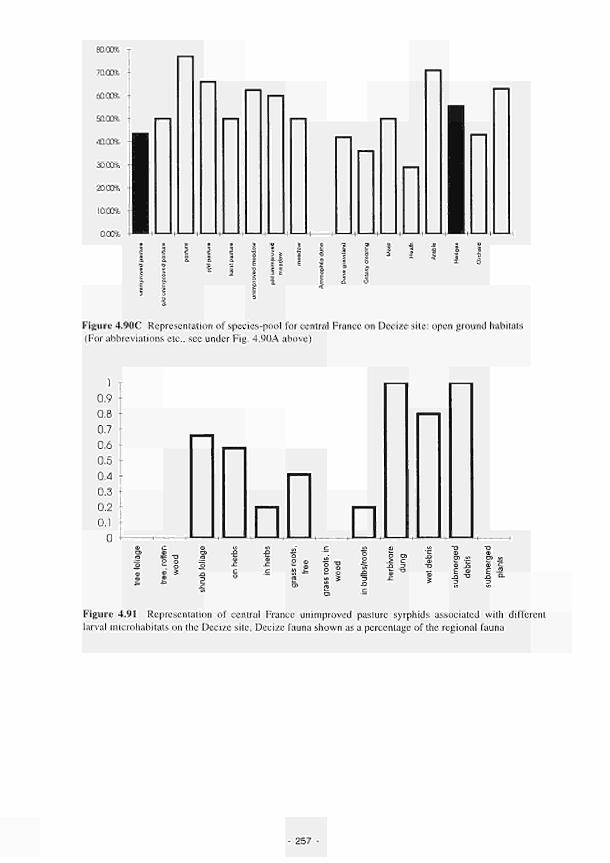
70.00%
ι π 2 S
Figure 4.90C Representation of species-pool for central France on Decize site: open ground habitats
(For abbreviations etc., see under Fig. 4.90A above)
1
0.9
0.8
0.7
0.Ó
0.5 τ
0.4
0.3
0.2
0.1
0 Π π Η 1
XI —
Figure 4.91 Representation of central France unimproved pasture syrphids associated with different
larval microhabitats on the Decize site, Decize fauna shown as a percentage of the regional fauna
257 -
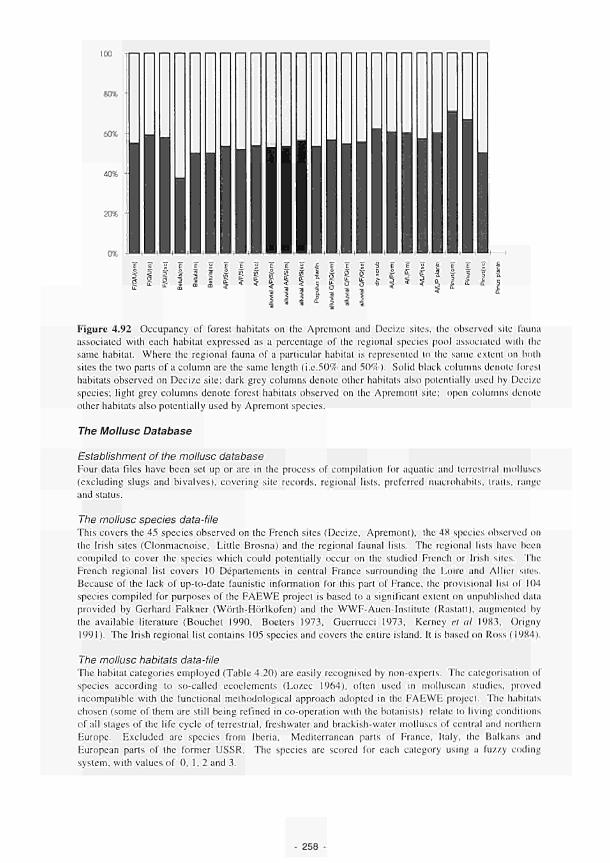
60··:
1 g ι Μ Μ I ï ! Κ π * 5 3 3 ΐ _ 1 ι
1 Ι j I | J j
I I I I I
Figure 4.92 Occupancy of forest habitats on the Apremont and Decize sites, (he observed site fauna associated with each habitat expressed as a percentage of the regional species pool associated wilh the same habitat. Where the regional fauna of a particular habitat is represented to the same extent on bolli sites the two parts of a column are the same length (i.e.50% and 50%). Solid black columns donóle forest habitats observed on Decize site; dark grey columns denote other habitals also potentially used by Decize species; light grey columns denote forest habitats observed on the Apremont site; open columns denote other habitats also potentially used by Apremont species.
The Mollusc Database
Establishment of the mollusc database Four data files have been set up or are in the process of compilation for aqualic and lerrestrial molluscs (excluding slugs and bivalves), covering site records, regional lists, preferred macrohabits, trails, range and status.
The mollusc species data-file This covers the 45 species observed on the French sites (Decize, Apremont), the 48 species observed on the Irish sites (Clonmacnoise, Little Brosna) and the regional faunal lists. The regional lists have been compiled to cover the species which could potentially occur on the studied French or Irish sites. The French regional list covers 10 Départements in central France surrounding the Loire and Allier sites. Because of the lack of up-to-date faunistic information for this pari of France, the provisional list of 104 species compiled for purposes of the FAEWE project is based to a significant extent on unpublished dala provided by Gerhard Falkner (Wörth-Hörlkofen) and the WWF-Auen-Institutc (Rastatt), augmented by the available literature (Bouchet 1990, Boeters 1973, Guerrucci 1973, Kerncy et al 1983, Origny 1991). The Irish regional list contains 105 speciesand covers the entire island. It is based on Ross (1984).
The mollusc habitats data-file The habitat categories employed (Table 4.20) are easily recognised by non-experts. The categorisation of species according to so-called ecoelements (Lozec 1964), often used in molluscan studies, proved incompatible with the functional methodological approach adopted in the FAEWE project. The habitats chosen (some of them are still being refined in co-operation with the botanisls) relaie to living conditions of all stages of the life cycle of terrestrial, freshwater and brackish-water molluscs of central and northern Europe. Excluded arc species from Iberia, Mediterranean parts of France, Italy, the Balkans and European parts of the former USSR. The species arc scored for each category using a fuzzy coding system, with values of 0, 1, 2 and 3.
258 -

brackish water mudflats supralittoral groundwater crenal (springs / spring brooks ) running waters without macrovegetation running waters with macrovegetation ponds / backwaters lakes reeds / temporary waters fens / intermediate mires floodplain meadows dry grassland floodplain forest / fen woodland humid deciduous forest dry deciduous forest / scrub coniferous forest cliffs / walls rocks / screes
Table 4.20 Habitat data-file categories for molluscs
The mollusc traits data-file External morphology and reproductive strategies reflect the tolerance of species to wet or dry conditions; food type and microhabitat provide insights into functioning of the RMWs. The choice of categories (Table 4.21) reflects the information generally available about molluscan biology and the unpublished data which has been made available by an expert source (G.Falkner pers. comm.). The process of scoring the species for each category is still in progress.
The mollusc range and status data-file The distribution categories used to characterise the range of different molluscs are derived from the biogeographic work of Freitag ( 1962) and Oberdorfer ( 1983). Use has also been made of the report on the status of European molluscs by Wells and Chatficld (1992), taking into account the tentative nature of the conclusions reached because of the variable quality of the available data (Table 4.22). There is need for a significant input from local specialists in order to complete the scoring process (3.7.1 ) for all species covered.
Use of the mollusc database Coupling of the species and macrohabitats data files allows prediction of changes in the molluscan fauna and deduction of changes which have occurred in local habitats at the RMWs as a consequence of environmental stress. This can be exemplified using data from the Irish sites.
The macrohabitats observed at HGMUs on the Little Brosna and Shannon sites were as follows:
crenal (springs/brooks) flowing water with macrovegetation reed beds/temporary waters floodplain meadows (callows)
In Fig. 4.93 the proportion of the fauna associated with each habitat is compared for the observed and predicted faunas of the sites. On the Shannon site the greatest similarity between observed and predicted faunas was obtained for the flowing water with macrovegetation habitat. The proportion of the fauna associated with crenal and reedbed/temporary water habitats was greater for the observed fauna than the predicted fauna, while the observed component of the fauna for floodplain meadow was smaller than thai predicted. On the Little Brosna site, the proportional representation of floodplain meadow and crenal habitats shows greatest similarity between observed and predicted faunas. For flowing water with
259 -
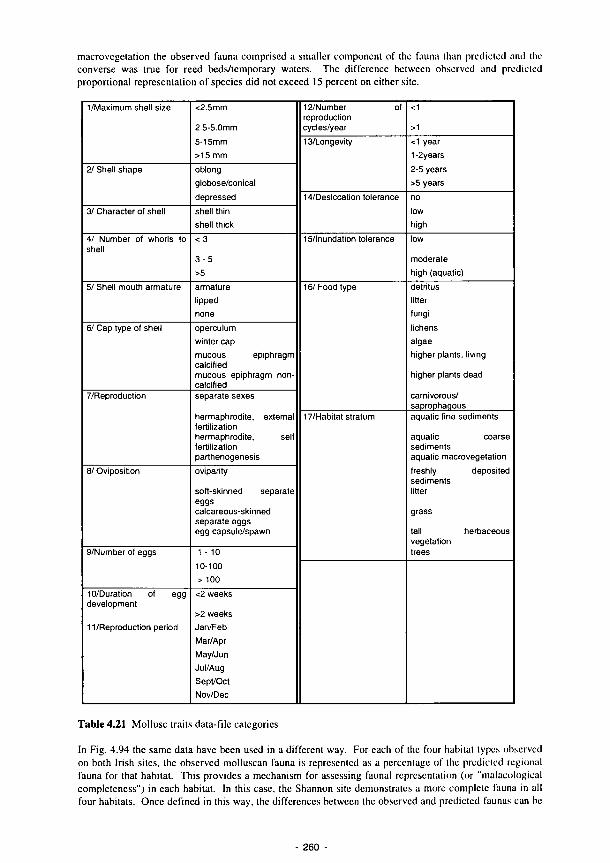
macrovegetation the observed fauna comprised a smaller component of the fauna than predicted and the converse was true for reed beds/temporary waters. The difference between observed and predicted proportional representation of species did not exceed 15 percent on either site.
1/Maximum shell size
2/ Shell shape
3/ Character of shell
4/ Number of whorls to shell
5/ Shell mouth armature
6/ Cap type of shell
7/Reproduction
8/ Oviposition
9/Number of eggs
10/Duration of egg development
11/Reproduction period
<2.5mm
2.5-5.0mm
5-15mm
>15 mm
oblong
globose/conical
depressed
shell thin
shell thick
< 3
3 - 5
>5
armature
lipped
none
operculum
winter cap
mucous epiphragm calcified mucous epiphragm non-calcified separate sexes
hermaphrodite, external fertilization hermaphrodite, self fertilization parthenogenesis
ovipanty
soft-skinned separate eggs calcareous-skinned separate eggs egg capsule/spawn
1 - 10
10-100
> 100
<2 weeks
>2 weeks
Jan/Feb
Mar/Apr
May/Jun
Jul/Aug
Sept/Oct
Nov/Dec
12/Number of reproduction cycles/year
13/Longevity
14/Desiccation tolerance
15/lnundation tolerance
16/Food type
17/Habitat stratum
<1
>1
<1 year
1 -2years
2-5 years
>5 years
no
low
high
low
moderate
high (aquatic)
detritus
litter
fungi
lichens
algae
higher plants, living
higher plants dead
carnivorous/ saprophagous aquatic fine sediments
aquatic coarse sediments aquatic macrovegetation
freshly deposited sediments litter
grass
tall herbaceous vegetation trees
Table 4.21 Mollusc traits data-file categories
In Fig. 4.94 the same data have been used in a different way. For each of the four habitat lypes observed on both Irish sites, the observed molluscan fauna is represented as a pcrccnlage of the predicted regional fauna for that habitat. This provides a mechanism for assessing faunal representation (or "malacological completeness") in each habitat. In this case, the Shannon site demonstrates a more complete fauna in all four habitats. Once defined in this way, the differences between the observed and prcdiclcd faunas can be
- 260 -
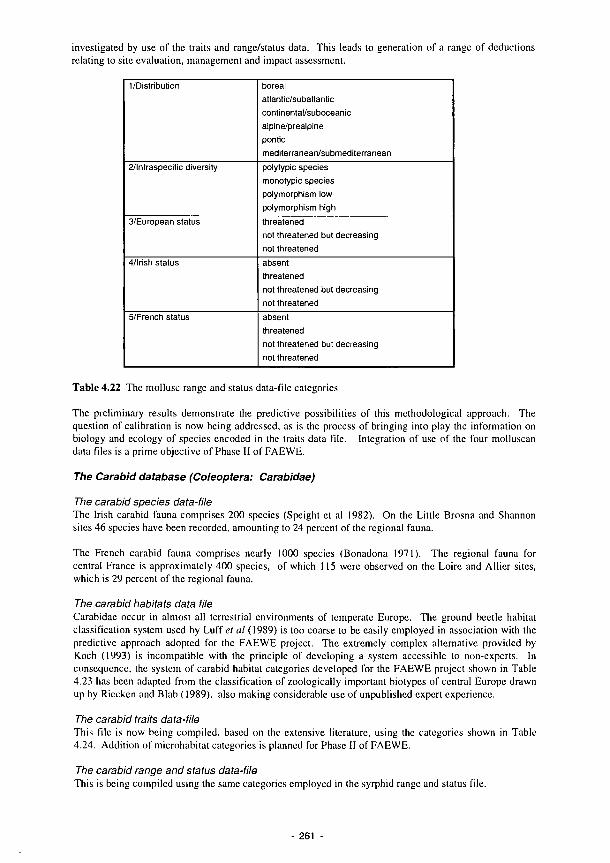
investigated by use of the traits and range/status data. This leads to generation of a range of deductions relating to site evaluation, management and impact assessment.
1/Distribution
2/lntraspecific diversity
3/European status
4/lrish status
5/French status
boreal atlantic/subatlantic continental/suboceanic alpine/prealpine pontic mediterranean/submediterranean polytypic species monotypic species polymorphism low polymorphism high threatened not threatened but decreasing not threatened absent threatened not threatened but decreasing not threatened absent threatened not threatened but decreasing not threatened
Table 4.22 The mollusc range and status data-file categories
The preliminary results demonstrate the predictive possibilities of this methodological approach. The question of calibration is now being addressed, as is the process of bringing into play the information on biology and ecology of species encoded in the traits data file. Integration of use of the four molluscan data files is a prime objective of Phase II of FAEWE.
The Carabid database (Coleóptera: Carabidae)
The carabid species data-file The Irish carabid fauna comprises 200 species (Speight et al 1982). On the Little Brosna and Shannon sites 46 species have been recorded, amounting to 24 percent of the regional fauna.
The French carabid fauna comprises nearly 1000 species (Bonadona 1971). The regional fauna for central France is approximately 400 species, of which 115 were observed on the Loire and Allier sites, which is 29 percent of the regional fauna.
The carabid habitats data file Carabidae occur in almost all terrestrial environments of temperate Europe. The ground beetle habitat classification system used by Luffe/ al (1989) is too coarse to be easily employed in association with the predictive approach adopted for the FAEWE project. The extremely complex alternative provided by Koch (1993) is incompatible with the principle of developing a system accessible to non-experts. In consequence, the system of carabid habitat categories developed for the FAEWE project shown in Table 4.23 has been adapted from the classification of zoologically important biotypes of central Europe drawn up by Riccken and Blab (1989), also making considerable use of unpublished expert experience.
The carabid traits data-file This file is now being compiled, based on the extensive literature, using the categories shown in Table 4.24. Addition of microhabitat categories is planned for Phase II of FAEWE.
The carabid range and status data-file This is being compiled using the same categories employed in lhe syrphid range and status file.
261

Shannon
60
40
20 m Observed
□ Predicted
• s* ν £~ "5 "5
Little Brosna 601
MÛ Observed
Π Predicted
σ» en T3 t ·
Figure 4.93 The proportion of observed and predicted species of molluscs
Little Brosna D Shannon
100
Crenal Flowing water R ^ a f i a Floooplam
anc vegetation ternoorarv wale' meadow
Figure 4.94 The proportion of the number of observed species which were actually predicted and the number of predicted species of molluscs
262

Spülsäume (Genist) Offene Schlammbänke Offene Sandbänke Offene Kiesbänke Pioniervegetation Hochstaudensäume Röhrichte Weidengebüsch Silberwiedenwald Hartholzauenwald Mesophiler Laubwald Hecken, Gebüsche Moorwiesen Feuchtwiesen Frischwiesen Weiden Trockenrasen Dünen Äcker, Felder
Open muddy banks Open sandy banks Open gravel banks Pioneer vegetation Tall herbaceous vegetation Reeds Salix scrub Softwood forest Hardwood forest Mesophilous deciduous forest Hedges, scrub Callows Wet meadows humid meadows Pasture Dry grassland Sand dunes Arable fields
Table 4.23 Carabid habitat data-file categories
Use of the carabid database Experimentation with use of the carabid database is only now beginning. Initial exploration is reported in Castella et al (in press).
Exploration of the relationships between elements of the data bases
The storage of information on the ecology of groups of invertebrates provides many opportunities to explore the relationships between the distribution of species among the wetland habitats and aspects of their ecology.
In this respect, we have used the possibilities offered by a recent ordination technique ("inter-battery analysis" or "co-inertia analysis", Chessel and Mercier, 1993; Bornetle et al., in press) to test the significance of the relationship between syrphid species distribution among habitats and their ecological trails. As an example, Fig. 4.95 provides the result of the simultaneous ordination of a data table storing the distribution of 65 syrphid species among the 18 habitats recognised on the Decize (Loire) and Apremont (Allier) sites, and an excerpt from the trait data base providing the trait information for these 65 species. One of the main outputs of this analysis is a picture of the similarities of the habitats from the two sites, not in terms of species composition but of trait representation. Hence this technique provides a more functional picture of the differences between sites than a traditional analysis of the species content of each site or habitat. An important part of the procedure is a test which compares the eigen values actually observed in the inter-battery analysis (i.e. the information explained in the analysis) with the eigen values generated from similar analyses derived from random permutations of the lines of the matched tables (here 100 permutations, Fig. 4.96). This test demonstrates that the eigen values observed in the inter-battery analysis arc higher than those obtained in the random permutations, evidencing the significance of the relationship between species distribution among habitats and species traits in the case of the data used here. Such an exploration enables us to validate the use of both species occurrence data (derived from field surveys) and knowledge representation data.
4.3.4 Impacts of desiccation and salinisation on vegetation
Specific impacts, unique to the semi-arid environment, were studied at the Spanish sites. The work concentrated on assessing the effects of desiccation and salinisation on ecological processes.
- 263
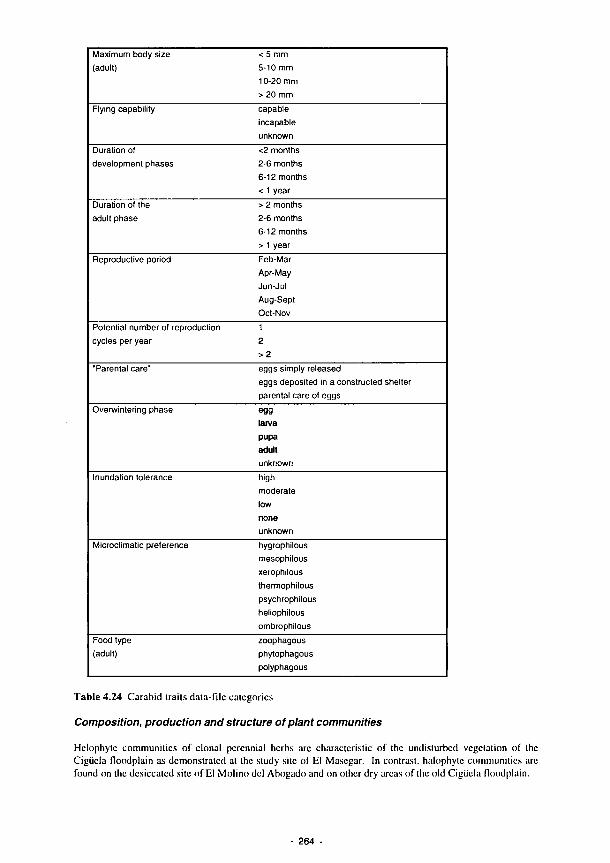
Maximum body size
(adult)
Flying capability
Duration of
development phases
Duration of the
adult phase
Reproductive period
Potential number of reproduction
cycles per year
■Parental care"
Overwintering phase
Inundation tolerance
Microclimatic preference
Food type
(adult)
< 5 mm
5-10 mm
10-20 mm
> 2 0 m m
capable
incapable
unknown
<2 months
2-6 months
6-12 months
< 1 year
> 2 months
2-6 months
6-12 months
> 1 year
Feb-Mar
Apr-May
Jun-Jul
Aug-Sept
Oct-Nov
1
2
> 2
eggs simply released
eggs deposited in a constructed shelter
parental care ol eggs
egg
larva
pupa
adult
unknown
high
moderate
low
none
unknown
hygrophilous
mesophilous
xerophilous
thermophilous
psych rophilous
heliophilous
ombrophilous
zoophagous
phytophagous
polyphagous
Table 4.24 Carabid traits data-file categories
Composition, production and structure of plant communities
Helophytc communities of clonal perennial herbs are characteristic of the undisturbed vegetation of the
Ciguela floodplain as demonstrated at the study site of El Masegar. In contrast, halophytc communities arc
found on the desiccated site of El Molino del Abogado and on other dry areas of the old Cigiicla floodplain.
264 -

Lpo
Lri
Asp
n Apa J rjH.7
.4
Apd
Apo
i Ari
Lar Amc
Lup
„Asc Lhc
Lov
» Aov
Ama
■ Ahc
F l x F 2
'4, ^ //
'2
4 · 3
1
Microhabitat
3 2
Food type
Figure 4.95 First factorial plane of interbattery analysis (occurrence of 65 syrphid species in 18 habitats
vs. ordination of die same species on the basis of 7 biological traits; only 4 of the traits are represented,
their categories are numbered according to Table 3.11). A = Allier site (Apremont); L = Loire site
(Decize); ov = overmature alluvial Alnus/Populus/Salix forest; ma = same type mature; sc = same type
scrub; po = pond; ri = river edge; sp = spring/flush in grassland; pa = pasture; up = unimproved pasture;
pd = poorly drained pasture; me = meadow; ar = arable crop; he = hedges.
265
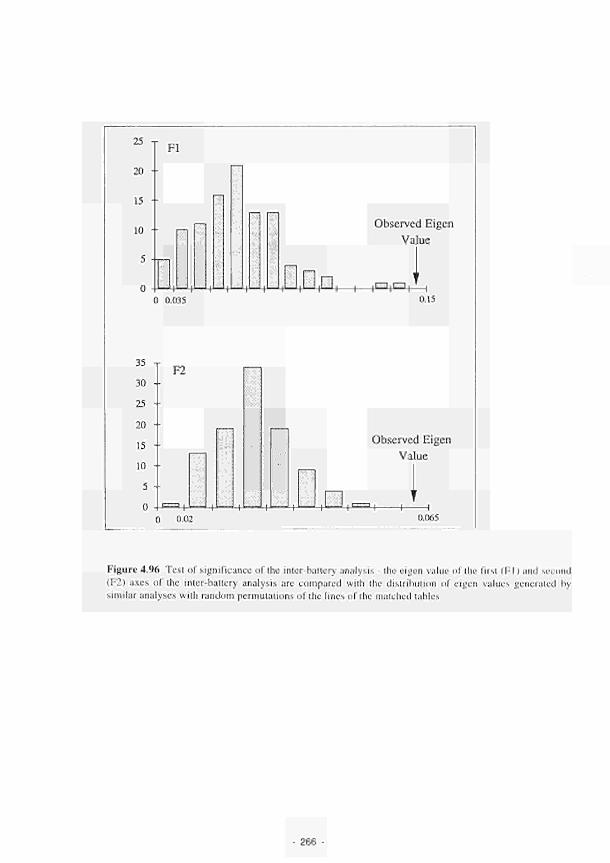
Fl 25 γ
20
15
io
Ma I 1 — 3 1 1 — ' \
Observed Eigen
Value
Η rEä+JSLi ,
0 0.035 0.15
35
30
25
20
15
10
5
0
F2
Observed Eigen
Value
0.02 0.065
Figure 4.96 Test of significance of the interbattery analysis the eigen value of" the l'irsi (Fl) and second
(F2) axes of the ¡nlerbaltery analysis are compared with the distribulion of eigen values generated by
similar analyses with random permutations of the lines of the matched tables
266
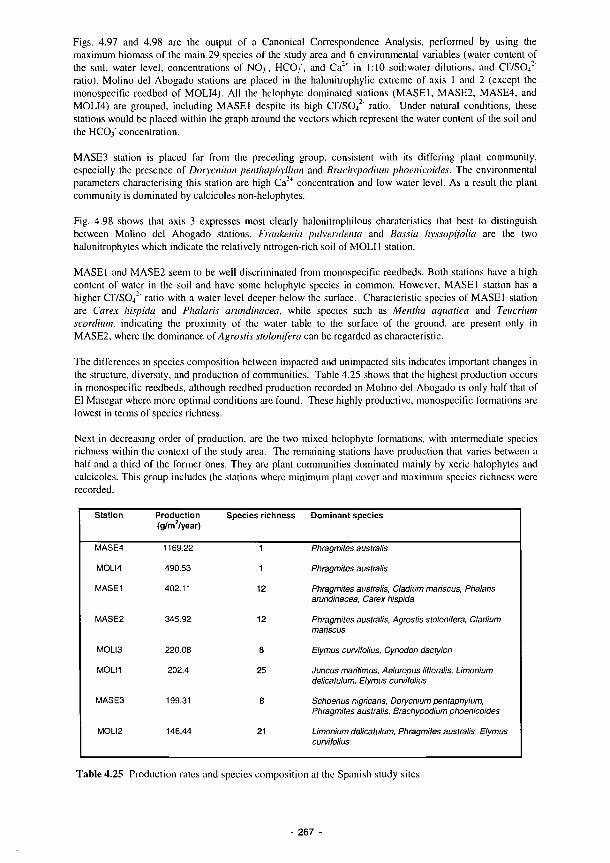
Figs. 4.97 and 4.98 are the output of a Canonical Correspondence Analysis, performed by using the maximum biomass of the main 29 species of the study area and 6 environmental variables (water content of the soil, waler level, concentrations of NO3", HCO3", and Ca"+ in 1:10 soihwater dilutions, and CI/SO4"" ratio). Molino del Abogado stations are placed in the halonitrophylic extreme of axis 1 and 2 (except the monospecific reedbed of MOLI4). All the helophyte dominated stations (MASE1, MASE2, MASE4, and MOLI4) are grouped, including MASE1 despite its high CI/SO4"" ratio. Under natural conditions, these stations would be placed within the graph around the vectors which represent the water content of the soil and the HCOi" concentration.
MASE3 station is placed far from the preceding group, consistent with its differing plant community, especially the presence of Dorycnium penthaphyllum and Brachypodium phoenicoides. The environmental parameters characterising this station are high Ca"+ concentration and low water level. As a result the plant community is dominated by caldcóles non-helophytes.
Fig. 4.98 shows that axis 3 expresses most clearly halonitrophilous charateristics that best to distinguish between Molino del Abogado stations. Frankenia pulverulenta and Bussia hyssopifolia are the two halonitrophytes which indicate the relatively nitrogen-rich soil of MOLI 1 station.
MASE I and MASE2 seem to be well discriminated from monospecific reedbeds. Both stations have a high content of water in the soil and have some helophyte species in common. However, MASE1 station has a higher CI/SO4" ratio with a water level deeper below the surface. Characteristic species of MASE 1 station are Carex hispida and Phalaris arundinacea, while species such as Mentha aquatica and Teucrium scordium, indicating the proximity of the water table to the surface of the ground, are present only in MASE2, where the dominance of Agrostis stolonifera can be regarded as characteristic.
The differences in species composition between impacted and unimpacted sits indicates important changes in the structure, diversity, and production of communities. Table 4.25 shows that the highest production occurs in monospecific reedbeds, although reedbed production recorded in Molino del Abogado is only half'that of' El Masegar where more optimal conditions are found. These highly productive, monospecific formations arc lowest in terms of'species richness.
Next in decreasing order of production, are the two mixed helophyte formations, with intermediate species richness within the context of the sludy area. The remaining stations have production that varies between a half and a third of the former ones. They are plant communities dominated mainly by xeric-halophytes and caldcóles. This group includes the stations where minimum plant cover and maximum species richness were recorded.
Station
MASE4
MOLI4
MASE1
MASE2
MOLI3
MOLI1
MASE3
MOLI2
Production (g/m*7year)
1169.22
490.53
402.11
345.92
220.08
202.4
199.31
146.44
Species richness
1
1
12
12
8
25
8
21
Dominant species
Phragmites australis
Phragmites australis
Phragmites australis, Cladium mariscus, Phalaris awndinacea, Carex hispida
Phragmites australis. Agrostis stoloni/era, Cladium mariscus
Elymus curvifolius, Cynodon dactylon
Juncus maritimus, Aeluropus littoralis, Limonium delicatulum, Elymus curvifolius
Schoenus nigricans, Dorycnium pentaphylum, Phragmites australis, Brachypodium phoenicoides
Limonium delicatulum, Phragmites australis, Elymus curvifolius
Table 4.25 Production rates and species composition at the Spanish study sites
267 -
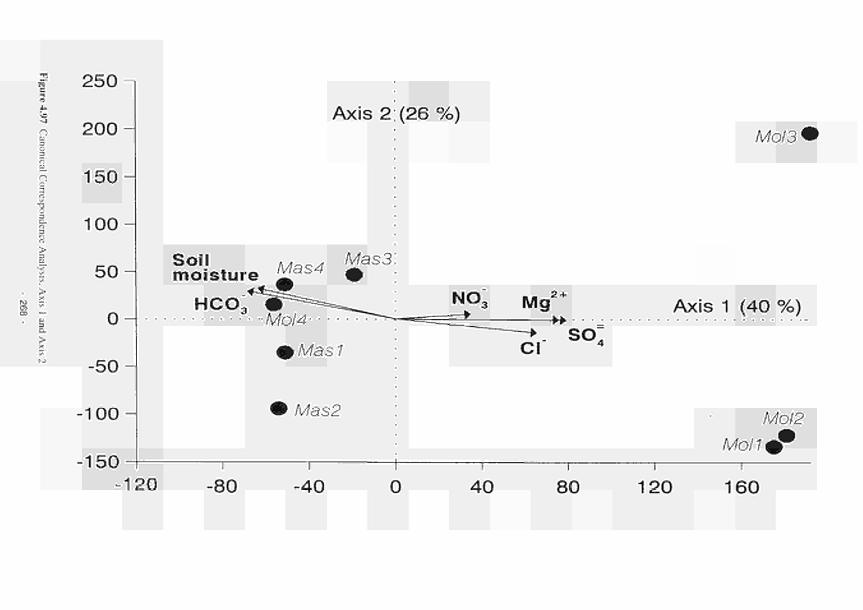
■fl
f 3 4 -
S n
E.
■y.
> 3 EL
2 5 0
2 0 0
150
100
5 0 -
0
- 5 0 -
Axis 2
Soil moisture Mas4
Mas3
(26 %)
/V/o/3
Axis 1 (40 %)
Mo/2
120 -80 -40 40 80 120 160
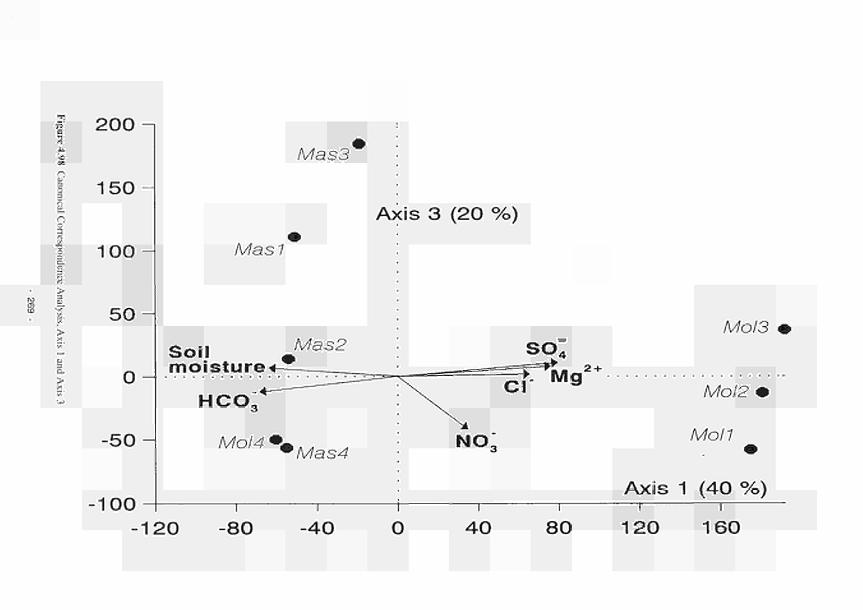
21 Æ' Β t c
4
'C
η
CO .¡ï.
D.
>
2 0 0 ^
150
100
5 0
Mas3
Axis 3 ( 2 0 % )
Masi
Soi l m o i s t u r e
M as 2 Mol3
so;

Canopy height and cover are smaller in the impacted site (Table 4.25). The landscape changes from dense
and tall vegetation to more open one of shorter vegetation, wilh frequent bare patches.
The species richness per area and the total number of species are not related to the differences between El
Masegar and Molino del Abogado in terms of relative abundance of'species. Tabic 4.25 shows that although
the total number of species is higher in the impacted site, the number of dominant species decrease. Except
for the reedbed, plant communities of Molino del Abogado include fewer co-dominant species and a higher
number of species with scarce cover or low biomass.
Effects of desiccation-salinisation on the performance and leaf pressure potential of
Phragmites australis
Reed is the only species that is present in all HGMUs of both impacted and unimpacted sites, due its
relatively wide range of tolerance of soil moisture and salinity conditions. As a result the presence of iced at
the driest stations is able to give an indication of' its past wetland status.
Changes in reed performance
Reed performance can give an indication of environmental variability. The aim of this work was lo discover
whether reed performance can be used to quantify the different disturbance or stress levels in the HGMUs
considered. Assessment of performance involved measurements of shoot density, biomass, percentage of
floration and biometrie measures.
Fig. 4.99 shows the distribution of reed height in lhe eight stations. Height distribution was used by Haslani
(1970) to determine the status oí Phragmites stands. Monospecific reedbeds occur al MASE 4 and MOLI 4.
Most reed shoots are tall in MASE 4, indicating that the sland is well developed and may be considered
optimal, while MOLI 4 seems to reflect suboptimal conditions for reed, on account of its shorter shoots,
indicating some stress.
The opposite trend within the performance gradient is represented by MOLI 1, 2 and 3, which may be
considered to experience considerable stress. As their distribution histograms show, most of lhe shoots arc
small and the plants do not flower in these stations.
Substantial differences were found in other measurements of performance. Fig 4.100 shows decrease of leaf
dimension and internodal length to be most indicative.
Changes in leaf pressure potential
Reed was used in this study as a reference species to diagnose water stress. The initial hypothesis was that
before the effects of desiccation-salinisation on reed becomes evidenl, lhe plani decreases its leaf pressure
potential (P), and when a certain threshold is reached there will be changes in performance.
Fig. 4.101 is a summary of the variation of Ρ and some soil variables in the stations studied. The base-
potential (BP) or pressure potential measured just before dawn, is an indication of water soil availability. This
is based on the assumption that night transpiration is minimal and the water potential gradient which existed
in the plant during the previous day conies into equilibrium with thai established in the soil (Ritchie and
Hinckey. 1975). DP is the diurnal depression of pressure potential during the hours of' maximum solar
radiation. Even though Ρ is not affected by plant height (except for tall trees), shoots were compared which
had great variability in height. Comparison was made between reeds less than 30cm high with those that
exceded 200cm. Ρ measures have been compared in relation to the average height of lhe stand and to the BP
("rei. Ρ" in Fig.4.101). The environmental variables were expected to influence water stress and,
consequently, the pressure potential.
The interpretation of Ρ measures of reed is very complex. Problems arise due to the high variation among
replicates because of several factors including leafage, leaf orientation and microtopography of the ground.
It was necessary to identify these sources of variation in order to relate measurements to them or to minimize
their effect by increasing the number of replicates or, when possible, by controlling field conditions.
Problems of data interpretation can be seen in Fig. 4.101. Nevertheless, results can be explained in terms of
soil salinity and water regimes. The most intense stress is experienced by the reed stand at lil Masegar
(MASE3), where the non-hclophyles are co-dominant with reed due to the dryness of the soil. Base-potential
270 -
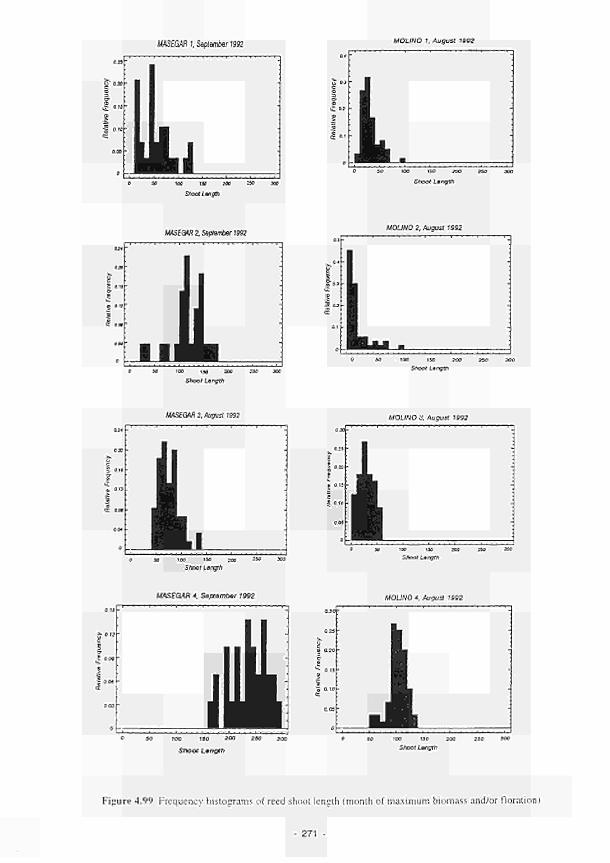
MASEGMI.Seçtmbertm MOLINO 1, August 1902
UASEtm 2, September 1992 M0UN0 2, August 1992
o so roo JM soo rso soo Shoot Length
MASBLVR 3, August 1992 MOLINO 3, August 1992
MASEOAR 4. September 1992 MOUNO 4, Auaust 1992
0 50 100 ISO 200 250 300
Figure 4.99 Frequency histograms of reed shool length (month of maximum biomass and/or floration)
- 271 -
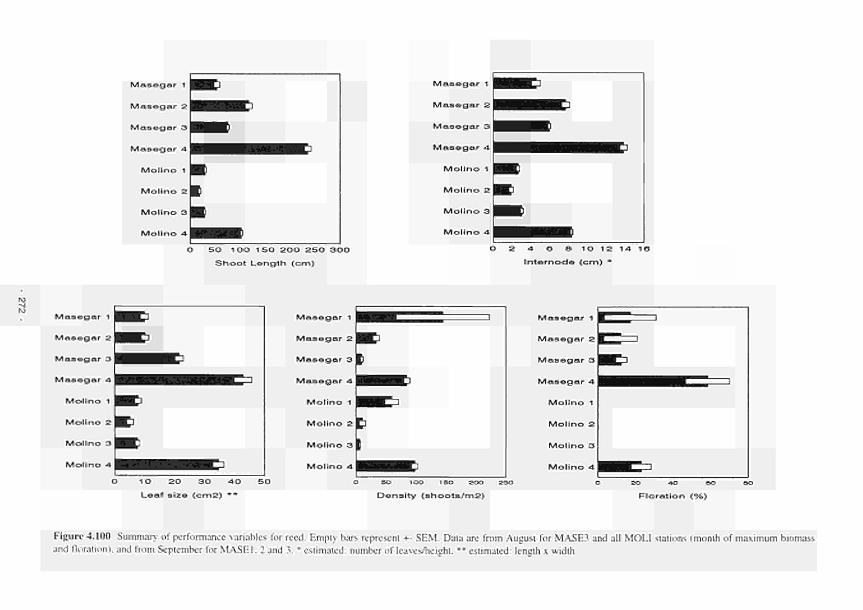
M a s e g a r 1
M a s e g a r 2
M a s e g a r 3
M a s e g a r 4
O 5 0 1 0 0 1 5 0 2 0 0 2 5 0 3 0 0 S h o o t L e n g t h ( c m )
O 2 4 Ο β I O 1 2 1-4 Κ I n t e r n o d e ( c m ) *
Ι Ο 2 0 3 0 4 0 L e a f s i z e ( c m 2 ) * *
SO 100 I S O 2 0 0 2 5 0
D e n s i t y ( s h o o t s / m 2 ) :o ΛΟ so
F l o r a t i o n (%)
Figure 4.100 Summar>' of performance variables for reed. Empty bars represent +- SEM. Data are from August for MASE3 and all MOLI stations (month of maximum biomass and floration). and from September for MASE 1, 2 and 3. * estimated: number of leaves/height. ** estimated: length χ width
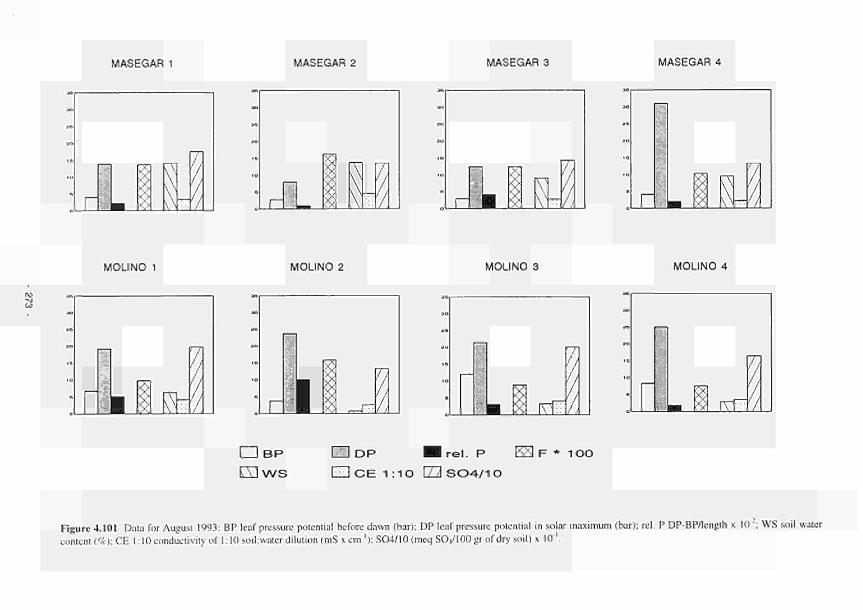
MASEGAR 1 MASEGAR 2 MASEGAR 3 MASEGAR 4
1
0
O
■ Γ I I Æ | | |
5
Γ '.. ι ι MOLINO 1 MOLINO 2 MOLINO 3 MOLINO 4
° Γ
><
ι y . >9 ίΥΐ77 1 Π BP ED DP ■ r e l . Ρ ΕΞ F * 10Ο
H W S ED CE 1:1 O E 3 S 0 4 / 1 0
Figure 4.101 Data for August 1993: BP leaf pressure potential before dawn (bar); DP leaf pressure potential in solar maximum (bar); rel. Ρ DP-BP/Iength χ 10' ; WS soil water
content (9c); CE 1:10 conductivity of 1:10 soihwater dilution (mS χ cm"1); SO4/10 (meq SOj/IOO gr of dry soil) χ IO'1.

was lower in Molino del Abogado than in El Masegar. indicating that Phragmites does not recover during the
night from diurnal waler stress. Paradoxically, the maximum stress considered here as the relative P, was
recorded in MOLI 2, where predawn values were similar to El Masegar.
Summary
There are a number of complications in interpreting the results of this study. One problem results from the
great number of factors that influence P. It is important that these be identified. For example, it was
observed during a sampling campaign that microtopographical differences within one particular station
resulted in differences of Ρ of around 10 bars. The effective rooting depth of' the plants is probably also a
critical factor. On balance the difficulties of interpreting results render this approach too unreliable for
application to a simple functional assessment procedure.
4.3.5 Primary production strategies
The role of hydroperiod and substrate composition on primary producer strategics was studied al three
locations within the La Mancha region. It was not possible to undertake investigations at El Masegar
because of the anthropogenic influence on its flooding regimes, the lack of primary producer strategics
present, and the short time duration of available permanent water. The small, shallow, temporary lakes
("lagunas") studied were located at Albardiosa, Peña Hueca and Alcahozo. Primary producer communities
were dominated by submerged macrophytes, phytoplankton and microphytobenthos respectively. The
hydroperiod characteristics of these lagunas are shown on Fig. 4.102. The salient differences arc the
length and intensity of flooded and dry periods and their relationship to precipitation events, the
presence/absence of surface water associated with the flooding, and the maximum groundwater levels.
Flooding periods are longer in microbenthos than phytoplankton dominated wetlands, and both have
considerably shorter flooding period than macrophyte sites.
The study of surface waterlevel dynamics using time series analysis yields additional relevant information
about the relationships between primary producer strategies and temporal characteristics of fluctuations,
periodicity, stationarity, and contribution of magnitude and frequency of fluctuations to
flooding/desiccation events (Fig. 4.103).
Fluctuations in surface water levels arc apparently periodic in the three types of' wetlands (autocorrelation
function value (ACF)>95 % confidence interval, for time lag=l (Figs. 4.103a, c and e)). The period
length (time lag correspondent to maximum ACF value) is about one year in the microbenthosdominatcd
community and around two years (phytoplankton) or more (macrophytes) in the others. Nevertheless, the
strength of the periodic component (slope with which ACF approaches zero) is only significant in the
microbenthos community, where surface waterlevel evolution may be considered stationary (ACF
converges to a stable values), as opposed to the phytoplankton community; no conclusions can be drawn
from the submerged macrophytes community at the temporal scale of the study with respect to stationarity.
Fourier analysis shows that flooding and desiccation events arc almost exclusively controlled by
infrequent, intense fluctuations in the wetland where submerged macrophytes are the dominant primary
producers (Fig. 4.104). Minor differences exist in the frequency and intensity of hydrological fluctuations
determining desiccation and flooding of each of the other two lypes of' wetlands (4.103d and 4.1031), but
the pattern is more irregular in the case of the phytoplanktonic community.
Analysis of sediment features (Fig. 4.104) suggests that significant differences exist between flooded and
dry periods in terms of water content in macrophyte and phytoplanklondominated wetlands, hut the
fluctuation range is notably wider in the first type. Noticeable trends are the lower waler and organic
matter contents in the sediments of the phytoplankton community, and the decrease in organic matter
content from flooding to dry periods in the site of macrophytes, in contrast to what happens in the other
two.
274
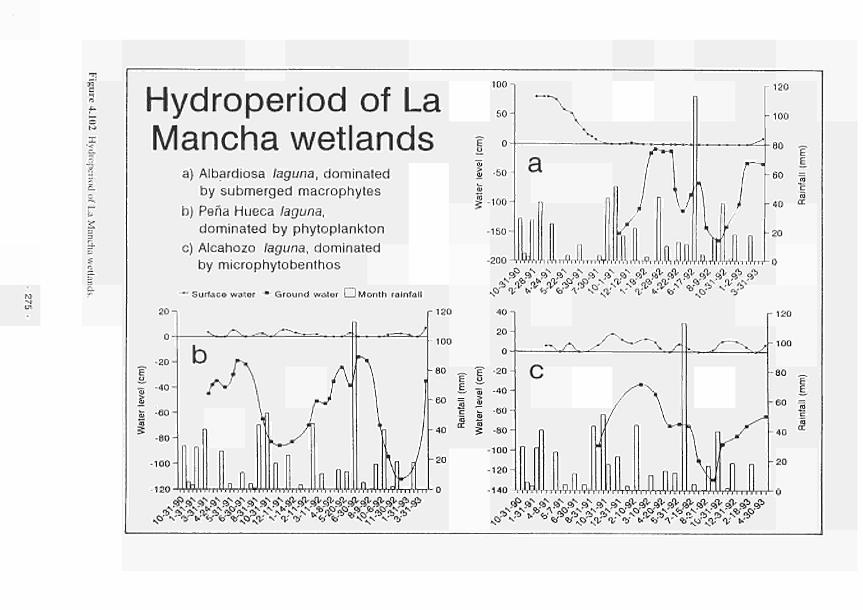
Hydroperiod of La Mancha wetlands
a) Albardiosa laguna, dominated
by submerged macrophytes
b) Peña Hueca laguna,
dominated by phytoplankton
c) Alcahozo laguna, dominated
by microphytobenthos
— Surface water " · " Ground water LJ Month rainfall
i
100
l u u
5 0
"Ê" o υ
ä 50
ω
I 100
150
200
\
v^
a f
ti,
π
1 I I m W i i m M ,
I ' /
r iTiT rjTT1! Τ
" * Ί
\j η Π Π
, . . **
\ J V¡
Old, ¡Vi ι ι i
_
n r
120
100
80 ?
E
60 =
40
20
çp OjN c i " of of q>* q,- q,- o j " cj<" e j " o j " ej
1
Λ O. b.' WW Λ ' sN1 o.' >v' η i . '
uw v rv ^ '
12Ü
100
¡"Ρ °>N .<*£ °>
N °>
N <»
N o>
N o>
N " i
1 q'
1 ojl <#" <"? i l ojl OjT o? o£>
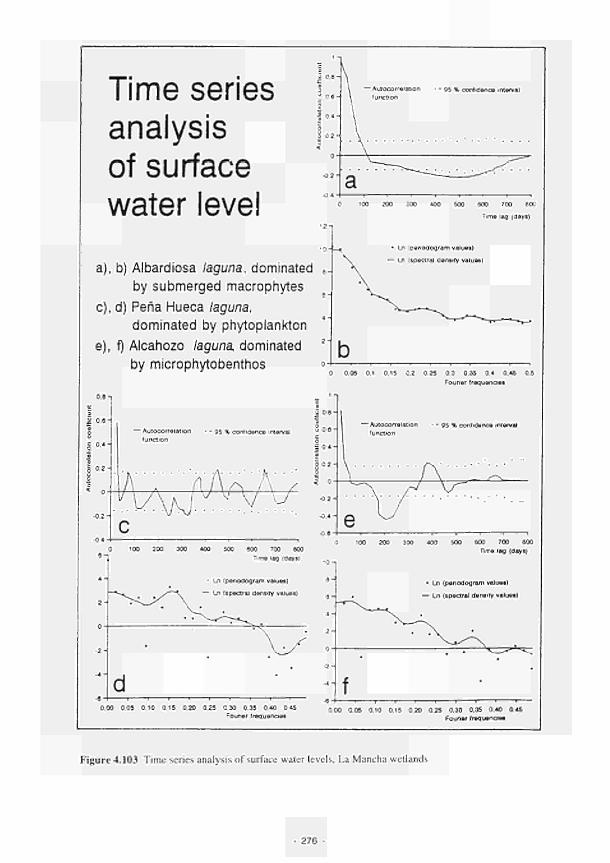
Time series analysis of surface water level
a), b) Albardiosa laguna, dominated
by submerged macrophytes
c), d) Peña Hueca laguna,
dominated by phytoplankton
e), f) Alcahozo laguna, dominated
by microphytobenthos
" Autocorrelation
function • 95 % confidence interval
100 200 300 400 500 600 700 800
Time lag (days)
Ln ipenodogram value·)
— Ln (spectral density values)
0 0,05 0.1 0,15 0.2 0.25 0.3 0,35 0.4 0,45 0.5
Founer frequencies
Autocorrelation 95 % confidence interval
function
a
4
2
2
4 ~
0 100
^ <
d
200
r/
300 400 500 600 700 SCO
Time lag (days)
■ Ln (penodograrn values)
— Ln (spectral density values)
' \
\S •
100 200 300 400 SCO 600 700 800
Time lag (days)
0
Θ
3
A -
2
2
4
β
f
• Ln (penodograrn value·)
— Ln (spectral denairy value·)
\ ■
.
Ι ι τ 1 1 1 1~ " o.oo o.o: 0.10 0.13 0.20 0.2: 0.30 0.3s 0.40 0.45
Founer frequencies 0.00 0.05 0.10 0.1S 0.20 0.25 0,30 0.35 0.40 0.45
Fourier frequência·
Figure 4.103 Time series analysis of surface water levels, La Mancha wetlands
276
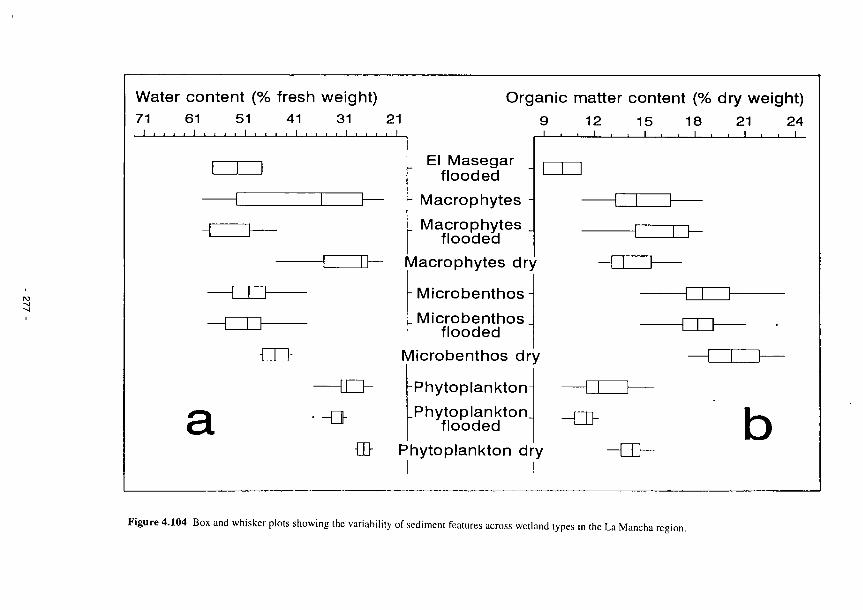
Water content (% fresh weight)
5 1 41 3 1 2 1 . . . ι
Organic matter content (% dry weight)
71 ι
61 . ι
41 . ι
31
I ι
c
CO
a iE>
-öf
9 ι
El Masegar flooded
Macrophytes
Macrophytes flooded
vlacrophytes dry
Microbenthos
Microbenthos flooded
Microbenthos dry
Phytoplankton
Phytoplankton flooded
Π} Phytoplankton dry
12 l _
1 5 ι
1 8 i_
21 L_
24 ι
J
c
a b
Figure 4.104 Box and whisker plots showing the variability of sediment features across wetland types in the La Mancha regie

4.3.6 Assessment of habitat support from the aquatic subsystem of Mediterranean type semi-arid wetlands
The complexity or absence of predictable patterns of ecosystem organisation in Mediterranean wetlands limits the degree of detail or insight which can be determined for habitat assessment purposes. Simplification by ignoring, for example, ecosystem components with short temporal persistence (as might be usefully done for other aquatic or terrestrial communities), can result in losing important information on functional variability when considering the whole wetland ecosystem. The investigation hypothesis was that in systems which experience large fluctuations in their ecological parameters, the key functional processes often show little correlation with the mechanisms triggering the different paths in ecosystem organisation and trophic dynamics (Levin 1992).
Variable
% sediment organic N-1NH4' (mg/1) NO3' (mg/1) P O / (mg/1) KEY N C.V. 1 II III IV
matter
Period
1 II III IV III IV III IV
number of observations coefficient of variation
N
7 13 11 2 10 3 10 3
flooding periods dry periods intermediate-final stages of flooding periods beginning of flooding periods
Median
16.70 1369 0.08 14.37 0.23 0.39 0.04 0.05
C.V.
0.16 0.11 0.90 1.37 0.28 1.19 1.17 1.41
Table 4.26 Influence of the alteration of flooding and dry periods on the variation of the various parameters related to trophic dynamics in the Laguna de Albardiosa (La Mancha region, Spain), a submerged macrophyte wetland located in the same watershed as El Masegar. Modified from Florín (1994).
Despite the artificial regulation of water regimes at El Masegar hydric fluctuation is a major controlling variable of its ecosystem organisation. The hydrological investigations (4.1.1) demonstrate the interannual variability of the El Masegar hydropcriod, suggesting important constraints on the life-cycle and development of submerged macrophytes, as compared with emergent and/or marginal plants. As a result, the appropriate time scales for assessing the food-webs associated with each plant strategy arc expected to be different.
Unfortunately, the study period at El Masegar covered only a part of a longer flooding period, which was followed by an exceptionally dry period. As a result, the effects of alternating Hooding and desiccation were not analysed at this wetland site. However, interesting patterns were observed in a parallel study performed in comparable macrophytc-dominatcd wetlands of the same region (Florin 1994) (Tabic 4.26). In summary, results show that mineralisation of the sediment organic matter during dry periods results in an increase in the concentration of dissolved nutrients in waler at the beginning of the Hooding periods.
In addition, up to 80 percent of the organic matter contained in the flooded sediments of El Masegar appeared to be mineralised in the last 10 weeks of the flooding period (Table 4.14). Recycling of this material partially results in the development of dense stands of Characcae algae, while the latter stages of the flooding period are associated wilh periphyton. Directly or indirectly, this production supports important populations of crayfish and coot, together with variable numbers of other highly valuable species (Garnett & Garnett 1989). Respiration of the sub-aquatic components only in the El Masegar food-webs (mainly sediment biota, Characeae algae, and crayfish) accounts for between 52-88 percent of gross primary production (Table 4.14).
4.3.7 Ornithological studies on the Irish floodplain sites
The ornithological work undertaken at the Irish sites was concerned wilh assessing the relationship between birds and habitat maintenance, habitat diversity and elements of biomass import/export.
278
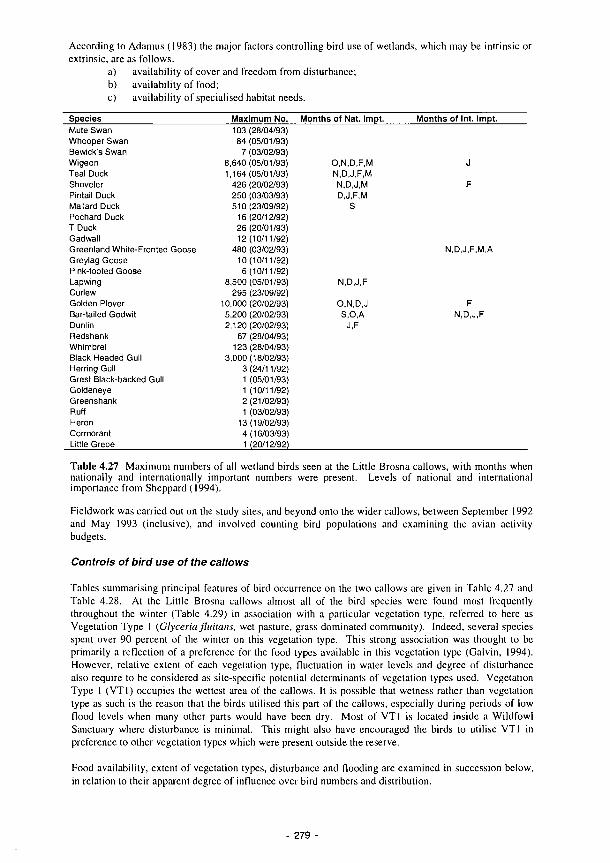
According to Adamus (1983) the major factors controlling bird use of wetlands, which may be intrinsic or extrinsic, are as follows:
a) availability of cover and freedom from disturbance; b) availability of food; c) availability of specialised habitat needs.
Species Mute Swan Whooper Swan Bewick's Swan Wigeon Teal Duck Shoveler Pintail Duck Mallard Duck Pochard Duck Τ Duck Gadwall Greenland White-Fronted Goose Greylag Goose Pink-footed Goose Lapwing Curlew Golden Plover Bar-tailed Godwit Dunlin Redshank Whimbrel Black Headed Gull Herring Gull Grest Black-backed Gull Goldeneye Greenshank Ruff Heron Cormorant Little Grebe
Maximum No. 103(28/04/93) 84 (05/01/93)
7 (03/02/93) 8,640 (05/01/93) 1,164(05/01/93)
426 (20/02/93) 250 (03/03/93) 510(23/09/92)
16(20/12/92) 26 (20/01/93) 12(10/11/92)
480 (03/02/93) 10(10/11/92)
6(10/11/92) 8,500 (05/01/93)
295 (23/09/92) 10,000(20/02/93) 5,200 (20/02/93) 2,120(20/02/93)
67 (28/04/93) 123(28/04/93)
3,000(18/02/93) 3(24/11/92) 1 (05/01/93) 1 (10/11/92) 2 (21/02/93) 1 (03/02/93)
13(19/02/93) 4(16/03/93) 1 (20/12/92)
Months of Nat. Impt.
0,N,D,F,M N,D,J,F,M N,D,J,M D,J,F,M
S
N,D,J,F
0,N,D,J S.O.A
J,F
Months of Int. Impt.
J
F
N,D,J,F,M,A
F N,D,J,F
Table 4.27 Maximum numbers of all wetland birds seen at the Little Brosna callows, with months when nationally and internationally important numbers were present. Levels of national and international importance from Sheppard (1994).
Fieldwork was carried out on the study sites, and beyond onto the wider callows, between September 1992 and May 1993 (inclusive), and involved counting bird populations and examining the avian activity budgets.
Controls of bird use of the callows
Tables summarising principal features of bird occurrence on the two callows are given in Table 4.27 and Table 4.28. At the Little Brosna callows almost all of the bird species were found most frequently throughout the winter (Table 4.29) in association with a particular vegetation type, referred to here as Vegetation Type 1 (Glyceria fluitans, wet pasture, grass dominated community). Indeed, several species spent over 90 percent of the winter on this vegetation type. This strong association was thought to be primarily a reflection of a preference for the food types available in this vegetation type (Galvin, 1994). However, relative extent of each vegetation type, fluctuation in water levels and degree of disturbance also require to be considered as site-specific potential determinants of vegetation types used. Vegetation Type 1 (VT1) occupies the wettest area of the callows. It is possible that wetness rather than vegetation type as such is the reason that the birds utilised this part of the callows, especially during periods of low flood levels when many other parts would have been dry. Most of VT1 is located inside a Wildfowl Sanctuary where disturbance is minimal. This might also have encouraged the birds to utilise VT1 in preference to other vegetation types which were present outside the reserve.
Food availability, extent of vegetation types, disturbance and flooding are examined in succession below, in relation to their apparent degree of influence over bird numbers and distribution.
- 279 -
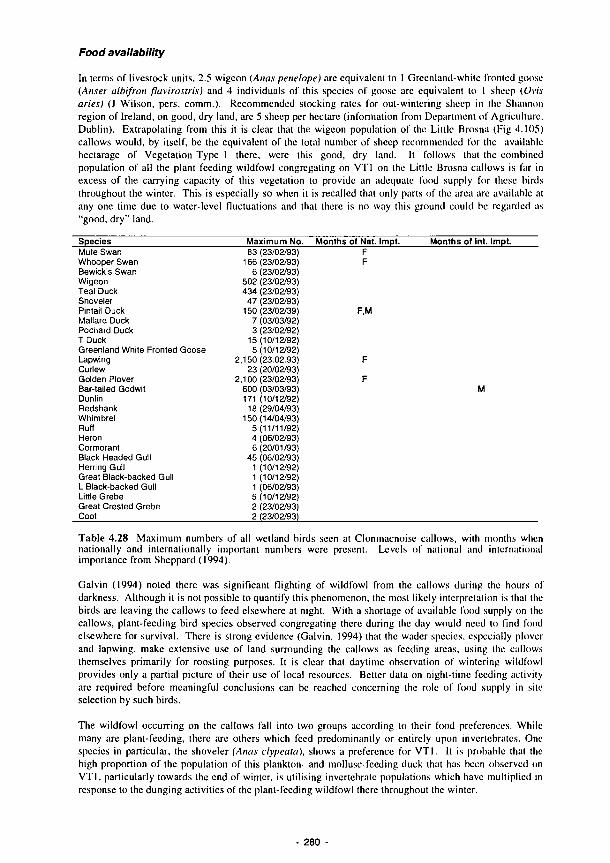
Food availability
In terms of livestock units, 2.5 wigeon (Anas penelope) are equivalent to 1 Greenland-white fronted goose (Anser albifron flavirostris) and 4 individuals of this species of goose are equivalent to 1 sheep (Ovis aries) (J Wilson, pers. comm.). Recommended slocking rates for out-wintering sheep in the Shannon region of Ireland, on good, dry land, are 5 sheep per hectare (information from Department of Agriculture, Dublin). Extrapolating from this it is clear that the wigeon population of the Little Brosna (Fig 4.105) callows would, by itself, be the equivalent of the total number of sheep recommended for the available heclarage of Vegetation Type 1 there, were this good, dry land. It follows that the combined population of all the plant feeding wildfowl congregating on VT1 on the Little Brosna callows is far in excess of the carrying capacity of this vegetation to provide an adequate food supply for these birds throughout the winter. This is especially so when it is recalled that only parts of the area are available at any one time due to water-level fluctuations and that there is no way this ground could be regarded as "good, dry" land.
Species Maximum No. Months ot Nat. Impt. Months of Int. Impt. Mute Swan Whooper Swan Bewick's Swan Wigeon Teal Duck Shoveler Pintail Duck Mallard Duck Pochard Duck Τ Duck Greenland White Fronted Goose Lapwing Curlew Golden Plover Bar-tailed Godwit Dunlin Redshank Whimbrel Ruff Heron Cormorant Black Headed Gull Herring Gull Great Black-backed Gull L Black-backed Gull Little Grebe Great Crested Grebe Coot
83 (23/02/93) 166(23/02/93)
6 (23/02/93) 502 (23/02/93) 434 (23/02/93)
47 (23/02/93) 150(23/02/39)
7 (03/03/92) 3 (23/02/92)
15(10/12/92) 5(10/12/92)
2,150(23.02.93) 23 (20/02/93)
2,100(23/02/93) 600 (03/03/93) 171 (10/12/92)
18(29/04/93) 150 (14/04/93)
5(11/11/92) 4 (06/02/93) 6 (20/01/93)
45 (06/02/93) 1 (10/12/92) 1 (10/12/92) 1 (06/02/93) 5(10/12/92) 2 (23/02/93) 2 (23/02/93)
F F
F.N
F
F
Table 4.28 Maximum numbers of all wetland birds seen at Clonmacnoise callows, with months when nationally and internationally important numbers were present. Levels of national and international importance from Sheppard (1994).
Galvin (1994) noted there was significant flighting of wildfowl from the callows during the hours of darkness. Although it is not possible to quantify this phenomenon, the most likely interpretation is that the birds are leaving the callows to feed elsewhere at night. Wilh a shortage of available food supply on the callows, plant-feeding bird species observed congregating there during the day would need to find food elsewhere for survival. There is strong evidence (Galvin, 1994) that the wader species, especially plover and lapwing, make extensive use of land surrounding the callows as feeding areas, using the callows themselves primarily for roosting purposes. It is clear thai daytime observation of wintering wildfowl provides only a partial picture of their use of local resources. Better data on night-time feeding activity are required before meaningful conclusions can be reached concerning the role of food supply in site selection by such birds.
The wildfowl occurring on the callows fall into two groups according to their food preferences. While many are plant-feeding, there are others which feed predominantly or entirely upon invertebrates. One species in particular, the shoveler (Anas clypeata), shows a preference for VTI. It is probable that the high proportion of the population of this plankton- and mollusc-feeding duck that has been observed on VTI, particularly towards the end of winter, is utilising invertebrate populations which have multiplied in response to the dunging activities of the plant-feeding wildfowl there throughout the winter.
- 280

Number
f1000)
Figure 4.105 Total number of Widgeon wintering on the callows of the Little Brosna ■ and at Clonmacnoise Q.
Nationally important areas —, internationally important areas.

Species Mute Swan Whooper Swan Wigeon Teal Duck Mallard Duck Shoveler Pintail Greenland White Fronted Goose Golden Plover Lapwing Dunlin Bar-tailed Godwit Curlew
Veg1 9 3 " 9 2 ' 9 4 " 9 2 ' 9 9 " 9 9 ' 97-77 · 5 8 " 5 2 ' 3 2 " 90 ' 4 2 *
Veg 2 5 5 1 6
< 1 1 1 3 5
11 1 0
16
Veg 3 0 3
<1 0
<1 0 2 6 5 6 3 4 6
Veg 4 <1
0 3 2 0 0 0
13 2 3 ' 2 0 · 14 · 2
15
Veg 6 0 0 0 0 0 0 0 1 0 0 0 0 2
Veg 7 0 0 2 0 0 0 0 0 9
11 0 4
18
Table 4.29 The total number of bird hours spent throughout the winter by the dominant wildfowl and waders on each of the vegetation types within the Little Brosna callows. Numbers arc expressed as a percentage of the total time spent by each species in the Little Brosna callows.
Key: Within species, bird hours were compared using the Duncan multiple range test and significances (p <0.01) are shown as *. One star indicates that this value was significantly greater than all oilier values, bar those with two stars. The latter were significantly greater than all other values. Veg 1 (VTI) = wet alluvia] grasslands (Glycerin fluilans) species poor, occurs where Hooding is
most prolonged; Veg 2 (VT2) = base-rich marshes (Agrostis stolonifera, Carex nigra) lower and middle elevations of
the Shannon callows; Veg 3 (VT3) = Sedge rich grassland (Carex hostiana) variant of VT2 occurs on drier part of the
callows; Vcg 4 (VT4) = Sedge rich grassland (Carex flava) occurs in drier parts of callows on a peaty
substrate; Veg 5 (VT5) = Festuca, Holcus, Lathyrus community upper part of the callows; Veg 6 (VT6) = Juncus levée community, rush present and a variety of grasses; Veg 7 (VT7) = Rumex levée community and Juncus. Veg 8 (VT8) = amalgamation of reed swamp and lall sedge communities
Relative extent of each vegetation type
Conclusions concerning vegetation-type preferences may be misleading unless the relative frequencies of the different vegetation types are allowed for. Hunter's Index of Preference (Hunter, 1962) was therefore used to assess utilisation of different vegetation types within the study area. The result for the Little Brosna callows shows an apparently marked preference for VTI by most species of duck, goose and swan, and the two waders the dunlin (Calidris alpina) and the black-tailed godwii (Limosa limosa), bul an apparently greater preference for sedge rich-grassland (Carexflava) (VT4) and levée community (Rumex and Juncus) (VT7) by the other wading birds. The results from Clonmacnoise show similar preferences on the part of some species, but not others.
Disturbance
The Shannon and Little Brosna callows arc remote and uninhabited and few people visit them in winter. As a result casual human disturbance is almost non-existent. Disturbance from natural predators is also negligible as Irish bird of prey populations are very low, in contrast to European wetlands where birds of prey can cause major disturbance to wildfowl (Tamisier, 1974, 1976; Campcrdon, 1981). However, sport shooting is frequent on the callows and causes a lot of disturbance. Most of the shooting takes place at dawn and dusk, wilh little shooting during the day. During ibis study, it was observed that shooting stopped birds from feeding (Galvin, 1994) and often forced them to move to other areas. In other wetlands, wildfowl and waders have been shown to react to shooting in a similar manner (Thornburg, 1973; Paulus, 1984; Campcrdon, 1981). This has been partially responsible for the under usage of the three callows Site, Bridge and Vect by most wildfowl and wader species as can be seen from Table 4.31, since these areas are outside the Little Brosna Wildfowl Sanctuary. The high intensity of shooting was almost certainly responsible for many of the wildfowl feeding during the night (Galvin, 1994), this being a
282 -
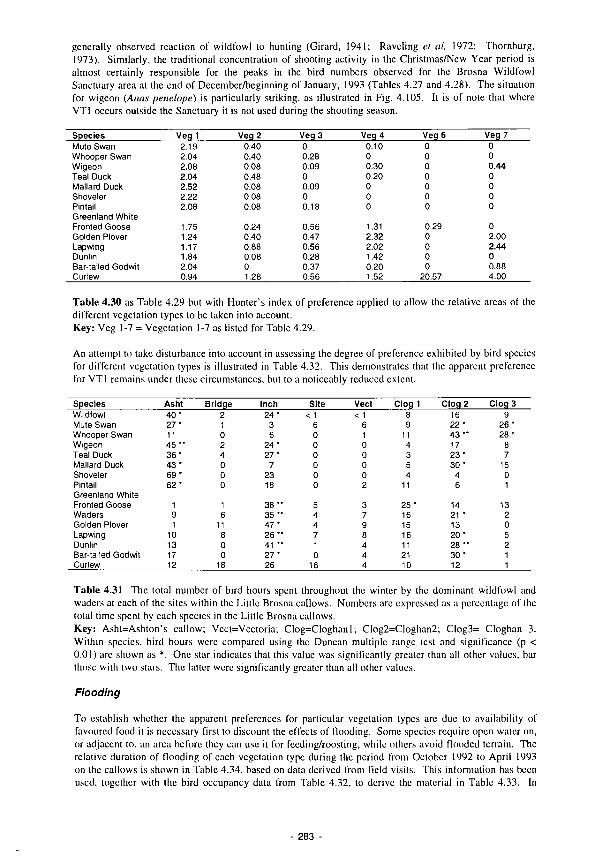
generally observed reaction of wildfowl to hunting (Girard, 1941; Raveling et al, 1972; Thornburg,
1973). Similarly, the traditional concentration of shooting activity in the Christmas/New Year period is
almost certainly responsible for the peaks in the bird numbers observed for the Brosna Wildfowl
Sanctuary area at the end of December/beginning of January, 1993 (Tables 4.27 and 4.28). The situation
for wigeon (Anas penelope) is particularly striking, as illustrated in Fig. 4.105. It is of note that where
VTI occurs outside the Sanctuary it is not used during the shooting season.
Species
Mute Swan
Whooper Swan
Wigeon
Teal Duck
Mallard Duck
Shoveler
Pintail
Greenland White
Fronted Goose
Golden Plover
Lapwing
Dunlin
Bar-tailed Godwit
Curlew
Veg1
2.19
2.04
2.08
2.04
2.52
2.22
2.08
1.75
1.24
1.17
1.84
2.04
0.94
Veg 2
0.40
0.40
0.08
0.48
0.08
0.08
0.08
0.24
0.40
0.88
0.08
0
1.28
Veg 3
0
0.28
0.09
0
0.09
0
0.18
0.56
0.47
0.56
0.28
0.37
0.56
Veg 4
0.10
0
0.30
0.20
0
0
0
1.31
2.32
2.02
1.42
0.20
1.52
Veg 6
0
0
0
0
0
0
0
0.29
0
0
0
0
20.57
Veg 7
0
0
0.44
0
0
0
0
0
2.00
2.44
0
0.88
4.00
Table 4.30 as Table 4.29 but with Hunter's index of preference applied to allow the relative areas of the
different vegetation types to be taken into account.
Key: Veg 1-7 = Vegetation 1-7 as listed for Table 4.29.
An attempt to take disturbance into account in assessing the degree of preference exhibited by bird species
for different vegetation types is illustrated in Table 4.32. This demonstrates that the apparent preference
for VTI remains under these circumstances, but to a noticeably reduced extent.
Species
Wildfowl
Mute Swan
Whooper Swan
Wigeon
Teal Duck
Mallard Duck
Shoveler
Pintail
Greenland White
Fronted Goose
Waders
Golden Plover
Lapwing
Dunlin
Bar-tailed Godwit
Curlew
Asht
40 '
27 *
11
4 5 "
3 6 '
43 '
69 ■
62 ·
1
9
1
10
13
17
12
Bridge
2
1
0
2
4
0
0
0
1
6
11
8
0
0
18
Inch
24*
3
6
2 4 -
27 ·
7
23
18
3 8 "
3 5 "
4 7 *
2 6 "
41 **
27"
26
Site
< 1
6
0
0
0
0
0
0
5
4
4
7
1
0
16
Vect
< 1
6
1
0
0
0
0
2
3
7
9
8
4
4
4
C log l
8
9
11
4
3
5
4
11
25 ■
16
15
16
11
21
10
Clog 2
16
22 ·
4 3 "
17
2 3 *
3 0 -
4
6
14
21 ·
13
2 0 '
2 8 "
3 0 -
12
Clog 3
9
2 6 -
28 ■
8
7
15
0
1
13
2
0
5
2
1
1
Table 4.31 The total number of bird hours spent throughout the winter by the dominant wildfowl and
waders at each of the sites within the Little Brosna callows. Numbers are expressed as a percentage of the
total time spent by each species in the Little Brosna callows.
Key: Asht=Ashton's callow; Vect=Vcctoria; Clog=Cloghanl; Clog2=Cloghan2; Clog3= Cloghan 3.
Within species, bird hours were compared using the Duncan multiple range test and significance (p <
0.01) arc shown as *. One star indicates that this value was significantly greater than all other values, bar
those with two stars. The latter were significantly greater than all other values.
Flooding
To establish whether the apparent preferences for particular vegetation types are due to availability of
favoured food it is necessary first to discount the effects of Hooding. Some species require open water on,
or adjacent to, an area before they can use it for fecding/roosting, while others avoid Hooded terrain. The
relative duration of flooding of each vegetation type during the period from October 1992 to April 1993
on the callows is shown in Table 4.34, based on data derived from field visits. This information has been
used, together with the bird occupancy data from Tabic 4.32, to derive the material in Table 4.33. In
283
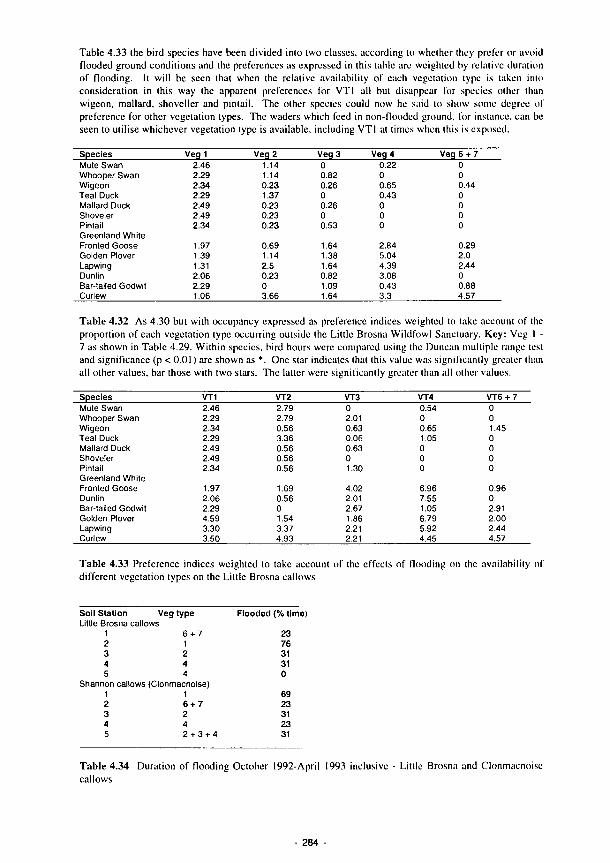
Table 4.33 the bird species have been divided into two classes, according to whether they prefer or avoid flooded ground conditions and the preferences as expressed in this table are weighted by relative duration of flooding. It will be seen that when the relative availability of each vegetation type is taken into consideration in this way the apparent preferences for VTI all but disappear for species other than wigeon, mallard, shoveller and pintail. The other species could now be said to show some degree of preference for other vegetation types. The waders which feed in non-flooded ground, for instance, can he seen to utilise whichever vegetation type is available, including VTI at times when this is exposed.
Species Mute Swan Whooper Swan Wigeon Teal Duck Mallard Duck Shoveler Pintail Greenland White Fronted Goose Golden Plover Lapwing Dunlin Bar-tailed Godwit Curle;v
Veg1 2.46 2.29 2.34 2.29 2.49 2.49 2.34
1.97 1.39 1.31 2.06 2.29 1.06
Veg 2 1.14 1.14 0.23 1.37 0.23 0.23 023
0.69 1.14 2.5 0.23 0 3.66
Veg 3 0 0.82 0.26 0 0.26 0 0.53
1.64 1.38 1.64 0.82 1.09 1.64
Veg 4 0.22 0 0.65 0.43 0 0 0
2.84 5.04 4.39 308 0.43 3.3
Veq 6 + 7 0 0 0.44 0 0 0 0
0 29 2.0 2 44 0 0.88 4.57
Table 4.32 As 4.30 but wilh occupancy expressed as preference indices weighted to take account of the proportion of each vegetation type occurring outside the Little Brosna Wildfowl Sanctuary. Key: Veg I -7 as shown in Table 4.29. Within species, bird hours were compared using the Duncan multiple range tesi and significance (p < 0.01) are shown as *. One star indicates that this value was significantly greater than all other values, bar those with two stars. The latter were significantly greater than all other values.
Species Mute Swan Whooper Swan Wigeon Teal Duck Mallard Duck Shoveler Pintail Greenland White Fronted Goose Dunlin Bar-tailed Godwit Golden Plover Lapwing Curlew
VT1 2.46 2.29 2.34 2.29 2.49 2.49 2.34
1.97 2.06 2.29 4.59 3.30 3.50
VT2 2.79 2.79 0.56 3.36 056 0.56 0.56
1.69 0.56 0 1.54 3.37 4.93
VT3 0 2,01 0.63 0.06 0.63 0 1,30
4.02 2.01 2.67 1.86 2.21 2.21
VT4 0.54 0 0 65 1.05 0 0 0
6.96 7.55 1.05 679 5.92 4.45
VT6+ 7 0 0 1.45 0 0 (1 0
096 0 2.91 2 0 0 2 44 4.57
Table 4.33 Preference indices weighted to take account of the effects of flooding on (he availability of different vegetation types on the Little Brosna callows
Soil Station Veg type Little Brosna callows
1 2 3 4 5
6 + 7 1 2 4 4
Shannon callows (Clonmacnoise) 1 2 3 4 5
1 6 + 7 2 4 2 + 3 + 4
Flooded (% time)
23 76 31 31 0
69 23 31 23 31
Table 4.34 Duration of flooding October 1992-April 1993 inclusive - Little Brosna and Clonmacnoise callows
284
4.3.8 Waterfowl and environmental conditions in La Mancha
The term waterfowl in this context refers mostly to the Charadriiformes (Lara-limicolas) but recorded species also includes members of the Analinae. It is generally assumed that wading birds feed on soil invertebrates and that abundance and diversity of soil invertebrates is generally determined by soil chemistry. The species and abundance of waterfowl feeding in wetlands may be useful indicators of soil chemistry and associated chemical processes.
During the winter large numbers of duck were present together with a much smaller number of waders. Previous records have shown numbers of up to 2-3,000 waders at Manjavacas during the spring migration, but in 1993 the passage of migrants appeared to be non-existent, presumably as they were unable to feed and flew to a more distant feeding area.
A wide range of chemical conditions was encountered at the various study sites in terms of pH (6.65 -9.28), conductivity (2.7 - 64.9mS/cm) and redox potentials (-476 to +766mV). Chemical changes within each site closely relate to the climatic pattern of maximum temperature and minimum rainfall during the summer. Rainfall generally occurs during the autumn and spring (Fig. 2.1) when leaching and dilution reduce the salinity of the sediments. Redox potentials clearly relate to water levels but there are sometimes considerable time lags involved in redox responses following inundation.
Stations most frequented by wetland birds had fairly stable pH values (8 - 8.5) throughout the year. Fewer birds were recorded at stations with higher mean pH, which generally correlates with higher conductivity. Birds were recorded at a wide range of salinities but a clear preference is shown for less saline (<10mS/cm) water bodies. Manjavacas shows, for the range of salinities present (from almost fresh in the northern part near the fresh water inflows to hypersaline in the southern part), that generally waders preferred to feed in the northern area, in the less saline water. Birds were also associated with a wide range of redox potentials (-300 to +500mV) but the areas most frequented by feeding flocks are characterised by a less extreme range and by frequent fluctuations between reduced and oxidised conditions. In some stations a relationship exists between wading birds and changes in water levels and redox potential. However, flocks of waders were recorded in stations with sediments that remain permanently flooded and reduced and in other stations with fluctuating water levels but with sediments that remain highly reduced. Extremely high rates of cellulose decomposition (up to 5.49% day loss in tensile strength) were recorded in areas most favoured by feeding wader flocks.
No macro-invertebrates were found in the sediments of the more saline natural lakes studied. No annelids were found in sediment samples from any of the lakes. Areas most favoured by wetland birds are those with high populations of chironomid larvae and these areas are those which receive relatively low salinity waste-water. It is possible that populations of invertebrates can build up in natural saline lakes during years when rainfall is more plentiful but it was not possible to investigate this possibility during the study period.
Faecal analysis revealed that even in the areas where chironomids were available, seeds, plant material (in particular Salicornia) and terrestrial Coleóptera (such as carabid beetles which invade the wetland as the water recedes) form the most important part of the diet of wader species. Contrary to the original assumption, that the waders are feeding on soil invertebrates, these wader species feeding in natural saline lakes rely to a large extent on food items on the surface of the water and sediments, and also within the water column, and they do not probe the sediment for invertebrates, as none exist.
The birds appear to be opportunists, like most other species in fluctuating systems, feeding on any available food resource which is often completely unrelated to any changes in soil chemistry. The fact that they are feeding on terrestrial beetles (at least during some periods) highlights the importance of the dry phase of these wetlands and the very different food chains and nutrient flows that exist.
4.4 Investigation of impacts
Several field, laboratory and computer based studies and experiments were established to help understand the relationships between function, process dynamics and impacts. The results of these exercises have provided information that allows for interpretations of impacts on wetland functions.
285 -
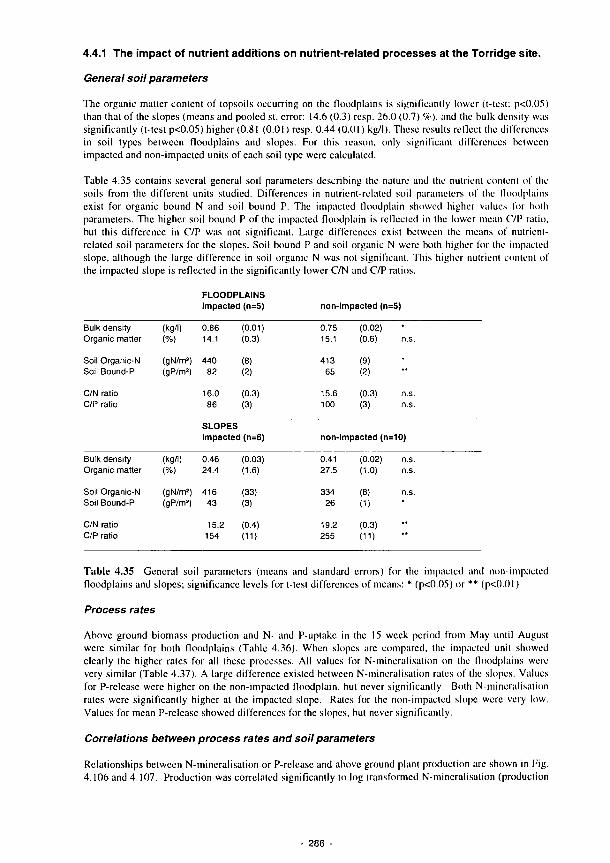
4.4.1 The impact of nutrient additions on nutrient-related processes at the Torridge site.
General soil parameters
The organic matter content of topsoils occurring on the floodplains is significantly lower (t-test; p<0.05)
than that of the slopes (means and pooled st. error: 14.6 (0.3) resp. 26.0 (0.7) 9c), and the bulk density was
significantly (t-test p<0.05) higher (0.81 (O.Oi) resp. 0.44 (0.01) kg/I). These results reflect the differences
in soil types between floodplains and slopes. For this reason, only significant differences between
impacted and non-impacted units of each soil type were calculated.
Table 4.35 contains several general soil parameters describing the nature and the nutrient content of the
soils from the different units studied. Differences in nutrient-related soil parameters of the floodplains
exist for organic bound N and soil bound P. The impacted floodplain showed higher values for both
parameters. The higher soil bound Ρ of the impacted floodplain is reflected in the lower mean C/P ratio,
but this difference in C/P was not significant. Large differences exist between the means of nutrient-
related soil parameters for the slopes. Soil bound Ρ and soil organic Ν were both higher for the impacted
slope, although the large difference in soil organic Ν was not significant. This higher nutrient contení of
the impacted slope is reflected in the significantly lower C/N and C/P ratios.
FLOODPLAINS impacted (n=5) non-impacted (n=5)
Bulk density
Organic matter
Soil Organic-N
Soil Bound-P
C/N ratio
C/P ratio
Bulk density
Organic matter
Soil Organic-N
Soil Bound-P
C/N ratio
C/P ratio
(kg/I)
(%)
(gN/m2)
(gP/m2)
(kg/i)
(%)
(gN/m2)
(gP/m2)
0.86
14.1
440
82
16.0
86
(0.01)
(0.3)
(8)
(2)
(0.3)
(3)
SLOPES
impacted (n=6)
0.46
24.4
416
43
15.2
154
(0.03)
(1.6)
(33)
(3)
(0.4)
(11)
0.75
15 1
413
65
156
100
non-i
0.41
27.5
334
26
19.2
255
(0.02)
(0.6) n.s.
(9)
(2)
(0.3) n.s.
(3) n.s.
mpacted (n=10)
(0.02) n.s.
(1.0) n.s.
(8) n.s.
(1)
(0.3)
(11)
Table 4.35 General soil parameters (means and standard errors) for the impacted and non-impacted
floodplains and slopes; significance levels for t-test differences of means: * (p<0.05) or ** (p<0.()l )
Process rates
Above ground biomass production and N- and P-uplake in the 15 week period from May until August
were similar for both floodplains (Table 4.36). When slopes are compared, the impacted unit showed
clearly the higher rates for all these processes. All values for N-mineralisation on the floodplains were
very similar (Table 4.37). A large difference existed between N-mineralisation rates of the slopes. Values
for P-release were higher on the non-impacted floodplain. hut never significantly. Both N-mineralisation
rates were significantly higher at the impacted slope. Rates for the non-impacted slope were very low.
Values for mean P-release showed differences for the slopes, but never significantly.
Correlations between process rates and soil parameters
Relationships between N-mineralisation or P-rclease and above ground plant production are shown in Fig.
4.106 and 4.107. Production was correlated significantly to log transformed N-mineralisation (production
286 -
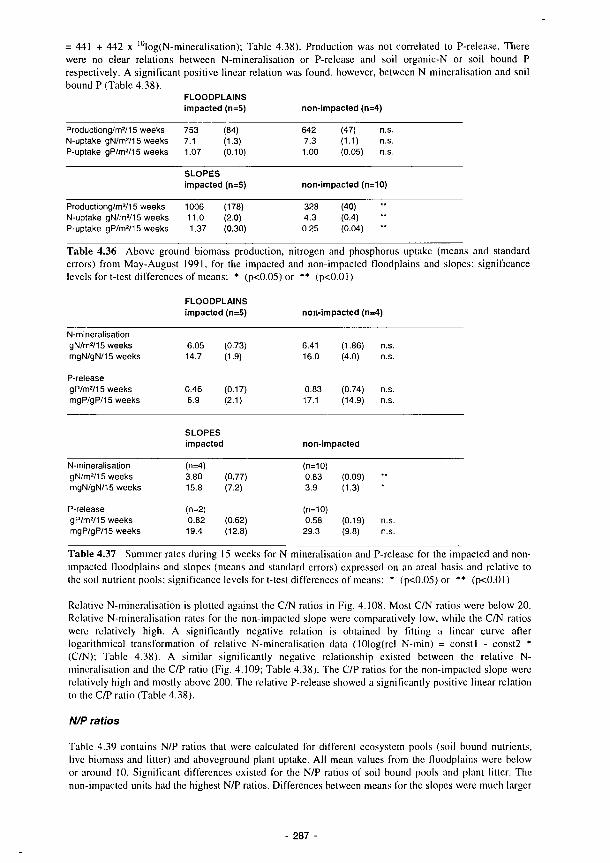
= 441 + 442 χ 10Iog(N-mineralisation); Table 4.38). Production was not correlated to P-release. There were no clear relations between N-mineralisation or P-rclease and soil organic-N or soil bound Ρ respectively. A significant positive linear relation was found, however, between N-mineralisation and soil bound Ρ (Table 4.38).
FLOODPLAINS impacted (n=5) non-impacted (n=4)
Productiong/m2/15 weeks N-uptake gN/m2/15 weeks P-uptake gP/m2/15 weeks
Productiong/m2/15 weeks N-uptake gN/m2/15 weeks P-uptake gP/m2/15 weeks
753 (84) 7.1 (1.3) 1.07 (0.10)
SLOPES impacted (n=5)
1006 (178) 11.0 (2.0) 1.37 (0.30)
642 7.3 1.00
(47) n.s. (1.1) n.s. (0.05) n.s.
non-impacted (n=10)
328 4.3
0.25
(40) (0.4) (0.04)
Table 4.36 Above ground biomass production, nitrogen and phosphorus uptake (means and standard errors) from May-August 1991, for the impacted and non-impacted floodplains and slopes; significance levels for t-test differences of means: * (p<0.05)or ** (p<0.01)
FLOODPLAINS Impacted (n=5) non-impacted (n=4)
N-mineralisation gN/m2/15 weeks mgN/gN/15 weeks
P-release gP/m2/15 weeks mgP/gP/15 weeks
N-mineralisation gN/m2/15 weeks mgN/gN/15 weeks
P-release gP/m2/15 weeks mgP/gP/15 weeks
6.05 14,7
0.46 6.9
SLOPES
(0.73) (1.9)
(0.17) (2.1)
impacted
(n=4) 3.80 15.8
(n=2) 0.82 19.4
(0.77) (7.2)
(0.62) (12.8)
6.41 16.0
0.83 17.1
(1.86) (4.0)
(0.74) (14.9)
non-impacted
(n=10) 0.83 3.9
(n=10) 0.58
29.3
(0.09) (1.3)
(0.19) (9.8)
n.s. n.s.
n.s. n.s.
··
n.s. n.s.
Table 4.37 Summer rates during 15 weeks for N-mineralisation and P-release for the impacted and non-impacted floodplains and slopes (means and standard errors) expressed on an areal basis and relative to the soil nutrient pools; significance levels for t-test differences of means: * (p<0.05)or ** (p<0.01)
Relative N-mineralisation is plotted against the C/N ratios in Fig. 4.108. Most C/N ratios were below 20. Relative N-mineralisalion rates for the non-impacted slope were comparatively low, while the C/N ratios were relatively high. A significantly negative relation is obtained by fitting a linear curve after logarithmical transformation of relative N-mincralisation data (I01og(rel N-min) = consti - const2 * (C/N); Table 4.38). A similar significantly negative relationship existed between the relative N-mincralisalion and the C/P ratio (Fig. 4.109; Table 4.38). The C/P ratios for the non-impacted slope were relatively high and mostly above 200. The relative P-release showed a significantly positive linear relation to the C/P ratio (Table 4.38).
N/P ratios
Tabic 4.39 contains N/P ratios that were calculated for different ecosystem pools (soil bound nutrients, live biomass and litter) and aboveground plant uptake. All mean values from the floodplains were below or around 10. Significant differences existed for the N/P ratios of soil bound pools and plant litter. The non-impacted units had the highest N/P ratios. Differences between means for the slopes were much larger
287
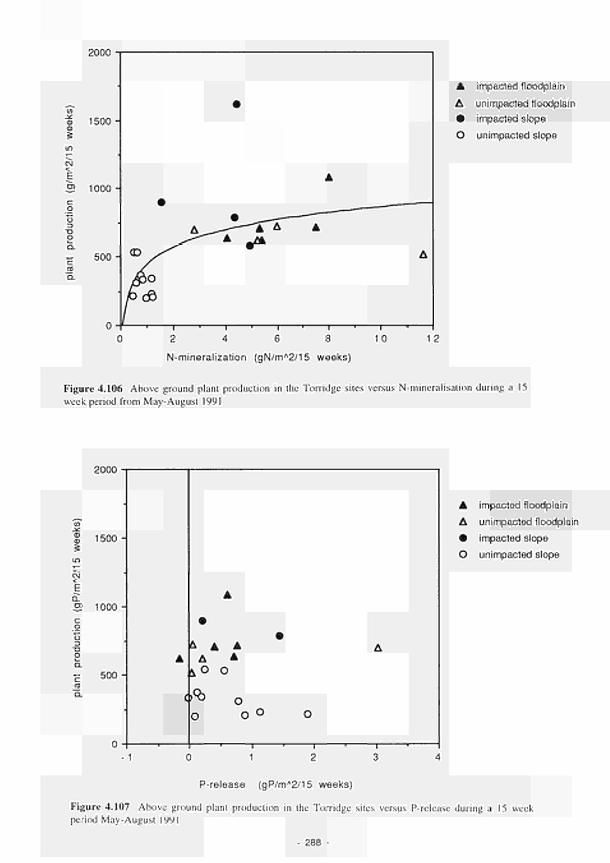
2000
1500
—ι— 2 4 6 8 10
Nmineralization (gN/mA2/15 weeks)
▲ impacted floodplain
Δ unimpacted floodplain
9 impacted slope
O unimpacted slope
Figure 4.106 Above ground plant production in the Torridge sites versus Nmineralisation during a 15
week period from MayAugust 1991
CO J £
ω S
LO
CM
< E EL
s c o õ 3
X l O
CL
Έ ra Q .
¿uuu
1500
1000
500
0
▲
c
A
•
• * A A
Δ A \ 0 O
><fe 0
o o o O
■ 1 ■ r
Δ
ι — , 1
A impacted floodplain
Δ unimpacted floodplain
• impacted slope
O unimpacted slope
Prelease (gP/mA2/15 weeks)
Figure 4.107 Above ground plant production in the Torridge sites versus Prclcase during a 15 week
period MayAugust 1991
288

CO φ
¡I -ζ.
α> σ>
ã z α σι ω Ε
A impacted floodplain
Δ unimpacted floodplain
• impacted slope
O unimpacted slope
C/N ratio
Figure 4.108 Relative Nmineralisation during a 15 week period from MayAugust 1991 in the Torridge
sites versus the soil C/N ratio
2 i> Φ Φ c 5
cu en Φ E
A impacted floodplain
Δ unimpacted floodplain
• impacted slope
O unimpacted slope
400
Figure 4.109 Relative Nmineralisation during a 15 week period from MayAugust 1991 in the Torridge
sites versus the soil C/P ratio
289
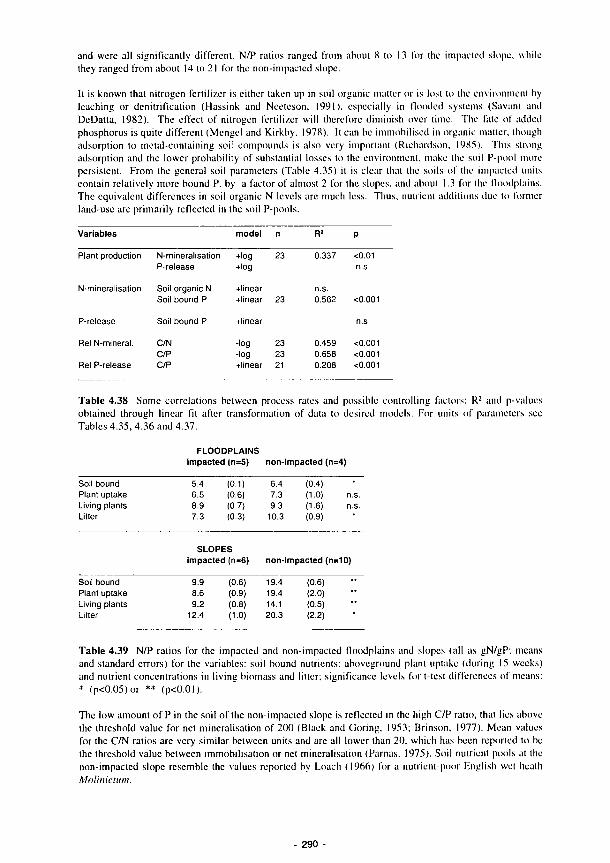
and were all significantly different N/P ratios ranged from about 8 to 13 for the impacted slope
they ranged from about 14 to 21 for the nonimpacted slope.
whi le
lt is known that nitrogen fertilizer is either taken up in soil organic matter or is lost to the environment by
leaching or denitrification (Hassink and Neelcson. 1991). especially in Hooded systems (Savant and
DeDatla, 1982). The effect of nitrogen fertilizer will therefore diminish over time. The fate of added
phosphorus is quite different (Mengel and Kirkby. 1978). It can be immobilised in organic matter, though
adsorption to metalcontaining soil compounds is also very important (Richardson, 1985). This strong
adsorption and the lower probability of substantial losses to the environment, make the soil Ppool more
persistent. From the general soil parameters (Table 4.35) it is clear that the soils of the impacted units
contain relatively more bound P. by a factor of almost 2 for the slopes, and about 1.3 for the floodplains.
The equivalent differences in soil organic N levels are much less. Thus, nutrient additions due to former
landuse are primarily reflected in the soil Ppools.
Variables
Plant production
Nmineralisation
Prelease
Rel Nmineral.
Rel Prelease
Nmineralisation
Prelease
Soil organic N
Soil bound Ρ
Soil bound Ρ
C N
C'P
C/P
model
+log
+log
+linear
+linear
+linear
log
log
+linear
η
23
23
23
23
21
R2
0.337
n.s
0.562
0.459
0.658
0.208
Ρ
<0.01
n.s.
<0.001
n.s.
<0.001
<0.001
<0.001
Table 4.38 Some correlations between process rates and possible controlling factors; R2 and pvalues
obtained through linear fit after transformation of data to desired models. For units of parameters see
Tables 4.35, 4.36 and 4.37.
FLOODPLAINS impacted (n=5) nonimpacted (n=4)
Soil bound
Plant uptake
Living plants
Litter
Soil bound
Plant uptake
Living plants
Litter
5.4
6 5
8.9
7.3
(0.1)
(0.6)
(0.7)
I0.3)
SLOPES
impacted ¡n=6)
9.9
8.6
9.2
12.4
(0.6)
(0.9)
(0.8)
(1.0)
6.4
7.3
9.3
10.3
(0.4)
(1.0) n.s.
(1.6) n.s.
(0.9)
nonImpacted (n=10)
19.4
19.4
14.1
203
(0.6)
(2.0)
(0.5)
(2.2)
Table 4.39 N/P ratios for the impacted and nonimpacted floodplains and slopes (all as gN/gP; means
and standard errors) for the variables: soil bound nutrients; aboveground plant uptake (during 15 weeks)
and nutrient concentrations in living biomass and litter; significance levels for ttest differences of means:
* (p<0.05)or ** (p<0.0l).
The low amount of Ρ in the soil of the nonimpacted slope is reflected in the high C/P ratio, that lies above
the threshold value for net mineralisation of 200 (Black and Goring, 1953; Brinson, I977). Mean values
for the C/N ratios are very similar between units and arc all lower than 20, which has been reponed to be
the threshold value between immobilisation or net mineralisation (Parnas, 1975). Soil nutrient pools at the
nonimpacted slope resemble the values reported by Loach (I966) for a nutricnlpoor English wel heath
Molinielum.
- 290

It can be concluded that the impacted slope unit clearly demonstrates the impact of nutrient additions. The floodplains differ only in soil-P status and do not show any clear effect of the impact of nutrient addition. It is possible that the effect of former nutrient additions has now gone, or has been completely masked by impacts derived from the river. It is known that river Hooding can deposit considerable amounts of Ρ with mineral sediments (Whigham et al, 1988).
The low value of aboveground plant production at the non-impacted slope (328 g/m2/15 weeks) indicates low nutrient availability. Values for aboveground production on the floodplain are very much in line with those for grazed fertilized Dutch grasslands on sandy soils (Hassink, 1992). These comparisons indicate that the nutrient levels in the non-impacted slope soil are typical of those recorded for an oligotrophic wet heathland ecosystem, whereas levels on both floodplains resemble grasslands that have been fertilized.
The correlative approach gives information about the relations between process rates and possible controlling factors. The significant positive correlation between biomass production and soil N-mineralisation (Table 4.38; Fig. 4.106) indicates that both increase when nutrient inputs increase. Contrary to studies on secondary succession of cut heathlands (Berendse, 1990), the increase of N-mineralisation in this study is not brought about by a larger soil organic N-pool (Table 4.38). Relative mineralisation rates correct for different soil organic-N pools, and can be used to examine possible relations with parameters describing the quality of soil organic matter. The relative N-mineralisation rate is negatively related to the soil C/N ratio (Fig. 4.108; Table 4.37). The C/N ratios from the non-impacted slope are relatively high and lie partly above the threshold value of 20. At the same time N-mineralisation is very low. Apparently, the N-content of soil organic matter is low in the unit dominated by Molinia caerulea. In the other units N-mineralisation is not hampered by a high C/N ratio, and other factors like soil type, environmental conditions or other quality parameters control mineralisation rates. When the possible control of relative N-mineralisation by C/P ratios is examined (Fig. 4.109; Table 4.38) again a negative relation appears. Above the threshold value of 200 almost no relative N-mineralisation occurs.
There is no clear relationship visible between plant production and P-release (Fig. 4.107), or between P-release and the soil bound P-pool. The type of P-containing soil compounds in the mineral floodplain soils are probably different from those in the more organic slope soils. All these different fractions will behave differently and therefore obscure any relation between P-release and the total soil bound P-pool.
One of the main objectives of this study was to examine the possible use of indicators for nutrient related processes and wetland functioning. The value of the C/N ratios has already been proven (Parnas, 1975). C/N ratios were close to the threshold value of 20 in the non-impacted slope where mineralisation values were very low. The C/P ratio was much higher than the threshold value, and possibly indicated a strong P-shortage. The use of this ratio however, has to be combined with information on inorganic P-pools and P-availability.
The N/P ratio in biomass is another possible valuable indicator (Verhoeven et al, 1993, 1994), although it is not yet generally tested for different vegetation lypes. A ratio between 14 and 16 indicated a co-limitation of Ν and Ρ in a recent review of fertilization experiments in several types of wet grasslands (Vorhoeven et al, 1994). Higher rations indicated a P-limitation, while lower ratios indicated an N-limitation. From Table 4.39 it is clear that the vegetation at the unimpacted slope is in the range limited by both Ν and P. The fertilization experiment carried out in 1992 (sec section 4.4.3) did however result in an N-limitation, but the N/P ratio was much lower in this year. In the following year (1993), however, the N/P ratio was 14.7, which is similar to the ratio in 1991 (Tabic 4.39). Then, the co-limitation was experimentally confirmed (van Oorschot et al, in prep). This indicates that Ν and Ρ availability can show important differences between years. In litter of the unimpacted slope, the ratio is higher at 20 because of the relatively more efficient P- than N-retranslocation. This ratio is reflected in values close to 20 for the soil bound nutrient pools. Most N/P ratios in living biomass of the other units is close to 10, suggesting N-limitations. This is in agreement with the relation between plant production and N-mineralisation described above (4.106).
An important objective of this study was to analyse the role of the vegetation in nutrienl cycling, and the influence of nutrient additions on this role. In comparative studies on atmospheric N-deposition on nutrient cycling in Dutch hcathlands (Aerts 1989; van Vuuren 1992) it was concluded that as nutrient availability increases, nutrient cycling occurs at a higher speed. From the data presented in this sludy a similar conclusion can be drawn.
291
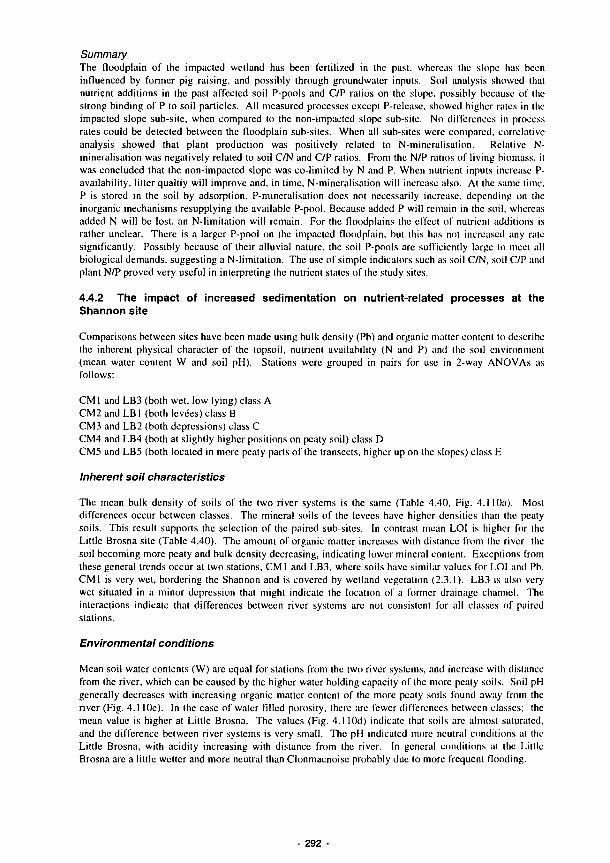
Summary
The floodplain of the impacted wetland has been fertilized in the past, whereas the slope has been
influenced by former pig raising, and possibly through groundwater inputs. Soil analysis showed that
nutrient additions in the past affected soil P-pools and C/P ratios on the slope, possibly because of the
strong binding of Ρ to soil particles. All measured processes except P-releasc, showed higher rates in the
impacted slope sub-site, when compared to the non-impacted slope sub-site. No differences in process
rates could be detected between the floodplain sub-sites. When all sub-sites were compared, correlative
analysis showed that plant production was positively related to N-mineralisation. Relative N-
mineralisation was negatively related to soil C/N and C/P ratios. From the N/P ratios of living biomass, it
was concluded that the non-impacted slope was co-limited by Ν and P. When nutrient inputs increase P-
availability, litter qualtiy will improve and, in time, N-mineralisation will increase also. At the same lime.
Ρ is stored in the soil by adsorption. P-mineralisation does not necessarily increase, depending on the
inorganic mechanisms resupplying the available P-pool. Because added Ρ will remain in the soil, whereas
added Ν will be lost, an N-limitation will remain. For the floodplains the effect of nutrient additions is
rather unclear. There is a larger P-pool on the impacted floodplain, but this has not increased any rate
significantly. Possibly because of their alluvial nature, the soil P-pools arc sufficiently large to meet all
biological demands, suggesting a N-limitation. The use of simple indicators such as soil C/N, soil C/P and
plant N/P proved very useful in interpreting the nutrient stales of the study sites.
4.4.2 The impact of increased sedimentation on nutrient-related processes at the
Shannon site
Comparisons between sites have been made using bulk density (Pb) and organic matter content to describe
the inherent physical character of the topsoil, nutrient availability (N and P) and the soil environment
(mean water content W and soil pH). Stations were grouped in pairs for use in 2-way ANOVAs as
follows:
CM 1 and LB3 (both wet, low lying) class A
CM2 and LB 1 (both levées) class Β
CM3 and LB2 (both depressions) class C
CM4 and LB4 (both at slightly higher positions on peaty soil) class D
CM5 and LB5 (both located in more peaty parts of the transects, higher up on the slopes) class E
Inherent soil characteristics
The mean bulk density of soils of the two river systems is the same (Table 4.40, Fig. 4.110a). Mosl
differences occur between classes. The mineral soils of the levees have higher densities than the peaty
soils. This result supports the selection of the paired sub-sites. In contrast mean LOI is higher for the
Little Brosna site (Table 4.40). The amount of organic matter increases with distance from the river the
soil becoming more peaty and bulk density decreasing, indicating lower mineral content. Exceptions from
these general trends occur at two stations, CM1 and LB3, where soils have similar values for LOI and Ph.
CM1 is very wet, bordering the Shannon and is covered by weiland vegetation (2.3.1). LB3 is also very
wet situated in a minor depression that might indicate the location of a former drainage channel. The
interactions indicate that differences between river systems are not consistent for all classes of paired
stations.
Environmental conditions
Mean soil water contents (W) are equal for stations from the two river systems, and increase with distance
from the river, which can be caused by the higher water holding capacity of the more peaty soils. Soil pH
generally decreases with increasing organic matter content of the more peaty soils found away from the
river (Fig. 4.110e). In the case of water filled porosity, there are fewer differences between classes; the
mean value is higher at Little Brosna. The values (Fig. 4.1 lOd) indicate that soils are almost saturated,
and the difference between river systems is very small. The pH indicated more neutral conditions at the
Little Brosna, with acidity increasing with distance from the river. In general conditions at the Little
Brosna are a little wetter and more neutral than Clonmacnoise probably due to more frequent Hooding.
- 292 -
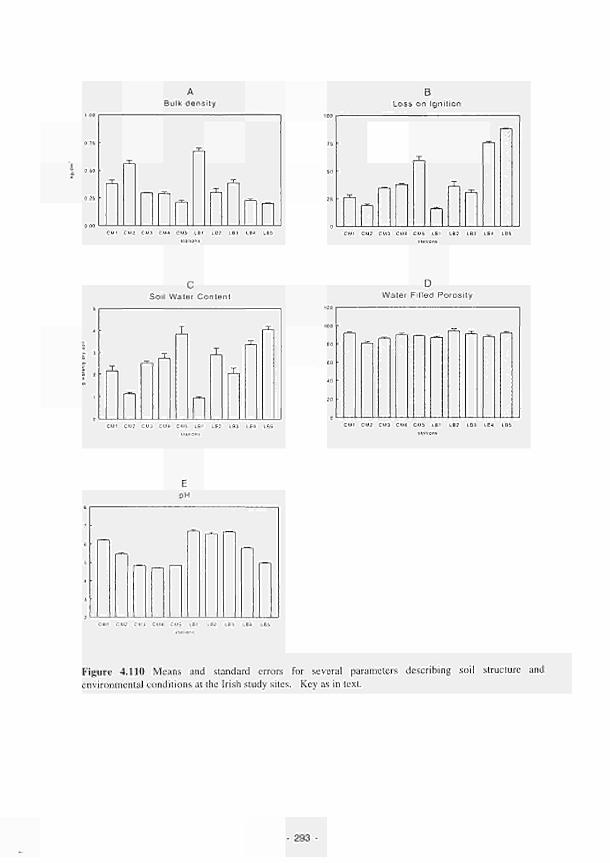
Β Loss on Ignit ion
Q Q CM1 CM2 CUS CU* CU5 LBt LB2 LBÎ IB4 LB5 CM1 CU2 CM3 CM4 CM 5 LBI LB2 LBÎ LB* LB5
Soil Water Content
X Γ-Ί
JT_
-=-
r-n ή
Π
χ J L
Water Filled Porosity
CUI CU2 CU3 CI.M CMã LBI LE? LB3 LB4 CM! CM? CM3 CM* CM5 LBt LB2 LB3 LB4
E pH
CUI CU? CUI CU4 CMi LBI LB? LB3
Figure 4.110 Means and standard errors for several parameters describing soil structure and environmental conditions at the Irish study sites. Key as in text.
- 293
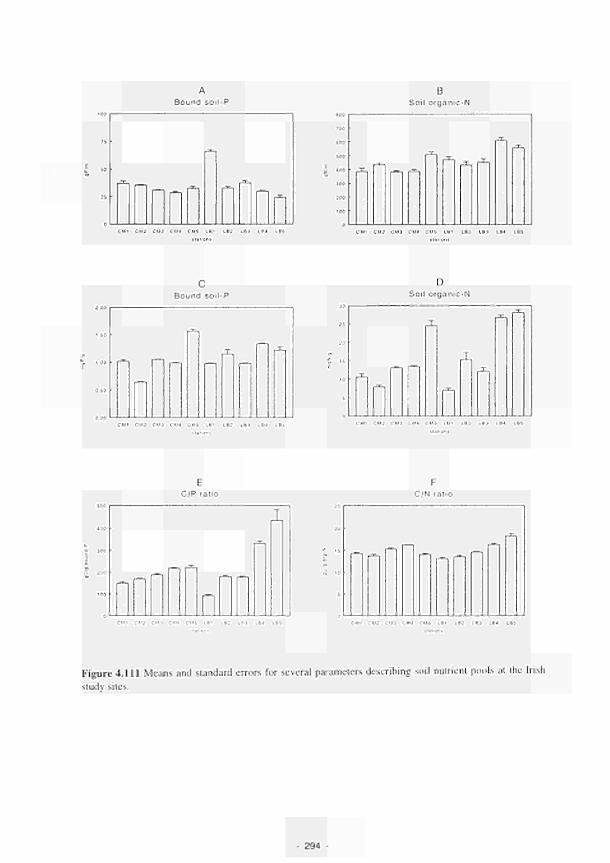
Bound soilP
CUI CU2 CUÌ CIJ4 CM5 LBI LE? LBJ Lß4 IB5
Β Soil organicN
2 LBI LB* LBS
C
Bound soilP Soil organicN
rJr.
^:-Π
J L
I
X «
CU1 CM? CM J CM4 CM 5 LBI LB! LB3 LBJ LBS CM ι CM2 CU3 CM4 CMS LUI LB 2 LBJ LB4 LBS
E C/P ralio
ππΓ
JL
πΠΠ CUI CM? CMS d u CIM LP1 LB? LBi L B4 IBS CMl CM2 CM3 CM4 C u i LBI LB? LB3 LB4 LB5
Figure 4.111 Means and standard errors for several parameters describing soil nutrient pools at the Irish
study sites.
294
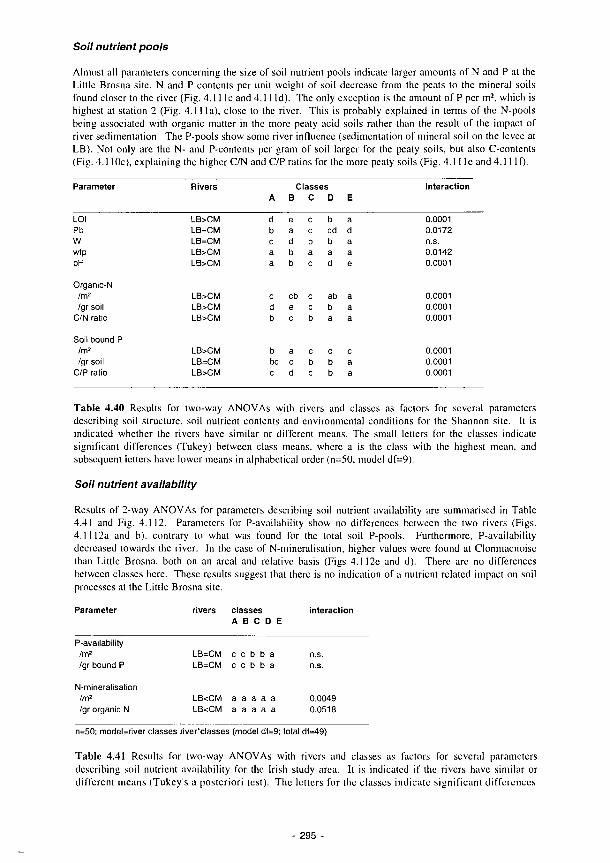
Soil nutrient pools
Almost all parameters concerning the size of soil nutrient pools indicate larger amounts of N and Ρ at the Little Brosna site. Ν and Ρ contents per unit weight of soil decrease from the peats to the mineral soils found closer to the river (Fig. 4.111c and 4.111d). The only exception is the amount of Ρ per in2, which is highest at station 2 (Fig. 4.11 la), close to the river. This is probably explained in terms of the N-pools being associated with organic matter in the more peaty acid soils rather than the result of the impact of river sedimentation. The P-pools show some river influence (sedimentation of mineral soil on the levee at LB). Not only are the N- and P-contents per gram of soil larger for the peaty soils, but also C-contents (Fig. 4.110c), explaining the higher C/N and C/P ratios for the more peaty soils (Fig. 4.11 le and 4.11 If)·
Parameter Rivers Classes Interaction A B C D E
0.0001 0.0172 n.s. 0.0142 0.0001
0.0001 0.0001 0.0001
LOI Pb W wfp pH
Organic-N /m2
/gr soil C/N ratio
Soil bound Ρ /m2
/gr soil C/P ratio
LB>CM LB=CM LB=CM LB>CM LB>CM
LB>CM LB>CM LB>CM
LB>CM LB=CM LB>CM
d b c a a
c d b
b bc c
e a d b b
eb e c
a c d
c c b a c
c c b
c b c
b cd b a d
ab b a
c b b
a d a a e
a a a
c a a
0.0001 0.0001 0.0001
Table 4.40 Results for two-way ANOVAs with rivers and classes as factors for several parameters describing soil structure, soil nutrient contents and environmental conditions for the Shannon site. It is indicated whether the rivers have similar or different means. The small letters for the classes indicate significant differences (Tukey) between class means, where a is the class with the highest mean, and subsequent letters have lower means in alphabetical order (n=50, model df=9).
So/7 nutrient availability
Results of 2-way ANOVAs for parameters describing soil nutrient availability arc summarised in Table 4.41 and Fig. 4.112. Parameters for P-availabilily show no differences between the two rivers (Figs. 4.1112a and b). contrary to what was found for the total soil P-pools. Furthermore, P-availability decreased towards the river. In the case of N-mineralisation, higher values were found at Clonmacnoise than Little Brosna, both on an areal and relative basis (Figs 4.1 12c and d). There arc no differences between classes here. These results suggest that there is no indication of a nutrient related impact on soil processes at the Little Brosna site.
Parameter
P-availability /m2
/gr bound Ρ
N-mineralisation /m2
/gr organic Ν
rivers
LB=CM LB=CM
LB<CM LB<CM
classes A B C D E
c c b b a c c b b a
a a a a a a a a a a
interaction
n.s. n.s.
0.0049 0.0518
n=50; model=river classes river'classes (model df=9; total df=49)
Table 4.41 Results for two-way ANOVAs wilh rivers and classes as factors for several parameters describing soil nutrient availability for the Irish study area. It is indicated if the rivers have similar or different means (Tukcy's a posteriori test). The letters for the classes indicate significant differences
295 -
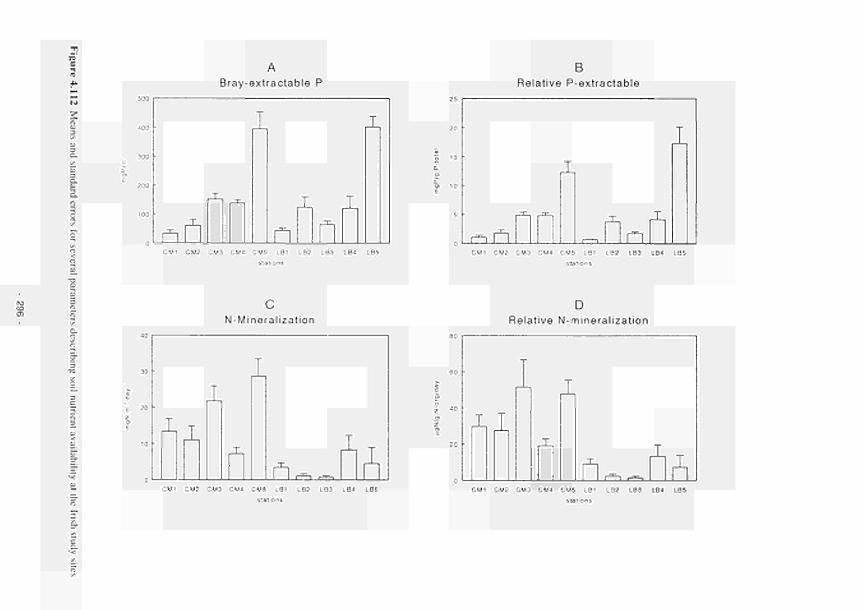
Bray-extractable Ρ
■00
300
;·αο
100
^
ήή
- U η JU
χ
n 1
χ
CM. CM2 CM3 CMi CM5 LBI LB2 LB3 LB4 LB5 stations
N-Mineralization
1Û
*c
E 2 0
Ζ
E
10
I τ
JL JL
, χ .
ñ r ^ ^
Τ
ή CM1 CM2 CM3 CM4 CM5 LSI LB2 LB3 LB4 LB5
stations
Β Relative P-extractable
CM1 CM2 CM3 C M i CM5 L91 LB2 LB3 LB4 LB5 stations
D Relative N-mineralizafion
-
τ I .
r \
JL
ñ ^ ^ χ ή CMI CM2 CM3 CM4 CM5 LB t LB2 LB3 LB4 IBS
stations
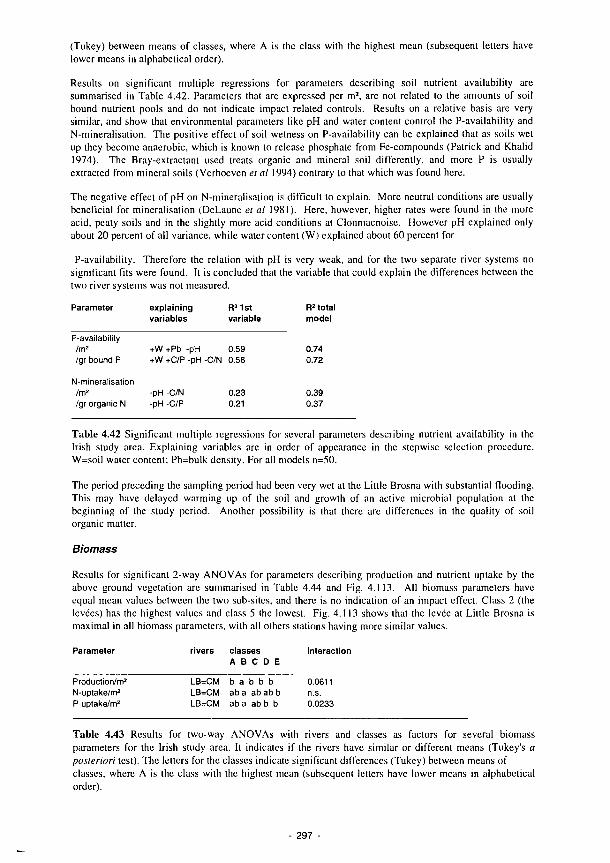
(Tukey) between means of classes, where A is the class with the highest mean (subsequent letters have
lower means in alphabetical order).
Results on significant multiple regressions for parameters describing soil nutrient availability are
summarised in Table 4.42. Parameters that are expressed per m2, are not related to the amounts of soil
bound nutrient pools and do not indicate impact related controls. Results on a relative basis are very
similar, and show that environmental parameters like pH and water content control the P-availability and
N-mineralisation. The positive effect of soil wetness on P-availability can be explained that as soils wet
up they become anaerobic, which is known to release phosphate from Fe-compounds (Patrick and Khalid
1974). The Bray-extractant used treats organic and mineral soil differently, and more Ρ is usually
extracted from mineral soils (Verhoeven et al 1994) contrary to that which was found here.
The negative effect of pH on N-mineralisation is difficult to explain. More neutral conditions are usually
beneficial for mineralisation (DeLaune et al 1981). Here, however, higher rates were found in the more
acid, peaty soils and in the slightly more acid conditions at Clonmacnoise. However pH explained only
about 20 percent of all variance, while water content (W) explained about 60 percent for
P-availability. Therefore the relation with pH is very weak, and for the two separate river systems no
significant fits were found. It is concluded that the variable that could explain the differences between the
two river systems was not measured.
Parameter
P-availability
/m2
/gr bound Ρ
N-mineralisation
/m2
/gr organic Ν
explaining
variables
+W+Pb -pH
+W +C/P -pH
-pH -C/N
-pH -C/P
R21st
variable
0.59
-C/N 0.58
0.23
0.21
R2 total
model
0.74
0.72
0.39
0.37
Table 4.42 Significant multiple regressions for several parameters describing nutrient availability in the
Irish study area. Explaining variables are in order of appearance in the stepwise selection procedure.
W=soil water content; Pb=bulk density. For all models n=50.
The period preceding the sampling period had been very wel at the Little Brosna with substantial flooding.
This may have delayed warming up of the soil and growth of an active microbial population al the
beginning of the study period. Another possibility is that there are differences in the quality of soil
organic matter.
Biomass
Results for significant 2-way ANOVAs for parameters describing production and nutrient uptake by the
above ground vegetation arc summarised in Table 4.44 and Fig. 4.113. All biomass parameters have
equal mean values between the two sub-sites, and there is no indication of an impact effect. Class 2 (the
levées) has the highest values and class 5 the lowest. Fig. 4.113 shows that the levée at Little Brosna is
maximal in all biomass parameters, with all others stations having more similar values.
Parameter rivers classes Interaction Α Β C D E
Production/m2 LB=CM b a b b b 0.0611
N-uptake/m2 LB=CM ab a ab ab b n.s.
P-uptake/m2 LB=CM ab a ab b b 0.0233
Table 4.43 Results for two-way ANOVAs with rivers and classes as factors for several biomass
parameters for the Irish study area. It indicates if the rivers have similar or different means (Tukcy's α
posteriori test). The letters for the classes indicate significant differences (Tukey) between means of
classes, where A is the class with the highest mean (subsequent letters have lower means in alphabetical
order).
297
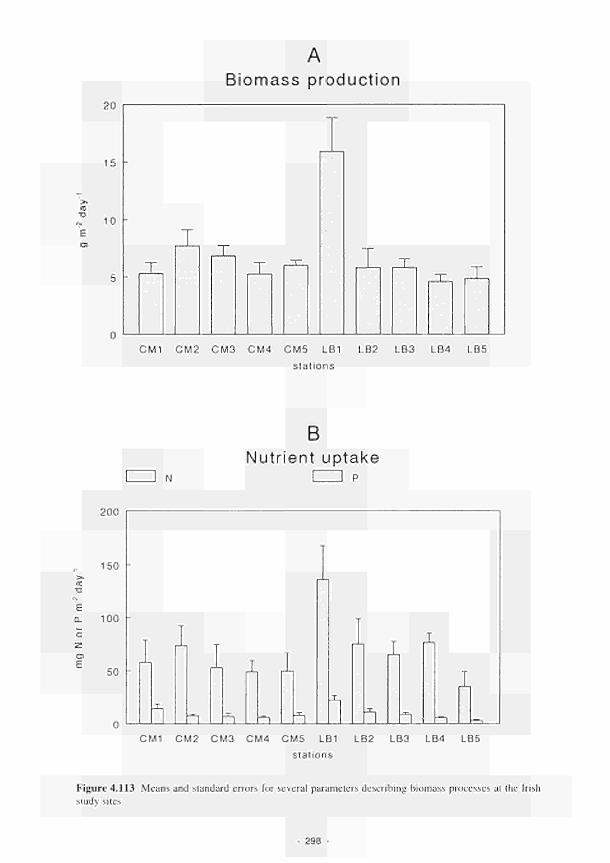
Biomass production
E CTI
CM1 CM2 CM3 CM4 CM5 LB1 LB2 LB3 LB4 LB5
s ta t ions
Β
Nutrient uptake 1__1 Ρ
ε α.
200
150
100
50
Ι
Ì ~1
L
=1
Γ J
~1
L \ _
"1
L " L
J
ι
:
CM1 CM2 CM3 CM4 CM5 LB1 LB2 LB3 LB4 LB5
stat ions
Figure 4.113 Means and standard errors for several parameters describing biomass processes at the Irish
study sites
298

Results for significant multiple regressions are summarised in Table 4.44. The multiple regressions show
the importance of soil bound Ρ for all three parameters. This again shows maxima on the levée at Little
Brosna (compare Figs 4.11 la and 4.113a), and is an indication of the importance of sedimentation of
mineral material. All other sites have very similar production values. This result is fully supported by the
phytometer study with soils from different study areas of the FAEWE project (Spink 1994). There is no
relation with the nutrient availability parameters, possibly because of low temperatures and the few hours
of sun in the sampling period. Differences due to nutrient availability could become more apparent later
in lhe growing season when maximum dilution of nutrients in plant tissue has taken place.
Parameter explaining R21st R
2 total
variables variable model
Production/m2 +soil bound Ρ 0.46 0.46
N-uptake/m2 +soil bound Ρ 0.23 0.23
P-uptake/m2 +soil bound Ρ + wfp 0.38 0.44
Table 4.44 Significant multiple regressions for several biomass parameters in the Irish study area.
Explaining variables are in order of appearance in the stepwise selection procedure. For all models n=50.
Summary
By classifying pairs of stations into five classes a meaningful analysis could be carried out. Large
differences for many parameters were found between the classes, often greater than differences between
rivers. However, soils of the Little Brosna floodplain are richer in both Ν and P. Higher Ν values were
found particularly in the more peaty soils that have been less affected by river influence, and are therefore
not likely to result from sedimentation. The higher soil P-conlcnt at Little Brosna was caused by high
values for the levée which is probably related to sedimentation (see also Whigham el al, 1988). These
differences in soil nutrient pools were, however, not reflected in soil nutrient availability. P-availability
was related to soil wetness, which shows mostly local variation. N-mineralisation was clearly higher at
the Clonmacnoise site. No satisfactory explanation could be found for this difference. Production and
nutrienl uptake were similar for most classes for the two rivers. Apparently, nutrient availability does not
control plant production in the sampling period. Indicative of this is that the fertilization experiment
performed at station CM2 in 1992 did not give any significant effects.
Thus, hardly any nutrient-related differences were found that could be attributed to increased
sedimentation. Therefore, this study does not provide insight into the effects of a sedimentation impact on
soil nutrient availability and plant production.
4.4.3 Fertilizer enhancement
Torridge
Results from the fertilizer experiment carried out in the Torridge study area in 1992, indicated that total
aboveground biomass increased significantly at the highest level of N-addition (treatment N2; Fig.
4.114a). This growth response is attributed to grasses, which contribute most of the biomass. This is
further confirmed by the highly significant correlation between total biomass and biomass of grasses only
(r=+0.7l9, p<0.00l df=29). The N-concentrations in the grasses were much lower than the critical level
of 14 mgN/g in all treatments (Fig.4.114b), whereas P-conccntrations were higher than the critical level of
0.7 mgP/g (Fig. 4.114c). N-concentrations did not increase on N-addilion, due to increased growth rate
(dilution effect). When Ρ was applied, growth was not stimulated and P-concentrations increased. The
N/P ratio of the control treatment was about 10. and was reduced by applying Ρ (Fig. 4.114d).
The fertilizer experiment in the greenhouse with the phytometer, indicated a limitation of firstly Ρ and
secondly N. From Fig. 4.115a it can be seen that applying Ν in isolation did not result in shoot weight
increases, whereas applying only Ρ did. Applying Ν in combination with Ρ resulted in the largest
increases. These plant responses could he predicted both from the plant nutrient concentrations of the
control treatment, and also from the N/P ratios (Figs. 4.115b - d). In all treatments where no Ρ was
added. P-conccntrations were below 0.7 mgP/g. while N-concentrations went up wilh N-addition to over
20. This is also reflected in the N/P ralio, which went up to values of 60. When Ρ was added at the highest
299
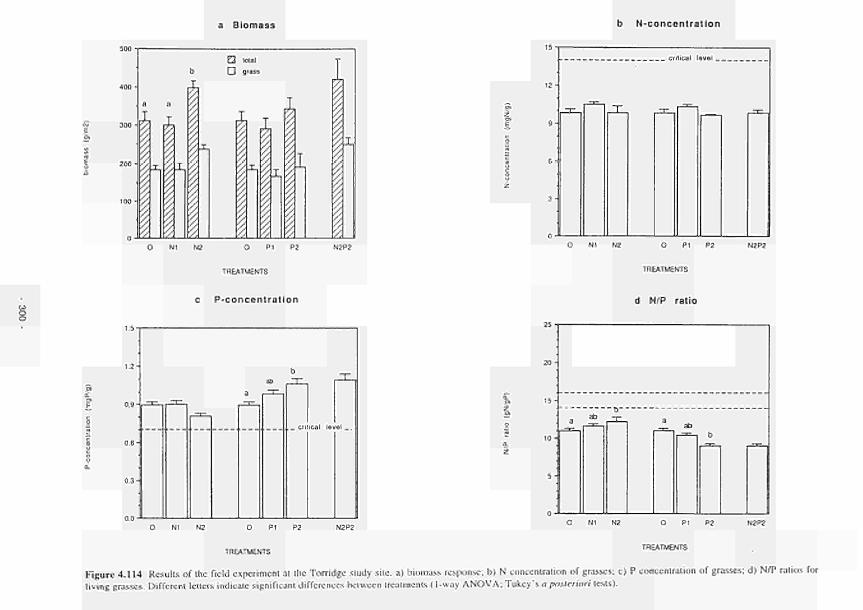
a B i o m a s s b N c o n c e n t r a t l o n
~ 300
Q loini
□ grass
lil ¿ ¿ *
i i I 't. ï. 2_ ^ JJ I
O NI N2 O PI P2 N2P2
TREATMENTS
la
12
9 -
6
3
-r
tical I
_ Τ " _,_
O NI N2 O PI P2 N2P2
TREATMENTS
co o o
c Pconcentration d N/P ratio
■
ι 2
0.6
0 3
ab
T " T " Γ
Jcal iet
"Γ ,
el _ .
O NI Ν2 Ο Ρ1 Ρ2 Ο Ni Ν2 Ο PI Ρ2
Figure 4.114 Results of the field experiment at the Torridge study site, a) biomass response; b) Ν concentration oí grasses; c) Ρ concentration of grasses; d) N/P ratios Tor
living grasses. Diffcrcnl letters indicate significant differences between treatments (Iway ANOVA; Tukcy's a posteriori tests).
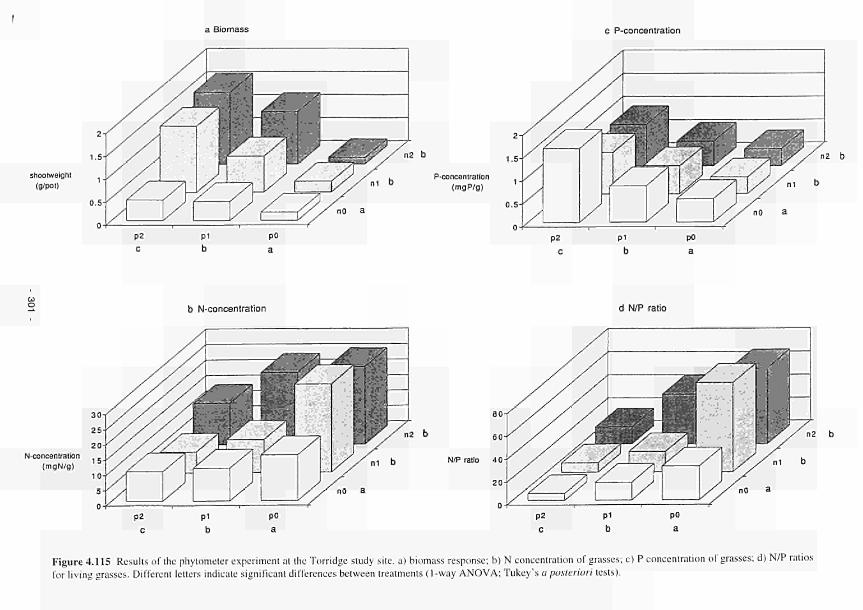
a Biomass c P-concentration
shoo (weight (g/poi)
n2 b
P-concenlration (mgP/g)
Π2 b
b N-concentrat ion d N/P ratio
N-concentration (mgN/g)
2 b
Figure 4.115 Results of the phylometer experiment at the Torridge study site, a) biomass response; b) Ν concentration of grasses; c) Ρ concentration of grasses; d) N/P ratios for living grasses. Different letters indicate significant differences between treatments ( 1-way ANOVA; Tukey's a posteriori tests).
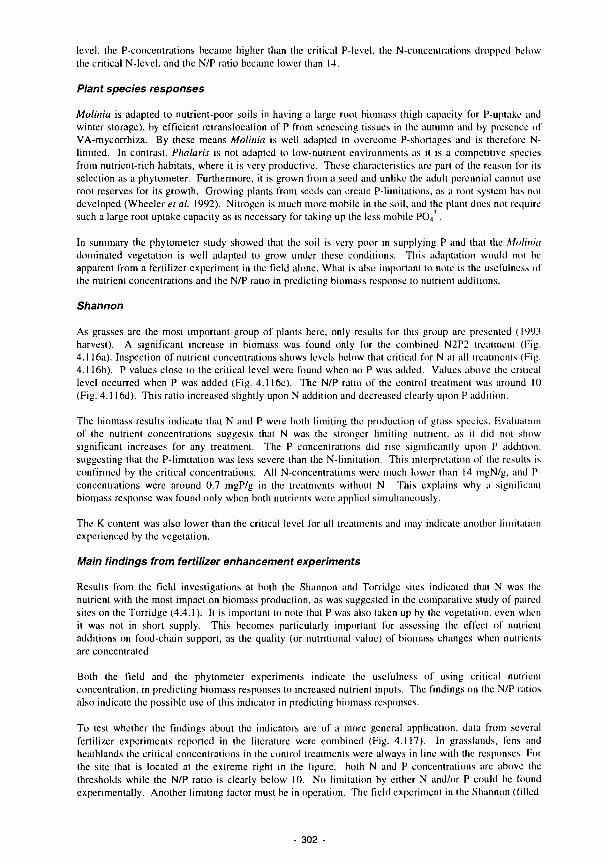
level, the P-concentrations became higher than the critical P-lcvel, the N-concentrations dropped below the critical N-level, and the N/P ratio became lower than 14.
Plant species responses
Molinia is adapted to nutrient-poor soils in having a large root biomass (high capacity for P-uptake and winter storage), by efficient retranslocation of Ρ from scncscing tissues in the autumn and by presence of VA-mycorrhiza. By these means Molinia is well adapted to overcome P-shortages and is therefore N-limiled. In contrast, Phalaris is not adapted to low-nutrienl environments as it is a competitive species from nutrient-rich habitats, where it is very productive. These characteristics arc part of the reason for its selection as a phytometer. Furthermore, it is grown from a seed and unlike the aduli perennial cannot use root reserves for its growth. Growing plants from seeds can create P-limitalions, as a root system has nol developed (Wheeler et al. 1992). Nitrogen is much more mobile in the soil, and the plani does not require such a large root uptake capacity as is necessary for taking up the less mobile POj .
In summary the phytometer study showed that the soil is very poor in supplying Ρ and that the Molinia dominated vegetation is well adapted to grow under these conditions. This adaptation would not he apparent from a fertilizer experiment in the field alone. What is also important to note is the usefulness of the nutrient concentrations and the N/P ratio in predicting biomass response to nutrienl additions.
Shannon
As grasses are the most important group of plants here, only results for this group are presented ( 1993 harvest). A significant increase in biomass was found only for the combined N2P2 treatment (Fig. 4.116a). Inspection of nutrient concentrations shows levels below that critical for Ν at all treatments (Fig. 4.116b). Ρ values close to the critical level were found when no Ρ was added. Values above the critical level occurred when Ρ was added (Fig. 4.1 16c). The N/P ratio of the control treatment was around 10 (Fig. 4.116d). This ratio increased slightly upon Ν addition and decreased clearly upon Ρ addition.
The biomass results indicate that Ν and Ρ were both limiting the production of grass species. Evaluation of' the nutrienl concentrations suggests thai Ν was the stronger limiting nutrient, as il did noi show significant increases for any treatment. The Ρ concentrations did rise significantly upon Ρ addition, suggesting that the P-limitalion was less severe than the N-limitation. This interpretation of the results is confirmed by the critical concentrations. All N-concentrations were much lower than 14 mgN/g, and P-concentrations were around 0.7 mgP/g in lhe treatments without N. This explains why a significant biomass response was found only when both nutrients were applied simultaneously.
The Κ content was also lower than the critical level for all treatments and may indicate another limitation experienced by the vegetation.
Main findings from fertilizer enhancement experiments
Results from the field investigations at both the Shannon and Torridge sites indicated that Ν was the nutrient with the most impact on biomass production, as was suggested in the comparative sludy of paired sites on the Torridge (4.4.1). It is important to note that Ρ was also taken up by the vegetation, even when it was not in short supply. This becomes particularly important for assessing the effect of nutrient additions on food-chain support, as the quality (or nutritional value) of biomass changes when nutrients are concentrated.
Both the field and the phytometer experiments indicate the usefulness of using critical nutrienl concentration, in predicting biomass responses to increased nutrient inputs. The findings on the N/P ratios also indicate the possible use of this indicator in predicting biomass responses.
To test whether the findings about the indicators are of a more general application, data from several fertilizer experiments reported in the literature were combined (Fig. 4.117). In grasslands, fens and healhlands the critical concentrations in the control treatments were always in line wilh the responses. For the site that is located at the extreme right in the figure, both Ν and Ρ concentrations arc above the thresholds while the N/P ratio is clearly below 10. No limitation by cither Ν and/or Ρ could be found experimentally. Another limiting factor must be in operation. The field experiment in lhe Shannon (filled
302

a Biomass b N - c o n c e n t r a t i o n
-
-
c
- r -τ
ideal level
"Γ -τι -
Ο Ν1 Ν2 Ο PI P2 N2P2
TREATMENTS
c P-concentrat ion d N/P ratio
:,' o -
1 b -
ι 0-
0.5-
ab
τ a a
τ
ab
Τ
b
T
c
T c
T
critical level
O N1 N2 O P1 P2 O N1 N2 O P1 P2
TREATMENTS TREATMENTS Figure 4.116 Results of the field experiment at the Shannon study site, a) biomass response; b) Ν concentration of grasses; c) Ρ concentration of grasses; d) N/P ratios for living grasses. Different letters indicate significant differences between treatments ( 1-way ANOVA; Tukey's a posteriori tests).
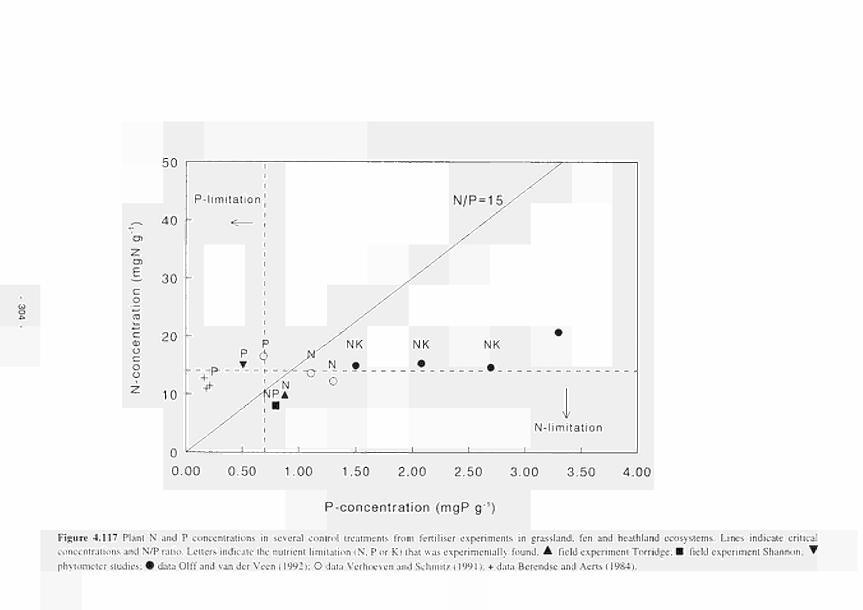
c CD υ c o υ
50
40
σι
■ä 30 c o
20 L
10
Plimitat¡on
0.00 0.50 1.00 1.50 2.00 2.50 3.00 3.50 4.00
Pconcentration (mgP g'1)
Figure 4.117 Plant N and Ρ concentrations in several control treatments from fertiliser experiments in grassland, fen and heathland ecosystems. Lines indicate critical
concentrations and N/P ratio. Letters indicate the nutrient limitation (Ν. Ρ or K) that was experimentally found. A field experiment Torridge; ■ field experiment Shannon; ▼
phytometer studies; · data Olff and van der Veen (1992); O data Verhoeven and Schmitz (1991): + data Berendse and Aerts (1984).

square in Fig. 4.117) shows a N/P ratio of 10 which is just outside the limit of critical P-concentrations. Nevertheless, a co-limitation was found, but with the possibility of a K-limitation also. It is suggested that the critical K-concentration (8 mgK/g) should be presented on a third axis.
This general comparison also shows that when K is limiting the N/P ratio is less useful for predicting biomass responses than the nutrient concentrations. The findings ofVerhoevan et al (1994) about a co-limitation range between 14 and 16 can be supported with the data from Fig. 4.117. In relation to this, it can be questioned whether the critical nutrient concentrations that were established for agricultureal use, have to be adjusted for natural vegetation types. To explore this topic further, a much larger database must be reviewed. Next to its use in predicting biomass responses, the N/P ratio gives information on the supply of each nutrient. For restoration purposes it is important to know which nutrient input should be reduced to give the best chances for re-establishing low-productivity plant communities. The advantage of measuring the N/P ratio is flexibility in that plant nutrient concentrations in spring can also be used, whereas for evaluation of the critical nutrient concentrations plants have to be sampled at the stage that living biomass reaches its maximum (peak standing crop).
The phytometers were more strongly limited by P, contrary to the field evidence from research in the Torridge area. They should, therefore, not be used to predict biomass responses to nutrient impacts by the actual vegetation, but as an indication of soil nutrient status and supply. In combination with field experiments, they can indicate specific adaptations of the vegetation to shortages, which cannot be assessed with a field experiment alone. This becomes very important when restoration is not only aiming at a low-productivity stand, but also at restoration of' characteristic species composition. Reducing the N-inputs, as N/P ratios might suggest, will not result in the re-establishment of species adapted to P-poor soils.
4.4.4 Hydrological regimes using mesocosms
The different water levels resulted in soil pF values ranging from 1 to 4 (Table 4.45). This was clearly reflected in the oxygen levels and redox potentials: oxygen was much lower in the wet treatment while redox potential decreased as the water level increased. The temperature was higher in the dry than the wel treatments, although differences were very small. The soil pH was highest in the wet treatments. The large standard errors for the redox potentials in the control treatments coincides with a soil pF value of 2 (Fig. 4.118), when large soil pores are not yet filled with water. As soils become wetter, these pores become filled and oxygen diffusion rate is reduced (Meek and Stolzy, 1978). Oxygen is quickly depleted from the soil atmosphere, while the redox potential shows a continuous range of decreasing values around this soil water level, until values between -200 and -400 are reached. From the investigations covering a range of differing water levels, P-availability seemed to be reduced in the dry treatment (Tabic 4.46), though this is not apparent from the 2-way ANOVA. When one-way ANOVAs were applied to turfs from each site, the dry treatment had the lowest values for the turfs originating from the Loire grassland.
Both C- and N-mineralisation rates respond to all the different water levels, with low values reached for the dry treatment, and high values for the wet treatment. Cotton strip tensile strength loss (CTSL) showed a somewhat different pattern, being low for both the dry and wet treatments. The two consecutive incubations were not different, and were averaged per turf. Turfs from both study areas responded in a similar way to the treatments for C and N mineralisation and CTSL, as the river factor was not significant for these three process rates.
Denitrification rates at the end of the incubation period clearly increased with moisture levels, and were higher for the Allier turfs, possibly due to higher mineralisation rates providing more N in these soils. The production of methane related to the wet treatments only, while there were no differences between soils from the two river floodplains.
The applied treatments gave rise to clearly different soil conditions, as expressed in soil oxygen content and redox potentials, and are in agreement with literature on flooding (Gambrcll and Patrick, 1978). The dry treatment clearly limited the rate of mineralisation of soil organic matter, while wetting increased this process rale. Similar results for N mineralisation have been found by Stanford and Epstein (1974). However, the redox potentials measured in the wet treatments were at levels where a reduction in decomposition could be expected (DcLaune et al, 1981), and was confirmed by the cotton strip results. Redox potentials for the wet treatments at the soil surface, where most of the organic matter is present, were not as low as those deeper at 5 and 15 cm. CTSL gives an indication of cellulose decomposition rates down the soil profile, while C-mineralisation probably reflects decomposition in mostly the topsoil.
- 305
Parameter
pF Eh 0
pH
1
Allier
dry
3.68 (0.15)
710(16)
99.4(0.1)
5.55 (0.05)
26.2 (0.7)
Allier
control
2.00(0.01)
283(141)
94.7(1.8)
5.47 (0.04)
24.6 (0.6)
Allier
wet
0.98 (0.23)
242 (17)
16.4(2.9)
6.08(0.10)
23.3 (0.8)
Loire
dry
3.96 (0.35)
755 (24)
99.6(0.1)
4.85 (0.07)
25.9 (0.5)
Loire
control
2.83(0.41)
408 (88)
94.4(2.1)
4.89(0.16)
25.2 (0.4)
Loire
wet
1.52(0.19)
253(11)
13.9(2.0)
5.26(0.14)
24.5 (0.5)
factor
river
AkLo
AI=Lo
AI=Lo
AI>Lo
AI=Lo
factor
treatment
dry>con>wet
dry>con>wet
dry=con>wet
dry=con<wet
dry>con>wet
interaction
n.s.
n.s.
n.s.
n.s.
n.s.
Table 4.45 Means and standard errors for several parameters describing soil environmental conditions in the turf experiment on soil moisture. Significant effects in the 2way
ANOVA arc listed under the factors river and treatment by indicating which river or treatment has higher values (p>0.05). Significant interactions between river and treatment
arc denoted by stars (* for p<0.05; ** for p<0.01). Abbreviations used: pF. soil pF value at the beginning of the core incubation; Eh, redox potential in mV (mean of 5 and
15cm); T. temperature in "C; Oi, soil oxygen concentration in 9Í of atmospheric concentration; pH. soil pH at the beginning of the soil core incubation. Before calculating
means and standard errors, redox potentials were averaged per turf over both depths and for the different measurements in time. CTSL arc average values for the top 3I lem of
the soil.
Parameter
Pavailability
gP/m'
Cmineralisation
gC/m'7day
Methane production
mgC/m7day
Nmineralisation
mgN/m'7day
Denitrification
mgN/m'/day
CTSL (311cm)
%/day
Allier
dry
2.50 (0.23)
1.68(0.19)
0.66 (0.66)
18.3 (3.4)
0.32 (0.04)
3.04 (0.37)
Allier
control
3.59 (0.64)
3.24 (0.32)
0.00 (0.00)
43.6(11.8)
6.82 (4.47)
5.27 (0.43)
Allier
wet
3.40 (0.95)
4.44 (0.52)
222(111)
117(54)
45.5 (38.2)
3.35(0.16)
Loire
dry
1.85(0.08)
1.49(0.22)
0.00 (0.00)
55.3(14.1)
2.27 (0.95)
3.10(0.24)
Loire
control
2.43(0.21)
3.27 (0.50)
0.00 (0.00)
55.3(14.1)
2.27 (0.95)
5.39 (0.70)
Loire
wet
2.58 (0.24)
2.97(0.41)
41.1 (10.8)
89.4(19.1)
8.37 (4.56)
2.44(0.51)
factor
river
AI=Lo
AI=Lo
AI=Lo
AI=Lo
AI>Lo
AI=Lo
factor
treatment
dry=con=wet
dry<con<wet
dry=con<wet
dry<con<wet
dry<con<wet
dry<con>wet
interaction
n.s.
n.s.
■
n.s
n.s.
n.s.
Table 4.46 Means and standard errors for several process rates for the turf experiment, conditions in the turf experiment on soil moisture. Significant effects in the 2way
ANOVA are listed under the factors river and treatment by indicating which river or treatment has higher values (p>0.05). Significant interactions between river and site arc
denoted by stars (* for p<0.05; ** for rxO.OI ). Denitrification measured at the end of the incubation period is presented.
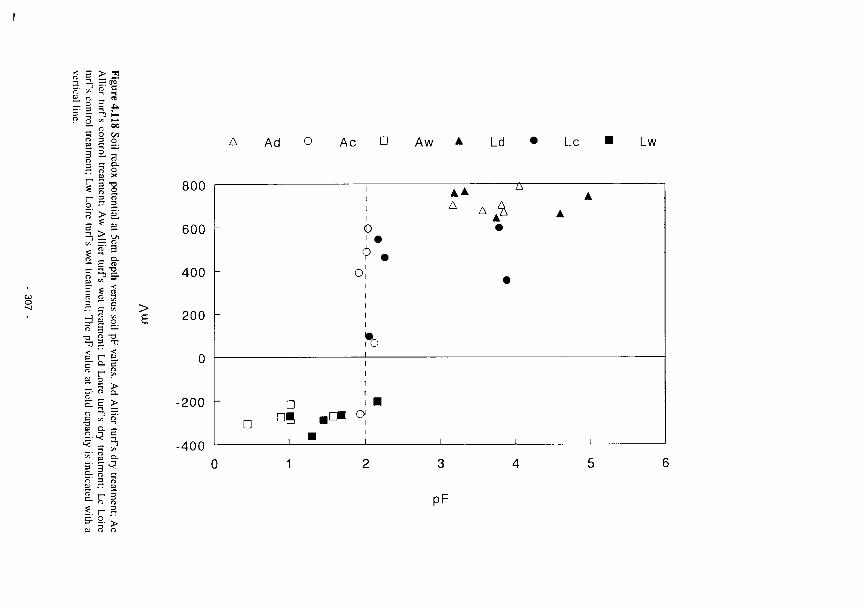
> Tl
ñ'
—
*Λ
η
-.
_ Γ:
f l
c
ΕΛ
Γ, 3
C
η
4
·— • Χ
Γ/1 C
3 2 . 1
= "Ι .τ 5 3 ΓΙ
η
—1
? C
—
Ο
> > > C
Τ3
C Π)
tu
w
Π
a c
=L Γ" EL
> a.
>
Ad O Ac ü Aw Ld Lc Lw
> E
800
600
400
200
200
400
π
I
I
I
1
0
1 ·
o!
I
I
To 1
1
1
D ! ■
, ■
AA Δ
•
•
ι ι
Α
Α
ι
— ι".
. c
=. η
> ο
PF
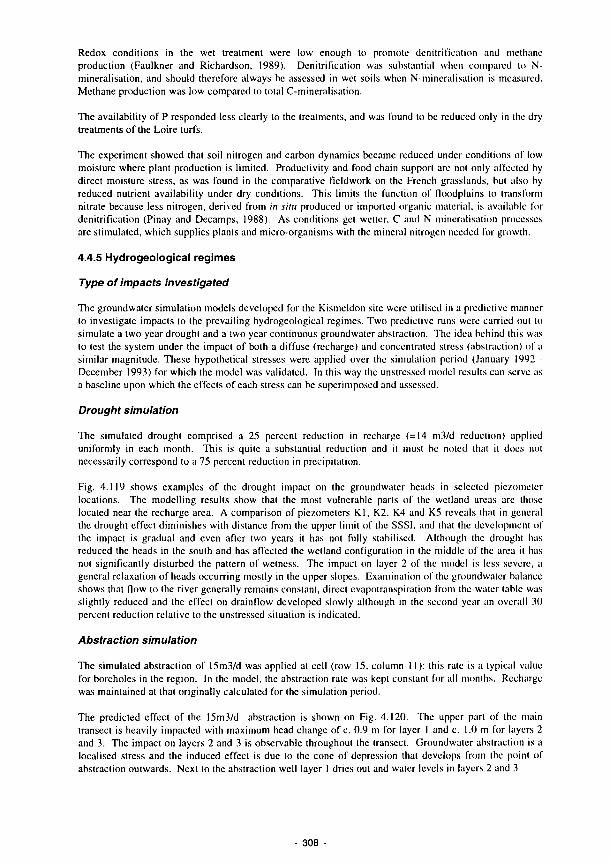
Redox conditions in the wet treatment were low enough to promote denitrification and methane
production (Faulkner and Richardson, 1989). Denitrification was substantial when compared to N-
mineralisation, and should therefore always be assessed in wet soils when N-mineralisation is measured.
Methane production was low compared to total C-mineralisation.
The availability of Ρ responded less clearly to the treatments, and was found to be reduced only in the dry
treatments of the Loire turfs.
The experiment showed that soil nitrogen and carbon dynamics became reduced under conditions of low
moisture where plant production is limited. Productivity and food chain support are not only affected by
direct moisture stress, as was found in the comparative fieldwork on the French grasslands, but also by
reduced nutrient availability under dry conditions. This limits the function of floodplains to transform
nitrate because less nitrogen, derived from in situ produced or imported organic material, is available for
denitrification (Pinay and Decamps, 1988). As conditions get wetter, C and Ν mineralisation processes
are stimulated, which supplies plants and micro-organisms with the mineral nitrogen needed for growth.
4.4.5 Hydrogeological regimes
Type of impacts investigated
The groundwater simulation models developed for the Kismeldon site were utilised in a predictive manner
to investigate impacts to the prevailing hydrogeological regimes. Two predictive runs were carried out lo
simulate a two year drought and a two year continuous groundwater abstraction. The idea behind this was
to test the system under the impact of both a diffuse (recharge) and concentrated stress (abstraction) of a
similar magnitude. These hypothetical stresses were applied over the simulation period (January 1992 -
December 1993) for which the model was validated. In this way the unstressed model results can serve as
a baseline upon which the effects of each stress can be superimposed and assessed.
Drought simulation
The simulated drought comprised a 25 percent reduction in recharge (=14 in3/d reduction) applied
uniformly in each month. This is quite a substantial reduction and it must be noted that it does not
necessarily correspond to a 75 percent reduction in precipitation.
Fig. 4.119 shows examples of the drought impact on the groundwater heads in selected piezometer
locations. The modelling results show that the most vulnerable parts of the wetland areas arc those
located near the recharge area. A comparison of piezometers Kl, K2, K4 and K5 reveals that in general
the drought effect diminishes with distance from the upper limit of the SSSI, and that the development of
the impact is gradual and even after two years it has not fully stabilised. Although the drought has
reduced the heads in the south and has affected the wetland configuration in the middle of the area it has
not significantly disturbed the pattern of welness. The impact on layer 2 of the model is less severe, a
general relaxation of heads occurring mostly in the upper slopes. Examination of the groundwater balance
shows that flow to the river generally remains constant, direct évapotranspiration from the waler table was
slightly reduced and the effect on drainflow developed slowly although in the second year an overall 30
percent reduction relative to the unstressed situation is indicated.
Abstraction simulation
The simulated abstraction of 15m3/d was applied at cell (row 15, column 11): this rate is a typical value
for boreholes in the region. In the model, the abstraction rate was kept constan! for all months. Recharge
was maintained at that originally calculated for the simulation period.
The predicted effect of the 15m3/d abstraction is shown on Fig. 4.120. The upper part of the main
transect is heavily impacted with maximum head change of c. 0.9 m for layer 1 and c. 1.0 m for layers 2
and 3. The impact on layers 2 and 3 is observable throughout the transect. Groundwater abstraction is a
localised stress and the induced effect is due to the cone of depression that develops from the point of
abstraction outwards. Next to the abstraction well layer I dries out and water levels in layers 2 and 3
308 -
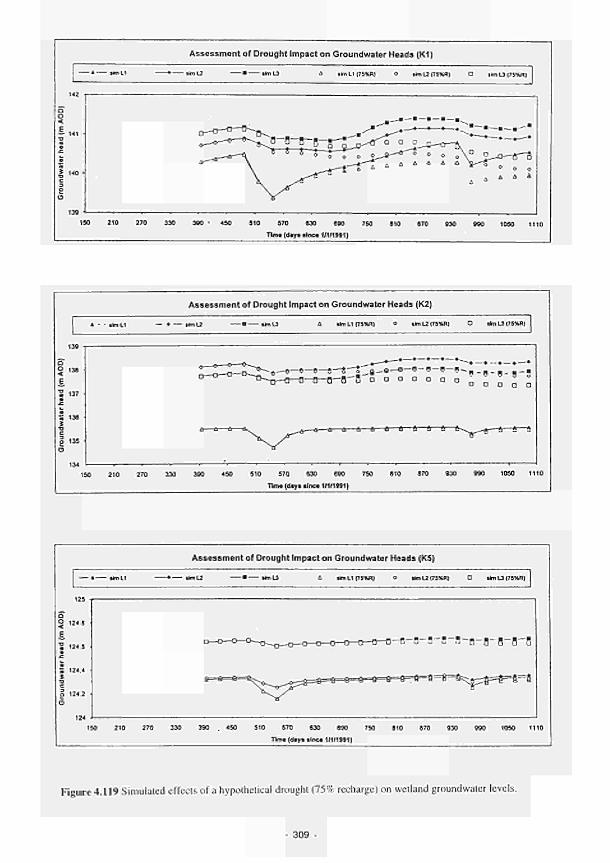
Assessment of Drought Impact on Groundwater Heads (K1)
,R| Λ imU[ 5XHl » UrnLriSXRI Ο i n , U (75%RI
c
E
150 210 270 330 300 ■ 450 510 570 530 590 750 510 570 930 MO 1050 1110
T im· (day· irne· 1/1/1991|
Assessment of Drought Impact on Groundwater Heads (K2)
* · · afcnU — ♦ — tknU ■ a«iL3 Δ slmLltTSXA) O •hnl2(7'%R) 0 tknU(75%R)
O 135
E
135
g 135
O
134
f l — Ο " " □ ο ο α α α ο □ ο α α □
-υ—ή—ο—ο—fi—ri—fi—fi—ó-*^r-*- •ΐ—ί—4
150 210 270 330 390 450 510 57CI 530 690 750 510 STO 930 990 1050 1110 Tim· (day· lir*. 1/1(1991)
Assessment of Drought Impact on Groundwater Heads (K5)
— * UmLI ♦ llmLÎ ■ rtnU Δ ι*ηLI (75KR) o iimL2(7S%R) O tfenL3(7S%R)
§ 124«
E.
S 124 5
g 1242
O
G—B35—!5—BB" fl_B~5
9=8=*
:^pí=e=ô
=8
150 210 270 330 390 . 450 510 570 530 590 750 510 570 930
Tim. (day· aine· 1(1/1991)
1050 1110
Figure 4.119 Simulated effects of a hypothetical drought (75% recharge) on wetland groundwater levels.
309
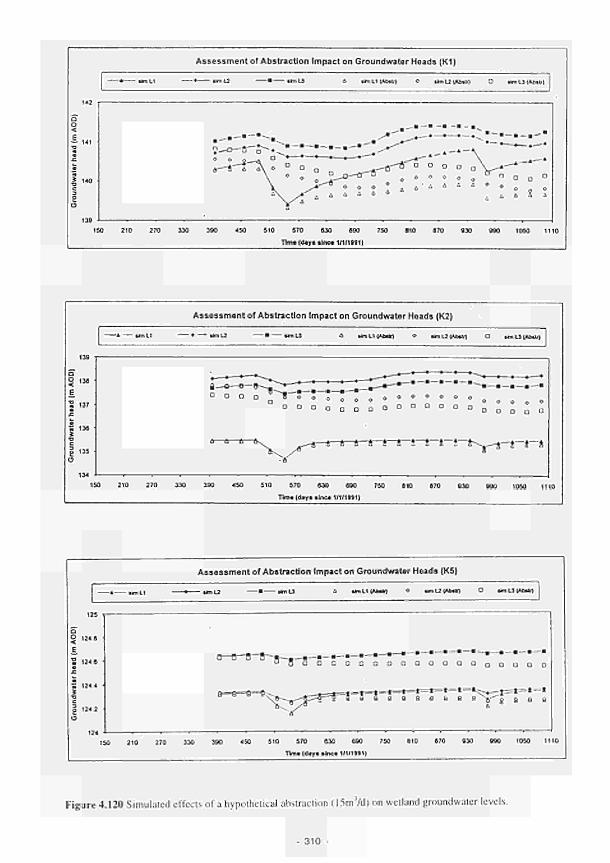
Assessment of Abstraction Impact on Groundwater Heads (K1)
a ihn LI (Abatr) o aan L2 (Abitr) O ahn L3 (Abatr)
t 140
210 270 330 390 450 510 570 SOO 590 750 610 STO 930 990 1050 1110
Tim· (day· aine· 1(1(1991)
Assessment of Abstraction Impact on Groundwater Heads (K2)
♦ U n U ■ aimlj atnL1(AbaV) o arm L2 (Abatí) O unL*(A6*lo
O 136
E.
ΐ 137
Ό C g 135 O
134
« a a a -
— ■—■—■
ο ο α α o
r—a—t—a—a t t -t—t—i—f V T * -t—ί—i
150 210 270 330 390 450 510 570 630 690 750 610 670 930 990 1050 1110 Tima (dayaalnca 1(1(19911
125
g 1246 E_ 'S 1246
g 1242
Assessment of Abstraction Impact on Groundwater Heads (K5)
Δ iti , LI (Maar) o arn L2 (afcatr) O un LI («Mio
150 210 270 330 390 450 510 570 530 590 750 610 670 930 990 1050 1110 Tima (day· linca 1(1(19911
Figure 4.120 Simulated effects of a hypothetical abstraction (l5m'Vd) on wetland groundwater levels.
- 310

PREDICTIVE RUN, UWER 1 A 75% RECHARGE Τ , STEADY STATE (January 92)
|Ni
20 25
15
Π
S a'·*?
H 30
2Γ
20
25 , 100m ,
PREDICTIVE RUN, LAYER 1 Jv ABSTRACTION (15m 3/d) Τ , STEADY STATE (January 92)
N
20 25
15
□ 30
'Ü?
INJ" eh
20
25
■ 'PO™ ■
Figure 4.121 Simulated effects of a hypothetical drought and abstraction on lhe Kismeldon groundwater
head distribution (steadv state model).
311
drop by up to 4 m. In comparison, layer 1 along the main transect seems generally to be little impacted (a
few tens of centimetres). The robustness of layer 1 is due to its low permeability. For layer I, the effect
of the abstraction occurs rapidly. By month 7 (July 1994) a significant part in the middle area (near the
abstraction) has dried out and by month 20 (August 1993) the wetness pattern has changed significantly.
Even after two years of pumping the cone of depression in layer 2 is relatively small. The groundwater
balances show that there is a significant reduction both in the How to the ditches (c. 50 percent) and in the
direct évapotranspiration from the groundwater. A slight decrease in flow to the river has also occurred.
Summary comment
Modelling suggests that the wetland is relatively robust, at least in terms of its groundwater budgets.
However, long term droughts or steady-state pumping at 15 m/d will cause significant reduction in the
site of the zones of wetness (Fig. 4.121), though again much of the transect zone will remain wet.
For an impact of about the same magnitude, the effect of abstraction is more focused causing dramatic
water level changes in its immediate area, whereas the drought induced water level changes are smaller
but more widespread and so more demanding on the storage reserves.
4.4.6 The impact of different flooding regimes on plant production, nutrient uptake and soil
nutrient dynamics
The results of comparative work done at the French study sites is presented. The results are from the
grassland units, all of which are divided into areas with a relatively low and relatively high elevation, referred
to as swales and ridges.
So/7 parameters
Soil moisture levels at the four units were clearly different throughout the 1991 season (Fig. 4.122). Levels
became similar only at the end of the study period (November 1991) following autumn rains. Soil pF values
of the Loire grassland ridge (LR) were above the wilting point from the end of May to July.
Values for several soil parameters and results from a 2-way ANOVA with the factors of river (Allier versus
Loire) and HGMU (ridge versus swale) are summarised in Table 4.47. The Allier soils arc, in general, more
organic, have lower bulk densities, are wetter and have higher soil nutrient pools (both on a soil dry weight
and volumetric basis). Soil of the relatively low lying swales are higher in organic matter content, lower in
bulk density, have higher moisture levels, and have mostly higher nutrient pools (except for Ρ on a volumetric
basis). The ANOVA for soil pH was not significant at the 0.05 level.
The highly interrelated character of the soil parameters is illustrated in a Principal Components Analysis (Fig
4.123). The first component accounted for 59 percent of total variance alone, and clearly distinguished the
Allier swale (AS, the wettest unit) from the Loire ridge (LR, the driest), with the other units intermediate.
The first component was highly correlated to soil moisture content (+w, -t-wfp and -pF). These soil
parameters increase along the 1st component axis, as indicated by the direction of arrows in Fig 4.123.
However, organic matter content and bulk density are also highly correlated to this component (+LOI, -Pb).
This highly correlated structure of the different soil parameters indicates that the difference in water tables
has resulted in a range of differences in soil variables. At the same time, it makes it difficult to ascribe the
differences between the two rivers or between swales and ridges, as found in the 2-way ANOVAs, only lo
soil moisture.
So/7 nutrient availability
P-availability per soil volume was higher in the Allier grasslands than at the Loire sites, but expressed relative
to the soil bound P-pool there were no differences (Table 4.48). The multiple regressions of these two P-
availability parameters wilh soil parameters indicate the positive influence of soil wetness for the volumetric
P-availability (Table 4.49). This can be interpreted as the increase solubility of Ρ under wetter conditions
(Khalid et al 1977), but the relationship found here was not very strong.
312

-o- AR AS LR LS
Τ
2."~~~^
Τ,-
ι ι
\ τ
τ \ Ο \ ± \ \
\---*0\
>^^_
ι ι
wilting point
\ field capacity " \ | ■
100 150 200 250 300
day number 1991
350 400
Figure 4.122 Soil pF values of the grassland units of the Allier and Loire rivers for 1991. AR Allier
grassland ridge (station3); AS Allier grassland swales (station4); LR Loire grassland ridge (station3); LS
Loire grassland swale (additional next to station3).
O AR □ AS • LR LS
LOI
rgNdw wip
component 1
Figure 4.123 Results of a principal components analysis on the soil parameters listed in Table 4.47, for
the grassland units of the French sites. Soil parameter values arc centred and standardised to correct for
the different units involved. LOI organic matter content; Pb bulk density; W gravimetric soil water
content; wfp water filled porosity; pF soil pF; pH soil pH; soilPvol soil Ρ content per m2; soilPdw soil Ρ
content per kg dry soil; orgNvol soil Ν content per m2; orgNdw soil Ν content per kg dry; C/N ratio of
carbon to organic nitrogen in soil; C/P ratio of carbon to bound phosphorus in soil.
313

Ό -q "Π -Ξ* _ ora
Ζ *
¡.δ fra c .
2 . o O AR □ AS LR LS
Ή . o τ ι -ι Il - , Ν) cT '—' -ι -. g
Q. CD Ol
=3 ■ ~*
õ' ■
S. s r 9
·< *κ »
< c. — c: =*. W 3 O P O
(B
3
"O
o a c o
5 3 —1
ω
5
12
10
' T T "
D
■ Q
wilting' point
•
•
•
/
m%-**''<*-\
^ ;u
o o, :
/ •
/ /
/
/ /
/ /
/
3
PF
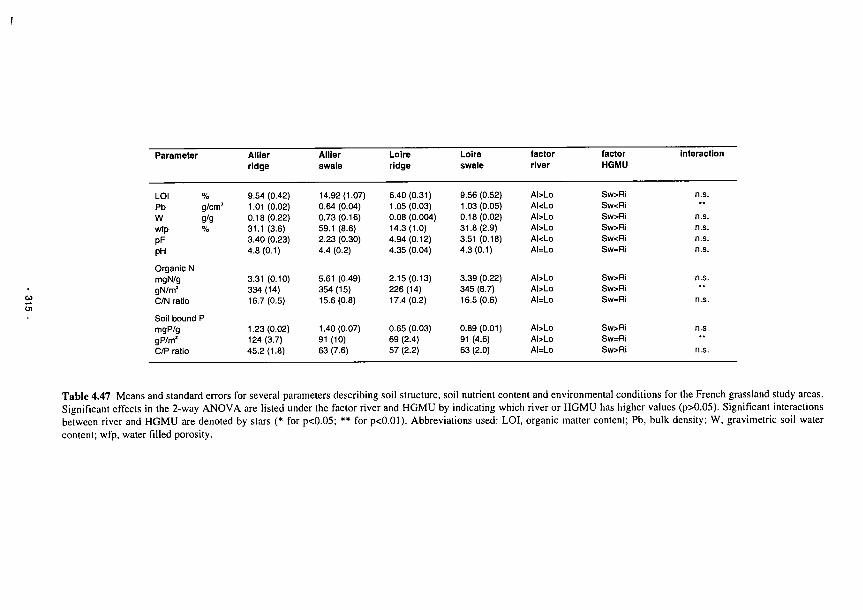
ω οι
Parameter
LOI Pb W wfp PF pH
Organic Ν mgN/g gN/m !
C/N ratio
% g/cms
g/g %
Soil bound Ρ mgP/g gP/m' C/P ratio
Alller ridge
9.54 (0.42) 1.01 (0.02) 0.18(0.22) 31.1 (3.6) 3.40 (0.23) 4.8(0.1)
3.31 (0.10) 334 (14) 16.7(0.5)
1.23(0.02) 124(3.7) 45.2(1.8)
Alller swale
14.92(1.07) 0.64 (0.04) 0.73(0.16) 59.1 (8.6) 2.23 (0.30) 4.4 (0.2)
5.61 (0.49) 354(15) 15.6(0.8)
1.40(0.07) 91 (10) 63 (7.6)
Loire ridge
6.40(0.31) 1.05(0.03) 0.08 (0.004) 14.3(1.0) 4.94 (0.12) 4.35 (0.04)
2.15(0.13) 226 (14) 17.4(0.2)
0.65 (0.03) 69 (2.4) 57 (2.2)
Loire swale
9.56 (0.52) 1.03(0.05) 0.18(0.02) 31.8(2.9) 3.51 (0.18) 4.3(0.1)
3.39 (0.22) 345 (8.7) 16.5 (0.6)
0.89(0.01) 91 (4.6) 63 (2.0)
factor river
AI>Lo A k L o AI>Lo AI>Lo AI<Lo AI=Lo
AI>Lo AI>Lo AI=Lo
AI>Lo AI>Lo AI=Lo
factor HGMU
Sw>Ri Sw<Ri Sw>Ri Sw>Ri Sw<Ri Sw=Ri
Sw>Ri Sw>Ri Sw=Ri
Sw>Ri Sw=Ri Sw>Ri
interaction
n.s.
** n.s. n.s. n.s. n.s.
n.s.
n.s.
n.s.
** n.s.
Table 4.47 Means and standard errors for several parameters describing soil structure, soil nutrient content and environmental conditions for the French grassland study areas. Significant effects in the 2-way ANOVA are listed under the factor river and HGMU by indicating which river or HGMU has higher values (p>0.05). Significant interactions between river and HGMU are denoted by stars (* for p<0.05; ** for p<0.01). Abbreviations used: LOI, organic matter content; Pb, bulk density; W, gravimetric soil water content; wfp, water filled porosity.
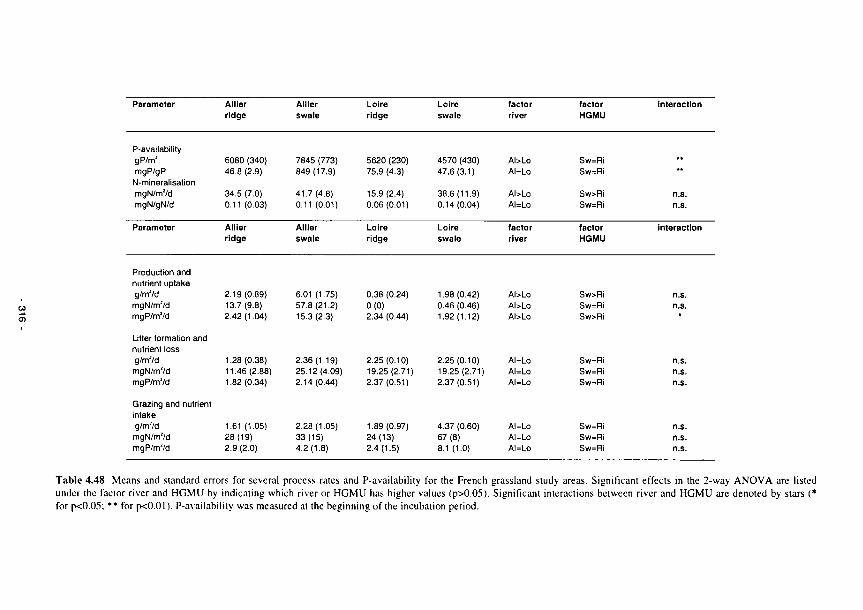
Parameter
P-availability gP/m!
mgP/gP N-mineralisation mgN/m'/d mgN/gN/d
Paramotor
Production and nutrient uptake g/m'/d
mgN/m7d mgP/m'/d
Litter formation and nutrient loss g/m7d
mgN/m'/d mgP/m'/d
Grazing and nutrient intake g/m'7d
mgN/m'/d mgP/m'/d
Allier ridge
6080 (340) 46.8 (2.9)
34.5 (7.0) 0.11 (0.03)
Alller r idge
2.19(0.89) 13.7(9.8) 2.42(1.04)
1.28 (0.38) 11.46(2.88) 1.82 (0.34)
1.61 (1.05) 28(19) 2.9 (2.0)
Allier swale
7845 (773) 849(17.9)
41.7(4.8) 0.11 (0.01)
Allier swale
6.01 (1.75) 57.8(21.2) 15.3(2.3)
2.36(1.19) 25.12 (4.09) 2.14(0.44)
2.28(1.05) 33(15) 4.2(1.8)
Loire ridge
5620 (230) 75.9 (4.3)
15.9(2.4) 0.06(0.01)
Loire ridge
0.38 (0.24) 0(0) 2.34 (0.44)
2.25(0.10) 19.25(2.71) 2.37(0.51)
1.89 (0.97) 24 (13) 2.4(1.5)
Loire swale
4570 (430) 47.6(3.1)
38.6(11.9) 0.14(0.04)
Loire swale
1.98(0.42) 0.46 (0.46) 1.92(1.12)
2.25(0.10) 19.25(2.71) 2.37(0.51)
4.37 (0.60) 67(8) 8.1 (1.0)
factor river
AI>Lo AI=Lo
AI>Lo AI=Lo
factor river
AbLo AI>Lo AI>Lo
AI=Lo AI=Lo AI=Lo
AI=Lo AI=Lo AI=Lo
factor HGMU
Sw=Ri Sw=Ri
Sw>Ri Sw=Ri
factor HGMU
Sw>Ri Sw=Ri Sw>Ri
Sw=Ri Sw=Ri Sw=Ri
Sw=Ri Sw=Ri Sw=Ri
Interaction
·· ··
n.s. n.s.
Interaction
n.s. n.s.
n.s. n.s. n.s
n.s. n.s. n.s.
Table 4.48 Means and standard errors for several process rates and P-availability for the French grassland study areas. Significant effects in the 2-way ANOVA are listed under the factor river and HGMU by indicating which river or HGMU has higher values (p>0.05). Significant interactions between river and HGMU are denoted by stars (* for rx0.05; ** for p<0.0l). P-availability was measured at the beginning of the incubation period.
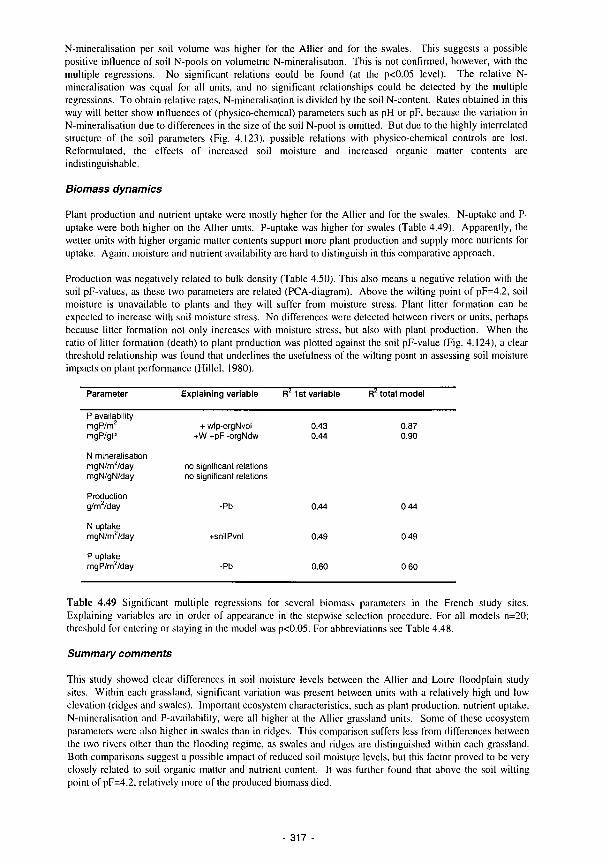
N-mineralisation per soil volume was higher for the Allier and for the swales. This suggests a possible positive influence of soil N-pools on volumetric N-mineralisation. This is not confirmed, however, with the multiple regressions. No significant relations could be found (at the p<0.05 level). The relative N-mineralisation was equal for all units, and no significant relationships could be detected by the multiple regressions. To obtain relative rates, N-mineralisation is divided by the soil N-content. Rates obtained in this way will better show influences of (physico-chemical) parameters such as pH or pF, because the variation in N-mineralisation due to differences in the size of the soil N-pool is omitted. But due to the highly interrelated structure of the soil parameters (Fig. 4.123), possible relations with physico-chemical controls are lost. Reformulated, the effects of increased soil moisture and increased organic matter contents are indistinguishable.
Biomass dynamics
Plant production and nutrient uptake were mostly higher for the Allier and for the swales. N-uptake and P-uptake were both higher on the Allier units. P-uptake was higher for swales (Table 4.49). Apparently, the wetter units with higher organic matter contents support more plant production and supply more nutrients for uptake. Again, moisture and nutrient availability are hard to distinguish in this comparative approach.
Production was negatively related to bulk density (Table 4.50). This also means a negative relation with the soil pF-values, as these two parameters are related (PCA-diagram). Above the wilting point of pF=4.2, soil moisture is unavailable to plants and they will suffer from moisture stress. Plant litter formation can be expected to increase with soil moisture stress. No differences were detected between rivers or units, perhaps because litter formation not only increases with moisture stress, but also wilh plant production. When the ratio of litter formation (death) to plant production was plotted against the soil pF-value (Fig. 4.124), a clear threshold relationship was found that underlines the usefulness of the wilting point in assessing soil moisture impacts on plant performance (Hillel, 1980).
Parameter
Ρ availability mgP/m2
mgP/gP
Ν mineralisation mgN/nVVday mgN/gN/day
Production g/m2/day
Ν uptake mgN/m^/day
Ρ uptake mgP/m^/day
Explaining variable
+ wfp-orgNvol +W +pF -orgNdw
no significant relations no significant relations
-Pb
+soilPvol
-Pb
R* 1st variable
0.43 0.44
0.44
0.49
0.60
R ; total model
0.87 0.90
0.44
0.49
0.60
Table 4.49 Significan! multiple regressions for several biomass parameters in the French study sites. Explaining variables are in order of appearance in the stepwise selection procedure. For all models n=20; threshold for entering or staying in the model was p<0.05. For abbreviations sec Table 4.48.
Summary comments
This study showed clear differences in soil moisture levels between the Allier and Loire floodplain sludy sites. Within each grassland, significant variation was present between units with a relatively high and low elevation (ridges and swales). Important ecosystem characteristics, such as plant production, nutrient uptake, N-mineralisation and P-availability, were all higher al the Allier grassland units. Some of these ecosystem parameters were also higher in swales than in ridges. This comparison suffers less from differences between the two rivers other than the flooding regime, as swales and ridges are distinguished wilhin each grassland. Both comparisons suggest a possible impact of reduced soil moisture levels, but this factor proved to be very closely related to soil organic matter and nutrient content. It was further found that above the soil willing point of pF=4.2, relatively more of the produced biomass died.
317

To further investigate the close relationship between soil moisture and soil nutrient pools, an experiment was conducted in 1993, in which soils from both sites were exposed to different soil moisture conditions, ln this experiment, the influence of different soil moisture levels on plant production and soil nutrient dynamics were examined.
The differences found may be interpreted as follows: sites that Hood more frequently have higher soil moisture contents, but at the same time receive more nutrient carrying sediments that increase soil nutrient pools. This can enhance plant productivity, and will lead to a further increase in soil organic matter content and soil nutrient pools (accumulation function). Cutting off areas from lluvial inputs of nutrients and moisture will, in time, lead to lower production values through creating moisture stress and possibly reducing N-mineralisation. As a result, the soil nutrient sink function through organic inputs will also decrease.
4.4.7 Microcosm simulation results
The microcosms (3.4.2) were designed to control the levels of Eh and pH within wetland soil suspensions. Patrick and Jugusujinda (1992) have shown that the process of reduction is sequential; Mn"+ ions only appear in the soil suspension at the redox level at which NO/ is no longer present. Consequently they were able to determine associated species at discrete levels of Eh by producing controlled reducing conditions in the laboratory.
The main objectives of the microcosm experiments were: • To investigate the rate of reduction in soil suspensions; • To investigate the rate and effects of reoxidisation; • To investigate the levels of inorganic phosphate, ferrous and ferric ions in the soil suspensions at
various levels of Eh; • To determine the equilibria phase between Fe~* and Fe(OH)j in the soil suspension • To compare phase diagrams produced in the controlled cells with those produced in the field.
Samples for investigation in the microcosms were peaty topsoils taken from a groundwatcr-l'ed fen system located near Exeter (Hogan and Maltby 1990b). Within the fen ecosystem two sites were chosen, coded B2 and F2, which represented contrasting vegetation and management. The soils are formed in fen peal with intercalated bands of medium loamy mineral material. B2 is sited in a seasonally grazed wel meadow, the drainage of which had been partially improved by a field margin ditch 10m away. The soil is affected by a fluctuating water table, which remained close to the surface during (he winter months, but declined during the rest of the year to reach a maximum depth of over 60cm in summer. The topsoil is black loamy peat (loss on ignition 41.9%). In contrast, the vegetation at F2 is ungrazed tussock-sedge (Carex paniculala) fen. which is undraincd with a water table remaining close to the surface for most of the year, declining to about 20cm in summer. The topsoil is dark reddish brown loamy peat, of somewhat higher organic matter content than B2 (loss on ignition 48.67c). The surface horizon of B2 is more humified and granular in structure than F2, probably due to the effects of drainage and subsequent oxidation of the peat. It also has a higher mineral content, wilh levels of iron, aluminium and calcium all greater than those in the equivalent horizon of the F2 peat. The B2 site had received fertilizer applications in the past, although none was applied during the field sampling period.
Three regimes were established for the cells:
• Cell 1 was left to reduce naturally over time and monitored over a period of twenty days for changes in pH and Eh.
• Cell 2 was reduced using nitrogen gas delivered via a solenoid 1 hour from scaling
• Cell 3 was also reduced after 1 hour using nitrogen which was bubbled through the cell; after a period of 278.5 hours (11.6 days) the cell was reoxygenatcd wilh an air mixture, being monitored throughout for changes in pH and Eh.
Cells 1-3 contained soils from site B2. Cells 4-6 contained soils from sile F2. and underwent the same procedures as cells 1-3. with the exception that reoxygenation of cell 6 occurred slightly later, at 291 hours (12 days). Samples were withdrawn from the cells at various stages for analysis of available phosphate (PO4-P), ferrous (Fc"*) and ferric iron (Fe *).
318
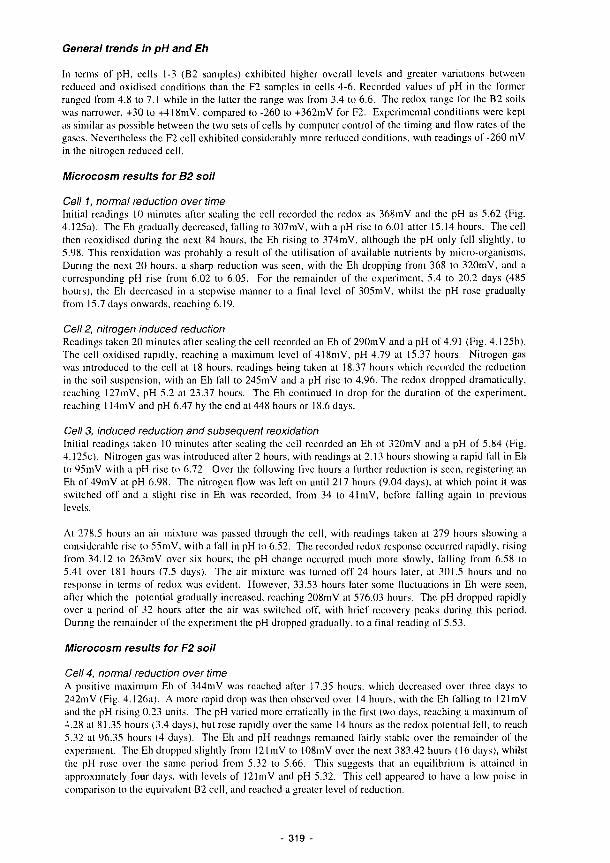
General trends in pH and Eh
In terms of pH, cells 1-3 (B2 samples) exhibited higher overall levels and greater variations between reduced and oxidised conditions than the F2 samples in cells 4-6. Recorded values of pH in the former ranged from 4.8 to 7.1 while in the latter the range was from 3.4 to 6.6. The redox range for the B2 soils was narrower, +30 to +418mV, compared to -260 to +362mV for F2. Experimental conditions were kept as similar as possible between the two sets of cells by computer control of the timing and flow rates of the gases. Nevertheless the F2 cell exhibited considerably more reduced conditions, with readings of -260 mV in the nitrogen reduced cell.
Microcosm results for B2 soil
Cell 1, normal reduction over time Initial readings 10 minutes after scaling the cell recorded the redox as 368mV and the pH as 5.62 (Fig. 4.125a). The Eh gradually decreased, falling to 307mV, with a pH rise to 6.01 after 15.14hours. The cell then reoxidised during the next 84 hours, the Eh rising to 374mV, although the pH only fell slightly, to 5.98. This reoxidation was probably a result of the utilisation of available nutrients by micro-organisms. During the next 20 hours, a sharp reduction was seen, with the Eh dropping from 368 to 320mV, and a corresponding pH rise from 6.02 to 6.05. For the remainder of the experiment, 5.4 to 20.2 days (485 hours), the Eh decreased in a stepwise manner to a final level of 305mV, whilst the pH rose gradually from 15.7 days onwards, reaching 6.19.
Cell 2, nitrogen induced reduction Readings taken 20 minutes after sealing the cell recorded an Eh of 290mV and a pH of 4.91 (Fig. 4.125b). The cell oxidised rapidly, reaching a maximum level of 4l8mV, pH 4.79 at 15.37 hours. Nitrogen gas was introduced to the cell at 18 hours, readings being taken at 18.37 hours which recorded the reduction in the soil suspension, with an Eh fall to 245mV and a pH rise to 4.96. The redox dropped dramatically, reaching 127mV, pH 5.2 at 23.37 hours. The Eh continued to drop for the duration of the experiment, reaching 114mV and pH 6.47 by the end at 448 hours or 18.6 days.
Cell 3, induced reduction and subsequent reoxidation Initial readings taken 10 minutes after sealing the cell recorded an Eh of 320mV and a pH of 5.84 (Fig. 4.125c). Nitrogen gas was introduced after 2 hours, with readings at 2.13 hours showing a rapid fall in Eh to 95mV with a pH rise to 6.72. Over the following five hours a further reduction is seen, registering an Eh of 49mV at pH 6.98. The nitrogen How was left on until 217 hours (9.04 days), at which point it was switched off and a slight rise in Eh was recorded, from 34 to 4lmV, before falling again to previous levels.
Al 278.5 hours an air mixture was passed through the cell, with readings taken at 279 hours showing a considerable rise to 55mV, with a fall in pH to 6.52. The recorded redox response occurred rapidly, rising from 34.12 to 263mV over six hours; the pH change occurred much more slowly, falling from 6.58 to 5.41 over 181 hours (7.5 days). The air mixture was turned off 24 hours later, at 301.5 hours and no response in terms of redox was evident. However, 33.53 hours later some fluctuations in Eh were seen, alter which the potential gradually increased, reaching 208mV at 576.03 hours. The pH dropped rapidly over a period of 32 hours after the air was switched off, with brief recovery peaks during this period. During the remainder of the experiment the pH dropped gradually, to a final reading of 5.53.
Microcosm results for F2 soil
Cell 4, normal reduction over time A positive maximum Eh of 344mV was reached alter 17.35 hours, which decreased over three days to 242mV (Fig. 4.126a). A more rapid drop was then observed over 14 hours, with the Eh falling to 121mV and the pH rising 0.23 units. The pH varied more erratically in the first two days, reaching a maximum of 4.28 at 81.35 hours (3.4 days), but rose rapidly over the same 14 hours as the redox potential fell, to reach 5.32 at 96.35 hours (4 days). The Eh and pH readings remained fairly stable over the remainder of the experiment. The Eh dropped slightly from 121mV to 108mV over the next 383.42 hours (16 days), whilst lhe pH rose over the same period from 5.32 to 5.66. This suggests that an equilibrium is attained in approximately four days, with levels of 121mV and pH 5.32. This cell appeared to have a low poise in comparison to the equivalent B2 cell, and reached a greater level of reduction.
319

Microcosm Results Redox Potential and pH for B2 (Cell 1)
380
360
340
320
300 100 200 300
Time (hours) •'.00
6.5
6.3
6.1
5.9
5.7
5.5 500
. Eh (mV)
pH
Redox Potent:al and pH for B2 (Cell 2)
200 300 Time (hours)
Eh
pH
350
:;oo
250
Redcx Potential and pH for B2 (Cell 3)
'W h
100 200 300 400 Time (hours)
6.2
5.7
5.2 500 600
- Eh
pH
Figure 4.125 Microcosm results for redox potential and pH for B2. a) Cell I ; b) Cell 2; c) Cell 3 - 320
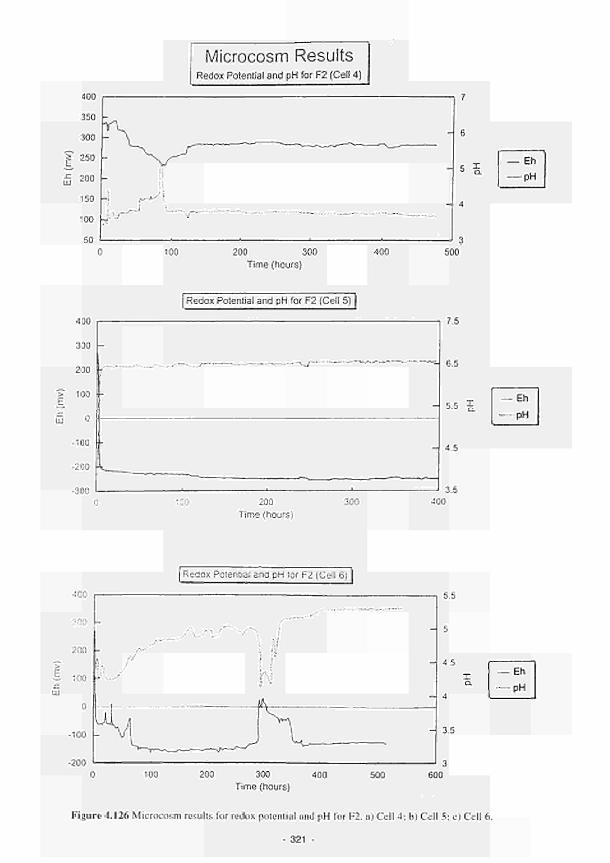
400
350
300
> 250
150
100
50
Microcosm Results Redox Potential and pH for F2 (Cell 4)
„-*/[
100 200 300
Time (hours)
■400 500
— Eh
— pH
00 200
Time (hours)
300
Eh
pH
E
uj
100 200 300 400
Time (hours)
500
Q,
600
— Eh
pH
Figure 4.126 Microcosm results for redox potential and pH for F2. a) Cell 4; b) Cell 5; c) Cell 6.
321
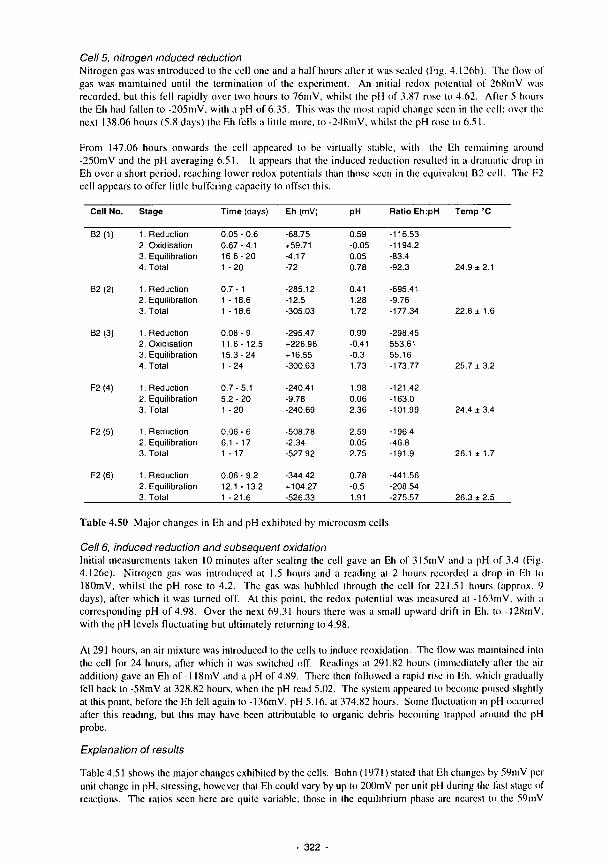
Cell 5, nitrogen induced reduction Nitrogen gas was introduced to the cell one and a half hours after it was sealed (Fig. 4.126h). The How of gas was maintained until the termination of the experiment. An initial redox potential of 268mV was recorded, but this fell rapidly over two hours to 76mV, whilst the pH of 3.87 rose to 4.62. After 5 hours the Eh had fallen to -205mV. with a pH of 6.35. This was the most rapid change seen in the cell; over the next 138.06 hours (5.8 days) the Eh fells a little more, to -248mV, whilst the pH rose to 6.51.
From 147.06 hours onwards the cell appeared to be virtually stable, with the Eh remaining around -250mV and the pH averaging 6.51. It appears that the induced reduction resulted in a dramatic drop in Eh over a short period, reaching lower redox potentials than those seen in the equivalent B2 cell. The F2 cell appears to offer little buffering capacity to offset this.
Cell No.
B2(1)
B2(2)
B2(3)
F2(4)
F2(5)
F2(6)
Stage
1. Reduction 2. Oxidisation 3. Equilibration 4. Total
1. Reduction 2. Equilibration 3. Total
1. Reduction 2. Oxidisation 3. Equilibration 4. Total
1. Reduction 2. Equilibration 3. Total
1. Reduction 2. Equilibration 3. Total
1. Reduction 2. Equilibration 3. Total
Time (days)
0.05 - 0.6 0.67-4.1 16 .6 -20 1 - 2 0
0.7- 1 1 -18.6 1 - 18.6
0.08 - 9 11.6- 12.5 15 .3 -24 1 -24
0 .7-5.1 5.2 - 20 1 -20
0.06 - 6 6.1 - 17 1 - 17
0.06 - 9.2 12.1 -13.2 1 -21.6
Eh (mV)
-68.75 +59.71 -4.17 -72
-285.12 -12.5 -305.03
-295.47 +226.98 + 16.55 -300.63
-240.41 -9.78 -240.69
-508.78 -2.34 -527.92
-344.42 +104.27 -526.33
pH
0.59 -0.05 0.05 0.78
0.41 1.28 1.72
0.99 -0.41 -0.3 1.73
1.98 0.06 2.36
259 0.05 2.75
0.78 -0.5 1.91
Ratio Eh:pH
-116.53 -1194.2 -83.4 -92.3
-695.41 -9.76 -177.34
-298.45 553.61 55.16 -173.77
-121.42 -163.0 -101.99
-196.4 -46.8 -191.9
-441.56 -208.54 -275.57
Temp °C
24.9 ±2 .1
22.8 ± 1.6
25.7 ±3 .2
24.4 ± 3.4
26.1 ± 1.7
26.3 ±2.5
Table 4.50 Major changes in Eh and pH exhibited by microcosm cells
Cell 6, induced reduction and subsequent oxidation Initial measurements taken I0 minutes after sealing the cell gave an Eh of 3l5mV and a pH of 3.4 (Fig. 4.126c). Nitrogen gas was introduced at 1.5 hours and a reading at 2 hours recorded a drop in Eh to I80mV, whilst the pH rose to 4.2. The gas was bubbled through the cell for 221.51 hours (approx. 9 days), after which it was turned off. At this point, the redox potential was measured al -163mV, wilh a corresponding pH of 4.98. Over the next 69.31 hours there was a small upward drift in Eh, to -l28mV, with the pH levels fluctuating but ultimately returning to 4.98.
At 291 hours, an air mixture was introduced to the cells to induce reoxidation. The How was maintained into the cell for 24 hours, after which it was switched off. Readings at 291.82 hours (immediately after the air addition) gave an Eh of-1 l8mV and a pH of 4.89. There then followed a rapid rise in Eh, which gradually fell back to -58mV at 328.82 hours, when the pH read 5.02. The system appeared to become poised slightly at this point, before the Eh fell again to -I36mV, pH 5.16, at 374.82 hours. Some fluctuation in pH occurred after this reading, but this may have been attributable to organic debris becoming trapped around the pH probe.
Explanation of results
Table 4.51 shows the major changes exhibited by the cells. Bohn ( 1971 ) stated thai Eh changes by 59mV per unit change in pH, stressing, however that Eh could vary by up to 200mV per unit pH during (he fasi stage of reactions. The ratios seen here arc quite variable; those in the equilibrium phase arc nearest to (he 59mV
322 -
benchmark value, whilst other values are considerably greater. The induced redox changes are likely to be the fastest reactions, due to an apparent catalytic effect of the nitrogen gas, whilst the equilibrium values should be as near as possible to a steady state and hence be closest to the accepted value.
The reduction rate in the naturally reducing cells occurred more rapidly and to a greater degree in the F2 suspension (cell 4) than the B2 (cell 1). Redox levels in the B2 cell never fell below lOOmV even where reduction was induced. There may be several reasons for this; the amount of nitrogen gas flowing into the cell was small and total saturation of the suspension may not have been achieved, or leakage from the cell may have occurred. If no such leakage is assumed, it is possible that complete reduction needed a longer time than the experimental period allowed, due to the system attaining 'poise' at a particular redox threshold. The higher mineral content, particularly iron and aluminium, of the B2 soil may account for this; Patrick and Mahapatra (1968) stress the importance of iron in the prevention of' systems reaching low redox potentials. The stage at which poise occurs corresponds to iron equilibrium and this iron 'threshold' extended for the duration of the experiment in cell 1. The ratio of Eh to pH was greater in all of the induced reduction cells (cells 2,3,5, & 6) than in the control (naturally reducing) cells. It appears that the addition of nitrogen gas catalyses the reaction, speeding up processes that would normally occur over a longer time period. The initial rapid reduction is the result of oxygen depletion from the system, followed by the utilisation of alternative electron donors. In the B2 soil, it appears that the Fe1+ hydrous oxides provide a buffering capacity, which may have also been promoted by Mn + hydrous oxides to a lesser degree. The rate of' reduction varies, but is generally faster in the reduction-induced cells. This rapid rate of reduction may have allowed several species of electron acceptors to be reduced at the same time, a process which would not necessarily occur under normal reducing conditions.
Chemical results from the microcosm experiments
Cells 3 and 6 were analysed for iron and phosphate from the soil solution. Iron levels were highest in cell 3, containing the B2 soil. The highest levels of phosphate were found at +30mV. Reoxidation of the cell at 282 hours produced a decrease in the phosphate concentration, but in subsequent samples it increased again. This drop in concentration may have been due to precipitation of iron phosphates, but may also have resulted from adsorption of phosphate onto newly precipitated iron hydroxide complexes, formed by the oxidation of ferrous iron. Patrick and Khalid ( 1974) attribute the ability of wetlands to adsorb phosphate to the presence of such a complex.
Cell 6, containing the F2 soil was sampled seven times during the experiment, representing a reduced data set compared to the B2 cell, which was sampled on ten occasions. Despite the intense reduction seen in the F2 cell, there was little change in phosphate levels throughout the experiment. Induced reoxidation of the cells at 294 hours resulted in a slight drop in phosphate levels, possibly indicating precipitation of insoluble compounds. There appears to be little relationship between phosphate concentration and pH.
Correlation coefficients were calculated from the microcosm results (cells 3 and 6) using Spearmans' Rank. The results arc similar for both soil types. A significant negative correlation is seen between pH and Eh and also between Fe + and Fe"+. Both iron forms arc significantly correlated with Eh, the ferric (Fc,+) form having a positive relationship, the ferrous form being negatively correlated. This is as expected, as a higher redox should maintain more oxidised ionic forms, whereas a low redox should result in the reduced ionic forms being present. The strong positive correlation between ferrous forms and pH suggests that they are available at relatively high pH. This again is as expected, given the negative relationship between Eh and pH; at low Eh, pH is higher and low Eh conditions result in the production of ferrous iron. No significant correlations were found between phosphate concentrations and redox, pH or either iron form.
- 323


5. DISCUSSION Wetlands, as with many other ecosystems, are linked in complex ways with their physical environments. The biotic and abiotic components of wetlands control the overall functioning of the ecosystem through interactive physical, biogeochemical and ecological process relationships. The prevailing physical (hydrogeomorphic) conditions are extremely important in developing and maintaining wetland structure together with the performance of specific functions. From landscape scale to microsite interactions, river marginal wetland systems provide avenues for the transfer of water, nutrients, sediments, particulate organic matter and organisms (Gregory et ai, 1991). The salient relationships and interactions among river marginal geomorphic processes and the ecological components are illustrated in Fig. 5.1. Hydrogeomorphic conditions affect many abiotic factors, including soil anaerobicity, nutrient and sediment supply, salinity and temperature. The results of the investigations undertaken by FAEWE scientists into the key ecosystem processes and relationships have generated much new discussion on the influence of environmental controls on wetland functioning.
Nutrient resources
Figure 5.1 Relationships among hydrogeomorphic processes, terrestrial plant succession, and aquatic ecosystems in riparian zones. Directions of arrows indicate predominant influences of geomorphic and biological components (rectangles) and physical and ecological processes (circles). (Adapted from Mitsch and Gosselink, 1993: from earlier work by Gregory et al., 1991).
5.1 Physical process studies
The physical process studies have highlighted the importance of understanding the prevailing hydrogeomorphic controls on wetland ecosystem functions. Observed spatial and temporal variations in How regimes, flooding conditions, solute transport and erosion and sedimentation rates at the sites have provided insights into the maintenance of functions and have emphasised the advantages of defining functional hydrogeomorphic units rather than trying to address the complete wetland ecosystem in making specific assessments. The fragility of some systems, especially in the semi-arid environment where desiccation and salinisation processes prevail, has been verified, and the pivotal role that hydrological pathways and How regimes play in biogeochemical cycling and ecosystem maintenance has been underlined.
325
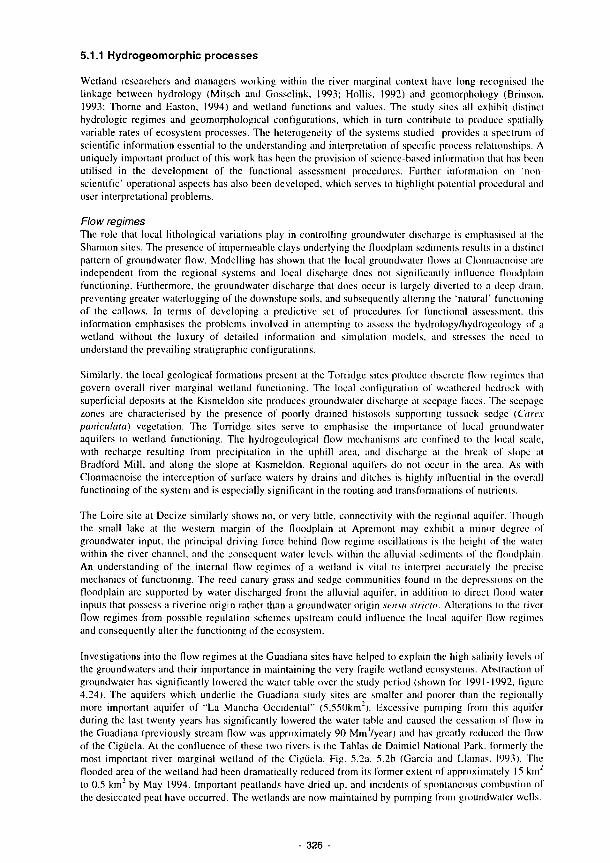
5.1.1 Hydrogeomorphic processes
Wetland researchers and managers working within the river marginal context have long recognised the linkage between hydrology (Mitsch and Gosselink, 1993; Hollis, 1992) and geomorphology (Brinson, 1993; Thome and Easton, 1994) and wetland functions and values. The study sites all exhibit distinct hydrologie regimes and geomorphological configurations, which in turn contribute to produce spatially variable rates of ecosystem processes. The heterogeneity of the systems studied provides a spectrum of scientific information essential to the understanding and interpretation of specific process relationships. A uniquely important product of this work has been the provision of science-based information thai has been utilised in the development of the functional assessment procedures. Further information on 'non-scientific' operational aspects has also been developed, which serves to highlight potential procedural and user interpretational problems.
Flow regimes The role that local lithological variations play in controlling groundwater discharge is emphasised al the Shannon sites. The presence of impermeable clays underlying the floodplain sediments results in a distinct pattern of groundwater flow. Modelling has shown that the local groundwater (lows at Clonmacnoise arc independent from the regional systems and local discharge does not significantly influence floodplain functioning. Furthermore, the groundwater discharge that docs occur is largely diverted to a deep drain, preventing greater waterlogging of the downslope soils, and subsequently altering the 'natural' functioning of the callows. In terms of developing a predictive set of procedures for functional assessment this information emphasises the problems involved in attempting to assess the hydrology/hydrogeology of a wetland without the luxury of detailed information and simulation models, and stresses the need to understand the prevailing stratigraphie configurations.
Similarly, the local geological formations present at the Torridge sites produce discrete How regimes that govern overall river marginal wetland functioning. The local configuration of weathered bedrock with superficial deposits at the Kismeldon site produces groundwater discharge at seepage faces. The seepage zones are characterised by the presence of poorly drained histosols supporting lussock sedge (Carex paniculala) vegetation. The Torridge sites serve to emphasise the importance of local groundwater aquifers to wetland functioning. The hydrogeological flow mechanisms arc confined to the local scale, with recharge resulting from precipitation in the uphill area, and discharge at (he break of slope al Bradford Mill, and along (he slope at Kismeldon. Regional aquifers do not occur in the area. As wilh Clonmacnoise the interception of surface waters by drains and ditches is highly inllucntial in the overall functioning of the system and is especially significant in the routing and transformations of nutrients.
The Loire site at Decize similarly shows no, or very little, connectivity with the regional aquifer. Though the small lake at the western margin of the floodplain at Apremont may exhibit a minor degree of groundwater input, the principal driving force behind How regime oscillations is the height of the waler within the river channel, and the consequent water levels within the alluvial sediments of (he Hoodplain. An understanding of the internal How regimes of a wetland is vital to interpret accurately the precise mechanics of' functioning. The reed canary grass and sedge communities found in (he depressions on lhe Hoodplain are supported by water discharged from the alluvial aquifer, in addition to direct flood waler inpuls thai possess a riverine origin rather than a groundwater origin sensu stricto. Alterations lo the river flow regimes from possible regulation schemes upstream could influence the local aquifer flow regimes and consequently alter the functioning of the ecosystem.
Investigations into the flow regimes at the Guadiana sites have helped to explain the high salinity levels of lhe groundwaters and their importance in maintaining the very fragile weiland ecosystems. Abstraction of groundwater has significantly lowered the water tabic over the sludy period (shown for 1991-1992. figure 4.24). The aquifers which underlie the Guadiana sludy sites arc smaller and poorer than the regionally more important aquifer of "La Mancha Occidental" (5,550km2). Excessive pumping from this aquifer during the last twenty years has significantly lowered the water table and caused the cessation of How in the Guadiana (previously stream How was approximately 90 Mm/year) and has greatly reduced the How of the Ciguela. At the confluence of these two rivers is the Tablas dc Daimiel National Park, formerly the most important river marginal wetland of the Cigiicla. Fig. 5.2a. 5.2b (Garcia and Llamas. 1993). The flooded area of the wetland had been dramatically reduced from its former extent of approximately 15 km lo 0.5 km" by May 1994. Important pcatlands have dried up. and incidents of spontaneous combustion of the desiccated peat have occurred. The wetlands arc now maintained by pumping from groundwater wells.
- 326
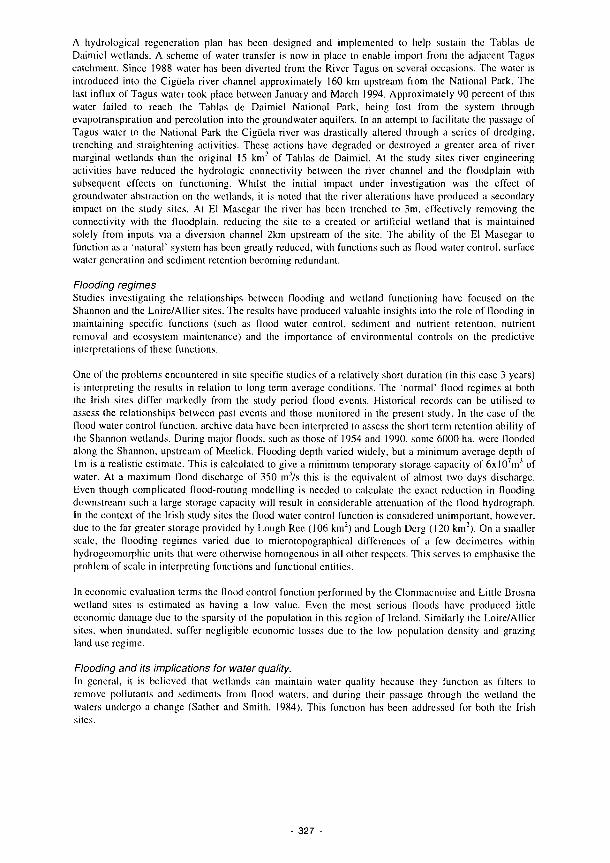
A hydrological regeneration plan has been designed and implemented to help sustain the Tablas de Daimiel wetlands. A scheme of water transfer is now in place to enable import from the adjacent Tagus catchment. Since 1988 water has been diverted from the River Tagus on several occasions. The water is introduced into the Ciguela river channel approximately 160 km upstream from the National Park. The last influx of Tagus water took place between January and March 1994. Approximately 90 percent of this water failed to reach the Tablas de Daimiel National Park, being lost from the system through évapotranspiration and percolation into the groundwater aquifers. In an attempt to facilitate the passage of Tagus water to the National Park the Ciguela river was drastically altered through a series of dredging, trenching and straightening activities. These actions have degraded or destroyed a greater area of river marginal wetlands than the original 15 km2 of Tablas de Daimiel. At the study sites river engineering activities have reduced the hydrologie connectivity between the river channel and the Hoodplain with subsequent effects on functioning. Whilst the initial impact under investigation was the effect of groundwater abstraction on the wetlands, it is noted that the river alterations have produced a secondary impact on the study sites. At El Masegar the river has been trenched to 3m, effectively removing the connectivity with the floodplain, reducing the site to a created or artificial wetland that is maintained solely from inputs via a diversion channel 2km upstream of the site. The ability of the El Masegar to function as a 'natural' system has been greatly reduced, with functions such as flood water control, surface water generation and sediment retention becoming redundant.
Flooding regimes Studies investigating the relationships between Hooding and wetland functioning have focused on the Shannon and the Loirc/Allier sites. The results have produced valuable insights into the role of nooding in maintaining specific functions (such as flood water control, sediment and nutrient retention, nutrient removal and ecosystem maintenance) and the importance of environmental controls on the predictive interpretations of these functions.
One of the problems encountered in site specific studies of a relatively short duration (in this case 3 years) is interpreting the results in relation to long term average conditions. The 'normal' flood regimes at both the Irish sites differ markedly from the study period flood events. Historical records can be utilised to assess the relationships between past events and those monitored in the present study. In the case of the flood water control function, archive data have been interpreted to assess the short term retention ability of the Shannon wetlands. During major Hoods, such as those of 1954 and 1990. some 6000 ha. were flooded along the Shannon, upstream of Mcelick. Flooding depth varied widely, but a minimum average depth of lm is a realistic estimate. This is calculated to give a minimum temporary storage capacity of 6x10⁷m' of water. At a maximum flood discharge of 350 m/s this is the equivalent of almost two days discharge. Even though complicated flood-routing modelling is needed to calculate the exact reduction in flooding downstream such a large storage capacity will result in considerable attenuation of' the flood hydrograph. In the context of the Irish sludy sites the Hood water control function is considered unimportant, however, due to the far greater storage provided by Lough Ree (106 km2) and Lough Derg (120 km2). On a smaller scale, the Hooding regimes varied due to microtopographical differences of a few decimetres within hydrogeomorphic units that were otherwise homogenous in all other respects. This serves to emphasise the problem of scale in interpreting functions and functional entities.
In economic evaluation terms the Hood control function performed by the Clonmacnoise and Little Brosna wetland sites is estimated as having a low value. Even the most serious floods have produced little economic damage due to the sparsity of the population in this region of Ireland. Similarly lhe Loirc/Allicr sites, when inundated, suffer negligible economic losses due to the low population density and grazing land use regime.
Flooding and its implications for water quality. In general, it is believed that wetlands can maintain water quality because they function as filters to remove pollutants and sediments from flood waters, and during their passage through the wetland the waters undergo a change (Sather and Smith, 1984). This function has been addressed for both the Irish sites.
327

PRECIPITATION ~ 6 - 8
LOCAL CREEKS RUNOFF
-~8 -12
EVAPORATIOI 9-15
GROUNDWATER DISCHARGE TO TABLAS AND
GUADIANA RIVER 3 0 - 4 0
GIGUELA RIVER RUNOFF -— 90
GUADIANA RIVER RUNOFF — 240
ANNUAL WATER BALANCE MO'ni ' l
OUTPUT
AZUER RIVER RUNOFF ~ 20
PRECIPITATION 6 -SURFACE RUNOFF 210 GROUNDWATER 30-40
TOTAL :·>:,·
EVAPORATION SURFACE RUNOFF
IRRIGATION DIVERSION
TOTAL
9-15 240
VILLARRUBIA WASTEWATER LAND APPLICATION
PRECIPITATION 6 - 8
MOLEMOCHO DAM
INNER DAM
EVAPORATION LOCAL CREEKS 7-<4
RUNOFF 8-12
TABLAS DE DAIMIEL NATIONAL PARK
GIGUELA RIVER RUNOFF + ATS 2 0 - 7 0
PUENTE NAVARRO DAM
GUADIANA RIVER SURFACE RUNOFF
0 - 1 0 ( Polluted woler )
ANNUAL WATER BALANCE (10*-
INPUT OUTPUT AZUER RIVER
RUNOFF -— 0
(except in very humid periods]
PRECIPITATION 6 - 8 SURFACE RUNOFF 30 - Θ0
GROUNDWATER 0
EVAPORATION 7-14 INFILTRATION 3 0 - 7 0
SURFACE RUNOFF 0 -10
TOTAL 40 - 90 TOTAL 4 0 - 90
Figure 5.2 Hydrological functioning of the Las Tablas dc Daimiel National Park; (a) undisturbed, (b) disturbed (after Garcia and Llamas, 1993).
328
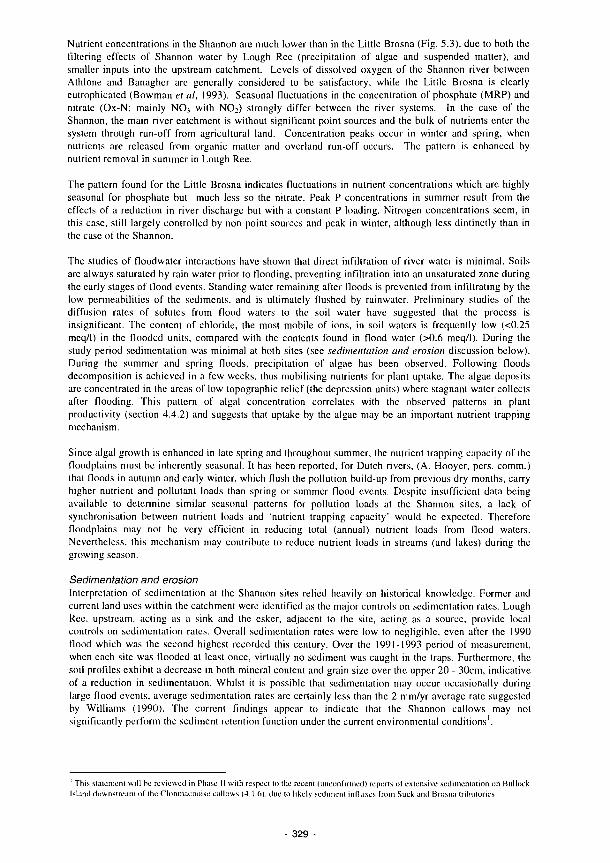
Nuíriem concentrations in the Shannon are much lower than in the Little Brosna (Fig. 5.3), due to both the
filtering effects of Shannon water by Lough Ree (precipitation of algae and suspended matter), and
smaller inputs into the upstream catchment. Levels of dissolved oxygen of the Shannon river between
Athlone and Banagher are generally considered to be satisfactory, while the Little Brosna is clearly
eutrophicated (Bowman et al, 1993). Seasonal fluctuations in the concentration of phosphate (MRP) and
nitrate (Ox-N; mainly NO3 with NOi) strongly differ between the river systems. In the case of the
Shannon, the main river catchment is without significant point sources and the bulk of nutrients enter the
system through run-off from agricultural land. Concentration peaks occur in winter and spring, when
nutrients are released from organic matter and overland run-off occurs. The pattern is enhanced by
nutrient removal in summer in Lough Ree.
The pattern found for the Little Brosna indicates fluctuations in nutrienl concentrations which are highly
seasonal for phosphate but much less so the nitrate. Peak Ρ concentrations in summer result from the
effects of a reduction in river discharge but with a constant Ρ loading. Nitrogen concentrations seem, in
this case, still largely controlled by non-point sources and peak in winter, although less dinlinctly than in
the case of the Shannon.
The studies of floodwater interactions have shown that direct infiltration of river water is minimal. Soils
are always saturated by rain water prior to flooding, preventing infiltration into an unsaturated zone during
the early stages of flood events. Standing water remaining after floods is prevented from infiltrating by the
low permeabilities of the sediments, and is ultimately flushed by rainwater. Preliminary studies of the
diffusion rates of solutes from flood waters to the soil water have suggested that the process is
insignificant. The content of chloride, the most mobile of ions, in soil waters is frequently low (<0.25
meq/1) in the flooded units, compared with the contents found in Hood water (>0.6 meq/l). During the
study period sedimentation was minimal at both sites (see sedimentation and erosion discussion below).
During the summer and spring floods, precipitation of algae has been observed. Following noods
decomposition is achieved in a few weeks, thus mobilising nutrients for plant uptake. The algae deposits
are concentrated in the areas of low topographic relief (the depression units) where stagnant waler collects
after Hooding. This pattern of algal concentration correlates with the observed patterns in plant
productivity (section 4.4.2) and suggests that uptake by the algae may be an important nutrient trapping
mechanism.
Since algal growth is enhanced in late spring and throughout summer, the nutrient trapping capacity of lhe
floodplains must be inherently seasonal. It has been reported, for Dutch rivers, (A. Hooyer, pers. cornili.)
thai Hoods in autumn and early winter, which Hush the pollution build-up from previous dry months, carry
higher nutrient and pollutant loads than spring or summer flood events. Despite insufficient data being
available to determine similar seasonal patterns for pollution loads at the Shannon sites, a lack of
synchronisation between nutrient loads and 'nutrient trapping capacity' would be expected. Therefore
floodplains may not be very efficient in reducing total (annual) nutrient loads from Hood waters.
Nevertheless, this mechanism may contribute to reduce nutrient loads in streams (and lakes) during the
growing season.
Sedimentation and erosion
Interpretation of sedimentation at the Shannon sites relied heavily on historical knowledge. Former and
current land uses within the catchment were identified as the major controls on sedimentation rates. Lough
Ree. upstream, acting as a sink and the esker, adjacent to the site, acting as a source, provide local
controls on sedimentation rates. Overall sedimentation rates were low to negligible, even after the 1990
flood which was the second highest recorded this century. Over the 1991-1993 period of measurement,
when each site was flooded at least once, virtually no sediment was caught in the traps. Furthermore, the
soil profiles exhibit a decrease in both mineral content and grain size over the upper 20 - 30cm, indicative
of a reduction in sedimentation. Whilst it is possible that sedimentation may occur occasionally during
large flood events, average sedimentation rates arc certainly less than the 2 mm/yr average rate suggested
by Williams (1990). The current findings appear to indicate that the Shannon callows may not
significantly perform the sediment retention function under the current environmental conditions'.
This statement will he reviewed in Phase II with respect to lhe recent (unconfirmed) reports of extensive sedimentation on Bullock
Island downstream of the Clonmacnoise callows (4.1.6), due to likely sediment influxes from Suck and Brosna trihulories.
- 329

I I I I I I I I I Ι I n
1 2 3 4 5 6 7 8 9 10 1112 1 2 3 4 5 6 7 8 9 10 ¡0 1112°
(a)Shannon (b) Little Brosna
800
600
K 400
y·1*
W"*· in ■ ■'V*^
1.5
89 90 91 92 9:
'P. 0.5
3°
800
m È 400
200
Swl··»
0.5
89 90 91 92 93
(c) Shannon (d) Little Brosna
(e) Shannon (f) Little Brosna
0.3
0.25
f 0.2 E Ê 0.15 Ζ
O 0.1
0.05
% \kí »Ά φ 7 88 89 90 91 92 9
5
4 —
3 f 2 Í
1
3o
OxN
MRP
0.3
0.25
f 0.2
ε S. 0.15 ζ
O 0.1
0.05
°3
f
η
Γ Åh Ufi
η'
¡
Πι I U
7 88 89 90 91 92 9
4
3 f
2k
1
ί
Οχ-Ν
MRP
Figure 5.3 Water chemistry of the Shannon and Little Brosna rivers, (a) and (b) Average nutrienl concentrations in river water 1987-1992. Note seasonal differences in total loads between sites, (c) and (d) Eleclroconductivity and chloride concentration for 1987- 1992. Data from EPA used until August 1991. (e) and (f) Ox-N and molybdate reactive phosphate (MRP) (3-month moving averages). All data from EPA.
330 -

The loss of this function can be attributed to reduction in erosion rates in the sediment source areas, where grazing by cattle and sheep has decreased over the last decades, and is often replaced by afforestation projects. The commencement of increases in floodplain sedimentation in prehistoric times is often attributed to the start of large-scale deforestation and grazing. Sediment carried by the Little Brosna during recent floods is largely derived from erosion upstream along the upper reaches of the Camcor river which is currently canalised. The eroded sediments now consist largely of gravel and sand, with only a minor silt fraction, but formerly the clayey tills in the Slieve Bloom mountains have formed an important sediment source.
In-channel flow velocities have been greatly reduced in the Shannon due to the installation of weirs and the deepening of the channel. This has produced an associated increase in in-stream sedimentation, as indicated by the very high organic material content (often >95 percent) in the upper river bed sediment. The organic detritus is thought to originate from intensive peat exploitation in the catchment which commenced in the 1950s. No, or very little, deposition of the organic detritus was observed on the floodplain during the study period, even in sites directly downstream of bog water inlets. The mechanics behind this absence of sedimentation are provided by How rates that are often low enough to allow the material to be deposited in the channel, whilst the opposite occurs during flooding when velocities remain loo high. Thus it is clear from the Irish studies that the sediment retention function is important under certain environmental conditions, but is not a characteristic function of all floodplains at all times.
Sedimentation rales were much higher at the French study sites (4.26-45.15 mm/yr) than al the Shannon, where the Apremont stations recorded higher rates than those at Decize due to greater river discharge. Depositional gradients are visible at Apremont with sedimentation characteristically decreasing with distance from the channel and also increasing with distance downslope within the depressions. At Decize sedimentation often provides material that can subsequently be eroded and redeposited downslope. Deposition rates are controlled by the flooding regime of the river, the waler-bornc sediment load, frictional effects of riparian vegetation and the exposure of bare soil surfaces due to poaching by cattle. Thus the depressions and the riparian woodland perform lhe sediment retention function at a greater rate than the rest of the floodplain. The importance of the function, when set in the context of the whole river system, is difficult to assess. The problem of spatial comparison of function is highlighted by the relative rates of sediment retention at Apremont and Decize. The higher rates at Apremont could be simply attributed to the greater river discharge, and subsequent larger sediment load potential, or they could be the result of reductions in the sediment load and flooding frequency of the Loire due to river regulation. The development of a clearer understanding of the dynamics behind the function will be achieved with the continued research in Phase II.
Erosion occurs only on the steepest slopes of the riparian elevations and on the major break of slope between the upper and lower floodplain units. Eroded material is generally redeposited downslope. No erosion was recorded within the depressions. The processes operating on the Loire/Allicr Hoodplain are characteristic of high order, low gradient river systems where sedimentation rates are much higher than erosion.
Measurements taken at the Spanish sites indicated that overall sedimentation was greater than erosion, wilh depositional rates generally higher at El Masegar than Molino dcl Abogado. Active alluvial processes are precluded due to the anthropogenic alterations to the river channel. Mass movement of sediments occurred on the slopes of the artificial dykes, providing a source for downslope sedimentation. The studies clearly indicated that the sediment retention function was not significant at the Spanish sites. Evaporitc crusls produced through water movement, salt precipitation and climatic interactions are often eroded and redeposited, producing resultant effects on water salinity and leading to ecological stresses.
Desiccation and salinisation The unique problems associated with the semi-arid environment of the Spanish study sites, where évapotranspiration predominantly exceeds precipitation, arc typified by the processes of desiccation and salinisation. These physical processes, unlike other processes such as flooding and sedimentation, have indirect, rather than direct, consequences on ecosystem functioning, through alterations to the soil system. Precipitation of salts reduces soil pore storage capacity, decreasing infiltration rates and reducing the efficiency of the short (erm flood storage function. Conversely, if the soil is greatly desiccated, resulting in cracks and fissures, the soil sloragc capacity may be increased temporarily.
331
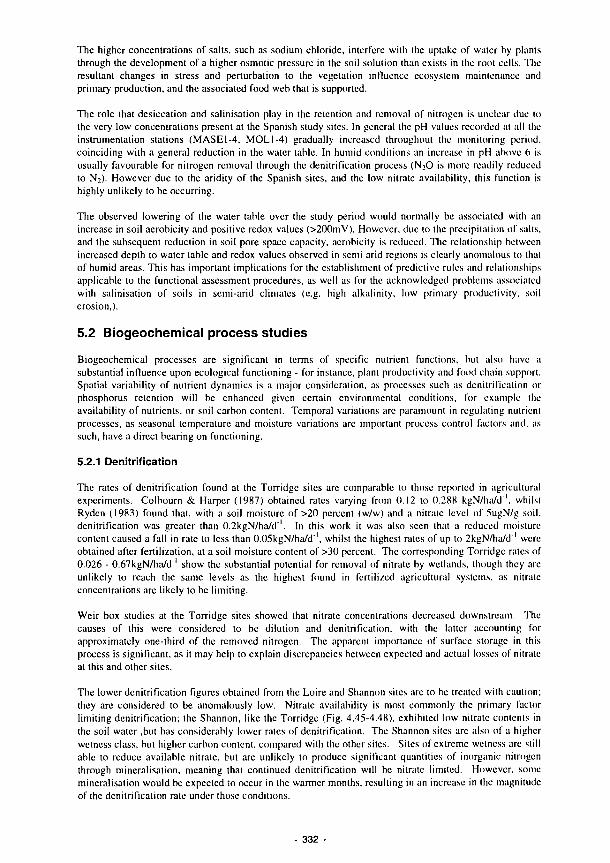
The higher concentrations of salts, such as sodium chloride, interfere with the uptake of water by plants through the development of a higher osmotic pressure in the soil solution than exists in the root cells. The resultant changes in stress and perturbation to the vegetation influence ecosystem maintenance and primary production, and the associated food web that is supported.
The role that desiccation and salinisation play in the retention and removal of nitrogen is unclear due lo (he very low concentrations present at the Spanish sludy sites. In general the pH values recorded at all the instrumentation stations (MASE 1-4, MOL I-4) gradually increased throughout the monitoring period, coinciding with a general reduction in the water table. In humid conditions an increase in pH above 6 is usually favourable for nitrogen removal through the denitrification process (N;0 is more readily reduced to N>). However due to the aridity of the Spanish sites, and the low nitrate availability, this function is highly unlikely to be occurring.
The observed lowering of the water table over the study period would normally be associated with an increase in soil aerobicity and positive redox values (>200mV). However, due to the precipitation of salts, and the subsequent reduction in soil pore space capacity, aerobicity is reduced. The relationship between increased depth to water table and redox values observed in semi arid regions is clearly anomalous to that of humid areas. This has important implications for the establishment of predictive rules and relationships applicable to the functional assessment procedures, as well as for the acknowledged problems associated with salinisation of soils in semi-arid climates (e.g. high alkalinity, low primary productivily, soil erosion,).
5.2 Biogeochemical process studies
Biogeochemical processes are significant in terms of specific nutrient functions, but also have a substantial influence upon ecological functioning - for instance, plant productivity and food chain support. Spatial variability of nutrient dynamics is a major consideration, as processes such as denitrification or phosphorus retention will be enhanced given certain environmental conditions, for example the availability of nutrients, or soil carbon content. Temporal variations are paramount in regulating nutrienl processes, as seasonal temperature and moisture variations are important process control factors and, as such, have a direct bearing on functioning.
5.2.1 Denitrification
The rates of denitrification found at the Torridge sites are comparable to those reported in agricultural experiments. Colbourn & Harper (1987) obtained rates varying from 0.I2 to 0.288 kgN/ha/d ', whilst Ryden (1983) found that, with a soil moisture of >20 percent (w/w) and a nilralc level of 5ugN/g soil, denitrification was greater than 0.2kgN/ha/d'. In this work it was also seen that a reduced moisture content caused a fall in rate to less than 0.05kgN/ha/d', whilst the highest rales of up to 2kgN/ha/d'' were obtained after fertilization, at a soil moisture content of >30 percent. The corresponding Torridge rates of 0.026 - 0.67kgN/ha/d"' show the substantial potential for removal of nitrate by wetlands, though they are unlikely to reach lhe same levels as the highest found in fertilized agricultural systems, as nitrate concentrations arc likely to be limiting.
Weir box studies at the Torridge sites showed that nitrate concentrations decreased downstream. The causes of this were considered to be dilution and denitrification, with the latter accounting for approximately one-third of the removed nitrogen. The apparent importance of surface storage in this process is significant, as it may help to explain discrepancies between expected and actual losses of nitrate at this and other sites.
The lower denitrification figures obtained from the Loire and Shannon sites arc to be treated wilh caution; they are considered to be anomalously low. Nitrate availability is most commonly the primary factor limiting denitrification; the Shannon, like the Torridge (Fig. 4.45-4.48), exhibited low nitrate contents in the soil water ,but has considerably lower rates of denitrification. The Shannon siles arc also of a higher wetness class, but higher carbon content, compared wilh the other sites. Sites of extreme wetness arc siili able lo reduce available nitrate, but are unlikely to produce significant quantities of inorganic nitrogen through mineralisation, meaning that continued denitrification will be nitrate limited. However, some mineralisation would be expected to occur in the warmer months, resulting in an increase in the magnitude of the denitrification rate under those conditions.
332
Results from the Loire sites are more erratic, with denitrification responses not entirely as would be expected. The sites are low in carbon, but have a higher pH than the Torridge sites and, in summer, contain considerably more soil nitrate. The summer rates are, in a few cases, an order of magnitude larger than winter, but in other cases little difference, or even a decrease in rate is observed. As nitrate is the primary rate-limiting factor, it would be expected that denitrification rates in late spring and summer should be at least similar, if not greater than those recorded at the Torridge sites, given the generally higher soil nitrate levels at these times. Dryness at certain stations - e.g. APRE 3, DECZ 3 - may account for some of the difference but this could be expected to be overridden in part by the higher nitrate content. Further testing of the denitrification assay at the Loire and Shannon sites will consolidate or refute the possibility that the results obtained thus far are anomalous.
Relevance to functioning
Denitrification is an important process in wetland ecosystems, providing a mechanism for improving water quality by removal of excess nitrate. The potential for denitrification in wetland ecosystems can be significant. Spatial considerations are important also; the ditch system experiment shows that a small area of the wetland can be responsible for much of the denitrification.
The results obtained from the Torridge suggest that surface storage is of considerable relevance in the determination or control of denitrification rates. Whilst the rate of denitrification appears to be reduced by surface storage, movement of nitrate downslope to the watercourse is also impeded, maintaining water quality. This suggests that hydrological routing is an important control for denitrification rates; a lesser capacity for surface storage or low input to the wetland from the nutrient source - i.e. the ditch in the case of the Torridge - will affect the rate or magnitude of nitrate reduction. In the overland flow system study the importance of hydrological routing and the presence of 'flush zones' highlighted the importance of particular areas at removing nitrate. These 'zones of enhanced denitrification' may represent a very small proportion of the overall catchment.
A quantitative, predictive relationship has not yet been established for denitrification rates. However, the regression and correlation results seem to reinforce the accepted theory that denitrification is controlled by carbon content, soil moisture and pH, after the primary factor of nitrate availability, which was not quantitatively evaluated. Regressions using an aggregate value for rainfall suggest that antecedent moisture conditions are important and will be further investigated. Soil carbon contents are seen to be of importance in calculations that exclude the organic Shannon sites; this may be of significance in functional assessment, as very wet or waterlogged organic soils may return low denitrification values despite high carbon status, due to limited quantities of nitrate.
Complex interactions between management factors at various scales, ranging from on-site fertilizer regime to catchment land use and detailed soil characteristics, determine the rate and capacity for wetlands to function as nitrogen sinks by means of denitrification. These relationships are summarised as a schematic flow diagram in Fig. 5.4.
5.2.2 Phosphorus dynamics
Simple statistical models have been generated and used as exploratory tools to determine important processes involved in phosphorus dynamics and to investigate the important controlling variables. The results of these models have been utilised in the development of the functional assessment procedures.
Phosphorus release
A discriminant analysis model was developed to improve understanding of the processes responsible for phosphorus release. The processes examined included mineralisation of organic material, reduction of ferric and manganese phosphates, and the influence of pH environment on the stability of the latter. The model identified the key variables that control these processes during a reduction period, and provides information on soil conditions that promote these processes. The discriminant models may be used as a predictive tool, though certain limitations have been identified:
333
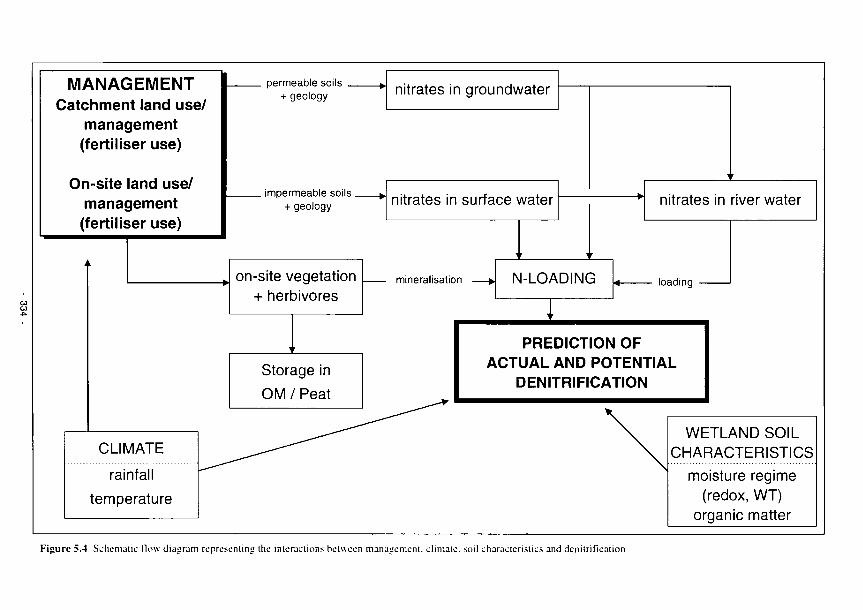
MANAGEMENT Catchment land use/
management (fertiliser use)
On-site land use/ management (fertiliser use)
CLIMATE rainfall
temperature
permeable soils ► + geology
on-site vegetation + herbivores
Storage in OM / Peat
nitrates in groundwater
, impermeable soils ». + geology nitrates in surface water
mineralisation
nitrates in river water
N-LOADING loading
PREDICTION OF ACTUAL AND POTENTIAL
DENITRIFICATION
WETLAND SOIL CHARACTERISTICS
moisture regime (redox, WT)
organic matter
Figure 5.4 Schematic flow diagram representing (he interactions between management, climate, soil characteristics and denitrification
i) the model requires data on a large number of variables;
ii) the model requires a detailed data base and appears to be very sensitive with respect to these variables
and must have accurate specific data. The model cannot run on generalisations, precluding its use in a
rapid assessment scheme.
Phosphorus adsorption isotherms
The capacity for short-term Ρ adsorption was investigated by determining Ρ isotherms for selected soils at
the study sites. Results have enabled some important relationships to be identified, which relate Ρ
adsorption capacity of soils to readily observable or measurable characteristics, thereby offering the
opportunity to identify predictors for the dynamics of Ρ adsorption.
The main findings in relation to soil properties were:
So/7 texture
Thresholds have been identified above or below which Ρ adsorption was found to increase considerably
viz.: < 30 percent sand, > 50 percent silt, > 7 percent clay. The importance of the relative proportions of
silt and clay above these levels is difficult to evaluate in isolation since relationships are complicated by
interactions with one or more of the following properties:
Organic carbon Ρ adsorption capacity tends to be greater with increasing levels of easily oxidisable organic carbon, up to
a maximum of about 30 percent, above which there is a substantial decline. These soils of higher organic
matter content may be comprised largely of poorly humified organic material which has low Ρ adsorption
capacity.
Iron
Amorphous forms of iron have a strong affinity for the adsorption of phosphorus. Isotherms indicate
threshold levels of 0.7 percent pyrophosphate- and 1 percent oxalate-extractable forms, above which high
levels of Ρ adsorption occur.
Interactions between variables In relation to major soil horizons the most important variables predicting Ρ adsorption capacity were
found to be pyrophosphate-extractable iron and organic carbon in topsoils (A horizons), total aluminium
and clay content in subsoils (B horizons) and silt content in substrates (C horizons). In soils of high
organic matter content, pyrophosphate-extractable iron was found to be the most important predictor,
while for low organic matter soils aluminium and clay were of major importance.
The variable importance of specific predictors between contrasting types of soils is exemplified in
comparison of the Loire and Shannon systems. Variations in Ρ adsorption capacity in mineral soils of the
Loire can be related to textural differences, while on the Shannon variations in organic carbon content are
more critical. This supports the need to consider broad regional differences between RMW ecosystem
types within the design of functional assessment procedures.
5.2.3 Decomposition
The cotton strip decomposition assay at the Shannon, Torridge and Loire sites embraced the climatic
gradient from euoceanic to continental. The inclusion of the results from the semi-arid area of the
Guadiana sites increases the climatic gradient to a more extreme continental level, with the dryness and
salinity of the study areas producing different decomposition patterns from temperate, non-alkaline soils.
Patterns found in recent studies of decomposition using the cotton strip assay suggest that moisture and
temperature are the primary environmental controls upon decomposition (Bunnell et al. 1977). Ineson et
al. (1988) have extended this relationship, finding a strong correlation with potential évapotranspiration.
Two basic decomposition patterns have been detected from FAEWE results:
i) where there is a low water table temperature appears to be the main environmental control on
decomposition rates,
335
ii) where the water table is consistently high increased decomposition results from a drop in water level,
but a larger increase occurs when both the water table drops and temperature increases.
These results concur generally with the established concept, bul become more complex in the case of high
water table sites, as the obvious relationship with water (i.e. the water table level) becomes negative, but
soil moisture may still be high. A drop in water table may mean that aclual évapotranspiration falls, hul
decomposition rates still increase, due to higher temperatures and sufficient available moisture in the soil.
In addition, it was found that the relationship between water tabic level and temperature was limited,
having an optimum level, below and above which CTSL begins to fall. The wettest and the driest,
warmest stations showed diminished average rates of decomposition, with the optimum conditions being a
moderate wetness class (II - III) and a mean annual temperature of approximately 12°C. The warmer,
more arid Guadiana sites further complicate the general pattern, as temperature appears to exert a lesser
effect where solubilisation of salts can occur, resulting in cementation of the cotton strip and reduced
CTSL rates.
In contrast to other cotton strip assay studies, e.g. French (1988), Maltby (1988), correlation wilh nutrient
levels produced either insignificant or negative results. The relationship was tested using total nitrogen
data from preliminary soil analyses. It is likely that other factors such as temperature and water tabic
position override any effect nutrienl levels may have, particularly in lhe cooler months, when
decomposition rates diminish. The decomposition sludy with litter-bags in the Torridge area mainly
indicated lhe important of litter quality, a factor not assessed with the cotton-strip assay. Litler quality is
partly determined by plant nutrient retranslocation, which itself is influenced by nutrient availability. Both
methods give comparable results for the Torridge units.
With regard to the effects of salinity upon CTSL rales in hotter, more arid regions, it is possible thai
cementation may not indicate a "real" influence upon decomposition, as a reduction of CTSL is achieved
through the effective strengthening of the cotton fabric. Whilst il is possible thai rc-precipitalion of
soluble salts may result in an alteration in biological process rates, this cannot be automatically assumed
from the cotton strip assay alone.
Relevance to functioning
The cotton strip decomposition assay gives an indication, although not necessarily a universally true
analogue, of decomposition processes operating within the soil and as such provides information about the
rate of organic matter turnover. The supply of inorganic nutrients is importan! lor many wetland
functions, such as denitrification. plant uptake and primary production, nutrient retention, peal
accumulation/loss and Horal speciation.
From the data analysis completed so far, no predictive equation has been formulated for CTSL rales.
Further statistical manipulation will be necessary to establish the feasibility of this. However, it may he
possible to form a qualitative assessment of potential CTSL ranges, given information on temperature,
water table dynamics/wetness class, pH and soil type, thus allowing the categorisation of potential organic
matter turnover rates.
5.2.4 Nutrient speciation under semi-arid conditions
The changes in salinity observed in the evaporation and flooding cycle of the Laguna de El Masegar have
considerable implications for nutrient speciation. Increases in salinity result in a decrease in speciation of
both inorganic carbon and phosphorus. Phosphorus appears to be precipitated as hydroxyapatile at
conditions of < 5mg/l salinity and is available to macrophytes but not phyloplankton. These changes in
speciation may have significant effects upon processes and, hence, functioning. The reduction in available
phosphorus at around 5mg/l salinity suggests an enhancement of the ability of the wetland lo act as a P-
sink. However, the slight increase in one species of available Ρ at lhe higher level may indicale a potential
for some re-solution of the unavailable form as salinity increases further.
The definite loss of inorganic carbon with greater salinity could have considerable impacts upon processes
and functioning. Carbon, in a form available for microbial respiration, is a significant controlling
parameter for several soil processes vital to nutrient functions, such as denitrification, decomposition and
nitrification. Consequently, the loss of inorganic carbon may diminish the potential of the weiland lo
- 336 -
perform these processes, despite the often enhancing effect of a higher pH seen in temperate systems. Nitrogen speciation appears to be virtually unaffected by greater salinity; it should be noted, however, that nitrogen processes are affected by pH and may, therefore, be altered here. However, the effects of desiccation are likely to negate any positive process responses caused by a higher pH.
5.2.5 Primary productivity under semi-arid conditions
Gross productivity and respiration were reduced under higher salinity; organic matter in the sediments was also seen to decrease, whilst available nutrients increased. This would be expected, as the turnover of organic matter should produce inorganic nutrient forms. However, there are potential negative effects: although the supply of inorganic nutrients is initially heightened, a cycle of reduction in organic matter would result in less material for mineralisation and hence a reduction in available nutrients. The reduction in organic malter would be likely to continue, due to the diminution in gross productivity caused by increased salinity. This alteration of nutrient status would impact significantly processes and functions.
5.2.6 The effects of impacts on biogeochemical processes
Several ecosystem functions are intimately connected with processes in the vegetation-soil system. Plant productivity, and the food chain support related to it, are controlled by N and Ρ availability. Soil organic matter formation, one of the ecosystem stores, is determined by plant litter production and decomposition. Ν and Ρ availability, the 'fertility' of the system, is strongly influenced by litter quality which depends on relranslocation of nutrients from dying biomass.
For a proper assessment of the effects of human impacts on these ecosystem functions, it is imperative to understand how the above-mentioned vegetation and soil processes are altered. The basic understanding gained from the present study is summarised for three of the impacts investigated together with the possibilities that exist for the use of simple indicators for these processes.
Nutrient impacts
The impact of nutrient additions was investigated in the English and Irish study areas. In England, the floodplain of the impacted site had been fertilized in the past, whereas the slope had been influenced by pig raising, and possibly through groundwater inputs. Soil investigations showed that these additions have primarily affected soil P-pools and soil C/P ratios on the slope, possibly because of the strong adsorption of Ρ to soil particles and the much more mobile character of N. Plant production, nutrient uptake and N-mineralisation were higher for the impacted when compared with the non-impacted slopes.
Correlative analysis showed that plant production was positively related to N-mineralisation. From this relationship it was concluded that vegetation production is controlled by N-availablity. From the N/P ratio of 14 in the living biomass of the vegetation at the unimpacted slope, it was concluded that this unit was co-limited by Ν and P. This co-limitation was confirmed in the second year of a fertilization experiment. In the first year a lower N/P ration (about 10) was measured and the treatments resulted in an N-limitation only. This suggests that the controls on the availability of Ν and Ρ are not similar and can result in important between-year differences. The vegetation at the unimpacted slope was adapted to a low P-availability. This was concluded from a fertilization experiment with a phytometer and a high P-rctranslocation efficiency.
The vegetation response in the fertilization experiments could be very well predicted by comparing the N-and P-concentrations of living biomass with 'critical' nutrient concentrations (4.2.3). Therefore, critical concentrations supply helpful threshold values for predictions of nutrient impacts. Further work must be done to lest them for their general applicability to different vegetation types. The N/P ratio is also useful in predicting biomass responses, but only when Κ is not in short supply. Both the ratio and the critical concentrations are important tools in planning habitat restoration measures. The advantage of using the N/P ratio is that plant nutrient concentrations throughout the growing season give a similar, reliable result, whereas only nutrienl concentrations at the moment of peak biomass are suitable for evaluation of growth limitation by using the 'critical' nutrient concentrations.
337 -

N-mineralisation was not related to the quantity of soil organic malter, but to its quality, expressed by C/N and C/P ratios. High ratios are the result of a high retranslocation efficiency from dying biomass. A litter decomposition experiment confirmed the indicative value of the C/N and C/P ralios for organic malter break-down, as they were negatively related to litter weight loss.
Summarising, at the unimpacted site, nutrient availability is low. and the vegetation maximises nutrient conservation. This results in low-quality litter (high C/N and C/P ratios) which reinforces the low nutrient availability by its negative effect on N-mineralisation. Low rates of decomposition and mineralisation, furthermore, promote the formation of soil organic mailer. When lhe site is impacted by nutrients, production will rise. As more productive species become established, litter quality changes, mineralisation increases and the soil partly loses its store function. Simultaneously, more mineral nutrients become available for processes such as leaching, denitrification and nulricnl uptake.
On the Shannon and Little Brosna systems, nutrient studies confirmed the findings of hydrological investigations of sediment dynamics, that there was generally no evidence for lhe impaci taking place at present". Large differences between many parameters were found across the gradients studied at each river system, whereas differences between the rivers were small. High C- and N-pools were related to the more peaty soils found further away from the river channel, and were not likely to rcsull from the effects of river sedimentation. The store functions of peaty soils in this landscape are a consequence of the wcl and cool climatic conditions. Only the higher soil P-content of lhe levée at Little Brosna could be a possible consequence of sedimentation. The mostly local differences in soil nulricnl pools were nol reflected in soil nutrient availability. Production and nulricnl uptake were similar for most stations within and between the two rivers. Apparently, nutrient availability does not control plant production here, findings confirmed by the results of the fertilization experiment performed in 1992 in which the vegetation did not give any significant response to nulricnl additions. Overall hardly any nutrient-related differences were found that could be attributed to increased sedimentation. The findings more probably indicale that unfavourable climatic conditions of low light intensity and temperature during the growing season are more important than nutrienl impacts in controlling growth of vegetation.
Moisture impacts
The impact of reduced flooding and consequent reduction in soil moisture was investigated in the French study area. Clear differences in soil moisture levels were noted between lhe Allier and Loire floodplain soils under study. Important processes, such as plani production, nutrient uptake and N-iiiincralisalion, were all higher in the welter Allier grassland units. Moisture stress for the vegetation was found above the soil willing point of pF=4.2. This comparison suggested an important impact of low soil moisture levels, but this factor proved to be very closely related to lower soil organic mailer and soil nulricnl eonlcnl. An experiment to investigate the relationship between soil moisture and soil nutrient pools indicated that soil nitrogen and carbon dynamics showed reduced rates under low moisture conditions, resulting in lhe low plant productivity.
These results indicate the serious impact that reductions in flooding regime can have on biogeochemical functioning. Sites that flood more frequently have higher soil moisture contents, hut at the same lime receive more nutrienl carrying sediments that increase soil nutrient pools. This enhances N-mineralisation and plant productivity, and leads to a further increase in soil organic matter contents and soil nulricnl pools (store function). Cutting off areas from fluvial inputs of nutrients and moisture will, in lime, lead lo lower plant production values through creating moisture stress and reducing N-mincralisation rales under dry conditions. As a consequence the soil nutrient storage function through organic inputs also decreases. Reduction of flooding also limits the N-lransformer function of floodplains, because less nitrogen, derived from ¡(ï situ produced or imported organic material, is available for denitrification.
Impacts in the context of the climatic range
Comparison of three of the study areas indicates distinct differences in soil moisture conditions and the mineral content of the soils between one area and the next. Both the climatic range and specific flooding regimes were responsible for these differences. Total soil nulricnl pools were mostly different between impacted and non-impacted sites at each of the sludy areas.
" The unsubstantiated reports of reeenl sedimentation near Clonmacnoise may eause Ihis statement to be reviewed (4.1,6).
338 -
Comparison of' plant production values for all unimpacted sites indicates that the Irish sites had
comparatively low values, possibly due to the effect of climatic limitations. A nutrient impact could not
be detected in Ireland but in England it was large compared with the climatic effect. N-mineralisation
rates in unimpacted sites increased from Ireland to France, suggesting a temperature effect. Again, the
nutrient impact in England raised N-mineralisation to a much higher level. P-availabilily varied mainly
between countries rather than between impacted and unimpacted paired sites. It seems that P-availability
is mostly determined by the soil type and its hydrological regime.
The primary overall control on plant production was soil mineral nitrogen availability. Nitrogen
mineralisation scenis to be controlled by the soil Ρ content mainly at extremely low P-levels. A second
control on plant production was soil moisture which was found to stress growth at low values.
5.3 Ecological processes
Investigations have focused on the need to describe sites in terms of observable ecological characteristics
and to relate these to environmental parameters, either measured in parallel studies within the FAEWE
project, or available from published sources. The establishment of these patterns and relationships
confirms the degree to which biotic indicators can be used to facilitate the assessment and prediction of
ecological functions performed by wetland ecosystems within the scheme of functional assessment.
5.3.1 Plant community analysis
Phytosociological studies have enabled the vegetation types at the study sites to be identified and mapped
(2.3). Analyses of these datasets containing the plant species identified have been carried out by various
techniques. The separate units and sub-units of vegetation (4.3.1) are associated with discrete soil and
environmental conditions and can be used to characterise individual parts of wetland systems, including
artificial features such as hedgebanks, ditches and gateways.
Work in Ireland on the floodplains of the Shannon and Little Brosna has indicated how plant community
composition and vegetation patterns can be determined by small height differences due to microrelief and
by the composition of' soil material. For example, a low dome on peatland of the Shannon floodplain
carries oligotrophic indicator species in a community of relatively high biodiversity, compared with
adjacent depressions. The lowest levels of biodiversity are found on mineral soils of lhe levées and
channel margins, where lhe vegetation is dominated by nutrienl-demanding species. In general within the
area it is known that the ecological importance of the haymeadow habitats on the callows has resulted
from the history of traditional management with little or no use of fertilizers or other improvement works
such as drainage or resceding.
At the Torridge site oligotrophic (rain-fed) systems can be separated from nutrient-rich grasslands,
supplied by base-rich groundwater. Distinctions of this kind enable predictions to be made about the likely
hydrological support mechanisms operating within the ecosystem and any effects that alterations in
hydrology would make to functioning. Data were also collected on the composition of plant communities
found on adjacent land of the same hydrogeomorphic units but having experienced differing land use
histories. Semi-natural grasslands of lhe study sites themselves contrasi wilh adjacent reclaimed pasture
with artificial drainage at Kismeldon and deciduous woodland at Bradford Mill. A knowledge of (he
differences in vegelaiion resulting from known anlhropogenic impacts enables the effects of wetland
management options to be predicted.
Phytosociological characteristics can be grouped al different levels to provide kinds of information
appropriate to a range of scales of interest. Studies in France on the Loire and Allier indicate the differing
effects of hydrological regime and anthropogenic impact. Low-lying river marginal wetland ecosystems
arc mainly hydrologically controlled, in contrast to siles on higher parts of' the floodplains, where human
impacts resulting from agricultural management predominate. However studies on lhe Loire site indicate
that in soils of low water holding capacity, unaffected by a high groundwater table, droughlincss is an
important regulator of species composition on grazed swards.
In the semi-arid climate of Spain ecological investigations have focused on the adaptation of vegetation to
desiccation and salinisation within the context of both seasonal cycles of welting and drying and long-term
climatic effects, reinforced bv the adverse effects of waler management (alteration to river channels and
- 339
Hows and abstraction of groundwater). Hydrological regime is particularly crucial in determining broad differences between salt-tolerant and freshwater communities and, within each, the nature and degree of plant diversity and productivily.
Analyses of the phytosociological data from the Spanish sludy siles indicale important differences between the (until recently) undisturbed helophyte vegetation of the Ciguela floodplain at El Masegar and dried out parts such as Molino del Abogado, which carry halophytic communities. Associated with changes in species composition, resulting from desiccation, are alterations in the structure, diversity and productivity of plant communities. In general the more species-rich communities tend to be lower in productivity, while the highest values are found in monospecific reedbeds of Phragmites australis, although even in the case of this habitat type, moisture stress substantially reduces productivity. The value-in using Phragmites as a bio-indicator of hydrological stress is discussed below.
5.3.2 Reed performance and hydrological stress
Results of field investigations have indicated the usefulness of measuring reed performance lo assess its ecological status and evaluate the degree of impact resulting from hydrological stress. The species is highly tolerant of fluctuations in water level and, in dry places, can dominale nutrient-deficient sites (Haslam 1970). It is regarded as sail tolerant and has been described as halophytic (Hellings and Gallagher 1992). The advantages of using Phragmites to assess stress and disturbance due to desiccation and salinisation can be summarised as follows:
• It can withstand a wide range of moisture and salinity conditions allowing ils use over a wide geographical area
• It is easily identified for study by non-experts • Morphological measurements are easy to make • It is a prominent and important component of many wetlands
lis value in a predictive system of wetland functional assessment is reviewed in 5.4.5.
5.3.3 Primary production strategies
Studies carried out in Spain at shallow seasonal walerbodies, subject to drying out in summer, have indicated the importance of hydroperiod and substrate composition to the strategics developed by submerged macrophytes, phytoplankton and micro-phytobenlhos, which act as primary producers within the ecosystem food webs. Each group has differing requirements in terms of both length of flooding period and patterns of fluctuations in water levels, which were shown to vary from one to more than two years. The relative periods of flooding and desiccation are controlled by infrequent intense fluctuations in water levels in systems dominated by submerged macrophytes, while in the case of the other types of primary producers, changes in water levels are of a smaller degree. Patlcrns of change in sediment organic matter and moisture content, linked to wetting and drying cycles, have been determined and were found to be different for specific plant community types. Where dominated by a phytoplankton community, organic matter content decreases from wet to dry periods, while wilh the other two primary producers it was found to increase.
5.3.4 The role of the aquatic component in habitat support
Wetland ecosystems frequently contain both lerrestrial and aquatic componcnls, the relationships between which are frequently complex in both spatial and temporal terms. In assessing the habitai support function it is important to consider the complete ecosystem complex, including those components which may persist for only short periods of time as occur in some of the La Mancha wcllands. The patterns of' waler level fluctuation which characterise the hydrological regimes in this semi-arid environment, often vary considerably between one year and another, requiring appropriately long time scales to be considered in the evaluation of ecological functioning. Mineralisation and recycling of organic matter in lake sediments, in relation to wetting and drying sequences, are critically imporlant in the growth and development of algal beds, which support higher components of lhe food web, such as crayfish and coot.
340
5.3.5 Waterfowl and environmental conditions
The general conclusion of the investigation of the wildfowl at the Irish sites must be that there is no overall dependence upon any one vegetation type by the bird species occupying the callows during the winter. On the contrary, presence or absence of flooded ground would seem to be of paramount importance, such that the birds can be said to be much more dependent upon the hydrological regime to which these callows are subject than on any feature of the present vegetation cover. Nonetheless, the relation between the flooding regime and vegetation types results in a de facto association between the birds and one vegetation type in particular, namely that which characterises the part of the callows subject to the most prolonged periods of Hooding. This association poses a different question - namely, is the vegetation type of this part of the callows to some extent dependent upon bird use? Many of the bird species involved are vegetation feeders, which use the callows for roosting but need to spend lime away from the callows feeding. In these circumstances, they will provide a nel input to the nutrient content of the callow system through deposition of faeces on their return from feeding elsewhere. This input will not be uniformly scattered on the surface of the callows, but will be added predominantly on the vegetation type characterising the zone in which they congregate - referred to here as Vegetation Type 1 (Glyceria fluiians community). The occurrence of this vegetation type both within and outside the Wildfowl Sanctuary on the Little Brosna callows suggests that, at least within the 20 years of existence of this protected area, any build-up of nutrient due to the effects of excreta from wildfowl has not had any gross effect on the vegetation, even though the birds hardly use the area outside the sanctuary. However, if more subtle effects of this nutrient input exist, it would not have been possible to detect them using the available field data.
The apparent association between the Glyceria fluitans community and large numbers of wildfowl on the callows prompted examination of data from other sites. Out of twelve sites known to be important for waterfowl and waders along the Shannon callows, seven proved to have significant areas of the G. fluitans community and four of the remaining five had a related vegetation type (tall-grass washlands) which occurs under similar conditions of prolonged flooding and sedimentation (Heery, 1991). The four additional Shannon callow areas for which botanical information is available and which do not support large numbers of wildfowl, lacked both of these vegetation types. In addition, Rhasane Turlough (Co. Galway), an internationally important site for swans, ducks and golden plover, also carried the G. fluitans community in large quantity (Sheppard, 1994 and Ryan, pers. comm.). Galvin (1994) notes that large numbers of wildfowl are associated with this same vegetation type in a number of British floodplain sites.
Given that the apparently preferential association between birds and the G. fluitans community is demonstrably co-incidental as far as the birds are concerned, rather than causal, the question remains whether the grazers among the wildfowl are having any particular effect upon this community through their cropping activities, as well as through the addition of excreta. The G. fluitans community is characterised by a number of plants which can continue to grow through the winter, whilst submerged underwater. It would be consistent with data from other situations that such plants derive competitive advantage from the grazing activities of the wildfowl, since they can continue to grow during this phase when other inactive species are being grazed out. So in this way also, the wildfowl may be influencing the constitution of this community.
Any attempt to identify relationships between sites and highly mobile organisms like migratory wildfowl needs to consider external factors affecting of population movements and aggregations as well as intrinsic site factors. Bird use of the callows would seem to be a case in point, where superficial interpretation suggested a preference by the wildfowl for a particular vegetation type, a relationship which proved spurious when extrinsic factors, namely off-site shooting activity and the river's flooding regime, were also considered. In terms of habitat maintenance, it would seem that the callows wildfowl are dependent more upon the hydrological regime and shooting than upon any intrinsic biological components of the callows system. The plant-feeding species may be exerting some influence upon the plant communities via excreta and grazing, but as yet this can only be hypothesised, rather than proven.
Observations made on the types, numbers and behaviour of birds using the wetland study sites and adjacent areas in Spain have been related to environmental conditions and the availability of food supply. Results have indicated that the birds are opportunistic feeders on a variety of food sources. Areas most favoured by wetland birds are those with high populations of chironomid larvae and these areas tend to be those which receive low-salinity waste-water. However, faecal analysis revealed that even in lhe areas
341 -
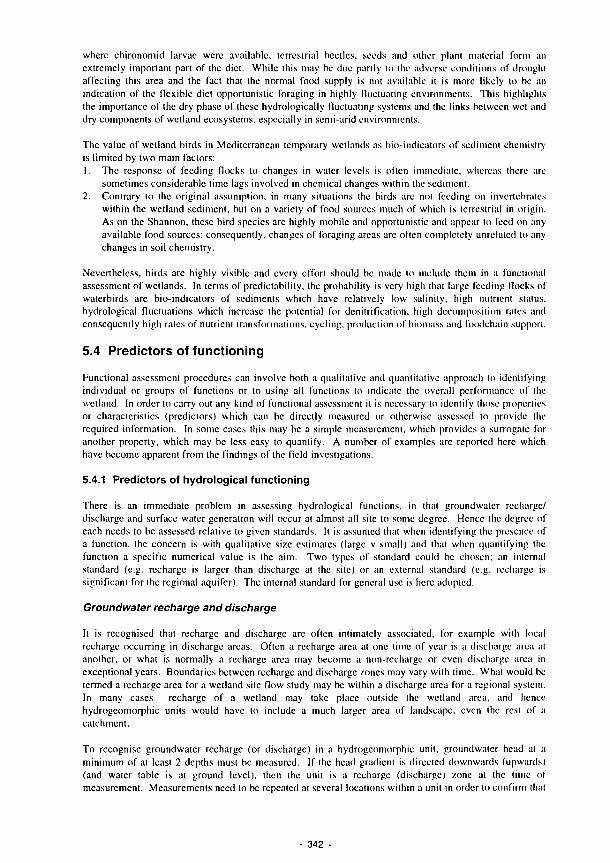
where chironomid larvae were available, terrestrial beetles, seeds and other plant material form an extremely important part of the diet. While this may be due partly to the adverse conditions of drought affecting this area and the fact that the normal food supply is not available it is more likely to be an indication of the flexible diet opportunistic foraging in highly fluctuating environments. This highlights the importance of the dry phase of these hydrologically fluctuating systems and the links between wet and dry components of wetland ecosystems, especially in semi-arid environments.
The value of wetland birds in Mediterranean temporary wetlands as bio-indicators of sediment chemistry is limited by two main factors: 1. The response of feeding flocks to changes in water levels is often immediate, whereas there arc
sometimes considerable time lags involved in chemical changes within the sediment. 2. Contrary to the original assumption, in many situations the birds are not feeding on invertebrates
within the wetland sediment, but on a variety of food sources much of which is terrestrial in origin. As on the Shannon, these bird species are highly mobile and opportunistic and appear to feed on any available food sources; consequently, changes of foraging areas are often completely unrelated to any changes in soil chemistry.
Nevertheless, birds are highly visible and every effort should he made to include them in a functional assessment of wetlands. In terms of predictability, the probability is very high that large feeding flocks of waterbirds are bio-indicators of sediments which have relatively low salinity, high nulricnl slatus, hydrological fluctuations which increase the potential for denitrification, high decomposition rates and consequently high rates of nutrient transformations, cycling, production of biomass and foodchain support.
5.4 Predictors of functioning
Functional assessment procedures can involve both a qualitative and quantitative approach lo identifying individual or groups of functions or to using all functions to indicate the overall performance of the wetland. In order to carry out any kind of functional assessment it is necessary to identify those properties or characteristics (predictors) which can be directly measured or otherwise assessed to provide the required information. In some cases this may be a simple measurement, which provides a surrogate for another property, which may be less easy to quantify. A number of examples arc reported here which have become apparent from the findings of the field investigalions.
5.4.1 Predictors of hydrological functioning
There is an immediate problem in assessing hydrological functions, in thai groundwater recharge/ discharge and surface water generation will occur at almost all site to some degree. Hence (he degree of each needs to be assessed relative to given standards. It is assumed that when identifying the presence of a function, the concern is with qualitative size estimates (large ν small) and thai when quantifying the function a specific numerical value is the aim. Two types of standard could be chosen; an internal standard (e.g. recharge is larger than discharge at the site) or an external standard (e.g. recharge is significant for the regional aquifer). The internal standard for general use is here adopted.
Groundwater recharge and discharge
It is recognised that recharge and discharge arc often intimately associated, for example with local recharge occurring in discharge areas. Often a recharge area al one lime of year is a discharge area al another, or what is normally a recharge area may become a non-rechargc or even discharge area in exceptional years. Boundaries between recharge and discharge zones may vary with time. What would be termed a recharge area for a wetland site flow study may be within a discharge area for a regional system. In many cases recharge of a wetland may lake place outside the wetland area, and hence hydrogeomorphic units would have to include a much larger area of landscape, even the rest of a catchment.
To recognise groundwater recharge (or discharge) in a hydrogeomorphic unit, groundwater head at a minimum of at least 2 depths must be measured. If the head gradient is directed downwards (upwards) (and water table is at ground level), then the unit is a recharge (discharge) zone al the time of measurement. Measurements need to be repeated at several locations within a unii in order to confirm that
342 -

the whole unit is acting as a recharge/discharge zone. In order to predict if a wetland has, for example, a
significant recharge function one of the following requirements could be met:
• when recharge > some value related to horizontal groundwater flow
• when recharge > some value dependent on just soil/rock type or rainfall
• when recharge >0
The choice partly depends on the precise definition of function and identifying when negligible recharge
become significant.
Significant recharge can also occur when there is no measurable vertical head gradient. As long as the
water level is not at the ground surface recharge will occur to the uppermost parts of the sequence. Large
amounts will occur only where the permeability is substantial. At Kismeldon the floodplain area receives
recharge, yet its principal characteristics are those of a throughflow area, the main recharge area being
taken as the high ground above the SSSI - i.e. upslope within the watershed.
Flooding from a river can cause recharge. It becomes significant when Hooding covers the site for more
than a given number of days per year, which depends upon substrate permeability and time of year.
Significant recharge is more likely where ground level is higher than surrounding areas, where soil and
rock is relatively permeable, and where the ground remains dry/dries out relatively quickly after rainfall.
Gleyed soils will indicate relatively little recharge.
There are several qualitative indicators of discharge, although absence of any of them should not be taken
as an indication that the function is not important: presence of discrete springs, continuously wet areas
during dry periods; rapid snow/ice melt in localised zones; and zones where surface water has electrical
conductivity/chemistry similar to groundwater/grealer than local rainfall, especially at periods of low
évapotranspiration.
Quantifying recharge can be undertaken in many ways. Excluding the more labour and/or expertise-
intensive methods, the following estimates can be made:
• Use MORECS effective precipitation data. Method is averaged over 40km grid squares and ignores
vegetation differences and runoff.
• Use local rainfall and potential évapotranspiration data and a soil moisture balance.
• Use area of downward head gradient χ permeability χ downward head gradient. Not very accurate
where considerable lateral How occurs, and vertical flow can be caused by processes other than local
recharge.
• Calculate river flood recharge using Darcy's Law and river stage.
• Use water level fluctuations and storage coefficient.
• Use recharge amount = rainfall concentrations/groundwaler concentration.
• Use a lysimcter.
• Calculate as a residual from a water balance/using a flow model (many variables).
• Use a regionally tested empirical relationship.
These variables have been incorporated into a method of semi-quantitatively assessing recharge amounts
based on comparisons with a total river catchment.
Surface water generation
Work at Kismeldon Meadows has suggested that the following will hold for the occurrence of surface
water generation: If discharge is occurring, groundwater will be supplied to the soil zone and ground
surface. If it is very significant, it will be observable as surface runoff during dry spells, and during snow
cover. If the aquifer is full as indicated by water levels in piezometers being <0.5m deep, (hen (he rainfall
will nol be able to penetrate the ground and it will, as a consequence, runoff. If the precipitation intensity
is greater than the soil infiltration rate, then water will runoff. Observations should be made during onset
of heavy rainfall. Potential infiltralion/runoff could be estimated using soil permeability. If the ground
slope is great enough and surface roughness is low enough then water will runoff before being able to
infiltrate. A qualitative guide based on slope angle and vegetation cover is being developed as a
component of the functional assessment procedures. A simple observation of the delay time before runoff
starts relative to the onset of heavy rainfall can be used to assess the presence of surface water generation.
343 -

Much of the generated surface water runoff is likely to move via ditches and drains. This can be observed during dry and wet periods.
Qualitative assessments of surface water generation can be aided by the application of hydrological classifications of soils. Farquharson et al. (1978) developed a scheme which enabled a map to be produced of Winter Rain Acceptance Potential (WRAP) which has been used in Hood studies to index catchment run off potential. The depth and permeability of the soil and substrate, together with the slope of the land determine the balance between infiltration (and delayed flow) and direct run off'. The WRAP map categories, which exclude those periods when appreciable soil moisture deficits occur, identify live classes of rain acceptance potential.
Subsequent developments in soil and hydrological databases in the UK have enabled a more detailed classification of the Hydrology Of Soil Types (HOST) to be made. This has utilised digitised regional maps, soil physical properties and stream now measurements to produce a hydrological classification which groups soils into 29 classes according to pathways and fluxes of water movements (Boorman and Hollis, 1990). Data requirements are hydrogeology (substrate permeability), soil parent material flow mechanisms, depth to aquifer or groundwater, presence of peaty topsoil, depth to gleyed and/or slowly permeable layer and integrated air capacity (mean air volume over top I in).
Quantifying surface water generation can be assessed through the following methods. Runoff in ditches can be monitored using weirs or flumes or by velocity-area methods, whilst runoff from drains can be monitored using weirs or bucket and stop watch. However, overland flow is very difficult to estimate. Some approximate slope angle/vegetation correlation methods exist and are being developed further. Direct measurement of surface water may well require specially set up overland flow traps feeding a collector reservoir. In the long term, when rainfall intensity exceeds permeability, the excess water will add to depressional storage or actively run off as overland flow, though it should be noted thai lliis can be-very inaccurate for short times after infiltration begins. In the situation where groundwater levels arc at ground surface and depressional storage is filled, all rainfall will be discharged as overland flow. In wetlands such as bogs depressional storage may be considerable.
Summary
Simple predictions of hydrology and especially hydrogeology are fraught with problems. Consequently, any attempts at predictions of functions are similarly problematic. The combination of results of the work undertaken at the study sites, and in particular at Kismeldon, combined with published work and accepted theories has shown that it is possible, to a general level of detail, lo interpret and predict the occurrence of hydrological functions. The predictive interpretations of hydrology can also be utilised to provide information pertinent to understanding also the biogeochemical functions that a wetland may be performing.
5.4.2 Soil characteristics as a predictor of biogeochemical functioning
The importance of the unique properties that wetland soils exhibil is repealedly emphasised by their inclusion in many wetland classification systems (1.3). In RMWs, as with other wetland lypes, the soil is both the medium in which many of the biogeochemical transformations take place, and the store for available nutrients for most forms of vegetation. Wetlands have been shown to he sinks for nitrogen (Mitsch, 1977; Peterjohn and Correli, 1984) and phosphorus (Richardson, 1985), although spatial and temporal variations, as emphasised by FAEWE research into N and Ρ dynamics, result in individual RMWs performing the nutrient removal and retention functions at different rates.
The biogeochemical process studies have verified and enhanced the current stale of understanding of wetland nutrient dynamics. A predictive model for the identification and evaluation of the nulricnl removal and retention functions performed by RMWs has been developed in associalion wilh the research into C, Ν
344
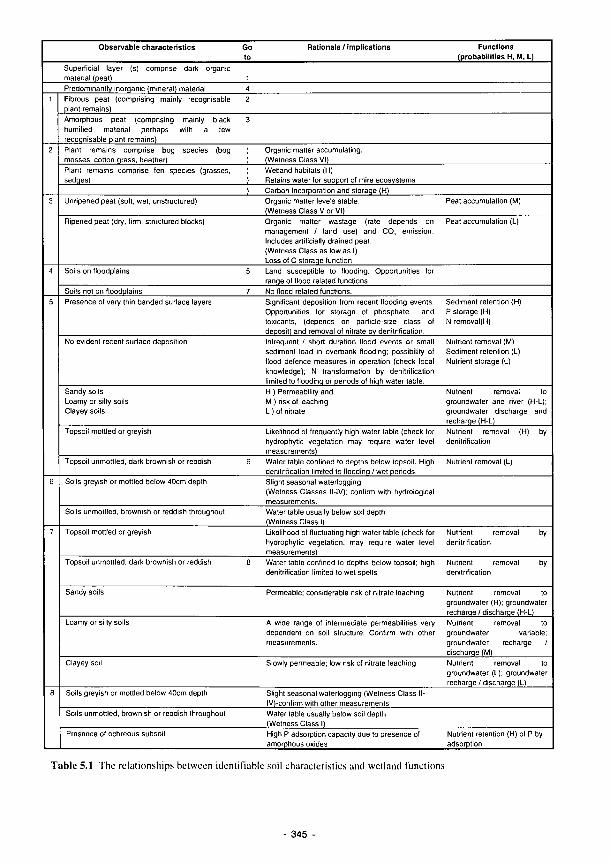
Observable characteristics Rationale / implications Functions (probabilities H, M, L)
Superficial layer (s) comprise dark organic material (peal) Predominantly inorganic (mineral) material Fibrous peat (comprising mainly recognisable 2 plant remains) Amorphous peat (comprising mainly black 3 humified material perhaps with a few recognisable plant remains) Plant remains comprise bog species (bog mosses, cotton grass, heather)
Organic matter accumulating. (Welness Class VI)
Plant remains comprise fen species (grasses, sedges)
Wetland habitats (H) Retains water for support of mire ecosystems Carbon Incorporation and storage (H)
Unripened peat (soft, wet, unstructured) Organic matter levels stable. (Wetness Class Vor VI)
Peat accumulation (M)
Ripened peat (dry, firm, structured blocks) Organic matter wastage (rate depends on management / land use) and CO, emission. Includes artificially drained peat. (Wetness Class as low as I) Loss of C storage function.
Peat accumulation (L)
Soils on floodplains Land susceptible to flooding. Opportunities for range of flood related functions.
Soils not on floodplains No flood related functions. Presence of very thin banded surface layers Significant deposition from recent flooding events.
Opportunities for storage of phosphate and toxicants, (depends on particle-size class of deposit) and removal of nitrate by denitrification.
Sediment retention (H) Ρ storage (H) Ν removal(H)
No evident recent surface deposition Infrequent / short duration flood events or small Nutrient removal (M) sediment load in overbank flooding; possibility of Sediment retention (L) flood defence measures in operation (check local Nutrient storage (L) knowledge); Ν transformation by denitrification limited to flooding or periods of high water table.
Sandy soils Loamy or silty soils Clayey soils
Η ) Permeability and M ) risk of leaching L ) of nitrate
Nutrient removal to groundwater and river (H-L); groundwater discharge and recharge (H-L)
Topsoil mottled or greyish Likelihood of frequently high water table (check for hydrophytic vegetation may require water level measurements)
Nutrient removal (H) by denitrification
Topsoil unmottled, dark brownish or reddish Water table confined to depths below topsoil. High denitrification limited to flooding / wet periods.
Nutrient removal (L)
Soils greyish or mottled below 40cm depth Slight seasonal waterlogging [Wetness Classes II-1V); confirm with hydrological measurements.
Soils unmottled, brownish or reddish throughout Water table usually below soil depth (Wetness Class I)
Topsoil mottled or greyish Likelihood of fluctuating high water table (check for hydrophytic vegetation, may require water level measurements)
Nutrient removal by denitrification
Topsoil unmottled, dark brownish or reddish Water table confined to depths below topsoil; high denitrification limited to wet spells
Nutrient removal by denitrification
Sandy soils Permeable; considerable risk of nitrate leaching Nutrient removal to groundwater (H); groundwater recharge / discharge (H-L)
Loamy or silty soils A wide range of intermediate permeabilities very Nutrient removal to dependent on soil structure. Confirm with other groundwater variable; measurements. groundwater recharge /
discharge (M) Clayey soil Slowly permeable; low risk of nitrate leaching Nutrient removal to
groundwater (L); groundwater recharge / discharge (L)
Soils greyish or mottled below 40cm depth Slight seasonal waterlogging (Wetness Class I lV)-confirm with other measurements
Soils unmottled, brownish or reddish throughout Water table usually below soil depth (Wetness Class I)
Presence of ochreous subsoil High Ρ adsorption capacity due to presence of amorphous oxides
Nutrient retention (H) of Ρ by adsorption
Table 5.1 The relationships between identifiable soil characteristics and wetland functions
345

and Ρ dynamics. Also included in the model is information on the role of the wetland soil in peal accumulation and sediment retention.
The objective was to produce a user-friendly scheme that outlined the relationships between easily identifiable soil characteristics and wetland functions, including the rationale behind the assumptions. The observable soil characteristics were described in non-expert terms suitable for an initial field based investigation. The proposed scheme is shown in Table 5.1. Information on soil mineral vs. organic content, mottling, banding, texture (sandy, loamy, clayey) and plant material is requested in general terms. The key guides the non-expert through the observable soil characteristics via the rationale/implications to the function and probability of it occurring.
In the case of a mineral soil (Go to 4), that did not occur on a floodplain (Go to 7), and was characterised by unmottled, dark brownish or reddish topsoil (Go to 8), and the presence of an ochrcous subsoil, the assumption is that it would possess a high Ρ adsorption capacity due to the presence of amorphous oxides and would have the potential for high denitrification rates during wet spells. Thus both the nutrient removal and nutrient retention potential of the soil would be high.
Information from this proposed scheme is being field tested, the results of which are being incorporated into the functional assessment procedures.
5.4.3 Vegetation as a predictor of functioning
The interactive dynamic effects of plant diversity or species composition arc often especially rich in wetland habitats within established plant communities as a result of competition. But this factor depends on other biotic and abiotic ecological factors including hydrodynamics, trophic level in term of nutrient availability and human impacts. For example, mechanical interference resulting from mowing, or biotic disturbance from grazing, removes the plani competition which would otherwise intercept light reaching the field layer in grasslands. According to the theory of' Grime ( 1979), the low availability of nutrients in oligotrophic habitats precludes competitive species or reduces the competitiveness of those which can survive, to the advantage of those species which are able to tolerate stress and disturbance.
Plant nutrient concentrations as indicators for trophic state and predictors for nutrient impact effects on functioning
Nutrient availability plays an important part in determining plant production, competitive dominance and species diversity. Determining which nutrienl controls plant production can give valuable information both for assessing the impaci on ecosystem functioning of specific nulricnl additions, and for wetland restoration purposes. In the first case, knowledge of nutrient limitations can he used to predict what will happen if enhanced inputs take place of a certain nutrient. For the second purpose, if information is known about specific nutrient limitations which arc responsible for the maintenance of particular habitats, it enables precise measures to be taken to reduce inputs of the limiting nulricnl, and thereby restore low production levels leading, in time, to higher species diversity.
The method examined in the fertilization experiment requires thai nutrient concentrations in lhe vegetation are measured, preferably at the end of the growing season. As long as K-conccnlralions are at least 8 mgKg'. use can be made of the N/P ratio; values between 14 and 16 indicate a co-limitation of Ν and P; ratios above 16 indicate P-limilations and those below 14 indicate N-limilations. When palhways for nutrienl inputs are known, assessment of changes can be predicted.
Plant communities as bioindicators of hydrological functions and trophic state
Hydrological processes are major ecological factors for plant community development. Hydrodynamics influence the trophic slate of a habitat in providing for the availability of nutrients. This can be seen using the example of the Torridge site.
Comparison of the vegetation maps of Bradford Mill (Fig. 2.1 la) and Kismeldon (Fig. 2.1 lb) wilh data collected during the hydrogeological investigations by the Birmingham group, allow for the production of maps (Fig. 5.4 a and b) that show the relationships between hydrological processes, dependent
- 346
geochemical processes and plant communities at the scale of RMWs. These maps can be used for predictive purposes interpreting the use of plant communities as bioindicators of major ecological factors.
The two diagrams (Fig. 5.5 a and b) help explain the processes which are taking place in such study sites: they show two configurations on the same type of hydrogeomorphic unit "Gentle slope" from the Torridge sites.
At Bradford Mill wet oligotrophic grassland is developed on soils in which the high degree of wetness during most of the year is mainly due to the interaction between rainfall and high retention of water in the slowly permeable soils. Nutrient availability results mainly from internal processes which take place within the ecosystem. Losses of nutrients arc more or less balanced by inputs from rainfall and overland flow. In contrast, eutrophic wet or flooded grasslands are maintained by hydrological inputs from groundwater discharge or flooding which provide plants with a constant source of nutrients from a source outside lhe habitat, i.e. from an upslope area or from the river. Plant productivity of eutrophic communities is three times thai of oligotrophic types.
At Kismeldon (Fig. 5.4b and 5.5b) the main part of the gentle slope unit is occupied by wet oligotrophic grasslands developed on slowly permeable soils in a ground-water recharge area. In a few places tussock sedge communities are found on peaty hummocks which correspond with ground-water discharge areas. Fig. 5.5 indicates that in the central part, where the greatest thickness of peat has accumulated, discharge provides a continuous flux of nutrients availability for plant growth. Around the point of discharge, the seepage of' more oxygenated water together with the nutrient flux has induced a tall herb fen or meadowsweet grassland with two or three times the productivity of the oligotrophic grassland. It is of interest that high productivily does not necessarily require high concentration of nitrogen or phosphorus but, as in this case, a permanent water flux of only low nutrient concentration.
Care is required in interpreting differences between sites such as these because of other ecological factors such as anthropogenic disturbance. This may not be a complication if the impact is of the same kind and magnitude as is the case in the Torridge study area where wet grassland communities at both sites arc lightly impacted by extensive grazing.
Plant communities as bioindicators of human activities
The structure and species composition of plant communities arc commonly the result of major or minor, direct or indirect disturbances induced by human activities, which themselves may also be dependent on hydrological functions, soil quality or other factors, making it difficult to examine the precise impact of a perturbation.
At Kismeldon, on the same hydrogeomorphic unit, the past reclamation and drainage of a field offers an opportunity to measure its impact some years later. Fig. 5.6 shows the plant community variations in relation to the drainage of a wet oligotrophic grassland, by a synchronical analysis. Floristic variations arc shown by the differentiation of an ecosociological group of species in terms of hydrological behaviour associated with trophic value.
Two impacts of drainage are shown. Over the drains in the reclaimed area, the improved grassland is a mesophile and mesotrophic pasture and is characterised by grasses and white clover. The land has received manure and, because of drainage improvements to the load bearing capacity of the topsoil, cattle have not poached the surface. Only two species. Juncus aculiflorus and Holcus lunulas, are humid or wet plant indicators in this pasture. The plant diversity is reduced to 10 species in comparison with the 32 species of the unimproved grassland.
Substantial agricultural improvement is evident only immediately above the drains. Between drains, over major areas of the field, the plant diversity (23 spp.) is greater where the drainage remains poor and land management has had two consequences: poaching by cattle is more evident even though the grazing is less inlcnsivc due to lower quality of plants; on drained land the use of fertilizers favours eutrophic species development at the expense of oligotrophic species. In this case, the disturbed habitat show a certain resistance to the drainage; although the diversity is still quantitatively high there has been nevertheless a great change and a loss of species which arc found only on lightly improved grasslands and wet oligotrophic areas.
- 347 -
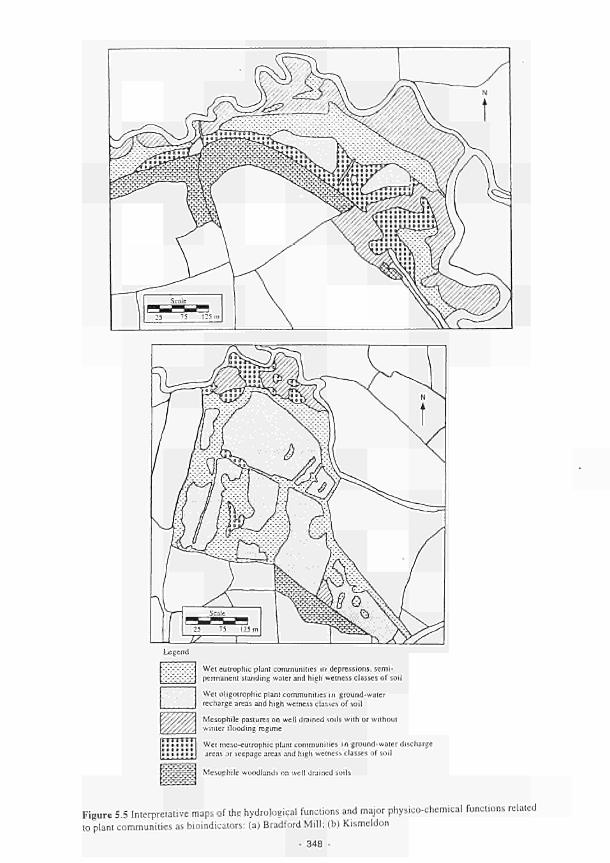
Legend
li Wet eutrophic plant communities in: depressions, semipermanent standing water and high wetness classes of soil
Wet oligotrophic plant communities in ground-water recharge arcas and high wetness classes of soil
Mesophile pastures on well drained soils with or without winter Hooding regime
Wet meso-eutrophic plant communities i n ground-water discharge areas sr seepage areas and high wetness classes of soil
5 § 5 5 § | § ] Mesophile woodlands on well drained soils
Figure 5.5 Interpretative maps of the hydrological functions and major physico-chemical functions related to plant communities as bioindicators: (a) Bradford Mill; (b) Kismeldon
3Ί8

(a)
water flux
Legend A
Β
flood
Oligotrophic mat-sward grassland on ground water recharge area
Oligo-mesotrophic acid purple moorgrass meadow on ground water recharge area
C Great tussock sedge hummocks on ground water discharge area
D Tall herb fen on flooded area and semi-permanent standing water
(b)
Legend C Great tussock sedge hummocks on ground water
discharge area
Cbis Meadowsweet stand and humid tall herb fen on seepage around G. W. discharge area
Β Acid purple moorgrass meadow on G. W. recharge area and run off
Figure 5.6 Relationships between topography, hydrodynamics and zonation of different humid grasslands: (a) Bradford Mill: (b) Kismeldon

Plant communities and habitat maintenance
In terms of ecological functions, habitat maintenance refers to conservation of species and community diversity. Individual plants and their assemblages arc responsible for faunal diversity by providing the structure of their habitat and food web support. In consequence, one of lhe most important biotic wetland functions is the sustainability of its biodiversity. This study does nol attempt to answer such questions as why the site is important biologically or what size of area is important to maintain biological interest. Rather the comparison of sites and of plant communities, enables factors or functions to be identified which could conserve, reduce or increase plant diversity. Results can be analysed at community or at landscape level.
Community level Comments here refer only to herbaceous plant communities. Al the Torridge site, five vegetation unils were found, one type of mesic grassland and four humid and wet grasslands. These two categories arc linked to topsoil hydrodynamics. Within humid grasslands, the main ecological factor is the trophic level in terms of availability of nutrients, especially nitrogen and phosphorus. Biodiversity, in terms of average number of species by releve, is highesl for the lowest end of the trophic gradient (Fig. 5.7a). This relationship is confirmed by data from the humid haymeadows of the Shannon callows (Fig. 5.7b).
At the Loire-Allier site, two main grasslands were described on the most elevated part of the floodplain called "lit majeur". Differences between the two grasslands arc due to the difference of soil texture which controls water retention. On sandy soils (of the Loire subsite), the vegetation is a xero-mesic grassland with higher biodiversity in comparison with the Allier subsite where mesic grassland is developed on more silty soils (Fig. 5.7c) of higher available water capacity.
The highest biodiversity within these grasslands is linked to the maximum slrcss in terms of low availability of nutrients and/or waler during the growing season. Alternatively high diversity of plains within grassland communities can be linked to anthropogenic disturbances, like mowing and grazing; grazing has the twin effects of removal of biomass and trampling of soil and plants. Maximum biodiversity is linked with low to moderate human disturbances, such as intensive grazing on mesic grasslands and less intensive grazing on humid grasslands (Fig. 5.7d).
Landscape level Within RMWs, individual HGMUs are defined as areas of homogeneous geomorphology, hydrology, hydrogeology and under normal conditions homogeneous soil. If no human impaci occurs, lhe vegetation may well be a single community unit in each HGMU. But in temperate or semi-arid climates, the vegetation is modified by human activity, past and present; so, in each HGMU, even if the potential vegetation is the same, the present vegetation is diverse in response to human impacts. At the Allier subsite. Fig. 4.88 shows the diversity of plant communities within the HGMU "lit majeur" and the relationships between anthropogenic effects and natural dynamics. At this level, the main ecological factor which controls biodiversity of the ecosystem is human impaci.
In most cases competition reduces the niche opportunities for non-competitors within plani communilics. According to Grime (1979) stress factors reduce the vitality of competitors, in space and time, enabling most species to coexist. This is illustrated by the fact that highest biodiversity is found in xero-mesic grasslands at the Loire subsite and in oligotrophic communities of heath rush meadow and acid purple moor-grass at the Kismeldon subsite.
Grime (1979) also indicates that human activity in land management, through grazing, cutting or trampling, reduces the biomass of plants; this also prevents dominance by competitive species reducing biodiversity.
In summary, the most effective sustainability of wetlands with high biodiversity of habitats is achieved at an intermediate level of moderate and low impact of human activity in space and in lime (Fig. 5.8). Without management or disturbance, competitors dominate the space and other species become excluded, a scenario found mainly in eutrophic habitats. In oligotrophic habitats, there is a reduced rale of decrease of biodiversity; the few dominant species continue to be accompanied by most of the other species which can continue to coexist but at a lower level of abundance.
350 -
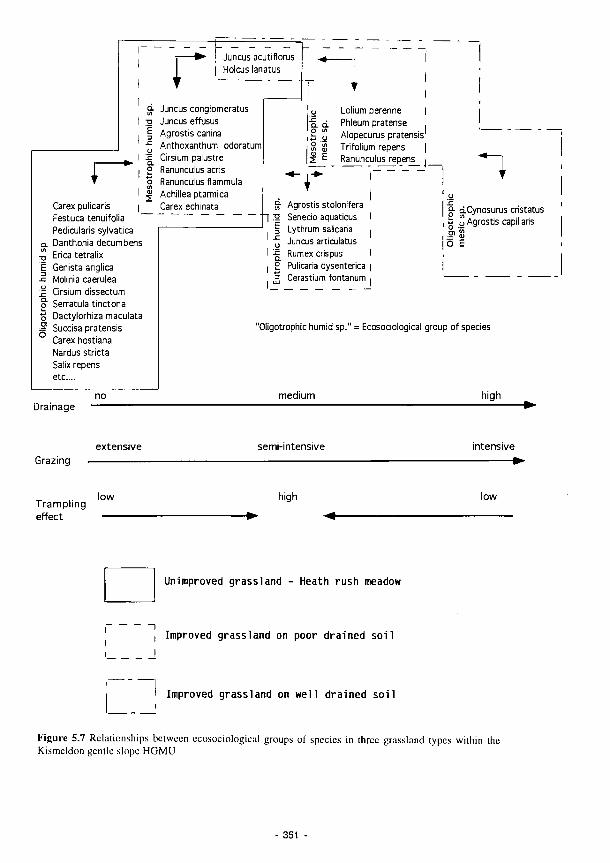
Γ ! Juncus acutiflorus
I Holcus lanatus
Carex pulicaris
Festuca tenuifolia
Pedicularis sylvatica
Danthonia decumbens
Erica tetralix
Genista anglica
Molinia caerulea
Cirsium dissectum
Serratula tinctoria
Dactylorhiza maculata
Succisa pratensis
Carex hostiana
Nardus stricta
Salix repens
etc....
Juncus conglomeratus
Juncus effusus
Agrostis canina
Anthoxanthum odoratum
Cirsium palustre
Ranunculus acris
Ranunculus flammula
Achillea ptarmica
Carex echinata
no Drainage
ut tu OJ C ■sr t
Lolium perenne
Phleum pratense
Alopecurus pratensis
Trifolium repens
Ranunculus repens
'1
Q. (fl
l
-C
0 f-i 3
UJ
- r
Agrostis stolonifera
Senecio aquaticus I
Lythrum salicaria ,
Juncus articulatus
Rumex crispus 1
Pulicaria dysenterica |
Cerastium fontanum ,
Π g- cLCynosurus cristatus
fc o Agrostis capillaris
o E
"Oligotrophic humid sp." = Ecosociological group of species
medium high
Grazing
extensive semi-intensive intensive
Trampl ing
effect
low high low
Unimproved grassland - Heath rush meadow
~i Improved grassland on poor drained soil
Improved grassland on well drained soil
Figure 5.7 Relationships between ecosociological groups of species in three grassland types within the Kismeldon gentle slope HGMU
351
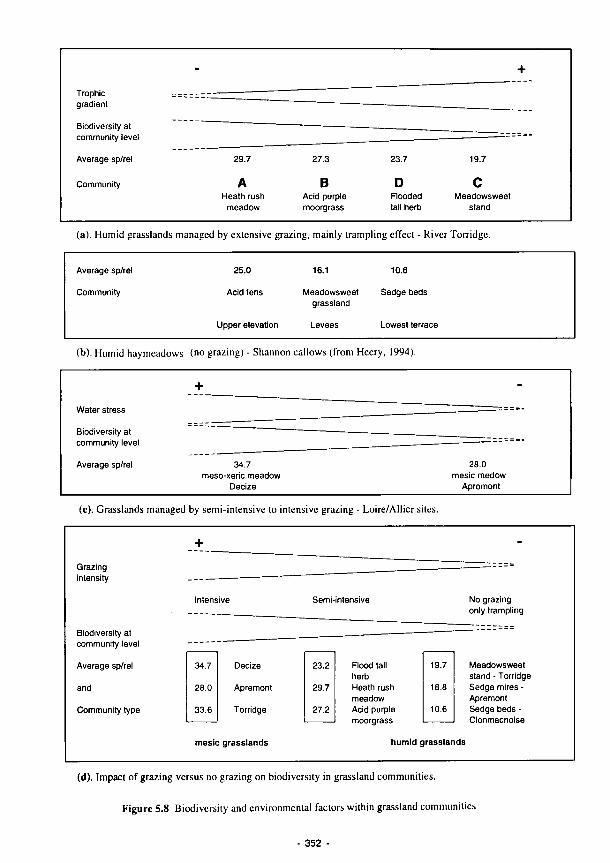
Trophic
gradient
Biodiversity at
community level
Average sp/rel
Community
29.7
A Healh rush
meadow
27.3
Β Acid purple
moorgrass
23.7
D Flooded
tall herb
19.7
C Meadowsweet
stand
(a). Humid grasslands managed by extensive grazing, mainly trampling effect River Torridge.
Average sp/rel
Community
25.0
Acid fens
Upper elevation
16.1
Meadowsweet
grassland
Levees
10.6
Sedge beds
Lowest terrace
(b). Humid haymeadows (no grazing) Shannon callows (from Hecry, 1994).
Water stress
Biodiversity at
community level
Average sp/rel
+
34.7
mesoxeric meadow
Decize
. z —=—
28.0
mesic medow
Apremont
(c). Grasslands managed by semiintensive to intensive grazing Loire/Allier sites.
Grazing
intensity
Biodiversity at
community level
Average sp/rel
and
Community type
+
Intens ive
34.7
28.0
33.6
mesh
Decize
Apremont
Torridge
: grasslands
Semiintensive
23.2
29.7
27.2
Flood tall
herb
Heath rush
meadow
Acid purple
moorgrass
humid ç
19.7
18.8
10.6
rasslar
No grazing
only trampling
Meadowsweet
stand Torridge
Sedge mires
Apremont
Sedge beds
Clonmacnoise
ds
(d). Impact of grazing versus no grazing on biodiversity in grassland communities.
Figure 5.8 Biodiversity and environmental factors within grassland communities
352

Diversity J ι Index
Diversity 11 Index
+ /
/ I
Intensive Moderate
oligotrophic habitat
Ν Disturbance
Low No Disturbance
Figure 5.9 Relationship between biodiversity and degree of anthropogenic impacts
353
Apart from human impacts there are other factors which can enhance biodiversity: natural disturbances such as fallen trees resulting from the effects of wind or flood which create or maintain open habitats, whilst high stress results in the most oligotrophic habitats such as raised bogs. The scale of disturbance can also be an important factor for biodiversity. Local impacts can create patches or microhabitals in which other species and plant communities can themselves develop, for example locations where wet annual plant communities develop in disturbed areas such as cattle tracks or gateways.
Plant communities as bioindicators of environmental conditions
Table 5.2 is a provisional attempt at relating wetland plant communities to certain functions, processes and environmental conditions. The data within the table refer to freshwater lowland wetlands (saline or brackish) in western Europe, with Mediterranean and semi-arid wetlands and mountain wetlands being excluded.
The community types refer to the CORINE biotopc manual (Devillcrs el at., 1991). However due to observed operational difficulties in identification of the biolopcs, species, dominants and co-dominants arc-also listed. The level of disturbance is defined with reference to plant survival responses: Very high D: All individuals of the population and the community cannot survive as individuals, hul
could survive as diaspores. High D: Only a few individuals could survive and rcsprout within the habitat following
disturbance. Moderate D: Many of the individuals survive but their vegetative and reproductive biomass is
diminished below optimum, resulting in reduced competitiveness. Low D or no D: Individuals survive, grow and produce seeds or diaspores in relation to stress or with
competition-dominance impacts.
Disturbance described in Table 5.2 could be natural (flooding, storm damage) or anthropogenic (grazing, trampling, burning, cutting, clearing, etc.). The soil and water characteristics refer only to the major, or determinate, characteristic in relation to the associated hydrological regime, e.g. eutrophic versus oligotrophic. The hydrological regimes include streams and permanent water bodies (e.g. oxbow lakes) that arc not river marginal in the strictest sense, and semi-permanent standing waters that can accumulale in floodplain depressions and at the fringes of lakes and ponds, bul not rivers. Springs arc not included here.
Within a predictive scheme for river marginal wcllands it is possible to inlcrpret lhe hydrological controls, and hence derive an insight into the functions being performed, from an assessment of lhe vegetation community type, or dominant species, occurring at a site. The knowledge produced from ibis method can be used in isolation within the functional assessment procedures, or incorporated inlo il to help verify and validate other findings or investigations.
5.4.4 Vegetation as a bioindicator of perturbation and wetland functions
The plant survival stralegy analysis, based on Grime's (1979) theory, was adopted to permit comparisons between any set of vegetation found in any ecosystem including RMWs. allowing for linkages between plant characteristics (or state variables) and wetland functions to be established.
The "competitiveness" (C score) of a plant population can be defined by calculating the community strategy scores (Competitive ability of the Functional Vegetation Type, CFVT, and lhe Stress tolerance of the Functional Vegetation Type, SFVT) derived from the mean competitiveness (C) and stress (S) scores of the constituent species. Statistical analysis has shown that a significant negative correlation exists between CFVT and SFVT. These results have been verified by glasshouse experiments. Field experiments have shown that lhe CFVT changed in lhe direction predicted by the strategy model as a result of imposed perturbations. This result has allowed CFVT to be taken as the basis for the calculation of an index of perturbation effect to which river marginal wetland vegetation is sensitive. This perturbation index is calculated as the inverse of the CFVT (x 100). Calculation of the perturbation index allows the vegetation community of an HGMU to be placed in a pre-defined Perturbation Band (PB), numbered I - V on a scale of increasing disturbance (Table 5.3), indicating the degree of perturbation of the HGMU.
354
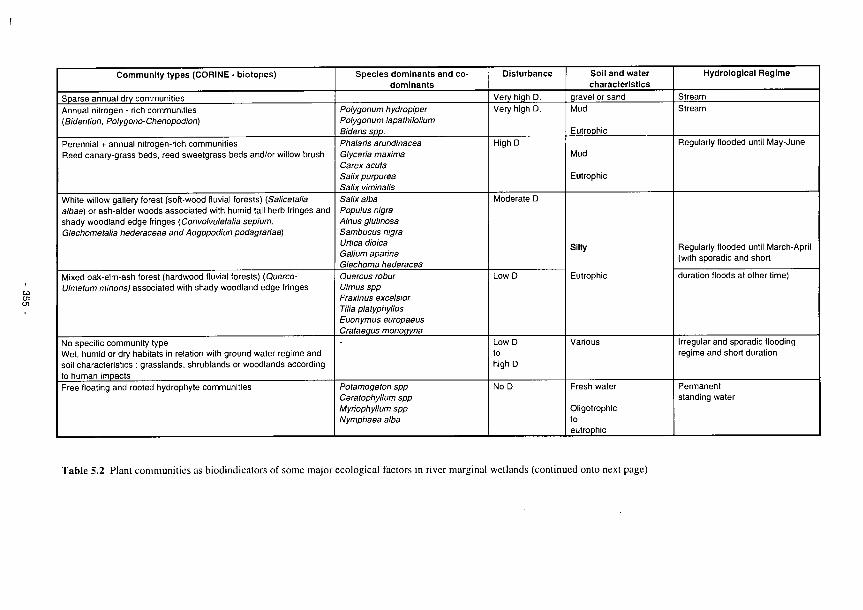
Community types (CORINE - biotopes)
Sparse annual dry communities Annual nitrogen - rich communities (Bidention, Polygono-Chenopodion)
Perennial + annual nitrogen-rich communities Reed canary-grass beds, reed sweetgrass beds and/or willow brush
White willow gallery forest (soft-wood fluvial forests) (Salicetalia albae) or ash-alder woods associated with humid tall herb fringes and shady woodland edge fringes (Convolvuletalia sepium, Glechometalia hederaceae and Aegopodiun podagrariae)
Mixed oak-elm-ash forest (hardwood fluvial forests) (Ouerco-Ulmetum minoris) associated with shady woodland edge fringes
No specific community type Wet, humid or dry habitats in relation with ground water regime and soil characteristics : grasslands, shrublands or woodlands according to human impacts Free floating and rooted hydrophyte communities
Species dominants and co-domlnants
Polygonum hydropiper Polygonum lapathifolium Bidens spp. Phalaris arundinacea Glyceria maxima Carex acula Salix purpurea Salix viminalis Salix alba Populus nigra Alnus glutinosa Sambucus nigra Urtica dioica Galium aparine Glechoma hederacea Quercus robur Ulmus spp Fraxinus excelsior Tilia platyphyllos Euonymus europaeus Crataegus monogyna
Potamogetón spp Ceratophyllum spp Myriophyllum spp Nymphaea alba
Disturbance
Very high D. Very high D.
High D
Moderate D
Low D
Low D to high D
No D
Soil and water characteristics
gravel or sand Mud
Eutrophic
Mud
Eutrophic
Silty
Eutrophic
Various
Fresh water
Oligotrophic to eutrophic
Hydrological Regime
Stream Stream
Regularly flooded until May-June
Regularly flooded until March-April (with sporadic and short
duration floods at other time)
Irregular and sporadic flooding regime and short duration
Permanent standing water
Table 5.2 Plant communities as biodindicators of some major ecological factors in river marginal wetlands (continued onto next page)
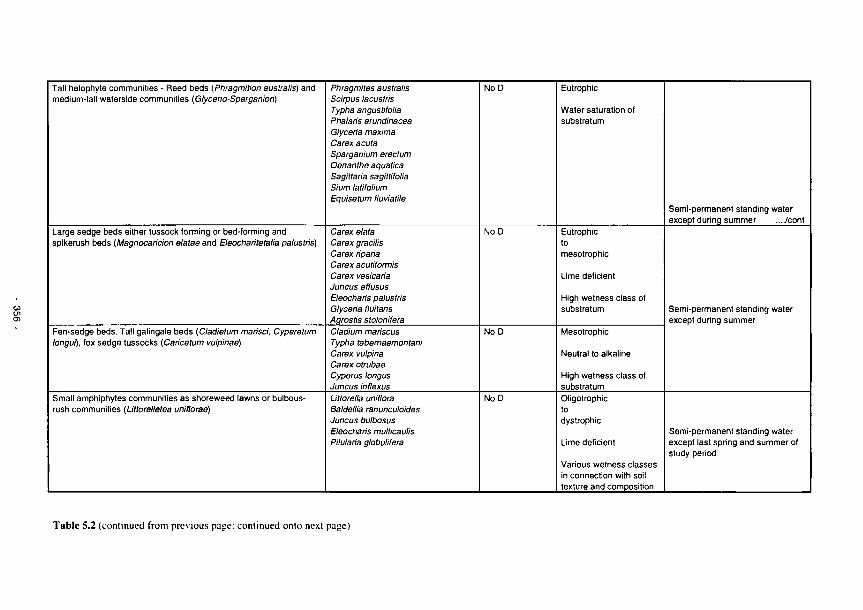
Tall helophyte communities - Reed beds (Phragmition australis) and medium-tall waterside communities (Glycerio-Sparganion)
Large sedge beds either tussock forming or bed-forming and spikerush beds (Magnocaricion elatae and Eleocharitetalia palustris)
Fen-sedge beds. Tall galingale beds (Cladietum marisci, Cyperetum longui), fox sedge tussocks (Caricetum vulpinae)
Small amphiphytes communities as shoreweed lawns or bulbous-rush communities (Littorelletea uniñorae)
Phragmites australis Scirpus lacustris Typha angustifolia Phalaris arundinacea Glyceria maxima Carex acuta Sparganium erectum Oenanthe aquatica Sagittaria sagittilolia Stum latifolium Equisetum fluviatile
Carex elata Carex gracilis Carex riparia Carex acutiformis Carex vesicaria Juncus effusus Eleocharis palustris Glyceria fluitans Aqrostis stolonifera Cladium mariscus Typha tabemaemontani Carex vulpina Carex otrubae Cyperus longus Juncus inflexus Littorella uniflora Baldellia ranunculoides Juncus bulbosus Eleocharis multicaulis Pilularia globulifera
No D
No D
No D
No D
Eutrophic
Water saturation of substratum
Eutrophic to mesotrophic
Lime deficient
High wetness class of substratum
Mesotrophic
Neutral to alkaline
High wetness class of substratum Oligotrophic to dystrophic
Lime deficient
Various wetness classes in connection with soil texture and composition
Semi-permanent standing water except durinq summer ..../cont
Semi-permanent standing water except during summer
Semi-permanent standing water except last spring and summer of study period
Table 5.2 (continued from previous page; continued onto next page)

Sedge ash-alder woods and tall herb ash alder woods
Meadowsweet stands (Filipendulion uimaria) and eutrophic humid grasslands (Calthion palustris. Bromion racemosi)
Swamp alder woods (Alnion glulinosae) and mire willow scrubs (Salicion cinéreas)
Tall rush pastures and floods swards (Agropyro-Rumicion crispí)
Alnus glutinosa Fraxinus excelsior Carex remota Solanum dulcamara Calystegia sepium Carex pendula Filipendula ulmaria Achillea ptarmica Deschampsia caespitosa Valeriana officinalis Angelica sylvestris Senecio aquaticus Caltha palustris Alnus glutinosa Osmunda regalis Carex elongata Carex paniculata Carex laevigata Salix atrocinerea Salix cinerea Athyrium lilix-femina
Juncus acutiflorus Juncus effusus Juncus articulatus Ranunculus repens Lotus uliginosus Rumex crispus Aqrostis stolonifera
No D to Low D
Moderate D
No D
to
Low D
Moderate D
Meso-eutrophic
High wetness class of soil
Oxygenated water
Mesodystrophic
High wetness class of soil
Oxygenated water
Submerged top soil during winter and early spring maximum or Ground water discharge area and seepage area
...Vcont
Submerged topsoil during winter and early spring maximum
or groundwater discharge area and seepage area
Table 5.2 (continued from previous page; continued onto next page)
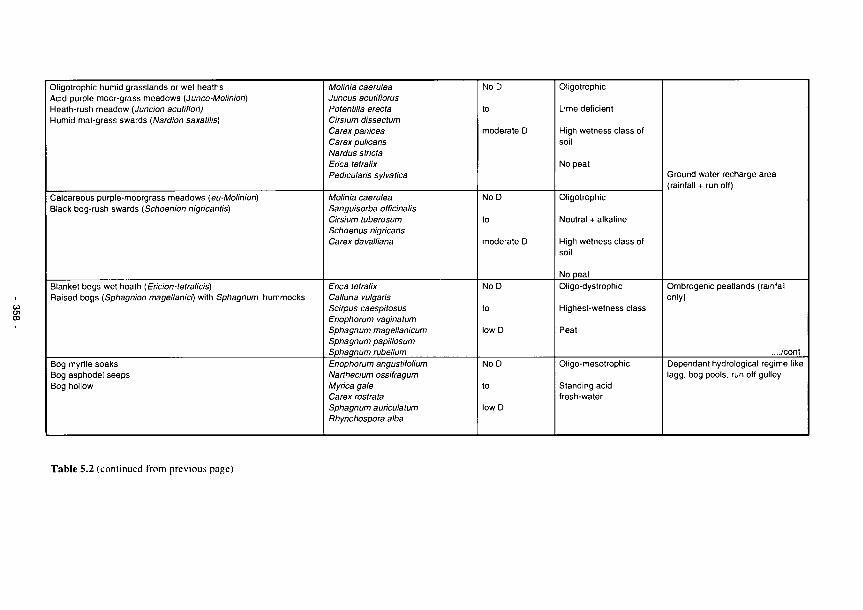
Oligotrophic humid grasslands or wet heaths Acid purple moor-grass meadows (Junco-Molinion) Heath-rush meadow (Junción acutiflori) Humid mat-grass swards (Nardion saxatilis)
Calcareous purple-moorgrass meadows (eu-Molinion) Black bog-rush swards (Schoenion nigricantis)
Blanket bogs wet heath (Ericion-tetralicis) Raised bogs (Sphagnion magellanici) wilh Sphagnum hummocks
Bog myrtle soaks Bog asphodel seeps Bog hollow
Molinia caerulea Juncus acutiflorus Potentina erecta Cirsium dissectum Carex panicea Carex pulicaris Nardus strida Erica tetralix Pedicularis sylvatica
Molinia caerulea Sanguisorba officinalis Cirsium tuberosum Schoenus nigricans Carex davalliana
Erica tetralix Calluna vulgaris Scirpus caespitosus Eriophorum vaginatum Sphagnum magellanicum Sphagnum papillosum Sphaqnum rubellum Eriophorum angustifolium Narthecium ossifragum Myrica gale Carex rostrata Sphagnum auriculatum Rhynchospora alba
No D
to
moderate D
No D
to
moderate D
No D
to
low D
No D
to
low D
Oligotrophic
Lime deficient
High wetness class of soil
No peat
Oligotrophic
Neutral + alkaline
High wetness class of soil
No peat Oligo-dystrophic
Highest-wetness class
Peat
Oligo-mesotrophic
Standing acid fresh-water
Ground water recharge area (rainfall + run off)
Ombrogenic peatlands (rainfall only)
..../cont Dependant hydrological regime like lagg. bog pools, run off gulley.
Table 5.2 (continued from previous page)

Given knowledge of the existing PB status of an HGMU, the effect of likely change in perturbation on the vegetation can be predicted. This in turn can be related to the total impact of the change in perturbation on wetland functioning. Total impact may be calculated as the sum of the impacts (on a scale 0 - 2) on individual functions. Table 5.3 is a tentative attempt to relate the perturbation bands to predictions of wetland functions. Much of this work is at the developmental stage and will be advanced further in Phase II of the project.
Perturbation Band (PB) of
HGMU vegetation
1 II III IV V
Confidence in PB as predictor of function value
Function Biogeochemical
2.1b N removal by plants
MED-HIGH MED-HIGH
MED MED-LOW
LOW
MOD
2.2c Plant uptake of N 2.2d Plant uptake of Ρ
MED-HIGH MED-HIGH
MED MED-LOW
LOW
POOR
Ecological 3.1a Maintains habitat structure
HIGH HIGH HIGH MED LOW
GOOD
3.2a Biomass production
HIGH MED-HIGH
MED MED-LOW
LOW
GOOD
3.2b Biomass export downstream via water course 3.2c Biomass export through harvesting
MED MED MED
MED-LOW MED-LOW
POOR
Table 5.3 Perturbation bands as predictors of wetland functions
5.4.5 Assessment of Phragmites australis as a predictor of habitat stress
Phragmites australis was used to study the effects of water stress brought about by the impact of desiccation-salinisation. This helophytc occurs widely on La Mancha floodplains and on a wide range of inland and coastal wetlands in Spain. Because of its wide distribution it could be used as a predictor of functioning in wetlands affected by water stress.
The performance of reed stands
Reed performance would seem to offer a reliable and robust approach to the study of stress and perturbation in a semi-arid environment. However, reed performance can be modified by a variety of perturbations. Fires consumed the above ground biomass of stations MASE1 and MASE2 in spring of 1992, and MASE3 and MASE4 in spring of 1993. It is not possible to relate any changes in subsequent regeneration to lhe individual effects of either fire or water stress.
In agreement with the findings of Van der Toorn and Mook (1982), the severe burning occurring in El Masegar led to an increase in reed shoot density, although the new shoots were thinner. Increases in density seem to be also a strategy to counteract water stress. Increasing density is accompanied by a decrease in the height, as a means of maintaining biomass production when growth is reduced due to adverse conditions of moisture and salinity. The height continues to decrease under conditions of increasing water stress, and the previously monospecific stand becomes invaded by other species. The result is a lower cover plant, due to the reduced size of shools, although the density can remain high. Reed shoot density is highest in monospecific communities due to the absence of other species, resulting in an anomalous relationship between density and water stress levels. In extreme states of desiccation and salinisation, flower head production of Phragmites stops and new individuals continue to decline in size until their disappearance. Rccd shoots had a xeromorphic aspect in MOLI2, with dwarf sterile shoots and lough leal'blades.
Fig. 5.10 is a diagnostic key of reed status in the sludy area, produced using data collected during investigations. A simple measurement of the rccd height combined with obscrvalions on the stand density and floration percentage can provide a quick assessment of the condition and degree of water stress experienced by the rccd
359
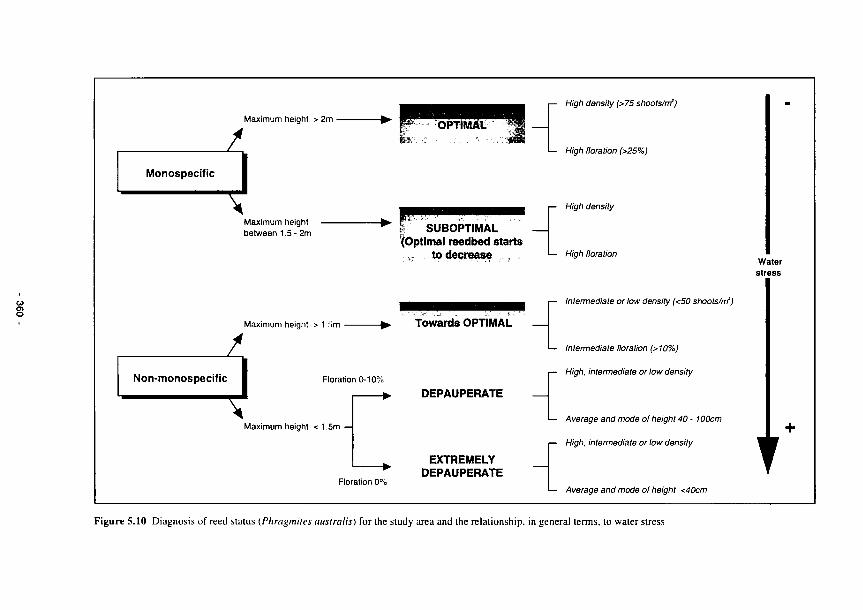
/
Maximum height > 2m ·
Monospecific
\
ι— High density (>75 shoots/rrf)
1— High floration (>25%)
Maximum height between 1.5- 2m
-► SUBOPTIMAL
(Optimal reedbed starts to decrease
r— High density
— High floration Water stress
— Intermediate or low density (<50 shoots/nf)
JL Maximum height > 1 urn *► Towards OPTIMAL
Non-monospecific Floration 0-10%
\ Maximum height < 1,5m —
-► DEPAUPERATE —
Floration 0°'
EXTREMELY DEPAUPERATE
Intermediate floration (>10%)
High, intermediate or low density
Average and mode of height 40 - 100cm
High, intermediate or low density
— Average and mode of height <40cm
1 Figure 5.10 Diagnosis of reed status (Phragmites australis) for the study area and the relationship, in general terms, to water stress
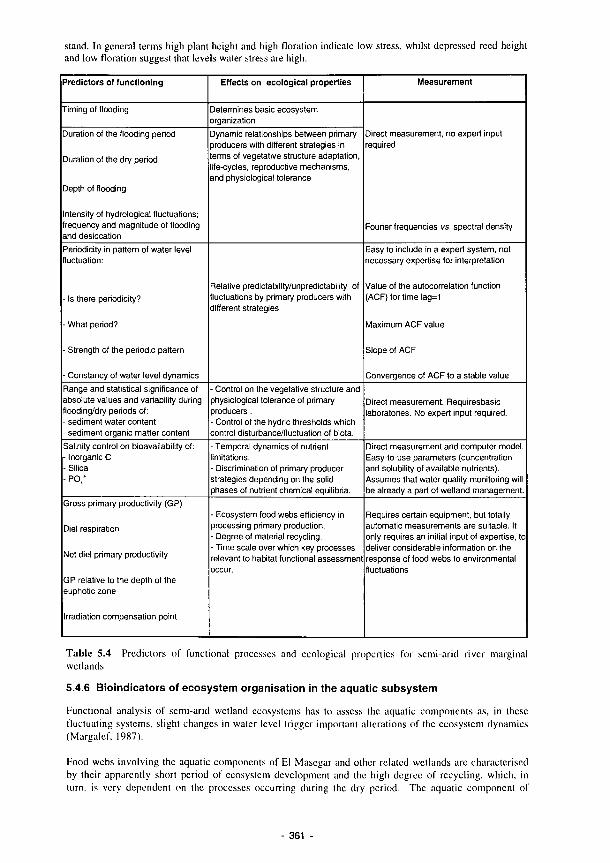
stand. In general terms high plant height and high floration indicate low stress, whilst depressed reed height and low floration suggest that levels water stress are high.
Predictors of functioning
Timing of flooding
Duration of the flooding period
Duration of the dry period
Depth of flooding
Intensity of hydrological fluctuations; frequency and magnitude of flooding and desiccation
Periodicity in pattern of water level fluctuation:
- Is there periodicity?
- What period?
- Strength of the periodic pattern
- Constancy of water level dynamics
Range and statistical significance of absolute values and variability during flooding/dry periods of: - sediment water content - sediment organic matter content
Salinity control on bioavailability of: - Inorganic C - Silica -PO, 1
Gross primary productivity (GP)
Diel respiration
Net diel primary productivity
GP relative to the depth of the euphotic zone
Irradiation compensation point
Effects on ecological properties
Determines basic ecosystem organization
Dynamic relationships between primary producers with different strategies in terms of vegetative structure adaptation, life-cycles, reproductive mechanisms, and physiological tolerance
Relative predictability/unpredictability of fluctuations by primary producers with different strategies
- Control on the vegetative structure and physiological tolerance of primary producers. - Control of the hydric thresholds which control disturbance/fluctuation of biota.
- Temporal dynamics of nutrient limitations. - Discrimination of primary producer strategies depending on the solid phases of nutrient chemical equilibria.
- Ecosystem food webs efficiency in processing primary production. - Degree of material recycling. - Time scale over which key processes relevant to habitat functional assessment occur.
Measurement
Direct measurement, no expert input required
Fourier frequencies vs. spectral density
Easy to include in a expert system, not necessary expertise for interpretation
Value of the autocorrelation function (ACF) for time lag=1
Maximum ACF value
Slope of ACF
Convergence of ACF to a stable value
Direct measurement. Requiresbasic laboratories. No expert input required.
Direct measurement and computer model. Easy-to-use parameters (concentration and solubility of available nutrients). Assumes that water quality monitoring will be already a part of wetland management.
Requires certain equipment, but totally automatic measurements are suitable. It only requires an initial input of expertise, to deliver considerable information on the response of food webs to environmental fluctuations
Table 5.4 Predictors of functional processes and ecological properties for semi-arid river marginal wetlands
5.4.6 Bioindicators of ecosystem organisation in the aquatic subsystem
Functional analysis of semi-arid wetland ecosystems has to assess lhe aquatic components as, in these fluctuating systems, slight changes in water level trigger important alterations of the ecosystem dynamics (Margalcf, 1987).
Food webs involving the aquatic components of El Masegar and other related wetlands arc characterised by their apparently short period of ecosystem development and the high degree of recycling, which, in turn, is very dependent on the processes occurring during the dry period. The aquatic component of
361
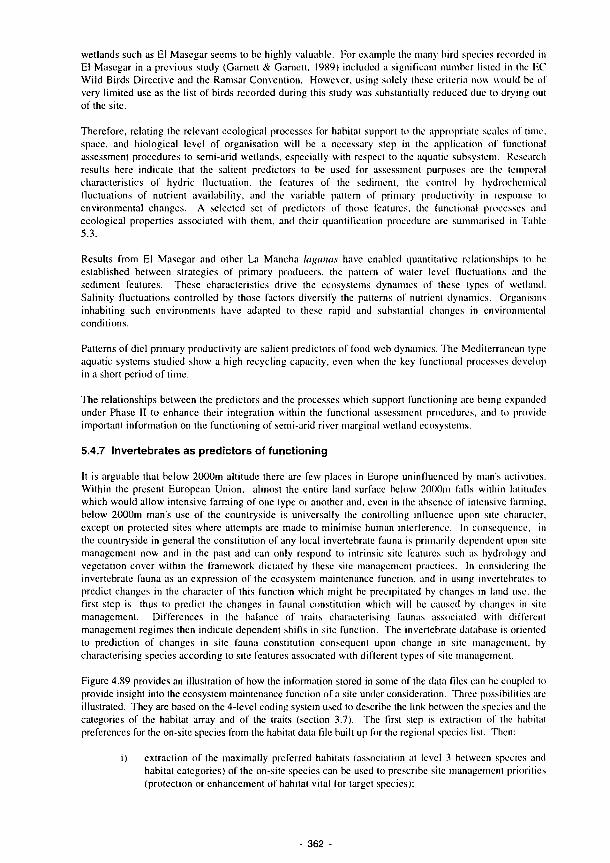
wetlands such as El Masegar seems to be highly valuable. For example the many bird species recorded in El Masegar in a previous study (Garnett & Garnett, 1989) included a significant number listed in the EC Wild Birds Directive and the Ramsar Convention. However, using solely these criteria now would he of very limited use as the list of birds recorded during this study was substantially reduced due to drying oui of the site.
Therefore, relating lhe relevant ecological processes for habitat support to the appropriate scales of time, space, and biological level of organisation will be a necessary step in the application of functional assessment procedures to semi-arid wetlands, especially with respect to the aquatic subsystem. Research results here indicate that the salient predictors to be used for assessment purposes are the temporal characteristics of hydric fluctuation, the features of the sediment, the control by hydrochemical fluctuations of nutrient availability, and the variable pattern of primary productivity in response to environmental changes. A selected set of predictors of those features, the functional processes and ecological properties associated with Ihem, and their quantification procedure are summarised in Table 5.3.
Results from El Masegar and other La Mancha lagunas have enabled quantitative relationships (o he established between strategies of primary producers, the pattern of water level fluctuations and the sediment features. These characteristics drive the ecosystems dynamics of these types of weiland. Salinity fluctuations controlled by those factors diversify the patlcrns of nulricnl dynamics. Organisms inhabiting such environments have adapted to these rapid and substantial changes in environmental conditions.
Patterns of diel primary productivity are salient predictors of food web dynamics. The Mediterranean type-aquatic systems studied show a high recycling capacity, even when the key functional processes develop in a short period of time.
The relationships between the predictors and the processes which support functioning arc being expanded under Phase II to enhance their integration within the functional assessment procedures, and to provide important information on the functioning of semi-arid river marginal wetland ecosystems.
5.4.7 Invertebrates as predictors of functioning
It is arguable that below 2000m altitude there are few places in Europe uninfluenced by man's activities. Within the present European Union, almost the entire land surface below 2000ni falls within latitudes which would allow intensive fanning of one type or another and, even in lhe absence of intensive farming, below 2000m man's use of the countryside is universally the controlling influence upon sile character, except on protected sites where attempts are made to minimise human interference. In consequence, in the countryside in general the constitution of any local invertebrate fauna is primarily dependent upon sile management now and in the past and can only respond to intrinsic site features such as hydrology and vegetation cover within the framework dictated by these site management practices. In considering lhe invertebrate fauna as an expression of the ecosystem maintenance function, and in using invertebrates to predict changes in the character of this function which might be precipitated by changes in land use. the first step is thus to predict the changes in faunal constitution which will be caused by changes in site management. Differences in the balance of trails characterising faunas associated with different management regimes then indicate dependent shifts in site function. The invertebrate database is oriented to prediction of changes in site fauna constitution consequent upon change in sile management, by characterising species according to site features associated with different types of sile management.
Figure 4.89 provides an illustration of how the information stored in some of the data files can be coupled lo provide insight into the ecosystem maintenance function of a site under consideration. Three possibilities arc illustrated. They are based on the 4-level coding system used to describe the link bclwcen the species and the categories of the habitat array and of the traits (section 3.7). The first step is extraction of the habitat preferences for the on-site species from the habitat data file built up for the regional species list. Then:
i) extraction of the maximally preferred habitats (association al level 3 between species and habitat categories) of the on-site species can be used lo prescribe site management priorities (protection or enhancement of habitat vital for target species);
362 -

ii) consideration of the total habitat spectrum of the on-site species (levels 1, 2 and 3 combined) can be used to predict changes which might occur in the faunal assemblages given a specified type of impact on some of the habitats present on-site;
¡ii) comparison of the list of on-site species associated with on-site habitats (species associated with habitat categories at levels 2 and 3), with the list of species predicted to occur (see prediction mechanism in section 4.3.3 - invertebrate data bases and habitat evaluation) in association with those habitats, leads lo assessment of the degree of completeness of the ecosystem maintenance function of the site, expressed as the proportion of the regional species list (species pool for the region) represented for each habitat.
A considerable problem in deciding which species traits to incorporate into a database with the general objectives of that constructed for purposes of the FAEWE project is selection of traits relevant to the issues which require to be addressed. There is little justification for expenditure of the amount of effort and time needed for database construction, if the database produced is useful only in the context of the FAEWE project and the issues it seeks to address. This has been taken into consideration in compiling the invertebrate database. In particular, an attempt has been made to develop a database which can be used in all ecosystems, not just in floodplain situations, and which is not dependent on a narrow interpretation of concepts of "function" for its utility. The codified species characteristics arc perceived as building blocks which can be put together in different combinations in order to respond to questions generated by differing concepts of site function. The trails codified so far are those perceived as being of the most general significance, in terms both of the range of ecosystems in which they may be used and the generalised concepts of site function to which they relate. As a basic working principle, the functional significance of a habitat present on a site is taken to be maximal when its fauna is most complele (degree of completeness being judged by comparison with the regional species pool for the habitat concerned). Differences in representation of traits between the local and regional fauna then help to identify functional differences.
363

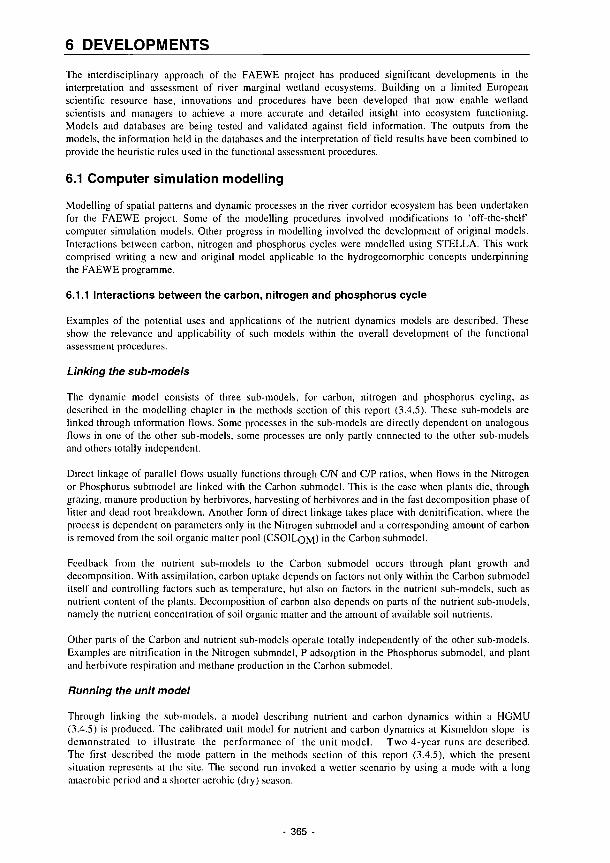
6 DEVELOPMENTS The interdisciplinary approach of the FAEWE project has produced significant developments in the interpretation and assessment of river marginal wetland ecosystems. Building on a limited European scientific resource base, innovations and procedures have been developed that now enable wetland scientists and managers to achieve a more accurate and detailed insight into ecosystem functioning. Models and databases are being tested and validated against field information. The outputs from the models, the information held in the databases and the interpretation of field results have been combined to provide the heuristic rules used in the functional assessment procedures.
6.1 Computer simulation modelling
Modelling of spatial patterns and dynamic processes in the river corridor ecosystem has been undertaken for the FAEWE project. Some of the modelling procedures involved modifications to 'off-the-shelf computer simulation models. Other progress in modelling involved the development of original models. Interactions between carbon, nitrogen and phosphorus cycles were modelled using STELLA. This work comprised writing a new and original model applicable to the hydrogeomorphic concepts underpinning the FAEWE programme.
6.1.1 Interactions between the carbon, nitrogen and phosphorus cycle
Examples of the potential uses and applications of the nutrient dynamics models are described. These show the relevance and applicability of such models within the overall development of the functional assessment procedures.
Linking the sub-models
The dynamic model consists of three sub-models, for carbon, nitrogen and phosphorus cycling, as described in the modelling chapter in the methods section of this report (3.4.5). These sub-models are linked through information flows. Some processes in the sub-models are directly dependent on analogous flows in one of the other sub-models, some processes are only partly connected to the other sub-models and others totally independent.
Direct linkage of parallel flows usually functions through C/N and C/P ratios, when flows in the Nitrogen or Phosphorus submodel are linked with the Carbon submodel. This is the case when plants die, through grazing, manure production by herbivores, harvesting of herbivores and in the fast decomposition phase of litter and dead root breakdown. Another form of direct linkage takes place with denitrification, where the process is dependent on parameters only in the Nitrogen submodel and a corresponding amount of carbon is removed from the soil organic matter pool (CSOILoM) ' n t n e Carbon submodel.
Feedback from the nutrient sub-models to the Carbon submodel occurs through plant growth and decomposition. With assimilation, carbon uptake depends on factors not only within the Carbon submodel itself and controlling factors such as temperature, but also on factors in the nutrient sub-models, such as nutrient content of the plants. Decomposition of carbon also depends on parts of the nutrient sub-models, namely the nutrient concentration of soil organic matter and the amount of available soil nutrients.
Other parts of the Carbon and nutrienl sub-models operate totally independently of the other sub-models. Examples are nitrification in the Nitrogen submodel, Ρ adsorption in the Phosphorus submodel, and plant and herbivore respiration and methane production in the Carbon submodel.
Running the unit model
Through linking the sub-models, a model describing nutrient and carbon dynamics within a HGMU (3.4.5) is produced. The calibrated unit model for nutrient and carbon dynamics at Kismeldon slope is demonstrated to illustrate the performance of the unit model. Two 4-year runs are described. The first described the mode pattern in the methods section of this report (3.4.5), which the present situation represents at the site. The second run invoked a wetter scenario by using a mode with a long anaerobic period and a shorter aerobic (dry) season.
365 -
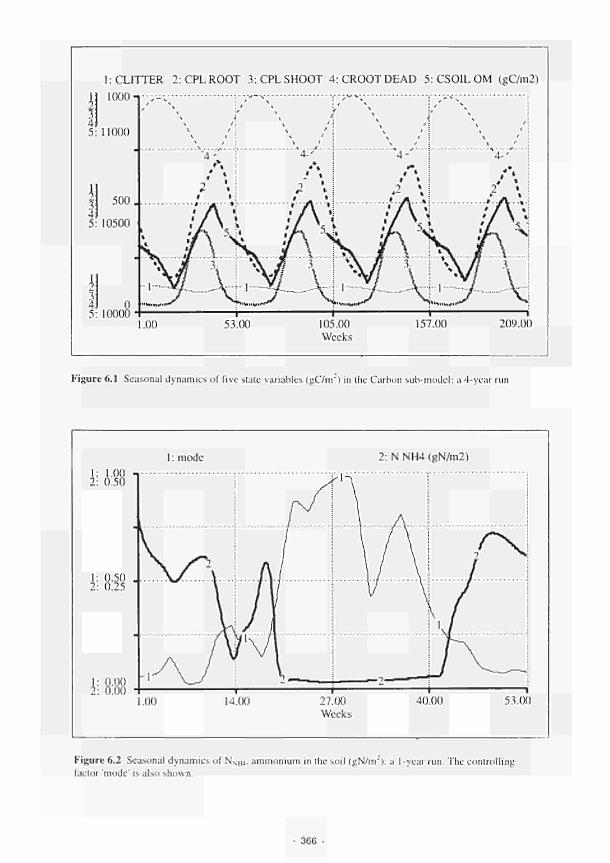
1:CLITTER 2:CPLR00T 3:CPLSH00T 4:CR00TDEAD 5:CS0IL0M (gC/m2) 1000'
1.00 53.00 105.00 Weeks
157.00 209.00
Figure 6.1 Seasonal dynamics of five state variables (gC/m2) in the Carbon sub-model: a 4-year run
1: 1.0C 2: 0.5C
1 : mode 2: N NH4 (gN/ni2)
27.00 Weeks
40.00 53.00
Figure 6.2 Seasonal dynamics of NNH4, ammonium in the soil (gN/m2): a 1-year run. The controlling factor 'mode' is also shown.
366
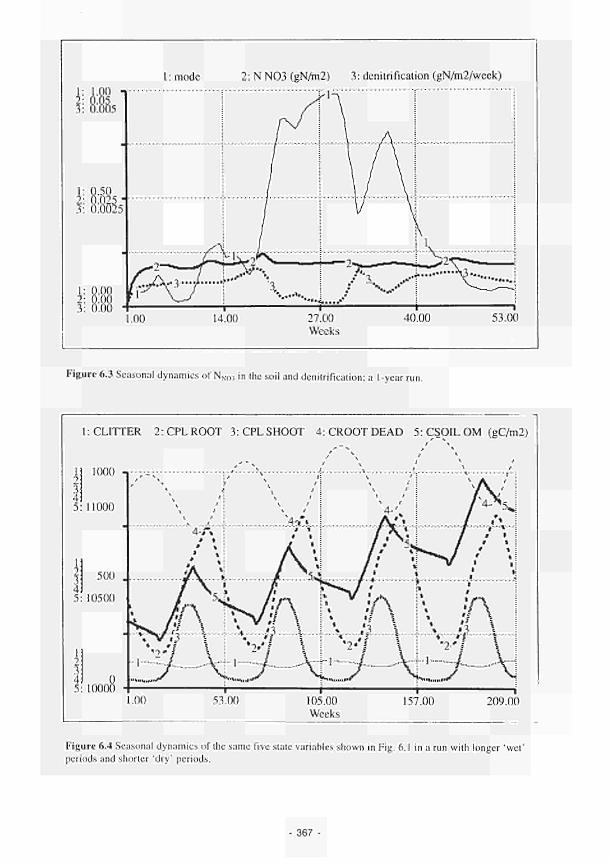
1 : mode 2: N N03 (gN/m.2) 3: denitrification (gN/m2/week)
1.00 14.00 27.00 Weeks
40.00 53.00
Figure 6.3 Seasonal dynamics of NN0- in the soil and denitrification; a 1-year run.
1 : CUTTER 2: CPL ROOT 3: CPL SHOOT 4: CROOT DEAD 5: CSOIL OM (gC/m2)
100 00
>s/·^ \ \ %■.·.:..# A··.·.·.·; Λ '} \ \ *v-/2 Y
i-'9 V|-i-*V \4i 1_JH-I4 Vj
1.00 53.00 105.00 Wecks
157.00 1
209.00
Figure 6.4 Seasonal dynamics of the same five state variables shown in Fig. 6.1 in a run with longer 'wet' periods and shorter 'dry' periods.
367
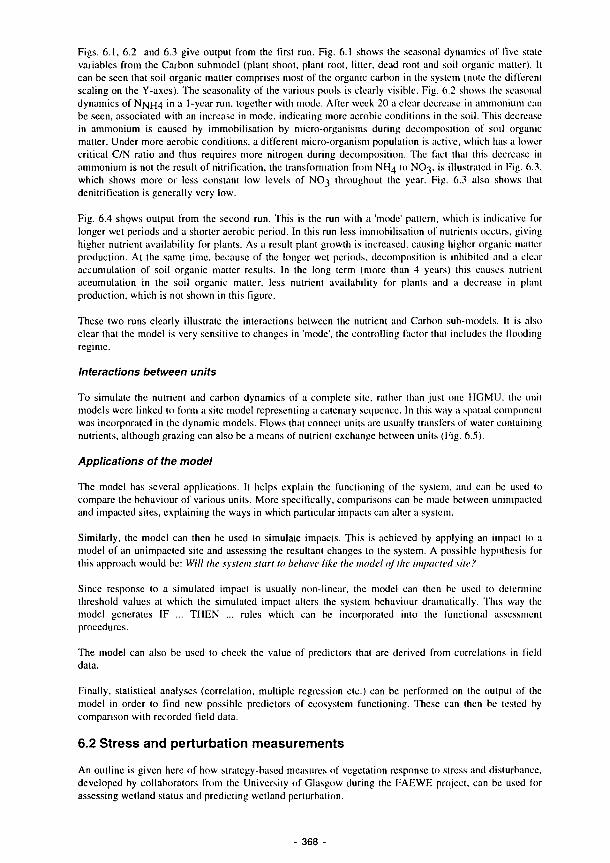
Figs. 6.1, 6.2 and 6.3 give output from the first run. Fig. 6.1 shows the seasonal dynamics of live stale-variables from the Carbon submodel (plant shoot, plant root, litter, dead root and soil organic matter). It can be seen that soil organic matter comprises most of the organic carbon in the system (note lhe different scaling on the Y-axes). The seasonality of the various pools is clearly visible. Fig. 6.2 shows the seasonal dynamics of N*\¡*-¡4 ' n a 1-year run, together with mode. After week 20 a clear decrease in ammonium can be seen, associated with an increase in mode, indicating more aerobic conditions in the soil. This decrease in ammonium is caused by immobilisation by micro-organisms during decomposition of soil organic matter. Under more aerobic conditions, a different micro-organism population is active, which has a lower critical C/N ratio and thus requires more nitrogen during decomposition. The fact that this decrease in ammonium is nol the result of nitrification, the transformation from NH4 to NO3. is illustrated in Fig. 6.3, which shows more or less constant low levels of NO3 throughout the year. Fig. 6.3 also shows that denitrification is generally very low.
Fig. 6.4 shows output from the second run. This is the run with a 'mode' paltern, which is indicative for longer wet periods and a shorter aerobic period. In this run less immobilisation of nutrients occurs, giving higher nutrient availability for plants. As a result plant growth is increased, causing higher organic mailer production. At the same time, because of the longer wet periods, decomposition is inhibited and a clear accumulation of soil organic matter results. In the long term (more than 4 years) this causes nutrienl accumulation in the soil organic matter, less nutrient availability for plants and a decrease in plant production, which is not shown in this figure.
These two runs clearly illustrate the interactions between the nutrient and Carbon sub-models. It is also clear that the model is very sensitive to changes in 'mode', the controlling factor that includes (lie Hooding regime.
Interactions between units
To simulate lhe nutrient and carbon dynamics of a complete site, rallier than just one HGMU, the unit models were linked to form a site model represcnling a catenary sequence. In this way a spatial component was incorporated in the dynamic models. Flows that connect units arc usually transfers of water containing nutrients, although grazing can also be a means of nutrient exchange between units (Fig. 6.5).
Applications of the model
The model has several applications. It helps explain the functioning of the system, and can he used to compare the behaviour of various units. More specifically, comparisons can be made between unimpacted and impacted sites, explaining the ways in which particular impacts can alter a system.
Similarly, the model can then be used to simulate impacts. This is achieved by applying an impact to a model of an unimpacted site and assessing the resultant changes to lhe system. A possible hypothesis for this approach would be: Will the system start to behave like the model of the impacted site.'
Since response to a simulated impact is usually non-linear, the model can then be used to determine threshold values at which the simulated impact alters lhe system behaviour dramatically. This way the model generates IF ... THEN ... rules which can be incorporated into the functional assessment procedures.
The model can also be used to check the value of predictors that are derived from correlations in field data.
Finally, statistical analyses (correlation, multiple regression etc.) can be performed on the outpul of the model in order to find new possible predictors of ecosystem functioning. These can then be tested by comparison with recorded field data.
6.2 Stress and perturbation measurements
An outline is given here of how strategy-based measures of vegetation response to stress and disturbance, developed by collaborators from the University of Glasgow during the FAEWE project, can be used for assessing wetland status and predicting wetland perturbation.
368
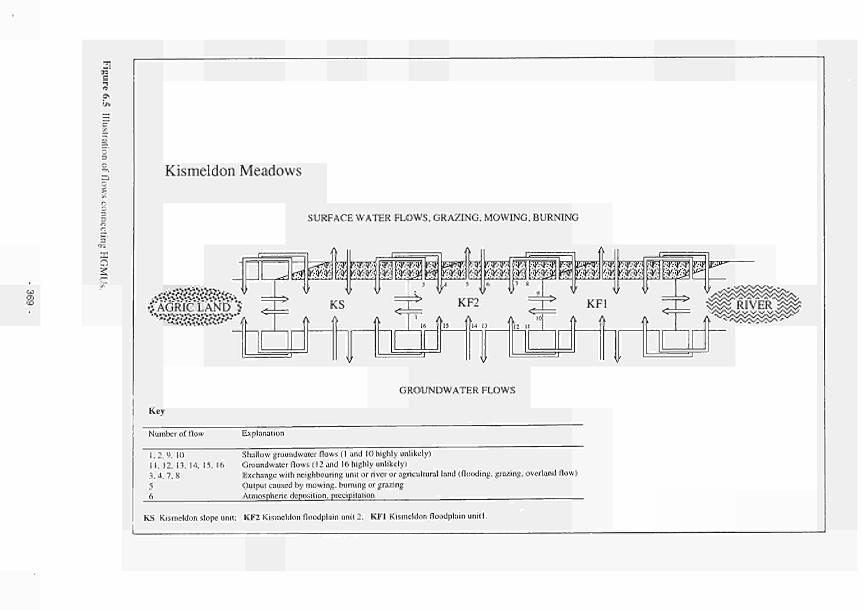
Kismeldon Meadows
SURFACE WATER FLOWS, GRAZING, MOWING, BURNING
X C:
-2 '■.*■ *.■"■.*■■.■■ " . " ■ .
ÍAGRICLAND ï'
GROUNDWATER FLOWS
Key
Number of flow Explanation
I, 2, 9. 10 Shallow groundwater flows (1 and 10 highly unlikely) II. 12. 13. 14, 15, 16 Groundwater flows ( 12 and 16 highly unlikely) 3, 4, 7, 8 Exchange with neighbouring unit or river or agricultural land (flooding, grazing, overland flow) 5 Output caused by mowing, burning or grazing 6 Atmospheric deposilion, precipitation
KS Kismeldon slope unit; KF2 Kismeldon floodplain unit 2; KF1 Kismeldon floodplain uniti.
The strategy forms a module within the overall functional assessment scheme, which the user reaches after delineation and definition of the HGMUs. The user is assumed to know that they are assessing a piece of wetland forming a defined unit (HGMU), and want now to know the answers to two basic questions, which will either allow them to progress further through the system, or lead them to specific answers about the wetland unit of interest:
i. how easily can the vegetation type of this HGMU be defined'! ii. how can I find out if the vegetation indicates signs of ecosystem perturbation (stress, disturbance or
both) affecting this HGMU ?
Answers to these questions can provide an assessment of current status of the HGMU in terms of the degree of stress and/or perturbation which it is experiencing. Examples of use mighl include:
i. The broad survey approach such as assessing the relative degree of perturbation affecting riverine wetlands across an area of interest (e.g. an NRA Region), while also offering a quick overall assessment of the vegetation of HGMUs present within each site and providing a prediction of the potential impaci of any known or suspected causes of perturbation affecting the wetland.
ii. A more intensive assessment of changes affecting a key wetland site such as an SSSI which has been impacted by groundwater abstraction, which has lowered the water tables since SSSI notification. Where the vegetation has been surveyed (within known areas of the sile - which may or may not correspond to HGMUs) at intervals over a period of years, the method provides an assessment of likely intensity of perturbation on each survey occasion, to give an indication of trend within the vegetation of the site which can in turn be related to current hydrological, or other relevant environmental data. Application of the technique also provides a prediction of likely impacts of further intensification of any perturbai ion trend picked up by the analysis, both on vegetation and on those aspects of weiland functioning reflected by the vegetation.
iii. Comparative predictive studies of the impacts of planning decisions likely to affect a number of sites within a given area: e.g. via the effects on the water table of moving a borehole providing public waler supply capability for a rural area containing a number of riverine wetlands. What would be the implications of waler table changes affecting these wetlands? Assuming that the hydrological implications can be modelled to give predicted changes in mean summer water table for each sile, then the method could provide predictions of changes in intensity of perturbation affecting each site. If current vegetation data were available for each site (usually the case for most of Europe), then predictions of likely change in vegetation type might also be made.
In the assessment scheme lhe following procedures can be defined:
1. Consult the database, given within the scheme as an appendix in the printed version, and as a look-up table on disk, for defining CFVT from dominant weiland plani species present. At this slagc this route will only be possible for a limited set of species because of the small number of HGMUs so far examined. However the database will build up as the scheme is developed.
2. Calculate the C score for each of n dominant species present:
C = (HT χ 0.0602) + (WTLV χ 0.0181) + 0.4690
[Units: HT in cm; WTLV in glO2]
Then sum species C scores and divide by total number of species used to calculate Funclional Vegetation Type index for competitiveness of vegetation (CFVT score):
CFVT = IC/n
3. Calculate perturbation index (P) as inverse of CFVT score, multiplied by 100 to remove decimal places:
370

Ρ = 100(1/CFVT)
4. Place HGMU into one of a number of predefined bands for Ρ index described verbally (e.g. "high perturbation" to "low perturbation").
5. Calculate CFVT using S-CFVT function, or use an alternative function derived from further rationalisation of the subset of state variables which avoids the potential difficulty of measuring C20+,
CFVT = (DOMx 0.454) + 1.691
6. Cross-reference to checklist of likely causes of perturbation, from other parts of scheme: this would refer the user back to hydrological and chemical assessments already made, or to other more subjective assessments of impacts on HGMU (or the site as a whole), from which the likely causes of the perturbation, as reflected by the vegetation, may be predicted.
7. Cross-reference to a table, which will provide further interpretation: here, it is envisaged that the user is given information which will permit some refinement of the basic CORINE biotope and Ρ banding of' the HGMU. For example: application of the scheme to an HGMU located in a frequently-flooded RMW might, thus far, have suggested that CORINE biotope 53.112 ("water fringe vegetation: dry Phragmites beds") is present, with a perturbation band P3 ("moderately perturbed"). This implies that the HGMU has undergone moderate levels of stress and/or disturbance. Application of this part of the procedure will allow an assessment of whether the HGMU is experiencing a reduction in eilher production or community diversity, below that which would be expected for the vegetation type. This could be as simple as a designation into "as expected" versus "degraded" category, or might be a more sophisticated measure of the degree of perturbation. The intention is to help the user assess the degree of ecosystem damage exhibited within the HGMU. A schematic representation of this approach is provided in Fig. 6.6.
6.3 Invertebrate databases and their use in site evaluation
The work on invertebrates carried out during the project has incorporated four types of innovation:
a) statistical processing of results based not on use of species as units, but on use of species as combinations of attributes b) use of regional species pool as basis for comparison in investigation of site faunas c) use of non-expert survey of' present site conditions as basis for prediction of potential site fauna d) use of terrestrial invertebrates to integrate non-flooded phase data with flooded-phase data in floodplain system.
Three types of limitation are recognised in the development of the approach:
a) lack of a defined impact model designed for any of the study sites to use as template for testing lhe efficiency of the methodology b) setting-up the invertebrate database is still not complete - it is as yet uncertain what modification of existing files (using available data) will be necessary before optimal efficiency is achieved. Only when it has been possible to investigate systematically lhe interactions between all elements of the database will it become clear what the major limitations of the database are. c) one major limitation of the existing database is the absence of information on the relation between the species and physical parameters - the fact that such data do not exist will certainly limit the versatility of the database.
Response thresholds cannot be meaningfully considered for site faunas without reference lo lhe scale of environmental change envisaged there and the length of time over which lhe response is to be considered -at one end of the scale there are changes in site conditions liable to cause immediate and total eradication of the existing site fauna, at the other are changes liable to alter the relative abundance of very few species over a period of years. In developing the methodology for the invertebrate study in the FAEWE project, the aim has been to address the sort of faunal responses which might be anticipated as a
371 -
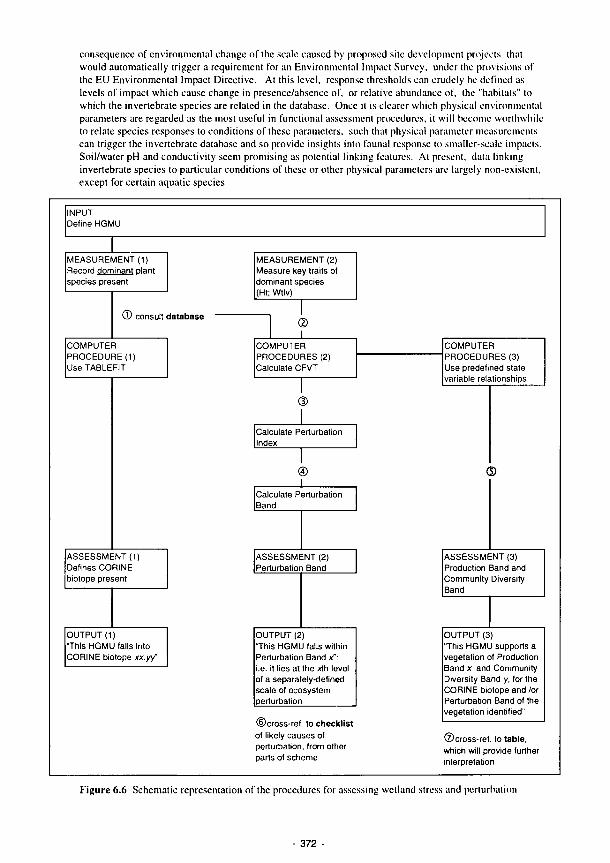
consequence of environmental change of the scale caused by proposed site development projects that would automatically trigger a requirement for an Environmental Impact Survey, under the provisions of the EU Environmental Impact Directive. At this level, response thresholds can crudely be defined as levels of impact which cause change in presence/absence of, or relative abundance of, the "habitats" to which lhe invertebrate species are related in the database. Once it is clearer which physical environmental parameters are regarded as the most useful in functional assessment procedures, it will become worthwhile to relate species responses to conditions of these parameters, such that physical parameter measurements can trigger the invertebrate database and so provide insights into faunal response lo smaller-scale impacts. Soil/water pH and conductivity seem promising as potential linking features. Al present, dala linking invertebrate species to particular conditions of these or other physical parameters are largely non-cxislent, except for certain aquatic species.
INPUT Define HGMU
MEASUREMENT (1) Record dominant plant species present
© consult database
COMPUTER PROCEDURE (1) Use TABLEFIT
ASSESSMENT (1) Defines CORINE biotope present
OUTPUT (1) "This HGMU falls into CORINE biotope xx.yf
MEASUREMENT (2) Measure key traits of dominant species (Ht; Wtlv)
-L COMPUTER PROCEDURES (2) Calculate CFVT
®
Calculate Perturbation Index
© _ l _
Calculate Perturbation Band
ASSESSMENT (2) Perturbation Band
OUTPUT (2) "This HGMU falls within Perturbation Band x": i.e. it lies at the xth level of a separately-defined scale of ecosystem perturbation
©cross-ref. to checklist of likely causes of perturbation, from other parts of scheme
COMPUTER PROCEDURES (3) Use predefined state variable relationships
(5)
ASSESSMENT (3) Production Band and Community Diversify Band
OUTPUT (3) 'This HGMU supports a vegetation of Production Band χ and Community Diversity Band y, for the CORINE biotope and /or Perturbation Band of the vegetation identified1'
©cross-ref. to table, which will provide further interpretation
Figure 6.6 Schematic representation of the procedures for assessing wetland stress and perturbation
372 -
The following priorities are identified for future work:
a) completion of compilation of the data files for Mollusca and Carabidae; b) finalisation of process of modification of existing data files for Syrphidae; c) use of the data files for the three complementary taxonomie groups to provide independent data sets which may be used in tandem to check and extend conclusions derived from each; d) systematic exploration of the interrelation between different data files for purposes of functional assessment; e) production of a "user-friendly" overlay to the database, to increase its usability by nonexperts.
6.4 Concept of hydrogeomorphic landscape units
The hydrogeomorphic classification proposed by Brinson (1993) classifies wetlands on the basis of factors that determine how wetlands function. The classification uses the factors geomorphic setting, hydrodynamics, and water source to group wetlands into classes with similar hydrogeoinorphic characteristics. Because these characteristics, to a great extent, determine the functions a wetland performs, the hydrogeomorphic classification is also a rudimentary functional wetland classification.
The FAEWE project has refined the hydrogeomorphic classification of Brinson (1993), which essentially dealt with wetlands as 'macro' features within the landscape, to allow assessment of river marginal wetland sites, and distinct units within one wetland, at a 'micro' landscape scale. Thus instead of classifying all of a wetland on its hydrogeomorphic properties, finite areas within the wetland are classified as 'hydrogeomorphic units'. The FAEWE project recognises the fact thai the hydrogeomorphic approach utilised in the development of functional assessment procedures by Brinson et al. (1994) is hierarchical and modular, and as such can be easily modified for different geographical scales, acknowledging the intrinsic similarities between the two systems.
6.4.1 The hydrogeomorphic unit (HGMU)
Assessment of a river marginal wetland site is built upon the identification and delineation of HGMUs. The HGMU is identified primarily in terms of its geomorphology. Breaks in slope are recorded, and the delineated slope units are described in terms of their gradient and surface morphology (regular or irregular; convex, concave or straight). Depressions and elevations, relative to a slope unit, are delineated. Each different geomorphic unit is assigned an identifying code. The hydrology (including the hydrogeology) of each geomorphic unit is assessed, although this assessment remains problematic. The FAEWE hydrological assessment methodology operates at three levels. Firstly, information pertaining to flooding, water levels, water table variations, groundwater, catchment size, precipitation, évapotranspiration, drainage and other hydrological criteria is assessed in a desk sludy that provides the user with a provisional hydrological assessment of the site. Secondly, the field based assessment defines the surface and groundwater inflows and outflows for each geomorphic unit. The assessment combines the desk study with informed field identification guidelines to produce a 'best estimate' of the water sources and hydrodynamics of the geomorphic units. The third level depends on the purpose of' the functional assessment. To achieve an accurate assessment of the functioning of a river marginal wetland detailed monitoring and assessment of the hydrology may be required. Where this is the case guidelines are provided and the user is directed to the appropriate institution/organisation/personnel to facilitate the objective.
Each HGMU is thus a composite of its geomorphology and hydrology. This is not intended to be a classification, but rather the concept aims to identify HGMUs within a river marginal wetland site. (In theory it is a classification system, though its practical application is precluded as the theoretical number of classes generated is over 4000).
The field methodology provides instructions for describing the soil type and the vegetation cover for each HGMU. The soil is assessed by combining information gathered in the desk study (soil maps, monographs, and other published material) with field observations of soil profile characteristics. The vegetation is assessed and conelated in relation to the CORINE classification. The applicability of the CORINE classification to utilisation within the functional assessment procedures is being reviewed. Integration of the CORINE system with accepted national and international vegetation classifications is
- 373
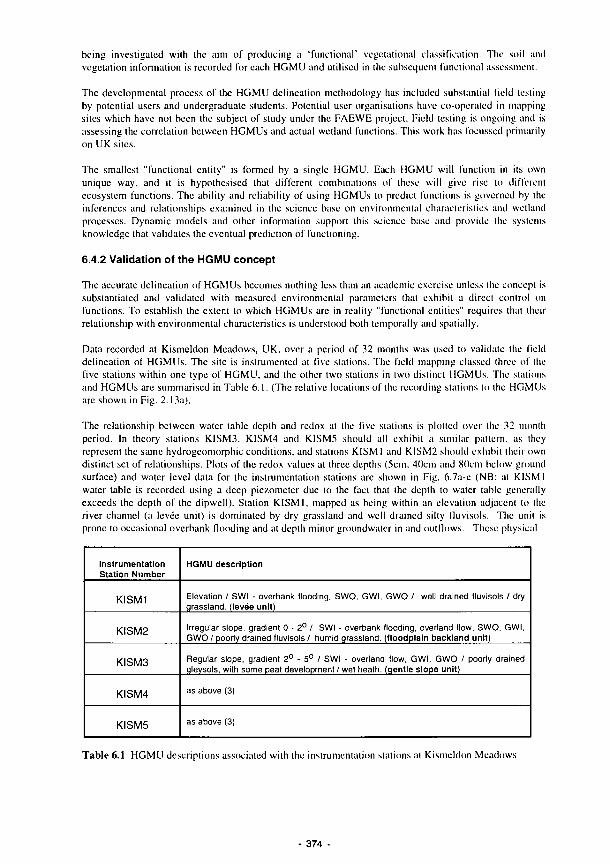
being investigated with the aim of producing a 'functional' vegetational classification. The soil and vegetation information is recorded for each HGMU and utilised in the subsequent functional assessment.
The developmental process of the HGMU delineation methodology has included substantial field testing by potential users and undergraduate students. Potential user organisations have co-operated in mapping sites which have not been the subject of study under the FAEWE project. Field testing is ongoing and is assessing the correlation between HGMUs and aclual wetland functions. This work has focusscd primarily on UK sites.
The smallest "functional entity" is formed by a single HGMU. Each HGMU will function in ils own unique way. and it is hypothesised that different combinations of these will give rise to different ecosystem functions. The ability and reliability of using HGMUs to predict functions is governed by the inferences and relationships examined in the science base on environmental characteristics and weiland processes. Dynamic models and other information support this science base and provide llic systems knowledge that validates the eventual prediction of functioning.
6.4.2 Validation of the HGMU concept
The accurate delineation of HGMUs becomes nothing less than an academic exercise unless the concepì is subslantiatcd and validated wilh measured environmental parameters that exhibit a direct control on functions. To establish the extent to which HGMUs arc in reality "functional entities" requires that their relationship with environmental characteristics is understood both temporally and spatially.
Data recorded at Kismeldon Meadows, UK, over a period of 32 months was used to validate the field delineation of HGMUs. The site is instrumented at five stations. The field mapping classed three of the five stations within one type of HGMU, and the other two stations in two distinct HGMUs. The stations and HGMUs arc summarised in Table 6.1. (The relative locations of the recording stations to the HGMUs are shown in Fig. 2.13a).
The relationship between water table depth and redox at lhe five stations is plotted over the 32 monili period. In theory stations KISM3, KISM4 and KISM5 should all exhibit a similar pattern, as they represent the same hydrogeomorphic conditions, and stations KISM I and KISM2 should exhibit their own distinct set of relationships. Plots of the redox values at three depths (5cm, 4()cni and 80cm below ground surface) and water level data for the instrumentation stations are shown in Fig. 6.7a-c (NB: at KISM1 water table is recorded using a deep piezometer due to the fact that the depth to water tabic generally exceeds the depth of the dipwcll). Station KISM I, mapped as being within an elevation adjacent to the river channel (a levée unit) is dominated by dry grassland and well drained silty fluvisols. The unii is prone to occasional overbank Hooding and at depth minor groundwater in and outflows. These physical
Instrumentation Station Number
KISM1
KISM2
KISM3
KISM4
KISM5
HGMU description
Elevation / SWI - overbank flooding, SWO, GWI, GWO / well drained fluvisols / dry qrassland. (levée unit)
Irregular slope, gradient 0 - 2° / SWI - overbank flooding, overland flow. SWO, GWI, GWO / poorly drained fluvisols / humid qrassland. (floodplain backland unit)
Regular slope, gradient 2° - 5° / SWI - overland flow, GWI, GWO / poorly drained qleysols, with some peal development / wet heath, (gentle slope unit)
as above (3)
as above (3)
Table 6.1 HGMU descriptions associated wilh the instrumentalion stations al Kismeldon Meadows
- 374
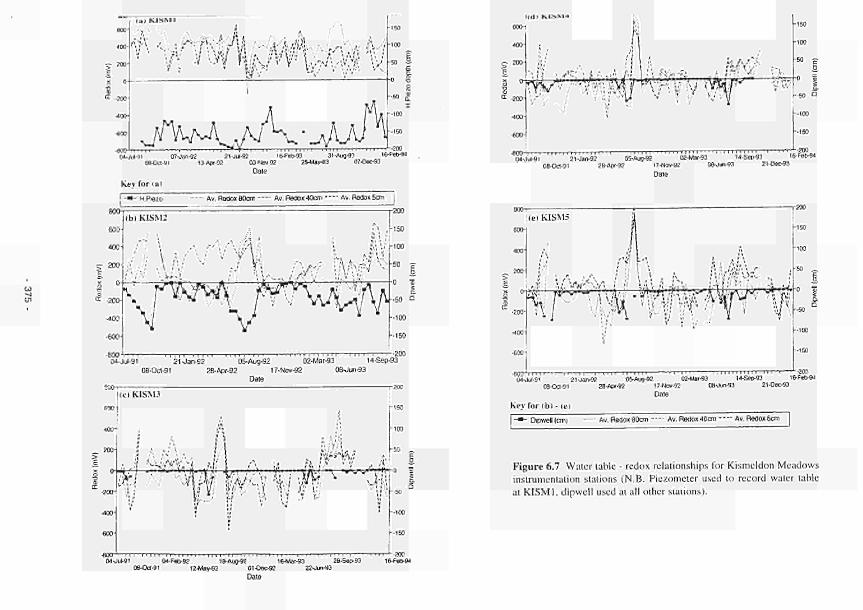
600-
<a> K I S M l
', γ. 'l
400
■ 200-
0 - -
•200
JO;·
•βοο-
-600' Μ ΐ · τ - Ί 04.JuMl 07Jaiv92 21-JJ-92 I6-F«l-93 31-Aug-93 II
0βΟα·91 Ι3-Λρτ·β2 03-NOT-92 25+lay*3 07-De»93 Date
Kev for tal ■ Av. Redox 80cm Av. Redox 40cm Av. Redox 5cm
800
6CC
40C
200
(bl KISM2 i l ,1150
" Ì /' ι • i l i 1100
, , . Ι^,\ k ·■* V··,
,.., /.¿y: iter v
■800 .
04Jul91 21Jan92 05Aug92 02Mar93 14Sep93
08Oct91 28Apr92 17NOV92 08^Jun93
Date
(CIK1SM3
fiOC|
■20O1
100
•600
^ S j . · , ' « ' ' '
Λϊ,-ί
. l'i,-' rv ,;. f i l'A ' V Λ .'ί
JÏ wi y η τ •5C
•100
■150
■600 ■ M .—I ι I I I ! ι ι ι ι ι ■ ι π π ι ι ι ι ι ' ι ι π Ι ι ! 1 ! ι ι—ι—ι—Γ—ι—ι ι ' ι ι ι — Τ Γ O40uk91 04Fet>92 1BAuf92 16Mar93 2frSet>93 16Feb94
ΟβΟα91 12MayJ12 OtOec92 22Jm93
Dale
| (d l K.15IV14
600·
400·
~ 200
E
■200
100
■600
'"«A/,·1* -ί TT* »■/»»»τ
m rWvt
ISO
too
50 I
o O; I ■50 Q
•100
•150
4300 M I — ι ι ι ι ι ι ι i i — i i i —ι ι ι ι ι ι— i l ι ' ι ' i ' ' ' ' ' ,
MJlJ91 210ai>92 OSAug92 02Mat93 14Se(>93 If
OBOct91 28Apr92 I7NOV92 06JIÍ193 21Oeo93
Dale
lelKISMS
400 ,\·
200 ¡/i
200
toc
■600
¿V
■^••V.'Y¿j ' ¡j y ¿ ¿ /,*·Λ, „ i n
200
150
■20C ■gQJ ' M i l l ! ι ι I I I Ι Ι Ι Μ Ι M I M I I l I I 1 I I I I I I I I Μ Ι Ι Ι Ι
040ul91 210an92 05Aug92 02Mar93 14Sep93 16Peö94 OaOa91 28AIX92 17NOV92 ΟΘΟυη93 21Oec93
Dale
Key for lb) (e)
| ·» Dipwell(cm; Av. Redox80cm Av. Redox 40cm Av.RedoxScm
Figure 6.7 Water table redox relationships for Kismeldon Meadows
instrumentation stations (N.B. Piezometer used to record water table
at KISM1, dipwell used at all other stations).
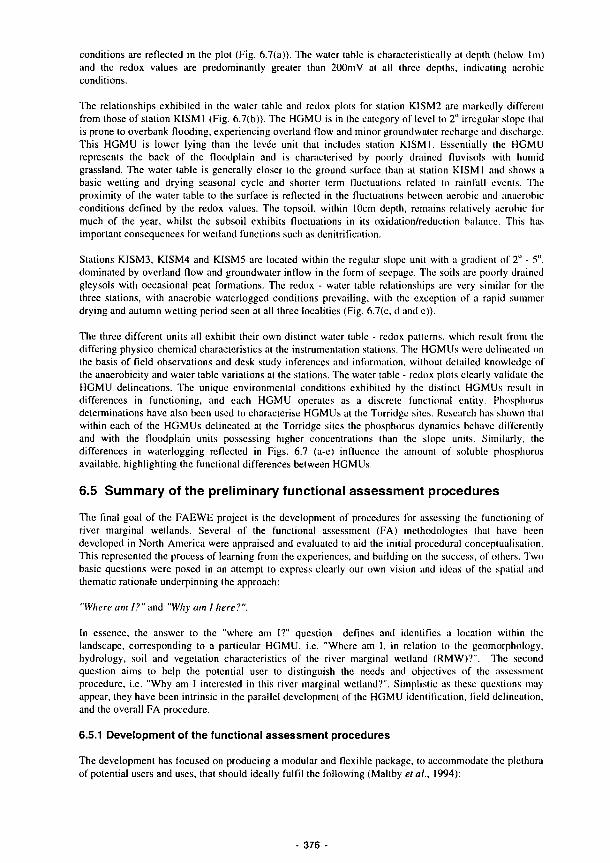
conditions are reflected in the plot (Fig. 6.7(a)). The water table is characteristically at depth (below lm) and the redox values are predominantly greater than 200mV at all three depths, indicating aerobic-conditions.
The relationships exhibited in the waler table and redox plots for station KISM2 are markedly different from those of station KISM1 (Fig. 6.7(b)). The HGMU is in the category of level to 2" irregular slope that is prone to overbank flooding, experiencing overland flow and minor groundwater recharge and discharge. This HGMU is lower lying than the levée unit that includes station K1SM1. Essentially the HGMU represents the back of the floodplain and is characterised by poorly drained fluvisols with humid grassland. The waler table is generally closer to the ground surface lhan at station KISM 1 and shows a basic wetting and drying seasonal cycle and shorter term fluctuations related to rainfall events. The proximity of the waler table to the surface is reflected in the fluctuations between aerobic and anaerobic-conditions defined by the redox values. The topsoil, within 10cm depth, remains relatively aerobic for much of the year, whilst the subsoil exhibits fluctuations in its oxidation/reduction balance. This has important consequences for wetland functions such as denitrification.
Stations KISM3, KISM4 and KISM5 are located within the regular slope unit with a gradient of 2" - 5", dominated by overland flow and groundwater inflow in the form of seepage. The soils are poorly drained gleysols with occasional peat formations. The redox - water table relationships arc very similar for (he three stations, with anaerobic waterlogged conditions prevailing, with the exception of a rapid summer drying and autumn wetting period seen at all three localities (Fig. 6.7(c, d and e)).
The three different units all exhibit their own distinct water table - redox patterns, which result from the differing physico-chemical characteristics at the instrumentalion stations. The HGMUs were delineated on the basis of field observations and desk study inferences and information, without detailed knowledge of the anaerobicity and water table variations at the stations. The water table - redox plots clearly validate the HGMU delineations. The unique environmental conditions exhibited by (he distinct HGMUs result in differences in functioning, and each HGMU operates as a discrete functional entity. Phosphorus determinations have also been used to characterise HGMUs at the Torridge sites. Research has shown that within each of the HGMUs delineated at the Torridge siles the phosphorus dynamics behave differently and with the floodplain units possessing higher concentrations than the slope units. Similarly, the differences in waterlogging reflected in Figs. 6.7 (a-e) influence the amount of soluble phosphorus available, highlighting the functional differences between HGMUs.
6.5 Summary of the preliminary functional assessment procedures
The final goal of the FAEWE project is the development of procedures for assessing the functioning of river marginal wetlands. Several of the functional assessment (FA) methodologies that have been developed in North America were appraised and evaluated to aid the initial procedural conceptualisation. This represented the process of learning from the experiences, and building on the success, of others. Two basic questions were posed in an attempt to express clearly our own vision and ideas of the spatial and thematic rationale underpinning the approach:
"Where am 1?" and "Why am I here?".
In essence, the answer to the "where am I?" question defines and identifies a location within the landscape, corresponding to a particular HGMU, i.e. "Where am I. in relation to the geomorphology, hydrology, soil and vegetation characteristics of the river marginal wetland (RMW)'.'". The second question aims to help the potential user to distinguish the needs and objectives of the assessment procedure, i.e. "Why am I interested in this river marginal wetland?". Simplistic as these questions may appear, they have been intrinsic in the parallel development of the HGMU identification, field delineation, and the overall FA procedure.
6.5.1 Development of the functional assessment procedures
The development has focused on producing a modular and flexible package, to accommodate the plethora of potential users and uses, that should ideally fulfil the following (Maltby el ai, 1994):
- 376

1. provide a synthetic (and where necessary rapid) assessment tool to assist planners to resolve decision-making dilemmas in regard to land use allocation, permitting of activities and catchment planning;
2. in doing so provide some guidance on the optimum (or perhaps minimum) conditions necessary for the support of wetland functioning;
3. identify levels of impact which alter functioning; 4. provide indications of ecosystem stability, levels of tolerance and resistance to change.
Fig. 6.8 shows the proposed overall structure of the assessment procedure. The development of this structure has been shaped by three approaches. Firstly, through the establishment of, and consultation with, the UK Potential Users Group, composed of NGOs and GOs who have been identified as possessing a possible application of, or requirement for, an FA procedure. This group has focused on the specific and practical end uses of the product, the possible limitations of the user, in both time and knowledge, and the degree of accuracy required for such an assessment. The majority of organisations contacted either gave a cautious welcome or a highly enthusiastic response to the proposal to develop functional assessment procedures. A summary of the perceptions of priorities of the contacted organisations is shown in Table 6.2.
Secondly, the structure of the FA procedures evolved through an assessment of the values and successes of similar projects in North America, for instance the Wetland Evaluation Technique (WET) of Adamus el al (1987). Shortcomings and limitations were identified, and possible remedies incorporated. Much of the groundwork involved in this process was undertaken in preliminary work by the Wetland Ecosystems Research Group at the University of Exeter on the Rhône Delta (France) and the Evros Delta (Greece) (Maltby el al., 1988), and the Messolonghi wetland (Greece) and the Odici Marshes (Spain) (Oliver et ai, 1990). Many wetland assessment procedures and manuals were consulted to synthesise the published concepts and structures into the format most appropriate for the European context.
Thirdly, the science base on which the FAEWE project is based had to be utilised to its maximum potential. Thus the structure of the procedure needed to be moulded to suit the strengths in the science, and not to become over ambitious causing the scientific developments and findings to be undermined, resulting in the inevitable loss of information and increase in uncertainty in the assessment. The final structure reflects a division of the procedure into sections that successively develop the detail and accuracy of the assessment, allowing different users to undertake different pathways through the package, and to arrive at different end points.
6.5.2 Summary of the FAEWE Procedures
A general introduction to the procedure outlines the scope of the FAEWE project, the collaborating establishments and partners and acknowledges the sources of funding. The concept of river marginal wetland functions and their associated products, services and values is briefly explained. An abridged version of the evolution of wetland functional assessment procedures is presented. A generalintroduction to the FAEWE functional assessment procedures, and its internal structure and sections, is included.
The User Guidelines section is divided into four sub-sections. The first sub-section deals with the question "which function to assess?" A great deal of variety exists in the terminology used to describe the functions performed by river marginal wetlands, and in an attempt to overcome this problem the FAEWE Procedures provide a list of 'functions to assess' that cover the melange of terms that are used to describe wetland functions. This list is accompanied by definitions, synonyms and alternative terminology: detail from this is shown in Table 6.3. The second sub-section deals with the problem of 'which assessment approach to take?', and concentrates on ensuring the user adopts the desired assessment format. Four possible approaches are possible within the FAEWE Procedures:
1. assessment of one function of interest; 2. overall functional assessment of the river marginal wetland; 3. assessment of a known impact on the function of interest; 4. assessment of a known impact on the overall functional performance of the wetland.
The user is provided with guidelines and information to aid the selection of the appropriate assessment approach. For instance, if the user is interested in assessing the wetland only for its flood defence potential the first section would indicate that the function to assess was "Hood control", and the second section would indicate that the appropriate approach is " 1. assessment of one function of interest". The third sub-
377
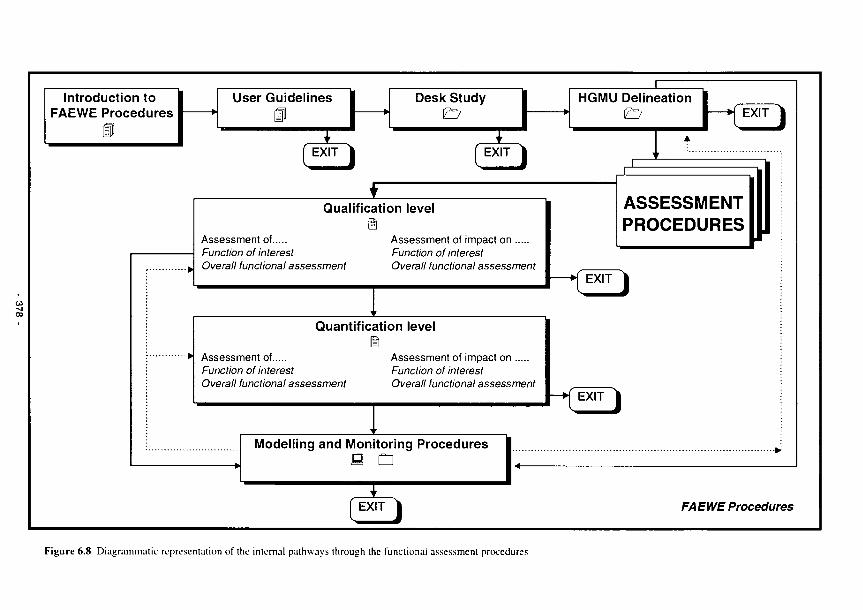
Introduction to FAEWE Procedures
i User Guidelines Desk Study
£D ŒD Qualification level
i Assessment of Assessment of impact on Function of interest Function of interest Overall functional assessment Overall functional assessment
Quantification level i
Assessment of Assessment of impact on Function of interest Function of interest Overall functional assessment Overall functional assessment
I HGMU Delineation
-+[ EXIT 1
ASSESSMENT PROCEDURES
-+[ EXIT 1
GED FAEWE Procedures
Figure 6.8 Diagrammatic representation of the internal pathways through the functional assessment procedures

section provides information on the level of detail of the assessment procedures. The process of potential user consultation has identified three desired levels of assessment:
1. qualification of the function; 2. quantification of the function; 3. detailed monitoring and modelling of the function.
Organisation Comments
National Rivers Authority (NRA)
English Nature (EN)
to determine the relative values/sensitivities of sites identify important habitats which require protection or enhancement more accurate targeting of resources identifying suitable restoration sites assistance in the environmental assessment of abstraction licences, drainage consents, planning applications, flood defence, etc.
assessing development proposals establishment of buffer zones
land
Countryside (CC)
Commission
Forestry Commission (FC)
Scottish Countryside Commission (SCC)
Joint Nature Conservation Committee (JNCC)
Broads Authority (BA)
World Wide Fund for Nature (WWF)
International Waterfowl and Wetland Research Bureau (IWRB)
encouraging appropriate management by owners and local authorities
CC (with EN) is a statutory consultee on Environmental Impact Statements (EISs), but has limited resources to do this effectively, so providing clear advice to those responsible for preparing an EIS is a requirement - only clearly prepared EISs can be properly assessed - in the UK, at least, no method exists to assess the quality of EISs
an information overload exists, with too many and too complex systems to be of practical utility
any models that are developed need to be "proven" the potential for such schemes to be applied is not high partly because of the complexity of legal and ownership constraints on management (cf JNCC) monitoring change in land use
prediction of vulnerability scheduling of river SSSIs and their corridors is a lengthy and laborious process
need to justify investment in conservation management and restoration
assessing value and developing management guidelines rapidly is an asset where resources are few and expertise narrow
need to be able to predict impacts (degradation) at important sites assessment schemes have to be straightforward and adaptable
Table 6. 2 Perception of priorities - summary results from an institutional inquiry of potential users
The selected assessment level influences where the user has to terminate the procedures. In some cases the desired assessment approach may be precluded due to inadequacies in the available information, indicating that the only approach possible is 3, to undertake detailed monitoring and modelling of the site. The final section in the User Guidelines details the internal structure of the procedures, explains the layered modular approach, defines possible colour-coded pages, and informs the user of potential pathways through the package. Worked examples will be used to help familiarise the user with each stage of the procedures.
After the user has utilised the User Guidelines to identify the purpose of, and the pathway through, the assessment procedure, a Desk Study has to he undertaken (Fig. 6.9). This provides information thai supports much of the field delineation and the functional assessment and is a vital component of the procedures. The Desk Study directs the user to existing data sources, e.g. topographic maps, soil maps, hydrological data, aerial photographs, that arc essential/useful to the study. Details arc given on precise requirements, and appendices give details of the sources of data sets in each of the EU member stales. The data acquired in the Desk Study is collated into a preliminary landscape assessment, allowing the user to
379
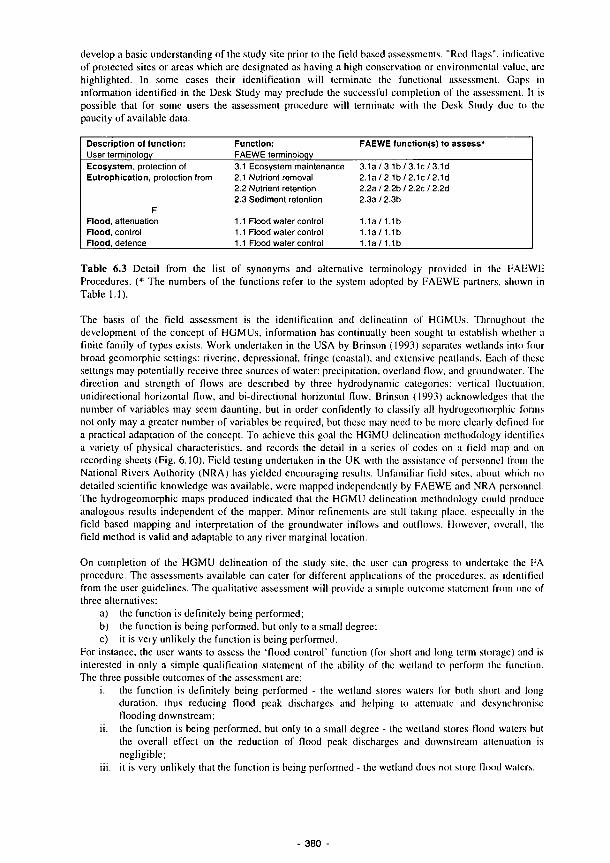
develop a basic understanding of the study site prior to the field based assessments. "Red Hags", indicative of protected sites or areas which are designated as having a high conservation or environmental value, arc highlighted. In some cases their identification will terminate the functional assessment. Gaps in information identified in the Desk Study may preclude the successful completion of the assessment. It is possible that for some users the assessment procedure will terminate with the Desk Study due to the paucity of available data.
Description of function: User terminoloqy Ecosystem, protection of Eutrophication, protection from
F Flood, attenuation Flood, control Flood, defence
Function: FAEWE terminoloqy 3.1 Ecosystem maintenance 2.1 Nutrient removal 2.2 Nutrient retention 2.3 Sediment retention
1.1 Flood water control 1.1 Flood water control 1.1 Flood water control
FAEWE function(s) to assess*
3.1a/3.1b/3.1c/3.1d 2.1a/2.1b/2.1c/2.1d 2.2a/2.2b/2.2c/2.2d 2.3a/2.3b
1.1a/ 1.1b 1.1a/ 1.1b 1.1a/ 1.1b
Table 6.3 Detail from the list of synonyms and alternative terminology provided in the FAEWE Procedures. (* The numbers of the functions refer to the system adopted by FAEWE partners, shown in Table 1.1).
The basis of the field assessment is the identification and delineation of HGMUs. Throughout the development of the concept of HGMUs, information has continually been sought to establish whether a finite family of lypes exists. Work undertaken in the USA by Brinson (1993) separates wetlands into four broad geomorphic settings: riverine, depressional, fringe (coastal), and extensive pcatlands. Each of these settings may potentially receive three sources of water: precipitation, overland How, and groundwater. The direction and strength of flows arc described by three hydrodynamic categories: vertical fluctuation, unidirectional horizontal flow, and bi-directional horizontal flow. Brinson (1993) acknowledges that the number of variables may seem daunting, but in order confidently to classify all hydrogeomorphic forms not only may a greater number of variables be required, but these may need to be more clearly defined for a practical adaptation of the concept. To achieve this goal the HGMU delineation methodology identifies a variety of physical characteristics, and records the detail in a scries of codes on a field map and on recording sheets (Fig. 6.10). Field testing undertaken in the UK with the assistance of personnel from the National Rivers Authority (NRA) has yielded encouraging results. Unfamiliar field sites, about which no detailed scientific knowledge was available, were mapped independently by FAEWE and NRA personnel. The hydrogeomorphic maps produced indicated that the HGMU delineation methodology could produce-analogous results independent of the mapper. Minor refinements are still taking place, especially in the field based mapping and interpretation of the groundwater inflows and outflows. However, overall, the field method is valid and adaptable to any river marginal location.
On completion of the HGMU delineation of the study site, the user can progress to undertake lhe FA procedure. The assessments available can cater for different applications of the procedures, as identified from the user guidelines. The qualitative assessment will provide a simple outcome statement from one of three alternatives:
a) the function is definitely being performed; b) the function is being performed, but only to a small degree; c) it is very unlikely the function is being performed.
For instance, the user wants to assess the 'flood control' function (for short and long term storage) and is interested in only a simple qualification statement of the ability of the wetland to perform the function. The three possible outcomes of the assessment arc:
i. the function is definitely being performed - the wetland stores waters for both short and long duration, thus reducing flood peak discharges and helping to attenuate and désynchronise flooding downstream;
ii. the function is being performed, but only to a small degree - the wetland stores Hood waters bul the overall effect on the reduction of flood peak discharges and downstream attenuation is negligible;
iii. it is very unlikely that the function is being performed - the wetland docs not store flood waters.
380

Information from User Guidelines
Desk Study 1. Topography 2. Geology 3. Geomorphology 4. Hydrology 5. Hydrogeology 6. Soils 7. Vegetation 8. Climate 9. Management
►
Prelimina Assessm*
¿2/ i
a. Aerial photographs b. Red flags c. Assessment area delineation
i. Field equipment
ry site ;nt
1
k V
Information to HGMU
delineation
Figure 6.9 Internal structure of the Desk Study section of the functional assessment procedures
Information from Desk
Study
HGI\ 1. Geon 2. Hydrc 3. Vege 4 Soi'*-
rlU Delineation ïorphology ilogy/Hydrogeology ation
a.
1 " HGMU Delineation of assessment area
Field map b. Recording sheets
35 r1 1
1 Information
to Assessment Procedures
Figure 6.10 Internal structure of the HGMU delineation section of the functional assessment procedures
The assessment is based on the identification of variables that control, indicate or predict functioning. The controlling variables for each function have been extracted from the scientific research programmes. For each function the controlling variables are listed and explained, allowing the user to understand the processes operating. An example for '2.1a N export (denitrification)' is shown in Table 6.4. Codes assigned to the HGMUs during the field delineation exercise are cross-referenced to provide inputs to the
381
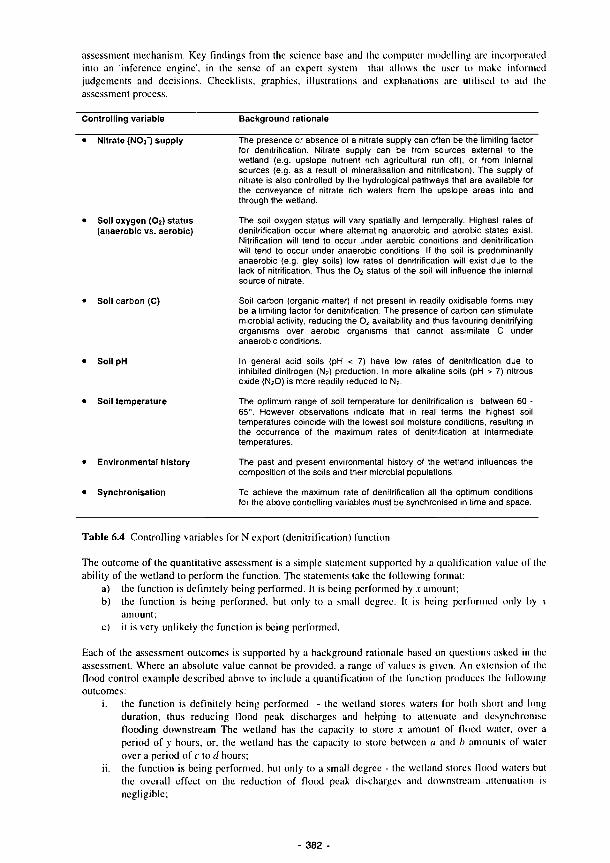
assessment mechanism. Key findings from the science base and the computer modelling arc incorporated
into an 'inference engine', in the sense of an expert system that allows the user to make informed
judgements and decisions. Checklists, graphics, illustrations and explanations are utilised to aid tin-
assessment process.
Controlling variable Background rationale
Nitrate (NO,') supply
Soil oxygen (02) status (anaerobic vs. aerobic)
• Soil carbon (C)
• Soll pH
• Soil temperature
• Environmental history
• Synchronisation
The presence or absence of a nitrate supply can often be the limiting factor for denitrification. Nitrate supply can be from sources external to the wetland (e.g. upslope nutrient rich agricultural run off), or from internal sources (e.g. as a result of mineralisation and nitrification). The supply of nitrate is also controlled by the hydrological pathways that are available for the conveyance of nitrate rich waters from the upslope areas into and through the wetland.
The soil oxygen status will vary spatially and temporally. Highest rates of denitrification occur where alternating anaerobic and aerobic states exist. Nitrification will tend to occur under aerobic conditions and denitrification will tend to occur under anaerobic conditions. If the soil is predominantly anaerobic (e.g. gley soils) low rates of denitrification will exist due to the lack of nitrification. Thus the 02 status of the soil will influence the internal source of nitrate.
Soil carbon (organic matter) if not present in readily oxidisable forms may be a limiting factor for denitrification. The presence of carbon can stimulate microbial activity, reducing the O2 availability and thus favouring denitrifying organisms over aerobic organisms that cannot assimilate C under anaerobic conditions.
In general acid soils (pH < 7) have low rates of denitrification due to inhibited dinitrogen (N2) production. In more alkaline soils (pH > 7) nitrous oxide (N2O) is more readily reduced to N2.
The optimum range of soil temperature for denitrification is between 60 -65°. However observations indicate that in real terms the highest soil temperatures coincide with the lowest soil moisture conditions, resulting in the occurrence of the maximum rales of denitrification at intermediate temperatures.
The past and present environmental history of the wetland influences the composition of the soils and their microbial populations.
To achieve the maximum rate of denitrification all the optimum conditions for the above controlling variables must be synchronised in lime and space.
Table 6.4 Controlling variables for N export (denitrification) function
The outcome of the quantitative assessment is a simple statement supported by a qualification value of the
ability of the wetland to perform the function. The statements take the following format:
a) the function is definitely being performed. It is being performed by χ amount;
b) the function is being performed, but only to a small degree. It is being performed only by χ
amount;
c) it is very unlikely the function is being performed.
Each of the assessment outcomes is supported by a background rationale based on questions asked in the
assessment. Where an absolute value cannot be provided, a range of values is given. An extension of the
flood control example described above to include a quantification of the function produces the following
outcomes:
i. the function is definitely being performed - the weiland stores waters for both short and long
duration, thus reducing flood peak discharges and helping to attenuate and désynchronise
flooding downstream The wetland has the capacity to store χ amount of Hood water, over a
period of y hours, or, the wetland has the capacity to store between a and b amounts of water
over a period of c to d hours;
ii. the function is being performed, but only to a small degree - the wetland stores Hood waters but
the overall effect on the reduction of flood peak discharges and downstream attenuation is
negligible;
382

iii. it is very unlikely that the function is being performed - the wetland does not store flood waters.
Both the qualification and quantification assessments are carried out on individual HGMUs. allowing the user to identify which areas of the wetland are valuable for certain functions. The overall accuracy of this section depends on the transferability of the results and assumptions derived from the collaborated science base, coupled with accurate HGMU delineation and detailed completion of the Desk Study.
The third assessment level, modelling and monitoring procedures, does not produce a simple outcome. Instead of producing statements on the ability of the wetland to perform a certain function, details and guidelines are provided on how to undertake long term modelling and monitoring of the wetland function. Information is provided on the procedures for establishing field monitoring, information collation and computer simulation modelling. It is at this stage the FAEWE Procedures become more than a simple functional assessment methodology and expand into a truly integrated set of procedures for the assessment of river marginal wetlands.This section of the procedures has been included to allow non-experts to undertake detailed studies into wetland functioning and to provide a more comprehensive and accurate assessment based on complete rather than incomplete information.
The assessment procedures have been designed to have a flexible, modular structure that allow for a variety of uses and a wide range of practical users. It has been essential to maintain a degree of 'user-friendliness' in an attempt not to confuse or alienate the user. The preliminary assessment procedures are undergoing field testing to calibrate and validate the inferences and assumptions. The science base that underpins the identification of controls, indicators and predictors is still evolving, resulting in continued revision and refining of the procedures which will be finalised in Phase II.
383

7 CONCLUSIONS
Phase I has focused on field and laboratory based studies of selected hydrological, biogeochemical and geomorphological processes and their various, often inter-related, effects on observable ecological characteristics in river marginal wetland ecosystems. Results have improved substantially our scientific understanding of the ecosystem dynamics and, through the use of modelling, are enabling relationships between processes and functions to be determined more precisely for the purposes of developing a methodology for wetland functional assessment. In carrying out this work some important insights have become clear in terms of dynamic inter-relationships among factors with implications for land use options within the context of environmental change.
Important processes
Studies of individual processes, identified as critical to the support and maintenance of RMW ecosystems, have not only produced substantial qualitative and quantitative information about those processes, but have highlighted the many ways in which they inter-relate to support the ecosystem complex associated with individual HGMUs, and which themselves are often linked in hydrological sequences. The most fundamental support of wetlands is through hydrological processes - the means by which these systems are kept sufficiently wet to maintain their characteristic components such as peaty soils and hydrophytic vegetation.
Hydrological flow regimes and pathways not only supply the water resource but also, through solute supply, control the trophic or nutrient status of the vegetation. The interaction between flows, on-site permeabilities and ground configuration can control water regimes in groundwater systems, although other factors such as flooding from a river or anthropogenic alteration through land drainage can have major effects.
The interdependence of ecosystem characteristics is embodied in the concept of the HGMU, which recognises distinct functional landscape areas in terms of hydrological, slope and soil characteristics. HGMUs of a particular wetland can occur as either simple or complex sequences across the floodplain and. in places, occupy adjacent lower valley slopes, as at the Torridge study site, depending upon local hydrological conditions. The sequence may resemble a catena in the sense of being genetically linked through a common source of soil parent material (e.g. river alluvium) or hydrological support such as HGMUs on a hydrological gradient receiving groundwater and/or floodwatcr along a particular flow pathway. The example of the Torridge site indicates the variety of hydrological support which can be found within a single wetland complex: footslopcs carry soils of low permeability in which wetness derives from rainfall, held within the soil, and some overland flow, though the latter is largely intercepted by drainage ditches. Groundwater discharges locally at discrete points, controlled by geological and geomorphological configurations below which flushes are developed. Groundwater moves laterally to the river channel through the more permeable alluvial deposits.
Low-lying backlands are affected by fluctuating groundwater levels although levées adjacent to the river channel become waterlogged to the surface only when river levels are high. Flooding from the river occurs for only a few days in most years. The rivers are spatey in character, levels responding rapidly to rain events but remaining at high levels for only short duration. River stage rarely exceeds bank full for more than a single day though floodwater usually remains standing in backlands for longer periods.
Where wetlands are confined to floodplains of coarse textured material without contributions of water from an underlying aquifer, as in the case of the Loire, water levels in river marginal wetlands are controlled by the height of the river.
In the semi-arid conditions of central Spain, where river marginal wetlands are further stressed by the lowering of regional aquifers due to waler abstraction and river engineering works to facilitate water transfer, some wetlands are no longer capable of maintenance by natural hydrological processes and require measures such as the pumping of groundwater from depth for their survival.
Wetness on the Shannon floodplain is maintained largely by rainfall which supports an alluvial aquifer in which water cycles at shallow depth and is separated from an underlying regional system by intervening
- 385
impermeable clays. The land is also subject to frequent persistent Hooding from the river, though mixing with groundwater is minimal.
HGMUs can be characterised and distinguished in terms of readily measured and interdependent physico-chemical properties such as hydrological regime (pattern of water table fluctuations), redox potential, oxygen content of air in soil pores and observable or measurable soil profile characteristics such as texture, colour and organic matter status, though other properties can be of over-riding importance in determining nutrient dynamics or ecological characteristics. Major factors here are anthropogenic effects such as N and Ρ supply from either on-site application or received from higher in the catchment via runoff, artificial land drainage, groundwater influx or river Hooding. Modification of plant communities can result from grazing, mowing, burning and other management factors.
The overall result of all these effects may be considered in terms of a complex land use/management overlay which modifies the natural system and is expressed as subdivisions of HGMUs into discrete vegetation types, and spatial variations of hydrological and biogeochemical functioning.
Spatial variability
HGMUs provide a useful strategic framework for the development of a predictive system of functional analysis for river marginal wetlands. However, at the operational level local factors may assume critical importance as exemplified from some of the FAEWE project findings:
• Local geological and geomorphological configurations at the Torridge control the discharge of groundwater at discrete places. The resultant local variations in soil and vegetation development are important in the support of habitats and maintenance of biodiversity.
• Discharge of groundwater on footslopcs creates areas of overland How (flushes) giving additional opportunities for water quality improvement through enhanced denitrification and dilution.
• The pattern of routing and storage of surface flows determines the effective area involved in nutrienl storage/sink functions. Storage has been shown to be important in both Ν and Ρ dynamics. In a short term study of nitrate concentrations found in surface drainage waters at Kismeldon, denitrification accounted for about one third of the decline in concentration occurring between the upper and lower parts of the slope system. It is suggested that the remainder was stored in surface waters detained within the ecosystem, where it gradually denitrified. Rales of denitrification measured elsewhere al the Torridge sites suggest that low rates predominate over most of the wetland, indicating the likelihood of small areas such as flushes being responsible for most of the nulricnl transformation and removal. Establishing criteria for identifying these areas will form an important part of the predictive system to assess the functional capability of wetland systems to deliver environmental benefits. Work to date indicates these areas often do not parallel the river channel and can he at some distance from it within the river corridor.
This has a major bearing on strategies for the protection of river water quality, restoration of ecological functioning and identifying zones for conservation management. It highlights the importance of site selection when creating 'buffer zones' to protect and enhance the environmental quality of river systems. Further research is continuing to improve the ability to identify locations of enhanced nutrienl transformation. But in any event strategies based on strips parallel to the river channel, unless accurately targeted, are generally an unrealistic way of achieving waler quality protection/enhancement.
• The ability of different soils to retain phosphorus, and ihus improve water quality, has been emphasised through the use of Ρ adsorption isotherms. Vertical (horizons through the soil profile) and horizontal (mappable soil types and properties e.g. Icxlure, organic carbon and amorphous iron content) spatial differences influential in controlling the Ρ adsorption capacity of soils have been identified, thereby offering the opportunity to define readily observable or measurable predictors for the dynamic of Ρ adsorption.
• The position of individual HGMUs along a sequence or gradient is important in determining the nature, magnitude and frequency of events and conditions, such as flooding and waterlogging, which
386

are important in controlling the processes such as decomposition and sedimentation, critical to the delivery of functioning of the system.
• Phytosociological studies have demonstrated the degree to which wetlands function to support a range of habitat types, often having diverse and specialised hydrological requirements and thereby contributing substantially to the maintenance of biodiversity. Adjacent vegetation units may differ fundamentally in their generic characteristics and functioning e.g. ombrotrophic and eutrophic types at the Torridge and Shannon sites, yet form an important complimentary mosaic within the ecosystem complex.
• Knowledge of plant assemblage characteristics can be used as bio-indicators of major primary ecological processes maintaining habitats and species and of secondary ecological factors such as disturbance (grazing, trampling, cutting, drainage, etc), which introduce spatial variability at a range of scales. Vegetation records the effects of past disturbance as integrated with present effects, in contrast with species which respond to more recent or present impacts. Patch dynamics are the result of these two kinds of processes.
• The ornithological studies have highlighted the importance of hydrological and vegetational spatial variability in the feeding activities of birds. In Ireland the wildfowl exhibited no overall dependence on any one type of vegetation. However the presence or absence of flooded ground was identified as being of paramount importance to their feeding habits. In Spain the availability of food supply for the bird population that was present on the beds of dried out lakes emphasised both the temporal and spatial importance of the dry phase present within the fluctuating hydrological regimes of Mediterranean type semi-arid wetlands.
Temporal variability
The studies of decomposition and nutrient transformations have indicated the importance of seasonal variations in temperature interacting with moisture changes to determine process rates. Where sites remain unsaturated throughout the year temperature is the primary control on decomposition rate, strong seasonal patterns emerging. Where the water table remains high for much of the time, decomposition rates increase when the water table drops, particularly when accompanied by a rise in temperature during the summer. There was also found to be a maximum level for the duration of waler-logging and for temperature, above and below which decomposition rates declined.
There are few discernible spatial or temporal patterns in rates of denitrification measured at the study sites, which in most cases are nitrate limited, although a moderate level of variation was found in the case of the Torridge and Loire sites. The less variable Shannon results did indicate the highest rates coincided with the highest temperatures during summer, though all values were low.
Studies of phosphorus dynamics at the Torridge indicate some seasonality in topsoil Ρ content, which is explained in terms of biological control. Inorganic Ρ was at a maximum and organic Ρ at a minimum in summer, when increased microbial activity promotes mineralisation. An overall decrease in Ρ in summer is the result of plant uptake. In contrasi the seasonal changes in the inorganic and organic components are reversed in the subsoils due to chemical controls, whereby under the wetter conditions of winter, reduction of organo-mincral complexes leads to a release of inorganic P.
Functioning related to flooding events can be more difficult to predict. Work on the Shannon has developed the use of a GIS to map the extent of Hooding likely to result from given river stage observations. Archive hydrometric data successfully predicts seasonal patterns of Hooding extent and duration.
Rapidly changing environmental conditions, such as during Hood events, can have variable temporal effects on the dynamics of processes and functions. The physical presence of water on the Hoodplain can have an immediate effect on the behaviour of certain groups of' fauna (e.g. feeding waders may move to an alternative site depending on Hood conditions). Biogeochemical processes such as denitrification may respond more slowly, being dependent upon factors such as the rate of oxygen depiction in the soil and development of anaerobic conditions. Moisture conditions controlling decomposition rales may critically depend upon rainfall patterns over the preceding days or weeks.
387
Climatic variability
Climatic variability reinforces the seasonal factors discussed above. The welter, cooler conditions in Ireland reduce the variability in wetness and temperature which arc important controls in many process rates. In contrast, the continental conditions in France and more dramatically lhe semi-arid environment of central Spain give rise to substantial seasonal variations in temperature, and to a lesser extern rainfall. In Spain many of the wetlands are strongly seasonal and experience major changes in process dynamics and ecosystem responses such as strategies adopted by primary producers between wet and dry conditions. Relationships need to be better understood if they are to be used a basis for predicting the effects of climatic change on wetland functioning.
Historical/anthropological effects
A comprehensive understanding of wetland ecosystem functioning requires account to be taken of historical impacts including recent human activities. These effects are demonstrated in a wide range of results based on the underlying research design framework using paired sites wilh contrasting levels of impact. A specific example is that of the long term storage of phosphorus resulting from past fertiliser use and pig husbandry in the impacted Torridge site at Bradford Mill. Compared with the relatively unimpacted site at Kismeldon plant productivity is higher which gives rise to litter of higher quality (lower C/N and C/P ratios). This increases rales of mineralisation, making more nutrients available for processes such as leaching, uptake and denitrification.
The most dramatic alteration to wetland environmental conditions has been observed ai lhe Spanish sites due to the impact on the hydrological regime and the resultant depletion of the groundwater, and the subsequent maintenance of the wetland sites through inter-basin waler transfers. A detailed knowledge of (he past and present anthropogenic management strategies is vilal in attempting to assess the current functioning of the ecosystem.
Problems have also been encountered in the recognition of specific impacts. The Shannon sites were originally selected to study the impact of sedimentation on RMWs. Initial field reconnaissance indicated that the Clonmacnoise RMW site was impacted by sedimentation, whilst the Little Brosna site was unimpacted. The detailed research into the sedimentation history at these two sites subsequcnlly established that active sedimentation on the Shannon Hoodplain was no longer taking place, conflicting wilh the interpretations of initial field studies. This emphasises the importance of the influence of historical features within the soil component of RMWs, and the need to interpret inherited characteristics accurately.
The land use history of a wetland site often can be critical in determining not only present use but qualitative and quantitative aspects of functioning through modifications to the original natural characteristics. There are also implications for decision making over the requirements for wetland rehabilitation in order to maximise the restoration of functional capacity. Examples of actions include the choice of restoration of blocking of an artificial drainage system, removal of Hood prevention measures or cessation of the pumping which has maintained a depressed groundwater table, for example as required for peat extraction from a bog or fen.
Compatibility of ecosystem functioning
Investigations of the development and functioning of an ecosystem tend to pay little attention lo the interaction between different functions and mutual compatibility of uses. However, these relationships arc very important in the present context, where emphasis is on assessing the benefits which derive from one or more functions under particular ecosystem conditions. For example, in the case of slope wetlands of the type studied at the Torridge, it would be possible to adjust the configuration of surface flows to extend over a wider area of the wetland in order to enhance the opportunities for nutrient retention and transformation and thereby lead to a significant improvement in river water quality. However the tradeoff is that it could result in loss of biodiversity due to alternation of the conditions which support specialised habitats and increasingly threatened associated species.
388
Biodiversity in the context of plant tolerance, stress and disturbance
Studies have focused on a range of impacts which produce stress and disturbance in wetland ecosystems. Some species or plant communities arc resilient or tolerant to certain stresses or impacts, while others are particularly vulnerable. In the case of oligotrophic systems it is necessary for low nutrient status to be maintained. Eutrophic conditions may result from surface or groundwater inputs and cause primary productivity to rise by a factor of three. This approach, based on the identification of factors affecting biodiversity rather than focusing on species lists, rarities or minimal areas, has emphasised the value of recognising the main stresses such as low nutrient levels, low soil available water capacity and waterlogging, which are important in maintaining biodiversity.
The work using invertebrate databases provides guidance on optimal management for habitat and biodiversity maintenance, which can be linked to the HGMU pattern. In general it is reaffirmed that the maximum biodiversity is obtained under moderate or low levels of human impact. Application of plant strategy analysis techniques provides procedures for the early warning of fundamental ecological changes due to stress, before changes have actually occurred in plant community composition.
In the case of semi-arid environments the performance of Phragmites stands rather than leaf pressure potential provides a better indication of stress due to desiccation.
Questions of scale
Scale issues are of considerable importance in ecological debate in the field of wetland science and management. Invertebrate studies on hoverilies have demonstrated their diverse habitat requirements. Developmental stages are relatively immobile and more habitat specific than adults. Only selected species are able to withstand sites subject to rapid change such as inundation by noodwater.
Bird studies have indicated the interdependence of HGMUs in providing the habitat support function. In Spain birds using seasonal wetlands are opportunistic feeders exploiting both wet and dry phases. In Ireland wader species move off the callows for feeding, the Hoodplains providing roosting sites.
In the case of hydrological support, small scale local patterns are important in some areas, for example at the Torridge, where aquifer recharge may take place only tens of metres upslope of the site where discharge occurs. In Spain inputs to the regional aquifer may originate hundreds of kilometres off-site and the water may have an aquifer residence time of hundreds or thousands of years.
Site based studies have been essential to establish specific information on process rates and local controlling variables. Broader studies under FAEWE have indicated the importance of land use changes at the catchment scale in controlling on-site functioning on river marginal wetlands. For example afforestation at the Little Brosna has led to a reduction in Hooding and sedimentation. It is now necessary to extend the site-based work to the catchment scale to enable application of the results to the appropriate level of planning and functional prediction. A proposed method is the development of catchment zonation maps (Fig. 7.1) which, by summarising the relationships between management factors and soils types, can identify and target areas which may be particularly important for certain functions, e.g. denitrification or phosphorus retention. Catchment zonation maps may be useful also as a tool for recognising key sites for restoration of wetland conditions as well as conserving existing ones.
Recommendations for further research
The work programme undertaken during the FAEWE Project has identified a number of gaps within our understanding of the dynamic processes operating in river marginal wetlands, and exposed limitations in our knowledge of the predictive relationships between process and function. The proposed research programme for FAEWE Phase II will provide additional scientific information to improve substantially the already advanced science-base and the ability to predict functioning through the use of the functional assessment procedures.
Phase II innovations will include the extension of the functional assessment procedures to the catchment scale, the development and application of a GIS. and the integration of socio-economic valuations into the assessment scheme.
389
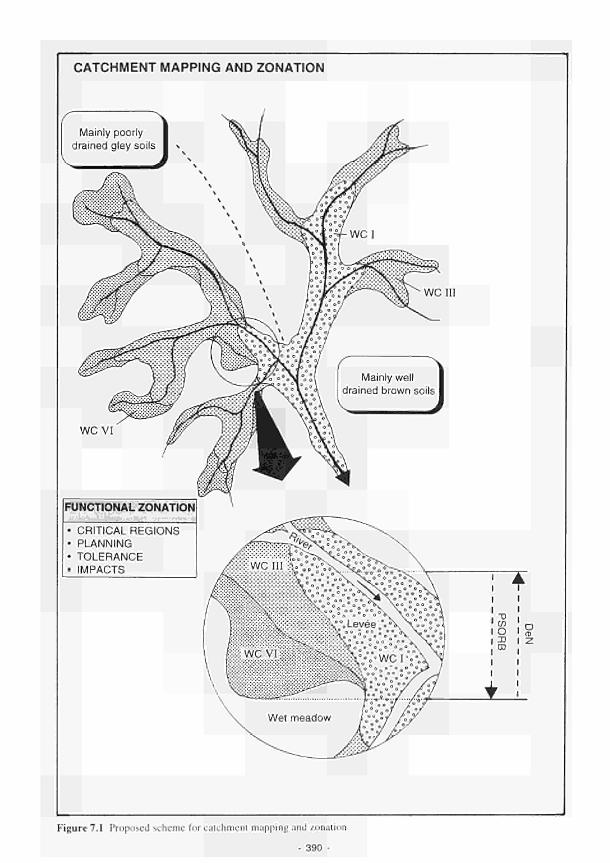
CATCHMENT MAPPING AND ZONATION
wem
"O CO O 3 CD
D
Figure 7.1 Proposed scheme for catchment mapping and zonation
- 390 -
Specific objectives will focus on:
• The investigation of nutrient dynamics in order to assess N and Ρ movements between hydrogeomorphic units; changes in nitrate and phosphate levels under variable soil and hydrological conditions; and a determination of the importance of local complexities in surface hydrology to the nutrient removal function.
• Plant trait responses to chemical stresses, due to the mobility and availability of potentially toxic elements under differing environmental conditions.
• Identification of sub-sets of vegetation which can be used as bio-indicators of stress, that will allow for the development of statistical models to establish the linkages between plant traits and specific wetland functions.
• Integration of the hydrological and nutrient dynamic models to develop a more general application in predicting effects of environmental change.
• Continued data correlation and modelling to refine the controlling variables of nutrient and primary production related functions.
• Extending the invertebrate group diagnostic potential beyond the Hoodplain to the wider catchment scale, combined with calibration of the predictive models from other sites both within and outside the European Union.
• The production of interpretative maps to enable the identification of key plant and vegelation characteristics in the functional assessment procedures, and the use of plant assemblage characteristics and cover to predict the degree of human impact and neglect and to indicate artificiality/naturalness.
• The development and integration of socio-economic valuations of river marginal wetland functions.
• The development of more operational approaches to catchment management, through the integration of the computer models, the GIS and the functional assessment procedures, all of which arc driven by the advancements made in the underlying science base.
The Phase II work programme commenced in Juiy 1994 and is due to continue for a further two years.
391

REFERENCES ABER, J.D. and MELILLO, J.M. (1982) Nitrogen immobilisation in decaying handwood leaf litter as a
function of initial nitrogen and lignin content, Can. J. Bot. 60, 2263-9
ADAMUS, P.R. (1983a) A Method for Wetland Functional Assessment. Volume I. FHWA Assessment Method Rep. No. FHWA-IP-82-23, Federal Highway Administration, U.S. Department of Transportation, Washington, D.C.
ADAMUS, P.R. (1983b) A Method for Wetland Functional Assessment. Volume II. FHWA Assessment Method Rep. No. FHWA-IP-82-24, Federal Highway Administration, U.S. Department of Transportation, Washington, D.C.
ADAMUS, P.R., STOCKWELL, L.T., CLAIRAIN Jr., E.J., SMITH, R.D. and YOUNG, R.E., (1987) Wetland Evaluation Technique (WET) Vol. II. U.S. Army Corps of Engineers, Waterways Experiment Station, Vicksburg, MS.
ADAMUS, P.R. and STOCKWELL, L.T., (1983) A Method for Wetland Functional Assessment: Volume I. Critical Review and Evaluation Concepts. Rep. No. FHWA-IP-82-23, Federal Highway Administration, U.S. Department of Transportation, Washington, DC.
ADAMUS, P.R., STOCKWELL, L.T., CLAIRAIN Jr., E.J., MORROW, M.E.. ROZAS, L.P. and SMITH, R.D., (1991) Wetland Evaluation Technique (WET) Vol. I, U.S. Army Corps of Engineers, Waterways Experiment Station, Vicksburg, MS.
AERTS, R., (1989) Plant strategies and nutrient cycling in heathland ecosystems. PhD thesis. University of Utrecht, The Netherlands.
AERTS, R. and BERENDSE, F., (1988) The effect of increased nutrient availability on vegetation dynamics in wet heathlands, Vegetatio. 76: 63-9
ANDERSON, G., (1960) Factors affecting the estimation of phosphate esters in soil, J. Sci. Food and Agrie. 11. 497-503
AVERY, B.W. (1987) Soil Survey Methods: A Review. Soil Surv. Tech. Monogr. No: 18
AVERY. B.W. and BASCOMB, CL. (eds) (1974) Soil Survey laboratory methods. Soil Surv. Tech. Monogr. No. 6
BACHE, B.W. and WILLIAMS, E.G., (1971) A phosphorus sorption index for soils, J. Soil Science. 22:289-300.
BAKER, C.J, (1994) * Aspects of Nitrogen Dynamics and the Functioning of River Marginal Wetlands. Unpublished PhD thesis, University of Exeter, UK.
BAKKER, S.A., BELTMAN, Β., DE KLEIN, C.A.M., MESTERS, C. and OORSCHOT, M.M.P. van, (1993) Method Manual Project. Group Landscape Ecology, Dept. of Plant Ecology and Environmental Biology, University of Utrecht, The Netherlands.
BARROW, N.J., (1978) The description of phosphate adsorption curves, J. Soil Sci. 29, 447-62
BASCOMB, C.L. (1961) A calcimeter for routine use on soil samples, Chetnv Ind, 1826-7
BASCOMB, C.L. (1964) Rapid method for the determination of cation-exchange capacity of calcareous and non-calcareous soils, J Sci. Fd Agrie. 15, 821-3.
BASCOMB, C.L.. (1968) Distribution of pyrophosphate-extractable iron and organic carbon in soils of various groups, J. Soil. Sci. 19. 251-68
393
BENDELOW, V.C. and HARTNUP, R. (1980) Climatic Classification of England and Wales. Soil Surv. Tech. Monogr No. 15.
BERENDSE. F.. (1990) Organic matter accumulation and nitrogen mineralisation during secondary succession in healhland ecosystems. J. Ecol.. 78: 413-27
BERENDSE, F.. BERG, B. and BOSATTA, E., (1987) The effect of lignin and nitrogen on the decomposition of litter in nutrient-poor ecosystems: a theoretical approach, Can. J. Botany. 65: 1116-20.
BERENDSE, F., BOBBINK. R. and ROUWENHORST. G., (1989) A comparative study on nutrient cycling in wet hcathland ecosystems. II. Litter decomposition and nutrient mineralisation, Oecologia, 78: 338-48.
BERNALDEZ. F.G., MONTES. C , PEREZ, C. and BESTEIRO, A.G., (1989). Minimización dc los impactos ecológicos originados por una posible explotación extraordinaria de las aguas subterráneas en la Comunidad de Madrid. Proyecto de Investigación. Segundo Informe. Canal de Isabel II y Departmento de Ecología, UAM, Spain.
BINK, F.A. and SIEPEL, H, (1986) Life history tactics and strategics in butterflies, In: Velthuis, H.H.W, (ed). Proc. 3rd European Congress of Entomology. Amsterdam. 409-12.
BINKLEY. D„ and HART S.C., (1989). The components of nitrogen availability in forest soils. In: Advances in Soil Sciences. Springer-Verlag. New York, N.Y. 57-112.
BLACK. C.A. and GORING. C.A.I.. (1953) Organic phosphorus in soils, Agronomy, 4: 123-52.
BOETERS, H.D., (1973) Die Gattung Bythinella und die Gattung Marstomopsis in Westeuropa. 1: Westeuropäische Hvdrobiidae. 4: (Prosobranchia), Malacologica 14: 1-285
BOHN, H.L., (1971) Redox Potentials. Soil Sci., 112:39-45.
BONADONA, P., (1971) Catalogue des coléoptères carabiques de France, Suppl. Nouv. Rev. d'Entomologie, Toulouse.
BOORMAN, D.B. and HOLLIS. J.M. (1990) A hvdrologicallv-hased classification of the soils of England and Wales. MAFF Conf. of River and Coastal Eng., Univ. of Loughborough.
BORNETTE. G.. AMORÖS, C and CHESSEL, D (in press) Rejuvenation in former braided channels of the Rhone River: successional patterns and allogenic processes, J. Vegelation Science.
BOUCHET, P., (1990) La malacofaune française: endemisme, patrimoine naturel el protection, Rev. Ecol (Terre Vie), 45: 259-88.
BOURNAUD, M., RICHOUX, P. and USSEGLIO-POLATERA, P.. (1992) An approach to the synthesis of qualitative ecological information from aquatic Coleóptera communities. Regulated Rivers: Research and Management 7: 165-80.
BOWDEN, W.B., (1987) The biogeochemistry of nitrogen in freshwater wetlands, Biogeoclieniislrv, 4: 313-48.
BOWMAN, J.J., MCGARRICLE, ML. and CLABBY, K.J. (1993) Water quality assessments, nutrient sources, conclusions and recommendations. Lough Dcrg, an investigation of culrophism and ils causes - Report to Lough Dcrg Working Group. Environmental Research Unii
BRAUN-BLANQUET, J. (1925) Zur Wertung der Gescllschaftstrcuc in de Pflanzcnsoziologic. Vierteliahrsschr. Naturf. Ges. Zürich, 70: 122-49
394 -

BRAY, R.H. and KURTZ, L.T., (1945). Determination of total, organic and available forms of
phosphorus in soils. Soil Sci.. 59
BRINSON, M.M., (1977) Decomposition and nutrient exchange of litter in an alluvial swamp forest,
Ecology 58: 6019.
BRINSON, M.M., (1993). A Hydrogeomorphic Classification for Wetlands. Technical Report WRPDE
4. U.S. Army Corps of Engineers.
BRINSON, M.M., LUGO, A.E. and BROWN, S, (1981) Primary productivity, decomposition and
consumer activity in freshwater wetlands. Annu. Rev. Ecol. Svstematics, 12: 12361.
BRINSON, M.M., KRUCZYNSKI, W., LEE, L.C., NUTTER, W.L., SMITH.R.D. and WHIGHAM.
D.F., (1994) Developing an approach for assessing the functions of wetlands. In: Mitsch, W.J.
(ed), Global Wetlands: Old World and New. Elsevier, Amsterdam.
BROWN, Α., KITTLE, P., DALE, E.E. and HUFFMAN, R.T., (1974) Rare and Endangered Species,
Unique Ecosystems and Wetlands, Department of Zoology and Department of Botany and
Bacteriology, University of Arkansas, Fayelteville, AR, USA.
BUNNELL, F.L., TAIT, D.E.N., FLANAGAN, P.W. AND van CLEVE, K., (1977) Microbial respiration
and sublrate weight loss. I. A general model of the inHuences of abiotic variables. Soil Boil
Biochem, 9: 3340.
BUREAU DES RECHARGES GÉOLOGIQUES ET MINIERES (BRGM) (1972). Plaine Alluviale du
Val D'Allier au nord de Moulins. Elude Hydrogéologique preliminaire, Minstere du
Dévelopemenl Industriel et Scientifique, service Géologique National.
BRGM (1977). Carte Géologique de la France 1/8.000. St. Pierre. Ministère de l'Industrie cl la
Recherche.
BRGM (1983). Carte Géologique de la France 1/50.000 Sancoins no. 548. Service Géologique National.
BRGM, CETEL (Centre d'Etudes Tecniques de Equipment de Lyon) (1985). Interaction des resources en
granulats et en eaux souterraines entre Moulins et le conlluence avec la Loire (Bec d'Allier).
Definition des zones d'exploilabilité des granulats et de la nappe alluviale, Ministère de
l'Urbanisme de Logement et de Transports, Ministère de Redéploiment Industriel et du
Commerce Extérieur.
CAMPERDON. P (1981) Hivernage du canard siflleur (Anan penelope L) en Camargue, (France),
stationnements et activilés, Alauda, 49: 16193
CASTELLA, E., SPEIGHT, M.C.D., OBRDLIK, P., SCHNEIDER, E. and LAVERY, T.A., (in press) *
A methodological approach to the use of terrestrial invertebrates for the assessment of alluvial
wetlands, J. Wetland Ecology and Management,
CASTELLA, E. and SPEIGHT, M.C.D. (in press) * Knowledge representation using fuzzy coded
variables: and example with Syrphidae (Diptera) and the assessment of riverine wetlands,
Ecological Modelling.
CEC, (1985) Soil Map of the European Communities 1:1.000.000, Directorate General for Agriculture,
BrusselsLuxembourg.
CHAPÍN, F.S.IIL, VITOUSEK, P.M. and van CLEVE, K., (1986) The nature of nutrienl limitation in
plant communities. Am. Nat.. 127:4858.
395

CHESSEL, D. and MERCIER. P. (1993) Couplage de triplets statistiques et liaisons espèces -
environnement. In: Lebreton. J.D., Asselain, B (eds), Biométrie cl Environnement. Masson.
Paris.
CHORLEY, R.J. and HAGGETT, P., (1967) Socio-Economie Models in Geography: Parts I and HI of
Models in Geography, University Paperbacks, Melhuen, London.
CLAYDEN, B. ( 1971 ) Soils of the Exeter district. Mem. Soil Surv. Gt. Br.
CLEMENT, B. (1994) * Svnecology of plant communities within river marginal wetlands. Proceedings of
the 4th workshop of the FAEWE EC-STEP project, Madrid, Spain.
COLBOURN, P., AND HARPER, J.W., (1987) Denitrification in drained and undrained arable clay soil.
J. Soil Sci.. 38:531-9.
CONNER, W.H. and DAY, Jr, J.W. (1982) The ecology of forested wetlands in the Southeastern United
States, In: Gopal, B., Turner, R.E., Wetzel, R.L. and Whigham, D.F. (eds). Wetlands: Ecology
and Management pp.69-87, National Institute of Ecology and International Scientific
Publications, Lucknow Publishing House, Lucknow, India.
COSTLE, D.M. (1978) The national stake in wetlands. In: Greeson, P.E., Clarke, J.R. and Clarke J.E.
(eds) Wetland functions and values: the stale of our understanding. Am. Water Res. Ass.,
Minneapolis, U.S.A., 7-10.
COWARDIN, L.M., CARTER, V., GOLET, F.C. and LaROE, E.T. (1979) Classification of Wetlands
and Deepwater Habitats of the United States, US Dept. Int. Rept, FWS/OBS-79-31, 35pp
CRAWFORD, R.M.M., (1989). Studies in plant survival. Blackwell Scientific. Oxford.
CUNGE, J.Α., (1983) Feasibility of mathematical modelling of meanders. In: River Meandering,
Proceedings of the Conference Rivers '83. 794-809, American Society of Civil Engineers, New
York.
DE LAUNE, R.D., REDDY, CN. and PATRICK, Jr. W.H. ( 1981 ) Organic matter decomposition in soil
as influenced by pH and redox conditions, Soil Biol. Biochcm, 13: 533-4.
DENIS, R.L.H. and SHRIEVE, T.G. (1991) Climatic change and the British butterfly fauna: opportunities
and constraints. Biological Conservation. 55: 1-16
DEVILLERS, P., DEVILLERS-TERSCHUREN, J. and LEDANT, J.P., (1991) CORINE Biotopes
Manual: Habitats of' the European Community. Part 2. Commission of the European
Communities, Luxembourg.
DE WIT, CT., DIJKSHOORN. W and NOGGLE, J.C, (1963) Ionic Balance and growth of plants, Vers!,
Landb, Ond. 69: 15, 1-68.
DEPARTMENT OF THE ENVIRONMENT ( 1988) The Nitrate Issue. HMSO, London.
EUROSTAT (1990). Nomenclature of territorial units for statistics (NUTS). Statistical Office of the
European Communities, Luxembourg.
EYRE. MD., FOSTER. G.N. and YOUNG, A.G., (1993). Relationships between water-beetle
distributions and climatic variables: a possible index for monitoring global climatic change, Arc.
Hvdrobiol., 127:437-50.
FAO (1973). Irrigation, drainage and salinity. Hutchinson/FAO/UNESCO, London
396
FARQUHARSON, F.A.K., MACKNEY, D., NEWSON, M.D. and THOMASSON, A.J. (1978)
Estimation of runoff potential for river catchments from soil surveys. Soil Surv. Spec. Surv. No.
11. Harpenden.
FAULKNER, S.P. and RICHARDSON, C.J., (1989). Physical and chemical characteristics of' freshwater
wetland soils. In: Hammer, D.A. (ed), Constructed wetlands for wastewater treatment, 1st ed,
Vol. 1. Lewis Publishers, Michigan, USA, 4172.
FLEISCHER, S. (1990) Wetlands a nitrogen sink, Acid Magazine, 9: 268
FLORIN, M. (1994) * Functioning of saline temporary lagunas of La Mancha. Relationships between
hydric and hydrochemical fluctuations and trophic dynamics, PhD dissertation, Department of
Ecology, Universidad Autónoma de Madrid, (title translated into English).
FLORIN, M., MONTES, C and RUEDA, F., (1993) * Origin, hydrologie functioning, and morphometric
characteristics of small, shallow, semiarid lakes (lagunas) in La Mancha, Central Spain.
Wetlands 13(4): 24759.
FORNES J.M. (1994) * Estudio hidrológico de las lagunas de Tirez, Peña Hueca y El Masegar. Tesis
Doctoral. Facultad de Geológicas, Universidad Compútense de Madrid.
FREITAG, H., (1962) Einführung in die Biogeographie von Mitteleuropa unter besonderer
Berücksichtigung von Deutschland. G. Fischer, Stuttgart.
FRENCH, D.D., (1988) Patterns of decomposition assessed by the use of litter bags and cotton strip assay
on fertilised and unfertilised heather moor in Scotland. In: Harrison, A.F., Latter, P.M., and
Walton, D.W.H. (eds), Cotton Strip Assay: an index of decomposition in soils. ITE Symposium
No. 24. Institute of Terrestrial Ecology, GrangeoverSands, Cumbria.
GALVIN, Ρ (1994) * A study of the relationships between habitat functioning (for selected bird species)
and major wetland processes in Hoodplain ecosystems. Unpublished report to National Parks and
Wildlife Services, Dublin.
GAMBRELL, R.P. and PATRICK, Jr, W.H. (1978) Chemical and microbiological properties of
anaerobic soils and sediments. In: Hook. D.D. and Crawford, R.M.M. (eds). Plant life in
anaerobic environments, 1st ed. Vol. 1, Ann Arbor Science, Michigan, 375423.
GARCIA, M. and LLAMAS, M.R., (1993) * Impacto de los regadios en la Llanura Manchega.
Ecosistemas. AbrilJunio, no. 5: 413.
GARCIA, M. and LLAMAS, M.R. (1994) Influence of groundwater exploitation on the functioning of the
Tablas de Daimiel National Park (Spain). Poster in XIX Assembly of the European Geophysical
Association (Grenoble 1994), Annales Geophvsicale, Supplement II to Vol. 12. C413 (abstract)
GARNETT, M. and GARNETT, Α., (1989). La Mancha project, February June 1989. International
Council for Bird Preservation.
GILVEAR, D.J., TELLAM, J.H., LLOYD, J.W. and LERNER, D.N. (1989) The hydrodynamics of East
Anglian fen systems. Unpublished final report to Nature Conservancy, National River Authority
and Broads Authority.
GIRARD. G.L. (1941) The mallard: its management in western Montana, J. Wildlife Management. 5:
23359
GOOD, R.E., WHIGHAM, D.F. and SIMPSON, R.L. (eds) (1978) Freshwater Wetlands: Ecological
Processes and Management Potential. Academic Press, New York.
GOODE, D. (1977) Pcatlands, A Nature Conservation Review. Vol. 1, Ratcliffe, D.A. (ed), Cambridge
University Press, 24987.
397

GOPAL, B„ and MASING. V„ (1990). Biology and Ecology. In: B. Palten (cd). Wetlands and Shallow Continental Water Bodies. SPB Academic Publishing. The Hague, The Netherlands.
GOSSELINK, J.G. and TURNER, R.E. (1978) The role of hydrology in freshwater wetland ecosystems. In: Good, R.E., Whigham, D.F. and Simpson, R.L. (eds), Freshwater Wetlands, Ecological Processes and Management Potential. Academic Press. New York, 63-78
GREWAL, K.S., BUCHAN. G.D. and SHERLOCK. R.R.. (1991). A comparison of three methods of organic carbon determination in some New Zealand soils. J. Soil Sci. 42: 251-7.
GREGORY. S.V., SWANSON, F.J., MCKEE, W.A. and CUMMINGS. K.W.. (1991). An ecosystem perspective of riparian zones. Bioscience 41: 540-51.
GRIME. J.P. (1979) Plant Strategies and Vegelation Processes. Wiley, Chichester.
GRIME, J.P., HODGSON, J.G. and HUNT, R. (1988) Comparative Plant Ecology, Unwin Hyinan, London.
GUERRUCCI, M.A. (1973) Aspects généraux du polymorphisme du Cepea hortensis en France. Malacologica. 14: 333-8.
HAMPTON, T., (1992). Estimation of recharging flows to a small weathered sandstone aquifer and associated wetland habitat al Kismeldon Meadows SSSI, North Devon. Unpublished MSc. project report. School of Earth Sciences, University of Birmingham, UK.
HARROD, T.R. ( 1981 ) Soils in Devon V: Sheet SS6I (Chulmleigh), Soi Surv. Ree. No. 70
HARWOOD, J.E. (1969) Water Res. 3: 273
HASLAM, S.M.. (1970). Variation of population type in Phragmites communis Trin. Annals of Botany, 34: 147-58.
HASSINK. J., ( 1992). Effects of grasssland management on N mineralisation potential; microbial biomass and N yield in the following year. Nethcrl. J. Agri. Sci., 40: 173-85.
HASSINK, J, and NEETESON. J.J. (1991) Effects of grassland management on the amounts of soil organic N and C, Nethcrl. J. Agri. Sci., 39: 225-36.
HAYCOCK, N.E. and BURT, T.P. (1993) Role of floodplain sediments in reducing the nitrate concentration of subsurface run-off: a case study in the Cotswolds, UK, Hydrological Processes, Vol. 7.
HAYNES. R.J. (1986) The decomposition process: Mineralisation, immobilisation, humus formation and degradation. In: Haynes. R.J. (ed), Mineral nitrogen in the plant-soil system. Academic Press, London, 52-126.
HEERY, S. (1983) A vegetation study of the Little Brosna floodplain grasslands. Unpublished report, National Association of Regional Game Councils, Ireland
HEERY, S. (1991) Plant communities of the grazed and mown grasslands of the R Shannon callows, Proc. R. Ir. Acad., 91 B: 1-19
HEERY. S. ( 1994) Flooding in spring on the Shannon Callows at Shannon Harbour, Ireland,
HEIL. G.W. and BOBBINK, R. (1993) "Calluna". a simulation model for evaluation of impacts of atmospheric nitrogen deposition on dry hcalhlands, Ecological Modelling, 68: 161-82.
- 398 -
HELLINGS. S.E. and GALLAGHER, J.L., (1992). The effects of salinity and flooding on Phragmites australis. J. App. Ecol., 29(1): 41-8.
HILL, M.O. (1979) TWINSPAN - A FORTRAN program for arranging multivariate data in an ordered two-way table by classification of the individuals and attributes. Cornell University, New York.
HILLEL, D., (1980). Fundamentals of soil physics. 1. Academic Press, New York.
HILLS, J.M., MURPHY, K.J., PULFORD, I.D. and FLOWERS, T.M. (1994) * The use of survival strategy theory to classify and predict changes in European wetland vegetation. Functional Ecology, in press.
HODGSON, J.M. (ed) (1981) Soil Survey field handbook. Soil Surv. Tech. Monogr. No. 5
HOGAN. D.V. and MALTBY, E. ( 1990a) A scoping study for environmental impact assessment of raised water levels on the Somerset Levels. Report 6, Wetland Ecosystems Research Group, Department of Geography, University of Exeter, U.K., Report to N.C.C. - Contract No: 13/F4A/242/DA02.
HOGAN, D.V. and MALTBY, E. (1990b) Hellings Park Environmental Investigations, Report to the National Trust, Wetland Ecosystems Research Group, Report 10, Department of Geography. University of Exeter, UK.
HOLLANDS, G.G (1987) Hydrogeologie classification of wetlands in glaciated regions. In: Kusler, J, (ed), Wetland Hydrology. Proceedings from a national wetland symposium. Association of Stale Wetland Managers, Inc., Berne, New York, 26-30.
HOLLIS, G.E., (1992). The hydrological functions of wetlands and their management. In: P.A. Gerakis (ed). Conservation and management of Greek Wetlands; Proceedings of a Greek Wetlands Workshop held Thessaloniki, Greece.
HOOYER, A. (1991) * Introduction to the Middle Shannon catchment. Ireland. Report 11/1, EC-STEP project.
HOSKINS, J.L. (1944) An interchangeable micro and macro distillation apparatus, Analyst. Lond. 69: 271
HUNTER, R.F. (1962) Hill sheep and their pasture: a sludy of sheep grazing in south-east Scotland, J. Ecol. 50:651-80
HUTCHINSON, CD. (1979) Ireland's wetlands and their birds. Irish Wildlife Conservancy
HVORSLEV. H (195 I) Timelag and Soil Permcahilitv. Groundwater Observations Bulletin No. 36. U.S. Corps of Engineers,
INESON, P., BACON, P.J. AND LINDLEY, D.K., (1988) Decomposition of cotton slrips in soil: analysis of the world data set. In: Harrison, A.F., Latter, P.M., and Walton, D.W.H. (eds), Cotton Strip Assay: an index of decomposition in soils. ITE Symposium No. 24. Institute of Terrestrial Ecology, Grange-ovcr-Sands, Cumbria.
JØRGENSEN, S.E. (1988) Fundamentals of Ecological Modelling. Developments in Environmental Modelling 9, Elsevier, Amsterdam.
JUNK, W.J. and WELCOMME. R.L. (1990) Floodplains, In: Patten, B.C. (ed), Wetlands and shallow continental water bodies Vol 1. SPB Academic Publishing. The Hague. 491-524.
KEDDY, P.A. (1990) Competitive hierarchies and centrifugal organisation in plant communities, In: Grace, J.B. and Tiiman. D. (eds), Perspectives on plant competition. Academic Press, New York, 265-90.
399
KEDDY, P.A. (1992) Assembly and response rules: two goals for predictive community ecology,
J. Vegetation Science, 3: 15764.
KERNEY, M.P., CAMERON, R.A.D. and JUNGBLUTH, J.H. (1983) Die Landschnecken Nord und
Mitteleuropas. Parey, P. Hamburg und Berlin. 384 S
KHALID, R.A., PATRICK, Jr, W.H. and DELAUNE, R.D. (1977), Phosphorus sorption characteristics
of flooded soils, Soil Sci. Soc. Am. J. 41:2. 3059
KIESELEV. P.A. (1975) Study of the water balance of stratified aquifers based on the analysis of their
regime during hydrogeological investigations of marshy lands and adjacent areas, In:
Proceedings of Minsk Symposium, Hydrology of Marshridden Areas, UNESCO, IAHS.
KOCH, K. (1993) Die Käfer Mitteleuropas. Ökologie Bd. 4. Artenassoziationen in Makrohabitatcn.
Aquatischer und semiaquaticher Bereich, Geocke & Evers. Krefeld.
KOCH, M., MALTBY, E. and OLIVER, G.A. (1990) Investigations of Denitrification on lhe River
Torridge. Final Report to South West Water. Wetland Ecosystems Research Group. Report 5,
Department of Geography, University of Exeter. U.K.
KOCH, M.S., MALTBY, E„ OLIVER, G.A. and BAKKER, S.A. (1992) Factors controlling
denitrification rales of tidal mudflats and fringing sail marshes in south west England, Estuarine
Coastal Shelf Sci. 34: 47185.
KOERSELMAN, W. and VERHOEVEN, J.T.A. (1993) Eutrofiering van laagvenen. Interne of externe
oorzaken? Landschap '93(4): 3144.
KORMANN, K (1988) Schwebfliegen Mitteleuropas: Vorkommen, Bestimmung. Beschreibung.
Ecomed, München.
KUSLER, J.A. (1978) Wetland protection: is science mccling lhe challenge. In: Greeson, P.E., Clarke,
J.R. and Clark J.E. (eds). Wetland functions and values: the state of our understanding. Am
Water Res. Ass.. Minneapolis, USA, 3142.
LEITCH, J.A. (1981) Wetland hydrology: state of the art and annotated bibliography, publisher
unknown.
LEVIN, S.A., (1992). The problem of pattern and scale in ecology. Ecology 73(6): 194367.
LLAMAS, M.R. (1993) Exploitación de aguas subterráneas y conservación dc ecosistemas. Las Aguas
Subterráneas : Importancia y Perspectivas, Instituto Tcchnológico Gcominero de España,
Madrid. 193209
LLAMAS. M.R. (1994) Four cases of real or apparent conflicts between groundwater exploitation and
wetland conservation. XXIII Int. Assoc, of Hvdrogeologists Congress (Adelaide, Australia,
1994)
LLOYD, J.W., TELLAM, J.H., RUKIN, N. and LERNER, D.N. (1993) Wetland vulnerability in East
Anglia: a possible conceptual framework and generalised approach. J. Env. Management 37: 87
102.
LOACH, K. (1966) Relations between soil nutrients and vegetation in welhcalhs. II. Nutrienl uptake by
the major species in the field and in controlled conditions, J. Ecol., 56: I 1727.
LONARD, R.I. and CLAIRAIN. E.J. (1985) Identification of methodologies and the assessment of
wetland functions and values. In: Kusler, J.A. and Ricxingcr, Ρ (eds). Proceedings of the
National Wetland Assessment Symposium. Portland, ME, 6672.
400

LOZEK, V. (1964) Quartärmollusken der Tschechoslowakei, Rozpravv Ustavu Geologického Praha, 31.
LUFF, M.L., EYRE, M.D. and RUSTON, S.P. (1989) Classification and ordination of habitats of ground beetles (Coleóptera. Carabidae). J. Biogeographv, 16: 121-30.
LUGO, A.E., BRINSON, M.M. and BROWN, S. (eds) (1990) Forested wetlands, Elsevier, Amsterdam.
McCLAUGHERTY. CA., ABER, J.D. and MELILLO, J.M. (1982) The role of fine roots in the organic matter and nitrogen budgets of two forested ecosystems, Ecology 63: 1481-90.
MACDONALD, M.H. and HARBAUGH, A.W. (1988) A modular three-dimensional finite-difference groundwater flow model, U.S. Geological Survey Techniques of Water Resource Investigations Report. Book 6.
MCKEAGUE, J.A. and DAY, J.H. (1966) Dithionite and oxalate extractable Iron and Aluminium as an aise in differentiating various classes of soils. Can. J. Soil Sci. 46. 13-22.
MCQUEEN. I.S. and MILLER, R.F., (1968). Calibration and evaluation of a wide-range gravimetric method for measuring moisture stress. Soil Science 106 (3): 225-31.
MALTBY, E., (1988) Use of cotton strips assay in wetland and upland environments - an international perspective. In: Harrison, A.F., Latter, P.M., and Walton, D.W.H. (eds), Cotton Strip Assay: an index of decomposition in soils. ITE Symposium No. 24. Institute of Terrestrial Ecology, Grangc-over-Sands, Cumbria.
MALTBY, E. (1990). Wetland Management Goals: Wise Use and Conservation. In: Marchand, M. and Udo de Haes, H.A., The People's role in Wetland Management. Centre for Environmental Studies, Leiden University. 46-65.
MALTBY, E. (1991) The world's wetlands under threat - developing wise use and international stewardship, In: Environmental Concerns. Danish Academy of Technical Sciences, Elsevier Applied Science, 109-36.
MALTBY, E. (1992) Soils and Wetland Functions. In: P.A. Gcrakis (ed), Conservation and Management of Greek Wetlands. Proceedings of a Greek Wetland Workshop, Thessaloniki, Greece, 17-21 April 1989.61-78.
MALTBY, E., (1993). Factors preventing sound wetland management in Europe and the case for a new approach.. In: Madgwick J. and Serafin R. (eds), Assessing and Monitoring Changes in Wetland Parks and Protected Areas; Proceedings of wetland workshop held in the Broads, October 9-13 1992. Leading Edge Press & Publicity, Hawes, England.
MALTBY, E. and FAULKNER, S.P. (in press) Biotic soil processes along hydrologie gradients in two Louisiana bottomland hardwood forests: I. Cellulose decomposition and II. Biotic indices. Wetlands.
MALTBY. E., HUGHES, N.R. and NEWBOLD, C (1988) Study on the dynamics and functions of coastal wetlands of the Mediterranean type. Report to EC DG XI, Wetland Ecosystems Research Group, Report 4, Department of Geography, University of Exeter, U.K.
MALTBY, E., HOGAN, DV., IMMIRZI, CP. and OLIVER, CA. (1991) Nutrient Dynamics and Functional Assessment of European Wetlands. Report to EC DG XII, Wetland Ecosystems Research Group, Report 9, Department of Geography, University of Exeter, UK
MALTBY, E., HOGAN, D.V., IMMIRZI, C.P., TELLAM, J.H. and PEUL, M.J. van der, (1994) * Building a new approach to the investigation and assessment of wetland ecosystem functioning. In: Mitsch, W.J. (cd). Global Wetlands: Old World and New. Elsevier, Amsterdam, pp. 637-658.
- 401
MARGALEF, R. (1987) Teoria y modelado de los sistemas fluctuantes, ln: González Bernaldez. F.G.. Torroja, J.M.. and Llamas. M.R. (eds). Bases Científicas para la Protección de los Humedales en España. Real Academia de Ciencias Exactas. Físicas y Naturales, Madrid, 31-41.
MAYES, E. (1984) The diet of the Greenland white-fronted goose in Ireland. Unpublished report to the Forest and Wildlife Service. Dublin. 1-24
MEEK. B.D. and STOLZY, L.H., (1978). Short-term flooding. In: Hook. D.D. and Crawford, R.M.M. (eds). Plant life in anaerobic environments. 1st ed. Vol. 1. Ann Arbor Science, Michigan. 375-97.
MEHTA, N.C., LEGG. J.O.. GORING, C.A.I, and BLACK, C.A. (1954) Determination of organic-phosphorus in soils: I Extraction Method, Soil Sci. Soc. Proc. 18, 443-9
MENGEL. K. and KIRKBY. E.A. (1978) Phosphorus. In: Principles of Plant Nutrition. Mengel. K. and Kirkby. E.A. (eds), 347-66.
MITSCH, W.J. (1977) Water hyacinth (Eichhornia crassipes) nutrient uptake and metabolism in a north-central Florida marsh. Archiv, fur hydrobiologia 81: 188-210.
MITSCH, W.J., and GOSSELINK, J.G.. (1993). Wetlands. 2nd cd. Van Nostrand Rheinhold. New York.
MITSCH, W.J., TAYLOR, J.R. and BENSON, K.B. (1991) Estimating primary production of forested wetland communities in different hydrologie landscapes. Landscape Ecology, 5: 75-92.
MØLLER H.S., (1992). Conservation of Wetlands in Denmark - Legislation and Administration. In: Proceedings of the Wetland Forum in Hokkaido. Hokkaido Govt. 218-25.
MORAGHAN. J.T. and BURESH. R. (1977) Correction for dissolved nitrous oxide in nitrogen studies. Soil Sci. Am. J. 41. 1201-2
MORAVEC. J. (1992) Is the Zürich-Montpellier approach still unknown in vegelation science of the English-speaking countries'.' J. Vegetation Science. 3: 277-8.
MOSS. D.. FURSE, M.T., WRIGHT, J.F. and ARMITAGE. P.D. (1987) The prediction of the macro-invertebrate fauna of unpolluted running-water sites in Great Britain using environmental data, Freshwater Biology, 17:41-52.
MUNEVAR, F. and WOLLUM. A.G.II, (1977). Effects of' the addition of phosphorus and inorganic nitrogen on carbon and nitrogen mineralization in Andcpts from Columbia. Soil Sci. Soc. Am. J.. 41: 540-45.
MURPHY, J. and RILEY, J.P. (1962) A modified single solution method for the determination of phosphate in natural waters. Anal. Chim. Acta. 27. 31-6
NAIMAN. R.J. AND DECAMPS, H., (1990). The ecology and management of aquatic-terrestrial ccotones. Paris. Parthenan. UNESCO
NATIONAL WETLANDS WORKING GROUP (1988) Wetlands of Canada, Ecological Land Classification Series, No. 24, Environment Canada, Ottawa. Ontario.
NOVITZKI, R.P. (1979) Hydrological characteristics of Wisconsin's wetlands and their influence on floods, stream flow and sediment. In: Greeson, P.E., Clark, J.R. and Clark, J.E. (eds), Weiland Functions and Values: the slate of our understanding. Am. Water Res. Ass., Minneapolis. U.S.A. 377-88.
OBERDORFER. E. (1983) Pflanzensoziologische Exkursionsflora. E Ulmer, Stuttgart.
ODUM. H.T.. (1956) Primary production in flowing waters. Limnol. Occanogr. I: 102-17.
402 -
ODUM, E.P. (1978) The value of wetlands: a hierarchical approach. In: Greeson, P.E., Clark, J.R. and Clark. J.E. (eds), Wetland Functions and Values: the state of our understanding. Am. Water Res. Ass., Minneapolis, U.S.A., 16-25.
OLIVER, G.A., HOGAN, D.V and MALTBY, E., (1990) Functional Analysis of Wetlands in Mcssolonghi and Odici. Report to EC DG XI, Wetland Ecosystems Research Group, Report 8, University of Exeter, U.K.
OORSCHOT, M.M.P. van, (1994) * Plant production, nutrient uptake and mineralisation in river marginal wetlands: the impact of nutrient additions due to former land-use. In: Mitsch, W.J. (ed), Global Wetlands: Old world and new. Elsevier, Amsterdam. 133-50.
OORSCHOT, M.M.P. van, VERHOEVEN, J.T.A and WHIGHAM, D.F.. (in prep). Nitrogen availability and mineralization in a hvdrologicallv altered riverine freshwater wetland.
ORIGNY, R. (1991) Observations sur Jaminia quadridens (Muller, 1774) (Mollusca, Gastropoda, Pulmonata, Stylomatophora, Enidae) en Touraine et Haut-Poitou, Vertigo, 1: 43-52.
PAPAYANNIS, T., (1993). MedWet: an integrated effort for the conservation of Mediterranean wetlands. In: Madgwick J. and Serafin R. (eds), Assessing and Monitoring Changes in Wetland Parks and Protected Areas; Proceedings of wetland workshop held in the Broads, October 9-13 1992. Leading Edge Press & Publicity, Hawes, England.
PARNAS, H. (1975) Model for decomposition of organic material by micro-organisms, Soil Biol. Biochem. 7: 161-9.
PATRICK, Jr. W.H., GOTAH, S. and WILLIAMS, B.G. (1973) Strengite dissolution in flooded soils and sediments. Science, 179:564-5.
PATRICK, Jr, W.H., and JUGUSUJINDA, A. (1992) Sequential reduction and oxidation of inorganic nitrogen, manganese and iron in flooded soils. Soil Sci. Soc. Am. J. 56: 1071-3.
PATRICK, Jr, W.H., and KHALID, R.A. (1974) Phosphate release and sorption by soils and sediments: effect of aerobic and anaerobic conditions. Science, 186: 53-5.
PATRICK, W.H. and MAHAPATRA, LC, (1968) Transformation and availability to rice of nitrogen and phosphorus in waterlogged soils. Adv. Agr. 20: 323-59.
PAULUS, L. (1984) Time-activity budgets of non-breeding Anatidae. In: Weiler. W.M. (ed) Waterfowl in winter. Univ. Minnesota Press. Mineapolis, U.S.A., 135-53
PETERJOHN, W.T. and CORRELL D.L. (1984) Nutrient dyamics in an agricultural watershed: observations on the role of a riparian forest. Ecology 65: 1466-75.
PINAY. G. and DECAMPS, H. (1988) The role of riparian woods in regulating nitrogen fluxes between the alluvial aquifer and surface water: a conceptual model. Regulated Rivers: Research and Management 2: 507-16
PLUMMER, L.N., JONES, B.F. and TRUESDELL, A.H., (1984) WATEOF - A FORTRAN IV version of WATEO, a computer program for calculating chemical equilibrium of natural waters. Waler Resources Investigations 76-13. U.S. Geological Survey.
PRICKETT, T.A. and LONNQUIST, C C , (1971). Selected digital computer techniques lor groundwater resources evaluation. Illinois State Water Survey Bull. 55.
PURSEGLOVE, J. ( 1991 ) Liberty, ecology, modernity. New Scientist, 44-8.
REVELING, D.G, CREWS. W.E. and KLIMSTRA. W.D. (1972) Activity patterns of Canada geese during winter. Wilson Bull.. 84: 278-95
- 403

RICHARDSON, C.J. (1985) Mechanisms controlling phosphorus retention capacity in freshwater wetlands. Science. 228: 1424-7.
R1ECKEN. U.. and BLAB. J. (1989) Biotope der Tiere Mitteleuropas. Verzeichnis zoologisch bedeutsamer Biotoptypen und Habitatqualitäten in Mitteleuropa einschließlich typischer Tierarten als Grundlage für den Naturschutz, Kilda Verlag Greven.
RISSER, P.G. (1990) The ecological importance of land-water ccotoncs. In: Naiman, R.J. and Decamps, H. (eds) The Ecology and Management of Aquatic-Terrestrial Ecotoncs, Parthenon Press, 7-21.
RITCHIE, G.A. and HINCKEY, T.M. (1975) The pressure chamber as an instrument for ecological research. Advances in Ecological Research, 9: 165-254.
ROSS. H.C.G. (1984) Catalogue on the land and freshwater Mollusca of lhe British Isles in the Ulster Museum. Ulster Museum. Belfast. Pubi. Nr. 251, 160.
RUSSELL, M.A. and MALTBY. E. (in press) The role of hydrologie regimes on phosphorus dynamics in seasonally waterlogged soils. In: Hughes, J. and Heathwaite, A.L. (eds), Hydrology and Hvdrochemistrv of British Wetlands. Wiley.
RYDEN J.C., (1983) Denitrification losses from a grassland soil in the field receiving different rates of nitrogen as ammonium nitrate. J. Soil Sci., 34: 355-65.
SAND-JENSEN, K. (1989) Environmental variables and their effect on pholosynthesis of aquatic plant communities, Aquat. Bot.. 34: 5-25.
SAS Institute Inc. (1985) SAS/STAT User's Guide, release 6.03. Cary. North Carolina, U.S.A.
SANZ DONAIRE, J.J. and SANCHEZ DE EVORA, A. (1993)* Humedales manchegos : características geoedáficas de functionalidad. Resultados preliminares : Anales de Geografía de la Universidad Complutense, 169-98
SANZ DONAIRE, J.J., DIAZ ALVAREZ, M.D. and SANCHEZ DE EVORA, A. (1994) La Mancha : transformaciones forzadas de los humedales, Bolelín de la Asociación de Geógrafos Españoles (A.G.E.), 39-61
SATHER, J.H. and SMITH, R.D. (1984) An Overview of Major Wetland Functions and Values, Western Energy and Land Use Team, U.S. Fish and Wildlife Service, FWS/OBS-84/18, Washington, D.C.
SAVAGE, A.A. (1994) The distribution of Corixidac in relation to the water quality of British lakes: a monitoring model, Freshwater Forum. 4: 32-61.
SAVANT. N.K. and DE DATTA, S.K. (1982) Nitrogen transformations in wetland rice soils, Adv. Agr„ 35:241-302.
SCHOLLENBERGER, C.J. (1927) A rapid approximate method for determining soil organic matter. Soil Sci. 24: 65-8.
SCHOOLFIELD, R.M., SHARPE, P.J.H. and MAGNUSON, CE. (1981) Non-linear regression of biological temperature-dependent rate models based on absolute reaction-rate theory, J. Thcor. Biol. 88: 719-31.
SCOTT, D.A. (1980) A preliminary inventory of wetlands of international importance in West Europe and North west Africa. International Waterfowl and Wetlands Bureau, Slimbridge, UK.
SHEPPARD, R. (1994) Ireland's wetland wealth: the hirdlife of the estuaries, lakes, coasts, rivers, bogs and turloughs of Ireland. IWC Dublin.
404 -
SIEPEL, H. and BUND, CF. van de, (1986) The use of life history strategies of microarthropods in
grassland management, Proc. 3rd Eur. Cong. Entomology, 3: 4814.
SOMMERS, L. E. and NELSON, D. W. (1972), Determimination of total Ρ in soils: a rapid perchloric
digestion procedure. Soil Sci. Soc. Am. Proc, 36: 902904.
SPEIGHT, M.C.D. (1978) A check list of Irish Syrphidae (Diptera), Bull. Ir. biogeog. Soc, 2: 2631.
SPEIGHT, M.C.D. (1985) Adjustments to the Irish hoverfly list, Ir. Nat. J„ 21: 38591.
SPEIGHT, M.C.D. (1986) Criteria for the selection of insects to be used as bioindicators in nature
conservation research, Proc. 3rd Eur. Cong. Entomology. 3: 4858.
SPEIGHT, M.C.D. (1993) Révision des syrphes de la faune de France: 1 Liste alphabétique des espèces
de la sousfamille des Syrphinae (Diptera, Syrphidae), Bull. Soc, cnt. Fr„ 98: 3546.
SPEIGHT, M.C.D. (in press) Révision des syrphes de la faune de France: 2 Liste alphabétique des
espèces des Microdontidae et de la sousfamille Milesiinae, excepté les genres Cheilosia,
Eumeriis et Merodon, Bull. Soc, ent Fr.
SPEIGHT, M.C.D.. ANDERSON, R. and LUFF, M.L. (1982) An annotated list of the Irish ground
beetles (Col., Carabidae + Cicindelidae), Bull. Ir. biogeog. Soc. 6: 2554.
SPEIGHT, M.C.D. and CASTELLA, E. (in press) * Bugs in the system: relationships between species
characteristics, distribution data and site evaluation in development of an expert system for
environmental impact assessment incorporating invertebrates. Proc. EIS Colloq.. Helsinki. 1992.
SPEIGHT, M.C.D. and LUCAS, J.A.W. (1992) Liechtenlein Syrphidae (Diptra). Ber. Bot. Zool. Ges.
Liechtenstein Sargans Werdenberg. 19: 327463.
SPEIGHT M.C.D. and NASH, R. (1993) Chrysotoxum cantimi, Ctenophora ornata, C.pectinicornis.
Helophilus trivittatus and Mesembrina mystacea (Diptera): insects new to Ireland, Ir. Nat. J.. 24:
2316.
SPENCE, D.H.N., CAMPBELL, R.M. and CHRYSTAL, J. (1971) Productivity of submerged freshwater
macrophytes. Hydrobiologia. 12: 16976.
SPINK. Α., (1994) * Phytomctric estimation of fertility. In: Proceedings of the 4th workshop of the
FAEWEECSTEP project, Madrid, Spain.
STANFORD, G. and EPSTEIN, E., (1974). Nitrogen mineralization water retention in soils. Soil Sci.
Soc. Am. J. 38: 1036.
SWIFT, M.J., HEAL, O.W. and ANDERSON, J.M. (1979) Decomposition in terrestrial ecosystems,
Studies in Ecology. Blackwell, Oxford, U.K.
TAMISIER, A. (1974) Ethoecological studies of Teal wintering in the Camargue (Rhône delta, France),
Wildfowl 25: 10717
TAMISIER, A. (1976) Diurnal activities of Greenwinged Teal and Pintail wintering in Louisiana,
Wildfowl 27: 1931
TER BRAAK, C.J.F., (1987). CANOCO a FORTRAN program for Canonical Community Ordination
by I Partial I IDetrendedl [Canonical! Correspondence Analysis. Principal Components Analysis
and Redundancy Analysis (Version 2.1). Report LWA8802. Agriculture Mathematics Group,
Wageningen, the Netherlands.
405
THIOULOUSE. J.(1989) Statistical analysis and graphical display of multivariate data on the Mackintosh Computer, Applications in the Bioscienccs. 5: 287-92.
THORNBURG. D.D. (1973) Driving duck movements on Keokuk Pool, Mississippi river, J. Wildlife Management 37: 382-9
THORNE, CR. and EASTON. K. (1994) Geomorphological reconnaissance of the River Scncc. Leicestershire for river restoration. The East Midland Geographer. Vol. 17. Parts I & 2, 40-1.
TINSLEY, J. (1950) The determination of organic carbon in soils by dichromatc mixtures. Trans. 4th Ini, Cong. Soil Sci., 1: 161-4.
TOORN, J. van der and MOOK. J.H., (1982). The influence of environmental factors and management on stands of Phragmites australis. I. Effects of burning, frost and insect damage on shoot density and shoot size. J. App. Ecol. 19: 477-99.
TORP, E. (1984) De danske svirreluer (Diptera, Syrphidae), Kcndetegcn. levevis og udbredelse. Danmarks Dyreliv I: 1-300, Fauna Boger, Kobenhavn.
TOTH, J., (1962). A Theory of Groundwater Motion in a Small Drainage Basin in Central Alberta, Canada. J. Geophysics Res. 67 (11): 4375-87.
TREWEEK. J.R., CALDOW, R., ARMSTRONG, Α., DWYER, J. and SHEIL, J. (1991) Wetland Restoration: Techniques for an integrated approach, (M.A.F.F./N.E.R.C Contract No: TO2059gl) I.T.E. Monks Wood Expt. St.. U.K.
TURBIDY, M., (1988). Clonmacnoise Heritage zone project: a portfolio of management plans. Final report to EC project no. 6611/85/08/1.
VERHOEVEN, J.T.A. (1992). Vegetation as a resource in wetlands with special reference to the wetlands of Greece. In: Gerakis P.A. (ed). Conservation and management of Greek wetlands: Proceedings of a Greek Wetland Workshop, held in Thessaloniki, Greece, 17-21 April 1989. IUCN, Gland, Switzerland.
VERHOEVEN, J.T.A. and ARTS. H.H.M. (1987) Nutrient dynamics in small mesotrophic fens surrounded by cultivated land. II. Ν and Ρ accumulation in plant biomass in relation to the release of inorganic Ν and Ρ in the peat soil, Oecologia. 72: 557-61.
VERHOEVEN, J.T.A., BEEK, S. van and STORM, W. (1983) Nutrient dynamics in small mesotrophic fens surrounded by cultivated land. I. Productivity and nutrienl uptake by the vegetation in relation to the flow of eutrophicatcd ground water. Oecologia. 60: 25-33.
VERHOEVEN, J.T.A., KOERSELMAN, W and BELTMAN, Β.. (1988). The vegetation of fens in relation to their hydrology and nutrient dynamics: a case study. In: J.J. Symoens (ed), Vegelation of Inland Waters. Kluer Academic Publishers, Dordrecht, the Netherlands, 249-82.
VERHOEVEN, J.T.A. and SCHMITZ, M.B. (1991) Control of plant growth by nitrogen and phosphorus in mesotrophic fens. Biogeochemistrv, 12: 135-48.
VERHOEVEN, J.T.A. and TOORN, J. van der, (1990). Marsh Eutrophication and wastewater treatment. In: B.C. Patten (cd). Wetlands and shallow continental water bodies. SPB Academic Publishing. The Hague, The Netherlands, 571-85.
VERHOEVEN. J.T.A.. WASSEN, M., MEULEMAN, A. and KOERSELMAN, W. (1994) Op zoek naar de bottleneck, N- en P- beperking in venen en duinvalleien. Landschap 11 : 25-39
VERHOEVEN, J.T.A., WHIGHAM, D.F., KERKHOEVEN, M. van and O'NEILL, J. (1994). Comparitive study of nutrient-related processes in geographically separated wetlands: lowards a
- 406
science base for functional assessment procedures. In: Mitsch, W.J. (ed) Glohal Wetlands. Old World and New. Elsevier, Amsterdam., 89-90.
VERMEER, J.G. (1986) The effect of nutrient addition and lowering of the water table on shoot biomass and species composition of a wet grassland community (Cirsio-Molinielum Siss et de Vries, 1942). Occol. Plant. 7: 145-55.
VUUREN, M.M.I, van, (1992). Effects of plant species on nutrient cycling in hcathlands. PhD thesis, University of Utrecht, The Netherlands.
VUUREN, M.M.I, van, and BERENDSE, F. (1992) Changes in soil organic matter and net mineralisation in heathland soils, after removal, addition or replacement of litter from Erica tetralix or Molinia caerulea, In: M.M.I, van Vuuren, Effects of plant species on nutrient cycling in heathlands. PhD thesis. University of Utrecht, The Netherlands, 111-32.
VUUREN, M.M.I, van, AERTS, R„ BERENDSE, F. and VISSER, W. de, (1992) Nitrogen mineralisation in heathland ecosystems dominated by different plant species, Biogcochemistrv 16: 151-66.
WALBRIDGE, M.R., and VITOUSEK, P.M., (1987). Phosphorus mineralisation potentials in acid organic soils: processes affecting PO4 ' isotope dilution measurements. Soil Biol Biochem 19: 709-17.
WATSON, S., (1992). A recharge assessment for a freshwater river marginal wetland in North Devon. England. Unpublished MSc project report. School of Earth Sciences, University of Birmingham, UK.
WALKLEY, A. and BLACK, C.A. (1934), An examination of the Degtjarejj method for determining soil organic matter and a proposed modification of the chromic acid titration method. Soil Sci. 37: 29-38.
WEAST, R.C. (ed) (1986) C R C Handhook of Chemistry and Physics.
WELLS, S.M. and CHATFIELD, J.E. (1992) Threatened non-marine molluscs of Europe. Nature and Environment, No: 64, Council of Europe. Strasbourg.
WETLAND ECOSYSTEMS RESEARCH GROUP (in prep). Inventory of Biological Resources: Danube River Basin Study (Revised Final Draft). Report prepared for the Programme Coordination Unit of' the Environmental Programme for the Danube River Basin under PHARE contract no. ZZ91 11.01 07-B004.
WHEELER, B.D. (1984) British fens: a review. In: Moore, P.D. (ed), European Mires, Academic Press, London, 237-81.
WHEELER, B.D. (1994), Towards a "hydrotopographical" classification of British Wetlands. Draft discussion document, Department of Animal and Plant Sciences, University of Sheffield, U.K.
WHEELER, B.D. , SHAW, S.C and COOK, R.E.D. (1992) Phytometric assessment of the fertility of undraincd rich-fen soils, J. Appi. Ecol. 29: 466-75.
WHIGHAM, D.F., CHITTERLING, C. and PALMER, B. (1988) Impacts of freshwater wetlands on water quality: A landscape perspective, Env. Manag. 12: 663-71.
WHITTAKER, R.H., and LIKENS, G.E.. (1975) In: Licth and R.H. Whitlaker (eds). Productivity of the Biosphere. Ecological Studies 14. Springer-Verlag. New York, U.S.A., 303-28.
WICKER, K.M., CASTILLE, G.C, DAVIS, D.J., GAGHANS, S.M., ROBERTS, D.W., SABIN, D.S., and WEINSTEIN, R.A., (1982). St. Bernard Parish: A study in wetland management. Coastal environments Inc., Baton Rouge, La. U.S.A., 132.
407 -

WILLIAMS, M. (ed) (1990) Wetlands: a threatened landscape. Special publications series. Institute of British Geographers, Blackwell. Oxford.
WRIGHT, J.F., ARMITAGE, P.D. and FURSE, M.T. (1989) Prediction of invertebrate communities using stream measurements. Regulated Rivers: Research & Management. 4: 147-55.
WRIGHT. J.F.. FURSE. M.T.. ARMITAGE. P.D. and MOSS. D. (1993) New procedures for identifying running-water sites subject to environmental stress and for evaluating sites for conservation, based on the macroinvertebrate fauna. Arch. Hvdrohiol. 127: 319-26.
YOSHINARI, T. and KNOWLES, R. (1976) Acetylene inhibition of nitrous oxide reductase by denitrifying bacteria. Biochcm. Biophys. Res. Cornili. Vol. 69 (III). 705-10.
* denotes publication by FAEWE contributing research personnel
- 408

The Communities research and development information service
C O R D I S
A vital part of your programme's dissemination strategy
CORDIS is the information service set up under the VALUE programme to give quick and easy access to information on European Community research programmes. It is available free-of-charge online via the European Commission host organization (ECHO), and now also on a newly released CD-ROM.
CORDIS offers the European R&D community:
— a comprehensive up-to-date view of EC R&TD activities, through a set of databases and related services,
— quick and easy access to information on EC research programmes and results, — a continuously evolving Commission service tailored to the needs of the research community and
industry, — full user support, including documentation, training and the CORDIS help desk.
The CORDIS Databases are:
R&TD-programmes - R&TD-projects - R&TD-partners - R&TD-results R&TD-publications - R&TD-comdocuments - R&TD-acronyms - R&TD-news
Make sure your programme gains the maximum benefit from CORDIS
— Inform the CORDIS unit of your programme initiatives, — contribute information regularly to CORDIS databases such as R&TD-news, R&TD-publications and
R&TD-programmes, — use CORDIS databases, such as R&TD-partners, in the implementation of your programme, — consult CORDIS for up-to-date information on other programmes relevant to your activities, — inform your programme participants about CORDIS and the importance of their contribution to the
service as well as the benefits which they will derive from it, — contribute to the evolution of CORDIS by sending your comments on the service to the CORDIS
Unit.
For more information about contributing to CORDIS, contact the DG XIII CORDIS Unit
Brussels Luxembourg Ms I. Vounakis M. B. Niessen
Tel. +(32) 2 299 0464 Tel. +(352) 4301 33638 Fax +(32) 2 299 0467 Fax +(352) 4301 34989
To register for online access to CORDIS, contact:
ECHO Customer Service BP2373
L-1023 Luxembourg Tel. +(352)3498 1240 Fax +(352)3498 1248
If you are already an ECHO user, please mention your customer number.
Jf


European Commission
EUR 16132 — Functional analysis of European wetland ecosystems — Phase 1 (FAEWE)
E. Maltby, D. V. Hogan, R.J. Mclnnes
Luxembourg, Office for Official Publications of the European Communities
1996 — 448 pp. — 16.2 χ 22.9 cm
ISBN 92-827-6606-3

Venta ■ Salg · Verkauf · Πωλήσεις · Sales * Vente · Vendita · Verkoop · Venda · Myynti · Försäljning
BELGIQUE/BELGIÉ IRELANO
Moniteur belge/ Belgisch Staatsblad
Rue de Louvain 42/Leuvensewcg 42 B10O0 Bnxelles/B1000 Brussel Tèi (02)512 00 26 Fax (02) 511 01 84
Jean De Lnnnoy
Avenue Ou Roi 202/Koningslaan 202 B1060 Bruxelles/B1060 Brussel Tel (02,538 51 69 Fax(02)538 08 41
Autres distributeurs/ Ovenge verkooppunten:
Rue de ta Loi 244/Wetstraat 244 B1040 Bruxelles/B1040 Brussel Tél. (02)231 04 35 Fax (02) 735 08 60
Doc υ meni delivery:
Crede*
Rue de la Montagne 34/Bergs tra al 34 Boite 11/Bus 11 B1000 Bruxelles/B1000 Brussel Tel (02)511 69 41 Fax (02) 513 31 95
J . H. Schultz Information A/S
Herstedvang 1012 DK2620 Albertslund TH 43 63 23 00 Fax (Sales) 43 63 19 69 Fax (Management) 43 63 19 49
DEUTSCHLAND
Bundesanzeiger Verlag
Postfach 10 05 34 D50445 Koin Tel (02 21)20 290 Fax (02 21) 2 02 92 7B
GREECE/ΕΛΛΑΔΑ
G.C. Eleftheroudakis SA
International Bookslore Nikis Street 4 GR10563 Athens Tel (01)322 63 23 Fax 323 98 21
MundlPrensa Libros, SA
Castellò. 37 E28001 Madrid Tel (91)431 33 99 (Libros)
431 32 22 (Suscripciones) 435 36 37 (Dirección)
Fax (91)575 39 98
Boletín Oficial del Estado Trafalgar. 2729 E28071 Madrid Tel (91)538 22 95 Fax(91)538 23 49
Sucursal:
Librería Internacional AEDOS
Consejo de Ciento, 391 Ε08009 Barcelona Tet (93) 488 34 92 Fax (93) 467 76 59
Librería de la Generalität de Catalunya
Rambla dels E sl udis, 11B (Palau Moja) E08002 Barcelona Tel (93)302 68 35 Tel (93)302 64 62 Fax (93) 302 12 99
FRANCE
Journal ofticiel Service d e t publ icat ion! des Communauté· européennes
26, rue Desaix F75727 Pans Cedex 15 Toi (1)40 58 77 01/31 Fax (1)40 58 77 00
Government Supplies Agency
45 Harcourt Road Dublin 2 Tel (1)66 13 I t i . Fax(1)47 52 760
ISRAEL
ITALIA
Licosa SpA
Via Duca di Calabria 1/1 Casella postale 552 150125 Firenze Tel (055)64 54 15 Fax 64 12 57
GRANDDUCHE DE LUXEMBOURG
Messageries du livre
5, me Rarlteisen L2411 Luxembourg Tél. 40 10 20 Fax 49 06 61
NEDERLAND
SDU Servicecentrum Uitgeverijen
Postbus 20014 2500 EA 'sGravenhage Tel.(070)37 89 880 Fa* (070) 37 Θ9 783
ÖSTERREICH
Manz'sche Vertagsund UnlversttAtsbuchhandlung
Kohknarkt 16 A1014 Wien Tel. (1) 531 610 Fax (1)531 61161
Document delivery:
Winschartskammer
Wiedner Hauptstraße A1045 Wien Tel. (0222)501054356 Fax (0222) 50206297
PORTUGAL
Imprensa Nacional —Casada Moeda. EP
Rua Marques Sá da Bandeira. 16A Ρ1099 Lisboa Codex Tet (01)353 03 99 Fax (01) 353 02 94/384 01 32
NIC Info a/a
Boks 6512 Etlerslad 0606 Oslo Tel. (22) 57 33 34 Fax (22) 66 19 01
SCHWEIZ/SUISSE/SVIZZERA
OS EC
Stampfenba chsl ra Be 85 CH8035 Zürich Tel. (01)365 54 49 Fax (01) 365 54 11
B ALG ARIJA
Europress »Classica BK Ltd
66. bd Vitosha BG1463 Solia Tel/Fax (2) 52 74 75
CESKÁ REPUBLlKA
Have I kova 22 C2130 00Praha3 Tel/Fax (2) 24 22 94 33
HRVATS KA
Med la tra d e
P. Hatza 1 HR4100 Zagreb Tel/Fax (041 )43 03 92
MAGYARORSZÁG
E u rot n (oSe rv ice
Europa Haz Margitszigct H1138 Budapest Tel/Fax (1) 111 60 61. (1) 111 62 16
POLSKA
Business Foundation
ui Krucza 36/42 PLOO512 Warszawa Tel. (2)621 99 93. 628 28 B2 International Fax&Phone (039) 12 00 77
ROMANIA
Euromedia
65, Strada Dionisio Lupu
Grupo Bertrand, SA
Rua das Terras dos Vales, 4A Apañado 37 Ρ2 700 Amadora Codex Tel. ( 01 )49 59 050 Fax 49 60 255
SUOMI/FINLAND
Akateeminen Kirjakauppa
Akademiska Bokhandeln Pohjoisesplanadi 39 / Norra esplanaden 39 P L / P B 128 FIN00101 Helsinki/Helsingfors Tel. (90) 121 4322 Fax (90) 121 44 35
SVERIGE
BTJ AB
Traktorvägen 11 Box 200 S221 00 Lund Tel. (046) 18 00 00 Fax (046) 18 01 25
UNITED KINGDOM
HMSO Books (Agency section)
HMSO Publications Contre 51 Nine Elms Lane London SW8 5DR Tel. (0171)873 9090 Fax (0171) 873 8463
ICELAND
Skòlavôrdustig. 2 IS101 Reykiavik Tel. 551 56 50 Fax 552 55 60
RUSSIA
CCEC
9,60leliya Oktyabrya Avenue 117312 Moscow TeL/Fax (095) 135 52 27
SLOVAKIA
Slovak Technical
Nam. slobody 19 SLO812 23 Bratislava 1 Tel (7) 52 204 52 Fax (7) 52 957 B5
CYPRUS
Cyprus Chamber of Commerce and Industry
Chamber Building 38 Grivas Dhigents Ave 3 Deligiorgis Street PO Box 1455
Tel. (2) 44 95 00, 46 23 12 Fax (2) 36 10 44
MALTA ~
Miller Distributora Ltd
PO Box 25 Maka International Airport LOA 05 Malta Tel. 66 44 B8 Fax 67 67 99
TÙRKIYE
Pres AS
Dùnya Infotel TR80050 TúnelIstanbul Tel (1)251 91 907251 96 96 Fax ( I) 251 91 97
Roy International
17. Shimon Hatarssi Streel P.O.B. 13056 61130TelAvtv Tel. (3) 546 14 23 Fax (3) 546 14 42
Subagent (or lhe Palestinian Authority:
INDEX Information Services
PO Box 19502 Jerusalem Tel (2)27 16 34 Fax (2) 27 12 19
Middle East Observer
41 Sherif St. Cairo Tel/Fax (2) 393 97 32
UNIPU8
4611 F Assembly Drive Unham. MD 207061391 Tel. Toll Free (800) 274 48 8 Fax (301) 459 00 56
Subscriptions only Uniquement abonnements
Renout Publ ishing Co. Ltd
1294 Algoma Road Ottawa, Ontario K1B 3W8 Tel. (613)741 43 33 Fax (613) 741 51 39
AUSTRALIA
Hunter Publications
58A Gipps Street C ol I ing wood Victoria 3066 Tel (3)9417 53 61 Fax (3) 9419 71 54
JAPAN
Procurement Services Int. (PStJapan)
Kyoku Dome Postal Code 102 Tokyo Kojimachi Posi Office Tel (03)32 34 69 21 Fax (03) 32 34 69 15
Subagent:
Kinokuniya Company Ltd Journal Department
PO Box 55 Chitóse Tokyo 156 Tel (03 )34 390124
SOUTH and EAST ASIA
Legal Library Services Ltd
Orchard PO Box 0523 Singapore 9123 Tel. 243 24 98 Fax 243 24 79
SOUTH AFRICA
Sarto
5th Floor, Export House Cnr Maude & West Streets Sandton 2146 Tel. (011)6633737 Fax (011)8836569
ANDERE LÄNDER OTHER COUNTRIES AUTRES PAYS
Office des publications officielles des Communautés européennes
2. rue Mercier L2985 Luxembourg Tél. 29 291 Télex PUBOFLU 1324 b Fax 48 85 73,48 68 17

Ol
O
cr
eo
ro
m I
o
OP *■ — — *
* * *
OFFICE FOR OFFICIAL PUBLICATIONS
OF THE EUROPEAN COMMUNITIES
L2985 Luxembourg
ISBN •iSflSVb.b.Db.a
789282"766064 >
Copyright © 2022 FDOKUMEN