Ethnolinguistic vitality of ethnic groups in the Baltic countries
30
Transcript of Ethnolinguistic vitality of ethnic groups in the Baltic countries

Contents
Acknowledgements ixList of tables and figures xiList of maps xvii
Sarah Smyth
Introduction 1
Part 1 Identity options 19
Irina Zak and Arie Cohen
Explicit/implicit acculturation and adaptation among Russian immigrant teachers in Israel 21
Martin Ehala and Anastassia Zabrodskaja
Ethnolinguistic vitality of ethnic groups in the Baltic countries 45
Mikhail A. Molchanov
Russian national identity: old traumas and new challenges 87
Part 2 Identities in the making 109
Svetlana Eriksson
Who are you? Cultural associations in (self-)othering and cultural identity negotiation among Russian-speaking adolescents from Russia and Latvia in Ireland 111

vi
Claudia Zbenovich
The Russian-Jewish babushka in Israel: discourse analysis of a cultural phenomenon 141
Galina Nikiporets-Takigawa
Digital debates on Soviet memory in the national identity construction of post-Soviet migrants 163
German Mendzheritskiy and Ekaterina Bagreeva
Should we speak Russian? Everyday practice of Russian-speaking migrants in Germany and Norway 183
Part 3 Identities lost and found 201
Sari Pöyhönen
Language and ethnicity lost and found: multiple identities of Ingrian Finnish teachers in Russia 203
Dionysios Zoumpalidis
Russian language – Greek identity: a sociolinguistic approach to the Pontic Greek community in Russia 227
Sholpan Zharkynbekova and Baurzhan Bokayev
Global transformations in Kazakhstani society and problems of ethno-linguistic identification 247
Jasmine Dum-Tragut
Striving for linguistic independence? The Armenian language in post-Soviet Armenia: language policy and language planning 279

vii
Notes on Contributors 303
Bibliography 307
Index 329
Index of ethnic groups, people and places 337

Negotiating Linguistic,Cultural and Social Identities
in the Post-Soviet World
Sarah Smyth and Conny Opitz (editors)
PETER LANGOxford • Bern • Berlin • Bruxelles • Frankfurt am Main • New York • Wien
Bibliographic information published by Die Deutsche NationalbibliothekDie Deutsche Nationalbibliothek lists this publication in the Deutsche Nationalbibliografie;detailed bibliographic data is available on the Internet at http://dnb.d-nb.de.
A catalogue record for this book is available from the British Library.
Library of Congress Control Number: zoi393O48o
ISBN 978-3-0343-0840-3
COVER DESIGN: Gemma Lewis
Peter Lang AG, International Academic Publishers, Bern 1013Hochfeldstrasse 31, CH-3oii Bern, [email protected], www.peterlang.com, www.peterlang.net
All rights reserved.All parts of this publication are protected by copyright.Any utilisation outside the strict limits of the copyright law, without thepermission of the publisher, is forbidden and liable to prosecution.This applies in particular to reproductions, translations, microfilming,and storage and processing in electronic retrieval systems.
Printed in Germany
Contents
Acknowledgements
List of tables and figures
List of maps
IX
xi
xvii
SARAH SMYTH
Introduction
PART i Identity options
IRINA ZAK AND ARIE COHEN
Explicit/implicit acculturation and adaptation amongRussian immigrant teachers in Israel zi
MARTIN EHALA AND ANASTASSIA ZABRODSKAJA
Ethnolinguistic vitality of ethnic groups in the Baltic countries 45
MIKHAIL A. MOLCHANOV
Russian national identity: old traumas and new challenges
PART -L Identities in the making 109
SVETLANA ERIKSSON
Who are you? Cultural associations in (self-)othering andcultural identity negotiation among Russian-speakingadolescents from Russia and Latvia in Ireland in

VI
CLAUDIA ZBENOVICH
The Russian-Jewish babushka in Israel: discourse analysisof a cultural phenomenon 141
Notes on Contributors
GALINA NIKIPORETS-TAKIGAWA
Digital debates on Soviet memory in the national identityconstruction of post-Soviet migrants
GERMAN MENDZHERITSKIY AND EKATERINA BAGREEVA
Should we speak Russian? Everyday practice ofRussian-speaking migrants in Germany and Norway
163
183
Index of ethnic groups, people and places
PART 3 Identities lost and found 101
SARI POYHONEN
Language and ethnicity lost and found: multiple identitiesof Ingrian Finnish teachers in Russia 2.03
DIONYSIOS ZOUMPALIDIS
Russian language - Greek identity: a sociolinguistic approachto the Pontic Greek community in Russia 2.2.7
SHOLPAN ZHARKYNBEKOVA AND BAURZHAN BOKAYEV
Global transformations in Kazakhstani society and problemsof ethno-linguistic identification 2-47
JASMINE DUM-TRAGUT
Striving for linguistic independence ? The Armenian languagein post-Soviet Armenia: language policy and language planning 179

I is( of tables and figures
I It I NA ZAK AND ARIE COHEN
Explicit/implicit acculturation and adaptation
among Russian immigrant teachers in Israel
'Table i Sequence of trial blocks Z9
'Iable z Teachers'acculturation attitudes across life domains 31
Table 3 ANOVA scores for acculturation profiles with BDI-II/RASI 32,
Table 4 Correlations between the acculturation scales andadaptation measures 33
Table 5 Contribution of implicit and explicit methods to evaluationofBDI-IIandRASI 36
Figure i Comparison of BDI-II scores in teachers with high and low IAT
within each acculturation profile 35
Figure z Comparison of RASI scores in teachers with high and low IAT
within each acculturation profile 36
MARTIN EHALA AND ANASTASSIA ZABRODSKAJA
Ethnolinguistic vitality of ethnic groups in the Baltic countries
Table i General characteristics of the two major linguistic groups in Estonia 54
Table z General characteristics of the major linguistic groups in Latvia 55
Table 3 General characteristics of the major linguistic groups in Lithuania 57

XllList of tables and figures List of tables and figures xni
6i
62
6z-63
63-64
65
70
Table 4 The sample in Estonia
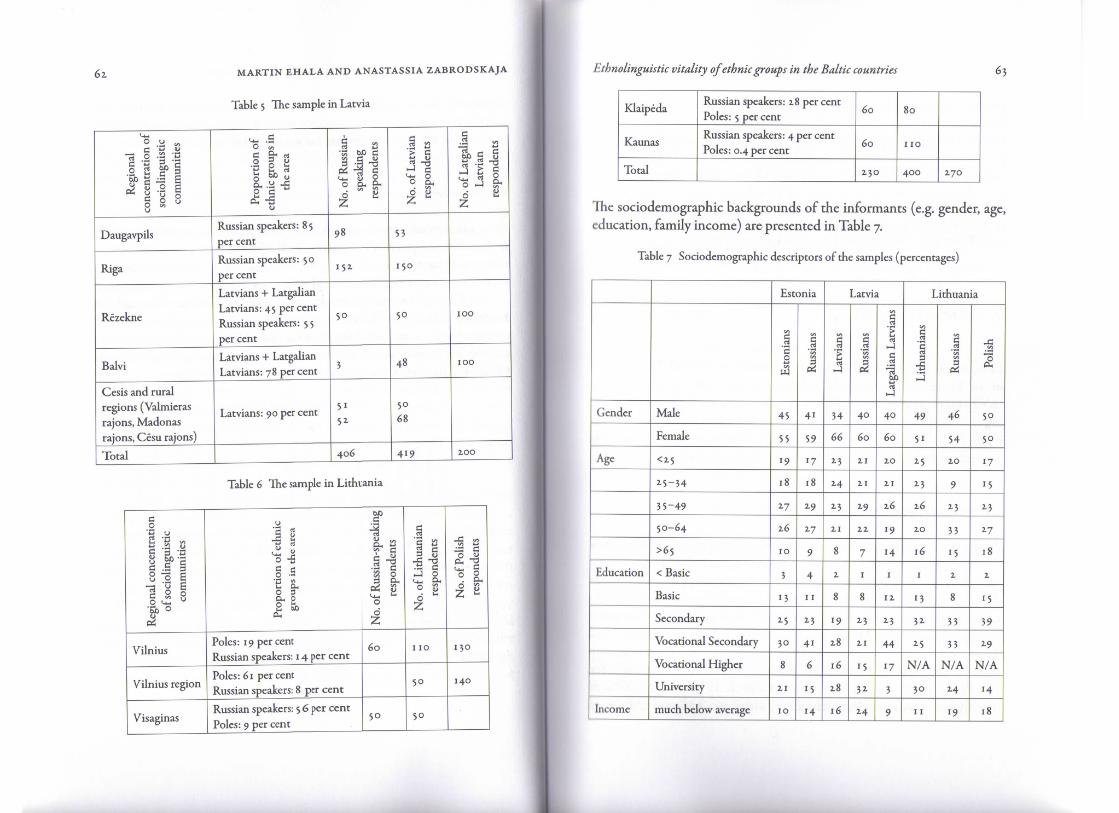
Table 5 The sample in Latvia
Table 6 The sample in Lithuania
Table 7 Sociodemographic descriptors of the samples (percentages)
Table 8 Perceived strength differential D (i - maximum superiority... -i - maximum inferiority)
Table 9 Perception of legitimacy (i - low... 6 - high)
Table 10 Perception of distrust (i — low ... 6 — high)
Table n Indicators of discordance D (-Q.ZS - positive ... 0.75 - negative)
Table iz Levels of utilitarianism and traditionalism (i - lowest... 6 - highest)
Table 13 Indicators of the U index (2, - highest... o - lowest)
Table 14 Language choice Ri (o - out-group language only... i — in-group language only)
Table 15 Cultural distance Rz (o - minimal... i - maximal)
Table 16 Degrees of vitality scale
Table 17 Vitality of ethnic groups in the Baltic countries
Table 18 Acculturation processes as a function of majorityand minority groups' vitality
Figure i Interdependence between group vitality V and theperceived strength of the groups PSD
Figure z Interdependence between group vitality V andintergroup discordance D
Figure 3 Interdependence between group vitality V and intergroup distance R 49
Figure 4 Interdependence between group vitality V and group value system U 51
72-
73
74
76
77
79
80
83
47
48
SVETLANA ERIKSSON
Who are you? Cultural associations in (self-)othering and cultural
identity negotiation among Russian-speaking adolescents from Russiaand Latvia in Ireland
Table i Age of research participants
Table z Gender of research participants
Figure i Cultural self-identification of research participants
138
138
139-140
GERMAN MENDZHERITSKIY AND EKATERINA BAGREEVA
Should we speak Russian? Everyday practice of Russian-speakingmigrants in Germany and Norway
Table i Thematic blocks of questionnaire
Table z Russian as a language of communication in the home
Table 3 Watching Russian TV by respondents
Table 4 Contacts with relatives and family members in the countryof origin
189
191
194
197-198
DIONYSIOS ZOUMPALIDIS
Russian language - Greek identity: a sociolinguistic approach to thePontic Greek community in Russia
' 1 able i Self-reported mother tongue(s) 2-35

MARTIN EHALA AND ANASTASSIA ZABRODSKAJA
Ethnolinguistic vitality of ethnic groupsin the Baltic countries
Introduction
Kthnolinguistic vitality 'is that which makes a group likely to behave as adistinctive and active collective entity in intergroup situations' (Giles ettil. 1977: 308). It has been suggested that groups that have low vitality arelikely to cease to exist as distinctive collectives, while those that have highv11ality are likely to survive.
Ethnolinguistic vitality is a complex social psychological phenomenon,a collective mindset to behave distinctively as a group. It is formed by sev-n ,il factors that will be outlined in Section i. Vitality is also related to thegroup's strength, sometimes called 'objective vitality', which is determinedI »y i hree structural variables: demography, institutional support and status( ( l i l c s et al. 1977). For our analysis, we also present short accounts of the»l i cngth of the groups whose vitalities are analysed (Section z). Objectivevlulity serves as an important reference point for assessing how vitality,which is socially constructed, reflects objective reality. In Section 3, themethodology of the study and sample design are addressed. Finally, the
1 1 1 | Mcr presents the results of three quantitative surveys of the ethnolinguis-111 v 11.11 i ty of the main ethnic groups in Estonia, Latvia and Lithuania. TheH 1 1 1 1 s are discussed comparatively, in an effort to further our understand-In^! cthnolinguistic vitalities of the Baltic titular groups and minorities.

46 MARTIN EHALA AND ANASTASSIA ZABRODSKAJA
[. Theoretical background
Although the concept of vitality is intuitively clear and has remained attrac-tive for researchers, it has been criticized for being a rough and unreliabletool for measuring a group's ability to behave collectively as a distinctiveentity (Husband and Saifullah Khan 1982.). As a response to this criticism,Ehala (1005,2.008, zoioa, zoiob) developed an extended theory of ethno-linguistic vitality (EEV) that draws on previous models of ethnolinguisticvitality (Giles et al. 1977; Sachdev and Bourhis 1993; Allard and Landry1994; Landry et al. 1996; Bourhis zooi) and several other works on thesocial psychology of language maintenance (Conklin and Lourie 1983;Edwards 1985,1994; Fishman 1986; Smolicz 1981; Sanders zooz). EEVspecifies the structural relationships between its four key variables thataffect the vitality of ethnolinguistic groups:
i. perceived strength differential (PSD) between the in-group ('us') andthe most prominent out-group ('them');
z. the level of intergroup discordance (D);3. perceived intergroup distance (R);1 and4. the level of utilitarianism (U) in the value system of the group studied.
All these factors are sociopsychological, and they reflect group members'perceptions, attitudes and beliefs about their own group and interethnicrelations in the setting in which they live. EEV is operationalized in away that makes it possible to assess these factors on a scale, so that eachrespondent is characterized by a vitality score. By calculating the averagescore for the sample and/or finding subgroups with different vitality scores,it becomes possible to assess the vitality of a given group, i.e. its readinessto act as a collective entity in intergroup relations. Below we characterizeeach of the subcomponents of EEV in more detail.
i R comes from the notion of radius, from the metaphor of ethnic groups having acertain gravity that attracts their members. The attraction decreases as the value of
R grows.
Ethnolinguistic vitality of ethnic groups in the Baltic countries 47
/. i. Perceived strength differential (PSD)
The driving force behind language shift is the power difference betweendominant and minority groups. Language and identity maintenancedepends on the opportunities and rewards, real or symbolic (includingpositive social identity), that the competing groups can provide for theirmembers. The sum of these factors can be called the perceived strength ofthe group. In EEV, perceived strength is the same variable that is under-stood as 'subjective vitality' in the standard ethnolinguistic vitality theory(see Bourhis et al. 1981).
For group vitality, the crucial factor is not perceived strength itself,but the perceived strength differential between the in-group and the mostprominent out-group. The reason is that groups exist in their sociohistori-cal settings and the perception of the strength of the 'us' group dependson the relative strength of any 'them' groups (see Figure i).
High vitality Low vitality
Positive PSD:Po sitive collective identity,high self-esteem
Negative PSD:Negative collective identity,
low self-esteem
Figure i Interdependence between group vitality Vand the perceived strength of the groups' PSD
In general, if PSD is small, the benefits of shifting one's group membershipdo not outweigh the emotional and social costs needed for a radical identityshift. The more PSD is in favour of the out-group, the more beneficial itseems to shift identity. Thus, provided that the influence of all other factorsis zero, the group V is equal to the differential of the perceived strengths(Swe and Sthey) of the minority (in our case, Russian-speaking) and major-it y (Estonian, Latvian or Lithuanian) groups. Mathematically, this can beformulated as follows: V = PSD = Swe - Sthey. If V < o, then the group haslow vitaJity; in other words, it has low potential to act as a group, a conditionthat maiy lead to identity and language shift. If V > o, then the group is vital,I.e. it is able to function as a group and to maintain its identity over time.

MARTIN EHALA AND ^NASTASSIA ZABRODSKAJA Ethnolinguistic vitality of ethnic groups in the Baltic countries 49
.2. Intergroup discordance (D)1.2
Intergroup discordance (D) expresses the perceived illegitimacy of theintergroup power relations, as well as distrust towards the out-group. Forexample, if a minority group perceives its low status to be legitimate, itsmembers may exhibit out-group favouritism (<>achdev and Bourhis 1991;Batalha et al. 1007), which encourages identity and language shift. On theother hand, if the situation is perceived to be illegitimate, the members arelikely to feel distrust towards the majority. In si^h conditions, there is lessmotivation and possibility for individual minority group members to shifttheir identities. Instead, the minority will be m<>re prone to act collectivelyfor justice. Thus, the lower the sense of legitimacy (i.e. the stronger thefeeling of injustice) and the higher the perception of distrust towards thepowerful out-group, the higher the vitality of the minority group.
High vitality Low vitality
High level of discordance No discordance,neutral feeling
Out-group favouritism
Figure ^ Interdependence between group vitality V ̂ intergroup discordance D
The relationship between D and the other components of V needs to bespecified, too. It would be reasonable to assume that the larger the negativePSD and the lower the value of D (i.e. the m>re legitimate the situationis considered to be, and the more trusting tr? attitudes are towards theout-group), the lower the V value of the respe<tive group (see Figure z). Inthis case, the low-status group is unlikely to challenge the existing powerrelations, as it feels too weak and perceives its ow status as legitimate. Thesmaller the negative PSD and/or the higher I>> the higher the V value, asthe low-status group has both the motivation establishing justice) and theperceived strength to change the power relations. When D is incorporated,the V formula takes the following form: V = $we ~ ^they) + D.
It is reasonable to assume that in a case wrfre there is neither perceiveddiscordance with the out-group nor perceive, out-group favouritism, the
value of D would be equal to zero, i.e. it would not affect the value of V.The higher the positive value of D, the more it will reduce the negativevalue of PSD, leading to higher values of V. If D has a negative value (indi-cating out-group favouritism), it will increase the negative value of PSD,leading to lower values of V.
/. ?. Intergroup distance (R)
Intergroup distance (R) relates to the extent of intergroup contact andthe distinctiveness of features characterizing the group. The avoidance ofintergroup contact expresses a group's disposition to maintain its in-groupnetworks, while the environment offers opportunities for the developmentof a different network that unavoidably weakens the heritage network(Landry et al. 1996). Therefore, a disposition to maintain segregative minor-ity networks would enhance V, despite a large negative PSD.
The network structure, in turn, is heavily related to language use: asintergroup contact often involves two languages, network structure deter-mines language use patterns. The more numerous the contacts of the minor-ity group with the dominant out-group, the more the dominant languagetends to be used. This means that the language use pattern is often a goodindicator of the extent of intergroup contact. Besides language, intergroupdistance can also be marked by other features, such as religion and othercultural practices (Myhill 1003), as well as racial features. Ultimately, inter-group distance is dependent on the symbolic and discursive factors thatestablish the norms concerning the acceptability, extent and nature of inter-group contacts; this is also related to ethnic distinctiveness (see Figure 3).
High vitality Low vitality
Large R:Segregated social networksHigh ethnic distinctiveness
Small R:Integrated social networksLow ethnic distinctiveness
Figure 3 Interdependence between group vitality V and intergroup distance R
50 MARTIN EHALA AND ANASTASSIA ZABRODSKAJA
Thus, all other factors being constant, the less intergroup contact takesplace and the more distinct the groups appear, i.e. the larger R, the higherV. Mathematically, the relationship of intergroup distance to the otherfactors can be expressed as V = ((Swe - Sthey) + D) / R.
The minimum value of R, both in terms of contact and distinctive-ness, is i. This means a very strong interconnectedness of social networksand a high cultural similarity between the groups. Such a situation may becharacteristic of dialect or regional language groups in relation to standardlanguage speakers (Ehala and Niglas zooy). In such cases, it is very easy toshift from one group to the other, and R has no impact on vitality, whichis determined only by PSD. When R is larger than i, this starts to reducethe effect of negative PSD, because of the costs that are associated with theshift from one group to another. Thus, the larger R gets, the closer V gets tozero, i.e. the point where the benefits of identity shift are cancelled out bythe costs. At this point, there would be no motivation for an identity shiftby the minority group members. This indicates a relatively higher vitality.
1.4. Utilitarianism (U)
U is a value system that justifies a pragmatic and economically beneficialcourse of action (Scollon and Scollon 1995). Cultures, however, functionas Jie interplay of pragmatic and emotional motivations, and utilitarianprinciples are balanced by what can be called the traditionalist value system.The traditionalist value system expresses the group members' commitmentto Jieir cultural practices and values. In a balanced culture, utilitarian andtraditionalist values are in modest conflict, the two sides of which arerational efficiency and tradition, which is a characteristic of many well-functioning societies. This opposition is well recognized by the majortheories of human values, such as Schwartz (1991,1006) and Inglehart andWclzel (2.005), although all authors use their own terminology.
Different groups may vary with regard to the salience of utilitarianand traditionalist values in their culture. Although the levels of utilitarian-ism and traditionalism can form different combinations (see Ehala ioiz),both of them are direcdy relevant to language and identity maintenance.
Ethnolinguistic vitality of ethnic groups in the Baltic countries 51
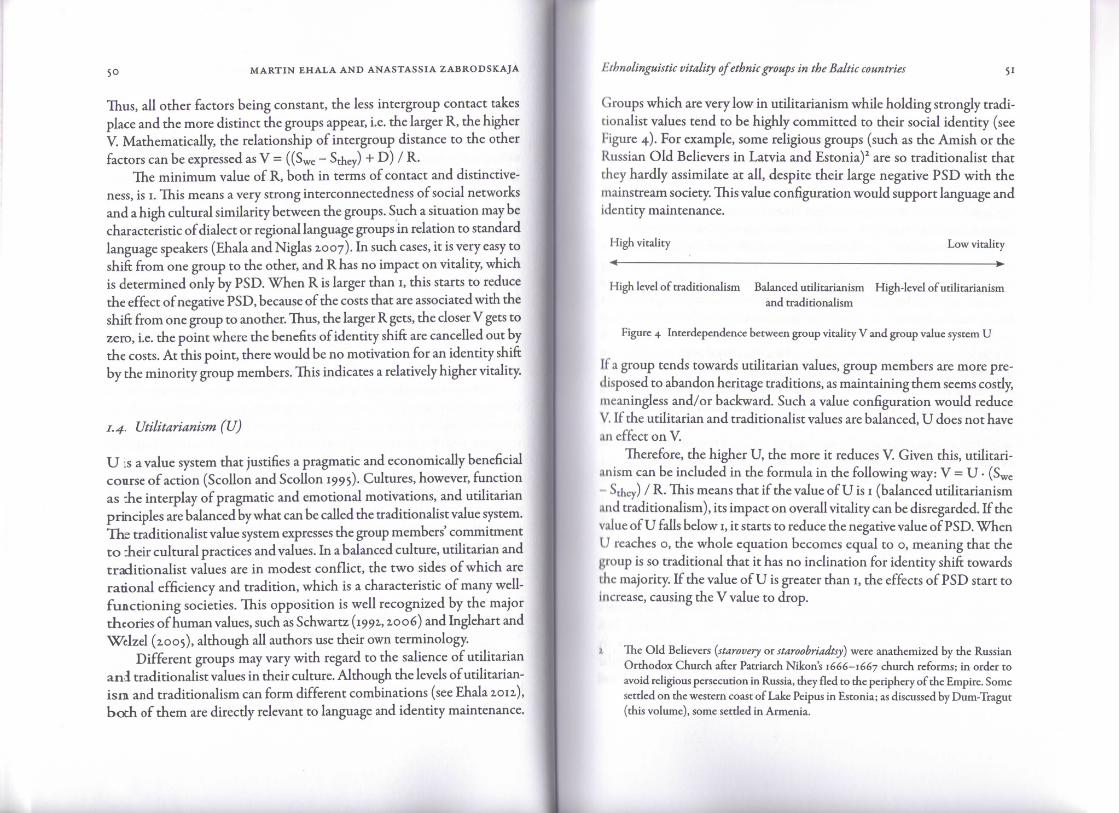
Groups which are very low in utilitarianism while holding strongly tradi-tionalist values tend to be highly committed to their social identity (seeFigure 4). For example, some religious groups (such as the Amish or theRussian Old Believers in Latvia and Estonia)2 are so traditionalist thatthey hardly assimilate at all, despite their large negative PSD with themainstream society. This value configuration would support language andidentity maintenance.
High vitality Low vitality
High level of traditionalism Balanced utilitarianism High-level of utilitarianismand traditionalism
Figure 4 Interdependence between group vitality V and group value system U
If a group tends towards utilitarian values, group members are more pre-disposed to abandon heritage traditions, as maintaining them seems costly,meaningless and/or backward. Such a value configuration would reduceV. If the utilitarian and traditionalist values are balanced, U does not havean effect on V.
Therefore, the higher U, the more it reduces V. Given this, utilitari-anism can be included in the formula in the following way: V = U • (Swe
- Sthey) / R- This means that if the value of U is i (balanced utilitarianism.ind traditionalism), its impact on overall vitality can be disregarded. If thevalue of U falls below i, it starts to reduce the negative value of PSD. WhenU reaches o, the whole equation becomes equal to o, meaning that thegroup is so traditional that it has no inclination for identity shift towardsthe majority. If the value of U is greater than i, the effects of PSD start toincrease, causing the V value to drop.
The Old Believers (starovery or staroobriadtsy) were anathemized by the RussianOrthodox Church after Patriarch Nikon's 1666-1667 church reforms; in order toavoid religious persecution in Russia, they fled to the periphery of the Empire. Somesettled on the western coast of Lake Peipus in Estonia; as discussed by Dum-Tragut(this volume), some settled in Armenia.

52- MARTIN EHALA AND ANASTASSIA ZABRODSKAJA
It must be noted, however, that language shift is not always connectedto high level of utilitarianism. As Zoumpalidis (this volume) shows, thePontic Greek community is undergoing a shift to Russian, yet the commu-nity is quite traditional in other aspects of its culture and has a strong senseof group identity. This is often the case with communities whose heritagelanguage is not one of their core values (see Smolicz 1981). Thus it is moreappropriate to say that high traditionalism favours identity maintenancein general and if language is one of the core values it is also maintained.
In some circumstances, utilitarianism can also be beneficial for ethnicminority maintenance, but only in cases where the language is spoken bya majority in another prominent country. For example, Poyhonen (thisvolume) reports that the Finnish language has become very popular innorth-western Russia, which helps the Ingrians to regain their lost languagecompetency. The same appears to be the case with Russian minorities inthe Baltic countries, where Russian can be maintained even on utilitariangrounds as it is a useful language in the region.
In sum, there are four vitality factors: perceived strength differential(PSD); intergroup discordance (D); intergroup distance (R); and tradition-alism/utilitarianism (U). By measuring these factors, we can draw a vitalityprofile of a group. This profile may help to predict the groups interethnicbehaviour and acculturation orientations.
. General characteristics of the main ethnic groupsin the Baltic States
Vitality is a complex combination of attitudes, which although they reflectthe stiength of the ethnic group do not always reflect it objectively. Thissectioi gives an overview of the demographic and institutional supportfactor; that could be taken as characterizing the strength of each particularethnicgroup. This overview serves as a reference point in the analysis and
Ethnolinguistic vitality of ethnic groups in the Baltic countries 53
discussion stages to pinpoint the differences between the objective strengthof the groups and the way they have constructed their vitality.
With regard to demographics, absolute values (the actual proportionsof each group in the population and its dispersion in the territory) aregiven. Institutional support factors include the presence of education inthe mother tongue at different levels, heritage language mass media andtheir diversity as well as the diversity of cultural activities in the languageand their quality and prestige. The economic context is described throughthe evaluation of the welfare of group members, and the stability of thegroups ethnic economy and political organization. Next, we present anoverview of these characteristics as applied to the ethnicities in the Balticcountries to contextualize the results of the vitality study.
Russian is the dominant language of ethnic Russians, Ukrainians,Belarusians and members of a number of other ethnicities in the territoryof the Soviet Union who settled in the Baltic countries during the Sovietperiod. These communities/groups have constructed a common language-based identity in which the Soviet element has a substantial role. In thissense, these communities show similar identity processes, which are char-acterized in detail by Nikiporets-Takigawa (this volume): Victory Day hasbecome a strong uniting symbol, along with nostalgia for several otherSoviet-era phenomena. As this common identity is constructed mainlyby means of the Russian language, we call these groups Russian-speakingcommunities without distinguishing the share of different ethnic back-grounds in them.
2.1. Estonia,
According to the ion census, there are 1.2.9 million people in Estonia. Theparticipants in our study were Estonians and Russian speakers (see Table i).As just noted, the latter included, along with Russians, representatives ofother ethnicities (share in the country's population: z6 per cent Russians,2. per cent Ukrainians, and i per cent Belarusians).

54 MARTIN EHALA AND ANASTASSIA ZABRODSKAJA
Table i General characteristics of the two major linguistic groups in Estonia
Population size
Percentage of totalpopulation
Geographicaldistribution
Education in thenative language
Mass media in thenative language
Cultural ife in thenative language
Materialprosperity
Role in Estonianeconomy
Political tctivity
Estonians
889,000
69 per cent
17,780 (z per cent) inIda-Virumaaz 1 5,000 (z4 per cent) inTallinn666,750 (75 per cent) in otherareas with high ethnic density
All levels and in all areas
A wide range of print,electronic and audiovisualmedia
Broad and rich cultural life
Higher incomes than thenational average
Decisive
Politically well organized
Russian speakers
384,000
Z9 per cent
1 30,000 (34 per cent) in Ida-Virumaa (high ethnic density)1 85,000 (48 per cent) inTallinn76,800 (zo per cent) in otherareas
Basic and incompletesecondary education; highereducation only in a fewdisciplines
Few local print, electronic andaudiovisual media; however,many Russian Federationsources are accessible
Limited local cultural life
Lower incomes compared tothe national average
Modest, with the exception ofIda-Viru, where substantial
Politically poorly organized
The sizaUe Russian-speaking population of Estonia lives very compactly:only 2.0 j>er cent are scattered in Estonian-speaking areas. Almost half ofthe Russian-speaking population lives in Tallinn and a third in Ida-ViruCounty,! region which is economically weaker than the national average.Here, th: density of the Russian-speaking population is extremely high.
Ethnolinguistic vitality of ethnic groups in the Baltic countries 55
Although education in Russian currently continues to the end of second-ary school, Russian-language schools are now being actively transitionedto partial Estonian-language instruction in the upper secondary level. Thelocal cultural life is fairly poor in comparison with Russia. Thus, our edu-cated guess would be that despite the fact that the demographics of theRussian-speaking community are quite good, economic weakness does notallow the community to be culturally and politically active.
2.2. Latvia
According to the 2.011 census, the population of Latvia was z,o 67,000(see Table z for a comparison of the major ethnic groups). AlthoughLatgalian Latvians themselves consider themselves to be Latvians andare thus included in the population figures vis-a-vis the Russian-speakingpopulation, the share of Latgalian Latvians is additionally expressed as aproportion of the rest of the population. Latgalian Latvian identity is thusa sub-identity of a regional Latvian identity. At the same time, LatgalianLatvians themselves still want to be seen separately from the rest of theLatvians (Latgalian is not understandable to Latvians; the mentality andculture are also different). Therefore, in evaluating the vitality of LatgalianI .atvians, we consider the two groups separately.
Table z General characteristics of the major linguistic groups in Latvia3
Populationsize
Percentage< > r totalpopulation
Latvians (incl.Latgalian Latvians)
i. z84 million
6 1 per cent
Russian speakers
676,000
3 1 per cent
Latgalian Latvians
140,000
7 per cent
t Data from the zon census; Joma and Merzs zoo8; Marten et al. zoo9.

MARTIN EHALA AND ANASTASSIA ZABRODSKAJA
Geographicaldistribution
Educationin the nativelanguage
Mass mediain the nativelanguage
Cultural lifein the nativelanguage
Materialprosperity
Economicrole
Politcalmaturity
Dominant in smalltowns and ruralareas. In the minorityinRiga(z99,i7ior 23 per cent), inDaugavpils ( i .4 percent or 1 8,oz6) andRezekne (1.2. percenter 15,560)
At all levels and inall areas
A wide range ofprint, electronic andaudiovisual media
Broad and richcultural life
Average
Average
Politicallywell-organized
Dominant in twolargest cities: 387,000(57 per cent) inRiga (5 5 percentof city population),88,000 (13 percent) in Daugavpils(85 per cent of citypopulation)
Basic and partlysecondary education,higher education inmany disciplines
Good selection ofprinted, electronicand audiovisualinformation. Mediachannels from Russia
Significant localcultural life
Above average
Significant
Politicallywell-organized
Ca. 60,000 in theLatgale region(43 per cent ofpopulation). The restare scattered acrossother parts of Latvia
Practically absent;taught as a subjectin seven schools inLatgale
Just one newspaperand a half-hour radioprogramme once aweek
Activities andreligious services
Below average
Below average
Narrow circle ofactivists
The Latvian Russian-speaking community is large in absolute numbers: itconstitutes more than one-third of the Latvian population and dominatesin the capital and major cities. In addition, the Russian speakers in Latviaare qiite active economically and their standard of living is above average.All o: this supports strong cultural and political organization. Given thesefigures, it can be argued that the Russian-speaking community, by its sizeand power, is a strong group and only slighdy weaker than Latvians. Latviansdomnate numerically but most of them live in rural areas and are weakerecommically than the urban Russian community. This balance of powerhas alowed the Russian minority to strengthen its presence in public policy.
llthnolinguistic vitality of ethnic groups in the Baltic countries 57
Latgalian Latvians form a relatively small community, which is scat-tered throughout the country and is in the minority even in its historicalhomeland. The cultural and economic role of Latgalian Latvians is verymodest. Objective indicators show that their language is under consider-able threat. The cultural identity of Latgalian Latvians is better maintainedbecause it is associated with the Catholic Church.
2.3. Lithuania
According to the ion census, there are 3.05 million people in Lithuania(Table 3).
Table 3 General characteristics of the major linguistic groups in Lithuania4
Population size
Percentage of totalpopulation
Geographicaldistribution
Lithuanians
1,583,000
8 5 per cent
Dominant inmost parts of thecountry. 40 percent live in thesouth-east andsouth In Vilniusconstitute 59per cent of townpopulation.
Russian speakers
201,000
6. 5 per cent
Ca. 108,000 whichis 5 4 per centof the Russian-speaking peoplein Lithuania andzo per cent ofthe populationof Vilnius. InVisaginas, 13,000or 1 1 per cent(75 per cent ofpopulation).
Poles
ziz,8oo
7 per cent
Over 50 per cent inrural areas. In thevicinity of Vilnius54,3 zz or Z5 percent (61.3 percentof total region'spopulation), and inSalcininki} region3i,zz3 or 15 percent (79.5 per centor total region'spopulation). InVilnius, 100,000or 5 5 per cent(19 per cent of itspopulation).
Data from overview publications by Hogan-Brun et al. zoo9.

MARTIN EHALA AND ANASTASSIA ZABRODSKAJA
Education in thenative language
Mass media in thenative language
Cultural life in thenative language
Materialprosperity
Economic role
Political maturity
At all levels and inall areas
A wide range ofprint, electronicand audiovisualmedia
Broad and richcultural life
Average
Significant
Politically wellorganized
Basic educationavailable, butLithuanian-language schoolspreferred
Print media andradio programmes;TV channels fromRussia widelyavailable
Limited localcultural life
Below average
Below average
Politically notorganized
Basic educationguaranteed. Limitedaccess to highereducation.
Print media andradio stations;Polish TV channels
Limited localcultural life
Below average
Below average
Politically organized
In terms of ethnic composition, Lithuania is the most homogeneous ofthe Baltic countries: the share of the titular nation is the largest, and nominority exceeds 10 per cent of the population. However, south-east andsouthern Lithuania, including the capital, are fairly multiethnic. Rural areasin the vicinity of Vilnius are populated by Polish speakers, a group whichis considerable in size and lives quite compactly, promoting the stabilityof thisgroup. In contrast, the Russian-speakingcommunity is widely scat-tered; zhe biggest part lives in Vilnius, making up one-fifth of the capital'sinhabitants. Though Russian-language mass media are easily accessible inLithuania and schools with Russian as a language of instruction do exist,the majority of the Russian speakers prefer Lithuanian schools and culturallife. Tr.e political organization of Russians is very weak, in contrast to thePoles, with their high political and cultural unity.
Ethnolinguistic vitality of ethnic groups in the Baltic countries
2.4. Summary
59
To summarize, on the basis of demographic and institutional supportfactors, the titular ethnic groups of the Baltic States are sustainable eth-nolinguistically, although some difficulties with cultural and politicaldomination are encountered by Latvians. Among the Russian-speakingcommunities, the largest lives in Latvia and has considerable cultural, eco-nomic and linguistic influence in the country. The second largest Russian-speaking community lives in Estonia, but both economically and politicallyit is much weaker than in Latvia. At the same time, it is quite compactlysettled, ensuring its sustainability. The number of Russian speakers inLithuania is lower, they are more dispersed across the country and they areconsiderably weaker than the Estonian Russian speakers. Considering thehistorical roots and compact residence of Poles in Vilnius and its vicinity,it is possible to consider the Polish community of Lithuania stronger thanthe local Russian one, though it is smaller. The small size is compensatedror by the high level of political and cultural self-organization. Among theBaltic minorities under consideration, the weakest are, undoubtedly, theLatgalian Latvians, because the community is small, scattered around thecountry and completely bilingual.
3. Research methodology
?. /. Measuring vitality
To date, no widely accepted measures of vitality exist, for various reasons.Hirst, social phenomena are extremely varied and difficult to measure, sincethe vitality of groups is influenced by various economic, demographic,historico-cultural and political factors. There is also no reliable methodtor measuring the economic, cultural, political and demographic power ofthese groups, which hampers comparative research, particularly in relationto different language environments.
6o MARTIN EHALA AND ANASTASSIA ZABRODSKAJA
Secondly, these factors influence the vitality of a group and its assimi-lation only indirectly, and this influence does not always lend itself to une-quivocal interpretation. The reason is that, strictly speaking, the phenomenaof language and identity shift occur not at the group level, but at the levelof the individual. What language is used in speaking with children, andwhat language is used in their education, depends primarily on individualbeliefs and the decisions made on the basis on those beliefs, instead of beingbased on the economic, cultural and other forces working on the groupas a whole. Given that language shift is a result of the language behaviourof individuals, the actual strength of a group is not as important as theindividual opinions of the group members regarding the group's strength,which are formed and expressed in communication.
Measurement of subjective assessment and attitudes makes it possibleto create a tool by means of which it is possible to collect easily comparabledata in very different social environments. The main assumption is that,while the strength of the group undeniably influences group behaviour, itsinfluence is mediated by its symbolic representations in public and privatediscourse. These socially shared representations can be formalized on uni-versal scales of human cognition such as weak-strong, similar-dissimilar,high-low. These scales can be transformed to quantitatively measurablemathematical scales that enable quantitative comparison across differentinterethnic situations.
One of the best research methods that meet these conditions is theLikcrt scale questionnaire, which offers a ra.ige of responses (Garrett etal. 1003). This approach has also been used ir classic studies on subjectivevitality (Bourhis et al. 1981; Abrams et al. zoc?). To reduce possible errorscaused by formulations of single questions, it svas decided to measure eachmodel component by using thematic groups :>f questions, comprising tenquestions each. The reliability of such a thematic group can be checked bymeans of statistical methods that strengthen tre reliability of the theoreticalpropositions underlying the formulation of tie questions. Basically, if theque;tions whose content reflects the concept; they are based on show highconelation among themselves, it is possible o argue with confidence that
Hthnolinguistic vitality of ethnic groups in the Baltic countries 61
all these questions express the attitudes of the respondents to more gen-eral phenomena underlying the questions themselves. For a more detailedoverview of the choice of questions see Ehala (zoo8).
1.2. Sampling
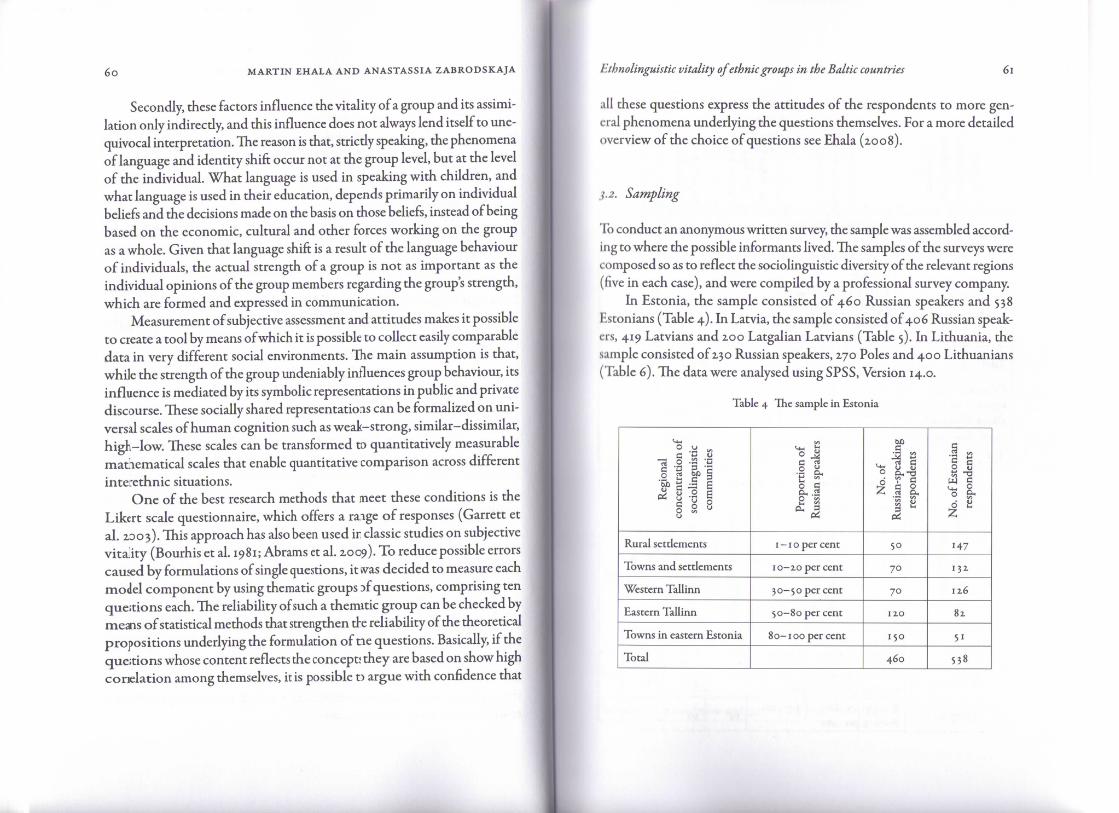
To conduct an anonymous written survey, the sample was assembled accord-ing to where the possible informants lived. The samples of the surveys werecomposed so as to reflect the sociolinguistic diversity of the relevant regions(five in each case), and were compiled by a professional survey company.
In Estonia, the sample consisted of 460 Russian speakers and 538Kstonians (Table 4). In Latvia, the sample consisted of 406 Russian speak-ers, 419 Latvians and zoo Latgalian Latvians (Table 5). In Lithuania, thesample consisted of Z3O Russian speakers, zyo Poles and 400 Lithuanians(Table 6). The data were analysed using SPSS, Version 14.0.
Table 4 The sample in Estonia
u*° u f>
•a l i iC 'O => "30 2 r? §•a s M 1^ 8 2 c
c X §0 S uu
Rural settlements
Towns and settlements
Western Tallinn
Eastern Tallinn
Towns in eastern Estonia
Total
<-* P210 «•c S"3 cII
-1
i - 1 o per cent
i o-io per cent
3 0-50 per cent
5 0-80 per cent
80- 1 oo per cent
bfi3 a
<*H 8 50 0,-a
^ i o& rt Ou,
P
5°
70
70
IZO
ISO
460
c.2 <«2 c0 gfc> -Ss §^ &<l §
1471311 168z
Si
538
MARTIN EHALA AND ANASTASSIA ZABRODSKAJA
Tables The sample in Latvia
Ui0 .a ~C C <u
-73 § -52 -0rt .5 r-j •--
11 11#§1 IC '2 §§ 8 u
Daugavpils
Riga
Rezekne
Balvi
Cesis and ruralregions (Valmierasrajons, Madonasrajons, Cesu rajons)
Total
^ .5o </,C £> rt.2 § B« a «0 "> «cL.a -g2 Sc^ -Su
Russian speakers: 85per cent
Russian speakers: 50per cent
Latvians + LatgalianLatvians: 45 per centRussian speakers: 5 5per cent
Latvians + LatgalianLatvians: 78 per cent
Latvians: 90 per cent
No.
of
Rus
sian
-sp
eaki
ngre
spon
dent
s
98
152-
50
3
5i52-
406
No.
of
Lat
vian
resp
onde
nts
53
150
So
48
5°68
419N
o. o
f L
atga
lian
Lat
vian
resp
onde
nts
IOO
100
ZOO
Table 6 The sample in Lithuania
o'13 u2 '*3 v>*j .2 og a "Cu £P 'qc .5 38 "3 S
— < (j C
S ^ u
Vilnius
Vilnius region
Visaginas
u .SfM rt ^3
-^ y y wi,u u <« C^3 -a 5 °c c -I c_o •- S oU OH
S.I * aS w>
Poles: 1 9 per centRussian speakers: 1 4 per cent
Poles: 6 1 percentRussian speakers: 8 per cent
Russian speakers: s 6 per centPoles: 9 per cent
60
5°
•21 c1-3•*8 grt s.O o
O2
I IO
50
50
-Si 52^3 C(2 ~2M-H *̂
°_ ^o 53Z ^
130
140
Ethnolinguistic vitality of ethnic groups in the Baltic countries
Klaipeda
Kaunas
Total
Russian speakers: z8 percentPoles: 5 per cent
Russian speakers: 4 per centPoles: 0.4 per cent
60
60
Z30
80
no
400 zyo
The sociodemographic backgrounds of the informants (e.g. gender, age,education, family income) are presented in Table 7.
Table 7 Sociodemographic descriptors of the samples (percentages)
Gender
Age
Education
Income
Male
Female
<Z5
2-5-34
35-49
50-64
>65
< Basic
Basic
Secondary
Vocational Secondary
Vocational Higher
University
much below average
Estonia
Est
onia
ns
45
55
19
18
2-7
z6
10
3
13
2-5
308
ZI
IO
Rus
sian
s
4i
59
i?
18
2-9
17
9
4
1 1
2-3
41
6
15
14
Latvia
Lat
vian
s
34
66
2.3
2-4
2-3
ZI
8
z
8
19
z8
16
z8
16
Rus
sian
s
40
60
ZI
ZI
2-9
zz
7
i
8
2-3
ZI
1532.
2-4
Lat
galia
n L
atvi
ans
40
60
zo
ZI
z6
19
14
i
IZ
2-3
44
i?
3
9
Lithuania
Lith
uani
ans
49
5i
2-5
2.3
z6
zo
16
i
i3
32-
2-5
N/A
30
u
Rus
sian
s
46
54
zo
9
2-3
33
15
z
8
33
33
N/A
2-4
i9
i1
50
5°
i?
15
2.3
2-7
18
z
1539
2-9
N/A
14
18

MARTIN EHALA AND ANASTASSIA ZABRODSKAJA
slightly below average
average
slightly above average
much above average
zo
54
13
z
2-3
55
8
o
ZI
53
10
o
2.1
4i
12,
1
16
59
15
1
2-4
53
10
i
ZZ
51
8
o
2-9
45
6
2,
The questionnaires were presented in the state language (Estonian, Latvianor Lithuanian) and Russian for the participants to choose the preferredone. There were no Polish or Latgalian Latvian versions.
4. Results of the study
First, results are presented separately for each factor (PSD, D, U and R)of the theoretical vitality model, followed by the results for the combinedfactors for measuring vitality (V). A short description of questions measur-ing each factor and indicators of reliability statistics are given (Cronbach'sa, the factor of internal constancy or internal uniformity indicating thestrength of the correlation between variables forming a scale).
4.1. Perceived strength differential
The PSD section comprised twenty questions.ten of which measured howstrorg the minority group perceived itself (Swe) as being, and ten moremeasuring how they compared themselves to the majority (S^gy). Questionsabout in- and out-groups were formulated in jarallel and were asked alter-nately. For example, a Russian-speaking infornant was asked: 'How muchare Russian culture and traditions appreciated in Estonian society?', and'Hov much are Estonian culture ind traditions Ippreciated in Estonian soci-ety?'The same questions were addressed to Esonians, only in reverse order,
[n our study, the reliability level of alrrost all groups of questions(tweity-two) was high (Cronbadi's a > .7) witl the exception of Lithuanian
Ethnolinguistic vitality of ethnic groups in the Baltic countries
Russian speakers evaluating the potential of Lithuanian (a = .571), LatgalianLatvians evaluating the capacity of the Russian-speaking group (a = .641),Latvians evaluating Latvian Russians (a = .679), and Latgalian Latvians(a = .683). As the deviations were insignificant, the average values on allblocks of questions were calculated. The numerical indicators were thentransformed from the initial scale (i - very strong... 7 - very weak) to astandard scale (o - very weak ... i - very strong). Therefore, it is possibleto consider each result as a percentage of absolute power, which was equalto i. Perceived strength differential was calculated as Swe - Sthey, and fellwithin the interval from -i (very weak) to +i (very strong). If the result ofA calculation equals o, it means that groups are perceived as equal amongthemselves. The results of the perceived strength of in- and out-groups arepresented in Table 8.
Table 8 Perceived strength differential D(i - maximum superiority... -i - maximum inferiority)
we -> they
Estonians ->Russians
Russians ->Estonians
PSD
0.13
-0.19
we -» they
Latvians•» Latgalian Latvians
Russians-> Latgalian Latvians
Latvians -> Russians
Latgalian Latvians-> Russians
Russians -> Latvians
Latgalian Latvians-» Latvians
PSD
0.30
0.15
O.IO
-O.IO
-O.2.O
-0.19
we -» they
Lithuanians -> Poles
Lithuanians-> Russians
Russians -> Poles
Poles -> Russians
Russians-> Lithuanians
Poles -> Lithuanians
PSD
0.30
0.19
0.07
o.oo
-0.19
-O.Z9
I he results show that all titular nations perceived their group as strongerthan the other groups. In Latvia and Lithuania, Russian speakers were seenus stronger than the other minority group, but Latvians perceive themselves

66 MARTIN EHALA AND ANASTASSIA ZABRODSKAJA Ethnolinguistic vitality of ethnic groups in the Baltic countries 67
to be closer to their Russian speakers in strength than Lithuanians. This ismirrored in the perception of all minority groups. Thus, Latvian Russianspeakers felt relatively stronger compared to the other groups of Russianspeakers, which is not surprising, considering the fact that they are the big-gest Russian-speaking community in the Baltic States. Lithuanian Russianspeakers and Poles felt that they were almost equal to one another, whileLatvian Russians and Latgalian Latvians saw Latvian Russians as the
stronger group.Undoubtedly, the most interesting result is the level of strength
Estonians felt in comparison with the local Russian-speaking community.Lithuanians assessed the strength of Russian speakers as much higher thanwould be expected from the small size of the group. To understand wheresuch views originate, we next address the analysis of single questions.
The evaluation by Lithuanians of their strength varied in the block ofquestions from 0.96 ('How much is Lithuanian used in media?') to 0.58('How would you estimate the population of the group?'). It became clearthat Lithuanians estimated the group as strong on language, cultural andeconomic indicators, but weak in terms of liow much Lithuanian culturein Lithuania was appreciated, how active a.id strong Lithuanians were inLithuanian society and how influential, in comparison with the presentsituation, the Lithuanian language and culture in Lithuania would be intwenty to thirty years' time.
Overall, Lithuanians estimated the strength of Russian speakers inL.thuania, in relation to some questions, to be high. The highest ratingwas given to Russian-language use in mass media (0.65) and its importanceir Lithuanian society (0.60); the lowest was the estimated strength of theRussian community in the demographic plan (0.43) and of the commu-nty's prospects in twenty to thirtyyears (0.40).
Byway of comparison, Estonians estimated the prevalence of Russian-language mass media as muchlower (0.51), aid the importance of Russian inEstonia as especially low (0.42,). Latvians nted the prevalence of Russian-language mass media the highest (0.70), bu: the importance of Russian fortlem was almost as low as for Estonians (0.44)- Thus, Lithuanians felt aweakness in their own ethnic group becaue of the perceived wide preva-lence of Russian-language trass media, ard also the high importance of
Russian in Lithuania. This result reflects not so much the power of theLithuanian Russian-speaking community, but a greater orientation ofLithuania towards Russia in comparison with Latvia and Estonia. SuchA 'Russian' orientation was apparently also partially caused by a weak orabsent sense of danger in relation to the Russian language and the localRussian-speaking community.
4.2. Perceived inter ethnic discordance D
To a large extent, interethnic relations are based on a shared understand-ing of reality constructed in public discourse and influenced by personalexperiences. Interethnic discordance expresses the perceived illegitimacyot intergroup power relations, as well as distrust towards the out-group.
As legitimacy is a highly abstract notion, the items that were usedto measure this variable were designed so that they would be maximallycontext sensitive, i.e. having direct relevance for this particular intergroupsetting. Questions affecting legitimacy focused on the status of the Russianlanguage in the country and the fairness of the treatment of the Russianminority. For example, in Estonia, the statements read as follows:
i. PyccKOMy aabiicy CAeAOBOAO 6w 6wxb B SCTOHHH axoptiM rocyAapcrBCHHbiM SSMKOM.[Russian should be the second official language in Estonia];
i. HoAOKCHHe pyccKoroBopameii o6mnHbi B SCTOHHH OTBCHaer MCXAyHapOAHbiMHopMOM. [The situation of the Russian community in Estonia corresponds tointernational norms];
V B OTHOIUCHHH K pycCKOflSHHHOMy HaCCAeHHK) 3cTOHCKOC TOCyAapCTBO CACAyCT
EaponeHCKHM ACMOKpaxHHecKHM npmjHnaM. [In its relations with the Russiancommunity, the Estonian Republic acts in accordance widi European democraticprinciples].
In Latvia and Lithuania, the statements were the same, but the name ofthe country was changed accordingly. In the questionnaires for Poles andI .ugalian Latvians, the questions concerning legitimacy were changed so

68 MARTIN EHALA AND ANASTASSIA Z.ABRODSKAJA
that they would express the most relevant questions about legitimacy andpower relations from the perspective of the respective minorities. For exam-ple, in the Polish questionnaire, the following statements were provided:
4. rioAbCKOMy flsbiicy CACAOBaAO 6bi 6biTb BxopbiM rocyAapcTBeHHWM asbiKOM B lOro-BOCTOHHOH Hac™ AHTBW. [Polish should be the second official language in the
south-eastern part of Lithuania];
5. BHAbHK>C H ero OKpCCTHOCTH AOA5KHH CTaib IToAbCKOH aBTOHOMHOH o6AacTbK).
[Vilnius and its region should be a Polish autonomous region].
In the questionnaire for Latgalian Latvians, instead of the question onofficial language status, the statement was phrased as
6. Latgaliesu valodai Latgales region! butu jabut par regionalo valodu. [Latgalian should
be the regional language in the Latgalian region]
There were also such questions as
7. Latvijai Latgales regiona janodrosina maclbas latgaliesu valoda. [Latvia should pro-
vide Latgalian as a language of instruction in the Latgalian region];
8. Latgales regionam Latvija ir jaiegust kulturas autonomijas statuss. [The Latgalian
region should get the status of cultural autononr in Latvia].
A ten-item questionnaire was designed to measure legitimacy and trust.All of the items used Likert-type scales, allowing for the following choices:i - strongly agree, z - agree, 3 - somewhat agree, 4 - somewhat disagree,5 - disagree, and 6 - strongly disagree. The \alidity and reliability of thescales were tested in a pilot study (Zabrodsktja 2.009).
The same items were used with all three samples to measure the per-ception of legitimacy and trust among the titilar nation, the local Russiancommunity and the second biggest ethnic grcup (in the case of Latvia andLithuania). The validity and reliability of the 'elevant scales were at accept-able levels (Cronbach's a > .7). Four statemeits were of a positive nature:
9. 3cxoHUbi OT3WBHHBH no oTHOtueHHK K cAHHOSflneAJbijaM. [Estonians are helpful as
cultural go-betweens];
Ethnolinguistic vitality of ethnic groups in the Baltic countries
10. 3cTOHu, . [Estonians are reliable];
n. 3cTOHu>i OTHocarca K pyccKoroBOpaiirHM XHTCASM SCTOHHH xopouio. [EstonianRussian speakers are regarded well by Estonians] ;
n. 3cxoHUbi XOTST corpyAHHiaTb c pyccKorosopHmHMH ^KHTCAHMH 3cTOHHH. [Estonianswish to cooperate with Estonian Russian-speakers].
Two statements expressed negative attitudes:
13. 3croHUbi AeiicTByioT noA BAKaHHCM caMbix HHSMCHHMX HHCTHHKTOB. [Estoniansbehave according to the influence of their lowest instincts];
i4.3cTOHu.bi arpeccHBHbi. [Estonians are aggressive].
In other versions of the questionnaire, the names of the ethnicities werechanged accordingly. The scales of the questions pertaining to trust werereversed so that the results express the level of distrust. This was neededto calculate the D index.
For statements expressing interethnic illegitimacy, three differentversions of the questionnaire were used. Thus, the reliability indices differ(Latvia and Estonia: Cronbach's a > .7, except for one sample of EstonianRussian speakers: Cronbach's a = .665; Lithuania: Cronbach's a < .7, lowestvalue in a sample of Lithuanian Russians Cronbach's a = .578, indicatingthat, in the Lithuanian context, the question about the Russian languageas a possible state language is not closely associated with the treatment ofthe Russian minority).5
Comparative data on the perception of legitimacy are presented inTable 9. In Latvia and Lithuania, titular nations show two results: the firstrow expresses the variables in relation to the Russian minority, and thesecond towards the second minority (Latgalian Latvians and Poles, respec-tively). Lowvalues correspond to low legitimacy. The neutral midpoint is 3.5.
The questions about the status of the Polish language as a possible second officiallanguage and the questions about Polish autonomy are equally unrelated to theconcept of legitimacy.

MARTIN EHALA AND ANASTASSIA ZABRODSKAJA
Table 9 Perception of legitimacy (i - low... 6 - high)
legitimacy
Iegitimacy2
Estonia
|
ow
4.78
iI
z.78
Latvia
1
1J
4-43
343
I
I
1.31
c «2 c3 rt
&'§3^3.36
Lithuania
VI
1
-1'3
4.80
4.83
v>i&
3-77
81
3.90
In analysing the results for legitimacy and distrust, it was clear that thetitular nations of the Baltic countries perceive the situation as quite legiti-mate: the highest scores for legitimacy are from the Lithuanians, especiallyin relation to the Polish minority (4.83); the lowest are among Latvians,especially with regard to Latgalian Latvians (3.43). These results are notsurprising, since they reflect the national sute system, including the atti-tude towards minority rights in the Baltic States since their formation.The relatively low legitimacy index in relation to Latgalian Latvians clearlyindicates the fairly positive attitude of Latvian respondents to a wideracceptance and use of the Latgalian language.
In comparison with the titular nations, die assessment of die legitimacyof power relations by Baltic ethnic minorities was lower. The lowest resultwas from Latvian Russians (z.3i), and the highest results among ethnicminorities were in Lithuania (Russians 3.77 and Poles 3.9). The evaluationgi\en by Latgalian Latvians (3.36) was close tc the neutral mid-scale (3.5). ̂ ecan therefore suggest that 'small' minorities (Poles and Lithuanian Russians)sec the ethnic situation in their country as legitimate or almost legitimate(Litgalian Latvians). The larger Russian minorities in Estonia and Latvia, tycontrast, see the situation as significantly mere illegitimate, mainly becauseof the attitudes towards the status of Russiar as a possible official language.
In analysing the indices of distrust (Talle 10), it is important to high-light the fact that in all cases they were beow 3.5, which characterizes aneutral attitude according to the scale. Thecfore, in each case, the averajeresult indicates the trust relationship to nembers of out-groups rath:r
Ethnolinguistic vitality of ethnic groups in the Baltic countries
than distrust. Perhaps we are dealing with a simple desire to express theconventional position, but the result may also be explained by the factthat there is very little grassroots hostility amongst the general populationof the Baltic countries, despite the fact that in political discourse stronglanguage is quite common. A similar phenomenon has also been noticedin the multilingual environment of Transylvania (Brubaker et al. zoo6).
Table 10 Perception of distrust (i - low... 6 - high)
istrust
istrust2
Estonia
|
oA
3.06
V)
rti13.16
Latvia
c3
rt
3-2-9
2..ZI
W3crti1
3-37
C 01rt C
^H rt
&'Ss ^H-l I""
2-74
Lithuania
VI
crt3
•g
^3
z.76
3.31
c3S3
PS!
1.60
o"pPN
3.OO
The index of distrust by the Lithuanian respondents towards the Polishwas high (3.31), in comparison with indicators of the Poles towards theLithuanians (3.0). Also, the relatively high indices of the mutual distrustin the pair 'Latvian Russians - Latvians' (3.37 and 3.2.9) should be noted.The results clearly demonstrate that the interethnic situation in Latvia isthe most intense in comparison with its Baltic neighbours. Yet as the lowdistrust values indicate, the tensions in the Baltic states are on the politicallevel (legitimacy of power relations) rather than interpersonal level (distrusttowards the members of the out-group).
In order to compile indicators of legitimacy and trust into one generalindicator, the perceived intergroup discordance D, both indicators weretransformed to fit a scale of measurement from o ... i, so that a neutralattitude (i.e., the absence of negative or positive feelings) merged with/.cro on the scale (see Ehala and Zabrodskaja zon). Thus, the discordancescale ranges from -0.15, which expresses the most positive attitude to theout-group, to +0.75, the most negative attitudes towards the out-group. Anull result is a neutral attitude. The values are presented in Table n.

72, MARTIN EHALA AND ANASTASSIA ZABRODSKAJA
Table n Indicators of discordance D (-0.25 - positive... 0.7$ - negative)
we -> they
Estonians-> Russians
Russians ->Estonians
D
0.12
0.06
we -> they
Latvians-> Russians
Latvians ->Latgalian Latvians
Russians-> Latvians
Latgalian Latvians-> Latvians
D
O.IO
-0.09
o.J5
-0.04
we -> they
Lithuanians-» Russians
Lithuanians-> Poles
Russians-» Lithuanians
Poles-> Lithuanians
D
0.07
0.14
-0.09
-0.06
Intergroup discordance is thus felt to the highest degree by Russian speak-ers towards Latvians, followed by Lithuanians in their attitude towardsPoles. Given the small size of the Polish community and its negative dis-cordance in relation to the Lithuanians (-0.06), this index is somewhatunexpected and probably reflects the sensitivity of Lithuanians to theproblems of Lithuanian territorial integrity (in relation to Poland). Arelatively unexpected result is the low average discordance of Russians inEstonia. The positive attitude of Latvians, a> a majority group, towardsLatgalian Latvians shows, of course, their corrmitment to greater recogni-tion of the Latgalian language.
4.3. Utilitarianism
To measure the utilitarianism and traditionalism of ethnic groups, a ques-tionnaire of ten statements was created, of vdiich six concerned utilitari-anism and four traditionalism. The structure of the questionnaire wasinspired by the Portrait Values Questionnaire by Schwartz et al. (1001),whc asked participants to mark on a six-poirt Likert scale to what extentthey were similar to the described person (i - very much similar to me ...6 — completely distinct from me). Among the statements on utilitarianism
the following: 'He/she is open to all trat is new' and 'He/she findswere
Ethnolinguistic vitality of ethnic groups in the Baltic countries 73
that traditional ways of living and old-fashioned values have become ahindrance to progress'. The statements about traditionalism included thefollowing: 'He/she considers it important to follow the practices of his/her culture' and Tt is important to him/her that his/her children shouldvalue these customs and traditions, too'.
All Cronbach's alphas were on the acceptable level. The comparativeaverage values for the groups of questions of utilitarianism and tradition-alism are presented in Table iz. This is based on a six-point Likert scale,where i indicates the lowest level of utilitarianism or traditionalism and6 the highest.
Table 12 Levels of utilitarianism and traditionalism (i - lowest... 6 - highest)
Jtilitarianism
Traditionalism
Estonia
io(J
(3
3-55
4.58
iwa
*
3-47
4.26
Latvia
1Bi-i
3.48
4.20
W5
«
W5
c2
3-59
3-99
G coCQ C
^3 rt
&'R^ J
3.8i
4.53
Lithuania
vi
_rt2rt3*-4•s3
3.86
4-71
1VJ
e5
3.63
4-3 S
Crt
^0
3-74
4-45
I >ata comparison shows that the titular groups in Estonia and Latviarepressed rather balanced utilitarianism (the average value is close totie neutral point 3.5), while Latgalian Latvians and the ethnic groups(il Lithuania showed a tendency to utilitarianism. At the same time,I i thuanians displayed the highest level of traditionalism among the Balticnitions. Let us also note that the level of traditionalism among all groupswis essentially above the neutral value of the scale, 3.5. This indicator is thel(west in the case of Latvian Russians (3.99).
The high values on the scale of traditionalism and small distinctionsIvtween the indicators of the studied groups mean that the values of theI index, which usually reflect a tendency for assimilation and languageslift, are rather small, and the tendency for culture and language preser-vtion dominates. As explained in Section 1.4., U expresses an interval

74 MARTIN EHALA AND ANASTASSIA ZABRODSKAJA
between utilitarianism and traditionalism and is calculated as follows: U= (Ut - Tr) + i. This means that, in the case of maximum traditionalismand absolute lack of utilitarianism, U = o. When Ut and Tr values areequal, U = i and, in the case of maximum utilitarianism and an absolutelack of traditionalism, U = z. All of the values of the U index are given inTable 13 in decreasing order, from most 'utilitarian' to most 'traditional'.
Table 13 Indicators of the U index (z - highest... o - lowest)
Estonia
Estonians
Russians
U
0.79
0.84
Latvia
Latvians
Russians
Latgalian Latvians
U
0.85
O.JZ
o.S6
Lithuania
Lithuanians
Russians
Poles
U
0.83
0.86
0.86
A comparison of the indicators of the U index makes it clear that all of thepeoples of the Baltic countries gravitated towards traditionalism (the Uvalues are lower than i.o). Latvian Russians had the highest U and Estoniansthe lowest. At the same time, it is surprising that the general variabilityin the U index in the case of different ethnic groups was extremely low(only 6 per cent on the scale) and, for most of the groups, the U valueswere almost identical. It is also interesting that the standard deviations oftheU index remained in all cases in the interval from 0.13 to 0.19. Thismems that the internal variability of the U index within ethnic groupswas much higher than the difference between them. In a.l groups, therewere subgroups which were much more utlitarian or more traditionalthai others. However, the analysis of these features lies outside the scopeof the present chapter.
4.4 Inter ethnic distance
Th< variable of distance R is comprised of tvo components: Ri expresse;thedistance in terms of the choice of language, and Rz shows a respondents assessment of his or her cultural distance in relation :o both groups
i'-thnolinguistic vitality of ethnic groups in the Baltic countr.•ies 75
For the measurement of the Ri (language choice), ten questions weretaken from a questionnaire about language contact networks (Landry et al.1996), concerning language use in the family; with friends; with colleagues;with officials and service personnel; and in the sphere of mass media andculture. For example, participants were asked: 'In which language do youcommunicate with your friends ?'. Responses were given on a seven-pointI .ikert scale, with the following range: i - only in language y; z - mainlyin language y; 3 - more in language y than in language x; 4 - equally inlanguage y and language x; 5 - more in language x than in language y; 6- mainly in language x; 7 - only in language x. An eighth option was alsoadded: 'in other languages'. Language y indicates the language in which arepresentative of an ethnic group normally communicates, and language» is the language of an out-group (group 'they'). In the Estonian question-naire, there was only one scale (Estonian-Russian or Russian-Estonian,Spending on ethnicity); in the questionnaires in Latvia and Lithuania, eachirspondent had to note his or her language distance on two scales becausethere were three groups participating in the study (Latvians, Russians andLatgalian Latvians; Lithuanians, Russians and Poles, respectively). In alluses, the internal uniformity of the scales was very high (Cronbach's a > .7).
For the measurement of cultural distance Rz, existing models (Babikertf al. 1980; Fukurawa 1997; Shenkar zooi; Chirkov et al. 1005) were ana-Kscd and a block of ten questions concerning the perception of intercul-i iral differences in culinary preferences, clothing styles, religious beliefs,mentality and traditions of communication was selected. The questionsi . this block included: 'In terms of physical appearance, how different.vc the Xs and you?', 'In terms of religious beliefs, how different are the>s and you?', and 'How easy is it to communicate with an X in relation tos udies/work?'. The responses were analysed on a seven-point Likert scale,uliich represented a choice from maximum difficulty of communication() to minimum (7). The internal uniformity of this questionnaire wasvry high: in most cases the Cronbach's alphas were higher than 0.8; onlyi i 'our cases were the Cronbach's alphas lower than 0.8, although all wereh^her than 0.75.
The high internal uniformity of both R components made it possible to. l< ulate the Ri and Rz indices, and the Rindex as their arithmetic average.
MARTIN EHALA AND ANASTASSIA ZABRODSKAJA
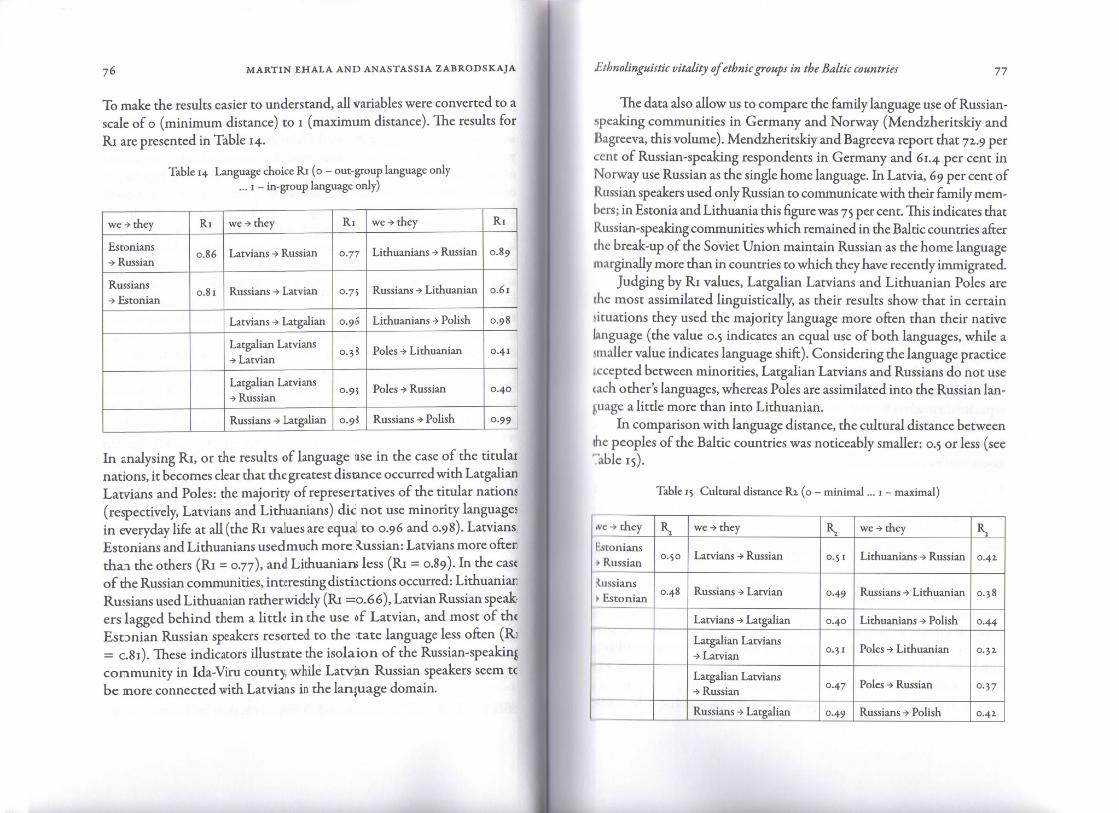
To make the results easier to understand, all variables were converted to ascale of o (minimum distance) to i (maximum distance). Trie results forRi are presented in Table 14.
Table 14 Language choice Ri (o - out-group language only... i - in-group language only)
we -» they
Estonians
-> Russian
Russians-» Estonian
Ri
0.86
0.8 1
we -> they
Latvians -> Russian
Russians -> Latvian
Latvians -> Latgalian
Latgalian Latvians
-> Latvian
Latgalian Latvians
-> Russian
Russians -» Latgalian
Ri
0.77
o.7S
0.96
0.38
0.95
0.9?
we -> they
Lithuanians •» Russian
Russians •> Lithuanian
Lithuanians -> Polish
Poles -> Lithuanian
Poles -> Russian
Russians -» Polish
Ri
0.89
0.61
0.98
0.41
0.40
0.99
In analysing Ri, or the results of language use in the case of the titularnations, it becomes clear that the greatest distance occurred with LatgalianLatvians and Poles: the majority of represertatives of the titular nations(respectively, Latvians and Lithuanians) die not use minority languagesin everyday life at all (the Ri values are equal to 0.96 and 0.98). Latvians,Estonians and Lithuanians used much more Russian: Latvians more oftenthan the others (Ri = 0.77), and Lithuanian; less (Ri = 0.89). In the caseof the Russian communities, interesting distiictions occurred: LithuanianRussians used Lithuanian ratherwidely (Ri =0.66), Latvian Russian speak-ers lagged behind them a little in the use of Latvian, and most of theEstDnian Russian speakers resorted to the ;tate language less often (Ri= c.8i). These indicators illustrate the isolaion of the Russian-speakingcoomunity in Ida-Viru county, while Latvim Russian speakers seem tcbe more connected with Latvians in the lanjuage domain.
Ethnolinguistic vitality of ethnic groups in the Baltic countries 77
The data also allow us to compare the family language use of Russian-speaking communities in Germany and Norway (Mendzheritskiy andBagreeva, this volume). Mendzheritskiy and Bagreeva report that 7Z.9 percent of Russian-speaking respondents in Germany and 61.4 per cent inNorway use Russian as the single home language. In Latvia, 69 per cent ofRussian speakers used only Russian to communicate with their family mem-bers; in Estonia and Lithuania this figure was 75 per cent. This indicates thatRussian-speaking communities which remained in the Baltic countries afterthe break-up of the Soviet Union maintain Russian as the home languagemarginally more than in countries to which they have recently immigrated.
Judging by Ri values, Latgalian Latvians and Lithuanian Poles arethe most assimilated linguistically, as their results show that in certainsituations they used the majority language more often than their nativelanguage (the value 0.5 indicates an equal use of both languages, while asmaller value indicates language shift). Considering the language practiceaccepted between minorities, Latgalian Latvians and Russians do not useeach other's languages, whereas Poles are assimilated into the Russian lan-guage a little more than into Lithuanian.
In comparison with language distance, the cultural distance betweendie peoples of the Baltic countries was noticeably smaller: 0.5 or less (see"able 15).
Table 15 Cultural distance Rz (o - minimal... i - maximal)
we -> they
(Estonians
> Russian
Russians> Estonian
R2
0.50
0.48
we -» they
Latvians -> Russian
Russians •» Latvian
Latvians -> Latgalian
Latgalian Latvians
-> Latvian
Latgalian Latvians•> Russian
Russians -> Latgalian
R?
0.51
0.49
0.40
0.31
0.47
0.49
we -> they
Lithuanians -» Russian
Russians -» Lithuanian
Lithuanians -> Polish
Poles -> Lithuanian
Poles -> Russian
Russians -> Polish
R
0.41
0.38
0.44
0-3Z
0.37
0.42.

78 MARTIN EHALA AND ANASTASSIA ZABRODSKAJA
It is interesting to note that the results in Latvia and Estonia (close to0.5) were much higher than the indicators for Lithuania (close to 0.4). Themore difficult situation of the interethnic relations in Estonia and Latvia,which led respondents to say that they felt distinctions more strongly, isreflected here. It is surprising that Lithuanians felt a sharp difference withPoles (0.44), since due to religious proximity the feeling of a smaller dis-tance with Poles, in comparison with Russians, would be more expected.Again, the results were influenced by the interethnic discordance whichLithuanians feel towards Poles more strongly towards Russians. But thePoles of Lithuania considered themselves very close to Lithuanians inculture (o.3z), closer than to Russians (0.37). Latgalian Latvians felt theleast distance from Latvians, which is to be expected considering thatLatgalian Latvian identity is a regional identity within Latvian nationalidentity. To sum up, it turns out that the identity of the Lithuanian Polishcommunity and its dynamics are quite complicated: this group is ratherstrongly located in both the Lithuanian and Russian language spaces, andfeels very similar to Lithuanians, while Lithuanians apparently wish toseparate themselves from Poles.
To account for both language and cultural distance between groups,R values as an average of Rj and R2 were calculated and the values used toassess vitality (next section).
4.5. Vitality
The vitality of ethnic groups was calculated wth the help of two formulas:
i) V = U.((Swc-Sthey) + D)/Rz) V = R.((Swe-Sthey) + D)/U
Formula (i) was used when PSD (Swe - Sth,y) was less than o. NegativePSD is common to minority groups, but not ilways and not uncondition-ally. Formula (z) was used when PSD was eqial to o or exceeded o. Sucha remit was characteristic of members of maprity groups.
Ethnolinguistic vitality of ethnic groups in the Baltic countries 79
Because of the formulas' mathematical properties, the scale's nega-tive and positive halves are not symmetrical on numerical values, thoughin terms of rating it is possible to distinguish the same degrees. Degrees ofvitality scales along with their description are presented in Table 16.
Table 16 Degrees of vitality scale
High vitality
Low vitality
Values of V
> i-5
0.6 ... 1.5
0.3 ... 0.6
o.i ... 0.3
o ... o.i
o ... -o.i
-O.I ... -O.Z
-o.z ... -0.3
-0.3 ... -0.4
< -0.4
Description
Extreme ethnocentrism
Strong ethnocentrism
Moderate ethnocentrism
Weak ethnocentrism
Stable vitality
"weakly shirting
Moderately shifting
Strongly shifting
Extremely shifting
Ii is important to note that the values of V are very closely connected withchnocentrism: the higher the vitality (V), the more ethnocentric the ethnos.11 the case of a very low V, the centre of the collective identity of a groupuoves from the ethnic group to the majority group, which, in essence, meansidentity and language shift. In some ways, it is possible to consider the scaleo: vitality to be a scale for the measurement of ethnocentrism, where nega-tive values indicate negative ethnocentrism. In the case of negative ethno-etntrism, members of a group would like to disassociate themselves fromtieir identity and to strive for some other more prestigious identity (usu-aly the majority identity). Undoubtedly, from the point of view of groupi Kiintenance, ethnocentrism is important, although extreme ethnocentrism^accompanied, as a rule, by a number of undesirable side effects, such asaiense of superiority (God's chosen people) and contempt for out-groups.

8o MARTIN EHALA AND ANASTASSIA ZABRODSKAJA Ethnolinguistic vitality of ethnic groups in the Baltic countries 81
Table 17 presents the average values of vitality (V) of all the ethnicgroups of the Baltic countries, and also the values of the variables basedon the calculation of vitality. The values of V in Table 17 are interpretedbased on the scale presented in Table 16. Since V expresses vitality onlyon an axis of two measured groups, in interpreting a V value, it is alwaysnecessary to consider the out-group in relation to which it was calculated.
Table 17 Vitality of ethnic groups in the Baltic countries
Ethnic group
Lithuanians -» Poles
Estonians-> Estonian Russians
Lithuanians-> Lithuanian Russians
Latvians-» Latvian Russians
Latvians-> Latgalian Latvians
Latvian Russians-» Latvians
Estonian Russians-> Estonians
Latgalian Latvians ->Latvians
Lithuanian Russians -»Lithuanians
Poles •> Lithuanians
V
0.91
0.87
0.65
0.55
o.4z
0.06
-0.08
-o.zo
-O.ZZ
-o.Z4
PSD
0.3
«.0.19
O.IO
0.30
-O.IO
-O.i9
-0.19
-0.19
-0.19
D
0.14
O.IZ
0.07
O.IO
-0.09
U
0.83
0.79
0.83
0.85
0.85
0.15 o.9z
0.06
-0.04
-0.09
-0.06
0.84
0.86
0.86
0.86
R
0.71
0.68
0.65
0.64
0.69
o.6z
0.64
0.34
0.49
0.37
Characterization
Strongethnocentrism
Moderateethnocentrism
Stable vitality
Moderatelyshifting
On the basis of these data, the most ethnocentric of the Baltic groupsare the Lithuanians in relation to the Poles, and the Estonians in relationto the Russians. The degree of their ethnocentrism can be characterized•is strong. Such a position expresses the rather rigid border between themajority group and the corresponding minority, and a clear feeling ofsuperiority on the part of the majority group, with low interest in andsympathy for the minority.
In this context, it is interesting to note that the ethnocentrism ofLithuanians in relation to Russians was much lower, as was the ethno-i-cntrism of Latvians concerning Latvian Russian speakers. Such a posi-i ion indicates a slightly greater readiness to communicate and co-operatewith these minority groups. The ethnocentrism of Latvians in relationio Latgalian Latvians appeared to be even lower. This is, however, quitei xplainable: Latvians simply perceive Latgalians as apart of the group (i.e.is Latvians). The low ethnocentrism indicates a readiness to recognize theright of Latgalian Latvians to use a variant of the language and to have anuitochthonic culture.
Judging by the results of the research, the Russian communities ofI -atvia and Estonia are in a stable situation. As minorities, they do notispire to assimilation. However, this is not true of Latgalian Latvians, nor•I Poles and Lithuanian Russians. The corresponding values indicate thefxtent of the relative threat to their vitality, i.e. their clear desire to belongo each country's majority group. Unfortunately, this depends not only»M them, but also on the vitality of members of the majority group or, tok more exact, on its ethnocentrism, since these processes occur not onlyutragroup, but also intergroup. An interpretation of the study results andIK- conclusions drawn on this basis about possible paths of development•I mterethnic processes in the three Baltic countries are presented below.

MARTIN EHALA AND ANASTASSIA ZABRODSKAJA
. Influence of vitality on interethnic processes
Though vitality expresses the readiness of an ethnic group for collectiveaction, processes occurring in reality depend not only on representationsshared by group members, but also on the attitudes of other groups in soci-ety and their relation to the same variables. In other words, real processesdepend on the vitality of both minority and majority groups.
A majority group which sees itself as being much stronger than theminority, and sees the situation as being quite legitimate (high PSD andD), tends to have assimilative influence on the minority incases when theminority perceives itself as similar to the majority (low R) and, in terms ofits values, is utilitarian (high U). Conversely, as the value of V depends onthe values of R, U and D, a majority group with high V is more segregativethan a majority with a lower V value.
If a majority group sees itself as being only a bit stronger than theminority and its discordance in relation to the minority is insignificant(small PSD and D), then such a group does not pressure the minority toassimilate. Depending on the R and U values, such a situation promoteseither minority integration (low R and high U), or its separation (high
Rand low U).Integration will occur when groups are similar culturally, and when
the majority is open to the cultural changes which integrition can bringabout. If the difference in the strength of the groups is smtll, closer inter-group contact does not result in assimilaticn of the stroig minority; itretains its cultural features. If the majority group feels a large interethnicdistance and, at the same time, is traditional (high R ard low U), it isquite probable that it will not wish to assinilate a stronj minority andcorsequently will prefer sepantion of the rrinority into ai autonomousor even independent territory.
In the case of the minority, the influenced the V valueis on the wholecomparable: the greater the vitality of the miiority, the moe probable thatit vUl aspire to preserve its cu.tural and linpistic identity or to achieveauonomy. In the case of a lov Vvalue, a bt depends 01 the R and U
Ethnolinguistic vitality of ethnic groups in the Baltic countries
(indicators: if cultural differences are large and the level of traditionalism isIhigh (as in some Islamic-origin immigrant communities living in Europe),the process of assimilation will be difficult and improbable.
Such properties of vitality and its components make it possible to usethe V value to anticipate acculturation and assimilation processes. JohnBerry's model of acculturation processes (1997) distinguishes five typesof acculturation: integration, segregation, separation, marginalization andassimilation. In Table 18 these processes are defined through the functionsof the V values of the majority and minority groups.
liible 18 Acculturation processes as a function of majority and minority groups' vitality
Minority
V « o
V < o
Majority
V > o
segregation
marginalization
V « o
integration or separation
assimilation
A high V in the majority leads to segregation or marginalization of theninority, depending on whether the V value of the minority is close to zero< r considerably below it. A rather low V value for the majority indicatespossible separation of the minority, integration of the two groups or minor-i y assimilation, depending on how high or low a Vvalue the minority has.
Interpreting the vitality results of the ethnic groups in the Baltic coun-ties in the framework presented in Table 18, it is possible to draw someconclusions about interethnic processes. Based on the V values of theIstonians and Estonian Russians, it is clear that the tendency prevailing insociety is segregation, which most likely will continue if there are no majorsiifts in the V values. The connection between the Lithuanian and Polish(.immunities indicates a marginalization of the Poles, while the V valuesii connection with the relationship between Lithuanians and RussiansI n i nt to the assimilation of Russian speakers.

84 MARTIN EHALA AND ANASTASSIA ZABRODSKAJA
The V indicators of Latvians and Russians are closest to the combina-tion predicting integration or separation. It is very probable that a changein this situation depends on whether the D value increases or decreases. Inthe first case, the ethnic borders will become stronger and there will be littlepossibility of co-operation, which, considering the comparable strength ofboth groups, may lead to an increase in the rights of the Russian commu-nity in Latvia or even to its autonomy. The destiny of Latgalian Latvians ismost likely assimilation or, at best, integration if they manage to maintaina high level of traditionalism and their uniqueness from other Latvians.
If these results are accurate and reliable, they can be helpful in under-standing the nature of the distinctions between the interethnic situationswhich have developed during the last decades in the Baltic States, and alsoin confirming the significance of vitality as an important variable influenc-ing a situation. These data can only be used to assess explicit integrationattitudes, not implicit attitudes. It would be very useful to study the inter-relationship of implicit acculturation attitudes (see Zak and Cohen in thisvolume) to see whether the Lithuanian Russians and Poles also show higherlevels of implicit attitudes towards identity shift.
Considering that the Russian communities in Estonia and Latvia aresizable, it is possible to assume that, in both sutes, the relationship betweenthe majority and the minority might be simlar. However, contemporaryevents have shown that the Latvian Russian community is mich more activein upholding its rights. It is possible to explain this distinctbn by the quitelo\ vitality of Estonian Russians. On the bisis of the results, we cannotgive a definite answer to the question of whythe vitality ofRussian speak-ers in Estonia is so small considering their demographic aid institutionalstrength; for this purpose, it \\ould be necesary to carry >ut a thoroughanalysis of qualitative data. At the same time, it is quite pobable that theEstonian Russian community is not (and mcst likely will rot be in future)ready for collective action.
The quite low vitality of Lithuanians in relation to the local Russianconmunity provides some explanation for ttcir readiness t» accept minor-ity members into their ranks. Hie low vitalty of Lithuanians is also thereason that Lithuanian Russians shift to Lihuanian so qiickly, whereasthe aggravated interethnic borlerswith Polaid make it dificult for Pole;
Ethnolinguistic vitality of ethnic groups in the Baltic countries 8 5
to do the same (leaving aside the topic of the legitimacy of Poles' positionin Lithuania, which has been controversial during the whole post-Sovietperiod).
On the basis of the above-mentioned factors, it is possible to assumethat if there are no significant changes in vitality values in the near future,the scenarios of development for interethnic relations in the three Balticstates will be as follows. In Estonia, the segregation of the Russian com-munity will continue; in Latvia, though some readiness of Russians forintegration has been shown, a strengthening of intensity may lead theRussian community to achieve autonomy; for the Russian-speaking com-munity of Lithuania, assimilation seems the most likely outcome, whichwould be satisfactory to both the Russian-speaking community and therepresentatives of the titular nation. Latgalian Latvians may improve theirstatus if they manage to increase their vitality and demand more rights.Lithuanian Poles will remain marginalized, unless they completely renounce:heir identity and shift to Lithuanian.
In general, the results of this research reflect the interethnic processestaking place in the societies of the Baltic states as they have been presentedin numerous earlier studies. However, we have added to the existing bodyof facts a great deal of more detailed comparative information. Furtherqualitative research should help to confirm the accuracy of these detailsaid, if necessary, will lead to modification of the model. The subsequentipplication of the described model in research on other interethnic situa-lions would help to test the universality of the model.
Acknowledgements
he research leading to these results has received funding from the EstonianHence Fund under grant agreement no. ETFy35o 'Ethnolinguistic vitality;iid identity construction: Estonia in the Baltic background'.


![[Ilić Marija] Ka etnolingvističkom rečniku čipskih Srba – etnolingvistički diskurs u etnodijalekatskom tekstu [On the Way to an Ethnolinguistic Lexicon: Ethnolinguistic Discourse]](https://static.fdokumen.com/doc/165x107/631611e9c32ab5e46f0d9c8b/ilic-marija-ka-etnolingvistickom-recniku-cipskih-srba-etnolingvisticki.jpg)