Quantitative 31P NMR detection of oxygen-centered and carbon-centered radical species

Liang, J., Xu, X., Bennett, J.M., Ye, W., & Quiñones, A.R. (2009). Ethnicity and changing functional health in middle and late life: a person-centered approach. Journal of Gerontology: Social Sciences, 65B(4), 470–481, doi:10.1093/geronb/gbp114. Advance Access published on December 14, 2009.
© The Author 2009. Published by Oxford University Press on behalf of The Gerontological Society of America.All rights reserved. For permissions, please e-mail: [email protected].
470Received April 29, 2009; Accepted September 4, 2009
Decision Editor: Kenneth F. Ferraro, PhD
REsEARch on ethnic variations in health changes among older adults could be significantly improved by
being more dynamic. Although cross-sectional studies have shown that older Latinos and African Americans experience greater disability and health disadvantage relative to older White Americans (carrasquillo, Lantigua, & shea, 2000; Zsembik, Peek, & Peek, 2000), intrapersonal and interper-sonal differences are confounded in such analyses. Mean-while, longitudinal studies have documented that Black Americans are more likely to experience a health decline than White Americans (Angel, Angel, & himes, 1992; Mendes de Leon et al., 1997; Peek, coward, henretta, Duncan, & Doughert, 1997). Although these studies yield very useful information concerning health transitions, they provide little information on the underlying growth curve or trajectory. Focusing on changes between two points in time, a transition differs significantly from a trajectory, a pathway charted by a series of transitions, which can be linear or nonlinear. A more complete understanding of the disable-ment process requires an analysis of the level, velocity, and its acceleration associated with a health trajectory.
current research on health trajectories in old age has been dominated by the variable-centered approach (Kelley-Moore & Ferraro, 2004; Mendes de Leon, Barnes, Bienias, skarupski, & Evans, 2005; Taylor & Lynch, 2004). Based
on the assumption that the population is homogeneous with respect to how the predictors operate on the outcomes, this approach identifies the average developmental tendencies, calibrates variability about the average, and explains that variability in terms of covariates of interest. For instance, the population distribution of development is assumed to be continuous in growth curve models (e.g., hierarchical linear models and latent growth curve modeling) (Muthén & Muthén, 2000; Raudenbush & Bryk, 2002).
In contrast, a pattern or person-centered approach em-phasizes subgroup heterogeneity that reflects qualitatively distinct subpatterns of changes (Muthén & Muthén, 2000; Ryff, singer, Love, & Essex, 1998). As an example, the mixture modeling strategy (e.g., semiparametric group-based approach) is designed to identify distinctive proto-typal developmental trajectories within the population, to calibrate the probability of population members following each such trajectory, and to relate those probabilities to co-variates of interest (Nagin, 2005).
A person-centered approach is useful in understanding heterogeneity in health trajectories. Although some older persons are very sick and disabled, others are free of illness and disability (Rowe & Kahn, 1987). Williams (2005) has observed that inadequate attention has been directed to diverging patterns of health over time in racial/ethnic
Ethnicity and changing Functional health in Middle and Late Life: A Person-centered Approach
Jersey Liang,1,2 Xiao Xu,3 Joan M. Bennett,1 Wen Ye,1 and Ana R. Quiñones1
1Department of health Management and Policy, University of Michigan school of Public health. 2Institute of Gerontology, University of Michigan.
3Department of Obstetrics & Gynecology, University of Michigan Medical school, Ann Arbor.
Objectives. Following a person-centered approach, this research aims to depict distinct courses of disability and to ascertain how the probabilities of experiencing these trajectories vary across Black, hispanic, and White middle-aged and older Americans.
Methods. Data came from the 1995–2006 health and Retirement study, which involved a national sample of 18,486 Americans older than 50 years of age. Group-based semiparametric mixture models (Proc Traj) were used for data analysis.
Results. Five trajectories were identified: (a) excellent functional health (61%), (b) good functional health with small increasing disability (25%), (c) accelerated increase in disability (7%), (d) high but stable disability (4%), and (e) persis-tent severe impairment (3%). however, when time-varying covariates (e.g., martial status and health conditions) were controlled, only 3 trajectories emerged: (a) healthy functioning (53%), moderate functional decrement (40%), and (c) large functional decrement (8%). Black and hispanic Americans had significantly higher probabilities than White Amer-icans in experiencing poor functional health trajectories, with Blacks at greater risks than hispanics.
Conclusions. Parallel to the concepts of successful aging, usual aging, and pathological aging, there exist distinct courses of changing functional health over time. The mechanisms underlying changes in disability may vary between Black and hispanic Americans.
Key Words: Group-based mixture models—health disparities—Minority aging (race/ethnicity).
ETHNICITY AND DISABILITY TRAJECTORIES 471
minority populations. Indeed, the disablement process may acquire a distinct natural history for any given ethnic group, which entails a unique configuration of health changes (Zsembik et al., 2000).
An increasing number of studies have documented the multitude of health trajectories in old age. These range from studies on catastrophic versus progressive decline in activi-ties of daily living (ADLs; Ferrucci et al., 1996) and distinct trajectories at the end of life (chen, chan, Kiely, Morris, & Mitchell, 2007; Lunney, Lyn, Foley, Lipson, & Guralnik, 2003) to those concerning multiple courses of changing functional health among older adults in general (Deeg, 2005; Dodge, Du, saxton, & Ganguli, 2006; Mavandadi, Rook, & Newsom, 2007). however, ethnic differences have not been a primary focus; hence, some important research questions remain unanswered. how do Blacks, hispanics, and Whites vary in the likelihood of following various health trajectories? Are there any differences in the mecha-nisms underlying ethnic variations in health across these three groups? Moreover, current research has been largely confined to a contrast between two groups involving White Americans versus non-White, Black, or hispanic Ameri-cans. There is little knowledge regarding the similarities and differences between Blacks and hispanics, and how hispanics stand in relation to the Black and White differen-tials in health.
Furthermore, research on trajectory groups could be ad-vanced by incorporating time-varying covariates. This is because explanatory variables of functional status (e.g., marital status and prior health conditions) may change sub-stantially over time. This is particularly true if a long period of observation is involved. Prior studies of trajectory groups of functional status included only time-constant covariates often derived from samples confined to a limited geographic area or region.
The present study contributes to current knowledge in three respects. We first identify the multiple trajectories of functional health in a national probability sample of Americans older than 50 years using an improved methodology involv-ing group-based mixture models (Nagin, 2005). second, we ascertain differences in the probabilities associated with various functional trajectories across Black, hispanic, and White Americans. Third, relative to White Americans, we explore how Black and hispanic Americans differ in the mechanisms underlying ethnic variations in the trajectories of functional disability.
HypothesesAlthough many physiological measures show substantial
losses with advancing age, there is substantial variability. Many older people suffer minimal physiological loss or none at all. These individuals might be viewed as aging suc-cessfully and should be differentiated from those who show nonpathological age-linked losses that can be designated as
usual or normal aging (Rowe & Kahn, 1987). Other investi-gators have distinguished normal aging from pathological aging, which is a result of diseases (Kane, Ouslander, & Abrass, 1999, pp. 4–7; schaie, 1996). Finally, there is some evidence that functional limitations and instrumental activi-ties of daily living (IADLs) have evolved over time by the following three distinct courses: (a) no decline, (b) moder-ate decline, and (c) sharp decline (Dodge et al., 2006; Mavandadi et al., 2007). hence, we hypothesize that at least three distinct trajectories exist, parallel to successful aging, usual aging, and pathological aging (h1).
A key factor leading to ethnic difference in health is ra-cial/ethnic stratification, a system involving ethnic groups interacting in patterns of dominance and subordination (Jackson, Antonucci, & Gibson, 1990; Williams, 1997). such stratification may influence health through several mechanisms, including (a) less advantaged socioeconomic circumstances, (b) constraints placed on lifestyle choices, or (c) stress as a result of perception of discrimination (crimmins, hayward, & seeman, 2004; Robert & house, 2000).
Most national surveys have suggested that functional limitations and disability among hispanic elders are similar to or slightly greater than among Whites but lower than among Blacks (carrasquillo et al., 2000). In addition, there is evidence that Blacks were more likely to experience health decline than Whites (Angel et al., 1992; Peek et al., 1997). Finally, according to Liang and colleagues (2008), both African and hispanic Americans had a higher level of disability than their White counterparts. Whereas Blacks had a greater rate of functional decline relative to Whites, there was no difference between hispanics and Whites. Ex-trapolating from these findings, we hypothesize that Black and hispanic Americans are more likely than their White counterparts to experience trajectories of poorer functional health, whereas hispanics tend to experience better health trajectories than Blacks (h2).
how socioeconomic status (sEs) and prior health are as-sociated with health trajectories may vary between Blacks and hispanics. Liang and colleagues (2008) found that with education and prior health conditions controlled, there were no differences between hispanics and Whites in the trajec-tory of disability, whereas the differences between Blacks and Whites persisted. In contrast, there is evidence that when sEs is controlled, the differences in biological risk profiles between Whites and Mexican immigrants aged 40 years and older disappear, but the differences between Whites and Blacks or U.s.-born Mexican Americans remain (crimmins, Kim, Alley, Karlamangla, & seeman, 2007). We hypothesize that education and prior health would ac-count for more hispanic–White differences than Black– White disparities in disability trajectories based on prior empirical observations (h3).
The aforementioned hypotheses will be evaluated within the following conceptual framework. In particular, gender, age, ethnicity, and sEs are viewed as key dimensions of

LIANG ET AL.472
social stratification, with sEs as a function of the other three. Furthermore, differences in functional health across dimensions of social stratification are partially mediated by social networks and prior health status. This framework has been articulated by a number of investigators (crimmins & seeman, 2001; house, Lantz, & herd, 2005).
Methods
Design and DataData came from the health and Retirement study (hRs),
which began in 1992 by surveying a national sample of more than 12,600 persons born in 1931–1941. In 1993, the “Asset and health Dynamics Among the Oldest Old” (AhEAD) study was launched with a national sample of individuals aged 70 years and older (i.e., born before 1924). Biennial follow-ups have been made of the hRs and AhEAD respondents thereafter. starting from 1998, hRs and AhEAD surveys were fully integrated and two new subsamples were added in 1998: children of the Depression Age (cODA)—persons born in 1924–1930—and War Baby (WB)—persons born in 1942–1947. As of 2006, these four components of hRs yielded a total of 26,988 respondents, representing all individuals older than 50 years in the United states. Extensive documentation of hRs, including re-sponse rates and mortality, is available at its Web site (http:// hrsonline.isr.umich.edu).
In the present study, baseline data were obtained from respondents in 1995 for AhEAD, in 1996 for hRs, and in 1998 for cODA and WB. Follow-up data were gathered in 1998 (for AhEAD and hRs cohorts), 2000, 2002, 2004, and 2006. hence, up to five or six repeated observations were obtained for each admission cohort over a period of 8–11 years. hRs data collected in 1992 and 1994 and AhEAD data in 1993 were excluded because of incompa-rable measures of functional status.
MeasuresFunctional status entailed a count of difficulties with six
ADLs (i.e., dressing, walking, bathing or showering, eating, getting in or out of bed, and using the toilet) and five IADLs (i.e., preparing hot meals, grocery shopping, making phone calls, taking medications, and managing own money and expenses). A higher score represented greater functional impairment. spector and Fleishman (1998) showed that ADL and IADL items could be combined to measure func-tional status with enhanced range and sensitivity.
several measures of social stratification were included. Age differences were measured by age in 1995. Dummy variables of gender and ethnicity (i.e., non-hispanic White, non-hispanic Black, and hispanic) were created. Education was indexed by years of schooling.
Our specifications incorporated several time-varying co-variates including proxy interview status, marital status,
self-rated health status, number of chronic diseases, and the Center for Epidemiological Studies-Depression (cEs-D) score. As an indicator for social networks, marital status was constructed as a dummy variable (1 = married or living with a partner). Diseases were a count of seven health con-ditions (i.e., heart disease, cancer, stroke, diabetes, hyper-tension, lung disease, and arthritis). self-rated health was a single item rating of the respondent’s health (1 = excellent, 2 = very good, 3 = good, 4 = fair, and 5 = poor). Depressive symptoms were represented by a count of nine dichotomous items (i.e., depressed, everything an effort, restless sleep, happy, lonely, enjoy life, sad, could not get going, and a lot energy) drawn from the cEs-D (Radloff, 1977). A higher score reflected greater depressive symptoms. Finally, in each wave of the survey, whether the observation was ob-tained through a proxy interview was coded as a dummy variable.
To ensure that a clear time sequence is defined between the time-varying covariates and the outcome measure, our model involved the lagged measure (i.e., observation from the last interview) and the change term (i.e., change between the previous observation and the current observation) for each of the time-varying covariates. For instance, marital status was included as a lagged covariate and as the change in status (−1 for dissolutions, 0 for no change, and 1 for the acquisition of a partner). Table 1 presents the descriptive statistics of all the measures.
Data AnalysisWe used group-based semiparametric mixture models
(hereafter referred to as group-based trajectory model) to identify distinctive clusters of individual trajectories within the population, which entails a multinomial modeling strat-egy designed to identify relatively homogeneous clusters of developmental trajectories (Jones, Nagin, & Roeder, 2001; Nagin, 2005). It includes two components. The first compo-nent is a basic group model that depicts clusters of individu-als with similar trajectories. Trajectory parameters are derived by a latent class analysis through maximum likeli-hood estimation with the following specifications:
β β β ε* *0 1 Time 1, ..., ; 1, ... g g g g
iT iT k kiT iTY X k K i n (1)
*giTY is a latent variable representing the underlying func-
tional status of individual i at time T (e.g., 1998) given membership in group g. Time refers to the timing of assess-ment from the baseline. XkiT is the time-varying covariate (e.g., lagged measures of prior health status and their cor-responding change terms) associated with individual i at time T. β β0 1, ,g g and βg
k are the coefficients associated with the intercept and rate of change in functional status and the ef-fects of K time-varying covariates for individuals in group g. ε*
iT is a disturbance term assumed to be normally distrib-uted with zero mean and constant variance.

ETHNICITY AND DISABILITY TRAJECTORIES 473
As indicated in Equation 1, the distinct trajectories of dis-ability were derived by modeling disability within each group as a function of time (i.e., number of years since the baseline) and other time-varying covariates. Within each group, disability was analyzed as an intercept only, a linear, or a polynomial model of time. We present Equation 1 as a linear function of time for simplicity of illustration. The time variable was centered at its mean to minimize multi-collinearity when polynomial functions of time were evalu-ated. Through a process similar to that of latent class analysis, parameters were estimated to define the shape of the trajectories and the probability of group membership. The number of groups was chosen on the basis of the Bayes-ian information criterion (BIc) score and an examination of the 95% confidence interval of adjacent trajectories.
Because the disability measure can only vary between 0 and 11, we assumed a censored normal distribution for g
iTY to account for possible floor and ceiling effects. In particular,
*giTY is a latent variable that is linked to its observed but cen-
sored counterpart, giTY (i.e., functional status measure with a
range of 0–11), as follows:
* 0 if < 0, g giT iTY Y (2)
* * if 0 11,g g giT iT iTY Y Y (3) and
*11 if 11.g giT iTY Y (4)
It is important to note that the derived trajectories may vary significantly depending upon the inclusion of time-varying covariates (XkiT) beyond the time-related parameters (TimeiT). Trajectories derived without time-varying covari-ates are not directly comparable with those identified by adjusting for time-varying covariates (Nagin, 2005, p. 124). This is because different variables are involved in identify-ing distinct latent classes or trajectory groups.
In the second component, trajectory group membership was treated as the dependent variable predicted by the per-son level time-constant covariates in a fashion similar to that for a multinomial logistic regression analysis. To exam-ine ethnic differences in functional health trajectories, we evaluated the following specifications:
θ θπ ( ) e / ei g i gz z
g i gx (5)
where qg represents the parameters of a multinomial logit model that capture the effects of time-constant covariates zi (e.g., age, gender, ethnicity, and education) on pg, the prob-ability of membership in group g (Nagin, 2005, pp. 96–99). A sAs procedure, Proc Traj, was used to estimate Equation 5 simultaneously with Equation 1 (Jones et al., 2001).
To evaluate the hypotheses outlined previously, we un-dertook the following analyses. First, we derived the basic trajectory groups by estimating a model (M1) in which dis-ability is a function of time only, without any other covari-ates. second, we identified trajectories while adjusting for
Table 1. Descriptive statistics of Time-Varying and Time-constant covariates
Time-varying covariates 1998 (n = 14,553) 2000 (n = 16,543) 2002 (n = 14,587) 2004 (n = 13,352) 2006 (n = 12,089)
Functional status 0.62 ± 1.74 0.56 ± 1.63 0.76 ± 1.80 0.78 ± 1.81 0.74 ± 1.77Time since baseline (in years) 2.37 ± 0.48 3.79 ± 1.07 5.75 ± 1.06 7.71 ± 1.05 9.68 ± 1.03Proxy status (lagged), n (%) 932 (6) 1,074 (6) 997 (7) 948 (7) 695 (6)change in proxy status (since last interview) 0.02 ± 0.22 0.02 ± 0.20 0.01 ± 0.21 −0.001 ± 0.20 −0.01 ± 0.20Marital status (lagged), n (%) 10,496 (72) 11,756 (71) 9.894 (68) 8,910 (67) 7,964 (66)change in marital status (since last interview) −0.02 ± 0.14 −0.05 ± 0.26 −0.03 ± 0.21 −0.02 ± 0.20 −0.03 ± 0.20self-rated health (lagged) 2.71 ± 1.14 2.85 ± 1.14 2.74 ± 1.11 2.79 ± 1.09 2.84 ± 1.09change in self-rated health (since last interview) 0.26 ± 0.94 −0.03 ± 0.92 0.11 ± 0.90 0.12 ± 0.88 0.07 ± 0.88Diseases (lagged) 1.56 ± 1.22 1.63 ± 1.25 1.71 ± 1.25 1.86 ± 1.27 1.99 ± 1.29change in diseases (since last interview) 0.21 ± 0.57 0.14 ± 0.59 0.21 ± 0.61 0.18 ± 0.61 0.17 ± 0.60Depressive symptoms (lagged) 1.76 ± 1.96 1.98 ± 2.11 1.94 ± 2.09 1.90 ± 2.13 1.83 ±2.11change in depressive symptoms (since last interview) 0.39 ± 2.04 0.06 ± 2.03 0.04 ± 2.02 0.03 ± 2.00 0.11 ± 1.95
Time-constant covariates Total (N = 18,486) White (n = 14,552) Black (n = 2,567) hispanic (n = 1,367) p Value
Died (between baseline and 2006), n (%) 4,755 (26) 3,704 (25) 731 (28) 320 (23) .0007Ever attrited (between baseline and 2006), n (%) 1,705 (9) 1,248 (9) 295 (11) 162 (12) <.0001Female, n (%) 10,505 (57) 8,124 (56) 1,603 (62) 778 (57) <.0001Age (years, in 1995) 64.28 ± 10.23 64.57 ± 10.23 63.31 ± 10.25 62.94 ± 9.84 <.0001Education 11.94 ± 3.37 12.54 ± 2.82 10.63 ± 3.64 8.04 ± 4.67 <.0001Baseline marital status, n (%) 13,222 (72) 10,892 (75) 1,369 (53) 961 (70) <.0001Baseline proxy interview status, n (%) 1,148 (6) 805 (6) 184 (7) 159 (12) <.0001Baseline self-rated health 2.70 ± 1.15 2.59 ± 1.12 3.09 ± 1.14 3.17 ± 1.18 <.0001Baseline diseases 1.52 ± 1.22 1.48 ± 1.21 1.78 ± 1.24 1.42 ± 1.22 <.0001Baseline depressive symptoms 1.76 ± 1.97 1.61 ± 1.85 2.21 ± 2.17 2.51 ± 2.43 <.0001Baseline ADL/IADL 0.42 ± 1.36 0.34 ± 1.21 0.73 ± 1.80 0.69 ± 1.77 <.0001
Notes: statistics are reported as mean ± standard deviation or n (%). Time-varying covariates are those associated with repeated observations within individuals. Data based on the 1995–2006 health and Retirement study. ADL = activities of daily living; IADL = instrumental activities of daily living.
*p < .05; **p < .01; ***p < .001.

LIANG ET AL.474
time-varying covariates (i.e., proxy interview, marital sta-tus, and health conditions; M2).
For each set of trajectory groups, we assessed ethnic dif-ferences in the probability of group membership while con-trolling selection bias (resulting from mortality and attrition), age differences, and gender (i.e., M1.1 and M2.1). In addi-tion, we examined how ethnic variations in the probability of group membership are mediated by education and base-line functional status (i.e., M1.2 and M2.2). To determine a mediation effect, we follow the classic approach outlined by Baron and Kenny (1986).
The hRs involves a national sample of households, aug-mented by oversamples of African Americans, hispanics, and Floridians. We undertook separate analyses with and without weighting (i.e., Level 1 weights from the corre-sponding wave of interview and Level 2 weights from the 1998 interview) and obtained very similar results. hence, we chose not to weight the data. To minimize the loss of subjects due to item missing, multiple imputation was un-dertaken (schafer, 1997). In addition, we included measures of mortality, attrition, and proxy status in our model to con-trol for selection bias associated with these factors. Finally, due to the massive sample (18,486 respondents with more than 71,000 observations), there is a concern about the over-abundance of significant results. To offset this, only esti-mates with a p value less than .01 were considered as being statistically significant.
Results
Trajectories of DisabilityTo identify the distinct trajectories of disability, we ex-
plored various models with alternative orders (e.g., intercept only, linear, quadratic, or cubic). Based on the statistical sig-nificance of their regression coefficients, a cubic specification was selected (see Table 2). The optimal number of trajectory
groups in each set of analyses was determined on the basis of (a) the BIc score and (b) whether there was an overlap in the 95% confidence interval of adjacent trajectories.
We chose five groups in charting disability over time (Table 2) because the BIc score leveled at five groups with the number of groups increasing from 2 to 10. In particular, the following trajectories were identified. First, accounting for 61.29% of the sample, “excellent functional health” (Trajectory 1) is characterized by a very low level of disability with positive but small linear and cubic slopes (Figure 1a; M1.0 in Table 2). There is little disability through-out the period of 11 years. hence, it mirrors “successful aging” as depicted by Rowe and Kahn (1987). As the sec-ond course, “good functional health with small increasing disability” (Trajectory 2) is distinguished by a slightly higher level of disability and a positive linear slope (24.65% of the sample). Individuals in this group experienced an in-crease of ADL/IADL from near zero to almost two during the 11-year period (Figure 1a). This seems to parallel what Rowe and Kahn (1987) described as usual or normal aging.
The remaining three trajectories all exhibit significantly greater disability that may reflect different types of patho-logical aging. First, the trajectory of “high but stable dis-ability” (Trajectory 3) accounted for 7.27% of the sample. It was characterized by some three ADL/IADL difficulties with a slight decrease over the second half of the 11-year period. second, the trajectory of “accelerated increase in disability” (Trajectory 4) fit 4.00% of the sample who expe-rienced slightly less than one ADL/IADL difficulty at the beginning, which then increased to more than seven at the end of the 11-year period. Third, 2.79% of the sample expe-rienced a course of “persistent severe disability” (Trajectory 5). Throughout the period of observation, individuals in this group consistently had seven or eight limitations in ADL/IADLs.
These findings offer some support for the existence of distinct disability trajectories particularly for those parallel
Table 2. Estimated Trajectory Groups and Group-specific Growth Parameters, Before Adjusting for Time-Varying covariates (M1.0)
Excellent functional health Good functional health with small increasing disability
high but stable disability
Accelerated increase in disability
Persistent severe disability
Growth parameter Intercept −4.711*** −0.432*** 3.436*** 3.247*** 8.634*** Linear slope 0.100** 0.459*** −0.019 1.351*** 0.230** Quadratic slope 0.009 0.005 −0.045*** 0.012 −0.055*** cubic slope 0.006** −0.004* 0.005 −0.018*** 0.002Group proportion (%) 61.29 24.65 7.27 4.00 2.79
sigma 2.534***Model fit statistics BIc (N = 71,124) −61,656.46 BIc (N = 18,486) −61,639.62 AIc fit index −61,541.81 Log likelihood −61,516.81
Notes: Level 1, N = 71,124; Level 2, N = 18,486. Data reflect aggregate results from multiple imputation. BIc = Bayesian information criterion; AIc = Akaike’s information criterion.
*p < .05; **p < .01; ***p < .001.

ETHNICITY AND DISABILITY TRAJECTORIES 475
to successful aging and usual aging. The results are less clear about pathological aging in that three trajectories rep-resenting different subtypes emerged.
Disability Trajectories With Time-Varying Covariates Adjusted
Disability trajectory groups were also examined by ad-justing for time-varying covariates including marital status,
proxy interview status, and health status (Figure 1b; Table 3). On the basis of our analysis of 2–10 trajectory groups and their BIc scores, we chose three groups to characterize changes in disability. First, healthy functioning (Trajectory 1) is represented by individuals who had nearly no disabil-ity throughout the entire 11-year period, although there is a positive but small linear slope. Over half (52.63%) of the sample followed such a pathway. second, moderate func-tional decrement (Trajectory 2) characterizes more than one
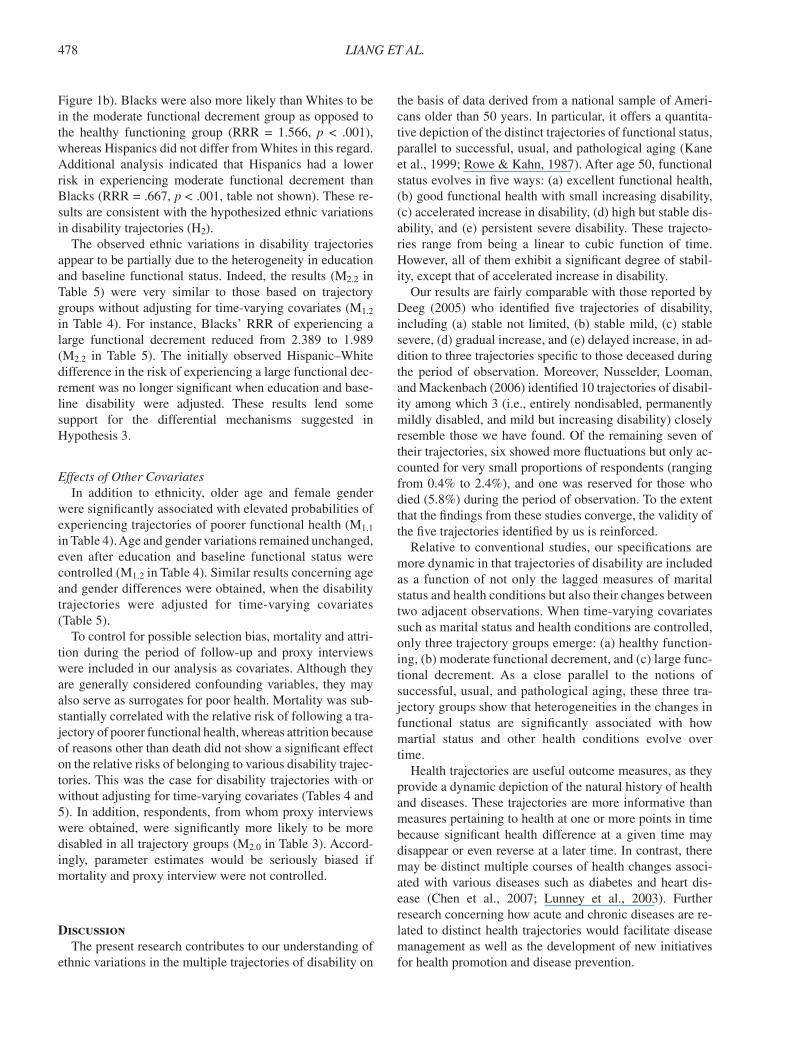
Figure 1. (a) Trajectory groups of functional disability over time without adjustment for time-varying covariates (M1.0). (b) Trajectory groups of functional disability over time with adjustment for time-varying covariates (M2.0). The dashed (---) lines represent the 95% confidence interval for each trajectory.
LIANG ET AL.476
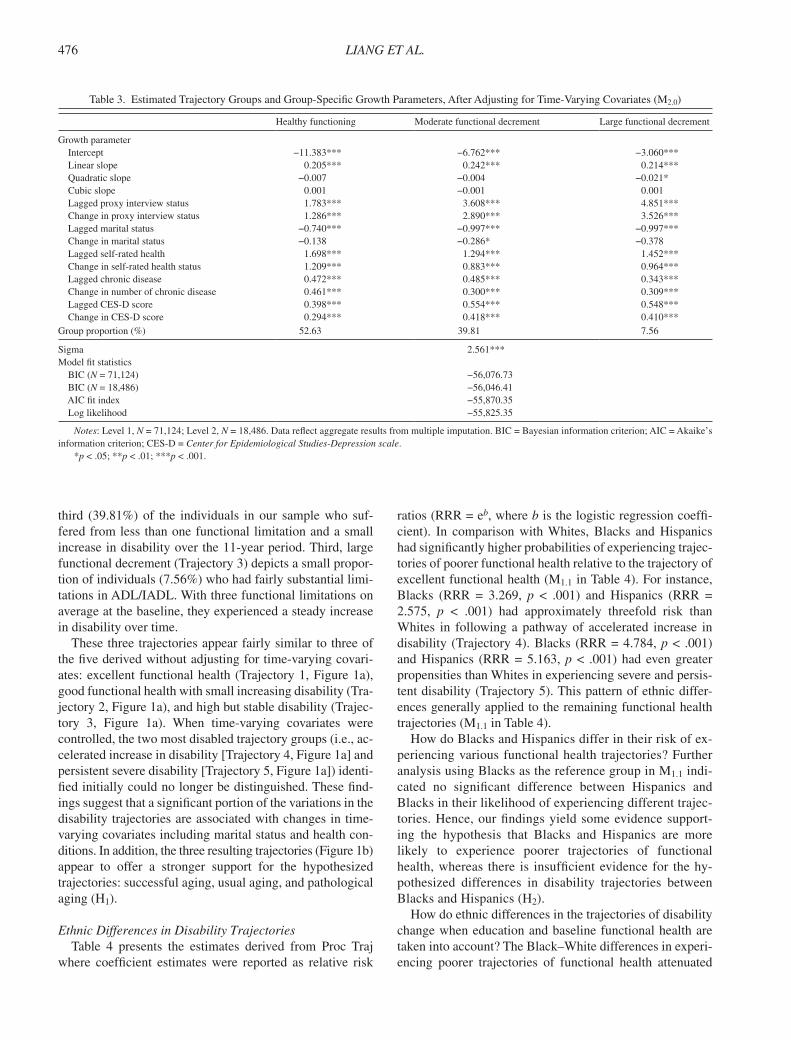
third (39.81%) of the individuals in our sample who suf-fered from less than one functional limitation and a small increase in disability over the 11-year period. Third, large functional decrement (Trajectory 3) depicts a small propor-tion of individuals (7.56%) who had fairly substantial limi-tations in ADL/IADL. With three functional limitations on average at the baseline, they experienced a steady increase in disability over time.
These three trajectories appear fairly similar to three of the five derived without adjusting for time-varying covari-ates: excellent functional health (Trajectory 1, Figure 1a), good functional health with small increasing disability (Tra-jectory 2, Figure 1a), and high but stable disability (Trajec-tory 3, Figure 1a). When time-varying covariates were controlled, the two most disabled trajectory groups (i.e., ac-celerated increase in disability [Trajectory 4, Figure 1a] and persistent severe disability [Trajectory 5, Figure 1a]) identi-fied initially could no longer be distinguished. These find-ings suggest that a significant portion of the variations in the disability trajectories are associated with changes in time-varying covariates including marital status and health con-ditions. In addition, the three resulting trajectories (Figure 1b) appear to offer a stronger support for the hypothesized trajectories: successful aging, usual aging, and pathological aging (h1).
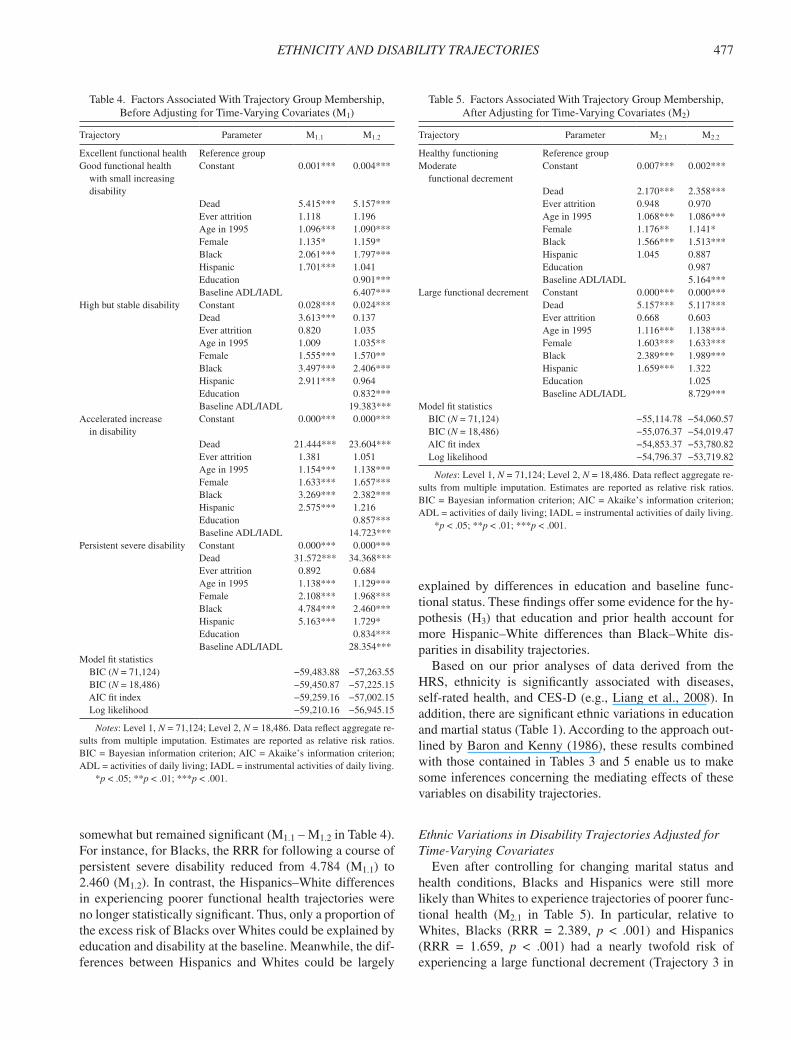
Ethnic Differences in Disability TrajectoriesTable 4 presents the estimates derived from Proc Traj
where coefficient estimates were reported as relative risk
ratios (RRR = eb, where b is the logistic regression coeffi-cient). In comparison with Whites, Blacks and hispanics had significantly higher probabilities of experiencing trajec-tories of poorer functional health relative to the trajectory of excellent functional health (M1.1 in Table 4). For instance, Blacks (RRR = 3.269, p < .001) and hispanics (RRR = 2.575, p < .001) had approximately threefold risk than Whites in following a pathway of accelerated increase in disability (Trajectory 4). Blacks (RRR = 4.784, p < .001) and hispanics (RRR = 5.163, p < .001) had even greater propensities than Whites in experiencing severe and persis-tent disability (Trajectory 5). This pattern of ethnic differ-ences generally applied to the remaining functional health trajectories (M1.1 in Table 4).
how do Blacks and hispanics differ in their risk of ex-periencing various functional health trajectories? Further analysis using Blacks as the reference group in M1.1 indi-cated no significant difference between hispanics and Blacks in their likelihood of experiencing different trajec-tories. hence, our findings yield some evidence support-ing the hypothesis that Blacks and hispanics are more likely to experience poorer trajectories of functional health, whereas there is insufficient evidence for the hy-pothesized differences in disability trajectories between Blacks and hispanics (h2).
how do ethnic differences in the trajectories of disability change when education and baseline functional health are taken into account? The Black–White differences in experi-encing poorer trajectories of functional health attenuated
Table 3. Estimated Trajectory Groups and Group-specific Growth Parameters, After Adjusting for Time-Varying covariates (M2.0)
healthy functioning Moderate functional decrement Large functional decrement
Growth parameter Intercept −11.383*** −6.762*** −3.060*** Linear slope 0.205*** 0.242*** 0.214*** Quadratic slope −0.007 −0.004 −0.021* cubic slope 0.001 −0.001 0.001 Lagged proxy interview status 1.783*** 3.608*** 4.851*** change in proxy interview status 1.286*** 2.890*** 3.526*** Lagged marital status −0.740*** −0.997*** −0.997*** change in marital status −0.138 −0.286* −0.378 Lagged self-rated health 1.698*** 1.294*** 1.452*** change in self-rated health status 1.209*** 0.883*** 0.964*** Lagged chronic disease 0.472*** 0.485*** 0.343*** change in number of chronic disease 0.461*** 0.300*** 0.309*** Lagged cEs-D score 0.398*** 0.554*** 0.548*** change in cEs-D score 0.294*** 0.418*** 0.410***Group proportion (%) 52.63 39.81 7.56
sigma 2.561***Model fit statistics BIc (N = 71,124) −56,076.73 BIc (N = 18,486) −56,046.41 AIc fit index −55,870.35 Log likelihood −55,825.35
Notes: Level 1, N = 71,124; Level 2, N = 18,486. Data reflect aggregate results from multiple imputation. BIc = Bayesian information criterion; AIc = Akaike’s information criterion; cEs-D = Center for Epidemiological Studies-Depression scale.
*p < .05; **p < .01; ***p < .001.
ETHNICITY AND DISABILITY TRAJECTORIES 477
somewhat but remained significant (M1.1 – M1.2 in Table 4). For instance, for Blacks, the RRR for following a course of persistent severe disability reduced from 4.784 (M1.1) to 2.460 (M1.2). In contrast, the hispanics–White differences in experiencing poorer functional health trajectories were no longer statistically significant. Thus, only a proportion of the excess risk of Blacks over Whites could be explained by education and disability at the baseline. Meanwhile, the dif-ferences between hispanics and Whites could be largely
Table 4. Factors Associated With Trajectory Group Membership, Before Adjusting for Time-Varying covariates (M1)
Trajectory Parameter M1.1 M1.2
Excellent functional health Reference groupGood functional health with small increasing disability
constant 0.001*** 0.004***
Dead 5.415*** 5.157***Ever attrition 1.118 1.196Age in 1995 1.096*** 1.090***Female 1.135* 1.159*Black 2.061*** 1.797***hispanic 1.701*** 1.041Education 0.901***Baseline ADL/IADL 6.407***
high but stable disability constant 0.028*** 0.024***Dead 3.613*** 0.137Ever attrition 0.820 1.035Age in 1995 1.009 1.035**Female 1.555*** 1.570**Black 3.497*** 2.406***hispanic 2.911*** 0.964Education 0.832***Baseline ADL/IADL 19.383***
Accelerated increase in disability
constant 0.000*** 0.000***
Dead 21.444*** 23.604***Ever attrition 1.381 1.051Age in 1995 1.154*** 1.138***Female 1.633*** 1.657***Black 3.269*** 2.382***hispanic 2.575*** 1.216Education 0.857***Baseline ADL/IADL 14.723***
Persistent severe disability constant 0.000*** 0.000***Dead 31.572*** 34.368***Ever attrition 0.892 0.684Age in 1995 1.138*** 1.129***Female 2.108*** 1.968***Black 4.784*** 2.460***hispanic 5.163*** 1.729*Education 0.834***Baseline ADL/IADL 28.354***
Model fit statistics BIc (N = 71,124) −59,483.88 −57,263.55 BIc (N = 18,486) −59,450.87 −57,225.15 AIc fit index −59,259.16 −57,002.15 Log likelihood −59,210.16 −56,945.15
Notes: Level 1, N = 71,124; Level 2, N = 18,486. Data reflect aggregate re-sults from multiple imputation. Estimates are reported as relative risk ratios. BIc = Bayesian information criterion; AIc = Akaike’s information criterion; ADL = activities of daily living; IADL = instrumental activities of daily living.
*p < .05; **p < .01; ***p < .001.
explained by differences in education and baseline func-tional status. These findings offer some evidence for the hy-pothesis (h3) that education and prior health account for more hispanic–White differences than Black–White dis-parities in disability trajectories.
Based on our prior analyses of data derived from the hRs, ethnicity is significantly associated with diseases, self-rated health, and cEs-D (e.g., Liang et al., 2008). In addition, there are significant ethnic variations in education and martial status (Table 1). According to the approach out-lined by Baron and Kenny (1986), these results combined with those contained in Tables 3 and 5 enable us to make some inferences concerning the mediating effects of these variables on disability trajectories.
Ethnic Variations in Disability Trajectories Adjusted for Time-Varying Covariates
Even after controlling for changing marital status and health conditions, Blacks and hispanics were still more likely than Whites to experience trajectories of poorer func-tional health (M2.1 in Table 5). In particular, relative to Whites, Blacks (RRR = 2.389, p < .001) and hispanics (RRR = 1.659, p < .001) had a nearly twofold risk of experiencing a large functional decrement (Trajectory 3 in
Table 5. Factors Associated With Trajectory Group Membership, After Adjusting for Time-Varying covariates (M2)
Trajectory Parameter M2.1 M2.2
healthy functioning Reference groupModerate functional decrement
constant 0.007*** 0.002***
Dead 2.170*** 2.358***Ever attrition 0.948 0.970Age in 1995 1.068*** 1.086***Female 1.176** 1.141*Black 1.566*** 1.513***hispanic 1.045 0.887Education 0.987Baseline ADL/IADL 5.164***
Large functional decrement constant 0.000*** 0.000***Dead 5.157*** 5.117***Ever attrition 0.668 0.603Age in 1995 1.116*** 1.138***Female 1.603*** 1.633***Black 2.389*** 1.989***hispanic 1.659*** 1.322Education 1.025Baseline ADL/IADL 8.729***
Model fit statistics BIc (N = 71,124) −55,114.78 −54,060.57 BIc (N = 18,486) −55,076.37 −54,019.47 AIc fit index −54,853.37 −53,780.82 Log likelihood −54,796.37 −53,719.82
Notes: Level 1, N = 71,124; Level 2, N = 18,486. Data reflect aggregate re-sults from multiple imputation. Estimates are reported as relative risk ratios. BIc = Bayesian information criterion; AIc = Akaike’s information criterion; ADL = activities of daily living; IADL = instrumental activities of daily living.
*p < .05; **p < .01; ***p < .001.
LIANG ET AL.478
Figure 1b). Blacks were also more likely than Whites to be in the moderate functional decrement group as opposed to the healthy functioning group (RRR = 1.566, p < .001), whereas hispanics did not differ from Whites in this regard. Additional analysis indicated that hispanics had a lower risk in experiencing moderate functional decrement than Blacks (RRR = .667, p < .001, table not shown). These re-sults are consistent with the hypothesized ethnic variations in disability trajectories (h2).
The observed ethnic variations in disability trajectories appear to be partially due to the heterogeneity in education and baseline functional status. Indeed, the results (M2.2 in Table 5) were very similar to those based on trajectory groups without adjusting for time-varying covariates (M1.2 in Table 4). For instance, Blacks’ RRR of experiencing a large functional decrement reduced from 2.389 to 1.989 (M2.2 in Table 5). The initially observed hispanic–White difference in the risk of experiencing a large functional dec-rement was no longer significant when education and base-line disability were adjusted. These results lend some support for the differential mechanisms suggested in hypothesis 3.
Effects of Other CovariatesIn addition to ethnicity, older age and female gender
were significantly associated with elevated probabilities of experiencing trajectories of poorer functional health (M1.1 in Table 4). Age and gender variations remained unchanged, even after education and baseline functional status were controlled (M1.2 in Table 4). similar results concerning age and gender differences were obtained, when the disability trajectories were adjusted for time-varying covariates (Table 5).
To control for possible selection bias, mortality and attri-tion during the period of follow-up and proxy interviews were included in our analysis as covariates. Although they are generally considered confounding variables, they may also serve as surrogates for poor health. Mortality was sub-stantially correlated with the relative risk of following a tra-jectory of poorer functional health, whereas attrition because of reasons other than death did not show a significant effect on the relative risks of belonging to various disability trajec-tories. This was the case for disability trajectories with or without adjusting for time-varying covariates (Tables 4 and 5). In addition, respondents, from whom proxy interviews were obtained, were significantly more likely to be more disabled in all trajectory groups (M2.0 in Table 3). Accord-ingly, parameter estimates would be seriously biased if mortality and proxy interview were not controlled.
DiscussionThe present research contributes to our understanding of
ethnic variations in the multiple trajectories of disability on
the basis of data derived from a national sample of Ameri-cans older than 50 years. In particular, it offers a quantita-tive depiction of the distinct trajectories of functional status, parallel to successful, usual, and pathological aging (Kane et al., 1999; Rowe & Kahn, 1987). After age 50, functional status evolves in five ways: (a) excellent functional health, (b) good functional health with small increasing disability, (c) accelerated increase in disability, (d) high but stable dis-ability, and (e) persistent severe disability. These trajecto-ries range from being a linear to cubic function of time. however, all of them exhibit a significant degree of stabil-ity, except that of accelerated increase in disability.
Our results are fairly comparable with those reported by Deeg (2005) who identified five trajectories of disability, including (a) stable not limited, (b) stable mild, (c) stable severe, (d) gradual increase, and (e) delayed increase, in ad-dition to three trajectories specific to those deceased during the period of observation. Moreover, Nusselder, Looman, and Mackenbach (2006) identified 10 trajectories of disabil-ity among which 3 (i.e., entirely nondisabled, permanently mildly disabled, and mild but increasing disability) closely resemble those we have found. Of the remaining seven of their trajectories, six showed more fluctuations but only ac-counted for very small proportions of respondents (ranging from 0.4% to 2.4%), and one was reserved for those who died (5.8%) during the period of observation. To the extent that the findings from these studies converge, the validity of the five trajectories identified by us is reinforced.
Relative to conventional studies, our specifications are more dynamic in that trajectories of disability are included as a function of not only the lagged measures of marital status and health conditions but also their changes between two adjacent observations. When time-varying covariates such as marital status and health conditions are controlled, only three trajectory groups emerge: (a) healthy function-ing, (b) moderate functional decrement, and (c) large func-tional decrement. As a close parallel to the notions of successful, usual, and pathological aging, these three tra-jectory groups show that heterogeneities in the changes in functional status are significantly associated with how martial status and other health conditions evolve over time.
health trajectories are useful outcome measures, as they provide a dynamic depiction of the natural history of health and diseases. These trajectories are more informative than measures pertaining to health at one or more points in time because significant health difference at a given time may disappear or even reverse at a later time. In contrast, there may be distinct multiple courses of health changes associ-ated with various diseases such as diabetes and heart dis-ease (chen et al., 2007; Lunney et al., 2003). Further research concerning how acute and chronic diseases are re-lated to distinct health trajectories would facilitate disease management as well as the development of new initiatives for health promotion and disease prevention.
ETHNICITY AND DISABILITY TRAJECTORIES 479
To the best of our knowledge, no prior study has focused on ethnic variations in person-centered disability trajecto-ries in middle and late life, particularly among Black, hispanic, and White Americans. We found that Black and hispanic Americans have significantly higher probabili-ties relative to White Americans in experiencing poor functional health trajectories, with Blacks having an even greater risk than hispanics. By analyzing functional health trajectories in conjunction with time-constant and time-varying covariates, we were able to examine ethnic differences in health in a more dynamic fashion. Indeed, it is remarkable that ethnic variations appeared to be rela-tively robust with or without controlling for time-varying covariates.
Prior research has revealed that many of the racial differ-ences in health can be explained by sEs factors (Robert & house, 2000). however, this may not apply to person-centered disability trajectories. Whereas the hispanic– White differentiation in the probabilities of experiencing various disability trajectories is largely mediated by sEs, Black–White disparities in this regard remain significant after these covariates are controlled. This finding provides some evidence that not all racial differences in health in the United states are explained by socioeconomic factors. In addition to sEs, racism, neighborhood attributes, lifestyle, and social capital may have a bearing on ethnic variations in health (crimmins et al., 2004; smaje, 2000). There is also some evidence that ethnic variations exist in the ways how pathology, impairments, functional limitations, and dis-ability are linked (Zsembik et al., 2000). The fact that im-migrants constitute a significant proportion of hispanic Americans may explain partially why hispanics and Whites converged in disability trajectories when sEs, marital status, and health conditions were adjusted (Williams & Lawler, 2001).
This study can be improved in several aspects. First, more ethnic groups may be included. For instance, Black immigrants from sub-saharan Africa or caribbean may be better educated than native-born Black Americans. similarly, the health profile of Black immigrants varies by specific group and health outcome (Williams, 2005). hispanics include cubans, Puerto Ricans, Mexican Americans, and central/south American-origin individu-als. They are culturally diverse with different customs, values, migration patterns, and sEs (Marger, 2003). In this regard, factors such as acculturation and age at im-migration may have important implications for health in middle and later life (Angel & Angel, 2006; Markides & Black, 1996). In contrast, one may consider incorporating additional ethnic groups such as Japanese, chinese, and Asian Indian Americans, which have shown substantial success in educational and occupational attainment in conjunction with better health (Williams). They could serve as useful benchmarks in understanding ethnic varia-tions in health dynamics.
second, ethnic variations in person-centered health tra-jectories can be further examined by analyzing each group separately. This will enable us to explore the unique pat-terns of trajectories within Blacks, hispanics, and Whites. For instance, the number, configuration, and relative distri-bution of the courses of disability among Blacks could vary substantially from those among hispanics and Whites. however, estimates from a given ethnic group (e.g., Blacks) so derived cannot be directly compared with those from other groups (e.g., hispanics and Whites) because they are a function of covariances within a specific group (i.e., Blacks). Nevertheless, additional insights could be gained from such analyses.
Third, as respondents of hRs were sampled in mid- and late life, differential mortality had already altered the repre-sentativeness of the original birth cohorts before they were eligible for inclusion (George, 2005). This is often referred to as left truncation, which may lead to selection bias. In the present study, left truncation is likely to lead to a higher proportion of healthy respondents to be included in the sam-ple. This might underestimate the rate of increase in disability over time. In contrast, survival may be more selective among Blacks and hispanics than among Whites. If this were the case, more Whites with poor health than Blacks and his-panics might be included in the hRs panel. This could lead to understated ethnic differences in health. however, it is unclear how large such biases are. More research on ways of adjusting for the biases due to left truncation is clearly warranted.
A more dynamic approach focusing on how person- centered health trajectories vary across Black, hispanic, and White Americans would lead to an improved under-standing of the linkages between ethnicity and health. Our research reveals that significant ethnic variations exist not only in the probabilities in experiencing various disability trajectories but also in the underlying mecha-nisms. Promising avenues for inquires include further explicating ethnic heterogeneities and implications of left truncation.
Funding
This research was supported by the National Institute on Aging via grants AG154124 and AG028116 (J.L., principal investigator) and the National Institutes of health via a pilot grant (X.X., principal investigator) from the Michigan claude D. Pepper Older Americans Independence cen-ter (5P30AG024824) and the Michigan Institute of clinical and health Research (UL1RR024986). The Japanese Ministry of health, Labor and Welfare Longevity Foundation and the Tokyo Metropolitan Institute of Gerontology provided additional support.
Acknowledgments
We thank Bobby Jones for his useful advice on the implementation of Proc Traj and interpretation of findings. J.L. planned the study, supervised the data analysis, interpreted the findings, and drafted the manuscript. X.X. played a major role in implementing the dynamic modeling with time-varying covariates and assisted in writing and revising the manuscript. J.M.B. and A.R.Q. shared the responsibility of data management and con-tributed to writing and revising the paper. W.Y. provided statistical consul-tation and assisted in writing and revising the manuscript.

LIANG ET AL.480
Correspondence
Address correspondence to Jersey Liang, PhD, Department of health Management and Policy, school of Public health, University of Michigan, 1420 Washington heights, Ann Arbor, MI 48109-2029. Email: jliang @umich.edu.
ReferencesAngel, R. J., & Angel, J. L. (2006). Minority group status and healthful
aging: social structure still matters. American Journal of Public Health, 96, 1152–1159.
Angel, R. J., Angel, J. L., & himes, c. L. (1992). Minority group status, health transitions, and community living arrangements among the elderly. Research on Aging, 14, 496–521.
Baron, R. M., & Kenny, D. A. (1986). The moderator-mediator variable distinction in social psychological research: conceptual, strategic, and statistical considerations. Journal of Personality and Social Psychology, 51, 1173–1182.
carrasquillo, O., Lantigua, R. A., & shea, s. (2000). Differences in func-tional status of hispanic versus Non-hispanic white elders: Data from the Medical Expenditure Panel survey. Journal of Aging and Health, 12, 342–361.
chen, J. h., chan, D. c., Kiely, D. K., Morris, J. N., & Mitchell, s. L. (2007). Terminal trajectories of functional decline in the long-term care setting. Journal of Gerontology: Medical Sciences, 62, 531–536.
crimmins, E. M., hayward, M. D., & seeman, T. E. (2004). Race/ethnic-ity, socioeconomic status, and health. In N. B. Anderson, R. Bulatao & B. cohen (Eds.), Critical perspectives on racial and ethnic differ-ences in health in late life (pp. 310–352). Washington, Dc: National Academies Press.
crimmins, E. M., Kim, J. K., Alley, D., Karlamangla, A., & seeman, T. (2007). hispanic paradox in biological profiles. American Journal of Public Health, 97, 1305–1310.
crimmins, E. M., & seeman, T. (2001). Integrating biology into demo-graphic research on health and aging (with a focus on the MacArthur study of successful Aging). In c. Finch, J. Vaupel & K. Kinsella (Eds.), Cells and surveys: Should biological measures be included in social science research? (pp. 9–41). Washington, Dc: National Academy Press.
Deeg, D. J. h. (2005). Longitudinal characterization of course types of functional limitations. Disability and Rehabilitation, 27, 253–261.
Dodge, h. h., Du, Y., saxton, J. A., & Ganguli, M. (2006). cognitive domains and trajectories of functional independence in nondemented elderly persons. Journal of Gerontology: Medical Sciences, 61, 1330–1337.
Ferrucci, L., Guralnik, J. M., simonsick, E., salive, M. E., corti, c., & Langlois, L. (1996). Progressive versus catastrophic disability: A longitudinal view of the disablement process. Journal of Gerontol-ogy: Medical Sciences, 51, M123–M130.
George, L. K. (2005). socioeconomic status and health across the life course: Progress and prospects [special Issue II]. Journal of Gerontology: Social Sciences, 60B, 135–139.
house, J. s., Lantz, P. M., & herd, P. (2005). continuity and change in the social stratification of aging and health over the life course: Evidence from a nationally representative longitudinal study from 1986 to 2001/2002 (Americans’ changing Lives study) [special Issue II]. Journal of Gerontology: Social Sciences, 60B, 15–26.
Jackson, J. s., Antonucci, T. c., & Gibson, R. c. (1990). cultural, racial, and ethnic minority influences on aging. In J. E. Birren & K. W. schaie (Eds.), Handbook of the psychology of aging (3rd ed., pp. 103–123). New York: Academic Press.
Jones, B., Nagin, D., & Roeder, K. (2001). A sAs procedure based on mixture models for estimating developmental trajectories. Sociological Method and Research, 29, 374–393.
Kane, R. L., Ouslander, J. G., & Abrass, I. B. (1999). Essentials of clinical geriatrics. New York: McGraw-hill.
Kelley-Moore, J. A., & Ferraro, K. F. (2004). The black/white disability gap: Persistent inequality in later life? Journal of Gerontology: Social Sciences, 59B, s34–s43.
Liang, J., Bennett, J. M., shaw, B. A., Quiñones, A. R., Ye, W., Xu, X., & Ofstedal, M. B. (2008). Gender differences in functional status in middle and older age: Are there any age variations? Journal of Gerontology: Social Sciences, 63, s282–s292.
Lunney, J. R., Lyn, J., Foley, D. J., Lipson, s., & Guralnik, J. M. (2003). Patterns of functional decline at the end of life. Journal of the American Medical Association, 289, 2387–2392.
Marger, M. N. (2003). Race and ethnic relations: American and global perspectives (6th ed.). Belmont, cA: Wadsworth.
Markides, K. s., & Black, s. A. (1996). Race, ethnicity, and aging: The impact of inequality. In R. h. Binstock & L. K. George (Eds.), Hand-book of aging and the social sciences (4th ed., pp. 153–170). san Diego, cA: Academic Press.
Mavandadi, s., Rook, K. s., & Newsom, J. T. (2007). Positive and negative social exchanges and disability in later life: An investigation of trajectories of change. Journal of Gerontology: Social Sciences, 62B, s361–s370.
Mendes de Leon, c. F., Barnes, L. L., Bienias, J. L., skarupski, K. A., & Evans, D. A. (2005). Racial disparities in disability: Recent evidence from self-reported and performance-based disability measures in a population-based study of older adults. Journal of Gerontology: Social Sciences, 60B, s263–s271.
Mendes de Leon, c. F., Beckett, L. A., Fillenbaum, G. G., Brock, D. B., Branch, L. G., Evans, D. A., & Berkman, L. F. (1997). Black-white differences in risk of becoming disabled and recovering from dis-ability in old age: A longitudinal analysis of two EPEsE populations. American Journal of Epidemiology, 145, 488–497.
Muthén, B., & Muthén, L. K. (2000). Integrating person-centered and variable-centered analyses: Growth mixture modeling with latent trajectories classes. Alcoholism: Clinical and Experimental Research, 24, 882–891.
Nagin, D. s. (2005). Group-based modeling of development. cambridge, MA: harvard University Press.
Nusselder, W. J., Looman, c. W. N., & Mackenbach, J. P. (2006). The level and time course of disability: Trajectories of disability in adults and young elderly. Disability and Rehabilitation, 28, 1015–1026.
Peek, c. W., coward, R. T., henretta, J. c., Duncan, R. P., & Dougherty, M. c. (1997). Differences by race in the decline of health over time. Journal of Gerontology: Social Sciences, 52, s336–s344.
Radloff, L. s. (1977). The cEs-D scale: A self-report depression scale for research in the general population. Applied Psychological Measurement, 1, 385–401.
Raudenbush, s. W., & Bryk, A. s. (2002). Hierarchical linear models (2nd ed.). Thousand Oaks, cA: sage.
Robert, s. A., & house, J. s. (2000). socioeconomic inequalities in health: An enduring sociological problem. In c. E. Bird, P. conrad & A. M. Fremont (Eds.), Handbook of medical sociology (5th ed., pp. 79–97). Upper saddle River, NJ: Prentice-hall.
Rowe, J. W., & Kahn, R. L. (1987). human aging: Usual and successful. Science, 237, 143–149.
Ryff, c. D., singer, B., Love, G. D., & Essex, M. J. (1998). Resilience in adulthood and later life: Defining features and dynamic processes. In J. Lomranz (Ed.), Handbook of aging and mental health: An integrative approach (pp. 69–96). New York: Plenum Press.
schafer, J. L. (1997). Analysis of incomplete multivariate data. London: chapman & hall.
schaie, K. W. (1996). Intellectual development in adulthood. In J. E. Birren & K. W. schaie (Eds.), Handbook of the psychology of aging (4th ed., pp. 266–286). New York: Academic Press.
ETHNICITY AND DISABILITY TRAJECTORIES 481
smaje, c. (2000). Race, ethnicity, and health. In c. E. Bird, P. conrad & A. M. Fremont (Eds.), Handbook of medical sociology (5th ed., pp. 114–128). Upper saddle River, NJ: Prentice hall.
spector, W. D., & Fleishman, J. A. (1998). combining activities of daily living with instrumental activities of daily living to measure functional disability. Journal of Gerontology: Social Sciences, 53B, s46–s57.
Taylor, M. G., & Lynch, s. M. (2004). Trajectories of impairment, social support, and depressive symptoms in later life. Journal of Gerontology: Social Sciences, 59B, s238–s246.
Williams, D., & Lawler, K. A. (2001). stress and illness in low-income women: The roles of hardiness, John henryism, and race. Women and Health, 32, 61–75.
Williams, D. R. (1997). Race and health: Basic questions, emerging direc-tions. Annals of Epidemiology, 7, 322–333.
Williams, D. R. (2005). The health of U.s. racial and ethnic populations [spe-cial Issue II]. Journal of Gerontology: Social Sciences, 60B, 53–62.
Zsembik, B. A., Peek, M. K., & Peek, c. W. (2000). Race and ethnic variation in the disablement process. Journal of Aging and Health, 12, 229–249.
Copyright © 2022 FDOKUMEN