Etnik Gruplar ve Etnik Ayrılıkçılık (Ethnic Groups and Ethnic Seperatism)
Upload
independentCategory
view
0download
0
1
CESIS Electronic Working Paper Series
Paper No. 261
Ethnic origin, local labour markets and self-employment in Sweden: A Multilevel Approach
Lina Andersson Mats Hammarstedt
Shakir Hussain Ghazi Shukur
November 2011
The Royal Institute of technology
Centre of Excellence for Science and Innovation Studies (CESIS) http://www.cesis.se

2
Ethnic origin, local labour markets and self-employment in Sweden:
A Multilevel Approach
Lina Andersson
Department of Economics and Statistics
Linnaeus University
SE-351 95 Växjö
Sweden
Mats Hammarstedt
Department of Economics and Statistics
Linnaeus University
SE-351 95 Växjö
Sweden
Ghazi Shukur
Department of Economics, Finance and
Statistics
Jönköping International Business School
SE- 551 11 Jönköping
Sweden
&
Department of Economics and Statistics
Linnaeus University
SE-351 95 Växjö
Sweden
Shakir Hussain
School of Medicine
University of Birmingham
Birmingham
United Kingdom
Abstract
We investigate the importance of ethnic origin and local labour markets conditions for self-
employment propensities in Sweden. In line with previous research we find differences in the
self-employment rate between different immigrant groups as well as between different
immigrant cohorts. We use a multilevel regression approach in order to quantify the role of
ethnic background, point of time for immigration and local market conditions in order to
further understand differences in self-employment rates between different ethnic groups. We
arrive at the following: The self-employment decision is to a major extent guided by factors
unobservable in register data. Such factors might be i.e. individual entrepreneurial ability and
access to financial capital. The individual’s ethnic background and point of time for
immigration play a smaller role for the self-employment decision but are more important than
local labour market conditions.
Keywords: Self-employment, immigrant background, local labour market
JEL-codes: J15, R23
3
1. Introduction
Are immigrants over-represented in self-employment compared to natives and do immigrants
have other reasons than natives for becoming self-employed? The questions have gained
increased attention in research in economics as well as in other disciplines. High self-
employment rates among the foreign born population have been documented in several
OECD-countries.1 Furthermore, several explanations for why immigrants are over-
represented in self-employment compared to natives, such as traditions from the home
country, the existence of ethnic enclaves, high rates of unemployment, different kinds of
discrimination and family traditions, have also been put forward in the literature.2
However, it has also been put forward that self-employment opportunities may arise not only
as a result of one single factor but instead of the fact that many different aspects meet in an
intersection facilitating immigrant self-employment, often referred to as the mixed
embeddedness approach.3 Thus, immigrants may be over-represented in self-employment as a
result of the interplay between factors such as personal resources, local market opportunities
and the economic environment.
In this paper we depart from the view that the interplay between social, economic and
institutional contexts are decisive for immigrant self-employment opportunities and explore
the extent to which differences in self-employment rates between immigrants and natives as
well as between different immigrant groups can be explained by the immigrants ethnic origin,
their point of time for immigration and economic conditions at the local market where the
self-employed individuals are active.
Our empirical analysis is carried out with the help of multilevel regression. Multilevel
modelling is suitable when the data consists of units (e.g. individuals) that are grouped at
different levels. Here, individuals are nested within different regions of origin, different points
of time for immigration and different local labour markets. Multilevel analysis allows us to
quantify such grouping effects and therefore we use logistic multilevel regression models to
estimate the probability of being self-employed in 2007.
Few previous attempts have been made to elucidate the extent to which self-employment
among immigrants is affected by the mix of personal resources, local market opportunities
and the economic environment. One such attempt is found in Ohlsson, Broomé & Bevelander
(2011) who found that individual to a larger extent than ethnic and social characteristics are
affecting self-employment propensities among immigrants. However, we extend the work by
Ohlsson, Broomé & Bevelander (2011) since we consider the fact that the self-employment
propensity may also differ within ethnic groups due to differences in time of immigration to
Sweden. Since the character of immigration to Sweden has changed considerably over time
we have good reasons to believe that there are differences in self-employment propensities not
only between different ethnic groups but also within certain groups with respect to their point
1 See e.g. Borjas (1986), Fairlie & Meyer (1996), Fairlie (1999) Hout & Rosen (2000) and Fairlie & Robb (2007)
for studies from the US, Le (2000) for a study from Australia, Clark & Drinkwater (2000) for a study from the
UK, Constant & Zimmermann (2006) for a study from Germany and Hammarstedt (2001, 2006) and Andersson-
Joona (2010) for studies from Sweden. 2 See e.g. Borjas (1986), Yuengert (1995), Fairlie & Meyer (1996), Clark & Drinkwater (2000), Hammarstedt
(2001a), Hammarstedt & Shukur (2009) and Andersson & Hammarstedt (2010, 2011). 3 See e.g. Kloosterman, van der Leun & Rath (1998), Kloosterman & Rath (2001) and Ram, Theodorakopoulus
& Jones (2008).

4
of time for immigration. Therefore, we explore the combined influence of ethnic origin and
year of immigration to Sweden rather than the influence of ethnic origin only.
The results in our empirical study reveal that the self-employment decision to a major extent
is guided by individual factors unobservable in register data. Such factors might be e.g.
individual entrepreneurial ability and access to financial capital. The individual’s ethnic
background and point of time for immigration play a smaller role but are more important than
local market conditions for the self-employment decision.
The remainder of the paper has the following structure: Section 2 gives an overview of the
immigrant population in Sweden. Data and some descriptive statistics are presented in Section
3. Our empirical strategy and the results are presented in Section 4 while Section 5, finally,
contains the conclusions.
2. The immigrant population in Sweden
Sweden, just as many other OECD countries, has experienced an increase in the share of
immigrants during recent decades. In 2011 more than 12 per cent of the total population is
foreign born. In addition to the increase in the immigrant population, the character of
immigration has also changed. During the Second World War refugee immigrants arrived
from Estonia and Latvia and after the Second World War and at times during the 1950s and
1960s there was refugee immigration to Sweden from different countries in Eastern Europe.
These immigrants were in general highly educated and did well in the Swedish labour market.
Labour-force migration to Sweden started during the second half of the 1940s, increased
during the 1950s and lasted primarily until the mid-1970s as a result of Sweden’s industrial
and economic expansion. The labour-force migration was made possible by institutional
changes which removed the needs for residence and work permits for immigrants from the
Nordic countries and made it possible for non-Nordic immigrants to enter Sweden
individually and then apply for a work permit. The labour-force migration during the 1950s
and 1960s consisted primarily of people from Finland, Norway and Denmark and from
countries in Southern Europe. The great majority of the labour-force migrants from Southern
Europe came from Yugoslavia, Italy and Greece. There was also labour-force migration from
Nordic countries other than Finland and from countries in Western Europe. Labour-force
migrants from these countries were in general better educated than labour-force migrants from
Finland or Southern Europe. The labour-force migrants did well in the Swedish labour market
and during the 1950s as well as the 1960s; the employment rate was often higher and the
unemployment lower among immigrants than among native Swedes.
In the mid-1960s Swedish labour organisations saw immigrants keeping wages low for less
skilled workers. A more restrictive immigration policy and a deterioration in the labour
market caused the character of immigration to change during the 1970s. As labour-force
migration tapered off, the number of refugees started to increase. In the mid-1970s, refugee
migration from Latin America started to reach significant proportions and during the 1980s
and 1990s a great number of refugees came from Asia and Africa. During the 1990s and at the
beginning of the 2000s, refugee immigration to Sweden has continued to increase; the influx
during the 1990s was dominated by refugees from the former Yugoslavia and the Middle East
while the influx during the early 2000s was dominated by Middle Eastern refugees.
The new immigration has changed the composition of the immigrant population. In 1970,
about 60 per cent of the foreign-born persons living in Sweden had been born in other Nordic
5
countries and about 30 per cent in other European countries. Only about 10 per cent were born
outside of Europe. In 2011 only about 30 per cent were born in other Nordic countries, about
30 per cent were born in other European countries and almost 40 per cent of the immigrant
population was born in non-European countries. Among the immigrants from non-European
countries the great majority are refugees from countries in Africa, Asia and the Middle East.
Early labour-force migrants did often well on the Swedish labour market and up to the mid-
1970s the average earnings and employment rates among immigrants were often higher than
among the native population. However, self-employment was a marginal phenomenon among
early labour force migrants in Sweden.4 Instead, a large increase in self-employment rates
among immigrants has occurred during more recent years, especially among immigrants
originating from certain countries in Southern Europe and the Middle East.5
Thus, large differences in self-employment rates between certain immigrant groups have been
documented in previous research. Furthermore, there are also large differences in self-
employment rates within certain groups of immigrants depending on point of time for their
immigration.6 Thus, when investigating the extent to which immigrant self-employment is
affect by personal resources, local market opportunities and the economic environment there
are good reasons to divide the immigrants not only by their ethnic origin but also by their
point of time for immigration.
3. Data and some descriptive statistics
We use data from the register-based longitudinal data base LISA (Longitudinal Integration
Database for Health Insurance and Labour Market Studies) developed by Statistics Sweden.
LISA contains information on everyone in Sweden, 16 years and older, and his or her
demographic characteristics, labour market characteristics and use of social benefits. We
include all foreign-born individuals resident in Sweden in 2007 and a 10-per cent random
sample of the native population resident in Sweden in 2007.7 The analysis focuses on
individuals aged between 20 and 64 years old. Students and early retired are excluded. These
selections are made in order to obtain a sample consisting of individuals who are active on the
labour market. In line with previous research on self-employment, we leave out farmers from
the analysis. Our total sample then consists of 987,435 individuals out of whom 659,040 are
foreign born and 328,395 are natives.
We define an individual as self-employed if he or she was registered as employed and if he or
she was registered as self-employed by Statistics Sweden in 2007. Statistics Sweden uses
information on labour earnings from the month of November to determine whether an
individual is wage-employed or self-employed. An individual is defined as self-employed if
earnings from self-employment constituted that person’s main source of income in November.
This means that if a person has earnings from both self-employment and wage employment,
he/she is registered as self-employed if self-employment earnings exceed wage earnings and
as wage-employed if wage earnings are larger than earnings from self-employment. We
include both private firms and limited liability companies.
4 See Hammarstedt (2001b).
5 See Hammarstedt (2001b, 2004, 2006) and Andersson & Hammarstedt (2011b).
6 See Hammarstedt (2004).
7 Individuals who are born in Sweden and whose parents are born in Sweden are defined as natives. Second-
generation immigrants are thus excluded from the analysis.

6
In order to explore the importance of origin for the self-employment decision we divide the
immigrants into eight groups based on their region of origin: Nordic countries, Western
Europe, Eastern Europe, Southern Europe, the Middle East, Africa, Asia and Latin America.
We also want to consider the fact that immigrants within a certain group immigrated to
Sweden at different points in time. Therefore, for each region we divide the individuals into
seven groups, cohorts, on the basis of the year of immigration to Sweden: those who arrived
before 1976, between 1976 and 1980, between 1981 and 1985, between 1986 and 1990,
between, 1991 and 1995, between 1996 and 2000, between 2001 and 2007. In total then we
have 57 groups: 56 immigrant groups (8 x 7) and natives.
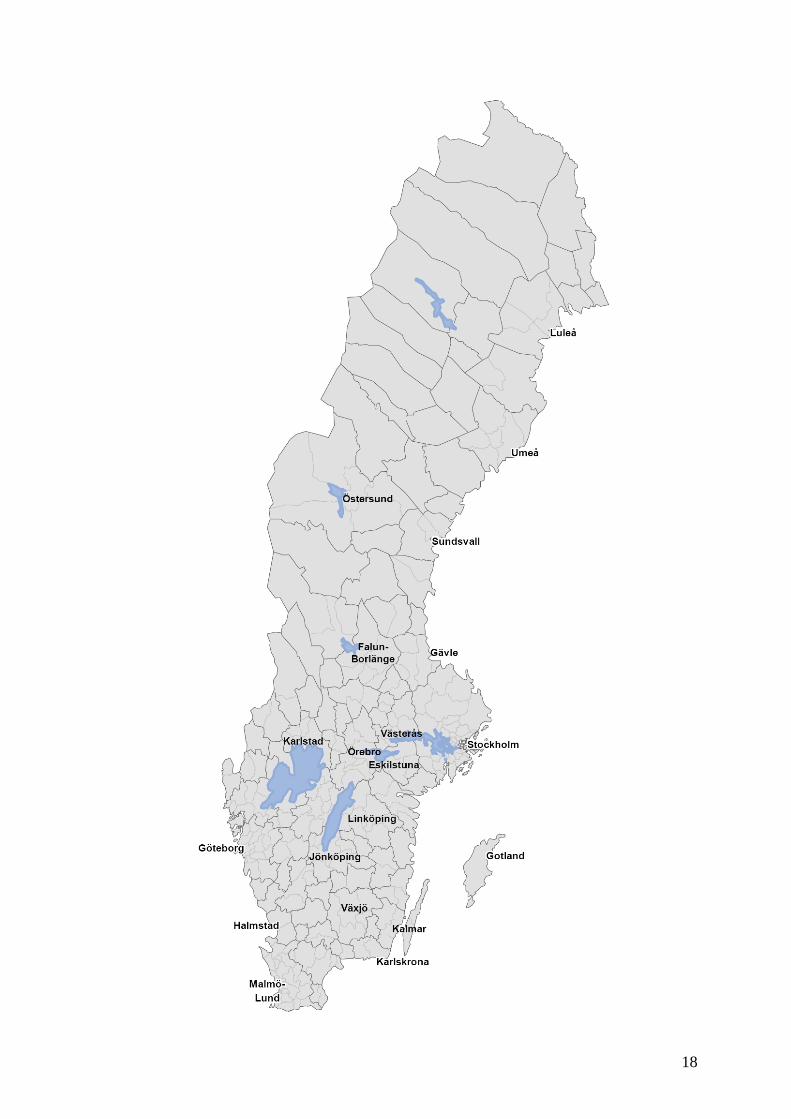
We also divide the individuals in our data into groups on the basis of their region of residence
in order to study the effect of the local business environment. For this purpose we use
Statistics Sweden’s regional division of Sweden into local labour markets; in 2007 there were
87 local labour markets in Sweden.8 The regional division is based on statistics of commuting
patterns between municipalities. Based on these statistics, local labour markets are created by
identifying local centres (independent municipalities) and by linking dependent municipalities
to these centres.9
Table 1: Descriptive statistics of individuals aged 20 to 64 in 2007, by gender and employment status.
Men Women
Self-employed Not self-
employed Self-employed
Not self-employed
Age 45.7 (10.3) 41.5 (11.9) 45.3 (10.6) 41.7 (11.7)
Educational attainment
Primary school 23.3 (42.2) 19.3 (39.5) 17.0 (37.6) 17.3 (37.9)
Secondary school 47.6 (49.9) 46.1 (49.8) 45.9 (49.8) 42.7 (49.5)
University degree 29.2 (45.4) 34.6 (47.6) 37.1 (48.3) 39.9 (49.0)
Married 61.0 (48.8) 47.5 (49.9) 62.2 (48.5) 52.6 (49.9)
Children 59.4 (49.1) 48.7 (50.0) 60.4 (48.9) 58.8 (49.2)
Region of origin
Sweden 36.4 (48.1) 33.8 (47.3) 34.0 (47.4) 32.3 (46.8)
Nordic countries 11.0 (31.3) 12.1 (32.6) 15.2 (35.9) 14.7 (35.4)
Western Europe 7.1 (25.7) 6.4 (24.5) 7.3 (26.1) 4.7 (21.3)
Eastern Europe 5.4 (22.7) 5.4 (22.7) 10.7 (30.9) 9.0 (28.7)
Southern Europe 7.1 (25.7) 10.9 (31.1) 5.8 (23.3) 9.2 (28.9)
The Middle East 24.3 (42.9) 15.2 (35.9) 13.5 (34.1) 11.7 (32.1)
Africa 2.6 (15.8) 5.9 (23.2) 1.4 (11.6) 4.3 (20.4)
Asia 4.2 (20.0) 5.7 (23.5) 9.6 (29.4) 9.5 (29.3)
Latin America 1.9 (13.7) 4.6 (21.0) 2.6 (15.9) 4.5 (20.7)
Number of observations 47,718 465,759 20,285 453,673
Standard deviations are within parentheses.
8 See Appendix A for a figure of the geographical division of the local labour markets in Sweden.
9 See SCB, MIS 2007:1 for more information.

7
Table 1 shows some descriptive statistics for the men and women included in our sample. It
emerges for both men and women that self-employed individuals tend to be older than those
who are not self-employed and they are also married and have children living in the
household to a larger extent. As regards educational attainment, self-employed men appear to
have a lower level of educational attainment than men who are not self-employed whereas the
differences among women are less pronounced.
Next, Table 2 shows the self-employment rate of men and women by region of origin and by
year of immigration. Table 2 reveals that the self-employment rate is higher for men than for
women both among when the individuals are divided up by region of origin and year of
immigration. For men the highest self-employment rate is found among immigrants
originating from the Middle East followed by immigrants from Western Europe and natives.
The lowest self-employment share is found among immigrants from Latin America and
Africa. For women on the other hand, women from Western Europe have the highest self-
employment rate followed by Eastern European women. Just as for men, women from Africa
and Latin America have the lowest self-employment rate. Turning to self-employment rate by
year of immigration, Table 2 shows that, in general, and for men in particular, the self-
employment rate increases with length of residence in Sweden. This is not surprising since for
example knowledge of labour markets, tastes of consumers and institutions as well as wealth
increase with time spent in the host countries.10
Also, the character of the immigration to
Sweden has changed considerably over time.
Table 2: Self-employment by region of origin and year of immigration in 2007 (aged 20–64), by gender
Self-employment rate (%) Self-employment rate (%)
Region of origin Men Women Year of immigration Men Women
Sweden 9.9 (29.9) 4.5 (20.7) Immigrated before 1976 11.7 (32.1) 5.5 (22.9)
Nordic countries 8.5 (27.9) 4.4 (20.6) Immigrated 1976–1980 13.7 (34.4) 5.5 (22.8)
Western Europe 10.2 (30.2) 6.4 (24.6) Immigrated 1981–1985 12.1 (32.6) 5.4 (22.5)
Eastern Europe 9.3 (29.0) 5.0 (21.8) Immigrated 1986–1990 11.2 (31.6) 5.2 (22.1)
Southern Europe 6.3 (24.2) 2.7 (16.3) Immigrated 1991–1995 8.5 (27.9) 3.7 (18.8)
The Middle East 14.1 (34.8) 4.9 (21.6) Immigrated 1996–2000 8.9 (28.5) 4.0 (19.6)
Africa 4.4 (20.6) 1.4 (11.7) Immigrated 2001–2007 4.2 (20.0) 2.5 (15.6)
Asia 6.8 (25.2) 4.3 (20.3)
Latin America 4.0 (19.7) 2.5 (15.7)
Number of observations 513,477 473,958 Number of observations 513,477 473,958
Standard deviations are within parentheses.
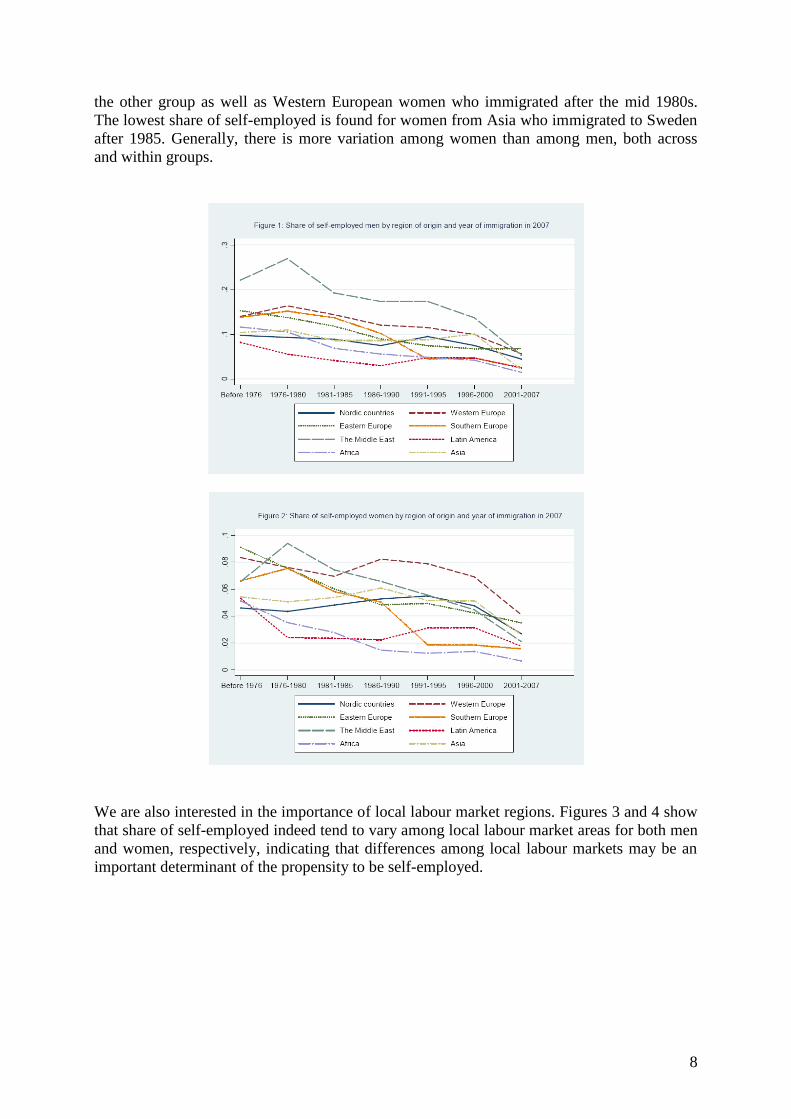
One purpose of the paper is to assess the importance of region of origin and year of
immigration on the decision to be self-employed. Figures 1 and 2 reveal that the self-
employment propensity varies among immigrant groups and that the self-employment
propensity also varies within groups due to differences in the time of immigration to Sweden.
Among men, immigrants from the Middle East are most likely to be self-employed and in
particular those who immigrated to Sweden during the first half of the 1980s. Further, men
with an Eastern European origin who immigrated to Sweden before 1991 have the lowest
tendency to be self-employed in 2007. For women, those with a Middle Eastern origin and
who immigrated to Sweden during 1976-1980 tend to be self-employed to a larger extent than
10
See Parker (2004).
8
the other group as well as Western European women who immigrated after the mid 1980s.
The lowest share of self-employed is found for women from Asia who immigrated to Sweden
after 1985. Generally, there is more variation among women than among men, both across
and within groups.
We are also interested in the importance of local labour market regions. Figures 3 and 4 show
that share of self-employed indeed tend to vary among local labour market areas for both men
and women, respectively, indicating that differences among local labour markets may be an
important determinant of the propensity to be self-employed.

9
4. Modelling self-employment
4.1 A multilevel regression approach
We apply multilevel analysis in order to assess the importance of region of origin, time of
arrival and local labour market conditions for explaining the observed variation an
individual’s decision of becoming self-employed. Multilevel modelling is appropriate when
data is hierarchically structured, i.e. when it consists of units (e.g. individuals) grouped at
different levels of a hierarchy.11
For example, groups tend to be differentiated in the sense that
their members both influence and are influenced by the group membership. As a result, it is
likely that individual outcomes are more correlated within a certain group (e.g. within a group
sharing the same ethnic origin) than individual outcomes across different groups (e.g. origins).
By applying multilevel analysis we are able to account for and also quantify such group
effects.
11
See Gelman &Hill (2007). Data Analysis Using Regression and Multilevel/Hierarchical Models, New York:
Cambridge
10
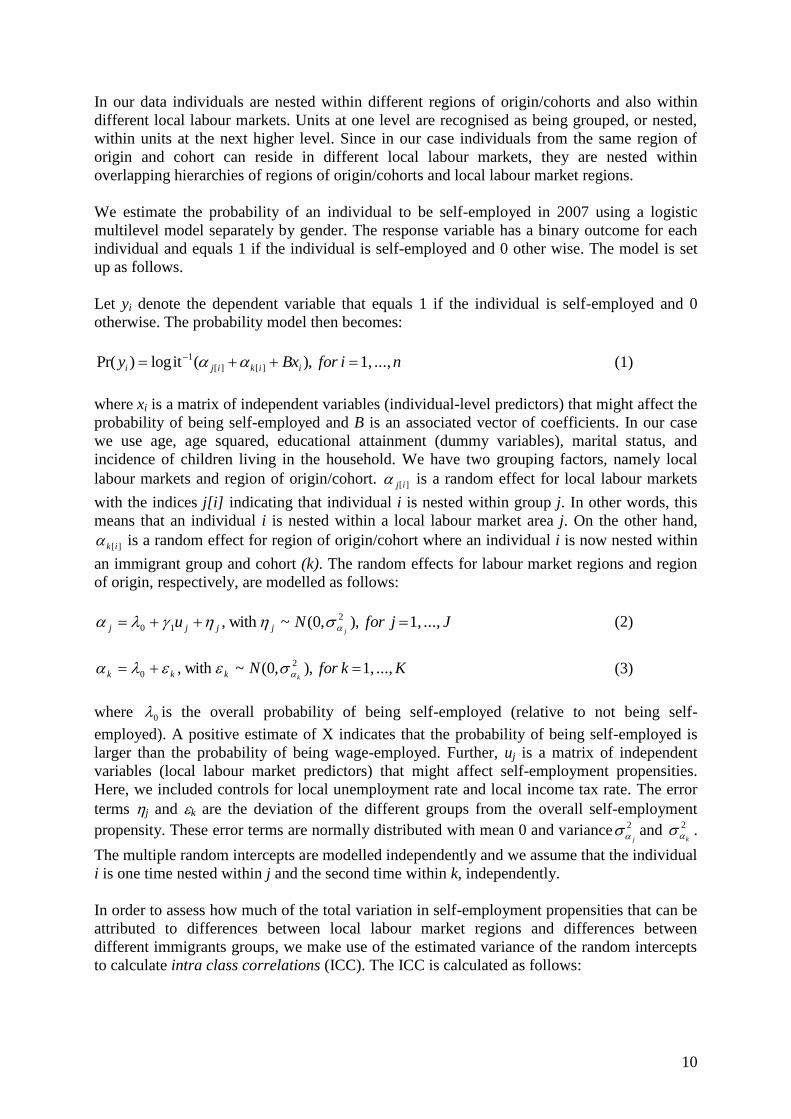
In our data individuals are nested within different regions of origin/cohorts and also within
different local labour markets. Units at one level are recognised as being grouped, or nested,
within units at the next higher level. Since in our case individuals from the same region of
origin and cohort can reside in different local labour markets, they are nested within
overlapping hierarchies of regions of origin/cohorts and local labour market regions.
We estimate the probability of an individual to be self-employed in 2007 using a logistic
multilevel model separately by gender. The response variable has a binary outcome for each
individual and equals 1 if the individual is self-employed and 0 other wise. The model is set
up as follows.
Let yi denote the dependent variable that equals 1 if the individual is self-employed and 0
otherwise. The probability model then becomes:
ni forBxy iikiji ..., 1, ),(itlog)Pr( ][][
1 (1)
where xi is a matrix of independent variables (individual-level predictors) that might affect the
probability of being self-employed and B is an associated vector of coefficients. In our case
we use age, age squared, educational attainment (dummy variables), marital status, and
incidence of children living in the household. We have two grouping factors, namely local
labour markets and region of origin/cohort. ][ij is a random effect for local labour markets
with the indices j[i] indicating that individual i is nested within group j. In other words, this
means that an individual i is nested within a local labour market area j. On the other hand,
][ik is a random effect for region of origin/cohort where an individual i is now nested within
an immigrant group and cohort (k). The random effects for labour market regions and region
of origin, respectively, are modelled as follows:
Jj forNujjjjj ..., 1, ),,0(~ with , 2
10 (2)
K k forNkkkk ..., 1, ),,0(~ with , 2
0 (3)
where 0 is the overall probability of being self-employed (relative to not being self-
employed). A positive estimate of X indicates that the probability of being self-employed is
larger than the probability of being wage-employed. Further, uj is a matrix of independent
variables (local labour market predictors) that might affect self-employment propensities.
Here, we included controls for local unemployment rate and local income tax rate. The error
terms j and k are the deviation of the different groups from the overall self-employment
propensity. These error terms are normally distributed with mean 0 and variance 2
j and 2
k .
The multiple random intercepts are modelled independently and we assume that the individual
i is one time nested within j and the second time within k, independently.
In order to assess how much of the total variation in self-employment propensities that can be
attributed to differences between local labour market regions and differences between
different immigrants groups, we make use of the estimated variance of the random intercepts
to calculate intra class correlations (ICC). The ICC is calculated as follows:

11
3/222
22
kj
kjICC (4)
where 2
j is the variance for local labour market and 2
k is the variance for region of origin.
Since we apply a logistic multilevel model the individual errors follow a logistic distribution.
In this case, the individual variance is equal to 3/2 , i.e. to 3.29. The ICC shows the
proportion of the total variance that can be explained by group differences in the population,
i.e. by differences between local labour market regions and between regions of origin and
point of time for immigration (cohorts).12
We estimate five different specifications. Specification 1 simply includes a random effect for
region of origin and time of immigration, i.e. in this model individuals are nested within
different regions of origin and cohorts. In Specification 2, we add individual characteristics,
i.e. age, aged squared, educational attainment, marital status, and incidence of children in the
household, to Specification 1 in order to asses how individual heterogeneity affects the
variance for region of origin. Specification 3 includes a random intercept for region of
origin/cohort and local labour market area, respectively. In Specification 4 we add individual-
level predictors to Specification 3. Finally, in Specification 5 we also include local labour
market characteristics, more precisely local unemployment rate and local income tax rate.13
By adding these local labour market predictors, we aim to control for possible differences in
economic conditions for self-employment among the local labour market regions. The
influence of local labour markets on self-employment propensities may then be interpreted as
the effect of local entrepreneurial climate.
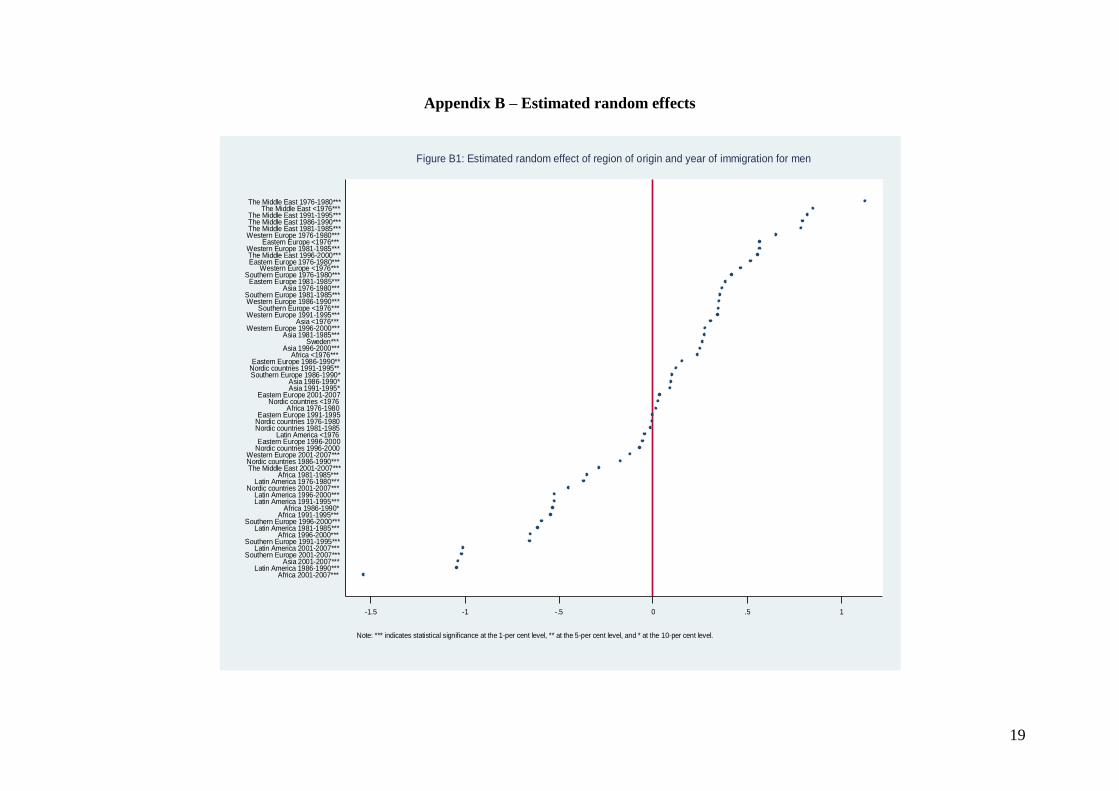
4.2 Estimation results
The results from the multilevel logistic regressions for males and females are presented in
Table 3 and Table 4, respectively, while the differences in self-employment propensity
between different immigrant groups and natives are highlighted by Figure B1 and Figure B2
in the Appendix.14
Figure B1 and B2 show the estimated random effects for region of origin
and time of immigration. The dots (random effect) show each group’s deviation from and the
groups’ distribution around the overall self-employment propensity (fixed effect). Thus,
random effects close to zero, indicated by the bold line in the figures imply small deviations
from the overall self-employment probability and random effects to the left and to the right of
the bold line indicate a lower and a higher self-employment propensity, respectively, than on
average.
Figure B1 reveals a high self-employment propensity among immigrants from the Middle
East; immigrant cohorts from the Middle East have a higher self-employment propensity than
the average with exception for the 2001–2007 cohort. We find relatively low self-employment
propensities among immigrants from Africa and Latin America. For Southern European
immigrants, the self-employment propensity is relatively high among early immigrant cohorts
while relatively low for more recent cohorts. Irrespectively of origin, we find that the self-
12
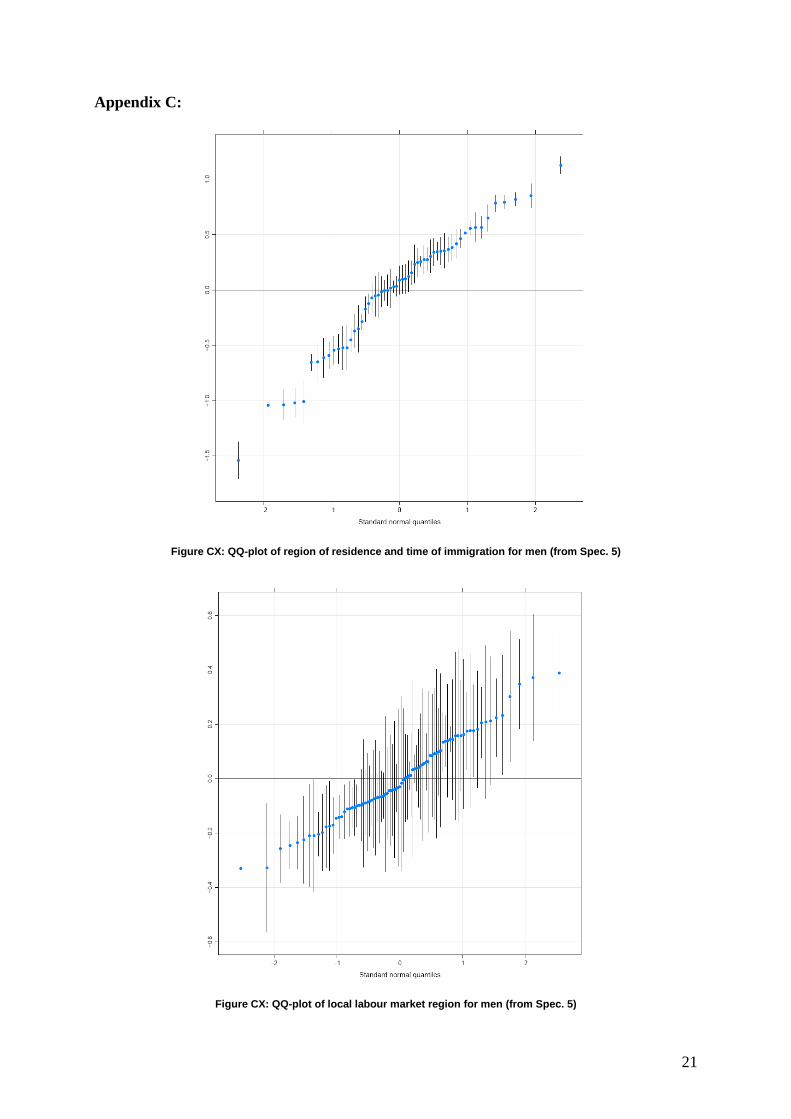
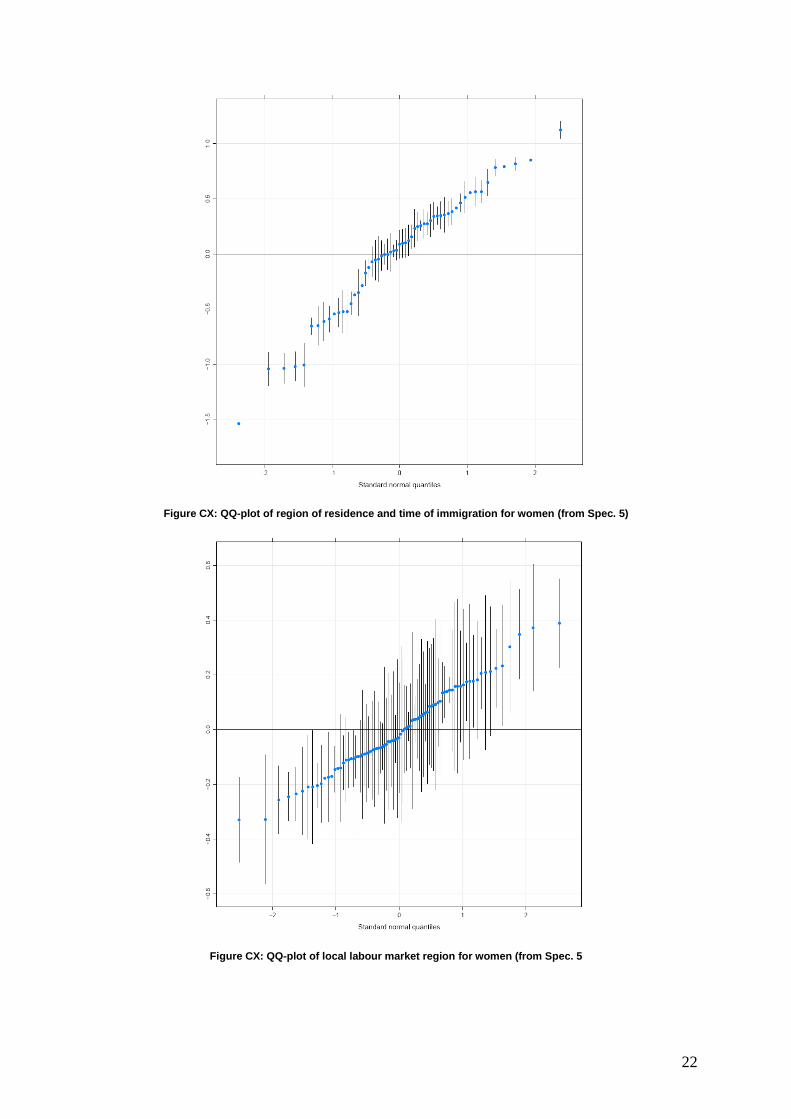
See Hox (2002). 13
Appendix C presents qq-plots of the two random effects for men and women, respectively. The plots indicate
that the distributions of the random effects fairly scattered around the assumed normal distribution. 14
The corresponding figures for how self-employment differs between different labour market areas are
available from the authors upon request.
12
employment propensity is very low for the 2001–2007 cohort, a result that reflect the fact that
it takes time in a new country to acquire financial capital, knowledge and resources needed to
succeed as self-employed and that also stress the importance of considering point of time for
immigration when immigrant self-employment propensities are analysed.
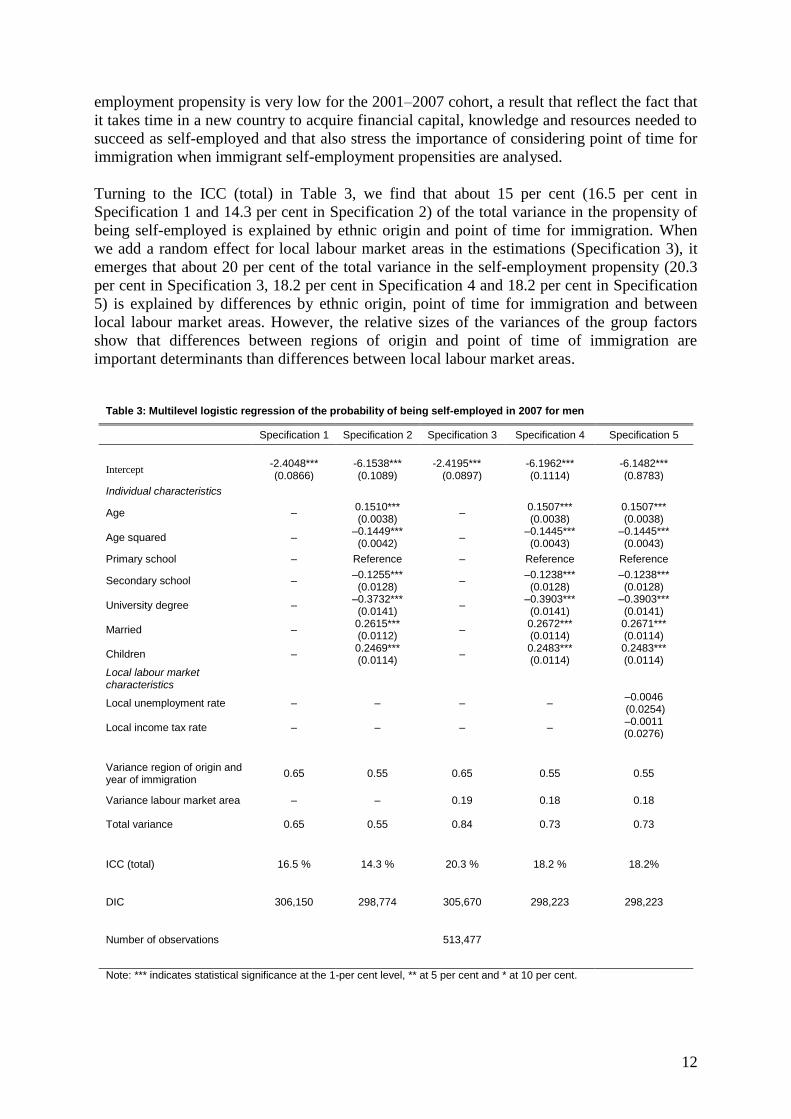
Turning to the ICC (total) in Table 3, we find that about 15 per cent (16.5 per cent in
Specification 1 and 14.3 per cent in Specification 2) of the total variance in the propensity of
being self-employed is explained by ethnic origin and point of time for immigration. When
we add a random effect for local labour market areas in the estimations (Specification 3), it
emerges that about 20 per cent of the total variance in the self-employment propensity (20.3
per cent in Specification 3, 18.2 per cent in Specification 4 and 18.2 per cent in Specification
5) is explained by differences by ethnic origin, point of time for immigration and between
local labour market areas. However, the relative sizes of the variances of the group factors
show that differences between regions of origin and point of time of immigration are
important determinants than differences between local labour market areas.
Table 3: Multilevel logistic regression of the probability of being self-employed in 2007 for men
Specification 1 Specification 2 Specification 3 Specification 4 Specification 5
Intercept -2.4048*** (0.0866)
-6.1538*** (0.1089)
-2.4195*** (0.0897)
-6.1962*** (0.1114)
-6.1482*** (0.8783)
Individual characteristics
Age – 0.1510*** (0.0038)
– 0.1507*** (0.0038)
0.1507*** (0.0038)
Age squared – –0.1449*** (0.0042)
– –0.1445*** (0.0043)
–0.1445*** (0.0043)
Primary school – Reference – Reference Reference
Secondary school – –0.1255*** (0.0128)
– –0.1238*** (0.0128)
–0.1238*** (0.0128)
University degree – –0.3732*** (0.0141)
– –0.3903*** (0.0141)
–0.3903*** (0.0141)
Married – 0.2615*** (0.0112)
– 0.2672*** (0.0114)
0.2671*** (0.0114)
Children – 0.2469*** (0.0114)
– 0.2483*** (0.0114)
0.2483*** (0.0114)
Local labour market characteristics
Local unemployment rate – – – – –0.0046 (0.0254)
Local income tax rate – – – – –0.0011 (0.0276)
Variance region of origin and year of immigration
0.65 0.55 0.65 0.55 0.55
Variance labour market area – – 0.19 0.18 0.18
Total variance 0.65 0.55 0.84 0.73 0.73
ICC (total) 16.5 % 14.3 % 20.3 % 18.2 % 18.2%
DIC 306,150 298,774 305,670 298,223 298,223
Number of observations 513,477
Note: *** indicates statistical significance at the 1-per cent level, ** at 5 per cent and * at 10 per cent.
13
Thus, our results for males show that about 80 per cent of the variation is explained by
individual factors other than those controlled for in the estimations. Such factors might i.e. be
individual entrepreneurial ability and access to financial capital. Further, since we are only
controlling for local unemployment rate and local income tax rate differences in self-
employment propensities might also be driven by circumstances on the local market that we
have not controlled for. Since we are studying immigrants we cannot rule out the fact that i.e.
customer discrimination plays a role for the possibilities to become and to survive as self-
employed.
Table 4: Multilevel logistic regression of the probability of being self-employed in 2007 for women, coefficients
Specification 1 Specification 2 Specification 3 Specification 4 Specification 5
Intercept –3.1348*** (0.0782)
–6.1254*** (0.1387)
–3.1537*** (0.0826 )
–6.1795*** (0.1414)
–6.3693*** (0.9961)
Individual characteristics
Age – 0.1137*** (0.0057)
– 0.1139*** (0.0057)
0.1139*** (0.0057)
Age squared – –0.1057*** (0.0065)
– –0.1061*** (0.0065)
–0.1061*** (0.0065)
Primary school – Reference – Reference Reference
Secondary school – 0.0537*** (0.0213)
– 0.0523*** (0.0213)
0.0524*** (0.0213)
University degree – –0.1352*** (0.0221)
– –0.1502*** (0.0222)
–0.1501*** (0.0222)
Married – 0.3137*** (0.0158)
– 0.3231*** (0.0156)
0.3230*** (0.0156)
Children – 0.0463*** (0.0174)
– 0.0452*** (0.0173)
0.0453*** (0.0173)
Local labour market characteristics
Local unemployment rate – – – – 0.0255
(0.0292)
Local income tax rate – – – – 0.0084
(0.0313)
Variance region of origin and year of immigration
0.58 0.52 0.58 0.52 0.52
Variance labour market area – – 0.20 0.19 0.19
Total variance 0.58 0.52 0.78 0.71 0.71
ICC (total) 15.0 % 13.6 % 19.2 % 17.8 % 17.8 %
DIC 164,589 162,508 164,348 162,238 162,237
Number of observations 473,958
Note: *** indicates statistical significance at 1 per cent, ** at 5 per cent, and * at 10 per cent.
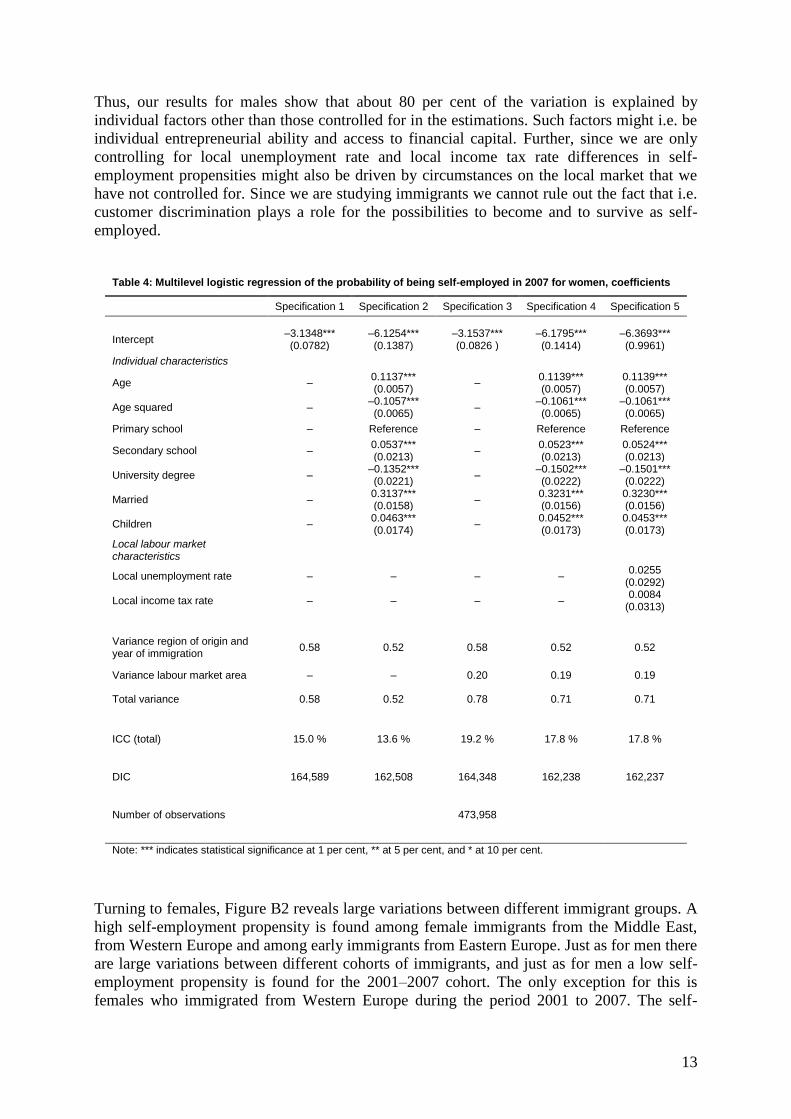
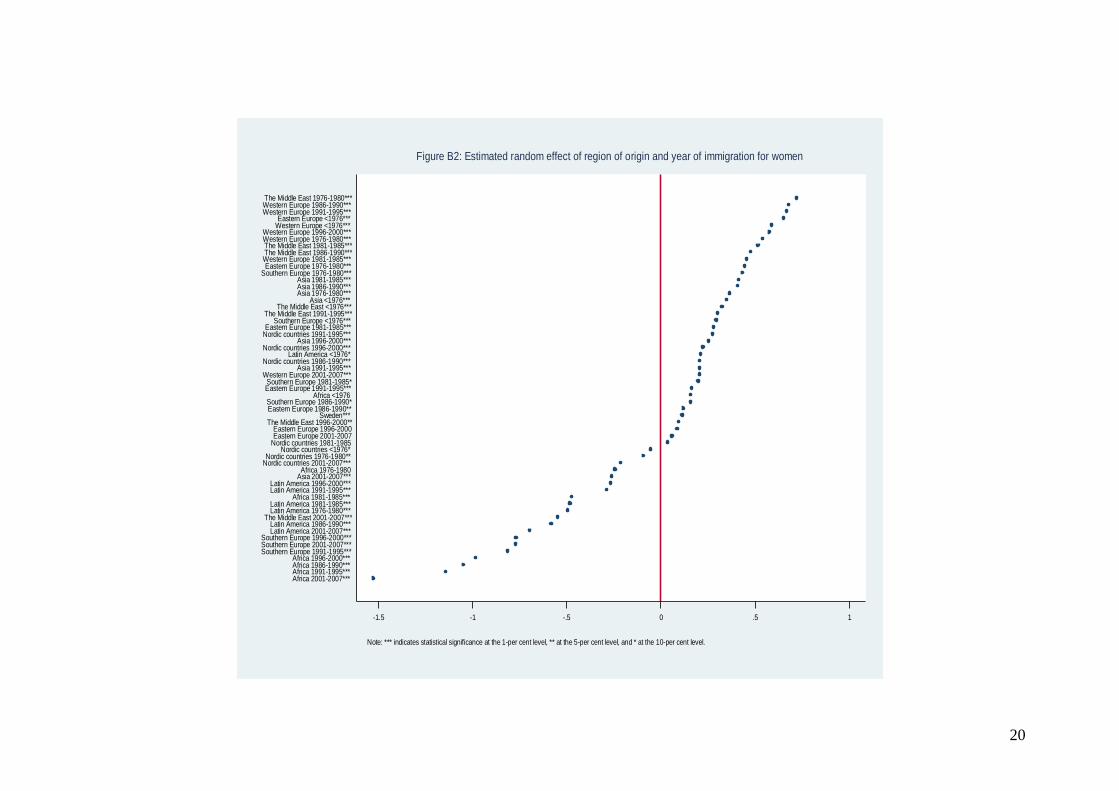
Turning to females, Figure B2 reveals large variations between different immigrant groups. A
high self-employment propensity is found among female immigrants from the Middle East,
from Western Europe and among early immigrants from Eastern Europe. Just as for men there
are large variations between different cohorts of immigrants, and just as for men a low self-
employment propensity is found for the 2001–2007 cohort. The only exception for this is
females who immigrated from Western Europe during the period 2001 to 2007. The self-
14
employment probability among females in this cohort is above the average self-employment
probability in our sample.
The estimations presented in Table 4 reveal that about 15 per cent (15.0 per cent in Model 1
and 13.6 per cent in Model 2) of the total variance in the propensity of being self-employed is
explained by ethnic origin and point of time for immigration. When we add a random effect
for local labour market areas to the specification, the share explained by the model increases
to about 20 per cent of the total variance (19.2 per cent in Model 3, 17.8 per cent in Model 4
and 17.8 per cent in Model 5). As for men, differences by region of origin and cohort are
more important determinants than differences between local labour market areas. Thus, the
importance of ethnic background, point of time for immigration and local labour market areas
looks about the same for females as for males.
5. Discussion and conclusions
This paper has been devoted to a study of how ethnic origin and local labour markets
influence self-employment propensities among immigrants in Sweden. In line with previous
research we find differences in the propensity to be self-employed between immigrants and
natives and among different immigrant groups. We also find large differences in self-
employment propensities between different immigrant cohorts originating from the same
region.
When quantifying the role of ethnic background, point of time for immigration and local
market conditions for self-employment propensities we find that the self-employment
decision is to a major extent guided by factors unobservable in register data. Such factors
might e.g. be individual entrepreneurial ability, access to financial capital and different kinds
of discrimination by customers on the local labour market. The individual’s ethnic
background and point of time for immigration play a smaller role for the self-employment
decision but are more important than local market conditions.
The result underlines that future research on immigrant self-employment should be conducted
by methods that help us to further understand the mechanisms behind the immigrant self-
employment decisions. Such methods might e.g. be different types of surveys in which
immigrant entrepreneurs are approached with questions about their motives behind their self-
employment decision and further also about which possibilities and obstacles they face when
becoming self-employed and also in their careers as self-employed.
15
References
Andersson-Joona, P. (2010). Exits from self-employment: Is there a native-immigrant
difference in Sweden?. International Migration Review, 44, 539–559.
Andersson, L. & Hammarstedt, M. (2010). Intergenerational transmissions in immigrant self-
employment: Evidence from three generations. Small Business Economics, 34, 261–276.
Andersson, L. & Hammarstedt, M. (2011a). Transmission of self-employment across
immigrant generations: The importance of ethnic background and gender. Review of
Economics of the Household, forthcoming.
Andersson, L. & Hammarstedt, M. (2011b). Ethnic enclaves, networks and self-employment
among immigrants in Sweden. International Migration, forthcoming.
Borjas, G. J. (1986). The self-employment experience of immigrants. Journal of Human
Resources, 21, 487–506.
Clark, K. & Drinkwater, S. (2000). Pushed out or pulled in? Self-employment among ethnic
minorities in England and Wales. Labour Economics, 7, 603–628.
Constant, A. & Zimmermann, K. F. (2006). The making of entrepreneurs in Germany: are
immigrants and natives alike?. Small Business Economics, 26, 279–300.
Fairlie, R. W. (1999). The absence of the African-American owned businesses: an analysis of
the dynamics of self-employment. Journal of Labor Economics, 17, 80–108.
Fairlie, R. W. & Meyer, B. D. (1996). Ethnic and racial self-employment differences and
possible explanations. Journal of Human Resources, 31, 757–793.
Gelman, A. & Hill, J. (2007) Data Analysis Using Regression and Multilevel/Hierarchical
Models, New York: Cambridge.
Hammarstedt, M. (2001a). Immigrant self-employment in Sweden – its variation and some
possible determinants. Entrepreneurship and Regional Development, 13, 147–161.
Hammarstedt, M. (2001b). Making a living in a new country. PhD thesis. Växjö University.
Hammarstedt, M. (2004). Self-employment among immigrants in Sweden – an analysis of
intragroup differences. Small Business Economics, 23, 115–126.
Hammarstedt, M. (2006). The predicted earnings differential and immigrant self-employment
in Sweden. Applied Economics, 38, 619–630.
Hammarstedt, M. & Shukur, G. (2009). Testing the home-country self-employment
hypothesis on immigrants in Sweden. Applied Economics Letters, 16, 745–748.
Hout, M. & Rosen, H. (2000). Self-employment, family background, and race. Journal of
Human Resources, 35, 670–691.
16
Hox, J. (2002) Multilevel Analysis: Techniques and Applications, Mahwah, New Jersey:
Lawrence Erlbaum Associates, Publishers.
Kloosterman, R., van der Leun, J. & Rath, J. (1998). Across the border. Immigrants’
economic opportunities, social capital and informal business activities. Journal of Ethnic and
Migration Studies, 24, 249–268.
Kloosterman, R. & Rath, J. (2001). Immigrant entrepreneurs in advanced economies: mixed
embededdness further explored. Journal of Ethnic and Migration Studies, 27, 189–202.
Le, A. T. (2000). The determinants of immigrant self-employment in Australia. International
Migration Review, 34, 183–214.
Ohlsson, H., Broomé, P. & Bevelander, P. (2011). The self-employment among immigrants
and natives in Sweden. Entrepreneurship and Regional Development, forthcoming.
Parker, C. (2004) The Economics of Self-Employment and Entrepreneurship, New York:
Cambridge University Press.
Ram, M., Theodorakoupoulos, N. & Jones, T. (2008). Forms of capital, mixed embeddedness
and Somali enterprise. Work, Employment & Society, 22, 427–446.
SCB, MIS 2007:1, Regional divisions in Sweden on 1 January 2007.
Yuengert, A. M. (1995). Testing hypotheses of immigrant self-employment. Journal of
Human Resources, 30, 194–204.

17
Appendix A: Local labour markets in Sweden 2007 (SCB, MSI 2007:1)
Code Number (in article)
Local labour market Code Number (in article)
Local labour market
LA301 1 Stockholm LA345 45 Örebro
LA302 2 Nyköping-Oxelösund LA346 46 Karlskoga
LA303 3 Eskilstuna LA347 47 Västerås
LA304 4 Linköping LA348 48 Fagersta
LA305 5 Norrköping LA349 49 Vansbro
LA306 6 Gislaved LA350 50 Malung
LA307 7 Jönköping LA351 51 Mora
LA308 8 Värnamo LA352 52 Falun-Borlänge
LA309 9 Vetlanda LA353 53 Avesta
LA310 10 Tranås LA354 54 Ludvika
LA311 11 Älmhult LA355 55 Ljusdal
LA312 12 Markaryd LA356 56 Gävle
LA313 13 Växjö LA357 57 Söderhamn
LA314 14 Ljungby LA358 58 Bollnäs
LA315 15 Emmaboda LA359 59 Hudiksvall
LA316 16 Kalmar LA360 60 Ånge
LA317 17 Oskarshamn LA361 61 Sundsvall
LA318 18 Västervik LA362 62 Kramfors
LA319 19 Vimmerby LA364 64 Örnsköldsvik
LA320 20 Gotland LA365 65 Strömsund
LA321 21 Olofström LA366 66 Härjedalen
LA322 22 Karlskrona LA367 67 Östersund
LA323 23 Malmö-Lund LA368 68 Malå
LA324 24 Kristianstad LA369 69 Storuman
LA325 25 Simrishamn-Tomelilla LA370 70 Sorsele
LA326 26 Halmstad LA371 71 Dorotea
LA327 27 Falkenberg LA372 72 Vilhelmina
LA328 28 Varberg LA373 73 Åsele
LA329 29 Bengtsfors LA374 74 Umeå
LA330 30 Lidköping-Götene LA375 75 Lycksele
LA331 31 Göteborg LA376 76 Skellefteå
LA332 32 Strömstad LA377 77 Arvidsjaur
LA333 33 Trollhättan LA378 78 Arjeplog
LA334 34 Borås LA379 79 Jokkmokk
LA335 35 Åmål LA380 80 Överkalix
LA336 36 Skövde LA381 81 Kalix
LA337 37 Torsby LA382 82 Övertorneå
LA338 38 Årjäng LA383 83 Pajala
LA339 39 Karlstad LA384 84 Gällivare
LA340 40 Filipstad LA385 85 Luleå
LA341 41 Hagfors LA386 86 Haparanda
LA342 42 Arvika LA387 87 Kiruna
LA343 43 Säffle
LA344 44 Hällefors
18
19
Appendix B – Estimated random effects
-1.5 -1 -.5 0 .5 1
Africa 2001-2007***Latin America 1986-1990***
Asia 2001-2007***Southern Europe 2001-2007***
Latin America 2001-2007***Southern Europe 1991-1995***
Africa 1996-2000***Latin America 1981-1985***
Southern Europe 1996-2000***Africa 1991-1995***
Africa 1986-1990*Latin America 1991-1995***Latin America 1996-2000***
Nordic countries 2001-2007***Latin America 1976-1980***
Africa 1981-1985***The Middle East 2001-2007***Nordic countries 1986-1990***Western Europe 2001-2007***
Nordic countries 1996-2000Eastern Europe 1996-2000
Latin America <1976Nordic countries 1981-1985Nordic countries 1976-1980Eastern Europe 1991-1995
Africa 1976-1980Nordic countries <1976
Eastern Europe 2001-2007Asia 1991-1995*Asia 1986-1990*
Southern Europe 1986-1990*Nordic countries 1991-1995**Eastern Europe 1986-1990**
Africa <1976***Asia 1996-2000***
Sweden***Asia 1981-1985***
Western Europe 1996-2000***Asia <1976***
Western Europe 1991-1995***Southern Europe <1976***
Western Europe 1986-1990***Southern Europe 1981-1985***
Asia 1976-1980***Eastern Europe 1981-1985***
Southern Europe 1976-1980***Western Europe <1976***
Eastern Europe 1976-1980***The Middle East 1996-2000***Western Europe 1981-1985***
Eastern Europe <1976***Western Europe 1976-1980***The Middle East 1981-1985***The Middle East 1986-1990***The Middle East 1991-1995***
The Middle East <1976***The Middle East 1976-1980***
Note: *** indicates statistical significance at the 1-per cent level, ** at the 5-per cent level, and * at the 10-per cent level.
Figure B1: Estimated random effect of region of origin and year of immigration for men
20
-1.5 -1 -.5 0 .5 1
Africa 2001-2007***Africa 1991-1995***Africa 1986-1990***Africa 1996-2000***
Southern Europe 1991-1995***Southern Europe 2001-2007***Southern Europe 1996-2000***
Latin America 2001-2007***Latin America 1986-1990***
The Middle East 2001-2007***Latin America 1976-1980***Latin America 1981-1985***
Africa 1981-1985***Latin America 1991-1995***Latin America 1996-2000***
Asia 2001-2007***Africa 1976-1980
Nordic countries 2001-2007***Nordic countries 1976-1980**
Nordic countries <1976*Nordic countries 1981-1985Eastern Europe 2001-2007Eastern Europe 1996-2000
The Middle East 1996-2000**Sweden***
Eastern Europe 1986-1990**Southern Europe 1986-1990*
Africa <1976Eastern Europe 1991-1995***Southern Europe 1981-1985*
Western Europe 2001-2007***Asia 1991-1995***
Nordic countries 1986-1990***Latin America <1976*
Nordic countries 1996-2000***Asia 1996-2000***
Nordic countries 1991-1995***Eastern Europe 1981-1985***
Southern Europe <1976***The Middle East 1991-1995***
The Middle East <1976***Asia <1976***
Asia 1976-1980***Asia 1986-1990***Asia 1981-1985***
Southern Europe 1976-1980***Eastern Europe 1976-1980***
Western Europe 1981-1985***The Middle East 1986-1990***The Middle East 1981-1985***Western Europe 1976-1980***Western Europe 1996-2000***
Western Europe <1976***Eastern Europe <1976***
Western Europe 1991-1995***Western Europe 1986-1990***The Middle East 1976-1980***
Note: *** indicates statistical significance at the 1-per cent level, ** at the 5-per cent level, and * at the 10-per cent level.
Figure B2: Estimated random effect of region of origin and year of immigration for women
21
Appendix C:
Figure CX: QQ-plot of region of residence and time of immigration for men (from Spec. 5)
Figure CX: QQ-plot of local labour market region for men (from Spec. 5)
22
Figure CX: QQ-plot of region of residence and time of immigration for women (from Spec. 5)
Figure CX: QQ-plot of local labour market region for women (from Spec. 5
Copyright © 2022 FDOKUMEN