ethekwini municipality and it's municipal entities annual ...
96
ETHEKWINI MUNICIPALITY AND IT’S MUNICIPAL ENTITIES ANNUAL FINANCIAL STATEMENTS FOR THE YEAR ENDED 30 JUNE 2011 I am responsible for the preparation of these annual financial statements, which are set out on pages 3 to 91, in terms of Section 126(1) of the Municipal Finance Management Act, Act 56 of 2003 and which I have signed on behalf of the Municipality. I certify that the salaries, allowances and benefits of Councillors as disclosed in note 28 of these consolidated annual financial statements are within the upper limits of the framework envisaged in Section 219 of the Constitution, read with the Remuneration of Public Officer Bearers Act and the Minister of Provincial and Local Government’s determination in accordance with this Act. Municipal Manager Durban 27 September 2011
-
Upload
khangminh22 -
Category
Documents
-
view
3 -
download
0
Transcript of ethekwini municipality and it's municipal entities annual ...

ETHEKWINI MUNICIPALITY
AND IT’S MUNICIPAL ENTITIES ANNUAL FINANCIAL STATEMENTS
FOR THE YEAR ENDED 30 JUNE 2011
I am responsible for the preparation of these annual financial statements, which are set out on pages 3 to 91, in terms of Section 126(1) of the Municipal Finance Management Act, Act 56 of 2003 and which I have signed on behalf of the Municipality. I certify that the salaries, allowances and benefits of Councillors as disclosed in note 28 of these consolidated annual financial statements are within the upper limits of the framework envisaged in Section 219 of the Constitution, read with the Remuneration of Public Officer Bearers Act and the Minister of Provincial and Local Government’s determination in accordance with this Act. Municipal Manager Durban 27 September 2011

1
eThekwini Municipality Annual Financial Statements for the year Ended 30 June 2011
INDEX
_____________________________________________________________________________________
The reports and statements below comprise the annual financial statements presented to the councillors:
INDEX PAGE
Statement of Financial Position 3
Statement of Financial Performance 4
Statement of Changes in Net Assets 5
Cash Flow Statement 6
Accounting Policies 7 - 19
Notes to the Annual Financial Statements 20- 66
APPENDIX A: Segmental Analysis of Property, Plant and Equipment 67
APPENDIX B: Segmental Statement of Financial Performance 68
APPENDIX C(1): Actual versus Budget (Revenue and Expenditure) 69-70
APPENDIX C (2) : Actual versus Budget (Acquisition of Property ,Plant and Equipment) 71
APPENDIX D: Disclosures of Grants and Subsidies in terms of the Municipal
Finance Management Act. 72

eThekwini Municipality and its Municipal EntitiesAnnual Financial Statements for the year ended 30 June 2011
INDEX
ABBREVIATIONS
GRAP Generally Recognised Accounting Practice
GAMAP Generally Accepted Municipal Accounting Practice
GAAP Generally Accepted Accounting Practice
MFMA Municipal Finance Management Act
HDF Housing Development Fund
CRR Capital Replacement Reserve
COID Compensation for Occupational Injuries and Diseases
VAT Value Added Taxation
PPE Property Plant and Equipment
SALGA South African Local Government Authority
GEPF Government Employees Pension Fund
NJMP Natal Joint Municipal Pension
DBSA Development Bank of South Africa
IMFO Institute of Municipal Finance Officers
MIG Municipal Infrastructure Grant (previously CMIP)
MEs Municipal Entities
SALA South African Local Authority Pension Fund
INK Inanda Ntuzuma KwaMashu
D' MOSS Durban Metropolitan Open Space System
ABM Area Based Management
DANIDA Danish International Development Agency
2

eThekwini Municipality and its Municipal EntitiesAnnual Financial Statements for the year ended 30 June 2011
MUNICIPAL MANAGER'S REPORT
3

eThekwini Municipality and its Municipal EntitiesAnnual Financial Statements for the year ended 30 June 2011
STATEMENT OF FINANCIAL POSITION AS AT 30 JUNE 2011
Group Municipality
Figures in Rand thousand Note(s) 2011 2010 2011 2010
NET ASSETS AND LIABILITIES
NET ASSETS
Housing development fund 2 278,807 341,225 278,807 341,225
Accumulated Surplus 23,206,847 20,930,275 22,639,874 20,351,358
23,485,654 21,271,500 22,918,681 20,692,583
LIABILITIES
Non-Current Liabilities
Long-term liabilities 3 9,516,575 8,242,350 9,418,040 8,150,386
Non-current provisions 4 255,950 263,376 255,950 263,376
Retirement benefit obligations 5 1,610,806 1,634,468 1,610,806 1,634,468
11,383,331 10,140,194 11,284,796 10,048,230
Current Liabilities
Deposits 6 958,255 807,433 936,733 789,263
Current portion of Retirement benefitobligations
5 137,356 140,874 137,356 140,874
Current provisions 4 35,672 34,195 33,018 31,528
Creditors 7 4,441,190 4,705,860 4,443,134 4,707,289
Unspent conditional grants and receipts 8 664,903 622,668 664,903 622,668
Bank overdraft 9 542,364 379,843 542,364 379,843
Current portion of long-term liabilities 3 693,376 524,974 692,416 524,300
7,473,116 7,215,847 7,449,924 7,195,765
Total Liabilities 18,856,447 17,356,041 18,734,720 17,243,995
Total Net Assets and Liabilities 42,342,101 38,627,541 41,653,401 37,936,578
ASSETS
Non-Current Assets
Biological Assets 47 36 - - -
Property, plant and equipment 10 31,914,387 29,628,170 30,807,310 28,464,851
Intangible assets 11 348,065 330,298 347,001 328,648
Investment properties 12 383,710 403,204 263,305 267,141
Investments in municipal entities 13 - - 674,204 724,499
Investment in joint venture 15 - - 70,610 137,089
Long-term Receivables 17 282,442 276,767 282,442 276,767
Deferred Revenue 7,515 5,204 - -
32,936,155 30,643,643 32,444,872 30,198,995
Current Assets
Inventories 18 216,592 229,225 211,406 224,145
Investments 14 2,450,000 327,044 2,450,000 327,044
Consumer debtors 19 2,573,941 2,219,666 2,569,788 2,219,123
Debtors 20 2,753,845 2,871,426 2,729,149 2,743,461
VAT 22 39,216 351,619 42,182 375,850
Current portion of Long-term Receivables 17 5,962 27,254 5,962 27,254
Call investment deposits 21 742,275 1,528,005 650,504 1,430,751
Bank balances and cash 9 624,115 429,659 549,538 389,955
9,405,946 7,983,898 9,208,529 7,737,583
Total Assets 42,342,101 38,627,541 41,653,401 37,936,578
4

eThekwini Municipality and its Municipal EntitiesAnnual Financial Statements for the year ended 30 June 2011
STATEMENT OF FINANCIAL PERFORMANCE
Group Municipality
Figures in Rand thousand Note(s) 2011 2010 2011 2010
Revenue 18,049,538 17,130,532 18,010,316 17,082,141
Property rates 23 4,056,102 3,971,889 4,073,638 3,979,179
Property rates - penalties imposed andcollection
81,854 150,210 81,854 150,210
Service charges 24 9,891,652 7,862,993 9,917,959 7,863,974
Rental of facilities and equipment 435,775 397,435 355,545 343,343
Fines 110,209 80,143 110,209 80,143
Licences and permits 29,640 28,109 29,640 28,109
Grants and subsidies 25 2,590,929 3,733,289 2,590,929 3,733,257
Public contributions and donations 12,711 34,516 9,876 31,978
Housing: Development Income 840,666 871,948 840,666 871,948
Other income 2,063,715 1,849,846 1,870,235 1,664,689
Other income 26 1,744,129 1,428,218 1,557,141 1,260,844
Interest earned - external investments 133,666 201,693 125,809 187,933
Interest earned - outstanding debtors 85,955 106,134 85,955 101,913
Gains on disposal of property, plant andequipment
48,851 78,943 48,655 78,943
Reversal of Impairment - PPE 3,576 - 3,576 -
Reversal of Loss on Impairment of Loans - - 1,561 198
Fair value adjustments 27 47,538 34,858 47,538 34,858
Total Revenue 20,113,253 18,980,378 19,880,551 18,746,830
Expenditure
Employee related costs 28 4,924,241 4,633,632 4,822,931 4,540,518
Remuneration of councillors 29 77,919 73,969 77,919 73,969
Bad debts 324,980 574,189 324,315 572,984
Depreciation - Property, Plant andEquipment
10 1,395,536 1,160,212 1,326,977 1,094,060
Amortisation of intangible assets 11 98,345 95,079 97,043 94,132
Repairs and maintenance 1,230,305 1,982,267 1,215,007 1,965,682
Finance costs 30 692,195 484,290 687,345 480,942
Bulk purchases 31 5,495,517 4,531,944 5,495,517 4,531,944
Contracted Services 889,158 830,311 874,755 817,435
Grants and subsidies paid 32 132,121 139,488 142,621 149,977
Housing: Development Expenditure 840,666 871,948 840,666 871,948
General expenses 33 1,792,680 1,648,601 1,688,214 1,526,998
Loss on disposal of property, plant andequipment
653 56,050 105 56,000
Depreciation - Investment Properties 12 4,325 3,932 1,805 1,829
Loss on Impairment of Investment inMunicipal Entity
- - 62,296 2,889
Impairment Loss - Property, Plant andEquipment
458 46,996 458 46,488
Fair value adjustment 27 - 65,848 - 65,848
Total Expenditure 17,899,099 17,198,756 17,657,974 16,893,643
Operating surplus 2,214,154 1,781,622 2,222,577 1,853,187
Share of Income from Joint Venture - - 3,521 5,238
Surplus for the year 2,214,154 1,781,622 2,226,098 1,858,425
Refer to Appendix C for comparison with the approved budget
5
eThekwini Municipality and its Municipal EntitiesAnnual Financial Statements for the year ended 30 June 2011
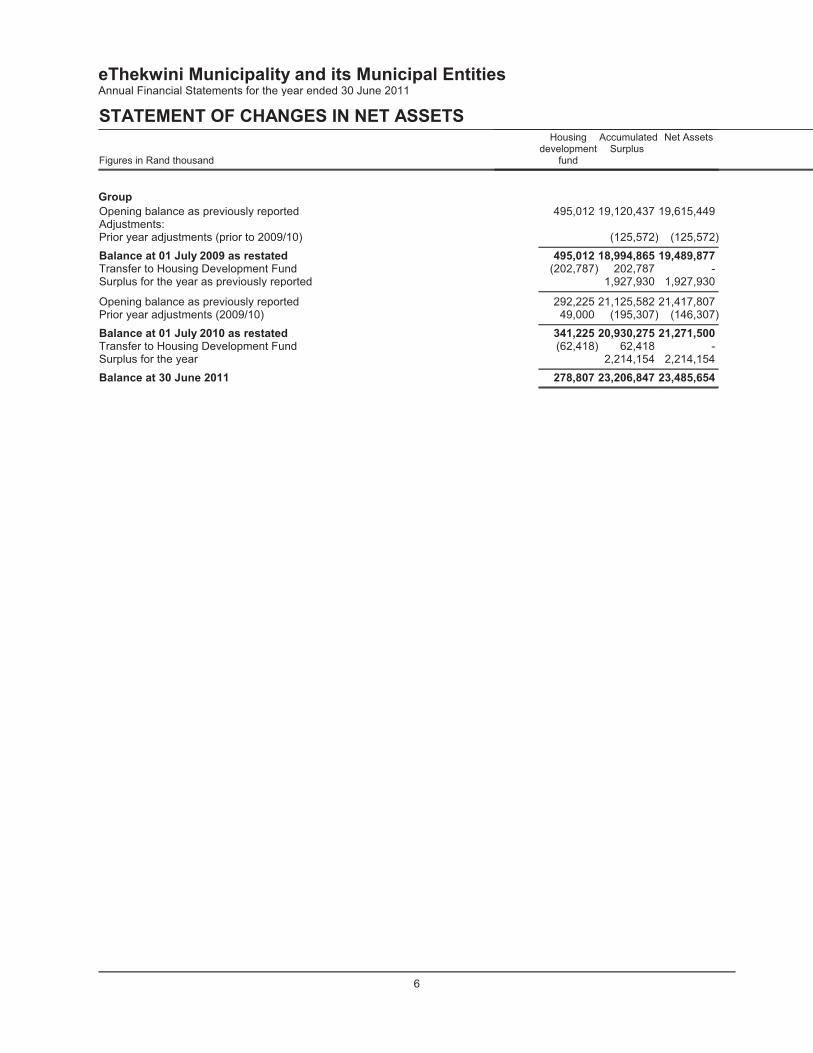
STATEMENT OF CHANGES IN NET ASSETS
Figures in Rand thousand
Housingdevelopment
fund
AccumulatedSurplus
Net Assets
Group
Opening balance as previously reported 495,012 19,120,437 19,615,449Adjustments:Prior year adjustments (prior to 2009/10) (125,572) (125,572)
Balance at 01 July 2009 as restated 495,012 18,994,865 19,489,877Transfer to Housing Development Fund (202,787) 202,787 -Surplus for the year as previously reported 1,927,930 1,927,930
Opening balance as previously reported 292,225 21,125,582 21,417,807Prior year adjustments (2009/10) 49,000 (195,307) (146,307)
Balance at 01 July 2010 as restated 341,225 20,930,275 21,271,500Transfer to Housing Development Fund (62,418) 62,418 -Surplus for the year 2,214,154 2,214,154
Balance at 30 June 2011 278,807 23,206,847 23,485,654
6

eThekwini Municipality and its Municipal EntitiesAnnual Financial Statements for the year ended 30 June 2011
STATEMENT OF CHANGES IN NET ASSETS
Figures in Rand thousand
Housingdevelopment
fund
AccumulatedSurplus
Net Assets
Municipality
Opening balance as previously reported 495,012 18,452,171 18,947,183Adjustments:Prior year adjustments (prior to 2009/10) (113,026) (113,026)
Balance at 01 July 2009 as restated 495,012 18,339,145 18,834,157Transfer to Housing Development Fund (202,787) 202,787 -Surplus for the year as previously reported 2,002,211 2,002,211
Opening balance 292,225 20,544,143 20,836,368Adjustments:Prior year adjustments (2009/10) 49,000 (192,785) (143,785)
Balance at 01 July 2010 as restated 341,225 20,351,358 20,692,583Transfer to Housing Development Fund (62,418) 62,418 -Surplus for the year 2,226,098 2,226,098
Balance at 30 June 2011 278,807 22,639,874 22,918,681
7

eThekwini Municipality and its Municipal EntitiesAnnual Financial Statements for the year ended 30 June 2011
Cash Flow Statement
Group Municipality
Figures in Rand thousand Note(s) 2011 2010 2011 2010
Cash flows from operating activities
Cash receipts from ratepayers, governmentand other
19,221,144 17,317,450 19,093,283 16,963,998
Cash paid to suppliers and employees (15,151,327) (14,573,483) (15,102,834) (14,247,929)
Cash generated from operations 34 4,069,817 2,743,967 3,990,449 2,716,069
Interest income 219,621 303,606 211,764 289,846
Finance Costs (692,195) (484,290) (687,345) (480,942)
Net cash from operating activities 3,597,243 2,563,283 3,514,868 2,524,973
Cash flows from investing activities
Purchase of property, plant and equipment 10 (3,680,621) (6,472,780) (3,667,625) (6,436,730)
Proceeds on disposal of property, plant andequipment, Investment properties andIntangible assets
10,11&12 92,568 91,283 79,105 103,521
Increase in investment properties 12 - (31,617) - -
Purchase of other intangible assets 11 (109,353) (67,289) (108,637) (66,311)
Increase in current investments (2,122,956) 2,076,749 (2,122,956) 2,111,607
Increase in non current investments - 323,179 - 288,321
Purchase of biological assets 47 (36) - - -
Increase in Loans to Municipal Entities - - - 198
(Increase) / decrease in non-currentreceivables
26,730 30,419 26,730 21,685
Increase in Investment in Municipal Entities - - (10,440) (19,999)
Decrease in Joint Venture loan account - - 70,000 25,000
Net cash from investing activities (5,793,668) (4,050,056) (5,733,823) (3,972,708)
Cash flows from financing activities
Loans repaid (564,194) (290,581) (564,230) (295,635)
New loans raised 2,006,824 2,900,373 2,000,000 2,900,000
Net cash from financing activities 1,442,630 2,609,792 1,435,770 2,604,365
Total cash movement for the year (753,795) 1,123,019 (783,185) 1,156,630
Cash at the beginning of the year 1,577,821 454,802 1,440,863 284,233
Total cash at end of the year 9 824,026 1,577,821 657,678 1,440,863
8

eThekwini Municipality and its Municipal EntitiesAnnual Financial Statements for the year ended 30 June 2011
ACCOUNTING POLICIES
1. Basis of preparation
The annual financial statements have been prepared in accordance with the Standards of Generally RecognisedAccounting Practices (GRAP). The annual financial statements have been prepared on the historical cost basis, andincorporate the principal accounting policies set out below.
Entities are required to apply the Standards of GRAP where the Minister has determined the effective date. TheMinister has determined the effective date for the following Standards of GRAP:
GRAP 1 Presentation of Financial StatementsGRAP 2 Cash Flow StatementsGRAP 3 Accounting Policies, Changes in Accounting Estimates and ErrorsGRAP 4 The Effects of Changes in Foreign Exchange RatesGRAP 5 Borrowing CostsGRAP 6 Consolidated and Separate Financial StatementsGRAP 7 Investments in AssociatesGRAP 8 Investment in Joint VenturesGRAP 9 Revenue from Exchange TransactionsGRAP 10 Financial Reporting in Hyperinflationary EconomiesGRAP 11 Construction ContractsGRAP 12 InventoriesGRAP 13 LeasesGRAP 14 Events After the Reporting DateGRAP 16 Investment PropertyGRAP 17 Property, Plant and Equipment GRAP 19 Provisions, Contingent Liabilities and Contingent AssetsGRAP 100 Non-current Assets Held for Sale and Discontinued OperationsGRAP 101 AgricultureGRAP 102 Intangible Assets
Accounting policies for material transactions, events or conditions not covered by the above GRAP Standards havebeen developed in accordance with paragraphs 7, 11 and 12 of GRAP 3. These accounting policies and the applicabledisclosures have been based on the South African Statements of Generally Accepted Accounting Practices (SAGAAP) including any interpretations of such Statements issued by the Accounting Practices Board.
Directives issued and effective:
Directive 1: Repeal of Existing Transitional Provisions in, and Consequential Amendments to, Standards of GRAPDirective 2: Transitional Provisions for the Adoption of Standards of GRAP by Public Entities, Municipal Entities and
Constitutional Institutions.Directive 3: Transitional Provisions for the Adoption of Standards of GRAP by High Capacity Municipalities.Directive 4: Transitional Provisions for the Adoption of Standards of GRAP by Medium and Low Capacity
Municipalities. Directive 5: Determining the GRAP reporting framework.Directive 7: The Application of Deemed Cost on the Adoption of Standards of GRAP.
Interpretations of the Standards of GRAPIGRAP Applying the Probability Test on Initial Recognition of Exchange Revenue.
Approved guidelines of Standards of GRAP:
Guide 1 Guideline on Accounting for Public Private Partnerships
Effective accrual based IPSAS's considering the provisions in paragraphs .15 to .19 of the Directive:
IPSAS 20 Related Party Disclosures
Effective IFRS's and IFRIC's that are applied considering the provisions in paragraphs .20 to .26 of the Directive:
IFRS 3 (AC 140) Business CombinationsIFRS 4 (AC 141) Insurance ContractsIFRS 6 (AC 143) Exploration for and Evaluation of Mineral ResourcesIIAS 12 (AC 102) Income Taxes
9

eThekwini Municipality and its Municipal EntitiesAnnual Financial Statements for the year ended 30 June 2011
ACCOUNTING POLICIES
ISIC - 21 (AC 421) Income Taxes - Recovery of Revalued Non-Depreciable AssetsSIC - 25 (AC 425) Income Taxes - Changes in the Tax Status of an Entity or its ShareholdersSIC - 29 (AC 429) Service Concession Arrangements - DisclosuresIFRIC 4 (AC 437) Determining whether an Arrangement contains a LeaseIFRIC 9 (AC 442) Reassessment of Embedded DerivativesIFRIC 12 (AC 445) Service Concession ArrangementsIFRIC 13 (AC 446) Customer Loyalty ProgrammesIFRIC 15 (AC 448) Agreements for the Construction of Real EstateIFRIC 17 (AC 450) Distributions of Non-cash Assets to OwnersIFRIC 18 (AC 451) Transfer of Assets from Customers
Standards of GRAP approved but, for which the Minister of Finance has not yet determined an effective date, thathave been early adopted by the Municipality:
GRAP 21 Impairment of Non-cash-generating AssetsGRAP 25 Employee BenefitsGRAP 26 Impairment of Cash-generating AssetsGRAP 104 Financial InstrumentsGRAP 25 Employee Benefits
Standard of GRAP used to interpret the requirements of other Standards of GRAP:GRAP 24 Presentation of Budget Information in Financial Statements
A summary of the significant accounting policies are disclosed below.
These accounting policies are consistent with the previous year, unless otherwise stated.
1.1 Basis of consolidation
The consolidated annual financial statements incorporate the financial statements of the Municipality and MunicipalEntities controlled by the Municipality, Joint Venture and the Transport Authority.
On acquisition, the assets and liabilities of a entity are measured at their fair values at the date of acquisition. Theinterests of outside shareholders are stated at the minority’s proportion of the fair values of the assets and liabilitiesrecognised.
The results of the entities acquired or disposed during the year are included in the consolidated Statement of FinancialPerformance from the effective date of acquisition or up to the effective date of disposal, as appropriate.
Where necessary, adjustments are made to the annual financial statements of municipal entities to bring theaccounting policies used into line with those used by the Municipality and other entities included in the Group.
All significant transactions and balances between members of the Group are eliminated on consolidation.
1.2 Presentation of currency
These annual financial statements are presented in South African Rand, which is the functional currency of theMunicipality and its entities.
10

eThekwini Municipality and its Municipal EntitiesAnnual Financial Statements for the year ended 30 June 2011
ACCOUNTING POLICIES
1.3 Going concern assumption
These annual financial statements have been prepared on a going concern basis.
1.4 Standards, amendments to standards and interpretations issued but not yet effective
GRAP 18: Segment Reporting – issued March 2005:
Compliance with this standard would have had an effect on the presentation only. Financial information would havebeen reported by segments. The disclosure of this information will assist users of the financial statements to betterunderstand the entity’s past performance and to identify the resources allocated to support the major activities of theentity.
GRAP 23: Revenue from Non-Exchange Transactions (Taxes and Transfers) – issued February 2008: Non-exchange transactions in which the entity receives services without directly giving approximately equal value inexchange, has not been accounted for as revenue. These transactions are minimal and are considered immaterial.Refer to paragraph 1.18.2 for compliance in current year.
GRAP 24: Presentation of Budget Information in Financial Statements – issued November 2007:
Compliance with this standard would have had an effect on the presentation only. The budget information is currentlydisclosed in the appendices.
GRAP 103: Heritage Assets – issued July 2008:
Compliance with this standard will not have an impact on the current financial information as the recognition andmeasurement requirements of the standard have already been adopted.
1.5 Housing Development Fund
The Housing Development Fund was established in terms of the Housing Act, (Act No. 107 of 1997). Loans fromnational and provincial government used to finance housing selling schemes undertaken by the Municipality wereextinguished on 1 April 1998 and transferred to a Housing Development Fund. Housing selling schemes, bothcomplete and in progress as at 1 April 1998, were also transferred to the Housing Development Fund. In terms of theHousing Act, all proceeds from housing developments, which include rental income and sales of houses, must be paidinto the Housing Development Fund. Monies standing to the credit of the Housing Development Fund can be usedonly to finance housing developments within the municipal area subject to the approval of the Provincial MECresponsible for housing.
11

eThekwini Municipality and its Municipal EntitiesAnnual Financial Statements for the year ended 30 June 2011
ACCOUNTING POLICIES
1.6 Investment properties
Initial Recognition
Investment property includes property (land or a building, or part of a building, or both land or buildings held under afinance lease) held to earn rentals and/or for capital appreciation, rather than held to meet service delivery objectives,the production or supply of goods or services, or the sale of an asset in the ordinary course of operations.
At initial recognition, the Municipality measures investment property at cost including transaction costs once it meetsthe definition of investment property. However, where an investment property was acquired through a non-exchangetransaction (i.e. where it acquired the investment property for no or a nominal value), its cost is its fair value as at thedate of acquisition.
The cost of self-constructed investment property is the cost at date of completion.
Derecognition
Investment property is derecognised on disposal or when the investment property is permanently withdrawn from useand no future economic benefits or service potential are expected from its disposal. Gains or losses arising from theretirement or disposal of investment property shall be determined as the difference between the net disposal proceedsand the carrying amount of the asset and shall be recognised in surplus or deficit in the period of the retirement ordisposal.
Compensation from third parties for investment property that was impaired, lost or given up shall be recognised insurplus or deficit when the compensation becomes receivable.
Subsequent Measurement
Investment property is measured using the cost model. Under the cost model, investment property is carried at costless any accumulated depreciation and any accumulated impairment losses. Transfers to or from investment propertyare made when and only when there is a change in use.
Depreciation is calculated on the depreciable amount, using the straight-line method over the estimated useful lives ofthe assets. Components of assets that are significant in relation to the whole asset and that have different useful livesare depreciated separately. The annual depreciation rates are based on the following estimated average asset lives:
Item Useful lifeProperty - land indefiniteProperty - buildings (2009: 30 years) 10 - 80 years
12

eThekwini Municipality and its Municipal EntitiesAnnual Financial Statements for the year ended 30 June 2011
ACCOUNTING POLICIES
1.7 Property, plant and equipment
Initial Recognition
Property, plant and equipment are stated at cost less accumulated depreciation. Heritage assets, which are culturallysignificant resources and which are shown at cost, are not depreciated owing to the uncertainty regarding theirestimated useful lives. Land is not depreciated as it is deemed to have an indefinite life.
When significant components of an item of property, plant and equipment have different useful lives, they areaccounted for as separate items (major components) of property, plant and equipment.
Where an asset is acquired by the Municipality for no or nominal consideration (i.e. a non-exchange transaction), thecost is deemed to be equal to the fair value of that asset on the date acquired.
Subsequent Measurement
Subsequent to initial recognition, items of property, plant and equipment are measured at cost less accumulateddepreciation and impairment losses. Land is not depreciated as it is deemed to have an indefinite useful life.
Where the Municipality replaces parts of an asset, it derecognises the part of the asset being replaced and capitalisesthe new component. Subsequent expenditure on an asset is capitalised when it increases the capacity or futureeconomic benefits associated with the asset.
Depreciation and Impairment:
Depreciation is calculated on cost, using the straight-line method over the estimated useful lives of the assets.Depreciation is calculated as soon as the asset becomes available for use. The annual depreciation rates are basedon the following estimated asset lives:-
Details YearsInfrastructure� Rivers and Coastal Engineering 20 - 80 years� Roads and Motorways 20 - 80 years� Economic Development 20 years� Traffic Equipment 10 - 80 years� Stormwater Drainage 20 - 80 years� Airport Infrastructure 15 - 80 years� Solid Waste 3 - 30 years� Water and Sanitation 20 - 80 years� Major Substations: Buildings 30 - 50 years� Transformers and Related Equipment 30 - 45 years� Mains 30 - 55 years� Street Lighting 20 - 30 years� Conventional and Prepaid Metering 15 - 25 yearsCommunity� Buildings 20 - 80 years� Recreational Facilities 10 - 80 yearsOther property, plant and equipment� Buildings 20 - 80 years� Markets and Informal Markets 15 - 30 years� Fire Engines 20 years� Landfill Sites 3 - 30 years� Car Parks 15 years� Fencing 20 years� Lifts (2010: 10 years) 20 years� Building Improvements 10 years� Heavy and Mobile Plant 7 - 10 years� Furniture and fittings 7 years� Vehicles 5 years� Bins and containers 5 years� Plant – General 5 years� Security Systems 5 - 15 years� Office equipment 5 - 7 years� Airconditioning 5 - 15 years� Public Address Systems 15 years� Turnstiles 15 years
13

eThekwini Municipality and its Municipal EntitiesAnnual Financial Statements for the year ended 30 June 2011
ACCOUNTING POLICIES
1.7 Property, plant and equipment (continued)� Electrical 20 years� Mechanical 20 years� Hostels 20 - 80 years� Library Books 5 - 10 years� Other items of Plant and Equipment (2010: 5 - 7 years) 3 - 5 years
All assets are considered to have a nil residual value.
In the prior years the acquisition costs of library books were expensed. In the current year the Municipality changed itspolicy. Library books are capitalized on acquisition in the current year. Comparative information has been restated toreflect the retrospective application of the change in accounting policy.
Derecognition:Items of Property, Plant and Equipment are derecognised when the asset is disposed of or when there are no furthereconomic benefits or service potential expected from the use of the asset. The gain or loss arising on the disposal orretirement of an item of property, plant and equipment is determined as the difference between the sales proceedsand the carrying value and is recognised in the Statement of Financial Performance.
The Municipality has an obligation to rehabilitate its landfill sites in terms of its licence stipulations. Provision is madefor this obligation in accordance with the Municipality’s accounting policy on non-current provisions – see AccountingPolicy 1.16 on Provisions.
The residual value, the useful life of an asset and the depreciation method is reviewed annually and any changes arerecognized as a change in accounting estimate in the Statement of Financial Performance.
The Municipality tests for impairment where there is an indication that an asset may be impaired. An assessment ofwhether there is an indication of possible impairment is done at each reporting date. Where the carrying amount of anitem of property, plant and equipment is greater than the estimated recoverable amount (or recoverable serviceamount), it is written down immediately to its recoverable amount (or recoverable service amount) and an impairmentloss is charged to the Statement of Financial Performance.
1.8 Intangible assets
Initial Recognition.
Intangible assets are initially recognised at cost and comprise of software and servitudes.
Where an intangible asset is acquired by the municipality for no or nominal consideration (i.e. a non-exchangetransaction), the cost is deemed to be equal to the fair value of that asset on the date acquired.
Internally generated intangible assets are subject to strict recognition criteria before they are capitalised. Researchexpenditure is never capitalised, while development expenditure is only capitalised to the extent that:� the municipality intends to complete the intangible asset for use or sale.� it is technically feasible to complete the intangible asset. � the municipality has the resources to complete the project. � it is probable that the municipality will receive future economic benefits or service potential.
Computer software is capitalised to computer equipment where it forms an integral part of computer equipment.
Servitudes are classified as intangible assets. Rights consist of servitudes. Rights are not amortised as they have anindefinite useful life. A servitude is granted for an indefinite period.
Subsequent Measurement
Intangible assets are subsequently carried at cost less accumulated amortisation and impairments. The cost of anintangible asset is amortised over the useful life where that useful life is finite. Where the useful life is indefinite, theasset is not amortised but is subject to an annual impairment test. Expenditure on an intangible asset is recognisedas an expense when it is incurred unless it forms part of the cost of an intangible asset that meets the recognitioncriteria. Residual value of intangible assets is estimated to be nil.
14

eThekwini Municipality and its Municipal EntitiesAnnual Financial Statements for the year ended 30 June 2011
ACCOUNTING POLICIES
1.8 Intangible assets (continued)Amortisation and Impairment
Amortisation is charged so as to write off the cost of intangible assets over their estimated useful lives, using thestraight line method as follows :-.
Computer Software 5 - 10 years
The amortisation period and the amortisation method for an intangible asset with a finite useful life are reviewed ateach reporting date and any changes are recognised as a change in accounting estimate in the Statement of FinancialPerformance. The municipality tests intangible assets with finite useful lives for impairment where there is anindication that an asset may be impaired. An assessment of whether there is an indication of possible impairment isdone at each reporting date. Where the carrying amount of an item of an intangible asset is greater than the estimatedrecoverable amount (or recoverable service amount), it is written down immediately to its recoverable amount (orrecoverable service amount) and an impairment loss is charged to the Statement of Financial Performance.
Derecognition:
Intangible assets are derecognised when the asset is disposed of or when there are no further economic benefits orservice potential expected from the use of the asset. The gain or loss arising on the disposal or retirement of anintangible asset is determined as the difference between the sales proceeds and the carrying value and is recognisedin the Statement of Financial Performance.
1.9 Impairment of Cash-generating and Non-cash-generating assets
The municipality assesses at each reporting date whether there is any indication that an asset may be impaired. Ifany such indication exists, the municipality estimates the recoverable amount of the asset.
1.10 Financial instruments
Initial recognition
Financial instruments are initially recognised at fair value.
Subsequent Measurement
Financial Assets are categorised according to their nature as either financial assets at fair value through profit or loss,held-to maturity, loans and receivables, or available for sale. Financial liabilities are categorised as either at fair valuethrough profit or loss or financial liabilities carried at amortised cost (“other”). The subsequent measurement offinancial assets and liabilities depends on this categorisation and, in the absence of an approved GRAP Standard onFinancial Instruments, is in accordance with IAS 39.
Loans to (from) municipal entities
These include loans to municipal entities and recognised at cost.
An impairment loss is recognised in profit or loss when there is objective evidence that it is impaired. The impairmentis measured as the difference between the investment’s carrying amount and the present value of estimated futurecash flows discounted at the effective interest rate computed at initial recognition.
Debtors
Debtors are recognised at fair value and subsequently measured at amortized cost using the effective interestmethod, less provision for impairment. A provision for impairment of debtors is established when there is objectiveevidence that the municipality will not be able to collect all amounts due according to the original terms of the debtors.The amount of the provision is the difference between the asset’s carrying amount and the present value of estimatedfuture cash flows, discounted at the effective interest rate. Impairment losses are recognised in the Statement ofFinancial Performance.
An estimate is made for doubtful debts based on the categorisation of debts and a review of past trends in collectionrates applied to all outstanding amounts at year-end.
15

eThekwini Municipality and its Municipal EntitiesAnnual Financial Statements for the year ended 30 June 2011
ACCOUNTING POLICIES
1.10 Financial instruments (continued)
Creditors
Trade payables are initially measured at fair value, and are subsequently measured at amortised cost, using theeffective interest rate method.
Cash and cash equivalents
These are initially and subsequently recorded at fair value.
For cash flow purposes cash and cash equivalents includes cash on hand, deposits held at call with banks, othershort-term highly liquid investments with original maturities of three months or less, and bank overdrafts.
Bank overdrafts are recorded based on the facility utilised. Finance charges on bank overdraft are expensed asincurred.
Borrowings and other financial liabilities
Borrowings are recognised initially at fair value, net of transaction costs incurred. Borrowings are subsequently statedat amortised cost; any difference between the proceeds (net of transaction costs) and the redemption value isrecognised in the statement of financial performance over the period of the borrowings using the effective interestmethod.
Long term borrowings are non-derivative financial loans and the Municipality does not hold financial loans for tradingpurposes. Long term borrowings are utilised solely for funding capital projects and the book value is disclosed atamortised cost.
Other financial liabilities are carried at amortised cost.
Loans and receivables
Loans and receivables are measured initially and subsequently at fair value, gains and losses arising from changes infair value are included in profit or loss for the period.
Loans and receivables are non-derivative financial assets with fixed or determinable payments that are not quoted inan active market and with no intention of trading. They are included in current assets, except for maturities greaterthan 12 months after the balance sheet date. These are classified as non-current assets. Loans and receivables areincluded in trade and other receivables in the Statement of Financial Position.
1.11 Investments
Investments are measured initially and subsequently at fair value, gains and losses arising from changes in fair valueare included in profit or loss for the period.
The Municipality classifies its investments in the following categories: loans and receivables and held-to-maturityinvestments. The classification depends on the purpose for which the investments were acquired. Managementdetermines the classification of its investments at initial recognition and re-evaluates this designation at everyreporting date. Investments held for less than 12 months are not fair-valued.
1.11.1 Held-to-maturity investments
Held-to-maturity investments are non-derivative financial assets with fixed or determinable payments and fixedmaturities that the municipality has the positive intention and ability to hold to maturity.
In the current year investments are carried at cost which represents the fair value of the investments as allinvestments have a maturity date less than 12 months.
On disposal of an investment, the difference between the net disposal proceeds and the carrying amount is chargedor credited to the Statement of Financial Performance.
16

eThekwini Municipality and its Municipal EntitiesAnnual Financial Statements for the year ended 30 June 2011
ACCOUNTING POLICIES
1.12 Investments in municipal entities
Group annual financial statements
The group annual financial statements include those of the municipality and its municipal entities. The results of themunicipal entities are included from the effective date of acquisition.
On acquisition the group recognises the municipal entities’s identifiable assets, liabilities and contingent liabilities atfair value, except for assets classified as held-for-sale, which are recognised at fair value less costs to sell.
Municipal annual financial statements
In the municipality’s separate annual financial statements, investments in municipal entities are carried at cost lessany accumulated impairment.
Investments in municipal entities under the ownership control of the Municipality are carried at cost. Separateconsolidated financial statements are prepared to account for the Municipality’s share of net assets and postacquisition results of these investments.
1.13 Investment in joint venture
Group annual financial statements
An investment in a joint venture is accounted for using the proportionate consolidation method, except when the assetis classified as held-for-sale. Under the proportionate consolidation method the group’s share of each of the assets,liabilities, income and expenses of the investment is combined line by line with similar items in the group annualfinancial statements. The use of proportionate consolidation is discontinued from the date on which it ceases to havejoint control over a jointly controlled entity.
Municipal annual financial statements
An investment in a joint venture is carried at cost less any accumulated impairment.
The Municipality's share of profits or losses, resulting from operations of the joint venture, is recognised on the accrualbasis and is capitalised to the cost of the investment.
1.14 Inventories
Initial Recognition
Inventories are initially recognized at cost. Cost generally refers to the purchase price, plus taxes, transport costs andany other costs in bringing the inventories to their current location and condition. Where inventory is manufactured,constructed or produced, the cost includes the cost of labour, materials and overheads used during the manufacturingprocess. .
Subsequent Measurement
Consumable stores, maintenance materials and water stock are valued at the lower of cost and net realisable value.In general, the basis of determining cost is the weighted average method.
Unsold properties are valued at the lower of cost and net realisable value on a weighted average cost basis. Directcosts are accumulated for each separately identifiable development. Costs also include a proportion of overheadcosts.
Redundant and slow-moving inventories are identified and written down from cost to net realisable value with regard totheir estimated economic or realisable values.
17

eThekwini Municipality and its Municipal EntitiesAnnual Financial Statements for the year ended 30 June 2011
ACCOUNTING POLICIES
1.15 Borrowing costs
Borrowing costs that are directly attributable to the acquisition, construction or production of qualifying assets arecapitalised to the cost of that asset unless it is inappropriate to do so. The Municipality ceases the capitalisation ofborrowing costs when substantially all the activities to prepare the asset for its intended use or sale are complete. It isconsidered inappropriate to capitalise borrowing costs where the link between the funds borrowed and the capitalasset acquired cannot be adequately established. Borrowing costs incurred other than on qualifying assets arerecognised as an expense in surplus or deficit when incurred.
1.16 Provisions
Provisions are recognised when:� the municipality has a present or constructive obligation as a result of a past event;� it is probable that an outflow of resources embodying economic benefits will be required to settle the obligation;
and� a reliable estimate can be made of the obligation.
Provisions are reviewed at reporting date and adjusted to reflect the current best estimate.
Where the effect is material, non-current provisions are discounted to their present value using a pre-tax discount ratethat reflects the market’s current assessment of the time value of money, adjusted for risks specific to the liability (forexample in the case of obligations for the rehabilitation of land).
1.17 Retirement Benefits
1.17.1 Defined contribution plans
The municipality provides retirement benefits for its employees and councillors. The contributions to fund obligationsfor the payment of retirement benefits are charged against revenue in the year they become payable. The definedbenefit funds, which are administered on a provincial basis, are actuarially valued triennially on the projected unitcredit method basis. Deficits identified are recognised as a liability and are recovered through lump sum payments orincreased future contributions on a proportional basis to all participating municipalities.
1.17.2 Pension obligations
The municipality and its employees contribute to 8 different Pension Funds, of which 2 (Durban Pension Fund and theKZN Pension Fund) cater for more than 95% of staff.
The Durban Pension Fund is a defined benefit fund and is actuarially valued on an interim basis each year with astatutory valuation undertaken every three years.
The KZN Municipal Pension Fund is a defined contribution fund. The contributions to fund obligations for the paymentof retirement benefits are charged against income in the year they become payable.
Natal Joint Superannuation & Retirement Funds and Government Employee Pension Fund are defined benefit funds.
The Natal Joint Provident Fund, Multi Linked and South African Local Authority are defined contribution funds.
The schemes are funded through payments to insurance companies or trustee-administered funds, determined byperiodic actuarial calculations.
The Municipality has both defined benefit and defined contribution plans.A defined benefit plan is a pension plan that defines an amount of pension benefit that an employee will receive onretirement, usually dependent on one or more factors such as age, years of service and compensation.A defined contribution plan is a pension plan under which the Municipality pays fixed contributions into a separateentity. The Municipality has no legal or constructive obligations to pay further contributions if the fund does not holdsufficient assets to pay all employees the benefits relating to employee service in the current and prior periods.
18

eThekwini Municipality and its Municipal EntitiesAnnual Financial Statements for the year ended 30 June 2011
ACCOUNTING POLICIES
1.17 Retirement Benefits (continued)The liability/asset recognized in the statement of financial position in respect of defined benefit pension plans is equalto the present value of the defined benefit obligation at the balance sheet date less the fair value of plan assets,together with adjustments for unrecognized actuarial gains or losses and past service costs. The defined benefitobligation is calculated annually by independent actuaries using the projected unit credit method. The present value ofthe defined benefit obligation is determined by discounting the estimated future cash outflows using interest rates ofhigh-quality corporate bonds that are denominated in the currency in which the benefits will be paid, and that haveterms to maturity approximating to the terms of the related pension liability.
Cumulative actuarial gains and losses arising from experience adjustments and changes in actuarial assumptions inexcess of the greater of 10% of the value of plan assets or 10% of the defined benefit obligations are spread toincome over the employees’ expected average remaining working lives. Past-service costs are recognisedimmediately in income.
For defined contribution plans, the Municipality pays contributions to publicly or privately administered pensioninsurance plans on a mandatory, contractual or voluntary basis. The Municipality has no further payment obligationsonce the contributions have been paid. The contributions are recognized as employee benefit expense when they are due. Prepaid contributions are recognised as an asset to the extent that a cash refund or a reduction in the futurepayments is available.
Durban Marine Theme Park (Proprietory) Limited reimburses uShaka Management (Pty) Ltd for the cost of theProvident Fund maintained by it for staff who work at uShaka Marine World. All such staff are obliged to be membersof the Provident Fund which is governed by the Pension Funds Act of 1956. Contributions are based on a percentageof the payroll and charged to the Statement of Financial Performance in the year to which they relate.
All staff of the I.C.C. Durban (Proprietory) Limited are members of the I.C.C. Pension Fund which is a definedcontribution fund.
1.17.3 Other post-employment benefit obligations
The municipality provides post-retirement healthcare benefits to their retirees. The entitlement to these benefits isusually conditional on the employee remaining in service up to retirement age and the completion of a minimumservice period. The expected costs of these benefits are accrued over the period of employment using an accountingmethodology similar to that used for defined benefit pension plans. Actuarial gains and losses arising from experienceadjustments, and changes in actuarial assumptions, are charged or credited to income in the year that they arise.
1.18 Revenue
Revenue comprises of the consideration received or receivable for the sale of goods and services in the ordinarycourse of the Municipality's activities. Revenue is shown net of value added tax, estimated returns, rebates anddiscounts and after eliminated revenue within departments of the Municipality. Revenue is recognised as follows:
Revenue from Exchange Transactions
Service charges relating to electricity and water are based on consumption. Meters are read on a monthly basis andare recognised as revenue when invoiced.
Provisional estimates of consumption are made monthly when meter readings have not been performed. Theprovisional estimates of consumption are recognised as revenue when invoiced. Adjustments to provisional estimatesof consumption are made in the invoicing period in which meters have been read. These adjustments are recognisedas revenue in the invoicing period. Revenue from the sale of electricity prepaid meter cards are recognised at thepoint of sale.
Service charges relating to refuse removal are recognised on a monthly basis by applying the approved tariff to eachproperty based on category of property and the property value.
Service charges from sewerage and sanitation are based on water consumption and are levied monthly.
Interest and rentals are recognised on a time proportion basis.
Dividends are recognised on the date that the Municipality becomes entitled to receive the dividend.
Revenue arising from the application of the approved tariff of charges is recognised when the relevant service is
19

eThekwini Municipality and its Municipal EntitiesAnnual Financial Statements for the year ended 30 June 2011
ACCOUNTING POLICIES
1.18 Revenue (continued)rendered by applying the relevant gazetted tariff. This includes the issuing of licences and permits.
Income for agency services is recognised on a monthly basis once the income collected on behalf of agents has beenquantified. The income recognised is in terms of the agency agreement.
Finance income from the sale of housing by way of instalment sales agreements or finance leases is recognised on atime proportion basis.
Revenue from the sale of goods is recognised when the risk is passed to the consumer.
Revenue from public contributions is recognised when all conditions associated with the contribution have been met.Where public contributions have been received but the municipality has not met the condition, a liability is recognised.
Durban Marine Theme Park (Proprietary) Limited recognises revenue from entrance parking fees and salesimmediately upon receipt. All other revenue is recognised as it accrues.All other revenue is recognised as it accrues.Revenue from non-exchange transactions
Revenue from property rates is recognised when the legal entitlement to this revenue arises. Collection charges arerecognised when such amounts are legally enforceable. Penalty interest on unpaid rates is recognised on a timeproportion basis.
Fines constitute both spot fines and summonses. Revenue from spot fines and summonses is recognised whenpayment is received. There is uncertainty regarding recoverability of outstanding fines and summonses. Spot fines areusually not given directly to an offender. Further legal processes have to be undertaken before the spot fine isenforceable. In respect of summonses the Public Prosecutor can decide whether to waive the fine, reduce it orprosecute for non-payment by the offender.
Donations are recognised on a cash receipt basis or where the donation is in the form of property, plant andequipment, at the fair value of the consideration received or receivable.
Contributed property, plant and equipment is recognised when ownership of the items of property, plant andequipment is transferred to the municipality.
Revenue from the recovery of unauthorised, irregular, fruitless and wasteful expenditure is based on legislatedprocedures, including those set out in the Municipal Finance Management Act (Act No.56 of 2003) and is recognisedwhen the recovery thereof from the responsible councillors or officials is virtually certain.
1.19 Grants,transfers and donations
Income received from conditional grants, donations and subsidies is recognised to the extent that the Municipality hascomplied with any of the criteria, conditions or obligations embodied in the agreement. To the extent that the criteria,conditions or obligations have not been met, a liability is recognised and funds are invested until utilised.
Interest earned on the investment is treated in accordance with grant conditions. If it is payable to the funder, it isrecorded as part of the creditor. If it is the Municipality's interest, it is recognised as interest earned in the Statement ofFinancial Performance.
Grants and receipts of a revenue nature: Income is transferred as revenue to the Statement of Financial Performanceto the extent that the criteria, conditions or obligations have been met.
20

eThekwini Municipality and its Municipal EntitiesAnnual Financial Statements for the year ended 30 June 2011
ACCOUNTING POLICIES
1.20 Leases
Operating leases - The Municipality as lessor
Assets leased to third parties under operating leases are included in investment properties and property, plant andequipment in the statement of financial position.
They are depreciated over their expected useful lives on a basis consistent with similar owned investment propertiesand property, plant and equipment. Rental income (net of any incentives given to lessees) is recognised over thelease term.
Operating leases – The Municipality as lessee
Leases where the lessor retains substantially all the risks and rewards of ownership are classified as operating leases.
Payments made under operating leases (net of any incentives received from the lessor) are charged to the statementof financial performance on a straight-line basis over the period of the lease.
1.21 Tax
Deferred income tax
The Municipality is exempted from tax in terms of section 10(1)(a) of the Income Tax Act..
Deferred income tax, with respect to Municipal entities, is provided in full, using the liability method, on temporarydifferences arising between the tax bases of assets and liabilities and their carrying amounts in the financialstatements. Currently enacted tax rates are used to determine deferred income tax.
Deferred tax assets are recognised to the extent that it is probable that future taxable profit will be available againstwhich temporary differences can be utilised.
The Municipality is exempted from tax in terms of section 10(1)(a) of the Income Tax Act.
1.22 Unauthorised Expenditure
Unauthorised expenditure is expenditure that has not been budgeted, expenditure that is not in terms of the conditionsof an allocation received from another sphere of government, municipality or organ of state and expenditure in theform of a grant that is not permitted in terms of the Municipal Finance Management Act (Act No.56 of 2003).Unauthorised expenditure is accounted for as an expense in the Statement of Financial Performance. Whereunauthorised expenditure is not approved, it is recovered from the responsible person and the amount received isaccounted for as revenue in the Statement of Financial Performance.
1.23 Irregular expenditure
Irregular expenditure is expenditure that is contrary to the Municipal Finance Management Act (Act No.56 of 2003), theMunicipal Systems Act (Act No.32 of 2000), the Public Office Bearers Act (Act No. 20 of 1998) or is in contravention ofthe Municipality’s supply chain management policy. Irregular expenditure excludes unauthorised expenditure. Irregularexpenditure is accounted for as expenditure in the Statement of Financial Performance. If the expenditure is notcondoned by the relevant authority it is treated as a current asset until it is recovered or written off as irrecoverable inthe Statement of Financial Performance.
1.24 Fruitless and Wasteful Expenditure
Fruitless and wasteful expenditure is expenditure that was made in vain and would have been avoided had reasonablecare been exercised. If the expenditure is not condoned by the relevant authority it is accounted for as a current assetin the Statement of Financial Position until such time as the expenditure is recovered from the responsible person orwritten off as irrecoverable in the Statement of Financial Performance.
21

eThekwini Municipality and its Municipal EntitiesAnnual Financial Statements for the year ended 30 June 2011
ACCOUNTING POLICIES
1.25 Translation of foreign currencies
Foreign currency transactions
Transactions in foreign currencies are initially recorded at the prevailing exchange rate on the dates of thetransactions. Monetary assets and liabilities denominated in such foreign currencies are retranslated at the ratesprevailing at the reporting date. Exchange differences are included in the Statement of Financial Performance.
1.26 Comparatives Information
1.26.1 Current year comparatives
Budgeted amounts have been included in an annexure to these financial statements for the current financial year only.
1.26.2 Prior year comparatives
When the presentation or classification of items in the annual financial statements is amended, prior periodcomparative amounts are restated. The nature and reason for the reclassification is disclosed.Where there has been achange in accounting policy in the current year,the adjustment is made retrospectively as far as is practicable,and theprior year comparatives are restated accordingly.
1.27 Long Service Awards
Provision for long service awards represents the present value of the estimated future cash outflows to be made bythe Municipality resulting from employee services provided up to Statement of Financial position date. The provisioncomprises amounts that the Municipality has a present obligation to pay resulting from employees services providedup to Statement of Financial position date.
22

eThekwini Municipality and its Municipal EntitiesAnnual Financial Statements for the year ended 30 June 2011
NOTES TO THE ANNUAL FINANCIAL STATEMENTSGroup Municipality
Figures in Rand thousand 2011 2010 2011 2010
2. HOUSING DEVELOPMENT FUND
Housing Development FundAccumulated Surplus 11,828 74,246 11,828 74,246Loans extinguished by Government on 1April 1998
266,979 266,979 266,979 266,979
Total 278,807 341,225 278,807 341,225
The Housing Development Fund isrepresented by the following assetsand liabilities:
Property, plant and equipment 10 74,503 77,859 74,503 77,859
Housing selling scheme loans 130,761 139,621 130,761 139,621
Housing rental Debtors 34,053 31,342 34,053 31,342
Housing other Debtors 6,121 24,187 6,121 24,187
Housing inventory 137 136 137 136
Investments 12,398 98,501 12,398 98,501
Investment properties 17,544 17,909 17,544 17,909
Bank and cash 92,130 54,009 92,130 54,009
Intangible Assets 9 9 9 9
Sub-total 367,656 443,573 367,656 443,573Long-term liabilities (391) (467) (391) (467)Unspent Conditional Grants (58,754) - (58,754) -Creditors (9,885) (82,062) (9,885) (82,062)Government Grant Reserve (19,819) (19,819) (19,819) (19,819)
Total Housing Development Fund Assetsand Liabilities
278,807 341,225 278,807 341,225
23

eThekwini Municipality and its Municipal EntitiesAnnual Financial Statements for the year ended 30 June 2011
NOTES TO THE ANNUAL FINANCIAL STATEMENTSGroup Municipality
Figures in Rand thousand 2011 2010 2011 2010
3. LONG-TERM LIABILITIES
Annuity Loans 10,114,553 8,656,418 10,110,256 8,651,486Non Annuity Loans - 23,000 - 23,000Debentures and Local Registered StockLoans
95,398 87,906 200 200
Sub-total 10,209,951 8,767,324 10,110,456 8,674,686
Current portion of long termliabilities
Annuity Loans 693,376 501,974 692,416 501,300
Non Annuity Loans - 23,000 - 23,000
Sub-total 693,376 524,974 692,416 524,300
Non-current liabilitiesLong term Portion 9,516,575 8,242,350 9,418,040 8,150,386
The fair value of all long term loans approximates their book values.
Refer to Note 52 for more detail on long-term liabilities.
Nil (2010: R27m) has been invested specifically in a ring-fenced account for the repayment of long-term liabilities.See note 35 for more detail.
DBSA Phase 2 and Phase 3 loans of R400million each are separately secured, each by a cession of an acceptablerevenue stream of R20 million p.a. as security. The DBSA Phase 2 loan of R400million is a floating interest ratecontract, and in order to mitigate the floating interest rate exposure, the Municipality entered into a fixed interest rateswap agreement with Standard Corporate & Merchant Bank.
DBSA Phase 5 of R300m is seperately secured by a cession of an acceptable revenue stream of R15 million p.a. assecurity .
AFD Calyon of R58.7m is seperately secured by a cession of carbon credit income in the event of default or non-payment. The income is estimated to be R9.9m to the year 2013.
Ushaka:Debentures:The unsecured convertible debenture bears interest at a non-compounding rate of 13% per annum.The accruedinterest is payable at the end of the twelfth year of the issued debenture.The debenture is convertible at the option ofthe holder into ordinary shares of the company at anytime during 12 years from date of issue.Should the holder notexcercise the option to convert,the debenture is redeemable at the option of either the issuer or the bearer after the 12years from date of issue.On redemption the debenture capital is repayable in three equal annual tranches during2017, 2018 and 2019.
All other loans are unsecured.
24

eThekwini Municipality and its Municipal EntitiesAnnual Financial Statements for the year ended 30 June 2011
NOTES TO THE ANNUAL FINANCIAL STATEMENTSFigures in Rand thousand
4. PROVISIONS
Reconciliation of provisions - Group - 2011
OpeningBalance
Additions/(Prioryear
overprovision)
Utilised duringthe year
Total
CurrentLong service awards 7,792 1,591 (806) 8,577Performance bonus, leave pay and overtime 19,573 4,448 (6,159) 17,862Clearance of Alien Vegetation 6,830 7,893 (5,490) 9,233
Non-currentEnvironmental rehabilitation: Landfill sites 48,640 12,111 - 60,751Clearance of Alien Vegetation 17,878 2,170 - 20,048Long service awards 196,858 (21,707) - 175,151
297,571 6,506 (12,455) 291,622
Reconciliation of provisions - Group - 2010
OpeningBalance
Additions/(Prioryear
overprovision)
Utilised duringthe year
Total
CurrentClearance of Alien Vegetation 4,570 6,973 (4,713) 6,830Performance bonus, leave pay and overtime 17,954 7,677 (6,058) 19,573Long service awards 12,206 (3,864) (550) 7,792
Non-currentEnvironmental rehabilitation: Landfill sites 44,399 4,284 (43) 48,640Clearance of Alien Vegetation 13,655 4,223 - 17,878Long service awards 123,012 73,846 - 196,858
215,796 93,139 (11,364) 297,571
Reconciliation of provisions - Municipality - 2011
OpeningBalance
Additions/(Prioryear
overprovision)
Utilised duringthe year
Total
CurrentClearance of Alien Vegetation 6,830 7,893 (5,490) 9,233Performance bonus 16,906 4,448 (6,146) 15,208Long service awards 7,792 1,591 (806) 8,577
Non-currentEnvironmental rehabilitation: Landfill sites 48,640 12,111 - 60,751Clearance of Alien Vegetation 17,878 2,170 - 20,048Long service awards 196,858 (21,707) - 175,151
294,904 6,506 (12,442) 288,968
25

eThekwini Municipality and its Municipal EntitiesAnnual Financial Statements for the year ended 30 June 2011
NOTES TO THE ANNUAL FINANCIAL STATEMENTSFigures in Rand thousand
4. Provisions (continued)
Reconciliation of provisions - Municipality - 2010
OpeningBalance
Additions/(Prioryear
overprovision)
Utilised duringthe year
Total
CurrentClearance of Alien Vegetation 4,570 6,973 (4,713) 6,830Performance bonus 15,458 7,424 (5,976) 16,906Long service awards 12,206 (3,864) (550) 7,792
Non-currentEnvironmental rehabilitation: Landfill sites 44,399 4,284 (43) 48,640Clearance of Alien Vegetation 13,655 4,223 - 17,878Long service awards 123,012 73,846 - 196,858
213,300 92,886 (11,282) 294,904
Non-current liabilities 255,950 263,376 255,950 263,376Current liabilities 35,672 34,195 33,018 31,528
291,622 297,571 288,968 294,904
Environmental rehabilitation: Landfill sites
The Landfill Rehabilitation Provision is created for the rehabilitation of the current operational sites at the futureestimated time of closure. The value of the provision is based on the expected future cost to rehabilitate the varioussites discounted back to the balance sheet date at the cost of capital, which is currently 10%. The Municipality has anobligation to rehabilitate these Landfill sites. The cost of such property includes the initial estimate of the costs ofrehabilitating the land and restoring the site on which it is located, the obligation for which a municipality incurs as aconsequence of having used the property during a particular period for landfill purposes. The Municipality estimatesthe useful lives and makes assumptions as to the useful lives of these assets, which influence the provision for futurecosts.
The asset is measured using the cost model:(a) subject to (b), changes in the liability are added to, or deducted from, the cost of the related asset in the currentperiod;(b) if a decrease in the liability exceeds the carrying amount of the asset, the excess is recognised immediately insurplus or deficit; and (c) if the adjustment results in an addition to the cost of an asset, the Municipality considers whether this is anindication that the new carrying amount of the asset may not be fully recoverable. If it is such an indication, the assetis tested for impairment by estimating its recoverable amount, and any impairment loss is recognised in surplus ordeficit.
Long service awards
Employees who achieve 15 years service will be granted 10 days paid leave (once off) together with a servicecertificate signed by the Head of Department. Employees who achieve 25 years service will be granted 15 days paid leave (once off) together with an engraved goldwatch to a maximum value of R2000 (value reviewable every five (5) years) and service certificate signed by Head ofDepartment.Employees who achieve 40 years service will be granted 20 days paid leave (once off) and a scroll duly signed by theMayor in recognition of loyal service rendered to the Council.The abovementioned leave is granted in addition to the annual leave entitlement and maximum accumulation grantedin terms of the National Conditions of Service, and may be taken, converted to cash in full or partially or accumulated.The abovementioned leave is only applicable to those employees who achieve the stated years of service after theeffective date of these conditions.The provision is an estimate of the long service award based on the monthly salaries rate at 30 June 2011 (2010: 30June 2010). It has been assumed that the staff turnover rate will be insignificant based on historical data. A discountrate of 9 % (2010: 11% )was used based on internal rate of return.
26

eThekwini Municipality and its Municipal EntitiesAnnual Financial Statements for the year ended 30 June 2011
NOTES TO THE ANNUAL FINANCIAL STATEMENTSFigures in Rand thousand
4. Provisions (continued)Clearance of Alien Vegetation
The clearing of alien vegetation is required in terms of the Conservation of Agricultural Resources Act, 1983 (Act No.43 of 1983). The Municipality has therefore made a provision for its obligation, based on future estimated costs for thenext 3 years. This provision will be reviewed annually to reflect the fair value of the obligation.Provision for invasive alien plant control / eradication is based on reliable data for growth rates, infestation rates anddensity. A detailed analysis, based on current costs of alien plant clearing, was undertaken. Input from numerous fieldstaff was obtained with regard to the level of infestation of currently managed areas.Data used for calculations:
Municipal owned land within the municipal area: 18 000 HaMunicipal owned open space currently managed (prioritised): 2 200 HaCurrent approximate cost of clearing very high infestations of IAP's: R5 200.00 / Ha
(2010: R4 995.00 / Ha).
Performance Bonus
All employees who are employed in accordance with provisions of section 57 of the Municipal Systems Act arerequired, in terms of their employment contracts, to sign a performance agreement and performance plan in terms ofwhich their performance is assessed annually. The criteria in terms of which they are assessed is linked to the I.D.P.8-point plan. Strategic focus areas and key performance indicators are set out in the plan, together with targets andweightings for each target. Employees are assessed quarterly and against these targets and a final assessment isconducted at the end of the financial year. The performance bonus paid to each employee is dependant on the overallscore achieved in this assessment and is subject to the approval of the City Manager.
5. RETIREMENT BENEFIT OBLIGATIONS
5.1. Defined benefit plan
Statement of Financial Positionobligation for:
Post-employment medical benefits 2,067,082 1,892,056 2,067,082 1,892,056Pension benefits (318,920) (116,714) (318,920) (116,714)
Balance at end of year 1,748,162 1,775,342 1,748,162 1,775,342
Statement of Financial Performance obligation for:
Post-employment medical benefits 175,026 302,883 175,026 302,883Pension Benefits: - - - - Defined Benefit Funds 110,780 111,662 110,780 111,662 Defined Contribution Funds 530,809 556,261 530,809 553,465
Total, included in employee benefitsexpense
28 816,615 970,806 816,615 968,010
5.1.1. Post-Retirement Medical Aid Plan
The municipality operates on 6 accredited medical aid schemes, namely Global Health, Hosmed, Munimed, Bonitas,Samwumed and LA Health. Pensioners continue on the option they belonged to on the day of their retirement.
Movement in the defined benefit obligation is as follows:
Balance at beginning of the year 1,892,056 1,589,173 1,892,056 1,589,173Current service cost 85,949 64,122 85,949 64,122Interest cost 171,672 147,959 171,672 147,959Actuarial (gains) losses (13,736) 151,079 (13,736) 151,079Benefit payments (68,859) (60,277) (68,859) (60,277)
Balance at end of year 2,067,082 1,892,056 2,067,082 1,892,056
27

eThekwini Municipality and its Municipal EntitiesAnnual Financial Statements for the year ended 30 June 2011
NOTES TO THE ANNUAL FINANCIAL STATEMENTSGroup Municipality
Figures in Rand thousand 2011 2010 2011 2010
5. Retirement benefit obligations (continued)Net expense recognised in the Statement of financial performance
Current service cost 85,949 64,122 85,949 64,122Interest cost 171,672 147,959 171,672 147,959Actuarial (gains) losses (13,736) 151,079 (13,736) 151,079Benefit payments (68,859) (60,277) (68,859) (60,277)
Total, included in employee benefitsexpense
28 175,026 302,883 175,026 302,883
Key assumptions used
The principal actuarial assumptions used were as follows:
Discount rates used %8.40 %9.25 %8.40 %9.25General increases to medical aidcontributions
%6.90 %7.75 %6.90 %7.75
Salary Inflation %6.00 %7.25 %6.00 %7.25Expected retirement age 63 63 63 63Proportion continuing membership atretirement
%100.00 %100.00 %100.00 %100.00
Proportion of retiring members who aremarried
%100.00 %100.00 %100.00 %100.00
Other assumptions:
Age of spouse - Husbands 5 years older than wives
Mortality of in-service members - Mortaility table based on durban Pension Fund experience
Mortality of pensioners - a(m) and a(f) ultimate tables plus 0.50% improvement per annum
(No explicit assumption was made about additional mortality or health care costs due to AIDS).
Percentage of in-service memberswithdrawing before retirement:
Age 20 %7.85 %7.85 %7.85 %7.85Age 25 %5.67 %5.67 %5.67 %5.67Age 30 %4.20 %4.20 %4.20 %4.20Age 35 %3.31 %3.31 %3.31 %3.31Age 40 %2.23 %2.23 %2.23 %2.23Age 45 %1.21 %1.21 %1.21 %1.21Age 50 %0.55 %0.55 %0.55 %0.55Age 55+ %0.00 %0.00 %0.00 %0.00
28

eThekwini Municipality and its Municipal EntitiesAnnual Financial Statements for the year ended 30 June 2011
NOTES TO THE ANNUAL FINANCIAL STATEMENTSGroup Municipality
Figures in Rand thousand 2011 2010 2011 2010
5. Retirement benefit obligations (continued)5.1.2. Pension benefits
The amounts recognised in the Statement of Financial Position were determined as follows:
Present value of funded obligations 7,369,519 7,066,557 7,369,519 7,066,557Present value of the defined benefitobligation-partially or wholly funded
(8,824,562) (8,226,174) (8,824,562) (8,226,174)
Asset not recognised due to future surpluspolicy not yet established
1,136,123 1,042,903 1,136,123 1,042,903
Liability (Surplus) in the Statement ofFinancial Position
(318,920) (116,714) (318,920) (116,714)
Movement in the defined benefit obligation is as follows:
Balance at beginning of the year (116,714) (70,929) (116,714) (70,929)Current service cost 110,780 111,662 110,780 111,662Contributions by plan participants 27,576 25,606 27,576 25,606Actuarial losses (11,157) 385,752 (11,157) 385,752Interest cost 649,868 656,977 649,868 656,977Benefit payments (474,105) (470,336) (474,105) (470,336)Obligation not recognised due to futuresurplus policy not yet established
(505,168) (755,446) (505,168) (755,446)
Balance at end of year (318,920) (116,714) (318,920) (116,714)
Movement in the fair value of plan assets is as follows:
Actuarial gains (losses) 185,120 1,019,721 185,120 1,019,721Employer contributions 70,361 67,461 70,361 67,461Employee contributions 27,576 25,606 27,576 25,606Benefit payments (474,105) (470,336) (474,105) (470,336)Expected return on assets 789,436 757,776 789,436 757,776Transfers out - (678,987) - (678,987)Asset not recognised due to future surpluspolicy not yet established
(598,388) (721,241) (598,388) (721,241)
Balance at end of year - - - -
The amounts recognised in the Statement of Financial Performance were as follows:
Current service cost - Defined Benefit Funds 110,780 111,662 110,780 111,662Current service cost - Defined ContributionFunds
530,809 556,261 530,809 553,465
Total included in employee benefitsexpense
641,589 667,923 641,589 665,127
29

eThekwini Municipality and its Municipal EntitiesAnnual Financial Statements for the year ended 30 June 2011
NOTES TO THE ANNUAL FINANCIAL STATEMENTSGroup Municipality
Figures in Rand thousand 2011 2010 2011 2010
5. Retirement benefit obligations (continued)
Key assumptions used
The principal actuarial assumptions used were as follows:
Discount rate %8.75 %9.25 %8.75 %9.25Expected return on plan assets %9.25 %9.75 %9.25 %9.75Future salary increases %6.75 %6.75 %6.75 %6.75Future pension increases %4.07 %4.55 %4.07 %4.55
Examples of mortality rates usedwere as follows:Active members (All):
Age 20 %0.13 %0.13 %0.13 %0.13Age 25 %0.18 %0.18 %0.18 %0.18Age 30 %0.25 %0.25 %0.25 %0.25Age 35 %0.37 %0.37 %0.37 %0.37Age 40 %0.52 %0.52 %0.52 %0.52Age 45 %0.72 %0.72 %0.72 %0.72Age 50 %0.99 %0.99 %0.99 %0.99Age 55 %1.37 %1.37 %1.37 %1.37Age 60 %1.89 %1.89 %1.89 %1.89
All Councillors and employees belong to 8 retirement funds. The KZN Municipal Pension Fund is a definedcontribution fund and became operational from 2001-11-01.
The results for the year ended 2005-06-30 (per the Fund Valuator) revealed that the fund was in sound financialposition.
The Durban Pension Fund is a defined benefit fund administered by the eThekwini Municipality. The rules of the Fundrequire that the financial condition of the Fund be investigated and reported on by the Fund's actuary annually. Thevaluation as at 2011-01-01 revealed that the Fund was 100% funded. The actuarial value of assets and liabilities wasdetermined to be R8.56 billion. Members and the employer contribute at the rate of 7.5% and 19.68% respectively withthe balance of the required controibutions being funded by the contribution stabilization reserve account and theemployer surplus account. In compliance with the Fund's rules an amount of R70.1 million was contributed by Councilin respect of retirement funding during the period under review.
Certain members and Council contribute to the Natal Joint Superannuation, Retirement and Provident Funds (NJMP),SALA, Multi Linked and GEPF. Employees of eThekwini Municipality make up less than 1% of the total members ofthe NJMPF. eThekwini's liability in these funds could not be determined owing mainly to the assets not being allocatedto each employer and one set of financials being compiled for each fund and not for each employer.
An interim valuation carried out on the NJMP Superannuation fund (defined benefit) at 31 March 2006 concluded thatthe surcharge of 6% be retained for the year to 30 June 2007 and thereafter at 4,5%.
The latest statutory valuation of the NJMP Retirement fund (defined benefit) as at 31 March 2007 reflected a funddeficit of R229.8 million in respect of members. The total contribution rate payable, including the total surcharge of14% will eliminate the deficit by the year 2010.
The latest statutory valuation of the NJMP Provident Fund (defined contribution) as at 31 March 2007 revealed that theFund was in a sound financial position.
Non-current liabilities 1,610,806 1,634,468 1,610,806 1,634,468Current liabilities 137,356 140,874 137,356 140,874
1,748,162 1,775,342 1,748,162 1,775,342
30

eThekwini Municipality and its Municipal EntitiesAnnual Financial Statements for the year ended 30 June 2011
NOTES TO THE ANNUAL FINANCIAL STATEMENTSGroup Municipality
Figures in Rand thousand 2011 2010 2011 2010
6. DEPOSITS
I.C.C. : Clients Deposits 20,036 16,802 - -Electricity 686,868 575,685 686,868 575,685Water 194,976 163,415 194,976 163,415Interest 54,889 50,163 54,889 50,163Ushaka:Rental Deposits 1,486 1,368 - -
Total Deposits 958,255 807,433 936,733 789,263
Included in eThekwini Municipality's deposits is an accrual of interest at an effective interest rate of 3% per annum(2010: 3%) which is paid to consumers when deposits are refunded.
7. CREDITORS
Trade payables 1,981,940 2,257,283 1,955,925 2,230,730Payments received in advance 1,093,956 1,027,144 1,093,956 1,027,144Accrued staff 13th cheques 38 36 - -Retentions 119,191 144,111 119,191 144,111Bank Deposits not yet receipted 135,545 164,014 135,545 164,014Staff leave 280,742 261,483 280,742 261,483Other payables 821,245 848,602 849,242 876,618Deferred expenditure 23,634 15,458 23,634 15,458Adjustment for fair value at amortised cost (15,101) (12,271) (15,101) (12,271)
Total Creditors 4,441,190 4,705,860 4,443,134 4,707,287
8. UNSPENT CONDITIONAL GRANTS AND RECEIPTS
Conditional Grants from other spheres of Government:
Electricity Demand Side Management Grant 3,279 8,000 3,279 8,000Department of Provincial and LocalGovernment
2,000 2,250 2,000 2,250
Department of Local Government andTraditional Affairs
7,311 8,213 7,311 8,213
Department of Transport and PublicTransport Infrastructure
317,859 335,273 317,859 335,273
Department of Economic Activity and variousIndustries
1,557 2,295 1,557 2,295
Expanded Public Works Incentive Grant 22,860 43,243 22,860 43,243Equitable Share - 3,089 - 3,089Neighbourhood Development PartnershipGrant
2,091 9,003 2,091 9,003
2010 KZN Government Grant 14,789 - 14,789 -Vuna Awards 2,898 2,945 2,898 2,945Municipal Infrastructure Grant 26,194 14,330 26,194 14,330Grant Accreditaion 299 315 299 315Metropolitan Transport Authority - TaxiRanks
32 32 32 32
Department of Housing 69,103 13,296 69,103 13,296Lamontville and R293 Trf Deeds /Administration
1,556 1,556 1,556 1,556
31

eThekwini Municipality and its Municipal EntitiesAnnual Financial Statements for the year ended 30 June 2011
NOTES TO THE ANNUAL FINANCIAL STATEMENTSGroup Municipality
Figures in Rand thousand 2011 2010 2011 2010
8. Unspent conditional grants and receipts (continued)
Other Conditional ReceiptsEuropean Union 9,923 13,819 9,923 13,819Donations and Public Contributions 129,866 120,110 129,866 120,110DANIDA - 831 - 831D Moss Interest and Land Sales 8,362 8,362 8,362 8,362Other Grants and Subsidies 44,924 35,706 44,924 35,706
Total Conditional Grants and Receipts 664,903 622,668 664,903 622,668
These amounts are invested in a ring-fenced investment until utilised. See note 25 for more detail. No grants orsubsidies were withheld during the year.
9. CASH AND CASH EQUIVALENTS
Refer to note 51 for details on Bank accounts and balances.
Cash and cash equivalents consist of:
Cash on hand 8,058 10,939 7,165 10,093Bank balances 616,057 418,720 542,373 379,862
Bank balances and cash 624,115 429,659 549,538 389,955Bank overdraft (542,364) (379,843) (542,364) (379,843)
81,751 55,123 7,174 10,112Call Investment Deposits 742,275 1,522,698 650,504 1,430,751
Cash and cash equivalents 824,026 1,572,514 657,678 1,440,863
10. PROPERTY, PLANT AND EQUIPMENT
Group 2011 2010
Cost Accumulateddepreciation
Carrying value Cost Accumulateddepreciation
Carrying value
Land and Buildings 4,780,881 (776,685) 4,004,196 4,423,151 (646,070) 3,777,081Infrastructure 25,067,833 (4,421,920) 20,645,913 22,201,119 (3,832,401) 18,368,718Community 4,415,429 (582,203) 3,833,226 4,380,519 (442,399) 3,938,120Other 5,564,586 (2,218,039) 3,346,547 5,213,903 (1,765,392) 3,448,511Heritage 10,002 - 10,002 17,881 - 17,881Housing Development Fund 135,843 (61,340) 74,503 138,405 (60,546) 77,859
Total 39,974,574 (8,060,187) 31,914,387 36,374,978 (6,746,808) 29,628,170
Municipality 2011 2010
Cost Accumulateddepreciation
Carrying value Cost Accumulateddepreciation
Carrying value
Land and Buildings 3,471,445 (514,407) 2,957,038 3,119,686 (430,816) 2,688,870Infrastructure 25,067,833 (4,421,920) 20,645,913 22,201,119 (3,832,401) 18,368,718Community 4,415,429 (582,203) 3,833,226 4,380,519 (442,399) 3,938,120Other 5,381,006 (2,094,378) 3,286,628 5,033,609 (1,660,206) 3,373,403Heritage 10,002 - 10,002 17,881 - 17,881Housing Development Fund 135,843 (61,340) 74,503 138,405 (60,546) 77,859
Total 38,481,558 (7,674,248) 30,807,310 34,891,219 (6,426,368) 28,464,851
32
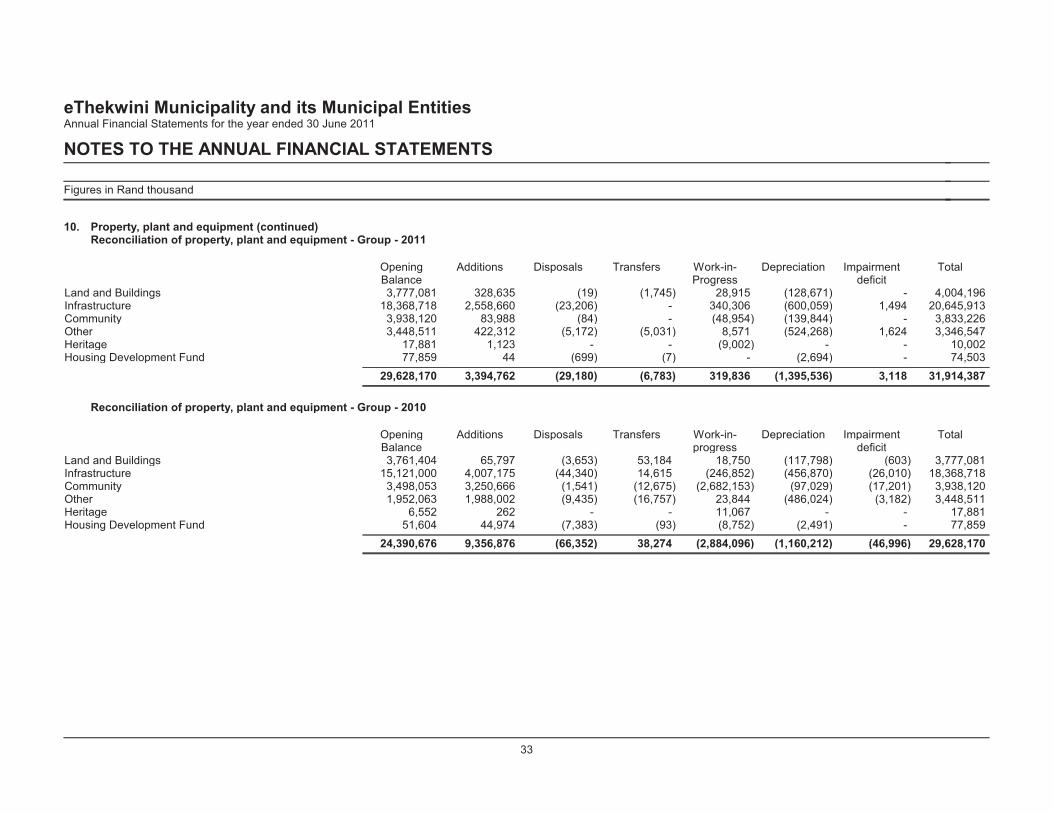
eThekwini Municipality and its Municipal EntitiesAnnual Financial Statements for the year ended 30 June 2011
NOTES TO THE ANNUAL FINANCIAL STATEMENTS
Figures in Rand thousand
10. Property, plant and equipment (continued)Reconciliation of property, plant and equipment - Group - 2011
OpeningBalance
Additions Disposals Transfers Work-in-Progress
Depreciation Impairmentdeficit
Total
Land and Buildings 3,777,081 328,635 (19) (1,745) 28,915 (128,671) - 4,004,196Infrastructure 18,368,718 2,558,660 (23,206) - 340,306 (600,059) 1,494 20,645,913Community 3,938,120 83,988 (84) - (48,954) (139,844) - 3,833,226Other 3,448,511 422,312 (5,172) (5,031) 8,571 (524,268) 1,624 3,346,547Heritage 17,881 1,123 - - (9,002) - - 10,002Housing Development Fund 77,859 44 (699) (7) - (2,694) - 74,503
29,628,170 3,394,762 (29,180) (6,783) 319,836 (1,395,536) 3,118 31,914,387
Reconciliation of property, plant and equipment - Group - 2010
OpeningBalance
Additions Disposals Transfers Work-in-progress
Depreciation Impairmentdeficit
Total
Land and Buildings 3,761,404 65,797 (3,653) 53,184 18,750 (117,798) (603) 3,777,081Infrastructure 15,121,000 4,007,175 (44,340) 14,615 (246,852) (456,870) (26,010) 18,368,718Community 3,498,053 3,250,666 (1,541) (12,675) (2,682,153) (97,029) (17,201) 3,938,120Other 1,952,063 1,988,002 (9,435) (16,757) 23,844 (486,024) (3,182) 3,448,511Heritage 6,552 262 - - 11,067 - - 17,881Housing Development Fund 51,604 44,974 (7,383) (93) (8,752) (2,491) - 77,859
24,390,676 9,356,876 (66,352) 38,274 (2,884,096) (1,160,212) (46,996) 29,628,170
33

eThekwini Municipality and its Municipal EntitiesAnnual Financial Statements for the year ended 30 June 2011
NOTES TO THE ANNUAL FINANCIAL STATEMENTS
Figures in Rand thousand
10. Property, plant and equipment (continued)
Reconciliation of property, plant and equipment - Municipality - 2011
OpeningBalance
Additions Disposals Transfers Work-in-progress
Depreciation Impairmentdeficit
Total
Land and Buildings 2,688,870 322,916 (19) - 28,915 (83,644) - 2,957,038Infrastructure 18,368,718 2,558,660 (23,206) - 340,306 (600,059) 1,494 20,645,913Community 3,938,120 83,988 (84) - (48,954) (139,844) - 3,833,226Other 3,373,403 415,035 (4,498) (6,771) 8,571 (500,736) 1,624 3,286,628Heritage 17,881 1,123 - - (9,002) - - 10,002Housing Development Fund 77,859 44 (699) (7) - (2,694) - 74,503
28,464,851 3,381,766 (28,506) (6,778) 319,836 (1,326,977) 3,118 30,807,310
Reconciliation of property, plant and equipment - Municipality - 2010
OpeningBalance
Additions Disposals Transfers Work-in-progress
Depreciation Impairmentdeficit
Total
Land and Buildings 2,649,563 45,121 (3,653) 53,184 18,970 (73,712) (603) 2,688,870Infrastructure 15,121,000 4,007,175 (44,340) 14,615 (246,852) (456,870) (26,010) 18,368,718Community 3,498,053 3,250,666 (1,541) (12,675) (2,682,153) (97,029) (17,201) 3,938,120Other 1,869,969 1,972,354 (9,376) (16,757) 23,844 (463,957) (2,674) 3,373,403Heritage 6,552 262 - - 11,067 - - 17,881Housing Development Fund 51,604 44,974 (7,383) (93) (8,752) (2,491) - 77,859
23,196,741 9,320,552 (66,293) 38,274 (2,883,876) (1,094,059) (46,488) 28,464,851
Included in Property, Plant and Equipment above are items that are still in use and that have a historical cost ofR199.9m but are fully depreciated. This amount is made up as follows:
Land and Buildings R2.4millionInfrastructure R179.5millionCommunity R15.7millionOther R2.3million
Refer to Note 53 and Appendix A for detailed analysis of fixed assets.
34

eThekwini Municipality and its Municipal EntitiesAnnual Financial Statements for the year ended 30 June 2011
NOTES TO THE ANNUAL FINANCIAL STATEMENTS
Figures in Rand thousand
11. INTANGIBLE ASSETS
Group 2011 2010
Cost Accumulatedamortisation
Carrying value Cost Accumulatedamortisation
Carrying value
Servitudes 47,882 - 47,882 47,634 - 47,634Computer software 717,117 (416,934) 300,183 581,612 (298,948) 282,664
Total 764,999 (416,934) 348,065 629,246 (298,948) 330,298
Municipality 2011 2010
Cost Accumulatedamortisation
Carrying value Cost Accumulatedamortisation
Carrying value
Servitudes 47,882 - 47,882 47,634 - 47,634Computer software 710,110 (410,991) 299,119 575,335 (294,321) 281,014
Total 757,992 (410,991) 347,001 622,969 (294,321) 328,648
Reconciliation of intangible assets - Group - 2011
OpeningBalance
Additions Disposals Transfers Work-in-progress
Amortisation Total
Servitudes 47,634 248 - - - - 47,882Computer software 282,664 124,225 (20) 6,779 (15,120) (98,345) 300,183
330,298 124,473 (20) 6,779 (15,120) (98,345) 348,065
Reconciliation of intangible assets - Group - 2010
OpeningBalance
Additions Disposals Transfers Work-in-progress
Amortisation Total
Servitudes 42,985 4,789 - (140) - - 47,634Computer software 315,153 55,173 (18) 108 7,327 (95,079) 282,664
358,138 59,962 (18) (32) 7,327 (95,079) 330,298
Reconciliation of intangible assets - Municipality - 2011
OpeningBalance
Additions Disposals Transfers Work-in-progress
Amortisation Total
Servitudes 47,634 248 - - - - 47,882Computer software 281,014 123,509 (20) 6,779 (15,120) (97,043) 299,119
328,648 123,757 (20) 6,779 (15,120) (97,043) 347,001
Reconciliation of intangible assets - Municipality - 2010
OpeningBalance
Additions Disposals Transfers Revaluations Amortisation Total
Servitudes 42,985 4,789 - (140) - - 47,634Computer software 313,533 54,195 (17) 108 7,327 (94,132) 281,014
356,518 58,984 (17) (32) 7,327 (94,132) 328,648
Intangible assets disclosed relate to servitudes registered by the electricity department of the municipality. The balance of theservitudes are disclosed in Property, Plant and Equipment. It has been the municipality's policy to capitalise servitudes to projectswhich are currently disclosed as Infrastructure costs.
35

eThekwini Municipality and its Municipal EntitiesAnnual Financial Statements for the year ended 30 June 2011
NOTES TO THE ANNUAL FINANCIAL STATEMENTS
Figures in Rand thousand
12. INVESTMENT PROPERTIES
Group 2011 2010
Cost Accumulateddepreciation
Carrying value Cost Accumulateddepreciation
Carrying value
Revenue Generating 162,756 (54,059) 108,697 175,892 (49,732) 126,160Non-revenue Generating 275,013 - 275,013 277,044 - 277,044
Total 437,769 (54,059) 383,710 452,936 (49,732) 403,204
Municipality 2011 2010
Cost Accumulateddepreciation
Carrying value Cost Accumulateddepreciation
Carrying value
Revenue Generating 90,803 (37,095) 53,708 90,803 (35,290) 55,513Non-revenue Generating 209,597 - 209,597 211,628 - 211,628
Total 300,400 (37,095) 263,305 302,431 (35,290) 267,141
Reconciliation of investment properties - Group - 2011
OpeningBalance
Disposals Depreciation Total
Revenue Generating 126,160 (13,138) (4,325) 108,697Non-revenue Generating 277,044 (2,031) - 275,013
403,204 (15,169) (4,325) 383,710
Reconciliation of investment properties - Group - 2010
OpeningBalance
Additions Disposals Transfers Depreciation Total
Revenue Generating 114,139 16,103 (150) - (3,932) 126,160Non-revenue Generating 301,641 15,514 (1,922) (38,189) - 277,044
415,780 31,617 (2,072) (38,189) (3,932) 403,204
Reconciliation of investment properties - Municipality - 2011
OpeningBalance
Disposals Depreciation Total
Revenue Generating 55,513 - (1,805) 53,708Non-revenue Generating 211,628 (2,031) - 209,597
267,141 (2,031) (1,805) 263,305
Reconciliation of investment properties - Municipality - 2010
OpeningBalance
Additions Disposals Transfers Depreciation Total
Revenue Generating 57,492 - (150) - (1,829) 55,513Non-revenue Generating 236,225 15,514 (1,922) (38,189) - 211,628
293,717 15,514 (2,072) (38,189) (1,829) 267,141
36
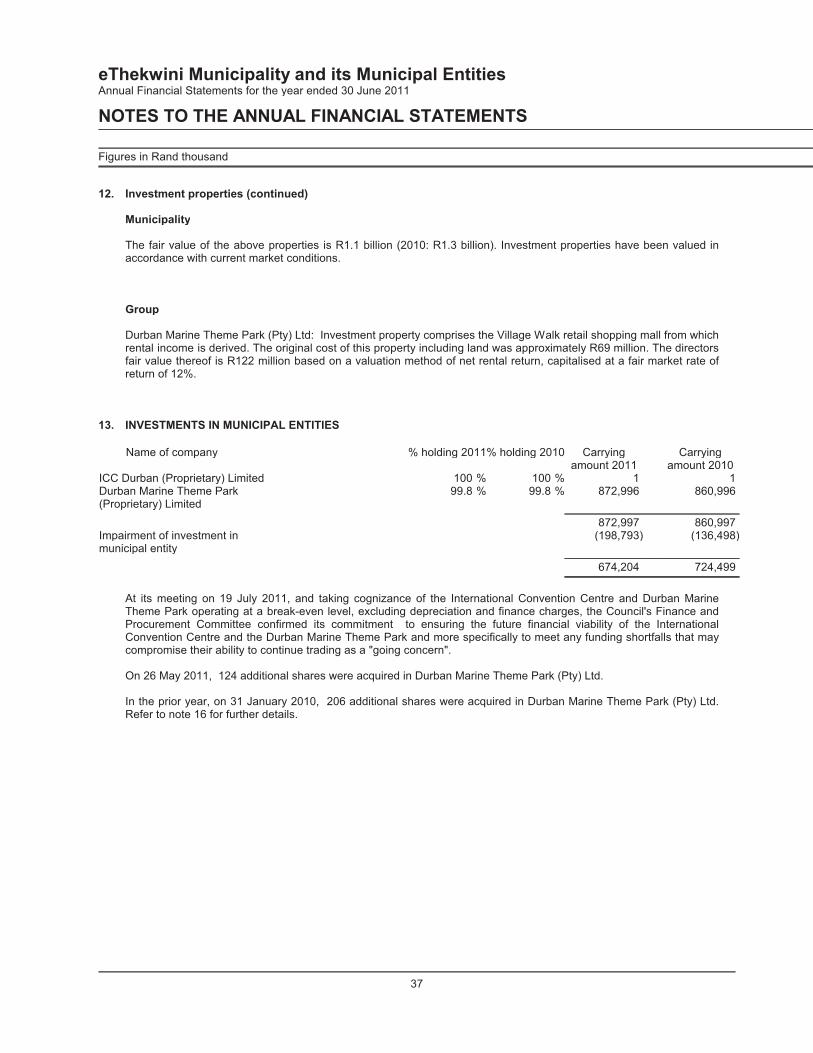
eThekwini Municipality and its Municipal EntitiesAnnual Financial Statements for the year ended 30 June 2011
NOTES TO THE ANNUAL FINANCIAL STATEMENTS
Figures in Rand thousand
12. Investment properties (continued)
Municipality
The fair value of the above properties is R1.1 billion (2010: R1.3 billion). Investment properties have been valued inaccordance with current market conditions.
Group
Durban Marine Theme Park (Pty) Ltd: Investment property comprises the Village Walk retail shopping mall from whichrental income is derived. The original cost of this property including land was approximately R69 million. The directorsfair value thereof is R122 million based on a valuation method of net rental return, capitalised at a fair market rate ofreturn of 12%.
13. INVESTMENTS IN MUNICIPAL ENTITIES
Name of company % holding 2011% holding 2010 Carryingamount 2011
Carryingamount 2010
ICC Durban (Proprietary) Limited %100 %100 1 1Durban Marine Theme Park(Proprietary) Limited
%99.8 %99.8 872,996 860,996
872,997 860,997Impairment of investment inmunicipal entity
(198,793) (136,498)
674,204 724,499
At its meeting on 19 July 2011, and taking cognizance of the International Convention Centre and Durban MarineTheme Park operating at a break-even level, excluding depreciation and finance charges, the Council's Finance andProcurement Committee confirmed its commitment to ensuring the future financial viability of the InternationalConvention Centre and the Durban Marine Theme Park and more specifically to meet any funding shortfalls that maycompromise their ability to continue trading as a "going concern".
On 26 May 2011, 124 additional shares were acquired in Durban Marine Theme Park (Pty) Ltd.
In the prior year, on 31 January 2010, 206 additional shares were acquired in Durban Marine Theme Park (Pty) Ltd.Refer to note 16 for further details.
37

eThekwini Municipality and its Municipal EntitiesAnnual Financial Statements for the year ended 30 June 2011
NOTES TO THE ANNUAL FINANCIAL STATEMENTSGroup Municipality
Figures in Rand thousand 2011 2010 2011 2010
13. Investments in municipal entities (continued)As at 30th June 2011 ICC Durban
(Proprietary)Limited
DurbanMarine ThemePark(Proprietary)Limited
Issued Share Capital (R'000) 1 9,384Percentage owned by Council (%) 100 99Indebtedness of Municipal Entities (R'000)-Non Interest Bearing
226,590 -
Loss on Impairment of Loans (226,590) -Electricity Income Received (R'000) 7,782 13,876Water Income Received (R'000) 886 3,721Gross Rates Income Received (R'000) 17,536 -Grant-in-Aid (Rates) (R'000) - - (10,500) -Refuse Removal (R'000) - - 418 -
As at 30th June 2010 ICC Durban(Proprietary)Limited
DurbanMarine ThemePark(Proprietary)Limited
Issued Share Capital (R'000) 1 9,260Percentage owned by Council (%) 100 99Indebtedness of Municipal Entities (R'000)-Non Interest Bearing
226,590 1,560
Loss on Impairment of Loans (226,590) (1,560)Electricity Income Received (R'000) 6,255 11,773Water Income Received (R'000) 574 3,851Gross Rates Income Received (R'000) 17,790 -Grant-in-Aid (Rates) (R'000) - - (10,500) -
38

eThekwini Municipality and its Municipal EntitiesAnnual Financial Statements for the year ended 30 June 2011
NOTES TO THE ANNUAL FINANCIAL STATEMENTSGroup Municipality
Figures in Rand thousand 2011 2010 2011 2010
14. INVESTMENTS
Financial Instruments - Held toMaturity
General Investments(Refer to note 35 for details)
- 27,044 - 27,044
Fixed and Negotiable Deposits 2,450,000 300,000 2,450,000 300,000
2,450,000 327,044 2,450,000 327,044
Total Cash Investments 2,450,000 327,044 2,450,000 327,044
Current assetsHeld to Maturity 2,450,000 327,044 2,450,000 327,044
IInvestments are non-derivative financial assets and are classified at fair value and are held to maturity. Investmentswill mature within two to four months, therefore cost equates fair value. The Municipality does not hold its investmentsfor trading purpose. Management determines the classification of its investments at the time of acquisition and re-evaluates such declaration on an annual basis.
15. INVESTMENT IN JOINT VENTURE
Name of company Unliste
d
% holding 2011% holding 2010 Carryingamount 2011
Carryingamount 2010
Effingham Development %66.74 %66.74 70,610 137,089
This represents a 66.74% investment in Effingham Development (Joint Venture).
The Effingham Development Joint Venture is a joint venture entered into with Moreland Developments (Pty) Ltd. Thejoint venture was formed with the objective of developing and marketing the serviced sites of the Effingham / Avoca(Riverhorse Valley Business Estate) land and Phoenix South (Bridge City) land.
Summary of the municipality's interest in the joint venture
AssetsTownship Property 44,096 57,232Current assets - Debtors 21,971 123,148Current assets - Bank Balances and Cash on hand 28,024 14,311
TOTAL ASSETS 94,091 194,691
Equity and LiabilitiesMembers Loan Accounts 70,610 137,089Current liabilities - Creditors 23,481 57,602TOTAL EQUITY AND LIABILITIES 94,091 194,691Reconciliation of Investment in Joint VentureBalance at beginning of year 137,089 156,851Share of Income for the year 3,521 5,238Payment received (70,000) (25,000)
BALANCE AT END OF YEAR 70,610 137,089
39

eThekwini Municipality and its Municipal EntitiesAnnual Financial Statements for the year ended 30 June 2011
NOTES TO THE ANNUAL FINANCIAL STATEMENTSGroup Municipality
Figures in Rand thousand 2011 2010 2011 2010
16. LOANS TO MUNICIPAL ENTITIES
Durban Marine Theme Park (Proprietary)Limited
- 1,561
ICC Durban (Proprietary) Limited 226,590 226,590
Subtotal 226,590 228,151Impairment of loans to municipal entities (226,590) (228,151)
- -
Loans to Municipal Entities are fully impaired as they are considered to be irrecoverable in the short-term.
On 26 May 2011 the loan of R1.5m to Durban Marine Theme Park (Pty) Ltd. was converted into ordinary shares in themunicipal entity. This loan was previously impaired. The reversal of the loan impairment as at 30 June 2010amounting to R1.5m was recognised as revenue in the current financial year.
17. RECEIVABLES
Long-term receivablesLoan:DIDT 140,402 136,237 140,402 136,237Fair Value Adjustment (11,593) (22,706) (11,593) (22,706)Housing Selling scheme loans 130,761 139,621 130,761 139,621First Metro Housing Loans 15,975 18,067 15,975 18,067Land sales 999 21,255 999 21,255Education Loans 10,787 9,167 10,787 9,167Sporting bodies 1,073 2,328 1,073 2,328Car Loans - 1 - 1Housing Bonds - 51 - 51
288,404 304,021 288,404 304,021
Less: Current portion transferred tocurrent receiveables
Housing Selling scheme loans 3,786 4,451 3,786 4,451First Metro Housing Loans 848 959 848 959
Land sales 999 21,255 999 21,255
Education Loans 115 98 115 98Sporting bodies 214 465 214 465Car Loans - 1 - 1Housing Bonds - 25 - 25
5,962 27,254 5,962 27,254
Non-current assetsLong-term receivables 282,442 276,767 282,442 276,767
Current assetsLong-term receivables 5,962 27,254 5,962 27,254
40
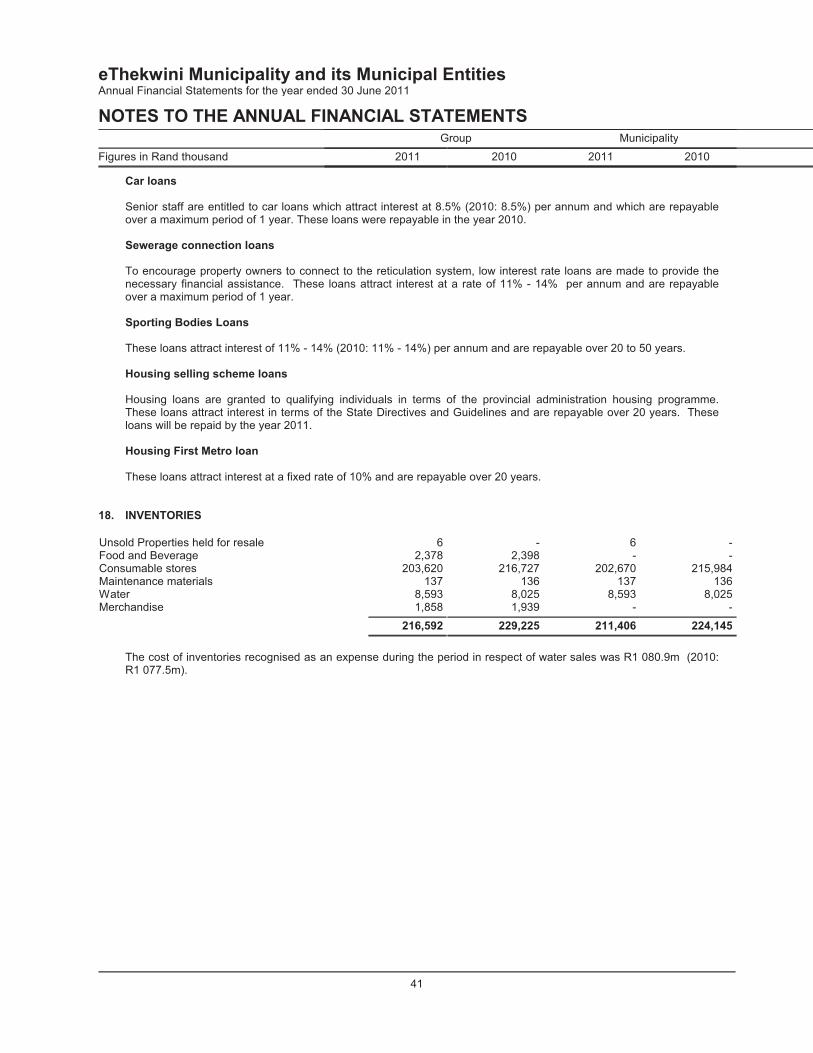
eThekwini Municipality and its Municipal EntitiesAnnual Financial Statements for the year ended 30 June 2011
NOTES TO THE ANNUAL FINANCIAL STATEMENTSGroup Municipality
Figures in Rand thousand 2011 2010 2011 2010
Car loans
Senior staff are entitled to car loans which attract interest at 8.5% (2010: 8.5%) per annum and which are repayableover a maximum period of 1 year. These loans were repayable in the year 2010.
Sewerage connection loans
To encourage property owners to connect to the reticulation system, low interest rate loans are made to provide thenecessary financial assistance. These loans attract interest at a rate of 11% - 14% per annum and are repayableover a maximum period of 1 year.
Sporting Bodies Loans
These loans attract interest of 11% - 14% (2010: 11% - 14%) per annum and are repayable over 20 to 50 years.
Housing selling scheme loans
Housing loans are granted to qualifying individuals in terms of the provincial administration housing programme.These loans attract interest in terms of the State Directives and Guidelines and are repayable over 20 years. Theseloans will be repaid by the year 2011.
Housing First Metro loan
These loans attract interest at a fixed rate of 10% and are repayable over 20 years.
18. INVENTORIES
Unsold Properties held for resale 6 - 6 -Food and Beverage 2,378 2,398 - -Consumable stores 203,620 216,727 202,670 215,984Maintenance materials 137 136 137 136Water 8,593 8,025 8,593 8,025Merchandise 1,858 1,939 - -
216,592 229,225 211,406 224,145
The cost of inventories recognised as an expense during the period in respect of water sales was R1 080.9m (2010:R1 077.5m).
41

eThekwini Municipality and its Municipal EntitiesAnnual Financial Statements for the year ended 30 June 2011
NOTES TO THE ANNUAL FINANCIAL STATEMENTSGroup Municipality
Figures in Rand thousand 2011 2010 2011 2010
19. CONSUMER DEBTORS
Gross BalancesRates 2,180,525 2,231,599 2,180,525 2,231,599Electricity 937,728 770,136 937,728 770,136Water 1,203,894 983,506 1,206,749 984,806Refuse 61,558 46,197 61,558 46,197Regional services levies 4,659 11,071 4,659 11,071Housing rental 66,624 58,399 66,624 58,399Waste water 100,730 11,155 100,730 11,155I.C.C. Debtors 10,053 5,101 - -
Total 4,565,771 4,117,164 4,558,573 4,113,363
Less Provision for bad debtsRates (1,059,306) (1,124,622) (1,059,306) (1,124,622)Electricity (204,567) (190,050) (204,567) (190,050)Water (657,395) (534,798) (657,395) (534,798)Refuse (5,403) (6,642) (5,403) (6,642)Regional services levies (4,659) (11,071) (4,659) (11,071)Housing rental (32,571) (27,057) (32,571) (27,057)Waste water (24,884) - (24,884) -I.C.C. Debtors (3,045) (3,258) - -
Total (1,991,830) (1,897,498) (1,988,785) (1,894,240)
Net BalanceRates 1,121,219 1,106,977 1,121,219 1,106,977Electricity 733,161 580,086 733,161 580,086Water 546,499 448,708 549,354 450,008Refuse 56,155 39,555 56,155 39,555Housing rental 34,053 31,342 34,053 31,342Waste water 75,846 11,155 75,846 11,155I.C.C. Debtors 7,008 1,843 - -
Total 2,573,941 2,219,666 2,569,788 2,219,123
RatesCurrent (0 -30 days) 440,142 633,790 440,142 633,79031 - 60 days 62,361 62,368 62,361 62,36861 - 90 days 49,076 46,561 49,076 46,56191 - 120 days 17,525 40,608 17,525 40,608121 - 365 days 1,056,850 745,530 1,056,850 745,530> 365 days 554,571 702,742 554,571 702,742
Total 2,180,525 2,231,599 2,180,525 2,231,599
Electricity, Water, Solid Waste and WasteWaterCurrent (0 -30 days) 945,150 683,175 945,150 683,17531 - 60 days 67,524 140,199 67,524 140,19961 - 90 days 62,925 47,623 62,925 47,62391 - 120 days 199,531 67,054 199,531 67,054> 120 days 1,031,635 874,243 1,031,635 874,243
Total 2,306,765 1,812,294 2,306,765 1,812,294
42

eThekwini Municipality and its Municipal EntitiesAnnual Financial Statements for the year ended 30 June 2011
NOTES TO THE ANNUAL FINANCIAL STATEMENTSGroup Municipality
Figures in Rand thousand 2011 2010 2011 2010
Regional services levies> 365 days 4,659 11,071 4,659 11,071
Housing rentalCurrent (0 -30 days) 1,928 2,089 1,928 2,08931 - 90 days 1,108 1,034 1,108 1,03491 - 120 days 31,018 28,219 31,018 28,219> 120 days 32,570 27,057 32,570 27,057
Total 66,624 58,399 66,624 58,399
I.C.C. DebtorsCurrent (0 -30 days) 2,188 1,155 - -31 - 60 days 686 438 - -61 - 90 days 1,144 189 - -91 - 120 days 392 341 - ->120 days 5,643 2,978 - -
Total 10,053 5,101 - -
20. DEBTORS
Other Debtors 943,971 1,244,744 920,891 1,118,780Fair Value Adjustment (813) (431) (813) (431)Provision for bad debts (79,317) (127,210) (79,425) (127,270)Insurance debtor 160,412 128,492 160,412 128,492Accruals 1,714,788 1,603,411 1,714,788 1,603,411Prepayments made in advance 14,804 22,420 13,296 20,479
2,753,845 2,871,426 2,729,149 2,743,461
21. CALL INVESTMENT DEPOSITS
30 Day deposits 742,275 1,528,005 650,504 1,430,751
22. VAT
VAT reconciliationVAT receivable 42,182 376,983 42,182 375,850VAT payable (2,966) (25,364) - -
Net Vat 39,216 351,619 42,182 375,850
VAT is payable on the receipts basis. Only once payment is received from debtors is VAT paid over to SARS.
43

eThekwini Municipality and its Municipal EntitiesAnnual Financial Statements for the year ended 30 June 2011
NOTES TO THE ANNUAL FINANCIAL STATEMENTSGroup Municipality
Figures in Rand thousand 2011 2010 2011 2010
23. PROPERTY RATES
Rates received
Residential 1,564,253 1,614,499 1,564,253 1,614,499Agricultural 3,288 2,256 3,288 2,256Agricultural - Prior Year adjustment - (3,274) - (3,274)Vacant Land 465,344 475,173 465,344 475,173Industrial 801,572 743,903 801,572 743,903Business & Commercial 1,207,289 1,114,815 1,224,825 1,122,105Public Service Infrastructure 14,072 24,395 14,072 24,395Unauthorised / Illegal Development 284 122 284 122
Total Assessment Rates 4,056,102 3,971,889 4,073,638 3,979,179
Valuations
Residential 247,376,234 243,346,560 247,376,234 243,346,560Agricultural 1,536,156 1,417,895 1,536,156 1,417,895Vacant Land 17,976,729 22,069,993 17,976,729 22,069,993Industrial 33,859,744 34,265,683 33,859,744 34,265,683Business & Commercial 81,444,791 77,390,069 81,444,791 77,390,069Public Service Infrastructure 10,106,936 8,846,659 10,106,936 8,846,659Unauthorised / Illegal Development 202,816 36,305 202,816 36,305
Total Property Valuations 392,503,406 387,373,164 392,503,406 387,373,164
The following are the rate randages that were applied to the valuations in respect of the various categories:Residential - R 0.00852 (2010:R 0.009); Agriculture - R 0.00213 (2010:R0.0024); Vacant Land - R 0.0408(2010:R0.0378); Industrial - R 0.02493 (2010:R 0.0258); Business and Commercial - R 0.01932 (2010:R 0.0201);Public Service Infrastructure - R 0.00213 (2010:R0.0024). The year-on-year increases in the rate randages wereminimal due to the previously rated sewerage element becoming tariff-based with effect from 1 July 2010. Allresidential property owners are exempt from paying rates on the first R120 000 (2010: R120 000) of their propertyvalue. Pensioners, child-headed households, disability grantees and the medically boarded are exempt from payingrates on the first R400 000 (2010:R400 000) of their property value (inclusive of the R120 000 referred to earlier). Norates are levied on the first R30 000 (2010: R30 000) value of vacant land.
24. SERVICE CHARGES
Sale of electricity 7,001,171 5,622,549 7,022,871 5,619,105Sale of water 1,828,898 1,715,108 1,833,505 1,719,533Solid waste 374,399 342,925 374,399 342,925Sewerage and sanitation charges 559,237 68,133 559,237 68,133Other service charges 127,947 114,278 127,947 114,278
Total service charges 9,891,652 7,862,993 9,917,959 7,863,974
44

eThekwini Municipality and its Municipal EntitiesAnnual Financial Statements for the year ended 30 June 2011
NOTES TO THE ANNUAL FINANCIAL STATEMENTSGroup Municipality
Figures in Rand thousand 2011 2010 2011 2010
25. GRANTS AND SUBSIDIES
Equitable share 1,417,624 1,126,955 1,417,624 1,126,955Municipal infrastructure grant 584,048 494,811 584,048 494,811Tsogo Sun 38,042 - 38,042 -European Union 4,605 29,655 4,605 29,655Provincial health subsidies 51,388 50,745 51,388 50,745Department of Transport and PublicTransport Infrastructure
147,414 539,758 147,414 539,758
Department of Economic Activities andvarious Industries
2,925 2,568 2,925 2,568
Vuna Awards 47 111 47 1112010 KZN Provincial grant 76,497 700,419 76,497 700,419Department of Minerals and Energy Affairs 29,721 1,800 29,721 1,800Tsogo Sun - 95,476 - 95,476Other grants 68,937 83,534 68,937 83,502Donations and Public Contributions 3,104 47,715 3,104 47,715D Moss Land Sales - 74 - 74Neighbourhood Development Partnership 32,693 188,765 32,693 188,765Department of Housing 104,622 343,229 104,622 343,229Danida 10,703 19,363 10,703 19,363Grant Accreditation 16 95 16 95Department of Local Government andTraditional Affairs
17,702 4,954 17,702 4,954
Provincial grants: Library Books - 706 - 706Metropolitan Transport Authority - Taxi ranks 591 1,881 591 1,881A1 Grand Prix - 644 - 644Department of Provincial and LocalGovernment
250 31 250 31
Total grants and subsidies 2,590,929 3,733,289 2,590,929 3,733,257
Equitable share
Balance unspent at beginning of year 3,089 3,048 3,089 3,048Current-year receipts 1,414,535 1,126,996 1,414,535 1,126,996Conditons met - transferred to revenue (1,417,624) (1,126,955) (1,417,624) (1,126,955)
Conditions still to be met - transferred toliabilities
- 3,089 - 3,089
In terms of the Constitution, this grant is used to subsidise the provision of basic services to indigent communitymembers. Unspent portion will be used to provide infrastructure development and job creation in INK as an urbanregeneration programme.
Municipal infrastructure grant
Balance unspent at beginning of year 14,330 191 14,330 191Current-year receipts 595,912 508,950 595,912 508,950Conditons met - transferred to revenue (584,048) (494,811) (584,048) (494,811)
Conditions still to be met - transferred toliabilities
26,194 14,330 26,194 14,330
This grant was used to construct roads and sewerage infrastructure.
45

eThekwini Municipality and its Municipal EntitiesAnnual Financial Statements for the year ended 30 June 2011
NOTES TO THE ANNUAL FINANCIAL STATEMENTSGroup Municipality
Figures in Rand thousand 2011 2010 2011 2010
D Moss Land Sales
Balance unspent at beginning of year 8,362 8,436 8,362 8,436Conditons met - transferred to revenue - (74) - (74)
Conditions still to be met - transferred toliabilities
8,362 8,362 8,362 8,362
The above relates to funding for the acquisition of D Moss land.
Department of Economic Activities and various Industries
Balance unspent at beginning of year 2,295 2,778 2,295 2,778Current-year receipts 2,187 2,085 2,187 2,085Conditons met - transferred to revenue (2,925) (2,568) (2,925) (2,568)
Conditions still to be met - transferred toliabilities
1,557 2,295 1,557 2,295
Funding was obtained from various sources and local industries for the implementation of the South Durban BasinMulti Point Plan. The expenditure is incurred over a multi year period based on the rollout of the projects perprogramme. Further funding will be expended based on the outcome of the Air Quality Management Plan which iscurrently underway.
Department of Transport and Public Transport Infrastructure
Balance unspent at beginning of year 335,273 298,105 335,273 298,105Current-year receipts 130,000 576,926 130,000 576,926Conditons met - transferred to revenue (147,414) (539,758) (147,414) (539,758)
Conditions still to be met - transferred toliabilities
317,859 335,273 317,859 335,273
The funds received and utilised relate to funding for subsidy for traffic and pedestrian planning as well as the Tansnat(2009:Remant Alton) Bus Operating subsidy. Unutilised funds will be expended in the forthcoming year.
Neighbourhood Development Partnership
Balance unspent at beginning of year 9,003 25,216 9,003 25,216Current-year receipts 25,781 172,552 25,781 172,552Conditons met - transferred to revenue (32,693) (188,765) (32,693) (188,765)
Conditions still to be met - transferred toliabilities
2,091 9,003 2,091 9,003
Focus of the grant is to stimulate and accelerate investment in poor underserviced residential neighbourhoods.
46

eThekwini Municipality and its Municipal EntitiesAnnual Financial Statements for the year ended 30 June 2011
NOTES TO THE ANNUAL FINANCIAL STATEMENTSGroup Municipality
Figures in Rand thousand 2011 2010 2011 2010
European Union
Balance unspent at beginning of year 13,819 42,136 13,819 42,136Current-year receipts 709 1,338 709 1,338Conditons met - transferred to revenue (4,605) (29,655) (4,605) (29,655)
Conditions still to be met - transferred toliabilities
9,923 13,819 9,923 13,819
The Municipality has an Area-based Management Programme that focuses on key areas of the Council and enhancesservice delivery and stimulates job and income generation to these basic areas. The European Union formed apartnership with the Council on condition that the funds provided are to be utilised only in these specific areas.
Other grants
Balance unspent at beginning of year 35,706 19,472 35,706 19,472Current-year receipts 76,591 99,322 76,591 99,322Current-year accruals - 414 - 414Conditons met - transferred to revenue (68,937) (83,502) (68,937) (83,502)
Conditions still to be met - transferred toliabilities
43,360 35,706 43,360 35,706
Other Grants and subsidies were utilised during the year to fund various Council projects.
Department of Housing
Balance unspent at beginning of year 13,296 51,271 13,296 51,271Current-year receipts 160,429 305,254 160,429 305,254Conditons met - transferred to revenue (104,622) (343,229) (104,622) (343,229)
Conditions still to be met - transferred toliabilities
69,103 13,296 69,103 13,296
Funding for the administration of Hostels in KwaZulu Natal.
Lamontville and R293 transfer Deeds
Balance unspent at beginning of year - 1,556 - 1,556
This grant was used to fund the maintenance of the Lamontville houses as well as the transfer of the R293 townshiphouses to the beneficiaries.
47

eThekwini Municipality and its Municipal EntitiesAnnual Financial Statements for the year ended 30 June 2011
NOTES TO THE ANNUAL FINANCIAL STATEMENTSGroup Municipality
Figures in Rand thousand 2011 2010 2011 2010
Danida
Balance unspent at beginning of year 831 1,973 831 1,973Current-year receipts 9,872 17,621 9,872 17,621Current-year accruals - 600 - 600Conditons met - transferred to revenue (10,703) (19,363) (10,703) (19,363)
Conditions still to be met - transferred toliabilities
- 831 - 831
These funds are used to enhance existing capacity in Urban Environmental Management. This programme prioritizespoverty reduction and building institutional capacity for enhanced local level delivery of environmentally sustainableservices.
Grant Accreditation
Balance unspent at beginning of year 315 410 315 410Conditons met - transferred to revenue (16) (95) (16) (95)
Conditions still to be met - transferred toliabilities
299 315 299 315
These funds are for the administrative support provided for RDP houses.
Department of Local Government and Traditional Affairs
Balance unspent at beginning of year 8,213 12,167 8,213 12,167Current-year receipts 16,800 1,000 16,800 1,000Conditons met - transferred to revenue (17,702) (4,954) (17,702) (4,954)
Conditions still to be met - transferred toliabilities
7,311 8,213 7,311 8,213
Funding provided for the implementation of projects identified through the KZN Corridor Development Programme andto unlock strategic economic development opportunities within the Northern Municipal Planning Region (NMPR) of thecity.
Donations and Public Contributions
Balance unspent at beginning of year 120,110 142,130 120,110 142,130Current-year receipts 12,860 13,656 12,860 13,656Transfer from Creditors (Incorrectclassification in prior year)
- 12,039 - 12,039
Conditons met - transferred to revenue (3,104) (47,715) (3,104) (47,715)
Conditions still to be met - transferred toliabilities
129,866 120,110 129,866 120,110
The grants were received from various organisations to finance various developments. Included in the above isfunding received from Tsogo Sun for the Suncoast precinct upgrade and the Inner City Distribution System. The abovealso includes a grant to fund the Bayhead Bridge Development Project.
48

eThekwini Municipality and its Municipal EntitiesAnnual Financial Statements for the year ended 30 June 2011
NOTES TO THE ANNUAL FINANCIAL STATEMENTSGroup Municipality
Figures in Rand thousand 2011 2010 2011 2010
2010 KZN Provincial grant
Balance unspent at beginning of year - 125,026 - 125,026Current-year receipts 91,286 575,393 91,286 575,393Conditons met - transferred to revenue (76,497) (700,419) (76,497) (700,419)
Conditions still to be met - transferred toliabilities
14,789 - 14,789 -
The grant was received for the building of the stadium and other constructions in preparation for 2010 FIFA WorldCup.
Provincial grants: Library Books
Current-year receipts - 706 - 706Conditons met - transferred to revenue - (706) - (706)
Conditions still to be met - transferred toliabilities
- - - -
This grant was utilised to fund the acquisition of library materials.
Metropolitan Transport Authority - Taxi ranks
Balance unspent at beginning of year 32 32 32 32Current-year receipts 591 1,881 591 1,881Conditons met - transferred to revenue (591) (1,881) (591) (1,881)
Conditions still to be met - transferred toliabilities
32 32 32 32
Funding from eThekwini Transport fund to contribute towards the upgrading of Taxi Ranks.
A1 Grand Prix
Balance unspent at beginning of year - 644 - 644Conditons met - transferred to revenue - (644) - (644)
Conditions still to be met - transferred toliabilities
- - - -
Funding received for the A1 Grand Prix related roadwork.
Department of Minerals and Energy Affairs
Balance unspent at beginning of year 8,000 - 8,000 -Current-year receipts 25,000 9,800 25,000 9,800Conditons met - transferred to revenue (29,721) (1,800) (29,721) (1,800)
Conditions still to be met - transferred toliabilities
3,279 8,000 3,279 8,000
The grant was used to finance the gas-to-electricity capital project.
49

eThekwini Municipality and its Municipal EntitiesAnnual Financial Statements for the year ended 30 June 2011
NOTES TO THE ANNUAL FINANCIAL STATEMENTSGroup Municipality
Figures in Rand thousand 2011 2010 2011 2010
Department of Provincial and Local Government
Balance unspent at beginning of year 2,250 2,281 2,250 2,281Conditons met - transferred to revenue (250) (31) (250) (31)
Conditions still to be met - transferred toliabilities
2,000 2,250 2,000 2,250
Grant to be utilised for the Shembe Development Precinct (Rural ABM) and the acquisition of land for the Bridge CityProject (INK).
Provincial health subsidies
Inventory received 6,848 8,133 6,848 8,133Current-year receipts 44,540 42,612 44,540 42,612Conditons met - transferred to revenue (51,388) (50,745) (51,388) (50,745)
Conditions still to be met - transferred toliabilities
- - - -
The Municipality renders health services on behalf of the Provincial Government. This grant has been used exclusivelyto fund clinic services (included in the public health vote in Appendix F). The conditions of the grant have been met.There was no delay or withholding of the subsidy.
Tsogo Sun
Balance unspent at beginning of year - 72,476 - 72,476Current-year receipts - 23,000 - 23,000Conditons met - transferred to revenue - (95,476) - (95,476)
Conditions still to be met - transferred toliabilities
- - - -
These funds were received from Tsogo Sun for the Suncoast Precinct upgrade and Inner-City distribution.
Expanded Public Works Programme Incentive
Balance unspent at beginning of year 43,243 - 43,243 -Current-year receipts 17,659 43,243 17,659 43,243Conditons met - transferred to revenue (38,042) - (38,042) -
Conditions still to be met - transferred toliabilities
22,860 43,243 22,860 43,243
This grant is to be used for job creation and poverty alleviation incentives.
Vuna Awards
Balance unspent at beginning of year 2,945 3,056 2,945 3,056Conditons met - transferred to revenue (47) (111) (47) (111)
Conditions still to be met - transferred toliabilities
2,898 2,945 2,898 2,945
The Vuna Awards is an initiative of the Department of Provincial and Local Government, together with its partners inthe coordination of development in local government, the South African Local Government Association, DevelopmentBank of Southern Africa and the National Productivity Institute. The Vuna awards, as the awards are called, reward themunicipalities that provide communities excellent services and governance.
50

eThekwini Municipality and its Municipal EntitiesAnnual Financial Statements for the year ended 30 June 2011
NOTES TO THE ANNUAL FINANCIAL STATEMENTSGroup Municipality
Figures in Rand thousand 2011 2010 2011 2010
26. OTHER INCOME
Sundry Income 596,875 532,770 409,887 365,396Fuel Levy 1,147,254 895,448 1,147,254 895,448
1,744,129 1,428,218 1,557,141 1,260,844
27. FAIR VALUE ADJUSTMENTS
Fair Value Adjustment - Creditors 2,830 81,407 2,830 81,407Fair Value Adjustment - Debtors (382) (852) (382) (852)Fair Value Adjustment - Long-termReceivables
11,113 (76,687) 11,113 (76,687)
Fair Value Adjustment - PPE 33,977 - 33,977 -Investments - Financial Instruments - (34,858) - (34,858)
47,538 (30,990) 47,538 (30,990)
28. EMPLOYEE RELATED COSTS
Employee related costs-Salaries and Wages 3,406,414 2,988,632 3,316,079 2,908,792Bonus - 1,760 - -Medical aid and Pension Benefits 5 816,615 970,806 816,615 968,010
UIF 32,552 28,811 26,460 22,951Leave pay provision contribution 69,774 204,444 69,774 204,151Travel, motor car, accommodation,subsistence and other allowances
134,493 111,978 134,493 111,978
Overtime payments 339,948 354,179 337,280 351,614Housing benefits and allowances 19,298 24,293 19,298 24,293Holiday Bonus 220,808 183,610 220,808 183,610Other 32,459 20,581 30,244 20,581Less: Employee costs capitalised to PPE (148,120) (255,462) (148,120) (255,462)
4,924,241 4,633,632 4,822,931 4,540,518
There were no advances to employees. Loans to employees are set out in note 17.
Included in the employee related costs are the following:
Remuneration of the Municipal Manager
Annual Remuneration 1,545 1,416 1,545 1,416Car Allowance 102 102 102 102Market Allowance 382 382 382 382Contributions to UIF, Medical Aid andPension Funds
21 1 21 1
Total 2,050 1,901 2,050 1,901
51

eThekwini Municipality and its Municipal EntitiesAnnual Financial Statements for the year ended 30 June 2011
NOTES TO THE ANNUAL FINANCIAL STATEMENTSGroup Municipality
Figures in Rand thousand 2011 2010 2011 2010
Remuneration of the Chief Finance Officer
Annual Remuneration 1,096 1,009 1,096 1,009Car Allowance 351 317 351 317Market Allowance 242 242 242 242Contributions to UIF, Medical Aid andPension Funds
238 203 238 203
Total 1,927 1,771 1,927 1,771
Safety and Security
Annual Remuneration 1,463 1,349 1,463 1,349Contributions to UIF, Medical and PensionFunds
17 1 17 1
Total 1,480 1,350 1,480 1,350
Health and Social Services
Annual Remuneration 1,283 684 1,283 684Contributions to UIF, Medical and PensionFunds
42 12 42 12
Car Allowance 120 70 120 70
Total 1,445 766 1,445 766
In the prior-year the above post was vacant for 5 months during the year.
Governance
Annual Remuneration 1,096 1,009 1,096 1,009Car Allowance 351 316 351 316Market Allowance 121 121 121 121Contributions to UIF, Medical Aid andPension Funds
235 198 235 198
Total 1,803 1,644 1,803 1,644
52

eThekwini Municipality and its Municipal EntitiesAnnual Financial Statements for the year ended 30 June 2011
NOTES TO THE ANNUAL FINANCIAL STATEMENTSGroup Municipality
Figures in Rand thousand 2011 2010 2011 2010
Procurements and Infrastructure
Annual Remuneration 1,492 1,365 1,492 1,365Car Allowance 120 120 120 120Market Allowance 210 210 210 210Contributions to UIF, Medical Aid andPension Funds
51 30 51 30
Total 1,873 1,725 1,873 1,725
Sustainable Development and City Enterprises
Annual Remuneration 1,014 1,004 1,014 1,004Car Allowance 150 180 150 180Contributions to UIF, Medical and PensionFunds
48 28 48 28
Total 1,212 1,212 1,212 1,212
I.C.C.: Remuneration of the Chief Executive Officer (vacant)
Annual Remuneration - 1,013 - -Car Allowance - 50 - -Performance Bonuses - 116 - -Contributions to UIF, Medical and PensionFunds
- 89 - -
Total - 1,268 - -
I.C.C.: Remuneration of Executive Managers
Annual Remuneration 4,686 3,449 - -Car Allowance 28 30 - -Performance Bonuses - 102 - -Contributions to UIF, Medical and PensionFunds
442 340 - -
Total 5,156 3,921 - -
Durban Marine Theme Park
Chairman Fees - 25 - -Directors Fees 133 108 - -Accounting Officers Fees 191 180 - -
Total 324 313 - -
53

eThekwini Municipality and its Municipal EntitiesAnnual Financial Statements for the year ended 30 June 2011
NOTES TO THE ANNUAL FINANCIAL STATEMENTSGroup Municipality
Figures in Rand thousand 2011 2010 2011 2010
29. REMUNERATION OF COUNCILLORS
Mayor 950 866 950 866Deputy Mayor 669 708 669 708Mayoral Commitee Members 5,370 3,465 5,370 3,465Speaker 685 705 685 705Councillors 64,328 62,506 64,328 62,506Councillors’ pension contribution 5,917 5,719 5,917 5,719
Total Councillors’ Remuneration 77,919 73,969 77,919 73,969
In-kind Benefits:
The Mayor, Deputy Mayor, Speaker and Mayoral Committee Members are full-time. Each is provided with an officeand secretarial support at the cost of the Council.
The Mayor and the Deputy Mayor each have the use of separate Council owned vehicles for official duties.
The Mayor has three full-time bodyguards . The Deputy Mayor and speaker have two full-time bodyguards.
30. FINANCE COSTS
Non-current borrowings 637,626 470,533 629,741 463,158Consumer Deposits 10,352 8,781 10,352 8,781Other interest paid 44,217 4,976 47,252 9,003
Total Finance costs 692,195 484,290 687,345 480,942
An amount of R215.1m (2010: R230.7m) relating to borrowing costs was capitalised to work-in-progress with 8.73%(2010: 8.75%) being the weighted average cost of funds borrowed generally by the municipality.
31. BULK PURCHASES
Electricity 4,414,590 3,454,403 4,414,590 3,454,403Water 1,080,927 1,077,541 1,080,927 1,077,541
Total Bulk Purchases 5,495,517 4,531,944 5,495,517 4,531,944
32. GRANTS AND SUBSIDIES PAID
Grant paid :Durban Arts Association 2,805 2,805 2,805 2,805Grant paid: Enhanced Extended DiscountBenefit
15,052 33,719 15,052 33,719
Grant paid: Sporting Organisations 35,969 33,216 35,969 33,216Grant paid: Playhouse Company 2,913 2,809 2,913 2,809Grant paid: Natal Philharmonic Orchestra 6,752 6,752 6,752 6,752Grant paid: Tourism Indaba 9,574 10,289 9,574 10,289Grant paid: Trade Point Durban 965 1,096 965 1,096Grant paid: Food Aid Program 6,985 87 6,985 87Grant paid: Other 51,106 48,715 61,606 59,204
Total Grants and Subsidies Paid 132,121 139,488 142,621 149,977
54

eThekwini Municipality and its Municipal EntitiesAnnual Financial Statements for the year ended 30 June 2011
NOTES TO THE ANNUAL FINANCIAL STATEMENTSGroup Municipality
Figures in Rand thousand 2011 2010 2011 2010
33. GENERAL EXPENSES
General Expenses 1,683,728 1,510,030 1,579,262 1,388,427Stadium: Operator costs 63,309 44,229 63,309 44,2292010 World Cup costs 34,864 70,891 34,864 70,891Stadium: Hire of temporary seating 10,779 23,451 10,779 23,451
1,792,680 1,648,601 1,688,214 1,526,998
34. CASH GENERATED FROM OPERATIONS
Surplus for the year 2,214,154 1,781,622 2,226,098 1,858,425Adjustments for:
Depreciation - property, plant and equipment 1,395,536 1,160,212 1,326,977 1,094,060Amortisation of intangibles 98,345 95,079 97,043 94,132Depreciation of investment properties 4,325 3,932 1,805 1,829Surplus on sale of assets (48,851) (78,943) (48,655) (78,943)Deficit on sale of assets 653 56,050 105 56,000Contribution to bad debt provision 324,980 574,189 324,315 572,984Reversal of loss on Impairment: Loans toMunicipal Entities
- - (1,561) -
Share of income from joint venture - - (3,521) (5,238)Loss on Impairment of Investment inMunicipal Entity
- - 62,296 2,889
Interest earned - other (219,621) (303,606) (211,764) (289,846)Finance Costs 692,195 484,290 687,345 480,942Fair value adjustments (47,538) 30,990 (47,538) 30,990Movements in retirement benefit assets andliabilities
(27,180) 257,098 (27,180) 257,098
Contributions to provisions - non current (7,426) 82,310 (7,426) 82,310Contributions to provisions - current 1,477 (535) 1,490 (706)Reversal of loss on impairment: PPE (3,576) - (3,575) (198)Impairment Loss: PPE 458 46,996 458 46,488
Changes in working capital:Inventories 12,633 (4,811) 12,739 (3,597)Decrease/(increase) in other debtors 117,199 (498,637) 13,930 (526,046)Decrease/(increase) in consumer debtors (679,255) (759,270) (674,980) (788,054)Increase in Creditors (261,840) (35,839) (261,325) (26,496)Increase in deposits 150,822 123,232 147,470 124,848(Decrease)/Increase in VAT 312,403 (77,692) 333,668 (78,067)Increase in Unspent conditional grants andreceipts
42,235 (189,767) 42,235 (189,735)
Increase in Deferred Income (2,311) (2,933) - -
4,069,817 2,743,967 3,990,449 2,716,069
55

eThekwini Municipality and its Municipal EntitiesAnnual Financial Statements for the year ended 30 June 2011
NOTES TO THE ANNUAL FINANCIAL STATEMENTSGroup Municipality
Figures in Rand thousand 2011 2010 2011 2010
35. UTILISATION OF LONG-TERM LIABILITES RECONCILIATION
Long-term liabilities 10,209,951 8,767,324 10,110,456 8,674,686Used to finance property, plant andequipment – at cost
(10,209,951) (8,767,324) (10,110,456) (8,674,686)
- - - -
Cash set aside for the repayment oflong-term liabilities
- 27,044 - 27,044
36. COMMITMENTS
36.1 Commitments in respect of capital expenditure
Approved and contracted for� Infrastucture 498,217 561,299 498,217 561,299� Community 40,046 39,965 40,046 39,965� Land and buildings 28 7,096 28 7,096� Other assets 21,194 30,384 21,194 30,384
Approved but not yet contracted for� Infrastucture 766,395 884,882 766,395 884,882� Community 48,250 117,525 48,250 117,525
! Other 4,689 16,164 4,689 16,164
Land and Buildings 110 1,450 110 1,450
Total 1,378,929 1,658,765 1,378,929 1,658,765
Operating leases – as lessee (expenditure)
Minimum lease payments due - within one year 30,881 27,914 30,881 27,914 - in second to fifth year inclusive 111,398 83,744 111,398 83,744 - later than five years 102,714 33,184 102,714 33,184
244,993 144,842 244,993 144,842
36.2 Operating leases – as lessor (income)
The future minimum lease paymentsreceivable under operating leasesare as follows:
- within one year 18,243 19,103 - - - in second to fifth year inclusive 31,907 43,931 - -
50,150 63,034 - -
Durban Marine Theme Park Pty (Ltd) : The operating leases relate to rental contracts derived from Ushaka VillageWalk. The lease agreements were entered into on various dates and will be operational for varying periods, the lastexpiring on 31 March 2017. For the purposes of calculating the lease commitments, options to renew the leases onexpiry have been ignored. The rental escalation percentage varies from lease to lease, the average being about 10%.
ICC Durban Pty (Ltd) : In the prior-year the operating leases relate to rental contracts derived from ICC Durban Pty(Ltd). The lease agreements were entered into on various dates and will be operational for varying periods. For thepurposes of calculating the lease commitments, options to renew the leases on expiry have been ignored. The rentalescalation percentage varies from lease to lease, the average being about 12%.
56

eThekwini Municipality and its Municipal EntitiesAnnual Financial Statements for the year ended 30 June 2011
NOTES TO THE ANNUAL FINANCIAL STATEMENTSGroup Municipality
Figures in Rand thousand 2011 2010 2011 2010
37. CONTINGENCIES
Contractual Disputes 1,123 - 1,123 -
Various departments within the municipality have price disputes with certain contractors.
Self Insurance Reserve 25,759 47,676 25,759 47,676
Various claims submitted to the Insurance department of the municipality are under dispute. The estimated liability ofsuch claims is disclosed.
Property Rates 60,009 52,314 60,009 52,314
During the implementation of the Municipal Property Rates Act (MPRA), ratepayers were given the opportunity toobject to the property valuations used in the computation of their property rates charge. These objections wereinvestigated and resolved. Ratepayers that were dissatisfied with the results of the response may lodge an appeal interms of the MPRA. The appeals process will commence in the near future, once an appeals board has beenestablished by Provincial Treasury to resolve appeals. The valuers from eValuations will be required to attend theappeals hearing in terms of Section 75(3) of the MPRA and their contract. If the ratepayers are successful in theirappeal, the above rates revenue recognised for the year will have to be reversed.
Bank Guarantees 15,509 15,508 15,509 15,508
These guarantee's are issued in favour of the following: - The Member(s), Jeena's Warehouse Close Corporation: R3.6m (Standard Bank) dated 11 November 1998;
- S.A. Post Office: R0.008m (Standard Bank) dated 11 December 1998; - S.A. Post Office: R1.9m (Standard Bank) dated 11 August 2004; - ESKOM Holdings: R7 800 (Standard Bank);
- Durban Marine Theme Park: R10m (First National Bank) dated 29 January 2009.
Legal Claims 151,379 1,250 151,379 1,250
Various claims submitted to the legal department of the municipality are in the process of being resolved. Theestimated liability of such claims, should the claimant be successful, is disclosed.
Legal disputes relate to:Rental charge R4.1m;Value of compensation in respect of expropriation of various properties R13.2m;Price charged in respect of AC Relay Project R108.9m;Various claims for Damages: R5.1m;Cancellation of Contract R20m.
57

eThekwini Municipality and its Municipal EntitiesAnnual Financial Statements for the year ended 30 June 2011
NOTES TO THE ANNUAL FINANCIAL STATEMENTSGroup Municipality
Figures in Rand thousand 2011 2010 2011 2010
38. RELATED PARTIES
`
RelationshipsMunicipal Entities Durban Marine Theme Park (Proprietary) Limited
I.C.C. Durban (Proprietary) LimitedRefer to note 13Ethekwini Transport Authority
Joint Venture Riverhorse Valley Joint VentureRefer to note 15
Councillors / Official with significant influence Durban Infrastructural Development Trust Trustees: G.M. Borman - Councillor R.D. Macpherson - Councillor V.G. Reddy - Councillor J. Balwanth - Council Official M. Tembe - Independent 3rd party P. Ngcobo - Independent 3rd party K. Ragunandan - Independent 3rd party
Councillors / Officials with significant influence Metro Club Trust Fund Trustees: Z.R.T. Gumede - Councillor V.G. Reddy - Councillor B.N. Magwaza - Council Official S.O. Cele - Council Official
Related party balances
Loan accounts - Owing by related partiesI.C.C. Durban (Proprietary) Limited - 226,590Durban Marine Theme Park (Proprietary) Limited - 1,561Loans fully impaired - (228,151)Durban Infrastructural Development Trust 140,402 136,237
140,402 136,237
Amounts included in Trade Receivable regarding related partiesI.C.C. Durban (Proprietary) Limited 1,467 984Durban Marine Theme Park (Proprietary) Limited 1,388 316Metro Club Trust Fund 2,422 2,422
5,277 3,722
Amounts included in Trade Payable regarding related partiesI.C.C. Durban (Proprietary) Limited 4,040 1,375Durban Marine Theme Park (Proprietary) Limited 172 337Ethekwini Transport Authority 50,973 62,548
55,185 64,260
58

eThekwini Municipality and its Municipal EntitiesAnnual Financial Statements for the year ended 30 June 2011
NOTES TO THE ANNUAL FINANCIAL STATEMENTS
Figures in Rand thousand
38. Related parties (continued)
Related party transactions
Sales to related partiesI.C.C. Durban (Proprietary) Limited: Electricity 7,782 6,255 Water 886 574 Operating Lease Rentals - Centrum Parking - 144 Gross Rates 17,536 17,790 Grant-in-Aid (Rates) (10,500) (10,500)Durban Marine Theme Park (Proprietary) Limited Electricity 13,876 11,773 Water 3,721 3,851Riverhorse Valley Joint Venture Electricity and Water 42 25 Income from Joint Venture 3,521 5,328
36,864 35,240
Purchases from related partiesI.C.C. Durban (Proprietary) Limited General Expenses 12,582 7,818Durban Marine Theme Park (Proprietary) Limited General Expenses 1,774 2,295Ethekwini Transport Authority - - General Expenses 2,500 10,489
16,856 20,602
39. PRIOR YEAR ADJUSTMENTS
The following adjustments were made to amounts previously reported in the annual financial statements of theMunicipality and Municipal Entities:
VAT: City Fleet VAT adjustment on capital acquisitions in the period prior to 2009/10.
Debtors:Reversal of over-provision of grant accrual in 2009/10. Under-provision of rental accruals.
Consumer Debtors:Adjustments as a result of valuation appeals.
Housing Development Fund:Additional contribution from Accumulated Surplus to H.D.F. in respect of 2009/10.
Property, Plant and Equipment, Intangible Assets and Investment Properties:In compliance with GRAP 17 useful lives of these assets were reviewed resulting in re-calculation of depreciation andamortisation amounts applicable to prior years.Library books were capitalised for the first time which resulted in prior-year adjustments.
The comparative statements for the 2010 year have been restated to recognise the amendments relating to all of theabove. The effects of the changes are detailed below:
59

eThekwini Municipality and its Municipal EntitiesAnnual Financial Statements for the year ended 30 June 2011
NOTES TO THE ANNUAL FINANCIAL STATEMENTSGroup Municipality
Figures in Rand thousand 2011 2010 2011 2010
39. PRIOR YEAR ADJUSTMENTS (continued)Property, Plant and Equipment
Balance previously reported - 29,578,931 - 28,399,160Accumulated Depreciation Adjustment -Prior to 2009/10
- 46,949 - 46,949
Depreciation Adjustment - 2009/10 - (6,777) - (6,777)Capitalisation of Library Books (cost) - priorto 2009/10
- 92,484 - 92,484
Capitalisation of Library Books (cost) -2009/10
- 9,319 - 9,319
Capitalisation of Library Books(depreciation) - prior to 2009/10
- (70,541) - (70,541)
Capitalisation of Library Books(depreciation) - 2009/10
- (8,177) - (8,177)
City Fleet - VAT Capitalisation adjustment -prior to 2009/10
- 2,434 - 2,434
Durban Marine Theme Park adjustment -prior to 2009/10
- (13,679) - -
Durban Marine Theme Park adjustment -2009/10
- (2,773) - -
- 29,628,170 - 28,464,851
Intangible AssetsBalance previously reported - 326,488 - 324,838Accumulated Amortisation Adjustment -Prior to 2009/10
- 4,566 - 4,566
Amortisation Adjustment - 2009/10 - (756) - (756)
- 330,298 - 328,648
Investment PropertiesBalance previously reported - 430,964 - 296,285Accumulated Depreciation Adjustment -Prior to 2009/10
- (27,706) - (27,706)
Depreciation Adjustment - 2009/10 - (1,438) - (1,438)Durban Marine Theme Park adjustment -prior to 2009/10
- 1,133 - -
Durban Marine Theme Park adjustment -2009/10
- 251 - -
- 403,204 - 267,141
60

eThekwini Municipality and its Municipal EntitiesAnnual Financial Statements for the year ended 30 June 2011
NOTES TO THE ANNUAL FINANCIAL STATEMENTSGroup Municipality
Figures in Rand thousand 2011 2010 2011 2010
39. PRIOR YEAR ADJUSTMENTS (continued)Housing Development Fund
Balance previously reported - 292,225 - 292,225Transfer from Accumulated Surplus - 49,000 - 49,000
- 341,225 - 341,225
Accumulated SurplusBalance previously reported - 21,251,154 - 20,657,169Accumulated Depreciation adjustment: PPE- prior to 2009/10
- 46,949 - 46,949
Depreciation adjustment: PPE - 2009/10 - (6,777) - (6,777)Capitalisation of Library Books: GeneralExpenses - prior to 2009/10
- 92,484 - 92,484
Capitalisation of Library Books: GeneralExpenses - 2009/10
- 9,319 - 9,319
Capitalisation of Library Books: Depreciation- prior to 2009/10
- (70,541) - (70,541)
Capitalisation of Library Books: Depreciation- 2009/10
- (8,177) - (8,177)
Accumulated Depreciation adjustment:Investment Properties - prior to 2009/10
- (27,706) - (27,706)
Depreciation adjustment: InvestmentProperties - 2009/10
- (1,438) - (1,438)
Accumulated Amortisation adjustment:Intangibles - prior to 2009/10
- 4,566 - 4,566
Amortisation adjustment: Intangibles -2009/10
- (756) - (756)
Transfer to Housing Development Fund -2009/10
- (49,000) - (49,000)
Reversal of M.I.G. Grant recognised asrevenue - 2009/10
- (21,740) - (21,740)
Debtors: Rental of Facilities adjustment -prior to 2009/10
- 298 - 298
Debtors: Rental of Facilities adjustment -2009/10
- 47 - 47
Consumer Debtors: Rates Incomeadjustment - prior to 2009/10
- (159,075) - (159,075)
Consumer Debtors: Rates Incomeadjustment - 2009/10
- (114,264) - (114,264)
Durban Marine Theme Park PPE adjustment- prior to 2009/10
- (13,679) - -
Durban Marine Theme Park PPE adjustment- 2009/10
- (2,773) - -
Durban Marine Theme Park InvestmentProperty adjustment - prior to 2009/10
- 1,133 - -
Durban Marine Theme Park InvestmentProperty adjustment - 2009/10
- 251 - -
- 20,930,275 - 20,351,358
61

eThekwini Municipality and its Municipal EntitiesAnnual Financial Statements for the year ended 30 June 2011
NOTES TO THE ANNUAL FINANCIAL STATEMENTSGroup Municipality
Figures in Rand thousand 2011 2010 2011 2010
39. PRIOR YEAR ADJUSTMENTS (continued)
Consumer DebtorsBalance previously reported - 2,493,003 - 2,492,460Rates adjustments - prior to 2009/10 - (159,073) - (159,073)Rates adjustments - 2009/10 - (114,264) - (114,264)
- 2,219,666 - 2,219,123
Other DebtorsBalance previously reported - 2,892,821 - 2,764,856Reversal of Accrual for M.I.G. Grant -2009/10
- (21,740) - (21,740)
Rental of Facilities adjustment - prior to2009/10
- 298 - 298
Rental of Facilities adjustment - 2009/10 - 47 - 47
- 2,871,426 - 2,743,461
VATBalance previously reported - 354,053 - 378,284City Fleet - PPE Capitalisation adjustment - (2,434) - (2,434)
- 351,619 - 375,850
40. TRAFFIC FINES
Traffic fines issued but not yet recovered atyear end.
1,118,032 1,022,657 1,118,032 1,022,657
The recoverability of outstanding traffic fines is uncertain.
41. COMPARISON WITH THE BUDGET
The comparison of the Municipality's actual financial performance with that budgeted is set out in Annexure's C(1) andC(2).
62

eThekwini Municipality and its Municipal EntitiesAnnual Financial Statements for the year ended 30 June 2011
NOTES TO THE ANNUAL FINANCIAL STATEMENTSGroup Municipality
Figures in Rand thousand 2011 2010 2011 2010
42. UNAUTHORISED, IRREGULAR, FRUITLESS AND WASTEFUL EXPENDITURE DISALLOWED
Cases reported during the 2010/11year are included below:
Supplier double charges on VAT resulting inoverpayment
- 1,035 - 1,035
Supplier overcharging of 10% administrationfee
- 49 - 49
Supplier irregular invoicing resulting inovercharging
- 121 - 121
Payments without any invoice - 17 - 17Irregular awarding of refurbishing work andrepairs to Metro Police Vehicles
- 43 - 43
The irregular expenditure relating to Housingwas awarded to contractors / consultants inaccordance with Council's delegatedauthority to the Head of Housing dated11/11/1997, to enter into contracts forhousing development in terms of NationalHousing Programs. This expenditure isdeemed to be irregular as the expenditurewas not reported to the Accounting Officerfor disclosure purposes. In the procurementof these goods and services due care wastaken to ensure that Council received valuefor money without compromising quality andwith minimum risk to Council.
576,905 428,869 576,905 428,869
Parks, Recreation & Culture: Non-compliance with S.C.M. - splitting of orders
2,247 6,820 2,247 6,820
Non-compliance with S.C.M. - various 612,014 - 612,014 -49 awards made to entities whose directors /members / principal shareholders /stakeholders were in the service ofeThekwini municipality
26,888 6,831 26,888 6,831
123 awards made to 109 entities whosedirectors / members / principal shareholders/ stakeholders were in the service of otherState institutions
- 44,265 - 44,265
7 awards made to entities whose directors /members / principal shareholders /stakeholders were in the service ofeThekwini municipality as Councillors
16,978 11,436 16,978 11,436
Consultant appointment non-compliancewith SCM: variation order
- 10,813 - 10,813
Durban Marine Theme Park (Pty) Ltd. -Non-compliance with Supply ChainManagement policy
- 3,156 - -
I.C.C. Durban (Pty) Ltd. - Non-compliance with Supply ChainManagement policy
10,830 19,121 - -
63

eThekwini Municipality and its Municipal EntitiesAnnual Financial Statements for the year ended 30 June 2011
NOTES TO THE ANNUAL FINANCIAL STATEMENTSGroup Municipality
Figures in Rand thousand 2011 2010 2011 2010
Investigations are still in progress regarding 10 other cases (2010: 15), the details of which are summarised asfollows:
• 9 cases (2010: 8) relating to non-compliance with Supply Chain Management policy totalling R2.1million (2010:R38.9million).• 1 case (2010: 2) relating to contractual overpayments totalling R0.3million (2010: R0.4million).
Irregular expenditure
Reconciliation of irregularexpenditure
Opening balance 915,680 383,664 874,315 364,526Irregular expenditure current year 1,245,862 532,576 1,235,032 510,299Recoveries / Condonements current year (1,194,230) (510) (1,194,230) (510)I.C.C. Durban (Pty) Ltd. - Recovery /Writtenoff current year
(29,951) (50) - -
Irregular expenditure awaitingcondonement
937,361 915,680 915,117 874,315
A report, in terms of section 170 (2) of the Municipal Finance Management Act No. 56 of 2003,has been submitted toNational Treasury for the condonation of irregular expenditure .
43. ADDITIONAL DISCLOSURE IN TERMS OF MUNICIPAL FINANCE MANAGEMENT ACT
Contributions to organized localgovernment
Council subscriptions 9,100 6,000 9,100 6,000Amount paid - current year (9,100) (6,000) (9,100) (6,000)
Balance unpaid (included in creditors) - - - -
Audit feesCurrent year audit fee 3,916 2,695 2,858 1,690Previous years audit fee 11,755 9,432 11,675 8,976Amount paid - current year (3,916) (2,695) (2,858) (1,690)Amount paid - previous years (11,755) (9,432) (11,675) (8,976)
Balance unpaid (included in creditors) - - - -
VATVAT received(paid) for the year 642,456 570,714 619,177 649,910
PAYE and UIFOpening balance - 292 - -Current year payroll deductions 678,318 568,306 668,821 563,332Amount paid - current year (677,997) (568,306) (668,821) (563,332)Amount paid - previous years - (292) - -
Balance unpaid (included in creditors) 321 - - -
64

eThekwini Municipality and its Municipal EntitiesAnnual Financial Statements for the year ended 30 June 2011
NOTES TO THE ANNUAL FINANCIAL STATEMENTSGroup Municipality
Figures in Rand thousand 2011 2010 2011 2010
Pension and Medical Aid Deductions
Opening balance - 479 - -Current year payroll deductions and CouncilContributions
1,144,787 1,004,990 1,131,640 1,002,383
Amount paid - current year (1,144,190) (1,004,990) (1,131,640) (1,002,383)Amount paid - previous years - (479) - -
Balance unpaid (included in creditors) 597 - - -
Councillors arrears
The following Councillors had arrear accounts outstanding for more than 90 days at any point of the respectivefinancial years:
30 June 2011Amount
OutstandingRands
Councillor Bayeni M 2,472Councillor Moyo F 7,293
9,765
30 June 2010Amount
OutstandingRands
Councillor Mabaso M 1,554Councillor Majola 1,936Councillor Ngwane B 420Councillor Hoosman N 17,149Councillor Shabalala A 2,774Councillor Gangile T 364Councillor Zwane P 272Councillor Cele G 5,605Councillor Bhengu M 3,323Councillor Magubane Z.E. (amount indispute)
52,764
Councillor Magwaza T.D. (amount indispute)
8,815
94,976
44. COMPARATIVE FIGURES
Certain comparative figures have been restated (refer note 39 for details).
45. TAXATION
No provision has been made for the taxation of municipal entities as they have an assessed loss of R378 083 619(2010: R423 689 449), which is available for set-off against future taxable income. No deferred tax asset has beenraised.
65

eThekwini Municipality and its Municipal EntitiesAnnual Financial Statements for the year ended 30 June 2011
NOTES TO THE ANNUAL FINANCIAL STATEMENTSFigures in Rand thousand
46. LEASES (INCOME) - LESSOR
Rental income recognised from operating leases have not been accounted for on the straight-line basis over the leaseterms for the following reasons:
Approximately 50% of lease income is short term ie. the lease is terminable at 1 to 3 months notice; Approximately 45% of long term lease income is based on turnover ie. subjective and not fixed.
Lease income is recognised as it accrues. The straight-lining of lease income is considered not to provide a fairreflection of income from leases.
47. BIOLOGICAL ASSETS
Group 2011 2010
Cost Accumulateddepreciation
Carrying value Cost Accumulateddepreciation
Carrying value
Birds 36 - 36 - - -
Reconciliation of biological assets - Group - 2011
OpeningBalance
Additions Total
Birds - 36 36
48. DISCLOSURE IN TERMS OF SUPPLY CHAIN MANAGEMENT POLICY
During the year there were contracts awarded of more than R2 000 to various employees of council or people who arespouse's, children or parents of people in the service of the municipality amounting to R26.9million (2010: R85.7million) and awards of R16.9million(2010: R11.4million) to companies of which councillor's or close family members ofcouncillor's are shareholders or directors.
Contract awards in terms of Section 36 (Deviation from, and ratification of minor breaches of, procurement processes)of the Supply Chain Management Policy amounted to:
Municipality: R469 million (2010: R1.049billion);Durban Marine Theme Park (Pty) Ltd.: R3.9 million (2010: R12.4million);
I.C.C. Durban (Pty) Ltd.: R1.1 million (2010: R4.9 million).
66

eThekwini Municipality and its Municipal EntitiesAnnual Financial Statements for the year ended 30 June 2011
NOTES TO THE ANNUAL FINANCIAL STATEMENTSFigures in Rand thousand
49. FINANCIAL INSTRUMENTS
Exposure to interest rate, credit risk and liquidity risks arise in the normal course of the municipality's operations.
Financial Risk Management
The Municipality has exposure to the following risks from its use of Financial Instruments:� Liquidity risk� Interest rate risk� Credit risk
This note presents information about the Municipality's exposure to each of the above risks and the Municipality'sobjectives, policies and processes for measuring and managing risks.
Further quantitative disclosures are included throughout these financial statements.
The Accounting Officer has overall responsibility for the establishment and oversight of the Municipality's riskmanagement framework. The Municipality's risk management policies are established to identify and analyse therisks faced by the Municipality, to set appropriate risk limits and controls and to monitor risks and adherenceto limits. Risk management policies and systems are reviewed regularly to reflect changes to market conditions and the Municipality's activities.
As part of managing the municipality's liquidity risk Promissory notes have been issued to facilitate the timeousrepayment of the borrowings. No further terms and conditions are attached to these promissory notesother than the normal repayment terms and conditions of the loan repayment.
The Municipality, through its training and management standards and procedures, aims to develop a disciplinedand constructive environment in which all employees understand their roles and obligations.
Categories of Financial Instruments - Group:
2011 2010Financial Assets:Investments and Receivables
Investments 2,450,000 327,044Cash and cash equivalents 824,026 1,572,514Long-term receivables 288,404 304,021Consumer Debtors 2,573,941 2,219,666Debtors 2,753,845 2,871,426
Financial Liabilities:Liabilities and Creditors
Long-term liabilities 10,209,951 8,767,324Creditors 4,441,190 4,705,860
Fair values versus carrying amounts:
The fair values of financial assets and liabilities, together with the carrying amounts shown in the balance sheet are asfollows:
2011 2011 2010 2010Carryingamount
Fairvalue
Carryingamount
Fairvalue
Investments 2,450,000 2,450,000 327,044 327,044Long-term receivables 299,997 288,404 326,727 304,021Consumer Debtors 2,573,941 2,573,941 2,569,788 2,569,788Debtors 2,754,658 2,753,845 2,871,857 2,871,426Long-term Liabilities 10,209,951 10,209,951 8,767,324 8,767,324Creditors 4,456,291 4,441,190 4,718,131 4,705,860
67

eThekwini Municipality and its Municipal EntitiesAnnual Financial Statements for the year ended 30 June 2011
NOTES TO THE ANNUAL FINANCIAL STATEMENTSFigures in Rand thousand
49. FINANCIAL INSTRUMENTS (continued)Categories of Financial Instruments - Municipality:
2011 2010Financial Assets:Investments and Receivables
Investments 2,450,000 327,044Cash and cash equivalents 657,678 1,440,863Long-term receivables 288,404 304,021Consumer Debtors 2,569,788 2,219,123Debtors 2,729,149 2,743,461
Financial Liabilities:Liabilities and Creditors
Long-term liabilities 10,110,456 8,674,686Creditors 4,443,134 4,707,289
Fair values versus carrying amounts:
The fair values of financial assets and liabilities, together with the carrying amounts shown in the balance sheet are asfollows:
2011 2011 2010 2010Carryingamount
Fairvalue
Carryingamount
Fairvalue
Investments 2,450,000 2,450,000 327,044 327,044Long-term receivables 299,997 288,404 326,727 304,021Consumer Debtors 2,569,788 2,569,788 2,219,123 2,219,123Debtors 2,729,962 2,729,149 2,743,892 2,743,461Long-term Liabilities 10,110,456 10,110,456 8,674,686 8,674,686Creditors 4,458,235 4,443,134 4,719,560 4,707,289
Basis for determining fair value:
The following summarises the significant methods and assumptions used in estimating the fair values of the FinancialInstruments reflected in the tables above:
Debtors and Creditors:
The fair value of Debtors and Creditors is estimated as the present value of future cash flows, discounted at themarket rate of interest at the reporting date.
68

eThekwini Municipality and its Municipal EntitiesAnnual Financial Statements for the year ended 30 June 2011
NOTES TO THE ANNUAL FINANCIAL STATEMENTSFigures in Rand thousand
49. FINANCIAL INSTRUMENTS (continued)Liquidity risk
Liquidity risk is the risk that the municipality will encounter in raising funds to cover future commitments. Themunicipality manages liquidity risk through an ongoing review of future commitments and credit facilities. Cash flowforecasts are prepared and adequate utilised borrowing facilities are monitored. The following are details of thecontractual maturities of financial liabilities:
Standard Bank:Ethekwini Municipality - Derivative Trading: R70 000 000;Ethekwini Municipality - Letter of Credit: R1 500 000;Ethekwini Municipality - Performance guarantee: R6 000 000;Ethekwini Municipality - Overdraft: R200 000 000;I.C.C. Durban - Credit card: R228 000;I.C.C. Durban - Performance guarantee: R550 000.
The total of these facilities amount to R278 278 000.
GROUP: Carryingamount
Contractualcash flows
12 monthsor less
More than12 months
30 June 2011Long-term Liabilities 10,209,951 10,209,951 693,376 9,516,575Creditors 4,456,291 4,456,291 4,354,076 102,215
30 June 2010Long-term Liabilities 8,767,324 8,767,324 524,974 8,242,350Creditors 4,718,131 4,718,131 4,662,463 55,668
MUNICIPALITY: Carryingamount
Contractualcash flows
12 monthsor less
More than12 months
30 June 2011Long-term Liabilities 10,110,456 10,110,456 692,416 9,418,040Creditors 4,458,235 4,458,235 4,356,020 102,215
30 June 2010Long-term Liabilities 8,674,686 8,674,686 524,974 8,149,172Creditors 4,707,289 4,707,289 4,651,621 55,668
Interest rate risk
The municipality's policy is to manage interest rate risk so that fluctuations in variable rates do not have a materialimpact on surplus (deficit). All long-term debt is at fixed rates.
The municipality's income and operating cash are substantially independent of changes in market rates. Themunicipality has no significant interest bearing assets.
69

eThekwini Municipality and its Municipal EntitiesAnnual Financial Statements for the year ended 30 June 2011
NOTES TO THE ANNUAL FINANCIAL STATEMENTSFigures in Rand thousand
49. FINANCIAL INSTRUMENTS (continued)Credit risk
Credit risk consists mainly of cash deposits, cash equivalents and trade debtors. The municipality only deposits cashwith major banks with high quality credit standing and limits exposure to any one counter-party. Trade receivablescomprise a widespread customer base. The Municipality has no control over the approval of new customers whoacquire properties in the designated metro area and consequently incur rates, water and electricity debts. The municipality limits this risk exposure in the following ways, in addition to its normal credit control and debtmanagement procedures:
- through the application of section 118(3) of the Municipal Systems Act (MSA), which permits the municipality torefuse connection of services whilst any amount remains outstanding from a previous debtor on the same property.
- a new owner is advised, prior to the issue of a revenue clearance certificate, that any debt remaining from theprevious owner will be transferred to the new owner, if the previous owner does not settle the outstanding amount.
- through the consolidation of rates and service accounts, thereby disconnecting services for the non-payment ofany of the individual debts, in terms of section 102 of the MSA.
Long term Receivables and Other Debtors are individually evaluated annually at balance sheet date for impairment ordiscounting.
The maximum credit and interest risk exposure in respect of the relevant financial instrument is as follows:
`
Financial instrument Group - 2011 Group - 2010 Municipality -2011
Municipality -2010
Consumer Debtors 2,573,941 2,219,666 2,569,788 2,219,123Other Debtors 2,753,845 2,871,426 2,729,149 2,743,161Cash and Cash Equivalents 824,026 1,572,514 657,678 1,440,863
The ageing of trade receivables at the reporting date was as follows:
Consumer Debtors:Gross 0 - 30 days 1,387,906 1,320,209 1,387,220 1,319,054 31 - 120 days 489,749 433,334 491,068 433,666 More than 120 days 2,688,116 2,363,621 2,680,285 2,360,643Less: Provision for Bad Debts (1,991,830) (1,897,498) (1,988,785) (1,894,240)
Net Consumer Debtors 2,573,941 2,219,666 2,569,788 2,219,123
Movement in the provision for BadDebts:
Balance at beginning of year 2,024,708 1,881,179 2,021,510 1,919,680Contribution 324,980 574,189 324,315 572,984Bad debts written off (278,541) (430,660) (398,699) (471,154)
Balance at year end 2,071,147 2,024,708 1,947,126 2,021,510
70

eThekwini Municipality and its Municipal EntitiesAnnual Financial Statements for the year ended 30 June 2011
NOTES TO THE ANNUAL FINANCIAL STATEMENTSFigures in Rand thousand
50. MATERIAL LOSSES
Water:Significant water losses of 104,321,876 kl (2010: 124,847,528 kl) occurred during the year under review, whichresulted in material revenue losses to the municipality. The estimated water losses amounting to R360,4m (2010:R406,2m) were due mainly to deterioration in the water reticulation system and water theft. The acceptable norm indeveloping countries is a water loss of 20%. The loss above the norm amounts to R143.3m (2010: R189.6m). Sincethe 2007 financial year the municipality has embarked on an AC-Mains replacement programme to replace ageinginfrastructure ,which was completed in the 2011 financial year.In addition other water loss interventions have beenimplemented,namely Pressure Reduction Valves,Advanced Pressure Management,Leak detection and RepairRegularising of Illegal Connections and Informal Area Metering to reduce water loss .
Electricity:Significant electricity losses of 630,883,534kWh (2010: 567,719,675 kWh) occurred during the year under reviewwhich resulted in material revenue losses to the municipality. These estimated electricity losses amounted to R262.8m(2010: R160.4m). The norm for electricity losses is 3% which is as a result of transmission losses. The loss incurredby the municipality is 5.5% (2010:5.2%) and is therefore due to a combination of transmission losses and losses dueto illegal connections.
Bad Debts written off:Debt of R271m (2010:456m) was written off during the year. 30% of the debt written off was interest raised onprescribed debt. Only the capital amount was written off in the previous year, in the current year interest relating tothis debt was written off. Prescribed debt is debt that cannot be legally recovered. The Municipality took steps to write-off this debt which is considered irrecoverable so that efforts can be focused on debt that can still be recovered. Thisdebt was written off in terms of Prescription Act which forbids the Municipality to recover prescribed debt as advised byour legal advisor. 38% of the debt written off was rental debt owed by Hostel residents.
Durban Marine Theme Park (Pty) Ltd. :Debts totalling R0.1m (2010: R1.2m) were impaired in the current year as they were no longer recoverable.
71

eThekwini Municipality and its Municipal EntitiesAnnual Financial Statements for the year ended 30 June 2011
NOTES TO THE ANNUAL FINANCIAL STATEMENTSFigures in Rand thousand
51. BANK BALANCES
Account number - Bank - AccountDescription
Cash BookBalance
30June 2011
BankStatement
balance30June 2011
Cash BookBalance
30June 2010
BankStatement
balance30June 2010
62085728106 - FNB - Main Expenditure - - 57,547 (361,867)050134353 - Standard Bank - Main Expenditure 3,872 (59,644) - -62085728263 - FNB - Main Expenditure EFT - - 33 (758,878)050133535 - Standard Bank - Main ExpenditureEFT
(975) (843,485) - -
62085720722 - FNB - Direct Deposits Account - 2,066 10,179 290,851050133969 - Standard Bank - Direct DepositsAccount
8,884 280,413 - -
62085725855 - FNB - Electronic DepositsAccount
- 4,274 26,384 1,343,203
050134116 - Standard Bank - ElectronicDeposits Account
23,897 1,527,204 - -
62085729948 - FNB - Cashiers Deposit Account - - (8,892) 156,139050134132 - Standard Bank - Cashiers DepositAccount
(5,948) 476,770 - -
62085730119 - FNB - Government DepositAccount
- - 25,190 595,304
050134140 - Standard Bank - GovernmentDeposit Account
6,759 80,233 - -
62085721952 - FNB - Electricity IncomeAccount
- - 1,899 9,984
050134655 - Standard Bank - Electricity IncomeAccount
2,062 6,958 - -
62085721481 - FNB - Electricity Prepaid VendorDeposits
- - 10,267 54,525
050134671 - Standard Bank - Electricity PrepaidVendor Deposits
2,830 48,979 - -
62085729071 - FNB - SARS E-Filing Account - - - -050134469 - Standard Bank - SARS E-FilingAccount
6,102 6,102 - -
62085725996 - FNB - Dishonoured ChequesAccount
- - (1,103) (2,196)
050134442 - Standard Bank - DishonouredCheques Account
(2,383) (999) - -
050073117 - Standard Bank - Main ExpenditureBank
20 20 262 262
62116972599 - FNB - Housing OperatingAccount
- - - -
62085721275 - FNB - Mayors Relief Account - - - -62085721332 - FNB - Direct Debit CollectionsAccount
- - - 54,431
050133993 - Standard Bank - Direct DebitCollections Account
- 67,509 - -
62085721762 - FNB - Transwitch Account - - 81 99,390050134019 - Standard Bank - TranswitchAccount
(1,588) 118,401 - -
62085722546 - FNB - Agents Deposit Account - - 21,804 84,484050134094 - Standard Bank - Agents DepositAccount
1,778 77,055 - -
62085722877 - FNB - Metro Police DepositAccount
- - - 3,882
050134213 - Standard Bank - Metro PoliceDeposit Account
- 3,937 - -
62085729790 - FNB - Metro Police TranswitchDeposit Account
- - - 1,016
050134183 - Standard Bank - Metro PoliceTranswitch Deposit Account
- 590 - -
72

eThekwini Municipality and its Municipal EntitiesAnnual Financial Statements for the year ended 30 June 2011
NOTES TO THE ANNUAL FINANCIAL STATEMENTSFigures in Rand thousand
62085723495 - FNB - Parks, Recreation andCulture Deposit Acc.
- - 211 (1,106)
050134248 - Standard Bank - Parks, Recreationand Culture Deposit Acc.
457 2,647 - -
62085723776 - FNB - City Engineers Account - - 398 3,187050134264 - Standard Bank - City EngineersAccount
365 4,204 - -
62085724992 - FNB - Durban Tourism DepositAccount
- - 105 151
050134272 - Standard Bank - Durban TourismDeposit Account
- 158 - -
050134531 - Standard Bank - Central ForeignRand Account
- (975) - -
050134574 - Standard Bank - Water ForeignRand Account
- 253,041 - -
62085729534 - FNB - Virginia Airport Account - - 1 434050134299 - Standard Bank - Virginia AirportAccount
21 819 - -
62116972755 - FNB - Department of HousingAccount
- - 825 8,521
050134329 - Standard Bank - Department ofHousing Account
2 92,114 - -
62085728908 - FNB - Sundry PAYE Account - - 472 472050134450 - Standard Bank - Sundry PAYEAccount
458 485 - -
62085729245 - FNB - Cash Payments Account - - 91 (752)050134507 - Standard Bank - Cash PaymentsAccount
25 (1,167) - -
62088851764 - FNB - Refunds ExpenditureAccount
- - 4,543 218
050134426 - Standard Bank - RefundsExpenditure Account
29,338 844 - -
62085724542 - FNB - Water and SanitationServices Expenditure Acc.
- - 365 (928)
050134582 - Standard Bank - Water andSanitation Services Expenditure Account
457 (1,208) - -
62085724732 - FNB - Water and SanitationServices EFT Account
- - 3 (306,256)
050133616 - Standard Bank - Water andSanitation Services EFT Account
(307) (542,174) - -
62085722348 - FNB - Electricity ExpenditureAccount
- - (7,255) (7,256)
050134701 - Standard Bank - ElectricityExpenditure Account
(714) (616) - -
62085722463 - FNB - Electricity EFT Account - - (362,593) (362,593)050133608 - Standard Bank - Electricity EFTAccount
(530,421) (530,421) - -
62085738750 - FNB - Salaries Account - - - (201,285)050133586 - Standard Bank - Salaries Account 48,494 (335,960) - -62085727661 - FNB - Durban Fresh ProduceMarket Account
- - 10,594 10,508
050134590 - Standard Bank - Durban FreshProduce Market Account
13,040 13,016 - -
62151500496 - FNB - CIFAL Durban Account - - 1,336 1,336050134515 - Standard Bank - CIFAL DurbanAccount
20 20 - -
62085727116 - FNB - General Bank Account - - 115,986 (662,710)050134493 - Standard Bank - General BankAccount
391,782 (692,687) - -
62085729378 - FNB - Bank Charges Account - - - (1,285)050134434 - Standard Bank - Bank ChargesAccount
(28) 271 - -
62246569191 - FNB - 2010 Host City OperatingAccount
- - 26,000 26,000
73

eThekwini Municipality and its Municipal EntitiesAnnual Financial Statements for the year ended 30 June 2011
NOTES TO THE ANNUAL FINANCIAL STATEMENTSFigures in Rand thousand
62121186705 - FNB - 2010 Soccer GrantAccount
- - 65,286 8,567
050134345 - Standard Bank - 2010 SoccerGrant Account
1,710 1,710 - -
Totals:ETHEKWINI MUNICIPALITY
Bank balances 542,373 3,089,640 379,862 2,752,865 Bank overdraft (542,364) (3,009,336) (379,843) (2,667,112)
Durban Marine Theme Park (Proprietary)Limited:50003801489 - Investec Bank - BusinessAccount
21,224 21,224 13,082 13,082
50003530849 - Investec Bank - Account - - 3,031 3,031100027X021905914 - RMB - Account 2,338 2,338 8,000 8,00062205707732 - FNB Durban - Current Account - - 1,568 1,56862205752282 - FNB Durban - Retail BankAccount
- - 360 360
050139452 - Standard Bank - Retail BankAccount
202 202 - -
050139495 - Standard Bank - Schools Account 9 9 - -050139509 - Standard Bank - Main DepositAccount
2,537 2,537 - -
443362 - Investec Bank - Account 10,275 10,275 - -I.C.C. Durban (Proprietary) Limited:50226959 - Standard Bank 194 194 1,266 1,266332845 - Standard Bank - - - -50881201632 - FNB 1,920 1,920 1,608 1,60850018949 - Standard Bank 1 1 616 61662205575387 - FNB 336 336 323 32350138162 - Standard Bank 6,232 6,232 - -50138197 - Standard Bank 392 392 - -Effingham Development Joint Venture:Bank Balances 28,024 - 14,311 -Totals: MUNICIPAL ENTITIES Bank balances 73,684 45,660 44,165 29,854
Totals: GROUP Bank balances 616,057 3,135,300 424,027 2,782,719 Bank overdraft (542,364) (3,009,336) (379,843) (2,667,112)
74

eThekwini Municipality and its Municipal EntitiesAnnual Financial Statements for the year ended 30 June 2011Notes to the Annual Financial StatementsFigures in Rand thousand
52: EXTERNAL LOANS FOR THE YEAR ENDED 30 JUNE 2011
DescriptionLoan
NumberInterest
RateDate
RepayableBalance at
30/06/10Received
during the year
(Redeemed) / Interest
Capitalised during this
period
Balance at 30/06/11
% R'000 R'000 R'000 R'000LONG TERM LOANS
Stock Loan K34 14.6 30/06/2013 200 0 0 200
Total Stock Loans 200 0 0 200
FRB PN 1/58 Variable 30/06/2016 203,074 0 (13,872) 189,202 INCA INDWA 1/66 9.52 30/06/2020 402,487 0 (25,582) 376,905 Nedbank Ltd 1/67 8.47 31/03/2021 764,600 0 (44,389) 720,211 DBSA Ph 1 P1 13.5 30/09/2017 481,330 0 (39,957) 441,373 DBSA Ph 2 P2 Variable 31/03/2016 219,723 0 (31,854) 187,869 DBSA Ph 3 P3 12.9 30/09/2017 324,987 0 (25,215) 299,772 DBSA Ph 4 P4 10.4 30/06/2019 432,668 0 (31,010) 401,658 DBSA Ph 5 P5 8.9 30/06/2020 251,995 0 (15,351) 236,644 DBSA Ph 6 P5 8.75 30/06/2022 710,385 0 (35,438) 674,947 DBSA Ph 7 P7 8.3 02/01/2028 2,780,340 0 (71,055) 2,709,285 Nedbank Ltd 7 yrs 1/70 10.09 28/02/2017 516,724 0 (53,768) 462,956 Nedbank Ltd 5 yrs 1/71 9.21 30/04/2015 507,696 0 (84,176) 423,520 RMB 1/72 10.28 30/06/2025 1,000,000 0 (30,190) 969,810 AFD Calyon 1/68 9.52 31/12/2018 55,477 0 (6,527) 48,950 ABSA 7 yrs 1/73 8.73 29/09/2017 1,000,000 (32,846) 967,154 ABSA 7 yrs 1/68 9.52 31/02/2018 1,000,000 1,000,000 Total Annuity Loans 8,651,486 2,000,000 (541,230) 10,110,256
ABSA 1/64 Variable 31/10/2010 23,000 0 (23,000) 0
Total Non Annuity Loans 23,000 0 (23,000) 0
TOTAL EXTERNAL LOANS 8,674,686 2,000,000 (564,230) 10,110,456
74

eThekwini Municipality and its Municipal EntitiesAnnual Financial Statements for the year ended 20 June 2011Notes to the Annual Financial StatementsFigures in Rand thousand
52: EXTERNAL LOANS FOR THE YEAR ENDED 30 JUNE 2011 (Continued)
DescriptionLoan
NumberInterest
RateDate
RepayableBalance at
30/06/10Received during
the year
Redeemed / (Interest
Capitalised) during this period
Balance at 30/06/11
% R'000 R'000 R'000 R'000DURBAN MARINE THEME PARK:
LONG TERM LOANS
Debenture Stock 13 87,706 0 7,492 95,198
Total Stock Loans 87,706 0 7,492 95,198
DBSA - Village Walk 8.5 4,932 0 -635 4,297
Total Annuity Loans 4,932 0 -635 4,297
92,638 0 6,857 99,495
TOTAL EXTERNAL LOANS: ETHEKWINI MUNICIPALITY 8,674,6 86 2,000,000 -564,230 10,110,456
GROUP TOTAL: 8,767,324 2,000,000 -557,373 10,209,951
TOTAL EXTERNAL LOANS (DURBAN MARINE THEME PARK)
75

eThekwini Municipality and its Municipal EntitiesAnnual Financial Statements for the year ended 30 June 2011Notes to the Annual Financial StatementsFigures in Rand thousand
NOTE 53: STATEMENT OF COMPARATIVE AND ACTUAL INFORM ATION FOR THE YEAR ENDED 30 JUNE 2011 - GROUP
Description
R thousandsOriginal Budget
Budget Adjustments
Final Budget Actual OutcomeUnauthorised Expenditure
Variance
Actual Outcome as % of
Final Budget
Actual; Outcome as a % of Original Budget
Financial Performance
Property rates 4 212 852 132 700 4 345 552 4 056 102 ( 289 450) 93% 96%Service charges 10 483 983 14 691 10 498 674 9 917 652 ( 581 022) 94% 95%Investment revenue 289 467 30 258 319 725 219 621 ( 100 104) 69% 76%Transfers recognised - operational 1 595 398 151 214 1 746 612 1 598 043 ( 148 568) 91% 100%Other own revenue 2 078 272 ( 66 025) 2 012 247 3 328 949 1 316 702 165% 160%
Total Revenue (excluding capital transfers and contributions) 18 659 973 262 838 18 922 810 19 120 367 197 557 101% 102%
Employee costs 5 005 245 36 738 5 041 983 4 924 241 117 742 98% 98%Remuneration of councillors 74 596 – 74 596 77 919 ( 3 323) 104% 104%Debt impairment 359 935 ( 6 000) 353 935 324 980 28 955 92% 90%Depreciation & asset impairment 1 428 494 – 1 428 494 1 498 664 ( 70 170) 105% 105%Finance charges 896 381 222 147 1 118 528 692 195 426 333 62% 77%Materials and bulk purchases 5 998 643 7 000 6 005 643 5 495 517 510 126 92% 92%Transfers and grants 159 516 7 603 167 119 142 621 24 498 85% 89%Other expenditure 4 840 810 ( 10 262) 4 830 548 4 742 962 87 586 98% 98%
Total Expenditure 18 763 621 257 226 19 020 847 17 899 099 1 121 748 94% 95%Surplus/(Deficit) ( 103 648) 5 611 ( 98 037) 1 221 268 (1 319 305) -1246% -1178%
Transfers recognised - capital 2 070 869 ( 24 223) 2 046 646 992 886 1 053 760 49% 0%Contributions recognised - capital & contributed assets – – – – –
Surplus/(Deficit) after capital transfers & contributions 1 967 221 ( 18 612) 1 948 609 2 214 154 265 545 114% 113%
Share of surplus/ (deficit) of associate – – – – – 0% 0%Surplus/(Deficit) for the year 1 967 221 ( 18 612) 1 948 609 2 214 154 265 545 114% 113%
Current Year 2010/11
76

eThekwini Municipality and its Municipal EntitiesAnnual Financial Statements for the year ended 30 June 2011Notes to the Annual Financial StatementsFigures in Rand thousand
NOTE 53: STATEMENT OF COMPARATIVE AND ACTUAL INFORM ATION FOR THE YEAR ENDED 30 JUNE 2011 - MUNICIPALIT Y
Description
R thousandsOriginal Budget
Budget Adjustments
Final Budget Actual OutcomeUnauthorised Expenditure
Variance
Actual Outcome as % of
Final Budget
Actual; Outcome as a % of Original Budget
Financial Performance
Property rates 4 212 852 132 700 4 345 552 4 074 (4 341 479) 0% 0%Service charges 10 483 983 14 691 10 498 674 9 917 959 ( 580 715) 94% 95%Investment revenue 169 023 44 222 213 245 211 764 ( 1 481) 99% 125%Transfers recognised - operational 1 595 398 151 214 1 746 612 1 598 043 ( 148 568) 91% 100%Other own revenue 2 078 272 ( 66 025) 2 012 247 7 155 825 5 143 578 356% 344%
Total Revenue (excluding capital transfers and contributions) 18 539 528 276 802 18 816 330 18 887 665 71 335 100% 102%
Employee costs 5 005 002 36 738 5 041 740 4 822 931 218 809 96% 96%Remuneration of councillors 74 596 – 74 596 77 919 ( 3 323) 104% 104%Debt impairment 359 935 ( 6 000) 353 935 324 315 29 620 92% 90%Depreciation & asset impairment 1 428 494 – 1 428 494 1 411 334 17 160 99% 99%Finance charges 889 490 222 147 1 111 637 687 345 424 292 62% 77%Materials and bulk purchases 5 998 643 7 000 6 005 643 5 495 517 510 126 92% 92%Transfers and grants 159 516 7 603 167 119 142 621 24 498 85% 89%Other expenditure 4 588 258 17 711 4 605 970 4 695 992 ( 90 022) 102% 102%
Total Expenditure 18 503 935 285 200 18 789 135 17 657 974 1 131 161 94% 95%Surplus/(Deficit) 35 593 ( 8 398) 27 195 1 229 691 (1 202 496) 4522% 3455%
Transfers recognised - capital – 2 046 646 2 046 646 992 886 1 053 760 49% 0%Contributions recognised - capital & contributed assets – – – – –
Surplus/(Deficit) after capital transfers & contributions 35 593 2 038 248 2 073 841 2 222 577 148 736 107% 6244%
Share of surplus/ (deficit) of associate – – – 3 521 3 521 0% 0%Surplus/(Deficit) for the year 35 593 2 038 248 2 073 841 2 226 098 152 257 107% 6254%
Current Year 2010/11
77

eThekwini Municipality and its Municipal EntitiesAnnual Financial Statements for the year ended 30 June 2011Notes to the Annual Financial StatementsFigures in Rand thousand
NOTE 53: STATEMENT OF COMPARATIVE AND ACTUAL INFORM ATION FOR THE YEAR ENDED 30 JUNE 2011 - GROUPDescription
R thousandsOriginal Budget
Budget Adjustments
Final BudgetActual
OutcomeUnauthorised Expenditure
Variance
Actual Outcome as % of
Final Budget
Actual; Outcome as a % of Original Budget
Capital expenditure & funds sources
Capital expenditure 5 384 458 ( 244 800) 5 139 658 3 789 997 1 349 662 74% 70%Transfers recognised - capital 2 070 420 ( 23 774) 2 046 646 998 865 1 047 782 49% 48%Public contributions & donations – – 9 876 ( 9 876)
Borrowing 2 280 000 – 2 280 000 2 000 000 280 000 88% 88%Internally generated funds 1 034 038 ( 221 026) 813 012 781 256 31 756 96% 76%
Total sources of capital funds 5 384 458 ( 244 800) 5 139 658 3 789 997 1 349 662 74% 70%
Cash flows –
Net cash from (used) operating 3 289 371 ( 239 387) 3 049 984 3 597 243 ( 547 259) 118% 109%Net cash from (used) investing 5 311 929 ( 244 751) 5 067 178 (5 793 668) 10 860 846 -114% -109%Net cash from (used) financing 1 868 263 224 614 2 092 877 1 442 630 650 247 69% 77%
Cash/cash equivalents at the year end 2 717 218 229 878 2 947 096 824 026 2 123 070 28% 30%
Current Year 2010/11
78

78

eThekwini Municipality and its Municipal EntitiesAnnual Financial Statements for the year ended 30 June 2011Notes to the Annual Financial StatementsFigures in Rand thousand
NOTE 53: STATEMENT OF COMPARATIVE AND ACTUAL INFORM ATION FOR THE YEAR ENDED 30 JUNE 2011 - MUNICIPALIT YDescription
R thousandsOriginal Budget
Budget Adjustments
Final BudgetActual
OutcomeUnauthorised Expenditure
Variance
Actual Outcome as % of
Final Budget
Actual; Outcome as a % of Original Budget
Capital expenditure & funds sources
Capital expenditure 5 370 572 ( 244 800) 5 125 772 3 776 253 1 349 519 74% 70%Transfers recognised - capital 2 070 420 ( 23 774) 2 046 646 992 886 1 053 760 49% 48%Public contributions & donations – – 9 876 ( 9 876)
Borrowing 2 280 000 – 2 280 000 2 000 000 280 000 88% 88%Internally generated funds 1 020 152 ( 221 026) 799 126 773 491 25 635 97% 76%
Total sources of capital funds 5 370 572 ( 244 800) 5 125 772 3 776 253 1 349 519 74% 70%
Cash flows –
Net cash from (used) operating 3 316 082 ( 239 387) 3 076 695 3 514 868 ( 438 173) 114% 106%Net cash from (used) investing 5 301 929 ( 244 751) 5 057 178 (5 733 823) 10 791 001 -113% -108%Net cash from (used) financing 1 868 263 224 614 2 092 877 1 435 770 657 107 69% 77%
Cash/cash equivalents at the year end 2 717 218 229 878 2 947 096 657 678 2 289 418 22% 24%
Current Year 2010/11
79

79

eThekwini Municipality and its Municipal EntitiesAnnual Financial Statements for the year ended 30 June 2011Notes to the Annual Financial StatementsFigures in Rand thousand
54.ANALYSIS OF PROPERTY PLANT AND EQUIPMENT AS AT 3 0 JUNE 2011 - GROUP
Opening Balance
Opening Under Construction
AdditionsUnder
ConstructionTransfers
Closing Balance
Opening Balance
Opening Impairment
Prior Year Adjustments
Additions DisposalsImpairme
ntsImpairments
ReversalTransfers Closing Balance Carrying Value
R'000 R'000 R'000 R'000 R'000 R'000 R'000 R'000 R'000 R'000 R '000 R'000 R'000 R'000 R'000 R'000Land and Buildings Land 353,701 181 59,794 0 0 413,251 0 0 0 0 0 0 0 0 0 413,251Buildings 4,118,785 87,330 268,841 28,915 252 4,501,929 689,299 603 15,656 131,151 -1,907 0 0 1,997 836,799 3,665,130
4,472,486 87,511 328,635 28,915 252 4,915,180 689,299 603 15,656 131,151 -1,907 0 0 1,997 836,799 4,078,381
Infrastructure Roads 5,716,049 515,907 585,286 442,021 0 7,247,905 957,762 5,440 0 201,792 -616 0 0 0 1,164,378 6,083,527Traffic Equipment & Ranks 443,200 118,623 40,367 -30,195 0 571,995 125,978 0 0 20,877 0 0 0 0 146,855 425,140Stormwater Drainage 1,033,277 90,089 94,796 -42,364 0 1,175,798 120,825 0 0 17,179 0 0 0 0 138,004 1,037,794Sewerage Pumps 34,685 23,491 208 13,073 0 71,457 7,760 0 0 79,997 0 0 0 0 87,757 -16,300Sewerage Mains & Reticulation 2,132,905 744,840 195,967 -195,913 0 2,861,346 397,200 0 0 20 -5,282 0 0 0 391,938 2,469,408Purification Works 95 111,613 0 -18,894 0 92,814 78 0 0 6 0 0 0 0 84 92,730Refuse Sites & Transfer Station 495,919 3,394 12,445 19,134 0 530,892 234,657 0 0 49,078 0 0 0 0 283,735 247,157Water Mains & Reticulation 3,307,789 1,956,597 1,330,771 -82,415 0 6,510,914 365,575 0 0 73,423 -975 0 0 0 438,023 6,072,891Water Reservoirs 293,637 44,456 0 16,459 0 354,552 41,835 15,531 0 4,531 0 -1 -1,493 0 60,403 294,149General Infrastructure 123,235 146,723 0 37,167 0 307,125 21,727 0 0 12,130 0 0 0 0 33,857 273,268Mains 2,030,960 100,295 130,330 3,042 0 2,264,319 621,353 0 -1,229 47,193 -85 0 0 0 667,232 1,597,087Major Substations 1,442,344 294,194 131,180 145,044 0 2,010,476 473,622 233 -3,079 46,181 -2,069 0 0 0 514,888 1,495,588Public Lighting 215,566 12,630 9,876 3,806 0 241,878 46,575 4,806 0 10,479 0 0 0 0 61,860 180,018Connections & Switches 743,483 25,123 27,434 30,341 826,362 402,570 0 -6,818 37,173 -19 0 0 0 432,906 393,456
18,013,144 4,187,975 2,558,660 340,306 0 25,067,833 3,817,517 26,010 -11,126 600,059 -9,046 -1 -1,493 0 4,421,920 20,645,913
Community Assets Recreation 3,798,276 54,432 44,221 -49,462 0 3,847,343 262,140 17,192 0 85,606 -40 0 0 0 364,898 3,482,445Clinics & Depots 107,668 2,148 13,144 947 0 123,907 40,359 0 0 40,339 0 0 0 0 80,698 43,209Cemetries & Crematoria 66,974 8,427 3,060 -2,599 0 75,862 20,953 0 0 2,425 0 0 0 0 23,378 52,484Community Halls 89,473 5,611 1,589 -4,086 0 92,587 10 0 0 10 0 0 0 0 20 92,567Fire Stations 18,787 9,493 2,365 551 0 31,196 15,884 0 0 1,583 0 0 0 0 17,467 13,729Libraries 155,136 13,861 19,396 851 0 189,244 27 0 78,718 8,707 0 0 0 0 87,452 101,792Museums 1,802 13 85 4,844 0 6,744 85 0 0 125 0 0 0 0 210 6,534Police Stations 48,418 0 128 0 0 48,546 7,022 9 0 1,049 0 0 0 0 8,080 40,466
4,286,534 93,985 83,988 -48,954 0 4,415,429 346,480 17,201 78,718 139,844 -40 0 0 0 582,203 3,833,226
Heritage Assets Exhibits 6,814 11,067 1,123 -9,002 0 10,002 0 0 0 0 0 0 0 0 0 10,002
6,814 11,067 1,123 -9,002 0 10,002 0 0 0 0 0 0 0 0 0 10,002
Other Assets Airconditioning 82,473 0 1,541 0 0 83,987 6,562 0 0 5,966 -27 0 0 0 12,501 71,486Security Systems 64,770 0 12,791 0 0 77,536 55,680 0 0 15,975 -15 0 0 0 71,640 5,896Computer Equipment 477,744 0 84,304 6,138 -27,036 536,400 290,183 0 -6,119 78,980 -3,994 0 0 -20,257 338,793 197,607Car Parks & Fencing 192,202 0 32,419 133 0 224,754 1,314 0 0 15,297 0 0 0 0 16,611 208,143Plant & Equipment 2,289,685 14,279 120,912 -7,308 1,132 2,413,627 451,159 0 -7,348 141,738 -4,242 458 0 -609 581,156 1,832,471Furniture & Fittings 91,880 0 17,372 0 -754 106,102 58,480 0 -1,461 18,716 -2,216 0 0 -754 72,765 33,337Markets 88,345 2,504 10,753 -1,282 0 100,320 36,730 0 0 6,111 0 0 0 0 42,841 57,479Vehicles 1,820,847 22,496 131,059 10,890 -52 1,944,102 878,108 2,102 -13,323 235,975 -37,747 0 -2,082 -52 1,062,981 881,121Fire Engines 66,830 1,407 11,205 0 0 79,302 14,383 0 0 5,724 -130 0 0 0 19,977 59,325
5,174,776 40,686 422,356 8,571 -26,710 5,566,130 1,792,599 2,102 -28,251 524,482 -48,371 458 -2,082 -21,672 2,219,265 3,346,865
Total 31,953,754 4,421,224 3,394,762 319,836 -26,458 39,974,574 6,645,895 45,916 54,997 1,395,536 -59,364 457 -3,575 -19,675 8,060,187 31,914,387
Cost / Revaluation Accumulated Depreciations
80

eThekwini Municipality and its Municipal EntitiesAnnual Financial Statements for the year ended 30 June 2011Notes to the Annual Financial StatementsFigures in Rand thousand
54.ANALYSIS OF PROPERTY PLANT AND EQUIPMENT AS AT 3 0 JUNE 2011 - MUNICIPALITYCost / Revaluation Accumulated Depreciations
Opening
Balance
Opening Under
Construction
Additions Under
Construction
Disposals Transfers Closing
Balance
Opening
Balance
Opening
Impairment
Prior Year
Adjustments
Additions Disposals Impairments Impairments
Reversal
Transfers Closing Balance Carrying Value
R'000 R'000 R'000 R'000 R'000 R'000 R'000 R'000 R'000 R'000 R'000 R'000 R'000 R'000 R'000 R'000 R'000Land and Buildings Land 353,701 181 59,794 0 -425 0 413,251 0 0 0 0 0 0 0 0 0 413,251Buildings 2,815,320 87,330 263,122 28,915 -2,194 0 3,192,493 490,497 603 -796 86,124 -1,907 0 0 574,521 2,617,972
3,169,021 87,511 322,916 28,915 -2,619 0 3,605,744 490,497 603 -796 86,124 -1,907 0 0 0 574,521 3,031,223
Infrastructure Roads 5,716,049 515,907 585,286 442,021 -11,358 0 7,247,905 957,762 5,440 0 201,792 -616 0 0 0 1,164,378 6,083,527Traffic Equipment & Ranks 443,200 118,623 40,367 -30,195 0 0 571,995 125,978 0 0 20,877 0 0 0 0 146,855 425,140Stormwater Drainage 1,033,277 90,089 94,796 -42,364 0 0 1,175,798 120,825 0 0 17,179 0 0 0 0 138,004 1,037,794Sewerage Pumps 34,685 23,491 208 13,073 0 0 71,457 7,760 0 0 79,997 0 0 0 0 87,757 -16,300Sewerage Mains & Reticulation 2,132,905 744,840 195,967 -195,913 -16,453 0 2,861,346 397,200 0 0 20 -5,282 0 0 0 391,938 2,469,408Purification Works 95 111,613 0 -18,894 0 0 92,814 78 0 0 6 0 0 0 0 84 92,730Refuse Sites & Transfer Station 495,919 3,394 12,445 19,134 0 0 530,892 234,657 0 0 49,078 0 0 0 0 283,735 247,157Water Mains & Reticulation 3,307,789 1,956,597 1,330,771 -82,415 -1,828 0 6,510,914 365,575 0 0 73,423 -975 0 0 0 438,023 6,072,891Water Reservoirs 293,637 44,456 0 16,459 0 0 354,552 41,835 15,531 0 4,531 0 -1 -1,493 0 60,403 294,149General Infrastructure 123,235 146,723 0 37,167 0 0 307,125 21,727 0 0 12,130 0 0 0 0 33,857 273,268Mains 2,030,960 100,295 130,330 3,042 -308 0 2,264,319 621,353 0 -1,229 47,193 -85 0 0 0 667,232 1,597,087Major Substations 1,442,344 294,194 131,180 145,044 -2,286 0 2,010,476 473,622 233 -3,079 46,181 -2,069 0 0 0 514,888 1,495,588Public Lighting 215,566 12,630 9,876 3,806 0 0 241,878 46,575 4,806 0 10,479 0 0 0 0 61,860 180,018Connections & Switches 743,483 25,123 27,434 30,341 -19 826,362 402,570 0 -6,818 37,173 -19 0 0 0 432,906 393,456
18,013,144 4,187,975 2,558,660 340,306 -32,252 0 25,067,833 3,817,517 26,010 -11,126 600,059 -9,046 -1 -1,493 0 4,421,920 20,645,913
Community Assets Recreation 3,798,276 54,432 44,221 -49,462 -124 0 3,847,343 262,140 17,192 0 85,606 -40 0 0 0 364,898 3,482,445Clinics & Depots 107,668 2,148 13,144 947 0 0 123,907 40,359 0 0 40,339 0 0 0 0 80,698 43,209Cemetries & Crematoria 66,974 8,427 3,060 -2,599 0 0 75,862 20,953 0 0 2,425 0 0 0 0 23,378 52,484Community Halls 89,473 5,611 1,589 -4,086 0 0 92,587 10 0 0 10 0 0 0 0 20 92,567Fire Stations 18,787 9,493 2,365 551 0 0 31,196 15,884 0 0 1,583 0 0 0 0 17,467 13,729Libraries 155,136 13,861 19,396 851 0 0 189,244 27 0 78,718 8,707 0 0 0 0 87,452 101,792Museums 1,802 13 85 4,844 0 0 6,744 85 0 0 125 0 0 0 0 210 6,534Police Stations 48,418 0 128 0 0 0 48,546 7,022 9 0 1,049 0 0 0 0 8,080 40,466
4,286,534 93,985 83,988 -48,954 -124 0 4,415,429 346,480 17,201 78,718 139,844 -40 0 0 0 582,203 3,833,226
Heritage Assets Exhibits 6,814 11,067 1,123 -9,002 0 0 10,002 0 0 0 0 0 0 0 0 0 10,002
6,814 11,067 1,123 -9,002 0 0 10,002 0 0 0 0 0 0 0 0 0 10,002
Other Assets Airconditioning 82,473 0 1,541 0 -27 0 83,987 6,562 0 0 5,966 -27 0 0 0 12,501 71,486Security Systems 64,770 0 12,791 0 -25 0 77,536 55,680 0 0 15,975 -15 0 0 0 71,640 5,896Computer Equipment 473,340 0 83,955 6,138 -4,750 -26,493 532,190 287,044 0 -6,119 78,242 -3,994 0 0 -19,715 335,458 196,732Car Parks & Fencing 192,202 0 32,419 133 0 0 224,754 1,314 0 0 15,297 0 0 0 0 16,611 208,143Plant & Equipment 2,164,637 14,279 119,300 -7,308 -3,494 0 2,287,414 372,956 0 -7,348 127,103 -3,137 458 0 0 490,032 1,797,382Furniture & Fittings 42,824 0 12,596 0 -452 0 54,968 35,619 0 -1,461 10,742 -386 0 0 0 44,514 10,454Markets 88,345 2,504 10,753 -1,282 0 0 100,320 36,730 0 0 6,111 0 0 0 0 42,841 57,479Vehicles 1,819,061 22,496 130,519 10,890 -40,887 0 1,942,079 877,125 2,102 -13,323 235,790 -37,582 0 -2,082 0 1,062,030 880,049Fire Engines 66,830 1,407 11,205 0 -140 0 79,302 14,383 0 0 5,724 -130 0 0 0 19,977 59,325
4,994,482 40,686 415,079 8,571 -49,775 -26,493 5,382,550 1,687,413 2,102 -28,251 500,950 -45,271 458 -2,082 -19,715 2,095,604 3,286,946
Total 30,469,995 4,421,224 3,381,766 319,836 -84,770 -26,493 38,481,558 6,341,907 45,916 38,545 1,326,977 -56,264 457 -3,575 -19,715 7,674,248 30,807,310
81

APPENDIX A:SEGMENTAL ANALYSIS OF PROPERTY, PLANT AN D EQUIPMENT (GROUP)
30th June 2011
Cost Accumulated Depreciation
Carrying Value
Opening
Balance Cost
Opening Balance
Capital Under Construction
Additions Under
Construction
Transfers Closing
Balance
Opening
Balance
Opening
Impairments
Prior Year
Adjustments
Additions Disposals Impairments Impairments
Reversal
Transfers Closing
BalanceR'000 R'000 R'000 R'000 R'000 R'000 R'000 R'000 R'000 R'000 R'000 R'000 R'000 R'000 R'000 R'000
Miscellaneous 80,631 0 0 0 0 80,631 14,730 0 -649 2,663 0 0 0 0 16,744 63,887Legal Services 9,353 0 120 0 0 9,327 1,354 0 0 429 -117 0 0 0 1,666 7,661Real Estates 83,239 0 651 0 5 83,747 12,836 0 0 2,697 -125 0 0 6 15,414 68,333Health 214,662 0 969 3,095 40 218,766 46,020 0 0 9,706 0 0 0 -7 55,719 163,047Skills Development 1,265 0 258 0 9 1,521 613 0 0 202 -10 0 0 -7 798 723Grant in Aid 17,491 0 3,618 261 0 21,370 403 0 0 949 0 0 0 0 1,352 20,018Security 46,859 0 11,956 0 -3 58,812 23,540 0 9 3,068 0 0 0 -3 26,614 32,198Metropolitan Police 80,911 0 2,453 0 -76 83,222 18,832 9 0 4,789 -42 0 0 -57 23,531 59,691Retail Market 71,553 1,282 2,005 -1,282 -8 73,550 15,283 603 0 1,976 0 0 0 -6 17,856 55,694Housing 1,079,459 39,614 53,087 -11,210 -54 1,160,860 137,310 0 0 39,211 -18 0 0 -43 176,460 984,400Municipal Information & Policy 2,997 0 13 0 -17 2,993 1,815 0 0 316 0 0 0 -15 2,116 877Ombudsperson & Head : Investigation 810 0 0 0 -107 620 581 0 0 64 -58 0 0 -90 497 123Office Of International & Governance 564 0 10 0 -6 513 249 0 0 83 -41 0 0 -4 287 226Community Participation 3,361 0 95 0 0 3,275 2,134 0 0 396 -148 0 0 0 2,382 893Office Of Geographic Information 3,424 0 96 0 0 3,520 638 0 0 272 0 0 0 0 910 2,610City Manager's Office 124 0 0 0 -16 108 106 0 0 7 0 0 0 -14 99 9Strategic Projects 3,668,550 22,114 42,530 -1,597 -3,072,190 659,407 66,497 0 33 24,163 0 1 0 -65,333 25,361 634,046Office Of The D C M : Sust. Development 178 0 50 0 0 228 28 0 0 38 0 0 0 0 66 162Office of the D C M :Sust.Procurement 177 0 26 0 -2 201 45 0 0 31 0 0 0 -1 75 126Office Of The D C M : Health, Safety 4,438 0 466 0 -11 4,891 677 0 0 432 -1 0 0 -9 1,099 3,792Office Of The D C M : Corp & HR 129 0 106 0 0 235 31 0 0 35 0 0 0 0 66 169Office Of The D C M : Governance 12 0 0 0 0 12 10 0 0 1 0 0 0 0 11 1Office Of The D C M : Treasury 838 0 44 0 -27 822 542 0 0 88 -24 0 0 -24 582 240Development Planning & Management 59,173 6,010 12,058 0 0 77,241 4,022 0 0 1,198 0 0 0 0 5,220 72,021Economic Development & Facilitation 170,501 200,060 168,086 -55,082 -74 483,491 7,639 0 0 12,705 0 0 0 -48 20,296 463,195City Enterprises 7,682 0 68 0 0 7,750 4,778 0 0 672 0 0 0 0 5,450 2,300Business Support 75,927 1,233 3,131 -1,233 -137 78,921 20,474 0 0 4,162 0 0 0 -34 24,602 54,319Procurement 9,496 0 204 106 -35 9,732 4,687 0 0 1,528 -34 0 0 -22 6,159 3,573Engineering 7,431,179 572,765 566,166 425,583 -1,576 8,981,895 1,157,413 5,440 526 228,541 -1,346 0 0 -1,267 1,389,307 7,592,588Emergency Services 224,736 12,778 12,506 551 -7 250,408 77,535 0 0 11,957 -137 0 0 -6 89,349 161,059Parks, Recreation, Cemetries & 1,589,365 24,656 52,398 -4,913 -426 1,660,397 326,906 17,192 78,591 60,986 -528 0 0 -346 482,801 1,177,596Governance 137,711 18,983 807 19,849 -1 177,145 33,989 0 0 5,227 -164 0 0 -1 39,051 138,094Communications 1,763 0 237 0 -14 1,948 880 0 0 247 -29 0 0 -12 1,086 862Regional Centres 102,678 0 186 100 0 102,964 25,703 0 0 2,803 0 0 0 0 28,506 74,458Human Resources 11,146 0 1,076 0 -210 11,982 6,391 0 0 1,466 -23 0 0 -185 7,649 4,333Management Services & Org Development 479 0 70 0 0 509 257 0 0 57 -26 0 0 0 288 221Finance 17,458 0 751 0 -463 17,385 12,189 0 0 1,189 -303 0 0 -376 12,699 4,686City Fleet 839,362 6,796 61,600 -1,471 -61 891,827 391,433 0 743 89,361 -12,453 0 0 -31 469,053 422,774Durban Transport 489,041 0 30,830 0 0 519,871 86,036 2,102 0 46,724 0 0 -2,082 0 132,780 387,091Office Of Audit & Perfomance Management 1,230 0 0 0 0 936 672 0 0 102 -193 0 0 0 581 355Information Technology 533,267 0 58,849 6,138 -18,528 579,070 197,256 0 0 92,156 -500 0 0 -13,172 275,740 303,330Ethekwini Transport Authority 590,638 129,207 37,525 -31,655 -546 725,144 129,636 0 0 26,623 -22 351 0 -496 156,092 569,052Occupational Health & Safety 1,412 0 280 0 0 1,683 765 0 0 208 -8 0 0 0 965 718Performance Management 317 0 0 0 0 315 70 0 0 53 0 0 0 0 123 192Durban Energy Office 557 453 7,205 22,570 0 30,758 39 0 0 106 -10 0 0 0 135 30,623Income 29,577 0 1,047 0 -1,723 28,345 18,504 0 0 3,167 -465 0 0 -1,554 19,652 8,693Finance and Major Projects 965 0 117 0 -9 981 596 0 0 136 -75 0 0 -8 649 332Internal Control and Business Systems 178,085 504 4,087 763 -1,706 181,350 42,380 0 0 5,556 -289 0 0 -1,281 46,366 134,984ABMS 6,291 29,296 22,296 -14,588 -41 43,254 1,003 0 0 1,186 0 0 0 -35 2,154 41,100SDB 10,124 0 1,674 0 0 11,798 482 0 0 411 0 0 0 0 893 10,905ABM INK 14,035 0 12,498 0 -11 26,520 2,029 0 0 1,533 -2 0 0 -9 3,551 22,969Water 4,112,922 2,009,883 1,145,397 -46,189 -477 7,215,527 662,470 15,531 111 137,560 -5,380 -1 -1,493 -408 808,390 6,407,137Sanitation 2,338,530 880,445 553,690 -201,733 0 3,552,483 474,463 0 0 95,266 -6,410 0 0 0 563,319 2,989,164Solid Waste 790,609 3,394 68,318 19,134 -126 873,850 447,063 0 -33 98,193 -6,908 0 0 -112 538,203 335,647Airport 1,647 0 102 0 0 1,749 388 0 0 82 0 0 0 0 470 1,279Moses Mabhida Stadium 0 0 49,449 0 3,072,186 3,121,635 0 0 86 107,137 0 106 0 65,331 172,660 2,948,975Housing 138,405 0 44 0 -42 135,843 60,546 0 0 2,694 -1,865 0 0 -35 61,340 74,503Market Service 108,203 746 3,615 -484 -3 111,648 19,202 0 0 3,158 -324 0 0 -1 22,035 89,613Gas 101,798 0 4,138 0 0 105,936 5,310 0 0 4,014 0 0 0 0 9,324 96,612Electricity Service 4,972,661 461,005 382,708 193,123 0 5,990,636 1,774,427 5,039 -40,872 187,197 -18,186 0 0 0 1,907,605 4,083,031Durban Marine Theme Park (PTY) LTD 630,679 0 11,021 0 -5 637,921 165,253 0 16,452 34,690 -3,100 0 0 0 213,295 424,626International Convension Centre (PTY) LTD 853,080 0 1,975 0 40 855,095 138,735 0 0 33,869 0 0 0 40 172,644 682,451Total 31,953,754 4,421,224 3,394,762 319,836 -26,458 39,974,574 6,645,895 45,916 54,997 1,395,536 -59,364 457 -3,575 -19,675 8,060,187 31,914,387
eThekwini Municipality and its Municipal Entities
82

APPENDIX A:SEGMENTAL ANALYSIS OF PROPERTY, PLANT AN D EQUIPMENT (MUNICIPALITY)
30th June 2011
Cost Accumulated Depreciation
Carrying Value
Opening
Balance Cost
Opening Balance Capital
Under Construction
Additions Under
Construction
Disposals Transfers Closing
Balance
Opening
Balance
Opening
Impairments
Prior Year
Adjustments
Additions Disposals Impairments Impairments
Reversal
Transfers Closing
BalanceR'000 R'000 R'000 R'000 R'000 R'000 R'000 R'000 R'000 R'000 R'000 R'000 R'000 R'000 R'000 R'000 R'000
Miscellaneous 80,631 0 0 0 0 0 80,631 14,730 0 -649 2,663 0 0 0 0 16,744 63,887Legal Services 9,353 0 120 0 -146 0 9,327 1,354 0 0 429 -117 0 0 0 1,666 7,661Real Estates 83,239 0 651 0 -148 5 83,747 12,836 0 0 2,697 -125 0 0 6 15,414 68,333Health 214,662 0 969 3,095 0 40 218,766 46,020 0 0 9,706 0 0 0 -7 55,719 163,047Skills Development 1,265 0 258 0 -11 9 1,521 613 0 0 202 -10 0 0 -7 798 723Grant in Aid 17,491 0 3,618 261 0 0 21,370 403 0 0 949 0 0 0 0 1,352 20,018Security 46,859 0 11,956 0 0 -3 58,812 23,540 0 9 3,068 0 0 0 -3 26,614 32,198Metropolitan Police 80,911 0 2,453 0 -66 -76 83,222 18,832 9 0 4,789 -42 0 0 -57 23,531 59,691Retail Market 71,553 1,282 2,005 -1,282 0 -8 73,550 15,283 603 0 1,976 0 0 0 -6 17,856 55,694Housing 1,079,459 39,614 53,087 -11,210 -36 -54 1,160,860 137,310 0 0 39,211 -18 0 0 -43 176,460 984,400Municipal Information & Policy 2,997 0 13 0 0 -17 2,993 1,815 0 0 316 0 0 0 -15 2,116 877Ombudsperson & Head : Investigation 810 0 0 0 -83 -107 620 581 0 0 64 -58 0 0 -90 497 123Office Of International & Governance 564 0 10 0 -55 -6 513 249 0 0 83 -41 0 0 -4 287 226Community Participation 3,361 0 95 0 -181 0 3,275 2,134 0 0 396 -148 0 0 0 2,382 893Office Of Geographic Information 3,424 0 96 0 0 0 3,520 638 0 0 272 0 0 0 0 910 2,610City Manager's Office 124 0 0 0 0 -16 108 106 0 0 7 0 0 0 -14 99 9Strategic Projects 3,668,550 22,114 42,530 -1,597 0 -3,072,190 659,407 66,497 0 33 24,163 0 1 0 -65,333 25,361 634,046Office Of The D C M : Sust. Development 178 0 50 0 0 0 228 28 0 0 38 0 0 0 0 66 162Office of the D C M :Sust.Procurement 177 0 26 0 0 -2 201 45 0 0 31 0 0 0 -1 75 126Office Of The D C M : Health, Safety 4,438 0 466 0 -2 -11 4,891 677 0 0 432 -1 0 0 -9 1,099 3,792Office Of The D C M : Corp & HR 129 0 106 0 0 0 235 31 0 0 35 0 0 0 0 66 169Office Of The D C M : Governance 12 0 0 0 0 0 12 10 0 0 1 0 0 0 0 11 1Office Of The D C M : Treasury 838 0 44 0 -33 -27 822 542 0 0 88 -24 0 0 -24 582 240Development Planning & Management 59,173 6,010 12,058 0 0 0 77,241 4,022 0 0 1,198 0 0 0 0 5,220 72,021Economic Development & Facilitation 170,501 200,060 168,086 -55,082 0 -74 483,491 7,639 0 0 12,705 0 0 0 -48 20,296 463,195City Enterprises 7,682 0 68 0 0 0 7,750 4,778 0 0 672 0 0 0 0 5,450 2,300Business Support 75,927 1,233 3,131 -1,233 0 -137 78,921 20,474 0 0 4,162 0 0 0 -34 24,602 54,319Procurement 9,496 0 204 106 -39 -35 9,732 4,687 0 0 1,528 -34 0 0 -22 6,159 3,573Engineering 7,431,179 572,765 566,166 425,583 -12,222 -1,576 8,981,895 1,157,413 5,440 526 228,541 -1,346 0 0 -1,267 1,389,307 7,592,588Emergency Services 224,736 12,778 12,506 551 -156 -7 250,408 77,535 0 0 11,957 -137 0 0 -6 89,349 161,059Parks, Recreation, Cemetries & 1,589,365 24,656 52,398 -4,913 -683 -426 1,660,397 326,906 17,192 78,591 60,986 -528 0 0 -346 482,801 1,177,596Governance 137,711 18,983 807 19,849 -204 -1 177,145 33,989 0 0 5,227 -164 0 0 -1 39,051 138,094Communications 1,763 0 237 0 -38 -14 1,948 880 0 0 247 -29 0 0 -12 1,086 862Regional Centres 102,678 0 186 100 0 0 102,964 25,703 0 0 2,803 0 0 0 0 28,506 74,458Human Resources 11,146 0 1,076 0 -30 -210 11,982 6,391 0 0 1,466 -23 0 0 -185 7,649 4,333Management Services & Org Development 479 0 70 0 -40 0 509 257 0 0 57 -26 0 0 0 288 221Finance 17,458 0 751 0 -361 -463 17,385 12,189 0 0 1,189 -303 0 0 -376 12,699 4,686City Fleet 839,362 6,796 61,600 -1,471 -14,399 -61 891,827 391,433 0 743 89,361 -12,453 0 0 -31 469,053 422,774Durban Transport 489,041 0 30,830 0 0 0 519,871 86,036 2,102 0 46,724 0 0 -2,082 0 132,780 387,091Office Of Audit & Perfomance Management 1,230 0 0 0 -294 0 936 672 0 0 102 -193 0 0 0 581 355Information Technology 533,267 0 58,849 6,138 -656 -18,528 579,070 197,256 0 0 92,156 -500 0 0 -13,172 275,740 303,330Ethekwini Transport Authority 590,638 129,207 37,525 -31,655 -25 -546 725,144 129,636 0 0 26,623 -22 351 0 -496 156,092 569,052Occupational Health & Safety 1,412 0 280 0 -9 0 1,683 765 0 0 208 -8 0 0 0 965 718Performance Management 317 0 0 0 -2 0 315 70 0 0 53 0 0 0 0 123 192Durban Energy Office 557 453 7,205 22,570 -27 0 30,758 39 0 0 106 -10 0 0 0 135 30,623Income 29,577 0 1,047 0 -556 -1,723 28,345 18,504 0 0 3,167 -465 0 0 -1,554 19,652 8,693Finance and Major Projects 965 0 117 0 -92 -9 981 596 0 0 136 -75 0 0 -8 649 332Internal Control and Business Systems 178,085 504 4,087 763 -383 -1,706 181,350 42,380 0 0 5,556 -289 0 0 -1,281 46,366 134,984ABMS 6,291 29,296 22,296 -14,588 0 -41 43,254 1,003 0 0 1,186 0 0 0 -35 2,154 41,100SDB 10,124 0 1,674 0 0 0 11,798 482 0 0 411 0 0 0 0 893 10,905ABM INK 14,035 0 12,498 0 -2 -11 26,520 2,029 0 0 1,533 -2 0 0 -9 3,551 22,969Water 4,112,922 2,009,883 1,145,397 -46,189 -6,009 -477 7,215,527 662,470 15,531 111 137,560 -5,380 -1 -1,493 -408 808,390 6,407,137Sanitation 2,338,530 880,445 553,690 -201,733 -18,449 0 3,552,483 474,463 0 0 95,266 -6,410 0 0 0 563,319 2,989,164Solid Waste 790,609 3,394 68,318 19,134 -7,479 -126 873,850 447,063 0 -33 98,193 -6,908 0 0 -112 538,203 335,647Airport 1,647 0 102 0 0 0 1,749 388 0 0 82 0 0 0 0 470 1,279Moses Mabhida Stadium 0 0 49,449 0 0 3,072,186 3,121,635 0 0 86 107,137 0 106 0 65,331 172,660 2,948,975Housing 138,405 0 44 0 -2,564 -42 135,843 60,546 0 0 2,694 -1,865 0 0 -35 61,340 74,503Market Service 108,203 746 3,615 -484 -429 -3 111,648 19,202 0 0 3,158 -324 0 0 -1 22,035 89,613Gas 101,798 0 4,138 0 0 0 105,936 5,310 0 0 4,014 0 0 0 0 9,324 96,612Electricity Service 4,972,661 461,005 382,708 193,123 -18,861 0 5,990,636 1,774,427 5,039 -40,872 187,197 -18,186 0 0 0 1,907,605 4,083,031Total 30,469,995 4,421,224 3,381,766 319,836 -84,770 -26,493 38,481,558 6,341,907 45,916 38,545 1,326,977 -56,264 457 -3,575 -19,715 7,674,248 30,807,310
eThekwini Municipality and its Municipal Entities
83

eThekwini Municipality and its Municipal EntitiesAPPENDIX B: GROUP : SEGMENTAL STATEMENT OF FINANCIAL PERFORMAN CE FOR THE YEAR ENDED 30 JUNE 2011
2010 2010 2010 2011 2011 2011Actual Actual Surplus/ Actual Actual Surplus/Income Expenditure (Deficit) Income Expenditure (Deficit)R'000 R'000 R'000 R'000 R'000 R'000
35,404 211,972 (176,568) Executive & Council 36,654 228,077 (191,423) 6,194,352 2,468,086 3,726,266 Finance & Admin 7,128,057 2,203,012 4,925,045 1,140,327 648,311 492,016 Planning & Development 226,888 630,376 (403,488)
51,593 276,190 (224,597) Health 52,178 300,172 (247,994) 48,783 472,231 (423,448) Community & Social Services 48,988 518,264 (469,276)
1,393,987 1,659,980 (265,993) Housing 1,061,088 1,342,051 (280,963) 113,649 864,509 (750,860) Public Safety 136,383 962,006 (825,623)
59,663 785,301 (725,638) Sport & Recreation 85,401 862,424 (777,023) 10,115 106,472 (96,357) Environmental Protection 8,109 111,294 (103,185)
1,196,259 1,699,945 (503,686) Waste Management 1,790,823 1,831,951 (41,128) 1,342,859 1,443,928 (101,069) Road Transport 620,021 1,455,239 (835,218) 2,733,012 2,669,202 63,810 Water 2,938,748 2,584,584 354,164 6,162,466 5,303,341 859,125 Electricity 7,486,745 6,266,595 1,220,150
74,726 109,353 (34,627) Other 71,576 109,570 (37,994) 129,158 168,056 (38,898) Durban Marine Theme Park (Pty)Ltd 150,094 184,175 (34,081) 104,981 132,003 (27,022) ICC Durban (Pty)Ltd 134,875 164,627 (29,752)
15,156 11,226 3,930 Ethekwini Transport Authority 3,674 15,251 (11,577) 10,947 5,709 5,238 Effingham/Link Road Joint Venture 5,025 1,505 3,520
20,817,437 19,035,815 1,781,622 Sub Total 21,985,327 19,771,173 2,214,154
(1,837,059) (1,837,059) 0 Less Inter-Dep charges (1,872,074) (1,872,074) 0
18,980,378 17,198,756 1,781,622 Total 20,113,253 17,899,099 2,214,154
84

eThekwini Municipality and its Municipal EntitiesAPPENDIX B: ETHEKWINI MUNICIPALITY : SEGMENTAL STAT EMENT OF FINANCIAL PERFORMANCE FOR THE YEAR ENDED 3 0 JUNE 2011
2010 2010 2010 2011 2011 2011Actual Actual Surplus/ Actual Actual Surplus/Income Expenditure (Deficit) Income Expenditure (Deficit)R'000 R'000 R'000 R'000 R'000 R'000
35,404 211,972 (176,568) Executive & Council 36,654 228,077 (191,423) 6,246,764 2,479,967 3,766,797 Finance & Admin 7,189,023 2,327,445 4,861,578 1,140,327 648,311 492,016 Planning & Development 226,888 630,376 (403,488)
51,593 276,190 (224,597) Health 52,178 300,172 (247,994) 48,783 472,231 (423,448) Community & Social Services 48,988 518,264 (469,276)
1,393,987 1,659,980 (265,993) Housing 1,061,088 1,342,051 (280,963) 113,649 864,509 (750,860) Public Safety 136,383 962,006 (825,623)
59,663 785,301 (725,638) Sport & Recreation 85,401 862,424 (777,023) 10,115 106,472 (96,357) Environmental Protection 8,109 111,294 (103,185)
1,196,259 1,699,945 (503,686) Waste Management 1,790,823 1,831,951 (41,128) 1,342,859 1,443,928 (101,069) Road Transport 620,021 1,455,239 (835,218) 2,733,012 2,669,202 63,810 Water 2,938,748 2,584,584 354,164 6,162,466 5,303,341 859,125 Electricity 7,486,745 6,266,595 1,220,150
74,726 109,353 (34,627) Other 71,576 109,570 (37,994)
20,609,607 18,730,702 1,878,905 Sub Total 21,752,625 19,530,048 2,222,577
5,238 Share of Income from JointVenture 3,521
(1,837,059) (1,837,059) 0 Less Inter-Dep charges (1,872,074) (1,872,074) 0
18,777,786 16,893,643 1,884,143 Total 19,884,072 17,657,974 2,226,098
85

85

eThekwini Municipality and its Municipal Entities
2011 2011 2011 2011 Explanation of Significant Variance s
Actual Budget Variance Variance greater than 10% ver sus Budget
R'000 R'000 R'000 %
REVENUE
Property rates 4,056,102 4,194,800 (138,698) (3)
Property rates - penalties imposed and collection charges 81,854 150,752 (68,898) (46) For reasons refer to annexure C(1A): 1
Service Charges 9,891,652 10,520,750 (629,098) (6)
Rental of facilities and equipment 435,775 369,305 66,470 18 For reasons refer to annexure C(1A): 2
Interest earned - external investments 133,666 220,590 (86,924) (39) For reasons refer to annexure C(1A): 3
Interest earned - outstanding debtors 85,955 97,279 (11,324) (12)
Fines 110,209 164,247 (54,038) (33) For reasons refer to annexure C(1A): 4
Licences and permits 29,640 27,478 2,162 8
Government grants and subsidies 2,590,929 3,658,109 (1,067,180) (29) For reasons refer to annexure C(1A): 5
Public contributions and donations 12,711 9,000 3,711 0
Other income 2,584,795 1,596,428 988,367 62 For reasons refer to annexure C(1A): 6
Fair Value Adjustment 47,538 0 47,538 0
Gains on disposal of property, plant and equipment 48,851 23,010 25,841 0
Reversal of Impairment-PPE 3,576 0 3,576 0
TOTAL REVENUE 20,113,253 21,031,748 (918,495)
EXPENDITURE
Executive & Council 228,077 234,626 (6,549) (3)
Finance & admin 2,237,058 2,548,664 (311,606) (12)
Planning & Development 630,376 774,569 (144,193) (19) For reasons refer to annexure C(1A): 7
Health 300,172 315,921 (15,749) (5)
Community & Social Services 518,264 578,233 (59,969) (10)
Housing 1,342,051 561,738 780,313 139 For reasons refer to annexure C(1A): 8
Public Safety 962,006 942,095 19,911 2
Sport & Recreation 862,424 890,873 (28,449) (3)
Environmental Protection 111,294 119,884 (8,590) (7)
Waste Management 1,831,951 1,961,456 (129,505) (7)
Road Transport 1,455,239 1,656,851 (201,612) (12) For reasons refer to annexure C(1A): 9
Water 2,584,584 2,990,855 (406,271) (14)
Electricity 6,266,595 7,247,805 (981,210) (14)
Other 109,570 123,348 (13,778) (11)
International Convention Centre 131,360 172,662 (41,302) (24)
Durban Marine Theme Park 179,876 183,774 (3,898) (2)
Ethekwini Transport Authority 15,251 0 15,251 0
Effingham/Link Road 5,025 0 5,025 0
Inter-departmental charges (1,872,074) (1,852,957) (19,117) 0
TOTAL EXPENDITURE 17,899,099 19,450,397 (1,551,298)
Share of Income from Joint Venture 3,521 0 0
SURPLUS FOR THE YEAR 2,217,675 1,581,351 636,324
APPENDIX C(1) : GROUP : ACTUAL VERSUS BUDGET (REVEN UE AND EXPENDITURE) FOR THE YEAR ENDED 30 JUNE 2011
86

eThekwini Municipality and its Municipal Entities
2011 2011 2011 2011 Explanation of Significant Variance s
Actual Budget Variance Variance greater than 10% ver sus Budget
R'000 R'000 R'000 %
REVENUE
Property rates 4,073,638 4,194,800 (121,162) (3)
Property rates - penalties imposed and collection charges 81,854 150,752 (68,898) (46) For reasons refer to annexure C(1A): 1
Service Charges 9,917,960 10,520,750 (602,790) (6)
Rental of facilities and equipment 355,544 315,803 39,741 13 For reasons refer to annexure C(1A): 2
Interest earned - external investments 125,809 213,245 (87,436) (41) For reasons refer to annexure C(1A): 3
Interest earned - outstanding debtors 85,955 97,279 (11,324) (12)
Fines 110,209 164,247 (54,038) (33) For reasons refer to annexure C(1A): 4
Licences and permits 29,640 27,478 2,162 8
Government grants and subsidies 2,590,929 3,658,109 (1,067,180) (29) For reasons refer to annexure C(1A): 5
Public contributions and donations 9,876 9,000 876 0
Other income 2,397,808 1,448,381 949,427 66 For reasons refer to annexure C(1A): 6
Fair Value Adjustment 47,538 0 47,538 0
Gains on disposal of property, plant and equipment 48,655 23,010 25,645 0
Reversal of Impairment-PPE 3,575 0 3,575 0
Reversal of Loss : Loan Impairment 1,561 0 1,561 0
TOTAL REVENUE 19,880,551 20,822,854 (942,303)
EXPENDITURE
Executive & Council 228,077 234,626 (6,549) (3)
Finance & admin 2,327,445 2,548,664 (221,219) (9)
Planning & Development 630,376 774,569 (144,193) (19) For reasons refer to annexure C(1A): 7
Health 300,172 315,921 (15,749) (5)
Community & Social Services 518,264 578,233 (59,969) (10)
Housing 1,342,051 561,738 780,313 139 For reasons refer to annexure C(1A): 8
Public Safety 962,006 942,095 19,911 2
Sport & Recreation 862,424 890,873 (28,449) (3)
Environmental Protection 111,294 119,884 (8,590) (7)
Waste Management 1,831,952 1,961,456 (129,504) (7)
Road Transport 1,455,239 1,656,851 (201,612) (12) For reasons refer to annexure C(1A): 9
Water 2,584,583 2,990,855 (406,272) (14)
Electricity 6,266,594 7,247,805 (981,211) (14)
Other 109,571 123,348 (13,777) (11)
Inter-departmental charges (1,872,074) (1,852,957) (19,117) 0
TOTAL EXPENDITURE 17,657,974 19,093,961 (1,435,987)
Share of Income from Joint Venture 3,521 0 0
SURPLUS FOR THE YEAR 2,226,098 1,728,893 497,205
APPENDIX C(1) : ETHEKWINI MUNICIPALITY : ACTUAL VER SUS BUDGET (REVENUE AND EXPENDITURE) FOR THE YEAR E NDED 30 JUNE 2011
87

eThekwini Municipality and its Municipal EntitiesAPPENDIX C(1A) : - ACTUAL VERSUS BUDGET (REVENUE AN D EXPENDITURE) FOR THE YEAR ENDED 30 JUNE 2011
1. Property Rates - Penalties Imposed and Collection Charges - Decrease
2. Rental of Facilities and Equipment - Increase
3. Interest Earned - External Investments - Decrease
4. Fines - Decrease
5. Government Grants and Subsidies - Decrease
The decrease is due mainly to the delay in the impleamentation of various projects funded by the EPWP grant.
6. Other Income - Increase
The Increase is mainly due to VAT refunds on the apportionment VAT adjustment,an increase in Security Income and income from Urban Improvement Rates.
7. Planning & Development - Decrease
a. Decreases in the employee related costs due to non filling of vacancies b. R 2m in respect of a three year project to be utilised in the next yearc. Delays in the implementation in Economic Development Programme due to MOA's not finalised.
8. Housing - Increase
The increase is due mainly to the increase in Provision of bad debts being adjusted to account for the total arrears accounts of R 32.57m in terms of the debtors age analysis (120 days and more).
9. Road Transport - Decrease
The decrease is due mainly to no major repairs and maintenance undertaken at the bus depots due to the planned capital upgrades.
The decrease is due to the write-off of prescribed debt
The increase is mainly attributable to an increase in the number of facilities generating rental income. The budget was reduced based on the low usage of public buses, the bus usage has since increased resulting in the increase in income.
The decrease is due to lower interest rates and utilisation of internal funds to meet accelerated expenditure.
Metro police - Despite various initiatives in place to encourage payment of fines, poor economic conditions & apathy of offenders to pay has resulted in a decline in income.
88

Output Unit2011
Actual
2011 Under
Construction
2011 Total Additions
Revised Budget
2011 Variance
2011 Variance %
Explanation of Significant Variances greater than 5 % versus Budget
R'000 R'000 R'000 R'000 R'000 %
Procurement and Infrastructure Housing 53,127 -11,210 41,917 141,581 -99,664 -70 Under- spending is due to the delays in Contracts for hostels upgrade.
Engineering 568,332 425,689 994,021 1,042,156 -48,135 -5
Ethekwini Transport Authority 45,353 -31,655 13,698 200,903 -187,205 -93 Savings are due to the delay in the implementation of Warwick Development pending finalisation of court case with
market traders.Sanitation 552,410 -201,733 350,677 369,226 -18,549 -5
Solid Waste 47,043 19,134 66,177 95,308 -29,131 -31 Decrease due to a delay in the appointment of contractors and problems in projects (Electron road transfer station,Bissasar and gas projectWater 1,141,153 -46,191 1,094,962 884,026 210,936 24 The increase is additional expenditure in respect of the Pipe Replacement programme.
Electricity Service 392,185 193,123 585,308 772,944 -187,636 -24 The decrease is as a result of slow progress in the awarding of tenders due to delays in the SCM processes.
Health and Safety
Parks, Recreation, Cemetries & Culture 52,399 -4,913 47,486 71,800 -24,314 -34 The decrease is due to incomplete projects and projects not yet commenced.
Health 1,715 3,095 4,810 9,550 -4,740 -50 The decrease is as a result of slow progress in the awarding of teders due to delays in the SCM processes.
Safety Social and SecurityEmergency Services 30,600 811 31,411 33,900 -2,489 -7 The decrease is as a result of delays in shipment and assembling of fire engines.
Sustainable Development and City EnterprisesSustainable Development and City Enterprises
211,426 -72,669 138,757 163,528 -24,771 -15 Saving is due to late appointment of contractors for Umnini MPCC project and Ezimbuzini Hive Development.
Treasury
Internal Control & Business systems 4,522 0 4,522 5,443 -921 -17 Under-expenditure is attributable to the delays in commencement of the 9th Floor building upgrade (Florence Mkhize Building)
Office of DCM: Treasury 0 0 0 0 0
Finance and Major Project 0 0 0 0 0 0
Income 52,779 0 52,779 57,120 -4,341 -8 Savings realised as a result of the lower RMS costs for the year, as well as delays in procurement of the Note Counting
MachinesINK 12,480 0 12,480 11,900 580 5
Finance 0 0 0
Real Estates 336 0 336 400 -64 -16 Under-spending is due to the delays in procuring Department's plant & equipment requirements.
Durban Transport 30,829 30,829 112,047 -81,218 -72 Under-spending is due to a delay in the procurement of "Rear Engine" buses to be acpuired in the next financial year(2011/2012).
City Fleet 61,502 -1,471 60,031 57,030 3,001 5
Durban Energy Office 7,196 22,570 29,766 34,500 -4,734 -14 Under-expenditure is due to the reduction in grant funding from the Department of Minerals & Energy for the Energy
Projects.
Governance
Governance 2,794 19,949 22,743 36,190 -13,447 -37 The contract for lifts refurbeshment commenced later than anticipated.
Corporate Human Resourses
Human Resources 19,148 -15,119 4,029 5,537 -1,508 -27 Under-expenditure is due to a delay in the implementation of other HR payroll system modules
City Manager's OfficeStrategic Projects 92,996 -1,597 91,399 121,152 -29,753 -25 The under expenditure resulted from the late start of the other projects and projects being funded late through Information Technology 91,215 6,900 98,115 119,531 -21,416 -18 The decrease is as a result of slow progess in the awarding of tenders due to delays in the SCM processes.
Durban Marine Theme Park(PTY) LTD 11,531 0 11,531 11,786 -255 -2International Convension Centre (PTY) 2,213 0 2,213 10,000 -7,787 -78 Only critical assets acquired due to cash constraints
Total 3,485,284 304,713 3,789,997 4,367,558 -577,561 -614
eThekwini Municipality and its Municipal Entities
APPENDIX C (2):GROUP-ACTUAL VERSUS BUDGET (ACQUISIT ION OF PROPERTY,PLANT AND EQUIPMENT) FOR THE YEAR E NDED 30 JUNE 2011- MUNICIPALITY
89

Output Unit2011
Actual
2011 Under
Construction
2011 Total Additions
Revised Budget
2011 Variance
2011 Variance %
Explanation of Significant Variances greater than 5% vers us Budget
R'000 R'000 R'000 R'000 R'000 %
Procurement and Infrastructure Housing 53,127 -11,210 41,917 141,581 -99,664 -70 Under- spending is due to the delays in Contracts for hostels upgrade.
Engineering 568,332 425,689 994,021 1,042,156 -48,135 -5
Ethekwini Transport Authority 45,353 -31,655 13,698 200,903 -187,205 -93 Savings are due to the delay in the implementation of Warwick Development pending finalisation of court case with market
traders.Sanitation 552,410 -201,733 350,677 369,226 -18,549 -5
Solid Waste 47,043 19,134 66,177 95,308 -29,131 -31 Decrease due to a delay in the appointment of contractors and problems in projects (Electron road transfer station,Bissasar and gas projectWater 1,141,153 -46,191 1,094,962 884,026 210,936 24 The increase is additional expenditure in respect of the Pipe Replacement programme.
Electricity Service 392,185 193,123 585,308 772,944 -187,636 -24 The decrease is as a result of slow progress in the awarding of tenders due to delays in the SCM processes.
Health and Safety
Parks, Recreation, Cemetries & Culture 52,399 -4,913 47,486 71,800 -24,314 -34 The decrease is due to incomplete projects and projects not yet commenced.
Health 1,715 3,095 4,810 9,550 -4,740 -50 The decrease is as a result of slow progress in the awarding of teders due to delays in the SCM processes.
Safety Social and SecurityEmergency Services 30,600 811 31,411 33,900 -2,489 -7 The decrease is as a result of delays in shipment and assembling of fire engines.
Sustainable Development and City EnterprisesSustainable Development and City Enterprises
211,426 -72,669 138,757 163,528 -24,771 -15 Saving is due to late appointment of contractors for Umnini MPCC project and Ezimbuzini Hive Development.
Treasury
Internal Control & Business systems 4,522 0 4,522 5,443 -921 -17 Under-expenditure is attributable to the delays in commencement of the 9th Floor building upgrade (Florence Mkhize Building)
Office of DCM: Treasury 0 0 0 0 0
Finance and Major Project 0 0 0 0 0 0
Income 52,779 0 52,779 57,120 -4,341 -8 Savings realised as a result of the lower RMS costs for the year, as well as delays in procurement of the Note Counting
MachinesINK 12,480 0 12,480 11,900 580 5
Finance 0 0 0
Real Estates 336 0 336 400 -64 -16 Under-spending is due to the delays in procuring Department's plant & equipment requirements.
Durban Transport 30,829 30,829 112,047 -81,218 -72 Under-spending is due to a delay in the procurement of "Rear Engine" buses to be acpuired in the next financial year(2011/2012).
City Fleet 61,502 -1,471 60,031 57,030 3,001 5
Durban Energy Office 7,196 22,570 29,766 34,500 -4,734 -14 Under-expenditure is due to the reduction in grant funding from the Department of Minerals & Energy for the Energy
Projects.
Governance
Governance 2,794 19,949 22,743 36,190 -13,447 -37 The contract for lifts refurbeshment commenced later than anticipated.
Corporate Human Resourses
Human Resources 19,148 -15,119 4,029 5,537 -1,508 -27 Under-expenditure is due to a delay in the implementation of other HR payroll system modules
City Manager's OfficeStrategic Projects 92,996 -1,597 91,399 121,152 -29,753 -25 The under expenditure resulted from the late start of the other projects and projects being funded late through Adjustment Information Technology 91,215 6,900 98,115 119,531 -21,416 -18 The decrease is as a result of slow progess in the awarding of tenders due to delays in the SCM processes.
Total 3,471,540 304,713 3,776,253 4,345,772 -569,519 -13
eThekwini Municipality and its Municipal Entities
APPENDIX C (2):MUNICIPALITY-ACTUAL VERSUS BUDGET (ACQUIS ITION OF PROPERTY,PLANT AND EQUIPMENT) FOR THE YEAR ENDED 30 JUNE 2011- MUNICIPALITY
90

NAME OF GRANTSNAME OF ORGAN OF STATE OR
MUNICIPAL ENTITYQUARTELY RECEIPTS QUARTELY EXPENDITURE
GRANTS AND SUBSIDIES DELAYED/ WITHHELD
REASON FOR DELAY OF FUNDS
DID YOUR MUNICIPALITY
COMPLY WITH THE GRANT
CONDITIONS IN TERMS OF GRANT
REASON FOR NON
COMPLIANCE
Sept Dec Mar Jun Total Sept Dec Mar Jun Sept Dec Mar Jun Yes/NoR'000 R'000 R'000 R'000 R'000 R'000 R'000 R'000 R'000 R'000 R '000 R'000 R'000
Financial Management Grant National Treasury 1,000 0 0 0 1,000 1,000 0 0 0 1,000 0 0 0 0 N/A Yes
Municipal Infrastructure Grant National Treasury 148,978 148,978 148,978 148,978 595,912 94,227 189,946 58,331 253,408 595,912 0 0 0 0 Yes N/A
Equitable Share/Subsidy National Treasury 579,830 463,864 347,898 1,391,592 579,830 463,864 347,898 1,391,592
Equitable Share - INK National Treasury 9,559 7,647 5,736 22,942 9,559 7,647 5,736 22,942 Yes N/A
Vuna Awards National Treasury 0 0 0 0 0 0 0 47,417 47,417 0 0 0 0 Yes N/A
DEAT Provincial Government 0 0 0 0 0 0 0 0 259,923 259,923 0 0 0 0 Yes N/A
NDPG National Treasury 11,385 4,660 9,736 0 25,781 14,020 6,869 3,846 1,046 25,781 0 N/A N/A N/A N/A Yes N/A
COGTA National Treasury 16,800 0 0 0 16,800 0 2,899 5,208 5,208 13,315 0 Yes N/A
Govt Subs - Primary Health KZN of Health - State 0 0 44,540 6,848 51,388 11,217 11,134 11,134 11,394 44,879 0 0 0 0 Yes N/A
Capital Grants - Dwaf DWAF 0 6,422 4,077 2,863 13,362 0 6,422 4,077 2,863 13,362 0 0 0 0 N/A Yes N/A
NDOT National /Provincial Treasury 330 0 0 0 330 29,341 50,338 12,068 19,973 111,720 0 0 0 0 Yes N/A
Department of Arts and Culture Provincial Government 0 2,502 0 0 2,502 226 291 1,100 1,676 3,293 0 0 0 0 0 Yes N/A
Office of the Premier Provincial Government 0 0 142 0 142 0 0 142 142 0 0 0 0 0 Yes N/A
2010 World Cup Host City - Operating National 26,000 26,000 26,000 Yes N/A
2010 FIFA World Cup Stadiums Development National 54,476 10,810 65,286 8,962 16264 14,899 10,372 Yes N/A
Intergrated National Electrification Program National Treasury 7,000 21,000 7,000 35,000 16,767 16,557 16,164 23,864 73,352 Yes N/A
NRF National Research Foundation 0 0 49 0 49 0 0 8 32 40 0 0 0 0 Yes N/A
Department of Housing Provincial Government 0 0 60,000 0 60,000 0 0 0 1,247 1,247 0 0 0 Yes N/A
Expanded Public Work Incentive Grant National Treasury 0 0 17,321 0 17,321 114 3,950 9,658 13,722 27,444 0 0 0 0 0 Yes N/A0
Grand Total 767,882 721,549 670,287 165,689 2,325,407 791,263 776,181 490,127 652,287 2,633,361 0 0 0 0
eThekwini Municipality and its Municipal Entities
APPENDIX D : GRANTS AND SUBSIDIES RECEIVED - 30 JUN E 2011
DISCLOSURE OF GRANTS AND SUBSIDIES IN TERMS OF SECT ION 123 MFMA,56 OF 2003
91