the role of stokvels in the economic transformation of ethekwini ...
23
UKZN INSPIRING GREATNESS THE ROLE OF STOKVELS IN THE ECONOMIC TRANSFORMATION OF ETHEKWINI MUNICIPALITY By: Mdu Bophela PhD/DBA Candidate 06 June 2018
-
Upload
khangminh22 -
Category
Documents
-
view
8 -
download
0
Transcript of the role of stokvels in the economic transformation of ethekwini ...

UKZN INSPIRING GREATNESS
THE ROLE OF STOKVELS IN THE ECONOMIC
TRANSFORMATION OF ETHEKWINI MUNICIPALITY
By: Mdu Bophela
PhD/DBA Candidate
06 June 2018

CONTENTS
1. INTRODUCTION & BACKGROUND
2. RESEARCH PROBLEM
3. AIM AND OBJECTIVES
4. LITERATURE REVIEW
5. RESEARCH METHODOLOGY
6. RESULTS AND DISCUSSION
7. RECOMMENDATIONS
8. CONCLUSION
9. Q & A SESSION

INTRODUCTION
❑ Informal economy in SA is valued at R160bn.
❑ Comprises a R49bn stokvel sector, with a membership of 11,4million.
❑ However stokvels remain hidden, marginalised and unrecognised – including in the national official
statistics.
❑ On 8 May 2018 President C.M. Ramaphosa emphasised the need for more banks in SA including a
Stokvel Bank towards the transformation of the economy.
❑ Developing the stokvel industry could be key to poverty alleviation, reduction of unemployment and
broadening equitable access to the ownership of the economy and capital accumulation; thus
improving the livelihoods and raising the standard of living in eThekwini Municipality (EM).

BACKGROUND❑ Eight (8) types of stokvels in SA - viz.; Grocery, Burial, Savings, Birthday, Lobola, Investment, High-budget and
other. This paper took a blanket approach – encompassing all stokvel types.
❑ In late 1990 the Presidency recognised "stokvels as a critical component for a cohesive society” (African
Response Research, 2012:4) and a safety net based on their ability to provide for financial and social capital – yet
remain marginalised.
❑ In 2001 EM adopted a Durban’s Informal Economy Policy wherein the word ‘stokvels’ is mentioned once - under
clause 7.2.12. The clause introduces stokvels as an alternative innovative solution for SMME’s to access financial
support in EM.
❑ In 2012 the SARB gazetted exemption notice no. 2173 for stokvels to trade under Bank Act 94 of 1990,
authorising NASASA to be a self-regulatory organisation for stokvels with a mandate to developing governance
structures for the industry.
❑ SALGA (2012) is a blue-print of guidelines for the 278 municipalities in SA to adopt a more developmental
approach towards the informal economy.
❑ As an account for progress in 2015 the Municipality of eThekwini documented, presented and adopted an
Integrated Developmental Plan (IDP) 2012/2017 inclusive of the informal economy.

THE RESEARCH PROBLEM
❑ SALGA’s (2012) blue-print, IDP 2015/2016 and Durban’s Informal Economy Policy of 2001 were source
documents for the paper into the role of stokvels in EM’s economic policy framework, however all excluded
stokvels to the margins.
❑ Rakabe (2013); Fourie (2013); African Research Response (2012) maintain that - for an industry valued at
R49bn, membership of 11,4million and 811,830 stokvel groups, stokvels remain a hidden economy.
❑ Rakabe (2013) further ascribes the marginalisation of stokvels to the oligopolistic nature of the mainstream
economy of SA.
❑ There was dearth in the consulted literature on role of stokvels in EM and an absence on a proposed model for
the integration of the industry into the policy framework of a municipality.
❑ An exploratory research by Arko-achemfuor (2012) went as far as the ability for stokvels to finance SMME’s in
rural SA.

AIM AND OBJECTIVES
AIM OF THE PAPER
❑ The aim of the paper is to explore the role of stokvels in the economic transformation of EM and to develop a
model for their integration into the economic policy framework of the municipality.
OBJECTIVES OF THE PAPER
❑ To determine the economic contribution factors of stokvels in the economy of EM;
❑ To investigate the role of stokvels in the economic policy framework of EM;
❑ To explore the views of stokvel groups and Municipality Council members (policy-makers) on the role of stokvels
in the economic framework of EM; and
❑ To develop a model for the integration of stokvels into the economic policy framework of EM

LITERATURE REVIEW
❑ A South African equivalent of a RoSCAs is a stokvel – a term unique only to SA (Maluku & Kaseke, 2014).
❑ The common denominator amongst RoSCAs is that they are used for both saving and borrowing and serve as
livelihood needs support systems and promote economic development for the community (Kabuya, 2015;
Sulistyo, 2015).
❑ Stokvels can be defined as - a credit union in which a group of people enter into an agreement to contribute a
fixed amount of money for a common pool - weekly, fortnightly or monthly.
❑ There are about eight (8) types of stokvels in SA, being; savings stokvels, burial stokvels, investment stokvels,
grocery stokvels, high-budget stokvels, birthday-party stokvels, lobola stokvels and others (African Response
Research, 2012; Maluku & Kaseke, 2014).
❑ The research reports by African Response Research (2012); Old Mutual (2011) revealed that stokvels have a
membership of approximately 11,400,400 registered individuals; belonging to 811,830 stokvels and collectively
saving R49 billion a year.

LITERATURE REVIEW cont’d…❑ Writers Arko-achemfuor (2012); Mashingo & Schoeman (2012); Maluku & Kaseke (2014), Hossein (2017) and
reports from research organisations like African Response Research (2012) indicate the reasons for and benefits ofparticipating in RoSCAs like stokvels as:
– The ability to save, invest and meet basic needs;
– Sustaining the existence of formal businesses thus creating employment;
– The financing/starting of small businesses;
– Women’s empowerment;
– Easy access to credit & mini-loans; and
– The creation of social capital, moral support & mutual assistance.
❑ Scholars Rakabe (2013); Fourie (2013) classify stokvels under informal economy.
❑ Schneider (2002) cited in SALGA (2012) estimated the size of the informal economy in SA around R160bn, 2.5times as large as the agri sector, 70% of the mining sector.
❑ There has been a “realisation that the informal economy has become a crucial factor in economic development,particularly in developing and emerging countries, and that it offers significant job and income generationopportunities” (Chen, 2012:3).
❑ According to David et al. (2013:4) “policy frameworks and strategies aimed at the informal economy must bedeveloped, without hampering the potential of the sector for economic growth. However, the main challenge is todevelop innovative, inclusive and supportive policies that recognise the value of the informal economy”.
❑ Conceptual framework for the research is based on Maslow’s hierarchy of needs and the construct of the Hayes &Wheelwright four-stage model.

RESEARCH METHODOLOGY
❑ Researcher chose a convergent parallel MIXED METHOD, with a pragmatic paradigm view and triangulation
strategy to confirm converging themes.
❑ Location of the research was EM’s 197 towns/cities in KwaZulu-Natal, SA.
❑ Target population of the research was the 36,333 stokvel groups of EM.
❑ Two sampling methods; simple random probability sampling for 395 stokvel groups and
purposive non-probability sampling for six Municipality Council members.
❑ Data collection used questionnaire instrument (for quantitative research) and interview schedule (for qualitative
research).
❑ A Likert scale was used to construct a questionnaire.

RESEARCH METHODOLOGY cont’d…
❑ To measure the reliability a Cronbach-alpha coefficient was employed.
❑ Quantitative data was analysed using; descriptive and inferential statistics.The coded and transcribed data was
entered into SPSS version 25.0.
❑ Qualitative data was thematically analysed, transcribed and grouped into themes using N-VIVO version 11.0.
❑ A theory triangulation technique was used to develop a new model for stokvels to be integrated into the policy
framework of EM.
❑ Findings for the research were interpreted and generalisations made for the stokvel population of EM.
❑ It was noted that the sample size (n = 395) for this research was equivalent to the sample size of the population of
stokvel groups in SA. It can therefore be inferred that the findings of this research could be generalised nationally
to the stokvel industry in SA.

RESULTS AND DISCUSSION
❑ Overall finding is that of 96.1% stokvels indicated their primary objectives; to save money, socialise and
network, loan funds to members.
❑ The key thematic finding that emerged was ‘Money saving and investments’ - corroborated by Maluku &
Kaseke (2014:509) who revealed that “membership in stokvels creates an opportunity to save…and an
“opportunity to invest in household property”.
Frequency Percent
Valid
Percent
Cumulative
Percent
To socialise and network 72 18.6 18.6 18.6
To save money 240 61.9 61.9 80.4
To create jobs by financing small business 4 1.0 1.0 81.4
To loan funds to members of your stokvel 57 14.7 14.7 96.1
To deposit our funds in high return
investments
15 3.9 3.9 100.0
Total 388 100.0 100.0
Table 1. Primary objective of stokvel groups in EM

❑ Overall findings indicate that EM needs to formulate an economic policy framework inclusive of stokvels, promote investmentopportunities for stokvels and create an environment for stokvels to co-invest in EM projects. African Response Research (2012:15) isin agreement with this finding in that “players in the FMCG sector are already appreciating the value of stokvels with Massmartacknowledging the significant portion of sales associated with stokvels”.
❑ The emerging key thematic findings of this research were ‘Business opportunities’, ’Job creation’ and a ‘Policy frameworkinclusive of stokvels’. The gaps identified are supported by Mpango (2013) cited in Wuyts & Kilama (2016) who maintained that,coupled with government policies aimed to review economic transformation for inclusivity and to promote a high savings culture asopposed to consumerism, a well-developed national plan will ensure that economic transformation will lead to enhanced growth andpoverty reduction.
Figure 1. Survey responses rank how the economy of EM can be transformed
0
20
40
60
80
100
120
Develop a policyframework for stokvel
industry only
Present investmentopportunities for stokvels
Develop a policyframework inclusive of
stokvel industry
Invite all stakeholders ofmunicipality to develop a
policy framework
Create an enablingenvironment for stokvels
to co-invest in themunicipality projects
Very-High High Medium Low None
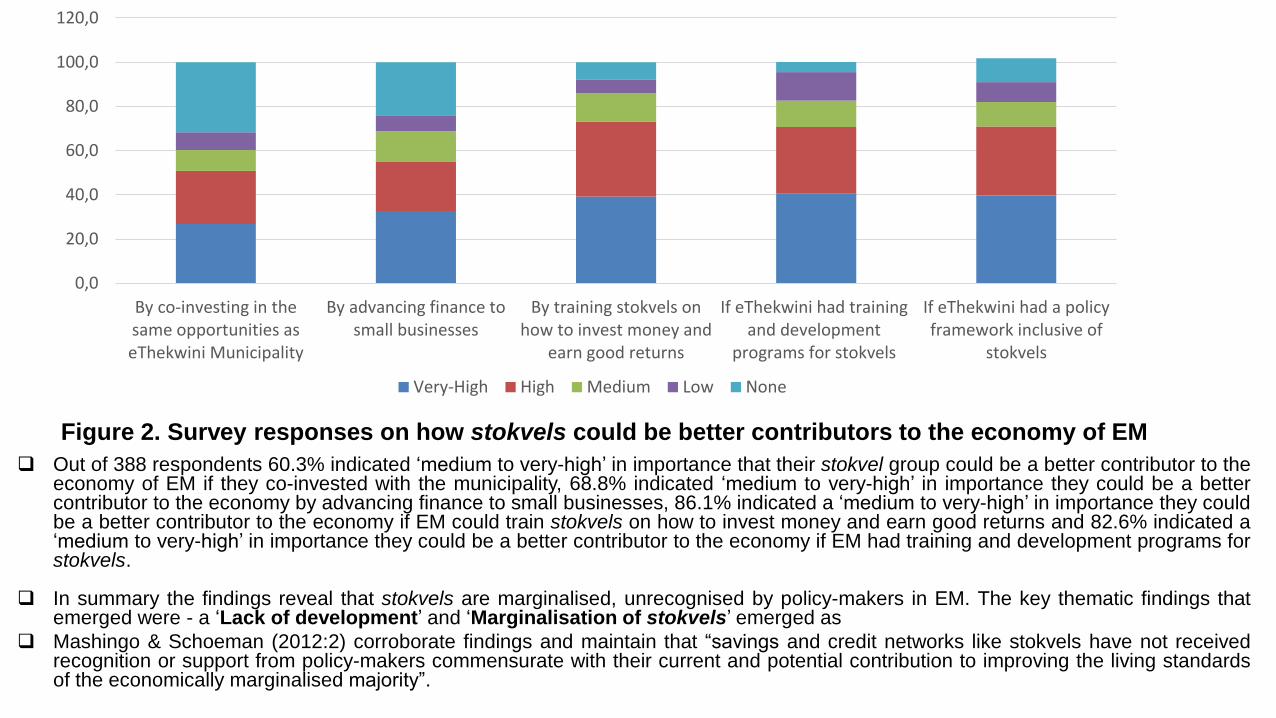
❑ Out of 388 respondents 60.3% indicated ‘medium to very-high’ in importance that their stokvel group could be a better contributor to theeconomy of EM if they co-invested with the municipality, 68.8% indicated ‘medium to very-high’ in importance they could be a bettercontributor to the economy by advancing finance to small businesses, 86.1% indicated a ‘medium to very-high’ in importance they couldbe a better contributor to the economy if EM could train stokvels on how to invest money and earn good returns and 82.6% indicated a‘medium to very-high’ in importance they could be a better contributor to the economy if EM had training and development programs forstokvels.
❑ In summary the findings reveal that stokvels are marginalised, unrecognised by policy-makers in EM. The key thematic findings thatemerged were - a ‘Lack of development’ and ‘Marginalisation of stokvels’ emerged as
❑ Mashingo & Schoeman (2012:2) corroborate findings and maintain that “savings and credit networks like stokvels have not receivedrecognition or support from policy-makers commensurate with their current and potential contribution to improving the living standardsof the economically marginalised majority”.
Figure 2. Survey responses on how stokvels could be better contributors to the economy of EM
0,0
20,0
40,0
60,0
80,0
100,0
120,0
By co-investing in thesame opportunities aseThekwini Municipality
By advancing finance tosmall businesses
By training stokvels onhow to invest money and
earn good returns
If eThekwini had trainingand development
programs for stokvels
If eThekwini had a policyframework inclusive of
stokvels
Very-High High Medium Low None

❑ The stokvel landscape in EM is dominated by seven types of stokvels; Grocery, Savings, Birthday, Investments, High-Budget
and Other. Burial type stokvels are no longer common due to incorporation of burial clauses in the agreements and mandates of
most stokvels.
❑ The findings highlight that the individual needs of members of stokvels give rise to stokvel typology as depicted in (fig.3 above).
This corroborate Maslow’s hierarchy of needs theory and the construct of the Hayes & Wheelwright model.
❑ This research observed that less sophisticated stokvels like Grocery stokvels believe in handling cash at meetings. Whereas
more sophisticated stokvels conduct their pooling of funds using the EFT banking system, etc. – corroborating the theories
adopted for the Conceptual Framework of this paper.
❑ The issuance by National Treasury of exemption notices no. 2173 & 1176 under the Bank Act 94 of 1990 accords stokvels a
business status. The observation finds concurrence in Neves & du Toit (2012) that RoSCAs like stokvels are similar to mutual
savings banks.
Table 2. Types of stokvel groups found in EM
Frequency Percent
Valid
Percent
Cumulative
Percent
Grocery stokvels 262 67.5 67.5 67.5
Investment stokvels 19 4.9 4.9 72.4
Savings stokvels 84 21.6 21.6 94.1
High budget stokvels 1 .3 .3 94.3
Birthday stokvels 8 2.1 2.1 96.4
Burial stokvels 2 .5 .5 96.9
Other stokvels 12 3.1 3.1 100.0
Total 388 100.0 100.0 Grocery Stokvels 67.5%
(Survival Need)
Savings Stokvels 21.6%
(Safety Need)
Birthday + Other Stokvels 5.2%
(Social Need)
Investment Stokvels 4.9%
(Esteem Need)
High-Budget Stokvels 0.3%
(Self Actualisation)
Figure 3. EM Stokvel Group Types by Hierarchy of Needs
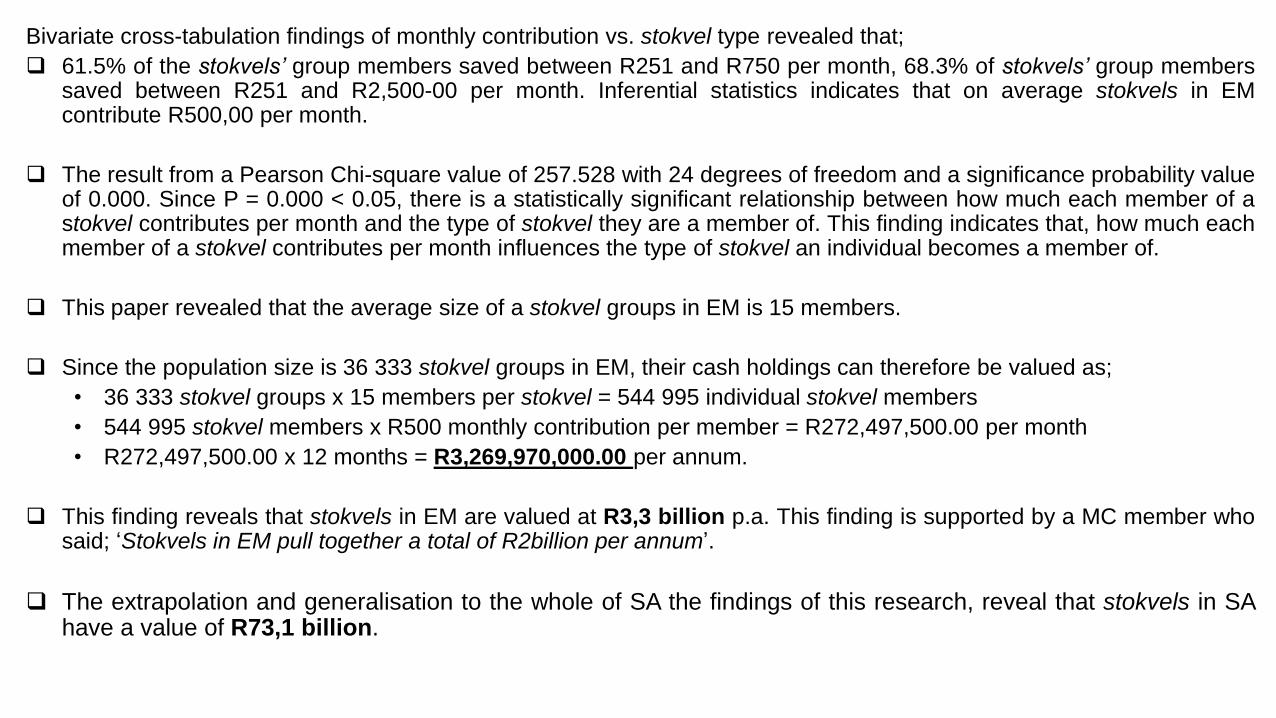
Bivariate cross-tabulation findings of monthly contribution vs. stokvel type revealed that;
❑ 61.5% of the stokvels’ group members saved between R251 and R750 per month, 68.3% of stokvels’ group memberssaved between R251 and R2,500-00 per month. Inferential statistics indicates that on average stokvels in EMcontribute R500,00 per month.
❑ The result from a Pearson Chi-square value of 257.528 with 24 degrees of freedom and a significance probability valueof 0.000. Since P = 0.000 < 0.05, there is a statistically significant relationship between how much each member of astokvel contributes per month and the type of stokvel they are a member of. This finding indicates that, how much eachmember of a stokvel contributes per month influences the type of stokvel an individual becomes a member of.
❑ This paper revealed that the average size of a stokvel groups in EM is 15 members.
❑ Since the population size is 36 333 stokvel groups in EM, their cash holdings can therefore be valued as;
• 36 333 stokvel groups x 15 members per stokvel = 544 995 individual stokvel members
• 544 995 stokvel members x R500 monthly contribution per member = R272,497,500.00 per month
• R272,497,500.00 x 12 months = R3,269,970,000.00 per annum.
❑ This finding reveals that stokvels in EM are valued at R3,3 billion p.a. This finding is supported by a MC member whosaid; ‘Stokvels in EM pull together a total of R2billion per annum’.
❑ The extrapolation and generalisation to the whole of SA the findings of this research, reveal that stokvels in SAhave a value of R73,1 billion.

Grocery
stokvel
Investmen
t stokvel
Savings
stokvel
High-
Budget
stokvel
Birthday
stokvel
Burial
stokvel
Other
stokvel
Formally
Employed
90 7 46 1 4 0 5 Frequency
58.7 4.6 30.1 0.7 2.6 0.0 3.3 Percent
58.7 4.6 30.1 0.7 2.6 0.0 3.3 Valid Percent
58.7 63.3 93.4 94.1 96.7 96.7 100.0 Cumulative Percent
Unemployed
/ Self-
Employed
172 12 38 0 4 2 7 Frequency
73.1 5.1 16.2 0.0 1.7 0.9 3 Percent
73.1 5.1 16.2 0.0 1.7 0.9 3.0 Valid Percent
73.1 78.2 94.4 94.4 95.3 97.0 100.0 Cumulative Percent
Table 3. Cross-tabulation of employment status versus stokvel type
❑ The result from a Pearson Chi-square value of 14.388 with 6 degrees of freedom and a significance probability
value was 0.026. Because P = 0.026 < 0.05, therefore there is a statistically significant correlation between the
employment status of a stokvel member and the type of stokvel they are a member of. This finding indicates
that the employment status of a stokvel member influences the type of stokvel they belong to.
❑ The findings corroborates Maslow’s hierarchy of needs as it reveals that a formally employed member of a
stokvel group, is more likely to partake in other types of stokvels since they would have graduated from the
“Survival Need” fulfilment stage of the pyramid of needs to the next stages.
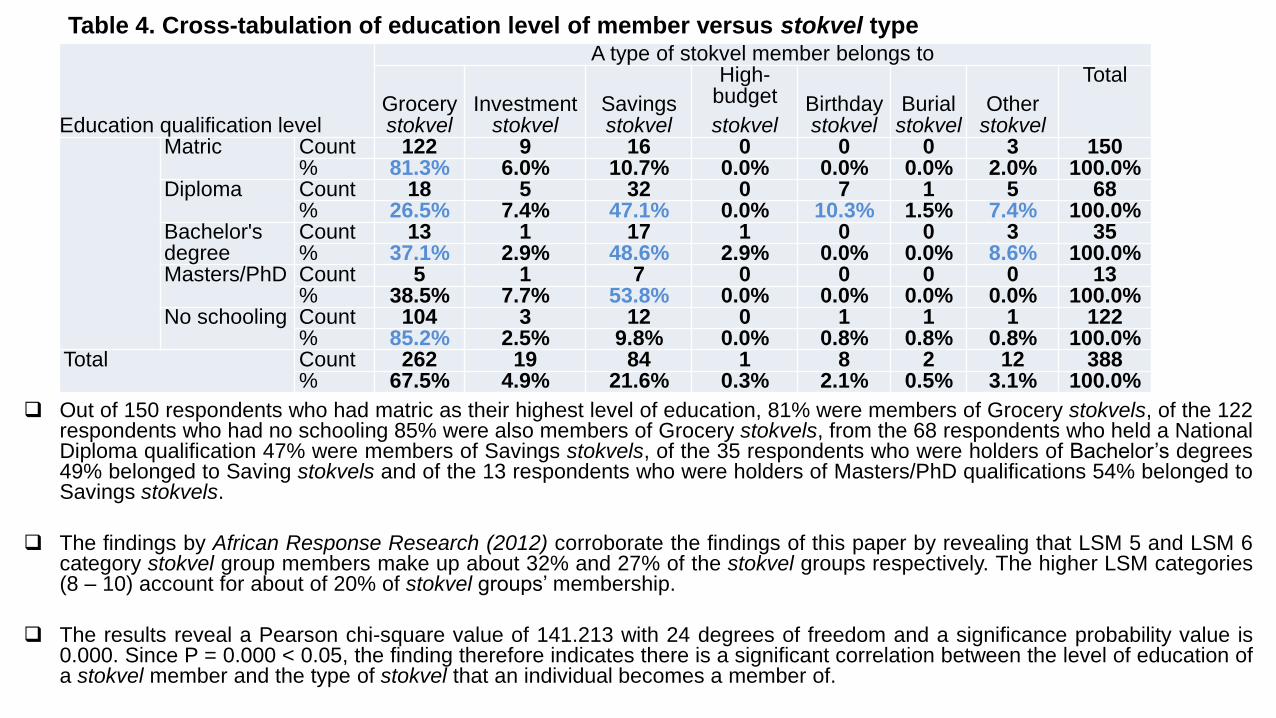
❑ Out of 150 respondents who had matric as their highest level of education, 81% were members of Grocery stokvels, of the 122respondents who had no schooling 85% were also members of Grocery stokvels, from the 68 respondents who held a NationalDiploma qualification 47% were members of Savings stokvels, of the 35 respondents who were holders of Bachelor’s degrees49% belonged to Saving stokvels and of the 13 respondents who were holders of Masters/PhD qualifications 54% belonged toSavings stokvels.
❑ The findings by African Response Research (2012) corroborate the findings of this paper by revealing that LSM 5 and LSM 6category stokvel group members make up about 32% and 27% of the stokvel groups respectively. The higher LSM categories(8 – 10) account for about of 20% of stokvel groups’ membership.
❑ The results reveal a Pearson chi-square value of 141.213 with 24 degrees of freedom and a significance probability value is0.000. Since P = 0.000 < 0.05, the finding therefore indicates there is a significant correlation between the level of education ofa stokvel member and the type of stokvel that an individual becomes a member of.
Education qualification level
A type of stokvel member belongs to
Grocery stokvel
Investment stokvel
Savings stokvel
High-budget
stokvelBirthday stokvel
Burial stokvel
Other stokvel
Total
Matric Count 122 9 16 0 0 0 3 150% 81.3% 6.0% 10.7% 0.0% 0.0% 0.0% 2.0% 100.0%
Diploma Count 18 5 32 0 7 1 5 68% 26.5% 7.4% 47.1% 0.0% 10.3% 1.5% 7.4% 100.0%
Bachelor'sdegree
Count 13 1 17 1 0 0 3 35% 37.1% 2.9% 48.6% 2.9% 0.0% 0.0% 8.6% 100.0%
Masters/PhD Count 5 1 7 0 0 0 0 13% 38.5% 7.7% 53.8% 0.0% 0.0% 0.0% 0.0% 100.0%
No schooling Count 104 3 12 0 1 1 1 122% 85.2% 2.5% 9.8% 0.0% 0.8% 0.8% 0.8% 100.0%
Total Count 262 19 84 1 8 2 12 388% 67.5% 4.9% 21.6% 0.3% 2.1% 0.5% 3.1% 100.0%
Table 4. Cross-tabulation of education level of member versus stokvel type

❑ A triangulation strategy was applied to create validity, trustworthiness and confidence about the findings of thisresearch.
❑ Maslow’s hierarchy of needs theory layered with Hayes & Wheelwright model holds true for stokvels of EM.
❑ Each of the models, when applied alone do not provide stokvel industry and policy-makers with information needed tomake rational decisions taking into account all the stokvel typology in the economic policy framework of EM.
• Stage 1: Internal Neutral (Grocery Stokvels)
• Stage 2: External Neutral (Savings & Social Stokvels)
• Stage 3: Internal Supportive (Investment Stokvels)
• Stage 4: External Supportive (High-Budget Stokvels)
• Stage 1: Survival Need (Grocery Stokvels)
• Stage 2: Safety Need (Savings Stokvels)
• Stage 3: Social Need (Social Stokvels)
• Stage 4: Self-Esteem Need (Investment Stokvels)
• Stage 5: Self-Actualisation (High-Budget Stokvels)
• Stage 1: Grocery Focus Stokvels
• Stage 2: Savings Focus Stokvels
• Stage 3: Social Focus Stokvels
• Stage 4: Investment Focus Stokvels
• Stage 5: High-Budget Focus Stokvels
Hayes & Wheelwright
Maslow's Theory
Proposed Model
Figure 4. New Model for Stokvel Integration into the Economic Policy Framework of EM

RECOMMENDATIONS
❑ Resulting from the integration model, this paper recommends a stokvel development model that would be applied
in conjunction with the integration model to enable policy-makers in the municipality to identify developmental
programs for stokvels based on their focus type (as illustrated in Figure 5. below)
• Focus on being leader of industry• Venturing into capital intensive programs/projects• Focus on being positive influence in community
High-Budget Type Focus
(Maslow's Self-Actualisation Needs/Hayes & Wheelwright External
Supportive)
• Focus on creating an alternative to savings by developing an investment portfolio
• Focus on formulating an investment strategy
Investment Type Focus
(Maslow's Esteem Needs/Hayes & Wheelwright Internal Supportive)
• Focus on monitoring performance metrics• Start to think long-term• Focus on building a social network• Actively pursue improvement activities
Social Type Focus
(Maslow's Social Needs/Hayes & Wheelwright External Neutral)
• Focus on monitoring performance metrics
• Start to think long-term
• Focus on building a social network
• Actively pursue improvement activities
Savings Type Focus
(Maslow's Safety Needs/Hayes & Wheelwright External Neutral)
• Operate on survival mode
• Short-term thinking horizon with no long-term plan
• Instant gratification
Grocery Type Focus
(Maslow's Survival Needs/Hayes & Wheelwright Internal Supportive)
Figure 5. Stokvel Development Model Overview
❑ It is a recommendation that policy-makers and business alike use the combined models to tailor-make their value
proposition for the stokvel industry on the basis of the models proposed.
Grocery Stokvels 67.5%
(Survival Need)
Savings Stokvels 21.6%
(Safety Need)
Birthday + Other Stokvels 5.2%
(Social Need)
Investment Stokvels 4.9%
(Esteem Need)
High-Budget Stokvels 0.3%
(Self Actualisation)

RECOMMENDATIONSIt is recommended;
❑ that National Treasury enforces exemption notice no. 2173 amendment of the Bank Act 94 of 1990 by making it a FICA requirement for Commercial banks to open banking accounts for only stokvels that are registered with NASASA.
❑ for the ‘black industrialists’ program to support the formation of a Stokvel Bank or an Informal Economy Bank in order to leverage this industry’s financial muscle. Such an initiative will go towards job creation, poverty alleviation and inequality redress.
❑ that High-budget type and/or Investment type stokvels take advantage of the bulk-buying power for the stokvel group to acquire and own high capital value assets.
❑ The Municipal Council needs to categorise and classify stokvels as per the models developed in this paper in order to align its economic programs, activities and campaigns of EM with the relevant stokvel group type.
As a marginalised sector, stokvels hold opportunities for growing the economy and absorbing the unemployed through the exploitation of existing and new markets. It is for this reason that efforts to unlock these opportunities will require tailor-made and imaginative interventions by policy-makers on the one hand and, on the other hand, self-driven initiatives by the stokvels.

CONCLUSION
• It should be the objective of EM to transform the economy of the Municipality by broadeningthe economy to be inclusive of the previously marginalised sectors of the economy includingstokvels.
• A lack of understanding and knowledge of the importance of the stokvel industry has led totheir marginalisation, and the continued lack of recognition may have negative impact in thealleviation of poverty, reduction of unemployment and inequity.
• Since the only clause in Durban’s Informal Economy Policy that mentions stokvels has notbeen implemented thus far, this paper provides fertile ground for the municipality tointegrate stokvels into the economic policy framework - in a meaningful way.
• The adoption, understanding and application of the developed models can only add value tothe integration of stokvels into the Economic Policy Framework of EM.
• Applied together the models in this paper will assist the municipality to build linkageplatforms between formal businesses and stokvels.
REFERENCES• Adams, J., Martin, K. A. B. and Harris, C. (2015) ‘Explaining Small-Business Development: A Small-Business Development Model Combining the Maslow and the Hayes and Wheelwright
Models’, Journal of the Indiana Academy of the Social Sciences, 18(317), pp. 26–37.
• African Response Research (2012) ‘Stokvels - A hidden economy’, African Response Research, (May 2012), pp. 1–19.
• Arko-achemfuor, A. (2012) ‘Financing Small , Medium and Micro-Enterprises ( SMMEs ) in Rural South Africa : An Exploratory Study of Stokvels in the Nailed Local Municipality , North
West Province’, Journal of Sociology Soc Anth, 3(2), pp. 127–133.
• Calvin, B. and Coetzee, G. (2010) A Review of the South African Microfinance Sector 2009. Available at: http://www.up.ac.za/media/shared/Legacy/sitefiles/file/1/3841/vol.pdf (Accessed:
21 May 2017).
• Chen, M. A. (2012) ‘The Informal Economy: Definitions, Theories and Policies’, WIEGO Working Paper, 1, p. 26.
• David, S. et al. (2013) Managing Informality: Local government practices and approaches towards the informal economy. Learning examples from five African countries. Available at:
http://www.enterprise-development.org/wp-content/uploads/managing_informality_local_governments_practices_towards_the_informal_economy.pdf (Accessed: 19 May 2017).
• eThekwini Municipality (2016) Integrated Development Plan 5 Year Plan: 2012-2017; 2016/2017 IDP Annual Review, Integrated Development Plan. Available at:
http://www.durban.gov.za/City_Services/BST_MU/Documents/Informal_Economy_Policy.pdf (Accessed: 13 September 2017)
• EThekwini Unicity Municipality (2001) Durban’s Informal Economy Policy, EThekwini Unicity Municipality. Durban. Available at:
http://www.durban.gov.za/City_Services/BST_MU/Documents/Informal_Economy_Policy.pdf (Accessed: 18 August 2017).
• Fourie, F. (2013) ‘Reducing unemployment: Waiting for high growth? Waiting for Godot?’, pp. 1–7. Available at: http://www.econ3x3.org/sites/default/files/articles/Fourie March 2013
Unemployment - Waiting for growth or Godot FINAL.pdf (Accessed: 19 May 2017).
• Hossein, C. S. (2017) ‘Fringe Banking in Canada: A Study of Rotating Savings and Credit Associations (ROSCAs) in Toronto’s Inner Suburbs’, Canadian Journal of Nonprofit and Social
Economy Research, 8(1), pp. 29–43.
• Kabuya, F. I. (2015) ‘The Rotating Savings and Credit Associations (ROSCAs): Unregistered Sources 0f Credit in Local Communities’, IOSR Journal Of Humanities And Social Science,
20(8), pp. 95–98.
• Kongolo, M. (2007) ‘Women and informal credit: Lessons from Moretele, South Africa’, Journal of International Women’s Studies, 8(4), pp. 121–132.
• Maluku, S. and Kaseke, E. (2014) ‘The role of stokvels in improving people’s lives: The case in orange farm, Johannesburg, South Africa’, Social Work, 50(4), pp. 504–515.
• Mashingo, P. and Schoeman, C. (2012) ‘Stokvels as an instrument and channel to extend credit to poor households in South Africa’, Journal of Economics, 5, pp. 49–61.
• National Treasury (2010) ‘Combined Annual Report of the Supervisors of the Co-operative Banks Development Agency and the South African Reserve Bank’, pp. 1–28.
• Neves, D. and du Toit, A. (2012) ‘Money and Sociality in South Africa’S Informal Economy’, Africa, 82(1), pp. 131–149.
• Old Mutual (2011) Special Feature: Stokvels/savings & investment clubs.
• Rakabe, E. (2013) ‘Unlocking the growth and employment potential of business in the margins’, Econ3x3. Available at: http://www.econ3x3.org/sites/default/files/articles/Rakabe 2013
Unlocking businesesin the margins FINAL for PDF.pdf (Accessed: 19 May 2017).
• SALGA (2012) Making the Informal Economy Visible : Guidelines for Municipalities in Respect of Adopting a More Developmental Approach Towards the Informal Economy. Available at:
http://led.co.za/sites/default/files/cabinet/orgname-raw/document/2012/municipal_informal_economy_guidelines_final_june2012_v2_0.pdf (Accessed: 19 May 2017).
• Statistics South Africa (2016) Community Survey 2016. Available at: http://cs2016.statssa.gov.za/wp-content/uploads/2016/07/NT-30-06-2016-RELEASE-for-CS-2016-_Statistical-
releas_1-July-2016.pdf (Accessed: 5 August 2017).
• Wheelwright, S. C. and Hayes, R. H. (1985) ‘Competing through manufacturing’, Harvard Business Review, pp. 99–109.

Q & A SESSION
THANK YOU