
Estimation of separate effects of water and nutrient limitation for rainfed lowland rice within a...
10
This article appeared in a journal published by Elsevier. The attached copy is furnished to the author for internal non-commercial research and education use, including for instruction at the authors institution and sharing with colleagues. Other uses, including reproduction and distribution, or selling or licensing copies, or posting to personal, institutional or third party websites are prohibited. In most cases authors are permitted to post their version of the article (e.g. in Word or Tex form) to their personal website or institutional repository. Authors requiring further information regarding Elsevier’s archiving and manuscript policies are encouraged to visit: http://www.elsevier.com/authorsrights
Transcript of Estimation of separate effects of water and nutrient limitation for rainfed lowland rice within a...

This article appeared in a journal published by Elsevier. The attachedcopy is furnished to the author for internal non-commercial researchand education use, including for instruction at the authors institution
and sharing with colleagues.
Other uses, including reproduction and distribution, or selling orlicensing copies, or posting to personal, institutional or third party
websites are prohibited.
In most cases authors are permitted to post their version of thearticle (e.g. in Word or Tex form) to their personal website orinstitutional repository. Authors requiring further information
regarding Elsevier’s archiving and manuscript policies areencouraged to visit:
http://www.elsevier.com/authorsrights

Author's personal copy
Field Crops Research 163 (2014) 100–108
Contents lists available at ScienceDirect
Field Crops Research
journa l homepage: www.e lsev ier .com/ locate / fc r
Estimation of separate effects of water and nutrient limitation forrainfed lowland rice within a province in the Mekong region
T. Inthavonga,∗, S. Fukaib, M. Tsuboc
a National Agriculture and Forestry Research Institute, Ministry of Agriculture and Forestry, Vientiane, Lao People’s Democratic Republicb The University of Queensland, School of Agriculture and Food Sciences, Brisbane, QLD 4072, Australiac Tottori University, Arid Land Research Center, 1390 Hamasaka, Tottori 680-0001, Japan
a r t i c l e i n f o
Article history:Received 7 January 2013Received in revised form 24 March 2014Accepted 28 March 2014Available online 20 April 2014
Keywords:ModelOryza sativaPotential yieldSoil nutrientWater stress
a b s t r a c t
Drought and low soil fertility are major constraints for high yield in rainfed lowland rice in Laos. Toexamine the separate effects of low water and nutrient availability and then to provide regional-scalefertilizer recommendations for rainfed lowland rice, a simulation study, together with field measure-ments, was carried out for Savannakhet province in the 2007 and 2008 seasons. To achieve this, a soilnutrient model QUEFTS (Quantitative Evaluation of the Fertility of Tropical Soils) was combined with arecently developed soil water balance (SWB) model. The nutrient model was used to estimate yield fromN, P and K uptake under various supply of nutrient in the soil, and then yield reduction due to waterstress was calculated from the water balance model. The combined model was validated with the yieldresults of field experiments conducted in the dry season with no water limitation and also with yieldsobtained from 101 farms across the province in two wet seasons where both water and nutrient mayhave been limiting yield. The yield under inherent nutrient supply without fertilizer input was calculatedfrom soil organic carbon, available P and K, and pH, and without water limitation, and was estimated torange widely between 1 and 2 t ha−1 for the central Lao province of Savannakhet. Yield was estimatedto increase on average from 1.6 t ha−1 to 2.9 t ha−1 with the recommended fertilizer application rate of60–13–16 N–P–K kg ha−1, and up to around 6 t ha−1 under non-limited nutrient conditions. Yield reduc-tion due to water stress alone, estimated from the soil water balance model, was 4–12%. These resultsindicate that the influence of water stress on the yield estimated for the two wet seasons was rathersmall, compared with that of nutrient stress. Fertilizer rates to achieve a particular yield target, whichwere calculated by subtracting inherent nutrient supply from nutrient uptake required for the yield tar-get and then dividing by fertilizer nutrient taken up per kg applied, were also estimated to determine thevariability of nutrient requirements at different locations. In most of the rice-growing areas, nitrogen,phosphorus and potassium required to achieve the yield target of 3 t ha−1 varied widely between 20 and70 kg ha−1, 5 and 35 kg ha−1 and 10 and 30 kg ha−1, respectively, suggesting the importance of utilizingthe site-specific fertilizer recommendation for rainfed lowland rice.
© 2014 Elsevier B.V. All rights reserved.
1. Introduction
In rainfed lowland rice environments, crop performance is vari-able among fields due to differences in field hydrology, inherent soilfertility and crop management practices, and it is also unpredictabledue to variable rainfall patterns. Crop simulation models can beutilized to evaluate separate effect of these factors on grain yield.Currently there are large differences in the scope and complex-ity of crop models including rice models that are used to estimate
∗ Corresponding author. Tel.: +856 20 23536456; fax: +856 21 770078.E-mail addresses: [email protected], [email protected] (T. Inthavong).
crop yield. The existing rice models like CERES-Rice (Ritchie et al.,1986) and ORYZA2000 (Bouman et al., 2001) use complex functionsdescribing water balance to estimate crop water availability, cropresponse to nutrients, and radiation penetration into crop canopiesto provide an estimate of canopy photosynthesis and eventuallyyield in rice. Models that are useful for crop yield estimation com-monly need to include a minimum of five interacting modules:duration of crop growth, biomass growth rate, the partitioning ofbiomass produced particularly to the economic yield component,soil water balance, and nutrient uptake and balance in the soil(Ritchie, 1990). There appears almost no rice model that estimatesfertilizer requirement under different water availability conditionsfor rice, particularly using rather limited soil information as inputs.
http://dx.doi.org/10.1016/j.fcr.2014.03.0200378-4290/© 2014 Elsevier B.V. All rights reserved.

Author's personal copy
T. Inthavong et al. / Field Crops Research 163 (2014) 100–108 101
Fertilizer requirement and water availability of rainfed lowlandrice in the Mekong region including Laos was recently reviewedby Fukai and Ouk (2012). In the Mekong region where rice is grownmostly as rainfed lowland rice and soil information is rather limited,soil fertility is generally low, and water availability varies greatlygeographically within a province as well as in different seasons(Inthavong et al., 2012).
The water balance component is important for model devel-opment, as insufficient water during crop growth is considered tobe one of the most serious problems limiting the productivity ofrainfed lowland rice in the Mekong region (Fukai and Ouk, 2012).Lilley and Fukai (1994) stated that water deficit imposed during thereproductive period can reduce grain yield by 20–70%, with reducedgrowth rate during panicle development reducing both grain num-ber and potential grain size. Ouk et al. (2006) from their work inthe Mekong region, reported that the yield reduction caused bywater stress increased as the free water level at around flower-ing (i.e. water level three weeks before and after flowering time)decreased below the soil surface. They used this water level as anindex of the severity of water deficit when estimating yield reduc-tion. A soil water balance (SWB) model was developed by Inthavonget al. (2011b) which used estimation of deep percolation loss fromsoil clay content under soil water saturation together with estima-tion of other components of water balance in lowland fields. Theresults from field experiments in Laos reported in Inthavong et al.(2011a) were used to validate the model, and spatial variation inwater availability and hence the length of the rice growing periodwithin the central Lao province of Savannakhet was estimated. Theestimated length of growing period for Savannakhet was found tovary greatly, and depended on soil clay content and rainfall partic-ularly late in the season which affected the time of the end of thegrowing period (Inthavong et al., 2012).
Apart from water, soil nutrients and fertilizer application man-agement strongly determine rice yield in the region. With increaseduse of high-yielding varieties with an increased demand for nutri-ents, fertilizer inputs have increased in the rainfed lowland riceenvironment. This is reflected in Laos, where it is acknowledged byfarmers that improved crop productivity cannot be met by eitherinherent nutrient supply or by ‘organic farming’ alone (Linquistand Sengxua, 2001). The site-specific nutrient supply is an impor-tant key to improving rice productivity (Dobermann et al., 2002,2003). To improve fertilizer use efficiency, a quantitative under-standing of crop nutrient demand and inherent nutrient supplyfrom the soil, and the supply from chemical fertilizer, are requiredfor site-specific fertilizer management. The approach for estimat-ing quantitative inherent soil nutrient supply developed by Janssenet al. (1990) and site-specific nutrient requirement by Dobermannand Cassman (2002) and Witt and Dobermann (2002), is widelyused for assessing soil fertility and chemical fertilizer applicationrequirement for maximizing yields under different soil conditions(Bindraban et al., 2000; Dobermann et al., 2003; Pathak et al., 2003).
The objective of this study was to estimate the separate effectof nutrient and water limitation on yield of rainfed lowland riceand to provide regional-scale fertilizer recommendations for rain-fed lowland rice. To achieve this, two already well developed soilnutrient and water balance models were combined and validatedin the present study, and used for Savannakhet province in Laos.
2. Materials and methods
2.1. Study area
The study focused on rainfed lowland rice areas in Savan-nakhet Province in the lower central agricultural region of Laos(15◦50′–17◦10′ N, 104◦40′–106◦50′ E). The central and western
parts of the province consist of a wide floodplain adjacent to theMekong River, so most of the land used for growing rice is located inthe western half of the province. The province has a monsoonal cli-mate, with the southwest monsoons being associated with distinctwet (May–October) and dry (November–April) seasons. Dominanttopsoil texture types are coarse-textured, sand (<5%), sandy loam(38%) and loamy sand (41%), while clay loam and loam texturegroups account for less than 20% of the total area of the province;in subsoil layers, sandy loam and clay loam soil textures accountfor 36% and 31% of the total area, respectively (SSLCC, 1996).
2.2. Model description
Both the soil nutrient model and water balance model used inthe current study have been published and hence only brief descrip-tions of these are given below. The model used here has combinedthese two component models.
A modified version of QUantitative Evaluation of the Fertility ofTropical Soils (QUEFTS) developed by Janssen et al. (1990) was usedto assess nutrient-limited yield of rice (Witt et al., 1999). The modelcalculates yield as a function of available soil nitrogen (N), phos-phorus (P) and potassium (K) and the procedure of the calculationmethod is described in detail in Witt et al. (1999). The approach forsite-specific nutrient management developed by Dobermann andCassman (2002) and Witt and Dobermann (2002) was incorporatedinto this module for the estimation of fertilizer rates to be appliedfor achieving the grain yield target (e.g. 4 t ha−1). The amount offertilizer needed to produce the target yield [fertilizer requirement(FR, kg ha−1)] can be calculated by subtracting the amount of nutri-ent available in the soil [inherent nutrient supply (Nind, kg ha−1)]from the amount of nutrient needed to produce the yield target[nutrient uptake required for the yield target (NUtarget, kg ha−1)],and then divided by the recovery efficiency of applied nutrient (RE,kg fertilizer nutrient taken up per kg applied):
FR = NUtarget − Nind
RE(1)
The required nutrient uptake is provided by Witt et al. (1999);15 kg N ha−1, 2.6 kg P ha−1 and 15 kg K ha−1 would be needed toproduce 1000 kg of rice grain per ha until yield reaches 70–80%of potential yield. The inherent N supply is estimated based onan equation by Janssen et al. (1990), while modified models byMulder (2000) were used to determine the inherent supply of Pand K. The recovery efficiencies used in the present study were0.5 for N, 0.2 for P and 0.45 for K; Witt and Dobermann (2002)reported 0.4–0.6, 0.2–0.3 and 0.4–0.5 for N, P, and K, respectively,for irrigated lowland rice.
The soil water balance (SWB) model was developed and val-idated with a range of free water levels. Free water levels weredetermined weekly during crop growth by installing a perforatedPVC tube in the paddy field (Inthavong et al., 2011b). The SWBmodel estimates the amount of water stored in a soil profile that isdivided into the surface soil (0–20 mm) and subsoil (200–1000 mm)layers. The components of the SWB model in the surface layer arerainfall, evapotranspiration (ET), downward water loss and runoff,while those in the subsoil layer are downward water loss into deepsoil and the water gain from the surface layer. The FAO crop coeffi-cient approach was used to estimate ET, and the downward waterloss was estimated from an empirical relationship with soil claycontent. The model has been described in detail and validated else-where (Inthavong et al., 2011b). The relative water level (WLREL)was determined by taking the mean of free water level aroundflowering time only when free water level was below the soil sur-face (Ouk et al., 2006). In the present study, the flowering date foreach genotype group was defined by using ‘days-to-flower’ col-lected from more than 30 genotypes grown in field experiments

Author's personal copy
102 T. Inthavong et al. / Field Crops Research 163 (2014) 100–108
under rainfed lowland conditions across two provinces (Savan-nakhet and Champassack) in Southern Laos, during the period2000–2002 (Tsubo et al., 2006). Additional rice data collected fromrice fields in 13 districts of Savannakhet, representing differentgrowing environments and covering a wide range of soils, agro-nomic practices and climatic condition for the 2007 and 2008 wetseason (Inthavong et al., 2011a), were also included in the datasetto define the flowering date for each genotype group. The timerequired to reach flowering ranged from between 87 and 105, 98and 117, and 104 and 138 days, for early, medium, and late matu-rity groups, respectively. Once the flowering date was determinedand matched with the corresponding WLREL, the spatial variationin yield reduction (YR) was estimated from the simple equation ofOuk et al. (2006), and the yield loss percentage was then multipliedwith the yield obtained from the nutrient model to provide yieldunder both nutrient and water limiting conditions. The equationdeveloped by Ouk et al. (2006) under Cambodian rainfed lowlandconditions was:
YR = −1.68 WLREL (2)
where YR is yield reduction (%), and WLREL is the relative waterlevel (cm). This model uses free water level (FWL) between thewell-watered and water stressed treatments around flowering (3weeks before and after flowering date), as an index of the sever-ity of the water deficit to describe yield reduction. WLREL is zerowhen FWL is equal to or higher than the soil surface, while WLRELis 0 – FWL when FWL is lower than the soil surface. This relation-ship shown in equation 2 would include not only the direct effectof plant water deficit but also the indirect effect of nutrient defi-ciency caused by anaerobic soil conditions. Although the indirecteffect through nutrient deficiency may be different if soil pH andother chemical properties differ between various rainfed lowlandrice environments in Cambodia and Laos, the direct effect of waterstress would be similar between the two countries. Generally thedirect effect of water deficit would be more important under severedrought stress conditions (Fukai and Ouk, 2012; Pantuwan et al.,2002).
2.3. Model inputs
Standard inputs of the combined model are described here. Soilinformation was obtained from the soil database (SSLCC, 1996),where soil physical and chemical analysis data were availablefor calculating volumetric soil moisture content and inherent soilnutrient supply for Laos. Climatic data recorded for the period1985–2007 for a total of 62-point locations; 43 locations withinLaos, and 19 meteorological stations in neighboring NortheastThailand were used to generate gridded surfaces of long termmedian weekly rainfall and potential evapotranspiration whichwere used as inputs into the model
The model was run for high yielding, medium maturing, non-photoperiod sensitive variety Thaddokkham-1 (TDK1). The meanHI of 0.45 obtained under rainfed lowland conditions over two years(1996–1997) for Savannakhet province, Laos (Inthapanya et al.,2000a) was used as an input. The 1st June sowing date was selectedas a common practice for rice farmers in this province. A summaryof model input requirements for simulation runs is given in Table 1.
2.4. Datasets for model validation
The model was validated using three data sets. The first set usesfarmers’ survey results from the wet season, while the second setuses results of a fertilizer experiment conducted under irrigationin the dry season. The third set of data was from the results ofpublished nutrient omission trials from central and southern Laos(Linquist and Sengxua, 2001). The first and third data sets are from
Table 1Model input data requirement.
Crop growing cycle (days)CultivarFertilizer application rateHarvest indexOrganic carbon, total P, exchangeable K and pHSowing dateVolumetric soil moisture content, i.e. saturation, field capacity, wilting point
and air dry conditionWeekly potential evapotranspirationWeekly rainfall
the wet season and the model was tested for both water and nutri-ent limiting conditions, while the second set was used only to testthe nutrient model under non-limiting water conditions.
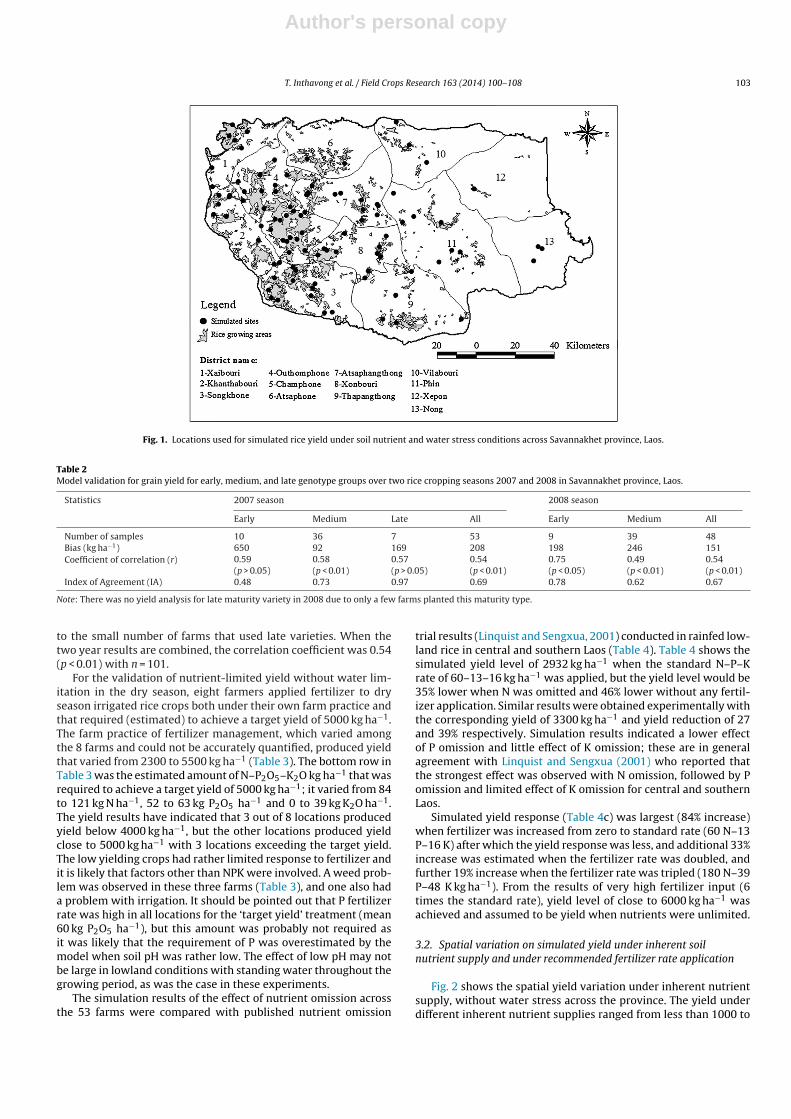
For the first data set, rice yields from 53 farmers’ fields in 2007and 48 in 2008 in Savannakhet province, Laos, were estimated usingthe combined model (Fig. 1). Using geographic information system(GIS) software, the soil information for each farm was extractedfrom the interpolated gridded soil surface map generated from 339soil profile samples (SSLCC, 1996) predominantly taken from agri-cultural land. Inherent soil nutrient supply was calculated followingequations of Janssen et al. (1990) and Mulder (2000), while volu-metric soil moisture contents at each threshold of wilting point,field capacity and saturation were calculated using the method ofSaxton and Rawls (2006) and used as soil information inputs foreach site. The model was run using farm management practice (e.g.rice cultivar, sowing date, fertilizer application rate, standing waterlevel at transplanting time) obtained from field surveys conductedin 2007 and 2008 (Inthavong et al., 2011a). The farmers were inter-viewed for information on rice grain production, harvest area andthe farm management practices utilized. The yield was then esti-mated by dividing the production by the harvested area. The 2007and 2008 gridded rainfall surfaces generated from 2 meteorologicaland 11 hydrological stations were employed as the weather inputs.The model performance was evaluated with Bias (average yield dif-ferences), coefficient of correlation (r) and the Index of Agreement(IA; Willmott, 1981).
The second data set comes from a 2011 dry season experimentin which 8 locations were selected from 3 Provinces (Savan-nakhet, Vientiane and Champassak) for their contrast in soil fertilityattributes (organic matter, extractable P and K with known pHlevel) under two fertilizer rates; the rate of farmer practices andthe rate estimated from the combined model to achieve targetgrain yield of up to 5000 kg ha−1. At all locations, variety TDK1 wasbroadcast, and the crop was grown under irrigated conditions.
3. Results
3.1. Model validation
When the simulated grain yield with both nutrient and waterlimitations were compared with the actual yields, the model over-estimated grain yield for the early genotype group by 650 kg ha−1
for 2007. The simulated grain yields for the medium and late geno-type groups, however, showed a close relationship with the actualyields (Table 2). The overall estimates were regarded as being sat-isfactory, with r = 0.54 (n = 53, p < 0.01) and IA = 0.69. Similarly, thelevel of agreement between simulated and observed grain yieldfor 2008 was satisfactory, with an overall mean r of 0.54 (p < 0.01,n = 48), a Bias (average yield differences) of 151 kg ha−1 and IA of0.67. The model provided a good estimate of grain yield for theearly genotype group, with high values of r and IA [0.75 (p < 0.01)and 0.78, respectively], while a satisfactory result was obtained forthe medium group, with an acceptance r value of 0.49 (p < 0.01) andIA of 0.62. There was no yield analysis for late genotype group, due
Author's personal copy
T. Inthavong et al. / Field Crops Research 163 (2014) 100–108 103
Fig. 1. Locations used for simulated rice yield under soil nutrient and water stress conditions across Savannakhet province, Laos.
Table 2Model validation for grain yield for early, medium, and late genotype groups over two rice cropping seasons 2007 and 2008 in Savannakhet province, Laos.
Statistics 2007 season 2008 season
Early Medium Late All Early Medium All
Number of samples 10 36 7 53 9 39 48Bias (kg ha−1) 650 92 169 208 198 246 151Coefficient of correlation (r) 0.59 0.58 0.57 0.54 0.75 0.49 0.54
(p > 0.05) (p < 0.01) (p > 0.05) (p < 0.01) (p < 0.05) (p < 0.01) (p < 0.01)Index of Agreement (IA) 0.48 0.73 0.97 0.69 0.78 0.62 0.67
Note: There was no yield analysis for late maturity variety in 2008 due to only a few farms planted this maturity type.
to the small number of farms that used late varieties. When thetwo year results are combined, the correlation coefficient was 0.54(p < 0.01) with n = 101.
For the validation of nutrient-limited yield without water lim-itation in the dry season, eight farmers applied fertilizer to dryseason irrigated rice crops both under their own farm practice andthat required (estimated) to achieve a target yield of 5000 kg ha−1.The farm practice of fertilizer management, which varied amongthe 8 farms and could not be accurately quantified, produced yieldthat varied from 2300 to 5500 kg ha−1 (Table 3). The bottom row inTable 3 was the estimated amount of N–P2O5–K2O kg ha−1 that wasrequired to achieve a target yield of 5000 kg ha−1; it varied from 84to 121 kg N ha−1, 52 to 63 kg P2O5 ha−1 and 0 to 39 kg K2O ha−1.The yield results have indicated that 3 out of 8 locations producedyield below 4000 kg ha−1, but the other locations produced yieldclose to 5000 kg ha−1 with 3 locations exceeding the target yield.The low yielding crops had rather limited response to fertilizer andit is likely that factors other than NPK were involved. A weed prob-lem was observed in these three farms (Table 3), and one also hada problem with irrigation. It should be pointed out that P fertilizerrate was high in all locations for the ‘target yield’ treatment (mean60 kg P2O5 ha−1), but this amount was probably not required asit was likely that the requirement of P was overestimated by themodel when soil pH was rather low. The effect of low pH may notbe large in lowland conditions with standing water throughout thegrowing period, as was the case in these experiments.
The simulation results of the effect of nutrient omission acrossthe 53 farms were compared with published nutrient omission
trial results (Linquist and Sengxua, 2001) conducted in rainfed low-land rice in central and southern Laos (Table 4). Table 4 shows thesimulated yield level of 2932 kg ha−1 when the standard N–P–Krate of 60–13–16 kg ha−1 was applied, but the yield level would be35% lower when N was omitted and 46% lower without any fertil-izer application. Similar results were obtained experimentally withthe corresponding yield of 3300 kg ha−1 and yield reduction of 27and 39% respectively. Simulation results indicated a lower effectof P omission and little effect of K omission; these are in generalagreement with Linquist and Sengxua (2001) who reported thatthe strongest effect was observed with N omission, followed by Pomission and limited effect of K omission for central and southernLaos.
Simulated yield response (Table 4c) was largest (84% increase)when fertilizer was increased from zero to standard rate (60 N–13P–16 K) after which the yield response was less, and additional 33%increase was estimated when the fertilizer rate was doubled, andfurther 19% increase when the fertilizer rate was tripled (180 N–39P–48 K kg ha−1). From the results of very high fertilizer input (6times the standard rate), yield level of close to 6000 kg ha−1 wasachieved and assumed to be yield when nutrients were unlimited.
3.2. Spatial variation on simulated yield under inherent soilnutrient supply and under recommended fertilizer rate application
Fig. 2 shows the spatial yield variation under inherent nutrientsupply, without water stress across the province. The yield underdifferent inherent nutrient supplies ranged from less than 1000 to

Author's personal copy
104 T. Inthavong et al. / Field Crops Research 163 (2014) 100–108
Table 3Rice yield (kg ha−1) at two fertilizer rates (N–P2O5–K2O kg ha−1), farmer practice and estimated rate required to target grain yield of 5000 kg ha−1, at eight locations [Phonhong(PH), Tulakhom (TK), Champhone (CP), Sakeun (SK), Beungxe (BX), Donekhor (DK), Saphai (SP), Vatsay (VS)] across three provinces in Laos in 2010/11 dry season. The bottomrows show estimated fertilizer rates (N–P2O5–K2O) required for the target yield of 5000 kg ha−1and observed field conditions.
Vientiane Savannakhet Champassak Mean
PH TK CP SK BX DK SP VS
Farmer practice yield 3067 3750 2260 5525 3023 4747 5437 3561 3921Target yield 4417 4894 3057 5566 3607 5072 5509 3977 4512Fertilizer rate 110-63-34 91-62-10 121-62-0 100-60-7 94-52-39 106-63-36 113-57-30 84-61-0Field issues W W FYM FYM W, S
W: weed problem; FYM: additional nutrient input of farm-yard manure; S: water stress.
Table 4Comparison of grain yield (kg ha−1) in nutrient omission trials (a) simulated in this study and (b) observed by Linquist and Sengxue (2001), and (c) simulated effect of fertilizerrate relative to standard 60N-13P-16 K kg ha−1 (multiplier of this rate from 0 to 6 times (0×, 1×, 2×, 3×, 4×, 5×, 6×) the standard rate).
(a) Simulated effect of nutrient omission from the standard fertilizer rate (60 N–13 P–16 K)Fertiliser rate (N–P–K) 60–13–16 0–13–16 60–0–16 60–13–0 0–0–0Grain yield 2932 1895 2248 2822 1595Yield reduction due to nutrient omission 35% 23% 4% 46%
(b) Observed effect of N omission from the standard fertilizer rate (60 N–13 P–16 K)Fertiliser rate (N–P–K) 60–13–16 0–13–16 0–0–0Grain yield 3300 2400 2000Yield reduction due to N omission 27% 39%
(c) Simulated effect of fertilizer rateTimes the standard rate (60 N–13 P–16 K) 0× 1× 2× 3× 4× 5× 6×Grain yield 1595 2932 3914 4672 5194 5543 5774Yield increase over the previous rate 84% 33% 19% 11% 7% 4%
Fig. 2. The spatial variation of simulated rice yield under inherent soil nutrient supply for Savannakhet province, Laos.
Table 5Examples of yield estimated from the combined model without any fertilizer inputs and also with no water stress, and soil information for rainfed lowland rice fields inOuthomphone, Songkhone, Atsaphone and Xepon districts of Savannakhet province, Laos.
Outhomphone Songkhone Atsaphone Xepon
Grain yield (kg ha−1) 913 1970 1457 3114Organic carbon (g kg−1) 2.5 5.7 3.7 16.7Total phosphorus (mg kg−1) 100 100 300 640Exchangeable potassium (mmol kg−1) 0.5 1.8 0.7 0.9

Author's personal copy
T. Inthavong et al. / Field Crops Research 163 (2014) 100–108 105
greater than 5000 kg ha−1; however, more than 75% of the totalrice growing areas in the province were estimated to give yieldsbetween 1000 and 2000 kg ha−1. The most productive areas thatcan potentially produce yield over 3500 kg ha−1 would account forjust 1% of the total area used for rice cultivation in the province.Four representative fields from districts of Outhomphone (districtnumber 4 in the figure), Songkhong (3), Atsaphone (6) and Xepon(12) were selected for comparing the model estimates of yieldunder a wide range of inherent soil fertility and climatic conditionsacross the province. The results (Table 5) show Xepon (12) gavethe highest simulated yield (3114 kg ha−1), following by Songkhone(3) (1970 kg ha−1) and Atsaphone (6) (1457 kg ha−1), whereas Out-homphone (4) gave the lowest yield of 913 kg ha−1. The variabilityof yield among these sites corresponded with the variation in inher-ent soil fertility. The soil in the Xepon (12) area is more fertile
than other sites, with higher organic carbon (16 g kg−1), which waspositively associated with the potential supply of N, and total P(640 mg kg−1), while the Songkhone (3) site had higher exchange-able K content (1.8 mmol kg−1) relative to other sites in this study(Table 5). These soil factors contributed to the highest uptake of Nand P in Xepon (12) and K in Songkhone (3). Thus, higher yields areachieved in these sites, when compared with fields in Atsaphone(6) and Outhomphone (4).
Grain yield with a blanket recommendation of fertilizer applica-tion rate (i.e. currently 60 kg N ha−1, 13 kg P ha−1 and 16 kg K ha−1
in Laos) was simulated for a total of 80 point locations in Savan-nakhet province. The average yield was 2800 kg ha−1, rangingbetween 1400 and 5600 kg ha−1 (data not shown). The large varia-tion was attributed to variation in inherent nutrient supply acrossthe province.
Fig. 3. Maps of nitrogen (N), phosphorus (P) and potassium (K) fertilizer requirement (kg ha−1) for achieving yield targets of 3 t ha−1 and 4 t ha−1 in Savannakhet province,Laos.

Author's personal copy
106 T. Inthavong et al. / Field Crops Research 163 (2014) 100–108
Table 6Simulated yield under inherent soil nutrient supply with no water limitation and with water limitation and yield reduction by water stress for 1st June 2007 sowing for 13districts of Savannakhet province, Laos.
Zone Number oflocations
Yield under inherent soil nutrient supply(without water limitation) (kg ha−1)
Yield under inherent nutrient supply andunder water limitation (kg ha−1)
Yield reduction due towater limitation (%)
Western zoneChamphone (5) 11 1817 1568 14Khanthabouli (2) 5 1657 1555 6Outhomphone (4) 5 1498 958 36Songkhone (3) 6 1818 1818 0Thapangthong (9) 1 1936 1606 17Xaibouri (1) 2 1875 1875 0Whole zone 30 1767 1563 12
Central zoneAtsphangthong (7) 5 1070 994 7Atsphone (6) 3 1923 1894 2Xonbouri (8) 6 1692 1612 5Whole zone 14 1562 1500 4
Eastern zoneNong (13) 2 1561 1561 0Phin (11) 3 1288 1288 0Vilabouri (10) 2 2069 1582 24Xepon (12) 2 2605 2605 0Whole zone 9 1881 1759 6
3.3. Spatial variation on simulated fertilizer requirement for yieldtargets
Fig. 3a–f illustrate the maps of fertilizer N, P and K require-ment for achieving yield targets of 3000 kg ha−1 and 4000 kg ha−1,respectively. Corresponding to the spatial variability of inherentsoil nutrient supplies, rate of N, P and K fertilizers between 20and 70 kg ha−1, 5 and 35 kg ha−1 and 0 and 10 kg ha−1, respec-tively, are required for almost all paddy fields, to achieve theyield target of 3000 kg ha−1. However, higher rates of N (exceed-ing 80 kg ha−1) and P (exceeding 40 kg ha−1) are required for yieldtargets of 4000 kg ha−1 in some fields in districts of Outhom-phone (4) and Khanthabouri (2), respectively, where the organicmatter and available P levels are the lowest. Even though theanalysis of lowland rice soil data (0–200 mm) show that a largeproportion of the paddy fields in Savannakhet province are clas-sified as being in the moderate inherent K category (SSLCC, 1996;Linquist and Sengxua, 2001), supplementary K fertilizer, between10 and 40 kg ha−1, was needed to produce the yield targets in somefields.
3.4. Yield limitation by water stress under inherent soil nutrientsupply
Yield reduction due to water stress was simulated under inher-ent soil nutrient supply. The simulated results for the 2007 wetseason (Table 6) shows Outhomphone (4) district encounteredsevere water stress in response to late season drought which causeda maximum yield reduction of 36%, followed by Vilabouri (10), Tha-pangthong (9) and Champhone (5) districts for which yield lossvaried from 14 to 24%. Water stress also would have occurred inrice fields in Atsaphangthong (7), Khanthabouri (2), Xonbouri (8),and Atsphone (6) districts, but the severity level in terms of yieldloss was smaller (2 to 8%). The expected yields including the effectof water stress would have been reduced from 1498 to 958 kg ha−1
in Outhomphone (4) and from 2069 to 1582 kg ha−1 in Vilabouri(10). It was noted that severe drought stress would have extendedover a large area of rice fields in the western part than in the centraland eastern parts of the province, with the overall mean yield lossof 12%, 4% and 6%, respectively.
4. Discussion
4.1. Model performance
The overall results of the model performance on yield estima-tion were satisfactory. The simulated results matched reasonablywell with yield data from the 101 farmers’ fields collected in2007 and 2008 wet seasons, and with the results of fertilizerrequirement experiment conducted in dry season under no waterlimiting conditions. The simulated effect of fertilizer applica-tion also matched with the results of nutrient omission trialsof Linquist and Sengxua (2001) where grain yield response toN, P and K omission was studied widely in central and south-ern Laos. Our simulated yields under the recommended fertilizerinputs for Savannakhet province were slightly lower than thosereported by Linquist and Sengxua (2001), probably because ofthe lower soil fertility of rice fields of Savannakhet provincecompared to that of the whole central and southern parts ofLaos.
The model used in this study was a combination of two pub-lished models, and the water balance model itself was validatedearlier with measured soil water levels throughout the growingperiod at 48 farms in 2008 (Inthavong et al., 2011b). Similarly thenutrient model has been widely tested in tropical region of Asiaby the authors Witt et al. (1999) and Witt and Dobermann (2002).However, because simulation models are simplified descriptionsof complex field situations, there are always factors that may notbe included but could affect crop performance and hence yield.In the current combined model of rainfed lowland rice, key fac-tors that are not included in the model are toposequence positioneffect, subsoil constraints including soil compaction, nutrient tox-icity effects as well as biotic constraints due to weeds, diseasesand insect pests. Toposequence effect is a unique feature of therainfed lowlands, and Tsubo et al. (2006) and Inthavong et al.(2011a) among others have found variation in water availabilityand yield across toposequence positions. Subsoil compaction is acommon problem in rainfed lowland fields which may affect riceyield through the adverse effect of stagnant water and possiblenutrient toxicity such as iron toxicity. The performance of the modelwould be improved if these factors are successfully incorporatedinto it.

Author's personal copy
T. Inthavong et al. / Field Crops Research 163 (2014) 100–108 107
4.2. Effect of water stress on grain yield
Yield reduction due to water deficit varies from year to year inrainfed lowland rice growing areas with erratic rainfall, and thedegree of yield reduction depends on the intensity, timing andduration of drought. The disappearance of field water particularlyflowering time results in a large yield reduction (Jearakongmanet al., 1995). A number of previous studies on the effect of waterstress on grain yield in lowland rice have reported large variation inyield reduction. For example, Pantuwan et al. (2002) measured 19%yield reduction under mild drought up to 81% under severe droughtin experiments that managed drought and well-watered field con-dition in Northeast Thailand. The large yield reduction occurred inthe fields exposed to prolonged severe drought during the flow-ering to grain filling period. A similar result was reported by Ouket al. (2006) in artificially induced drought conditions in Cambodia(12–46% yield reduction). However, under the farmers practice offield management, yield reduction is generally smaller than thoseexperimental conditions where drought was artificially inducedby draining water from the field. For example, Tsubo et al. (2009)estimated moderate yield reduction (up to 22% for photoperiod-sensitive long-maturing cultivars) responding to mild drought in amulti-year and multi-location experiment in Cambodia. The yieldreduction simulated in the present study (up to 36% in 2007) is ofsimilar magnitude to the field study of Tsubo et al. (2009), but theactual yield reduction would depend on the timing and amountof rainfall in the simulated season (Inthavong et al., 2011b). Withregard to spatial distribution, the simulated yield reduction waslarger in the western zone (12%) than in the central and easternzones (4% and 6%, respectively) of the province. This was mostlyassociated with the geographical gradient of field water availability,as annual rainfall decreases from the southern and north-easternparts of the province to the north-western corner of the provincewhere rainfall is the lowest (Inthavong et al., 2012).
Thus, according to the present simulation study, as well asexperimental results, yield reduction due to water stress duringcrop growth may be rather modest in rainfed lowland rice in centralLaos. However, two points need to be pointed out; one is that ter-minal drought stress, i.e., continuous drought stress to the expectedcrop maturity, can cause a severe yield reduction if late maturingor photoperiod sensitive varieties were used however, generallyterminal drought problems have become less severe with the intro-duction of both photoperiod insensitive, quicker maturing varietiesand earlier planting times (Fukai and Ouk, 2012). The second pointis that early season drought is common in the Mekong region,and this prevents farmers seeding or transplanting seedlings atan appropriate time, however these aspects were not consid-ered in the simulation study or the experimental work quotedhere.
4.3. Effect of nutrient input on grain yield
Compared to rather modest effect of drought stress that devel-ops during crop growth, the simulation study indicated a largeeffect of nutrient stress on grain yield. The present study showsthat the yield under no fertilizer application is almost half thatachieved under the recommended rate of fertilizer application andless than one third of the yield under unlimited nutrient conditions.The simulated effect of nutrient omission from the recommendedfertilizer rate matches with the published work of Linquist andSengxua (2001) as shown in Table 4. Further, in the work at a vil-lage within the western zone of Savannakhet province, Inthapanyaet al. (2000b) reported 50–75% yield increase from around 1.2 t ha−1
to 1.8–2.1 t ha−1 with the recommended fertilizer application. Thesimulated yield without fertilizer application under water limita-tion in the western districts in the 2007 wet season (1.6 t ha−1)
was 33% higher than the yield (1.2 t ha−1) reported by Inthapanyaet al. (2000b). The Savannakhet weather station, which is located inthe western zone, registered about 100 mm in October in the years(1996 and 1997) when Inthapanya et al. (2000b) conducted theexperiments, while October rainfall was over 300 mm in the yearwhen the present study was conducted. This implies that the yielddifference could be due to the difference in field water availabil-ity in the late growing season. The simulated yield in the presentstudy under inherent nutrient supply without water stress waslow at 1–2 t ha−1 in more than 75% of the total rice growing areas.The importance of fertilizer application was further emphasizedby Linquist and Sengxua (2001), who reported that the recom-mended fertilizer application significantly increased yield in mostrainfed lowland rice fields in the central region, where Savannakhetprovince is located, to southern Laos. Similarly, the fertilizer appli-cation rate was found to be important in determining crop yield,as demonstrated in the 2011 dry season in the present study. Thisconclusion was supported by the positive relationship between Nand P fertilizer rates and yield among 101 farms surveyed in thetwo year study in Savannakhet (Inthavong et al., 2011a).
There was variation in inherent nutrient supply and yield with-out fertilizer application across the province; hence a blanketrecommendation of fertilizer application rate is unlikely to be effec-tive in achieving high returns. More refined fertilizer applicationrecommendation appears possible and promising; for example, therelatively low yield under inherent nutrient supply (913 kg ha−1)in Outhomphone (4) district reflects an inadequate inherent soilnutrient supply (12.6 kg N ha−1 and 2.5 kg P ha−1). Therefore, toachieve a yield target at 3 t ha−1in Outhomphone would require amedium rate of 60 kg N ha−1 and 26 kg P ha−1 fertilizers. In con-trast, almost all fields in Champhone (5) district would requireonly 30 kg N ha−1 and 5 kg P ha−1 to achieve the same yield level.Therefore, fertilizer recommendation at the district or village levelwould be useful for rice producers to ensure application of appro-priate rates of inorganic fertilizers for increasing rice yield. Withregards to the nutrient requirements of rice in the rainfed low-lands, yield is more responsive to applied fertilizer under favorablewater environments compared to drought-prone environments(Wade et al., 1999). It can be recommended that low or no fer-tilizer is applied to rainfed lowlands with high drought risk, i.e.upper toposequence fields, while appropriate fertilizer applicationcan be recommended for low drought risk areas, i.e. lower topose-quence fields (Haefele and Konboon, 2009; Haefele et al., 2010). Inaddition, there are several sound techniques of nutrient manage-ment to improve productivity of rainfed lowland rice. For example,splitting N fertilizer applications into several at various growthstages (e.g. transplanting, tillering and panicle initiation) enhancesthe yield, compared with the fertilizers applied only at transplan-ting (Linquist and Sengxua, 2003), and the use of organic residuessuch as rice straw and hulls improves the yield response to fertil-izer inputs as well as inherent soil nutrient supply (Linquist et al.,2007). These agronomic techniques are important for rainfed low-land rice ecosystems under limited soil nutrient condition, such asin the lowlands in Savannakhet province.
5. Conclusion
The soil water balance model was linked with the soil nutrientmodel, and then the combined model, which requires fewer sets ofinput data to run than most current rice models, was applied to esti-mate rice yield for the rainfed lowlands in Savannakhet province,Laos. The model generally performed well in predicting crop yieldlevels, as the simulation results were similar to both the observedfarmers’ yield data, collected from a wide range of soil and cli-matic conditions throughout the province, and also similar to yield

Author's personal copy
108 T. Inthavong et al. / Field Crops Research 163 (2014) 100–108
response to fertilizer rates under experimental conditions. The sim-ulated results confirmed that the low rice yield often observedin the province was associated with low inherent nutrient sup-ply, particularly of N and P. Thus, application of N and P fertilizerscan be expected to increase grain yield but the response woulddepend on inherent soil fertility and water availability conditions.The information on fertilizer requirement to achieve specific yieldtargets can be useful in helping rice farmers, as well as the districtor provincial agriculture and forestry extension sectors, in formu-lating appropriate and effective recommendations on the use ofinorganic fertilizers in rice field in different areas in each district ofSavannakhet province.
References
Bindraban, P.S., Stoorvogel, J.J., Jansen, D.M., Vlaming, J., Groot, J.J.R., 2000. Landquality indicators for sustainable land management: proposed method for yieldgap and soil nutrient balance. Agric. Ecosys. Environ. 81, 103–112.
Bouman, B.A.M., Kropp, M.J., Tuong, T.P., Wopereis, M.C.S., ten Berge, H.F.M., vanLaar, H.H., 2001. ORYZA 2000 modeling lowland rice. International Rice ResearchInstitute, Los Banos, Philippines.
Dobermann, A., Cassman, K.G., 2002. Plant nutrient management for enhanced pro-ductivity in intensive grain production systems of the United States and Asia.Plant Soil 247, 153–175.
Dobermann, A., Witt, C., Dawe, D., Abdulrachman, S., Gines, H.G., Nagarajan, R.,Satawathananont, S., Son, T.T., Tan, P.S., Wankg, G.H., Chien, N.V., Thoa, V.T.K.,Phung, C.V., Stalin, P., Muthukrishnan, P., Ravi, V., Babu, M., Chatuporn, S., Sook-thongsa, J., Sun, Q., Fu, R., Simbahan, G.C., Adviento, M.A.A., 2002. Site-specificnutrient management for intensive rice cropping systems in Asia. Field CropsRes. 74, 37–66.
Dobermann, A., Witt, C., Abdulrachman, S., Gines, H.C., Nagarajan, R., Son, T.T., Tan,P.S., Wang, G.H., Chien, N.V., Thoa, V.T.K., Phung, C.V., Stalin, P., Muthukrish-nan, P., Ravi, V., Babu, M., Simbahan, G.C., Advieno, M.A.A., 2003. Soil fertilityand indigenous nutrient supply in irrigated rice domains of Asia. Agron. J. 95,913–923.
Fukai, S., Ouk, M., 2012. Increased productivity of rainfed lowland rice croppingsystems of the Mekong region. Crop Pasture Sci. 63, 944–973.
Haefele, S.M., Konboon, Y., 2009. Nutrient management for rainfed lowland rice innortheast Thailand. Field Crops Res. 114, 374–385.
Haefele, S.M., Sipaseuth, N., Phengsouvanna, V., Dounphady, K., Vongsouthi, S., 2010.Agro-economic evaluation of fertilizer recommendation for rainfed lowlandrice. Field Crops Res. 119, 215–224.
Inthapanya, P., Sipaseuth Sihavong, P., Sihathep, V., Chanphengsay, M., Fukai, S.,Basnayake, J., 2000a. Genotypic differences in nutrient uptake and utilization forgrain yield production of rainfed lowland rice under fertilized and non-fertilisedconditions. Field Crops Res. 65, 57–68.
Inthapanya, P., Sipaseuth Sihavong, P., Sihathep, V., Chanphengsay, M., Fukai, S.,Basnayake, J., 2000b. Genotypic performance under fertilised and non-fertilisedconditions in rainfed lowland rice. Field Crops Res. 65, 1–14.
Inthavong, T., Fukai, S., Tsubo, M., 2011a. Spatial variations in water availability,soil fertility and grain yield in rainfed lowland rice: a case from Savannakhetprovince, Lao PDR. Plant Prod. Sci. 14, 184–195.
Inthavong, T., Tsubo, M., Fukai, S., 2011b. A water balance model for characterizationof length of growing period and water stress development for rainfed lowlandrice. Field Crops Res. 121, 291–301.
Inthavong, T., Tsubo, M., Fukai, S., 2012. Soil clay content rainfall, and toposequencepositions determining spatial variation in field water availability as estimatedby a water balance model for rainfed lowland rice. Crop Pasture Sci. 63, 529–538.
Janssen, B.H., Guiking, F.C.T., van der Eijk, D., Smaling, E.M.A., Wolf, J., van Reuler,H., 1990. A system for quantitative evaluation of the fertility of tropical soils(QUEFTS). Geoderma 46, 299–318.
Jearakongman, S., Rajatasereekul, S., Naklang, K., Romyen, P., Fukai, S., Skulkhu, E.,Jumpaket, B., Nathabutr, K., 1995. Growth and grain yield of contrasting ricecultivars grown under different conditions of water availability. Field Crops Res.44, 139–150.
Lilley, J.M., Fukai, S., 1994. Effect of timing and severity of water deficit on four diverserice cultivars. III. Phenological development, crop growth and grain yield. FieldCrops Res. 37, 225–234.
Linquist, B., Sengxua, P., 2001. Nutrient management in rainfed lowland rice in theLao PDR. International Rice Research Institute, Los Banos, Philippines.
Linquist, B., Sengxua, P., 2003. Efficient and flexible management of nitrogen forrainfed lowland rice. Nutr. Cycl. Agroecosyst. 67, 107–115.
Linquist, B.A., Phengsouvanna, V., Sengxue, P., 2007. Benefits of organic residues andchemical fertilizer to productivity of rain-fed lowland rice and to soil nutrientbalances. Nutr. Cycl. Agroecosyst. 79, 59–72.
Mulder, I., Working Paper No. 30 2000. Soil fertility: QUEFTS and fermers’ percep-tions. International Institute for Environment and Development/Institute forEnvironmental Studies, London/Amsterdam.
Ouk, M., Kang, S., Thun, V., Sakhan, S., Then, R., Pin, C., Pruch, P., Ith, Y., Fukai, S.,Fisher, K.S., Basnayake, J., Tsubo, M., 2006. Rainfed lowland rice (Oryza sativa L.)performance under contrasting water availabilities in Cambodia. Cambodian J.Agric. 7, 1–11.
Pantuwan, G., Fukai, S., Cooper, M., Rajatasereekul, S., O’Toole, J.C., 2002. Yieldresponse of rice (Oryza sativa L.) genotypes to different types of drought underrainfed lowlands. Part 1. Grain yield and yield components. Field Crops Res. 73,153–168.
Pathak, H., Aggarwal, P.K., Roetter, R., Kalra, N., Bandyopadhaya, S.K., Prasad, S., vanKeulen, H., 2003. Modelling the quantitative evaluation of soil nutrient supplynutrient use efficiency, and fertilizer requirements of wheat in India. Nutr. Cycl.Agroecosyst. 65, 105–113.
Ritchie, J.T., Alocijia, E.C., Uehara, G., 1986. IBSNAT/CERES rice model. Agrotechnol.Transfer 3, 1–5.
Ritchie, J.T., 1990. Specifications of the ideal model for predicting crop yields. In:Muchow, R.C., Bellamy, J.A. (Eds.), Climatic Risk in Crop Production: Modelsand Management for the Semiarid Tropics and Subtropics. CAB International,Wallingford, UK, pp. 97–121.
Saxton, K.E., Rawls, W.J., 2006. Soil water characteristic estimates by tex-ture and organic matter for hydrologic solution. Soil Sci. Soc. Am. J. 70,1569–1578.
SSLCC, 1996. Soil physical and chemical properties analysis for soil of Lao PDR. SoilSurvey and Land Classification Center (SSLCC), Vientiane, Laos.
Tsubo, M., Basnayake, J., Fukai, S., Sihathep, V., Siyavong, P., Sipaseuth Chan-phengsay, M., 2006. Toposequential effects on water balance and productivityin rainfed lowland rice ecosystem in Southern Laos. Field Crops Res. 97,209–220.
Tsubo, M., Fukai, S., Basnayake, J., Ouk, M., 2009. Frequency of occurrence of var-ious drought types and its impact on performance of photoperiod-sensitiveand insensitive rice genotypes in rainfed lowland conditions in Cambodia. FieldCrops Res. 113, 287–296.
Wade, L.J., Amarante, S.T., Olea, A., Harnpichitvitaya, D., Naklang, K., Wihardjaka, A.,Sengar, S.S., Mazid, M.A., Singh, G., McLaren, C.G., 1999. Nutrient requirementsin rainfed lowland rice. Field Crops Res. 64, 91–107.
Willmott, C.J., 1981. On the validation of models. Phys. Geogr. 2, 174–184.Witt, C., Dobermann, A., 2002. A site-specific nutrient management approach for
irrigated, lowland rice in Asia. Better Crops Int. 16, 20–24.Witt, C., Dobermann, A., Abdulrachman, S., Gines, H.C., Guanghuo, W., Nagarajan, R.,
Satawatananont, S., Son, T.T., Tan, P.S., Tiem, L.V., Simbahan, G.C., Olk, D.C., 1999.Internal nutrient efficiencies of irrigated lowland rice in tropical and subtropicalAsia. Field Crops Res. 63, 113–138.