Improved annotation through genome-scale metabolic modeling of Aspergillus oryzae
Upload
khangminh22Category
view
1download
0
ESTIMATION OF QUANTITATIVE LOSSES OF RICE (ORYZAE SATIVA L.)
DURING HARVESTING, THRESHING AND CLEANING IN THE UPPER
EAST REGION: A CASE STUDY AT TONO IRRIGATION PROJECT
BY
OFORI OBENG NKETIAH
(10279647)
THIS THESIS IS SUBMITTED TO THE UNIVERSITY OF GHANA, LEGON IN
PARTIAL FULFILLMENT OF THE REQUIREMENTS FOR THE AWARD OF
MPHIL CROP SCIENCE DEGREE
COLLEGE OF BASIC AND APPLIED SCIENCE
DEPARTMENT OF CROP SCIENCE
SCHOOL OF AGRICULTURE
UNIVERSITY OF GHANA, LEGON.
JULY, 2015
University of Ghana http://ugspace.ug.edu.gh

i
DECLARATION
I, Ofori Obeng Nketiah declare that except of references cited, which have been duly
acknowledged, this work “Estimation of Quantitative Losses of Rice (Oryzae sativa L.)
during harvesting, threshing and cleaning in the Upper East Region: A Case Study
at Tono Irrigation Project” is the result of my own work as a student of the Department
of Crop Science, College of Basic and Applied Science, University of Ghana during the
2014 - 2015 academic year. This work has never been presented in whole or part for the
award of any degree of this University or elsewhere.
............................................. Date……………………….
Ofori Obeng Nketiah
(Student)
This thesis has been submitted for examination with our approval as supervisors
............................................. Date……………………….
Prof. P. N. T. Johnson
(Major Supervisor)
............................................ Date………………………..
Dr. (Mrs) Gloria Essilfie
(Co-supervisor)
University of Ghana http://ugspace.ug.edu.gh

ii
ABSTRACT
Loss assessment helps to identify constraints affecting the production and therefore the
productivity of food crops. Information on loss assessment will thus assist in possible
interventions needed to improve productivity. Quantitative losses associated with the
production of rice (var. Jasmine 85) in the Kassena Nankana West District of the Upper
East Region, one of the major rice producing areas in Ghana has not been adequately
documented. A semi structured questionnaire was used to collect data from 84 rice
farmers who were selected through a combination of multi-stage, purposive, and simple
random sampling techniques. A multiple regression analysis was conducted to estimate
quantitative losses and the factors that influenced the losses of rough rice. Kendall’s
Coefficient of Concordance (WC) was used to determine the degree of agreement in the
challenges farmers face at farm level. A technology-verification experiment was
conducted on 12 farmer fields to estimate the yields and quantitative losses that do occur
during harvesting and threshing at two (2) different harvesting times: improved harvesting
time (35 days after heading) and farmer time of harvest (42 days after heading). A
methodology adopted by Anwar (2010) was used to determine farmers’ harvest moisture
content of rough rice. Rice cultivation on the Tono Irrigation Project was found to be
dominated by males; only 38% were females. Therefore, males have purposefully made
rice farming as a livelihood. Averagely, 0.68 ha field was under rice cultivation. Still, the
average rough rice was produced at 2.73 mt/ha. The output saved for household
consumption (0.7 mt/ha) was not significantly different (P>0.05) from the output (0.65
mt/ha) lost to the soil. Besides, the amount of rough rice that could have been saved for
domestic consumption was equally lost at a percentage loss of 24%. From the perspective
University of Ghana http://ugspace.ug.edu.gh

iii
of the farmers, the losses were attributed to inappropriate time of harvesting. From the
regression analysis, acreage (β=0.952 mt, P<0.01) and gender (β=0.162 mt, P≤0.05) were
found to be positively related with losses in rough rice production. However, farm
education (β= -0.656 mt, P<0.01) and adequate labour (β= -0.018 mt, P<0.05) were found
to reduce field losses. The coefficient of determination (R2) was 0.655; which implies that
66% of the variation in the quantity of rough rice lost during harvesting and handling was
explained by the specific variables in the model. The F-statistic was found to be significant
at 1%. This implies that all the explanatory variables had a significant joint impact on the
level of rough rice lost during harvesting and handling. The Kendall (Wa ) was estimated
at 0.839. This suggests that the degree of agreement among the rankings of the challenges
faced at farm gate was approximately at 84%. Therefore, the most pressing challenge was
inaccessibility of tarpaulin and continuous adoption of improvised tarpaulins. From this
study, the yield from improved time of harvest (4.8 ± 0.96 mt/ha) was (P<0.05) higher
than farmer time of harvest (3.7 ± 1.2 mt/ha). Therefore, the losses incurred during
improved harvest (5.88 ± 3.47%) was lower than farmer time of harvest (10.35 ± 1.94%).
The harvest moisture content (20.88 ± 2.56%) was not significantly different (P>0.05)
from the optimum harvest moisture content (22%). Increasing loss reduction awareness
through farmer field schools and farmers adopting 35 days after heading as a harvesting
time could lessen high levels of field losses, poverty index and improve domestic
consumption.
University of Ghana http://ugspace.ug.edu.gh

iv
DEDICATION
I would like to dedicate this thesis to my father Mr. Kwagyan Ofori, and my mother Ms.
Beatrice Koduah for their prayers, encouragement and financial support.
University of Ghana http://ugspace.ug.edu.gh

v
ACKNOWLEDGMENTS
I want to give thanks to God Almighty for his infinite grace, wisdom, direction, and
abundant blessings in life entire endeavor.
Special thanks go to my supervisors Professor P. N. T. Johnson and Dr. (Mrs.) Gloria
Essilfie for their patience, guidance devotion to work, encouragement and constructive
criticisms during the preparation and execution of this work. I am most grateful to them
for everything.
My sincere gratitude goes to my parents for all the support they offered me. I also want
to appreciate my colleagues for their constructive criticism.
I acknowledge Mr. Elvis Baidoo of CSIR-FRI, Accra, and Mr. George Adongo for their
help and support.
I appreciate all the encouragements from all my friends and colleagues, to the farmers
who participated and everyone who helped to make this work a success.
God richly bless you and provide for all your needs.
University of Ghana http://ugspace.ug.edu.gh

vi
TABLE OF CONTENTS
DECLARATION ............................................................................................................... i
ABSTRACT ...................................................................................................................... ii
DEDICATION ................................................................................................................. iv
ACKNOWLEDGMENTS .................................................................................................v
TABLE OF CONTENTS ................................................................................................. vi
LIST OF FIGURES, TABLES AND PLATES .................................................................x
LIST OF ABBREVIATIONS ......................................................................................... xii
CHAPTER ONE ................................................................................................................1
1.1 INTRODUCTION ....................................................................................................1
CHAPTER TWO ...............................................................................................................5
2.0 LITERATURE REVIEW .........................................................................................5
2.1 Rice Plant .................................................................................................................5
2.2 Origin and Taxonomy of Rice ..................................................................................6
2.2.1 Overview of Rice and Research in Ghana .........................................................6
2.2.2 Overview of Jasmine 85 into Ghanaian rice production ....................................7
2.3 Importance of Rice ...................................................................................................8
2.4 Rice Production and Consumption ...........................................................................9
2.4.1 World Rice Production and Consumption .........................................................9
2.4.2 Rice Production and Consumption in West Africa ..........................................10
2.4.3 Rice Production and Consumption in Ghana ...................................................11
2.4.4 Rice Production at Tono ..................................................................................12
2.4.5 Assessment of Farmers’ Perception on yield gaps and Losses at Farm Level 13
2.5 General Pre-Harvest and Post-Harvest Operations of Rice ....................................13
2.5.1 Pre-harvest Operations .....................................................................................13
2.5.2 Postharvest Operations ....................................................................................14
2.5.2.1 Harvesting .....................................................................................................14
2.5.2.1.1 Harvest Moisture Content (HMC) of Rough Rice .....................................15
2.5.2.1.2 Yield of Rough Rice during Harvesting Times .........................................15
2.5.2.2 Threshing and Cleaning ................................................................................16
2.6 Postharvest Loss Assessment .................................................................................17
2.6.1 Harvesting Losses ............................................................................................18
2.6.2 Threshing Losses .............................................................................................18
University of Ghana http://ugspace.ug.edu.gh

vii
2.7 Importance of postharvest loss (PHL) reduction of rice ........................................19
2.7.1 Strategies to the Reduction of Losses at Farm Level .......................................20
2.8 Factors Influencing Harvesting and Handling Losses ............................................21
2.8.1 Socio-economic Characteristics of Rice Farmers ............................................21
2.8.2 Acreage ............................................................................................................22
2.8.3 Gender ..............................................................................................................22
2.8.4 Farm Education ................................................................................................23
2.8.5 Labour ..............................................................................................................24
2.8.6 Usage of Tarpaulins and Threshability of Rough Rice....................................25
2.9 Challenges Affecting Rice Farmers at Farm Level ................................................25
CHAPTER THREE ..........................................................................................................27
3.0 METHODOLOGY .................................................................................................27
3.1 Study Area ..............................................................................................................27
3.1.1 Study Framework .............................................................................................27
3.1.2 Sampling Technique and Sampling Size .........................................................28
3.2 Survey .....................................................................................................................29
3.2.1 Determination of Factors Influencing Losses at Field .....................................29
3.2.2 Ranking Challenges faced at farm level ..........................................................30
3.3 Determination of Quantitative Loss .......................................................................31
3.3.1 Determination of Yields on Improved Harvesting and Farmer Practice .........31
3.3.2 Determination of Shattering Losses during Cutting ........................................32
3.3.3 Determination of In-Field Staking Losses during Handling ............................33
3.3.4 Determination of Losses during Threshing and Cleaning ...............................34
3.4 Determination of Harvest Moisture Content of Rough Rice ..................................36
3.5 Statistical Analysis .................................................................................................37
CHAPTER FOUR ............................................................................................................38
4.0 RESULTS ...............................................................................................................38
4.1 Quantitative Loss Assessment Survey....................................................................38
4.1.1 Socio-demographic Characteristics of Rice Farmers .......................................38
4.1.2 Levels, causes and stages of Losses perceived by Farmers at Farm Level .....39
4.1.3 Rice Output, Yield gap, Revenue and Postharvest Losses at 6 Communities .40
University of Ghana http://ugspace.ug.edu.gh

viii
4.1.4 Factors Influencing Harvesting and Handling Losses .....................................42
4.1.5 Challenges Farmers face at farm level .............................................................43
4.2 Yield of Paddy at Different Times of Harvest........................................................44
4.2.1 Losses at 35 Days after Heading (35DAH) .....................................................45
4.2.1.1 Shattering Losses at 35 Days after Heading (35DAH) .................................45
4.2.1.2 In – Field Stacking at 35 Days after Heading (35DAH)...............................45
4.2.1.3 Threshing Losses at 35 Days after Heading (35DAH) .................................46
4.2.1.4 Overall Losses at Farmer Fields at 35 Days after Heading (35DAH) ..........46
4.2.2 Losses at Farmer Time of Harvest (42 Days After Heading) ..........................47
4.2.2.1 Shattering Losses ..........................................................................................47
4.2.2.2 In-field Staking Losses .................................................................................47
4.2.2.3 Threshing Losses ..........................................................................................48
4.2.2.4 Overall Losses at Farmer Fields ...................................................................48
4.2.3 Summary of Losses at 3 different points .........................................................48
4.3 Harvest Moisture Content of Rough Rice at Tono Irrigation Project ....................49
CHAPTER FIVE ..............................................................................................................50
5.0 DISCUSSION ........................................................................................................50
5.1 Qualitative Loss Assessment Survey .....................................................................50
5.1.1 Socio-demographic Characteristics of Rice Farmers .......................................50
5.1.2 Levels and causes of Losses perceived by Farmers at Farm Level .................51
5.1.3 Rice Output, Revenue and Postharvest Losses at 6 Communities ..................52
5.1.4 Factors Influencing Harvesting and Handling Losses .....................................54
5.1.5 Challenges Farmers face at farm level .............................................................57
5.2 Yield of Paddy Harvested at Different Times of Harvesting .................................57
5.2.1 Shattering Losses .............................................................................................58
5.2.2 In – field Losses ...............................................................................................59
5.2.3 Threshing Losses .............................................................................................60
5.2.4 Harvesting and Handling Losses at Farmer Fields ..........................................61
5.3 Harvest Moisture Content of Rough Rice at Tono Irrigation Project ....................62
CHAPTER SIX ................................................................................................................64
6.0 CONCLUSIONS ....................................................................................................64
University of Ghana http://ugspace.ug.edu.gh

ix
6.1 RECOMMENDATIONS .......................................................................................66
REFERENCES .................................................................................................................69
APPENDICES .................................................................................................................81
University of Ghana http://ugspace.ug.edu.gh

x
LIST OF FIGURES, TABLES AND PLATES
Figure 1 Levels of Postharvest Losses perceived by Farmers .........................................39
Figure 2 Perception of causes of Postharvest Losses during rice cultivation by farmers at
Tono Irrigation Project .....................................................................................................40
Figure 3 Farmers’ perception about Stages where Losses occur at Farm Level ..............40
Figure 4 Actual Revenue obtained and potential revenue from a hectare of Rough
Rice ..................................................................................................................................41
Figure 5 Comparison of yields at harvesting times ..........................................................44
Table 2. 1 Regional Rice Production, Area Cropped and Yields in Ghana 2009-2010 ...11
Table 4. 1 Socio-demographic Characteristics of Respondents (n=84) ...........................38
Table 4. 2 Rough Rice Output and Postharvest losses .....................................................41
Table 4. 3 Total Production of Rough Rice and Losses at 6 Communities .....................42
Table 4. 4 Estimate of Yield Gaps at 6 Communities ......................................................42
Table 4. 5 Regression estimate of the factors influencing harvesting and handling
losses ................................................................................................................................43
Table 4. 6 Descriptive statistics of the challenges faced by farmers at farm level ..........43
Table 4. 7 Mean ranks of challenges faced at farm level ................................................44
Table 4. 8 Yields at 2 different harvesting times .............................................................44
Table 4. 9 Descriptive statistics of shattered rough rice at 35 days after heading (35DAH)
..........................................................................................................................................45
Table 4. 10 Descriptive statistics of in – field Stacking Losses at 35 days after heading
(35DAH) ..........................................................................................................................45
Table 4. 11 Descriptive statistics of threshing Losses at 35 days after heading
(35DAH) ..........................................................................................................................46
Table 4. 12 Overall Losses studied at 6 Farmer Fields ....................................................46
Table 4. 13 Descriptive statistics of shattered rough rice at farmer time of harvest ........47
Table 4. 14 Descriptive statistics of in – field Stacking Losses at farmer time of
harvest ..............................................................................................................................47
Table 4. 15 Descriptive statistics of threshing Losses at farmer time of harvest .............48
Table 4. 16 Overall Losses studied at 6 Farmer Fields ....................................................48
Table 4. 17 Comparison of Losses at 3 different point of losses .....................................49
Table 4. 18 Experimental Results for Harvested Rough Rice at 12 Farmer Fields .........49
University of Ghana http://ugspace.ug.edu.gh

xi
Plate 1 a Demarcation of quadrat on farmer fields, b. Demarcated quadrats set randomly
at farmer field .................................................................................................................. 31
Plate 2 Panicles harvested from a quadrat....................................................................... 32
Plate 3 In-field Staking.................................................................................................... 33
Plate 4 Dropped rough rice on tarpaulin ......................................................................... 34
Plate 5 Staking panicles for threshing ............................................................................. 34
Plate 6 Farmers beating panicles with sticks................................................................... 35
Plate 7 a Threshed rough rice from 25 m² quadrat; b Collected scattered and Unthreshed
rough rice ........................................................................................................................ 35
University of Ghana http://ugspace.ug.edu.gh

xii
LIST OF ABBREVIATIONS
CARD Coalition for African Rice Development
CBOs Community Based Organizations
CRI Crop Research Institute
CSA Commodity System Assessment
CSIR Council of Scientific and Industrial Research
DAH Days After Heading
FAO Food and Agriculture Organization
FBOs Farmer Based Organizations
FFSs Farmer Field Schools
GAPs Good Agronomic Practices
GSFP Ghana School Feeding Programme
HMC Harvest Moisture Content
HRY Head Rice Yield
ICOUR Irrigation Company of Upper Region
IFAD International Fund for Agricultural Development
IRRI International Rice Research Institute
LDCs Less Developed Countries
MCs Moisture Contents
University of Ghana http://ugspace.ug.edu.gh

xiii
MiDA Millennium Development Authority
MOFA Ministry of Food and Agriculture
PHH Postharvest Handling
PHLs Postharvest Losses
R2 Adjusted Coefficient of Determination
SARI Savanah Agriculture Research Institute
SRID Statistical Research Institute Department
USAID United States Agency for International Development
USDA United States Department of Agriculture
Var. Variety
w.b Wet basis
Wa Kendall
WARDA West Africa Rice Development Association
WC Kendall’s Coefficient of Concordance
University of Ghana http://ugspace.ug.edu.gh

1
CHAPTER ONE
1.1 INTRODUCTION
Rice (Oryzae sativa L.) is a prime cereal crop for about 40 per cent of the world’s
population (Bhullar & Gruissem, 2013; Jackson & Lettington, 2003; Khush & Brar,
2002); it contributes 27% of the dietary energy supply (Edoka et al., 2009; Kennedy et
al., 2003; Kubo & Purevdorj, 1991; Rai, 2003). It has become an indispensable food
commodity in the Ghanaian markets and very important to numerous segments of the
West African populace (Akowuah et al., 2012; Ekeleme et al., 2008).
In Ghana, the consumption rate of rice is very high for many households. The annual per
capita consumption of rice increased from 17.5 kilograms in 1999–2001 to 22.4 kilogram
in 2002–2004 (Tomlins et al., 2005) and 24 kilogram in 2010–2011 (MoFA, 2011). The
demand for rice is expected to increase at a growing rate of 11.8 percent annually in the
medium term (MiDA, 2010). It is also a major economic food commodity serving as food
security, a source of calories (Onwueme & Sinha, 1991) and employment to peri – urban
and rural lives.
Rice is one of the most significant cereal after maize in Ghana and has become a cash
crop for many farmers especially in the Navrongo rice hub (MiDA, 2010; Osei – Asare,
2010). Approximately, 27 percent of rice production in Ghana emanates from the Upper
East Region (Ragasa et al., 2013). Rice cultivation in Kassena NankanaWest District is
mitigating poverty, improving rural development and livelihoods among rice farmers
(WARDA, 2005).
University of Ghana http://ugspace.ug.edu.gh

2
Successively, a range of technological interventions have been introduced to assist small-
scale farmers to increase yield. For instance, an emergency rice initiative was launched in
2009 with an objective to increase rice productivity in order to improve food security
(Abass et al., 2014; Ajah & Ajah, 2010; Buah et al., 2011). Even though, production levels
of rough rice between 2000 and 2010 has been growing; they do not meet rice
consumption.
According to MOFA (2011), the average yield of rough rice rose from 2.16 mt/ha in 2000
but remains at 2.71 mt/ha in 2010. However, the national food balance sheet (2010/2011)
reported that the total national production of rice for consumption was 256,617 mt but
was then supported with a total import of 283,000 mt amounting to a total supply of
539,617 mt. Meanwhile 492,000 mt of rough rice was produced in the same 2010.
These low levels of milled rice annually are due to postharvest losses which can be
attributed to the untimely manner of harvesting by rice farmers. For instance, at late
harvesting, rough rice is susceptible to shattering leading to field losses, then cracks
during threshing and milling (Somado & Berhe, 2008). Therefore, timeliness in harvesting
is a fundamental influence on field losses, rough rice quality and its marketability. FAO
(1989) has also noted that post-harvest losses of rice is attributed to mishandling rough
rice and the untimely manner of harvesting rising to about 25%.
Besides, high moisture content at harvest, reduces field losses of rough rice; that is, rough
rice is normally harvested at high moisture contents (MCs) of about 20% to 24% wet basis
(wb). However, many rice farmers on average harvest below 20% wet basis (Cnossen &
Siebenmorgen, 2000). This reduces the output levels of rough rice. Qin and Siebenmorgen
(2005) and Siebenmorgen et al. (2007) reported that optimal harvest moisture content
University of Ghana http://ugspace.ug.edu.gh

3
(HMC) of rice is key to maximize the output of rice. Therefore, in order to increase
production levels, harvesting activities and harvest moisture content must be investigated.
Basically, improvement on postharvest management at farm level during harvesting and
handling plays an important role in achieving the potential yield of rough rice. Therefore,
there is a vital need to identify the farmers’ harvesting and postharvest handling inabilities
and the factors influencing the losses (Obeng-Ofori, 2011). This is because, the factors
governing farm level losses generally occur before the farm gate in Less Developed
Countries (LDCs) (Hodges et al., 2010).
Even though there has been some estimation of losses on harvesting and handling of some
rice varieties, these studies were done several years ago. On the other hand, quantitative
losses are not adequately documented on rice (var. Jasmine 85); which happens to be a
very popular variety cultivated in the study area. Therefore, it is imperative to study the
quantitative losses of rice (var. Jasmine 85). The data that would be obtained from the
study on harvesting times and postharvest handling will help assist in identifying possible
interventions that could be used to mitigate the current levels of postharvest losses of rice
in the area. Thus, this study aimed at estimating the quantitative losses that occur during
harvesting, threshing and cleaning of rice (var. Jasmine 85) produced at Tono Irrigation
Project in the Upper East Region.
University of Ghana http://ugspace.ug.edu.gh

4
The specific objectives of the study were to;
1. Assess farmers’ perception on causes, yield gaps and the determinants of
harvesting and handling losses of rice (var. Jasmine 85)
2. Assess how rice yields at 35 days after heading (DAH) and farmers’ date of
harvesting influence the level of quantitative losses at shattering, in-field staking
and threshing
3. Assess how Harvest Moisture Content (HMC) influence the level of quantitative
losses at shattering, in-field staking and threshing
University of Ghana http://ugspace.ug.edu.gh

5
CHAPTER TWO
2.0 LITERATURE REVIEW
2.1 Rice Plant
Rice (Oryza sativa L.) is an annual grass that belongs to the family Graminae or poaceae
(Agropedia, 2009; FAO, 2013). It has hollow and jointed culms; narrow, sessile leaf
blades joined to the leaf sheaths with collars and terminal panicles (Moldenhauer &
Slaton, 2001). The rice plant has prominent organs that supports the success of its life
cycle. These include the vegetative and the floral parts. The vegetative parts are the roots,
culms and leaves; while the floral part is solely made up of the spikelet.
The rice plant usually takes 3 to 6 months from germination to maturity but depends on
the variety and the ecology under which the plant is grown (Ranawake et al., 2013). It
undergoes a series of developmental process which starts from the emergence of
coleoptile to the formation of hard dough on the panicle. Generally, the developmental
cycle is categorized as vegetative and productive periods. At the vegetative stage, the
plant is totally green and at maturity the straw becomes golden in colour. The vegetative
phase includes emergence, seedling development, tillering, internode elongation, culm
development. The reproductive phase entails prebooting, booting, heading, grain filling
and the maturity stage (Dunand & Saichuk, 2009).
After a complete vegetative stage, the plant bears a terminal shoot called the inflorescence
(floral part). It is also known as the panicle. The number of the spikelets on the panicle
forms the flower (Moldenhauer & Slaton, 2001). This organ has both the male (anthers
containing pollen) and the female (ovary) reproductive organ. At this stage, the rice plant
University of Ghana http://ugspace.ug.edu.gh

6
is noted to have headed. Within the heading period, self–fertilization takes place leading
to the development of hard dough. The development of the hard dough also known as the
grain results mainly from accumulation of carbohydrates in the pistils of the florets
(Dunand, 1998).
2.2 Origin and Taxonomy of Rice
The genus Oryza, to which grown rice belongs, have originated at least 130 million years
ago and got dispersed as a wild grass (Dogara & Jumare, 2014). There are 24 species of
Oryza and a chromosome number of 2n=24 (IRRI, 2005). Among the numerous species
of rice, the two cultivated species are diploids: the Asian rice, Oryza sativa, which is the
widespread rice and the African rice, Oryza glaberrima, are the main rice species of
research development in rice (Dogara & Jumare, 2014). Oryza sativa L. is set categorized
into two sub-species based on ecological situations: the indica type and the japonica type
(Linares, 2002). The Asian rice (O. sativa) is characterized by good yields and absence of
lodging and grain shattering – unlike its African counterpart (O. glaberrima) (Jones et al.,
1997). Due to these traits, it has called for several research.
2.2.1 Overview of Rice and Research in Ghana
The rice plant Oryza sativa L. and its extensive cultivation in Ghana has led to the
development of several varietal types. Some categories of varieties are highly susceptible
to diseases, pest and environmental stress. These situations called for the strengthening of
the existing germplasm to overcome the persisting limitations for some varietal types.
Rice research in Ghana is conducted primarily by the Crops Research Institute (CRI) and
the Savannah Agricultural Research Institute (SARI) of the Council for Scientific and
University of Ghana http://ugspace.ug.edu.gh

7
Industrial Research (CSIR). Also, the department of Crop Science, University of Ghana,
has conducted some varietal research and testing on rice to develop Marshall
(Amankwatia) variety which was unveiled to Ghanaian farmers in 2010 and has the
tendency to tolerate blast disease (Ragasa et al., 2013).
2.2.2 Introduction of Jasmine 85 into Ghanaian rice production
In this half century, aromatic rice has been a preferred rice grain for consumers. Rice
breeders in the United States of America delved into the development of an aromatic rice
for farmers. A practical approach was to generate a variety from an existing variety with
a certain degree of desirable traits. This was IR841 and later named as Jasmine 85 in the
United States (Tanasugarn, 1998). Jasmine 85 is an aromatic rice variety developed in
1966, by a Thailand rice breeder: Ben Jackson at the International Rice Research Institute
(IRRI). In 1989, the USDA in collaboration with IRRI, University of Arkansas, Louisiana
State University, and Texas A & M University, released Jasmine 85 (IR841) to American
farmers under the label Jasmine 85 (Oluyemi, 2014; Tanasugarn, 1998).
The variety was then introduced into Ghana in 2009, yielding about 4.5 – 8 tons per
hectare and the variety has become the most preferred rice variety to rice farmers (Ragasa
et al., 2013). The registration number of Jasmine 85 is ‘CV-1O7, PI 595927’ (IRRI, 1998),
and characterized as aromatic, long grain, good taste and with maturity days within 110 –
120. Aroma in Jasmine 85 is attributed to the presence of 2-acetyle-1-pyrroline (2AP)
(Napasintuwong, 2012; Oluyemi, 2014). The aroma is apparent during its vegetation
period as well as cooking periods.
University of Ghana http://ugspace.ug.edu.gh

8
It is noted by several studies that consumers appreciate the aromatic trait of Jasmine 85
over other varieties without the aromatic traits (Abansi et al., 1992; Damardjati and Oka,
1992; Untong et al., 2010). The variety is classified 7.2 mm of non-polished grain,
3.2:1 length-width ratio, 36% of head rice (>80% by length) or full grain, and 14%
moisture at storage (Napasintuwong, 2012).
2.3 Importance of Rice
Rice is essential for its nutrition, food security and economics (Wayne & Dilday, 2003).
It has a considerable amount of proteins and carbohydrates (Norman & Kebe, 2004). It
has 20% of dietary protein and 3% of dietary fat (Kennedy et al., 2003). The cereal crop
is mainly consumed in the form of whole grains. It provides more calories than some
cereal crops like millet. The utilization of rice in the Asian community accounted for 30%
of caloric intake in 2005 (Pandey et al., 2010). Rice farming is the prime activity, energy
source and income for about 100 million households in Africa (Sanint et al., 1998). Tran
(2004) stated that 1 billion of the world populace are engaged directly or indirectly with
rice production. Rice farming serves as a source of employment; which tends to improve
food security. Thereby, provides 54% of energy for rural lives and feeds more than 95%
of rural families (Norman & Kebe, 2004).
The ability of the staple to absorb over 100 million farmers has actually helped to mitigate
poverty among rice growing communities (Sanint et al., 1998). Thus, the livelihoods of
people is increasing while income levels also go at a rise. Such livelihoods include
transplanting of rice seedlings, harvesting panicles and collection of paddy through
threshing. The income made from rice cultivation and post-production activities provides
University of Ghana http://ugspace.ug.edu.gh

9
money to cover the costs of everyday transactions and other societal activities of people
in the rural areas.
Its importance has encouraged the research work not only in increasing yield but
developing drought resistant varieties that enables farmers to adapt to the erratic rainfall
pattern in several ecological zones across the country. An instance being the
combinational trait between O. sativa and O. glaberrima gave Nerica variety. This variety
was technologically advanced to stand the low input levels and harsh ecological
conditions of African agriculture while boosting productivity.
2.4 Rice Production and Consumption
2.4.1 World Rice Production and Consumption
The global populace is noted to be 7 billion but expected to as much grow to 8.9 billion
in 2050, increasing at 47 per cent (United Nations, 2004). This indicates that, the world
production of rice is needed to increase. For the reason that, there is the need to meet the
expecting rise in demand for rice. In order to meet the demand of the growing global
populace, the world’s annual rough rice production was needed to increase at 27.6% by
the year 2010 (FAO, 1993). Also, it is projected that the world’s annual rough rice needs
to increase from 520 million tons currently to at least 880 million tons by 2025; which is
expected at a growth of almost 70%. This necessity has the tendency to shoot up at one
billion tons by the year 2050 (Lampe, 1995). The Asian continent has a huge lead in rice
production and consumption of rice but the agricultural lands are almost exhausted (Tran,
1997). This implies that Africa could have a comparative advantage in years to come. The
demand of rice is projected to grow in the decades to come but in different amount of
University of Ghana http://ugspace.ug.edu.gh

10
quantity across all regions. The change is mainly attributed to the growth with the human
populace. Also, rise in income, expansion of urban communities and consumer
preferences has a great influence to the demand of rice. At the global level, per capita rice
consumption may become constant, but will increase in Africa, the Middle East, and the
Latin Americas while it will decline in some Asian countries that are experiencing diet
shifts due to higher incomes and urbanization.
2.4.2 Rice Production and Consumption in West Africa
Rice has become a vital food commodity in the numerous households in West Africa.
There has been an extensive endeavor to the strengthening of rice research. There have
also been strong developmental programs on breeding and selection in many African
countries (Berhe & Mado, 2008), in areas where there are no programs on breeding, such
countries benefit from varieties that have been developed to suite the different ecological
zones. The region produces about 8 per cent calories of rice and cultivated in two main
ecosystems, namely rain fed uplands and lowlands in Sub-Saharan Africa (FAO, 2010b).
Rice production in the sub region has risen since the 1970s reaching almost 7 mt of milled
rice at the end of the last decade (Defoer, Wopereis, Jones, Lancon, & Erenstein, 2003).
The increase at the production base is about 70% extension of the production area and
30% growth in yield (Fagade, 2000; Falusi, 1997). Despite growth in production, the gap
between the demand for rice and the sub regional supply is on a growth.
Rice consumption has steadily increased since over the years. Seck (2011) confirmed that
the population in the sub region is expected as much to double from 770 million in 2005
to 1.5 billion by 2050. The consumption pattern has overwhelmed production. The
average growth of rice consumption is more than 6% per annum and has accrued to over
University of Ghana http://ugspace.ug.edu.gh

11
10 million tonnes of milled rice per annum. The increase in rice consumption cannot be
isolated from population growing at a pace of 2.6% per year. Moreover, there has also
been an increasing pattern of rice at 1.1% per annum. (Defoer et al., 2003). Therefore, the
consumption pattern has been growing between 5% to 6% per annum since 1961 (Nwanze
et al., 2006).
2.4.3 Rice Production and Consumption in Ghana
According to Kula and Dormon (2009) Ghana’s rice production assessments range from
200,000 to 300,000 mt of paddy of which the bulk comes from the Upper East, Northern
and Volta Region. The rice production coming from Upper East is estimated to be 27%
(Ragasa et al., 2013; MOFA, 2011). In Ghana, substantial amounts of rice are produced
in all regions except central. Sixty percent (66%) of the national production comes from
Northern Ghana as provided in Table 2.1.
Table 2. 1 Regional Rice Production, Area Cropped and Yields in Ghana 2009-2010
Region/year 2009 2010
Area (Ha) Production
(MT)
Yield
(Mt/Ha)
Area (ha) Production
(mt)
Yield
(mt/ha)
Ashanti 9,560 12,440 1.23 10,115 27,705 2.74
Brong
Ahafo
- 5 - 4,020 6592.8 1.64
Central 4,160 5,090 1.22 4,290 5,241 1.22
Eastern 7,310 19,740 2.70 6,630 20,703 3.12
Greater 4.53 2,323 12,773 5.49
Northern 62,930 185,877 2.95
Upper east 39,833 111,273 2.81 47,361 135,222 2.86
Upper west 4,570 7,291 1.60
Volta 21,860 67,229 3.08
Western 17,130 23,022 1.34
Total 162,000 391,000 2.40 181,228 491,603 2.71
Source: MoFA, SRID, 2010
University of Ghana http://ugspace.ug.edu.gh

12
The yields that are obtained are not encouraging. Average rice yields in Ghana are higher
than rice yields in Nigeria, Guinea, and Ivory Coast, but lower than in Mali and Senegal.
The yields have been growing at 3 percent annually in Ghana from 2.0 mt/ha in 2004 to
2.5 mt/ha in 2012. Recently, rice yields vary considerably by cropping type but average
yields are 2.5 to 4.2 mt/ha in the major season and 2.1 to 3.5 mt/ha during the minor season
(Kula & Dormon, 2009).
Rice is widely consumed in Ghana (Chipili et al., 2003); because the Ghanaian population
have had a dietary shift to rice (Guisse, 2010). The per capita rice production increased
from 17.5 kg to 38 kg within a period of ten years. It is therefore valued to rise up to 63
kg by the year 2018 (MOFA, 2009). At 2010, the per capita consumption of rice was 24
kg per annum (MoFA, 2011). In addition, rice consumption in 2011/12 was 62,000 mt
with per capita consumption of rice at 28 kg with urban areas accounting for
approximately 76 percent of total rice consumption (CARD, 2010). Due to urbanization,
consumption of rice is preferred over most staple foods attributed to the convenience in
storage as well as cooking.
2.4.4 Rice Production at Tono
In Ghana, rice production is mostly cultivated on irrigable lands. Among the 22 public
irrigation schemes under the government led management (Kranjac-Berisavljevic’ et al.,
2003), the Tono Irrigation Project is categorized among Kpong, Vea and Afife as large
irrigation facility (CARD, 2010). The average paddy yield in all varieties at the Tono
Irrigation Project was estimated to be 3.3 mt/ha but 3.2 mt/ha has been estimated for
Jasmine 85 (Ragasa et al., 2014).
University of Ghana http://ugspace.ug.edu.gh

13
2.4.5 Assessment of Farmers’ Perception on yield gaps and Losses at Farm Level
Assessment of farmers’ knowledge on yield gaps and postharvest losses are important.
The approach helps to identify the levels of yield gaps and postharvest loss awareness
among rice farmers (Abass et al., 2014). This is so because farmers understanding on
yield and PHL have received inadequate attention in the studies on losses of rice (Martins,
2013). The fall of yield at farm level is mainly driven by some various constraints such as
biological, physiological and socioeconomic. These constraints are addressed by
smallholder farmers during the production phase. Such interventions include the use of
chemicals in controlling some biotic agents to deter the development of nuisance in the
rice fields. Alam and Hossain (2008) indicated that rice yields in different ecosystems is
not increasing; despite the introduction of improved package of production practices.
Apart from the inadequacies during handling of harvested rice, the yields are also
compromised by biotic and abiotic stress. The stress at farm level play a role in field
losses.
2.5 General Pre-Harvest and Post-Harvest Operations of Rice
2.5.1 Pre-harvest Operations
Rice farming cannot be separated from farm management. The activities involved in the
management of the farm has the tendency to improve the output that is to be achieved at
farm level (Lantin, 1999). Therefore, it is always important to adopt appropriate
agricultural practices and an improved rice variety that can assure the maximum output at
farm level. In addition, the major activities that engage most women especially is the use
of pesticides, hand weeding and bird scaring (Norman & Kebe, 2004; Takeshima & Salau,
University of Ghana http://ugspace.ug.edu.gh

14
2010). The activities involved with pre harvest operations is to obtain a farming space,
improve the health of soil and the most important part of it all changing the form of soil.
2.5.2 Postharvest Operations
Postharvest operations at farm level is categorized into two main activities. The activities
are cutting of matured panicles and separation of edible parts. The two categorized
activities is achieved through a physical transformation process (Takeshima & Salau,
2010). The operations at each point contribute to quantitative losses. Depending on the
country and the technology available, the activity will vary from farmer to farmer and this
explains the wide variations of loss assessment figures globally.
2.5.2.1 Harvesting
Rice is harvested when the crop reaches its maturity. The physiological maturity is often
indicated by colour change of the panicle. Also, the ripening stage can be determined
within a specified period of maturity. For instance, most of the rice varieties cultivated in
the tropics mature within a period of 110 – 120 days. Also, an immature grain is avoided
by timely harvest. Therefore, harvesting is appropriately done at 5 days after maturity
because to harvest rough rice is dependent on the duration of maturity (Lantin, 1999). The
operation is carried out either by cutting the rice stalk or cutting the panicles (Appiah et
al., 2011). Harvesting constitute the major constraint to rice production (Somado & Berhe,
2008). It is a vital operation that can increase the quantity of rough rice (Alizadeh &
Allameh, 2013) but it can also compromise all efforts to achieve good quality milled rice
(Asiedu et al., 2011). In Tono, farmers cut the rice plant from the base and this method is
widely practiced in most rice growing countries. It is noted to be cut from about 10 cm -
15 cm above the soil surface (Lantin, 1999). The cut straws are stacked in the field while
University of Ghana http://ugspace.ug.edu.gh

15
harvesting continues. For the duration of the handling stage, activities involved causes
physical losses (Naphire, 1997).
2.5.2.1.1 Harvest Moisture Content (HMC) of Rough Rice
Rice moisture content (MC) at harvest is one of the most significant factors influencing
the quantity and total economic value of rice (Qin & Siebenmorgen, 2005). Harvest
Moisture Content has an impact on the gross income to a producer (Lu et al., 1995). The
harvest moisture content also affects the physical losses and the yield of rough rice.
Suitable time for harvest is when at least 80% of the panicles have attained full maturity,
at a moisture content between 20 - 24% while rough rice has a full ripened colour (Asiedu
et al., 2011).
Harvest Moisture Content (HMC) is dependent on the location at which panicles are
collected. Therefore, the HMC affects the quantity of rough rice within that location
(Bautista & Siebenmorgen, 2005; Khan & Salim, 2005). Moisture level in soil compensate
the excess transpiration of water molecules from the surfaces of the kernels. This prevents
kernels shattering while attached to the ears of the panicles. In cases where there is high
evapotranspiration, paddy is susceptible to excessive shattering especially in rain fed
areas.
2.5.2.1.2 Yield of Rough Rice during Harvesting Times
Generally, rice cultivation in Africa is noted to be low – yielding (Jenny et al., 2008).
Since then, it has called for the designing of strategies for improvement in the yield of
rough rice (Cuevasperes et al., 1995). Many farmers have adopted the used of improved
cultivars but have not optimized the appropriate crop management systems. This has then
affected the potential yield of rough rice at the farm level (Feil, 1992; Nanfumba et al.,
University of Ghana http://ugspace.ug.edu.gh

16
2013). In addition, Good Agronomic Practices (GAPs) in rice cultivation have been
adopted especially pest control measures and fertilizer application; whereas the
approaches were to augment the yields of rough rice in most developing countries
(USDA-National Agricultural Statistics Service, 2008). However, these interventions and
the improvements have not really improved the production of rough rice (Tabien et al.,
2008).
Additionally, improvements that are needed to increase rough rice during harvesting is
met halfway. Therefore, there must be possibilities to increase Head Rice Yield (HRY)
through proper crop management practices especially at the farm level. It is also true that
farmers encounter several on farm challenges in rice production leading to PHLs.
Eliminating the constraints to rough rice yield does not guarantee an increase in
production (Ofori et al., 2010). But, the situation must be supported with some level of
commitment in terms of adopting improved time of harvesting rough rice at farm level.
Tanaka (1976) indicated that there is always a need on the farmer’s behalf to know the
optimal growth duration for the maximum yield of the variety under cultivation.
2.5.2.2 Threshing and Cleaning
This activity involves the separation of rough rice from the panicle and is mostly obtained
by hitting the straws with sticks. Paddy is threshed when the straws receive beating
impacts from a stick. With this operation, there is always a high tendency where paddy is
lost through incomplete detach of rough rice from the ears of the panicles and the worst
is the scattering of paddy due to the impact force from beating stick (Candia et al., 2012).
University of Ghana http://ugspace.ug.edu.gh

17
2.6 Postharvest Loss Assessment
Postharvest Loss Assessment is an important part of any loss reduction and intervention
programme (Boxall, 1986). The assessment procedure has the tendency to identify the
loopholes for drastic attention. There have been several investigations that have sought
into assessing postharvest losses in the Sub – Saharan Africa. IRRI (1997) reported an
alarming large estimated loss of 37%. Also, postharvest paddy losses of 35% have been
attributed to small-scale farmers, varying varieties and environmental location (Hodges
et al., 2010; Somado & Berhe, 2008).
The largest Postharvest Losses (PHLs) usually occur at the farm level (World Bank et al.,
2011). This is highly attributed to physical grain loss due to shattering, scattering or
spillage during transportation of rough rice from the field. In assessing postharvest losses,
results are very much location specific, technology and social behavior practice
dependent, and based on sample statistics. The effectiveness of loss assessment studies
make stakeholders aware of the need to allocate resources to post-production research,
and to also to underline priority areas for research (De Padua, 1999). Physical losses
during harvesting of matured paddy at field is based on the estimation of rough rice lost
per the measured quadrat as percentage of actual yield (Boxall, 1986).
There has been much emphasis on agricultural production rather than postharvest research
in most rice growing communities. Postharvest research has also been classified as a third
dimension in the production of rough rice (Kader & Rolle, 2004). But, there has been a
growing interest in the important role of postharvest system in the rice value chain. Yet,
there has been low research in West Africa, contributing low transfer of postharvest
University of Ghana http://ugspace.ug.edu.gh
18
technology among small scale rice farmers. Researching into the existing postharvest
system through loss assessment studies help to identify obstacles.
2.6.1 Harvesting Losses
Harvesting refers to cutting of straws, in – field staking and bundling to the threshing floor
(Guisse, 2010). These various activities account for the losses that do occur at farm level
(Naphire, 1997). Losses to harvesting vary with the method used to collect rough rice.
Harvesting loss of African rice in Madagascar is estimated to be 6.9%. Asian countries
encountered an estimated harvesting loss of 4% (Calverley, 1996) where rice farmers in
Bangladesh encountered a loss of 1.95% (Huq & Greeley, 1980).
Field stacking is a main way of handling harvested straws. The practice has the tendency
of incurring losses ranging from 0.11 to 0.76% (Khan & Salim, 2005). The longer the
intermediary piling on the field, particularly where the grain moisture content is high or
have collected moisture from the soil, the degree of loss can be attributed to fungal
infestation whilst when the moisture level of straw is low, there is a high tendency of
shattering losses.
2.6.2 Threshing Losses
Losses to threshing is dependent on the type of method used (Guisse, 2010). The method
also varies from country to country. The methods are categorized as manual, animal
threading or mechanical. Losses to threshing is due to incomplete removal of rough rice
and scattering of rough rice (Candia et al., 2012). In Malaysia, a threshing loss was
estimated between 5% - 13% while the Philippines experienced 2% - 6% loss (FAO,
2007).
University of Ghana http://ugspace.ug.edu.gh

19
2.7 Importance of postharvest loss (PHL) reduction of rice
Postharvest losses of rough rice come to play either by physical or qualitative. The losses
happen between harvest and consumption (Abebe & Bekele, 2006). In Ghana, postharvest
losses of rice is well-known but reduction in the losses of rice is usually considered as a
third aspect as compared to rice production and population growth (Kader & Rolle, 2004).
But, the reduction of losses on rice is essential. Also, the increasing population in the
world is a threat to food security. The extent of postharvest losses does not only consist
of physical deterioration of quality grains, but also takes into account sunk cost (total cost
of inputs used in producing lost grain).
Secondly, in situations where losses are not addressed in Ghana, it will increase economic
pressure and bring about surges in the price of rice. This shows that postharvest system is
important. Due to the increase demand for rice on the global market, the economic
environment has predicted rice prices that are capable of increasing at 10% - 20% (Pandey
et al., 2010). In general, food losses contribute to high food prices, puts pressure on
farmers to produce more to compensate the lost grain whiles it put much stress on the
ecology (FAO, 2010a).
The reduction of the losses in rice fields shall complement the effort to enhance food
security. This approach will improve farm level productivity. Through this, rice farmers
will benefit significantly among the rural lives. Therefore, when efforts are geared
towards achieving postharvest rice loss reduction, importation of rice in Ghana will not
prevail. Also, reduction in losses generate much income for rice actors, improve product
quality and safety on the aspect of consumers. Therefore, the combination of cost effective
and sustainable strategies has the capacity to promote food and nutritional security among
University of Ghana http://ugspace.ug.edu.gh
20
human lives. PHL reduction is as critical component of farm level production (World
Bank et al., 2011).
2.7.1 Strategies to the Reduction of Losses at Farm Level
A systematic scrutiny of rice during production, harvesting and handling is important and
a first step in identifying an appropriate strategy for reducing losses (Bell et al., 1999;
Kitinoja & Gorny, 1999). Also, the reduction of postharvest loss is not new. Therefore,
there is a need to engage farmers in a Commodity System Assessment (CSA) to have the
conscious of losses that can occur at each point of postharvest operation.
Primarily, losses start during the pre-harvest period but much concern has centered on
production but there has been less yields from the fields. This is recognized to the
continuous adoption of planting saved seeds over a period of growing seasons. Contrary,
the adoption and use of quality rice seeds has the capacity to decrease the losses. For
instance, the adoption of bad seeds that encourage shattering or lodging at field.
Therefore, the increase in the supply of quality rice seeds are the appropriate strategy to
ensure food security at the production level (Hoque & Haque, 2014).
Furthermore, physical losses of rough rice within post-production system is generally low.
Studies have identified series of estimates that have described the extent of the losses.
Such estimates have underlined harvesting and handling losses. The losses associated to
harvesting can be mitigated when farmers harvest timely. However, farmers do not
harvest at the appropriate time. In addition, losses during threshing and drying is well
mitigated using appropriate tarpaulin. It is well-known among small scale rice farmers for
the use of improvised tarpaulins made out of used sacks. In cases where these prevailing
situations are addressed, the losses will be mitigated.
University of Ghana http://ugspace.ug.edu.gh

21
2.8 Factors Influencing Harvesting and Handling Losses
2.8.1 Socio-economic Characteristics of Rice Farmers
There is much demand for rice. It is noted that, farmers in rice production encounter
various challenges that needs to be tackled. Such challenges faced at farm level are
influenced by the socioeconomic characteristics of rice farmers. These characteristics
have not been given much interest in rice losses. In most cases, studies have tackled the
issues of productivity (Donkoh & Awuni, 2011). Moreover, when socioeconomic
characteristics are studied, it enables planners and policy makers to develop a more
friendly – user programs and strategies to the benefit of postharvest losses at farm level.
It is much well-known that farmers in rice farming are of small to medium scale (Amaza
& Maurice, 2005; Okoruwa & Ogundele, 2006). The average farm size ranges from 0.6
ha to 1.68 ha while 0.1 to 0.3 considered as small scale farms (Onoja & Herbert, 2012).
Yet still, farmers are not able to harvest much rice from the field. This is highly attributed
to less schooling among the rice farmers. Mbah (2006) discovered that, 69% of rice
farmers are either illiterates or semi illiterates. This indicates that education in agriculture
is paramount among rice farmers. Also, education influences the rice output at farm level.
Therefore, studies conducted by Horna et al. (2005) identified some farmer characteristics
that could affect the output of rice production. In the study, some of the identified
characteristics were gender and access to farm education.
Subsequently, there are several factors that influences losses at farm level. Some of the
variables include acreage, size of tarpaulin to handle rough rice at field, the social
behavior of the women while threshing, labour adequacy and competence of the farmer.
These socioeconomic variables influence physical losses at farmer fields.
University of Ghana http://ugspace.ug.edu.gh

22
2.8.2 Acreage
Approximately 69% of Ghana’s land is for agriculture (USAID, 2011). It is noted that
production of rough rice undergo some degree of losses which affect the sustainable and
rural development of farmers (Donkor & Owusu, 2014; IFAD, 2008). In most cases, land
size in agriculture is either classified as small or average. Approximately 90% of
agricultural acreages are less than 2 hectares (MoFA, 2011). Sarah et al., (2014)
highlighted in a survey that farm size has decreased overtime. Irrespective of the farm
size, usually, the land is capable of producing higher outputs. This require high amount
of labour to harvest rough rice at farm level. This result in high level of poor handling of
rough rice.
2.8.3 Gender
Gender involvement in rice production and postharvest handling is well recognized
among smallholder farmers. In many cases, women are more active in the operations
(Akande et al., 2007; Huvio, 1998; WARDA et al., 2008) but their roles in the economic
growth continues to be inadequately acknowledged (Mohammed & Abdulquadri, 2011).
In Upper East Region and some rice growing communities, men, women and the youth
are major players in rice production and handling of rough rice but most postharvest
handling of rice are handled by women. Besides there is division of labour which exists
among gender. Meanwhile, the gender pattern for rice cultivation is complex in many
places. Therefore, research into gender is an approach to sustainability and for an effective
rice development in West Africa. (Agboh-Noameshie et al., 2013). Also, gender has
become a cross cutting issue in terms of promoting equity. The issues highlight liaising
University of Ghana http://ugspace.ug.edu.gh

23
male and female farmers to appropriate programs which targets the improvement in
household food security and poverty reduction (Ayoola et al., 2011).
2.8.4 Farm Education
Education in rice farming is key; governments around the globe have routinely advocated
investment in education (Asadullah & Rahman, 2005). Also, information is consistently
an essential pillar in the development of farmers in Upper East Region because their
livelihoods can be improved (Meyer, 2005). Information and education raise a positive
return to agriculture (Bachhv, 2012; Oladele, 2006). Therefore, farmer’s accessibility to
information has the tendency to influence the behaviour towards handling of agricultural
produce (Asiabaka and Kenyon 2002). In addition, adoption of better access to rough rice
handling is dependent on the extent of farm education a farmer engages with. Ganpat and
Sespersad (1996) highlighted, the constant interaction with information source will have
an effect on the adoption behaviour of the farmer. It is recommended that paddy is
harvested as soon as they are physiologically matured and this knowledge can be passed
on to farmers through farm trainings.
Hodges & Stathers (2012) stated that it is essential to be able to make out when crops
have matured in the field. This technical know-how can be acquired during interactions
on farm training activities. The trainings will help farmers to harvest at an appropriate
moisture content of around 20-25% (Hodges & Stathers, 2012). The technology transfer
to farmers will help to inform, correct decision making and increase the quantity of rough
rice collected (Adejo et al., 2012; Aina et al., 1995; Dulle & Ngalapa, 2014; Idiegbeyan-
Ose Jerome & Theresa, 2009). The trainings pertaining to postharvest handling will
encourage farmers to analyse the prevailing difficulties that they might encounter in the
University of Ghana http://ugspace.ug.edu.gh

24
course of post-production; therefore the challenges which include time of harvest and
post-harvest techniques would be tackled (FAO, 2009). Education arises when a farmer
with limited knowledge acquires or adopts a newly introduced practice particularly from
a fellow farmer within the catchment area of the same crop production (Appleton &
Balihuta, 1996; Knight, Wier, & Woldhanna, 2003) Therefore, since such farmers become
the point of reference for many farmers; farmers enhance their own postharvest handling
management. Also, farm education will give the rice actor a firsthand approach to adjust
from poor handling of rough rice to a more improved way of handling the food commodity
during and after harvest. In addition, rice farmers need applicable information and
knowledge on postharvest handling techniques and opportunities to increase output and
to sell their surplus (Agboh-Noameshie et al., 2013).
2.8.5 Labour
The majority of rice consumed in most rice growing communities and some part of the
country emanates from rural farmers. They indulge in indigenous practices where family
labour and/or hired labour is used for most of the farm operations (Edoka et al., 2014). In
addition, agriculture accounts for 70% of labour force (World Bank, 2007). Women for
instance, play a vital role contributing 60% – 80% of agricultural labour force (Mgbada,
2000).
Rice is normally cut by hand using different type of labour of which the balance is
dependent on farmer acreage (Denning et al., 2013). Around 10 – 15 person-days per acre
is required for manual cutting, while 5–7 person-days are needed for manual threshing;
losses in manual systems can reach 7–20% depending on the season and local practices
(Bautista et al., 2007). The goal of good harvesting is to ensure maximum grain yield by
University of Ghana http://ugspace.ug.edu.gh

25
minimizing grain loss and preventing quality deterioration. In subsistence and small-scale
farming systems, these operations are still often carried out manually (Pandey et al.,
2010). Smallholder farmers do not only contribute to rice productivity but also to overall
economic growth and provision of labour (Biggs & Biggs, 2001).
2.8.6 Usage of Tarpaulins and Threshability of Rough Rice
The use of drying materials is very important in the rice value chain. Such materials are
noted to be a tarpaulin. It is more important to use during the time of threshing, especially
when there is an absent of a threshing and drying floor. The material is impermeable and
mostly used to cover stored produce in dump areas (World Bank et al., 2011). In the
absence of tarpaulin, farmers put together opened sacks to serve as an improvised
tarpaulin. Even though, farmers make themselves improvised tarpaulins, the size is not
proportional to the land size. This improvised material cannot serve efficiently as a
tarpaulin would. Moreover, it is permeable and cannot be used in damp areas.
The threshability of kernels to detach from the straw is paramount. At times where rough
rice is not detached from the straw, it adds up to physical loss at farm level. It is well
observed in rice growing communities that females in rice growing areas have proved to
possess particular skills in executing some particular tasks (Agboh-Noameshie et al.,
2013); but losses at farm level can be attributed to the social behaviour of women during
labour. Therefore, the behaviour of the one threshing determines how much rough rice
will be collected.
2.9 Challenges Affecting Rice Farmers at Farm Level
During the production phase of rice, preharvest factors influence the potential yield that
could have been harvested. These challenges can result from the incidence of biological
University of Ghana http://ugspace.ug.edu.gh

26
agents, physical stress from the ecology and socioeconomic problems (Thanh & Singh,
2006). It is well noted that the presence of socioeconomic problems contributes to the
extent of losses at field. Adepoju (2014) identified pest/diseases and limited access to
credit as the most pressing constraint to farmers apart from inadequate storage facilities.
Seid et al. (2013) and Basappa et al. (2007) identified diseases and less capital as
challenges faced by farmers. Also, Aidoo et al. (2014) also identified that farmers
consider limited access to finance/credit as one major constraint at farm level.
Constraints are capable of varying from one place to the other. For instance, different
ecologies have different situations depending on the mitigation strategies that are used to
address the problem at hand.
University of Ghana http://ugspace.ug.edu.gh

27
CHAPTER THREE
3.0 METHODOLOGY
3.1 Study Area
The study was conducted at the Kassena Nankana West District. The district falls within
the Guinea Savannah woodlands of Ghana and generally a lowland with a rise and fall
landscape. The drainage system of the district is constituted mainly around the tributaries
of the Sissili River. It is one of its tributaries, the Asibelika River, which has been dammed
to provide the Tono Irrigation facility. The facility is the second irrigable land managed
by Irrigation Company of Upper Region (ICOUR). The scheme lies within latitude 10ᵒ
45’ N and longitude 1ᵒ W. It has a total area of about 3840 ha with an irrigable area 2490
ha. The source of water is from river Tono. The irrigation scheme is a storage based
gravity-fed irrigation system of which stored water from the dam is diverted to the fields
by gravity through large canal and lateral systems to various rice fields. The study was
conducted during the major season of 2014.
3.1.1 Study Framework
The study was conducted in three segments: a survey, a technology – verification
experiment on farmer fields and a laboratory experiment. The survey sought for farmers’
perception on causes of rice loss during harvesting, handling and the capable factors that
influence quantitative losses of rough rice at farm level. The technology – verification
experiment was carried out to assess the potential losses that do exist during shattering, in
– field staking, threshing and cleaning. The activities done at the laboratory sought to
measure the harvest moisture content of rough rice at the experimental fields.
University of Ghana http://ugspace.ug.edu.gh

28
The rice variety (Jasmine 85) frequently cropped by farmers on the scheme was used for
the study. On the selected fields, 2.25 m² quadrats were randomly set to determine
shattering losses whereas 25 m² quadrats were also randomly set on farmer fields to
determine the losses during in – field staking and threshing. The quadrats were replicated
thrice per the variety under study.
3.1.2 Sampling Technique and Sampling Size
A multi – stage sampling approach was adopted and used to select rice farmers. Upper
East Region was first and purposively selected because the region has over decades
produced rough rice in Ghana. The Tono Irrigation Project is situated in the suburb of
Navrongo and the intensive rice cultivation in the region is in the environs of Kassena
Nankana West District. It was then purposively selected in the secondary stage of
sampling. Six (6) communities were randomly sampled for the survey and 3 communities
used for the technology – verification experiment. The selection phase served as the third
stage of sampling. To conclude the sampling stage, a conventional statistical model,
n = N
1+N (α) ² (1)
Where; n=sample size; N=sample frame; and ɑ = margin of error, was used to derive the
sample size for the study. With reference to the number of households stated by Namara
et al. (2011), the project manages about 3,250 rice farmers across three districts: Builsa
South, Kassena Nanakana West and Kassena Nankan East, a sample size of 97 was
obtained using a margin error of 10%. At most 16 respondents were expected from each
of the randomly sampled communities for the survey. However, a sample size of 84 rice
University of Ghana http://ugspace.ug.edu.gh
29
farmers were willing to be interviewed from 6 different communities while 4 rice farmer
fields were sampled for the field experimentation using convenient sampling technique.
3.2 Survey
The perception of rice farmers at the catchment area of Navrongo and its environs on
quantitative losses of rice were pursued through a survey using a semi – structured
questionnaire (Appendix I). The survey was designed to seek farmers’ perception on
harvesting and handling losses; stages at which losses are incurred; general characteristics
of respondents, economic characteristics; estimation of the losses and factors influencing
the losses. The questionnaire was first pretested among farmers at Kapania before
administered to the 6 sampled communities.
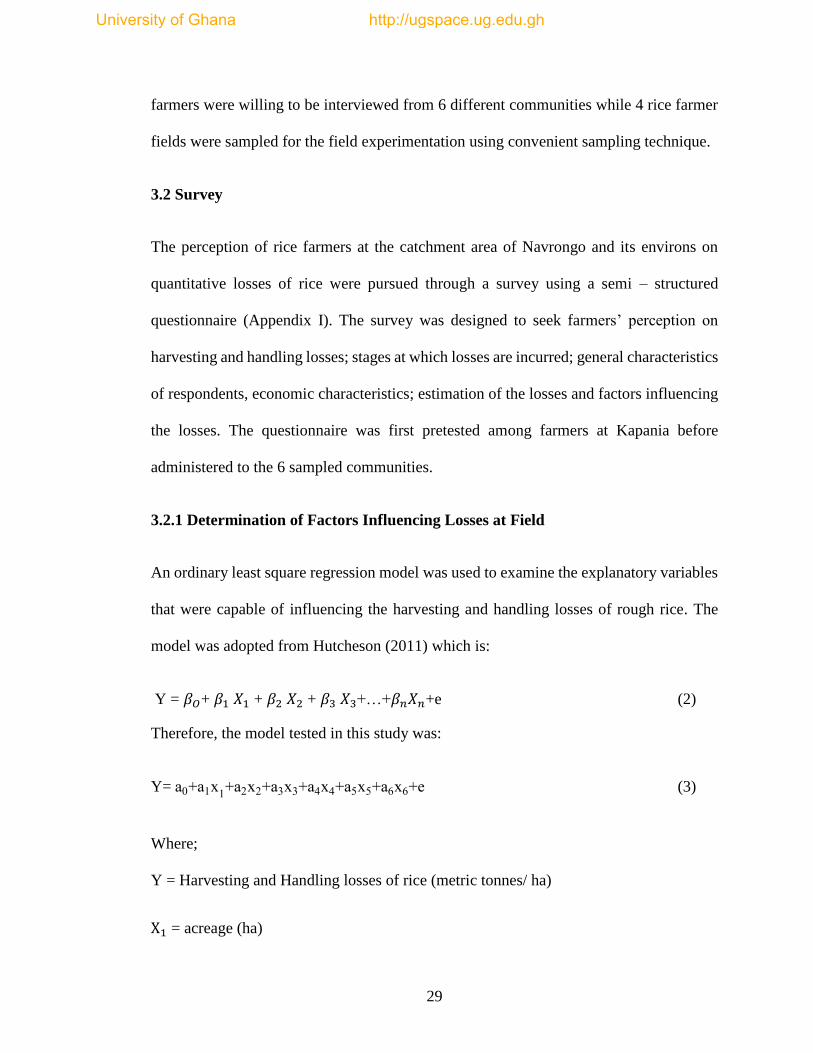
3.2.1 Determination of Factors Influencing Losses at Field
An ordinary least square regression model was used to examine the explanatory variables
that were capable of influencing the harvesting and handling losses of rough rice. The
model was adopted from Hutcheson (2011) which is:
Y = 𝛽𝑂+ 𝛽1 𝑋1 + 𝛽2 𝑋2 + 𝛽3 𝑋3+…+𝛽𝑛𝑋𝑛+e (2)
Therefore, the model tested in this study was:
Y= a0+a1x1+a2x2+a3x3+a4x4+a5x5+a6x6+e (3)
Where;
Y = Harvesting and Handling losses of rice (metric tonnes/ ha)
X1 = acreage (ha)
University of Ghana http://ugspace.ug.edu.gh

30
X2 = gender dummy takes ‘1’ male and ‘0’ female
X3 = farm education ‘1’ partake and ‘0’ otherwise
X4 = size of tarpaulin ‘1’ small ‘2’ medium ‘3’ large
X5 = threshability ‘1’ numerous threshing ‘0’ done once
X6 = labour (man-days), e = 0.05
∂Y/∂X1, ∂Y/∂X2, ∂Y/∂X5 > 0; while ∂Y/∂X3, ∂Y/∂X4, ∂Y/∂X6 < 0.
This indicates that acreage, gender and threshability are expected to be positively
significant while farm education, size of tarpaulin and labour are expected to be negatively
significant.
3.2.2 Ranking Challenges faced at farm level
Kendall’s Coefficient of Concordance was used to measure the degree of agreement
among the rankings of constraints by respondents using the rank scores of 1 to 6. The
challenges were ranked from the most pressing to least pressing as postulated by Legendre
(2010). The degree of agreement was estimated from the formula:
WC =∑ T2−(∑ T)2/n
n
m²(n2−1)
12
(4)
Where WC = Kendall’s Coefficient of Concordance
T = sum of ranks for each perception being ranked,
m = sample size
n = number of perception ranked
University of Ghana http://ugspace.ug.edu.gh

31
3.3 Determination of Quantitative Loss
Quantitative loss was determined by using the weigh in-weigh out approach data
collection form (Appendix II). In every procedure, the weight of known sample was
determined for each particular stage. The percentage loss for each procedure was
determined using Boxall (1986). It states that all residual rough rice at each stage during
the farmer’s own operation should be collected from the area under study over the
obtained yield of the same area. Therefore, the loss assessment at each procedure was
estimated using the formula:
Percentage Loss (%) = 𝑅𝑒𝑠𝑖𝑑𝑢𝑎𝑙 𝑅𝑜𝑢𝑔ℎ 𝑅𝑖𝑐𝑒
𝐴𝑡𝑡𝑎𝑖𝑛𝑒𝑑 𝑌𝑖𝑒𝑙𝑑 𝑜𝑓 𝐻𝑎𝑟𝑣𝑒𝑠𝑡𝑒𝑑 𝐴𝑟𝑒𝑎 × 100 (5)
3.3.1 Determination of Yields on Improved Harvesting and Farmer Practice
Six (6) quadrats of 2.25 m² were set randomly in 12 farmer fields. Plate 1 a and b shows
demarcation of a quadrat and three (3) demarcated quadrats set randomly at the farmer
field.
Plate 1 a Demarcation of a quadrat on farmer field, b. Three demarcated quadrats
set randomly at farmer field
a b
University of Ghana http://ugspace.ug.edu.gh

32
These quadrats were labeled as plot A while the remaining quadrats labeled as plot B.
Panicles were harvested from plot A at 35 Days After Heading (DAH) while panicles of
plot B were harvested during farmer’s actual harvesting time (42 Days After Heading).
The farmer’s actual harvesting time could be early or late harvesting. Panicles were
harvested by the use of sickle as shown in plate 2. This procedure as developed by
AfricaRice Centre in Benin was repeated for the other eleven (11) farmer fields. Yields at
different times from the 12 farmer fields were labeled as 35 DAH and Farmer’s actual
harvesting time respectively.
Plate 2 Panicles harvested from a quadrat
3.3.2 Determination of Shattering Losses during Cutting
In the 12 selected rice farms, a surveyor’s tape and wooden pegs were used to demarcate
quadrats with sides 1.5 m x 1.5 m. Sickle was used for harvesting because it is the most
adopted harvesting tool among the farmers. An experienced farmer was used to harvest
the panicles in the quadrats. Residual rice grains on the harvested area that dropped in the
plot were immediately collected, cleaned, and weighed separately into paper bags. The
University of Ghana http://ugspace.ug.edu.gh

33
weights of the residual rough rice represent the shattering losses. The total yield of the
quadrats was collected and weighed for each of the selected fields. The shattering loss in
the quadrats were determined by expressing weight of shattered rough rice as a percentage
of the total yield of all the quadrats. The shattering loss was then given by the mean of
shattering losses for all the selected fields.
3.3.3 Determination of In-Field Staking Losses during Handling
A quadrat method of 25 m2 was used for the determination of intermediary piling losses
for 12 farmer fields. Adopting the method used in the determination of shattering losses,
panicles were harvested in each quadrat. The harvested panicles were placed on tarpaulin
to trap rough rice that would have dropped into the soil as shown in plate 3.
Plate 3 In-field Staking
The bundled straws in each of the quadrats were collected, threshed, cleaned and the
subsequent weights recorded. The dropped rough rice on tarpaulin for each quadrat were
collected, cleaned, weighed and recorded. The recorded weights of rough rice that
dropped gives the in – field stacking loss as shown in plate 4.
University of Ghana http://ugspace.ug.edu.gh

34
Plate 4 Dropped rough rice on tarpaulin
The threshed kernels and the dropped kernels was the total yield of each quadrat under
study. The in – field stacking loss in each quadrat was expressed as weight of dropped
kernels on tarpaulin as a percentage of the total yield of the quadrat. The losses on a
particular farmer field was then expressed as a mean of in – field staking loss in the three
quadrats.
3.3.4 Determination of Losses during Threshing and Cleaning
A quadrat method of 25 m² was used for the determination of threshing and cleaning
losses. Plate 5 shows a farmer harvesting a 25 m2 on to a tarpaulin for threshing.
Plate 5 Staking panicles for threshing
Harvested rice straws were beaten by sticks as it is mostly practiced by the farmers.
Unthreshed and scattered rough rice losses were determined. Panicles were carefully
University of Ghana http://ugspace.ug.edu.gh

35
collected from 6 farmer fields using the traditional method of harvesting. A larger
tarpaulin was first laid on the threshing floor to trap scattered kernel due to the impact
force by the stick.
Plate 6 Farmers beating panicles with sticks
A farmer improvised tarpaulin was then laid on the larger tarpaulin. Harvested straws
were then placed on the farmer improvised tarpaulin for threshing as shown in plate 6.
The farmer threshed rough rice were collected, cleaned, weighed and recorded while
scattered and re-threshed kernels were also collected, cleaned, weighed and recorded as
presented in plate 7.
Plate 7 a Threshed rough rice from 25 m² quadrat; b Collected scattered and
Unthreshed rough rice
Straws were sorted and subjected to re – threshing. The kernels obtained from re –
threshing were cleaned, weighed and recorded. The farmer threshed rough rice, scattered
a b
University of Ghana http://ugspace.ug.edu.gh

36
and re – threshed rough rice were the total yield of each quadrant under study. Scattered
and re – threshed rough rice were obtained as a threshing loss. The percentage loss due to
scattering and re – threshed rough rice was obtained by expressing weight of the rough
rice loss as a percentage of the total yield of the farmer field. The procedure was repeated
for the other 5 farmer fields.
3.4 Determination of Harvest Moisture Content of Rough Rice
A quadrat method of 2.25 m2 was used for the determination of farmers’ harvest moisture
content. In each farmer field, the quadrats were triplicated. Harvested rough rice were
hand stripped, cleaned and were taken to the laboratory for moisture content
determination. The moisture content of harvested rough rice were taken using the
methodology adopted by Anwar (2010).
The sub-samples were collected from (12) farmer fields. Anwar (2010) stipulated that
samples must be crushed into powdery form. The powdered rough rice is to be kept in a
petri dish and placed in a microwave oven to have a preliminary idea on the efficiency of
the microwave. The samples were exposed to microwave radiation for 10 minutes. The
result was not favorable but was conducted for the second time. The second set of the
powdered rough rice were exposed to the microwave radiations at 7 minutes. The samples
were taken out and cooled in a desiccator containing silica gel for the purpose of cooling.
After the cooling period, an electronic digital scale (SP-10016204) with weight capacity
7 kg was used to measure the weight of the samples. Moisture content (w.b.) were
calculated using the formula:
University of Ghana http://ugspace.ug.edu.gh

37
% W = 𝐴−𝐵
𝐴 × 100 (6)
Where %W = Percentage of moisture in sample, A = weight of wet sample and B = weight
of dry sample
3.5 Statistical Analysis
Different analytical tools were employed for the various segments of the study. Statistical
Package for Social Sciences was used to analyse data obtained from the survey.
Descriptive statistics: frequency distribution, percentages, mean and tabular analysis were
used to analyze the socioeconomic characteristics of respondents and the constraints faced
by farmers. The t-test was used to determine statistical inferences of the parameters
measured from the technology – verification fields using GenStat Statistical Software 12th
edition.
University of Ghana http://ugspace.ug.edu.gh

38
CHAPTER FOUR
4.0 RESULTS
4.1 Quantitative Loss Assessment Survey
The result of this survey unveiled farmer’s perception on rice harvesting and handling
losses at Tono at the Kassena Nankana West District of Ghana. The survey will serve as
the bases for executing good policies to improve existing postharvest handling practices
in Ghana.
4.1.1 Socio-demographic Characteristics of Rice Farmers
Eighty-four (84) respondents were interviewed. Thirty-two 32 (38.1%) females and 52
(61.9%) males contributed to the study. A distribution of 51.2% (43) were not actively
into farm education (postharvest handling (PHH) and farm trainings). Yet, 48.8% (41)
were reported to have involved themselves in farm education.
Table 4. 1 Socio-demographic Characteristics of Respondents (n=84)
Variable Attributes Frequency Percentage
Gender
Male
Female
32
52
38.1
61.9
Farm Education Otherwise
Partake
43
41
51.2
48.8
Acreage 0.2
0.4
0.6
0.8
1.0
<1.60
2
26
19
20
9
8
2.4
31
22.6
23.8
10.7
9.5
Source: Field Data generated from Tono Irrigation Project, 2014 Major Season
University of Ghana http://ugspace.ug.edu.gh

39
4.1.2 Levels, causes and stages of Losses perceived by Farmers at Farm Level
Figure 1 shows that a proportion of 10.7% (9) of the respondents perceived to have lost
rough rice below (10%). Also, 22.6% (19) of the respondents’ level of losses ranged
between (10% - 19%) while 25.0% (21) of the respondents perceived to have lost paddy
within a postharvest loss of (20% - 29%). But majority of the respondents with a ratio of
41.7% (35) affirmed most of the losses were higher than (30%).
Figure 1 Levels of Postharvest Losses perceived by Farmers
Figure 2 presents the causes of postharvest losses that farmers encountered at farm level.
Forty-four 44 (52.4%) of the respondents affirmed that the level of losses was due to time
of harvest. But, 13 (15.5%), 15 (17.8%) and 12 (14.3%) of the respondents associated the
level of losses to lack of improved seeds, inappropriate planting methods and labour,
respectively.
10.7
22.6 25.0
41.7
0.0
10.0
20.0
30.0
40.0
50.0
<10% 10% - 19% 20% - 29% >30%
Pro
po
rtio
n o
f Fa
rmer
s (%
)
Level of Losses
University of Ghana http://ugspace.ug.edu.gh

40
Figure 2 Perception of causes of Postharvest Losses during rice cultivation by
farmers at Tono Irrigation Project
Figure 3 shows that threshing represented the stage where the highest amount of rough
rice was lost. Harvesting stage was also identified by 21 (25%) of the respondents.
Respondents that attributed losses to transportation of harvested rough rice were higher
(12, 14.3%) as compared to farmers that made reference to incomplete cutting of panicle
(8, 9.5%).
Figure 3 Farmers’ perception about Stages where Losses occur at Farm Level
4.1.3 Rice Output, Yield gap, Revenue and Postharvest Losses at 6 Communities
Table 4.2 shows that on an average, 0.68 ha field was under rice cultivation. The total
output of rice obtained was averaged at 1855.24 kg (2.7283 mt/ha). Farmers saved an
15.5 17.8
52.4
14.3
0.010.020.030.040.050.060.0
Lack ofimproved seeds
PlantingMethods
Time of harvest Labour
Pro
po
rtio
n o
f Fa
rmer
s
Causes of Postharvest Losses
25.0
14.3
51.2
9.5
0.010.020.030.040.050.060.0
harvesting Transportation Threshing In completecutting
Pro
po
rtio
n o
f Fa
rmer
s (%
)
Point of Losses
University of Ghana http://ugspace.ug.edu.gh

41
average rough rice of 481.90 kg (0.708 mt/ha) while a quantity of output lost was 443.81
kg (0.652 mt/ha). Therefore, the output saved for household was not significantly different
(P>0.05) from the output that was lost to the soil.
Table 4. 2 Rough Rice Output and Postharvest losses
Variable 2014 Major Season
Farm Size (ha)
Quantity Produced (mt/ha)
Quantity saved (mt/ha)
Quantity Lost (mt/ha)
Quantity Sold (mt/ha)
Unit Price (GHS; US$/0.16 mt)
Actual Revenue Obtained (GHS; US$)
Value of Loss (GHS; US$)
Potential Revenue (GHS; US$)
0.6833
2.7283
0.7087 (25.9%)
0.6527 (23.92%)
2.0336
200; 57.14
2,542; 726.29
815.88; 233.11
3,410.38; 974.29
Source: Obtained from field Data in the 2014 Major Season
Farmers sold a bag of rough rice (160 kg) for GHS 200.00 (US$ 57.14) and made an actual
revenue of GHS 2,542 (US$ 726.29). The monetary terms of rough rice lost to the soil
was valued at GHS 815.88 (US$ 233.11) as shown in Figure 4.
Figure 4 Actual Revenue obtained and potential revenue from a hectare of Rough Rice
Yogbania, Yigwania, Wuru, Biu, Bonia and Korania were communities subjected to be
studied for postharvest loss estimation. Table 4.3 shows that Bonia was recorded to have
produced the highest total output of rough rice (39.68 mt), than Yigwania, which produced
3410.38
815.88
2542
0
1000
2000
3000
4000
PotentialRevenue
Value of Loss Actual RevenueObtained
Am
ou
nt
(GH
S)
University of Ghana http://ugspace.ug.edu.gh

42
the least output (15.68 mt). Production of rough rice estimated during the study was
155.84 mt while 37.28 mt was estimated as the total losses of rough rice lost at farm level.
Therefore, the total postharvest loss during the survey was estimated at 23.92%. The
estimated yield gap at the community level was 0.51 mt/ha with a value of GHS 637.50
(US$ 182.14) as presented in Table 4.4.
Table 4. 3 Total Production of Rough Rice and Losses at 6 Communities
Source: Field Data Source: generated from Tono Irrigation Project, 2014 Major Season
Table 4. 4 Estimate of Yield Gaps at 6 Communities
Community Mean Yield at
Tono (mt/ha)
Mean Yield at
Community Level
Yield Gaps
(mt/ha)
Yogbania
Yigwania
Wuru
Biu
Bonia
Korania
3.2
3.2
3.2
3.2
3.2
3.2
2.75
2.42
2.78
2.65
2.78
2.79
0.45
0.78
0.42
0.55
0.42
0.41
Average 2.7 0.51 (18.8%)
Source: Field Data generated from Tono Irrigation Project, 2014 Major Season
4.1.4 Factors Influencing Harvesting and Handling Losses
Table 4.5 presents that acreage, gender, farm education and labour were found to
significantly influence the level of harvesting and handling losses at the study area. The
regression model was statistically significant at 1%, and the proportion of variance in the
Community Total Production of paddy
(mt)
Total Losses of
paddy (mt)
Yogbania
Yigwania
Wuru
Biu
Bonia
Korania
17.6
15.68
22.08
28.64
39.68
32.16
4
4.64
5.28
8.16
6.72
8.48
Total 155.84 37.28
University of Ghana http://ugspace.ug.edu.gh
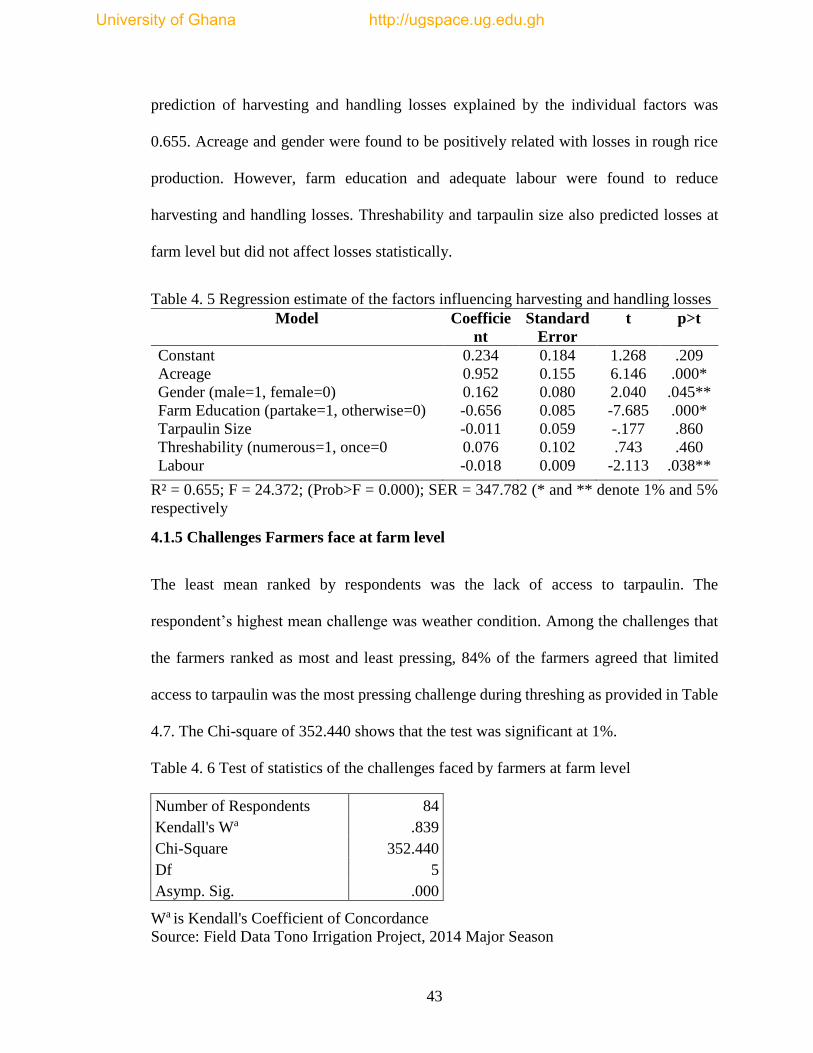
43
prediction of harvesting and handling losses explained by the individual factors was
0.655. Acreage and gender were found to be positively related with losses in rough rice
production. However, farm education and adequate labour were found to reduce
harvesting and handling losses. Threshability and tarpaulin size also predicted losses at
farm level but did not affect losses statistically.
Table 4. 5 Regression estimate of the factors influencing harvesting and handling losses
Model Coefficie
nt
Standard
Error
t p>t
Constant
Acreage
Gender (male=1, female=0)
Farm Education (partake=1, otherwise=0)
Tarpaulin Size
Threshability (numerous=1, once=0
Labour
0.234
0.952
0.162
-0.656
-0.011
0.076
-0.018
0.184
0.155
0.080
0.085
0.059
0.102
0.009
1.268
6.146
2.040
-7.685
-.177
.743
-2.113
.209
.000*
.045**
.000*
.860
.460
.038**
R² = 0.655; F = 24.372; (Prob>F = 0.000); SER = 347.782 (* and ** denote 1% and 5%
respectively
4.1.5 Challenges Farmers face at farm level
The least mean ranked by respondents was the lack of access to tarpaulin. The
respondent’s highest mean challenge was weather condition. Among the challenges that
the farmers ranked as most and least pressing, 84% of the farmers agreed that limited
access to tarpaulin was the most pressing challenge during threshing as provided in Table
4.7. The Chi-square of 352.440 shows that the test was significant at 1%.
Table 4. 6 Test of statistics of the challenges faced by farmers at farm level
Number of Respondents 84
Kendall's Wa .839
Chi-Square 352.440
Df 5
Asymp. Sig. .000
Wa is Kendall's Coefficient of Concordance
Source: Field Data Tono Irrigation Project, 2014 Major Season
University of Ghana http://ugspace.ug.edu.gh

44
Table 4. 7 Mean ranks of challenges faced at farm level
Challenges Mean Rank
Limited access to tarpaulin
Limited access to credit
Labour
Fungal Disease
Bird Scaring
Weather
1.50
1.96
2.72
3.89
5.21
5.67
1
2
3
4
5
6
Source: Field Data Tono Irrigation Project, 2014 Major Season
4.2 Yield of Paddy at Different Times of Harvest
Table 4.8 gives a summary of the yields obtained for the two harvesting times. The
comparison of yield levels of the two harvest time is presented in Figure 5.
Table 4. 8 Yields at 2 different harvesting times
Harvesting Times Minimum
(mt/ha)
Maximum
(mt/ha)
Mean
(mt/ha)
Standard
Deviation
35 DAH
Farmer Time of
Harvest
3.5
2.3
6.4
5.4
4.8
3.7
0.96
1.2
Source: Generated from the experimental fields, DAH (days after heading)
Figure 5 Comparison of yields at harvesting times
1
2
3
4
5
6
7
1 2 3 4 5 6 7 8 9 10 11 12
Me
tric
To
nn
es
Pe
r H
ect
are
Number Of Farmers
35 Days after Heading Farmers Date of Harvest
University of Ghana http://ugspace.ug.edu.gh

45
4.2.1 Losses at 35 Days after Heading (35DAH)
4.2.1.1 Shattering Losses at 35 Days after Heading (35DAH)
Table 4.9 summarizes the extent of losses that occurred at farmer fields. The losses to
shattering has been detailed in Appendix III. The study uncovers that, weight of rough
rice that shattered at (3) three different laterals were the same (P>0.05).
Table 4. 9 Descriptive statistics of shattered rough rice at 35 days after heading (35DAH)
Parameters Minimum
Maximum
Mean Standard
Deviation
Threshed Paddy (kg)
Dropped Paddy (kg)
Yield at Quadrant (kg)
Shattered Loss (%)
0.925
0.002
0.927
0.21
1.895
0.011
1.906
0.88
1.29
0.006
1.296
0.44
0.28
0.0028
0.28
0.23
Source: Field Data Tono Irrigation Project, 2014 Major Season
4.2.1.2 In – Field Stacking at 35 Days after Heading (35DAH)
Table 4.10 shows the effect obtained under the investigation of intermediary piling loss.
The piled panicles amassed an average yield of 14.404 kg/25 m² (5.8 mt/ha), of which
0.128 kg/25 m² was estimated as an intermediary piling loss. The overall losses for
intermediary piling loss was estimated to range within 0.32 - 1.82% but gave an average
piling loss of 0.88%. The experimental fields show that percentage weights at the three
(3) laterals were not significantly different (P>0.05).
Table 4. 10 Descriptive statistics of in – field Stacking Losses at 35 days after heading
(35DAH)
Parameters Minimum Maximum Mean Standard
Deviation
Threshed Paddy (kg)
Dropped Paddy on
Tarpaulin(kg)
Yield at Quadrant (kg)
In – field Staking Loss (%)
10.27
0.051
10.403
0.32
21.02
0.319
21.281
1.82
14.23
0.128
14.40
4
0.88
3.2
0.09
3.3
0.5
Source: Field Data Tono Irrigation Project, 2014 Major Season
University of Ghana http://ugspace.ug.edu.gh

46
4.2.1.3 Threshing Losses at 35 Days After Heading (35DAH)
Table 4.11 summarizes the average estimate of threshing loss as 4.4%. Threshing losses
were estimated from losses that occurred through scattering of rough rice as a result of
beating with sticks and incomplete removal of rough rice from panicles. The incomplete
removal of rough rice resulted a loss ranging from 0.05 to 0.83% while the losses due to
scattering ranged from 0.054 to 0.683%. The threshing loss was in the range of 1.26 -
9.9% as detailed in Appendix III.
Table 4. 11 Descriptive statistics of threshing Losses at 35 days after heading (35DAH)
Parameters Minimum Maximum Mean Standard
Deviation
Re-threshed and Scattered Paddy (kg)
Yield at Quadrant (kg)
In – field Staking (threshing) Loss
(%)
0.149
11.81
1.26
1.34
16.51
9.9
0.62
14.10
4.4
0.5
1.9
3.3
Source: Field Data Tono Irrigation Project, 2014 Major Season
4.2.1.4 Overall Losses at Farmer Fields at 35 Days after Heading (35DAH)
Table 4. 12 summarizes the losses that occurred at shattering, in – field staking and
threshing as obtained at the experimental fields during the 2014 major cropping season.
The overall field loss studied at 35 days after heading resulted as 1.79 – 11.34%.
Table 4. 12 Overall Losses studied at 6 Farmer Fields
Point of Losses Percentage Losses
Shattering
In – Field Staking
Threshing
Total
0.21 – 0.88
0.32 – 1.82
1.26 – 9.9
1.79 – 11.34
Source: Field Data Tono Irrigation Project, 2014 Major Season
University of Ghana http://ugspace.ug.edu.gh

47
4.2.2 Losses at Farmer Time of Harvest (42 Days After Heading)
4.2.2.1 Shattering Losses (42 Days After Heading)
The output from the quadrat area yielded 0.809 kg. The average shattered rough rice
during farmer time (42 days after heading) of harvest ranged from 0.110 kg to 0.250 kg.
This gave a shattering percentage loss of 1.96%. Table 4. 13 presents the descriptive
statistics on the parameters studied during farmer time of harvest.
Table 4. 13 Descriptive statistics of shattered rough rice at farmer time of harvest
Parameters Minimum Maximum Mean Standard
Deviation
Threshed Paddy (kg)
Dropped Paddy (kg)
Yield at Quadrant (kg)
Shattered Loss (%)
0.558
0.110
0.574
1.18
0.925
0.250
0.939
2.91
0.794
0.016
0.809
1.96
0.1127
0.0044
0.1127
0.6065
Source: Field Data Tono Irrigation Project, 2014 Major Season
4.2.2.2 In-field Staking Losses (42 Days After Heading)
The quadrat yielded a mean output of 12.464 kg of rough rice with an intermediary loss
trapped on tarpaulin was 0.159 kg to 0.453 kg. The in-field staking loss was estimated at
2.53% as presented in Table 4. 14
Table 4. 14 Descriptive statistics of in – field Stacking Losses at farmer time of harvest
Parameters Minimum Maximum Mean Standard
Deviation
Threshed Paddy (kg)
Dropped Paddy on Tarpaulin(kg)
Yield at Quadrant (kg)
In – field Staking Loss (%)
9.266
0.159
9.503
1.32
19.018
0.453
19.380
3.59
12.156
0.308
12.464
2.53
2.907
0.082
2.941
0.671
Source: Field Data Tono Irrigation Project, 2014 Major Season
University of Ghana http://ugspace.ug.edu.gh

48
4.2.2.3 Threshing Losses (42 Days After Heading)
The threshing loss at farmer time (42 days after heading) of harvesting rough rice was
estimated at 5.92% with a loss within the range of 0.506 kg to 0.845 kg. Table 4. 15
summarizes the extent of loss during threshing.
Table 4. 15 Descriptive statistics of threshing Losses at farmer time of harvest
Parameters Minimum Maximum Mean Standard
Deviation
Re-threshed and Scattered Paddy (kg)
Yield at Quadrant (kg)
Threshing Loss (%)
0.506
10.490
4.04
0.845
12.511
7.97
0.652
11.336
5.92
0.16
0.84
1.52
Source: Field Data Tono Irrigation Project, 2014 Major Season
4.2.2.4 Overall Losses at Farmer Fields (42 Days After Heading)
Table 4. 16 shows the losses that occurred at the experimental fields. The losses that
occurred at different point of losses during harvesting and handling has been detailed in
Appendix III.
Table 4. 16 Overall Losses studied at 6 Farmer Fields
Point of Losses Percentage Losses
Shattering
In – Field Staking
Threshing
Total
1.18 – 2.91
1.32 – 3.59
4.04 – 7.97
7.80 – 12.75
Source: Field Data Tono Irrigation Project, 2014 Major Season
4.2.3 Summary of Losses at 3 different points
Table 4. 17 shows the comparison of two (2) different harvesting times: 35DAH and the
farmer practice (42 days after heading). The overall losses for 35 days after heading and
the farmer practice (42 days after heading) were 5.88 ± 3.47 and 10.35 ± 1.94 respectively.
University of Ghana http://ugspace.ug.edu.gh

49
Table 4. 17 Comparison of Losses at 3 different point of losses
35 Days after Heading 42 days after heading
Point of Losses % mean loss % mean loss
Shattering
In-field Staking
Threshing
Overall Losses
0.44 ± 0.23
0.88 ± 0.43
4.4 ± 3.33
5.88 ± 3.47
1.96 ± 0.61
2.53 ± 0.67
5.92 ± 1.52
10.35 ± 1.94
Source: Field Data Tono Irrigation Project, 2014 Major Season (DAH days after heading)
means ± standard deviations
4.3 Harvest Moisture Content of Rough Rice at Tono Irrigation Project
Table 4. 18 shows the harvest moisture content (HMC) at farm level. The result ranged
within 17.1% - 24.7%. The mean moisture content was 20.88 ± 2.56. Thus, the mean
moisture content was not significantly different (P>0.05) from the optimal moisture
content (22%) as provided in Appendix III.
Table 4. 18 Experimental Results for Harvested Rough Rice at 12 Farmer Fields
Farmer
Fields
Weight of wet
powdered
sample
(g)
Weight of dry
powdered
samples
(g)
Moisture
Removed
(g)
Moisture
Content w.b.
(%)
1
2
3
4
5
6
7
8
9
10
11
12
9.86
9.86
9.86
10.04
9.98
10.08
9.56
9.85
10.02
9.98
10.05
10.03
7.77
7.43
8.12
7.68
8.12
7.79
7.75
7.80
7.73
8.27
8.03
7.93
2.09
2.43
1.74
2.36
1.86
2.29
1.81
2.05
2.29
1.71
2.02
2.1
21.2
24.7
17.6
23.5
18.6
22.7
18.9
20.8
22.9
17.1
20.1
20.9
Source: Laboratory Data, 2014 Major Season (w.b. wet basis)
University of Ghana http://ugspace.ug.edu.gh

50
CHAPTER FIVE
5.0 DISCUSSION
5.1 Qualitative Loss Assessment Survey
5.1.1 Socio-demographic Characteristics of Rice Farmers
The gender distribution in this study shows that the males have purposefully made rice
farming as a livelihood as acknowledged by Donkor and Owusu (2014). Larger proportion
of males are into the production of rice and most of the males worked with their spouses
as confirmed by Enwerem and Ohajianya (2012). By observation, majority of the females
were more involved in postharvest activities than owning a rice field. The observation
made in the study area agreed with the findings documented by Rural Livelihood
Development Company (2009). Also, the observation made during the study was also
similar to the observation made by Akande et al. (2007) and WARDA et al. (2008).
The ratio of farmers that did not participate in farm education (51.2%) were higher than
the ratio that did participate in farm education programs (48.8%). This suggests that even
though the majority of farmers were involved in farm education programs, generally the
participatory level was low. From observation, activities of Farmer Based Organizations
(FBOs) are well absorbed in the area of study, but it appeared some individual farmers
did not fully take the advantage of the organization. The only advantage such category of
famers got from the Community Based Organizations (CBOs) was the access to farm
souvenirs and subsidized inputs. The observation made was in agreement with the
findings of Mansuri and Rao (2004). Babalola et al. (2010) underlined that, a farmer’s
membership to a community based organization was when the farmer had the interest to
access market after harvest of which the findings of this study has affirmed. But the
University of Ghana http://ugspace.ug.edu.gh

51
establishment of community organizations pertaining to farm activities was intended to
improve the capacity of its members and not only to access credit and markets.
It was also noted that rice farmers were predominantly small scale farmers. The study
buttresses that rice farmers cultivated on smaller farm sizes. The work reveals that 31%
of the rice farmers cultivate on a farm size of 0.4 ha while 23.8% of the same respondents
cultivate on farm size of 0.8 ha. Therefore, the land size in the study area did not contradict
the report by MOFA (2011). That is, the average land size of 0.68 ha implies that
agricultural farm lands have decreased overtime as stated by Hazell et al. (2010) which
reported that due to increasing nonagricultural activities; there has been a reduction of
agricultural land size. Also, the result (0.68 ha) is similar to the finding Onoja and Herbert
(2012) which stated that an average farm size is at 0.6 ha.
5.1.2 Levels and causes of Losses perceived by Farmers at Farm Level
The level of losses outlined by farmers were guessed estimates but farmers were aware
that losses did occur at farm level. Among the respondents, majority (41.7%) perceived
to loose rough rice above 30%. But, the quantitative loss estimation made during the
survey which was approximately 24% was not in agreement with the estimates made by
the majority of rice farmers (41.7%) in the study area. The survey shows clearly that there
was a significant difference between the losses estimated by the respondents. In addition,
this implies that farmers did not know how to measure field losses.
Farmers attributed the level of losses to four (4) major causes. Majority of the farmers
(52.4%) considered inappropriate time of harvesting to be the major cause of reducing the
output of rice at farm level. Farmers of this proportion suggested that, adoption of Good
Agronomic Practices (GAPs) with appropriate inputs such as improved seeds were good
University of Ghana http://ugspace.ug.edu.gh

52
for rice farming. They also established that, time of harvest was the main cause of losses;
and showed concern that, appropriate time to harvest was a challenge at farm level. Their
concern was not conflicting the findings of Doi et al. (2013).
Apart from farmers showing huge concern to inappropriate time of harvesting; a
proportion of the farmers (17.8%) associated the losses to unsuitable planting methods.
Therefore, the least group of the respondents attributed harvest and handling losses to
planting methods, plant density and spacing. This implies that competition in rice field
will lessen the optimal yield. Comparatively, a group of the respondents (14.3%)
associated losses of rough rice to inadequate labour. The farmers suggested that losses
pertaining to labour was also intentional on the side of the workforce. This was
characterised by the social behaviour of women during harvesting and threshing. The
assertion made by 14.3% of the rice farmers confirmed the observation made by Candia
et al. (2012). These women exhibit the behaviour of not threshing the straws thoroughly
so as to benefit from the unthreshed straws. This also encourages gleaners to garner
around, pick the unthreshed straws and the incomplete cut of rice stands in the field for
threshing. The threshed paddy by gleaners store the rough rice as a household meal.
5.1.3 Rice Output, Revenue and Postharvest Losses at 6 Communities
The average harvested rough rice during the 2014 major season survey was approximately
2.73 mt/ha. Still, the obtained rough rice during the survey was not different from the
yield of rough rice produced in the last 5 years as documented by MOFA (2011).
Meanwhile, the Statistical Research Institute Department (SRID) of MOFA estimated an
achievable yield of rough rice to about 6 mt/ha. The estimation shows that the study area
University of Ghana http://ugspace.ug.edu.gh

53
was not able to achieve half of the nation’s targeted rice output. Moreover, the output
obtained from the study area (2.73 mt/ha) was not similar to the average yield of Jasmine
85 (3.2 mt/ha) as Takeshima et al. (2013) highlighted in a survey at Tono. The yield gap
contributed by biotic and abiotic constraints was estimated at 0.51 mt/ha. In addition, from
2009 to 2011 the average yield of rice output at Tono Irrigation Project was estimated at
3.12 mt/ha as stated by Ragasa et al. (2013). But, the surveyed output (2.7 mt/ha) did not
conform to the yield (3.12 mt/ha). This suggests that, farmers were not able to access
enough amount of inputs such as fertilizers to maintain the yield recorded by Ragasa et
al. (2013); because there has been a reduction of rice output in the 2014 major cropping
season.
Practically, farmers saved some part (26%) of their annual yield for domestic consumption
or seeds for the next production season. The result estimated in the study area was not
dissimilar from Mishra et al. (2012) which reported that farmers save some rough rice for
household consumption. This implies that the head of household keeps some rough rice
to feed his or her family in the long run. Also, Fu et al. (2010) stated that farmers select
disease free panicles prior to threshing for the next planting season. However, the decision
for farmers to keep disease free rough rice for the next planting season does not guarantee
an optimum yield; this is so because the true foundation of the seed might have been lost
and has resulted as grain but not a seed.
Farmers lose some amount of rough rice to the soil. It was postulated that the average
quantity of rough rice saved for household will not significantly be different from the
quantity of rough rice that would be lost during harvesting and handling. This hypothesis
confirms that rough rice saved for household consumption (0.7087 mt/ha) was not
University of Ghana http://ugspace.ug.edu.gh
54
significantly different (P>0.05) from the rough rice lost to the soil (0.6527 mt/ha).
Besides, the amount of rough rice that could have been saved for domestic consumption
was equally lost.
An average yield was estimated at 2.73 mt/ha for the 2014 major cropping season. The
output lost at field during the same season was valued at GHS 815.88 (US$ 233.11). This
represented a loss of 23.92% of the harvested output at the study area. This per cent loss
implies that rice farmers had to receive 76% of the total production. But, farmers received
50% of the total production. The finding correlates with the assertion made by Fu et al.
(2010) which highlighted that farmers always sell half of harvested rough rice after a
cropping season. This study also agrees with the finding studied by Ininda (2008) which
also reported that about 50% of farmers produce are sold on the market. Also, 26% of the
production went into domestic consumption. Most of the farmers showed intentions of
selling some saved bags during the off season. The percentage loss (24%) estimated
conformed to the result obtained for West Africa by FAO (2007) which computed a 24%
weight loss of rice as field loss. The results of this study is also similar to the findings
obtained by World Bank et al. (2011) and Hodges (2012). In addition, the estimated loss
from the survey was also similar to the documents that were reviewed by Affognon et al.
(2015) which reported that physical losses of rice was lost at 25.6% without any
intervention at farm level.
5.1.4 Factors Influencing Harvesting and Handling Losses
The F – statistic was statistically significant which indicated that the regression model
was a good fit. This implies that the explanatory variables in the regression model had a
significant and common influence on the extent of losses that did occur during harvesting
University of Ghana http://ugspace.ug.edu.gh

55
and handling at farm level. An approximate 66% of the variation in the quantity of rough
rice lost at farm level during harvesting and handling was explained by the specific
variables in the model.
Acreage had a highly significant effect (P<0.01) on the level of harvesting and handling
losses in the study. Generally, larger agricultural land size has the capacity of giving
higher output. Therefore, increase in an acre of land size has the tendency to make farmers
face high losses at farm level. This is so because the land size requires a large number of
workforce to work on the field. Even when, the farmer has a large number of workforce
to engage during harvesting; handling of the panicles will become a problem because the
workforce has to cover a larger area and most often in a day. From the model, it was
estimated that 0.952 mt of rough rice was capable of going lost at farm level. The findings
obtained in this study is in line with the findings of Basavaraja et al. (2007) and Enwerem
and Ohajianya (2012).
Gender also had a significant effect (P<0.05) on harvesting and handling losses. The
harvesting and handling losses were estimated to reach 0.162 mt of rough rice. This study
shows that as the number of male farmers’ increase in rice farming, male farmers will still
encounter some extent of losses at field but their fellow counterparts (females) were
expected to experience less losses. This suggests that irrespective of gender, a farmer is
capable of encountering losses in rice production. This study disagrees with Babalola et
al. (2010) which stated that gender and losses had no effect. In addition, to minimize the
occurrence of losses, interventions should target the gender perspective and its equality
as documented by Rural Livelihood Development Company (2009).
University of Ghana http://ugspace.ug.edu.gh

56
Farm education enhances farmers’ knowledge towards harvesting and handling of rough
rice. For instance, the variable under examination indicated statistically that, there was
also a highly significant effect (P<0.01) on losses with a tendency to reduce harvesting
and handling losses of about 0.656 mt. It implies that farm education will demonstrate a
significant role in rice farming as it has been affirmed by Wang et al. (1996) and Seyoum
et al. (1998). In addition, Hasnah et al. (2004) reported a significant and positive impact
of farm education on agricultural activities while Ganpat and Sespersad (1996) stressed
that farmers’ consistent interaction with information influences the adoption behaviour of
farmers.
Therefore, Farmer Field Schools will significantly improve farmers’ understanding and
build the knowledge of farmers as documented by Asfaw and Admassie (2004), Lunduka
et al. (2013) and Weir and Knight (2004). Anderson and Feder (2007) established that,
when farmers are engaged on farmer field schools, there would be a reflective learning,
aiming to improve the capacity of farmers. Instances where this approach is involved
among rice farmers, there will be high tendency to reduce the losses that do occur at farm
level. Therefore, it is the trainings that has an effect on rough rice output especially when
the farmer has the urge to adopt what has been taught.
Also, harvesting and handling losses was statistically significant (P<0.05) to labour. As
labour increases by a man – day, there will be a reduction in a loss of rough rice at 0.018
mt. The outcome as estimated in the model agrees with Basavaraja et al. (2007) which
reported that adequate labour exerted a reduction influence on postharvest losses. This
study suggests that, when farmers engage enough labour into contract harvesting
University of Ghana http://ugspace.ug.edu.gh

57
alongside with the household workforce, the losses that do occur during harvest will be
minimised.
Tarpaulin size was able to help reduce losses of 0.011 mt/ha but statistically insignificant
to the losses that do occur during harvesting and handling. Also, threshability had no
effect of reducing losses and was also insignificant to losses at farm gate.
5.1.5 Challenges Farmers face at farm level
The major challenges reported by respondents in the study area included bird scaring,
incidence of fungal disease, limited access to finance, accessibility to tarpaulin, labour
and weather conditions. Accessibility to tarpaulin was the least mean score (1.50) and the
most pressing challenge faced at farm level. It was clear that respondents did not have a
problem with the weather condition during production and post-production stages. This
led to a situation where respondents ranked it as the least (5.67) pressing challenge during
and after production. This was because farmers had access to the irrigation water from the
Tono Dam.
The Kendall (Wa ) was 0.839. This infers that the degree of agreement among the rankings
of the challenges encountered at farm gate was approximately at 84%. This was also
evidently shown by the P-value of 0.000. Therefore, there was a significant agreement
among the ranking of challenges.
5.2 Yield of Paddy Harvested at Different Times of Harvesting
A survey by Takeshima et al. (2013) document reported that the average yield of Jasmine
85 rice was measured at 3.2 mt/ha. From this study, the improved time of harvesting (35
DAH) yielded a mean output of 4.8 ± 0.96 mt/ha. The achieved yield surpassed the yield
University of Ghana http://ugspace.ug.edu.gh

58
that was reported by MOFA (2007). The potential yield can be increased through
enhancements in sustainable practices, adoption of underutilized and profitable
technologies as stated by Ragasa et al. (2013); for example row planting, optimal plant
density and spacing has not been well adopted by farmers in most rice growing
communities. The yield obtained under improved time of harvesting (35 DAH) can be
improved upon to its maximum potential yield. Yet still the estimated output was in the
range of 4.5 mt/ha to 8 mt/ha as Ragasa et al. (2013) reported. In contrast, the farmer
practice (42 DAH) gained a mean yield of 3.7 mt/ha which was not different from the
average yield of jasmine 85 as stated in the survey conducted by Takeshima et al. (2013).
From the hypothesis, the analysis confirms that the outputs were significantly different
(P<0.05). This implies that harvesting at 35 days after heading is a sustainable method to
harvest rough rice at farm level. The study is in line with the document by Lantin (1999)
which established that, the date of physiological maturity of rough rice is within 28 to 34
days after heading. Therefore, this period was an optimum harvest time to collect panicles
from the field. This study is also not different from the study conducted by Hossain et al.
(2009), which stated that harvesting aromatic rice at 30 to 35 days after heading is suitable
for higher grain quality in respect to head rice yield.
5.2.1 Shattering Losses
The shattering loss (35DAH) was estimated to be within a range of 0.21% - 0.88% while
the farmer time of harvest (42 DAH) gave a range of 1.18% – 2.91%. The results show
that farmers at the catchment area of the Tono Irrigation facility that cultivated Jasmine
85 variety lines lost 0.44% of their production as shattering losses (35 DAH) to the soil
but that of the farmer practice (42 DAH), the shattered rough rice accounted a percentage
University of Ghana http://ugspace.ug.edu.gh

59
loss of 1.96. The loss estimated for shattering (farmer practice) of Jasmine 85 is similar
to 1.56% shattering loss as recorded by Candia et al. (2012). This implies that the more
the rice plant continues to be in the field, the more it has the ability to shatter.
At the time of this study, the average yield of Jasmine 85 at the Tono was 3.2 mt/ha. The
improved harvest time (35 DAH) gave a loss of 0.014 mt/ha. In comparison to the famer
practice (42 DAH), the amount of rough rice lost was 0.063 mt/ha.
The result obtained in this study for shattering loss (35DAH) was different from the
findings of Candia et al. (2012). The study of Candia et al. (2012) affirmed that the variety
under study had a shattering property but in this assessment, when the rough rice was
harvested a bit late, it shattered even more than the ‘Kaiso’ variety that Candia et al.
(2012) studied.
The minimum shattered kernels (35DAH) amassed to 0.002 kg/2.25 m² (0.008 mt/ha),
whilst the maximum rough rice that shattered was 0.011 kg/2.25 m² (0.05 mt/ha). The
losses that were estimated by Calverley (1994) during cutting for some Asian countries
were higher than the estimated shattering loss (35DAH). In contrast, the shattered rough
rice during the farmer practice showed a minimum loss of 0.110 kg/2.25 m² (0.5 mt/ha)
and a maximum loss of 0.250 kg/2.25 m² (1.1 mt/ha). This study suggests that farmers at
the study area encountered huge loss at the cutting base.
5.2.2 In – field Losses
After cutting the matured panicles, farmers primarily pile the panicles in small mounts,
the effect of the practice resulted to some quantity of physical loss. The intermediary
piling losses of rough rice (35DAH) was estimated in the range of 0.32% – 1.82%. An
University of Ghana http://ugspace.ug.edu.gh

60
average rough rice of Jasmine 85 lost due to small mounts of piled panicles in – field was
0.88% (0.028 mt/ha). To compare with the farmer practice, the assessment shows that, the
estimated loss for in-field staking was 1.32% - 3.59%. The mean of in-field staking loss
was estimated at 2.53% (0.08 mt/ha).
Since, harvesting entails two points; which includes cutting leading to shattering and
placing cut panicles in small mounds. These two points were classified as harvesting.
Therefore, the harvesting loss (35DAH) that was studied in the catchment area was
estimated as 1.32%, in comparison, the harvesting loss during farmer practice (42 DAH)
was 4.49%. This indicates that, the harvest loss (35DAH) of Jasmine 85 was estimated as
an average of 0.042 mt/ha, but the farmer practice (42 DAH) gave an estimate of 0.143
mt/ha. Therefore, the percentage loss of harvest (35DAH) was not different from the loss
of panicle harvesting method as studied by Appiah et al. (2011). The loss figure did not
surpass 3% but was in the range of 1% and 3% as reported for South East Asia (FAO,
1997). In addition, Hodges et al. (2010) indicated that 1% - 5% was estimated as a result
of cutting and handling. This study for both practices was in the range of percentage loss
during harvesting. Yet, the less percentage loss was more sustainable to practice.
5.2.3 Threshing Losses
The average threshing loss includes losses due to incomplete removal of rough rice from
cut panicles and scattered rough rice due to the exerted force by the beating stick. With
reference to the average yield of Jasmine 85 at Tono, the result implies that the minimum
and maximum threshing losses of improved practice (35 DAH) was estimated at 1.26%
(0.040 mt/ha) and 9.9% (0.32 mt/ha) respectively with a mean loss of 4.4% (0.141 mt/ha).
University of Ghana http://ugspace.ug.edu.gh

61
Candia et al. (2012) generated a threshing loss of 4.7%, and it was similar to the threshing
loss that had been estimated in this study.
In contrast, the threshing loss of farmer practice (42 DAH) was estimated at 4.04% (0.129
mt/ha) to 7.97% (0.255 mt/ha). Therefore, the threshing loss yielded a mean loss of 5.9%
(0.19 mt/ha). But, the average threshing loss experienced by Asian farmers was 3.38%
(FAO, 2002, 2007); the threshing loss in this study was closely related to the findings
obtained among the Asian farmers. FAO (1997), indicated that 2% - 7% of losses was
attributed to mishandling of rough rice at farm level. Therefore, threshing loss for both
practices complied with the finding. Still, adequate handling during manual threshing was
estimated to be within the range of 1% - 5% threshing loss (Hodges et al., 2010).
Therefore, the average threshing loss (35DAH) was in the range.
5.2.4 Harvesting and Handling Losses at Farmer Fields
The farmers were assessed for an overall loss. The results from the experimental fields
show that losses associated with shattering and in – field staking of rough rice ranged
between 0.21% to 0.88% and 0.32% to 1.82% respectively, while the threshing loss
ranged from 1.26% to 9.9%. Among all the losses studied for each activity, there were
variations in the approaches of workforce used. The estimated total loss during harvesting
and handling at experimental fields were observed to range from 1.79% to 11.34% with
an average loss of an approximate 6% (0.192 mt/ha). To compare with the farmer practice
(42 DAH), the mean loss was estimated at an approximate loss of 10% (0.32 mt/ha). This
result shows that farmers harvested panicles at 7 days after the improved harvesting time
(42 days after heading). Meanwhile, the maturity stage of rice (var. Jasmine 85) was
estimated at 110 – 120 days and harvested within 5 days after maturity as stated by Dawe
University of Ghana http://ugspace.ug.edu.gh

62
et al. (2002). The losses (10%) obtained during the farmer time of harvesting was
attributed to the additional days the rice plant stood at field. The study suggests that,
harvesting at 35 days after heading has a huge impact to reduce the loss that farmers
encounter at farm level. Therefore, farmers would be capable to reduce the estimated loss
(24%) during the survey to about 6% as reported by FAO (2007) and Hodges et al. (2010).
5.3 Harvest Moisture Content of Rough Rice at Tono Irrigation Project
It was postulated that harvest moisture content (HMC) by farmers were significantly
different from an optimal moisture content of 22%. The study uncovers an on – field HMC
(20.88%) which was not significantly different (P>0.05) from the HMC stated by Hodges
and Stathers (2012). The result of this study agrees with the findings of Wang et al. (2004).
Qin and Siebenmorgen (2005) reported that, high significant of field losses were incurred
if HMC is less than 22%.
The HMC deviated from 20.88% by 2.56%. This occurrence was dependent on harvest
location and harvest date as studied by Lu et al. (1992). Siebenmorgen et al. (1992) and
Wang et al. (2004) confirmed that, at a given variety from a particular location, the harvest
moisture content generally decreased linearly with the harvest date and increased during
cutting based on in – field stacking. It was observed that, panicles were stacked in – field
as women continue harvesting. Thus, the hydroscopic nature of rough rice picks up
moisture when stacked. Siebenmorgen et al. (1992) stressed that, the presence of moisture
at field increased the harvest moisture content, particularly during late harvesting and
when the harvest moisture content of rough rice was low. The findings from the
experimental fields is in line with the study conducted by Jodari and Linscombe (1996),
which identified that harvest moisture content had the tendency to rise from one
University of Ghana http://ugspace.ug.edu.gh

63
percentage point with a 5 mm rainfall, and could rise up as much as four percentage points
depending on the atmospheric pressure. Therefore, the yields of rough rice was largely
dependent on harvest moisture content and location because when the field was with no
moisture, the rate at which rough rice will shatter will be high but at periods where
moisture level was high, kernels will still be attached to the ears of the panicles.
University of Ghana http://ugspace.ug.edu.gh

64
CHAPTER SIX
6.0 CONCLUSIONS
On the loss assessment survey, it was observed that both male and female farmers were
into rice cultivation. Despite the numerous campaign and awareness that had brought the
attention of female farmers owning agricultural fields, practically, males were
predominant over female farmers.
The survey indicated that, a proportion of farmers engage themselves in Farmer Field
Schools (FFS) whiles others did not. Therefore, there was an equal distribution of farmers
that did participate and that did not participate in FFS.
Subsequently, from the perspective of the farmers 52.4% associated the level of losses to
inappropriate time of harvesting. Apart from that, farmers perceived different levels of
losses. The losses that were perceived by farmers were guess estimates. Therefore,
farmers had no formal way of estimating or measuring the losses that were encountered
at farm level. In addition, 51.2% emphasised that the most point of losses that was during
threshing. As a result, the survey showed that almost all the rice farmers interviewed
indicated that losses of rough rice at farm gate is a major challenge.
Small scale farming is predominant in the Ghanaian agriculture. It was not surprising that
farmers were farming on an average field of 0.68 ha field. The output from the field (2.7
mt/ha) did not match up with the achievable yield of rice (6 mt/ha) as documented by
Statistical Research Institute Department (SRID) of the Ministry of Food and Agriculture.
The amount of rough rice lost (0.652 mt/ha) is not different from the rough rice saved
(0.708 mt/ha). This shows that, the amount of rough rice saved, either for household
University of Ghana http://ugspace.ug.edu.gh

65
consumption or to be sold later on the market was just equal to the rough rice lost to the
soil. Therefore, the economic loss was valued at GHS 815.88 (US$ 233.11) (23.92%).
There are so many factors affecting physical losses at famer fields. The factors studied
are 6 explanatory variables. Acreage, gender; farm education and labour statistically
predicted the losses during harvesting and handling. The effects of the factors influencing
harvesting and handling losses were different. Acreage and gender influenced the losses
positively whilst adequate labour and training of farmers on harvesting and handling
losses significantly predicted a reduction in loss of rough rice at farm level. The adjusted
coefficient of determination (approximately 66%) indicated that the quantity of rough rice
lost at farm level during harvesting and handling was explained by the explanatory
variables in the model.
Farmers’ accessibility to the use of tarpaulin during handling of harvested rice straw at
farm level was important. It was observed that during threshing where majority of farmers
and a large number of work force share one tarpaulin whilst some farmers come along
with an improvised tarpaulin made out of used poly sacs.
The yield of rice among rice farmers was not encouraging at field. Farmers harvested
when the entire field has turned golden straw. This stage of the rice plant compromises
the full potential of rough rice. It was shown in the study that, harvest at 35 days after
heading yielded (4.8 mt/ha) more than the time the farmers chose (42 days after heading)
to harvest (3.7 mt/ha). Therefore, to harvest at 35 days after heading is more vital and has
the tendency of achieving high head rice yield (HRY).
University of Ghana http://ugspace.ug.edu.gh

66
Harvesting losses included shattering and in – field staking. The loss that was estimated
during harvesting is 1.32%. This implies that farmers were losing an average rough rice
of 0.042 mt/ha. Subsequently, 4.4% of rough rice was lost during threshing. Practically,
farmers were losing an average rough rice of 0.141 mt/ha. The overall loss that occurred
during harvesting and handling ranged 1.79% to 11.34% with an average loss of 6%.
Harvesting at 35 days after heading coupled with good agronomic practice can reduce
farm level losses to about 6% or less. This approach can help to stabilise the rate at which
rice is lost at farm level.
Finally, studies have noted that farmers do not harvest at an appropriate moisture content.
However, from the experimental fields, farmers harvested at 20.88±2.56% moisture
content. This harvest moisture content was highly attributed to the location and the soil
moisture content.
6.1 RECOMMENDATIONS
The recommendation are categorised into two (2) parts. It targets the socioeconomic
improvement of farmers and the academic discourse. The following recommendations are
suggested:
It is well-known that rice is an essential cereal crop. It serves as a source of energy to
many lives. Therefore, this study highly endorses important postharvest loss reduction
programmes to rice farmers through advocacy and awareness. When a loss reduction
campaign is coupled with potent and sustainable food systems, the yield gap will be
addressed. A campaign like this should incorporate competitive rice production,
appropriate harvesting times and farm field schools among identified Community Based
University of Ghana http://ugspace.ug.edu.gh

67
Organisations (CBOs) and Farmer Based Organisations (FBOs). Through the
implementation of a loss reduction programme campaign, there will be high tendency to
conserve and convert rice loss to plate. This approach will widen the understanding of
PHL among rice farmers. When programmes like Farmer Field Schools (FFS), and
exchange visits are implemented within rice growing communities; it will bring on board
both extension personnel and farmers. For instance, when rice farmers are taught loss
reduction through demonstration fields, the prevailing losses at field will be lessened.
Moreover, such programmes will increase awareness among rice farmers, private sector
and high policy level. The programme will then build the capacity of farmers to produce
more rice. Furthermore, food availability will then expand within the local rice markets.
For that reason, rice farmers or local rice sellers can be linked to the Ghana School
Feeding Programme (GSFP). This will then support food availability among school
children and hence, create more market openings for farmers who fall short of
international standards.
Secondly, loss assessment and reduction studies should be conducted at different rice
growing communities on the newly released rice variety (CSIR-AGRA rice). The study
will serve as a means to inform the breeders whether the variety stands its full potential
on the aspect of PHLs. In addition, a research pertaining to the variety will unveil more
data to understand postharvest loss situation on the newly released rice variety.
Also, since rough rice is highly processed through parboiling in the environs of Navrongo
and some rice growing communities, a loss assessment study could be conducted on
parboiled rice to evaluate the quantity and nature of losses that women parboilers
University of Ghana http://ugspace.ug.edu.gh

68
experience during the off – farm activity. The economic losses associated with parboiling
of rice at various stages can also be assessed.
In addition, since the study did not delve into the losses that occur during milling, a loss
assessment study can be looked at some optimal harvest moisture content (HMC) and the
effect on rice milling quality.
University of Ghana http://ugspace.ug.edu.gh

69
REFERENCES
Abansi, C. L., Duff, B., Lantican, F. A., & Juliano, B. O. (1992). Consumer demand for
rice grain quality in selected rural and urban markets in the Philippines. In L. J.
Unnevehr, B. Duff, & B. O. Juliano (Eds.), Consumer demand for rice grain quality,
Manila: International Rice Research Institute.
Abass, A. B., Ndunguru, G., Mamiro, P., Alenkhe, B., Mlingi, N., & Bekunda, M. (2014).
Post-harvest food losses in a maize-based farming system of semi-arid savannah area
of Tanzania. Journal of Stored Products Research, 57, 49–57.
http://doi.org/10.1016/j.jspr.2013.12.004
Abebe, G. H., & Bekele, H. (2006). Farmers ’ Post-Harvest Grain Management Choices
under Liquidity Constraints and Impending Risks : Implications for Achieving Food
Security Objectives in Ethiopia.
Adejo, P. E., Edoka, M. H., & Adejoh, S. O. (2012). Indigenous practices and the
challenges of climate change among small-scale farmers in Dekina Local
Government Area of Kogi State, Nigeria. In Proceedings of the 17th Annual National
Conference of the Agricultural Extension Society of Nigeria (AESON), held at
University of Nigeria, Nsukka, 11-14th March, 2012 (pp. 70–77).
Adepoju, A. O. (2014). Post-harvest losses and welfare of tomato farmers in Ogbomosho,
Osun state, Nigeria. Journal of Stored Products and Postharvest Research, 5(2), 8–
13.
Affognon, H., Mutungi, C., Sanginga, P., & Borgemeister, C. (2015). Unpacking
Postharvest Losses in Sub-Saharan Africa: A Meta-Analysis. World Development,
66, 49–68. http://doi.org/10.1016/j.worlddev.2014.08.002
Agboh-Noameshie, A., Kabore, A., & Misiko, M. (2013). Integrating Gender
Considerations in Rice Research for Development in Africa. In M. C. S. Wopereis,
D. E. Johnson, N. Ahmadi, E. Tollens, & A. Jallah (Eds.), Realizing Africa’s Rice
Promise (pp. 343–354).
Agropedia. (2009). Botanical Classification of Rice. Http://agropedia.iitk.
Ac.in/content/botanical-Classification-Rice, Submitted by Naipictuased Harward, p.
51.
Aidoo, R., Danfoku, R. A., & Mensah, J. O. (2014). Determinants of postharvest losses
in tomato production in the Offinso North district of Ghana. Journey of Development
and Agricultural Economics, 6(8), 338–344. http://doi.org/10.5897/JDAE2013.0545
Aina, L. O., Kaniki, A. M., & Ojiambo, J. B. (1995). Preface. In L. O. Aina, A. M. Kaniki,
& J. B. Ojiambo (Eds.), Agricultural information in Africa. Ibadan: Third World
Information Services.
Ajah, J., & Ajah, F. C. (2010). Socio-economic Determinants of Small- scale Rice
Farmers’ Output in Abuja, Nigeria. Asian Journal of Rural Development, 4, 16–24.
Akande, T., Cisse, Y., & Kormawa, P. (2007). Streamlining policies for enhancing rice
production in Africa: past experiences, lessons learnt and the way forward. African
Crop Science Journal, 15(4), 223–235.
University of Ghana http://ugspace.ug.edu.gh

70
Akowuah, J. O., Addo, A., & Bart - Plange, A. (2012). Influence of Drying Temperature
and Storage Duration on Fissuring and Milling Quality of Jasmine 85 Rice Variety.
Journal of Science and Technology, 32(2), 26–33.
Alam, M. S., & Hossain, M. (2008). Farmers’ Perceptions on Yields gaps, Production
Losses and Priority Research Problem areas in Bangladesh. The Bangladesh Journal
of Agricultural Economics, 21(1&2), 21–38.
Alizadeh, M. R., & Allameh, A. (2013). Evaluating rice losses in various harvesting
practices. International Research Journal of Applied and Basic Sciences, 4(4), 894–
901.
Amaza, P. S., & Maurice, D. C. (2005). Identification of factors that influence technical
efficiency in rice-based production systems in Nigeria. Paper presented at Workshop
on policies and strategies for promoting rice production and food security in Sub-
Saharan Africa: 7-9 November 2005, Cot.
Anderson, J. R., & Feder, G. (2007). Agricultural extension. In Handbook of agricultural
economics. Agricultural development: Farmers, farm production and farm markets.
Elsevier, 3, 2343 – 2378.
Anwar, S. I. (2010). Determination of Moisture Content of Bagasse of Jaggery Unit Using
Microwave Oven. Journal of Engineering Science and Technology, 5(4), 472–478.
Appiah, F., Guisse, R., & Dartey, P. K. A. (2011). Post harvest losses of rice from
harvesting to milling in Ghana. Journal of Stored Products and Postharvest
Research, 2(4), 64–71.
Appleton, S., & Balihuta, A. (1996). Education and agricultural productivity: Evidence
from Uganda. Journal of International Development, 8(3), 415–444.
http://doi.org/10.1002/(SICI)1099-1328(199605)8:3<415::AID-JID396>3.0.CO;2-
9
Asadullah, M. N., & Rahman, S. (2005). Farm Productivity and Efficiency in Rural
Bangladesh: Role of Education Revisited.
Asfaw, A., & Admassie, A. (2004). The role of education on the adoption of chemical
fertilizers under different socioeconomic environments in Ethiopia. Agricultural
Economics, 30, 215–228.
Asiabaka, C. C., Morse, S., & Kenyon, L. (2002). The development, dissemination and
adoption of technologies directed at improving availability of clean yam planting
material in Nigeria and Ghana.
Asiedu, E., Kone, A., Konan, J. K., & Ramchander, S. (2011). CORAF / WECARD Staple
Crops Programme Global Food Security Response Initiative: Training Manual for
Improved Rice Postharvest Technologies in West Africa, 1–44.
Ayoola, J. B., Dangbegnon, C., Daudu, C. K., Mando, A., Kudi, T. M., Amapu, I. Y., …
Ezui, K. S. (2011). Socio-economic factors influencing rice production among male
and female farmers in Northern Guinea Savanna Nigeria: lessons for promoting
gender equity in action research. Agriculture and Biology Journal of North America,
2(6), 1010–1014. http://doi.org/10.5251/abjna.2011.2.6.1010.1014
Babalola D. A., Makinde Y. O., Omonona B. T., & Oyekanmi M. O. (2010). Determinants
University of Ghana http://ugspace.ug.edu.gh

71
of Postharvest Losses in tomato production: A case study of Imeko – Afon Local
government area of Ogun state. Journal of Life and Physical Sciences Acta SATECH,
3(2), 14 – 18.
Bachhv, N. B. (2012). Information needs of the rural farmers : A study from Maharashtra,
India; A survey, Library Philosophy and Practice. Retrieved from
http://digitalcommons.unl.edu/cgi/viewcontent.cgi?article=2043&context=libphilpr
ac
Basappa, G., Deshmanya, J. B., & Patil, B. L. (2007). Postharvest Loss of maize Crop in
Karnataka – An Economic Analysis. Karnataka Journal of Agricultural Sciences,
20(1), 69–71.
Basavaraja, H., Mahajanashetti, S. B., & Udagatti, N. C. (2007). Economic Analysis of
Post-harvest Losses in Food Grains in India : A Case Study of Karnataka.
Agricutural Economics Research Review, 20, 117–126.
Bautista, E. U., Phan, H. H., & Schmidley, A. A. (2007). Adoption of Mini Rice Combine
for Wetland Rice Fields. Philipp Journal of Biosystem, 36 – 44.
Bautista, R. C., & Siebenmorgen, T. J. (2005). Individual Rice Kernel Moisture Content
Variability Trends. Applied Engineering in Agriculture, 21(4), 637–643.
Bell, A., Mazaud, F., & Mück, O. (1999). Guidelines for the analysis of postproduction
systems. FAO, Rome, Italy., 102. Retrieved from http://www.fao.org/inpho
Berhe, T., & Mado, T. (2008). Promoting Rice “ From Plant to Plate ” For Food Security
in Sub-Saharan Africa : SG2000 Strategy. Rice Policy and Food Security in Sub-
Saharan Africa, 29.
Bhullar, N. K., & Gruissem, W. (2013). Nutritional enhancement of rice for human health:
The contribution of biotechnology. Biotechnology Advances, 31(1), 50–57.
http://doi.org/10.1016/j.biotechadv.2012.02.001
Biggs, F., & Biggs, S. (2001). Evolving themes in rural development 1950s-2000s 19.
Development Policy Review, 19(4), 2001.
Boxall, R. A. (1986). A critical review of the methodology for assessing farm-level grain
losses after harvest.
Buah, S. S. J., Nutsugah, S. K., Kanton, R. A. L., Atokple, I. D. K., Dogbe, W., Karikari,
S. A., … Ndiaye, K. (2011). Enhancing farmers’ access to technology for increased
rice productivity in Ghana. African Journal of Agricultural Research, 6(19), 4455–
4466. http://doi.org/10.5897/AJAR11.1152
Calverley, D. J. B. (1994). Programme for the prevention of food losses: A study of eleven
projects in Asia concerned with rice. Final report, FAO.
Calverley, D. J. B. (1996). A study of loss assessment in eleven projects in Asia concerned
with rice. Rome, FAO (PFL/INS/001)., 1996.
Candia, A., Okurut, S., Komaketch, A., Saasa, A. R., & Mudusu, J. (2012). On-farm post-
harvest physical grain losses of “ Kaiso ” rice variety in Eastern Uganda. Uganda
Journal of Agricultural Sciences, 13(1), 61–70.
CARD. (2010). Mapping of Poverty Reduction Strategy Papers (PRSPs), Sector
University of Ghana http://ugspace.ug.edu.gh

72
Strategies and Policies related to rice development in Ghana Coalition for African
Rice Devel opment (CARD) (2010). “Mapping of Poverty Reduction Strategy Papers
(PRSPs), Sector Strategies and P.
Chipili, J., Sreenivasprasad, S., Nutsugah, S. K., Twumasi, J. k., & Dartey, K. (2003).
Rice blast management in Ghana: Characterization of the pathogen diversity.
Journal of the Ghana Science Association, 5, 20–25.
Cnossen, A., & Siebenmorgen, T. J. (2000). The glass transition temperature concept in
rice drying and tempering: Effect on milling quality. American Society of
Agricultural Engineers, 43, 1661–1667.
Cuevasperes, F. E., Berrio, L. E., Gonzales, D. I., Correa, V. F., & Tulande, E. (1995).
Genetic improvement in yield of semi-dwarf rice cultivars in Columbia. Crop
Science, 35, 725 – 729.
Damardjati, D. S., & Oka, M. (1992). Evaluation of urban consumer preferences for rice
quality characteristics in Indonesia. In L. J. Unnevehr, B. Duff, & B. O. Juliano
(Eds.), Consumer Demand for Rice Grain Quality, Manila: International Rice
Research Institute.
Dawe, D. C., Hardy, B., & Hettel, G. P. (2002). Source Book for the Most Important
Economic Activity on Earth. International Rice Research Institute.
De Padua, D. (1999). Grain Post Production Systems.
Defoer, T., Wopereis, M. C. S., Jones, M. P., Lancon, F., & Erenstein, O. (2003).
Challenges, innovation and change: towards rice- based food security in sub-Saharan
Africa. In Proceedings of the 20 th Session of the International Rice Commission
Bangkok, Thailand, 23-26 July 2002. FAO. Retrieved from
http://www.fao.org/docrep/006/y4751e/y4751e0p.htm#bm25.1
Denning, G., Baroang, K., & Sandar, T. M. (2013). Rice Productivity Improvement in
Myanmar (No. Background Paper No.2).
Dogara, A. M., & Jumare, A. I. (2014). Origin , Distribution and Heading date in
Cultivated Rice.
Doi, R., Arif, C., Setiawan, B. I., & Mizoguchi, M. (2013). Quantitative Use of
Luminosity-normalized Grayscale Images of Greenness , Redness and Yellowness
of a Rice Canopy Derived from Multi-temporally Acquired Digital Photographs.
International Journal of Agriculture & Biology, 15(4), 707–712.
Donkoh, S. A., & Awuni, J. A. (2011). Adoption of farm management practices in
lowland rice production in Northern Ghana. Journal of Agricultural and Biological
Science, 2(4), 84–93.
Donkor, E., & Owusu, V. (2014). Examining the socioeconomic determinants of rice
farmer’s choice of land tenure systems in the Upper East Region of Ghana. Journal
of Agricultural Technology, 10(3), 505–515.
Dulle, F., & Ngalapa, H. (2014). Assessment of information needs of rice farmers in
Tanzania ; A case study of Kilombero District , Morogoro. Library Philosophy and
Practice, 1071.
University of Ghana http://ugspace.ug.edu.gh

73
Dunand, R., & Saichuk, J. (2009). Rice Growth and Development. In Louisiana Rice
Production Handbook, Louisiana State University Agricultural Center (pp. 41–53).
Edoka, M. H., Adejoh, S. O., & Ibrahim, M. K. (2009). The role of women in rice
production in Idah local government area of Kogi State, Nigeria. In Proceedings of
the 43rd Annual Conference on Agricultural Society of Nigeria, October 19-23,
2009, Abuja (p. 648).
Edoka, M. H., Igbokwe, E. M., & Adejo, P. E. (2014). Constraints to Farmers’ Labour
Group Productivity in Eastern Kogi State, Nigeria. Journal of Agricultural
Extension, 18(2), 68–75.
Ekeleme, F. A. Y., Kamara, L. O., Omoigui, A., Tegbaru, J. M., & Onyibe, J. E. (2008).
Guide to Rice Production in Borno State, Nigeria. IITA, Ibadan, Nigeria, ISBN:
9781313242, pp20.
Enwerem, V. A., & Ohajianya, D. O. (2012). Farm Size and Technical Efficiency of Rice
Farmers in Imo By. Greener Journal of Agricultural Sciences, 3(2), 128–136.
Fagade, S. O. (2000). Yield gaps and Productivity decline in rice production in Nigeria.
In Proceedings of the Expert Consultation on Yield Gap and Productivity Decline in
Rice, 5-7 September 2000. FAO, Rome.
Falusi, A. O. (1997). Agricultural development and food production in Nigeria: problems
and prospects. In M. Shaib, B., Adedipe, N. O., Aliyu, M. Jir (Ed.), Integrated
agricultural production in Nigeria: Strategies and Mechanisms NARPMonograph
No. 5. p. 151-170.
FAO. (1989). Prevention of Postharvest Food Losses, fruits, Vegetables and Root Crops
Training Manual. Rome, Italy.
FAO. (1993). Agriculture: Toward 2010. FAO, Rome, Italy, C93/24, Nov. 93.
FAO. (1997). Estimated Post-Harvest Losses of Rice in Southeast Asia.
http://fao.org/News/Factfile/FF9712-Ehtm.
FAO. (2007). Postharvest Loss Compenduim-database of Information on PHL for
different Crop types. www.fao.org/inpho.
FAO. (2009). On-farm post-harvest management of food grains A manual for extension
workers with special reference to Africa.
FAO. (2010a). Food Outlook, Global Market Analysis.
FAO. (2010b). The low and lower-middle-income countries in rice producing Asia are
Bangladesh, Cambodia, China, India, Indonesia, DPR Korea, Lao PDR, Maldives,.
FAO. (2013). FAO Rice Market Monitor (RMM). Volume, 16, Trade and Market
Division, Food and Agriculture Organization of the United Nations, Rome, Italy, pp:
1-36.
Feil, B. (1992). Breeding progress in small grain cereals. Plant Breed, 108, 1 – 11.
Fu, R. H. Y., Abe, S. S., Wakatsuki, T., & Maruyama, M. (2010). Traditional Farmer-
managed Irrigation System in Central Nigeria. Japan Agricultural Research
Quaterly, 44, 53–60.
University of Ghana http://ugspace.ug.edu.gh

74
Ganpat, W., & Sespersad, C. (1996). An analysis of linkage in a Rice based knowledge
system in Trinided. Proceedings of 12th Annual conference of the Association for
international Agric and Extension education (AIAEE) held at Arington Virginia, pp
131 – 136.
Guisse, R. (2010). Postharvest losses of rice (ORYZAE SATIVA) from harvesting to
milling: A case study in Besease and Nobewam in the Ejisu Juabeng District in the
Ashanti Region of Ghana.
Hasnah, Fleming, E. M., & Coelli, T. (2004). Assessing the performance of a nucleus
estate and smallholder scheme for oil production in West Sumatara. Agricultural
Systems, 79, 17–30.
Hazell, P., Poulton, C., Wiggins, S., & Dorward, A. (2010). The Future of Small Farms:
Trajectories and Policy Priorities. World Development, 38(10), 1349–1361.
Hodges, R. J. (2012). Post-harvest Weight Losses of Cereal Grains in Sub-Saharan
Africa. Retrieved from http://www.erails.net/FARA/aphlis/aphlis/weightlosses-
review/ (verified 13 April 2015).
Hodges, R. J., Buzby, J. C., & Bennett, B. (2010). Postharvest losses and waste in
developed and less developed countries: opportunities to improve resource use. The
Journal of Agricultural Science, 149(1), 37–45.
http://doi.org/10.1017/S0021859610000936
Hodges, R. J., & Stathers, T. (2012). Training Manual for Improving Grain Postharvest
Handling and Storage.
Hoque, M. Z., & Haque, M. E. (2014). Socio-economic Factors Influencing Profitability
of Rice Seed Production in Selected Areas of Bangladesh. The Agriculturists, 12(1),
33–40.
Horna, J. D., Smale, M., & von Oppen, M. (2005). Farmer willingness to pay for seed-
related information: rice varieties in Nigeria and Benin .Washington DC. :
International Food Policy Research Institute (IFPRI), EPT Discussion Paper 142.
Hossain, M. F., Bhuiya, M. S. U., Ahmed, M., & Mian, M. H. (2009). Effect of Harvesting
Time on the Milling and Physicochemical Properties of Aromatic Rice. Thai Journal
of Agricultural Science, 42(2), 91–96.
Huq, F., & Greeley, M. (1980). Rice in Bangladesh: An empirical analysis of farm level
food losses in five post-harvest operations. In Grain quality improvement -
Proceedings of the 3rd annual workshop on grains postharvest technology. Kuala
Lumpur, Malaysia, 29-31 January 1980. (pp. 245– 262).
Hutcheson, G. D. (2011). Ordinary Least-Squares Regression. In L. Moutinho & D. G.
Hutcheson (Eds.), The SAGE Dictionary of Quantitative Management Research (pp.
96–97).
Huvio, T. (1998). Women’s role in rice farming. Retrieved from
http://www.fao.org/sd/wpdirect/wpan0027.htm
Idiegbeyan-Ose Jerome, D. B. M., & Theresa, U. A. (2009). Information as an effective
tool in rural development. International Journal of Library and Information Science,
1(3), 22–28.
University of Ghana http://ugspace.ug.edu.gh

75
Ininda, J. (2008). New High Yield Rice Breed to cut Rice Importation. (Agra programme
officer for crop improvement and farm variety adoption. Retrieved from
http://allafrica.com/stories/200806180503.html (Accessed 16th November 2014)
International Fund for Agricultural Development (IFAD). (2008). Improving access to
land and tenure security. Accra, Ghana.
IRRI. (1997). Disappearing food, How big are the post-harvest losses. Retrieved from
earthtrends.wri.org/features/view_feature.php?theme
IRRI. (1998). Registration of Jasmine 85. Crop Science, 38, 895 – 896.
IRRI. (2005). World Rice Statistics IRRI (2005). World Rice Statistics Los Baños.
Retrieved from http://www.irri.org/science/ricestat
Jackson, M. T., & Lettington, R. J. L. (2003). Conservation and use of rice germplasm:
an evolving paradigm under the International Treaty on Plant Genetic Resources for
Food and Agriculture. In Proceedings of the 20th Session of the International Rice
Commission Bangkok, Thailand, 23-26 July 2002.
Jenny, C. A., Steven, B., Vijaya, R., & Timmer, C. P. (2008). West African Experience
with the World Rice Crisis, 2007–2008. CGD Working Paper 242. Washington,
D.C.: Center for Global Development. CGD Working paper 242. Washington DC.:
Center for Global Development.
Jodari, F., & Linscombe, S. D. (1996). Grain fissuring and milling yields of rice cultivars
as influenced by environmental conditions. Crop Science, 36, 1496–1502.
Jones, M. P., Dingkuhn, M., Aluko, G. K., & Semon, M. (1997). Interspecific Oryza sativa
× O. glaberrima Steud. progenies in upland rice improvement. Euphytica, 92, 237–
246.
Kader, A. A., & Rolle, R. S. (2004). The Role of post-harvest management in assuring
the quality and safety of horticultural produce. FAO, UN, Rome.
Kennedy, G., Burlingame, B., & Nguyen, V. N. (2003). Nutritional contribution of rice
and impact of biotechnology and biodiversity in rice-consuming countries. In
Proceedings of the 20th Session of the International Rice Commission Bangkok,
Thailand, 23-26 July 2002. FAO. Retrieved from
http://www.fao.org/docrep/006/y4751e/y4751e05.htm#bm05
Khan, A. S., & Salim, M. (2005). Rice harvesting and threshing. Pakistan Journal of Food
Science, 15(1-2), 45–52.
Khush, G. S., & Brar, D. S. (2002). Biotechnology for rice breeding: Progress and Impact.
In Proceedings of the 20th Session of International Rice Commission Bangkok,
Thailand, 23-26 July 2002. FAO. Retrieved from
http://www.fao.org/docrep/006/y4751e/y4751e04.htm#bm04
Kitinoja, L., & Gorny, J. R. (1999). Postharvest technology for small-scale produce
marketers: economic opportunities, quality and food safety (No. University of
California Postharvest Horticultural Series 21).
Knight, J., Wier, S., & Woldhanna, T. (2003). The role of education in facilitating risk-
taking and innovation in agriculture. Journal of Development Studies, 39, 1–22.
University of Ghana http://ugspace.ug.edu.gh

76
Kranjac-Berisavljevic’, G., Blench, R. M., & Chapman, R. (2003). Technical Change in
West African Agriculture.
Kubo, M., & Purevdorj, M. (1991). The Future of Rice Production and Consumption.
Journal of Food Distribution Research, 35(1), 128–142.
Kula, O., & Dormon, E. (2009). To the Global Food Security Response Analysis Global
Food Security Response.
Lampe, K. (1995). Rice Research: Food for 4 Billion People. GeoJournal, 35(3), 253 –
259.
Lantin, R. (1999). Rice: Post-harvest Operations. FAO.
Legendre, P. (2010). Coefficient of concordance. In N. J. Salkind (Ed.), Encyclopedia of
Research Design (Vol. 1, pp. 164–169). Los Angeles: SAGE Publications, Inc.
Linares, O. F. (2002). Africa Rice ( Oryzae glaberrima). History and Future Potential,
National Academy of Science, United States of America, 99, 16360 – 16365.
Lowder, S. K., Skoet, J., & Singh, S. (2014). What do we really know about the number
and distribution of farms and family farms worldwide? Background paper for The
State of Food and Agriculture 2014. (No. ESA Working Paper No. 14-02).
Lu, R., Siebenmorgen, T. J., Costello, T. A., & Jr, E. O. F. (1995). Effect of Rice Moisture
Content at Harvest on Economic Return. Applied Engineering in Agriculture, 2(5),
685–690.
Lu, R., Siebenmorgen, T. J., Dilday, R. H., & Costello, T. A. (1992). Modeling Long-
Grain Rice Milling Quality and Yield during the Harvest Season. American Society
of Agricultural Engineers, 35(6), 1905–1913.
Lunduka, R., Ricker-Gilbert, J., & Fisher, M. (2013). What are the farmlevel impacts of
Malawi’s farm input subsidy program? A critical review. Agricultural Economics,
44(6), 563–579.
Mansuri, G., & Rao, V. (2004). Community-based and -driven development: A critical
review. World Bank Research Observer, 19(1), 1–39.
Martins, A. G. (2013). Post - Harvets Loss in Tropical Soybean Systems: Brazillian
Managers’ Perception and Mitigation Strategies: Two Manuscripts.
Mbah, S. O. (2006). Resources management for rice production in Ishiagu, Ivo L .G. A.
of Ebonyi State.
Meyer, H. W. J. (2005). The nature of information, and effective use of information in
rural development. Journal of Information Research, 10(2).
Mgbada, J. U. (2000). Production of staple crops by rural women in Enugu and Ebonyi
States. Lessons for nhancing povrty alleviation programmes. In T. A. Olowu (eds).
Agricultural extension and poverty alleviation in Nigeria. In Proceedings of the 6th
Annual National Conference of the Agricultural Extension Society of Nigeria (p. 11).
MiDA. (2010). Investment Opportunity in Ghana: Maize, Rice and Soy Bean.
Mishra, S., Chaudhury, S. S., & Nambi, V. A. (2012). Strengthening of traditional paddy
seed selection practices of tribal farm families with improved knowledge and skills
University of Ghana http://ugspace.ug.edu.gh

77
in Koraput district , Odisha. Indian Journal of Traditional Knowledge, 11(3), 461–
470.
MOFA. (2009). National Rice Development Strategy, Accra, Ghana. Introduction of
Strategy Development Partners in Ghana, 23rd April 2009. Retrieved from
www.jica.go.jp/activities/issues/agricul/pdf [Accessed 10th November 2014]
MoFA. (2011). Agriculture in Ghana: Facts and Figures. Accra, Ghana: Statistics,
Research, and Information Directorate. Retrieved from http://mofa.gov.gh/site/wp-
content/uploads/2011/10/AGRICULTURE-IN-GHANA-FF-2010.pdf
MOFA (Ministry of Food and Agriculture). (2007). District level agricultural production
and price data.
Mohammed, B. T., & Abdulquadri, A. F. (2011). Comparative Analysis of Gender
Involvement in Agricultural Production in Nigeria. Continental Journal of
Agricultural Science, 5(3), 35–40.
Moldenhauer, K., & Slaton, N. (2001). 1 – Rice Growth and Development. Rice
Production Handbook, University of Arkansas, 7–14.
Namara, R. E., Horowitz, L., Nyamadi, B., & Barry, B. (2011). Irrigation Development
in Ghana : Past experiences , emerging opportunities , and future directions.
Nanfumba, D., Turyahabwe, N., Ssebuliba, J., Kakuru, W., Kaugule, J., Omio, S., &
Samuka, M. (2013). Participatory identification of farmer acceptable improved rice
varieties for rain-fed lowland ecologies in uganda. African Crop Science Journal,
21(s3), 683–691.
Napasintuwong, O. (2012). Breeding for the best: Jasmine rice market competition and
protection.
Naphire. (1997). Technical Guide on Grain Postharvest. National Postharvest Institute of
Research (NAPHIRE). Munoz, Nueva, Philippines, 1997.
Norman, J. C., & Kebe, B. (2004). African smallholder farmers : rice production and
sustainable livelihoods. Regional Perspectives, 33–64.
Nwanze, K. F., Mohaptra, S., Kormawa, P., Shallemiah, K., & Bruce-Oliver, S. (2006).
Building the capacity for farmer based organisation for sustainable rice farming in
northern Ghana. Journal of the Science of Food and Agriculture, 86, 675–677.
Obeng-Ofori, D. (2011). Protecting grain from insect pest infestations in Africa: producer
perceptions and practices. Stewart Post-Harvest Revision, 7(3), 1–15.
Ofori, E., Kyei-Baffour, N., Mensah, E., & Agyare, W. A. (2010). Yield Gap Analysis in
Rice Production from Stakeholders’ Perspective at Annum Valley Bottom Irrigation
Project at Nobewam in Ghana. ARPN Journal of Agricultural and Biological
Science, 5(6), 50–57.
Okoruwa, V. O., & Ogundele, O. O. (2006). Technical efficiency differentials in rice
production technologies in Nigeria. A research paper presented at a workshop
organized by The Nigerian Institute of Social and Economic Research (NISER)
Ibadan, Nigeria.
Oladele, O. (2006). Multilinguality of farm broadcast and agricultural information
University of Ghana http://ugspace.ug.edu.gh

78
accessing Nigeria. Nordic Journal of African Studies, 15(2), 199–205.
Oluyemi, A. T. (2014). Characterisation of Jasmine 85 Rice ( Oryza sativa ) variety from
different sources of seed production in Ghana.
Onoja, A. O., & Herbert, B. C. (2012). Econometric evaluation of rice profitability
determinants in Kogi State, Nigeria. Journal of Agricultural Extension and Rural
Development, 4(5), 107–114. http://doi.org/10.5897/JAERD11.071
Onwueme, I. C., & Sinha, T. D. (1991). Field Crop Production in Tropical Africa.
Technical Centre for Agricultural and Rural Co-operation (CTA), Ede, The
Netherlands, ISBN-13: 9789290810865.
Osei – Asare, Y. (2010). Mapping of Poverty Reduction Strategy Papers (PRSPs), Sector
Strategies and Policies Related to Rice Development in Ghana. The FEBS Journal.
Pandey, S., Byerlee, D., Dawe, D., Dobermann, A., Mohanty, S., Rozelle, S., & Hardy,
B. (2010). Rice in the global economy. Strategic Research and Policy Issues for Food
Security. IRRI.
Qin, G., & Siebenmorgen, T. J. (2005). Harvest Location and Moisture Content Effects
on Rice Kernel-to-Kernel Breaking Force Distributions. Applied Engineering in
Agriculture, 21(6), 1011–1016.
Ragasa, C., Dankyi, A., Acheampong, P., Wiredu, A. N., & Chapoto, A. (2013). Patterns
of Adoption of Improved Rice Technologies in Ghana.
Ragasa, C., Takeshima, H., Chapoto, A., & Kolavalli, S. (2014). Substituting for Rice
Imports in Ghana.
Rai, M. (2003). Genetic diversity in rice production: past contribution and the potential
of utilization for sustainable rice production. In Proceedings of the 20th Session of
the International Rice Commission Bangkok, Thailand, 23-26 July 2002.
Ranawake, A. L., Amarasinghe, U. G. S., & Senanayake, S. G. J. N. (2013).
Determination of some agronomic characters in different age groups of traditional
rice cultivars in Sri Lanka under fertilized and non-fertilized conditions. Journal of
Agricultural Biotechnology and Sustainable Development, 5(5), 79–83.
http://doi.org/10.5897/JABSD2013.0204
RLDC Rural Livelihood Development Company. (2009). Rice Sector Strategy:
Improving Rice Profitability Through Increased Productivity and Better Marketing
Focusing on Tanzanian’s Central Corridor, (November).
Sanint, L. R., Correa, V. F. J., & Izquerdo, J. (1998). Current situations and Issues on rice
production in Latin America and the Carribean.
Seck, A. P. (2011). RiceToday: Feeding the world in 2050. International Rice Research
Institute October-December 2011, 10(4), 12–13.
Seid, H., Haseen, B., & Yitbarek, W. H. (2013). Postharvest Loss Assessment of
Commercial Horticultural Crops in South Wollo, Ethiopia Challenges and
Opportunities. Food Science and Quality Management, 17, 34–39.
Seyoum, E. T., Battese, G. E., & Fleming, E. M. (1998). Technical Efficiency and
Productivity of maize producers in eastern Ethiopia: A case study of farmers within
University of Ghana http://ugspace.ug.edu.gh

79
and outside the Sasakawa Global 2000 project. Agricultural Economics, 19, 341–
348.
Siebenmorgen, T. J., Bautista, R. C., & Counce, P. A. (2007). Optimal harvest moisture
content for maximizing milling quality of long and medium grain rice cultivars.
American Society of Agricultural Engineers, 23(4), 517–527.
Siebenmorgen, T. J., Counce, P. A., Lu, R., & Kocher, M. F. (1992). Correlation of head
rice yield with individual kernel moisture content distribution at harvest. American
Society of American Engineers, 35, 1879–1884.
Somado, E. A., & Berhe, T. (2008). Harvest and Post-Harvest Opeartions. Module 12. p
111-115. In E. A. Somado, R. G. Guei, & S. O. Keya (Eds.), The New Rice for Africa
- A Compendium. (pp. 111–115).
Tabien, R. E., Samonte, S. O. P., & McClung, A. M. (2008). Forty-eight Years of Rice
Improvement in Texas since the Release of Cultivar Bluebonnet in 1944. Crop
Science, 48(6), 2097–2106. http://doi.org/10.2135/cropsci2007.12.0680
Takeshima, H., Jimah, K., Kolavalli, S., Diao, X., & Funk, R. L. (2013). Dynamics of
Transformation Insights from an Exploratory Review of Rice Farming in the Kpong
Irrigation Project, (June).
Takeshima H., K., Jimah, S. K., Diao, X., & Funk, R. (2013). Dynamics of
transformation: Insights from an exploratory review of rice farming in the Kpong
Irrigation Project.
Takeshima, H., & Salau, S. (2010). Agricultural Mechanization and the Smallholder
Farmers in Nigeria.
Tanaka, T. (1976). Regulation of plant type and carbon assimilation of rice. Japan
Agricultural Research Quarterly, 10(4), 161–167.
Tanasugarn, L. (1998). Jasmine rice crisis: A Thai perspective. In Intellectual Property
and International Trade Law Forum (Special Issue 1998). Central Intellectual
Property and International Trade Court. Bangkok, Thailand.
Thanh, N. C., & Singh, B. (2006). Constraints faced by farmers in Rice Production and
Export. Omonrice, 14, 97–110.
Tomlins, K. I., Manful, J. T., Larweh, P., & Hammond, L. (2005). Urban consumer
preference and sensory evaluation of locally produced and imported rice in West
Africa. Food Quality and Preference, 16(1), 79–89.
Tran, D. V. (2004). Rice Agriculture: prospects and strategies in Asia. Paper presented
at the Workshop on Sustainable Use of Agricultural Resources and Environment
Management with focus on the role of Rice Farming, Tokyo, Japan, 21-23 Jan. 2004.
Tran, D. V. (1997). World rice production main issues and technical possibilities. In :
Chataigner J. (ed.). Activités de recherche sur le riz en climat méditerranéen .
Cahiers Options Méditerranéennes, 24(2), 57–69.
United Nations. (2004). World Population to 2300.
United States Agency for International Development (USAID). (2011). Ghana
Partnership for Growth Land Tenure Investigation for Constraints Analysis.
University of Ghana http://ugspace.ug.edu.gh

80
Untong, A., Pongpatcharatorntep, D., & Kaosa-ard, M. (2010). Import demand for Thai
rice and factors determining its price in modern trade market of China. Applied
Economics Journal, 17(2), pp 55–77.
USDA-National Agricultural Statistics Service. (2008). Quick statistics for rice. Available
at http://www.nass.usda.gov/Data_ and_Statistics/Quick_Stats/index.asp (verified 2
November 2014). USDA-NASS, Washington, DC.
Wang, J., Cramer, G. L., & Wailes, E. J. (1996). Production Efficiency in Chinese
Agriculture: evidence from Rural Household Survey data. Agricultural Economics,
15, 17–28.
Wang, L., Siebenmorgen, T. J., Matsler, A. D., & Bautista, R. C. (2004). Effects of Rough
Rice Moisture Content at Harvest on Peak Viscosity. Cereal Chemistry, 81(3), 389–
391.
WARDA. (2005). Rice, A Strategy Crop for Food Security and Poverty Alleviation.
WARDA, FAO, & SAA. (2008). NERICA: The New Rice for Africa. In E. A. Somado,
R. G. Guei, & S. O. Keya (Eds.), A compendium Africa Rice Center, Cotonou, Benin;
Food and Agriculture Organization of the United Nations, Rome, Italy; Sassakawa
Africa Association, Tokyo, Japan.
WARDA, SAA, & FAO. (2008). NERICA: The New Rice for Africa – A compendium .
(Somado, E.A., Guei, R.G. and Keya, S.O., eds). Africa Rice Center, Cotonou,
Benin; Food and Agriculture Organization of the United Nations, Rome, Italy;
Sassakawa Africa Association, Tokyo, Japan., 2008.
Wayne, C. S., & Dilday, R. H. (2003). Rice: origin, history, technology, and production.
John Wiley & Sons, Inc.
Weir, S., & Knight, J. (2004). Externality effects of education: dynamics of the adoption
and diffusion of an innovation in rural Ethiopia. Economic Development and
Cultural Change, 53, 93–113.
World Bank. (2007). Human Development Report for Nigeria (HDR). November, 2007.
World Bank, FAO, & NRI. (2011). Missing Food : The Case of Postharvest Grain Losses
in Sub Saharan Africa.
University of Ghana http://ugspace.ug.edu.gh

81
APPENDICES
APPENDIX I: QUESTIONNAIRE ON ESTIMATING QUANTITATIVE LOSSES
DURING HARVESTING AND HANDLING OF ROUGH RICE
The quantitative loss assessment survey seeks to estimate losses incurred at farm level
and your responses to these questions will be supportive to the study. Information given
to the survey will be used for academic and research purposes. The information will be
treated confidential. We humbly ask for your cooperation to make this a success.
1. Gender: A. Male B. Female
2. What rice variety do you cultivate? …………………….
3. Do you participate in postharvest handling training? 1. Yes [ ] 2. No [ ]
4. Do you experience postharvest losses at farm? 1. Yes [ ] 2. No [ ]
5. What percentage quantity of loss do you experience?
1. <10% 2. 10%-19% 3. 20%-29% 4. >30%
6. Do you know how to measure the losses perceived above? 1. Yes [ ] 2. No [ ]
7. What are the causes of the losses?
1. Lack of improved seeds 2. Planting Methods 3. Time of Harvest 4. Labour
1=very high, 2=high, 3=moderate 1 2 3
a. Lack of improved seeds
b. Planting Methods
c. Time of Harvest
d. Labour
8. At which stage do you experience the highest losses?
1. Harvesting 2. Transportation 3. Threshing 4. In-complete cutting
University of Ghana http://ugspace.ug.edu.gh

82
FARM AREA UNDER CULTIVATION AND LOSS COMPUTATION
(Av. Yield of Jasmine 85 at Tono Irrigation Project is at (3.3 mt/ha or 3300kg/ha)
Takeshima et al. (2013); raw data from CRI/SARI/IFPRI survey (2012 – 2013)
9. Rice field
under
cultivation
(ac.) 1 Ac.
= 0.4 Ha
Total
Volume
of Paddy
produced
/ (number
of bags)
Weight
per bag
Volume of
paddy used
for household
consumption/
no. of bags
Volume
stored
(kg)/number
of bags at
store
Total
volume of
bags for
sales
(kg)/Supply
Computed PHL
(Y)
10. How much do you sell a 160 kg sac of rough rice? ………………………
11. Do you use tarpaulin? 1. Yes [ ] 2. No [ ]
12. What is the size of the tarpaulin? 1. Small 2. Medium 3. Large [ ]
13. How do you get access to tarpaulin? 1. Self-owned 2. Hired 3. Improvised
14. How many times do you thresh harvested straws? 1. Once 2. Numerous
15. How many work force do you use to harvest and thresh harvested straws? ……….
16. How many days do the work force use to complete the task? ..............
17. Estimated man days during harvesting and handling. ………………
CHALLENGES FACED AT FARM LEVEL
Rank the challenges in order of most pressing to least pressing using numerical scales
from 1 to 5.
Challenges Rank (using 1 most pressing)
Bird Scaring
Fungal Diseases
Limited Access to Credit
Access to tarpaulin
Labour
Weather
University of Ghana http://ugspace.ug.edu.gh

83
APPENDIX II: DATA COLLECTION SHEET (FIELD WORK)
Data sheet for loss assessment during manual harvesting operation
a. Baseline information (Control)
Date of harvesting-------------------------- Farmer No………Village------------------
Variety planted------------------------- Planting date ----------------------
Improved harvesting: (35DAH)
Plot
No
Plot
size
No of
hill
Label on
sampling
bag
Score of
threshability
Field moisture contents
(of grains collected
outside the plots)
Weight of
grains
from
sampled
straws
Mean
moisture
contents
Rep
1
2 3 Mean
A1
A2
A3
a. Farmer’s Harvesting Date
Actual Harvesting Time ------------ Or Early Harvesting Time --------
------------- Plot
No
Plot
Size
No
of
Hill
Label On
Sampling
Bag
Score of
Threshability
Field Moisture Contents Weight of
Grains from
Sampled
Straws
Mean
Moisture
Contents
Rep1 Mean
B1
B2
B3
Actual harvesting time for collecting shattered grain
Plot No Plot size No of hill Weight
Weight of
dropped grains
weight of the
threshed grain
total weight of
grain in the plot
C1
C2
C3
University of Ghana http://ugspace.ug.edu.gh

84
Losses due to grain dropping during intermediary piling (infield staking)
Plot
No
Plot size
Weights Field moisture contents
weight of
the grain
dropped on
first
tarpaulin
before
threshing
weight of
the threshed
grain
total weight of
grain in the
plot
Rep1 Rep2 Rep3 Mean
Plot
1
5m x 5m
Plot
2
5m x 5m
Plot
3
5m x 5m
Data sheet for loss assessment during Threshing and Cleaning
a. Farmer’s Manual Practices Plot
No
Plot size Sample
size
Weight of
farmer
threshed
paddy
Mean
moisture
content of
farmer
threshed
paddy
Weight of
scattered
grains
Weight of
grains from
re-thresh
all those
straws
Label on
sampling
bag (1kg)
FMTP
D1 5m x 5m 1/3
D2 5m x 5m 1/3
D3 5m x 5m 1/3
use improved harvested panicle samples from plot d only
University of Ghana http://ugspace.ug.edu.gh

85
APPENDIX III: TABLES
Shattering losses at 35 Days After Heading (35DAH)
Shattered grains
Farm No Average
Weight of
threshed grain
in quadrant
(kg)
Average
Weight of
dropped
grains (kg)
Average Total
weight of grains
in quadrant (kg)
Average
shattering
in the
quadrant
(%)
1
2
3
4
5
6
7
8
9
10
11
12
1.551
1.078
1.895
1.236
1.611
0.925
1.143
1.072
1.063
1.224
1.458
1.224
0.005
0.007
0.004
0.011
0.01
0.002
0.004
0.008
0.004
0.003
0.006
0.003
1.556
1.085
1.899
1.246
1.621
0.927
1.147
1.08
1.067
1.227
1.464
1.227
0.32
0.65
0.21
0.88
0.61
0.21
0.34
0.74
0.37
0.24
0.41
0.24
In – field Stacking Losses at 35 Days After Heading (35DAH)
In field stacking
Farm No. Average Weight
of threshed
grain in
quadrant (kg of
paddy)
Average Weight
of dropped
grains that
dropped first on
tarpaulin before
threshing
Average Total
weight of
grains in
quadrant (kg of
paddy
Average in
field stacking
in the
quadrant (%)
1
2
3
4
5
6
7
8
9
10
11
12
17.237
11.999
21.018
13.729
17.896
10.266
12.704
13.864
11.808
13.064
16.225
10.948
0.319
0.055
0.262
0.162
0.222
0.137
0.061
0.059
0.051
0.077
0.079
0.051
17.556
12.054
21.281
13.892
18.118
10.403
12.744
13.923
11.859
13.714
16.305
10.999
1.82
0.46
1.23
1.17
1.23
0.32
0.48
0.42
0.43
0.56
0.48
0.46
University of Ghana http://ugspace.ug.edu.gh

86
Threshing losses at 35 Days After Heading (35DAH)
Farm No Re-
threshed
collected
(kg of
paddy)
Scattered
grains
collected
(kg of
paddy)
Re -
threshed
and
scattered
grains
collect
Threshed
paddy
Yield of
quadrant
Grain
loss
(%)
1
2
3
4
5
6
0.302
0.314
0.825
0.074
0.05
0.095
0.683
0.348
0.511
0.312
0.159
0.054
0.985
0.662
1.336
0.386
0.209
0.149
14.536
11.499
10.818
15.499
13.186
11.659
16.506
12.823
13.49
16.271
13.604
11.808
5.97
5.16
9.9
2.37
1.54
1.26
Shattering losses (Farmer Practice)
Farmer No. Average
Weight of
threshed grain
in quadrant
(kg)
Average
Weight of
dropped
grains (kg)
Average
Total
weight
of
grains in
quadrant
(kg)
Average
shattering in the
quadrant (%)
1
2
3
4
5
6
7
8
9
10
11
12
0.852
0.754
0.833
0.924
0.753
0.925
0.843
0.772
0.663
0.724
0.558
0.924
0.02
0.011
0.025
0.011
0.011
0.014
0.02
0.015
0.018
0.013
0.016
0.013
0.872
0.765
0.858
0.935
0.764
0.939
0.863
0.787
0.681
0.737
0.574
0.937
2.29
1.44
2.91
1.18
1.44
1.49
2.32
1.91
2.64
1.76
2.78
1.39
University of Ghana http://ugspace.ug.edu.gh

87
In – field Stacking Losses (Farmer Practice)
Farm No. Average
Weight of
threshed grain
in quadrant (kg
of paddy)
Average
Weight of
dropped
grains that
dropped first
on tarpaulin
before
threshing
Average
Total
weight of
grains in
quadrant
(kg of
paddy
Average in
field stacking in
the quadrant
(%)
1
2
3
4
5
6
7
8
9
10
11
12
15.211
9.54
19.018
10.729
13.896
9.266
10.704
11.864
11.408
10.064
14.225
9.948
0.453
0.355
0.362
0.362
0.252
0.237
0.361
0.159
0.251
0.277
0.379
0.251
15.664
9.895
19.38
11.091
14.148
9.503
11.065
12.023
11.659
10.341
14.604
10.199
2.89
3.59
1.87
3.26
1.78
2.49
3.26
1.32
2.15
2.68
2.59
2.46
Threshing losses (Farmer Practice)
Farm
No
Re-threshed
collected
(kg of
paddy)
Scattered
grains
collected
(kg of
paddy)
Re - threshed
and scattered
grains collect
Threshed
paddy
Yield of
quadrant
Grain
loss (%)
1
2
3
4
5
6
0.202
0.214
0.325
0.174
0.155
0.195
0.643
0.348
0.511
0.332
0.359
0.454
0.845
0.562
0.836
0.506
0.514
0.649
10.536
9.499
8.818
11.499
10.186
9.659
12.226
10.623
10.49
12.511
11.214
10.957
6.91
5.29
7.96
4.04
4.58
6.72
Sample Size Mean Variance deviation of mean
%35days after heading 10 1.0836 0.04625 0.2151 0.06801
Farmer date of harvest 12 0.8355 0.07324 0.2706 0.07813
Difference of means: 0.248
Standard error of difference: 0.106
95% confidence interval for difference in means: (0.02733, 0.4689)
University of Ghana http://ugspace.ug.edu.gh

88
Test of null hypothesis that mean of 35 Days After Heading is equal to mean of Farmer
Date of Harvest
Test statistic t = 2.34 on 20 d.f.
Probability = 0.030
Harvest Moisture Content of Rough Rice at Tono Irrigation Project
Identifier Minimum Mean Maximum Values Missing
Moisture 17.10 20.88 24.70 12 0
One-sample t-test
Summary
Standard Standard error
Sample Size Mean Variance deviation of mean
Moisture 12 20.88 6.556 2.560 0.7391
95% confidence interval for mean: (19.26, 22.51)
Test of null hypothesis that mean of moisture is equal to 22.00
Test statistic t = -1.51 on 11 d.f.
Probability = 0.159
Kendall's W Test
Ranks
Mean
Rank
Bird Scaring 5.22
Fungal Disease 3.90
Limited Access to credit 1.98
Access to tarpaulin 1.51
Labour 2.73
Weather 5.66
University of Ghana http://ugspace.ug.edu.gh

89
Challenges N Mean Standard
Deviation
Minimum Maximum
Bird Scaring
Fungal Disease
Limited Access to credit
Limited Access to tarpaulin
Labour
Weather
84
84
84
84
84
84
5.21
3.89
1.96
1.50
2.72
5.67
0.64
0.56
0.83
0.59
0.92
0.49
3
3
1
1
1
4
6
5
4
3
4
6
Paired Samples Test
Paired Differences t df Sig. (2-
tailed) Mean Std.
Deviation
Std. Error
Mean
95% Confidence
Interval of the
Difference
Lower Upper
Pair
1
Quantity
consumed –
Quantity lost
38.095 631.080 68.856 -98.857 175.048 .553 83 .582
University of Ghana http://ugspace.ug.edu.gh
Copyright © 2022 FDOKUMEN