ESTIMATION OF PARAMETERS DESCRIBING MORPHO-PHYSIOLOGICAL FEATURES OF MEDITERRANEAN RICE VARIETIES...
10
Scientific Section Boschetti M. et al. Italian Journal of Agrometeorology 40 - 49 (3) 2006 40 ESTIMATION OF PARAMETERS DESCRIBING MORPHO-PHYSIOLOGICAL FEATURES OF MEDITERRANEAN RICE VARIETIES FOR MODELLING PURPOSES STIMA DI PARAMETRI MORFO-FISIOLOGICI DI INTERESSE MODELLISTICO PER VARIETÀ DI RISO MEDITERRANEE Mirco Boschetti 1,2 *, Stefano Bocchi 2 , Daniela Stroppiana 1 , Pietro Alessandro Brivio 1 1 IREA-CNR, Institute for Electromagnetic Sensing of the Environment, National Research Council, Via Bassini 15, 20133 Milano, Italy. 2 Department of Crop Science, University of Milano, Via Celoria 2, 20133 Milano, Italy * Corresponding Author : Tel. +39-02-23699297, E-mail: [email protected], Fax: +39-02-23699300. Received 23/9/2006 – Accepted 6/12/2006 Abstract This paper illustrates the estimation of parameters describing some morphological and physiological characteristics of Ja- ponica-type and Indica-type rice varieties to be used for crop models parameterization. Seasonal variability of Specific Leaf Area (SLA; m 2 kg -1 ) was determined from biomass and Leaf Area Index (LAI; m 2 m -2 ) measurements. Coefficient of light extinction (k; -) was estimated by transmittance measurements recorded by LAI2000. Radiation Use Efficiency (RUE; g MJ -1 ) was derived by regressive analysis between different above ground biomass measurements and corresponding cumu- lative Absorbed Photosynthetically Active Radiation (APAR; MJ m -2 ). Results show that development stage determines more variability in SLA than cultivar typology. k parameter varies during the different plant developing stages in agree- ment with other published data; however, no significative difference is evident among the varieties, representative of dif- ferent rice-group, when a mean seasonal value of 0.53 is derived. The analysis highlighted a sensible difference in RUE values between traditional tall Japonica variety (1.83 g MJ -1 ) and new semi-dwarf Indica variety (3.14 g MJ -1 ). A method to account for thermal limitations to RUE derived by field experiment is proposed. Applying this procedure, an unstressed RUE value (required by simulation models) for Japonica type medium late and Indica type early varieties was found to be respectively 2.69 and 3.25 g MJ -1 . Keywords: Oryza sativa L., coefficient of light extinction, radiation use efficiency, specific leaf area, above ground biomass, leaf area index, simulation model. Riassunto Il presente lavoro descrive le metodologie adottate per la stima di alcuni parametri morfo-fisiologici della coltura riso utili alla parametrizzazione di modelli di crescita e produzione. La sperimentazione ha permesso di calcolare per due gruppi di varità, tipologia Japonica e tipologia Indica, la variabilità stagionale dell’ area specifica fogliare (SLA; m2 kg-1), come rapporto tra misure di indice di area fogliare (LAI; m2 m-2) e misure di biomassa e di stimare, grazie a misure di trasmit- tanza acquisite con lo strumento LAI2000, valori del coeffiente di estinzione della luce (k; -). Il parametro Radiation Use Efficiency (RUE; g MJ-1) è stato ottenuto con analisi di regressione tra periodici campionamenti di biomassa e relativi va- lori cumulati di Absorbed Photosynthetically Active Radiation (APAR; MJ m-2). I risultati mostrano che lo stadio di svi- luppo determina una grande variabilità del parametro SLA per entrambi i gruppi di varietà analizzati. Il parametro k pre- senta una variabilità in funzione della varietà e dello stadio di sviluppo in accordo con altre pubblicazioni. Non si sono tuttavia evidenziate differenze significative tra le varietà nella stima di un valore medio annuo (0.53, -). La stima della RUE ha invece rilevato differenze sostanziali tra varietà tradizionali a tipologia Japonica (1.83 g MJ-1) e nuove varietà a profilo Indica (3.14 g MJ-1). Un metodo originale viene proposto nella stima della RUE basata su dati sperimentali di campo per compensare eventuali limitazioni termiche. Applicando tale procedura, sono stati ottenuti valori potenziali del parametro RUE, richiesti per la simulazione modellistica, per le varietà appartenenti alla tipologia Japonica con ciclo me- dio (2.69 g MJ-1 ) e a tipologia Indica a ciclo corto ( 3.25 g MJ-1). Parole chiave: Oryza sativa L., coefficiente di estinzione della luce, efficienza d’uso della radiazione, Area Specifica Fogliare, biomassa, Indice di Area Fogliare, modelli di simulazione. Introduction Computer models can be efficiently used to simulate growth and yield of many crops since the 70s. Perform- ances of these models depend on reliable parameteriza- tions which require specific experiments to measure and estimate the proper crop parameters. The WARM model (Confalonieri et al., 2005) was de- veloped in order to find the best balance between reli- ability and usability by reducing the number of parame- ters to a minimum directly measurable or derivable from measured data. The net photosynthesis is simulated on
Transcript of ESTIMATION OF PARAMETERS DESCRIBING MORPHO-PHYSIOLOGICAL FEATURES OF MEDITERRANEAN RICE VARIETIES...

Scientific Section Boschetti M. et al. Italian Journal of Agrometeorology 40 - 49 (3) 2006
40
ESTIMATION OF PARAMETERS DESCRIBING MORPHO-PHYSIOLOGICAL FEATURES OF MEDITERRANEAN RICE VARIETIES
FOR MODELLING PURPOSES
STIMA DI PARAMETRI MORFO-FISIOLOGICI DI INTERESSE MODELLISTICO PER VARIETÀ DI RISO MEDITERRANEE
Mirco Boschetti 1,2 *, Stefano Bocchi2 , Daniela Stroppiana1, Pietro Alessandro Brivio1
1 IREA-CNR, Institute for Electromagnetic Sensing of the Environment, National Research Council, Via Bassini 15, 20133 Milano, Italy.
2 Department of Crop Science, University of Milano, Via Celoria 2, 20133 Milano, Italy * Corresponding Author : Tel. +39-02-23699297, E-mail: [email protected], Fax: +39-02-23699300.
Received 23/9/2006 – Accepted 6/12/2006 Abstract This paper illustrates the estimation of parameters describing some morphological and physiological characteristics of Ja-ponica-type and Indica-type rice varieties to be used for crop models parameterization. Seasonal variability of Specific Leaf Area (SLA; m2 kg-1) was determined from biomass and Leaf Area Index (LAI; m2 m-2) measurements. Coefficient of light extinction (k; -) was estimated by transmittance measurements recorded by LAI2000. Radiation Use Efficiency (RUE; g MJ-1) was derived by regressive analysis between different above ground biomass measurements and corresponding cumu-lative Absorbed Photosynthetically Active Radiation (APAR; MJ m-2). Results show that development stage determines more variability in SLA than cultivar typology. k parameter varies during the different plant developing stages in agree-ment with other published data; however, no significative difference is evident among the varieties, representative of dif-ferent rice-group, when a mean seasonal value of 0.53 is derived. The analysis highlighted a sensible difference in RUE values between traditional tall Japonica variety (1.83 g MJ-1) and new semi-dwarf Indica variety (3.14 g MJ-1). A method to account for thermal limitations to RUE derived by field experiment is proposed. Applying this procedure, an unstressed RUE value (required by simulation models) for Japonica type medium late and Indica type early varieties was found to be respectively 2.69 and 3.25 g MJ-1. Keywords: Oryza sativa L., coefficient of light extinction, radiation use efficiency, specific leaf area, above ground biomass, leaf area index, simulation model. Riassunto Il presente lavoro descrive le metodologie adottate per la stima di alcuni parametri morfo-fisiologici della coltura riso utili alla parametrizzazione di modelli di crescita e produzione. La sperimentazione ha permesso di calcolare per due gruppi di varità, tipologia Japonica e tipologia Indica, la variabilità stagionale dell’ area specifica fogliare (SLA; m2 kg-1), come rapporto tra misure di indice di area fogliare (LAI; m2 m-2) e misure di biomassa e di stimare, grazie a misure di trasmit-tanza acquisite con lo strumento LAI2000, valori del coeffiente di estinzione della luce (k; -). Il parametro Radiation Use Efficiency (RUE; g MJ-1) è stato ottenuto con analisi di regressione tra periodici campionamenti di biomassa e relativi va-lori cumulati di Absorbed Photosynthetically Active Radiation (APAR; MJ m-2). I risultati mostrano che lo stadio di svi-luppo determina una grande variabilità del parametro SLA per entrambi i gruppi di varietà analizzati. Il parametro k pre-senta una variabilità in funzione della varietà e dello stadio di sviluppo in accordo con altre pubblicazioni. Non si sono tuttavia evidenziate differenze significative tra le varietà nella stima di un valore medio annuo (0.53, -). La stima della RUE ha invece rilevato differenze sostanziali tra varietà tradizionali a tipologia Japonica (1.83 g MJ-1) e nuove varietà a profilo Indica (3.14 g MJ-1). Un metodo originale viene proposto nella stima della RUE basata su dati sperimentali di campo per compensare eventuali limitazioni termiche. Applicando tale procedura, sono stati ottenuti valori potenziali del parametro RUE, richiesti per la simulazione modellistica, per le varietà appartenenti alla tipologia Japonica con ciclo me-dio (2.69 g MJ-1 ) e a tipologia Indica a ciclo corto ( 3.25 g MJ-1). Parole chiave: Oryza sativa L., coefficiente di estinzione della luce, efficienza d’uso della radiazione, Area Specifica Fogliare, biomassa, Indice di Area Fogliare, modelli di simulazione. IntroductionComputer models can be efficiently used to simulate growth and yield of many crops since the 70s. Perform-ances of these models depend on reliable parameteriza-tions which require specific experiments to measure and estimate the proper crop parameters.
The WARM model (Confalonieri et al., 2005) was de-veloped in order to find the best balance between reli-ability and usability by reducing the number of parame-ters to a minimum directly measurable or derivable from measured data. The net photosynthesis is simulated on

Scientific Section Boschetti M. et al. Italian Journal of Agrometeorology 40 - 49 (3) 2006
41
the basis of the Monteith’s model (Monteith, 1977), also known as Radiation Use Efficiency (RUE), that defines the Above Ground Biomass accumulation (AGB, g m-2) for a given time period as APAR multiplied by RUE co-efficient. Light interception by the canopy is estimated, assuming a monolayer canopy, from LAI and k using the Lambert-Beer’s law (Monsi and Saeki, 1953). Daily leaf area development is calculated as a function of the bio-mass partitioned to leaves each day and the development stage specific SLA. In order to apply RUE-based models, such as WARM, for rice regional monitoring in Mediterranean-European environment, crop specific parameters are needed. No dedicated field studies have been carried out to measure the previous mentioned parameters for Mediterranean varieties. In particular, for RUE, Campbell et al. (2001) noted that although rice is the most important food crop in the world, little field-scale, season-long research on RUE has been conducted. For these reasons the objective of this work was the es-timation k, RUE, SLA, and Harvest Index (HI; -) to be used in crop modelling for regional estimates of rice pro-duction. The variability of these parameters as a function of phenology and variety was analysed by collecting data in two field experiments carried out in 2003 and 2004. A method to estimate maximum potential RUE for model-ling application not affected by temperature limitation was tested using also other available experimental field data set. Not all the parameters necessary to run complex explicative models were estimated, but only those usu-ally considered the most important in describing LAI de-velopment and light harvesting in RUE-based approach. For all the estimated parameters, the group-of-varieties approach proposed by Confalonieri and Bocchi (2005) was followed, estimating specific sets of crop parameters for Indica type early varieties (IE), Japonica type early varieties (JE) and Japonica type medium-late varieties (JM). Physiological and modelling meaning of the selected parameters A short description of the physiological and modellistic meaning and importance of SLA, k, HI and RUE pa-rameters are here presented Specific Leaf Area Specific leaf area is the leaf area (m2) to leaf mass (kg) ratio. SLA values range between 15 and 40 m2 kg-1 de-pending on crop typology but present also an intra-specific variability. Physiologically, high SLA values reduce the amount of assimilate required to produce a given leaf area, this results in an earlier ground cover and consequently a greater light harvest that produces a higher assimilation rate early in the season. It is one of the most important parameters in crop simulation models because it determines the amount of green area index (GAI; -) produced in a day.
Coefficient of light extinction The coefficient of light extinction k describes the capac-ity of the canopy of light interception. k coefficient is crop specific but can differ also on the basis of cultivated varieties. The light extinction capacity depends on the plant morpho-physiological conditions and consequently it varies during the season dependently on plant devel-opment. As underlined by Kiniry et al. (2001) lower val-ues of k allow a better light penetration into the canopy thus illuminating more leaf area that guarantee a more efficient light harvest. This characteristic is typical of plant with more upright leaves. In crop modelling this parameter describes the light penetration through the canopy and is used to quantify, through the Lambert – Beer’s law (Monsi and Saeki, 1953), the fraction of Absorbed Photosynthetically Ac-tive Radiation (fAPAR) (equation 1). High k values de-termine strong light absorption while lower value deter-mines a deeper light penetration in the canopy.
LAIkfAPAR *exp1 −−= ( 1)
Wageningen models (e.g. WOFOST; Van Keulen and Wolf, 1986) requires different k values for different de-velopment stages. Other models such as CropSyst (Stöckle et al., 2003) or WARM (Confalonieri et al., 2005) use a mean k value for the entire crop cycle. For this reason k parameter variations were analysed along the season and a crop mean value was also estimated. Harvest Index The harvest Index describes the ratio between the com-mercial part (in case of cereals is grain) and the total above ground biomass at the end of the crop cycle. The concept of HI was used during the cultivars selection to obtain better ratios between source-sink organs. The semi-dwarf cultivars have lower biomass production but a higher grains weight being also more resistant to lodg-ing and more stable in terms of grains production over the years. Before the Green Revolution, HI of many crops was 0.3 or less, and now it has been increased to about 0.5 in many cases. Modern high-yielding rice varieties can reach HI greater than 0.6. For some crop models once total biomass production is simulated, rice yield can be estimated by applying a specific HI. Italian varieties range from traditional low yielding cultivar (HI ≈ 0.38) to new high yielding (HI > 0.5). Radiation Use Efficiency The amount of CO2 assimilated by the crop canopy and converted to dry biomass can be considered nearly stable per unit of intercepted/absorbed solar radiation under non stress condition (Monteith, 1977; Sinclair and Muchow, 1999). At canopy level, the saturation limiting processes that occur in leaf photosynthesis are far less pronounced so linear model can be used (Kiniry et al., 1989). RUE can be experimentally measured over a period of time as crop dry weight increases divided by APAR re-ferred to the same period (Sinclair and Muchow, 1999). The amount of APAR used for RUE estimation depends

Scientific Section Boschetti M. et al. Italian Journal of Agrometeorology 40 - 49 (3) 2006
42
on two elements: the incoming PAR and the capacity (i.e. the fraction) of absorption by the crop (fAPAR). PAR can be measured directly with quantum sensor in-struments or estimated as a proportion (~45-50%) of in-coming global radiation measured by traditional mete-orological station (Kiniry et al., 1989). fAPAR can be directly derived by transmittance measurements or esti-mated from LAI measurements using a proper k in Lam-bert-Beer’s law. Other way to derived RUE is to convert measurements of carbon exchange (CE) between atmosphere and plants
(Campbell et al., 2001) in equivalent dry biomass value adopting crop specific coefficient of transformation; the estimated accumulated biomass along a period of time is then related to corresponding absorbed PAR to calculate RUE. A high efficiency in radiation use is typical of efficient biological systems in terms of carbon fixation and there-fore dry biomass accumulation. Much breeder’s work was done to increase crop efficiency changing the plant habitus selecting dwarfness, erect leaves, high canopy LAI and biochemical photosynthetic efficiency. For this
Tab. 1 – Rice parameters (SLA, k, RUE, max LAI and HI) values found in international literature. Tab. 1 – Valori pubblicati dei parametri della coltura riso (SLA, k, RUE, max LAI and HI) .
Parameter Value Temp.var. Location Variety Type Reference 39 after 31 days Italy Gladio semi-dwarf Confalonieri and Bocchi, 2005
27-60 after 30 days - - - Ash et al., 1998 35 after 31 days -
26.6 after 46 days -
SLA (m2 kg-1)
23 after 64 days Cote d'Ivore
- Med. Tall Dingkuhn et al. 1999
0.4 -0.6 - - - - Kropff et al., 1994* 0.35 DVS<0.65 - - - 0.49 0.65<DVS<1.0 - - - 0.61 1.0<DVS<2.0 - - -
Casanova et al., 1998
0.65 - - - - Montheith 1969* 0.35 DVS<0.53 - - - Mitchell et al. 1998
0.30 - 0.38 after 31 days - - 0.47 mean - - Med. Tall Dingkuhn et al. 1999
0.38-0.40 range Jefferson - 0.45 mean Cypress - 0.42 mean
Texas (US) Lemont -
Kiniry et al; 2001
K (-)
0.68 mean Texas (US) Cypress - Cambpell et al., 2001 4.1 mean - - - Warren-Wilson, 1967* 3.28 mean - - - Horie and Sakuratani (1985)** 2.25 mean - - - Casanova et al., 1998 2.2 mean - - - Kiniry et al. 1989 2.34 mean Philippine - - Mitchell et al, 1998 2.37 mean - - - Charles-Edwards, 1982* 2.41 mean - - - Horie et al., 1997 2.32 mean (1999) 2.46 mean (2000) Jefferson Early US
var. 2.41 mean (1999) 2.77 mean (2000) Cocodrie Early US
var. 2.09 mean (1999) 2.59 mean (2000) Cypress Late US
var. 2.21 mean (1999) 2.24 mean (2000)
Texas (US)
Lemont Late US var.
Kiniry et al; 2001
5.09 mean (1998)
RUE (g AGB MJ-1)
3.52 mean (1999) Texas (US) Cypress Late US var. Cambpell et al., 2001
> 5 - Texas (US) Cypress Cambpell et al., 2001 > 7.0 - Arkansass (US) - - Grigg et al. 2000*
5.7 - 8.2 - Philippine - - 6.7 - 10.4 - China - - Ying et al. 1998a*
6.0 - 7.0 - Japan - - Hasegawa and Horie, 1996 > 7.0 - Australia Lemont - Borrell et al., 1997* 5.8 - - Tall 3.0 - Australia - semi-dwarf Prasertsak and fukai, 1997*
5.3 - - traditional 6.8 - Cote d'Ivore - improved Dingkuhn et al. 1999
LAI (max)
11.2-12.7 - Texsas (US) Lemont Kiniry et al; 2001 0.35 - 0.50 - Philippine - - 0.44-0.48 - China - - Ying et al. 1998a*
0.36-0.62 - China - -
0.40-0.55 - India - -
0.35 -0.55 - Philippine - -
HI (-)
0.42 - 0.57 - Australia - -
Berge et al., 1997*
Developmet stage (DVS): Seeding DVS=0, flowering DVS=1, maturity=2. Intemidiate stage defined by linear model based on temperature (Van Keulen and Seligmanm 1987
* reference found in Kiniry et al., (2001)
** reference found in Sinclair and Muchow (1999)

Scientific Section Boschetti M. et al. Italian Journal of Agrometeorology 40 - 49 (3) 2006
43
reason new rice varieties present in general higher RUE values with respect to traditional ones. Consideration related to RUE estimation Radiation use efficiency as a crop model parameter should represent a potential maximum value for the crop. External factors that reduce crop RUE in specific condi-tions (development stage, level of irradiance, tempera-ture, damages for cold and disease) should be simulated by the model. In this way it is guaranteed the general va-lidity of the model in situation that differs from that of the experimental data used for the calibration. While in field experiments management tries to prevent stresses (i.e. water needs, weeds and pests presence) only rarely researches are carried out in non-limiting temperature conditions. Temperature represents indeed a limiting fac-tor that affect RUE estimation (Prince 1991; Stöckle et al., 2003), especially when a macrothermal crop (such as rice) is grown in temperate environment. Kiniry et al. (2001), reporting the results of RUE estima-tion of US rice cultivars, underline that the difference in RUE observed in two subsequent field experiment, year 1999 and 2000, were related to temperature changes. The Authors showed that the higher value estimated in 2000 correspond to summer average higher temperatures re-corded from May to July. Similar results can be derived by analysing data published by Campbell et al. (2001): seasonal rice RUE derived from the 1998 field experi-ment was higher than that for 1999 data (Tab. 3, Camb-pell et al., 2001) as a consequence of mean higher sea-sonal temperature (Tab.1, Cambpell et al., 2001). For these reasons, Tao et al. (2005) derived a potential RUE value for Maize to be used in CASA model (Potter et al., 1993) for regional applications considering both temperature and moisture down-regulator. The first fac-
tor takes into account physiological reduction of RUE when temperatures are higher or lower than the optimal thermal range for growth. The latter factor is used to compensate for potential water stress. Recently, Ahl et al. (2004) adopted a similar approach to calculate RUE, for different forest species, considering air and soil tem-perature constraints in order to derive the cumulative growing season APAR that effectively influenced plant growth. Materials and methods Field experiments Data for parameters’ estimation come from two field ex-periments. A summary of the data sets used in relation to the parameters estimated is reported in table 2. The 2004 experiment was conducted in Opera (Milano Province; Lat 45° 23’, Long 9° 11’). Cultivars Gladio (Indica type, early, IE) and Volano (Japonica type, me-dium-late, JM) were sown in May 24 and grown under flooded conditions. The two varieties were chosen be-cause belonging to different morpho-physiological group. Gladio is the most cultivated variety in Italy (23.26% of total rice, Statistics from Ente Nazionale Risi-ENR) and Volano is the second Japonica – medium cycle variety cultivated, after Balilla (6.82% of total rice). The experimental factors (variety and N fertiliza-tion) were arranged in a completely randomized block design with four replicates to obtain a total of 40 elemen-tary 35 m2 (7×5 m) wide plots. The fertilization was ap-plied in two doses of 80 kg N ha-1 (urea) at the tillering stage (June 22; code 25 of the BBCH scale for rice; Lan-cashire et al., 1991; 0.25 of the development stage code (DVSC) proposed by Van Keulen and Seligam (1987)) and at the beginning of the stem elongation phase (July
Tab. 2 – Field data available for rice crop parameters estimation. Tab. 2 – Dati di campo disponibili per la stima dei parametric della coltura riso. Data set
Culti-var Group Biomass LAI PAR transmision
*** Meteo Parameter est.
# re-plic. Fert # samp. # samp. Method # samp. Method # samp. Par. SLA K HI RUE
Gladio I 4 (T2*) PL1 7 7 and
10 D & L 4 time x 4 replic ok ok ok ok Opera
2004 Volano JM - - - - - 4 time x 4 replic
daily T & GR
- ok ok
-
Besate 2003 Volano JM 4 (T2**)
PL1 4 7 and 3 D & L - - daily T & GR
ok - -
ok Opera 2002
Thai-bonet I 3 LP1 4 3 D - - daily T &
GR - - -
ok Vigna-te 2002 Sillaro I 3 LP1 4 3 D - - daily T &
GR - - -
ok
Loto JE 4 LP1 7 5 D - - daily T & GR
- - - ok
Cripto JM 4 LP1 7 5 D - - daily T & GR
- - - ok
Rosate 1990
Europa JM 4 LP1 7 5 D - - daily T & GR
- - - ok
L = LAI2000 D = destructive; GR=global radiation; T= temperature
T2* 80 + 80 Kg ha-1 *** LAI2000 (DIFN)
T2** 140 Kg ha-1 LP1 Production Level 1 (de Wit and Penning de Vies, 1982)
Scientific Section Boschetti M. et al. Italian Journal of Agrometeorology 40 - 49 (3) 2006
44
20; code 34 of the BBCH; 0.53 of DVSC). Ten indirect LAI2000 measurements were acquired for all the studied plots during the growing season. Destructive AGB and LAI samplings were conducted seven times only for Gladio on the plots which received the maximum nitro-gen dose (Production Level 1 (PL1), de Wit and Penning de Vries, 1982). In the 2003 experiment, cultivar Volano was sown on April 28 and grown under flooded conditions in a com-pletely randomized block design with four replicates. The experimental factor was the top-dressing nitrogen fertilization (urea), applied at the beginning of the stem elongation phase on June 27 (BBCH code = 30; DVSC = 0.42). Nitrogen levels were 0, 70 and 140 kg N ha-1. Seven LAI2000 acquisitions and three destructive bio-mass and LAI measurements were performed during the season for PL1 plots (Table 2). For both the experiments, field management allowed to prevent water stress, weeds and pests. Daily global radiation and temperature data were ac-quired in both the years using a standard weather station positioned close to the field. Data set acquired in 1990 and 2002, presented in Confalonieri and Bocchi (2005), were used to calculated radiation use efficiency for In-dica and Japonica type varieties. Parameters determination Specific Leaf Area SLA values were calculated as the ratio between destruc-tive LAI and biomass. Destructive LAI was measured in laboratory for a sample of six plants per plot: leaf blade and stem (culm and sheath) were separated and laid on a flat surface to acquire digital photographs. Leaf area (i.e. leaf blade; Yoshida, 1981) of all the harvested plants was determined by digital image analysis (Stroppiana et al., 2006). Samples were then dried in an oven at 70 °C until constant weight and subsequently leaf and stem dry bio-mass was determined. SLA value for Volano and Gladio were derived respectively from the 2003 and 2004 LAI and leaf biomass data. Coefficient of light extinction The LAI2000 estimates light transmitted by the ratio of radiative measurements below and above the canopy (LI-COR, Inc., Nebraska, USA). PAR transmittance can be derived multiplying the instrument output DIFN (DIF-fuse Not Intercepted) by a value of 0.94 assuming only 6% of visible light reflected by green canopy (Dingkun et al., 1999). The reliability of this assumption was con-firmed by the analysis of spectral reflectance data ob-tained by field spectroradiometer, data not showed, (Stroppiana et al., 2005). Light extinction coefficient k is then calculated inverting Lambert-Beer’s law as:
1*)ln( −−= LAIPARk transm (eq. 2)
Representative values of k for the two cultivars at differ-ent development stages were in both cases derived by regressing of –ln(PARtransm) vs LAI (Casanova et al., 1998; Dingkuhn et al 1999). LAI values were obtained
by LAI2000 instrument excluding in the calculation the 5th ring (Stroppiana et al., 2006). HI In the 2004 experiment, at physiological maturity, all the plants in half square meter for each PL1 plots were har-vested to calculate HI. Weight of the total AGB and grain were dried in oven and measured. Grains were sub-sequently separated from the panicles and weighted; HI was calculated for each variety as the ratio between the two measurements. Radiation Use Efficiency RUE was calculated as the slope of the linear regression between values of above ground biomass and cumulated APAR (calculated using Eq. 3) (Sinclair e Muchow, 1999). PAR was derived as the 45% of incoming global radiation measured by the weather station (Kiniry et al., 1989) while daily fAPAR time series were estimated by Lambert-Beer formula (Monsi and Saeki, 1953) using the k values previously derived. The daily green LAI time series were obtained interpolating the field LAI measurements, derived by LAI2000, of each experimen-tal data set using a sigma function.
ddd fAPARPARAPAR ×= ( 3)
In the equation the subscript letter d refers to the daily value. Estimation of Potential Radiation Use Efficiency Potential RUE (or RUEmax) was calculated taking into account the constraints to biomass accumulation due to suboptimal thermal conditions by multiplying the daily APAR values for a temperature-dependent limiting fac-tor (Tlim) (eq. 4). Tlim was derived using a beta function drawn by three cardinal temperatures as suggested by Yan and Hunt (1999) (eq. 5).
0
5
10
15
20
25
30
35
40
0.0 0.1 0.2 0.3 0.4 0.5 0.6 0.7 0.8 0.9 1.0 1.1 1.2DVS
SLA
(m2 /k
g)
Volano SLA
Gladio SLA
Fig. 1- Mean SLA values for the different sampling date as a
function of development stage (DVSC code), one standard error bars are also presented. Gladio data are derived from 2004 experiment; Volano from 2003.
Fig. 1- Valore medio di SLA per differenti date di campiona-mento rappresentate in funzione dello stadio di sviluppo (codici DVSC); le barre indicano il valore di deviazione standard. I dati per la varietà Gladio derivano dall’esperimento del 2004 mentre per il Volano da quello del 2003.

Scientific Section Boschetti M. et al. Italian Journal of Agrometeorology 40 - 49 (3) 2006
45
limTfAPARPAReffAPAR ddd ××= (4)
APAReff is the APAR that effectively influence the crop growth
c
TTTT
optc
mc
bopt
babopt
optc
TTTT
TTTTT
⎥⎥⎥
⎦
⎤
⎢⎢⎢
⎣
⎡
⎟⎟⎠
⎞⎜⎜⎝
⎛
−−
⋅⎟⎟⎠
⎞⎜⎜⎝
⎛
−−
=−
−
lim
( 5)
In Eq. 5, Ta (°C) is the average air daily temperature, Tb (°C) is the base temperature for rice growth, Topt (°C) is the optimum temperature for growth, and Tc (°C) is the cutoff temperature for growth. The C parameter of equation 5 was set to 1.92 by assum-ing Tlim = 0.5 when mean temperature is equal to 20 C°. Tb, Tc and Topt are set to 11, 42 and 28°C, respectively, based on Confalonieri and Bocchi (2005). The analysis of Covariance (ANCOVA) was performed to examine the influence on RUE calculation of other factors. ANCOVA method belongs to the Generalized Linear Models (GLM), it introduces in linear regression quantitative (APAR) and qualitative (group-of-varieties and meteorological year) explanatory variables to model the dependent variable (Biomass). ANCOVA analysis was performed to identify whether or not the explanatory variables bring significant information to the model (APAR vs Biomass). This analysis allowed testing if me-teorological conditions influence RUE values and if the cultivar group are characterised by significant different RUE values. Results and discussion Specific Leaf Area dynamic Figure 1 shows the SLA temporal variability for Volano (2003 dataset) and Gladio (2004 dataset) in relation to development stages. The values of SLA for the two va-
rieties present a typical decreasing behaviour. The derived values fall in the range of values reported by other Authors. Asch et al. (1999) for the first 30 days af-ter sowing measured values that range from 27 to about 60 m2 kg-1 respectively for Indica and Japonica type cul-tivars differing in early vigour. Dingkuhn et al. (1998) found values between about 20 and 36 m2 kg-1 during the 30 days after sowing in an experiment with cultivars grown under different N levels and climatic conditions. The experimental results presented here confirmed that mean Indica SLA values are in general slightly higher than Japonica ones along the growing season. Gladio is in fact a newer variety with respect to Volano, character-ised by a more efficient leaf growth. Table 6 reports the derived values in relation to the spe-cific BBCH and DVSC development code. A mean value, average of the observations carried out during the first part of the crop cycle (Stöckle personal communica-tion), is also proposed to be suitable for models that need a single SLA value for the entire season (e.g. CropSyst). Coefficient of light extinction Figure 2 and 3 show PAR extinction coefficient values respectively derived for Japonica type (cv. Volano) and Indica type (cv. Gladio) varieties. As reported in the Literature (Kiniry et al., 2001; Casa-nova et al., 1998; Dingkun et al., 1999), k values vary during the season. The two cultivars were sown the same day (24 may 2004) but presented different phenological stages during the same sampling days because of the dif-ferent lengths of their cycles. Gladio is an early variety while Volano is a medium-late one: the two cultivars need respectively 130 and 155 days from sowing to ma-turity (Ente Nationale Risi; www.enterisir.it /ris_schede.jsp). The sampling period for Volano covers four phenologi-
y = -0.58x - 0.50R2 = 0.74
y = -0.59x - 0.21R2 = 0.89
y = -0.53x - 0.36R2 = 0.93
y = -0.60x - 0.06R2 = 0.92-5
-4.5
-4
-3.5
-3
-2.5
-2
-1.5
-1
-0.5
0
0 1 2 3 4 5 6 7 8
LAI [m2/m2]
ln (P
AR
tran
smitt
ed)
16/06 (DAS 23)
14/07 (DAS 51)
26/07 (DAS 63)
25/08 (DAS 93)
Fig. 2- PAR extinction coefficient derived by regression analysis
(continuous line) of ln(PARtrans) and Leaf Area Index for VOLANO (Japonica type). Different k values were calcu-lated at 23 (tillering), 51 (stem elongation), 63 (booting) and 93 (heading) days after sowing.
Fig. 2- Coefficiente di estinzione della PAR derivato da analisi di regressione (linea continua) tra ln(PARtrans) e Leaf Area Index per varietà VOLANO (Japonica type). I differenti va-lori di k sono stati calcolati rispettivamente 23 (tillering), 51 (stem elongation), 63 (booting) e 93 (heading) giorni dopo la semina.
y = -0.43x - 0.54R2 = 0.33
y = -0.45x - 0.39R2 = 0.72
y = -0.49x - 0.34R2 = 0.90
y = -0.64x + 0.11R2 = 0.93
-4.5
-4
-3.5
-3
-2.5
-2
-1.5
-1
-0.5
0
0 1 2 3 4 5 6 7 8
LAI [m2/m2]
ln (P
AR
tran
smitt
ed)
16/06 (DAS 23)
14/07 (DAS 51)
26/07 (DAS 63)
25/08 (DAS 93)
Fig. 3- PAR extinction coefficient derived by regression analysis
(continuous line) of ln(PARtran) and Leaf Area Index GLADIO (Indica type). Different k values were calculated at 23 (tillering), 51 (stem elongation), 63 (booting) and 93 (flowering) days after sowing.
Fig. 3- Coefficiente di estinzione della PAR derivato da analisi di regressione (linea continua) tra ln(PARtrans) e Leaf Area Index per varietà GLADIO (Indica type). I differenti valori di k sono stati calcolati rispettivamente 23 (tillering), 51 (stem elongation), 63 (booting) e 93 (heading) giorni dopo la semina.

Scientific Section Boschetti M. et al. Italian Journal of Agrometeorology 40 - 49 (3) 2006
46
cal stages: tillering (BBCH code = 21; DVSC = 0.20) on June 16th; stem elongation (BBCH code = 30; DVSC = 0.40) on July 14; booting (BBCH code = 43; DVSC = 0.68) on July 26, and heading (BBCH = 0.53; DVSC = 0.90) on August 25th. k values at tillering (0.58) and at stem elongation (0.53) are lower than those for booting (0.59) and heading (0.60) as showed by Casanova et al. (1998). The same sampling period and dates correspond, for Gladio, to different phenological stages: tillering (BBCH code = 21; DVSC = 0.20), stem elongation (BBCH code = 32; DVSC = 0.44); booting (BBCH code = 48; DVSC = 0.79), and anthesis (BBCH code = 61; DVSC = 1). k values for Gladio show a wider range being respectively 0.43, 0.45, 0.49 and 0.64. The different light extinction capacity of the two culti-vars is probably due to differences in canopy morphol-ogy. Mean Tilt Angle (MTA) parameter provided by LAI2000 describes the general foliage orientation with respect to the zenith direction (LI-COR, Inc., Nebraska, USA). Gladio and Volano present MTA values respec-tively of 70° and 60° revealing that Gladio has more erect leaves. Volano, Japonica type, is an old low yielding variety that presents higher k values with respect to Gladio during the entire growing season. Gladio, Indica type semid-warf, is a recent variety selected for its high productivity. As already mentioned, lower values of k allow a better light penetration into the canopy that in correspondence of high LAI value provide a better radiation use effi-ciency (Kiniry et al., 2001). This characteristic of Gladio derives by its more upright leaves. Last measurement for Gladio presents the highest k value (0.64) because the cultivar is already in flowering stage when panicle are emerged and canopy have changed its habitus being more planofile. Results suggest that for models which use variable k val-ues as function of different phenological stages, such as WOFOST (Van Keulen and Wolf, 1986), it is better to use different values for the two varieties. A k mean parameter was also derived for the two culti-vars, to be used in models characterized by a single k
value for the entire season (e.g. CropSyst [Stöckle et al., 2003] and WARM [Confalonieri et al., 2005]), by inter-polating all the collected data (Casanova et al., 1998). Gladio and Volano seasonal k values do not statistically differ (P=0.35) resulted respectively equal to 0.52 and 0.53. A rice crop mean value of 0.53, derived by regres-sion of all the data, is proposed for territorial modelling purpose when it is not practicable to provide a local spe-cific k parameter for the different cultivars. Similar value, k=0.54, was derived by Casanova (1998) for Spanish varieties and by Dingkuhn (1999), who esti-mated k values ranging from 0.5 and 0.6 for varieties cultivated in Africa. Grain yield and HI Table 3 presents the results of the analysis of total bio-mass, grain yield and harvest index for the two varieties obtained from the PL1 plots during 2004. Volano presented a slightly lower AGB with respect to Gladio. However, the difference between the two varie-ties is significantly appreciable (P< 0.05) on grain weight. Gladio, as expected, presents a higher yield, pro-ducing 7.23 t ha-1 compare to the 5. 27 t ha-1 produced by Volano.
Tab. 3 – Total biomass, grain yield and HI for the two cultivars, fertilized plot (80 + 80 kg ha-1). Mean values and standard de-viation (in brackets) of the four replications are presented and compared to ENR statistics for 2004.
Tab. 3 – Biomassa finale, produzione di granella and HI dei due cultivar, livello fertilizzazione (80 + 80 kg ha-1). I valori medi e le deviazioni standard (in parentesi) delle quattro repliche sono presentati e comparati alle statistiche di produzione del 2004 dell’ ENR.
CV Field experiment ENR-STAT Total biomass Grain yield HI Grain yield t ha-1 t ha-1 - t ha-1 Gladio 15.58 (0.80) 7.23 (0.60) 0.53 (0.01) 5.44 (1.09) Volano 13.82 (0.39) 5.27 (0.41) 0.39 (0.03) 4.87 (1.43)
a
0
1
2
3
4
5
6
7
100 120 140 160 180 200 220
DOY
LAI (
m2/
m2)
00.10.20.30.40.50.60.70.80.91
fAPA
R (-
)
LAI_fieldLAI_interfAPAR
b
0
1
2
3
4
5
6
7
100 150 200 250
DOY
LAI (
m2/
m2)
00.10.20.30.40.50.60.70.80.91
fAPA
R (-)
LAI_fieldLAIfAPAR
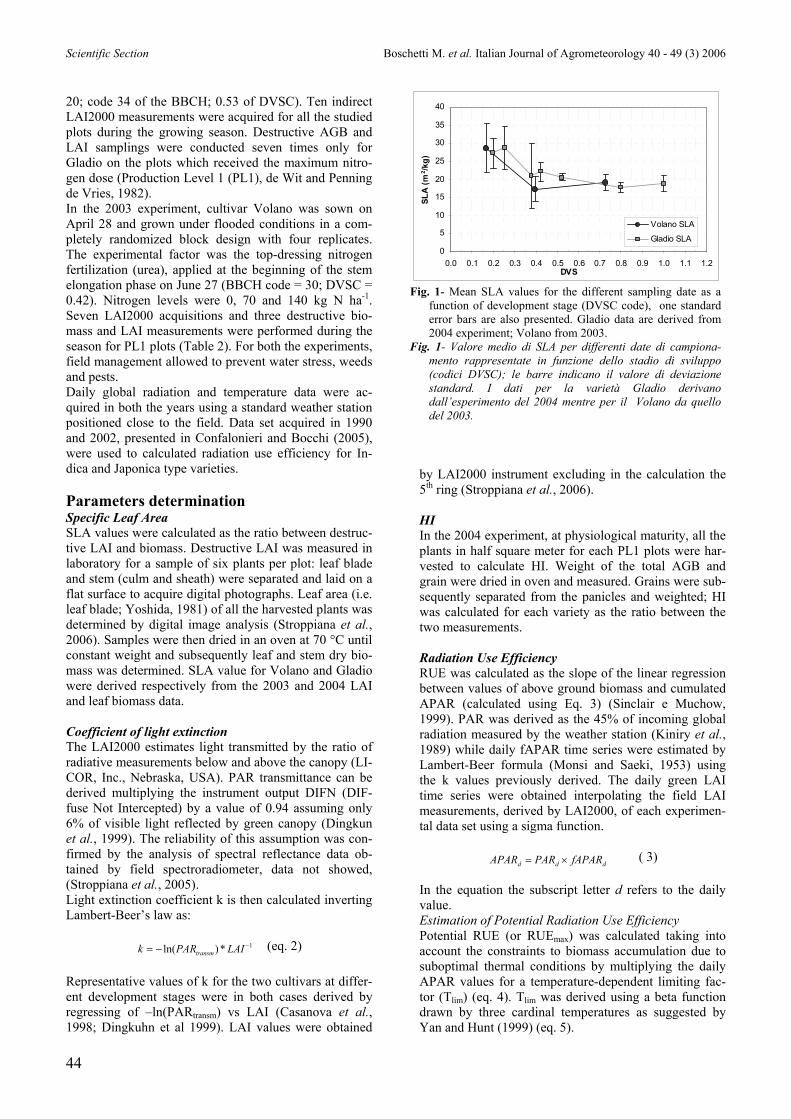
Fig. 4- Field mean LAI values, interpolated value and corresponding fAPAR time series for 2003 (Besate rice fields) (a) and 2004 (Opera
rice fields) (b). Fig. 4- Misure di campo di LAI: valori giornalieri interpolati e corrispondenti stime di fAPAR per il 2003 (Besate) (a) e 2004 (Opera) (b).

Scientific Section Boschetti M. et al. Italian Journal of Agrometeorology 40 - 49 (3) 2006
47
The high-yielding characteristic of recent Indica type va-rieties is highlighted by the value of HI. Gladio presents an HI of about 0.53 sensibly higher (P< 0.001) than Vo-lano, a traditional variety, which presents a value of only 0.39. HI estimated values are in agreement with other Italian field experiments; results demonstrate that for models that use HI approach for grain yield estimation, it is very important to take into account the differences be-tween varieties. RUE Examples of field LAI values, interpolated LAI time se-ries and fAPAR profiles for Volano and Gladio are pre-sented in figure 4. Figure 5 shows the scatter plot of cumulated APAR es-timations and related biomass samples for all the avail-able datasets, data were pooled according to the different morfo-physiological and merceological group. From data analysis, it seems that Japonica and Indica type varieties belong to different domain in terms of radiation use effi-ciency. New Indica type varieties are more efficient with
a value of 3.14 g MJ-1 with respect to the lower values of 1.83 g MJ-1 (Japonica traditional varieties) and 1.88 g MJ-1 (recent Japonica varieties). Differences between Japonica and Indica type can be jus-tified by difference in morpho-physiological characteris-tics. Estimation of light extinction coefficient (k) for the two rice typologies underline that new Indica type pre-sent lower k values that produce better illumination of lower canopy leaves thus maximising total canopy RUE (Kiniry et al., 2001). However, our estimates for Japon-ica are lower compared to values found in literature. If all the data are separated according to the year of the
y = 3.14x - 36.29R2 = 0.93
y = 1.83x - 31.84R2 = 0.86
y = 1.88x - 90.87R2 = 0.940
200
400
600
800
1000
1200
1400
1600
0 100 200 300 400 500 600 700
APAR (MJ/m2)
Biom
ass
(g/m
2 )
IE
JM
JE
Fig. 5- Regression analysis between field biomass values and relative cumulated APAR. Data were grouped according to rice-group class IE, JE and JM (details in the text).
Fig. 5- Analisi di regressione tra misure di campo di biomassa e relativa APAR cumulata. I dati sono raggruppati per va-rietà IE, JE and JM (detagli nel testo).
a
y = 1.99x - 13.04R2 = 0.93
y = 2.64x - 154.57R2 = 0.97
y = 1.88x - 90.87R2 = 0.94
y = 1.69x - 81.16R2 = 0.90
0
200
400
600
800
1000
1200
0 200 400 600 800
APAR (MJ m-2)
Bio
mas
sa (g
/m-2
)
Besate Volano 2003
Rosate europa 1990
Rosate cripto 1990
Rosate loto 1990
b
y = 2.96x - 34.40R2 = 0.93
y = 3.44x - 91.04R2 = 1.00
y = 3.45x + 32.98R2 = 0.990
200
400
600
800
1000
1200
1400
1600
0 100 200 300 400 500
APAR (MJ m-2)
Bio
mas
sa (g
/m-2
)
Vignate 2002
Opera 2004
Opera 2002
Fig. 6- Biomass vs APAR for all the separated datasets. Japonica group (a) and Indica group (b) data. Fig. 6- Scatter-plot Biomassa vs APAR per tutti i data set rappresentati separatamente per le varietà a tipologia Japonica (a) e Indica (b).
Tab. 4- Monthly mean temperature during the growing sea-son of 1990, 2002, 2003 and 2004.
Tab. 4- Valori medi mensili di temperatura per le stagioni di crescita del 1990, 2002, 2003 and 2004.
1990 2002 2003 2004 April 17.45 15.18 16.85 - May 18.71 17.84 19.38 18.61 June 20.71 23.68 25.42 21.59 July 22.72 23.20 24.56 23.01 Aug. 22.13 22.50 26.25 23.65 Sept. 16.71 21.18 22.43 21.28
May-Jul 20.71 21.57 23.12 21.07 Jul-Sep 20.52 22.29 24.41 22.65
Tab. 5- ANCOVA analysis results for the two data sets: the
original APAR data (No Temp. Limited) and the tempe-rature limited effective APAR (Temp. limited).
Tab. 5- Risultati dell’analisi dell’ ANCOVA per i due data set: dati originali di APAR (No Temp. Limited) e valori di APAR effettiva ricalcolati tenendo conto della limitazione di temperature (Temp. limited).
Temp. Limited No Temp. Limited
Variable Pr > F Pr > F
APAR < 0.0001 < 0.0001
Year 0.600 0.16*
CV_class 0.893 0.916

Scientific Section Boschetti M. et al. Italian Journal of Agrometeorology 40 - 49 (3) 2006
48
experiment, it is possible to see higher difference among RUE estimation in the Japonica rice group (figure.6a) compared to Indica group (figure 6b). Differences in RUE estimation among the available data-sets can be related to temperature. Table 4 shows the av-erage daily mean temperature for each month of the growing seasons of the experimental data analysed here. These data show that 1990 was the coldest year; in par-ticular, mean temperature for the May-July period is 2°C lower than the other years. 2003 was the hottest year of the century and present the highest temperatures; how-ever 1990 is also ~ 2 °C colder than 2002 and 2004 for the period Jul-Sept. RUE Max estimation Specific values proposed for modelling different rice group, obtained separating the different data set and con-sidering thermal limitation, are: 3.25 g MJ-1 for IE (R2=0.90), 2.77 g MJ-1 (R2=0.95) for JE and 2.69 g MJ-1 (R2=0.91) for JM.
Analysis of covariance (Table 5) showed that when tem-perature limitation is not taken into account the categori-cal variable Year is significant (*, P<0.05) in influencing the results, as a consequence the RUE values obtain by regression analysis are year dependent. However, for both data sets no significant differences are evidenced among cultivar classes. A potential RUE mean value cor-responding to a value of 2.89 g MJ-1, compensated for temperature limitation, can be proposed for modelling rice when no information on cultivar typology is avail-able. RUE rice values published are usually lower than those here derived; Kiniry et al. (1989) presented a mean value of 2.2 g MJ-1. More recent results published by Kiniry et al. (2001) report mean value slightly higher of 2.26 g MJ-1 for 1999 and 2.56 g MJ-1 for the warmer season of 2000. However, a recent paper of Campbell et al. (2001) presents very high rice RUE data up to 5.66 g MJ-1 that almost double the value found by Kiniry et al. (2001). High values are also found in old publication, mentioned in Kiniry et al (1989) (Table 1). In their review Sinclar and Muchow (1998), comparing theoretical limit and potentiality of RUE for corn, soy-bean and rice, affirm that even if rice does not have the C4 pathway it produces a large fraction of carbohydrate, so its potential RUE must be greater than other C3. They suggest a potential maximum value of about 1.5 g MJ-1 of global solar radiation. This figure is equal to more than 2.9 g MJ-1 PAR confirming the results of this re-search. Table 6 reports a summary of the results, grouped for dif-ferent rice-group analysed, obtained in the present re-search; variability of the parameters due to different phenological stages is described and mean seasonal val-ues are provided. Conclusion This study underlines the necessity of different parame-terisations for modelling rice growth and yield. Rice groups proposed by Confalonieri and Bocchi (2005) pre-sent sensible differences in the crop models parameters describing plant morphology. In particular Indica early group shows more erect leaves that provides lower k val-ues and a higher RUE values. Collected data also showed that meteorological condi-tions can affect RUE estimation; however, the method used to take into account thermal limitation effect on biomass accumulation allowed comparing different data set retrieving potential maximum RUE values for differ-ent groups of rice varieties. Strongest differences have been observed on grain yield values among rice group producing almost the same AGB. HI values are in fact sensibly different among the two selected cultivars. This aspect underlines the need of describing in crop model the processes that determine different grain mass production in order to provide reli-able estimation of crop yield. Based on these first results, other field measurements can be carried out to study the general validity of the derived parameters. Moreover, experiments addressed to study ontogeny and the effects of plant nitrogen on rice RUE
Tab. 6- Summary of crop parameters estimated from field experi-ments for Indica Early (IE) and Japonica Medium late (JM) rice varieties.
Tab. 6 - Riassunto dei parametri della coltura riso stimati da dati sperimentali per varietà a tipologia Indica Early (IE) e Japo-nica Medium late (JM). Unit Phen. Stage IE JM
Descript. DVS BBCH
0.20 21 27.20 28.51
0.25 27 28.68 - tillering
0.38 29 20.92 -
0.42 30 22.16 17.17stem elong.
0.44 32 20.62 -
booting 0.79 48 17.70 19.49
heading 0.97 56 18.89 -
SLA m2 kg-1
mean first stages 0.25-0.38 21-23 27.50 28.50
tillering 0.20 21 0.43 0.58
stem elong. 0.44 32 0.45 0.53
booting 0.79 48 0.49 0.59
heading 0.90 53 - 0.60
anthesis 1.0 58 0.64 -
k -
mean seaso-nal - - 0.52 0.53
seasonal - - 3.13 1.83 Potential
Max* - - 3.25 2.69 RUE g MJ-1
mean rice - - 2.90
LAI - max 0.9-1.0 56 ~ 6 ~ 7 HI - maturity 2.0 99 0.53 0.39
MTA** degree mean seaso-nal - - 70° 60°
** Mean Tilt Angle (MTA) foliage orientation respect to the zenith direction
* Potential Max RUE calculated taking into account temperature limi-tatio

Scientific Section Boschetti M. et al. Italian Journal of Agrometeorology 40 - 49 (3) 2006
49
for Mediterranean varieties are needed. In this contest the authors are currently participating to an exploratory re-search, TOP-FERT http://agrifish.jrc.it/marsstat/topfert/ coordinated by JRC, to study the relationship between rice RUE and top-dressing nitrogen fertilization. Acknowledgements Authors want to thank all the colleagues that provide a precious helps in conducting field campaign. In particu-lar we want to acknowledge Davide Gusberti (Di.Pro.Ve. Unimi) for supporting field samplings, Mauro Musanti (IREA-CNR) for carrying out LAI2000 measurements and Roberto Confalonieri for its helpful comments and suggestions. A particular thanks to Mr Fedeli that guests our experiments in his farms and to Bruno Marabelli (ENR) for providing the official statistics of Italian Rice production. References Ahl D.E., Gower S.T., Mackaya D.S., Burrowsa S.N., Normanb J.M.,
Diakc G. R., 2004. Heterogeneity of light use efficiency in a northern Wisconsin forest: implications for modeling net primary production with remote sensing. Remote Sensing of Environment, 93, 168– 178
Asch F., Sow A., Dingkuhn M., 1999, Reserve mobilization, dry matter partitioning and specific leaf area in seedling of African rice culti-vars differing in early vigour. Field Crops Research, 62, 191-202.
Cambpell C.S., Heilman j.L., McInnes K.J., Wilson L.T., Medley J.C., Wu. G., Cobos D.R., 2001. Seasonal variation in radiation use effi-ciency of irrigated rice. Agriculture and Forest Meteorology, 110, 45-54.
Casanova D., Epema G.F., Goudriaan J., 1998. Monitoring rice reflec-tance at field level for estimating biomass and LAI. Field Crops Re-search, 55, 83:92.
Confalonieri R., Bocchi S., 2005. Evaluation of CropSyst for simulating the yield of flooded rice in northern Italy. European Journal of A-gronomy. 23, 315-326.
Confalonieri, R., Acutis, M., Donatelli, M., Bellocchi, G., Mariani, L., Boschetti, M., Stroppiana, D., Bocchi, S., Vidotto, F., Sacco, D., Gri-gnani, C., Ferrero, A., Genovese, G., 2005. WARM: a scientific group on rice modelling. Rivista Italiana di Agrometeorologia, 2, 54-60.
De Wit C.T., Penning de Vries F.W.T., 1982. La synthese et la simula-tion des systems de production primaire. Agricultural Research Rep. 918, PUDOC, Wageningen.
Dingkuhn, M., Jones, M.P., Johnson, D.E., Sow, A., 1998. Growth and yield potential of Oryza sativa and O. glaberrima upland rice culti-vars and their interspecific progenies. Field Crops Res. 57, 57-69.
Dingkuhn, M., Johnson, D.E., Sow, A., Audebert, A.Y., 1999. Relation-ships between upland rice canopy characteristics and weed competi-tiveness. Field Crops Res. 61, 79-95.
Kiniry J. R., Jones C.A., O'Toole J.C., Blanchet R., Cabelguenne M., Spanel D.A., 1989. Radiation-use-efficiency in biomassa accumula-tion prior to grain filling for five grain crop species. Field Crops Re-search, 20, 51-64.
Kiniry J. R., Mc Cauley G., Xie Y., Arnorl J.G., 2001. Rice parameters describing crop performance of four U.S. cultivars. Agronomy Jour-nal, 93, 1354-1361.
Lancashire, P.D., Bleiholder, H., Langelüddecke, P., Stauss, R., Van den Boom, T., Weber, E., Witzenberger, A., 1991. A uniform decimal code for growth stages of crops and weeds. Ann. Appl. Biol. 119, 561-601.
Monsi M., Saeki T., 1953. Über den lichtfaktor in den pflanzengesell-schaften und seine bedeutung fur die stoffproduktion. Jpn. J. Bot. 14, 22–52.
Monteith J.L., 1977. Climate and crop efficiency of crop production in Britain. Phil. Trans. Res. Soc. London Ser. B 281, 277-329.
Potter C.S., Randerson J.T., Field C.B., Matson P.A., Vitousek P.M., Mooney H.A., Klooster S.A., 1993. A process model based on global satellite and surface data. Global Biogeochemical Cycle 7, 911-841.
Prince S.D., 1991. A model of Regional primary production for use with course resolution satellite data. International journal of Remote Sensing, 12, 1313-1330.
Sinclair T.R., Muchow R.C., 1999. Radiation Use Efficiency. Advances in Agronomy 65, 215–265.
Stöckle, C.O., Donatelli, M., Nelson, R., 2003. CropSyst, a cropping systems simulation model. European Journal of Agronomy, 18:3/4, 289-307, Second special issue 2nd International Symposium on Modelling Cropping Systems - Florence, Italy.
Stroppiana D., Boschetti M., Confalonieri R. , Bocchi S., Brivio P. A., 2005. Analysis of hyperspectral field radiometric data for monitoring nitrogen concentration in rice crops. Proceeding of the “Remote Sensing for Agriculture, Ecosystem and Hydrology VII”, edited by Manfred Owe, Guido D’Urso, 2005 Proc. of SPIE Vol. 5976 59760R-1.
Stroppiana, D., Boschetti, M., Confalonieri, R., Bocchi, S., Brivio, P.A., 2006. Evaluation of LAI-2000 for leaf area index monitoring in paddy rice, Field Crops Research. 99, 167-170.
Tao F., Yokozawa M., Zhang Z., Xu Y., Hayashi Y. 2005. Remote sens-ing of crop production in china by production efficiency models: models comparisons, estimates and uncertainties. Ecological Model-ling. 183, 385-396.
Van Keulen H., Wolf J., 1986. Modelling of agricultural production: weather, soils and crops. Pudoc Wageningen 1986.
Van Keulen H., Selegam N.G., 1987. Simulation of water use, nitrogen and growth of a spring wheat crop. Simulation monographs. Pudoc, Wageningen.
Yan, W., Hunt, L.A., 1999. An equation for modelling the temperature response of plants using only the cardinal temperatures. Annals of Botany 84, 607- 614.
.