
Estimation de paramètres et modélisation de piles au lithium ...
83
Université de Sherbrooke Faculté de génie Département de génie chimique et de génie biotechnologique Estimation de paramètres et modélisation de piles au lithium et aux ions lithium Parameter estimation and modeling of lithium and lithium-ion batteries Thèse de doctorat Spécialité : génie chimique Barzin Rajabloo Jury : Marin Désilets (directeur) Pierre Proulx Marcel Lacoix Daniel Bélanger Sherbrooke (Québec) Canada May 2017
-
Upload
khangminh22 -
Category
Documents
-
view
9 -
download
0
Transcript of Estimation de paramètres et modélisation de piles au lithium ...

Université de Sherbrooke Faculté de génie
Département de génie chimique et de génie biotechnologique
Estimation de paramètres et modélisation de piles au
lithium et aux ions lithium
Parameter estimation and modeling of lithium and
lithium-ion batteries
Thèse de doctorat
Spécialité : génie chimique
Barzin Rajabloo
Jury : Marin Désilets (directeur)
Pierre Proulx
Marcel Lacoix Daniel Bélanger
Sherbrooke (Québec) Canada May 2017

II
To my parents
To my wife and sister, Mahsa and Noushin

III
Résumé
Les batteries au Li-ion (BLI) figurent parmi les technologies les plus prometteuses pour le
design de systèmes de stockage d’énergie à cause de leurs caractéristiques intrinsèques. Leur
grand voltage de travail, leur grande densité énergétique et leur impact écologique positif
expliquent l’intérêt soutenu de l’utilisation des BLI pour remplacer par exemple les moteurs à
explosion dans les applications de transport terrestre. Il n’est donc pas surprenant de constater
que ces technologies ont eu une attention scientifique importante et que plusieurs auteurs ont
développé des modèles numériques simulant leur comportement. Il reste cependant difficile de
représenter tous les phénomènes multiphysiques qui se déroulent à l’intérieur des batteries
rechargeables par des modèles mathématiques. Des compromis importants doivent être faits
lorsqu’on doit choisir un modèle représentant les principaux phénomènes physico-chimiques
tout en restant assez simple pour pouvoir l’utiliser dans des études s’échelonnant sur de larges
périodes temps. Représentant à la fois la cinétique électrochimique et le transport de masse, les
modèles électrochimiques ont été introduits pour prendre en compte les phénomènes les plus
importants. Ces modèles demandent cependant de connaître tous les paramètres
électrochimiques, des données qui sont difficiles à obtenir expérimentalement. Les techniques
d’estimation de paramètres simplifient l’obtention de ces données critiques pour représenter le
comportement de la pile. Dans cette étude, une méthode d’estimation de paramètres a été
introduite pour estimer les paramètres électrochimiques des BLI les plus influents, en prenant
en compte différents matériaux d’électrode positive. La méthode proposée repose sur une
amélioration du modèle à particule unique, qui représente lui-même une simplification du
modèle pseudo-2D, le modèle électrochimique le plus connu et le plus complexe dans le
domaine de la simulation de piles à électrodes poreuses. Les paramètres électrochimiques les
plus importants ont été identifiés en négligeant la micro-structure de la batterie au Li-ion. Une
étude de sensibilité a ensuite permis d’identifier les domaines temporels et les courants de
décharge les plus favorables pour l’identification de chaque paramètre. Étant donné que le
comportement des BLI dépend fortement des matériaux actifs utilisés pour la fabrication des
électrodes, la méthodologie proposée a été testée sur 3 matériaux actifs différents (LiCoO2,
LiMn2O4 and LiFePO4) employés dans la fabrication industrielle d’électrodes positives.
Finalement, une autre amélioration du modèle à particule unique a été proposée et testée afin de
mieux représenter le comportement spécifique du LiFePO4 (LFP), un matériau actif parmi les
plus prometteurs pour l’électrode positive. Plus précisément, un modèle électrochimique
simplifié incluant une équation représentant la variation de résistance en fonction du degré de
décharge a été développé et les coefficients de cette équation ont été déterminés au moyen de la
méthode d’estimation de paramètres proposée.
Mots-clés: Batteries au Li-ion, cellule Li/LFP, estimation de paramètres, modèle à particule
unique

IV
Abstract
Specific characteristics of Li-ion batteries (LIBs) make them promising candidates for energy
storage systems when compared with the others. High working voltage and energy density as
well as green technology of LIBs are the reasons for increasing interest to use these
electrochemical systems as the substitute of conventional combustion engine of automobiles.
Consequently, the interest to study these technologies has increased recently and several models
have been introduced to simulate their behavior. However, it is difficult to model all
multiphysics phenomena happening inside such rechargeable batteries. Some important choices
need to be made when one wants to select an appropriate model for considering the main physics
elements and yet be simple enough for large time scale studies. Combining
chemical/electrochemical kinetics and transport phenomena, electrochemical models have been
introduced to tackle most important principles inside the cell. These models, however, require
known electrochemical parameters which most of the time are hard to get experimentally.
Parameter estimation (PE) techniques simplify extracting these representative parameters of the
cell behaviour. In this study, a PE methodology has been introduced to estimate the most
influential electrochemical parameters of LIBs considering different positive electrode
materials. The methodology starts with simplifying the well-known pseudo-two-dimensional
(P2D) model, the most complex and the most popular electrochemical engineering models for
simulating porous electrodes and introducing an enhanced single particle model (SPM).
Neglecting the micro-structure of LIB, major electrochemical parameters are detected at the cell
level. Next, the best time domains and discharge current rates to estimate each parameter are
estimated by virtue of sensitivity analyses. Owing to the fact that the behavior of LIBs depends
on the active materials employed in the electrode, the proposed methodology is verified for three
different positive electrode active materials including LiCoO2, LiMn2O4 and LiFePO4.
Furthermore, focusing on LiFePO4 (LFP), as the most promising positive electrode active
material, a new modification is proposed to the model to address special features of this material.
In this regard, a simplified electrochemical model is equipped with a variable resistance
equation whose coefficients are estimated by means of PE.
Key word: Li-ion batteries, Li/LFP cell, parameter estimation, single particle model

V
Acknowledgments
Foremost, I would like to express my sincere gratitude to my advisor Prof. Martin Désilets for
his helpful advices, motivation, and continuous support. I will remember all the moments he
was encouraging me during the hard times when I had lost my motivation.
My sincere thanks also goes to my thesis committee: Prof. Daniel Bélanger, Prof. Pierre Proulx
and Prof. Marcel Lacroix, for their helpful comments and encouragement.
I am highly indebted to Prof. Gessie Brisard, Yves Choquette and Prof. Gaétan Lantagne, for
their guidance and for providing valuable information regarding this research.
I express my special thanks and love to my friends, Mohsen Ariana, Mohammad Gholami and
Ali Jokar and all other friends who have helped me during these years.
Last but not the least; I would like to thank my family: my parents, my wife and my sister for
supporting me. There is no way to thank you enough. I will be always grateful to you for
everything you have done for me.

VI
Table of Contents
Résumé........................................................................................................................................................... III
Abstract ......................................................................................................................................................... IV
Acknowledgments ............................................................................................................................................V
List of figures .............................................................................................................................................. VIII
List of tables.....................................................................................................................................................X
List of symbols ............................................................................................................................................... XI
List of abbreviations ................................................................................................................................... XIII
1. Introduction ............................................................................................................................................ 1
1.1 Lithium ion batteries ............................................................................................................................ 1
1.2 BMS .................................................................................................................................................... 3
1.3 Parameter estimation ............................................................................................................................ 4
1.4 Research project description ................................................................................................................. 5
1.5 Research project objectives .................................................................................................................. 6
1.5.1 Principal objectives ..................................................................................................................... 6
1.5.2 Specific objectives ...................................................................................................................... 6
1.6 Contribution, originality of this study ................................................................................................... 6
1.7 Thesis plan .......................................................................................................................................... 7
2. State of the art ........................................................................................................................................ 9
2.1 Lithium-ion batteries modeling ............................................................................................................ 9
2.1.1 Pseudo-two-dimensional (P2D) model ...................................................................................... 10
2.1.2 Single particle model (SPM) ..................................................................................................... 13
2.2 Parameter estimation (PE) .................................................................................................................. 14
2.2.1 Parameter estimation process .................................................................................................... 16
CHAPITRE 3 : AVANT-PROPOS ............................................................................................................... 20
3. An inverse method for estimating the electrochemical parameters of lithium-ion batteries, Part II:
Implementation ............................................................................................................................................. 22
3.1 Abstract ............................................................................................................................................. 22
3.2 Introduction ....................................................................................................................................... 22
3.3 Direct model ...................................................................................................................................... 24
3.4 The parameter estimation process ....................................................................................................... 25
3.5 The reference data and the parameters ................................................................................................ 27
3.5.1 The Reference data ................................................................................................................... 27
3.5.2 The parameters ......................................................................................................................... 28
3.6 Sensitivity analysis ............................................................................................................................ 29
3.7 Results and discussion ....................................................................................................................... 33

VII
3.8 Conclusion ........................................................................................................................................ 38
Acknowledgements ................................................................................................................................ 38
Appendix ............................................................................................................................................... 38
CHAPITRE 4 : AVANT-PROPOS ............................................................................................................... 41
4. A new variable resistance single particle model for lithium iron phosphate electrode ....................... 42
4.1 Abstract ............................................................................................................................................. 42
4.2 Introduction ....................................................................................................................................... 42
4.3 Experimental ..................................................................................................................................... 45
4.4 Model development ........................................................................................................................... 46
4.5 Results and discussion ....................................................................................................................... 52
4.6 Conclusion ........................................................................................................................................ 58
Acknowledgements ................................................................................................................................ 58
Nomenclature ......................................................................................................................................... 58
5. Conclusion ............................................................................................................................................ 60
5.1 Future work ....................................................................................................................................... 61
References ...................................................................................................................................................... 62

VIII
List of figures
Figure 1.1: Ragone plot for different secondary batteries [1] ................................................... 1
Figure 1.2: Different types of lithium secondary batteries based on their shape: (a) cylindrical,
(b) coin, (c) prismatic and (d) pouch [2] .................................................................................. 2
Figure 1.3: Movement of Li+ in an electrolyte and insertion/extraction of Li+ within electrodes
in a lithium ion battery ............................................................................................................ 2
Figure 1.4: Schematic of BMS ................................................................................................ 4
Figure 1.5: Parameter estimation process ................................................................................ 5
Figure 2.1: SPM for discharge process .................................................................................. 13
Figure 2.2: Different time domains for estimating electrochemical parameters ...................... 18
Figure 3.1: Solution procedure for inverse problems [40] ...................................................... 26
Figure 3.2: Schematic curve of sensitivity analysis for graphite/LiCoO2 (presented in Part I) 30
Figure 3.3: Schematic curve generated from a sensitivity analysis for graphite/LiMn2O4 ....... 31
Figure 3.4: Schematic curve of sensitivity analysis for graphite/LiFePO4 ............................. 32
Figure 3.5: Cell potential and open circuit potential of two electrodes (graphite/LFP) for a
discharge current of 5C ......................................................................................................... 32
Figure 3.6: Simulated (solid lines) and experimental (symbols) discharge curves for the
graphite/LiCoO2 cell ............................................................................................................. 34
Figure 3.7: Simulated (solid lines) and experimental (symbols) discharge curves for the
graphite/LiMn2O4 cell ........................................................................................................... 35
Figure 3.8: Current-dependent radius of particles in graphite electrode.................................. 36
Figure 3.9: Simulated (solid lines) and experimental (symbols) discharge curves for the graphite/
LiFePO4 cell ......................................................................................................................... 37
Figure 4.1: (a) Schematic of the cell (b) SEM image of the cross section of the positive electrode
and current collector cross section ......................................................................................... 46

IX
Figure 4.2: Schematic of the simulated and experimental discharge curves of Li/LFP half-cell
with (a) thin positive electrode, and (b) thick positive electrode. OCP is depicted in its plateau
condition. .............................................................................................................................. 48
Figure 4.3: (a) Schematic of an experimental discharge potential and corresponding OCP, and
(b) XRD analysis of disassembled LFP electrode after discharge process. Two phases exist in
LFP active material discharged with 1C rate. ........................................................................ 49
Figure 4.4: Simulated (solid lines) and experimental (symbols) discharge curves for high-power
cell ........................................................................................................................................ 54
Figure 4.5: Simulated (solid lines) and experimental (symbols) charge curves for high-power
cell ........................................................................................................................................ 54
Figure 4.6: Apparent particle radius in each charge/discharge current from the PE and the SPM
............................................................................................................................................. 55
Figure 4.7: Simulated (solid lines) and experimental (symbols) potential of high-power Li/LFP
half-cell for a variable load ................................................................................................... 56
Figure 4.8: Simulated (solid line) and experimental (symbols) discharge curves for high-energy
cell ........................................................................................................................................ 56

X
List of tables
Table 2.1: Best time domains for PE of different electrochemical parameters of a graphite/LCO
cell ........................................................................................................................................ 19
Table 3.1: Range of the diffusion coefficients and of the reaction rate constants for Li-ion
batteries ................................................................................................................................ 29
Table 3.2: Estimated parameters for the graphite/LiCoO2 cell ............................................... 34
Table 3.3: Estimated parameters for the graphite/ LiMn2O4 cell ............................................ 35
Table 3.4: Estimated parameters for the graphite/LiFePO4 cell .............................................. 36
Table 3.5: the specific error values of all discharge curves for each cathode material ............ 37
Table 4.1: Measured and assumed parameters for the Li/LiFePO4 cell .................................. 53
Table 4.2: Estimated parameters for the high-power Li/LFP half-cell .................................... 53
Table 4.3: Estimated parameters for the high-energy Li/LFP half-cell ................................... 57
Table 4.4: Specific error values of all discharge curves for each cathode material ................. 57

XI
List of symbols
𝑎𝑖 Specific surface of electrode 𝑖 (𝑖 = 𝑝, 𝑛), m2/m3
𝑐 Electrolyte concentration, mol/m3
𝑐𝑠,𝑖 Concentration of lithium ions in the particle of electrode 𝑖 (𝑖 = 𝑝, 𝑛), mol/m3
𝑐𝑠,𝑖,0 Initial concentration of lithium ions in the particle of electrode 𝑖 (𝑖 = 𝑝, 𝑛),
mol/m3
𝑐𝑠,𝑖𝑚𝑎𝑥 Maximum concentration of lithium ions in the particle of electrode 𝑖 (𝑖 = 𝑝, 𝑛),
mol/m3
𝐷 Electrolyte diffusion coefficient, m2/s
𝐷𝑠,𝑖 Lithium ion diffusion coefficient in the particle of electrode 𝑖 (𝑖 = 𝑝, 𝑛), m2/s
𝐹 Faraday’s constant, C/mol
𝐼 Superficial current density, A/cm2
𝑖0 Exchange current density, A/cm2
𝑖𝑛 Transfer current normal to the surface of the active material, A/m2
𝑗𝑖 Wall flux of Li+ on the particle of electrode 𝑖 (𝑖 = 𝑝, 𝑛), mol/m2s
𝑛 Negative electrode
𝑝 Positive electrode
𝑟 Radial coordinate, m
𝑅 Universal gas constant , J/(mol K)
𝑅𝑖 Radius of the particle of electrode 𝑖 (𝑖 = 𝑝, 𝑛), m
𝑠 Separator
𝑠 Stoichiometric coefficient, positive for anodic reactants
𝑡+0 Li+ transference number with respect to the velocity of solvent
𝑇 Absolute temperature, K
𝑈𝑖 Open-circuit potential of electrode 𝑖 (𝑖 = 𝑝, 𝑛), V
𝑥 Spatial coordinate, m
𝑥𝑖0 Initial state of charge at the electrode 𝑖 (𝑖 = 𝑝, 𝑛)
Greek
𝛼𝑖 Transfer coefficient (𝑖 = 𝑎: anodic , 𝑖 = 𝑐: cathodic)

XII
𝜀𝑖 Porosity of region 𝑖 (𝑖 = 𝑝, 𝑠, 𝑛)
𝜏 Tortuosity
𝜑1 Solid-phase potential, V
𝜑2 Solution-phase potential, V

XIII
List of abbreviations
BDS Battery Design Studio
BMS Battery Management System
DOD Depth-Of-Discharge
EC Ethylene Carbonate
ECM Equivalent Circuit Model
EIS Electrochemical Impedance Spectroscopy
EOCV End Of Charge Voltage
EV Electric Vehicle
HEV Hybrid Electric Vehicle
HPPC Hybrid Pulse Power Characterization
LIB Lithium Ion Battery
MCMB Mesocarbon microbeads
P2D Pseudo 2 Dimensional
POD Proper Orthogonal Decomposition
PSS Pseudo Steady State
SEI Solid Electrolyte Interface
SOC State-Of-Charge
SOH State-Of-Health
SPM Single Particle Model

1
1. Introduction
1.1 Lithium ion batteries
Lithium ion batteries (LIBs) have become one of the most appropriate candidates for energy
storage because of their specific characteristics in comparison with alternative technologies. In
fact, their prime position in the Ragone plot (Figure 1.1) and other features including long
service life, high energy-to-weight ratios, no memory effect and low self-discharge are the
reasons for their success.
Figure 1.1: Ragone plot for different secondary batteries [1]
Figure 1.2 illustrates different types of LIBs according to cell shape and component materials.
A battery consists of five regions: positive electrode, negative electrode, a separator that
prevents electron to flow directly between the electrodes and two current collectors on the
outside of each electrode. Usually, lithium ion batteries use a transition metal oxide as a positive
electrode, carbon as the negative electrode, and a lithium salt dissolved in a nonaqueous organic
solvent as the electrolyte.
During discharge, the lithium ions are shuttled from the negative electrode (anode) to the
positive electrode (cathode) whereas the reverse process occurs during charge (Figure 1.3).
During the discharging process, the anode undergoes an oxidation reaction and lithium ions
leave the negative electrode (e.g. carbon) towards positive electrode (e.g. LFP) while electrons
move in the same direction in the external circuit. Meanwhile, a reduction reaction happens at
the cathode when the lithium ions and electrons combine. The reverse process takes place during
the charging process.

2
Figure 1.2: Different types of lithium secondary batteries based on their shape: (a) cylindrical, (b) coin, (c)
prismatic and (d) pouch [2]
Figure 1.3: Movement of Li+ in an electrolyte and insertion/extraction of Li+ within electrodes in a lithium
ion battery
The following characteristics are vital for different parts of a secondary battery. For anode
materials, the potential of the electrochemical reaction should be close to the reduction potential
of lithium metal. This characteristic makes it possible to provide continuous redox reactions and
to maximize the performance of the cell by increasing cell voltage. Carbon-based materials are
good candidates to obtain continuous, repeated redox reactions due to their stable structure. The

3
electrolyte should have an electrochemical and thermal stability within the range of the working
conditions. For example, the temperature inside which the liquid electrolyte should be stable
ranges from -20 to 60. Polymer electrolyte, on the other hand, is needed to be stable until
4.5 V because the typical metal oxide positive electrodes of Li-ion batteries such as LiCoO2,
LiNiO2, and LiMn2O4 have a voltage of 4.3V in fully charged state [3]. The separator, which
prevents short circuit caused by the electrical contact between the cathode and the anode, should
keep its integrity at high temperatures. Stable transition metal oxides are typically used as
positive electrodes to minimize the expansion/contraction caused by intercalation
/deintercalation of lithium ions within lattice structure. Common cathode materials are lithium
transition metal oxides such as layered LiMO2 (M=Ni, Co, Mn) and spinel LiM2O4
(M=Ti, V, Mn) and lithium transition metal phosphates such as olivine LiMPO4
(M=Fe, Co, Ni, Mn).
Among various olivine composites, LiFePO4 (LFP) has found to be the most promising because
of its structural and chemical stabilities. However, this active material suffers from poor
electronic conductivity and low apparent lithium diffusivity. Another specific behavior of the
LFP active material is a two-phase process of intercalation/deintercalation. The special
treatments to overcome LFP deficiencies and its complex two-phase intercalation/
deintercalation process make it difficult to simulate this challenging technology.
1.2 BMS
To meet the power and the energy required for various applications, especially in electrical
vehicle (EV), large numbers of LIBs are usually used in series and/or in parallel configurations.
Monitoring the operation and controlling the working conditions of such a pack of batteries is
vital. A Battery Management System (BMS) is responsible to receive input data such as the
surface temperature and terminal potential from the battery pack, and to simulate the electrical
behaviour of the batteries by virtue of a mathematical model (Figure 1.4). This intelligent system
provides valuable information such as the State of Charge (SOC) and State of Health (SOH) of
the battery pack. In addition, an active BMS can change the working conditions of batteries to
optimize their lifespan and performance.

4
Figure 1.4: Schematic of BMS
LIB models, at the heart of BMS, can be divided into two general types: empirical-based models
and electrochemical-based models. The former, which are usually used in automotive industries,
are simple and fast. In fact, empirical-based models typically use previous responses of the
batteries to predict the most probable future behaviors of these energy storage devices. Although
they deliver a fast response, they are not able to simulate the performance of cells in working
conditions that are different from the conditions used for calibrating the models.
Electrochemical-based models, on the other hand, are capable to simulate the behavior of the
batteries in a wide range of operating conditions and applications. These models take into
account the chemical/electrochemical kinetics and transport equations to simulate all physical
phenomena happening inside the cells. Electrochemical-based models, however, are more
complex and they need larger number of parameters including physical and chemical
parameters. Some parameters, such as the physical dimensions and the chemistry of materials
are obtainable from experimental measurements. However, some other parameters including
design parameters, electrode specific parameters, kinetic parameters, etc. are hardly accessible
from measurements. Parameter Estimation (PE) techniques are introduced to get around these
difficulties. These techniques can also be implemented to study several dimensions of LIB
performance, such as their thermal behavior and lifespan predictions.
1.3 Parameter estimation
Inverse methods are developed to estimate the unknown parameters of a system based on its
measured behaviour. The idea is to minimize the difference between the experimental data
reflecting the performance of the system and the simulated results. This optimization is
conducted by changing the parameters systematically and iteratively (Figure 1.5). When this
difference (objective function) is less than an a priori established criterion, the estimated
parameters are assumed to be representative of the real physical parameters. To verify the

5
results, the estimated parameters should be examined in conditions beyond the ones used for PE
process.
Figure 1.5: Parameter estimation process
Parameter estimation, as one of the most important deliverables of an inverse problem, depends
on several factors. Initial guesses and boundaries for the estimated parameters play a vital role
in PE. In addition, a well-suited direct model significantly alters the PE process. This model
should be fast and simple enough to be efficiently used inside an iterative loop. At the same
time, it should be accurate enough to consider important physical phenomena inside the cells.
PE process also relies on the optimization process. Choosing an appropriate solution method
can help to guaranty the reliability of the parameters obtained from this process.
1.4 Research project description
Generally speaking, the study of the behavior of LIBs demands to understand and implement
all dominant physical phenomena happening inside the cell by virtue of a well suited
electrochemical model. The governing equations to be included in such a comprehensive model
need to rely on some significant parameters. These parameters, which are not facile to extract
from experiment, can be estimated by PE.
Beside common major parameters found in all electrode active materials, the special features of
LFP like resistive-reactant characteristics of these favorable positive electrode active materials,
add more complexities to the electrochemical model. Complex models are typically not well
suited for time consuming study such as predicting the life of the cell. On the other side, the
importance to estimate cell parameters with a high reliability, which calls for the effectiveness
of the PE procedure, and the urge to introduce a convenient model for LFP material lead us to
define the basic question of the research project: ‘Can we develop a simple electrochemical
model that represents the behavior of LFP positive electrode in Li-ion batteries and use it inside
an inverse method in order to estimate the most influential parameters?’

6
The focus of this study will be on the electrochemical models introduced to simulate LIB at the
cell level. In other words, the micro-structure of LIB and physical phenomena taking place in a
very small time and length scale are ignored. Working on the most general yet accurate
electrochemical model, PE methodology developed in this study is a good seeding point for
future studies at large time and length scale such as predicting the life of LIBs or performance
of LIBs in pack configuration.
1.5 Research project objectives
1.5.1 Principal objectives
The principal objectives of this study are: 1. developing a PE methodology which works for
different chemistries of electrode materials used in representative working conditions, 2.
introducing a simple still precise model for LFP active material using PE methodology
developed as the first objective to identify the hard to get parameters.
This study will take into account the modifications of an applicable electrochemical model and
using a proper optimizer.
1.5.2 Specific objectives
In order to fulfill the principal goals, other objectives should be accomplished:
1. Find and adapt a befitting direct model which includes the most important phenomena
occurring inside the cell. This model needs to be as simple as possible to guaranty the
convergence of the time consuming PE process.
2. Perform sensitivity analyses to detect the important electrochemical parameters and the way
they influence the performance of the cell.
3. Choose an appropriate optimizer and develop a well-designed and efficient PE procedure.
4. Modify the electrochemical model to represent the special features of LFP active material
while avoiding complex models. It is necessary to consider the special features of LFP through
simple equations whose constants can be obtained by PE.
1.6 Contribution, originality of this study
As discussed earlier, the simulation of LIBs is of a great importance due to the increasing
demand related to these technologies, especially in the automotive industries. Although

7
numerous researches are focusing in this field, a better understanding of this device is still of
great scientific value. Moreover, varieties of electrode materials and their peculiar features call
for developing specialized models. It is worth noting that the need to use more accurate and
complex models than empirical relations entrains the need to find a systematic way to extract
the required parameters.
The contribution and the originality of this study comprise two different aspects of the research
question. In PE methodology, a systematic inverse method is applied to decipher all main
electrochemical parameters. These parameters are estimated from the domains where they have
higher influence on the simulated results. Incorporating a mathematical sensitivity analysis in
PE procedure for the first time has strengthen the effectiveness of the procedure and the
reliability of the obtained parameters. This unique methodology can be applied for any electrode
active materials to efficiently estimate inaccessible parameters of the cells. The original PE
process developed in this study has been verified for three different positive electrode
chemistries.
For the second part of the research question, a new modification has been proposed to one of
the prevalent electrochemical model in order to consider the special features of LFP as the
positive electrode material. In this regard, an equation representing a variable resistance of LFP
has been proposed and its coefficients have been estimated by virtue of the PE. This unique and
efficient model can be incorporated into larger numerical studies without compromising
accuracy and reliability.
1.7 Thesis plan
The thesis contains five chapters as follow:
State of art, as the second chapter, reviews other related studies. Besides, more detailed
explanations about different LIB models have been included in this chapter. The selection of a
proper electrochemical model is demonstrated. Simplifications of complex models to build a
quick, simpler but accurate one are also illustrated. The PE methodology, as the first part of
research question, is clarified here. Finally, to understand the importance and the influences of
the main parameters on the simulation results, a sensitivity analysis is introduced and conducted
in this chapter three.
The third chapter presents the implementations of the PE methodology explained in the second
chapter. The methodology for estimating the needed electrochemical parameters is verified for
three different positive electrode active materials including LiCoO2, LiMn2O4 and LiFeO4.
Promising results are compared with experimental data.

8
In chapter 4, an electrochemical model is modified to consider the peculiar specifications of
LFP as positive electrode active material. In fact, a variable resistance equation is coupled with
the electrochemical kinetics and transport equations. This resistance is representing two
phenomena observed at the end of the discharge process of LIBs using LFP as the positive active
material including: 1. higher diffusion overpotential as Li+ ions are intercalated inside larger
particles, 2. higher ohmic resistance based on resistive-reactant feature of LFP material. The
proposed model is verified for two different Li/LFP cells, designed respectively for high-energy
and high-power applications. The simplicity of the model allows one to use it as an alternative
of complex and time consuming models especially in large time and length scales studies.
The final chapter summarizes the conclusions of this research project. In addition, the
perspectives of the project are described and subsequent objectives are briefly proposed for
future works.

9
2. State of the art
There have been many studies on LIBs to analyze various problems such as underutilization,
capacity fade, lower energy density, thermal runaway, etc. To address these issues, various
experimental and computational studies have been done in different time and length scales. The
first part of following section focuses on models introduced to simulate the performance of
LIBs. Pseudo-two-dimensional (P2D) model and single particle model (SPM) are explained as
they are the most popular electrochemical models. The second part of this chapter reviews PE
studies. The methodology of PE used in this project is finally presented.
2.1 Lithium-ion batteries modeling
There are different categories for LIB modeling including empirical models, electrochemical
engineering models, multiphysics models, and molecular/atomistic models.
Empirical models [4, 5] apply various functions such as polynomial, exponential, power law,
logarithmic, etc. to fit experimental data. Ignoring physicochemical principles, empirical models
provide fast responses and predict the future behavior of lithium-ion batteries based on historical
data. Although they are easy to implement, they only work inside a specific set of operating
conditions. Therefore, their predictions can be very poor when estimating other battery
operating conditions.
Electrochemical engineering models provide, on the other hand, predictions that are more
precise at the cost of higher complexity and longer computation time. These models incorporate
chemical/electrochemical kinetics and transport phenomena and their predictions are valid
inside a wide range of operating conditions. They are divided into different sub-models such as
single particle models (SPM), ohmic-porous electrode models and pseudo-two-dimensional
models (P2D).
Developed by Atlung et al. [6] and later expanded by Haran et al. [7], SPM is the most simplified
electrochemical engineering model. It ignores the local concentration and potential in the
solution phase. More precisely, the most important assumption in the SPM is about the uniform
current distribution along the thickness of the porous electrodes, which results to treat the porous
electrodes as a large number of single particles, all of which are subjected to the same conditions.
SPMs are applicable for low applied current densities, thin electrodes, and highly conductive
electrodes [8], where the overpotential is only affected by the diffusion [9, 10].
Ohmic porous-electrode models, which are more complex that SPM, consider the potential in
both solid and electrolyte phases. Additional phenomena can be addressed by virtue of these

10
models, such as considering the conductivities as a function of the porosity [11]. Such a model
has been used to design the separator and electrode thicknesses [12-14]. However, these models
neglect the spatial variation in the concentration of Li+; a similar assumption is done in SPMs.
As the most comprehensive electrochemical model, pseudo-two-dimensional (P2D) models are
developed based on the concentrated solution theory. When compared to ohmic porous-
electrode models, predictability was improved in P2D models by considering the diffusion in
electrolyte and solid phases as well as a Butler-Volmer kinetics at both electrodes. P2D models
solve the electrolyte concentration, electrolyte potential, solid-state potential, and solid-state
concentration within the porous electrodes. It also solves the electrolyte concentration and
potential within the separator. Similar models have been developed based on the P2D model
[10, 15-22].
Combining the electrochemical behavior of batteries with other aspects of these systems such
as thermal and mechanical features leads to another category of LIB modeling, called
multiphysics models. Among different multiphysics models, thermal modeling includes Joule
heating effects into one of the electrochemical engineering models while the stress-strain models
consider expansion and contraction due to the intercalation/deintercalation of lithium into/from
the electrode active material.
At smaller time and length scales, the molecular/atomic models are introduced using a stochastic
approach to simulate the diffusion of lithium from site to site within an active particle [23-25].
2.1.1 Pseudo-two-dimensional (P2D) model
The equations required to simulate the electrochemical performance of porous electrodes with
concentrated electrolytes are based on the porous electrode and concentrated solution theories.
The basis of these theories has been reviewed by Newman and Tiedemann [26]. In the porous
electrode theory, instead of taking into account the exact position and shapes of all particles and
pores, properties are averaged over a control volume big enough with respect to the pores so as
to use continuity equations, but small enough with respect to the overall volume of the electrode.
The electrode is treated as a superposition of active material, filler, and electrolyte, and these
phases coexist at every point in the model, each of with known volume fraction. Without
considering the detailed pore geometry, the porous electrode is described by specific
(interfacial) area, 𝑎, and volume fraction of each phase 𝜀. The electrochemical reaction at the
surface becomes a homogeneous reaction because of the existence of the interface between the
two phases at each point in the volume of the electrode.

11
The effective parameters, such as the effective diffusivity of electrolyte in this porous structure,
𝐷𝑒𝑓𝑓, can be calculated by
effD D (2.1)
Where D is the intrinsic diffusivity (bulk value) of the Li ions in the electrolyte, 𝜀 is volume
fraction of the porous structure and 𝜏 is the tortuosity of active material , which is usually related
to the porosity by the Bruggeman relation [27].
0.5 (2.2)
Generally, the particles of the active material can be treated as spheres. The interfacial area (𝑎)
is equal to the surface area of each sphere times the number of spheres per unit volume (𝑁𝑝):
24pa N R (2.3)
The volume fraction occupied by the solid material (𝜀𝑠) is equal to the volume per sphere times
the number of spheres per unit volume:
34 3pN R (2.4)
Eliminating 𝑁𝑝, the interfacial area can be solved from known quantities like volume fraction
of solid material and particle radius:
3 /i i ia R (2.5)
Where 𝑖 = 𝑝 , 𝑛 as positive and negative electrode respectively.
P2D model consists of a set of six equations, to be solved for the following variables [28]:
1 Solid Phase Potential
2 Solution Potential
c Lithium ion concentration in the solution
sc Lithium concentration in the electrode at the electrode/electrolyte interface
ni Reaction rate
2i Solution phase current density

12
As mentioned earlier, the focus of this project is on SPM, inside which the potential and
concentration of Li+ in the solution are assumed as constants. Therefore, only two variables, the
reaction rate and concentration of ions inside the solid phase, and the corresponding equations
that need to be solved in the SPM, will be explained here.
2.1.1.1 Reaction rate
The dependency of the local electrochemical reaction rate on the concentration and potential is
usually determined by the Butler-Volmer rate equation:
1 2 1 2
0
a c
n
F U F Ui i exp exp
RT RT
(2.6)
The surface overpotential, 𝜙1 − 𝜙2 − 𝑈, is the deviation from the thermodynamic potential
difference between the solid and the solution at the existing surface concentrations. 𝑈 is the
open-circuit potential of the solid material evaluated at the surface concentration (a function of
intercalant concentration). The 𝛼𝑎, 𝛼𝑐 are the anodic and cathodic transfer coefficients,
respectively. The exchange current density, 𝑖0, is the reference current for the system based on
kinetics of the reaction. It is a function of the lithium concentrations in electrolyte and solid
active materials, i.e:
0 , , ,
a ac a a
a c s max s e s ei F K K c c c c
(2.7)
Where 𝑐 and 𝑐𝑠 are the volume-averaged lithium concentration in the electrolyte and solid
phases, respectively, 𝑐𝑠,𝑒 is the area-averaged solid-state lithium concentration at the
electrode/electrolyte interface, and 𝑐𝑠,𝑚𝑎𝑥 is the maximum concentration of lithium in the solid
phase. 𝐾𝑎 and 𝐾𝑐 are the rate constants for the anodic and cathodic directions of a reaction,
respectively.
2.1.1.2 Transport in the solid
The porous electrode is approximated as a collection of evenly sized spheres. Neglecting the
effects of stress, anisotropic diffusion and volume changes in the solid and assuming a good
electrical conductivity of active material as well, the transport of lithium ions can be described
by the Fick’s law in spherical coordinates:
2
2
1s ss
c cD r
t r r r
(2.8)

13
With the boundary conditions:
0
0 s s
Lir r R
c cand D j
r r
(2.9)
And with the following initial condition:
00,s sc t r c (2.10)
Where 𝑗𝐿𝑖+ is the flux of lithium at the particle surface due to the electrochemical reaction and
𝐷𝑠 is the diffusion coefficient. The boundary condition at the interface of solid particles and
electrolyte is responsible for the coupling between the electrochemical reaction rate and the
mass balance in the solid.
2.1.2 Single particle model (SPM)
Aiming to simplify the P2D model, the single particle model (SPM) has been introduced based
on two main assumptions: First, a uniform current distribution is assumed along the thickness
of the porous electrode. Second, the electrolyte potential and concentration are supposed to be
constant. These assumptions allow representing the entire porous electrode by a single
intercalation particle [8]. Figure 2.1 demonstrates SPM for the discharge process schematically.
Figure 2.1: SPM for discharge process

14
In SPM, the material balance for the lithium ions inside the electrode active material can be
represented by the Fick’s law in spherical coordinates (Eq. 2.8). Like in P2D model, the Butler-
Volmer kinetics equation (Eq. 2.6) is also representing the reaction rate.
The molar flux of lithium ions in SPM is related to the total current I passing through the cell:
j
j
IJ
FS (2.11)
Where 𝐹 is Faraday’s constant and jS is the total electroactive surface area of electrode 𝑗
3 j j
j
j
VS
R
(2.12)
Where j is the volume fraction of the solid phase active material in electrode 𝑗 and 𝑉𝑗 is the
total volume of that electrode.
Simplicity and minimum computational requirements make SPM a good candidate for time-
consuming studies such as life modeling [29, 30] and where a fast response is needed such as
online estimation [10]. It is also more facile to implement some modifications in SPM. For
example, Safari et al. [31] assumed four groups of particles with different connectivities to the
matrix to address the resistive-reactant feature of LFP as the positive active material. Adding
electrolyte concentration [32] and potential [33] inside SPM model improves the results for
higher rates of charge or discharge simulations.
2.2 Parameter estimation (PE)
Electrochemical models need known parameters to simulate the behavior of the cells. The
number of these parameters reflects the complexity of the model. PE is an applicable tool to find
the parameters that are difficult to measure or to extract from experiments. Here, some studies
using PE are summarized and the methodology for this technique is later described.
In 2007, Santhanagopalan et al. [34] performed a PE to estimate internal parameters of a lithium
cobalt oxide/carbon (MCMB) cell. These parameters were the diffusivity of Li+ ions in the
positive electrode (Ds,p), the reaction rate constants at the electrodes/electrolyte interfaces (Kn
and Kp) and the initial State Of Charge of negative and positive electrodes (SOCn,0 and SOCp,0).
They illustrated that the SPM model they have used inside their PE is valid for low discharge

15
rates (<1C). However, the P2D model provides accurate results for the charge/discharge rates
up to 2C at the cost of longer simulation times.
An interesting application for PE is to study the variation of influential parameters during the
life of batteries. PE finds the parameters value by analyzing the experimental data after a
determined period or cycle numbers in specific working conditions. Then, these parameters are
introduced as functions of time or/and cycle numbers. Using an appropriate model, which is a
representative of the behavior of batteries, this methodology can even help to determine and
understand the origin of aging in particular conditions.
With the aim of quantifying the capacity fade of a MCMB/LiCoO2 battery, Santhanagopalan et
al. [35] estimated some significant parameters of the cell including the SOC of the negative and
positive electrodes (SOCn,0 and SOCp,0) and the active material loading of electrodes (wp and
wn). They studied the loss of active material and the loss of cyclable lithium under different
temperature conditions.
In 2011, Ramadesigan et al. [36] applied a PE with a simplified P2D model to clarify the
changes in significant parameters as the cell is aged. The estimated parameters in this work were
the effective diffusion coefficient of lithium ion in the solution phase (𝐷), effective diffusion
coefficient of lithium in the solid phase for the negative and positive electrodes (𝐷𝑠𝑛 and 𝐷𝑠𝑝),
and the electrochemical reaction rate constants for the negative and positive electrodes (𝑘𝑛 and
𝑘𝑝). Monotonic reduction of the effective solid-phase diffusion coefficient and of the
electrochemical reaction rate constant at the negative electrode with cycle number illustrated
the influence of negative electrode properties on the aging of battery. Ramadesigan et al. were
able to extrapolate the change in those parameters with cycle number to predict the capacity
fade.
In 2013, Marcicki et al. [37] introduced a modified SPM considering concentration and potential
dynamics of the liquid phase. They estimated the electrochemical parameters and their
Arrhenius temperature dependence in various steps. First, the active material volume fractions
and utilization windows were estimated from OCP data. In the next step, the resistance
parameters were determined, and finally diffusion parameters related to the model were
extracted. They also included a time-variable resistance to capture the resistive-reactant feature
of LFP positive electrode material.
Utilizing multi-objective genetic algorithm, Zhang et al. [38] identified the parameters of
LiCoO2 and LiFePO4 Li-ion batteries. Considering the experimental results obtained at two
temperature (15 and 30), they introduced four objective functions including terminal

16
voltage and surface temperature to estimate 25 parameters. A good agreement was achieved
between the experimental data and the simulated results in low discharge rates.
PE studies differ in terms of the optimizers used to minimize the error between experimental
data and simulated results and of the direct models implemented inside the resolution of the
inverse problem. Some well-known optimizers in Li-ion battery parameterizations are
Levenberg-Marquardt method [34, 35], Genetic Algorithm [38-40], Homotopy optimization
method [41], and Particle Swarm optimization [42]. In regards of the direct model, most of the
studies use a simplified/reduced P2D model or a modified SPM [36, 37, 41, 42]. In fact, the
complexity of the resolution process and the accuracy needed for PE demand the use of a simple
yet reliable model. In the first part of this study, a modified SPM was implemented to simulate
the behaviour of Li ion batteries with different cathode materials. The resistivity of the
electrolyte is considered by virtue of a time and current varying resistance. Moreover, as one of
the most suitable optimizer, Genetic Algorithm was applied to perform PE. In the following, the
important features about PE are summarized.
2.2.1 Parameter estimation process
In general, PE is an inverse problem in which the unknown parameters are estimated by means
of comparisons between the experimental data and simulated results (see Figure 1.5). The
difference between the experiments and predictions becomes the objective function. An
optimizer is used as a mathematical tool to minimize the objective function and to compute the
vector of parameters, which are the output of a PE study.
The experimental data in Li-ion battery parameterization is most of the time the values of the
terminal voltage extracted from charge/discharge process in N time intervals from zero to cutoff
time ( ct ) as shown in Eq. (2.13)
*1
** 2
1 2
*1
, , ...,, 0cell N
N N
V
Vt t t t c
V
t
V (2.13)
Typically, the objective function (S) is defined as the ordinary least-squares function of the
measured data ( *cellV ) and the calculated values ( cellV ) [43]:

17
2* * *
, ,
1
NT
cell cell cell cell cell i cell i
i
S V V
V V P V V P P (2.14)
The superscript T indicates the transpose. When the experimental data are collected from M
charge/discharge processes, the objective function becomes:
2
* * *,
1 1
,
M NT
cell cell cell cell cell i
m n
S V Vcell i
V V P V V P P (2.15)
The vector of parameters, P, is a set of required parameters such as diffusion coefficients, initial
SOC, reaction rates and porosity of electrode. This vector is estimated by minimizing the
objective function in the following conditions:
, ,1 ,min j low j j highS S subject to P P P P (2.16)
Pj,low and Pj,high are the minimum and maximum of the Pj values respectively.
Choosing an appropriate optimizer is important in PE studies. High number of parameters rise
the risk of finding local minimum instead of determining a global one. It is worth noting that
the optimizer types can be divided in two categories: 1- deterministic and 2- stochastic methods.
Both categories have their positive points and drawbacks. Deterministic methods are faster than
stochastic ones. However, they are more complex to implement and the risk of finding local
extremum is higher in these methods. Stochastic techniques, on the other hand, are the better
candidates for PE of a system with numerous unknown parameters because of their random-
based operation functions [44].
To increase the speed of optimization, especially when one of the stochastic method is used,
sensitivity analysis is an effective technique to be used in a preliminary step to increase the
performance of the method. It helps to detect the most influential parameters and the best time
domains for their estimation. Recently, Jokar et al. [40] performed sensitivity analyses to
evaluate the parameters of a SPM representing graphite/LiCoO2 Li-ion battery. Implementing a
GA optimizer, they estimated 10 parameters of a simplified P2D model. The unknown
parameters include the solid diffusion coefficients (Ds,n and Ds,p), the
intercalation/deintercalation reaction-rate constants (Kn and Kp), the initial SOC (SOCn,0 and
SOCp,0), the electroactive surface areas (Sn and Sp) and two unknown variables used in the
formulation of the electrolyte potential drop function. In addition, they performed six scenarios
to illustrate the improvements achieved with the use of a sensitivity analysis and their special
methodology. In general, the sensitivity or the Jacobian matrix (J) is the first order partial

18
derivatives of the calculated cell potential ( cellV P ) with the respect to the unknown parameters
( jP ):
T
Tcell
jj
VJ P
P (2.17)
The Jacobian value for each parameter changes with the discharge time and discharge rate.
Therefore, it is possible to find the period and the rate when the voltage of the cell is more
sensitive to a specific parameter.
Jokar et al. [40] divided the galvanostatic discharge curves of a graphite/LCO battery into three
distinct regions (Figure 2.2): 1. the beginning of discharge curve; 2. the discharge cell voltage
plateau; and 3. the end of discharge process.
Figure 2.2: Different time domains for estimating electrochemical parameters
According to their sensitivity analysis, Jokar et al. [40] allocated each region to estimate
particular parameters. Table 2.1 summarizes the outcomes of their study.
To validate their methodology, Jokar et al. [40] used reference data generated from a P2D model
available in COMSOL® Multiphysics V. 5.1. To make the data even more close to reality, they
also added random noises.

19
Table 2.1: Best time domains for PE of different electrochemical parameters of a graphite/LCO cell
Symbol Unit Time domain & rate
Ds,p m2/s Region 2 in low and high discharge rates
Ds,n m2/s Region 2 in low discharge rate – Region 3
in high discharge rate
Kp m2.5/mol0.5 s Region 2 in low and high discharge rates
Kn m2.5/mol0.5 s Region 2 in low and high discharge rates
Sp m2 Region 1 and 3 in all discharge rates
Sn m2 Region 3 in all discharge rates
SOCp,0 - Region 1 and 3 in all discharge rates
SOCn,0 - Region 3 in all discharge rates
The methodology introduced by Jokar et al. [40] was later verified by Rajabloo et al. [45] and
applied to various cathode positive electrode active materials. The next chapter deals with
implementation of PE process for LiCoO2, LiMn2O4 and LiFePO4.
20
CHAPITRE 3 : AVANT-PROPOS
Auteurs et affiliation:
Barzin Rajabloo: étudiant au doctorat, Université de Sherbrooke, Faculté de génie,
Département de génie chimique et de génie biotechnologique.
Ali Jokar: étudiant au doctorat, Université de Sherbrooke, Faculté de génie,
Département de génie chimique et de génie biotechnologique.
Martin Désilets: professeur, Université de Sherbrooke, Faculté de génie, Département
de génie chimique et de génie biotechnologique.
Marcel Lacroix: professeur, Université de Sherbrooke, Faculté de génie, Département
de génie mécanique.
Date d’acceptation: 10 Décembre 2016
État de l’acceptation: version finale publiée
Revue: Journal of The Electrochemical Society
Référence: [45]
Titre français: Méthode inverse pour l’estimation de paramètres électrochimiques de piles au
Li-ion. Partie II : Mise en œuvre.
Contribution au document: Cet article démontre la performance d’une nouvelle méthode
d’identification de paramètres de modèles électrochimiques représentant le comportement de
piles au Li-ion. La méthode est appliquée avec succès à 3 types de piles différentes ce qui prouve
la validité du modèle simplifié et de la méthode inverse.
Résumé français : Cet article est la deuxième partie d’une étude portant sur l’estimation de
paramètres de piles au Li-ion. La méthodologie avait été développée au préalable dans la partie
I. Dans la partie II, la méthodologie est testée pour trois piles utilisant des matériaux d’électrodes
positives différents : LiCoO2, LiMn2O4 et LiFePO4. Une méthode inverse combinée à une
version simplifiée du modèle P2D est utilisée pour identifier les paramètres électrochimiques
suivants : Coefficients de diffusion (Ds,n and Ds,p), constantes de réaction d’intercalation /
désintercalation (Kn and Kp), état de charge initial (SOCn,0 and SOCp,0) et les surfaces
électroactives (Sn and Sp) d’une pile au Li-ion. Les mesures expérimentales du potentiel pour

21
des condition de décharge lentes et rapides ont été utilisées comme données de référence au sein
de la fonction objective de la méthode inverse en utilisant le meilleur intervalle de temps, celui
identifié dans l’étude de sensibilité. Pour tous les cas simulés, les prédictions numériques
représentent de façon fidèle les données expérimentales.

22
3. An inverse method for estimating the
electrochemical parameters of lithium-ion
batteries, Part II: Implementation
3.1 Abstract
This paper is the second part of a two part study on parameter estimation of Li-ion batteries.
The methodology was developed in Part I. In Part II, the methodology is tested for LiCoO2,
LiMn2O4 and LiFePO4 positive electrode materials. An inverse method combined to a simplified
version of the Pseudo-two-Dimensional (P2D) model is used to identify the solid diffusion
coefficients (Ds,n and Ds,p), the intercalation/deintercalation reaction-rate constants (Kn and Kp),
the initial SOC (SOCn,0 and SOCp,0), and the electroactive surface areas (Sn and Sp) of Li-ion
batteries. Experimental cell potentials for both low and high discharge rates provide the
reference data for minimizing the objective function in the best time interval. For all cases
simulated, the numerical predictions show excellent agreement with the experimental data.
Keywords: Parameter estimation; Inverse method; Li-ion battery; Simplified P2D model;
Sensitivity analysis, Genetic Algorithm (GA); LFP
3.2 Introduction
Lithium-ion (Li-ion) batteries are increasingly employed for energy storage. Their working
voltage and energy density are higher than those of similar energy storage technologies. Their
service life is longer. They exhibit high energy-to-weight ratios and low self-discharge. As a
result, they have become the preferred energy storage devices in the electronics and the
automotive industries.
Mathematical modeling of Li-ion batteries is an essential engineering tool for their design and
operation. Two different approaches are usually adopted to predict their behavior. These
approaches may be divided, broadly speaking, into empirical models and electrochemical
models.
Empirical models are the simplest mathematical models. They are relatively easy to implement
and they provide fast responses. This is why they are mostly suited for control systems used in
the high tech industry and in the automotive industry. The scope of applications of empirical
models is however narrow. Empirical models ignore the physical phenomena that take place in
the cell. Consequently, they cannot predict the life and the capacity fading of the battery.
Furthermore, they are only valid for the battery for which they have been developed [46-48].

23
Electrochemical models provide, on the other hand, reliable responses of the battery under a
wide range of operating conditions and for different applications. They account for the
chemical/electrochemical kinetics and the transport phenomena. Electrochemical models are
unequivocally superior to empirical models. But they are also more complex and require longer
computation times.
Among the electrochemical models, the Pseudo-two-Dimensional (P2D) model stands out. The
P2D model rests on the porous electrode theory, the concentrated solution theory and the use of
appropriate kinetics equations [4-6]. A simplified and computationally efficient version of the
P2D model is the Single Particle Model (SPM). In the SPM, it is assumed that the current
distribution along the thickness of the porous electrode remains uniform and that the electrolyte
properties are constant [11, 50].
Both empirical and electrochemical models need to be calibrated in order to simulate faithfully
the Li-ion cells. Moreover, due to their complexity, electrochemical models require extensive
data such as the chemical/electrochemical parameters and the physical properties of the battery.
Some of these parameters are readily available. They are provided by the manufacturer or can
be determined experimentally. Others like the mass transport properties, the charge transfer and
the kinetics parameters are more difficult to determine. This is the case of internal parameters
such as the diffusivity of Li+ ions in the electrodes (Ds,n and Ds,p), the reaction rate constants at
the electrodes/electrolyte interface (Kn and Kp), the initial State Of Charge of the electrodes
(SOCn,0 and SOCp,0) and the volume fraction of active material in the electrodes (εn and εp), etc
[34-39,42 , 51]. In this case, the collected experimental data must be processed with optimization
methods in order to reveal unknown parameters and properties. A literature review of the
methods applied to Li-ion batteries, i.e., the Parameter Estimation methods (PE), is provided in
the first part of this study [40]. An innovative inverse PE method for identifying the
electrochemical parameters of Li-ion batteries was also proposed in Part I. This inverse PE
method rests on a simplified version of the P2D model combined with an inverse method and
sensitivity curves of the expected parameters. The PE method may predict the solid diffusion
coefficients (Ds,n and Ds,p), the intercalation/deintercalation reaction-rate constants (Kn and Kp),
the initial SOC (SOCn,0 and SOCp,0), and the electroactive surface areas (Sn and Sp) of the Li-
ion battery. A Genetic Algorithm (GA) is used to minimize the objective function. The results
displayed in Part I show good agreement between the predicted discharge curves and the noisy
reference data at both low and high discharge rates.
The present paper follows Part I by verifying the proposed methodology for Li-ion cells made
of different active cathode materials. The noisy reference data that were generated with the P2D
model and used for validating the PE model in Part I are now substituted with actual
experimental data. These data come from Li-ion batteries made of different positive electrode
materials: LiCoO2 (LCO), LiMn2O4 (LMO) and LiFePO4 (LFP).

24
In the following section, the simplified P2D model, introduced in starting of paper, is reviewed.
Next, the Parameter Estimation method is presented. The reference data and the expected
parameters are discussed afterward. Sensitivity analysis section focuses on the sensitivity
analysis of the Li-ion batteries. The features of the LFP and the challenges of simulating this
positive electrode active material are discussed in Results and discussion section. Finally, the
PE results are presented in Conclusion section.
3.3 Direct model
Empirical and electrochemical models are the preferred approaches for simulating the State of
Charge (SOC) and the State of Health (SOH) of Li-ion batteries [11, 46, 52].
Empirical models rely on polynomial, exponential, power law, logarithmic, and trigonometric
functions to match the experimental data. These models are simple and computationally
inexpensive. They are however solely applicable to the battery for which they were calibrated.
As a result, the scope of applications of empirical models is limited [4, 5].
Electrochemical models are, on the other hand, unquestionably superior to empirical models for
predicting the behavior of Li-ion batteries. These models take into account the
chemical/electrochemical kinetics and the transport phenomena that take place into the battery.
But their complexity may be a drawback. They are also CPU time consuming.
The P2D model is a popular electrochemical model [6]. The P2D model considers both the
diffusion and the potential in the solid and in the electrolyte phases. The kinetics is described
by the Butler-Volmer expression. The P2D model solves the electrolyte concentration, the
electrolyte potential, the solid-state potential, and the solid-state concentration within the porous
electrodes. It also predicts the electrolyte concentration and the electrolyte potential within the
separator. The transport phenomena, the electrochemistry, and the thermodynamics are
portrayed by coupled nonlinear partial differential equations (PDEs) in space and time [15-21,
28, 50].
Most P2D models are, however, elaborate and CPU time consuming. A simplified version of
the P2D model is the SPM, which was developed by Atlung et al. [6] and later improved by
Haran et al. [7] The SPM accounts for a lumped solution resistance and it ignores the local
concentration and potential in the solution phase. It also assumes that the current distribution
along the thickness of the porous electrode is uniform. As a conclusion, each electrode is
modeled as one spherical particle. Intercalation and de-intercalation phenomena happens
through a reaction at the surface and a diffusion inside spherical particle. It should be noted that
assuming uniform current distribution and ignoring concentration and potential in the solution

25
phase are not always possible. As a result, the SPM is most suitable for simulating Li-ion
batteries with thin and highly conductive electrodes subjected to low current densities [8].
As a compromise between the simplicity of the SPM model and the accuracy of P2D models, a
simplified version of the P2D model was introduced in Part I. It rests on the following equations:
2 2
20 1 2
4 42 2ln ln
2 2 ...
p p n ncell p n
m m m mRT RT IV U U
F F a a It a It
(3.1)
where
,
0.5 0.5 maxmax 0.5,,
3; ,
1
surfp p s p
p pp s pp p s p e p p
V cIm S SOC
R cFK S c c SOC SOCp
(3.2)
,
max 0.5 max0.5 0.5, ,
3; ,
1
surfs nn n
n nnn n s n e n n s n
cVIm S SOC
RFK S c c SOC SOC cn
(3.3)
2,,
2 2 21
1 23 exp ;sin cos 0,0 max 5
,,
s ks k kk k k
kk k k
DDJ Rk kSOC SOC t tk kR Rc Ds ks k
(3.4)
SPM differs to simplified P2D model in last term of potential equation (Eq.1) where a lump
solution resistance has been replaced by a varying resistance as a function of capacity. The
derivation of the potential equation is explained in paper Part I.
The potential equation is applied in the PE process for which the electrochemical parameters
and the unknown variables of the electrolyte potential drop function are estimated.
The proposed simplified P2D model improves the results of the SPM particularly at high C-
rate charge/discharge. Moreover, the number of parameters needed for the simplified P2D
model is less than that for the P2D model. As a result, the proposed simplified P2D model is
befitting online simulation and optimization.
3.4 The parameter estimation process
Inverse problems belong to a class of ill-posed mathematical problems. Their solution is
strongly dependent on the initial conditions, on the boundary conditions and on the measured
signals. This makes the solution of inverse problems more challenging than that of direct
problems.

26
In PE problems, the unknown parameters of a system can be determined with an inverse method.
Of course, the parameters should be measurable and identifiable. Figure 3.1 depicts a schematic
of the PE procedure [40].
Direct
ModelObjective
Function
f=f(Y-Y*)
Experimental
Data
+
-Optimization
Process
Y
Y*
Input
Parameters
Feedback
System’s Parameters
Figure 3.1: Solution procedure for inverse problems [40]
The objective function for the identification of the Li-ion parameters is defined as the difference
between the experimental data for the time-varying cell potential and the numerical predictions
generated by the direct model.
The vector of experimental data ( *cellV ) is comprised of N time intervals between zero and the
cut-off time (0 < 𝑡 ≤ 𝑡𝑐). It is expressed as
*1
** 2
1 2
*1
; , , ...,cell N
N N
V
Vt t t t
V
V (3.5)
The objective function (S) is defined as the ordinary least-square function of the experimental
data ( *cellV ) and the numerical predictions ( cellV ) [43] for one charge or discharge cycle:
2* * *
, ,
1
NT
cell cell cell cell cell i cell i
i
S V V
V V P V V P P (3.6)
For M charge/discharge processes [34]:
27
2
* * *,
1 1
, ( )M NT
cell cell cell cell cell i
m n
S V Vcell i
V V P V V P P (3.7)
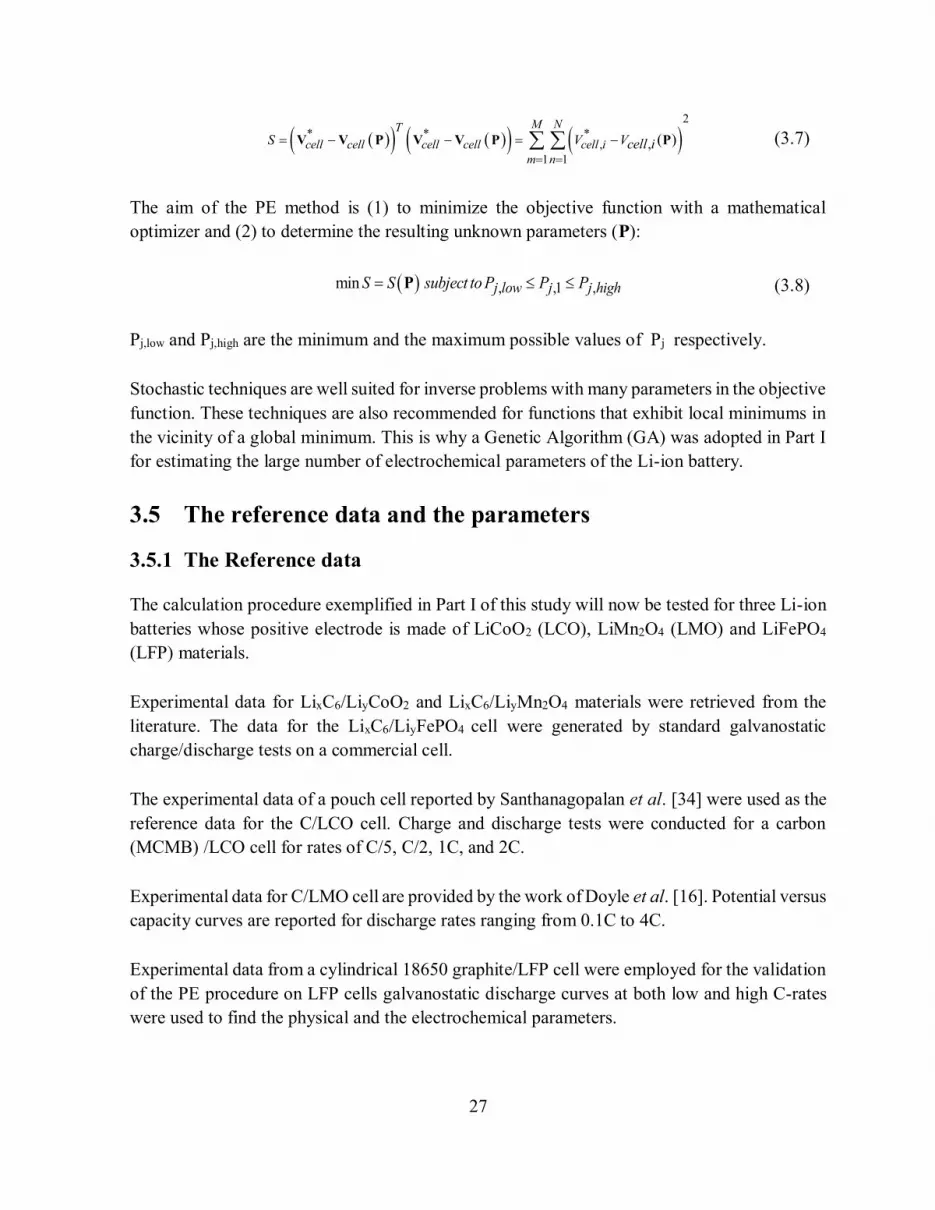
The aim of the PE method is (1) to minimize the objective function with a mathematical
optimizer and (2) to determine the resulting unknown parameters (P):
, ,1 ,min j low j j highS S subject to P P P P (3.8)
Pj,low and Pj,high are the minimum and the maximum possible values of Pj respectively.
Stochastic techniques are well suited for inverse problems with many parameters in the objective
function. These techniques are also recommended for functions that exhibit local minimums in
the vicinity of a global minimum. This is why a Genetic Algorithm (GA) was adopted in Part I
for estimating the large number of electrochemical parameters of the Li-ion battery.
3.5 The reference data and the parameters
3.5.1 The Reference data
The calculation procedure exemplified in Part I of this study will now be tested for three Li-ion
batteries whose positive electrode is made of LiCoO2 (LCO), LiMn2O4 (LMO) and LiFePO4
(LFP) materials.
Experimental data for LixC6/LiyCoO2 and LixC6/LiyMn2O4 materials were retrieved from the
literature. The data for the LixC6/LiyFePO4 cell were generated by standard galvanostatic
charge/discharge tests on a commercial cell.
The experimental data of a pouch cell reported by Santhanagopalan et al. [34] were used as the
reference data for the C/LCO cell. Charge and discharge tests were conducted for a carbon
(MCMB) /LCO cell for rates of C/5, C/2, 1C, and 2C.
Experimental data for C/LMO cell are provided by the work of Doyle et al. [16]. Potential versus
capacity curves are reported for discharge rates ranging from 0.1C to 4C.
Experimental data from a cylindrical 18650 graphite/LFP cell were employed for the validation
of the PE procedure on LFP cells galvanostatic discharge curves at both low and high C-rates
were used to find the physical and the electrochemical parameters.

28
The equations used for calculation open circuit potential (OCP) as a function of state of charge
for graphite, LCO and LMO are given in Appendix. The open circuit potential of LFP positive
electrode was calculated by interpolating the experimental data at low discharge current. Note
that the open circuit potential is an intrinsic characteristic of each positive electrode material.
The open circuit potentials are dependent upon the ionic intercalation/deintercalation
mechanisms. As a result, the range of influence of the battery’s parameters may change, hence
the need to perform a sensitivity analysis for validating the PE procedure for various active
materials.
3.5.2 The parameters
Numerous physical and chemical parameters are needed for simulating the behavior of Li-ion
batteries and for predicting their performance. Some parameters such as the physical dimensions
or the chemistry of materials are readily available from the manufacturer. Other parameters are
more difficult to determine. These hard-to-get parameters include design parameters (porosity,
particle size, etc.), electrode specific parameters (diffusion coefficients, electrical conductivity,
contact resistance, etc.), and kinetics parameters (transfer coefficients, reaction-rate constants,
etc.). Parameter estimation methods allow the determination of these parameters from
experimental charge/discharge curves. For the present study, eight electrochemical parameters
were determined with the parameter estimation method. These parameters are the solid diffusion
coefficients (Ds,n and Ds,p), the intercalation/deintercalation reaction-rate constants (Kn and Kp),
the initial SOC (SOCn,0 and SOCp,0), and the electroactive surface areas (Sn and Sp). In spite of
the fact that all these parameters are identifiable with the Li-ion direct model, their magnitude
is dependent on the positive and negative materials. Table 3.1 provides some of their values
reported in the open literature.
On the other hand, different active materials exhibit different behavior during charge/discharge
processes. The chemical/electrochemical properties are influenced by the
intercalation/deintercalation mechanisms and by the structure of the active materials. This
behavior will be elucidated in the sensitivity analysis.

29
Table 3.1: Range of the diffusion coefficients and of the reaction rate constants for Li-ion batteries
Parameter LCO LMO LFP
Diffusion coefficient, DLi
[m2/s]
1.0e-14 [8,34] 1.0e-13 [16] 1.18e-18 [31]
Reaction rate constant, K
[m2.5/mol
0.5 s] 6.6667e-11 [8] 2.334e-11[53] 1e-13 [63]
Parameter LFP Graphite
low high Ref. low high Ref.
Diffusion coefficient, DLi
[m2/s]
10e-22 10e-14 [54-59] 9e-10 2e-10 [21,28,60-64]
Reaction rate constant, K
[m2.5/mol
0.5 s] 10e-13 10e-9
[31, 62,63,
65-68] 8.19e-12 5e-11 [61,63,68,69]
3.6 Sensitivity analysis
A sensitivity analysis may be conducted for delineating the time interval domain for which the
output of the system, i.e., the cell potential, is most sensitive to the input parameters and the
properties. The sensitivity analysis improves the accuracy of the inverse method and the
parameter estimation process.
The sensitivity or the Jacobian matrix (J) is defined as the first order partial derivative of the
calculated cell potential (𝑽𝑐𝑒𝑙𝑙 (𝑷)) with respect to the unknown parameters (Pj), that is:
T
Tcell
jj
VJ P
P (3.9)
As explained in Part I, the governing equations for the SPM are employed to calculate the
dimensionless sensitivity coefficients for each parameter. The sensitivity coefficients depend on
time and on the discharge rate.
The discharge curves may be divided into three regions: 1. the early stages of the discharge
process; 2. the intermediate region of the discharge process when the potential varies gradually;
3. the end of the discharge process characterized by a sharp decline in the potential. Farkhondeh
et al. [70] fitted experimental data for Li/LFP half-cells for these three regions. The authors
were able to determine the regions where each of the cell parameters is the most influential on
the battery’s behavior.

30
In the present study, the best time domain for the PE of different electrochemical parameters is
determined from a sensitivity analysis of the electrode chemistry.
The best time domains for estimating the parameters of a graphite/LiCoO2 cell are shown in
Figure 3.2 (see also Figure 5f in Part I). Green and red colored parameters can be estimated
better in low and high discharge rates, respectively. Therefore, the best time domain for
estimating Ds,p at low discharge rates is region 2, and region 3 for high discharge rates. It was
concluded, in Part I, that Ds,n, Kn and Kp can be determined from region 2, for both low and high
discharge rates. For all discharge rates, region 3 is best for determining Sn and SOCn,0. Finally,
regions 1 and 3 are the best time intervals to find Sp and SOCp,0 , at both low and high discharge
rates
Cut-off
Voltage
Vcell(V)
time(s)
Dn Dp kn kp
2C,5CC/10,C/2,1CAll discharge curves
SOCp
Sp
SOCp
Sp
SOCn
Sn
Dp
1 2 3
Figure 3.2: Schematic curve of sensitivity analysis for graphite/LiCoO2 (presented in Part I)
The best time domains for estimating the parameters of the graphite/LiMn2O4 cell were obtained
from a sensitivity analysis. The results are depicted in Figure 3.3. In this case, the discharge
curve was divided into 2 regions. The main conclusions to be drawn from this figure are:
For the parameters SOCn,0, Sn, Ds,n, Kn and Kp: Region 1 appears to be the best time domain for both
low and high discharge rates.
For the parameter Ds,p: Region 1 is recommended for low discharge rates. Region 2 is better for high
discharge rates.
For the parameters Sp and SOCp,0: Region 2 is best for both low and high discharge rates.

31
The sensitivity analysis also provides the order of sensitivity of the parameter, which is Sp,
SOCp,0, SOCn,0, Sn, Kp, Kn, Ds,p, Ds,n. This order results from different Jacobian value for each
parameter. For instance, it was found that the output cell potential is more sensitive to Sp than
to Ds,n.
Cut-off
Voltage
Vcell(V)
time(s)
SOCn Sn Dn Dp kn kp
C/10,C/2,1C,2C
All discharge curves
SOCp
Sp
Dp
12
LiMnO2
5C
Figure 3.3: Schematic curve generated from a sensitivity analysis for graphite/LiMn2O4
A similar sensitivity analysis was conducted for graphite/LiFePO4. The results are illustrated in
Figure 3.4. The conclusions concerning the best time domains for estimating the parameters of
this battery may be summarized as follows:
For the parameters Ds,n, Kn and Kp: region 2 appears to be the best time domain for both low and
high discharge rates.
For the parameter Ds,p: Region 1 is recommended only for low discharge rates (C/10). The
dimensionless sensitivity coefficient for Ds,p is close to zero at other discharge curves.
For the parameters εn and SOCn,0: Region 3 is suitable at all discharge rates.
For the parameters εp and SOCp,0: Region 1 is prescribed for both low and high discharge rates.

32
Cut-off
Voltage
time(s)
Dn kn kp
C/10
All discharge curves
SOCp
εp
Dp
SOCn
εn
1 2 3
LiFePO4
Vcell(V)
Figure 3.4: Schematic curve of sensitivity analysis for graphite/LiFePO4
The parameter sensitivity resulting from the PE analysis may be stated in the following
decreasing order: SOCn,0, εn, SOCp,0, Kn, Ds,n, εp, Kp, Ds,p. This order reveals that the PE process
for graphite material is more sensitive than that for LFP. This behavior is shown in Figure 3.5.
The open circuit potential of the electrodes and the cell potential are compared.
Figure 3.5: Cell potential and open circuit potential of two electrodes (graphite/LFP) for a discharge
current of 5C

33
Figure 3.5 reveals that the cell potential follows the open circuit potential of the LFP in region
1 only. In regions 2 and 3, the LFP has no influence. Graphite is the dominant electrode. The
LFP electrode is made of fine powder compared to that of graphite electrode. As a result, the
capacity of the positive electrode is higher than that of the negative electrode when the thickness
and the porosity of two electrodes are almost same. This is the case for graphite/LFP cells
designed for high power applications. Here, the LFP electrode is almost always operated in the
plateau region. Since graphite material dictates the overall potential, the effect of the LFP
electrode on the performance of the graphite/LFP cell is insignificant.
Fortunately, for future studies such as introducing an aging model considering the changes in
dominant parameters, PE methodology is still valid and helpful. Due to the fact that graphite is
recognized as the most dominant electrode in losing capacity mechanisms. In addition, it is
worth noting that the methodology is anticipated to be well capable to estimate the influential
parameters of LFP positive electrode material when LFP is the dominant electrode with capacity
less than graphite. In fact, in this case, the order of sensitivity of the potential to the parameters
would change and parameters related to the capacity of the positive electrode such as diffusion
coefficient and porosity would possess higher sensitivities.
In order to simulate graphite/LFP cell, a Mosaic model was developed [71]. The Mosaic model
proposed by Andersson et al. was adopted [71]. This model assumes a particle-radius
dependency on the current density. Small radius particles are involved in the
lithiation/delithiation process at high current densities. Large radius particles are, on the other
hand, influential at lower current densities. Maheshwari et al. [65] adjusted the radius of the
positive electrode particles for each C-rate in order to match the simulation results with the
experimental data. Maheshwari et al. concluded that employing a current dependent radius is
equivalent to simulating the actual particle size distribution (PSD). Prada et al. [62] observed a
similar behavior for the evolution of the particle radius with the current density. The higher the
current density, the smaller is the effective particle radius. Prada et al. have developed a Mosaic
model in which the radii of both positive and negative electrodes were adjusted according to the
experimental data.
Here, the Mosaic model was used to simulate the discharge curves of LFP/graphite cells of the
18650 battery type. The model was applied to the negative electrode (the graphite electrode) so
as to obtain a good fit between the numerical predictions and the experimental data.
3.7 Results and discussion
The inverse methodology introduced in Part I was implemented to find each parameter in its
best time domain. The PE was carried out for different Li-ion batteries.

34
Table 3.2 presents the estimated parameters for the graphite/LiCoO2 cell. Each parameter was
calculated for its best time domain.
Table 3.2: Estimated parameters for the graphite/LiCoO2 cell
Symbol Units Range Estimated
value min max
Ds,p m2/s 1.0e-15 1.0e-13 9.9451e-14
Ds,n m2/s 1.0e-15 1.0e-13 4.9270e-14
Kp m2.5/mol0.5 s 1.0e-12 1.0e-10 4.1618e-11
Kn m2.5/mol0.5 s 1.0e-12 1.0e-10 2.1138e-11
Sp m2 0.6 1.3 1.02
Sn m2 0.6 1.3 0.81
SOCp,0 - 0.4 0.6 0.53
SOCn,0 - 0.6 0.8 0.68
Figure 3.6 compares the predicted and the experimental discharge curves for different currents
(C/5, C/2, 1C and 2C). The agreement between the simulation and the experiment is striking.
Figure 3.6: Simulated (solid lines) and experimental (symbols) discharge curves for the graphite/LiCoO2
cell
The PE methodology developed in Part I was next tested for the spinel LiMn2O4 positive
electrode. The estimated parameters are summarized in Table 3.3.

35
Table 3.3: Estimated parameters for the graphite/ LiMn2O4 cell
Symbol Units Range Estimated
value min max
Ds,p m2/s 1.0e-15 1.0e-12 6.7259e-13
Ds,n m2/s 1.0e-15 1.0e-12 7.5502e-13
Kp m2.5/mol0.5 s 1.0e-12 1.0e-10 1.8324e-11
Kn m2.5/mol0.5 s 1.0e-12 1.0e-10 2.8141e-11
Sp m2 0.9 1.6 1.39
Sn m2 0.9 1.6 1.42
SOCp,0 - 0.17 0.3 0.22
SOCn,0 - 0.65 0.85 0.71
Estimated parameters introduced in Table 3.3 were used as the input of simplified P2D model.
Figure 3.7 confronts the predicted and the measured discharge curves. Once again, the numerical
predictions match the experimental data.
Figure 3.7: Simulated (solid lines) and experimental (symbols) discharge curves for the graphite/LiMn2O4
cell
Table 3.4 provides the estimated parameters for the graphite/LFP. The simulations were
conducted using a current dependent radius for the negative electrode (based on the Mosaic
model). In this case, the electroactive area is a dependent parameter (Eq. (3.2) and (3.3)). The
porosities of the electrodes (εp and εn) were chosen as the estimated parameters instead of the
total electroactive area of the electrodes.
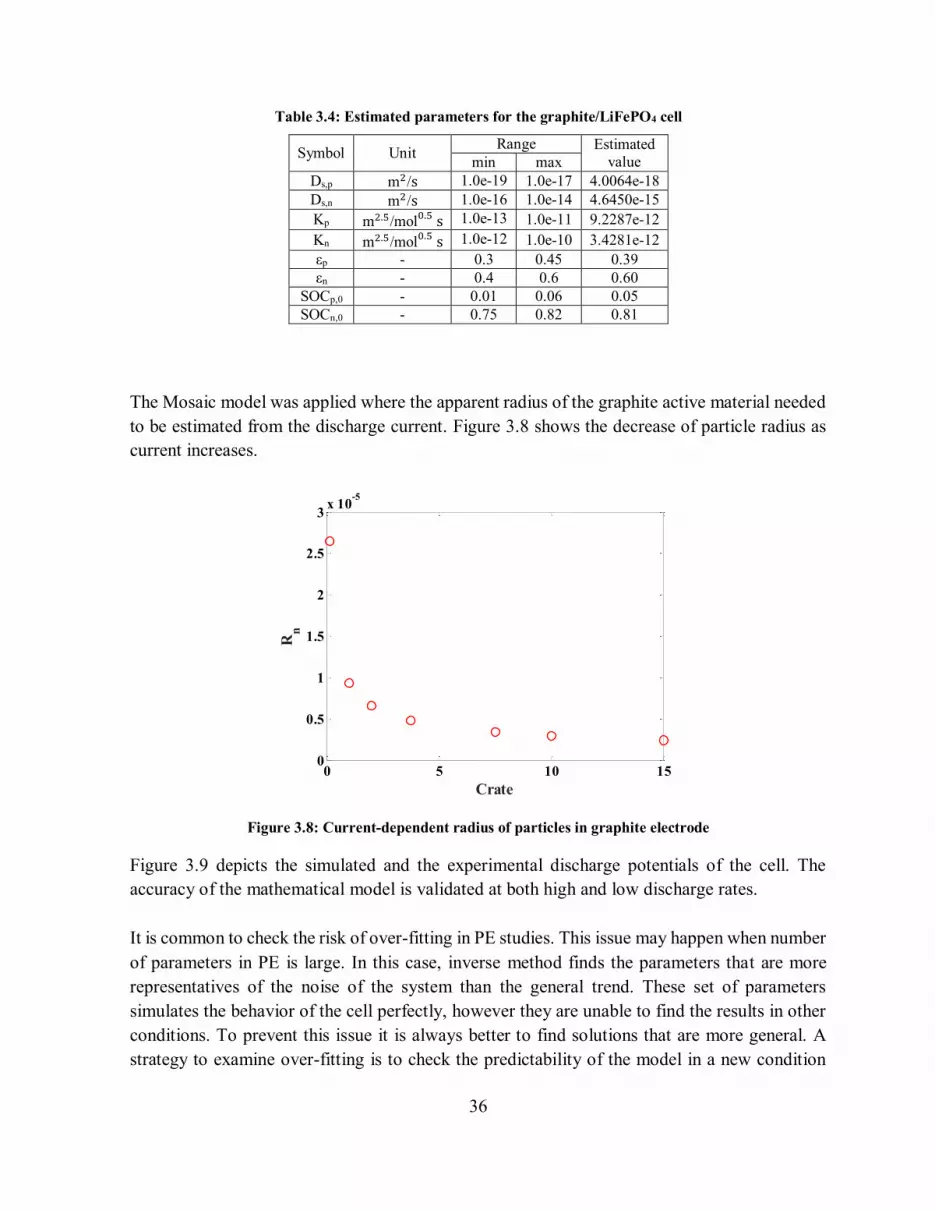
36
Table 3.4: Estimated parameters for the graphite/LiFePO4 cell
Symbol Unit Range Estimated
value min max
Ds,p m2/s 1.0e-19 1.0e-17 4.0064e-18
Ds,n m2/s 1.0e-16 1.0e-14 4.6450e-15
Kp m2.5/mol0.5 s 1.0e-13 1.0e-11 9.2287e-12
Kn m2.5/mol0.5 s 1.0e-12 1.0e-10 3.4281e-12
εp - 0.3 0.45 0.39
εn - 0.4 0.6 0.60
SOCp,0 - 0.01 0.06 0.05
SOCn,0 - 0.75 0.82 0.81
The Mosaic model was applied where the apparent radius of the graphite active material needed
to be estimated from the discharge current. Figure 3.8 shows the decrease of particle radius as
current increases.
Figure 3.8: Current-dependent radius of particles in graphite electrode
Figure 3.9 depicts the simulated and the experimental discharge potentials of the cell. The
accuracy of the mathematical model is validated at both high and low discharge rates.
It is common to check the risk of over-fitting in PE studies. This issue may happen when number
of parameters in PE is large. In this case, inverse method finds the parameters that are more
representatives of the noise of the system than the general trend. These set of parameters
simulates the behavior of the cell perfectly, however they are unable to find the results in other
conditions. To prevent this issue it is always better to find solutions that are more general. A
strategy to examine over-fitting is to check the predictability of the model in a new condition
0 5 10 150
0.5
1
1.5
2
2.5
3x 10
-5
Crate
Rn

37
other than conditions that are used for PE. In Figure 3.9, simulated potential for discharge rate
of 10C is provided by parameters estimated from lower discharge rates (mentioned in Table 3.4).
It is obvious that the model is able to predict the performance of cell outside the conditions used
for PE.
Figure 3.9: Simulated (solid lines) and experimental (symbols) discharge curves for the graphite/ LiFePO4
cell
By using Eq. (10), the specific error values for each discharge curve is calculated for each
cathode materials and presented in Table 3.5.
2*
, , ,1
1N
s cell m i cell ii
e V VN
P (3.10)
Table 3.5: the specific error values of all discharge curves for each cathode material
es C/5 C/2 1C 2C 3C 4C 8C
LiCoO2 1.1×10⁻⁴ 2.0×10⁻⁴ 1.0×10⁻⁴ 1.2×10⁻⁴ - - -
LiMn2O4 - 1.0×10⁻⁴ 3.0×10⁻⁴ 1.1×10⁻³ 4.5×10⁻³ 1.0×10⁻² -
LiFePO4 2.5×10⁻⁶ - 4.1×10⁻⁵ 1.5×10⁻⁴ - 8.4×10⁻⁴ 1.5×10⁻³

38
3.8 Conclusion
A methodology for the electrochemical Parameter Estimation (PE) of Li-ion batteries was
developed. The methodology rests on an inverse method combined to a simplified version of
the Pseudo-two-Dimensional (P2D) model. It is designed to identify the solid diffusion
coefficients (Ds,n and Ds,p), the intercalation/deintercalation reaction-rate constants (Kn and Kp),
the initial SOC (SOCn,0 and SOCp,0), and the electroactive surface areas (Sn and Sp) of the Li-
ion battery. The methodology was tested for LiCoO2, LiMn2O4 and LiFePO4 positive electrode
materials. The numerical predictions showed excellent agreement with the experimental data in
all cases.
Acknowledgements
The authors are very grateful to Hydro-Québec and to the Natural Sciences and Engineering
Council of Canada (NSERC) for their financial supports.
Appendix
Guo et al. fitted the experimental curves to find open circuit potential for LiyCoO2 as a function
of the state of charge (SOC) in the following manner [8]:
4.04596 exp 42.30027 16.56714 0.04880arctan 50.01833 26.48897
0.05447arctan 18.99678 12.32362 exp 78.24095 78.68074
LCO p p
p p
U SOC SOC
SOC SOC
(3.11)
Where the surface state of charge of the positive electrode ( pSOC ) equals to the stoichiometric
value y in LiyCoO2.
Open-circuit potential of LMO can be calculated in terms of the SOC from the following curve
fitting equation [16]:
0.492465
8
4.19829 0.0565661tanh 14.5546 8.60942
10.0275479 1.90111
0.998432
0.157123exp 0.04738 0.810239exp 40 0.133875
LMO p
p
P p
U SOC
SOC
SOC SOC
(3.12)

39
Where pSOC equals to the stoichiometric value y in LiyMn2O4.
The open circuit potential of the negative electrode was expressed in terms of the SOC [8]:
60.13966 0.68920exp 49.20361 0.41903exp 254.40067
exp 49.9788 43.37888 0.028221arctan 22.52300 3.65328
0.01308arctan 28.34801 13.43960
LiC n n
n n
n
U SOC SOC
SOC SOC
SOC
(3.13)
Where the surface state of charge of the negative electrode (nSOC ) equals to the stoichiometric
value x in LixC6.
Nomenclature:
max,s kc Maximum concentration of Li+ in the particle of electrode k (k=p,n), mol/m3
,surfs k
c Concentration of Li+ at the surface of the particles of the electrode k (k=p,n), mol/m3
,s kD Li+ diffusion coefficient in the particle of electrode k (k=p,n), m2/s
F Faraday’s constant, C/mol
I Applied current density, A/m2
p jJ Dimensionless sensitivity coefficient, V
kK Reaction rate constant of electrode k (k=p,n), m2.5/mol0.5s
n Negative electrode
p Positive electrode
P Unknown parameter matrix
r Radial coordinate, m
R Universal gas constant, J/mol K
kR Radius of the particle of electrode k (k=p,n), m

40
S Objective function, V2
kS Total electroactive area of electrode k (k=p,n), m2
kSOC State Of Charge of electrode k (k=p,n)
,0kSOC Initial State Of Charge of electrode k (k=p,n)
t Time, s
T Absolute temperature, K
kU Open-circuit potential of electrode k (k=p,n), V
kV Total volume of electrode k (k=p,n), m3
cellV Numerical potential, V
*cellV Experimental potential, V
x Spatial coordinate, m
x Stoichiometric coefficient of Li in negatove electrode
y Stoichiometric coefficient of Li in positive electrode
Greek
k Porosity of region k (k=p,s,n)

41
CHAPITRE 4 : AVANT-PROPOS
Auteurs et affiliation:
Barzin Rajabloo: étudiant au doctorat, Université de Sherbrooke, Faculté de génie,
Département de génie chimique et de génie biotechnologique.
Ali Jokar: étudiant au doctorat, Université de Sherbrooke, Faculté de génie,
Département de génie chimique et de génie biotechnologique.
Walter Wakem Fankem: étudiant à la maîtrise, Université de Sherbrooke, Faculté de
sciences, Département de chimie.
Martin Désilets: professeur, Université de Sherbrooke, Faculté de génie, Département
de génie chimique et de génie biotechnologique.
Gessie Brisard: professeur, Université de Sherbrooke, Faculté de sciences,
Département de chimie.
Revue: The Journal of Power Sources
Titre français: Un nouveau modèle SPM (Modèle à particule unique) avec résistance variable
représentant les électrodes à base de Fer-Phosphate
Contribution au document: Cet article contribue au développement d’un nouveau modèle
SPM (Modèle à particule unique) qui représente fidèlement le comportement spécifique des
piles au Li-ion à base d’électrodes positives de Fer-Phosphates.
Résumé français : Une nouvelle approche empirique basée sur l’utilisation d’une résistance
variable est proposée pour le modèle SPM (Modèle à particule unique) afin de représenter la
faible conductivité électronique et ionique des électrodes positives à base de Fer-Phosphate des
piles au Li-ion (LFP). L’augmentation de résistance observée dans les piles LFP en fin de
décharge peut être expliquée par deux phénomènes : 1. Une augmentation de la surtension
associée au transfert de masse qui résulte du phénomène d’intercalation/désintercalation des
ions dans les plus grosses particules. 2. L’augmentation de la résistance ohmique basée sur la
caractéristique bien connue des piles LFP, appelée « resistive-reactant ». Le nouveau modèle a
été validé à partir de données expérimentales obtenues à l’aide de 2 types de piles-bouton
fabriquées en laboratoire: un type haute énergie et un type haute puissance. Une comparaison
entre les résultats expérimentaux et les prédictions du modèle numérique montre que le nouveau
modèle à résistance variable représente adéquatement l’augmentation de résistance en fin de
décharge pour ce type de piles au Li-ion.

42
4. A new variable resistance single particle model for
lithium iron phosphate electrode
4.1 Abstract
Based on the poor intrinsic ionic and electronic conductivity features of lithium iron phosphate
(LFP), an empirical variable resistance approach is proposed for the Single Particle Model
(SPM). The increasing resistance behavior observed at the end of discharge process of LFP
batteries can be justified by two phenomena: 1. Increasing diffusion overpotential that results
from the intercalation/deintercalation of ions in larger particles. 2. Increasing ohmic resistance
based on the resistive-reactant feature of LFP as the positive electrode active materials. The
model is validated for two different laboratory made Li/LFP coin cells: a high-energy and a
high-power configuration. Comparisons between the experimental results and the model
predictions reveal that a variable resistance is successful to tackle the increasing overpotential.
Keywords: Single particle model (SPM), Lithium iron phosphate (LFP), Parameter estimation.
4.2 Introduction
The high thermal stability and safety as well as the high reversibility of olivine LiFePO4 have
made it the most promising material for the positive electrode of Li-ion cells, especially for
applications in electric vehicles. However, some improvements are still necessary to overcome
some of its deficiencies, such as poor electronic conductivity [72, 73] and low apparent lithium
diffusivity [74, 75].
The poor intrinsic ionic and electronic conductivity of this material have been improved by
decreasing the size of the LFP powder to the nanoscale and by adding a carbon coating upon
the surface of the particles, respectively [73, 75, 76].
Another specific behavior of the LFP active material is its electrochemical delithiation reaction,
which is occurring through a two-phase process [77]. It is generally accepted that during the
intercalation/deintercalation of the Li ion, lithium iron phosphate undergoes a two-phase
mechanism where the existence of both Li-poor LixFePO4 and Li-rich Li1-yFePO4 phases results
in a stable voltage plateau at 3.5V [78].
There are different approaches to simulate the complex behavior of LFP including the core-shell
[66, 79-82], the phase field [83-85], the domino cascade [86], the spinodial decomposition [85,
87], the resistive-reactant (RR) [31, 63, 88], the variable solid-state diffusivity (VSSD) [70, 89,

43
90] and the mosaic models [71]. Different explanations are proposed to justify the disagreements
between the aforementioned models [91]: the specific experimental conditions and the
dependency of delithiation/lithiation kinetics and phase compositions on the particle size, the
morphology and physical properties of the studied LiFePO4 material, to name a few.
Srinivasan and Newman [66] developed a core-shell model initially introduced by Padhi et al.
[79]. Intercalation and phase change in LFP were both represented through a shrinking core
model consisting of a Li-rich and a Li-poor phases. The diffusion of Li inside the growing shell
of one phase (e.g. Li-rich phase of LiFePO4 during discharge) and the mass transfer across the
phase boundary to the core of the other phase (e.g. Li-poor phase of FePO4 during discharge)
were addressed in their model.
Although the treatment of the two-phase process considered in core-shell, phase-field, domino
cascade and spinodial decomposition models may be appropriate to simulate galvanostatic
discharge of the Li-ion cell, it requires important computational resources when simulating
cycling working conditions. Less demanding models such as VSSD which somehow simulate
the influence of the phase change without considering it explicitly [70], on the other hand, are
among best candidates for large-scale applications of secondary batteries such as battery
management systems.
Thorat made an effort to find an alternative and easier way to represent the influence of the
aforementioned two-phase process [89]. He introduced a model with a concentration-dependent
solid-state diffusion coefficient for LFP. However, he had to use the Fickian diffusion with a
constant solid-state diffusivity to obtain results that are more representative of the battery
performance.
Later, in 2012, Farkhondeh and Delacourt [90] improved the approach of Thorat [89] to simulate
different commercial LFP electrodes. They introduced a variable solid-state diffusivity (VSSD)
model while ignoring the porous-electrode effects. To make the model suitable for high C-rates,
Farkhondeh et al. [70] merged the VSSD model with the pseudo-2-dimensional (P2D) model of
Doyle et al. [49]. They also considered a particle sizes distribution (PSD) for the active material,
taking into consideration 4 different particle sizes. Although the VSSD model of Farkhondeh et
al. [70] exhibited good simulation results, it is not appropriate for large scale and heavy
simulations like the ones involved in the simulation of battery packs.
The mosaic model, proposed by Andersson et al. [71], is a low-cost approach that accounts for
a distribution of particle sizes of the active material (PSD). This model is based on the particle-
radius dependency on the current density. More precisely, when the current density is high, the
particles with smaller radius are more active in lithiation/delithiation mechanism. Large radius
particles are, on the other hand, more influential at lower current densities. Later, the mosaic

44
model has been implemented by others [40, 45, 62, 65, 92] to improve the predictability of the
model vis-a-vis the capacity of LFP electrode material.
As mentioned earlier, another feature of the LFP electrode is its resistive-reactant behavior. LFP
has the properties of an electrically insulating material [93]. Therefore, the use of conducting
additives such as carbon is vital to decrease the ohmic drop and to improve the intrinsic
electronic conductivity of LFP [94]. Quality and quantity of these conducting additives are at
the origin of two different resistances: intraparticle and interparticle, respectively. The former
represents the ohmic drop caused by the electrons travelling through non-carbon coated active-
particle surface [88]. The later happens when the electrode is composed of poorly connected
particles, which causes higher resistivity paths through the conductive matrix [63].
Thomas-Alyea [88] investigated the intraparticle resistivity of LFP by conducting experiments
where two electrodes with a different amount of conductive carbon coating are compared. She
concluded that the voltage drop in both charge and discharge profiles is due to intraparticle
resistivity of LFP rather than the ionic conductivity of electrolyte and the electronic conductivity
of the bulk positive electrode. Later, Safari and Delacourt [63] studied the interparticle
resistance of LFP active material. They used a different number of current collectors at the anode
side as a spacer to change the uniaxial pressure. In their experiments, they showed that
increasing the uniaxial pressure improves the connectivity between the active material particles
and thus decrease the ohmic drop due to the interparticle resistivity.
In their RR model introduced to simulate LFP, Safari and Delacourt [63] assumed four spherical
particle groups with the same particle size but with different electronic connectivities to the
conductive matrix. It should be noted that both interparticle and intraparticle resistances of LFP
active material cause ohmic drop and consequently make a non-uniform current distribution.
RR model has also been applied by others [70, 90] to consider the resistive-reactant feature of
LFP.
Although VSSD and RR models seem good approaches to simulate the slow solid-state Li ion
transport and the poor electronic conductivity of LFP, they are still not well suited to investigate
cycling conditions and performing time-consuming studies such as aging and battery pack level
simulation. Aiming at introducing a simple model to take into account the resistive reactant
feature of LFP, Marcicki [95] combined his simplified Li-ion battery model with a resistance
that varies linearly with the depth of discharge (DOD). He used the middle portion of the
discharge curve to find a semi-empirical equation for resistive reactant effects. The results show
a good agreement comparing with experimental data obtained from a cylindrical graphite/iron
phosphate cell for a range of galvanostatic discharge experiments from C/3 to 4.8 C. However,
there is also a need to study the resistive reactant effect of LFP in the whole portion of

45
discharge/charge curves of a Li/LFP half-cell, thus eliminating the influence of graphite as the
negative electrode.
In this work, we introduce an improved varying resistance SPM and we apply it to study a
Li/LFP half-cell. The exponential resistance introduced here shows promising results in
simulating LFP material behavior. We examine the validity of the model for two different
Li/LFP cells, a high-capacity and a high-power cells.
In the following sections, the experimental setup is presented. Afterward, the model
development and its constitutive equations are explained. Finally, the results are discussed.
4.3 Experimental
Experimental studies were performed on a Li (Li/LiFePO4) CR2032 coin cell made of
commercial available positive and negative electrode materials. These coin cells were built by
assembling the following components (see Figure 4.1a): a positive electrode, a negative
electrode, a polypropylene separator membrane (Celgard 2400) between both electrode, a
stainless steel spacers and a spring. Two different kind of cells were built: a high energy and a
high power Li cells. Positive electrode is thicker (100 µm) in the high-energy Li cell than the
high-power Li cell (34 µm).
The positive electrode was prepared using 85 % LiFePO4/C, 7.5 % Carbon Black (CB) and 7.5
% PVDF (Polyvinylidene difluoride). The PVDF binder was first dissolved in N-methyl-2-
pyrrolidinone. The mixture of LiFePO4/C and carbon black was then added to the binder
solution after being ball milled for 10 minutes. The slurry obtained was mixed using a magnetic
stirrer for one hour in order to homogenize the mixture. The positive electrode was then cast,
applying the slurry on one side of a sandblasted aluminum foil (25 µm thick). The treated
electrode dried in an oven at 90 ᵒC under vacuum (25 In Hg) for 6 hours. After drying, the
positive electrode was calendared in order to reduce the porosity of the coating and finally
punched in 2 cm2 disks.

46
Figure 4.1: (a) Schematic of the cell (b) SEM image of the cross section of the positive electrode and
current collector cross section
The electrolyte was prepared inside an argon-filled glove box (1 ppm H2O) and consists of 1 M
LiPF6 salt in Ethylene Carbonate (EC), Dimethyl Carbonate (DMC) and Ethyl Methyl
Carbonate (EMC), in a volume fraction of 1/1/1. All battery grade carbonates and Li salt have
been bought from Sigma Aldrich.
The particle size distribution measured by laser diffraction sizing revealed that the mean value
for the radius of particle is 0.35 m. This value is considered as the radius of particle in 1-C
discharge rate. Moreover, the specific area of the samples was studied using the Brunauer-
Emmett-Teller method (BET).
Charge/discharge curves were measured using a MTI cycler BST8-MA. The BST8-MA cycler
has been used to analyze the rate performance of the materials at different C-rate considering a
cut-off voltage of 2.8-3.6 V. The charge consists of a Constant Current Charge (CCC) up to 3.6
V, followed by a Constant Voltage Charge (CVC) until the current reach the one corresponding
to C/50. On the other side, the discharge consists of a simple Constant Current Discharge (CCD),
down to a cut-off voltage of 2.8 V. Once assembled, the cells were subjected to SEI formation.
The SEI formation consists of 5 cycles at low C-rate (C/12) in order to form a stable solid
electrolyte interface.
4.4 Model development
Pseudo-two-dimensional (P2D) model [10, 16, 17, 49] is well suited for most simulations of Li-
ion batteries because such a model is considering the mass transport and the charge transfer in
both solid and electrolyte phases. However, the single particle model (SPM) [6-8], used as a
simplified version of P2D, is a better candidate for simulating cycling conditions or other time-
(b) (a)

47
consuming studies. The current distribution along the thickness of the porous electrode remains
uniform in SPM, which is the case of Li-ion batteries with thin and highly conductive electrodes
subjected to low current densities [8].
When it comes to fit the end-of-discharge capacity for LFP, SPM and P2D models give poor
predictions, both assuming a constant diffusion coefficient in the solid active material (Ds,p) or
a constant radius of the active material (Rp). In other words, constant value of Ds,p (or Rp) may
result in a good fitting for a specific current density. However, it leads to either under-prediction
or over-prediction of utilization when higher or lower current densities are simulated [66]. This
is a case where a rate-dependent diffusion coefficient [96, 97] or a rate-dependent radius of
particle [40, 45, 62, 65, 92] can be implemented to obtain a representative end-of-discharge
capacity. The Mosaic model is based on a rate-dependent radius of particle. The radius
considered is typically increased when the discharge current goes from a higher value to a lower
value. The mosaic model predicts the utilisation window of LFP active material very well, which
is an indirect effect of the particle-size distribution (PSD) [65].
Figure 4.2 schematically compares the results of P2D and SPM with the experimental data for
the discharge of the LFP half-cell (Li/LFP). Potential is depicted as a function of depth of
discharge (DOD) in an arbitrary discharge rate higher than 1C. Here, the assumption is that both
models are combined with a Mosaic model. Figure 4.2 reveals three important features: 1. the
slope in the plateau region, 2. the end-of-discharge capacity, and 3. the increasing polarization
as the discharge proceeds, especially at the end of the discharge process. In the case of the thin
electrode, both SPM and P2D predict the performance reasonably well, mainly because of the
uniform current distribution. However, in the case of the thick electrode, where a non-uniform
current distribution exists, only P2D model can represent the slope of the discharge curve and
the voltage drop due to the low conductivity of the matrix.

48
Figure 4.2: Schematic of the simulated and experimental discharge curves of Li/LFP half-cell with (a) thin
positive electrode, and (b) thick positive electrode. OCP is depicted in its plateau condition.
For both models, the use of the Mosaic model helps to predict the end-of-discharge capacity.
However, both models are unable to follow the increasing polarization at the end of the
discharge. This is the place where other models such as the shrinking core, the VSSD or the RR
models can be implemented to simulate this specific behavior of the LFP electrode active
material. Srinivasan and Newman [66] divided the resistance into two components: 1. Contact,
matrix and kinetic resistance (R1 in Fig. 2), 2. Diffusion resistance (R2 in Fig. 2). They showed
promising results in simulating LFP positive electrode. Safari and Delacourt [63] and later
Farkhondeh and Delacourt [70] attributed the resistance (R1+R2 in Fig. 2) to the resistive
reactant feature of LFP and variable solid diffusivity of this active material. However, as
described later, a model implementing a variable resistance function can produce good results
without the necessity of using sophisticated and time-consuming models.
The cell resistance evolution during the charge/discharge process can be interpreted by
comparing the flat OCP of LFP in intermediate SOC with the sloped voltage versus capacity
curves at higher charge/discharge rates [63]. This resistance sums up the influences of the
variable solid diffusivity as well as the resistive-reactant feature of LFP, including both
interparticle and intraparticle resistances in following ways. First, assuming that smaller
particles lithiate faster that the larger ones justifies increasing the transport limitation as the
charge/discharge proceeds. Therefore, instead of using a variable diffusivity of ions into the
solid active material to mimic a higher diffusion overpotential at the end of the charge/discharge,
it is easier to integrate the mass transport limitations into a varying resistivity.
Moreover, as the charge/discharge proceeds, electrons and ions have to go through a larger
distance inside the low conductive matrix phase [66]. Therefore, increasing the resistance during
the end of discharge results from lithiating poorly coated particles (interaparticle resistance) and

49
poorly connected particles to the matrix (interparticle resistance). This behavior represents the
resistive-reactant feature of LFP.
Another explanation for a varying resistance can be interpreted from Figure 4.3a where a
discharge process is depicted schematically. Here, the potential as a function of DOD is
compared with the OCP and the corresponding end of discharge capacity is also marked. The
end of discharge clearly occurs when the OCP is still in the plateau region. This conclusion is
based on a XRD (X-ray diffraction) analysis of a two identical cells: one discharged with C/24
rate and the other with 1C rate up to the cut off potential of 2.8 V (Figure 4.3b). The XRD
diagram demonstrates that two phases are present in the disassembled LFP electrode after a 1C
discharge rate. In other words, the end of discharge is reached before LFP active material gets
homogeneous. Therefore, increasing overpotential at the end of discharge comes from another
source of resistivity than high overpotential at one phase region of OCP. As a conclusion, an
increasing resistance helps to introduce a simple and applicable model for LFP active material.
Figure 4.3: (a) Schematic of an experimental discharge potential and corresponding OCP, and (b) XRD
analysis of disassembled LFP electrode after discharge process. Two phases exist in LFP active material
discharged with 1C rate.
Such a varying resistance can be implemented into a single particle model (SPM) to build a
more rapid and robust model, aimed at performing heavy simulations (for instance to study BMS
or aging), for a large range of C-rates. It should be noted that there is no need for an electrolyte
potential drop function [40, 45] because such resistive losses will also be included in the
empirical varying resistance.
Assuming a uniform current distribution along the thickness of the porous electrode in SPM
makes it possible to represent the entire porous electrode (positive/negative) by a single

50
intercalation particle [8]. Fick’s second law in spherical coordinate system represents the mass
balance of lithium ions in the electrode active material [8]:
, ,2
,2
1s j s js j
c cD r
t r rr
(4.1)
with initial conditions as
0, ,0,s j s jc t r c (4.2)
The boundary conditions are zero flux of lithium ions at the center of the spherical particle
(symmetry condition) and jJ molar flux of lithium ions at the surface of particle. These
conditions can be expressed respectively as
,0
0ss j
r
cD
r
(4.3)
, s
s j jr R j
cD J
r
(4.4)
Where j = p, n for the positive and negative electrodes respectively, 𝐷𝑠 is the solid phase lithium
ion diffusion coefficient, and 𝑅𝑗 is the solid particle radius.
The molar flux of lithium ions in SPM is related to total current I passing through the cell as
jj
IJ
FS (4.5)
Where 𝐹 is Faraday constant and 𝑆𝑗 is the total electroactive surface area of electrode 𝑗
3 j j
jj
VS
R
(4.6)
Where 𝜀𝑗 is the volume fraction of solid phase active material in electrode 𝑗 and 𝑉𝑗 is the total
volume of that electrode. In the case of Li/LFP half-cell, the electroactive surface area of the
negative electrode, Sn , is equal to the geometrical surface of the Li foil, An .

51
The state of charge (SOC) for the positive electrode is defined as
,
, ,max
s p
s pp
cSOC
c (4.7)
Guo et al. [8] illustrated that Eq. (4.1) can be solved by Eigenfunction Expansion Method
(EEM). They indicated that a mass balance on lithium ions in an intercalation particle of
electrode active material yields the SOC at the surface of particle as [8]:
2, ,
2 2 21
1 23 exp, 5
s p s pkp
p pkk
D DSOC SOC t tp p ini
R R
(4.8)
Where p is the dimensionless flux of lithium ions at positive electrode:
,
max,
pp
p s p
I R
S F D cs p
(4.9)
and k is the kth eigenvalue calculated from:
sin cos 0k k k (4.10)
Once the SOC in positive electrode is known, the potential of the cell can be found as following:
0.5 0.5max 0.5 1,
Imp
FK S c c SOC SOCp p s p e p p
(4.11)
0.5
Imn
FK S cn n e
(4.12)
2 24 42 2ln ln
2 2cell
m m m mp pRT RT n nV U I Rcell p F F
(4.13)

52
In the potential equation (Eq. (4.13)), Rcell is the variable resistance function. Unlike other
studies that consider a lumped resistance or a concentration dependent resistance, here a SOC
dependent resistance is introduced to calibrate the SPM. Here, an exponential resistivity is
introduced to account for increasing ohmic losses and diffusion overpotential as the discharge
proceeds. The exponential form comes from the difference between the potential profile and
OCP curve (see Figure 4.3a):
1 2 3exp( )cell pR a a SOC a (4.14)
The physical/electrochemical parameters and the unknown of cell variable resistance (Eq.
(4.14)) are estimated by virtue of Parameter Estimation (PE) process [40, 45]. These parameters
are the solid diffusion coefficient (Ds,p), the intercalation/deintercalation reaction-rate constant
(Kp), the porosity of the electrode (εp), the unknown coefficients in the cell resistance equation
( 1a , 2a and 3a ) and the radius of the particles at each discharge current except 1C. The radius of
the particles for the 1C charge/discharge process is assumed 0.35 m, based on particle size
distribution.
4.5 Results and discussion
Two different types of coin cells were built in laboratory to examine the validity of the proposed
model for both high-power and high-energy configurations. The thicknesses of the positive
electrode of these configurations were measured from SEM: the high-power thinner electrode
is 34 µm thick while the high-capacity thicker electrode is 100 µm thick. For a discharge rate of
1C, the assumed mean radius of particles is 0.35 µm. This value is measured with a laser
diffraction-sizing instrument. However, the particle size has been estimated for other discharge
rates, as it is proposed in the Mosaic model.
The open circuit potential (OCP) for each type of cells was determined from a discharge
experiment at low C-rate (C/24). The rate constant ( nK ) was assumed from an exchange current
density of 0.5 21.90mA/cmn n ei F K c , as reported in the literature [31] for similar technology.
Table 4.1 provides the parameter values used for LFP and Li.

53
Table 4.1: Measured and assumed parameters for the Li// LiFePO4 cell
Positive electrode Negative electrode
Parameters Symbol Value Symbol Value
Electrode thickness (µm) 34a h.-power
100a h.-energy
Particle radius for 1C (µm) Rp 0.35a
Maximum solid-phase lithium concentration (mol/m3) max,cs p 22,806b[31]
Exchange current density (mA/cm2) in 1.90[31]
Charge transfer coefficient p 0.5b n 0.5b
Salt concentration in the liquid phase (mol/L) ce 1b ce 1b
a Measured b Assumed
The other parameters are estimated by virtue of the Parameter Estimation (PE) process.
Table 4.2 presents the estimated parameters and the range used for each of them during the
identification iterative process.
Table 4.2: Estimated parameters for the high-power Li/LFP half-cell
Symbol Unit Range Estimated
value min max
Ds,p m2/s 1.0e-19 1.0e-17 8.25e-18
Kp m2.5/mol0.5 s 5.0e-13 5e-12 1.826e-12
εp - 0.15 0.30 0.263
1a Ωm2 2e-4 2e-3 6.3539e-4
2a - 1 10 3.819
3a Ωm2 2e-3 6e-3 4.8e-3
Figure 4.4 and Figure 4.5 illustrate good agreements between simulated and experimental
potential in discharge and charge process, respectively. Here, even in moderate C-rate, SPM
coupled with the use of an exponential resistance shows promising results.

54
Figure 4.4: Simulated (solid lines) and experimental (symbols) discharge curves for high-power cell
Figure 4.5: Simulated (solid lines) and experimental (symbols) charge curves for high-power cell
In parameter estimation studies, it is important to check the risk of over-fitting. Over-fitting in
PE studies happens when the number of parameters is large and the inverse method finds the
parameters that are more representative of the noise of the system than representing the general
trend. Although the estimated parameters simulate the performance perfectly, they are
inefficient to study the behavior of the cell in other conditions. One way to examine the over-
fitting is to test the model in a new condition that differs from conditions that are used for PE.
0 0.2 0.4 0.6 0.8 12.8
3
3.2
3.4
Capacity [mAh]
Pote
nti
al
[V]
0 0.2 0.4 0.6 0.8 13.2
3.3
3.4
3.5
3.6
3.7
Capacity [mAh]
Pote
nti
al
[V]
3C 2C 1C C/2 C/10 C/10 C/2 C/1 2C 3C
3C 2C 1C C/2 C/10 4C

55
In this regard, the model is verified by simulating potential for a discharge rate of 4C (also
depicted in Figure 4.4). Here, the estimated parameters are based on lower discharge rates
(mentioned in Table 4.2). Obviously, the predictability of the model is good enough outside the
conditions used for PE.
The estimated particle radius for both charge and discharge process is depicted in Figure 4.6. It
is seen that the higher the discharge current is, the smaller gets the particle radius, which is in
agreement with the Mosaic model.
Figure 4.6: Apparent particle radius in each charge/discharge current from the PE and the SPM
A changing load test was performed to verify efficiency of the model. In this regard, a fully
charge cell is discharged with 3C rate for 8 minutes. This follows by a charge and discharge
process each with 2C rate in 8 minutes. Finally, 15 minutes of charge and 15 minutes of
discharge are applied with 1C rate. Figure 4.7 demonstrates the experimental data and simulated
results where a good agreement is evident.
-3 -2 -1 0 1 2 30.2
0.25
0.3
0.35
0.4
0.45
0.5
0.55
C rates
Pa
rtcile
ra
diu
s [µ
m]
Discharge
Charge

56
Figure 4.7: Simulated (solid lines) and experimental (symbols) potential of high-power Li/LFP half-cell for
a variable load
It is generally easier to model cells designed for high-power applications because, in this case,
the electrodes are thinner and the overpotentials are smaller. However, it is necessary to check
the accuracy of the model for cells with different applications. Therefore, the validity of the
model is examined here for thicker positive electrode in order to justify its capability. Figure 4.8
illustrates the comparison between the model estimations and the experimental measurements
for high-energy Li/LFP cell.
Figure 4.8: Simulated (solid line) and experimental (symbols) discharge curves for high-energy cell
0 500 1000 1500 2000 2500 3000 3500
3.2
3.4
3.6
time [s]
Pote
nti
al
[V]
0 0.5 1 1.5 2 2.5 3 3.5 42.8
3
3.2
3.4
Capacity [mAh]
Pote
nti
al
[V]
C/2 C/10 C/1 3C 2C

57
As seen in Figure 4.8, a good agreement is achieved between the simulation results and the
experimental measurements, this time with the thicker positive electrode design. The estimated
parameters for such a configuration, which are the porosity of the electrode (εp), the unknown
coefficients in the cell resistance equation ( 1a , 2a and 3a in Eq. (4.14)) and the radius of
particles in each discharge current (except 1C), are provided in Table 4.3. The solid diffusion
coefficient (Ds,p), and the intercalation/deintercalation reaction-rate constant (Kp) are chosen to
be the same as in case of the high-power cell design.
Table 4.3: Estimated parameters for the high-energy Li/LFP half-cell
Symbol Unit Range Estimated
value min max
εp - 0.15 0.30 0.263
1a Ωm2 6e-6 8e-5 3.7891e-05
2a - 2 20 6.2385
3a Ωm2 2e-3 6e-3 3.9e-3
Using Eq. (4.15), the specific error values for each discharge curve is calculated for both high-
energy and high-power Li cells. The values for specific error are summarized in Table 4.4.
2
*, , ,
1
1N
s cell m i cell ii
e V VN
P (4.15)
Table 4.4: Specific error values of all discharge curves for each cathode material
es C/10 C/2 1C 2C 3C 4C
High power 9.25×10⁻⁵ 1.35×10⁻⁴ 1.24×10⁻⁴ 9.28×10⁻⁵ 1.23×10⁻⁴ 2.69×10⁻⁴
High energy 1.27×10⁻⁴ 1.42×10⁻⁴ 3.59×10⁻⁴ 7.92×10⁻⁵ 1.57×10⁻⁴ -
Although the errors are very low and acceptable, it seems that no correlation exists between the
errors and the discharge rates. In another word, the error does not increase while higher
discharge rates are simulated. An interpretation can be that for higher discharge rates, the
resistance of cell behaves closer to the exponential form of the equation (Eq. (4.14), which
compensates the higher error of SPM simulation in high discharge rates.

58
4.6 Conclusion
An empirical variable resistance has been added inside a Single Particle Model (SPM) to
represent the increasing overpotential specifically found at the end of the charge/discharge
process of a Li/LFP cell. This improved SPM model takes into account 1- the increasing
diffusion overpotential due to the intercalation/deintercalation of ions in larger particles and 2-
the increasing ohmic resistance from the resistive-reactant feature of LFP. The electrolyte
overpotential can also be a part of this increasing resistance, which makes the model well suited
for charge/discharge rates higher than 1C. Parameter Estimation method provided the
electrochemical parameters of the cell and the constant coefficients of the empirical function of
resistance. A current-dependent radius (Mosaic model) was considered for the particles to mimic
the particle-size distribution (PSD). Model-experiment comparisons indicated promising results
for two designs of Li/LFP coin cells, a high-power and a high-capacity configurations.
Acknowledgements
The authors are very grateful to Hydro-Québec and to the Natural Sciences and Engineering
Council of Canada (NSERC) for their financial support.
Nomenclature:
max,s kc Maximum concentration of Li+ in the particle of positive electrode, mol/m3
,s pD Li+ diffusion coefficient in the particle of positive electrode, m2/s
F Faraday’s constant, C/mol
I Applied current density, A/m2
kK Reaction rate constant of electrode k (k=p,n), m2.5/mol0.5s
P Unknown parameter vector
R Universal gas constant, J/mol K
pR Radius of the particles of positive electrode, m

59
kS Total electroactive area of electrode k (k=p,n), m2
pSOC State of charge of positive electrode
,p iniSOC Initial state of charge of positive electrode
t Time, s
T Absolute temperature, K
pU Open-circuit potential of positive electrode, V
pV Total volume of positive, m3
cellV Model’s estimation of the cell potential, V
Greek
p Porosity of positive electrode
p Dimensionless flux of lithium ion at positive electrode
k The kth eigenvalue
Subscripts
ini Initial state
p Positive electrode
n Negative electrode
s Solid phase

60
5. Conclusion
The research project presented in this thesis is divided in two parts: 1. developing a PE
methodology to estimate the main electrochemical parameters of LIBs, and 2. introducing a
simple model to simulate the peculiar behavior of LIB with LFP as the positive electrode
material. The proposed PE methodology showed promising results for simulating LIBs with
three different positive electrode active materials including LiCoO2, LiMn2O4 and LiFePO4,
thus expressing its full potential and flexibility. As the second main objective, PE have been
successfully used to calculate the most influential electrochemical parameters of LFP positive
electrode and the coefficients of the newly proposed variable resistance SPM. Again, a good
agreement has been found when experimental data were compared to the model predictions.
A well-suited model for the simulation of LIBs depends on the desired time and length scales.
Increasing demands for employing LIBs in electric and hybrid electric vehicles (EV/HEV) in
the form of a battery pack integrated to an efficient battery management system (BMS)
necessitate selecting an appropriate model for large time and length scales. Considering kinetics
and mass transport inside the cell, electrochemical engineering models surpass other models
available in the open literature. Although SPM neglects the concentration and potential fields in
the solution phase, it still appears to be the best candidate among other electrochemical models
for PE and large time/length scale studies. Here, a modified SPM is derived from a P2D model
assuming a linear function for the electrolyte concentration and a polynomial function for its
conductivity. This modification succeeds to enhance SPM with an electrolyte potential drop
function and makes it more accurate in higher discharge/charge rate simulations. PE provides
parameters that SPM needs. These parameters include design parameters, electrode specific
parameters and kinetics parameters. In the work presented, eight key internal parameters of LIB
determined by PE have been identified: the solid diffusion coefficients (Ds,n and Ds,p), the
intercalation/deintercalation reaction-rate constants (Kn and Kp), the initial SOC (SOCn,0 and
SOCp,0), and the electroactive surface areas (Sn and Sp). In this study, PE is also used to
determine the two coefficients of the newly introduced electrolyte potential drop function. A
sensitivity analysis is conducted for defining the best time domains to estimate each parameter.
Although these parameters are identifiable with the Li-ion direct model, their magnitude is
dependent on the positive and negative materials. Moreover, various structures of the active
materials and different intercalation/deintercalation mechanisms call for the application of the
methodology for each different positive electrode active materials. Accordingly, separated
sensitivity analyses were carried out for each material.
After achieving good results with the PE methodology presented in chapter three, special
features of LFP active material were addressed and a variable resistance SPM was introduced
to represent these characteristics. Again, major parameters of LFP electrode were estimated. In

61
addition, three coefficients of an exponential equation representing the resistivity of LFP were
determined to illustrate the increasing overpotential drop at the end of the discharge process.
This resistive behavior of LFP was attributed to two phenomena: 1. increasing diffusion
overpotential from intercalation / deintercalation of ions in larger particles at the end of
discharge, and 2. higher ohmic resistance due to transfer of electrons inside low conductive
matrix phase as the discharge proceeds. The varying resistance SPM displayed improvements
in modeling the behavior of LFP electrode in both case of high-energy and high-power Li/LFP
coin cells.
5.1 Future work
The systematic and accurate PE methodology presented in this study is the first step toward a
better estimation of the inside electrochemical parameters of LIBs. Although the methodology
and the process were verified for different electrode active materials, it is always necessary to
check the predictability of the methodology when it comes to estimate parameters of new
materials with a different structure. Moreover, it would be of merit to expand this study by
modifying the assumptions in the direct electrochemical model. However, it should be noted
that enhancing the model could jeopardize the speed of the PE process and make the
methodology inconvenient for the online estimation. For example, adding temperature equations
and heat generation relationships would improve the predictability of PE in various working
temperature. In this case, the needed calculation time, however, will increase due to coupling of
electrochemical equation and thermal ones.
One of the best scenario for pursuing this study is to perform PE during lifetime of the cells in
different time intervals and cycle numbers. Due to the fact that electrochemical parameters are
representing the physical phenomena occurring inside the cells, following the changes in these
parameters will shed light on the mechanisms and phenomena taking place when the battery
ages. In this regard, attributing appropriate empirical functions for each dominant parameter
will lead to the development of a semi-empirical aging model.

62
References
[1] Dunn, B., Kamath, H., & Tarascon, J. M. (2011). Electrical energy storage for the grid: a
battery of choices. Science, 334(6058), 928-935.
[2] Tarascon, J. M., & Armand, M. (2001). Issues and challenges facing rechargeable lithium
batteries. Nature, 414(6861), 359-367.
[3] Park, J. K. (Ed.). (2012). Principles and applications of lithium secondary batteries. John
Wiley & Sons.
[4] Bloom, I., Cole, B. W., Sohn, J. J., Jones, S. A., Polzin, E. G., Battaglia, V. S., ... & Ingersoll,
D. (2001). An accelerated calendar and cycle life study of Li-ion cells. Journal of Power
Sources, 101(2), 238-247.
[5] Liaw, B. Y., Jungst, R. G., Nagasubramanian, G., Case, H. L., & Doughty, D. H. (2005).
Modeling capacity fade in lithium-ion cells. Journal of power sources, 140(1), 157-161.
[6] Atlung, S., West, K., & Jacobsen, T. (1979). Dynamic aspects of solid solution cathodes for
electrochemical power sources. Journal of The Electrochemical Society, 126(8), 1311-1321.
[7] Haran, B. S., Popov, B. N., & White, R. E. (1998). Determination of the hydrogen diffusion
coefficient in metal hydrides by impedance spectroscopy. Journal of Power Sources, 75(1), 56-
63.
[8] Guo, M., Sikha, G., & White, R. E. (2011). Single-particle model for a lithium-ion cell:
Thermal behavior. Journal of The Electrochemical Society, 158(2), A122-A132.
[9] Zhang, D., Popov, B. N., & White, R. E. (2000). Modeling lithium intercalation of a single
spinel particle under potentiodynamic control. Journal of The Electrochemical Society, 147(3),
831-838.
[10] Santhanagopalan, S., Guo, Q., Ramadass, P., & White, R. E. (2006). Review of models for
predicting the cycling performance of lithium ion batteries. Journal of Power Sources, 156(2),
620-628.
[11] Ramadesigan, V., Northrop, P. W., De, S., Santhanagopalan, S., Braatz, R. D., &
Subramanian, V. R. (2012). Modeling and simulation of lithium-ion batteries from a systems
engineering perspective. Journal of The Electrochemical Society, 159(3), R31-R45.

63
[12] Doyle, M., & Newman, J. (1995). Modeling the performance of rechargeable lithium-based
cells: design correlations for limiting cases. Journal of Power Sources, 54(1), 46-51.
[13] Doyle, M., & Newman, J. (1995). The use of mathematical modeling in the design of
lithium/polymer battery systems. Electrochimica Acta, 40(13), 2191-2196.
[14] Newman, J. (1995). Optimization of Porosity and Thickness of a Battery Electrode by
Means of a Reaction‐Zone Model. Journal of the Electrochemical Society, 142(1), 97-101.
[15] Botte, G. G., Subramanian, V. R., & White, R. E. (2000). Mathematical modeling of
secondary lithium batteries. Electrochimica Acta, 45(15), 2595-2609.
[16] Doyle, M., Newman, J., Gozdz, A. S., Schmutz, C. N., & Tarascon, J. M. (1996).
Comparison of modeling predictions with experimental data from plastic lithium ion cells.
Journal of the Electrochemical Society, 143(6), 1890-1903.
[17] Fuller, T. F., Doyle, M., & Newman, J. (1994). Relaxation Phenomena in Lithium‐Ion‐
Insertion Cells. Journal of the Electrochemical Society, 141(4), 982-990.
[18] Fuller, T. F., Doyle, M., & Newman, J. (1994). Simulation and optimization of the dual
lithium ion insertion cell. Journal of the Electrochemical Society, 141(1), 1-10.
[19] Gomadam, P. M., Weidner, J. W., Dougal, R. A., & White, R. E. (2002). Mathematical
modeling of lithium-ion and nickel battery systems. Journal of Power Sources, 110(2), 267-
284.
[20] Ning, G., White, R. E., & Popov, B. N. (2006). A generalized cycle life model of
rechargeable Li-ion batteries. Electrochimica acta, 51(10), 2012-2022.
[21] Ramadass, P., Haran, B., Gomadam, P. M., White, R., & Popov, B. N. (2004). Development
of first principles capacity fade model for Li-ion cells. Journal of the Electrochemical Society,
151(2), A196-A203.
[22] Thomas, K. E., & Newman, J. (2003). Thermal modeling of porous insertion electrodes.
Journal of the Electrochemical Society, 150(2), A176-A192.
[23] Bhattacharya, J., & Van der Ven, A. (2010). Phase stability and nondilute Li diffusion in
spinel Li 1+ x Ti 2 O 4. Physical Review B, 81(10), 104304.

64
[24] Van der Ven, A., Bhattacharya, J., & Belak, A. A. (2012). Understanding Li diffusion in
Li-intercalation compounds. Accounts of chemical research, 46(5), 1216-1225.
[25] Ceder, G., Abdellahi, A., Akyildiz, O., Malik, R., & Thornton, K. (2013, October). Phase
transformation kinetics and morphology in LiFePO4. In Meeting Abstracts (No. 11, pp. 575-
575). The Electrochemical Society.
[26] Newman, J., & Tiedemann, W. (1975). Porous‐electrode theory with battery applications.
AIChE Journal, 21(1), 25-41.
[27] Bruggeman, D. A. G. (1935). Calculation of various physics constants in heterogenous
substances I Dielectricity constants and conductivity of mixed bodies from isotropic substances.
Ann. Phys, 24(7), 636-664.
[28] Thomas, K. E., Newman, J., & Darling, R. M. (2002). Mathematical modeling of lithium
batteries. In Advances in lithium-ion batteries (pp. 345-392). Springer US.
[29] Safari, M., Morcrette, M., Teyssot, A., & Delacourt, C. (2009). Multimodal physics-based
aging model for life prediction of Li-ion batteries. Journal of The Electrochemical Society,
156(3), A145-A153.
[30] Ning, G., & Popov, B. N. (2004). Cycle life modeling of lithium-ion batteries. Journal of
The Electrochemical Society, 151(10), A1584-A1591.
[31] Safari, M., & Delacourt, C. (2011). Mathematical modeling of lithium iron phosphate
electrode: galvanostatic charge/discharge and path dependence. Journal of The Electrochemical
Society, 158(2), A63-A73.
[32] Tanim, T. R., Rahn, C. D., & Wang, C. Y. (2015). A temperature dependent, single particle,
lithium ion cell model including electrolyte diffusion. Journal of Dynamic Systems,
Measurement, and Control, 137(1), 011005.
[33] Rahimian, S. K., Rayman, S., & White, R. E. (2013). Extension of physics-based single
particle model for higher charge–discharge rates. Journal of Power Sources, 224, 180-194.
[34] Santhanagopalan, S., Guo, Q., & White, R. E. (2007). Parameter estimation and model
discrimination for a lithium-ion cell. Journal of the Electrochemical Society, 154(3), A198-
A206.

65
[35] Santhanagopalan, S., Zhang, Q., Kumaresan, K., & White, R. E. (2008). Parameter
estimation and life modeling of lithium-ion cells. Journal of The Electrochemical Society,
155(4), A345-A353.
[36] Ramadesigan, V., Chen, K., Burns, N. A., Boovaragavan, V., Braatz, R. D., &
Subramanian, V. R. (2011). Parameter estimation and capacity fade analysis of lithium-ion
batteries using reformulated models. Journal of The Electrochemical Society, 158(9), A1048-
A1054.
[37] Marcicki, J., Canova, M., Conlisk, A. T., & Rizzoni, G. (2013). Design and parametrization
analysis of a reduced-order electrochemical model of graphite/LiFePO 4 cells for SOC/SOH
estimation. Journal of Power Sources, 237, 310-324.
[38] Zhang, L., Wang, L., Hinds, G., Lyu, C., Zheng, J., & Li, J. (2014). Multi-objective
optimization of lithium-ion battery model using genetic algorithm approach. Journal of Power
Sources, 270, 367-378.
[39] Forman, J. C., Moura, S. J., Stein, J. L., & Fathy, H. K. (2012). Genetic identification and
fisher identifiability analysis of the Doyle–Fuller–Newman model from experimental cycling of
a LiFePO4 cell. Journal of Power Sources, 210, 263-275.
[40] Jokar, A., Rajabloo, B., Désilets, M., & Lacroix, M. (2016). An Inverse Method for
Estimating the Electrochemical Parameters of Lithium-Ion Batteries I. Methodology. Journal
of The Electrochemical Society, 163(14), A2876-A2886.
[41] Masoudi, R., Uchida, T., & McPhee, J. (2015). Parameter estimation of an
electrochemistry-based lithium-ion battery model. Journal of Power Sources, 291, 215-224.
[42] Rahman, M. A., Anwar, S., & Izadian, A. (2016). Electrochemical model parameter
identification of a lithium-ion battery using particle swarm optimization method. Journal of
Power Sources, 307, 86-97.
[43] Ozisik, M. N. (2000). Inverse heat transfer: fundamentals and applications. CRC Press.
[44] Colaço, M. J., Orlande, H. R., & Dulikravich, G. S. (2006). Inverse and optimization
problems in heat transfer. Journal of the Brazilian Society of Mechanical Sciences and
Engineering, 28(1), 1-24.

66
[45] Rajabloo, B., Jokar, A., Désilets, M., & Lacroix, M. (2017). An Inverse Method for
Estimating the Electrochemical Parameters of Lithium-Ion Batteries II: Implementation.
Journal of The Electrochemical Society, 164(2), A99-A105.
[46] Zhang, J., & Lee, J. (2011). A review on prognostics and health monitoring of Li-ion
battery. Journal of Power Sources, 196(15), 6007-6014.
[47] Lu, L., Han, X., Li, J., Hua, J., & Ouyang, M. (2013). A review on the key issues for
lithium-ion battery management in electric vehicles. Journal of power sources, 226, 272-288.
[48] Rahimi-Eichi, H., Ojha, U., Baronti, F., & Chow, M. Y. (2013). Battery management
system: an overview of its application in the smart grid and electric vehicles. IEEE Industrial
Electronics Magazine, 7(2), 4-16.
[49] Doyle, M., Fuller, T. F., & Newman, J. (1993). Modeling of galvanostatic charge and
discharge of the lithium/polymer/insertion cell. Journal of the Electrochemical Society, 140(6),
1526-1533.
[50] Jokar, A., Rajabloo, B., Désilets, M., & Lacroix, M. (2016). Review of simplified Pseudo-
two-Dimensional models of lithium-ion batteries. Journal of Power Sources, 327, 44-55.
[51] Masoudi, R., Uchida, T., & McPhee, J. (2015). Parameter estimation of an
electrochemistry-based lithium-ion battery model. Journal of Power Sources, 291, 215-224.
[52] Seaman, A., Dao, T. S., & McPhee, J. (2014). A survey of mathematics-based equivalent-
circuit and electrochemical battery models for hybrid and electric vehicle simulation. Journal
of Power Sources, 256, 410-423.
[53] Cai, L., & White, R. E. (2009). Reduction of model order based on proper orthogonal
decomposition for lithium-ion battery simulations. Journal of The Electrochemical Society,
156(3), A154-A161.
[54] Prosini, P. P., Lisi, M., Scaccia, S., Carewska, M., Cardellini, F., & Pasquali, M. (2002).
Synthesis and characterization of amorphous hydrated FePO4 and its electrode performance in
lithium batteries. Journal of the Electrochemical Society, 149(3), A297-A301.
[55] Prosini, P. P., Lisi, M., Zane, D., & Pasquali, M. (2002). Determination of the chemical
diffusion coefficient of lithium in LiFePO 4. Solid State Ionics, 148(1), 45-51.

67
[56] Denis, Y. W., Fietzek, C., Weydanz, W., Donoue, K., Inoue, T., Kurokawa, H., & Fujitani,
S. (2007). Study of LiFePO4 by cyclic voltammetry. Journal of the Electrochemical Society,
154(4), A253-A257.
[57] Churikov, A. V., Ivanishchev, A. V., Ivanishcheva, I. A., Sycheva, V. O., Khasanova, N.
R., & Antipov, E. V. (2010). Determination of lithium diffusion coefficient in LiFePO 4
electrode by galvanostatic and potentiostatic intermittent titration techniques. Electrochimica
Acta, 55(8), 2939-2950.
[58] Matsui, H., Nakamura, T., Kobayashi, Y., Tabuchi, M., & Yamada, Y. (2010). Open-circuit
voltage study on LiFePO 4 olivine cathode. Journal of Power Sources, 195(19), 6879-6883.
[59] Tang, X. C., Li, L. X., Lai, Q. L., Song, X. W., & Jiang, L. H. (2009). Investigation on
diffusion behavior of Li+ in LiFePO 4 by capacity intermittent titration technique (CITT).
Electrochimica Acta, 54(8), 2329-2334.
[60] Srinivasan, V., & Newman, J. (2004). Design and optimization of a natural graphite/iron
phosphate lithium-ion cell. Journal of the Electrochemical Society, 151(10), A1530-A1538.
[61] Yu, S., Kim, S., Kim, T. Y., Nam, J. H., & Cho, W. I. (2013). Model Prediction and
Experiments for the Electrode Design Optimization of LiFePO4/Graphite Electrodes in High
Capacity Lithium-ion Batteries. Bull. Korean Chem. Soc, 34(1), 79.
[62] Prada, E., Di Domenico, D., Creff, Y., Bernard, J., Sauvant-Moynot, V., & Huet, F. (2012).
Simplified electrochemical and thermal model of LiFePO4-graphite Li-ion batteries for fast
charge applications. Journal of The Electrochemical Society, 159(9), A1508-A1519.
[63] Safari, M., & Delacourt, C. (2011). Modeling of a commercial graphite/LiFePO4 cell.
Journal of The Electrochemical Society, 158(5), A562-A571.
[64] Doyle, M., & Fuentes, Y. (2003). Computer simulations of a lithium-ion polymer battery
and implications for higher capacity next-generation battery designs. Journal of The
Electrochemical Society, 150(6), A706-A713.
[65] Maheshwari, A., Dumitrescu, M. A., Destro, M., & Santarelli, M. (2016). Inverse parameter
determination in the development of an optimized lithium iron phosphate–Graphite battery
discharge model. Journal of Power Sources, 307, 160-172.
[66] Srinivasan, V., & Newman, J. (2004). Discharge model for the lithium iron-phosphate
electrode. Journal of the Electrochemical Society, 151(10), A1517-A1529.

68
[67] Dodd, J. L. (2007). Phase composition and dynamical studies of lithium iron phosphate
(Doctoral dissertation, California Institute of Technology).
[68] Li, J., Cheng, Y., Jia, M., Tang, Y., Lin, Y., Zhang, Z., & Liu, Y. (2014). An
electrochemical–thermal model based on dynamic responses for lithium iron phosphate battery.
Journal of Power Sources, 255, 130-143.
[69] Kumaresan, K., Sikha, G., & White, R. E. (2008). Thermal model for a Li-ion cell. Journal
of the Electrochemical Society, 155(2), A164-A171.
[70] Farkhondeh, M., Safari, M., Pritzker, M., Fowler, M., Han, T., Wang, J., & Delacourt, C.
(2014). Full-range simulation of a commercial LiFePO4 electrode accounting for bulk and
surface effects: A comparative analysis. Journal of The Electrochemical Society, 161(3), A201-
A212.
[71] Andersson, A. S., & Thomas, J. O. (2001). The source of first-cycle capacity loss in LiFePO
4. Journal of Power Sources, 97, 498-502.
[72] Ravet, N., Goodenough, J. B., Besner, S., Simoneau, M., Hovington, P., & Armand, M.
(1999, October). Abstract# 127, 196. In Meeting of the Electrochemical Society, Hawai.
[73] Ravet, N., Chouinard, Y., Magnan, J. F., Besner, S., Gauthier, M., & Armand, M. (2001).
Electroactivity of natural and synthetic triphylite. Journal of Power Sources, 97, 503-507.
[74] Yamada, A., Chung, S. C., & Hinokuma, K. (2001). Optimized LiFePO4 for lithium battery
cathodes. Journal of the electrochemical society, 148(3), A224-A229.
[75] Delacourt, C., Poizot, P., Levasseur, S., & Masquelier, C. (2006). Size effects on carbon-
free LiFePO4 powders the key to superior energy density. Electrochemical and Solid-State
Letters, 9(7), A352-A355.
[76] Huang, H., Yin, S. C., & Nazar, L. S. (2001). Approaching theoretical capacity of LiFePO4
at room temperature at high rates. Electrochemical and Solid-State Letters, 4(10), A170-A172.
[77] Laffont, L., Delacourt, C., Gibot, P., Wu, M. Y., Kooyman, P., Masquelier, C., & Tarascon,
J. M. (2006). Study of the LiFePO4/FePO4 two-phase system by high-resolution electron energy
loss spectroscopy. Chemistry of Materials, 18(23), 5520-5529.

69
[78] Bramnik, N. N., Nikolowski, K., Baehtz, C., Bramnik, K. G., & Ehrenberg, H. (2007).
Phase transitions occurring upon lithium insertion-extraction of LiCoPO4. Chemistry of
Materials, 19(4), 908-915.
[79] Padhi, A. _. K., Nanjundaswamy, K. S., & Goodenough, J. B. D. (1997). Phospho‐olivines
as positive‐electrode materials for rechargeable lithium batteries. Journal of the electrochemical
society, 144(4), 1188-1194.
[80] Yamada, A., Koizumi, H., Sonoyama, N., & Kanno, R. (2005). Phase change in Li x
FePO4. Electrochemical and Solid-State Letters, 8(8), A409-A413.
[81] Kasavajjula, U. S., Wang, C., & Arce, P. E. (2008). Discharge model for LiFePO4
accounting for the solid solution range. Journal of The Electrochemical Society, 155(11), A866-
A874.
[82] Dargaville, S., & Farrell, T. W. (2010). Predicting active material utilization in LiFePO4
electrodes using a multiscale mathematical model. Journal of the Electrochemical Society,
157(7), A830-A840.
[83] Singh, G. K., Ceder, G., & Bazant, M. Z. (2008). Intercalation dynamics in rechargeable
battery materials: general theory and phase-transformation waves in LiFePO 4. Electrochimica
Acta, 53(26), 7599-7613.
[84] Burch, D., Singh, G., Ceder, G., & Bazant, M. Z. (2008). Phase-transformation wave
dynamics in LiFePO4. In Solid State Phenomena (Vol. 139, pp. 95-100). Trans Tech
Publications.
[85] Burch, D., & Bazant, M. Z. (2009). Size-dependent spinodal and miscibility gaps for
intercalation in nanoparticles. Nano letters, 9(11), 3795-3800.
[86] Delmas, C., Maccario, M., Croguennec, L., Le Cras, F., & Weill, F. (2008). Lithium
deintercalation in LiFePO4 nanoparticles via a domino-cascade model. Nature materials, 7(8),
665-671.
[87] Sasaki, T., Ukyo, Y., & Novák, P. (2013). Memory effect in a lithium-ion battery. Nature
materials, 12(6), 569-575.
[88] Thomas-Alyea, K. E. (2008). Modeling resistive-reactant and phase-change materials in
battery electrodes. ECS Transactions, 16(13), 155-165.

70
[89] Thorat, I. V. (2009). Understanding Performance-limiting Mechanisms in Lithium-ion
Batteries for High-rate Applications. ProQuest.
[90] Farkhondeh, M., & Delacourt, C. (2011). Mathematical modeling of commercial LiFePO4
electrodes based on variable solid-state diffusivity. Journal of The Electrochemical Society,
159(2), A177-A192.
[91] Wang, J., & Sun, X. (2015). Olivine LiFePO 4: the remaining challenges for future energy
storage. Energy & Environmental Science, 8(4), 1110-1138.
[92] Delacourt, C., & Safari, M. (2011). Analysis of lithium deinsertion/insertion in Li y FePO
4 with a simple mathematical model. Electrochimica Acta, 56(14), 5222-5229.
[93] Delacourt, C., Laffont, L., Bouchet, R., Wurm, C., Leriche, J. B., Morcrette, M. &
Masquelier, C. (2005). Toward understanding of electrical limitations (electronic, ionic) in
LiMPO4 (M= Fe, Mn) electrode materials. Journal of the Electrochemical Society, 152(5),
A913-A921.
[94] Dominko, R., Gaberscek, M., Drofenik, J., Bele, M., Pejovnik, S., & Jamnik, J. (2003). The
role of carbon black distribution in cathodes for Li ion batteries. Journal of Power Sources, 119,
770-773.
[95] Marcicki, J. (2012). Modeling, parametrization, and diagnostics for lithium-ion batteries
with automotive applications (Doctoral dissertation, The Ohio State University).
[96] Arora, P., Doyle, M., Gozdz, A. S., White, R. E., & Newman, J. (2000). Comparison
between computer simulations and experimental data for high-rate discharges of plastic lithium-
ion batteries. Journal of power Sources, 88(2), 219-231.
[97] Paxton, B., & Newman, J. (1996). Variable Diffusivity in Intercalation Materials A
Theoretical Approach. Journal of The Electrochemical Society, 143(4), 1287-1292.
[98] Franger, S. F. L. C., Le Cras, F., Bourbon, C., & Rouault, H. (2002). LiFePO4 synthesis
routes for enhanced electrochemical performance. Electrochemical and Solid-State Letters,
5(10), A231-A233.