Estimating vegetation water content with hyperspectral data for different canopy scenarios:...
14
This article was originally published in a journal published by Elsevier, and the attached copy is provided by Elsevier for the author’s benefit and for the benefit of the author’s institution, for non-commercial research and educational use including without limitation use in instruction at your institution, sending it to specific colleagues that you know, and providing a copy to your institution’s administrator. All other uses, reproduction and distribution, including without limitation commercial reprints, selling or licensing copies or access, or posting on open internet sites, your personal or institution’s website or repository, are prohibited. For exceptions, permission may be sought for such use through Elsevier’s permissions site at: http://www.elsevier.com/locate/permissionusematerial
-
Upload
independent -
Category
Documents
-
view
2 -
download
0
Transcript of Estimating vegetation water content with hyperspectral data for different canopy scenarios:...

This article was originally published in a journal published byElsevier, and the attached copy is provided by Elsevier for the
author’s benefit and for the benefit of the author’s institution, fornon-commercial research and educational use including without
limitation use in instruction at your institution, sending it to specificcolleagues that you know, and providing a copy to your institution’s
administrator.
All other uses, reproduction and distribution, including withoutlimitation commercial reprints, selling or licensing copies or access,
or posting on open internet sites, your personal or institution’swebsite or repository, are prohibited. For exceptions, permission
may be sought for such use through Elsevier’s permissions site at:
http://www.elsevier.com/locate/permissionusematerial

Autho
r's
pers
onal
co
py
Estimating vegetation water content with hyperspectral data for differentcanopy scenarios: Relationships between AVIRIS and MODIS indexes
Yen-Ben Cheng a,⁎, Pablo J. Zarco-Tejada a, David Riaño a,b, Carlos A. Rueda a, Susan L. Ustin a
a Center for Spatial Technologies and Remote Sensing (CSTARS), Department of Land, Air, and Water Resources (LAWR), One Shields Avenue, The Barn,University of California, Davis, CA 95616, USA
b Departamento de Geografía, Universidad de Alcalá, Colegios 2, E-28801 Alcalá de Henares, Madrid, Spain
Received 17 April 2006; received in revised form 6 July 2006; accepted 15 July 2006
Abstract
Three linked leaf and canopy radiative transfer models were used to assess uncertainties in three vegetation architectures for the relationshipsbetween canopy water content and Equivalent Water Thickness (EWT). The leaf radiative transfer model PROSPECT was linked to SAILH,rowMCRM, and FLIM canopy reflectance models to generate synthetic spectra for a range of leaf and canopy parameters under closed, row-structured, and forest canopy architectures, respectively. Leaf water content (Cw) and leaf area index (LAI) were used to calculate canopy watercontent. Leaf and canopy parameters that affect the retrieval of EWT, estimated by the MODTRAN-based fitting technique, were used toinvestigate their influence on the water content estimates. Results showed a consistent relationship between retrieved EWT and canopy watercontent for the different simulated architectural scenarios. It was shown that EWTwas negatively affected by leaf dry matter and soil background.Retrievals of EWT from hyperspectral Advanced Visible Infrared Imaging Spectrometer (AVIRIS) imagery at three study sites were then used forcross-validation of the Moderate Resolution Imaging Spectrometer (MODIS) data, assessing the behavior of NDVI, EVI, NDWI, and SIWSI aspotential indicators of vegetation water content. All four MODIS indexes showed consistent agreement with retrievals of EWT from AVIRISimagery at the agricultural site and the savanna–shrub site, with EVI having the highest correlation. However, at the conifer forest study site thetwo water indexes, NDWI and SIWSI, yielded better agreement with retrievals of EWT than NDVI and EVI. The performance of NDVI wasinconsistent across sites. This manuscript demonstrates the importance of canopy architecture when estimating EWT by showing that large errorsare obtained when EWT estimates derived from absorption feature curve-fitting are applied to different canopy types. These errors are propagatedin simple indexes that produce inconsistent results when applied to divergent vegetation conditions.© 2006 Elsevier Inc. All rights reserved.
Keywords: Radiative transfer model; Equivalent water thickness; AVIRIS; MODIS
1. Introduction
Accurate quantitative estimates of biochemical properties ofvegetation canopies are important applications of remotesensing for terrestrial ecology (Gao & Goetz, 1995). Estimatesof vegetation water content are of interest for assessingvegetation water status in agriculture and forestry (Gao, 1996;Gao & Goetz, 1995; Peñuelas et al., 1997; Ustin et al., 2004a,b,1998; Zarco-Tejada et al., 2003), and have been used fordrought assessment (Peñuelas et al., 1993) and prediction of
susceptibility to wildfire (Chuvieco et al., 2004; Riaño et al.,2005; Ustin et al., 1998).
Reflectance in the near-infrared (NIR) and shortwave-infrared (SWIR) regions is largely influenced by water anddry matter in the leaves (Gao, 1996; Jacquemoud et al., 1996;Peñuelas et al., 1997; Tucker, 1980), while photosyntheticpigments only absorb in the visible and red-edge spectral region(Carter, 1994; Miller et al., 1990; Ustin et al., 2004a,b; Zarco-Tejada et al., 2004, 2001). Thus, measurements in NIR-SWIRprovide a pigment-independent quantitative estimate of vege-tation water content, although they are also affected by leafstructure, leaf dry matter, canopy structure, and leaf area index(Gao, 1996; Jacquemoud et al., 1996; Serrano et al., 2000;Zarco-Tejada et al., 2003). Most satellite and airborne estimates
Remote Sensing of Environment 105 (2006) 354–366www.elsevier.com/locate/rse
⁎ Corresponding author.E-mail address: [email protected] (Y.-B. Cheng).
0034-4257/$ - see front matter © 2006 Elsevier Inc. All rights reserved.doi:10.1016/j.rse.2006.07.005

Autho
r's
pers
onal
co
py
of vegetation moisture content use empirical band-ratio indexes(Gao, 1996; Huete et al., 1997; Peñuelas et al., 1997; Serrano etal., 2000; Ustin et al., 2004a), but the accuracy of these indexesacross a wide range of ecological conditions is uncertain.
Several studies support that accurate estimates of canopywater content can be derived from the Moderate ResolutionImaging Spectrometer (MODIS). Zarco-Tejada and Ustin(2001) and Zarco-Tejada et al. (2003) proposed a modelinversion method with a linked leaf-canopy radiative transfer
simulation which successfully monitored water content inchaparral vegetation by taking into account variations in leafcharacteristics and canopy structure (Zarco-Tejada et al., 2003).The MODIS data product MOD09A1 provides calibratedreflectance for the seven spectral bands in the 400–2500 nmspectral region that are measured at 250 m or 500 m pixelresolutions (http://modis.gsfc.nasa.gov). Band 2, centered at858.5 nm, band 5 at 1240 nm, and band 6 at 1640 nm have beenused to retrieve water content (Fensholt & Sandholt, 2003; Gao,
Fig. 1. Effects of (a) dry matter content (Cm) and (b) leaf internal structure parameter (N) on reflectance spectra simulated by PROSPECT-SAILH. (c) Three differentsoil spectra used in simulation. Effects of different soil background on reflectance spectra simulated by (d) PROSPECT-SAILH, (e) PROSPECT-rowMCRM, (f)PROSPECT-FLIM. (Parameters were set according to Table 1, but leaf equivalent water thickness (Cw)=0.015 cm, leaf area index (LAI)=3, sun zenith angle (ts)=30°,view zenith angle (tv)=0°, and relative azimuth angle (ps)=0°).
355Y.-B. Cheng et al. / Remote Sensing of Environment 105 (2006) 354–366

Autho
r's
pers
onal
co
py
1996; Xiao et al., 2005; Zarco-Tejada et al., 2003; Zarco-Tejada& Ustin, 2001). Gao (1996) first proposed the NormalizedDifference Water Index (NDWI) using the water absorptionfeatures at 860 nm and 1240 nm from MODIS to retrievevegetation liquid water. The combination of MODIS bandscentered at 858.5 nm and 1640 nmwas proposed under the nameof the Shortwave Infrared Water Stress Index (SIWSI, Fensholt& Sandholt, 2003) and Land Surface Water Index (LSWI, Xiaoet al., 2005) to monitor spatial and temporal changes invegetation water content in the semiarid Sahelian zone of WestAfrica and paddy rice fields in China. This combination isessentially the same as theNormalized Difference Infrared Index(NDII, Hardisky et al., 1983) applied to the Landsat ThematicMapper data.
In hyperspectral airborne studies, analytical techniques havebeen developed to interpret water absorption features for vegetationwater content estimates (Gao & Goetz, 1995; Green et al., 1993;Roberts et al., 1997; Serrano et al., 2000; Ustin et al., 1998). Giventhe contiguous spectral coverage in the 400–2500 nm region, aspectral matching technique was developed to simultaneouslyestimate water vapor and liquid water in a MODTRAN-basedradiative transfer model (ACORN, ImSpec LLC, AnalyticalImaging and Geophysics LLC, Boulder, CO) (Green et al., 1991,1993; Roberts et al., 1997). The MODTRAN-based approachimplemented in ACORN provides an output layer in whichvegetation liquidwater content is expressed as theEquivalentWaterThickness (EWT), or the equivalent depth of water in the pixel thatis required to fit the water absorption modeled in the calibrationprocedure (Green et al., 1991, 1993; Roberts et al., 1997). Robertset al. (1997) used EWT tomonitor temporal and spatial variation inwater content in herbaceous, shrub, and conifer vegetation. Ustin etal. (1998) compared different methods for estimating canopy watercontent and showed that EWTcould estimate canopywater contentof chaparral shrubs and detect seasonal differences. Serrano et al.(2000) reported that EWTshowed significant contrast among plantcommunities of coastal sage shrub, ceanothus, and chamisechaparral. Later, Champagne et al. (2003) validated EWT againstin situ plant-derived estimates, and demonstrated EWT to monitorplant water content in crops. Cheng et al. (submitted forpublication-a) also showed that retrievals of EWT from AdvancedVisible Infrared Imaging Spectrometer (AVIRIS) data had goodagreement with in situ canopy water content measurement at asemi-arid site, although under-estimated canopy water content atplots which contained significant proportions of soil background.Canopy Relative Water Content (RWC) measured in the field(Serrano et al., 2000) was compared to retrievals of EWT fromAVIRIS data, which did not perform as well as simple waterindexes. Thus, uncertainties introduced by plant physiological andenvironmental parameters into EWT retrievals derived from theMODTRAN-based curve-fitting method in ACORN need furtherstudy.
This study extends progress in understanding and assessinguncertainties of the algorithm for retrieval of EWT implementedin ACORN using three architecturally extreme vegetation scen-arios simulated by three radiative transfer (RT) models. First weapplied a leaf radiative transfer model to three canopy reflec-tance models to simulate three different vegetation cover types:
(i) closed canopy crops, (ii) row-structured open canopy crops,and (iii) closed canopy forests. The three linked models wereused to generate synthetic AVIRIS-equivalent spectra in order toexamine the agreement between theoretical vegetation canopywater content and EWT retrievals obtained from the ACORN-based fitting algorithm that have been widely used and acceptedfor this purpose (Champagne et al., 2003; Cheng et al.,submitted for publication-a; Green et al., 1993; Roberts et al.,1997; Serrano et al., 2000; Ustin et al., 1998).
This investigation studied the potential effects of other leafbiochemical and canopy biophysical variables on EWT retrievalsusing synthetic AVIRIS-equivalent spectra. Furthermore, threestudy sites with different vegetation types and cover were chosenfor comparison, and EWT at the three sites were retrieved fromAVIRIS imagery acquired in years 2002 and 2004 with the samealgorithm. The EWTmaps were resampled toMODIS pixels andcompared to four band-ratio indexes derived from MODISreflectance products to evaluate the agreement of water retrievalsfrom AVIRIS and MODIS instruments with different resolutions.
2. Study sites
Three study sites with different architectural characteristicswere selected for this modeling study: (i) closed and open canopycrops, (ii) semi-arid shrublands, and (iii) boreal conifer forests.
Table 1Values of parameters when they are fixed and range of variation whenparameters are randomly generated
Range of variation Fixed value
PROSPECTLeaf water content, Cw (cm) 0.001–0.03Leaf dry matter content, Cm
(g cm−2)0.001–0.03 0.015
Leaf internal structure parameter, N 1–2 1.5
SAILHLeaf area index, LAI 1–5Leaf angle distribution function,LADF
Planophile,erectophile, plagiophile
Plagiophile
Soil reflectance, ρs Bright, medium, dark Medium
rowMCRMLeaf area index, LAI 1–5Leaf angle distributeion function,LADF
Planophile,erectophile, plagiophile
Plagiophile
Soil reflectance, ρs Bright, medium, dark MediumCanopy height, h 0.2–2 1.1Crown width, lp 0.2–1.5 0.85Soil strip length, ls 0.2–2 1.1Row direction, alpha row 0–180 90
FLIMLeaf area index, LAI 1–5Leaf angle distribution function, LADFSoil reflectance, ρs Bright, medium, dark MediumCrown height (m) 5–20 12.5Crown diameter (m) 3–8 5.5Tree density (trees ha−1) 200–1000 500Extinction coefficient of crown,crown alpha
0.3–0.7 0.5
356 Y.-B. Cheng et al. / Remote Sensing of Environment 105 (2006) 354–366

Autho
r's
pers
onal
co
py
The first site is located at AZCAL Properties in the SanJoaquin Valley (36°13′14ʺN, 119°55′55ʺW) near Lemoore,California (USA), approximately intermediate between LosAngeles and San Francisco. Seven common agricultural crops(alfalfa, cotton, tomatoes, garlic, wheat, beans, and carrots) areproduced on the ranch, and all but the pistachio orchards havecrops rotated annually among fields. The crop map for thesection of the ranch used in this study was previously describedby Ustin et al. (2004a). We selected alcala (Gossypium hirsutumL.) and pima (Gossypium barbadense L.) cotton fields toanalyze, each averaging 67 ha for a total of 871 ha, and theaverage yield of these fields was 6010 kg/ha in 2002.
The second site, Walnut Gulch Experimental Watershed, is aUSDA research station andAmeriFlux site located near Tombstonein southeastern Arizona (USA) (Hymer et al., 2000; Huete et al.,2002). Walnut Gulch (centered at 31°44′12ʺN and 109°56′31ʺW)is locatedwithin the upper 150 km2 of the SanPedroRiver drainagebasin. In the past, most of this semi-arid site was covered bygrassland, but shrubs now dominate two thirds of the watershed(Abrahams et al., 1995; Hymer et al., 2000; Huete et al., 2002;http://www.tucson.ars.ag.gov). Creosote bush (Larrea tridentata),whitethorn (Acacia constricta), and banana yucca (Yucca baccata)are the most common shrubs in the shrubland region while thegrassland located east of the shrubland is dominated by black grama(Bouteloua eripoda), curly mesquite grass (Hilaria belangeri), andtobosa grass (Hilaria mutica) (Abrahams et al., 1995; Hymer et al.,2000).
The third site selected is the Howland Forest, an AmeriFluxresearch site and EOS land validation core site of 7000 hacentered around 45°12′33ʺN and 68°44′49ʺW, located north ofBangor, Maine (USA) (Hollinger et al., 2004, 1999; http://www.geog.umd.edu/cress/s8rep.htm). This boreal transition forestconsists of spruce–hemlock–fir, aspen–birch, and hemlock–hardwoodmixtures, and is dominated by red spruce (Picea rubensSarg.) and eastern hemlock (Tsuga canadensis (L.) Carr.) aroundthe flux measurement tower (Hollinger et al., 2004, 1999).
3. Simulation methods and image data processing
3.1. Models simulation methods
The widely used leaf radiative transfer model, PROSPECT(Jacquemoud, 1993; Jacquemoud & Baret, 1990; Jacquemoudet al., 1995, 1996), was linked with three different canopyreflectance models: (i) SAILH (Kuusk, 1985; Verhoef, 1984) tosimulate a closed crop scenario; (ii) rowMCRM, a Markov-Chain Canopy Reflectance Model (MCRM) (Kuusk, 1995a,b)with additions to simulate row crop structure; and (iii) FLIM(Rosema et al., 1992) to simulate open-canopy woodlands. Forthe FLIM model, leaf reflectance (ρ) and transmittance (τ)spectra from PROSPECT were used as inputs since the FLIMmodel requires an infinite reflectance (ρcanopy) for thesimulation of the crown reflectance. The Lillesaeter model(Lillesaeter, 1982) designed for an infinite number of stacked
Table 2Effects of leaf and canopy parameters on retrieval of EWT from ACORN as shown by the coefficient of determination (r2)
Randomlygeneratedparameters
Cw, LAI Cw, LAI, Cm Cw, LAI, N Cw, LAI,LADF
Cw, LAI, ρs Cw, LAI, h(crown_h)
Cw, LAI, lp(crown_d)
Cw, LAI,ls (tree_D)
Sun zenithangle
15 30 55 15 30 55 15 30 55 15 30 55 15 30 55 15 30 55 15 30 55 15 30 55
PROSPECT+SAILH
0.96 0.97 0.96 0.89 0.91 0.89 0.94 0.94 0.94 0.94 0.94 0.95 0.95 0.95 0.95
PROSPECT+rowMCRM
0.96 0.92 0.90 0.82 0.86 0.87 0.96 0.93 0.90 0.95 0.93 0.90 0.79 0.83 0.90 0.91 0.68 0.76 0.60 0.64 0.87 0.45 0.48 0.84
PROSPECT+FLIM
0.89 0.88 0.86 0.80 0.77 0.70 0.77 0.79 0.72 0.76 0.82 0.86 0.88 0.88 0.85 0.67 0.71 0.76 0.73 0.74 0.81
Randomlygeneratedparameters
Cw, LAI,alpharow
Cw, LAI,crown_alpha
Cw, LAI, Cm, N Cw, LAI,LADF, ρs
Cw, LAI, andcanopy
Cw, LAI, leafand canopy
Sun zenithangle
15 30 55 15 30 55 15 30 55 15 30 55 15 30 55 15 30 55
PROSPECT+SAILH
0.90 0.88 0.88 0.93 0.93 0.93 0.86 0.87 0.86
PROSPECT+rowMCRM
0.95 0.85 0.69 0.82 0.85 0.87 0.79 0.82 0.90 0.36 0.41 0.42 0.36 0.37 0.49
PROSPECT+FLIM
0.86 0.87 0.88 0.73 0.71 0.63 0.68 0.71 0.76 0.63 0.62 0.64
Bold fonts indicate sun zenith angle. Italic fonts indicated r2 of Cw⁎LAI and EWT.Cw, LAI, and canopy parameters:PROSPECT-rowMCRM: Cw, LAI, LADF, ρs, h, lp, ls, alpharow.PROSPECT-FLIM: Cw, LAI, ρs, tree_D, crown_d, crown_h, crown_alpha.Cw, LAI, leaf and canopy parameters:PROSPECT-SAILH: Cw, LAI, Cm, N, LADF, ρs.PROSPECT-rowMCRM: Cw, LAI, Cm, N, LADF, ρs, h, lp, ls, alpharow.PROSPECT-FLIM: Cw, LAI, Cm, N, ρs, tree_D, crown_d, crown_h, crown alpha.
357Y.-B. Cheng et al. / Remote Sensing of Environment 105 (2006) 354–366

Autho
r's
pers
onal
co
py
leaves was linked to FLIM to simulate crown reflectance fromPROSPECT leaf optical properties (Eq. (1)).
qcanopy ¼q
1−s2ð1Þ
The simulation of infinite canopy reflectance from leafreflectance and transmittance has been successfully demon-strated in previously published studies (see Zarco-Tejada et al.,2001). The synthetic spectra generated by the three models(5 nm bandwidth) were later convolved to AVIRIS-equivalentwavelength intervals using band center and Full-Width-Half-Max (FWHM) intervals of the appropriate Gaussian functioncontained in spectral calibration files of AVIRIS data.
The influences of leaf biochemical and canopy biophysicalparameters on the retrievals of EWT by the ACORN fittingmethod under each canopy scenario were studied using simula-
tions of canopy reflectance by forward modeling. The leaf model,PROSPECT, was randomly varied for inputs such as dry mattercontent (Cm) and the internal leaf structure parameter (N) sincethese variations affect water absorption features, which is shownin Fig. 1a and b, respectively. In contrast, variation in chlorophyllcontent (Ca+b) does not affect spectral regions beyond 800 nmand therefore was set to a constant value.
The potential effects of soil background on retrievals ofEWT were investigated for each model simulation using threesoil reflectance spectra. The three soil spectra (Kuusk, 2001)used as input are shown in Fig. 1c and the synthetic canopyspectra generated by the three linked leaf-canopy models areshown in Fig. 1d–f. For the FLIM model, the three soils wereconsidered as ground reflectance to emphasize the soilbackground effects. Clearly, these model results demonstratethe contribution of background conditions on water contentretrieval as a function of the canopy closure. All simulation
Fig. 2. Schematic view of the simulation study for EWT retrieval.
358 Y.-B. Cheng et al. / Remote Sensing of Environment 105 (2006) 354–366
Autho
r's
pers
onal
co
py
parameters are listed in Table 1 and viewing geometryparameters were set at: sun zenith angles (ts)=30°, view zenithangle (tv)=0°, and relative azimuth angle (ps)=0°.
Each variable that might affect retrievals of EWT wassystematically studied. In each case, parameters were generatedusing a uniform distribution and a subset was chosen randomlywithin a given range, while others were set to a fixed value.Several previous radiative transfer modeling studies were used todefine the ranges (Bacour et al., 2002; Ceccato et al., 2001;Jacquemoud et al., 1996; Zarco-Tejada et al., 2003). The rangesand fixed values are listed in Table 1 and the different cases arelisted in Table 2. Eight cases were simulated with PROSPECT-SAILH, 13 cases with PROSPECT-rowMCRM, and 11 cases
with PROSPECT-FLIM. Each case consisted of a total of 1000synthetic AVIRIS-equivalent canopy reflectance spectra, andeach case was simulated three times for three different sun zenithangles (ts) (15°, 30° and 55°). View zenith angle (tv) and relativeazimuth angle (ps) were both set to 0°. The leaf angle distributionfunction (LADF) was randomly chosen among planophile,erectophile, and plagiophile distributions (Lemeur, 1970) whilesoil reflectance was randomly chosen from the three spectra ofdiffering brightness (shown in Fig. 1c). Leaf water content (Cw)and leaf area index (LAI) were the two parameters that wererandomly generated in each case since EWT is sensitive tochanges in both. The input value of Cw⁎ LAI used for thesimulations in the forward modeling scheme was considered the
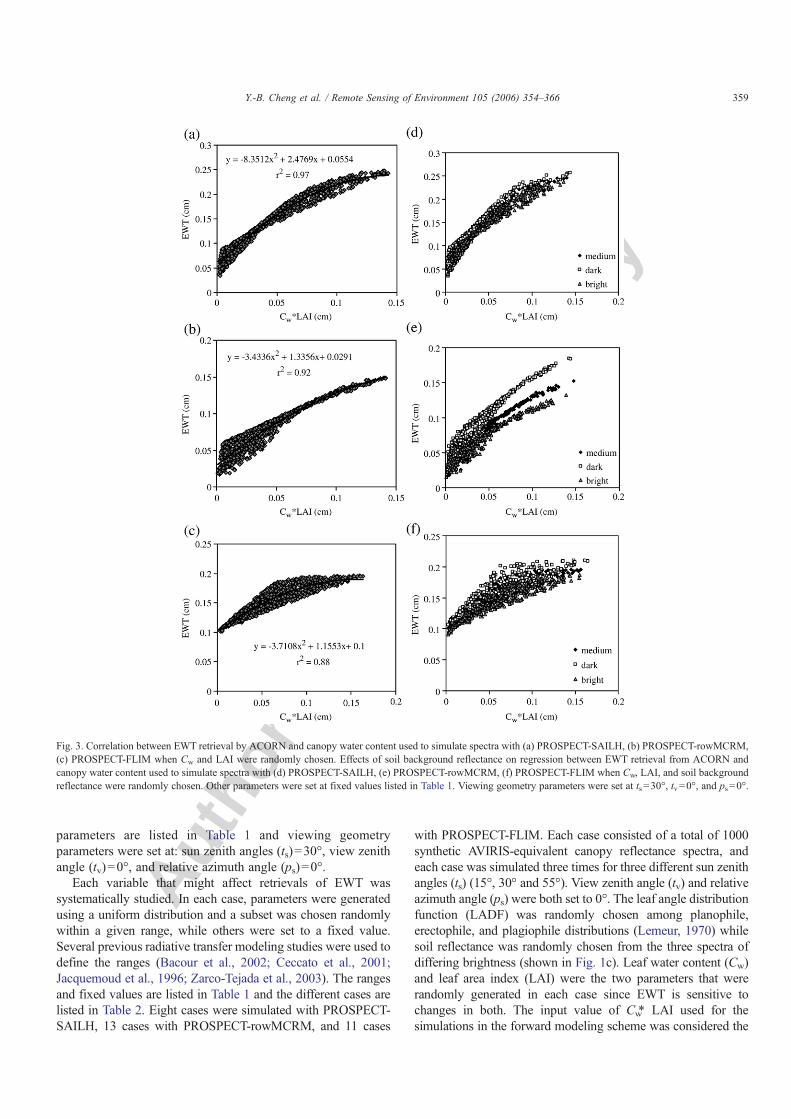
Fig. 3. Correlation between EWT retrieval by ACORN and canopy water content used to simulate spectra with (a) PROSPECT-SAILH, (b) PROSPECT-rowMCRM,(c) PROSPECT-FLIM when Cw and LAI were randomly chosen. Effects of soil background reflectance on regression between EWT retrieval from ACORN andcanopy water content used to simulate spectra with (d) PROSPECT-SAILH, (e) PROSPECT-rowMCRM, (f) PROSPECT-FLIM when Cw, LAI, and soil backgroundreflectance were randomly chosen. Other parameters were set at fixed values listed in Table 1. Viewing geometry parameters were set at ts=30°, tv=0°, and ps=0°.
359Y.-B. Cheng et al. / Remote Sensing of Environment 105 (2006) 354–366
Autho
r's
pers
onal
co
py
“true” canopy water content and used to validate retrievals ofEWT using the AVIRIS-equivalent spectra. All random AVIRIS-equivalent synthetic canopy reflectance spectra were inverted andtransformed into radiance using irradiance files generated fromACORN at the three sun zenith angles and a visibility of 23 km.
3.2. Equivalent water thickness retrieval with ACORN
Retrievals of EWT used the ACORN fitting algorithm whichintegrates techniques developed by Green et al. (1991, 1993) andRoberts et al. (1997). The technique was originally developed to
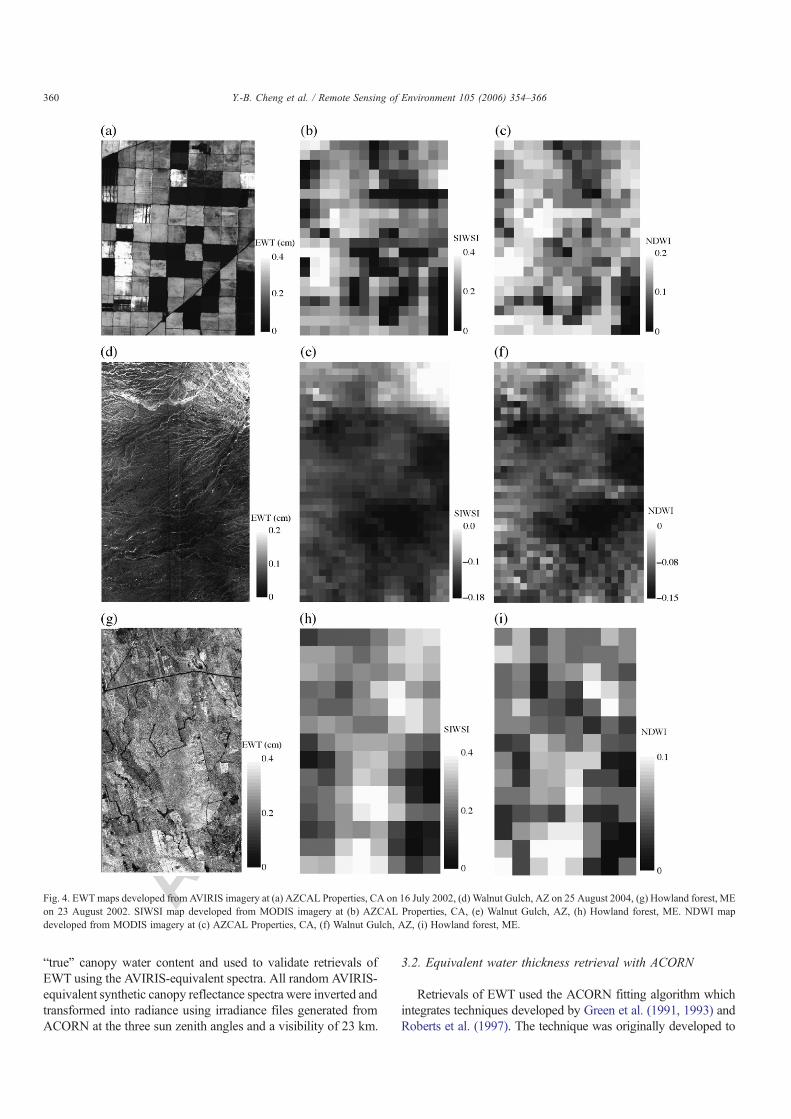
Fig. 4. EWTmaps developed from AVIRIS imagery at (a) AZCAL Properties, CA on 16 July 2002, (d) Walnut Gulch, AZ on 25 August 2004, (g) Howland forest, MEon 23 August 2002. SIWSI map developed from MODIS imagery at (b) AZCAL Properties, CA, (e) Walnut Gulch, AZ, (h) Howland forest, ME. NDWI mapdeveloped from MODIS imagery at (c) AZCAL Properties, CA, (f) Walnut Gulch, AZ, (i) Howland forest, ME.
360 Y.-B. Cheng et al. / Remote Sensing of Environment 105 (2006) 354–366

Autho
r's
pers
onal
co
py
improvewater vapor retrieval fromAVIRIS data by fittingAVIRISmeasured radiance centered at 940 nm to a radiance spectrum ofwater vapor absorption generated byACORN. Because of a 40 nmspectral difference between the center wavelength of liquid waterabsorption and water vapor absorption, liquid water can besimultaneously retrieved with water vapor by fitting the measuredpixel reflectance to the equivalent transmittance spectrum for a slabof water based on the Beer-Lambert Law (Green et al., 1993;Roberts et al., 1998, 1997). Although this technique was originallydesigned to improve water vapor compensation for calibratingAVIRIS data to apparent surface reflectance, studies have shownthe potential to retrieve this physically based liquid water featureand use it to monitor vegetation water content (Champagne et al.,2003; Cheng et al., submitted for publication-a; Roberts et al.,1997; Serrano et al., 2000; Ustin et al., 1998). Cheng et al.(submitted for publication-b) showed that EWT from AVIRIS waslinearly related to spectral water indexes. Retrievals of EWTweremade from all synthetic AVIRIS-equivalent radiances usingACORN and the retrieved EWTwas later compared with canopywater content used as input for the simulations under the differentcanopy scene assumptions and variation of leaf and canopyparameters. The schematic view of the simulation study to retrieveEWT from simulated spectra is shown in Fig. 2.
3.3. Validation of retrievals from AVIRIS and MODIS imagery
The AVIRIS instrument is an airborne high-spatial resolutionhyperspectral scanner, having 224 contiguous bands in 400–2500 nm with approximately 10 nm bandwidth. AVIRIS spatialresolution varies from 4m to 20m depending on flight altitude. Anatmospheric correction to convert the data from radiance toapparent surface reflectance was performed using ACORN. EWTwas retrieved from AVIRIS data using ACORN Mode 1.5:Advanced atmospheric correction of hyperspectral data withspectral fitting forwater vapor and vegetation liquidwater. AVIRISoverflights at AZCAL Properties (16 July 2002), Walnut GulchExperimental Watershed (25 August 2004), and the HowlandForest (23 August 2002) were used to retrieve EWT, which wassubsequently used as a reference for canopy water content. Aftercomparison to the simulation study, AVIRIS EWT was used toexamine canopywater content retrievals fromMODIS products bycalculating the mean EWT from AVIRIS data for the area of eachMODIS pixel.
The MODIS reflectance product (MOD09A1) is an 8-daycomposite dataset consisting of seven bands between 400 nmand 2500 nm and six additional bands indicating viewinggeometry, state information, and atmospheric conditions. Band1 (645 nm), Band 2 (858.8 nm), and Band 3 (469 nm) were usedto derive the greenness indexes NDVI following Eq. (2) (Rouseet al., 1974) and EVI with Eq. (3) (Huete et al., 2002),respectively. Band 2 (858.5 nm), Band 5 (1240 nm), and Band 6(1640 nm) were used to calculate the water indexes NDWI andSIWSI following Eq. (4) (Gao, 1996; Zarco-Tejada et al., 2003)and Eq. (5) (Fensholt and Sandholt, 2003), respectively.
NDVI ¼ Band2−Band1Band2þ Band1
¼ R858:5−R645
R858:5 þ R645ð2Þ
EVI ¼ 2:5� Band2−Band1Band2þ 6� Band1−7:5� Band3þ 1
¼ 2:5� R858:5−R645
R858:5 þ 6� R645−7:5� R469 þ 1ð3Þ
NDWI ¼ Band2−Band5Band2þ Band5
¼ R858:5−R1240
R858:5 þ R1240ð4Þ
SIWSI ¼ Band2−Band6Band2þ Band6
¼ R858:5−R1640
R858:5 þ R1640ð5Þ
MODIS data were cross-calibrated to AVIRIS data to alignthe radiometric measurements (accounting for view geometrydifferences due to swath position and the 8-day compositing).AVIRIS was spatially and spectrally degraded to match MODISresolutions and bright pixels (e.g. vegetation, like cotton fieldsin the near-infrared region) and dark pixels (e.g. harvested areasand bare soil) were chosen from each image to develop anempirical cross-calibration regression for each spectral band.AVIRIS pixels within the corresponding MODIS pixel wereextracted as mean reflectance for MODIS Band 1, Band 2, Band3, Band 5 and Band 6 over the full extent of the AVIRISoverflights.
3.4. Statistical analysis
For each of the four MODIS indexes, consistency ofregressions with AVIRIS EWT at different sites was examinedby testing parallelism between two straight regression lines. Thetest for parallelism (Kleinbaum et al., 1988) was performed ontwo regression lines of AVIRIS and one MODIS index atdifferent study sites. This involved a null hypothesis of nodifference between the two slopes from two regression lines ofAVIRIS EWT and one MODIS index at two different sites, andα value was set as 0.05 in this study. The test statistic wascomputed as the difference between the two slopes divided bythe standard error of the difference between the slopes.
4. Results
4.1. Retrieval of EWT from synthetic spectra
Retrievals of EWT from ACORN were conducted usingrandomly chosen synthetic canopy reflectance spectra from eachof the three models. These EWT retrievals were compared to theproduct of Cw and LAI used as inputs and the resultingdetermination coefficients are provided in Table 2. Resultsshow that retrievals of EWT from ACORN-simulated spectraproduced good relationships to actual canopy water contentderived from input data used to generate the synthetic canopyreflectance spectra for the linked leaf-canopy models (r2=0.86–0.97).Modeled EWT, with the exception of the canopy propertiesfor rowMCRM, have r2=0.60 or better.
The regression results when Cw and LAI only were randomlygenerated are shown in Fig. 3a,b,c. The determinationcoefficient between retrieved EWT and canopy water decreasesas more parameters are included in the model (Table 2). At the
361Y.-B. Cheng et al. / Remote Sensing of Environment 105 (2006) 354–366

Autho
r's
pers
onal
co
py
leaf level, all three linked leaf-canopy models show thatchanges in dry matter content (Cm) decreased values of r
2 morethan the internal structure parameter (N). This result indicatesthat changes in dry matter should produce more errors inretrievals of EWT than the number of layers a leaf is composedof. At the canopy level, the contribution of background soilreflectance was observed in all three models. However, it wasmore significant in open canopies with direct backgroundcontributions than in closed-canopy uniform vegetation, asexpected. The three different soil backgrounds used in thesynthetic canopy reflectance spectra are distinguishable inregressions between retrieved EWT and input canopy watercontent (Fig. 3d–f). With the same input canopy water content,the synthetic canopy reflectances simulated with dark soilsretrieved highest EWT, which is lower in medium and brightsoils (Fig. 3d–f). This discrimination is most apparent in casessimulated from the PROSPECT-rowMCRM model (Fig. 3e)than from the other two models. The three sun zenith angles(15°, 30°, and 55°) used in this study show that in most casesthere was little influence on the correlation coefficients for EWT(Table 2). Overall, these results indicate the importance of thecanopy structure and background component influences onestimates of EWT from the widely accepted MODTRAN-basedcurve-fitting method in ACORN.
4.2. Comparison of AVIRIS and MODIS data for water contentestimation
Given the acceptably high r2 (mean=0.79; n=96) consideringall simulations between modeled water content and retrievals ofEWTusingACORN,we investigated the retrieval of canopywatercontent fromMODIS by comparing EWT retrieved from AVIRISto four vegetation/water indexes derived fromMODIS reflectancedata at the three study sites. TheACORN-derived EWTdevelopedfrom AVIRIS imagery at the three study sites at the original
AVIRIS spatial scale are shown in Fig. 4a (AZCAL Properties), d(Walnut Gulch), and g (Howland Forest). OneMODIS image wascoincident with each AVIRIS overflight. The correspondingSIWSI and NDWI were derived from MODIS MOD09A1reflectance, shown in Fig. 4b,e,h and c,f,i, respectively.
Before comparing the AVIRIS EWT to the MODIS indexes,the AVIRIS and MODIS indexes were cross-calibrated. The fourindexes (NDVI, EVI, NDWI, and SIWSI) were calculated toassess data agreement. MODIS band-passes and spatial resolu-tions were computed in AVIRIS data. Fig. 5 shows the fourindexes derived from AVIRIS and MODIS data at AZCALProperties on 16 July 2002. The regression between AVIRISNDWI and MODIS NDWI was close to the one-to-one relation-ship. This agreement between AVIRIS and MODIS indexes waspreviously shown at an old-growth conifer forest in southwesternWashington (Cheng et al., submitted for publication-b). Based onthis agreement, comparisons between ACORN-derived EWTfrom AVIRIS data and indexes derived fromMODISMOD09A1reflectance bands were then conducted.
4.3. Comparisons between AVIRIS EWT and MODIS indexes
The four NDVI, EVI, NDWI, and SIWSI indexes calculatedfrom MODIS MOD09A1 reflectance consistently had linearrelationships to ACORN-derived EWT from AVIRIS at all threestudy sites. The sites varied about one order of magnitude inEWT although the mean EWT was markedly different, withWalnut Gulch having an order of magnitude lower EWT thanAZCAL or Howland. Likewise the magnitude and ranges of thefour indexes varied widely between the three sites. In general,the range of values for a particular index within each site wasnot large. The regressions between AVIRIS EWT and theMODIS indexes are shown in Fig. 6 and Table 3.
At AZCAL Properties, all four indexes showed similarcorrelations to retrievals of EWT. MODIS EVI had the best r2 at0.64 while MODIS NDVI was slightly lower at r2 =0.50 (Fig.6, Table 3), as expected. The water indexes were intermediatebetween the chlorophyll indexes, with NDWI r2 =0.54 and
Fig. 5. Comparison of four indexes derived from MODIS reflectance productand cross-calibrated AVIRIS data at AZCAL Properties, CA on 16 July 2002.
Fig. 6. Regression between four indexes derived from MODIS data and EWTretrieved from AVIRIS imagery at AZCAL Properties, CA on 16 July 2002,Walnut Gulch, AZ on 25 August 2004, Howland forest, ME on 23 August 2002.
362 Y.-B. Cheng et al. / Remote Sensing of Environment 105 (2006) 354–366

Autho
r's
pers
onal
co
py
SIWSI r2 =0.57. These data (day 197) were acquired 2–3 weeks after canopy closure (LAI∼2–2.5) at a time when thecanopy is fully green and growing exponentially.
In the Walnut Gulch region, all four MODIS indexes yieldedgood correlations (the highest correlations among the three sites)with ACORN-derived EWT from AVIRIS imagery. MODISNDVI obtained the best r2 at 0.89 to retrievals of EWT followedby EVI with r2=0.82 and SIWSI at r2=0.81, while NDWI hadthe lowest correlation with r2=0.62 (Fig. 6b; Table 3). The datafrom this site was acquired about 2 weeks after the start of thesummermonsoon in 2004. One explanation for the larger range inNDVI at this site and the higher correlations to all indexes despitethe low EWT is due to the rapid response of the grasslands to thesummer precipitation while the creosote bush community wasmostly dormant and showed little response to summer rain. LAIsfor these discontinuous canopy vegetation types range from 0.16to 0.3 (Cheng et al., submitted for publication-a).
At Howland forest, the two water indexes derived fromMODIS data had better correlations to EWT (r2 =0.66 forSIWSI and 0.59 for NDWI). Here, the two MODIS vegetationindexes performed less well, NDVI had the lowest correlation toEWT with r2 of 0.49, and EVI having a slightly bettercorrelation (r2 =0.55) than NDVI. LAI at this Ameriflux site isreported an average of 5.5 (Hollinger et al., 1999), putting it inthe range where NDVI is typically saturated (Holben et al.,1980; Sellers, 1985), possibly explaining the lower correlationfor the vegetation indexes. Other dense conifer forests have alsoshown that water indexes provide better estimates of LAI thanNDVI (Roberts et al., 2004).
Statistical analysis showed that for each MODIS index, itsregression lines with ACORN-derived EWT from AVIRIS werenot consistently parallel among the sites. For NDVI and SIWSI,slopes of regression lines with EWTwere significantly different atthe forest site, Howland. For EVI and NDWI, slopes of regressionlines were significant at the agricultural site, AZCAL Properties.
5. Discussion
Three linked leaf-canopy radiative transfer models havingdifferent vegetation canopy closure scenarios were used togenerate AVIRIS-equivalent spectra. Possible model errors anduncertainties in estimates of water content due to covarying leafbiochemical and canopy biophysical properties were tested asshown in Table 2.At the leaf level, variation in drymatter producesthe largest error in water content. At the canopy level varying soil
brightness had a large effect on the PROSPECT-rowMCRMmodel. All models show decreasing accuracy as the number ofindependent parameters that are allowed to vary increases. Thevariation in retrieval accuracy of ACORN-derived EWT is shownby the coefficients of determination in Table 2, which varied from0.36 to 0.97. When only leaf water content (Cw) and LAI wereallowed to vary, good correlation (r2=0.86–0.97) was achievedbetween simulated EWT from ACORN and input canopy watercontent. This demonstrates that ACORN-derived EWT is sensitiveto changes in canopy water content and can be used to estimatecanopy water content in the three simulated vegetation scenarioswhen each canopy type is analyzed separately. This is illustrated inFig. 3 which shows that retrievals of EWT are significantlyinfluenced by vegetation canopy architecture causing an over orunder estimation of canopy water content.
Nevertheless, different assumptions and algorithms used inthese three canopy reflectancemodels could contribute to the offsetand different scattering seen in Fig. 3. For example, dissimilaritiesin the near-infrared region of spectra generated from SAIL andMCRM were addressed by Bacour et al. (2002) who attributedmodel differences to how multiple scattering is accounted for.Furthermore, since leaf water content (Cw) and LAI were set tovary independently, low canopy water content could have resultedfrom either low Cw or low LAI. Thus, the offset seen in Fig. 3could also have resulted from this and other fixed parameters likedry matter content and soil background reflectance when canopywater content was low.
Our objectives were to investigate the uncertainties inretrievals of EWT, and therefore, changes in correlation withwater content used for the simulations due to other variables areemphasized. At the leaf level, as described in the previoussection, changes in dry matter content produce more errors inEWT than other leaf biochemical properties. Studies havereported extensive influences caused by both dry matter content(Cm) and leaf internal structure parameter (N) on reflectance inthe near- and mid-infrared region simulated by PROSPECT(Bacour et al., 2002; Ceccato et al., 2001). In this study, Fig. 1a,bdemonstrate more significant changes in leaf reflectance areintroduced by changes of Cm than by N. Nonetheless, dry mattercontent is usually species-dependent (Riaño et al., 2005; Shipley& Vu, 2001) and might not change as much as in the simulationif only one species type was involved. Therefore, errorscontributed by dry matter to EWT could be reduced. At thecanopy level, large effects contributed by the soil backgroundwere significant although their influence could be determined byestimating the proportions of bare soil and soil backgroundreflectance.
Parameters driving the background proportions of bare soil(e.g. soil strip length in rowMCRM and tree crown diameter inFLIM) affected the retrieval of EWT from ACORN (Table 2).SAILH assumed an idealized canopy layer morphology with ahomogenous distribution of horizontal leaves. Therefore, SAILHis more suitable to simulate closed canopy vegetation (e.g. thecotton canopy). Furthermore, because it does not have an explicitparameter for variable soil background, it is less suited fordiscontinuous canopy conditions such as at theWalnut Gulch site.The proportion of soil background is implicitly accounted for in
Table 3Statistics of regressions between AVIRIS EWTandMODIS indexes presented inFig. 6
MODISindexes(y)
AVIRIS EWT (cm) (x)
Walnut Gulch AZCAL Properties Howland Forest
a b r2 a b r2 a b r2
NDVI 1.887 0.1528 0.89 1.7065 0.3348 0.50 0.4569 0.7182 0.49EVI 0.8126 0.1146 0.82 2.4188 0.0624 0.64 0.4576 0.405 0.55NDWI 0.3903 0.129 0.62 0.7014 0.0701 0.54 0.4067 0.0821 0.59SIWSI 1.1655 0.1807 0.81 1.415 0.0173 0.57 0.8491 0.11 0.66Regression line: y=ax+b
363Y.-B. Cheng et al. / Remote Sensing of Environment 105 (2006) 354–366

Autho
r's
pers
onal
co
py
SAILH with LAI and LADF parameters, unlike rowMCRM andFLIM. The effect of soil background reflectance for this model isobserved in the case where soil background reflectance wasrandomly chosen and vegetation had low LAI (Fig. 3d).
As we mentioned in the previous section, effects contributedby the soil background reflectance were model-dependent (Fig.3d–f) and as a function of the amount of each scene component,shadow, background, and pure vegetation, on the simulatedarchitecture reflectance. These differences resulted from differ-ences in the algorithms and assumptions of the three canopyreflectance models. The rowMCRM canopy reflectance modelwas designed to simulate row-structured canopies (homogenousdiscontinuously covered canopy). Additionally, based on therandom input parameters (crown width and soil strip length), theFractional Vegetation Cover (FVC) of our PROSPECT-rowMCRM simulation averaged 0.48. Therefore, soil back-ground effects on canopy reflectance are more significant than inthe SAILH and FLIM canopy models. As a result, the regressionbetween EWT from ACORN and canopy water content used asinput for simulations was largely dependent on soil reflectance(Fig. 3e). In contrast, SAILH and FLIMwere designed to simulatevegetation cover scenarios with smaller proportions of bare soil(closed canopy crops and forest), and therefore, soil backgroundreflectance had less effect on these simulations (Fig. 3d,f).Besides, average FVC for PROSEPCT-FLIM simulation was0.70 based on input parameters (crown width and tree density).Results are therefore consistent, showing larger backgroundeffects on the row-structured simulated architecture than in theclosed canopies, where soil reflectance plays a minor role.
In the case studies, we extend this understanding of the factorsintroducing errors into estimates of EWT to evaluate the accuracyof retrievals of canopy water content from MODIS reflectanceproducts using ACORN-derived EWT from AVIRIS imagery. Atthe AZCAL Properties site, the cotton fields were uniformlyclosed canopy, mostly green, and with little bare soil and dry plantlitter at the growth stage when the AVIRIS image was acquired(16 July 2002). The cotton canopy structure was very similar tothe scenario (Table 2) using PROSPECT-SAILH, in whichACORN-derivedEWThad the best agreementwith actual canopywater content compared to the other two scenarios (Table 2).Therefore, ACORN-derived EWT from AVIRIS imagery shouldprovide the most accurate estimates of canopywater content at theAZCAL site. The two MODIS moisture indexes (NDWI andSIWSI) had similar correlations (r2=0.54 and 0.57) with canopyEWT from AVIRIS imagery. Moreover, the slope of theregression line between EWT and NDWI at the AZCAL sitewas significantly different from the other two sites. This mightsuggest a potential usage of NDWI to differentiate agriculturalsites. Chlorophyll-based MODIS indexes, NDVI and EVI, alsoshowed similarly good correlations with EWT (r2=0.64 and0.50). Ustin et al. (2004a) also found NDVI and NDWI had highcorrelation to measured water content at this site in July 2002,where they estimated water content from AVIRIS by continuumremoval at 980 nm (980 CR). While the spectral absorptance ofchlorophyll is insensitive to variation in water content, in cottoncanopies both water and chlorophyll are co-located in leaves andthere is little non-green canopy at this stage in the growing season.
Thus LAI is highly correlated with these indexes. The two watermeasurement indexes, 980 CR and NDWI, are also highlycorrelated, as expected. Our results are comparable and suggestthat retrievals from MODIS products can be used to estimatecanopy water content under different canopy types.
In the semi-arid savanna-shrubland at the Walnut Gulch site,MODIS indexes had the best correlation with retrievals of EWTfrom AVIRIS imagery at the three sites. In contrast to the othersites, vegetation cover is sparse with variable and significantbare soil background and abundant dead plant material.Therefore, within one MODIS pixel (500 m by 500 m), thereflectance is a mixture of green, senescent and dead vegetation,and bare soil. The growth form (grass, shrub) is also expected tovary within MODIS pixels. However, retrievals from MODISprovided good agreement with retrievals from fine spatialresolution AVIRIS data (20 m by 20 m). Because of this mixing,one should assume that EWT from AVIRIS at this site areadversely affected by the variable and abundant soil backgroundreflectance and the varying dry plant matter in the data.
At Howland forest, a conifer and mixed forest, the twoMODIS water indexes (NDWI and SIWSI) produced the bestcorrelations with EWT from AVIRIS compared to the twovegetation indexes (NDVI and EVI). Cheng et al. (submitted forpublication-b) showed similar results for a Douglas fir/westernhemlock-dominated conifer forest in southwestern Washington,where MODIS water indexes (NDWI and SIWSI) had bettercorrelations to EWT than MODIS NDVI. NDVI and EVI do notdirectly measure water absorptance and become saturated athigh leaf biomass typical of dense conifer forests. Roberts et al.(2004) found that NDVI in the Wind River forest insouthwestern Washington became insensitive to spatial varia-tion of Leaf Area Index and EWT was better correlated withLAI. Moreover, this might also explain the significantlydifferent slope of the regression line (relatively shallow)between EWT and NDVI at the Howland site. EVI showedhigher correlation (r2 =0.55) with EWT than NDVI, whichmight have resulted from its continuing sensitivity to canopystructure at higher LAI (Huete et al., 2002) rather than pigmentcontent.
6. Conclusions
In this study, we investigated a physically-based water indexretrieved from hyperspectral AVIRIS images using syntheticspectra from three canopy reflectance models coupled to thePROSPECT leaf radiative transfer model. EWT from simulatedAVIRIS data showed good agreement to the input canopy watercontent from the models. The modeling component of this studyshowed that while EWT can be used to estimate canopy watercontent, the presence of leaf dry matter, variation in soilbackground reflectance, and canopy architecture will contributeerrors in EWT retrieval. Four different vegetation/water indexeswere derived from MODIS reflectance data and were comparedto ACORN-derived EWT from AVIRIS overflights as refer-ences at three sites with different vegetation cover. The linearrelationship between AVIRIS indexes and MODIS indexesillustrates the general agreement between MODIS and
364 Y.-B. Cheng et al. / Remote Sensing of Environment 105 (2006) 354–366

Autho
r's
pers
onal
co
py
hyperspectral canopy water content retrievals. Indexes derivedfrom MODIS data produced linear correlations with EWT at allthree sites (r2 from 0.49 to 0.89).
At the agricultural site the coefficient of determination forwater indexes were in between the correlation to pigment indexes,while at the semi-arid shrub–grassland, the two pigment indexeswere highest and the water indexes were lowest, although therewas no significant difference between EVI and SIWSI. NDWIhad the poorest regression coefficient at this semi-arid site withEWT. At the forested site, the two water indexes had higher r2
than the two pigment indexes, with NDVI having the lowestcorrelation compared to the other three indexes. The two MODISwater indexes, NDWI and SIWSI, maintained good correlationswith EWT fromAVIRIS, and appear to provide better estimates ofcanopy water content in dense forests.
Differences in ranges, slopes, and r2 among regressions ofthe four MODIS indexes at the three sites show that they eachmeasure some independent information about the canopy.Results from the hyperspectral AVIRIS and multispectralMODIS imagery, which are consistent with the simulationstudy, demonstrate the importance of canopy architecture inquantitative estimates of vegetation EWT. All methods showlarge errors when EWT estimates are made across vegetationtypes with markedly different canopy characteristics. Weconclude that quantitative estimates of EWT must be modeledseparately with appropriate canopy structures to account fordifferent canopy architectures.
Acknowledgements
Portions of this study were supported by National Aeronauticsand Space Administration (NASA) under Grant No. NNG04GQ42G “Global Estimation of Canopy Water Content” andContract No. NAG5-9360 “New EOS Data Products to ImproveBiogeochemical Estimates” and support from the Cotton Foun-dation, #5002-008-00, “Evaluation of Advanced HyperspectralRemote Sensing for Detection of Cotton Water Stress and Irri-gation Refinement”. Financial support was provided to P.J Zarco-Tejada under the “Ramón y Cajal” and “Averroes” Programs fromSpain are acknowledged. Financial support to D. Riaño under the“Ramón yCajal” Program ofMinistry of Science and TechnologyfromSpain is acknowledged. The authors gratefully acknowledgeS. Jacquemond, W. Verhoef, A. Kuusk, and J. Praks for sharingcomputer code for leaf and canopy reflectance models. GeorgeScheer (University of California, Davis) and Lawrence Ross(University of California, Davis) are gratefully acknowledged forIT support in this study.
References
Abrahams, A. D., Parsons, A. J., & Wainwright, J. (1995). Effects of vegetationchange on interrill runoff and erosion, Walnut Gulch, southern Arizona.Geomorphology, 13, 37−48.
Bacour, C., Jacquemoud, S., Tourbier, Y., Dechmbre, M., & Frangi, J. -P. (2002).Design and analysis of numerical experiments to compare four canopyreflectance models. Remote Sensing of Environment, 79(1), 72−83.
Carter, G. A. (1994). Ratios of leaf reflectances in narrow wavebands as indicatorsof plant stress. International Journal of Remote Sensing, 15, 697−704.
Ceccato, P., Flasse, S., Tarantola, S., Jacquemond, S., & Grégoire, J. -M. (2001).Detecting vegetation leaf water content using reflectance in the opticaldomain. Remote Sensing of Environment, 77, 22−33.
Champagne, C.M., Staenz, K., Bannari, A., McNairn, H., & Deguise, J-C. (2003).Validation of a hyperspectral curve-fitting model for the estimation of plantwater content of agricultural canopies. Remote Sensing of Environment, 87,148−160.
Cheng, Y.-B., Ustin, S. L., Riaño, D., & Vanderbilt, V. C. (submitted forpublication-a). Water content estimation from hyperspectral images andMODIS indexes in southeastern Arizona. Submitted to Remote Sensing ofEnvironment.
Cheng, Y.-B., Zarco-Tejada, P. J., Ustin, S. L., Wharton, S., & Paw U, K. T.(submitted for publication-b). Relationships between MODIS water indexesand tower flux data in an old-growth conifer forest.Manuscript submitted toJournal of Geophysical Research-Atmospheres.
Chuvieco, E., Cocero, D., Riaño, D., Martin, P., Martínez-Vega, J., de la Riva, J.,et al. (2004). Combining NDVI and Surface Temperature for the estimationof live fuels moisture content in forest fire danger rating. Remote Sensing ofEnvironment, 92(3), 322−331.
Gao, B. -C. (1996). NDWI-A normalized difference water index for remotesensing of vegetation liquid water from space. Remote Sensing ofEnvironment, 58(3), 257−266.
Gao, B. -C., & Goetz, A. F. H. (1995). Retrieval of equivalent water thicknessand information related to biochemical components of vegetation canopiesfrom AVIRIS data. Remote Sensing of Environment, 52(3), 155−162.
Green, R. O., Conel, J. E., Margolis, J. S., Bruegge, C. J., & Hoover, G. L. (1991).An inversion algorithm for retrieval of atmospheric and leaf water absorptionfromAVIRIS radiance with compensation for atmospheric scatting.Proc. thirdAVIRIS workshop. JPL Publication, Vol. 91-28. Pasadena, CA: Jet PropulsionLaboratory.
Green, R. O., Conel, J. E., & Roberts, D. A. (1993). Estimation of aerosol opticaldepth and calculation of apparent surface reflectance from radiancemeasured by the airborne visible-infrared imaging spectrometer (AVIRIS)using MODTRAN2. SPIE Conference 1937: Imaging Spectrometry of theTerrestrial Environment, the International Society for Optical Engineering(SPIE), Orlando, FL., 14-15 April.
Fensholt, R., & Sandholt, I. (2003). Derivation of a shortwave infrared waterstress index from MODIS near-and shortwave infrared data in a semiaridenvironment. Remote Sensing of Environment, 87(1), 111−121.
Hardisky, M. A., Lemas, V., & Smart, R. M. (1983). The influence of soil salinity,growth form, and leafmoisture on the specral reflectance ofSpartina alternifoliacanopies. Photogrammetric Engineering and Remote Sensing, 49, 77−83.
Holben, B. N., Tucker, C. J., & Fan, C. -J. (1980). Spectral assessment ofsoybean leaf area and leaf biomass. Photogrammetric Engineering andRemote Sensing, 46, 651−656.
Hollinger, D. Y., Aber, J., Dail, B., Davidson, E. A., Goltz, S.M., Hughes, H., et al.(2004). Spatial and temporal variability in forest-atmosphere CO2 exchange.Global Change Biology, 10, 1689−1706.
Hollinger, D. Y., Goltz, S. M., Davidson, E. A., Lee, J. T., Tu, K., & Valentine,H. T. (1999). Seasonal patterns and environmental control of carbon dioxideand water vapour exchange in an ecotonal boreal forest. Global ChangeBiology, 5, 891−902.
Huete,A.R., Didan,K.,Muira, T., Rodriguez, E. P., Gao,X.,&Ferreira, L.G. (2002).Overview of the radiometric and biophysical performance of the MODISvegetation indices. Remote Sensing of Environment, 83(1-2), 195−213.
Huete, A. R., Liu, H. Q., Batchily, K., & Leeuwen, W. V. (1997). A comparisonof vegetation indices over a global set of TM images for EOS-MODIS.Remote Sensing of Environment, 59(3), 440−451.
Hymer, D. C., Moran, M. S., & Keefer, T. O. (2000). Soil water evaluation usinga hydrologic model and calibrated sensor network. Soil Science Society ofAmerica Journal, 64(1), 319−326.
Jacquemoud, S. (1993). Inversion of the PROSPECT+SAIL canopy reflectancemodel from AVIRIS equivalent spectra: Theoretical study. Remote Sensingof Environment, 44, 281−292.
Jacquemoud, S., & Baret, F. (1990). PROSPECT, a model of leaf opticalproperties spectra. Remote Sensing of Environment, 34(2), 75−91.
Jacquemoud, S., Baret, F., Andrieu, B., Danson, F. M., & Jaggard, K. (1995).Extraction of vegetation biophysical parameters by inversion of the
365Y.-B. Cheng et al. / Remote Sensing of Environment 105 (2006) 354–366

Autho
r's
pers
onal
co
py
PROSPECT+SAIL models on sugar beet canopy reflectance data.Application to TM and AVIRIS sensors. Remote Sensing of Environment,52(3), 163−172.
Jacquemoud, S., Ustin, S. L., Verdebout, J., Schmuck, G., Andreoli, G., &Hosgood, B. (1996). Estimating leaf biochemistry using the PROSPECT leafoptical properties model. Remote Sensing of Environment, 56(3), 194−202.
Kleinbaum, D. G., Kupper, L. L., & Muller, K. E. (1988). Comparing TwoStraight-line Regression Models. Applied regression analysis and othermultivariable methods (pp. 95−102). Boston: PWS-Kent 718pp.
Kuusk, A. (1985a). The hot spot effect of a uniform vegetation cover. SovietJournal of Remote Sensing, 3(4), 645−658.
Kuusk, A. (1995b). A fast, invertible canopy reflectance model. Remote Sensingof Environment, 51(3), 324−350.
Kuusk, A. (1995b). A Markov chain model of canopy reflectance. Agriculturaland Forest Meteorology, 76, 221−236.
Kuusk, A. (2001). A two-layer canopy reflectance model. Journal ofQuantitative Spectroscopy & Radiative Transfer, 71, 1−9.
Lemeur, R. (1970). Effects of spatial leaf distribution on penetration andinterception of direct radiation.Plant response to climatic factors, Proceedingsof the Uppsala Symposium (Ecology and Conservation) (pp. 349−356). Paris:UNESCO.
Lillesaeter, O. (1982). Spectral reflectance of partly transmitting leaves-Laboratory measurements and mathematical-modeling. Remote Sensing ofEnvironment, 12, 247−254.
Miller, J. R., Hare, E. W., & Wu, J. (1990). Quantitative characterization of thevegetation red edge reflectance: An inverted-Gaussian model. InternationalJournal of Remote Sensing, 11, 1755−1773.
Peñuelas, J., Filella, I., Biel, C., Serrano, L., & Savé, R. (1993). The reflectanceat the 950–970 nm region as an indicator of plant water status. InternationalJournal of Remote Sensing, 14, 1887−1905.
Peñuelas, J., Piñol, J., Ogaya, R., & Filella, I. (1997). Estimation of plant waterconcentration by the reflectance Water Index WI (R900/R970). Interna-tional Journal of Remote Sensing, 18, 2869−2875.
Riaño, D., Vaughan, P., Zarco-Tejada, E., & Ustin, P. J. (2005). Estimation offuel moisture content by inversion of radiative transfer models to simulateequivalent water thickness and dry matter content. Analysis at leaf andcanopy level. IEEE Transactions on Geoscience and Remote Sensing, 43,819−826.
Roberts, D. A., Gardner, M., Church, R., Ustin, S. L., Scheer, G., & Green, R. O.(1998). Mapping chaparral in the Santa Monica Mountains using multipleendmember spectral mixture models. Remote Sensing of Environment, 65(3), 267−279.
Roberts, D. A., Green, R. O., & Adams, J. B. (1997). Temporal and spatialpatterns in vegetation and atmospheric properties from AVIRIS. RemoteSensing of Environment, 62(3), 223−240.
Roberts, D. A., Ustin, S. L., Ogunjemiyo, S., Greenberg, J., Dobrowski, S. Z.,Chen, J., et al. (2004). Spectral and structural measures of northwest forestvegetation at leaf to landscape scale. Ecosystems, 7(5), 545−562.
Rosema, A., Verhoef, W., Noorbergen, H., & Borgesius, J. J. (1992). A newforest light interaction model in support of forest modeling. Remote Sensingof Environment, 42, 23−41.
Rouse, J. W., Hass, R. H., Schell, J. A., & Deering, D. W. (1974). Monitoringvegetation systems in the Great Plains with ERTS. Proceedings, thirdEarth Resources Technology Satellite-1 Symposium, Greenbelt, NASA SP-351 (pp. 309–317).
Sellers, P. J. (1985). Canopy reflectance, photosynthesis and transpiration. In-ternational Journal of Remote Sensing, 6(8), 1335−1372.
Serrano, L., Ustin, S. L., Roberts, D. A., Gamon, J. A., & Peñuelas, J. (2000).Deriving water content of chaparral vegetation from AVIRIS data. RemoteSensing of Environment, 74(3), 570−581.
Shipley, B., & Vu, T. T. (2001). Dry matter content as a measure of dry matterconcentration in plants and their parts. New Phytologist, 153(2), 359−364.
Tucker, C. J. (1980). Remote sensing of leaf water content in the near infrared.Remote Sensing of Environment, 10, 23−32.
Ustin, S. L., Darling, D., Kefauver, S., Greenberg, J., Cheng, Y. -B., & Whiting,M. L. (2004a). Remotely sensed estimates of crop water demand. S.P.I.E. theinternational symposium on optical science and technology. 49th annualmeeting, Denver, CO, 2–6 August.
Ustin, S. L., Jacquemoud, S., Zarco-Tejada, P. J., and Asner, G. (2004b). RemoteSensing of Environmental Processes, State of the Science and NewDirections. in Manual of Remote Sensing Vol. 4. Remote Sensing for NaturalResource Management and Environmental Monitoring.ASPRS. John Wileyand Sons, New York 768p. +cd. (S.L. Ustin, vol. Ed.). ASPRS. John Wileyand Sons, New York, pages 679-730.
Ustin, S. L., Roberts, D. A., Jacquemoud, S., Pinzón, J., Gardner, M., Scheer, G.,et al. (1998). Estimating canopy water content of chaparral shrubs usingoptical methods. Remote Sensing of Environment, 65(3), 280−291.
Verhoef, W. (1984). Light scattering by leaf layers with application to canopyreflectance modeling: the SAIL model. Remote Sensing of Environment, 16,125−141.
Xiao, X., Boles, S., Liu, J., Zhuang, D., Frolking, S., Li, C., et al. (2005).Mapping paddy rice agriculture in southern China using multi-temporalMODIS images. Remote Sensing of Environment, 95(4), 480−492.
Zarco-Tejada, P. J., Miller, J. R., Morales, A., Berjón, A., & Agûera, J. (2004).Hyperspectral indices and model simulation for chlorophyll estimation inopen-canopy tree crops. Remote Sensing of Environment, 90(4), 463−476.
Zarco-Tejada, P. J., Miller, J. R., Noland, T. L., Mohammed, G. H., & Sampson,P. H. (2001). Scaling-up and model inversion methods with narrow-bandoptical indices for chlorophyll content estimation in closed forest canopieswith hyperspectral data. IEEE Transactions on Geoscience and RemoteSensing, 39(7), 1491−1507.
Zarco-Tejada, P. J., Rueda, C. A., & Ustin, S. L. (2003). Water contentestimation in vegetation with MODIS reflectance data and model inversionmethods. Remote Sensing of Environment, 85(1), 109−124.
Zarco-Tejada, P. J., & Ustin, S. L. (2001). Modeling Canopy Water Content forCarbon Estimates from MODIS data at Land EOS Validation Sites. IGARRSMeeting, Sydney, Australia, July.
366 Y.-B. Cheng et al. / Remote Sensing of Environment 105 (2006) 354–366