Estimating the prevalence of deception in online review communities
10
Estimating the Prevalence of Deception in Online Review Communities Myle Ott Dept. of Computer Science Cornell University Ithaca, NY 14850 [email protected] Claire Cardie Depts. of Computer Science and Information Science Cornell University Ithaca, NY 14850 [email protected] Jeff Hancock Depts. of Communication and Information Science Cornell University Ithaca, NY 14850 [email protected] ABSTRACT Consumers’ purchase decisions are increasingly influenced by user-generated online reviews [3]. Accordingly, there has been growing concern about the potential for posting decep- tive opinion spam—fictitious reviews that have been deliber- ately written to sound authentic, to deceive the reader [15]. But while this practice has received considerable public at- tention and concern, relatively little is known about the ac- tual prevalence, or rate, of deception in online review com- munities, and less still about the factors that influence it. We propose a generative model of deception which, in con- junction with a deception classifier [15], we use to explore the prevalence of deception in six popular online review commu- nities: Expedia, Hotels.com, Orbitz, Priceline, TripAdvisor, and Yelp. We additionally propose a theoretical model of online reviews based on economic signaling theory [18], in which consumer reviews diminish the inherent information asymmetry between consumers and producers, by acting as a signal to a product’s true, unknown quality. We find that de- ceptive opinion spam is a growing problem overall, but with different growth rates across communities. These rates, we argue, are driven by the different signaling costs associated with deception for each review community, e.g., posting re- quirements. When measures are taken to increase signaling cost, e.g., filtering reviews written by first-time reviewers, deception prevalence is effectively reduced. Categories and Subject Descriptors I.2.7 [Artificial Intelligence]: Natural Language Process- ing; J.4 [Computer Applications]: Social and Behavioral Sciences—economics, psychology ; K.4.1 [Computers and Society]: Public Policy Issues—abuse and crime involving computers ; K.4.4 [Computers and Society]: Electronic Commerce General Terms Algorithms, Experimentation, Measurement, Theory Keywords Deceptive opinion spam, Deception prevalence, Gibbs sam- pling, Online reviews, Signaling theory Copyright is held by the International World Wide Web Conference Com- mittee (IW3C2). Distribution of these papers is limited to classroom use, and personal use by others. WWW 2012, April 16–20, 2012, Lyon, France. ACM 978-1-4503-1229-5/12/04. 1. INTRODUCTION Consumers rely increasingly on user-generated online re- views to make, or reverse, purchase decisions [3]. Accord- ingly, there appears to be widespread and growing concern among both businesses and the public [12, 14, 16, 19, 20, 21] regarding the potential for posting deceptive opinion spam—fictitious reviews that have been deliberately writ- ten to sound authentic, to deceive the reader [15]. Perhaps surprisingly, however, relatively little is known about the ac- tual prevalence, or rate, of deception in online review com- munities, and less still is known about the factors that can influence it. On the one hand, the relative ease of producing reviews, combined with the pressure for businesses, prod- ucts, and services to be perceived in a positive light, might lead one to expect that a preponderance of online reviews are fake. One can argue, on the other hand, that a low rate of deception is required for review sites to serve any value. 1 The focus of spam research in the context of online reviews has been primarily on detection. Jindal and Liu [8], for example, train models using features based on the review text, reviewer, and product to identify duplicate opinions. 2 Yoo and Gretzel [23] gather 40 truthful and 42 deceptive hotel reviews and, using a standard statistical test, manually compare the psychologically relevant linguistic differences between them. While useful, these approaches do not focus on the prevalence of deception in online reviews. Indeed, empirical, scholarly studies of the prevalence of deceptive opinion spam have remained elusive. One reason is the difficulty in obtaining reliable gold-standard annota- tions for reviews, i.e., trusted labels that tag each review as either truthful (real) or deceptive (fake). One option for producing gold-standard labels, for example, would be to rely on the judgements of human annotators. Recent stud- ies, however, show that deceptive opinion spam is not eas- ily identified by human readers [15]; this is especially the case when considering the overtrusting nature of most hu- man judges, a phenomenon referred to in the psychological 1 It is worth pointing out that a review site containing de- ceptive reviews might still serve value, for example, if there remains enough truthful content to produce reasonable ag- gregate comparisons between offerings. 2 Duplicate (or near-duplicate) opinions are opinions that appear more than once in the corpus with the same (or sim- ilar) text. However, simply because a review is duplicated does not make it deceptive. Furthermore, it seems unlikely that either duplication or plagiarism characterizes the ma- jority of fake reviews. Moreover, such reviews are potentially detectable via off-the-shelf plagiarism detection software.
Transcript of Estimating the prevalence of deception in online review communities
Estimating the Prevalence of Deceptionin Online Review Communities
Myle OttDept. of Computer Science
Cornell UniversityIthaca, NY 14850
Claire CardieDepts. of Computer Science
and Information ScienceCornell UniversityIthaca, NY 14850
Jeff HancockDepts. of Communication and
Information ScienceCornell UniversityIthaca, NY 14850
ABSTRACTConsumers’ purchase decisions are increasingly influencedby user-generated online reviews [3]. Accordingly, there hasbeen growing concern about the potential for posting decep-tive opinion spam—fictitious reviews that have been deliber-ately written to sound authentic, to deceive the reader [15].But while this practice has received considerable public at-tention and concern, relatively little is known about the ac-tual prevalence, or rate, of deception in online review com-munities, and less still about the factors that influence it.
We propose a generative model of deception which, in con-junction with a deception classifier [15], we use to explore theprevalence of deception in six popular online review commu-nities: Expedia, Hotels.com, Orbitz, Priceline, TripAdvisor,and Yelp. We additionally propose a theoretical model ofonline reviews based on economic signaling theory [18], inwhich consumer reviews diminish the inherent informationasymmetry between consumers and producers, by acting as asignal to a product’s true, unknown quality. We find that de-ceptive opinion spam is a growing problem overall, but withdifferent growth rates across communities. These rates, weargue, are driven by the different signaling costs associatedwith deception for each review community, e.g., posting re-quirements. When measures are taken to increase signalingcost, e.g., filtering reviews written by first-time reviewers,deception prevalence is effectively reduced.
Categories and Subject DescriptorsI.2.7 [Artificial Intelligence]: Natural Language Process-ing; J.4 [Computer Applications]: Social and BehavioralSciences—economics, psychology ; K.4.1 [Computers andSociety]: Public Policy Issues—abuse and crime involvingcomputers; K.4.4 [Computers and Society]: ElectronicCommerce
General TermsAlgorithms, Experimentation, Measurement, Theory
KeywordsDeceptive opinion spam, Deception prevalence, Gibbs sam-pling, Online reviews, Signaling theory
Copyright is held by the International World Wide Web Conference Com-mittee (IW3C2). Distribution of these papers is limited to classroom use,and personal use by others.WWW 2012, April 16–20, 2012, Lyon, France.ACM 978-1-4503-1229-5/12/04.
1. INTRODUCTIONConsumers rely increasingly on user-generated online re-
views to make, or reverse, purchase decisions [3]. Accord-ingly, there appears to be widespread and growing concernamong both businesses and the public [12, 14, 16, 19, 20,21] regarding the potential for posting deceptive opinionspam—fictitious reviews that have been deliberately writ-ten to sound authentic, to deceive the reader [15]. Perhapssurprisingly, however, relatively little is known about the ac-tual prevalence, or rate, of deception in online review com-munities, and less still is known about the factors that caninfluence it. On the one hand, the relative ease of producingreviews, combined with the pressure for businesses, prod-ucts, and services to be perceived in a positive light, mightlead one to expect that a preponderance of online reviewsare fake. One can argue, on the other hand, that a low rateof deception is required for review sites to serve any value.1
The focus of spam research in the context of online reviewshas been primarily on detection. Jindal and Liu [8], forexample, train models using features based on the reviewtext, reviewer, and product to identify duplicate opinions.2
Yoo and Gretzel [23] gather 40 truthful and 42 deceptivehotel reviews and, using a standard statistical test, manuallycompare the psychologically relevant linguistic differencesbetween them. While useful, these approaches do not focuson the prevalence of deception in online reviews.
Indeed, empirical, scholarly studies of the prevalence ofdeceptive opinion spam have remained elusive. One reasonis the difficulty in obtaining reliable gold-standard annota-tions for reviews, i.e., trusted labels that tag each reviewas either truthful (real) or deceptive (fake). One option forproducing gold-standard labels, for example, would be torely on the judgements of human annotators. Recent stud-ies, however, show that deceptive opinion spam is not eas-ily identified by human readers [15]; this is especially thecase when considering the overtrusting nature of most hu-man judges, a phenomenon referred to in the psychological
1It is worth pointing out that a review site containing de-ceptive reviews might still serve value, for example, if thereremains enough truthful content to produce reasonable ag-gregate comparisons between offerings.2Duplicate (or near-duplicate) opinions are opinions thatappear more than once in the corpus with the same (or sim-ilar) text. However, simply because a review is duplicateddoes not make it deceptive. Furthermore, it seems unlikelythat either duplication or plagiarism characterizes the ma-jority of fake reviews. Moreover, such reviews are potentiallydetectable via off-the-shelf plagiarism detection software.
deception literature as a truth bias [22]. To help illustratethe non-trivial nature of identifying deceptive content, givenbelow are two positive reviews of the Hilton Chicago Hotel,one of which is truthful, and the other of which is deceptiveopinion spam:
1. “My husband and I stayed in the Hilton Chicago andhad a very nice stay! The rooms were large and com-fortable. The view of Lake Michigan from our roomwas gorgeous. Room service was really good and quick,eating in the room looking at that view, awesome! Thepool was really nice but we didnt get a chance to use it.Great location for all of the downtown Chicago attrac-tions such as theaters and museums. Very friendly staffand knowledgable, you cant go wrong staying here.”
2. “We loved the hotel. When I see other posts aboutit being shabby I can’t for the life of me figure outwhat they are talking about. Rooms were large withTWO bathrooms, lobby was fabulous, pool was largewith two hot tubs and huge gym, staff was courteous.For us, the location was great–across the street fromGrant Park with a great view of Buckingham Fountainand close to all the museums and theatres. I’m sureothers would rather be north of the river closer to theMagnificent Mile but we enjoyed the quieter and morescenic location. Got it for $105 on Hotwire. What abargain for such a nice hotel.”
Answer: See footnote.3
The difficulty of detecting which of these reviews is fakeis consistent with recent large meta-analyses demonstratingthe inaccuracy of human judgments of deception, with accu-racy rates typically near chance [1]. In particular, humanshave a difficult time identifying deceptive messages fromcues alone, and as such, it is not surprising that research onestimating the prevalence of deception (see Section 8.2) hasgenerally relied on self-report methods, even though suchreports are difficult and expensive to obtain, especially inlarge-scale settings, e.g., the web [5]. More importantly, self-report methods, such as diaries and large-scale surveys, haveseveral methodological concerns, including social desirabilitybias and self-deception [4]. Furthermore, there are consid-erable disincentives to revealing one’s own deception in thecase of online reviews, such as being permanently bannedfrom a review portal, or harming a business’s reputation.
Recently, automated approaches (see Section 4.1) haveemerged to reliably label reviews as truthful vs. deceptive:Ott et al. [15] train an n-gram–based text classifier using acorpus of truthful and deceptive reviews—the former culledfrom online review communities and the latter generatedusing Amazon Mechanical Turk (http://www.mturk.com).Their resulting classifier is nearly 90% accurate.
In this work, we present a general framework (see Sec-tion 2) for estimating the prevalence of deception in onlinereview communities. Given a classifier that distinguishestruthful from deceptive reviews (like that described above),and inspired by studies of disease prevalence [9, 10], we pro-pose a generative model of deception (see Section 3) thatjointly models the classifier’s uncertainty as well as the ground-truth deceptiveness of each review. Inference for this model,
3The first review is deceptive opinion spam.
which we perform via Gibbs sampling, allows us to estimatethe prevalence of deception in the underlying review commu-nity, without relying on either self-reports or gold-standardannotations.
We further propose a theoretical component to the frame-work based on signaling theory from economics [18] (see Sec-tion 6) and use it to reason about the factors that influencedeception prevalence in online review communities. In ourcontext, signaling theory interprets each review as a signalto the product’s true, unknown quality; thus, the goal ofconsumer reviews is to diminish the inherent informationasymmetry between consumers and producer. Very briefly,according to a signaling theory approach, deception preva-lence should be a function of the costs and benefits thataccrue from producing a fake review. We hypothesize thatreview communities with low signaling cost, such as commu-nities that make it easy to post a review, and large benefits,such as highly trafficked sites, will exhibit more deceptiveopinion spam than those with higher signaling costs, suchas communities that establish additional requirements forposting reviews, and lower benefits, such as low site traffic.
We apply our approach to the domain of hotel reviews.In particular, we examine hotels from the Chicago area, re-stricting attention to positive reviews only, and instantiatethe framework for six online review communities (see Sec-tion 5): Expedia (http://www.expedia.com), Hotels.com(http://www.hotels.com), Orbitz (http://www.orbitz.com),Priceline (http://www.priceline.com), TripAdvisor (http://www.tripadvisor.com), and Yelp (http://www.yelp.com).
We find first that the prevalence of deception indeed variesby community. However, because it is not possible to vali-date these estimates empirically (i.e., the gold-standard rateof deception in each community is unknown), we focus ourdiscussion instead on the relative differences in the rate ofdeception between communities. Here, the results confirmour hypotheses and suggest that deception is most prevalentin communities with a low signal cost. Importantly, whenmeasures are taken to increase a community’s signal cost,we find dramatic reductions in our estimates of the rate ofdeception in that community.
2. FRAMEWORKIn this section, we propose a framework to estimate the
prevalence, or rate, of deception among reviews in six on-line review communities. Since reviews in these communi-ties do not have gold-standard annotations of deceptiveness,and neither human judgements nor self-reports of deceptionare reliable in this setting (see discussion in Section 1), ourframework instead estimates the rates of deception in thesecommunities using the output of an imperfect, automateddeception classifier. In particular, we utilize a supervisedmachine learning classifier, which has been shown recentlyby Ott et al. [15] to be nearly 90% accurate at detectingdeceptive opinion spam in a class-balanced dataset.
A similar framework has been used previously in stud-ies of disease prevalence, in which gold-standard diagnostictesting is either too expensive, or impossible to perform [9,10]. In such cases, it is therefore necessary to estimate theprevalence of disease in the population using a combinationof an imperfect diagnostic test, and estimates of the test’spositive and negative recall rates.4
4Recall rates of an imperfect diagnostic test are unlikely to

Our proposed framework is summarized here, with eachstep discussed in greater detail in the corresponding section:
1. Data (Section 5):
Assume given a set of labeled training reviews, Dtrain =
{(xi, yi)}Ntrain
i=1 , where, for each review i, yi ∈ {0, 1}gives the review’s label (0 for truthful, 1 for deceptive),
and xi ∈ R|V | gives the review’s feature vector repre-sentation, for some feature space of size |V |. Similarly,assume given a set of labeled truthful development re-
views, Ddev = {(xi, 0)}Ndev
i=1 , and a set of unlabeled test
reviews, Dtest = {xi}Ntest
i=1 .
2. Deception Classifier (Section 4.1):
Using the labeled training reviews, Dtrain, learn a su-pervised deception classifier, f : R|V | → {0, 1}.
3. Classifier Sensitivity and Specificity (Section 4.2):
By cross-validation on Dtrain, estimate the sensitivity(deceptive recall) of the deception classifier, f , as:
η = Pr(f(xi) = 1 | yi = 1). (1)
Then, use Ddev to estimate the specificity (truthfulrecall) of the deception classifier, f , as:
θ = Pr(f(xi) = 0 | yi = 0). (2)
4. Prevalence Models (Section 3):
Finally, use f , η, θ, and either the Naıve PrevalenceModel (Section 3.1), or the generative Bayesian Preva-lence Model (Section 3.2), to estimate the prevalenceof deception, denoted π, among reviews in Dtest. Note
that if we had gold-standard labels, {yi}Ntest
i=1 , the gold-standard prevalence of deception would be:
π∗ =1
N test
Ntest∑i=1
yi. (3)
3. PREVALENCE MODELSIn Section 2, we propose a framework to estimate the
prevalence of deception in a group of reviews using onlythe output of a noisy deception classifier. Central to thisframework is the Prevalence Model, which models the un-certainty of the deception classifier, and ultimately producesthe desired prevalence estimate. In this section, we proposetwo competing Prevalence Models, which can be used inter-changeably in our framework.
3.1 Naïve Prevalence ModelThe Naıve Prevalence Model (naıve) estimates the preva-
lence of deception in a corpus of reviews by correcting theoutput of a noisy deception classifier according to the clas-sifier’s known performance characteristics.
Formally, for a given deception classifier, f , let πf be thenumber of reviews in Dtest for which f makes a positiveprediction, i.e., the number of reviews for which f predictsdeceptive. Also, let the sensitivity (deceptive recall) and
be known precisely. However, imprecise estimates can oftenbe obtained, especially in cases where it is feasible to performgold-standard testing on a small subpopulation.
Ntest
α
π *
yi
f (xi )η* θ *
β γ
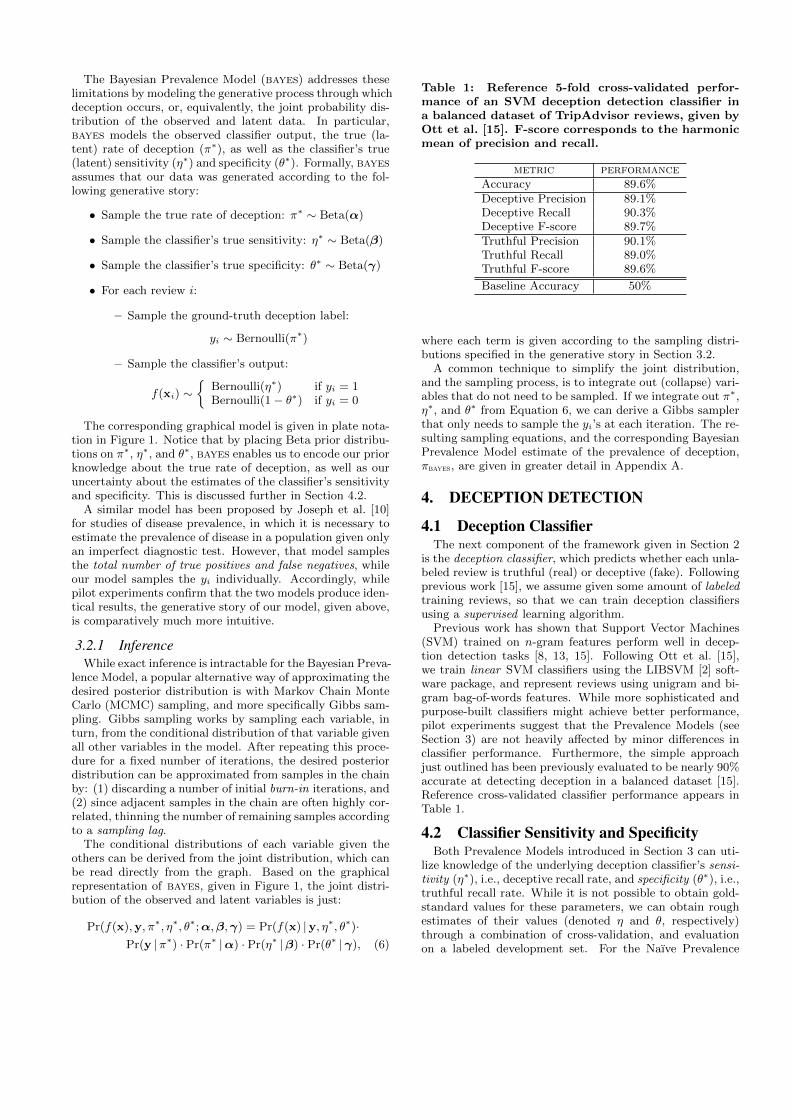
Figure 1: The Bayesian Prevalence Model in platenotation. Shaded nodes represent observed vari-ables, and arrows denote dependence. For example,f(xi) is observed, and depends on η∗, θ∗, and yi.
specificity (truthful recall) of f be given by η and θ, respec-tively. Then, we can write the expectation of πf as:
E[πf ] = E
1
N test
∑x∈Dtest
δ[f(x) = 1]
=
1
N test
∑x∈Dtest
E [δ [f(x) = 1]]
= ηπ∗ + (1− θ)(1− π∗), (4)
where π∗ is the true (latent) rate of deception, and δ[a = b]is the Kronecker delta function, which is equal to 1 whena = b, and 0 otherwise.
If we rearrange Equation 4 in terms of π∗, and replace theexpectation of πf with the observed value, we get the NaıvePrevalence Model estimator:
πnaıve =πf − (1− θ)η − (1− θ) . (5)
Intuitively, Equation 5 corrects the raw classifier output,given by πf , by subtracting from it the false positive rate,given by 1 − θ, and dividing the result by the differencebetween the true and false positive rates, given by η−(1−θ).Notice that when f is an oracle,5 i.e., when η = θ = 1, theNaıve Prevalence Model estimate correctly reduces to theoracle rate given by f , i.e., πnaıve = πf = π∗.
3.2 Bayesian Prevalence ModelUnfortunately, the Naıve Prevalence Model estimate, πnaıve,
is not restricted to the range [0, 1]. Specifically, it is negativewhen πf < 1− θ, and greater than 1 when πf > η. Further-more, the Naıve Prevalence Model makes the unrealistic as-sumption that the estimates of the classifier’s sensitivity (η)and specificity (θ), obtained using the procedure discussedin Section 4.2 and Appendix B, are exact.
5An oracle is a classifier that does not make mistakes, andalways predicts the true, gold-standard label.
The Bayesian Prevalence Model (bayes) addresses theselimitations by modeling the generative process through whichdeception occurs, or, equivalently, the joint probability dis-tribution of the observed and latent data. In particular,bayes models the observed classifier output, the true (la-tent) rate of deception (π∗), as well as the classifier’s true(latent) sensitivity (η∗) and specificity (θ∗). Formally, bayesassumes that our data was generated according to the fol-lowing generative story:
• Sample the true rate of deception: π∗ ∼ Beta(α)
• Sample the classifier’s true sensitivity: η∗ ∼ Beta(β)
• Sample the classifier’s true specificity: θ∗ ∼ Beta(γ)
• For each review i:
– Sample the ground-truth deception label:
yi ∼ Bernoulli(π∗)
– Sample the classifier’s output:
f(xi) ∼{
Bernoulli(η∗) if yi = 1Bernoulli(1− θ∗) if yi = 0
The corresponding graphical model is given in plate nota-tion in Figure 1. Notice that by placing Beta prior distribu-tions on π∗, η∗, and θ∗, bayes enables us to encode our priorknowledge about the true rate of deception, as well as ouruncertainty about the estimates of the classifier’s sensitivityand specificity. This is discussed further in Section 4.2.
A similar model has been proposed by Joseph et al. [10]for studies of disease prevalence, in which it is necessary toestimate the prevalence of disease in a population given onlyan imperfect diagnostic test. However, that model samplesthe total number of true positives and false negatives, whileour model samples the yi individually. Accordingly, whilepilot experiments confirm that the two models produce iden-tical results, the generative story of our model, given above,is comparatively much more intuitive.
3.2.1 InferenceWhile exact inference is intractable for the Bayesian Preva-
lence Model, a popular alternative way of approximating thedesired posterior distribution is with Markov Chain MonteCarlo (MCMC) sampling, and more specifically Gibbs sam-pling. Gibbs sampling works by sampling each variable, inturn, from the conditional distribution of that variable givenall other variables in the model. After repeating this proce-dure for a fixed number of iterations, the desired posteriordistribution can be approximated from samples in the chainby: (1) discarding a number of initial burn-in iterations, and(2) since adjacent samples in the chain are often highly cor-related, thinning the number of remaining samples accordingto a sampling lag.
The conditional distributions of each variable given theothers can be derived from the joint distribution, which canbe read directly from the graph. Based on the graphicalrepresentation of bayes, given in Figure 1, the joint distri-bution of the observed and latent variables is just:
Pr(f(x),y, π∗, η∗, θ∗;α,β,γ) = Pr(f(x) |y, η∗, θ∗)·Pr(y |π∗) · Pr(π∗ |α) · Pr(η∗ |β) · Pr(θ∗ |γ), (6)
Table 1: Reference 5-fold cross-validated perfor-mance of an SVM deception detection classifier ina balanced dataset of TripAdvisor reviews, given byOtt et al. [15]. F-score corresponds to the harmonicmean of precision and recall.
metric performanceAccuracy 89.6%Deceptive Precision 89.1%Deceptive Recall 90.3%Deceptive F-score 89.7%Truthful Precision 90.1%Truthful Recall 89.0%Truthful F-score 89.6%
Baseline Accuracy 50%
where each term is given according to the sampling distri-butions specified in the generative story in Section 3.2.
A common technique to simplify the joint distribution,and the sampling process, is to integrate out (collapse) vari-ables that do not need to be sampled. If we integrate out π∗,η∗, and θ∗ from Equation 6, we can derive a Gibbs samplerthat only needs to sample the yi’s at each iteration. The re-sulting sampling equations, and the corresponding BayesianPrevalence Model estimate of the prevalence of deception,πbayes, are given in greater detail in Appendix A.
4. DECEPTION DETECTION
4.1 Deception ClassifierThe next component of the framework given in Section 2
is the deception classifier, which predicts whether each unla-beled review is truthful (real) or deceptive (fake). Followingprevious work [15], we assume given some amount of labeledtraining reviews, so that we can train deception classifiersusing a supervised learning algorithm.
Previous work has shown that Support Vector Machines(SVM) trained on n-gram features perform well in decep-tion detection tasks [8, 13, 15]. Following Ott et al. [15],we train linear SVM classifiers using the LIBSVM [2] soft-ware package, and represent reviews using unigram and bi-gram bag-of-words features. While more sophisticated andpurpose-built classifiers might achieve better performance,pilot experiments suggest that the Prevalence Models (seeSection 3) are not heavily affected by minor differences inclassifier performance. Furthermore, the simple approachjust outlined has been previously evaluated to be nearly 90%accurate at detecting deception in a balanced dataset [15].Reference cross-validated classifier performance appears inTable 1.
4.2 Classifier Sensitivity and SpecificityBoth Prevalence Models introduced in Section 3 can uti-
lize knowledge of the underlying deception classifier’s sensi-tivity (η∗), i.e., deceptive recall rate, and specificity (θ∗), i.e.,truthful recall rate. While it is not possible to obtain gold-standard values for these parameters, we can obtain roughestimates of their values (denoted η and θ, respectively)through a combination of cross-validation, and evaluationon a labeled development set. For the Naıve Prevalence
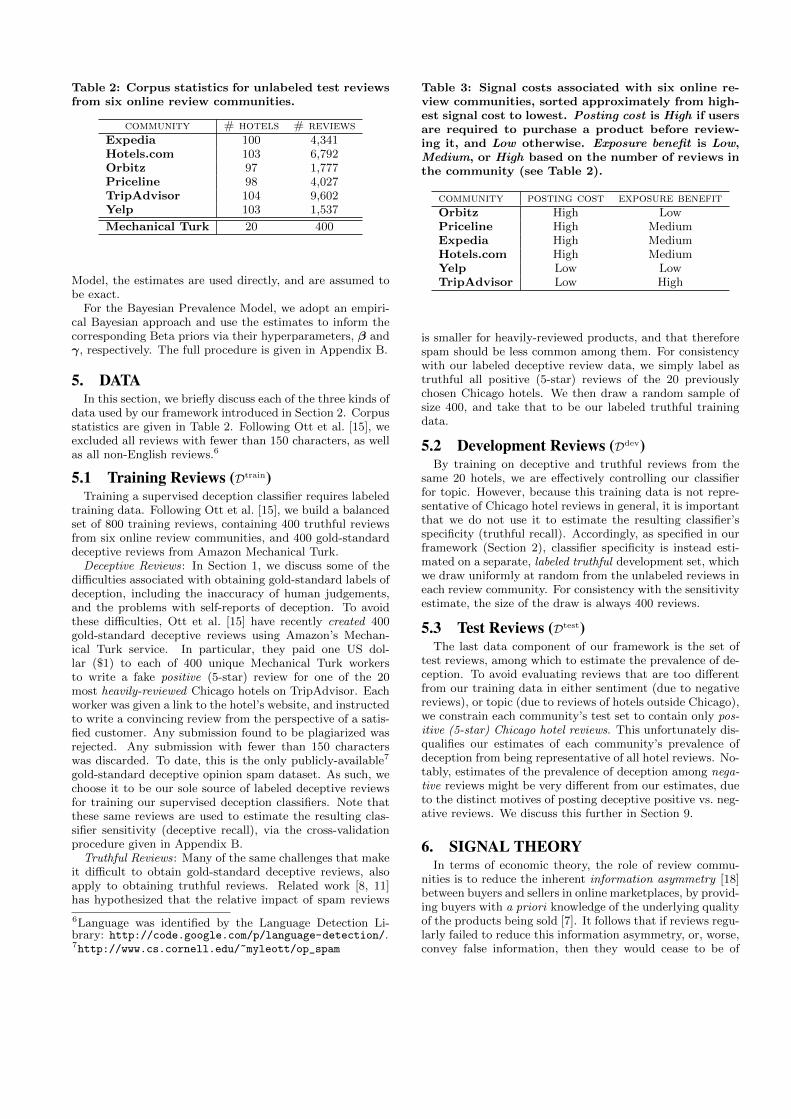
Table 2: Corpus statistics for unlabeled test reviewsfrom six online review communities.
community # hotels # reviewsExpedia 100 4,341Hotels.com 103 6,792Orbitz 97 1,777Priceline 98 4,027TripAdvisor 104 9,602Yelp 103 1,537
Mechanical Turk 20 400
Model, the estimates are used directly, and are assumed tobe exact.
For the Bayesian Prevalence Model, we adopt an empiri-cal Bayesian approach and use the estimates to inform thecorresponding Beta priors via their hyperparameters, β andγ, respectively. The full procedure is given in Appendix B.
5. DATAIn this section, we briefly discuss each of the three kinds of
data used by our framework introduced in Section 2. Corpusstatistics are given in Table 2. Following Ott et al. [15], weexcluded all reviews with fewer than 150 characters, as wellas all non-English reviews.6
5.1 Training Reviews (Dtrain)Training a supervised deception classifier requires labeled
training data. Following Ott et al. [15], we build a balancedset of 800 training reviews, containing 400 truthful reviewsfrom six online review communities, and 400 gold-standarddeceptive reviews from Amazon Mechanical Turk.
Deceptive Reviews: In Section 1, we discuss some of thedifficulties associated with obtaining gold-standard labels ofdeception, including the inaccuracy of human judgements,and the problems with self-reports of deception. To avoidthese difficulties, Ott et al. [15] have recently created 400gold-standard deceptive reviews using Amazon’s Mechan-ical Turk service. In particular, they paid one US dol-lar ($1) to each of 400 unique Mechanical Turk workersto write a fake positive (5-star) review for one of the 20most heavily-reviewed Chicago hotels on TripAdvisor. Eachworker was given a link to the hotel’s website, and instructedto write a convincing review from the perspective of a satis-fied customer. Any submission found to be plagiarized wasrejected. Any submission with fewer than 150 characterswas discarded. To date, this is the only publicly-available7
gold-standard deceptive opinion spam dataset. As such, wechoose it to be our sole source of labeled deceptive reviewsfor training our supervised deception classifiers. Note thatthese same reviews are used to estimate the resulting clas-sifier sensitivity (deceptive recall), via the cross-validationprocedure given in Appendix B.
Truthful Reviews: Many of the same challenges that makeit difficult to obtain gold-standard deceptive reviews, alsoapply to obtaining truthful reviews. Related work [8, 11]has hypothesized that the relative impact of spam reviews
6Language was identified by the Language Detection Li-brary: http://code.google.com/p/language-detection/.7http://www.cs.cornell.edu/~myleott/op_spam
Table 3: Signal costs associated with six online re-view communities, sorted approximately from high-est signal cost to lowest. Posting cost is High if usersare required to purchase a product before review-ing it, and Low otherwise. Exposure benefit is Low,Medium, or High based on the number of reviews inthe community (see Table 2).
community posting cost exposure benefitOrbitz High LowPriceline High MediumExpedia High MediumHotels.com High MediumYelp Low LowTripAdvisor Low High
is smaller for heavily-reviewed products, and that thereforespam should be less common among them. For consistencywith our labeled deceptive review data, we simply label astruthful all positive (5-star) reviews of the 20 previouslychosen Chicago hotels. We then draw a random sample ofsize 400, and take that to be our labeled truthful trainingdata.
5.2 Development Reviews (Ddev)By training on deceptive and truthful reviews from the
same 20 hotels, we are effectively controlling our classifierfor topic. However, because this training data is not repre-sentative of Chicago hotel reviews in general, it is importantthat we do not use it to estimate the resulting classifier’sspecificity (truthful recall). Accordingly, as specified in ourframework (Section 2), classifier specificity is instead esti-mated on a separate, labeled truthful development set, whichwe draw uniformly at random from the unlabeled reviews ineach review community. For consistency with the sensitivityestimate, the size of the draw is always 400 reviews.
5.3 Test Reviews (Dtest)The last data component of our framework is the set of
test reviews, among which to estimate the prevalence of de-ception. To avoid evaluating reviews that are too differentfrom our training data in either sentiment (due to negativereviews), or topic (due to reviews of hotels outside Chicago),we constrain each community’s test set to contain only pos-itive (5-star) Chicago hotel reviews. This unfortunately dis-qualifies our estimates of each community’s prevalence ofdeception from being representative of all hotel reviews. No-tably, estimates of the prevalence of deception among nega-tive reviews might be very different from our estimates, dueto the distinct motives of posting deceptive positive vs. neg-ative reviews. We discuss this further in Section 9.
6. SIGNAL THEORYIn terms of economic theory, the role of review commu-
nities is to reduce the inherent information asymmetry [18]between buyers and sellers in online marketplaces, by provid-ing buyers with a priori knowledge of the underlying qualityof the products being sold [7]. It follows that if reviews regu-larly failed to reduce this information asymmetry, or, worse,convey false information, then they would cease to be of
-‐6%
-‐4%
-‐2%
0%
2%
4%
6%
Jan-‐09 Jul-‐09 Jan-‐10 Jul-‐10 Jan-‐11 Jul-‐11
(a) Orbitz
-‐6%
-‐4%
-‐2%
0%
2%
4%
6%
Jan-‐09 Jul-‐09 Jan-‐10 Jul-‐10 Jan-‐11 Jul-‐11
(b) Priceline
-‐6%
-‐4%
-‐2%
0%
2%
4%
6%
Jan-‐09 Jul-‐09 Jan-‐10 Jul-‐10 Jan-‐11 Jul-‐11
(c) Expedia
-‐6%
-‐4%
-‐2%
0%
2%
4%
6%
Jan-‐09 Jul-‐09 Jan-‐10 Jul-‐10 Jan-‐11 Jul-‐11
(d) Hotels.com
-‐6%
-‐4%
-‐2%
0%
2%
4%
6%
Jan-‐09 Jul-‐09 Jan-‐10 Jul-‐10 Jan-‐11 Jul-‐11
(e) Yelp
-‐6%
-‐4%
-‐2%
0%
2%
4%
6%
Jan-‐09 Jul-‐09 Jan-‐10 Jul-‐10 Jan-‐11 Jul-‐11
(f) TripAdvisor
Figure 2: Graph of Naıve estimates of deception prevalence versus time, for six online review communities.Blue (a–d) and red (e–f) graphs correspond to high and low posting cost communities, respectively.
value to the user. Given that review communities are, infact, valued by users [3], it seems unlikely that the preva-lence of deception among them is large.
Nonetheless, there is widespread concern about the preva-lence of deception in online reviews, rightly or wrongly, andfurther, deceptive reviews can be cause for concern even insmall quantities, e.g., if they are concentrated in a singlereview community. We propose that by framing reviews assignals—voluntary communications that serve to convey in-formation about the signaler [18], we can reason about thefactors underlying deception by manipulating the distinctsignal costs associated with truthful vs. deceptive reviews.
Specifically, we claim that for a positive review to beposted in a given review community, there must be an in-curred signal cost, that is increased by:
1. The posting cost for posting the review in a givenreview community, i.e., whether users are required topurchase a product prior to reviewing it (high cost) ornot (low cost). Some sites, for example, allow anyoneto post reviews about any hotel, making the reviewcost effectively zero. Other sites, however, require thepurchase of the hotel room before a review can be writ-ten, raising the cost from zero to the price of the room.
and decreased by:
2. The exposure benefit of posting the review in thatreview community, i.e., the benefit derived from otherusers reading the review, which is proportional to thesize of the review community’s audience. Review siteswith more traffic have greater exposure benefit.
Observe that both the posting cost and the exposure benefitdepend entirely on the review community. An overview of
these factors for each of the six review communities is givenin Table 3.
Based on the signal cost function just defined, we proposetwo hypotheses:
• Hypothesis 1 : Review communities that have low sig-nal costs (low posting requirements, high exposure),e.g., TripAdvisor and Yelp, will have more deceptionthan communities with high signal costs, e.g., Orbitz.
• Hypothesis 2 : Increasing the signal cost will decreasethe prevalence of deception.
7. EXPERIMENTAL SETUPThe framework described in Section 2 is instantiated for
the six review communities introduced in Section 5. In par-ticular, we first train our SVM deception classifier followingthe procedure outlined in Section 4.1. An important stepwhen training SVM classifiers is setting the cost parameter,C. We set C using a nested 5-fold cross-validation pro-cedure, and choose the value that gives the best averagebalanced accuracy, defined as 1
2(sensitivity + specificity).
We then estimate the classifier’s sensitivity, specificity,and hyperparameters, using the procedure outlined in Sec-tion 4.2 and Appendix B. Based on those estimates, we thenestimate the prevalence of deception among reviews in ourtest set using the Naıve and the Bayesian Prevalence Models.Gibbs sampling for the Bayesian Prevalence Model is per-formed using Equations 7 and 8 (given in Appendix A) for70,000 iterations, with a burn-in of 20,000 iterations, anda sampling lag of 50. We use an uninformative (uniform)prior for π∗, i.e., α = 〈1, 1〉. Multiple runs are performed toverify the stability of the results.
0%
2%
4%
6%
8%
10%
Jan-‐09 Jul-‐09 Jan-‐10 Jul-‐10 Jan-‐11 Jul-‐11
(a) Orbitz
0%
2%
4%
6%
8%
10%
12%
Jan-‐09 Jul-‐09 Jan-‐10 Jul-‐10 Jan-‐11 Jul-‐11
(b) Priceline
0%
2%
4%
6%
8%
10%
12%
Jan-‐09 Jul-‐09 Jan-‐10 Jul-‐10 Jan-‐11 Jul-‐11
(c) Expedia
0%
2%
4%
6%
8%
10%
12%
Jan-‐09 Jul-‐09 Jan-‐10 Jul-‐10 Jan-‐11 Jul-‐11
(d) Hotels.com
0%
2%
4%
6%
8%
10%
12%
Jan-‐09 Jul-‐09 Jan-‐10 Jul-‐10 Jan-‐11 Jul-‐11
(e) Yelp
0%
2%
4%
6%
8%
10%
12%
Jan-‐09 Jul-‐09 Jan-‐10 Jul-‐10 Jan-‐11 Jul-‐11
(f) TripAdvisor
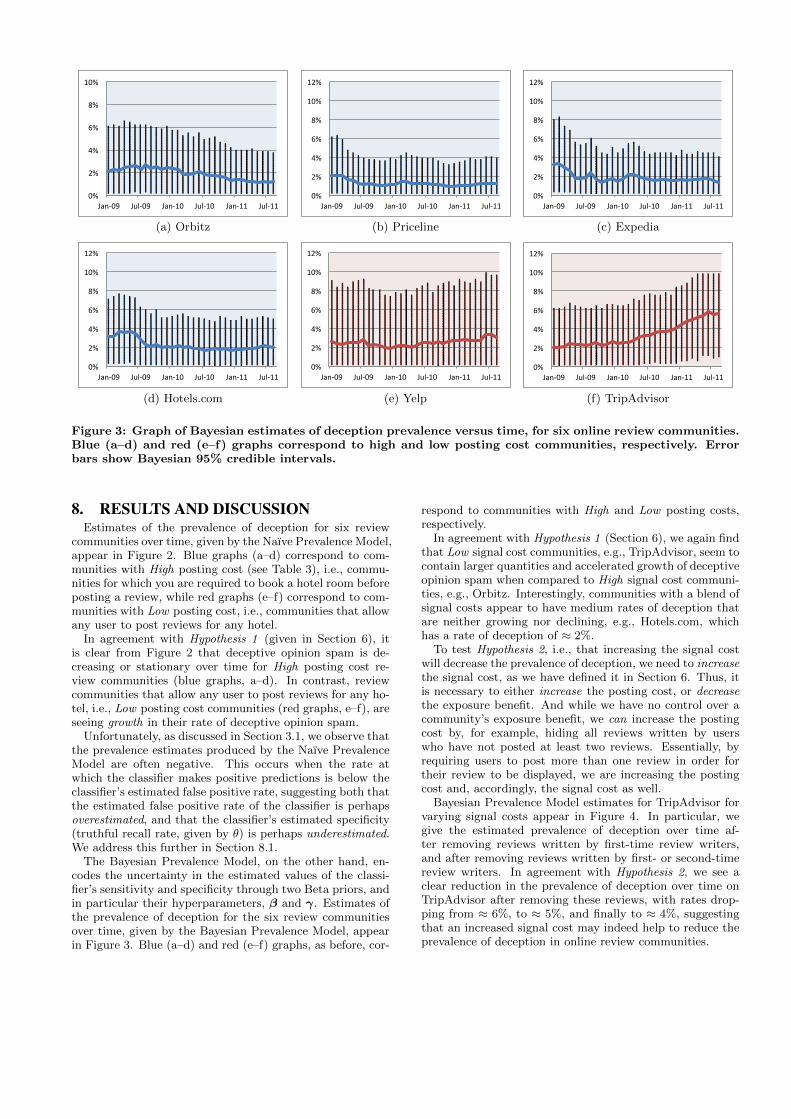
Figure 3: Graph of Bayesian estimates of deception prevalence versus time, for six online review communities.Blue (a–d) and red (e–f) graphs correspond to high and low posting cost communities, respectively. Errorbars show Bayesian 95% credible intervals.
8. RESULTS AND DISCUSSIONEstimates of the prevalence of deception for six review
communities over time, given by the Naıve Prevalence Model,appear in Figure 2. Blue graphs (a–d) correspond to com-munities with High posting cost (see Table 3), i.e., commu-nities for which you are required to book a hotel room beforeposting a review, while red graphs (e–f) correspond to com-munities with Low posting cost, i.e., communities that allowany user to post reviews for any hotel.
In agreement with Hypothesis 1 (given in Section 6), itis clear from Figure 2 that deceptive opinion spam is de-creasing or stationary over time for High posting cost re-view communities (blue graphs, a–d). In contrast, reviewcommunities that allow any user to post reviews for any ho-tel, i.e., Low posting cost communities (red graphs, e–f), areseeing growth in their rate of deceptive opinion spam.
Unfortunately, as discussed in Section 3.1, we observe thatthe prevalence estimates produced by the Naıve PrevalenceModel are often negative. This occurs when the rate atwhich the classifier makes positive predictions is below theclassifier’s estimated false positive rate, suggesting both thatthe estimated false positive rate of the classifier is perhapsoverestimated, and that the classifier’s estimated specificity(truthful recall rate, given by θ) is perhaps underestimated.We address this further in Section 8.1.
The Bayesian Prevalence Model, on the other hand, en-codes the uncertainty in the estimated values of the classi-fier’s sensitivity and specificity through two Beta priors, andin particular their hyperparameters, β and γ. Estimates ofthe prevalence of deception for the six review communitiesover time, given by the Bayesian Prevalence Model, appearin Figure 3. Blue (a–d) and red (e–f) graphs, as before, cor-
respond to communities with High and Low posting costs,respectively.
In agreement with Hypothesis 1 (Section 6), we again findthat Low signal cost communities, e.g., TripAdvisor, seem tocontain larger quantities and accelerated growth of deceptiveopinion spam when compared to High signal cost communi-ties, e.g., Orbitz. Interestingly, communities with a blend ofsignal costs appear to have medium rates of deception thatare neither growing nor declining, e.g., Hotels.com, whichhas a rate of deception of ≈ 2%.
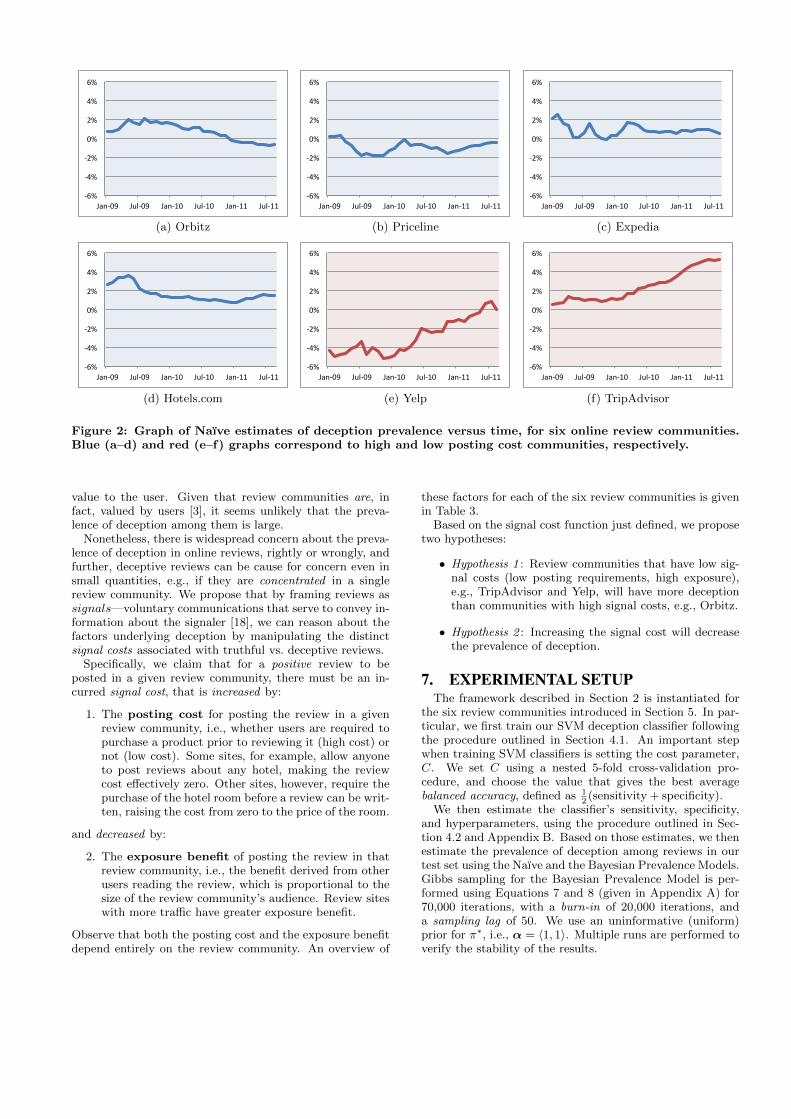
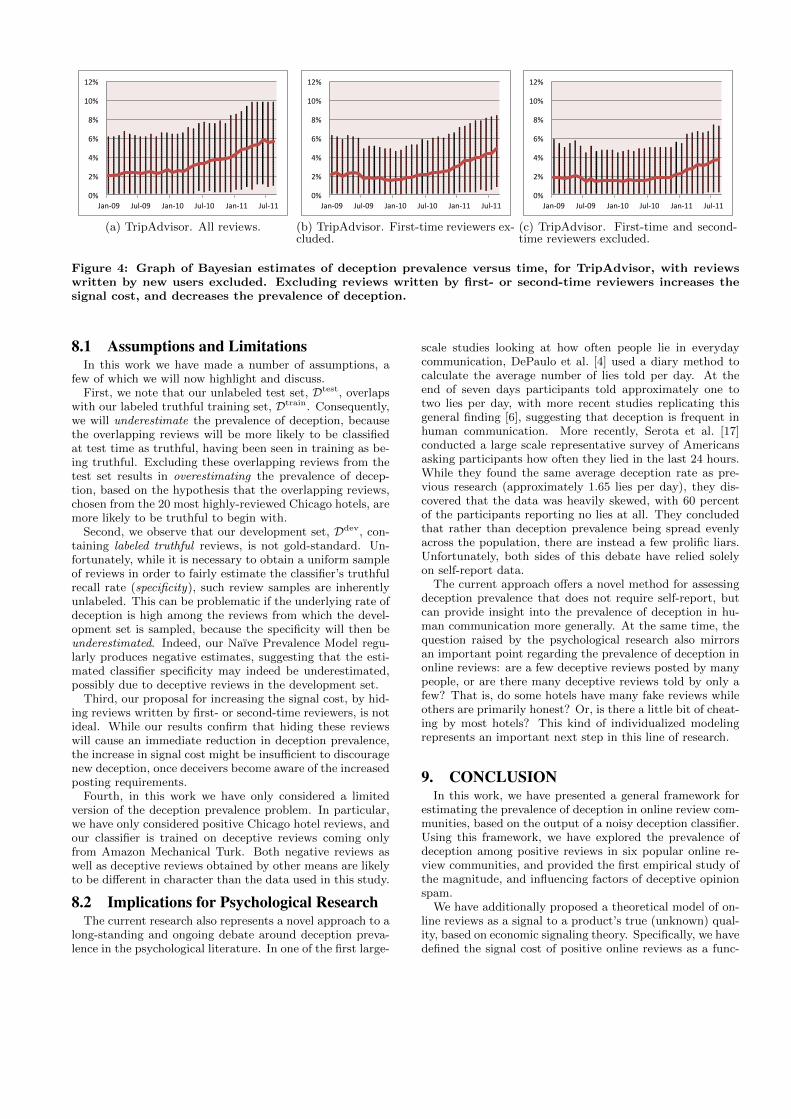
To test Hypothesis 2, i.e., that increasing the signal costwill decrease the prevalence of deception, we need to increasethe signal cost, as we have defined it in Section 6. Thus, itis necessary to either increase the posting cost, or decreasethe exposure benefit. And while we have no control over acommunity’s exposure benefit, we can increase the postingcost by, for example, hiding all reviews written by userswho have not posted at least two reviews. Essentially, byrequiring users to post more than one review in order fortheir review to be displayed, we are increasing the postingcost and, accordingly, the signal cost as well.
Bayesian Prevalence Model estimates for TripAdvisor forvarying signal costs appear in Figure 4. In particular, wegive the estimated prevalence of deception over time af-ter removing reviews written by first-time review writers,and after removing reviews written by first- or second-timereview writers. In agreement with Hypothesis 2, we see aclear reduction in the prevalence of deception over time onTripAdvisor after removing these reviews, with rates drop-ping from ≈ 6%, to ≈ 5%, and finally to ≈ 4%, suggestingthat an increased signal cost may indeed help to reduce theprevalence of deception in online review communities.
0%
2%
4%
6%
8%
10%
12%
Jan-‐09 Jul-‐09 Jan-‐10 Jul-‐10 Jan-‐11 Jul-‐11
(a) TripAdvisor. All reviews.
0%
2%
4%
6%
8%
10%
12%
Jan-‐09 Jul-‐09 Jan-‐10 Jul-‐10 Jan-‐11 Jul-‐11
(b) TripAdvisor. First-time reviewers ex-cluded.
0%
2%
4%
6%
8%
10%
12%
Jan-‐09 Jul-‐09 Jan-‐10 Jul-‐10 Jan-‐11 Jul-‐11
(c) TripAdvisor. First-time and second-time reviewers excluded.
Figure 4: Graph of Bayesian estimates of deception prevalence versus time, for TripAdvisor, with reviewswritten by new users excluded. Excluding reviews written by first- or second-time reviewers increases thesignal cost, and decreases the prevalence of deception.
8.1 Assumptions and LimitationsIn this work we have made a number of assumptions, a
few of which we will now highlight and discuss.First, we note that our unlabeled test set, Dtest, overlaps
with our labeled truthful training set, Dtrain. Consequently,we will underestimate the prevalence of deception, becausethe overlapping reviews will be more likely to be classifiedat test time as truthful, having been seen in training as be-ing truthful. Excluding these overlapping reviews from thetest set results in overestimating the prevalence of decep-tion, based on the hypothesis that the overlapping reviews,chosen from the 20 most highly-reviewed Chicago hotels, aremore likely to be truthful to begin with.
Second, we observe that our development set, Ddev, con-taining labeled truthful reviews, is not gold-standard. Un-fortunately, while it is necessary to obtain a uniform sampleof reviews in order to fairly estimate the classifier’s truthfulrecall rate (specificity), such review samples are inherentlyunlabeled. This can be problematic if the underlying rate ofdeception is high among the reviews from which the devel-opment set is sampled, because the specificity will then beunderestimated. Indeed, our Naıve Prevalence Model regu-larly produces negative estimates, suggesting that the esti-mated classifier specificity may indeed be underestimated,possibly due to deceptive reviews in the development set.
Third, our proposal for increasing the signal cost, by hid-ing reviews written by first- or second-time reviewers, is notideal. While our results confirm that hiding these reviewswill cause an immediate reduction in deception prevalence,the increase in signal cost might be insufficient to discouragenew deception, once deceivers become aware of the increasedposting requirements.
Fourth, in this work we have only considered a limitedversion of the deception prevalence problem. In particular,we have only considered positive Chicago hotel reviews, andour classifier is trained on deceptive reviews coming onlyfrom Amazon Mechanical Turk. Both negative reviews aswell as deceptive reviews obtained by other means are likelyto be different in character than the data used in this study.
8.2 Implications for Psychological ResearchThe current research also represents a novel approach to a
long-standing and ongoing debate around deception preva-lence in the psychological literature. In one of the first large-
scale studies looking at how often people lie in everydaycommunication, DePaulo et al. [4] used a diary method tocalculate the average number of lies told per day. At theend of seven days participants told approximately one totwo lies per day, with more recent studies replicating thisgeneral finding [6], suggesting that deception is frequent inhuman communication. More recently, Serota et al. [17]conducted a large scale representative survey of Americansasking participants how often they lied in the last 24 hours.While they found the same average deception rate as pre-vious research (approximately 1.65 lies per day), they dis-covered that the data was heavily skewed, with 60 percentof the participants reporting no lies at all. They concludedthat rather than deception prevalence being spread evenlyacross the population, there are instead a few prolific liars.Unfortunately, both sides of this debate have relied solelyon self-report data.
The current approach offers a novel method for assessingdeception prevalence that does not require self-report, butcan provide insight into the prevalence of deception in hu-man communication more generally. At the same time, thequestion raised by the psychological research also mirrorsan important point regarding the prevalence of deception inonline reviews: are a few deceptive reviews posted by manypeople, or are there many deceptive reviews told by only afew? That is, do some hotels have many fake reviews whileothers are primarily honest? Or, is there a little bit of cheat-ing by most hotels? This kind of individualized modelingrepresents an important next step in this line of research.
9. CONCLUSIONIn this work, we have presented a general framework for
estimating the prevalence of deception in online review com-munities, based on the output of a noisy deception classifier.Using this framework, we have explored the prevalence ofdeception among positive reviews in six popular online re-view communities, and provided the first empirical study ofthe magnitude, and influencing factors of deceptive opinionspam.
We have additionally proposed a theoretical model of on-line reviews as a signal to a product’s true (unknown) qual-ity, based on economic signaling theory. Specifically, we havedefined the signal cost of positive online reviews as a func-

tion of the posting costs and exposure benefits of the reviewcommunity in which it is posted. Based on this theory, wehave further suggested two hypotheses, both of which aresupported by our findings. In particular, we find first thatreview communities with low signal costs (low posting re-quirements, high exposure) have more deception than com-munities with comparatively higher signal costs. Second, wefind that by increasing the signal cost of a review community,e.g., by excluding reviews written by first- or second-time re-viewers, we can effectively reduce both the prevalence andthe growth rate of deception in that community.
Future work might explore other methods for manipu-lating the signal costs associated with posting online re-views, and the corresponding effects on deception preva-lence. For example, some sites, such as Angie’s List (http://www.angieslist.com/), charge a monthly access fee in or-der to browse or post reviews, and future work might studythe effectiveness of such techniques at deterring deception.
10. ACKNOWLEDGMENTSThis work was supported in part by National Science
Foundation Grant NSCC-0904913, and the Jack Kent CookeFoundation. We also thank, alphabetically, Cristian Danescu-Niculescu-Mizil, Lillian Lee, Bin Lu, Karthik Raman, LuWang, and Ainur Yessenalina, as well as members of theCornell NLP seminar group and the WWW reviewers fortheir insightful comments, suggestions and advice on vari-ous aspects of this work.
11. REFERENCES[1] C. Bond and B. DePaulo. Accuracy of deception
judgments. Personality and Social Psychology Review,10(3):214, 2006.
[2] C.-C. Chang and C.-J. Lin. LIBSVM: A library forsupport vector machines. ACM Transactions onIntelligent Systems and Technology, 2:27:1–27:27,2011. Software available athttp://www.csie.ntu.edu.tw/~cjlin/libsvm.
[3] Cone. 2011 Online Influence Trend Tracker. Online:http://www.coneinc.com/negative-reviews-
online-reverse-purchase-decisions, August 2011.
[4] B. DePaulo, D. Kashy, S. Kirkendol, M. Wyer, andJ. Epstein. Lying in everyday life. Journal ofpersonality and social psychology, 70(5):979, 1996.
[5] J. Hancock. Digital Deception: The Practice of Lyingin the Digital Age. Deception: Methods, Contexts andConsequences, pages 109–120, 2009.
[6] J. Hancock, J. Thom-Santelli, and T. Ritchie.Deception and design: The impact of communicationtechnology on lying behavior. In Proceedings of theSIGCHI conference on Human factors in computingsystems, pages 129–134. ACM, 2004.
[7] N. Hu, L. Liu, and J. Zhang. Do online reviews affectproduct sales? The role of reviewer characteristics andtemporal effects. Information Technology andManagement, 9(3):201–214, 2008.
[8] N. Jindal and B. Liu. Opinion spam and analysis. InProceedings of the international conference on Websearch and web data mining, pages 219–230. ACM,2008.
[9] W. Johnson, J. Gastwirth, and L. Pearson. Screeningwithout a “gold standard”: The Hui-Walter paradigm
revisited. American Journal of Epidemiology,153(9):921, 2001.
[10] L. Joseph, T. Gyorkos, and L. Coupal. Bayesianestimation of disease prevalence and the parameters ofdiagnostic tests in the absence of a gold standard.American Journal of Epidemiology, 141(3):263, 1995.
[11] E. Lim, V. Nguyen, N. Jindal, B. Liu, and H. Lauw.Detecting product review spammers using ratingbehaviors. In Proceedings of the 19th ACMinternational conference on Information andknowledge management, pages 939–948. ACM, 2010.
[12] D. Meyer. Fake reviews prompt belkin apology. http://news.cnet.com/8301-1001_3-10145399-92.html,Jan. 2009.
[13] R. Mihalcea and C. Strapparava. The lie detector:Explorations in the automatic recognition of deceptivelanguage. In Proceedings of the ACL-IJCNLP 2009Conference Short Papers, pages 309–312. Associationfor Computational Linguistics, 2009.
[14] C. Miller. Company settles case of reviews it faked.http://www.nytimes.com/2009/07/15/technology/
internet/15lift.html, July 2009.
[15] M. Ott, Y. Choi, C. Cardie, and J. Hancock. Findingdeceptive opinion spam by any stretch of theimagination. In Proceedings of the 49th AnnualMeeting of the Association for ComputationalLinguistics: Human Language Technologies-Volume 1,pages 309–319. Association for ComputationalLinguistics, 2011.
[16] B. Page. Amazon withdraws ebook explaining how tomanipulate its sales rankings.http://www.guardian.co.uk/books/2011/jan/05/
amazon-ebook-manipulate-kindle-rankings, Jan.2011.
[17] K. Serota, T. Levine, and F. Boster. The prevalence oflying in America: Three studies of self-reported lies.Human Communication Research, 36(1):2–25, 2010.
[18] M. Spence. Job market signaling. The quarterlyjournal of Economics, 87(3):355, 1973.
[19] D. Streitfeld. In a race to out-rave, 5-star web reviewsgo for $5. http://www.nytimes.com/2011/08/20/technology/finding-fake-reviews-online.html,Aug. 2011.
[20] D. Streitfeld. For $2 a star, an online retailer gets5-star product reviews. http://www.nytimes.com/2012/01/27/technology/for-2-
a-star-a-retailer-gets-5-star-reviews.html,Jan. 2012.
[21] A. Topping. Historian Orlando Figes agrees to paydamages for fake reviews.http://www.guardian.co.uk/books/2010/jul/16/
orlando-figes-fake-amazon-reviews, July 2010.
[22] A. Vrij. Detecting lies and deceit: Pitfalls andopportunities. Wiley-Interscience, 2008.
[23] K. Yoo and U. Gretzel. Comparison of Deceptive andTruthful Travel Reviews. Information andCommunication Technologies in Tourism 2009, pages37–47, 2009.
APPENDIXA. GIBBS SAMPLER FOR BAYESIAN PREVA-
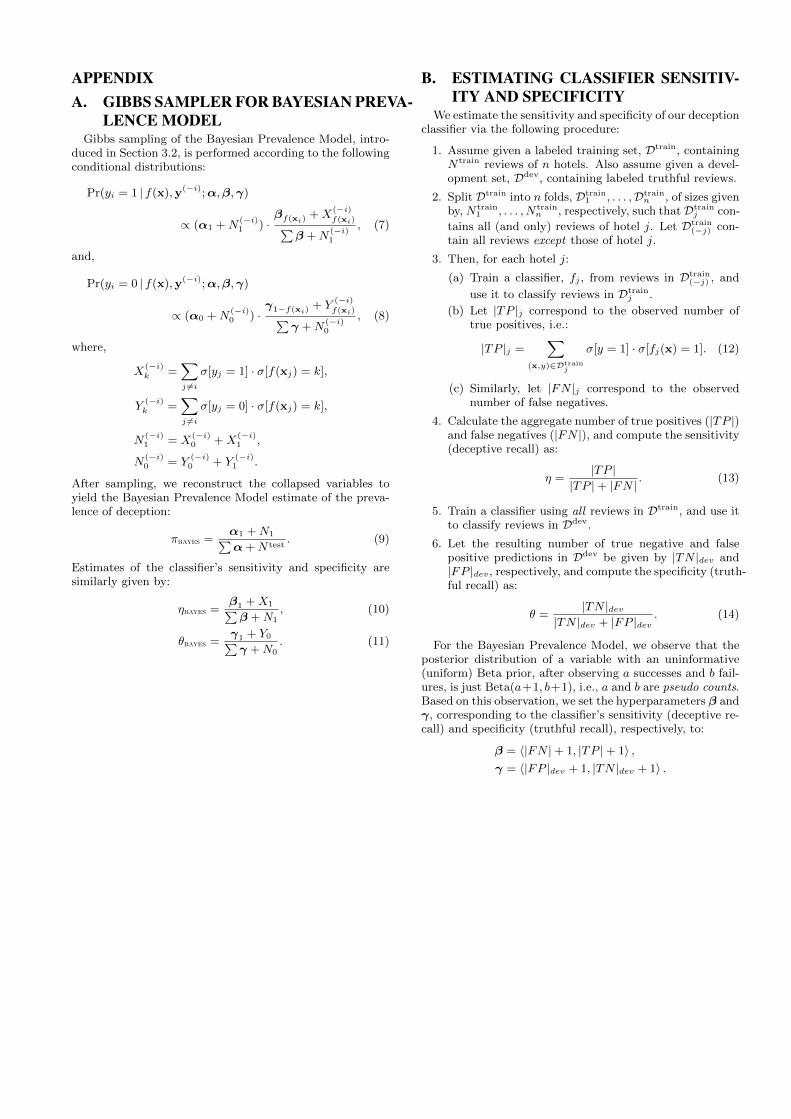
LENCE MODELGibbs sampling of the Bayesian Prevalence Model, intro-
duced in Section 3.2, is performed according to the followingconditional distributions:
Pr(yi = 1 | f(x),y(−i);α,β,γ)
∝ (α1 +N(−i)1 ) ·
βf(xi)+X
(−i)
f(xi)∑β +N
(−i)1
, (7)
and,
Pr(yi = 0 | f(x),y(−i);α,β,γ)
∝ (α0 +N(−i)0 ) ·
γ1−f(xi)+ Y
(−i)
f(xi)∑γ +N
(−i)0
, (8)
where,
X(−i)k =
∑j 6=i
σ[yj = 1] · σ[f(xj) = k],
Y(−i)k =
∑j 6=i
σ[yj = 0] · σ[f(xj) = k],
N(−i)1 = X
(−i)0 +X
(−i)1 ,
N(−i)0 = Y
(−i)0 + Y
(−i)1 .
After sampling, we reconstruct the collapsed variables toyield the Bayesian Prevalence Model estimate of the preva-lence of deception:
πbayes =α1 +N1∑α +N test
. (9)
Estimates of the classifier’s sensitivity and specificity aresimilarly given by:
ηbayes =β1 +X1∑β +N1
, (10)
θbayes =γ1 + Y0∑γ +N0
. (11)
B. ESTIMATING CLASSIFIER SENSITIV-ITY AND SPECIFICITY
We estimate the sensitivity and specificity of our deceptionclassifier via the following procedure:
1. Assume given a labeled training set, Dtrain, containingN train reviews of n hotels. Also assume given a devel-opment set, Ddev, containing labeled truthful reviews.
2. Split Dtrain into n folds, Dtrain1 , . . . ,Dtrain
n , of sizes givenby, N train
1 , . . . , N trainn , respectively, such thatDtrain
j con-
tains all (and only) reviews of hotel j. Let Dtrain(−j) con-
tain all reviews except those of hotel j.
3. Then, for each hotel j:
(a) Train a classifier, fj , from reviews in Dtrain(−j) , and
use it to classify reviews in Dtrainj .
(b) Let |TP |j correspond to the observed number oftrue positives, i.e.:
|TP |j =∑
(x,y)∈Dtrainj
σ[y = 1] · σ[fj(x) = 1]. (12)
(c) Similarly, let |FN |j correspond to the observednumber of false negatives.
4. Calculate the aggregate number of true positives (|TP |)and false negatives (|FN |), and compute the sensitivity(deceptive recall) as:
η =|TP |
|TP |+ |FN | . (13)
5. Train a classifier using all reviews in Dtrain, and use itto classify reviews in Ddev.
6. Let the resulting number of true negative and falsepositive predictions in Ddev be given by |TN |dev and|FP |dev, respectively, and compute the specificity (truth-ful recall) as:
θ =|TN |dev
|TN |dev + |FP |dev. (14)
For the Bayesian Prevalence Model, we observe that theposterior distribution of a variable with an uninformative(uniform) Beta prior, after observing a successes and b fail-ures, is just Beta(a+1, b+1), i.e., a and b are pseudo counts.Based on this observation, we set the hyperparameters β andγ, corresponding to the classifier’s sensitivity (deceptive re-call) and specificity (truthful recall), respectively, to:
β = 〈|FN |+ 1, |TP |+ 1〉 ,γ = 〈|FP |dev + 1, |TN |dev + 1〉 .