Estimating the pore size distribution of activated carbons from adsorption data of different...
25
Journal of Colloid and Interface Science 273 (2004) 39–63 www.elsevier.com/locate/jcis Estimating the pore size distribution of activated carbons from adsorption data of different adsorbates by various methods Piotr A. Gauden, a,b Artur P. Terzyk, a,∗ Gerhard Rychlicki, a,b Piotr Kowalczyk, c Magdalena S. ´ Cwiertnia, a and Jerzy K. Garbacz b a Physicochemistry of Carbon Materials Research Group, Department of Chemistry, N. Copernicus University, Gagarina 7, 87-100 Toru´ n, Poland b Department of Environment Protection, Academy of Humanities and Economics, Okrzei 9, 87-800 Wloclawek, Poland c Department of Chemistry, Faculty of Science, Chiba University, 1-3 Yayoi, Inage, Chiba 263, Japan Received 3 July 2003; accepted 20 August 2003 Abstract Experimental adsorption isotherms of four adsorbates (N 2 , Ar, C 6 H 6 , and CCl 4 ) as well as adsorption enthalpy (C 6 H 6 and CCl 4 ) measured on two strictly microporous carbons are used to evaluate the porosity of adsorbents (i.e., pore size distributions (PSDs) and average pore diameter (L av )). The influence of the diameter of adsorbates (d A ) as well as of the temperature (T ) is analyzed in order to explain the differences or similarities between the above-mentioned quantities for all systems. Proposed previously, the general relationships between the parameters of the Dubinin–Astakhov (DA) isotherm equation (the characteristic energy of adsorption (E 0 ) and the exponent of this equation (n)) and the average slit-width of carbon micropores are investigated. Moreover, the thermodynamic verification of the Horvath– Kawazoe (HK) theory and the ND model is presented based on data of the adsorption and enthalpy of adsorption of benzene and carbon tetrachloride on two carbons. Finally, the pore diameters calculated from calorimetry data using the Everett and Powl method and those calculated applying the recently developed equations are compared. In our opinion the change of apparent PSD should be monitored by performing a series of isotherm measurements from high (equal and higher than room temperature) to low temperatures (ca. 77.5 K) as was presented in the current study. Moreover, the analysis of the experimental data leads to the conclusion that the entropy of C 6 H 6 and CCl 4 can approach to the values characteristic of quasi-solid (a partially ordered structure). Therefore, this behavior of the adsorbate should be taken into consideration in the theoretical assumptions of model and its thermodynamic verification. 2003 Elsevier Inc. All rights reserved. Keywords: Adsorption; Active carbon; Microporosity; Pore width; The Horvath–Kawazoe theory, DFT; The Nguyen–Do model; Potential theory; Calorimetry; Thermodynamics of adsorption; Molecular sieve effect 1. Introduction Usually information on the micropore system of the in- vestigated adsorbents can be obtained from Dubinin’s theory of the volume filling of micropores (TVFM), applying, for example, the Dubinin–Astakhov (DA) [1] equation, (1) Θ = exp − A pot βE 0 n , where A pot = RT ln(p s /p); p and p s are the equilibrium and the saturation pressure, respectively; R and T are the gas constant and the temperature, respectively; Θ is the de- * Corresponding author. E-mail address: [email protected] (A.P. Terzyk). gree of micropore filling; β is the affinity coefficient (the specific parameter of the system under investigation depend- ing on the adsorptive only, and it has been assumed that β (C 6 H 6 ) = 1); E 0 , the characteristic energy, and n, the ex- ponent of the above-mentioned equation, are the best-fit parameters. It should be pointed out that the DA equation possesses limitations [2–5]; however, it still occupies the leading position in the adsorption field [4–8]. For carbona- ceous adsorbents the values of the exponent n lie usually in the range 1–3, depending strongly upon the type of ad- sorbent [6,9–11]. Values of n approaching three and higher are the most frequently found in the literature for adsorbents with narrow micropores of small size range, while values of n approaching one are found for adsorbents with a wide range of pore sizes [6,9–11]. 0021-9797/$ – see front matter 2003 Elsevier Inc. All rights reserved. doi:10.1016/j.jcis.2003.08.033
-
Upload
independent -
Category
Documents
-
view
0 -
download
0
Transcript of Estimating the pore size distribution of activated carbons from adsorption data of different...

ption
erage poreeensth–rbonand thosenitored byK) as was
ld be taken
Journal of Colloid and Interface Science 273 (2004) 39–63www.elsevier.com/locate/jcis
Estimating the pore size distribution of activated carbons from adsordata of different adsorbates by various methods
Piotr A. Gauden,a,b Artur P. Terzyk,a,∗ Gerhard Rychlicki,a,b Piotr Kowalczyk,c
Magdalena S.Cwiertnia,a and Jerzy K. Garbaczb
a Physicochemistry of Carbon Materials Research Group, Department of Chemistry, N. Copernicus University, Gagarina 7, 87-100 Toru´n, Polandb Department of Environment Protection, Academy of Humanities and Economics, Okrzei 9, 87-800 Włocławek, Poland
c Department of Chemistry, Faculty of Science, Chiba University, 1-3 Yayoi, Inage, Chiba 263, Japan
Received 3 July 2003; accepted 20 August 2003
Abstract
Experimental adsorption isotherms of four adsorbates (N2, Ar, C6H6, and CCl4) as well as adsorption enthalpy (C6H6 and CCl4) measuredon two strictly microporous carbons are used to evaluate the porosity of adsorbents (i.e., pore size distributions (PSDs) and avdiameter (Lav)). The influence of the diameter of adsorbates (dA) as well as of the temperature (T ) is analyzed in order to explain thdifferences or similarities between the above-mentioned quantities for all systems. Proposed previously, the general relationships betwethe parameters of the Dubinin–Astakhov (DA) isotherm equation (the characteristic energy of adsorption (E0) and the exponent of thiequation (n)) and the average slit-width ofcarbon micropores are investigated. Moreover, the thermodynamic verification of the HorvaKawazoe (HK) theory and the ND model is presented based on data of the adsorption and enthalpy of adsorption of benzene and catetrachloride on two carbons. Finally, the pore diameters calculated from calorimetry data using the Everett and Powl methodcalculated applying the recently developed equations are compared. In our opinion the change of apparent PSD should be moperforming a series of isotherm measurements from high (equal and higher than room temperature) to low temperatures (ca. 77.5presented in the current study. Moreover, the analysis of the experimental data leads to the conclusion that the entropy of C6H6 and CCl4 canapproach to the values characteristic of quasi-solid (a partially ordered structure). Therefore, this behavior of the adsorbate shouinto consideration in the theoretical assumptions of model and its thermodynamic verification. 2003 Elsevier Inc. All rights reserved.
Keywords:Adsorption; Active carbon; Microporosity; Pore width; The Horvath–Kawazoe theory, DFT; The Nguyen–Do model; Potential theory;Calorimetry; Thermodynamics of adsorption; Molecular sieve effect
in-eoryr
end-that
st-fittionthena-
ad-erntseside
1. Introduction
Usually information on the micropore system of thevestigated adsorbents can be obtained from Dubinin’s thof the volume filling of micropores (TVFM), applying, foexample, the Dubinin–Astakhov (DA) [1] equation,
(1)Θ = exp
[−
(Apot
βE0
)n],
whereApot = RT ln(ps/p); p and ps are the equilibriumand the saturation pressure, respectively;R and T are thegas constant and the temperature, respectively;Θ is the de-
* Corresponding author.E-mail address:[email protected] (A.P. Terzyk).
0021-9797/$ – see front matter 2003 Elsevier Inc. All rights reserved.doi:10.1016/j.jcis.2003.08.033
gree of micropore filling;β is the affinity coefficient (thespecific parameter of the system under investigation deping on the adsorptive only, and it has been assumedβ(C6H6) = 1); E0, the characteristic energy, andn, the ex-ponent of the above-mentioned equation, are the beparameters. It should be pointed out that the DA equapossesses limitations [2–5]; however, it still occupiesleading position in the adsorption field [4–8]. For carboceous adsorbents the values of the exponentn lie usuallyin the range 1–3, depending strongly upon the type ofsorbent [6,9–11]. Values ofn approaching three and highare the most frequently found in the literature for adsorbewith narrow micropores of small size range, while valuof n approaching one are found for adsorbents with a wrange of pore sizes [6,9–11].

40 P.A. Gauden et al. / Journal of Colloid and Interface Science 273 (2004) 39–63
n iscro-
asis26].fromall-atnal
dand
sor-The
ac-
epen
ingney
ution
-
cor-in
if--
stiction-ike.ddif-ionion.
ad-lium,lue,dif-
cter-i-
owsmere
them.lid-antsed
em.etern-
the
The simplest method of microporosity characterizatiothe application of the relation between the average mipore diameter of the slit-shaped micropores (Lav) andE0.Plenty of such relations have been proposed on the bof both semi-theoretical and experimental research [12–On the basis of the set of independent data obtainedthe adsorption an immersion techniques and from smangle scattering of X-rays (SAXS), Dubinin proposedthe beginning of the 1980s a simple inversely proportiorelationship betweenE0 and Lav [12]. Later, this relationwas slightly modified by Dubinin and Stoeckli [15] anintensively investigated by Bhatia and Shethna [13]Kadlec [14],
(2)Lav = κ
E0,
whereκ is the characteristic constant for a defined adbate/adsorbent pair in the micropore region [12,13].value of this characteristic constant for benzene vapor ontivated carbon is about 12 kJ nm mole−1 [12,13]. It has beenalso assumed that this parameter is in a small degree ddent on the characteristic energy of adsorption [14],
(3)Lav = 13.028− 1.53× 10⁻⁵E3.50
E0.
Next, others relations were developed since this turnpoint. The intensive investigations were done by McEna[16,20],
(4)Lav = 6.6− 1.79 ln(E0),
(5)Lav = 4.691 exp[−0.0666E0],Stoeckli and co-workers [17–19,21,22,24],
(6)Lav = 16.5
E0,
(7)Lav = 18
E0,
(8)Lav = 10.8
E0 − 11.4,
(9)Lav =(
30
E0
)+
(5705
E30
)+ 0.028E0 − 1.49,
Choma and Jaroniec [23],
(10)
Lav =(
10.416
E0
)+
(13.404
E30
)+ 0.008212E0 + 0.5114,
and Ohkubo et al. [26],
(11)Lav = 2× 10³Vmi,α
(Sc,α − Sme,α),
where the parameters are calculated from the high-resolαs -plots method (Vmi,α—the volume of micropores,Sc,α—the total specific surface area, andSme,α—the specific surface area of mesopores).
In Fig. 1 the plots of the most widespread equationsrelatingE0 and the micropore width (symbols) are shown
-
Fig. 1. The comparison of the predicted average pore diameters (using dferent empirical relations (Eqs. (2)–(10))-points) with calculated from theoretical relations proposed previously (Eqs. (13) and (14); C6H6 and N2;lines).
the typical range (found in the literature) of the characterienergy observed for carbonaceous adsorbents. All relashipsLav = f (E0) generate the decreasing hyperbolic-lfunction for the range ofE0 values shown in this figureIt can be concluded that the values ofLav evaluated baseon the various relationships are sometimes significantlyferent one from the other. Moreover, this type of relatwas usually derived from the experimental investigatThe sieve effect was studied based on the molecularsorption probe data (adsorption from gaseous phase (hebenzene, and others) and from liquid phase (methyl bcaffeine, and others)) on microporous adsorbents withferent pore structures. The latter was additionally charaized using for example HREM (high resolution electron mcroscopy), SAXS and other techniques. Fig. 1 clearly shthat there are differences between the results generated frorelationships proposed by different authors however, thwere no the attempts to elaborate the reasons causingThe authors of the current study do not question the vaity of the relations proposed by others. However, we wto underline that the main disadvantage of so far propoequations is a wrong and misleading application of thNamely, usually the values of the average pore diamof investigated adsorbents are calculated for the experimetal systems being different as those considered during

P.A. Gauden et al. / Journal of Colloid and Interface Science 273 (2004) 39–63 41
canthetheses
n ofllmi-uredate-ostthefrentbonfill-aryre-and
e rences
11,ons
ns)ob-).r
caltinede, itsiondonme-ores
))the
athsis,
de-
rsTa-ed
er
915
6
rrent
e),
nmare
ailssly.riva-l-
encere-
ear-
theouser-nar-hereef-
gherob-
derivation of the relations. Moreover, the same equationsbe used for the various adsorbates differing first of all, indiameter and with other physicochemical constants. Onother hand, it should be also pointed out that carbons posvery complicated porous structure and the assumptiosimple slit-like geometry of pores is simplification. It is weknown that there no exists the model of the structure ofcroporous carbon that can successfully explain all measexperimentally physical and chemical features of this mrial and the new models are still proposed [27]. The mimportant problem connected with the development ofrelations betweenE0 andLav is, in our opinion, the type othe microporous structure of the studied carbons. Diffeauthors used different carbons. Probably some of the carpossessed fine micropores (where the primary microporeing process occurs), others micropores where both primand secondary micropore filling occurred. Therefore, thelationships between the characteristic adsorption energythe pore diameter cannot be regarded as general, and thsons mentioned above cause, in our opinion, the differebetween the plots of the curves in Fig. 1.
On the other hand, as was shown previously [6,7,9–28–37], it is necessary to take into account (in the relatiLav = f (E0)) the parametern of the DA equation (whichhas not been considered before in this class of equatioThe significance of this parameter is the important prlem of the theory of volume filling of micropores (TVFMChen and Yang showed thatn is really a structural parameteof carbon [25,38]. Dobruskin [39], considering the physimeaning of the parameters of DA equation, noticed than
does not depend on the pore dimensions and it is determonly by the standard deviation of micropore sizes, henccharacterizes the surface heterogeneity. Similar concluwas also provided by Jagiełło and Schwarz [36], Con[40,41] as well as other authors. Summing up, this parater should be connected with the average size of micropand the micropore size distributions (MSDs).
Therefore, in order to find the relationshipsLav =f (E0, n), a procedure for linking the DA equation (Eq. (1(i.e., values of adsorption and/or relative pressure) andeffective pore diameter was proposed [7,28–34]. Horvand Kawazoe [42,43] based on thermodynamic analyapplying the potential derived by Everett and Powl [44],rived the equation [31–34,42–44]
(12)
ln(p/ps) = AHK
L − d
[BHK
(L − d/2)3− CHK
(L − d/2)9− DHK
],
whered is the sum of the diameter of an adsorbent (da) atomand an adsorbate molecule (dA) (the remaining parameteof the above equation are defined in Appendix A andble 1). Finally, the following two equations were obtain[7,29–34],
s
s
a-
.
Table 1The parameters characterizing adsorbates analyzed in the current pap(Ar, N2, CCl4, and C6H6) (the other values are given in [29,31,32])
Parameter Adsorbate
Ar N2 CCl4 C6H6
Diameter,dA 0.336 0.300 0.465 0.45Liquid density,ρ (g/cm3) 1.465 0.808 1.565 0.86Temperature,T (K) 77.50 77.50 308.00 313.1Affinity coefficient, β 0.31 0.32 1.06 1.00T /β (K) 250 242 290 310AHK 77.911 62.380 51.918 34.98
Table 2The parameters of Eq. (13) for different adsorbates analyzed in the cupaper
Parameter Adsorbate
Ar N2 CCl4 C6H6
a1(all) 0.7864 0.7775 0.8206 0.8951b1(all) −6.5449 −9.5761 −14.0445 −15.0715c1(all) 2.1878 2.1227 2.5580 2.6875a2(all) 79.6156 53.7290 53.3734 39.7903b2(all) −27.2554 −13.8278 −18.2474 −14.3832c2(all) 4.0201 1.7692 2.6748 2.1493
Lav(all)
dA
= a1(all)
1+ b1(all) exp[−c1(all)n](13)+ a2(all) + b2(all) × n + c2(all)n
2
E0,
not only for the micropore diameters (called the first rangand [27–32]
Lav(mic)
dA
=(
a1(mic)n
b1(mic) + n
)(a2(mic)n
b2(mic) + n
)E0
(14)× E
( a3(mic)nb3(mic)+n
)0
for calculations up to effective diameter equal to 2(called the second range). The values of parametersgiven in Tables 2 and 3 [7,29–32]. The additional detof all above-mentioned calculations were given previou[7,28–32]; therefore they are omitted in the current studyTaking into account the assumptions made during the detion of Eq. (12), the main condition, which should be fufilled for the chosen molecules of adsorbates, is the absof a dipole moment and a spherical-like structure. Thefore, we chose N2, Ar, CCl4, and C6H6. For some of theseadsorbates the Horvath–Kawazoe method was adoptedlier, for example, for N2 [42,43], Ar [45] and/or C6H6 [46].Moreover, these adsorbates have been widely applied ininvestigation of the structural heterogeneity of microporcarbons. However, the choice of nitrogen at its liquid tempature as the probe molecule may not be suitable for veryrow pores such as those in carbon molecular sieves, wthe activated diffusion effects might be important. Thesefects can be reduced by conducting the experiment at hitemperatures. It is thus useful to investigate the MSD

42 P.A. Gauden et al. / Journal of Colloid and Interface Science 273 (2004) 39–63
Table 3The parameters of Eq. (14) for different adsorbates analyzed in the current paper
Parameter Adsorbate
Ar N2 CCl4 C6H6
a1(mic) 15.9173 24.1672 11.9839 18.3776b1(mic) 1.5868 2.2709 1.5805 3.2093a2(mic) 0.9839 0.9960 0.9916 1.01b2(mic) −2× 10⁻² −1.29× 10⁻² −1.86× 10⁻² −8.92× 10⁻⁴
a3(mic) −0.5259 −0.8586 −0.5657 −1.0718b3(mic) 0.8743 1.2266 0.8047 2.1161
a-K,esose
esty ofem-fora-rs ins o
m-ed i
rage
d efthees)
thethatthece-en-ulard us
ostion
of
andad-umeim-notap-
35],oint
thect
tomad-to
msen-DAoge-eousce ofpore-thetion
lta-
ationin
theeiroushosei.e.,tionntethat
ainlectofofons.rsthe-
orp-a-omar-63],lues
cula-d, askers
tained from adsorption of different adsorbates at temperture other than the boiling point of nitrogen at ca. 77.5for example at near-ambient temperatures. The temperaturchosen in the calculation were equal or very close to thapplied in measurements where the investigated adsorbatare used for the determination of structural heterogeneicarbons. The temperature was equal to liquid nitrogen tperature for N2 and Ar adsorption, to room temperatureC6H6 and CCl4 (liquid density at the temperature of mesurement was used in the calculation of the parameteEq. (12)). These temperatures as well as the final valueconstantsAHK are given in Table 1 (the other physicocheical constants of the adsorbent and the adsorbates, uscalculations of Eq. (12), and the final values ofBHK, CHK,andDHK can be found in [7,29–32]).
Summing up, all the above results show that the avepore diameter is a function not only ofE0 but also ofn.Then, using Eqs. (13) and/or (14), the average reducefective diameter can be calculated and multiplied byadsorbate diameter (Table 1). The typical plots (the linfor chosen adsorbates (C6H6 and N2) and values ofn (1.50and 3.25) are compared with relationships proposed byother authors (points) in Fig. 1. It should be pointed outthe shape of this curves is similar to that observed forempirical and/or semi-empirical relationships. This produre was also applied previously [7,29–31,33] to experimtal data of adsorption on different carbonaceous molecsieves. The correlation between suggested and calculateing Eqs. (13) and (14) pore diameters is very good.
On the other hand, we recently tried to answer the mgeneral questions:What kind of PSD assumes DA equatitself? Does this distribution change if the parametersthe DA isotherm change (especiallyn) [35]. A partial an-swer to this problem has recently been given by Ohbaco-workers [47,48]. They studied the simulated nitrogensorption isotherms in heterogeneous carbons and assGaussian distribution of pores. It was shown that the sulated isotherms can be fitted by typical DR, althoughin the whole range of relative pressures. The interestingproach of Ohba and co-workers [47,48] was extended [and the problem was investigated from the opposite pof view. Two groups of low-temperature (T = 77.5 K) N2
adsorption isotherms were generated [35]. We studiedinfluence ofn at constantE0 and, to the contrary, the effe
f
n
-
-
d
of E0 at constantn. The obtained curves were converted inhigh-resolutionαs -plots in order to explain the mechanisof adsorption. Moreover, the new algorithm (called thesorption stochastic algorithm (ASA)) [49–53] was usedsolve the problem of fitting the local adsorption isotherof the Nguyen and Do method [51,54–56] to experimtal data [49–56]. The obtained results show that theequation generates isotherms describing almost a homneous structure of pores and/or a bimodal heterogenstructure [35]. Corresponding PSDs indicate the presenhomogeneous porosity, primary and/or secondary microfilling, or both. The parametern of the DA equation is responsible not only for the homogeneity of pores (i.e.,deviation of pores from average size) but for the adsorpmechanism in micropores. In other words, loweringn leadsto the change in this mechanism from primary to simuneous primary and secondarymicropore filling. Taking allobtained results into account suggests that the DA equis probably the most universal description of adsorptionmicropores.
All theoretical models (as, for example, considered incurrent study: HK, ND, and DFT) are connected with thown specific assumptions of the description of the porstructure and/or mechanism of adsorption. Of course, tpostulations can significantly influence obtained results,PSD curves. The modeling of local and/or global adsorpisotherms for different pore widths using DFT theory, MoCarlo simulations, and the ND model leads to resultsshould be, for some cases, treated with caution. The msimplifications of those theories are, for example, the negof the pore connectivity, ignoring of different thicknesscarbon microcystallites forming micropores, or existencevarious surface groups on the surface of activated carbMoreover, it is very difficult to find papers where authoobtained satisfactory results (using the above-mentionedories) describing simultaneously the experimental adstion isotherm, adsorption enthalpy, and entropy (or heat cpacity) for adsorption in microporous carbons around rotemperature. Although all simulation and modeling of cbons is very interesting and sometimes spectacular [57–it should be remembered that small changes in the vaof fundamental parameters taken as constants in caltions can lead to drastic changes in the results obtaineshown in the important papers by McEnaney and co-wor

P.A. Gauden et al. / Journal of Colloid and Interface Science 273 (2004) 39–63 43
hisfac-. Itthe
imes-acef th
cti-lexthe
ultstureand-aretheodoritof, asoc-
hod,ka,
Dsitiv-th-
thejectby0].ionu-
-oretionole-the-erys ofal-ptsim-
umob-thatteri-rialseth-im-of
ica-n
notm-ur
ate-be-[59],
[64] and others [65,66]. In our opinion the results of ttype of the calculation are speculative as long as a satistory model of the structure of carbons is not evaluatedshould be pointed out that very complicated models ofstructure of a microporous activated carbon are sometconsidered in some advanced numerical and simulation calculations (for example, the RMC method, where the surfsites have been added at random points on the edges ographene microcrystals characterizing by differing size andshape [60]) in order to describe the “real” structure of avated carbons. However, taking into account this compstructure is connected with considerable extension oftime of calculations. On the other hand, very puzzling resare obtained from the description of the micropore strucof various carbonaceous materials (the different originthermal (or chemical) treatment)) for the reason that the differences between the micropore size distribution plotsinsignificant. For example, Ismadji and Bhatia publishedresults of microporosity determination from DFT methfor three carbons, Filtrasorb-400, Norit ROW 0.8, and NROX 0.8 (Fig. 3 [67] and/or Fig. 2 [68]). The numberpeaks on PSD curves and the ranges of their locationwell as the shapes, are very similar. The same situationcurs often for other carbons (for example, the DFT metleads to very similar results for carbon D43/1 (Carbo-TechEssen, Germany) as for carbons WD and AHD (HajnówPoland) (Fig. 11 [52])). In our opinion this behavior of PSis very surprising and can be caused by the low sensity and the simplifications of the mentioned above meods.
On the other hand, the most important limitations ofHorvath–Kawazoe model (this method is the leading subof our current study) are widely described, for exampleDombrowski and co-workers [69] and Rege and Yang [7The main restrictions are the following: the overestimatof the filling pressures relative to DFT and molecular simlation results, incorrect adsorbate pair interaction, “unstructured” local density profiles, assuming one-stage micropfilling, and equating the free-energy change upon adsorpto the average interaction energy of the adsorbing mcules. Summing up, the HK method and the potentialory of adsorption have limitations, although they are vpopular. Their foundation are questionable on the basitheoretical studies involving density functional theory cculations and computer simulations [59]. There are attemto improve the HK method and success was achieved inproving the relation between the pore width and equilibripressure [25,38,69–72]. Surprising results were recentlyserved by Jaroniec and co-workers [73]. They showedthe HK method can be successfully used for the characzation of ordered mesoporous silicas and related mateMoreover, some authors stated that the HK and DFT mods of pore size distribution determination lead to very silar results [7,30,31,72,74], and that confirms the validitythe assumptions of the HK method as well as its applbility to the determination of microporosity of carbons. O
e
.
Fig. 2. Adsorption isotherms of Ar, N2, CCl4, and C6H6 on activated car-bon: A (open symbols) and B (closed symbols).
the other hand, others suggested that the HK method iseffective for highly microporous carbons and a further iprovement of this method is required [62,75–77]. In oopinion, the results of the scientific reports lead to the stment that for some microporous carbons the similaritytween both methods exists. Valladares and co-workers

44 P.A. Gauden et al. / Journal of Colloid and Interface Science 273 (2004) 39–63
terr-—thed:
he
e va-orepar-nts
tiga-nts
nec-cel-m-
atetheon-ed
etersl-ndre-nalthe
very[30]m-themi-the
ere-tooltantros-
re-ar-
olidsdand
sor-nd/or
ept
r-y—id-fjaxeousour
ofex-ane,iox-ertyd
sor-rent
Fig. 3. (a) The general relationships between effective pore diame(L−da ) and relative pressure (p/ps ) for adsorption of four analyzed adsobates; open symbols—the Horvath and Kawazoe theory; closed onesNguyen and Do method (for CCl4 the following parameters were adopteσff = 0.3305 (nm) [85];εff = 118.05 (K) [85]; γ = 0.0132 (N/m) [97];ν = 2.727 × 10⁻⁵ (m3/mol) [98]; CBET = 97.80 [99] and for Ar:σff = 0.5140 (nm) [100];εff = 366.00 (K) [100];γ = 0.02488 (N/m) [97];ν = 9.830× 10⁻⁵ (m3/mol) [98]; CBET = 59.32 [101]. (b) The influenceof adsorbate size (diameter,dA) on the plots presented in Fig. 3a. Tpore-width is replaced by “reduced” effective variables ((L − da)/dA).
based on molecular simulation methods, showed, that thlidity of the results of HK method depends on the micropstructure of studied carbon. More reliable results (coming to DFT) are obtained for strictly microporous adsorbe[7,30,31].
Therefore, it can be concluded that systematic investion of the pore structure of the wide class of adsorbecharacterized by the various type of heterogeneity isessary. Nine microporous carbon films obtained fromlulose by Zawadzki and co-workers [78] (and next cheically modified) were investigated previously to evalutheir porosity [30]. Similarity was observed betweenresults obtained by the DFT and HK methods, and this cfirms the results of Valladares et al. [59]. It was concludthat a good correlation occurs between the pore diamobtained from DFT analysis (for N2 adsorption), those caculated from C6H6 calorimetry data using the Everett aPowl potential [44], and those calculated applying thecently developed equation (Eqs. (13) and (14)). The firesults show that in the structure of these adsorbentsmajority of micropores possess the same diameter (anarrow distribution of pores). Summing up, past studieswere limited to adsorption of nitrogen (77.5 K—nine saples altogether) and benzene (313 K—for one sampleisotherm and adsorption enthalpy was measured) oncroporous carbons with homogeneous porosity where“primary micropore filling” occurs. In our opinion, theHorvath and Kawazoe method is very simple, and thfore it can be applied in the current study as a usefulto show different aspects connected with the imporand complicated problem of the characterization of poity.
The next unsolved problem (due to the difference insults met in the literature—for example [79–85]) of the chacterization of the heterogeneous pore structure of s(carbonaceous materials, especially) is the analysis baseon the isotherms of several simple adsorbates. JagiełłoSchwarz [79] stated that for the series of different adbates and the same adsorbent (activated carbon G210 amolecular sieving carbon MSC-5A) “it is seen that excfor CO2 all other adsorbates (N2, CH4, C2H4, and C2H6)give practically overlapping functions MSDs.” This diffeence was explained by these authors in the following wathe CO2 molecule has to be “thinner” than other consered molecules. Wang and Do [80], for characterization othe micropore-size distribution of activated carbons (Aand/or Nuxit), presented an approach using simultantheoretical description of multiple-temperature (three or ffor the individual adsorbent) experimental isotherm datamany adsorbates (eight for the individual adsorbate; forample, for Ajax activated carbon, methane, ethane, propbutane, benzene, toluene, carbon dioxide, and sulfur dide). In this case the MSD is treated as an intrinsic propof the activated carbon (independent of an adsorbate) anthe sole source of heterogeneity in spite of different adbates having access to different pore size ranges (diffe

P.A. Gauden et al. / Journal of Colloid and Interface Science 273 (2004) 39–63 45
tiont dif
79],ar-
ions
82])),intp-es,-ifeorp-ndrend,21
arekSDredtheytheaccuK).PSDea-per-ifeSDellted
car-n
car-(Natineea-thetoificandthemsoleed
ua-nts)ribu-
rmsove-rop-
leadten-
ad-ithous)].
tseen
edultsmthee-
and
ro-omisn-icce-cter-
re-010),
car-bones-ionion)re ofper-the89]er-e-
bedal-nonin
molecular sizes). On the other hand, in the same situaas considered above, some authors observed significanferences in MSDs—for example, Jagiełło and Schwarz [who compared the micropore-size distribution of two cbons (G and/or M) calculated from CF4 and SF6 adsorptiondata. The differences between micropore size distributwere also reported by Trznadel andSwiatkowski (Horvath–Kawazoe method; adsorbates: N2, Ar, and C6H6; adsorbent:granulated A-type activatedcarbon [81]), Dombrowski andco-workers (DFT method; adsorbates: N2 and Ar, adsor-bent: two activated carbons, Saran and/or coconut char [Nguyen and Do (adsorbates: N2, C6H6 (three temperaturesadsorbent: Ajax and/or ACF [83]). We agree with the poof view of Nguyen and Do, who try to explain these discreancies in the following way: “(they are caused by) differencin the experimental temperatures and molecular propertiesuch as molecular dimension,molecule–molecule interaction energy, etc.” Interesting results were presented by Scaand co-workers [84]. A set of measurements of gas adstion (nitrogen (77 K), methane (293.1 K), argon (77 K), acarbon dioxide (293.1 K)) of a single sample of AX21 weinvestigated based on DFT. Scaife and co-workers foufor example, that the pore structures predicted for AXusing nitrogen at 77 K and carbon dioxide at 293.1 Kquite different, CO2 showing a unimodal micropore peanot seen at 77 K by nitrogen or argon. Moreover, the Pfor carbon dioxide was shifted to smaller pores compawith other adsorbates. On the basis of those studiesrecommended CO2 as the adsorbate for characterizingpore structure of carbonaceous adsorbents (is a morerate probe of micropore structure than nitrogen at 77Moreover, they suggested that the change of apparentcould be monitored by performing a series of isotherm msurements form high (equal and higher than room temature) to low temperatures. It is very important that Scaand co-workers [84] stated that the accuracy of the Pcould be improved by fitting to isosteric enthalpies as was the adsorption isotherm. Ravikovitch et al. [85] presenan approach to PSD characterization of microporousbonaceous materials such asactivated carbon and carbofibers based on nonlocal DFT for nitrogen, argon, andbon dioxide adsorption at standard temperatures (77 K2and Ar) and 273 K (CO2)). The authors suggested thfrequently observed disagreement between PSDs obtafrom adsorption isotherms of different gases and those msured at different temperatures was mostly attributed toshortcomings of the slit-like pore model, in particularthe molecular sieving and networking effects and specadsorbate–adsorbent interactions. However, Ravikovitchco-workers [85] believe that possible inconsistencies inpore size distributions calculated from different isothermay be caused by the choice of the parameters for intermcular interactions and also by the solution of the ill-posproblem of deconvolution of the integral adsorption eqtion. They always observed (for all analyzed adsorbea good agreement between nitrogen and argon dist
-
,
-
d
-
tions. PSD curves calculated from carbon dioxide isothewere in good agreement with those evaluated for the abmentioned adsorbates only for ultramicropores and micores narrower than ca. 1 nm.
Summing up, the results presented in this sectionto the statement that for microporous carbons the exsive investigation should be still continued. Therefore, inthe present paper we try to extend the analysis on thesorption on two strictly microporous activated carbons wwider dispersion of pores (i.e., being more heterogenecomparing with the mentioned carbonaceous films [30Moreover, the influence of the diameter of adsorbates (dA)and the temperature (T ) of the adsorption measuremenis analyzed in order to explain the differences betwcalculated values of the average diameters (Lav) and theplots of the micropore-size distributions (MSDs) determinfrom adsorption data of different adsorbates. The resof the HK method [42,43] are compared with those frothe Nguyen–Do and DFT methods (they are treated asreference methods) [53,54,86], from adsorption calorimtry [87–90], and from the method proposed by EverettPowl [44].
2. Experimental
The adsorption sieving properties of two ashless micporous polymeric carbons (called A and B) obtained frpolyfurfuryl alcohol [87,88,91,92] are investigated in thstudy. The initial carbon (A) with a negligibly small concetration of oxygen functionalities, was oxidized with nitrconc. acid at 353 K for 2 h (carbon B). The detailed produre of carbon preparation and the carbon surface charaistics were given previously [87,88,91,92].
Nitrogen and argon adsorption isotherms at 77.5 K, psented in this paper, were determined using the ASAP 2MicroPore System (Micromeritics, Norcross, GA, USAan automatic volumetric adsorption apparatus. Bothbons were desorbed for three hours in a flow of He, carA at 573 K, and carbon B at 493 K (a constant prsure of ca. 10−5 Pa was obtained). Benzene adsorptisotherms (and the corresponding enthalpy of adsorptwere measured on carbons A and B at the temperatu313 K (for carbon tetrachloride the measurements wereformed at 308 K). Isotherms were determined usingvolumetric apparatus described by Kiselev and Dreving [with Baratron pressure transducers (MKS Instruments, Gmany). The differential enthalpy of adsorption was dtermined using a Tian–Calvet microcalorimeter descripreviously [87,88,91,92]. During the calculation the vues of liquid density (ρ) and the pressure of saturatio(ps ) collected in Table 1 were applied. The comparisof the experimental adsorption isotherm data is givenFig. 2.

46 P.A. Gauden et al. / Journal of Colloid and Interface Science 273 (2004) 39–63
re-
.ew
bedpro-Thisonshortter-
ticalna-umtedces
imitAs
pre-ticedi-l-sn
ns.rForres(in-the
arlo5].pa-
u-decss.her
cro-ryltsac-
tive
f
ermseheein
-rents noter-
ed in
3. Results and discussion
3.1. The influence of the temperature and the adsorbatediameter on the micropore-size distributions—the HKmethod
The starting point of our current consideration are thesults of the calculation of the relative pressure (p/ps ) versusmicropore effective width (L − da) for Ar, N2, CCl4, andC6H6 based on Eq. (12) and values of parameterAHK col-lected in Table 1 andBHK − DHK taken from [7,29–32]In order to determine the pore-size distribution, the nDHK (determining Horvath–Kawazoe) procedure descrirecently [33,34] was applied. The standard bisectioncedure is used as a kernel in the proposed algorithm.method gives stable results for most of non-linear functiand the computation takes a very short period of time (srange of changes in the micropore widths, which are demined). Fig. 3a (open symbols) shows the final theoreresults of the calculations obtained for adsorption of alyzed adsorbates in slit-like pores [32–34]. The maximvalue of the effective pore-width on Figs. 3–5 is restricto 2 nm in order to provide the readers with some nuanof the analyzed plots. Moreover, this value is the upper lof micropore diameters recommended by IUPAC [93].shown in Fig. 3a, the relative location of (L − da) vs (p/ps )is connected with the type of adsorbate, but all curvessented in this figure have the same shape. It can be nothat the adsorbates fill the pores with arbitrarily chosenameter (with increasing relative pressure values) in the folowing order: Ar, CCl4, N2, and C6H6. This sequence doenot depend on the parameterAHK of the master equatio(Eq. (12)). The curves for Ar and CCl4 as well as N2 andC6H6 converge for the finer range of micropore dimensioOn the other hand, for CCl4 and N2 the curves coincide fopore widths close to 2 nm, as can be seen in Fig. 3a.the wider pores than presented in this figure (mesopothese plots predict similar values of the relative pressurecreasing to unity) as obtained from the Kelvin equation,BJH method, DFT simulation, Gibbs ensemble Monte Cmolecular simulation, and other methods [54,57,69,94,9
It is obvious that the values of the physicochemicalrameters can influence the obtained curves of (L − da) vs(p/ps ) presented in Fig. 3a. It is very difficult unambigous state at the moment which the parameters have asive effect on the obtained results because the parameterAHK−DHK (Eq. (12)) are the functions of many variableEach atom or molecule of the adsorbates consideredis characterized by the different diameter,dA (Table 1) andtherefore they possess different accessibility to the mipore structure of the analyzedadsorbents. It seems veprobable thatdA has a significant influence on the resupresented in Fig. 3. To take the type of adsorbate intocount these plots are converted into “reduced” effecwidth plots of the function ln(p/ps) = f ((L − da)/dA)—Fig. 3b (open symbols). This recalculation (application o
d
)
i-
e
Fig. 4. (a) The influence of the type of adsorbate on the adsorption isothgenerated based on the Dubinin–Astakhov equation (Eq. (1)) applying thparameters (β and T ) collected in Table 1. (b) The comparison of trelationshipsΘ vs ((L − da)/dA) for all analyzed adsorbates (only thHK model is analyzed). Plots are obtained from the data presentedFigs. 3b and 4a.
the reduced variable) standardizes the description of the adsorption process and it will be used a few times in the curpaper. As a result, the shape of the analyzed curves doechange but this figure is more legible. The effect of tempature on the filling pressure of pores can also be observ

P.A. Gauden et al. / Journal of Colloid and Interface Science 273 (2004) 39–63 47
ly.
Fig. 5. The influence of the type of adsorbate on the micropore size-distribution plotted as a function of the effective micropore width (or the reducedeffectivemicropore width) for characteristic energy,E0, equal to 25 kJ/mol and parameter of the DA equationn = 2.5, based on the HK and ND models, respectiveatas fo
tioncedata
d-n thhe
e at
istic),n,
--g toe). 2.ity
ted
1))
ered
ithled
us,by
ure
u-
e-. Inalu-
this figure. In general, for a pore of a given ((L − da)/dA),the lower the temperature (Ar and N2), the sooner pore fill-ing occurs (in terms of relative pressure). In contrast to dpresented in Fig. 3a, here, the sequence of adsorbatefixed reduced pore widths is Ar, N2, CCl4, and C6H6 and itis the same as obtained for the parameterAHK (Table 1) ofthe master equation (Eq. (12)). Furthermore, in this situathe curves do not coincide in the low range of the reduslit-widths, but for wider pores, as can be observed for dpresented in Fig. 3a.
In the next figure (Fig. 4a) the influence of the type of asorbate on the adsorption isotherms generated based oDubinin–Astakhov equation (Eq. (1)) is shown (during tcalculation the values ofβ andT collected in Table 1 wereapplied). Adsorption isotherms are presented in this figurrelative pressure from 1× 10⁻¹¹ up to 1p/ps and they aregenerated for arbitrarily chosen values of the characterenergy of adsorption (the same for all analyzed adsorbatesE0 = 25 kJ/mol, and the exponent of the DA equation = 2.5 (obviously the assumption of the sameE0 value forall the adsorbates simplified the considerations—the influence of the temperature and theaffinity coefficient is emphasized). All generated isotherms, shown in Fig. 4a, belon1st type of IUPAC classification [93] (i.e., Langmuir-typas it is also observed for experimental data shown in FigAs it turned out, the ratio of the temperature to the affin
r
e
coefficient,T/β has the main influence of plots presenin this figure (the same values ofE0 andn). In order to ex-plain this situation the Dubinin–Astakhov equation (Eq. (is converted to the following form:
(15)
Θ = exp
[−
(Apot
βE0
)n]
= exp
[−
(T
β
)n(R ln(ps/p)
E0
)n].
The values of the ratio (T/β) are shown in Table 1—thhighest one is obtained for C6H6 (310 K) and the lowest foN2 (242 K). A general tendency in Fig. 4a is that for a fixvalue of the degree of pore filling (Θ), p/ps decreases with(T/β). In the other words, for two microporous solids wdifferent values of analyzed ratio, the same fraction of filmicropores occurs at a lower value ofp/ps for a solid witha higher ratio of temperature to the affinity coefficient. Thin this situation the location of curves is determined againthe parameter characterizing adsorbate and the temperatof the adsorption process.
In order to obtain the differential micropore-size distribtion, the relationship between the adsorption,W (or relativeadsorption,Θ = (W/W0)) and arbitrarily chosen paramter characterizing the micropore size, should be knownthe current paper, micropore size distributions are evated based on (J (L − da) = dΘ/d(L − da)). For exam-ple, knowing the adsorption isotherm data (Θ vs p/ps—

48 P.A. Gauden et al. / Journal of Colloid and Interface Science 273 (2004) 39–63
rela-tionar-
preawnef-
cter
sf thee5b)s. 5
en-theal-
asedell-
ofvs
Ac-nte
v-thener-
ua-t
ob-))-andordexpo-tes,
nessforsfol-
,
thedthetimef the
eri-
lled
-
Fig. 4a) and assuming the relationship between thetive pressure and pore width (Fig. 3b), the wanted funcΘ = f (L − da) is very easy to obtain. Thus, the compison of relationshipsΘ vs ((L − da)/dA) for all analyzedadsorbates is shown in Fig. 4b based on the resultssented in Figs. 3b and 4a. The main conclusion drfrom the results shown in this figure is the decisivefect of function the(ln(p/ps) = f ((L − da)/dA)) on thecalculated MSDs while the fixed values ofE0 and n areassumed. In the other words, the shape of MSDs charaized by the maximum value of functionJ (L − da) relatedto (L − da)p,max (or ((L − da)/dA)p,max), is determined toa larger extent by(ln(p/ps) = f ((L − da)/dA)) than by(Θ = f ((L − da)/dA)) due to similarity of the sequenceof curves observed in Figs. 3b and 4b. The sequence ovalue of((L − da)/dA)p,max related to the maximum valuof J (L − da) for the various adsorbates (Figs. 5a andis the same as the sequence of curves presented in Figand 5d.
The influence of the type of adsorbate on the differtial micropore size distribution, plotted as a function ofeffective and reduced effective micropore width, for the vues of the characteristic energyE0, equal to 25 kJ/mol andparameter of the DA equation,n = 2.5 are shown in Figs. 5and 5b. A simple numerical differentiation procedure is u[31,33,34,53,96]. The MSD plots are the asymmetrical bshaped function possessing two points of inflexion.
In order to achieve the same PSDs(J (L − da) = dΘ/
d(L − da)) for different adsorbates the identical plotsthe relationship between the degree of micropore fillingeffective pore diameter (or pore diameter) should exist.cording to Eqs. (1) and (12), each isotherm can be preseas the functionΘ = f (L) (see also Fig. 4b). Next, the deriative can easily be calculated numerically. Therefore,low-temperature nitrogen adsorption isotherms were geated at relative pressures from 1× 10⁻⁷ up to 1 for arbi-trarily chosen values of both parameters of the DA eqtion (i.e., the first set (E0 = 24.86 kJ/mol and exponenn = 2.54) and the second one (E0 = 24.41 kJ/mol and ex-ponentn = 2.39)). Summing up, these parameters aretained from the fitting of the theoretical model (Eq. (1to the experimental N2 isotherms for carbon A and B, respectively (investigated in the current study (see Fig. 2Table 1)). These data are treated as the reference. Into obtain the values of the characteristic energy and enent of the DA equation for the remaining three adsorbathe nonlinear fitting procedure is used again. The goodof the fit of the theoretical model (Eqs. (1) and (12))Ar, CCl4, and C6H6 to the reference N2 adsorption data iexpressed by the determination coefficient (DC). Thelowing results are obtained: for carbon A, Ar (E0 = 36.76kJ/mol, n = 2.46, and DC= 0.9999), CCl4 (E0 = 42.11kJ/mol, n = 2.58, and DC= 0.9938), and C6H6 (E0 =30.43 kJ/mol, n = 2.50, and DC= 0.9963); for carbon BAr (E0 = 36.07 kJ/mol, n = 2.31, and DC= 0.9999), CCl4(E0 = 41.48 kJ/mol, n = 2.38, and DC= 0.9944), and
-
-
c
d
r
Fig. 6. Pore size distributions for studied activated carbons obtained onbasis of the Nguyen and Do method,DFT theory, and the Horvath anKawazoe method (only the range of micropores is shown). Additionallytotal pore-size distribution from DFT method is presented a secondseparately in the smaller figures—the arrow denotes the upper limit owidths of micropores.
C6H6 (E0 = 29.94 kJ/mol, n = 2.32, and DC= 0.9967).The final conclusions and the comparison with the expmental data will be given below.
3.2. The influence of the temperature and the adsorbatediameter on the micropore-size distributions—the NDmethod with the ASA algorithm
In Fig. 3 we also show a comparison of the so-camaster curves (i.e., pore filling pressure,p/ps , vs effectivepore diameter, (L − da), or “reduced” effective pore diame

P.A. Gauden et al. / Journal of Colloid and Interface Science 273 (2004) 39–63 49
eA)
heodof
ds to]. Inthesim-s oob-ultsThe
-ouldrs isrtu-eter
theua-tedtede-
sede-
s of.
orp-. 2)dif-
e 4)eri-nottion
rs is
s are-
herDA
pro-ters
ineddther-udy,res
an
imum
DFTr-
s
thismi-
(atTe-
lue
par-ri-
romn-))
sorp-wer
ter,(L−da)/dA)), generated from the Nguyen–Do (with thpreviously proposed adsorption stochastic algorithm (ASfor the solution of linear Fredholm integral equation of tfirst kind [53]). It should be pointed out that the ND methwas shown to be applicable for determination of porositycarbonaceous materials, and as shown previously, leapractically the same results as the DFT method [50,51the current paper this method is adopted probably forfirst time for adsorption data of CCl4. For other adsorbatethe parameters can be found elsewhere [54,95]. It is veryportant that Figs. 3a and 3b show that similar sequencepore filling pressure vs effective pore diameter curvestained from ND and HK methods, and the shift of the resof the ND method to larger pore diameters is observed.only difference is for the curves shown in Fig. 3a for N2 andCCl4, and this is caused by the differences in molecular diameters taken for calculations in the both methods (it shbe stated that idea of the values of particular parametetreated optionally and freely by some authors and, unfonately, one can find different values of the same paramin the literature).
Fig. 5 shows the pore size distributions obtained fromND method for the same values of parameters of DA eqtion as for analysis of the HK model (the results presenin the same figure). The pore-size distributions calculaform the Nguyen–Do method shift to larger pore diamters in comparison with the HK model (and this is cauby the difference of the pore filling pressure vs pore diamter curves shown in Fig. 3). However, similar sequencecurve connected with both types of theories is observed
3.3. The experimental verification of theoreticalconsiderations
3.3.1. Pore size distributions—the low-temperaturenitrogen adsorption data analysis
Based on the results of low-temperature nitrogen adstion isotherms (they are shown among other things in Figthe structure of carbons A and B was characterized usingferent methods (the obtained results are collected in TablSome of them were applied previously for the charactzation of carbonaceous films [30]. Therefore, they aredescribed in the current studies and the detailed descripcan be found in [30]. However, the meaning of parametepresented in Appendix A.
We have recently underlined [30,53,74] that there iproblem connected with the comparative analysis of thesults of DFT method with those obtained from the otones, especially from the methods based on DR and/orequation. The reason is that the empirical equationsposed for the calculation of the average micropore diamecorrelate the characteristic energy of adsorption, obtamainly from DR equation (see below) with the average wiof the slit. The best fit of DR and/or DA equation to expimental data of adsorption, discussed in the current stwas obtained for the data measured up to the relative p
f
.
-
Table 4Structural data of two carbons, A and B (nitrogen was applied asadsorbate)—the meaning of parameters are presented in Appendix A
Carbon A B
Surface areas (m2/g)SBET 823.9 852.3
SDR 987.9 914.5
SDA 882.7 823.3
SmicroDFT 697.9 907.6
SmesoDFT 5.2 9.8
SDFT 703.1 917.4
Sc,α 994.5 958.0
Sme,α 24.4 21.9
Pore volumes (cm3/g)W0DR 0.426 (83.3%)a 0.404 (79.0%)a
W0DA 0.416 (81.3%)a 0.413 (82.6%)a
V microDFT,I 0.190 (51.2%)b 0.248 (59.2%)b
V microDFT 0.290 (78.2%)b 0.340 (81.1%)b
V mesoDFT 0.081 0.078
VDFT 0.371 0.419
VHK 0.416 0.408
Vmi,α 0.408 0.408
Micropore average diameters (nm)c
Lav,DFT,I (L <∼ 1) 0.702 0.652Lav,DFT,II (∼ 1< L <∼ 2) 1.371 1.362Lav,DFT,tot (L <∼ 2) 0.848 0.846Lav,ND,I (L <∼ 1) 0.690 0.674Lav,ND,II (∼ 1< L <∼ 2) 1.454 1.516Lav,ND,tot (L <∼ 2) 0.890 0.923
a For the total micropore volumeW0DR/0DA (Dubinin–Astakhov (DA)(Eq. (1) and/or Dubinin–Radushkevich (DR) (Eq. (1),n = 2) equations)the percentage contributions are evaluated for the reference—the maxnitrogen adsorption atp/ps ≈ 1.
b The same procedure as for the potential theory is applied for themethod (in this case the reference is the total volume of micropores detemined from the largest value of the cumulative pore size distribution).
c The average pore diameters obtained for three groups of micropore((L <∼ 1); (∼ 1 < L <∼ 2); and (L <∼ 2)) based onJ(L − da)DFT andJ(L − da)ND.
sure ca. 0.1 (Table 5). There are the following reasons ofchoice. The percentage contribution of the volume ofcropores evaluated from DA or DR equations ((W0DA/0DR),divided by the maximum value of adsorption of nitrogenp/ps ≈ 1)) are similar to those calculated from the DFmethod ((the total volume of the micropores with diamters smaller and/or equal to 2 nm,V micro
DFT ), divided by thetotal volume of micropores determined from the upper vaof the cumulative pore size distribution,VDFT)—see the re-sults collected in Table 4. On the other hand, the comison of the values of the ratio of the volume of the pmary micropores to the total pore volumes determined fDFT (V micro
DFT,I/VDFT,tot) with those calculated from the potetial theory equations (the Dubinin–Astakhov (DA) (Eq. (1and/or Dubinin–Radushkevich (DR) (Eq. (1),n = 2)), leadsthe statement that the same values are obtained if the adtion isotherms are analyzed by this theory in the range lo

50 P.A. Gauden et al. / Journal of Colloid and Interface Science 273 (2004) 39–63
4340
8303
2970
6061
rs
Table 5Parameters of the Dubinin–Astakhov (DA) (Eq. (1)) and the Dubinin–Radushkevich (DA) (Eq. (1),n = 2) equations
Carbon DA—Eq. (1) DR—Eq. (1),n = 2
E0DA nDA W0DA DCDA E0DR W0DR DCDR(kJ/mol) (cm3/g) (kJ/mol) (cm3/g)
ArA 18.91 3.065 0.357 0.9941 17.64 0.419 0.97B 18.39 2.698 0.347 0.9941 17.50 0.391 0.98
N2A 24.86 2.535 0.401 0.9941 24.48 0.426 0.98B 24.41 2.386 0.395 0.9931 24.22 0.413 0.99
CCl4A 21.94 2.335 0.323 0.9862 22.14 0.335 0.98B 16.80 4.583 0.324 0.9854 18.93 0.370 0.91
C6H6A 18.32 4.823 0.364 0.9947 16.39 0.468 0.92B 19.08 4.122 0.390 0.9958 16.98 0.496 0.94
Note.These equations were fitted to the range of adsorption which takes place inthe pores where micropore filling and cooperative swings mechanism occu(relative pressure less than 0.1p/ps ); i.e., all micropores were considered).
llyrlier
meorurege
2],cro-
p-eptionsentt for
thelateom-atednu-di-
e14))ame
alFT
reasox-
theida-flu-thei-
sultOn
sfacemer-ated,
for-
er-
thatg. 6).woand
s di-
4 thecture-dth]. It
) tondualre-olidsvedero-te-
ekoled
than 0.002p/ps . In the case of adsorption in practicahomogeneous microporous structure (as for studied eacarbonaceous films [30]) the contribution of the voluof primary microporesV micro
DFT,I was almost the same as fW0DR/0DA. Therefore, the homogeneity of the pore structis the key factor and following the mechanism of multistamicropore filling published by Kakei and co-workers [10in the studied carbons the primary and secondary mipore filling occur in the range up to ca. 0.1p/ps of theadsorption isotherm. This means that the average microore diameters, obtained usingE0 values calculated for thosranges of adsorption isotherms, characterize the adsorprocess occurring only in the part of the micropores prein the system. Therefore, it should be emphasized thaheterogeneous microporous structures (as occurring instudied carbons) the values of the pore diameters calcuon the basis of this fragment of the isotherm should be cpared only with the total average pore diameters calculusing the density functional method or other advancedmerical methods. Summing up, the average microporeameters were calculated usingthe results of the most widspread equations shown above (Eqs. (2)–(11), (13) and (In order to compare these results, the average pore diters were calculated for the groups of microporesL <∼ 1.0,∼ 1.0 < L <∼ 2.0, andL <∼ 2.0, based on the numericintegration of cumulative pore size distributions (both Dand ND models are analyzed).
Table 4 shows that, generally, the values of surface acalculated applying different methods increase after theidation of the initial carbon A. Remarkable changes inpore volumes determined by different methods after oxtion of carbon A are not observed. Summing up, the inence of this process on porosity is small since it leads toblocking of the smallest and/or narrowing of the wider mcropore entrances, respectively [87,88,91,92]. These reare similar to those observed previously [87,88,91,92].
d
.-
s
the other hand, it can be noted that the investigated sample(carbon A and B) possess values of apparent BET surareas (Table 4) close to those observed to typical comcial carbons [11]. The total volumes of mesopores evaluby the DFT method (0.081 and 0.078 cm3/g, respectively)as well as their surface areas (5.2 and 9.8 m2/g, respec-tively), are very small and similar to those observedstrictly microporous carbonaceous films (where the majority of micropores possess the same diameter (∼ 0.4< L <∼0.6 nm) [30]). On the other hand, the analysis of the diffential pore size distributions (J (L − da)DFT) calculated forboth studied samples (i.e., carbons A and B) indicatesthe pores are grouped around three main diameters (FiIn order to simplify the consideration for both carbons tgroups of micropores are assumed to be present (firstsecond are analyzed jointly). The first one approacheameters equal to 0.7–1.0 nm (i.e.,L <∼ 1.0 nm) whilst thesecond one oscillates in the range 1.0–2.0 nm. In Tableparameters of the primary and secondary porous stru(determined from DFT for manual choice regularization parameterλ equal to 1× 10⁻⁵ [53,74,103,104]) are include(Lav,DFT,I andLav,DFT,II , respectively) and compared withose evaluated from the Nguyen and Do model [49–56is seen that the volume of the primary micropores (V micro
DFT,I )contributes about 51.2% (carbon A) or 59.2% (carbon Bthe total volume of pores. Moreover, 78.2% (carbon A) a81.1% (carbon B) (Table 4) of pores smaller and/or eqto 2 nm in the total volume of all pores is observed. Thefore, studied carbons can be regarded as microporous swith dispersed microporosity (Fig. 6). The results achiefrom the high-resolutionαs -plot method (Fig. 7) and thnew method of calculating the pore-size distributions pposed by Nguyen and Do (ND theory) confirm this stament (Fig. 6). The shapes of the high-resolutionαs -plots (theFS/CS type, following the classification proposed by Kanet al. [105]) observed for both studied samples (Fig. 7)

P.A. Gauden et al. / Journal of Colloid and Interface Science 273 (2004) 39–63 51
i-ts,
ding
tesup,of
t sigticeifts
isonhetially
belts
ud-lmser
HK
am-pre-the
a-in–
is(14ndage
sesthe
m
e totion
ative
ansults(14))cancon-, thei-the
e mi-ifi-ver-ell as. 8)/or
ityodsultsthef
tofedal-
n-eu-
isper-geninn thede-
Fig. 7. High-resolution N2 (T = 77.5 K) αs -plots obtained using graphtized carbon Sterling FT-G as the reference system (the same type of ploi.e., FS/CS is obtained).
to the suggestion that they posses the micropores leato both filling and co-operative swings onαs -plots. It canbe noticed that the linear region is short and this indicathe presence of relatively narrow pores [102]. SummingDFT and ND methods suggest a polymodal structurepores and indicate that the chemical treatment does nonificantly influence the porosity. Furthermore, one can nothat the method proposed by Nguyen and Do slightly shthe dimension of pores to larger diameters in comparwith the DFT results (Fig. 6 and Table 4). Contrary to tmethods mentioned above, HK suggests an exponendecreasing form of the MPSD curves (see Fig. 6). It cannoticed that HK method approximate DFT and ND resureasonably well. Similar situation was observed for stied recently strictly microporous homogeneous carbon fi[30]. The HK theory leads smaller (carbon A) and larg(carbon B) pore diameters in comparison with DFT andmodels.
The comparison of calculated average micropore dieters (nitrogen adsorption data are only analyzed) issented in Table 4 and in Fig. 8. The optimized values ofparametern of the Dubinin–Astakhov (DA) isotherm eqution (Table 5) are close to those assumed in the DubinRadushkevich one (n = 2). Therefore, the influence of thparameter on the results obtained based on Eqs. (13) andis insignificant. For all the studied samples, Eq. (9) athe ND method lead to the highest values of the avermicropore width, while Eqs. (13) and (14) in most calead to the lowest ones. Results similar to the DFT are
-
)
Fig. 8. The comparison of the average pore diameters obtained froEqs. (2)–(11), (13), (14) and DFT and ND methods (Lav,DFT,tot and/orLav,ND,tot, Table 4). The full range of micropores was considered duthe fact that DA and/or DR equation was fitted to the range of adsorpwhich takes place in the pores where micropore filling and a cooperswings mechanism occur.
most frequently obtained for Eqs. (6), (10), and (11). It cbe seen that a good correlation between calculated rebased on relations proposed by us (i.e., Eqs. (13) andand the results obtained from DFT and/or ND methodsnot be obtained (although, PSDs are comparable). Intrary to activated carbons analyzed in the current papersimilarity was obtained previously for the more strictly mcroporous adsorbents—carbonaceous films [30]. This isconsequence of the more homogeneous structure of thcropores [30]. For carbon A and B micropores are signcantly dispersed (Fig. 6). Therefore, the values of the aage widths calculated based on monomodal PSDs as wpore-size distributions obtained from the HK method (Figare shifted to smaller values in comparison with DFT andND values.
To discuss the possibility of the existence of similarbetween the Horvath–Kawazoe and ND (or DFT) methin the next figures (Figs. 9 and 10) we present the resof the analysis of modeled DA isotherms, described byabove-mentioned theories [35]. In Fig. 9 the influence on
(the parameter of the DA equation) on theJ (L − da) func-tion is shown forE0 = 25 kJ/mol. It can be noticed thathe increase inn leads to an increase in maximum valuethis function (and narrowing of the distribution is observsimultaneously) for the HK model (Fig. 9—lines). The evuated values of(L − da) related to the maximum of MSDare similar. Moreover, the result of the numerical differetiation provides a decrease inLav value with the increasin n at constantE0. On the other hand, PSD curves calclated form the ND model (Fig. 9, bars) show that for highn
an almost homogeneous pore system is observed (the dsion of pore diameters is around the diameter of one nitromolecule). The decrease in then value leads to a decreasethe intensity of the peak and the second peak appears irange of pores with diameters around 1.5 nm. Thus, the

52 P.A. Gauden et al. / Journal of Colloid and Interface Science 273 (2004) 39–63
zoe
Fig. 9. The influence of parametern on theJ(L − da) calculated for N2 (E0 = 25 kJ/mol); bars—the Nguyen–Do method; lines—the Horvath–Kawamethod.figi-
steddif-f
tionaryary
ra-
inedrac-mes
ors obofof
, and
orp-donlyerveds
de-f two
eth-oreion(13)theyT,rowthe
aryy
crease inn value (at constantE0) leads to the conversion othe PSD from monomodal to bimodal. Moreover, a neglbly small amount of mesopores are present forn = 1. Thedetailed analysis of the Nguyen and Do models suggethat for the first group of isotherms (constant energy,ferentn values) a decrease inn leads to the conversion oαs–FS plots into FS/CS [35], suggesting the transformaof the mechanism of adsorption in micropores from primmicropore filling into simultaneous primary and secondmicropore filling.
In the next figure (Fig. 10) the influence of the pameter E0 on the J (L − da) calculated for N2 (n = 3.0)is shown. In this case, the analysis of the results obtafrom the HK theory shows that the increase in the chateristic energy of adsorption leads to decrease in maximuvalue ofJ (L − da) and increase the related to them valuof (L − da)p,max (Fig. 10—lines). It can be noticed that fthe largest energy value an almost homogeneous PSD itained from the ND method (Fig. 10—bars). In the rangeE0 20–25 kJ/mol bimodal PSD is observed, as a resultthe decrease in the intensity of the peak around 0.7 nm
-
the increase in the intensity of the peak related to the adstion in wider pores (ca. 1.2 nm). For the smallest analyzevalue of energy the first peak vanishes completely andthe second is visible. The same changes as those obson PSD curves occur also onαs -plots. For the largest valueof energy (40 and 32 kJ/mol) the obtainedαs -plots belongto the FS group, and the CS swing is almost absent. Thecrease in energy value leads, however, to the creation oswings; thus, forE0 in the range 20–25 kJ/mol, FS/CS-typeαs -plots are observed. For the smallest energies, theαs -plotsbecome the typical CS type [35].
It can be seen that the similarity between the both mods occurs only for isotherms describing primary micropfilling process (i.e., FS type of swing in the high-resolutαs -plot is observed). Therefore, since the relations (Eqs.and (14)) are based on the HK adsorption potential,lead to results similar to those obtained from ND (DFGCMC) methods, only for carbons possessing very narmicropores. The results presented in this section lead tostatement that for microporous carbons where a primmicropore filling process predominates (especially, strictl

P.A. Gauden et al. / Journal of Colloid and Interface Science 273 (2004) 39–63 53
hod.
Fig. 10. The influence of parameterE0 on theJ(L − da ) calculated for N2 (n = 3.0); bars—the Nguyen–Do method; lines—the Horvath–Kawazoe metth-rza-ob-enrestiveving
esof
-rp-3].theowneo-
s, buaryrmsn the
b-R
es-cted
s aref the
theatis-ses
ory,ever,terstalouldre-izeFT
microporous), similarity exists between DFT and HK meods [7,30,31,59,74]. Therefore, the HK model is, as a matteof fact, the simplest method of microporosity characterition leading (in some cases) to results similar to thosetained from DFT or ND methods. The differences betwethose methods vanish if the existence of wider micropocan be neglected. Summing up, the HK method is effecfor highly microporous carbons possessing the pores hasimilar width.
3.3.2. Pore size distributions—the influence of adsorbatThe comparison of the experimental adsorption data
Ar, N2, CCl4, and C6H6 on activated carbon: A (open symbols) and B (closed symbols) is given in Fig. 2. All adsotion isotherms belong to I type of IUPAC classification [9Moreover, the small influence of the type of adsorbent onplots is observed. The comparison of adsorption data shin Fig. 2 (the experimental data) and Figs. 5a and 5c (thretical ones) suggests similar sequences of the isothermfor C6H6 the difference is more significant. It is necessto remember that the theoretical DA adsorption isothe(Eq. (1)) are plotted for all analyzed adsorbates based o
t
same values of the characteristic energy (E0 = 25 kJ/mol)and parametern (=3.0). The optimized parameters are otained from the fitting of the theoretical equations (Dand/or DA) to experimental data (up to the relative prsure ca. 0.1 as was mentioned above). They are collein Table 6. The analysis ofW0, E0, andn shows that thedifference between those parameters for the two carbonirrelevant. The highest discrepancy between the results ocalculation based on DA and DR is achieved for CCl4 (thelargest molecule—Table 1). For all investigated systemsevaluated values of the determination coefficient are sfactory (DC close to 0.98 and higher) and for all the caDCDA > DCDR.
As described above it is possible, based on the HK theto achieve the same PSDs for different adsorbates. Howthe comparison of the hypothetical values of both parameof the DA equation with the calculated from experimendata suggests that the pore size distribution curves shbe slightly different. The experimental data confirm this psumption. The comparison of the differential micropore-sdistributions calculated for carbon A and B using the D(N2), HK (Ar, N2, CCl4, and C6H6) and ND (Ar, N2, CCl4,

54 P.A. Gauden et al. / Journal of Colloid and Interface Science 273 (2004) 39–63
3)
)
befor
ore
onbasitiald in
othinedr.resob-
onsizere-the
ctlylateoverimes,romhegers ispore
meatesticalultsr is
sor-
ergorp-tionthe
f andatesmi-egen-rage
e-
val-
ibu-
eri-due
teriz-nt ton
ofthe
yof
wndad-tural
, oneeckre-en-therbe
her-heretionse isere-
n.ex-
the
Table 6The comparison of the average pore diameters obtained from Eqs. (1and (14) for all investigated adsorbates
Carbon Lav (nm)
DA—Eq. (1) DR—Eq. (1),n = 2
Eq. (14) Eq. (13) Eq. (14) Eq. (13
ArA 0.882 0.868 0.936 1.072B 0.902 0.915 0.940 1.079
N2A 0.612 0.606 0.657 0.676B 0.628 0.627 0.661 0.681
CCl4A 0.898 0.933 0.911 0.996B 0.991 1.099 0.967 1.094
C6H6A 0.699 0.922 0.895 0.991B 0.714 0.820 0.884 0.972
and C6H6) methods, are presented in Fig. 11. It cannoted that the calculated HK pore-size distribution curvessome adsorbates are very similar (especially for N2, Ar, andC6H6), and they cover practically the same ranges of pdiameters; but sometimes they significantly differ (CCl4).The location and the shape of the MSDs strictly dependan adsorbate. For example, the MSD estimated on theof the N2 adsorption isotherm is similar to an exponenand suggests that the main portion of pores are locateeffective micropores with width greater than 1 nm for bcarbons. The shapes and location of distributions obtafrom Ar and C6H6 adsorption isotherms are very similaHere the main portion of micropores is shifted to larger po(0.6–0.8 nm) for the considered adsorbents. The MSDtained from CCl4 data clearly shows that the main portiof micropores is located between 0.9–1.2 nm. The poredistribution curves calculated from the ND model (and psented in Fig. 11) are different from those obtained fromHK theory. The location and the shape of the MSDs stridepend on an adsorbate. It can be noticed that the calcuND pore-size distribution curves for some adsorbates cpractically the same range of pore diameters; but sometthey significantly differ (CCl4 and N2). On the other handthe shapes and location of the distributions obtained fAr and C6H6 adsorption isotherms are very similar. Tpore-size distributions form ND method are shifted to larpore diameters in comparison with the HK model and thicaused by the differences in the pore filling pressure vsdiameter curves as shown in Fig. 3.
On the other hand, the values ofE0 andn (collected in Ta-ble 5) are used for the calculation of the average pore diaters based on Eqs. (13) and (14) for all analyzed adsorbThus, the present studies are limited only to the theorerelationships proposed previously [28–34]. The final resare compared in Table 6. The main aim of current papethe analysis of the influence of the diameter of the ad
s
d
-.
bates (dA) and the temperature (T ) on the average diametof micropores (Lav) and PSDs. Assuming a lack of swellin(the geometric invariance of the adsorbent during the adstion process), one can take into consideration the correlabetween the accessibility of the adsorbed molecule (anddiameter of this molecule) to the microporous structure oadsorbent and the pore widths.The analysis of data collectein Table 6 establishes the following sequence of adsorbwith respect to the increase of the average widths ofcropores: N2 < C6H6 < Ar < CCl4. This sequence is thsame as obtained for the above-mentioned MSDs. Nitromolecules are the smallest (dA = 0.300 nm; Table 1). Therefore they can penetrate the finest micropores—lower avepore widths are obtained (Eqs. (13) and (14)). Ar diamter (dA = 0.336 nm; Table 1) is larger than N2 and that iswhy for this adsorbate larger average pore widths are euated. A similar situation is observed for CCl4 (dA = 0.465nm). For this adsorbate the differential pore size distrtions should lie between Ar and C6H6 (if the influence ofthe adsorbate diameters is analyzed only). But for expmental data (Fig. 11) a different situation is observedto an exception to the rule for C6H6 (dA = 0.459) nm. Ap-parently, the mutual position ofJ (L − da) decides not onlydA but also the temperature and the parameters characing an adsorbate (Fig. 5a). It is necessary at this momeremember that Ar, CCl4, or C6H6 experimental adsorptioisotherms are measured in various temperatures.
3.3.3. Calorimetric dataAs mentioned above, the thermodynamic verification
the most popular methods of porosity determination ofcarbonaceous adsorbents (DFT, HK, and others) is rarelmet in the literature (mainly the Polanyi–Dubinin theoryadsorption was successfully verified [106]). It is well knothat the measurement of the enthalpy of adsorption can leato very interesting information about the mechanism ofsorption process as well as about the energetic and strucheterogeneity of adsorbents [32,87,88,91,92].Moreoverof the methods of a theoretical model verification is to chthe applicability of the both adsorption isotherm andlated enthalpy equations for the description of experimtal adsorption and heat of adsorption data (sometimes othermodynamic functions are also analyzed). It shouldpointed out that the HK model was derived based on tmodynamic assumptions (the details can be found elsew[25,38,42,43,68–72]).One of the most important postulaof this model is the assumption that the adsorbed phaconsidered to have the similar properties as liquid. Thfore, the above mentioned condition should be fulfilled by[42,43]
(16)|T �Sads| � |qdiff |,whereT is the absolute temperature,�Sads is the entropyof adsorption andqdiff is the differential heat of adsorptioIn other words, Horvath and Kawazoe suggested, usingperimental data, that the entropy term is negligible in

P.A. Gauden et al. / Journal of Colloid and Interface Science 273 (2004) 39–63 55
Fig. 11. The comparison of the differential micropore-size distributions calculated using DFT (N2) and HK or ND (Ar, N2, CCl4, and C6H6) methods. Thepore-size distributions calculated based on the DFT model are treated as the reference.
ous
-sa-hetal”ea-
eri-findper-ud-f
3.thece-the
larad-
ure
hate, the.
nure
he-
ovndre
circumstances mentioned above. They used the N2 isothermadsorption data (77.5 K) measured on strictly micropormolecular sieve carbon HGM 638, and calculatedqdiff basedon the simplified relation [42,43]
(17)qdiff = �Gads− �H vap,
where�Gads= −Apot and�H vap is the enthalpy of vaporization (equal with minus sign to the enthalpy of condention, L). Horvath and Kawazoe noticed the similarity of tdata calculated based on Eq. (17) with the “experimenisosteric heat of adsorption obtained from isotherms msured at different temperatures.
It should be pointed out that the HK model has been vfied only for one set of experimental data and we do notother cases in the literature. Therefore, we decided toform the thermodynamic verification for both samples stied in this paper. The calorimetrically measured enthalpies oadsorption of C6H6 and CCl4 are shown in Figs. 12 and 1Moreover, these data will be applied to calculate, usingmethod published by Everett and Powl [44], the enhanment of potential energy in micropores in comparison toenergy of adsorption on a “flat” surface.
Knowing adsorption isotherms and the differential moheats of adsorption, the differential molar entropies of
sorbed molecules (Sdiff ) can be calculated by [92]
(18)Sdiff = Sg − (qdiff/T ) − R ln(p/p0) + R,
whereSg is the molar entropy of the gas at the temperatT (for C6H6 at 313.15 K it is equal to 273.1 J/(mol K) [107]and for CCl4 at 308 K it is equal to 315.50 J/(mol K) [107]),andp0 is the standard state pressure. It is well known tdifferent standard states can be chosen, and in our casgas at the standard pressure ofp0 = 101325 Pa was applied
We also calculated the enthalpy and entropy of adsorptiobasing on the potential theory and applying the proceddescribed previously [106]. Assuming the fulfillment of tmain condition of the potential theory (first of all the temperature invariance condition(∂Apot/∂T )Θ = 0), we obtain
(19)�H ads= −Apot − αT Θ
F(Apot),
(20)�Sads= − αΘ
F(Apot),
whereF(Apot) = −dΘ/dApot is the differential adsorptionpotential distribution. Therefore, for the Dubinin–Astakhequation (Eq. (1)) the differential heat of adsorption athe differential molar entropies of adsorbed molecules a

56 P.A. Gauden et al. / Journal of Colloid and Interface Science 273 (2004) 39–63
ically
tion
Fig. 12. The experimental data (circles) measured for C6H6 on carbon A and B (T = 313 K). Entropy: the differential molar entropy of adsorbed C6H6calculated based on Eq. (18) (circles); Eq. (22) (thin or bold dashed lines(for the DA or DR equations, respectively)); horizontal dashed lines—the values of theentropy of liquid (Sliq = 179.89 J/(mol K)) and solid (Ssol = 136.50 J/(mol K)) benzene. Enthalpy: the differential molar enthalpy measured calorimetr(circles) and calculated based on: Eq. (17) (crosses); Eq. (23) (solid line); Eq. (21) (thin or bold short dashedlines (for the DA or DR equations, respectively),α = 1.16× 10⁻³ K−1 [97]); the model proposed by Nguyen and Do (closed symbols); horizontal dashed line—the value of the enthalpy of condensa(L = 33.042 kJ/mol [97]).
an-in th
ofthe
horsdsor-uringlid–idus-s there-tioned by
bes—
ountt of-
given by
qdiff = Apot + αT Θ
F(Apot)+ L − RT
(21)= Apot + αTβE0
n
(Apot
βE0
)1−n
+ L − RT
and
(22)Sdiff = Sliq + �Sads= Sliq − αβE0
n
(Apot
βE0
)1−n
,
whereα is the coefficient of the adsorbate thermal expsion (the meanings of other parameters are presentedprevious sections and in Appendix A).
On the other hand, the calculations of the enthalpyadsorption from ND method were performed adopting
e
procedure described by Nguyen and Do [108]. The autassumed that the decrease in the potential energy of abate molecules is the principal source of heat released dthe adsorption process. For micropores, where the sofluid interaction is much more significant than the fluid–fluinteraction, the potential change, which is calculateding the Lennard–Jones energy equation, can be taken afirst approximation to the heat of adsorption. The heatleased from individual micropores at any stage of adsorpcan thus be evaluated. Based on the procedure proposNguyen and Do the total heat at any overall loading canestimated by summing up the heats from individual porethis is the cumulative heat produced when the fixed amis loaded into a clean sample. Next, the differential heaadsorption is calculated; i.e., it is the incremental heat pro

P.A. Gauden et al. / Journal of Colloid and Interface Science 273 (2004) 39–63 57
l
he
Fig. 13. The experimental data (circles) measured for CCl4 on carbons A and B (T = 308 K). Entropy: the differential molar entropy of adsorbed CC4calculated based on Eq. (18) (circles); Eq. (22) (thin or bold dashed lines(for the DA or DR equations, respectively)); horizontal dashed lines—the valuesof the entropy of liquid (Sg = 315.5 J/(mol K)) and liquid (Sliq = 228.1 J/(mol K)) carbon tetrachloride on carbon. Enthalpy: the differential molar enthalpymeasured calorimetrically (circles) and calculated based on Eq. (17) (crosses); Eq. (23) (solid line); Eq. (21) (thin or bold short dashed lines (forthe DA orDR equations, respectively),α = 1.22× 10⁻³ K−1 [97]); the model proposed by Nguyen and Do (closed symbols); horizontal dashed line—the value of tenthalpy of condensation (L = 33.545 kJ/mol [97]).
sedof
ic
ret-
seds
en-rac-
luid
ntedforyzed)rbons8%.536
of
eroc-n inopy
on
duced per mole when the loading is incrementally increafrom lower value of adsorption to upper one. The detailscalculations are given in [108].
The final results of the calculation of the thermodynamfunctions (i.e.,qdiff and/or Sdiff ) are shown in Figs. 12and 13. In order to compare the experimental and theoical data of enthalpy of adsorption the state of C6H6 andCCl4 molecules in micropores should be investigated baon the differential molar entropies of adsorbed molecule(Sdiff ). It can be seen that the values of the differentialtropy of adsorbed benzene falls close to the value chateristic of a solid (Ssol = 136.50 J/(mol K) [109], especiallyfor carbon A (Fig. 12). Furthermore, the entropy of the CC4on the same carbons is lower than the entropy of liq(Sliq = 228.10 J/(mol K) [109]). However, it is interesting
to compare the plots of the entropy of adsorption presein Figs. 12 and 13 with those obtained previously [30]the carbonaceous films (the benzene data are only analpossessing more homogeneous pore structure than caA and B. As it can be seen from our previous study [30], 8of micropores of films possess the same diameter (0nm, and the volume 0.178 cm3/g, determined from DFTfor N2 adsorption) and that is the reason why the plotthe integral molar entropy of adsorbed C6H6 is almost con-stant (Fig. 7 in [30]). As it can be noticed, for the highvalues of adsorption the increase in differential entropycurs, and this is caused by the commence of adsorptiothe secondary structure of pores where differential entrapproaches to the value characteristic of a liquid. Compar-ison of the differential entropy of benzene adsorption
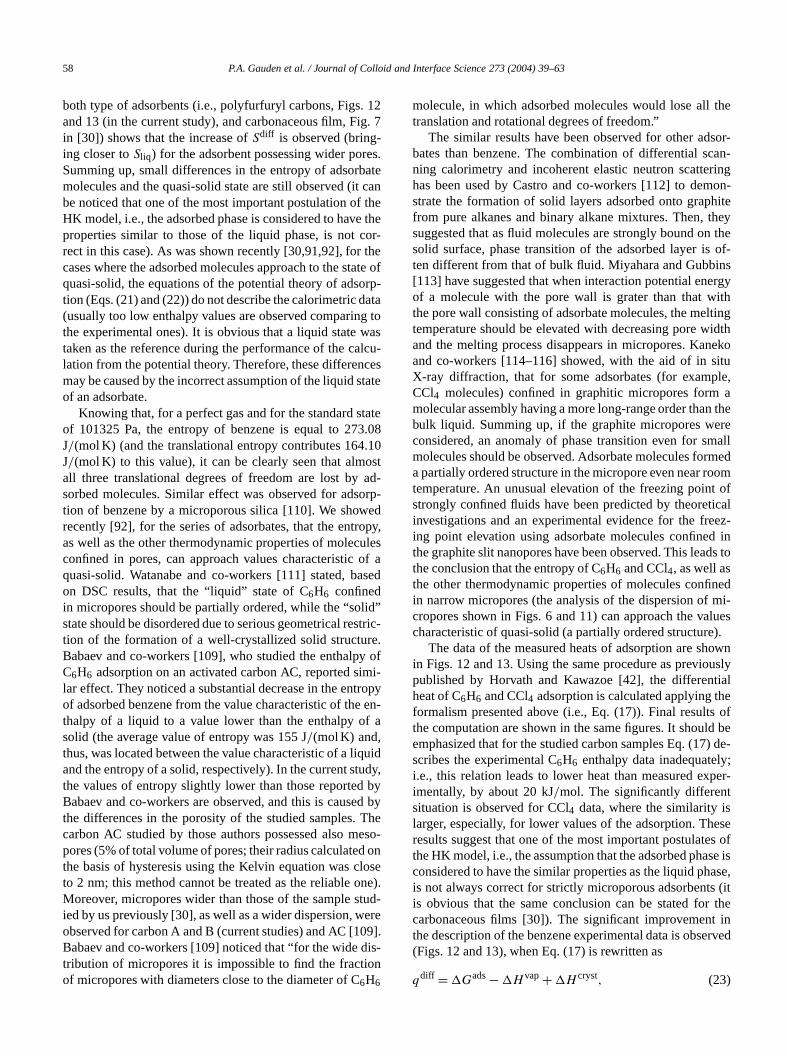
58 P.A. Gauden et al. / Journal of Colloid and Interface Science 273 (2004) 39–63
12ig. 7-es.atecanthee theor-theoforp-atatowasalcustate
tate3.08.10stad-orp-edy,ulesof a
ased
id”strice.y ofimi-ropyen
f a
ddy,byd b
Theesoon
losene)tud-ere09].is-
on
e
sor-can-ringon-
hiteyn the
of-nsergyithltingidth
nekoitule,a
n there
mallmed
oomt ofticaleez-d inds to
nedmi-lues).ownuslytiale
s ofd be) de-y;per-tsesees ofse isase,(it
r thet inrved
both type of adsorbents (i.e., polyfurfuryl carbons, Figs.and 13 (in the current study), and carbonaceous film, Fin [30]) shows that the increase ofSdiff is observed (bringing closer toSliq ) for the adsorbent possessing wider porSumming up, small differences in the entropy of adsorbmolecules and the quasi-solid state are still observed (itbe noticed that one of the most important postulation ofHK model, i.e., the adsorbed phase is considered to havproperties similar to those of the liquid phase, is not crect in this case). As was shown recently [30,91,92], forcases where the adsorbed molecules approach to the statequasi-solid, the equations of the potential theory of adstion (Eqs. (21) and (22)) do not describe the calorimetric d(usually too low enthalpy values are observed comparingthe experimental ones). It is obvious that a liquid statetaken as the reference during the performance of the clation from the potential theory.Therefore, these differencemay be caused by the incorrect assumption of the liquid sof an adsorbate.
Knowing that, for a perfect gas and for the standard sof 101325 Pa, the entropy of benzene is equal to 27J/(mol K) (and the translational entropy contributes 164J/(mol K) to this value), it canbe clearly seen that almoall three translational degrees of freedom are lost bysorbed molecules. Similar effect was observed for adstion of benzene by a microporous silica [110]. We showrecently [92], for the series of adsorbates, that the entropas well as the other thermodynamic properties of molecconfined in pores, can approach values characteristicquasi-solid. Watanabe and co-workers [111] stated, bon DSC results, that the “liquid” state of C6H6 confinedin micropores should be partially ordered, while the “solstate should be disordered due to serious geometrical retion of the formation of a well-crystallized solid structurBabaev and co-workers [109], who studied the enthalpC6H6 adsorption on an activated carbon AC, reported slar effect. They noticed a substantial decrease in the entof adsorbed benzene from the value characteristic of thethalpy of a liquid to a value lower than the enthalpy osolid (the average value of entropy was 155 J/(mol K) and,thus, was located between the value characteristic of a liquiand the entropy of a solid, respectively). In the current stuthe values of entropy slightly lower than those reportedBabaev and co-workers are observed, and this is causethe differences in the porosity of the studied samples.carbon AC studied by those authors possessed also mpores (5% of total volume of pores; their radius calculatedthe basis of hysteresis using the Kelvin equation was cto 2 nm; this method cannot be treated as the reliable oMoreover, micropores wider than those of the sample sied by us previously [30], as well as a wider dispersion, wobserved for carbon A and B (current studies) and AC [1Babaev and co-workers [109] noticed that “for the wide dtribution of micropores it is impossible to find the fractiof micropores with diameters close to the diameter of C6H6
-
-
-
y
-
.
molecule, in which adsorbedmolecules would lose all thtranslation and rotational degrees of freedom.”
The similar results have been observed for other adbates than benzene. The combination of differential sning calorimetry and incoherent elastic neutron scattehas been used by Castro and co-workers [112] to demstrate the formation of solid layers adsorbed onto grapfrom pure alkanes and binary alkane mixtures. Then, thesuggested that as fluid molecules are strongly bound osolid surface, phase transition of the adsorbed layer isten different from that of bulk fluid. Miyahara and Gubbi[113] have suggested that when interaction potential enof a molecule with the pore wall is grater than that wthe pore wall consisting of adsorbate molecules, the metemperature should be elevated with decreasing pore wand the melting process disappears in micropores. Kaand co-workers [114–116] showed, with the aid of in sX-ray diffraction, that for some adsorbates (for exampCCl4 molecules) confined in graphitic micropores formmolecular assembly having a more long-range order thabulk liquid. Summing up, if the graphite micropores weconsidered, an anomaly of phase transition even for smolecules should be observed. Adsorbate molecules fora partially ordered structure in the micropore even near rtemperature. An unusual elevation of the freezing poinstrongly confined fluids have been predicted by theoreinvestigations and an experimental evidence for the fring point elevation using adsorbate molecules confinethe graphite slit nanopores have been observed. This leathe conclusion that the entropy of C6H6 and CCl4, as well asthe other thermodynamic properties of molecules confiin narrow micropores (the analysis of the dispersion ofcropores shown in Figs. 6 and 11) can approach the vacharacteristic of quasi-solid (a partially ordered structure
The data of the measured heats of adsorption are shin Figs. 12 and 13. Using the same procedure as previopublished by Horvath and Kawazoe [42], the differenheat of C6H6 and CCl4 adsorption is calculated applying thformalism presented above (i.e., Eq. (17)). Final resultthe computation are shown in the same figures. It shoulemphasized that for the studied carbon samples Eq. (17scribes the experimental C6H6 enthalpy data inadequateli.e., this relation leads to lower heat than measured eximentally, by about 20 kJ/mol. The significantly differensituation is observed for CCl4 data, where the similarity ilarger, especially, for lower values of the adsorption. Thresults suggest that one of the most important postulatthe HK model, i.e., the assumption that the adsorbed phaconsidered to have the similar properties as the liquid phis not always correct for strictly microporous adsorbentsis obvious that the same conclusion can be stated focarbonaceous films [30]). The significant improvementhe description of the benzene experimental data is obse(Figs. 12 and 13), when Eq. (17) is rewritten as
(23)qdiff = �Gads− �H vap+ �H cryst,

P.A. Gauden et al. / Journal of Colloid and Interface Science 273 (2004) 39–63 59
to
ad-te a
romor-hisi.e.,
p-fibu-ortCllpye is
ow-
outisncetheuldsults
4],n be”pen-of
andc-tionricalthead-pubid-ds))
sedpy),
outandion-nter-
or thtionnd,
ndas-
car-andofstant).
,the
. Itero
ribed
der--
rop-ld be
sly.
where�H cryst is the enthalpy of crystallization (equal9.84 kJ/mol [97] for C6H6 and 2.41 kJ/mol for CCl4 [97]).This behavior is justified due to the approach that thesorbed molecules can be treated as a quasi-solid stadescribed above in detail.
Figs. 12 and 13 show that the enthalpy generated fDubinin’s theory (Eq. (21)) for both carbons and both adsbates is similar to that generated from the HK model. Tis caused by the similar assumptions of both methods,that in practice the enthalpyof adsorption is reasonably aproximated by the change in�Gads and the assumption oa liquidlike state of an adsorbate leads to a small contrtion of the entropic term (Figs. 12 and 13, thin or bold shdashed lines). As in the case of the HK method for C4adsorption a better similarity is observed to the enthameasured experimentally (the assumption of liquid statmore reliable).
The results of the calculation from the ND method shthat this method leads to remarkably lower enthalpy values than measured experimentally. It should be pointedthat this is not the confirmation of the inapplicability of thmodel (it leads to the same PSD results as the most advamethod—DFT). It is possible that different procedure ofcalculation of adsorption enthalpy from this method shobe applied. This problem needs further study and the rewill be reported.
Using the method published by Everett and Powl [30,4the enhancement of potential energy in micropores caevaluated (comparing to the energy of adsorption on a “flatsurface). Thus, calorimetry can be applied as an indedent method of the indirect determination of the widthmicropores of studied carbons. In order for the EverettPowl method to be applied the contribution of the funtional groups of an adsorbate to the enthalpy of adsorpon microporous carbon must be evaluated. The empirelationships proposed previously [92] and correlatingadsorption energy with physicochemical parameters ofsorbates are discussed. In Fig. 14 (where the data,lished previously (open symbols) and additionally consered in the current paper adsorbate—benzene (diamonit is shown that the initial integral enthalpies (Q0A and/orQ0B ), i.e., at so-called “zero coverage” (calculated baon the standard procedures from the differential enthalare correlated with an adsorbate polarizability,α (adsorp-tion on the carbon A) or dielectric constant,ε (adsorptionon the carbon B). For the nonspecific adsorbates (withany dipole moment such as methane, carbon dioxidecarbon tetrachloride (Fig. 14a, squares)), the linear relatships (Fig. 14a, dashed line) between enthalpy of adsorptioand the adsorbate polarizability is observed (it characizes the dispersive adsorbate–adsorbent interactions). Fsecond group, the specific adsorbate–adsorbent interaccontribute to the enthalpy of adsorption at low coverage atherefore, the relationships betweenQ0A andα is more com-plicated (Fig. 14a, solid line). Using the linear relation aknowing the adsorption enthalpy value, and, moreover,
s
d
-
,
es
Fig. 14. (a) The dependence of the enthalpy of adsorption onbon A on adsorbate polarizability (points—experimental data, soliddashed line—theoretical relationships [88,91,92]). (b) The dependencethe enthalpy of adsorption on carbon B on adsorbate dielectric con(points—experimental data, solid line—theoretical relationship [88,91,92]
suming the addition of specific and nonspecific interactionsone is able to separate the enthalpy of adsorption intocontribution of the two kinds of energy to this enthalpyis interesting to admit that the enthalpy of adsorption at zcoverage on the oxidized carbon (carbon B) can be descby the similar relation,Q0B vs ε (Fig. 14b; solid line) foreight investigated adsorbates. This suggests that for moately oxidized carbon the specific adsorbate–adsorbent interactions predominate during adsorption in carbon micores, even at very small coverages. Summing up, it shoustated that the evaluating values ofQ0A and/orQ0B excel-lent verified both theoretical equations proposed previou

60 P.A. Gauden et al. / Journal of Colloid and Interface Science 273 (2004) 39–63
nsity
n Atheen
n bezerontted
uslyte–fadsSDter)
eeretm-oneer,re-
enalsodif-
9-3and4)).
sed
3)6 anm-
ionsrm-
ingtatractry
sor-r-
likee)ona-
s.eters
sesod isary
omecti-soletes
ffer-
ad-uidnts.hehen
be-bedid as
larfniontherybenty ofalpy
hav-tri-rac-
dies
Fig. 15. Carbon A diameters calculatedfrom the enhancement of adsorptiopotential in micropores (i.e., the Everet and Powl model [44]), the denfunctional theory and based on Eqs. (13) and (14).
Thus, the integral molar adsorption energies on carbocan be compared with the enthalpies of adsorption ofsame molecules on graphitized carbon black and thehancement of the adsorption potential in micropores cacalculated. If we assume that adsorption enthalpy atcoverage is equivalent to the energy of adsorbate–adsorbeinteractions, the value of this enhancement is strictly relato the pore diameter. However, as it was shown previo[88,91,92], in the carbon A micropores specific adsorbaadsorbent interactions enlarge the enthalpy of adsorption omolecules with dipole moments at low coverage. This leto the conclusion, that the results of the calculation of Pcurves for polar adsorbates (for example, alcohols or washould be treated with precaution. Fortunately, knowing thvalue of the potential energy enhancement and using Evand Powl’s theoretical results [44], the carbon A pore diaeters can be calculated for benzene and two Lennard–Jpotential models (LJ 10-4 and/or LJ 9-3 [5,44]). Moreovthese results are compared with published previouslysults for the following adsorbates: CH4, CH3OH, C2H5OH,CH2Cl2, and CCl4 [88,91,92]. The redrawn results takfrom [88,91,92] are shown in Fig. 15 (benzene data areanalyzed) together with pore diameters calculated usingferent models of porosity determination potentials (LJand LJ 10-4) and based on the low-temperature nitrogenargon adsorption data (DFT model and Eqs. (13) and (1In Fig. 15, the solid lines are plotted applying the propogeneral empirical relations betweenLav and dA for bothpotentials [88,91,92]. Thus, the applicability of Eqs. (1and (14) can be checked using data presented in TableFig. 8. It is seen from Fig. 15 that the obtained pore diaeters lie close to the lines drawn using empirical equat[88,91,92]. It can be seen that this relation is linear, confi
-
t
s
d
ing the occurrence of the molecular-sieve effect and showagain that for application ofpolar molecule adsorption dato the characterization of porosity, it is necessary to subthe effect of “specific” interactions occurring even at velow coverages.
4. Conclusions
From the present studies on the adsorption of four adbates (N2, Ar, C6H6, and CCl4) on two microporous adsobents, the following conclusions can be put forward:
1. All empirical and semiempirical relationships,Lav = f
(E0, n = const), generate the decreasing hyperbolic-function for the typical (and found in the literaturrange of the characteristic energy observed for carbceous adsorbents. The theoretical relationships,Lav =f (E0, n) give the similar function as empirical oneThe reasons causing differences between pore diamcalculated from various approaches are discussed.
2. It is explained why the HK method gives for some cathe same results as DFT, and is shown that this methapplicable for the carbons where the process of primmicropore filling dominates.
3. The presented results confirm the suggestions of sauthors that the PSD is an intrinsic property of the avated carbon (independent of an adsorbate) and thesource of heterogeneity in spite of different adsorbahaving access to different pore size ranges (their dience in molecular size).
4. It is shown that the assumption considering of thesorbed phase to have the similar properties as liqis sometimes incorrect for the microporous adsorbeThe significant improvement in the description of tbenzene experimental enthalpy data is observed wthe enthalpy of crystallization is considered. Thishavior is justified due to the approach that the adsormolecules can be treated as the state of quasi-solwas described above in details.
5. Finally, we paid attention to the application of pomolecules adsorption data,for the characterization oporosity of the carbonaceous adsorbents. In our opifor this type of adsorbate it is necessary to subtracteffect of “specific” interactions occurring even at velow coverages (i.e., the energy of adsorbate–adsorinteractions can be calculated and next, the energspecific interactions can be evaluated from the enthof adsorption).
Consequently, the relationship between the phase beior and pore width of micropores (i.e., micropore-size disbution) of the microporous and mesoporous carbons chaterized by the different pore structure needs further stuand the results will be reported in the future.

P.A. Gauden et al. / Journal of Colloid and Interface Science 273 (2004) 39–63 61
ov
))
and
is
d
usr
ous
ec-
x-
e-
ov
nge
theg
in
ase
res
res
res
-
ated
ys-
ed
rsom
ger
heg
rp-
Appendix A. Nomenclature
ASA Adsorption stochastic algorithmAHK Constant of Eq. (12)Apot The free energy of adsorption in Dubinin–Astakh
isotherm equation—Eq. (1) (≡ −�Gads)a1(all) The parameter of Eq. (13)—shown in Table 2a1(mic) The parameter of Eq. (14)—shown in Table 3a2(all) The parameter of Eq. (13)—shown in Table 2a2(mic) The parameter of Eq. (14)—shown in Table 3a3(mic) The parameter of Eq. (14)—shown in Table 3BHK Constant of Eq. (12)b1(all) The parameter of Eq. (13)—shown in Table 2b1(mic) The parameter of Eq. (14)—shown in Table 3b2(all) The parameter of Eq. (13)—shown in Table 2b2(mic) The parameter of Eq. (14)—shown in Table 3b3(mic) The parameter of Eq. (14)—shown in Table 3CBET BET constant on flat surfaceCHK Constant of Eq. (12)c1(all) The parameter of Eq. (13)—shown in Table 2c2(all) The parameter of Eq. (13)—shown in Table 2DA The Dubinin–Astakhov equation (Eq. (1))DC The determination coefficientDFT The density functional theoryDR The Dubinin–Radushkevichequation (Eq. (1),n = 2DHK Constant of Eq. (12)d The sum of the diameter of an adsorbent atom
an adsorbate moleculeda The diameter of an adsorbent atom (for carbon
equal to 0.34 nm)dA The diameter of an adsorbate moleculeE0 The characteristic energyof adsorption calculate
from Dubinin–Astakhov equation—Eq. (1)HK The Horvath and Kawazoe methodHREM High-resolution electron microscopyJ (L − da) The differential pore size distributionL The pore width (diameter)L The enthalpy of condensationLav The average pore widthLav,I The average effective width of the primary poro
structure (L <∼ 1) determined from DFT and/oND
Lav,II The average effective width of the secondary porstructure (∼ 1 < L <∼ 2) determined from DFTand/or ND
Lav,tot The average effective width of the primary and sondary porous structure (L <∼ 2) determined fromDFT and/or ND
L/dA Reduced pore width(L − da) The effective pore width(L − da)/dA The reduced effective pore width(L − da)p,max The effective pore width related to the ma
imum value of functionJ (L − da)
(L − da)/dA)p,max The reduced effective pore width rlated to the maximum value of functionJ (L −da)/dA)
MSD The micropore size distributionn The best fit parameter of the Dubinin–Astakh
equation—Eq. (1)ND The Nguyen and Do methodp Equilibrium pressure of an adsorbatePSD The pore size distributionp/ps Relative pressureps Saturation pressure of an adsorbatep0 The standard state pressure (= 101325 Pa)qdiff The differential heat of adsorptionR Universal gas constantS The surface areaSAXS The small-angle X-ray scatteringSBET The apparent surface area (calculated in the ra
of relative pressure ca. 0.05 up to ca. 0.3)Sc,α The total specific surface area calculated from
high-resolutionαs plot (graphitized carbon SterlinFT-G was applied as a reference system)
SDA The micropore area (=4 × 10³ W0DR/Lav, whereLav is the average micropore width calculatedthis case by Eq. (9))
SDR The micropore area (=4 × 10³ W0DR/Lav, whereLav is the average pore width calculated in this cby Eq. (9))
SDFT The surface of pores calculated for all the po(=Smicro
DFT + SmesoDFT )
SmicroDFT The surface of pores calculated for all the po
with diameters smaller and/or equal to 2 nmSmeso
DFT The surface of pores calculated for all the powith diameters larger and/or equal to 2 nm
Sdiff The differential molar entropies of adsorbed molecules
Sg The molar entropy of gasSliq The molar entropy of liquidSme,α The specific surface area of mesopores calcul
from the high-resolutionαs plot (graphitized car-bon Sterling FT-G was applied as a reference stem)
Ssol The molar entropy of solidT The temperatureTVFM Theory of the volume filling of microporesV The pore volumeV micro
DFT,I The volume of the primary micropores determinfrom DFT
V microDFT The total volume of the micropores with diamete
smaller than and/or equal to 2 nm determined frDFT
V mesoDFT The volume of the mesopores with diameters lar
than and/or equal to 2 nm determined from DFTVHK The micropore volumes determined from HKVmi,α The volume of micropores calculated from t
high-resolutionαs plot (graphitized carbon SterlinFT-G was applied as a reference system)
W AdsorptionWexp,tot The maximum value of the experimental adso
tion (for p/ps ≈ 1)

62 P.A. Gauden et al. / Journal of Colloid and Interface Science 273 (2004) 39–63
heich
ion
he
or-
5
3)
a-
ous
of
ous
6)
ol.
4.
.
ar-
9.997)
ys.
)
ic
t.
i.
5.
19.)
4
,
tig-
g,
id
.
16
6
r-
r-
W0 The volume of micropores calculated from tDubinin–Astakhov and/or Dubinin–Radushkevisotherm equation (Eq. (1))
Greek letters
α The coefficient of the adsorbate thermal expansβ The affinity coefficientγ Surface tension�H ads The enthalphy of adsorption�Sads The entropy of adsorption�Gads The free energy of adsorption equal toRT ln(p/ps)
�H vap The enthalpy of vaporizationε Interaction energyΘ The degree of micropore filling—defined by t
Dubinin–Astakhov equation—Eq. (1)κ The characteristic constant for a defined ads
bate/adsorbent pair in the micropore regionλ The regularization coefficientν Liquid molar volumeρ Liquid densityσ Collision diameter
Subscripts
A Adsorbatea Adsorbentall Calculated not only for the range of microporesmic Calculated only for the range of microporesff Fluid–fluid
References
[1] M.M. Dubinin, A.V. Astakhov, Izv. Akad. Nauk SSSR Ser. Khim(1971) 125 (in Russian).
[2] J. Toth, J. Colloid Interface Sci. 163 (1994) 299.[3] J. Toth, Adv. Colloid Interface Sci. 55 (1995) 54.[4] G.F. Cerofolini, N. Re, Riv. Del Nuovo Cimento Bologna 16 (199
1.[5] D.D. Do, Adsorption Analysis: Equilibria and Kinetics, ICP, Sing
pore, 1998.[6] W. Rudzinski, D.H. Everett, Adsorption of Gases on Heterogene
Surfaces, Academic Press, London, 1992.[7] P.A. Gauden, A.P. Terzyk, Theory of Adsorption in Micropores
Carbonaceous Materials, WICHiR, Warsaw, 2002 (in Polish).[8] M. Jaroniec, R. Madey, Physical Adsorption on Heterogene
Solids, Elsevier, Amsterdam, 1988.[9] A. Ozawa, S. Kusumi, Y. Ogino, J. Colloid Interface Sci. 56 (197
83.[10] B. Rand, J. Colloid Interface Sci. 56 (1976) 337.[11] G. Rychlicki, A.P. Terzyk, W. Majchrzycki, J. Chem. Techn
Biot. 74 (1999) 329.[12] M.M. Dubinin, Carbon 23 (1985) 373.[13] S.K. Bhatia, H.K. Shethna, Langmuir 10 (1994) 3230.[14] O. Kadlec, Dokl. Akad. Nauk SSSR 285 (1985) 925.[15] M.M. Dubinin, H.F. Stoeckli, J. Colloid Interface Sci. 75 (1980) 3[16] B. McEnaney, Carbon 25 (1987) 69.[17] H.F. Stoeckli, L. Ballerini, S. DeBernardini, Carbon 27 (1989) 501[18] H.F. Stoeckli, Carbon 27 (1989) 363.
[19] H.F. Stoeckli, F. Kraehenbuehl, L. Ballerini, S. DeBernardini, Cbon 27 (1989) 125.
[20] B. McEnaney, T.J. Mays, in: COPS II Conference, Alicante, 1990.[21] H.F. Stoeckli, P. Rebstein, L. Ballerini, Carbon 28 (1990) 907.[22] H.F. Stoeckli, D. Huguenin, A. Laederach, Carbon 32 (1994) 135[23] J. Choma, M. Jaroniec, Karbo-Energochemia-Ekologia 11 (1
368 (in Polish).[24] H.F. Stoeckli, F. Kraehenbuehl, Carbon 22 (1986) 297.[25] S.G. Chen, R.T. Yang, J. Colloid Interface Sci. 177 (1996) 298.[26] T. Ohkubo, T. Iiyama, K. Nishikawa, T. Suzuki, K. Kaneko, J. Ph
Chem. 103 (1999) 1859.[27] P.J.F. Harris, Int. Mater. Rev. 42 (1997) 206.[28] A.P. Terzyk, P.A. Gauden, G. Rychlicki, R. Wojsz, Carbon 36 (1998
1703, Erratum, Carbon 37 (1999) 539.[29] A.P. Terzyk, P.A. Gauden, Colloids Surf. A 177 (2001) 57.[30] A.P. Terzyk, P.A. Gauden, J.Zawadzki, G. Rychlicki, M. Wisniewski,
P. Kowalczyk, J. Colloid Interface Sci. 243 (2001) 183.[31] P.A. Gauden, Theoretical Description of the Structural and Energet
Heterogeneity of Carbonaceous Materials, thesis, UMK, Torun, 2001(in Polish).
[32] A.P. Terzyk, P. Kowalczyk,P.A. Gauden, G. Rychlicki, S. Zi˛etek,Colloids Surf. A 201 (2002) 17.
[33] P. Kowalczyk, A.P. Terzyk,P.A. Gauden, L. Solarz, CompuChem. 26 (2002) 125.
[34] P. Kowalczyk, A.P. Terzyk, P.A.Gauden, G. Rychlicki, Adsorpt. ScTechnol. 20 (2002) 295.
[35] A.P. Terzyk, P.A. Gauden, P.Kowalczyk, Carbon 40 (2002) 2879.[36] J. Jagiełło, J.A. Schwarz, J. Colloid Interface Sci. 154 (1992) 22[37] A.P. Terzyk, J. Colloid Interface Sci., in press.[38] S.G. Chen, R.T. Yang, Langmuir 10 (1994) 4244.[39] V.K. Dobruskin, Langmuir 14 (1998) 3840.[40] J.B. Condon, Micropor. Mesopor. Mater. 38 (2000) 359.[41] J.B. Condon, Micropor. Mesopor. Mater. 38 (2000) 377.[42] G. Horvath, K. Kawazoe, J. Chem. Eng. Jpn. 16 (1983) 470.[43] G. Horvath, Colloid Surf. A 141 (1998) 295.[44] D.H. Everett, J.C. Powl, J. Chem. Soc. Faraday Trans. 72 (1976) 6[45] G. Rychlicki, A.P. Terzyk, G. Szymanski, Pol. J. Chem. 67 (1993
2029.[46] A. Swiatkowski, B.J. Trznadel, S. Zi˛etek, Adsorpt. Sci. Technol. 1
(1996) 58.[47] T. Ohba, T. Suzuki, K. Kaneko, Carbon 38 (2000) 1879.[48] T. Ohba, K. Kaneko, Langmuir 17 (2001) 3666.[49] P. Kowalczyk, L. Solarz, A.P. Terzyk, P.A. Gauden, V.M. Gun’ko
Shedae Informaticae 1259 (11) (2002) 75.[50] P. Kowalczyk, A.P. Terzyk, P.A. Gauden, R. Leboda, E. Szmech
Gauden, G. Rychlicki, Z. Ryu,H. Rong, Carbon 41 (2003) 1113.[51] P. Kowalczyk, V.M. Gun’ko, A.P. Terzyk, P.A. Gauden, H. Ron
Z. Ryu, D.D. Do, Appl. Surf. Sci. 206 (2003) 67.[52] P. Kowalczyk, A.P. Terzyk, P.A. Gauden, V.M. Gun’ko, J. Collo
Interface Sci. 256 (2002) 378.[53] P.A. Gauden, P. Kowalczyk,A.P. Terzyk, Langmuir 19 (2003) 4253[54] C.D. Nguyen, D.D. Do, Colloids Surf. A 187 (2001) 51.[55] V.M. Gun’ko, D.D. Do, Colloids Surf. A 193 (2001) 71.[56] V.M. Gun’ko, R. Leboda, J. Skubiszewska-Zi˛eba, V.V. Turov,
P. Kowalczyk, Langmuir 17 (2001) 3148.[57] R.J. Dombrowski, D.R. Hyduke, Ch.M. Lastoskie, Langmuir
(2000) 5041.[58] A. Vernov, W.A. Steele, Langmuir 7 (1991) 2817.[59] D.L. Valladares, F. Rodriguez-Reinoso, G. Zgrablich, Carbon 3
(1998) 1491.[60] K.T. Thompson, K.E. Gubbins, Langmuir 16 (2000) 5761.[61] P.B. Balbuena, K.E. Gubbins, Langmuir 9 (1993) 1801.[62] P.J.M. Carrott, M.M.L. Ribeiro Carrott, T.J. Mays, in: FOA Confe
ence, Paris, 1988.[63] A. Seri-Levy, D. Avnir, Langmuir 9 (1993) 3067.[64] Y.F. Yin, B. McEnaney, T.J. Mays, Carbon 36 (1998) 1425.[65] T. Suzuki, K. Kaneko, N. Setoyama, M. Maddox, K. Gubbins, Ca
bon 34 (1996) 909.

P.A. Gauden et al. / Journal of Colloid and Interface Science 273 (2004) 39–63 63
rf.
...
i-
e,
3.16
3.g-
Ad-,
nd
ys-
n73
andmic
ti,3.
on
-,
k,
ical
16..
.
day
y,
. 13
i,
ol-
,
9
9)
ys.
-
s,
ys.
[66] S.K. Bhatia, Langmuir 18 (2002) 6845.[67] S. Ismadji, S.K. Bhatia, Langmuir 16 (2000) 9303.[68] S. Ismadji, S.K. Bhatia, Langmuir 17 (2001) 1489.[69] R.J. Dombrowski, Ch.M. Lastoskie, D.R. Hyduke, Colloids Su
A 187–188 (2001) 23.[70] S.U. Rege, R.T. Yang, AIChE J 46 (2000) 734.[71] L.S. Cheng, R.T. Yang, Chem. Eng. Sci. 49 (1994) 2599.[72] A. Saito, H.C. Foley, Micropor. Mater. 3 (1995) 531.[73] M. Jaroniec, J. Choma, M. Kruk, Colloids Surf. A 214 (2003) 263[74] P. Kowalczyk, A.P. Terzyk,P.A. Gauden, Langmuir 18 (2002) 5406[75] J. Choma, M. Jaroniec, J.P. Olivier, Przem. Chem. 76 (1997) 101[76] J. Choma, M. Jaroniec, Polish J. Chem. 71 (1997) 380.[77] S. Blacher, B. Sahouli, B. Heinrichs, P. Lodewyckx, R. Pirard, J.P. P
rard, Langmuir 16 (2000) 6754.[78] J. Zawadzki, M. Wisniewski, J. Weber, O. Heintz, B. Azambr
Carbon 39 (2001) 187.[79] J. Jagiełło, J.A. Schwarz, Langmuir 12 (1996) 2837.[80] K. Wang, D.D. Do, Langmuir 13 (1997) 6226.[81] B.J. Trznadel, A.Swiatkowski, Adsorpt. Sci. Technol. 17 (1999) 30[82] R.J. Dombrowski, D.R. Hyduke, Ch.M. Lastoskie, Langmuir
(2000) 5041.[83] C. Nguyen, D.D. Do, Langmuir 16 (2000) 7218.[84] S. Scaife, P. Kluson, N. Quirke, J. Phys. Chem. B 104 (2000) 31[85] P.I. Ravikovitch, A. Vishnyakov, R. Russo, A.V. Neimark, Lan
muir 16 (2000) 2311.[86] K.E. Gubbins, in: J. Fraissard, C.W. Conner (Eds.), Physical
sorption: Experiment, Theory and Application, Elsevier, Amsterdam1997.
[87] G. Rychlicki, Role of Carbon Surface Chemism in Adsorption aCatalytic Processes, UMK, Torun, 1985 (in Polish).
[88] A.P. Terzyk, The Investigation of Molecular Interactions in the Stem Adsorbate–Microporous Activated Carbon, thesis, UMK, Torun,1995 (in Polish).
[89] A.V. Kiselev, V.P. Dreving, The Experimental Methods in Adsorptioand Molecular Chromatography, Izd. Mosk. Univ., Moscow, 19(in Russian).
[90] F. Rouquerol, J. Rouquerol, K.S.W. Sing, Adsorption by PowdersPorous Solids: Principles, Methodology and Applications, AcadePress, San Diego, 1999.
[91] G. Rychlicki, A.P. Terzyk, Adsorpt. Sci. Technol. 16 (1998) 641.[92] G. Rychlicki, A.P. Terzyk, Adsorpt. Sci. Technol. 17 (1999) 323.[93] K.S.W. Sing, D.H. Everett, R.A.W. Haul, L. Moscou, R.A. Pierot
J. Rouquerol, T. Siemieniewska, Pure Appl. Chem. 57 (1985) 60
[94] Lastoskie, N. Qiurke, K.E. Gubbins, in: W. Rudzinski, W.A. Steele,G. Zgrablich (Eds.), Equilibria and Dynamics of Gas AdsorptionHeterogeneous Solid Surfaces, Elsevier, Amsterdam, 1997.
[95] P. Kowalczyk, P.A. Gauden, A.P.Terzyk, D.D. Do, G. Rychlicki, An-nales UMCS 58 (2002) 46.
[96] W.H. Press, S.A. Teukolsky, W.T.Vetterling, B.P. Flannery, Numerical Recipes in Fortran, Cambridge Univ. Press, Cambridge, UK1992.
[97] I. Gajewska, H. Najberg, I. Senderacka, Physicochemical HandbooWarsaw, WNT, 1961 (in Polish).
[98] K.P. Miszczenko, A.A. Rawdiel, Handbook of the PhysicochemConstants, PWN, Warsaw, 1974 (in Polish).
[99] L. Gardner, M. Kruk, M. Jaroniec, J. Phys. Chem. B 105 (2001) 5[100] R. Radhakrishnan, K.E. Gubbins, A. Watanabe, K. Kaneko, J. Chem
Phys. 111 (1999) 9058.[101] N.N. Avgul, A.V. Kiselev, I.A. Lygina, E.A. Mihailova, Izv. Akad
Nauk SSSR Ser. Khim 5 (1962) 769 (in Russian).[102] K. Kakei, S. Ozeki, T. Suzuki, K. Kaneko, J. Chem. Soc. Fara
Trans. 86 (1990) 371.[103] P.A. Webb, C. Orr, AnalyticalMethods in Fine Particles Technolog
Micromeritics Instrument Corp., Norcross, GA, 1997.[104] M. v. Szombathely, P. Brauer, M. Jaroniec, J. Comput. Chem
(1992) 17.[105] K. Kaneko, C. Ishii, H. Kanoh, Y.Hanzawa, N. Setoyama, T. Suzuk
Adv. Colloid Interface Sci. 76–77 (1998) 295.[106] M.M. Dubinin, Adsorption and Porosity, WAT, Warsaw, 1975 (in P
ish).[107] Landolt–Bornstein, Zahlenwerte und Funktionen, Springer-Verlag
Berlin, 1961.[108] C. Nguyen, D.D. Do, Carbon 39 (2001) 1327.[109] P.I. Babaev, M.M. Dubinin, A.A. Isirikyan, Izv. Akad. Nauk. SSSR
(1976) 1929.[110] P. Pendleton, J. Colloid Interface Sci. 227 (2000) 227.[111] A. Watanabe, T. Iiyama, K. Kaneko, Chem. Phys. Lett. 305 (199
71.[112] M.A. Castro, S.M. Clarke, A. Inaba, T. Arnold, R.K. Thomas, J. Ph
Chem. B 102 (1998) 528.[113] M. Miyahara, K.E. Gubbins, J. Chem. Phys. 106 (1997) 1.[114] T. Iiyama, K. Nishikawa, T. Suzuki, T. Otowa, M. Hijiriyama, Y. No
jima, K. Kaneko, J. Phys. Chem. B 101 (1997) 3037.[115] K. Kaneko, A. Watanabe, T. Iiyama, R. Radhakrishan, K.E. Gubbin
J. Phys. Chem. B 103 (1999) 7061.[116] T. Ohkubo, T. Iiyama, K. Nishikawa, T. Suzuki, K. Kaneko, J. Ph
Chem. B 103 (1999) 1859.