Estimating spatial inequalities of urban child mortality
32
DEMOGRAPHIC RESEARCH VOLUME 28, ARTICLE 2, PAGES 33-62 PUBLISHED 8 JANUARY 2013 http://www.demographic-research.org/Volumes/Vol28/2/ DOI: 10.4054/DemRes.2013.28.2 Research Article Estimating spatial inequalities of urban child mortality Marta M. Jankowska Magdalena Benza John R. Weeks This publication is part of the Special Collection on “Spatial Demography”, organized by Guest Editor Stephen A. Matthews. © 2013 Jankowska, Benza & Weeks. This open-access work is published under the terms of the Creative Commons Attribution NonCommercial License 2.0 Germany, which permits use, reproduction & distribution in any medium for non-commercial purposes, provided the original author(s) and source are given credit. See http:// creativecommons.org/licenses/by-nc/2.0/de/
-
Upload
independent -
Category
Documents
-
view
1 -
download
0
Transcript of Estimating spatial inequalities of urban child mortality

DEMOGRAPHIC RESEARCH VOLUME 28, ARTICLE 2, PAGES 33-62 PUBLISHED 8 JANUARY 2013 http://www.demographic-research.org/Volumes/Vol28/2/ DOI: 10.4054/DemRes.2013.28.2 Research Article
Estimating spatial inequalities of urban child mortality
Marta M. Jankowska
Magdalena Benza
John R. Weeks This publication is part of the Special Collection on “Spatial Demography”, organized by Guest Editor Stephen A. Matthews. © 2013 Jankowska, Benza & Weeks. This open-access work is published under the terms of the Creative Commons Attribution NonCommercial License 2.0 Germany, which permits use, reproduction & distribution in any medium for non-commercial purposes, provided the original author(s) and source are given credit. See http:// creativecommons.org/licenses/by-nc/2.0/de/
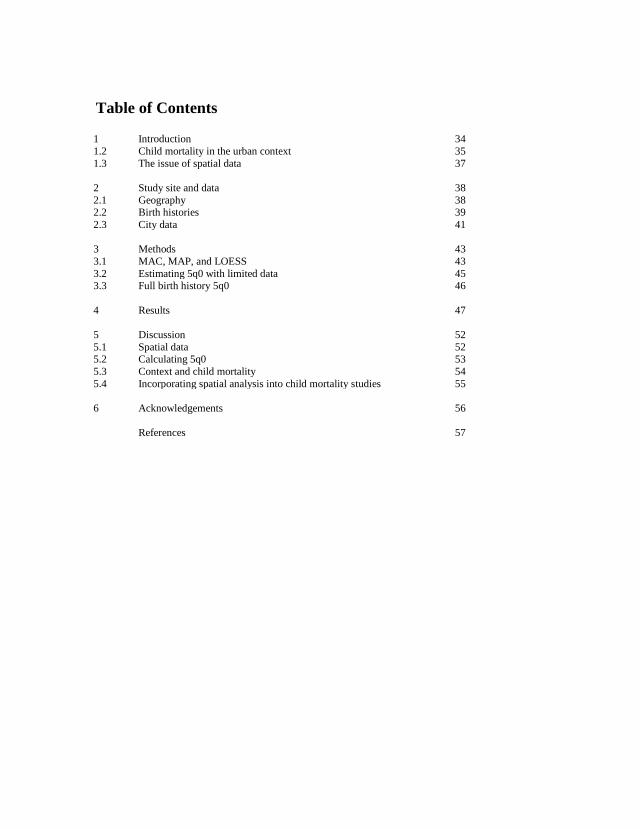
Table of Contents
1 Introduction 34
1.2 Child mortality in the urban context 35
1.3 The issue of spatial data 37
2 Study site and data 38
2.1 Geography 38 2.2 Birth histories 39
2.3 City data 41
3 Methods 43
3.1 MAC, MAP, and LOESS 43
3.2 Estimating 5q0 with limited data 45 3.3 Full birth history 5q0 46
4 Results 47
5 Discussion 52
5.1 Spatial data 52 5.2 Calculating 5q0 53
5.3 Context and child mortality 54
5.4 Incorporating spatial analysis into child mortality studies 55
6 Acknowledgements 56
References 57

Demographic Research: Volume 28, Article 2
Research Article
http://www.demographic-research.org 33
Estimating spatial inequalities of urban child mortality
Marta M. Jankowska1
Magdalena Benza2
John R. Weeks3
Abstract
BACKGROUND
Recent studies indicate that the traditional rural-urban dichotomy pointing to cities as
places of better health in the developing world can be complicated by poverty
differentials. Knowledge of spatial patterns is essential to understanding the processes
that link individual demographic outcomes to characteristics of a place. A significant
limitation, however, is the lack of spatial data and methods that offer flexibility in data
inputs.
OBJECTIVE
This paper tackles some of the issues in calculating intra-urban child mortality by
combining multiple data sets in Accra, Ghana and applying a new method developed by
Rajaratnam et al. (2010) that efficiently uses summary birth histories for creating local-
level measures of under-five child mortality (5q0). Intra-urban 5q0 rates are then
compared with characteristics of the environment that may be linked to child mortality.
METHODS
Rates of child mortality are calculated for 16 urban zones within Accra for birth cohorts
from 1987 to 2006. Estimates are compared to calculated 5q0 rates from full birth
histories. 5q0 estimates are then related to zone measures of slum characteristics,
housing quality, health facilities, and vegetation using a simple trendline R2 analysis.
1 Department of Geography, San Diego State University, 5500 Campanile Drive, San Diego, CA 92182-4493.
Phone: (619)-594-5437. E-mail: [email protected]. 2 San Diego State University. 3 San Diego State University.

Jankowska, Benza & Weeks: Estimating spatial inequalities of urban child mortality
34 http://www.demographic-research.org
RESULTS
Results suggest the potential value of the Rajaratnam et al. method at the micro-spatial
scale. Estimated rates indicate that there is variability in child mortality between zones,
with a spread of up to 50 deaths per 1,000 births. Furthermore, there is evidence that
child mortality is connected to environmental factors such as housing quality, slum-like
conditions, and neighborhood levels of vegetation.
1. Introduction
Despite a half-century of improvement in life expectancy, levels in sub-Saharan Africa
remain low. Almost three decades ago Farah and Preston (1982:381) noted that
―mortality levels in sub-Saharan Africa are the highest in the world and are the object of
substantial national and international concern.‖ That conclusion has been repeated over
time (Balk et al. 2004; Ewbank 1993), and it is still the case today even as mortality
declines. Hill (1993) estimated that in 1936 the probability of a child in Ghana dying
before age five was 0.371. By 1980 it had dropped to 0.164, and the 2003 Ghana
Demographic and Health Survey (GDHS) produced a rate of 0.111 (GSS, NMIMR, and
Orc Macro 2004). Most recently, the 2008 GDHS showed a continued drop to .080,
although that rate is believed to slightly understate the actual level of child mortality
(GSS, GHS, and ICF Macro 2009). While decreasing, rates are still stubbornly high and
ten times higher than in the United States.
High levels of child mortality are a major contributing factor to low life
expectancy as sub-Saharan societies move through health and mortality transitions.
These transitions are pushing mortality risks into the very young and very old cohorts
due to the double burden of acute communicable and chronic degenerative diseases
(Boutayeb 2006; Weeks 2011). As income and wealth rise in the context of an
improving economy, they almost always do so in an unequal fashion leading to widely
different risk profiles for acute and chronic illness. Child mortality is a direct
consequence of high-risk profiles for acute illness. In West Africa, as in almost every
other part of the world, chances of survival for children and adults are higher in cities
than in rural areas (Balk et al. 2004). Yet, research indicates that the averages used to
compare urban and rural areas mask significant urban inequalities (Timæus and Lush
1995; Vlahov et al. 2010).
As interest in urban child mortality differentials increases, there remains a gap in
our understanding of the spatial components of child mortality inequality. Spatial
inequality can highlight aspects of child mortality that poverty or urban/rural
classifications cannot – namely, the processes that link individual health outcomes to

Demographic Research: Volume 28, Article 2
http://www.demographic-research.org 35
characteristics of a place. Context, or a person‘s social and physical surroundings, has
been demonstrated by multiple studies to be a statistically significant factor for diverse
health outcomes (Montgomery and Hewett 2005; Pickett and Pearl 2001; Riva, Gauvin,
and Barnett 2007). As Dunn and Cummins (2007:1822) noted, ―changes in context may
produce changes in the risk profile for whole populations, rather than just for the people
who receive and are successful with individually-oriented interventions.‖ In this regard
spatial demography, or the demographic study of attributes aggregated to a level within
a geographical hierarchy (Voss 2007), can contribute to understanding which aspects of
urban context are meaningful for child mortality.
Unfortunately, the analysis of intra-urban child mortality patterns is exceedingly
difficult due to data and methodological constraints. Rajaratnam et al. (2010) have
recently developed and validated a new set of low-cost methods that efficiently use
summary birth histories for creating local-level measures of under-five child mortality
(5q0). In their paper, they apply the low-cost method using census data for jurisdictions
(municipios, roughly equivalent to US counties) in Mexico. The method has significant
potential for deriving local-level measures of 5q0, but its applicability for limited data
input at the micro-scale is as yet untested. The purpose of this study is two-fold: 1) to
test the utility of the Rajaratnam et al. method with small numbers at the micro-scale
level of zones within a developing world city – Accra, Ghana and 2) to compare the
variability of intra-urban 5q0 with characteristics of the environment that may be linked
to child mortality (housing, vegetation, health care facility access).
1.2 Child mortality in the urban context
Analysis of poverty and demographic differentials within cities and between urban
areas emphasizes disparities that can lead to unequal morbidity and mortality (Garenne
2010; Perera, Østbye, and Jayawardana 2009). Songsore and McGranaham (1993;
2007) analyzed two week prevalence of diarrhea and respiratory problems in children
under five in Accra, Ghana and consistently found the poorest participants to have
significantly higher rates of illness than middle- and high-income participants. Van de
Poel, O‘Donnell, and Van Doorslaer (2007) found that the magnitude in the urban-rural
gap for stunting in 47 developing countries falls dramatically when controlling for
wealth, and their analysis confirms the existence of higher socioeconomic inequality in
stunting and child mortality for urban areas as compared to rural areas. In reviewing
research on health of children in Asian cities, Fry, Cousins, and Olivola (2002: ii)
concluded that ―without exception, disaggregated data show dramatic differences in
health indicators between slum and non-slum populations or between the lower and

Jankowska, Benza & Weeks: Estimating spatial inequalities of urban child mortality
36 http://www.demographic-research.org
upper economic quintiles. There is a great need to promote disaggregated urban data
collection.‖
Besides poverty and demographic differentials, child mortality has also been
examined through a hierarchical lens by testing the effects and differences between
households, communities, and countries (Entwisle 2007). Findings emphasize the
importance of community education as well as access to health care and basic
infrastructure at courser spatial scales (Fay et al. 2005; Harttgen and Misselhorn 2006;
Kravdal 2004; Ladusingh and Singh 2006). In one of the few studies that focuses
exclusively on urban areas, Antai and Moradi (2010) used Demographic and Health
Survey (DHS) data over time to find that rapid urbanization in Nigeria has been
associated with increasing rates of under-five mortality as more and more people crowd
into disadvantaged urban areas. The relationship between urban disadvantage and child
mortality held steady, even after controlling for child and mother risk factors.
Antai and Moradi‘s study provides significant evidence that urban context matters
for child mortality, but the small sample size of the DHS did not permit a spatial
analysis within cities. Health issues in rapidly developing third world cities are
extremely complex (Montgomery 2009), partly because they are characterized by wide
swaths of poverty of varying magnitude as well as by pockets of extreme affluence
(Montgomery and Hewett 2005). A consequence of urban complexity is that traditional
individual-level risk factors for child mortality can become complicated by
overwhelming environmental burdens of living conditions such as lack of sanitation and
poor air quality (Boadi and Kuitunen 2006; Cameron and Williams 2009). This can also
work in the positive direction with environmental characteristics, such as improved
access to nutrition, medical care, or pure drinking water in the form of sachets that
shield children from higher-than-expected mortality (Stoler et al. 2012b). The impact of
these urban interactions may create a dissonance between the risk profile of an
individual and observed health outcomes among local residents.
There is an urgent need for better understanding of health and demographic
processes in the dynamic and rapidly-developing third world urban areas. Unraveling
the complexities of urban child mortality necessitates a spatial view of where children
in cities are suffering in order to better grasp how the urban physical and social
environment plays a role in child mortality. Only a handful of studies have attempted to
analyze child mortality disparities between urban neighborhoods, the most prominent
completed by the African Population and Health Research Center (APHRC) (2002) in
Nairobi, Kenya. The APHRC found very high rates of child mortality within slums, as
well as differences between slums, which ranged from 100 to 254 deaths under five
years of age per 1,000 children. The spatial scope of the study was a comparison of the
eight districts within the Province of Nairobi, and the emphasis was only on differences
between slum and non-slum districts. Currently there is almost no spatially explicit
Demographic Research: Volume 28, Article 2
http://www.demographic-research.org 37
research statistically linking urban environments to intra-urban 5q0 outcomes. Such
research is important for a number of reasons including the need to explore links
between place and child mortality, to assess the effectiveness of urban interventions,
and to better understand how other demographic processes like migration and family
structural changes are impacting child mortality.
1.3 The issue of spatial data
In accepting the potential importance of intra-urban child mortality differentials, we
arrive at a significant problem: the lack of geo-referenced child mortality data and
methods that can accommodate limited data inputs. In the absence of an accurate vital
statistics system, which is often the case in the developing world, the probability that a
child will survive from birth to their fifth birthday (5q0) can best be calculated from
complete birth history data collected from women, as is done in the DHS. Such data are
expensive to collect, and to our knowledge no survey has attempted a thorough spatial
sample of a developing world city to assess patterns of 5q0 derived from birth histories.
DHS samples rarely exceed several hundred respondents per city, thus limiting the
spatial comparisons that are possible. However, methods that rely on summary birth
histories focusing on the ratio of children who have died (CD) to the number of children
ever born (CEB), are less resource-intensive and can expand potential data sources.
―Specifically, the proportions of children dead classified by the mother‘s five-year age
group or duration of marriage can provide estimates of the probabilities of dying
between birth and various childhood ages‖ (United Nations Population Division 1983:
73).
Unfortunately, it is very rare to find summary birth history data at the fine spatial
scale of urban neighborhoods. Some censuses include questions about CEB and CD,
but many developing countries do not have a recent or existing census. Furthermore,
data collected must also include a geographical component. There are, however,
methods of ‗amplifying‘ existing spatial data that may assist in providing enough birth
history data for estimating under-five child mortality. In this paper we pull from
Schenker and Raghunathan (2007) and Roberts and Binder (2009) by combining
sample surveys from the same year into pooled datasets, thus enhancing our CEB and
CD measures within each geographical unit of analysis.
We then use these data to test the Rajaratnam et al. (2010) method developed at the
Institute for Health Metrics and Evaluation, University of Washington, which offers a
new low-cost method for calculating 5q0 from summary birth histories. The Rajaratnam
et al. method was developed using 166 Demographic and Health Surveys (DHS) and
four separate calculations of 5q0 from a combination of birth history, mother‘s age, and

Jankowska, Benza & Weeks: Estimating spatial inequalities of urban child mortality
38 http://www.demographic-research.org
time since first birth. Depending upon data availability, the method allows anywhere
from one to all four calculations to be placed into a region-specific regression model,
resulting in a smoothed 5q0 trend. Furthermore, data from surveys in past years can be
run through the four methods and included in the final regression that generates the 5q0
estimates. However, the problem of disaggregated data is still applicable to the method
– without enough data for CEB or CD in each age cohort or geographical region,
estimates may become unreliable. As noted above, the Rajaratnam et al. method has
been validated for municipios in Mexico by comparing vital statistics with census data,
but it has not been tested for small data sets at the micro-scale. Doing so is the major
purpose of this study.
2. Study site and data
2.1 Geography
The study site is the Accra Metropolitan Assembly (AMA)—the core district of the
Greater Accra Metropolitan Area (GAMA) and the capital city of Ghana, located on the
Gulf of Guinea. It exemplifies third world urban growth with an increase in population
from approximately 0.5 million in 1965, to 1.6 million people in 2000, to an expected
3.5 million by 2025 (United Nations Population Division 2010). Ghana Statistical
Service (GSS) has created geographic delineations for the city varying in scale, the
finest of which are the 1,731 enumeration areas (EA), similar to US census blocks. EAs
provide the geographical sampling basis for the four health surveys from which we
draw our data for this analysis, as well as for the 2000 Census of Housing and
Population. A coarser scale of GSS geographic delineations are localities, of which
there are 43 within the AMA, each one belonging to one of the six sub-metro areas
within the AMA district as of the 2000 census. Localities were aggregated into zones
with the help of satellite imagery and expert knowledge of the city so that identifiable
neighborhood areas are reflected in the resulting zones. Additionally, each zone was
built to include a sufficiently large sample size—a minimum of 50 births per age
cohort—to run the 5q0 analysis (Figure 1).

Demographic Research: Volume 28, Article 2
http://www.demographic-research.org 39
Figure 1: Accra Metropolitan Area in the south of Ghana
Notes: Enumeration Areas (EAs) nested within aggregated zones. EAs sampled in each health surveys are colored gray.
2.2 Birth histories
The study draws on several different surveys as sources of summary birth history data
including: the Women‘s Health Study of Accra (WHSA) for 2003 and 2008, the Ghana
Demographic and Health Survey (DHS) for 2003 and 2008, the 2003 Accra Slum
Survey (AccraSS), and the 2009 Housing and Welfare Study of Accra (HAWS). All
surveys were conducted as two-stage cluster probability samples where EAs served as
the sampling frame. The DHS was designed to be representative of the GAMA, and all
others were designed to be representative of the AMA: no survey was designed to be
representative of the EA level, and as such no weighting is utilized in reporting results.
Surveys were also not designed to be spatially representative of the city, and therefore
do not have an equitable spatial spread of EAs.4 Nonetheless, the fact that EAs and
households within EAs were selected at random provides data that have a spatial spread
reflecting the distribution within the city. While this is not an ideal spatial sample, the
data offer spatial insights not otherwise available. The non-DHS surveys were modeled
after the DHS and included questions regarding education, religion, ethnicity, and
economic situation as well as an extensive health and reproductive history.
4 We are not aware of any surveys currently in existence that are spatially representative of fertility and child mortality outcomes in urban areas – this is a challenge for conducting spatially explicit research on child
mortality at finer spatial scales.

Jankowska, Benza & Weeks: Estimating spatial inequalities of urban child mortality
40 http://www.demographic-research.org
The 2003 and 2008 Ghana DHS include national samples of 5,691 and 5,096
women respectively (GSS, GHS, and ICF Macro 2009; GSS, NMIMR, and ORC Macro
2004). GPS data points were acquired for the DHS sampling clusters within Accra, and
were related to EA boundaries for women surveyed in the AMA—443 women in 2003
and 348 in 2008. The 2003 WHSA includes 3,174 women, with over-sampling for older
women (Hill et al. 2007). In the 2008 WHSA, 1,819 women were successfully re-
interviewed, and 995 women (from the same EAs sampled in the 2003 survey) were
asked to participate to replace women who could not be located or had passed away.
The HAWS and AccraSS are very similar to the WHSA except that they targeted
households in slums as part of a UN-Habitat effort to obtain DHS-style data from
neighborhoods defined as slums in Accra. In 2003, the AccraSS surveyed 607 women
aged 18 and over, while the HAWS surveyed 1,703 women in 2009 (Stoler et al. 2012b;
Un-Habitat and Ghana Statistical Service 2003). All surveys were given by trained
survey personnel, who interviewed women in their homes.
Given that each survey is modeled after the DHS, including sampling structure and
method of interview, the surveys are good candidates for pooling data. We pooled the
2003 datasets and then the 2008 datasets with the goal of maximizing sample numbers
for each zone and minimizing missing data within particular age cohorts. The result was
two data sets with a five-year offset that could then be placed into the final 5q0
regression calculation. The surveys meet a number of criteria for data pooling including
same variables of interest, similar types of respondents, same modes of interviewing,
same survey context, same sample design, and same time of surveys (Roberts and
Binder 2009; Schenker and Raghunathan 2007). Some concern could arise over the
spatially targeted approach of the AccraSS and HAWS surveys, since the focus on slum
neighborhoods might bias unweighted aggregated numbers. However, the spatial nature
of the study allows these sampling points to be assessed within their localized spatial
context rather than as part of the city average. Table 1 provides selected descriptive
statistics for each survey and the pooled 2003 and 2008 data sets.
Demographic Research: Volume 28, Article 2
http://www.demographic-research.org 41
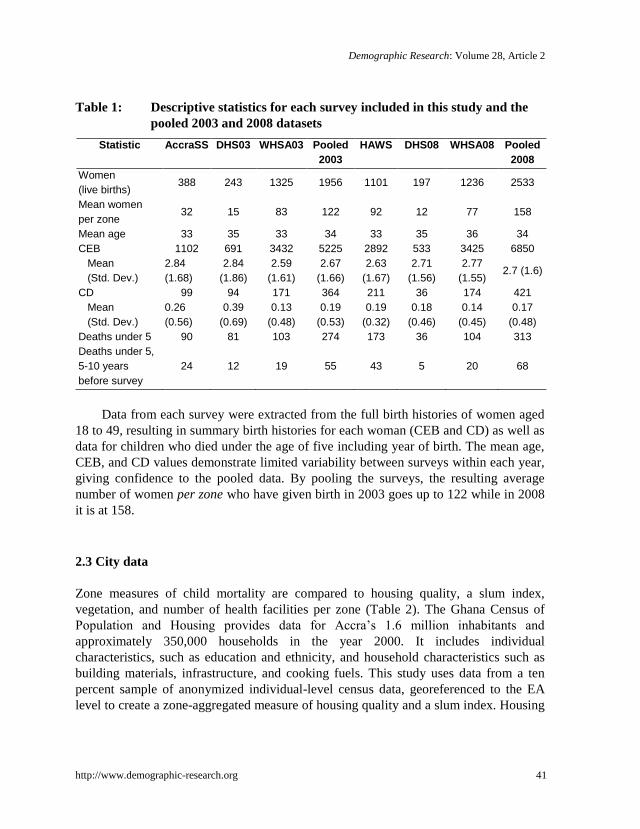
Table 1: Descriptive statistics for each survey included in this study and the
pooled 2003 and 2008 datasets
Statistic AccraSS DHS03 WHSA03 Pooled
2003
HAWS DHS08 WHSA08 Pooled
2008
Women
(live births) 388 243 1325 1956 1101 197 1236 2533
Mean women
per zone 32 15 83 122 92 12 77 158
Mean age 33 35 33 34 33 35 36 34
CEB 1102 691 3432 5225 2892 533 3425 6850
Mean
(Std. Dev.)
2.84
(1.68)
2.84
(1.86)
2.59
(1.61)
2.67
(1.66)
2.63
(1.67)
2.71
(1.56)
2.77
(1.55) 2.7 (1.6)
CD 99 94 171 364 211 36 174 421
Mean
(Std. Dev.)
0.26
(0.56)
0.39
(0.69)
0.13
(0.48)
0.19
(0.53)
0.19
(0.32)
0.18
(0.46)
0.14
(0.45)
0.17
(0.48)
Deaths under 5 90 81 103 274 173 36 104 313
Deaths under 5,
5-10 years
before survey
24 12 19 55 43 5 20 68
Data from each survey were extracted from the full birth histories of women aged
18 to 49, resulting in summary birth histories for each woman (CEB and CD) as well as
data for children who died under the age of five including year of birth. The mean age,
CEB, and CD values demonstrate limited variability between surveys within each year,
giving confidence to the pooled data. By pooling the surveys, the resulting average
number of women per zone who have given birth in 2003 goes up to 122 while in 2008
it is at 158.
2.3 City data
Zone measures of child mortality are compared to housing quality, a slum index,
vegetation, and number of health facilities per zone (Table 2). The Ghana Census of
Population and Housing provides data for Accra‘s 1.6 million inhabitants and
approximately 350,000 households in the year 2000. It includes individual
characteristics, such as education and ethnicity, and household characteristics such as
building materials, infrastructure, and cooking fuels. This study uses data from a ten
percent sample of anonymized individual-level census data, georeferenced to the EA
level to create a zone-aggregated measure of housing quality and a slum index. Housing

Jankowska, Benza & Weeks: Estimating spatial inequalities of urban child mortality
42 http://www.demographic-research.org
quality is measured by placing household characteristics5 into a principal components
analysis (PCA), using the first component from the rotated matrix to create the measure
(for a full description of the measure please see Weeks et al. 2012). Higher values
indicate better housing quality. The slum index draws on the UN-Habitat (2003) criteria
for what constitutes a slum6, creating a score for each household that is aggregated to
the zone level where higher values are more slum-like areas (Weeks et al. 2007). The
measures are similar in that they are assessing communal living standards but are able
to provide unique evaluations due to the differences in the variables they draw upon.
Table 2 demonstrates variability of the slum index and housing quality measure for
zones throughout the city.
Vegetation can be used as a proxy for overcrowding and socio-economic status of
an area (National Research Council 2007). It is of particular interest in the developing
world as an obtainable measure of social processes through remote sensing when on-
the-ground data is limited. Vegetation for the city is calculated based on Ridd‘s
vegetation-impervious surface-soil (VIS) model (Ridd 1995) from a combination of
QuickBird and ASTER imagery of Accra in 2002 and 2001. The high spatial resolution
QuickBird image was the primary data source used as it covered most of the study area.
Some EAs in the eastern part of the city not included in the QuickBird image were
filled in with ASTER imagery (Stoler et al. 2012a). Each zone‘s percent of vegetation
was calculated from the imagery using the VIS model. Finally, georeferenced data for
239 health facilities functioning in the AMA in 2008 were gathered from Ghana Health
Services and are coded into government, private, and non-profit facilities. These data do
not include all of the non-profit facilities functioning in Accra.
5 Household characteristics for the housing quality index include: electricity, source of water, type of toilet,
type of bathing facility, methods of waste disposal, cooking fuel, kitchen facility, and number of persons per
sleeping room. 6 UN-Habitat defines a household as a slum if it lacks one or more of the following characteristics: structural quality and durability of dwelling, access to safe water, sufficient living area, access to sanitation facilities,
and security of tenure.

Demographic Research: Volume 28, Article 2
http://www.demographic-research.org 43
Table 2: Housing quality, slum index, vegetation, and health facilities for each
zone and for Accra as a whole
Zones Housing quality Slum index Vegetation
(prop. covered)
Health facilities
(total)
101 2.0 2.1 0.1 5
103 1.9 2.1 0.1 6
104 1.9 2.0 0.2 39
107 2.0 2.0 0.2 3
108 2.5 1.7 0.2 15
201 1.5 2.5 0.0 18
301 2.3 2.0 0.2 32
401 2.2 2.0 0.2 12
405 2.9 1.8 0.4 15
406 1.8 2.3 0.1 5
407 1.9 2.2 0.2 4
501 1.9 2.1 0.1 15
502 1.5 2.3 0.1 21
506 3.0 1.5 0.5 21
601 2.3 1.8 0.2 18
605 2.0 2.0 0.2 10
Accra 2.1 2.0 0.2 239
3. Methods
3.1 MAC, MAP, and LOESS
The Institute for Health Metrics and Evaluation offers a free tutorial and R software
code for running the Rajaratnam et al. (2010) low-cost method, which can be
downloaded from their website (www.healthmetricsandevaluation.org) or as an
attachment (Text S1) from the PlosMedicine website for the original paper. The method
offers four measures of 5q0 using a combination of birth history, mother‘s age, and time
since first birth. As the goal is to test the applicability of the method for basic birth
histories, we exclude all measures utilizing time since first birth and are left with two
measures: Maternal Age Cohort (MAC) and Maternal Age Period (MAP).
The MAC method is based on the standard indirect method adapted by Feeney
(1980), which estimates child mortality from the portion of CD out of CEB modified to
generate cohort-specific estimates and includes country-specific random effects
(equation 1).

Jankowska, Benza & Weeks: Estimating spatial inequalities of urban child mortality
44 http://www.demographic-research.org
iiiii
i
iiiji
P
P
P
PCEB
CEB
CDUq
)2925(
)2420(
)2420(
)1915(logit)05logit( 43210 (1)
Where i is the five-year maternal age group, P is the parity (average CEB) for each
specified maternal age group, CDi is the total dead children from maternal age group i , CEBi is the total children ever born from maternal age group i, U are country-specific
random effects, and β-s are region and age cohort-specific coefficients estimated using
DHS complete birth histories. The country-specific random effects were generated by
comparing a traditional measure of under-five child mortality (from long birth histories)
to Rajaratnam et al.‘s CD/CEB measure from a composite of DHS surveys from around
the world. These effects are provided by Rajaratnam et al. in the downloadable version
of the program.
The MAP method is based on the same standard indirect method as MAC but, in
this case, is modified to estimate a period-based ratio of CD to CEB that allocates births
and deaths to each year previous to the survey. Regional frequency distributions of
births and deaths calculated by Rajaratnam et al. (2010) as a function of time prior to
the survey are used to generate expected allocations of births and deaths over time
(equation 2).
tjk
t
tttt
CEB
CDUq
logit)05logit( 10
(2)
Where t is the index of calendar time (years), CDt is the total dead children in time
bin t, CEBt is the total children ever born in time bin t, U are country-specific random
effects, and β-s are region and calendar time-specific coefficients estimated using DHS
complete birth histories.
In effect, the MAC and MAP measures allow the limited local birth history data to
be honed by country and regional specific data from past DHS full birth histories. The
measures are then smoothed using a local regression smoothing technique (LOESS)
(Cleveland and Loader 1996) to provide trends over time. MAC and MAP measures
from other survey time points can also be simultaneously placed into LOESS, providing
more data for the regression analysis. We calculated MAC and MAP measures for the
2003 and 2008 data, placing them into the LOESS regression for each zone and for the
city as a whole. Some minor modifications were made to deal with limited data at the
zone level, as discussed in 3.2 below. LOESS 5q0 results are mapped for five-year
intervals. Results are compared to zone measures of the slum index, housing quality,
health facilities, and vegetation using a simple trendline R2 analysis.

Demographic Research: Volume 28, Article 2
http://www.demographic-research.org 45
3.2 Estimating 5q0 with limited data
While the MAC and MAP measures pull strength from DHS country effects, they are
calculated from provided data of births and deaths for each age cohort and therefore are
reliant on sufficient input data. Rajararatnam et al. do not specify what ‗sufficient‘ data
inputs might be as their example draws on census data with large numbers of women in
each municipio in Mexico. We set a loose standard of 50 births per age cohort in each
zone (with the exception of the 18-19 cohort) in at least one of the two pooled survey
sets. However, in balancing enough data per zone and creating zones that are logical in
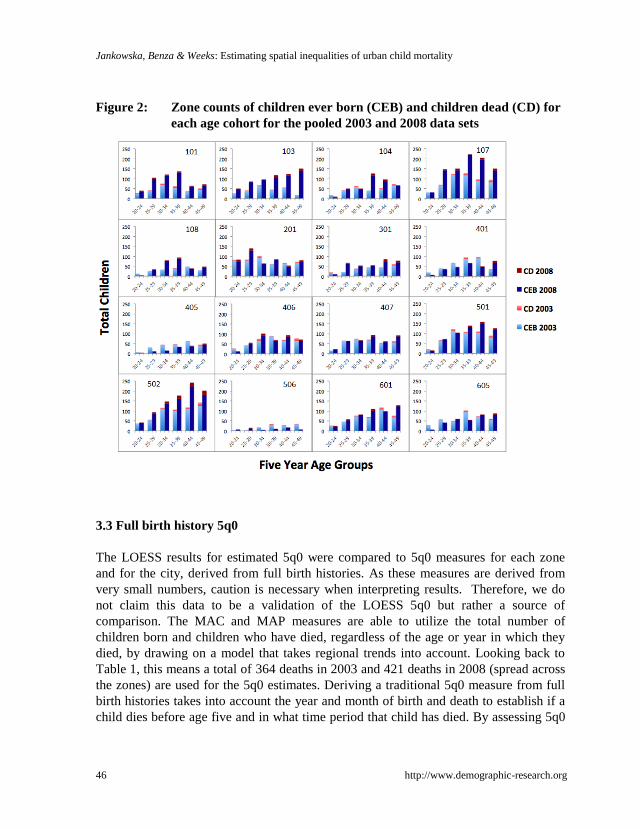
terms of cohesive areas in Accra, not all zones have 50 births in all age cohorts. Figure
2 illustrates, for each zone, numbers of children ever born (CEB) and children dead
(CD) by women‘s five-year age cohorts with the exception of the 18-19 age group due
to very low numbers across localities. The data limitation issue presents itself as more
complex than simply ‗not enough‘ in this figure. Some zones barely meet the 50 births
per age cohort standard (e.g., zones 405 and 506). Others have relatively good data but
are missing CEB or CD data in one or more age cohorts (e.g., zones 104 and 107).There
is a general trend of very few observations in the 20-24 age cohort, raising some
concern as to estimates produced from these cohorts.
The sensitivity of the measures to both high and low extreme CD/CEB ratio values
is higher for the MAC method than for the MAP method as MAC creates estimates
directly from the age cohort data while MAP estimates period based ratios, allocating
births and deaths to each year before the survey. Zero values are particularly
problematic as the CD/CEB ratio will be zero for these age cohorts, which may throw
off MAC estimates for these cohorts. We excluded the data-sparse 18-19 cohort from
analysis due to this sensitivity. From the remaining cohorts, there are a total of 18 age
cohorts across the zones in 2003 with no deaths, and in 2008 there are 16 cohorts. In
order to account for some of the MAC sensitivity, outputs were examined for extreme
outliers before placing estimates into the LOESS regression. Outliers that were clearly
not in tandem with both MAC and MAP trends (based on standard deviations) were
removed from the LOESS regression resulting in nine removals, one each for zones
103, 104, 201, 401, 405, 407, 501, 506, and 601.
Jankowska, Benza & Weeks: Estimating spatial inequalities of urban child mortality
46 http://www.demographic-research.org
Figure 2: Zone counts of children ever born (CEB) and children dead (CD) for
each age cohort for the pooled 2003 and 2008 data sets
3.3 Full birth history 5q0
The LOESS results for estimated 5q0 were compared to 5q0 measures for each zone
and for the city, derived from full birth histories. As these measures are derived from
very small numbers, caution is necessary when interpreting results. Therefore, we do
not claim this data to be a validation of the LOESS 5q0 but rather a source of
comparison. The MAC and MAP measures are able to utilize the total number of
children born and children who have died, regardless of the age or year in which they
died, by drawing on a model that takes regional trends into account. Looking back to
Table 1, this means a total of 364 deaths in 2003 and 421 deaths in 2008 (spread across
the zones) are used for the 5q0 estimates. Deriving a traditional 5q0 measure from full
birth histories takes into account the year and month of birth and death to establish if a
child dies before age five and in what time period that child has died. By assessing 5q0

Demographic Research: Volume 28, Article 2
http://www.demographic-research.org 47
in 5-year intervals, only children born in a particular time frame can be considered for
each interval. The 2003 sample has 274 children who died before age 5 while there are
313 in the 2008 data. Taking into account the year of birth for the child, only 55
children died ten to five years before the 2003 survey, and 68 died before the 2008
survey.
We calculated 5q0 from the full birth histories for 2003 and 2008 for each zone
and for the city as a whole. Births and deaths under five were tabulated in five-year
intervals starting with 1979 and ending with 1998 for the 2003 data, and starting with
1979 and ending with 2003 for the 2008 data. The 5q0 measure was calculated as a
simple ratio of children dead before age five divided by children born, multiplied by
1,000 to arrive at child deaths under-five per 1,000 births. We use the city level 5q0
calculations as a validation for the city LOESS regression. The zone results are too
limited in data to be used as validation, but they are the best available comparison for
the LOESS regression results.
4. Results
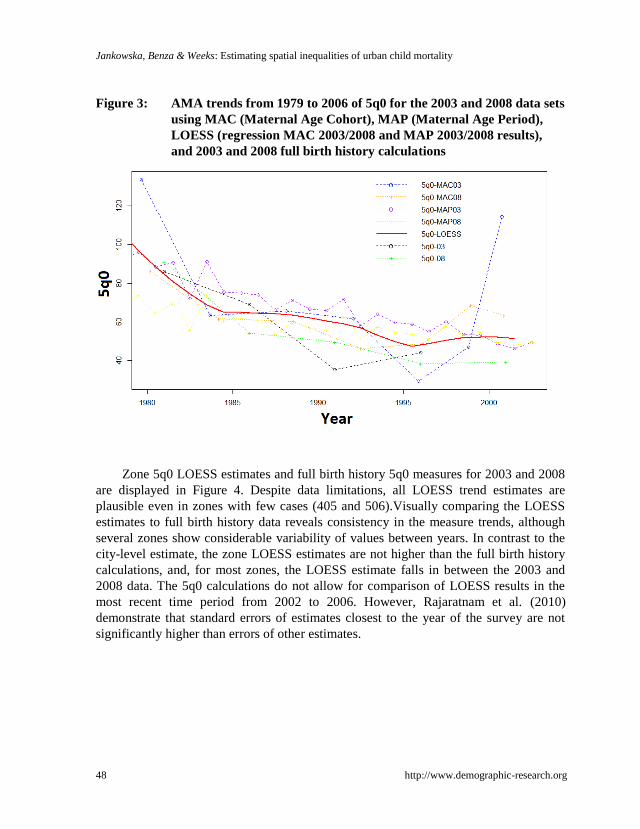
AMA trends of 5q0 between 1979 and 2006 from each method for both years of data
are displayed below in Figure 3. Overall, while all 5q0 measures follow a similar trend,
there is variation between each measure. The sensitivity of the MAC (Maternal Age
Cohort) method to limited data can be seen in the 2003 estimates; particularly the
extreme upward trend at year 2001. The 2003 data set has almost 600 fewer women and
1,500 fewer births than the 2008 data. The 2008 MAC estimate appears to coincide with
the more stable 2003 and 2008 MAP estimates. The 2003 MAP (Maternal Age Period)
trend begins with higher 5q0 estimates than the 2008 trend, but the two converge and
follow the same pattern starting around 1997.
Placing all estimates into a LOESS regression results in the red trend line pictured
in Figure 3. The 2001 LOESS 5q0 estimate for Accra is 51.4, almost the same as the
2008 DHS 5q0 measure for the greater Accra region—50.1—but much lower than the
Ghana urban rate of 74.7 and country-wide rate of 84.8 (GSS, GHS, and ICF Macro
2009). Both of these measures are higher than the 2008 birth history 5q0 calculation
which puts 2001 5q0 at 39.4. While there are differences between the 2003 and 2008
5q0 calculations from the full birth histories, the LOESS trend estimates a higher 5q0
than both starting after 1985. The consistently higher estimates of the MAC, MAP, and
combined LOESS are likely a result of country and sub-Saharan DHS trend effects used
in the model. These trends are much higher than the sub-region specific measures for
the greater Accra region.
Jankowska, Benza & Weeks: Estimating spatial inequalities of urban child mortality
48 http://www.demographic-research.org
Figure 3: AMA trends from 1979 to 2006 of 5q0 for the 2003 and 2008 data sets
using MAC (Maternal Age Cohort), MAP (Maternal Age Period),
LOESS (regression MAC 2003/2008 and MAP 2003/2008 results),
and 2003 and 2008 full birth history calculations
Zone 5q0 LOESS estimates and full birth history 5q0 measures for 2003 and 2008
are displayed in Figure 4. Despite data limitations, all LOESS trend estimates are
plausible even in zones with few cases (405 and 506).Visually comparing the LOESS
estimates to full birth history data reveals consistency in the measure trends, although
several zones show considerable variability of values between years. In contrast to the
city-level estimate, the zone LOESS estimates are not higher than the full birth history
calculations, and, for most zones, the LOESS estimate falls in between the 2003 and
2008 data. The 5q0 calculations do not allow for comparison of LOESS results in the
most recent time period from 2002 to 2006. However, Rajaratnam et al. (2010)
demonstrate that standard errors of estimates closest to the year of the survey are not
significantly higher than errors of other estimates.

Demographic Research: Volume 28, Article 2
http://www.demographic-research.org 49
Figure 4: LOESS trend estimates from 1980 to 2006 for each zone. Full birth-
history-derived calculations of 5q0 from the 2003 and 2008 data are
also shown for comparison
Jankowska, Benza & Weeks: Estimating spatial inequalities of urban child mortality
50 http://www.demographic-research.org
Pearson‘s correlation results between zone LOESS estimates demonstrate that the
zones share similar trends. All zones have positive correlations with each other with the
exception of zone 108, which is negatively correlated with all zones due to a gradually
increasing 5q0 trend. Zones 501 and 502, directly next to each other in the center of the
city, have a trend correlation of .98. Both zone trends are correlated at .95 or higher
with zones 101, 107, and 406. All of these zones are neighborhoods with relatively low
standards of living where higher child mortality might be expected. However, these
zones show consistent declines in child mortality over the years, indicating
improvements in child mortality even in the worst neighborhoods of Accra.
Average LOESS zone estimates for five-year intervals are mapped in Figure 5,
where 5q0 changes through time can be seen spatially. There is a clear citywide
reduction in 5q0 from the late 80s to the late 90s. However, some zones in the eastern
half of the city show an increase in the most recent LOESS estimate. In each five-year
interval there is considerable variability between the zone estimates. Without
confidence intervals, LOESS estimates cannot be compared between zones with any
degree of statistical certainty. However, the Figure 5 maps illustrate a relatively wide
range of 5q0 estimates between zones. The 1992 to 1996 interval 5q0 estimates range
from 23.7 to 83.5 while the 1997 to 2001 estimates range from 21.3 to 77.9, almost
identical to the 2002-2006 interval. These are differences in the range of 50 deaths per
1,000 births between zones in Accra.
The slum index, housing quality, and vegetation were scaled from 0 to 1 where
zero indicates best outcomes for the slum index and housing quality, but worst
outcomes for vegetation (zero indicates the least vegetation). The values were compared
to the 1997-2001 time interval of LOESS 5q0 zone estimates since all city data was
collected in year 2000. The data are also compared to change in 5q0 from 1992 to 2001.
Health facility data were collected in 2008 and were compared to both 1997-2001 and
2002-2006 time intervals. However, there was no relationship between the number of
clinics in a zone and the zone‘s measure of 5q0 (R2=0.03 for both years). Trendline R
2
values for the remaining measures are shown in Figure 6.
The left image of Figure 6 depicts values from the 1997-2001 time interval, and
we see expected relationships of zones with higher slum indexes, worse housing
quality, and less vegetation related to higher 5q0 estimates. The highest R2 score is for
the slum index. The right image of Figure 6 shows values for the change in 5q0 from
1992 to 2001. Here the story is more complex. Zones with more slum characteristics
and worse housing are associated with improvements in 5q0 rates, while increasing 5q0
is related to better housing quality, lower slum index, and more vegetation. It is
important to emphasize that this result is not only a function of the decreasing 5q0 rates
in low socio-economic zones like 101, 103, 501, 502, and 406 (Figure 5). At the same
time 5q0 appears to be increasing in better off zones such as 405 and 601.

Demographic Research: Volume 28, Article 2
http://www.demographic-research.org 51
Figure 5: LOESS five-year 5q0 estimates from 1987 to 2006 for zones in Accra
Figure 6: Trendlines of the scaled zone slum index, housing quality, and
vegetation as related to 1997-2001 zone 5q0 (left) and change in 5q0
from 1992 to 2001 (right)
Jankowska, Benza & Weeks: Estimating spatial inequalities of urban child mortality
52 http://www.demographic-research.org
5. Discussion
Emerging research increasingly demonstrates large urban differentials of child mortality
in the developing world, but there has been almost no research on intra-urban spatial
patterns beyond the findings that slums have higher levels of child mortality than non-
slum areas. This lack of research is due in part to the limitations of existing data
coupled with significant methodological barriers. In this paper, we explored the
effectiveness of the new low-cost method developed by Rajaratnam et al. (2010) at the
fine spatial scale of urban zones, dividing Accra, Ghana, into 16 such areas. The
approach taken in this paper demonstrates considerable potential for effectively
estimating small area 5q0 rates and opens up a number of possible paths forward. At the
same time the method raises a number of issues for deliberation.
5.1 Spatial data
As previously discussed, the primary issue with measuring intra-urban child mortality is
data. A significant conclusion of this study is that, in light of limited spatial data
sources, resourcefulness in augmenting and combining existing data can provide the
necessary numbers for calculating 5q0 rates at fine spatial scales. Spatial demographers
have yet to tackle other methods of enhancing child mortality data, such as utilizing
spatial models to assist in deriving missing data. For example, data can be imputed by
combining spatially extensive data with substantively intensive sample surveys (Elbers
et al. 2003; Hentschel et al. 2000; Wang 2003), or by using spatial models like kriging
or Bayesian modeling to fill in neighboring CEB or CD data gaps (Le, Sun and Zidek
1997; Stein 1999). Additionally, rather than ‗filling in the gaps‘ from existing data,
future researchers may choose to undertake a spatial sampling scheme that includes
respondents selected on the basis of a hierarchy of meaningful geographic boundaries.
In the complex urban environment, it may even be of interest to utilize the traditional
geographic approach of laying out a sampling grid.
Closely tied to the data is the determination of an appropriate scale of analysis – in
other words, how to delineate the data into bounded spaces. Spatial disaggregation of
already limited data sets proves to be a balancing act between obtaining a fine enough
spatial scale to assess differences within an urban area and ensuring enough data exist
in each unit for analysis. In aggregating localities into zones, we utilized an iterative
process of first aggregating localities based on satellite imagery and knowledge of the
city and then testing to see if our data threshold was met. The focus was to develop
geographical aggregations and boundaries that are true to on-the-ground processes
rather than arbitrary aggregations that were purely driven by data needs. We set a

Demographic Research: Volume 28, Article 2
http://www.demographic-research.org 53
threshold of 50 births per age cohort in each zone (with the exception of the 18-19
cohort). However, in creating zones that made social and physical sense, some
flexibility in meeting this threshold was required. In the future, such a threshold
warrants exploration, possibly through a sensitivity analysis of how small numbers of
births impact estimates. Zones that did not meet the data threshold in many age cohorts
(zones 405 and 506) resulted in estimates that were just as plausible as zones with better
data. Lower data requirements may allow for finer spatial disaggregation and more
precise knowledge about the spatial variability of child mortality in a city. Such an
analysis, while very important, was beyond the scope of this paper.
5.2 Calculating 5q0
In testing the Rajaratnam et al. method at the micro-scale of zones in Accra, we
conclude that the method has significant potential. At the city level, the method slightly
over-estimated child mortality when compared to calculated 5q0 for both 2003 and
2008 data. However, it was on trend, particularly when compared to the 2008 5q0
calculation. At the zone level, no over-estimation was observed, and LOESS estimates
were consistently between the 2003 and 2008 5q0 calculations. Visual comparison of
zone 5q0 rates with zone LOESS estimates allows us to conclude that the LOESS
estimates are plausible and reflective of calculated 5q0 rates. The robustness of the
LOESS performance across all zones, irrespective of data limitations, lends further
confidence in the LOESS results.
Due to the limitations of intra-urban child mortality data, we believe that the
Rajaratnam et al. method is particularly suited for exploring spatial patterns of 5q0. The
method offers considerable flexibility by utilizing summary rather than full birth
histories. It offers choices for developing measures that can use a combination of data
including children ever born, children dead, mother‘s age, and time since first birth.
Furthermore, the application of the LOESS regression allows multiple time points and
data sets to be fed into the analysis. This is of particular interest to researchers with
discrepant data sources that cannot be joined together. Surveys could be calibrated or
weighted to each other before spatial disaggregation, and 5q0 measures could be
calculated for each individual survey and then fed into LOESS. We believe this is the
best method currently available for small area 5q0 estimates.
There are multiple future steps to be taken to improve local estimates and achieve
statistical confidence in obtained estimates. The MAC, MAP, and LOESS methods all
draw on country-specific random effects and regional frequency distributions of births
and deaths from DHS surveys. Differences between urban and rural rates are often
large, and the inclusion of rural data in random effects and frequency distributions may

Jankowska, Benza & Weeks: Estimating spatial inequalities of urban child mortality
54 http://www.demographic-research.org
pull LOESS results upward. As the DHS is designed to be representative at the urban
and rural levels for almost all countries it is administered in, rural data could be
excluded in calculating random effects and frequency distributions. This would
effectively tailor MAC, MAP, and LOESS to be urban-specific and, presumably, to be
more accurate in intra-urban estimates.
The next step in testing the Rajaratnam et al. method will be to calculate
confidence intervals and perform a more robust estimate validation. Confidence
intervals will provide certainty in the possible range of 5q0 estimates, and will allow for
comparison of zones to determine if differences in 5q0 rates are statistically different
within the city. This is a key step in understanding how child mortality might be
influenced by differences in places. Further validation will be performed when the 2010
Ghana Census data are released, which includes CEB and CD for each female
respondent, and will provide cases in the hundreds of thousands.
5.3 Context and child mortality
Comparison of the LOESS estimates to measures of environmental and social
conditions in the zones yielded expected results in the 1997-2001 time period but
surprising results for the 1991 to 2001 trend. The significance of wealth differentials for
child mortality found in other studies leads to a natural assumption that neighborhoods
with more slum-like conditions and poorer housing quality may be the best targets for
health interventions. In Accra, we do see a correlation between poorer environmental
conditions and worse 5q0 estimates across all zones for the 1997-2001 period. However
when examining the trend over time, we actually see improving child mortality rates in
lower SES areas with concurrent deterioration in specific higher SES areas. While the
number of clinics in a zone had no trendline relationship to 5q0 or change in 5q0, the
results for the other variables may be indicative of the effectiveness of past and ongoing
interventions that reach out to perceived worst slums. At the same time, women in
zones 405 and 601, areas that are not perceived to be bad areas of the city, may not be
getting the care they need. Antai and Moradi (2010) point out that focusing
interventions on the most disadvantaged urban neighborhoods will exclude women who
may benefit from such interventions and are living in neighborhoods that do not
obviously qualify.
The spatial analysis helps to tease out the areas in the city that are doing well, as
well as areas that may be falling behind. Future research may focus on conducting a
multi-level analysis of the zones to better understand how individual and area-level
effects are impacting child mortality. Another area of potential research, and a
significant consideration for the results presented here, are the effects of migration.

Demographic Research: Volume 28, Article 2
http://www.demographic-research.org 55
Accra faces significant rural to urban migration as well as movement within the city as
women relocate to neighborhoods for economic or personal reasons. Migration may
impact the location of a woman‘s residence at the time of survey as compared to the
location of a woman at the time of losing a child. Furthermore, women in certain zones
may be more likely to have migrated than others. Understanding the impacts of
migration on small area child mortality estimates may be a fruitful area of study for
spatial demography.
An in-depth analysis of variance resulting from migration was beyond the scope of
this study; however, our data do provide information pertaining to a woman‘s
residential location in years past. As a basic assessment of a woman‘s duration of
residence at the place she was surveyed, we calculated the mean number of years that a
woman (aged 18-49) has lived at her current house of residence for each zone using the
2008 WHSA and HAWS data sets. Values ranged from 6 (zone 506) to 17 (zone 401).
Other than zone 506, only two other zones had average values below ten years – zones
201 and 101. These data cannot tell us if a woman moved within her neighborhood,
from a different neighborhood with similar or different characteristics, or from a
different town altogether. But, as most zones have an average residential period of at
least ten years, we can have some assurance that migration isn‘t severely impacting
LOESS estimates.
5.4 Incorporating spatial analysis into child mortality studies
The analysis presented here tested the Rajaratnam et al. method for urban zones in
Accra, Ghana. We conclude that the method has significant potential for small area
child mortality estimates and offers considerable flexibility to researchers grappling
with limited data resources. This study also demonstrates the need for examining intra-
urban child mortality: zones in Accra exhibit considerable variation in 5q0 rates with
differences as high as 50 deaths per 1,000 births between zones. This finding
underscores that child mortality is a complex demographic event that varies
significantly even within a city. Understanding child mortality and how it is affected by
other demographic events such as migration, the health transition, and changing family
structure might best be done in the urban environment where these processes are rapidly
playing out in close spatial proximities. The Rajaratnam et al. method provides an
important first step to the possibility of disaggregating child mortality estimates for
urban areas.
Jankowska, Benza & Weeks: Estimating spatial inequalities of urban child mortality
56 http://www.demographic-research.org
6. Acknowledgements
This research was funded in part by grant number R01 HD054906 from the Eunice
Kennedy Shriver National Institute of Child Health and Human Development (―Health,
Poverty and Place in Accra, Ghana,‖ John R. Weeks, Project Director/Principal
Investigator). The content is solely the responsibility of the authors and does not
necessarily represent the official views of the National Institute of Child Health and
Human Development or the National Institutes of Health. Additional funding was
provided by Hewlett/PRB (―Reproductive and Overall Health Outcomes and Their
Economic Consequences for Households in Accra, Ghana,‖ Allan G. Hill, Project
Director/Principal Investigator). The 2003 Women‘s Health Study of Accra was funded
by the World Health Organization, the US Agency for International Development, and
the Fulbright New Century Scholars Award (Allan G. Hill, Principal Investigator). The
generous support received during all phases of this study from the Institute for
Statistical, Social and Economic Research (ISSER - Director - Ernest Aryeetey), the
School of Public Health (Richard Adanu) and the Medical School (Rudolph Darko and
Richard Biritwum), and the University of Ghana is gratefully acknowledged. The
authors gratefully acknowledge feedback from Julie Rajaratnam, as well as valuable
comments from anonymous reviewers.

Demographic Research: Volume 28, Article 2
http://www.demographic-research.org 57
References
African Population Health Research Center (2002). Population and health dynamics in
Nairobi's informal settlements: Report of the Nairobi cross-sectional slums
survey (NCSS) 2000. Nairobi: APHRC.
Antai, D. and Moradi, T. (2010). Urban area disadvantage and under-5 mortality in
Nigeria: The effect of rapid urbanization. Environmental Health Perspectives
118(6): 877-883. doi:10.1289/ehp.0901306.
Balk, D., Pullum, T., Storeygard, A., Greenwell, F., and Neuman, M. (2004). A spatial
analysis of childhood mortality in West Africa. Population, Space and Place
10(3): 175-216. doi:10.1002/psp.328.
Boadi, K.O. and Kuitunen, M. (2006). Factors affecting the choice of cooking fuel,
cooking place and respiratory health in the Accra metropolitan area, Ghana.
Journal of Biosocial Science 38(3): 403-412. doi:10.1017/S0021932005026635.
Boutayeb, A. (2006). The double burden of communicable and non-communicable
diseases in developing countries. Transactions of the Royal Society of Tropical
Medicine and Hygiene 100(3): 191-199. doi:10.1016/j.trstmh.2005.07.021.
Cameron, L. and Williams, J. (2009). Is the relationship between socioeconomic status
and health stronger for older children in developing countries? Demography
46(2): 303-324. doi:10.1353/dem.0.0054.
Cleveland, W.S. and Loader, C. (1996). Smoothing by local regression: Principles and
methods. In: Haerdle, W. and Schimek, M.G. (eds.). Statistical theory and
computational aspects of smoothing. New York: Springer.
Dunn, J.R. and Cummins, S. (2007). Placing health in context. Social Science &
Medicine 65(9): 1821-1824. doi:10.1016/j.socscimed.2007.05.040.
Elbers, C., Lanjouw, P., Mistiaen, J., Özler, B., Simler, K., UN University, and World
Institute for Development Economics Research (2003). Are neighbours equal?
Estimating local inequality in three developing countries. United Nations
university. World institute for development economics research (UNU/WIDER).
Entwisle, B. (2007). Putting people into place. Demography 44(4): 687-703.
doi:10.1353/dem.2007.0045.
Ewbank, D.C. (1993). Effects of health programs on child mortality in sub-Saharan
Africa. Washington DC: National Academies Press.

Jankowska, Benza & Weeks: Estimating spatial inequalities of urban child mortality
58 http://www.demographic-research.org
Farah, A.A. and Preston, S.H. (1982). Child mortality differentials in Sudan. Population
and Development Review 8(2): 365-383. doi:10.2307/1972992.
Fay, M., Leipziger, D., Wodon, Q., and Yepes, T. (2005). Achieving child-health-
related millennium development goals: The role of infrastructure. World
Development 33(8): 1267-1284. doi:10.1016/j.worlddev.2005.03.001.
Feeney, G. (1980). Estimating infant mortality trends from child survivorship data.
Population Studies 34(1): 109-128. doi:10.2307/2173698.
Fry, S., Cousins, B., and Olivola, K. (2002). Health of children living in urban slums in
Asia and the near East: Review of existing literature and data. Environmental
Health Project, Activity Report. Washington, D.C.: USAID.
Garenne, M. (2010). Urbanisation and child health in resource poor settings with
special reference to under-five mortality in Africa. Archives of Disease in
Childhood 95(6): 464-468. doi:10.1136/adc.2009.172585.
Ghana Statistical Service (GSS), Ghana Health Service (GHS), and ICF Macro (2009).
Ghana demographic and health survey 2008. Calverton, MD: GSS, GHS, and
IFC Macro.
Ghana Statistical Service (GSS), Noguchi Memorial Institute for Medical Research
(NMIMR), and ORC Macro (2004). Ghana demographic and health survey,
2003. Calverton, MD: GSS, NMIMR, and ORC Macro.
Harttgen, K. and Misselhorn, M. (2006). A multilevel approach to explain child
mortality and undernutrition in South Asia and Sub-Saharan Africa. University
of Göttingen.
Hentschel, J., Lanjouw, J.O., Lanjouw, P., and Poggi, J. (2000). Combining census and
survey data to trace the spatial dimensions of poverty: A case study of Ecuador.
The World Bank Economic Review 14(1): 147-165. doi:10.1093/wber/14.1.147.
Hill, A. (1993). Trends in childhood mortality. In: Foote, K.A., Hill, K.H. and Martin,
L.G. (eds.). Demographic Change in Sub-Saharan Africa. Washington, D.C.:
National Academy Press: 153-217.
Hill, A.G., Darko, R., Seffah, J., Adanu, R.M.K., Anarfi, J.K., and Duda, R.B. (2007).
Health of urban Ghanaian women as identified by the Women's Health Study of
Accra. International Journal of Gynecology and Obstetrics 99(2): 150-156.
doi:10.1016/j.ijgo.2007.05.024.
Kravdal, Ø. (2004). Child mortality in India: The community-level effect of education.
Population Studies 58(2): 177-192. doi:10.1080/0032472042000213721.

Demographic Research: Volume 28, Article 2
http://www.demographic-research.org 59
Ladusingh, L. and Singh, C.H. (2006). Place, community education, gender and child
mortality in North-east India. Population, Space and Place 12(1): 65-76.
doi:10.1002/psp.393.
Le, N.D., Sun, W., and Zidek, J.V. (1997). Bayesian multivariate spatial interpolation
with data missing by design. Journal of the Royal Statistical Society: Series B
(Statistical Methodology) 59(2): 501-510. doi:10.1111/1467-9868.00081.
Montgomery, M. (2009). Urban poverty and health in developing countries. Population
reference bureau (PRB).
Montgomery, M. and Hewett, P.C. (2005). Urban poverty and health in developing
countries: Household and neighborhood effects. Demography 42(3): 397-425.
doi:10.1353/dem.2005.0020.
National Research Council (2007). Tools and methods for estimating populations at
risk from natural disasters and complex humanitarian crises. National Academy
Press.
Perera, B., Østbye, T., and Jayawardana, C. (2009). Neighborhood environment and
self-rated health among adults in southern Sri Lanka. International Journal of
Environmental Research and Public Health 6(8): 2102-2112. doi:10.3390/
ijerph6082102.
Pickett, K.E. and Pearl, M. (2001). Multilevel analyses of neighbourhood
socioeconomic context and health outcomes: A critical review. British Medical
Journal 55(2): 111-122. doi:10.1136/jech.55.2.111.
Rajaratnam, J.K., Tran, L.N., Lopez, A.D., and Murray, C.J.L. (2010). Measuring
under-five mortality: Validation of new low-cost methods. PLoS Medicine 7(4):
e1000253. doi:10.1371/journal.pmed.1000253.
Ridd, M.K. (1995). Exploring a V-I-S (vegetation-impervious surface-soil) model for
urban ecosystem analysis through remote sensing: Comparative anatomy for
cities. International Journal of Remote Sensing 16(12): 2165-2185.
doi:10.1080/01431169508954549.
Riva, M., Gauvin, L., and Barnett, T.A. (2007). Toward the next generation of research
into small area effects on health: A synthesis of multilevel investigations
published since July 1998. Journal of Epidemiology and Community Health
61(10): 853-861. doi:10.1136/jech.2006.050740.

Jankowska, Benza & Weeks: Estimating spatial inequalities of urban child mortality
60 http://www.demographic-research.org
Roberts, G. and Binder, D. (2009). Analyses based on combining similar information
from multiple surveys. In: Survey Research Methods Section of the Joint
Statistical Meetings (JSM). Washington, DC: 2138-2147.
Schenker, N. and Raghunathan, T.E. (2007). Combining information from multiple
surveys to enhance estimation of measures of health. Statistics in Medicine
26(8): 1802-1811. doi:10.1002/sim.2801.
Songsore, J. and McGranahan, G. (1993). Environment, wealth and health: Towards an
analysis of intra-urban differentials within the Greater Accra Metropolitan Area,
Ghana. Environment and Urbanization 5(2): 10-34. doi:10.1177/
095624789300500203.
Songsore, J. and McGranahan, G. (2007). Poverty and the Environmental Health
Agenda in a Low-income City: The Case of the Greater Accra Metropolitan
Area (GAMA), Ghana. In: Marcotullio, P. and Mcgranahan, G. (eds.) Scaling
urban environmental challenges: From local to global and back. London:
Earthscan: 132.
Stein, M.L. (1999). Interpolation of spatial data: Some theory for kriging. Springer
Verlag.
Stoler, J., Daniels, D., Weeks, J.R., Stow, D.A., Coulter, L.L., and Finch, B.K. (2012a).
Assessing the utility of satellite imagery with differing spatial resolutions for
deriving proxy measures of slum presence in Accra, Ghana. GIScience &
Remote Sensing 49(1): 31-52. doi:10.2747/1548-1603.49.1.31.
Stoler, J., Fink, G., Weeks, J.R., Otoo, R.A., Ampofo, J.A., and Hill, A.G. (2012b).
When urban taps run dry: Sachet water consumption and health effects in low
income neighborhoods of Accra, Ghana. Health & Place 18(2): 250-262.
doi:10.1016/j.healthplace.2011.09.020.
Timæus, I.M. and Lush, L. (1995). Intra-urban differentials in child health. Health
Transition Review 5(2): 163-190.
UN-Habitat (2003). The Challenge of Slums - Global Report on Human Settlements
2003. Nairobi, Kenya: UN-Habitat.
UN-Habitat and Ghana Statistical Service (2003). The Accra Slum Survey of 2003.
Nairobi: UN-Habitat.
United Nations Population Division (1983). Manual X: Indirect Techniques for
Demographic Estimation. New York: United Nations.

Demographic Research: Volume 28, Article 2
http://www.demographic-research.org 61
United Nations Population Division (2010). World Population Prospects, the 2010
Revision Data Online [electronic resource]. New York: Department of Economic
and Social Affairs, Population Division. http://www.un.org/esa/population/
unpop.htm.
Van de Poel, E., O'Donnell, O., and Van Doorslaer, E. (2007). Are urban children really
healthier? Evidence from 47 developing countries. Social Science & Medicine
65(10): 1986-2003.
Vlahov, D., Boufford, J.I., Pearson, C., and Norris, L. (2010). Urban Health in a Global
Perspective. In: Urban Health: Global Perspectives. San Francisco: Jossey-Bass.
Voss, P.R. (2007). Demography as a spatial social science. Population Research and
Policy Review 26(5-6): 457-476. doi:10.1007/s11113-007-9047-4.
Wang, L. (2003). Determinants of child mortality in LDCs: Empirical findings from
demographic and health surveys. Health Policy 65(3): 277-299. doi:10.1016/
S0168-8510(03)00039-3.
Weeks, J.R. (2011). Population: An Introduction to Concepts and Issues, Eleventh
Edition. Belmont, CA: Wadsworth Cengage Learning.
Weeks, J.R., Getis, A., Stow, D.A., Hill, A.G., Rain, D., Engstrom, R., Stoler, J.,
Lippitt, C., Jankowska, M., Lopez-Carr, A.C., Coulter, L., and Ofiesh, C. (2012).
Connecting the dots between health, poverty and place in Accra, Ghana. Annals
of the Association of American Geographers 102(5): 932-941. doi:10.1080/
00045608.2012.671132.
Weeks, J.R., Hill, A., Stow, D., Getis, A., and Fugate, D. (2007). Can we spot a
neighborhood from the air? Defining neighborhood structure in Accra, Ghana.
GeoJournal 69(1-2): 9-22. doi:10.1007/s10708-007-9098-4.

Jankowska, Benza & Weeks: Estimating spatial inequalities of urban child mortality
62 http://www.demographic-research.org