
Estimating potential costs and gains from an aquifer storage and recovery program in Australia
12
Estimating potential costs and gains from an aquifer storage and recovery program in Australia Shahbaz Khan a,b,c, *, Shahbaz Mushtaq b,c , Munir A. Hanjra a,b , Ju ¨ rgen Schaeffer d a Commonwealth Scientific and Industrial Research Organization, Land and Water, Wagga Wagga, NSW, Australia b International Centre of Water, Charles Sturt University, Wagga Wagga, NSW 2650, Australia c Cooperative Research Centre for Irrigation Futures, Australia d GHD Pty Ltd., Locked Bag 5 Morwell, Vic. 3840, Australia 1. Introduction Australia encompasses a range of climatic zones, including wet tropics, cool temperate zones, and deserts. Rainfall varies from an average of several meters per year, to areas averaging less than 200 mm. Australia’s climate is variable over time, with substantial variation in average annual rainfall (Khan et al., 2007; Kokic et al., 2007). Indeed, the term ‘average rainfall’ has little meaning in Australia, where rainfall variability and high levels of evapotranspira- tion produce a land of ‘droughts and flooding rains’ (Proust et al., 2007). The sporadic spatial and temporal distribution of rainfall motivates interest in managing water supply through storage to match the demand (Keller et al., 2000). The recent drought and the increase in concerns about climate change have highlighted the need to manage Australia’s water resources sustainably. Greater storage is needed to minimize the negative impacts of drought (Botzan et al., 1999; Khan et al., 2004a,b). Artificial recharge can provide water during drought periods for irrigation and environmental needs, and reverse falling groundwater levels (Khan et al., 2008). Storage in aquifers also prevents water losses due to leakage and evaporation from surface storage (Pratt Water, 2004a; Donovan et al., 2002; Khan et al., 2004a; Barnett et al., 2000; Dudding et al., 2006). agricultural water management 95 (2008) 477–488 article info Article history: Received 11 June 2007 Accepted 5 December 2007 Published on line 31 January 2008 Keywords: Groundwater Artificial storage and recovery Murrumbidgee Deep aquifers Drought Water allocation Water price abstract Artificial recharge of aquifer storage can provide water during drought periods, reverse falling groundwater levels and reduce water losses associated with leakage and evapora- tion, as compared with surface water storage. We examine the technical and economic potential of artificial storage and recovery for drought mitigation in the Murrumbidgee Region of New South Wales, Australia. Potential locations for infiltration basins and injec- tion/recovery wells are identified according to criteria such as water availability, aquifer suitability, recharge potential, and potential to provide a usable resource. The estimated annual artificial recharge potential is 180,000 ML through a combination of injection wells and infiltration basins. The cost estimates for artificial recharge vary from AU$ 62 ML 1 to AU$ 174 ML 1 depending on the choice of recharge method. Underground storage capacity can be developed at less than half the cost of surface storage facilities without undesirable environmental consequences or evaporation losses. The estimated benefits of artificial storage and recovery through infiltration basins are three to seven times the costs, during low allocation years. # 2007 Elsevier B.V. All rights reserved. * Corresponding author at: Charles Sturt University, International Centre of Water for Food Security, Building 24, Wagga Wagga, NSW 2650, Australia. Tel.: +61 2 6933 4933; fax: +61 2 6933 2647. E-mail address: [email protected] (S. Khan). available at www.sciencedirect.com journal homepage: www.elsevier.com/locate/agwat 0378-3774/$ – see front matter # 2007 Elsevier B.V. All rights reserved. doi:10.1016/j.agwat.2007.12.002
-
Upload
independent -
Category
Documents
-
view
2 -
download
0
Transcript of Estimating potential costs and gains from an aquifer storage and recovery program in Australia
a g r i c u l t u r a l w a t e r m a n a g e m e n t 9 5 ( 2 0 0 8 ) 4 7 7 – 4 8 8
avai lab le at www.sc iencedi rec t .com
journal homepage: www.e lsev ier .com/ locate /agwat
Estimating potential costs and gains from an aquifer storageand recovery program in Australia
Shahbaz Khan a,b,c,*, Shahbaz Mushtaq b,c, Munir A. Hanjra a,b, Jurgen Schaeffer d
aCommonwealth Scientific and Industrial Research Organization, Land and Water, Wagga Wagga, NSW, Australiab International Centre of Water, Charles Sturt University, Wagga Wagga, NSW 2650, AustraliacCooperative Research Centre for Irrigation Futures, AustraliadGHD Pty Ltd., Locked Bag 5 Morwell, Vic. 3840, Australia
a r t i c l e i n f o
Article history:
Received 11 June 2007
Accepted 5 December 2007
Published on line 31 January 2008
Keywords:
Groundwater
Artificial storage and recovery
Murrumbidgee
Deep aquifers
Drought
Water allocation
a b s t r a c t
Artificial recharge of aquifer storage can provide water during drought periods, reverse
falling groundwater levels and reduce water losses associated with leakage and evapora-
tion, as compared with surface water storage. We examine the technical and economic
potential of artificial storage and recovery for drought mitigation in the Murrumbidgee
Region of New South Wales, Australia. Potential locations for infiltration basins and injec-
tion/recovery wells are identified according to criteria such as water availability, aquifer
suitability, recharge potential, and potential to provide a usable resource. The estimated
annual artificial recharge potential is 180,000 ML through a combination of injection wells
and infiltration basins. The cost estimates for artificial recharge vary from AU$ 62 ML�1 to
AU$ 174 ML�1 depending on the choice of recharge method. Underground storage capacity
can be developed at less than half the cost of surface storage facilities without undesirable
environmental consequences or evaporation losses. The estimated benefits of artificial
through infiltration basins are three to seven times the costs, during
Water pricelow allocation years.storage and recovery
# 2007 Elsevier B.V. All rights reserved.
1. Introduction
Australia encompasses a range of climatic zones, including
wet tropics, cool temperate zones, and deserts. Rainfall
varies from an average of several meters per year, to areas
averaging less than 200 mm. Australia’s climate is variable
over time, with substantial variation in average annual
rainfall (Khan et al., 2007; Kokic et al., 2007). Indeed, the
term ‘average rainfall’ has little meaning in Australia,
where rainfall variability and high levels of evapotranspira-
tion produce a land of ‘droughts and flooding rains’
(Proust et al., 2007). The sporadic spatial and temporal
distribution of rainfall motivates interest in managing water
* Corresponding author at: Charles Sturt University, International CentrAustralia. Tel.: +61 2 6933 4933; fax: +61 2 6933 2647.
E-mail address: [email protected] (S. Khan).
0378-3774/$ – see front matter # 2007 Elsevier B.V. All rights reservedoi:10.1016/j.agwat.2007.12.002
supply through storage to match the demand (Keller et al.,
2000).
The recent drought and the increase in concerns about
climate change have highlighted the need to manage
Australia’s water resources sustainably. Greater storage is
needed to minimize the negative impacts of drought (Botzan
et al., 1999; Khan et al., 2004a,b). Artificial recharge can provide
water during drought periods for irrigation and environmental
needs, and reverse falling groundwater levels (Khan et al.,
2008). Storage in aquifers also prevents water losses due to
leakage and evaporation from surface storage (Pratt Water,
2004a; Donovan et al., 2002; Khan et al., 2004a; Barnett et al.,
2000; Dudding et al., 2006).
e of Water for Food Security, Building 24, Wagga Wagga, NSW 2650,
d.

a g r i c u l t u r a l w a t e r m a n a g e m e n t 9 5 ( 2 0 0 8 ) 4 7 7 – 4 8 8478
Aquifer storage and recovery, known also as managed
aquifer recharge, is the process of artificially recharging
aquifers by infiltrating water through permeable media or
by direct injection through tubewells. The goal is to store water
in a suitable aquifer during times when water is available, and
recover water from the same aquifer when it is needed (Dillon,
2005; Pyne, 1995; Dudding et al., 2006). Large volumes can be
stored underground, reducing or eliminating the need to
construct surface reservoirs and minimizing evaporation
losses. Aquifer storage and recovery (ASR) has been utilised
throughout the world to enhance local and regional water
resources (Khan et al., 2004a).
In the Murrumbidgee Region of New South Wales,
Australia, up to 350,000 ML of water per year are lost from
the system due to evaporation, supply and storage inefficien-
cies, and on farm losses (Khan et al., 2004c). Through the
development of an ASR scheme, current storage could be
utilised to augment the groundwater system, thus increasing
water in storage in the region. During periods of drought or low
rainfall, groundwater could be utilised for maintaining some
security of water supply. During periods of plentiful rainfall
artificial recharge would replenish the groundwater system
and potentially help to restore groundwater dependent
ecosystems within the region.
The aim of this paper is to examine the technical and
economic potential of ASR for drought mitigation in the
Murrumbidgee Region. We evaluate potential water avail-
ability, water quality, and potential locations for ASR in the
study area. We estimate the cost of artificial storage and
recharge schemes using infiltration basins and injection wells.
We develop a hypothetical scheme that demonstrates the
potential of artificial storage and recovery for drought
mitigation at the regional scale.
2. Literature review
Aquifer storage and recovery is a relatively recent develop-
ment. The first investigations of injecting potable water into
saline aquifers were conducted about 50 years ago (Ceder-
strom, 1957). In early trials the injected water formed a lens or
bubble of potable water within the saline groundwater.
Current methods of artificial recharge include surface
spreading, infiltration pits or basins, and injection wells
(Bouwer, 1989; EPA South Australia, 2004; Sheng, 2005; Dudding
etal.,2006;Pavelicetal.,2007).Surfacespreadingandinfiltration
pits and basins allow water to infiltrate into an aquifer largely by
passive means, requiring less energy. However, there must be a
good hydraulic connection between the surface and the aquifer,
with no impermeable layers separating the two (Dillon, 2005).
Injection wells are used in areas where impermeable strata
between the surface and the aquifer make recharge by surface
infiltration impractical or in areas where land for surface
spreading is limited (Pavelic et al., 2007).
A key factor in the operation of an ASR well is its recovery
efficiency, defined as the percentage of water volume stored
that is subsequently recovered, while meeting a target water
quality criterion in the recovered water (Pyne, 1995). Recovery
efficiency tends to improve with successive cycles when the
same volume of water is stored in each cycle because the
residual water not recovered in one cycle becomes a transition
or buffer zone of marginal quality surrounding the stored
water in the next cycle (Pyne, 1995). Indications from ASR sites
around the world suggest that in saline aquifers efficiency can
reach 85% (Reese, 2002), while in non-saline aquifers efficiency
can approach 100% depending on the nature of the ground-
water system. Hydro-geological and design factors are
important to the recovery of non-saline water from within a
saline aquifer (Reese, 2002).
The potential benefits of ASR and artificial recharge, as
adapted from Pyne (1995) and Pratt Water (2004a) include:
� s
easonal, long term and emergency storage,� r
estoration of groundwater levels,� m
aintenance of distribution system pressure and flow,� im
provement of water quality,� p
revention of saltwater intrusion,� r
eduction of environmental effects of streamflow diver-sions,
� a
gricultural water supply,� n
utrient reduction in agricultural runoff,� e
nhancement of wellfield production,� d
eferred expansion of water facilities,� c
ompensation for surface salinity barrier leakage losses,� r
eclaimed water storage for reuse, soil aquifer treatment,� h
ydraulic control of contaminant plumes,� m
inimisation of surface storage costs and evaporativelosses, and
� s
torage capacity losses.The costs of ASR programs vary with location and depend
primarily on land acquisition, water pre-treatment, environ-
mental regulations and permitting, design and construction,
and operation and maintenance costs (Pitman, 1999; Topper
et al., 2004). The estimated initial capital cost of a 100 ML ASR
program in South Australia is about AU$ 2000 ML�1 (Dillon,
2005). The estimated capital cost of a 200 ML ASR program in
Salisbury, Australia is AU$ 625 ML�1 (Pitman, 1999).
Employing a comparative benefit–cost analysis, using cost
assessment simulation and employing weighted coefficients
rather than market prices, Botzan et al. (1999) show significant
benefits from artificially recharging the aquifer adjacent to the
San Joaquin River in California. Similarly, Donovan et al. (2002)
report net savings of about $700 per year during a 20-year period
of recharging an aquifer in the Las Vegas Valley. Acharya and
Barbier (2000) use a production function approach to value
groundwater recharge in northern Nigeria. A 1 m decrease in
groundwater recharge (from 6 m to 7 m), reduces welfare in
households growing vegetables by an estimated 7.6%. As 77% of
the households produce vegetables and wheat, this might have
significant implications for equity. Hussain et al. (2004) provide
similar evidence for the upper Indus Basin.
3. Study area
Benefit–cost analyses of aquifer storage and recovery pro-
grams in Australia are rare. Our goal is to provide such a study
for the Murrumbidgee catchment, which extends from the
Snowy Mountains in the east to the juncture of the
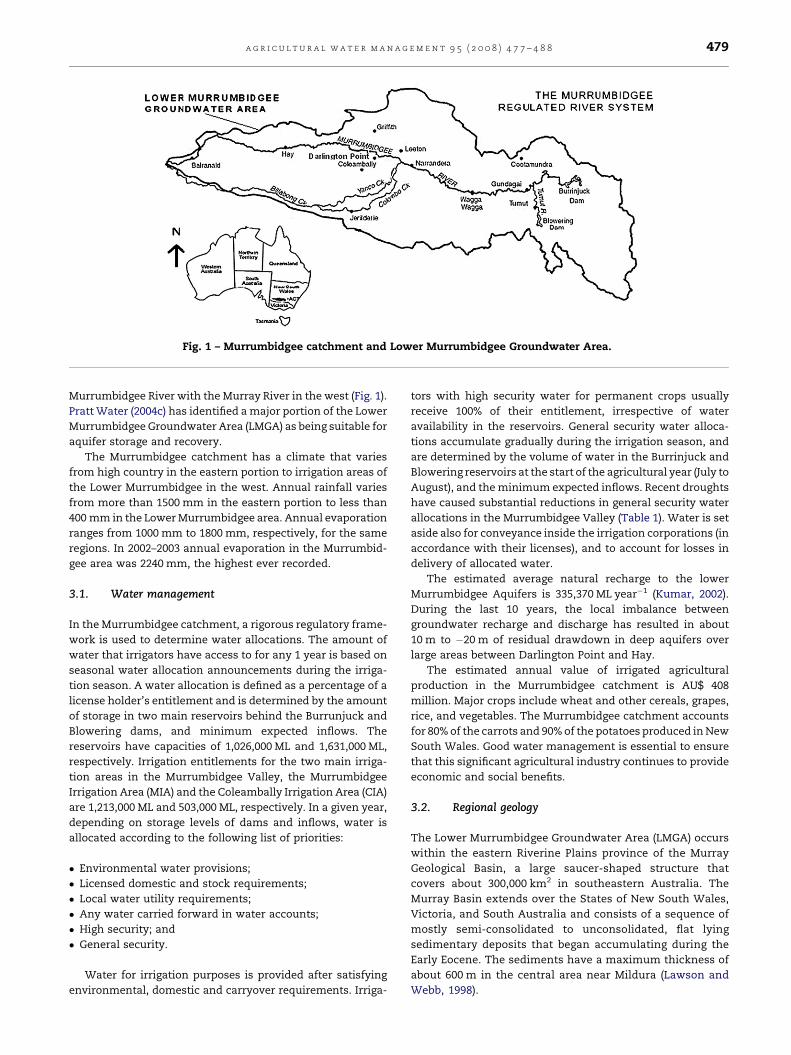
Fig. 1 – Murrumbidgee catchment and Lower Murrumbidgee Groundwater Area.
a g r i c u l t u r a l w a t e r m a n a g e m e n t 9 5 ( 2 0 0 8 ) 4 7 7 – 4 8 8 479
Murrumbidgee River with the Murray River in the west (Fig. 1).
Pratt Water (2004c) has identified a major portion of the Lower
Murrumbidgee Groundwater Area (LMGA) as being suitable for
aquifer storage and recovery.
The Murrumbidgee catchment has a climate that varies
from high country in the eastern portion to irrigation areas of
the Lower Murrumbidgee in the west. Annual rainfall varies
from more than 1500 mm in the eastern portion to less than
400 mm in the Lower Murrumbidgee area. Annual evaporation
ranges from 1000 mm to 1800 mm, respectively, for the same
regions. In 2002–2003 annual evaporation in the Murrumbid-
gee area was 2240 mm, the highest ever recorded.
3.1. Water management
In the Murrumbidgee catchment, a rigorous regulatory frame-
work is used to determine water allocations. The amount of
water that irrigators have access to for any 1 year is based on
seasonal water allocation announcements during the irriga-
tion season. A water allocation is defined as a percentage of a
license holder’s entitlement and is determined by the amount
of storage in two main reservoirs behind the Burrunjuck and
Blowering dams, and minimum expected inflows. The
reservoirs have capacities of 1,026,000 ML and 1,631,000 ML,
respectively. Irrigation entitlements for the two main irriga-
tion areas in the Murrumbidgee Valley, the Murrumbidgee
Irrigation Area (MIA) and the Coleambally Irrigation Area (CIA)
are 1,213,000 ML and 503,000 ML, respectively. In a given year,
depending on storage levels of dams and inflows, water is
allocated according to the following list of priorities:
� E
nvironmental water provisions;� L
icensed domestic and stock requirements;� L
ocal water utility requirements;� A
ny water carried forward in water accounts;� H
igh security; and� G
eneral security.Water for irrigation purposes is provided after satisfying
environmental, domestic and carryover requirements. Irriga-
tors with high security water for permanent crops usually
receive 100% of their entitlement, irrespective of water
availability in the reservoirs. General security water alloca-
tions accumulate gradually during the irrigation season, and
are determined by the volume of water in the Burrinjuck and
Blowering reservoirs at the start of the agricultural year (July to
August), and the minimum expected inflows. Recent droughts
have caused substantial reductions in general security water
allocations in the Murrumbidgee Valley (Table 1). Water is set
aside also for conveyance inside the irrigation corporations (in
accordance with their licenses), and to account for losses in
delivery of allocated water.
The estimated average natural recharge to the lower
Murrumbidgee Aquifers is 335,370 ML year�1 (Kumar, 2002).
During the last 10 years, the local imbalance between
groundwater recharge and discharge has resulted in about
10 m to �20 m of residual drawdown in deep aquifers over
large areas between Darlington Point and Hay.
The estimated annual value of irrigated agricultural
production in the Murrumbidgee catchment is AU$ 408
million. Major crops include wheat and other cereals, grapes,
rice, and vegetables. The Murrumbidgee catchment accounts
for 80% of the carrots and 90% of the potatoes produced in New
South Wales. Good water management is essential to ensure
that this significant agricultural industry continues to provide
economic and social benefits.
3.2. Regional geology
The Lower Murrumbidgee Groundwater Area (LMGA) occurs
within the eastern Riverine Plains province of the Murray
Geological Basin, a large saucer-shaped structure that
covers about 300,000 km2 in southeastern Australia. The
Murray Basin extends over the States of New South Wales,
Victoria, and South Australia and consists of a sequence of
mostly semi-consolidated to unconsolidated, flat lying
sedimentary deposits that began accumulating during the
Early Eocene. The sediments have a maximum thickness of
about 600 m in the central area near Mildura (Lawson and
Webb, 1998).
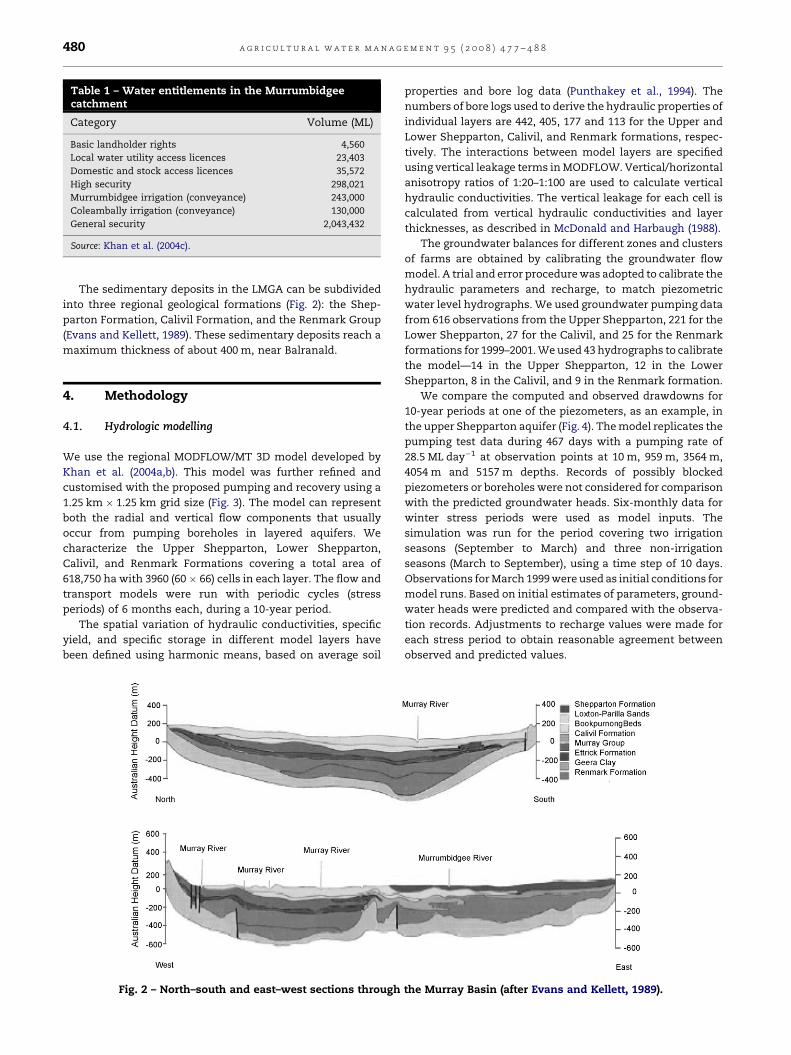
Table 1 – Water entitlements in the Murrumbidgeecatchment
Category Volume (ML)
Basic landholder rights 4,560
Local water utility access licences 23,403
Domestic and stock access licences 35,572
High security 298,021
Murrumbidgee irrigation (conveyance) 243,000
Coleambally irrigation (conveyance) 130,000
General security 2,043,432
Source: Khan et al. (2004c).
a g r i c u l t u r a l w a t e r m a n a g e m e n t 9 5 ( 2 0 0 8 ) 4 7 7 – 4 8 8480
The sedimentary deposits in the LMGA can be subdivided
into three regional geological formations (Fig. 2): the Shep-
parton Formation, Calivil Formation, and the Renmark Group
(Evans and Kellett, 1989). These sedimentary deposits reach a
maximum thickness of about 400 m, near Balranald.
4. Methodology
4.1. Hydrologic modelling
We use the regional MODFLOW/MT 3D model developed by
Khan et al. (2004a,b). This model was further refined and
customised with the proposed pumping and recovery using a
1.25 km � 1.25 km grid size (Fig. 3). The model can represent
both the radial and vertical flow components that usually
occur from pumping boreholes in layered aquifers. We
characterize the Upper Shepparton, Lower Shepparton,
Calivil, and Renmark Formations covering a total area of
618,750 ha with 3960 (60 � 66) cells in each layer. The flow and
transport models were run with periodic cycles (stress
periods) of 6 months each, during a 10-year period.
The spatial variation of hydraulic conductivities, specific
yield, and specific storage in different model layers have
been defined using harmonic means, based on average soil
Fig. 2 – North–south and east–west sections through
properties and bore log data (Punthakey et al., 1994). The
numbers of bore logs used to derive the hydraulic properties of
individual layers are 442, 405, 177 and 113 for the Upper and
Lower Shepparton, Calivil, and Renmark formations, respec-
tively. The interactions between model layers are specified
using vertical leakage terms in MODFLOW. Vertical/horizontal
anisotropy ratios of 1:20–1:100 are used to calculate vertical
hydraulic conductivities. The vertical leakage for each cell is
calculated from vertical hydraulic conductivities and layer
thicknesses, as described in McDonald and Harbaugh (1988).
The groundwater balances for different zones and clusters
of farms are obtained by calibrating the groundwater flow
model. A trial and error procedure was adopted to calibrate the
hydraulic parameters and recharge, to match piezometric
water level hydrographs. We used groundwater pumping data
from 616 observations from the Upper Shepparton, 221 for the
Lower Shepparton, 27 for the Calivil, and 25 for the Renmark
formations for 1999–2001. We used 43 hydrographs to calibrate
the model—14 in the Upper Shepparton, 12 in the Lower
Shepparton, 8 in the Calivil, and 9 in the Renmark formation.
We compare the computed and observed drawdowns for
10-year periods at one of the piezometers, as an example, in
the upper Shepparton aquifer (Fig. 4). The model replicates the
pumping test data during 467 days with a pumping rate of
28.5 ML day�1 at observation points at 10 m, 959 m, 3564 m,
4054 m and 5157 m depths. Records of possibly blocked
piezometers or boreholes were not considered for comparison
with the predicted groundwater heads. Six-monthly data for
winter stress periods were used as model inputs. The
simulation was run for the period covering two irrigation
seasons (September to March) and three non-irrigation
seasons (March to September), using a time step of 10 days.
Observations for March 1999 were used as initial conditions for
model runs. Based on initial estimates of parameters, ground-
water heads were predicted and compared with the observa-
tion records. Adjustments to recharge values were made for
each stress period to obtain reasonable agreement between
observed and predicted values.
the Murray Basin (after Evans and Kellett, 1989).
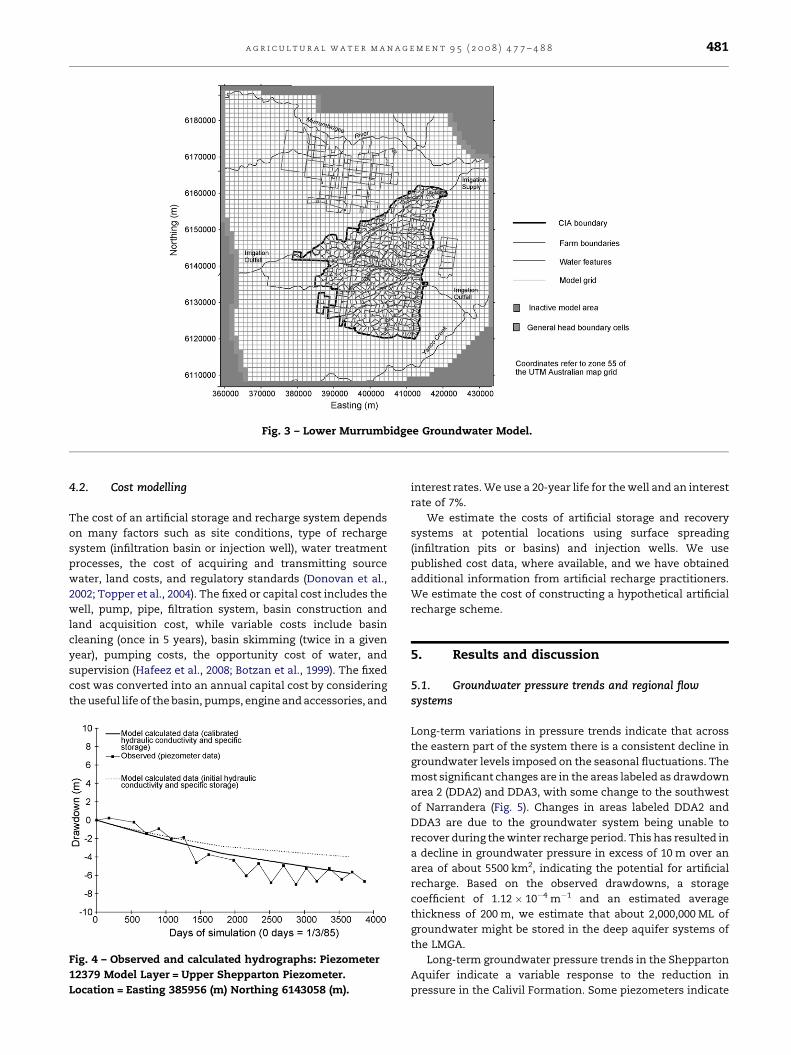
Fig. 3 – Lower Murrumbidgee Groundwater Model.
a g r i c u l t u r a l w a t e r m a n a g e m e n t 9 5 ( 2 0 0 8 ) 4 7 7 – 4 8 8 481
4.2. Cost modelling
The cost of an artificial storage and recharge system depends
on many factors such as site conditions, type of recharge
system (infiltration basin or injection well), water treatment
processes, the cost of acquiring and transmitting source
water, land costs, and regulatory standards (Donovan et al.,
2002; Topper et al., 2004). The fixed or capital cost includes the
well, pump, pipe, filtration system, basin construction and
land acquisition cost, while variable costs include basin
cleaning (once in 5 years), basin skimming (twice in a given
year), pumping costs, the opportunity cost of water, and
supervision (Hafeez et al., 2008; Botzan et al., 1999). The fixed
cost was converted into an annual capital cost by considering
the useful life of the basin, pumps, engine and accessories, and
Fig. 4 – Observed and calculated hydrographs: Piezometer
12379 Model Layer = Upper Shepparton Piezometer.
Location = Easting 385956 (m) Northing 6143058 (m).
interest rates. We use a 20-year life for the well and an interest
rate of 7%.
We estimate the costs of artificial storage and recovery
systems at potential locations using surface spreading
(infiltration pits or basins) and injection wells. We use
published cost data, where available, and we have obtained
additional information from artificial recharge practitioners.
We estimate the cost of constructing a hypothetical artificial
recharge scheme.
5. Results and discussion
5.1. Groundwater pressure trends and regional flowsystems
Long-term variations in pressure trends indicate that across
the eastern part of the system there is a consistent decline in
groundwater levels imposed on the seasonal fluctuations. The
most significant changes are in the areas labeled as drawdown
area 2 (DDA2) and DDA3, with some change to the southwest
of Narrandera (Fig. 5). Changes in areas labeled DDA2 and
DDA3 are due to the groundwater system being unable to
recover during the winter recharge period. This has resulted in
a decline in groundwater pressure in excess of 10 m over an
area of about 5500 km2, indicating the potential for artificial
recharge. Based on the observed drawdowns, a storage
coefficient of 1.12 � 10�4 m�1 and an estimated average
thickness of 200 m, we estimate that about 2,000,000 ML of
groundwater might be stored in the deep aquifer systems of
the LMGA.
Long-term groundwater pressure trends in the Shepparton
Aquifer indicate a variable response to the reduction in
pressure in the Calivil Formation. Some piezometers indicate
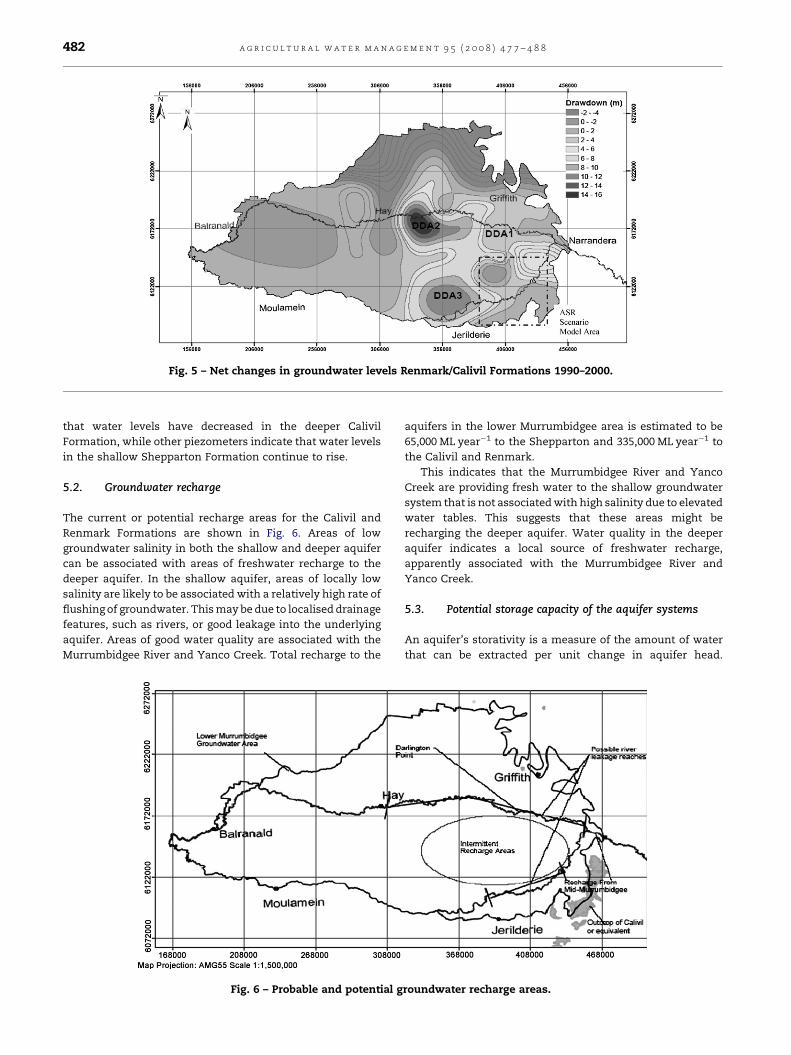
Fig. 5 – Net changes in groundwater levels Renmark/Calivil Formations 1990–2000.
a g r i c u l t u r a l w a t e r m a n a g e m e n t 9 5 ( 2 0 0 8 ) 4 7 7 – 4 8 8482
that water levels have decreased in the deeper Calivil
Formation, while other piezometers indicate that water levels
in the shallow Shepparton Formation continue to rise.
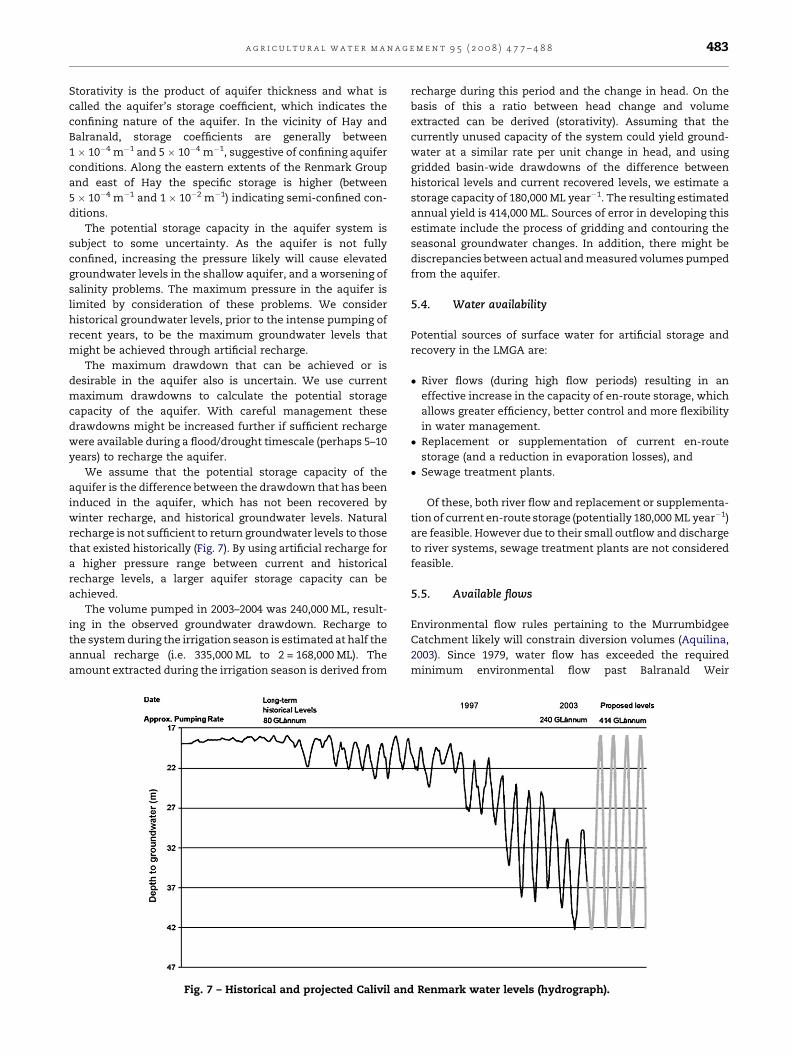
5.2. Groundwater recharge
The current or potential recharge areas for the Calivil and
Renmark Formations are shown in Fig. 6. Areas of low
groundwater salinity in both the shallow and deeper aquifer
can be associated with areas of freshwater recharge to the
deeper aquifer. In the shallow aquifer, areas of locally low
salinity are likely to be associated with a relatively high rate of
flushing of groundwater. This may be due to localised drainage
features, such as rivers, or good leakage into the underlying
aquifer. Areas of good water quality are associated with the
Murrumbidgee River and Yanco Creek. Total recharge to the
Fig. 6 – Probable and potential g
aquifers in the lower Murrumbidgee area is estimated to be
65,000 ML year�1 to the Shepparton and 335,000 ML year�1 to
the Calivil and Renmark.
This indicates that the Murrumbidgee River and Yanco
Creek are providing fresh water to the shallow groundwater
system that is not associated with high salinity due to elevated
water tables. This suggests that these areas might be
recharging the deeper aquifer. Water quality in the deeper
aquifer indicates a local source of freshwater recharge,
apparently associated with the Murrumbidgee River and
Yanco Creek.
5.3. Potential storage capacity of the aquifer systems
An aquifer’s storativity is a measure of the amount of water
that can be extracted per unit change in aquifer head.
roundwater recharge areas.
a g r i c u l t u r a l w a t e r m a n a g e m e n t 9 5 ( 2 0 0 8 ) 4 7 7 – 4 8 8 483
Storativity is the product of aquifer thickness and what is
called the aquifer’s storage coefficient, which indicates the
confining nature of the aquifer. In the vicinity of Hay and
Balranald, storage coefficients are generally between
1 � 10�4 m�1 and 5 � 10�4 m�1, suggestive of confining aquifer
conditions. Along the eastern extents of the Renmark Group
and east of Hay the specific storage is higher (between
5 � 10�4 m�1 and 1 � 10�2 m�1) indicating semi-confined con-
ditions.
The potential storage capacity in the aquifer system is
subject to some uncertainty. As the aquifer is not fully
confined, increasing the pressure likely will cause elevated
groundwater levels in the shallow aquifer, and a worsening of
salinity problems. The maximum pressure in the aquifer is
limited by consideration of these problems. We consider
historical groundwater levels, prior to the intense pumping of
recent years, to be the maximum groundwater levels that
might be achieved through artificial recharge.
The maximum drawdown that can be achieved or is
desirable in the aquifer also is uncertain. We use current
maximum drawdowns to calculate the potential storage
capacity of the aquifer. With careful management these
drawdowns might be increased further if sufficient recharge
were available during a flood/drought timescale (perhaps 5–10
years) to recharge the aquifer.
We assume that the potential storage capacity of the
aquifer is the difference between the drawdown that has been
induced in the aquifer, which has not been recovered by
winter recharge, and historical groundwater levels. Natural
recharge is not sufficient to return groundwater levels to those
that existed historically (Fig. 7). By using artificial recharge for
a higher pressure range between current and historical
recharge levels, a larger aquifer storage capacity can be
achieved.
The volume pumped in 2003–2004 was 240,000 ML, result-
ing in the observed groundwater drawdown. Recharge to
the system during the irrigation season is estimated at half the
annual recharge (i.e. 335,000 ML to 2 = 168,000 ML). The
amount extracted during the irrigation season is derived from
Fig. 7 – Historical and projected Calivil an
recharge during this period and the change in head. On the
basis of this a ratio between head change and volume
extracted can be derived (storativity). Assuming that the
currently unused capacity of the system could yield ground-
water at a similar rate per unit change in head, and using
gridded basin-wide drawdowns of the difference between
historical levels and current recovered levels, we estimate a
storage capacity of 180,000 ML year�1. The resulting estimated
annual yield is 414,000 ML. Sources of error in developing this
estimate include the process of gridding and contouring the
seasonal groundwater changes. In addition, there might be
discrepancies between actual and measured volumes pumped
from the aquifer.
5.4. Water availability
Potential sources of surface water for artificial storage and
recovery in the LMGA are:
� R
d R
iver flows (during high flow periods) resulting in an
effective increase in the capacity of en-route storage, which
allows greater efficiency, better control and more flexibility
in water management.
� R
eplacement or supplementation of current en-routestorage (and a reduction in evaporation losses), and
� S
ewage treatment plants.Of these, both river flow and replacement or supplementa-
tion of current en-route storage (potentially 180,000 ML year�1)
are feasible. However due to their small outflow and discharge
to river systems, sewage treatment plants are not considered
feasible.
5.5. Available flows
Environmental flow rules pertaining to the Murrumbidgee
Catchment likely will constrain diversion volumes (Aquilina,
2003). Since 1979, water flow has exceeded the required
minimum environmental flow past Balranald Weir
enmark water levels (hydrograph).
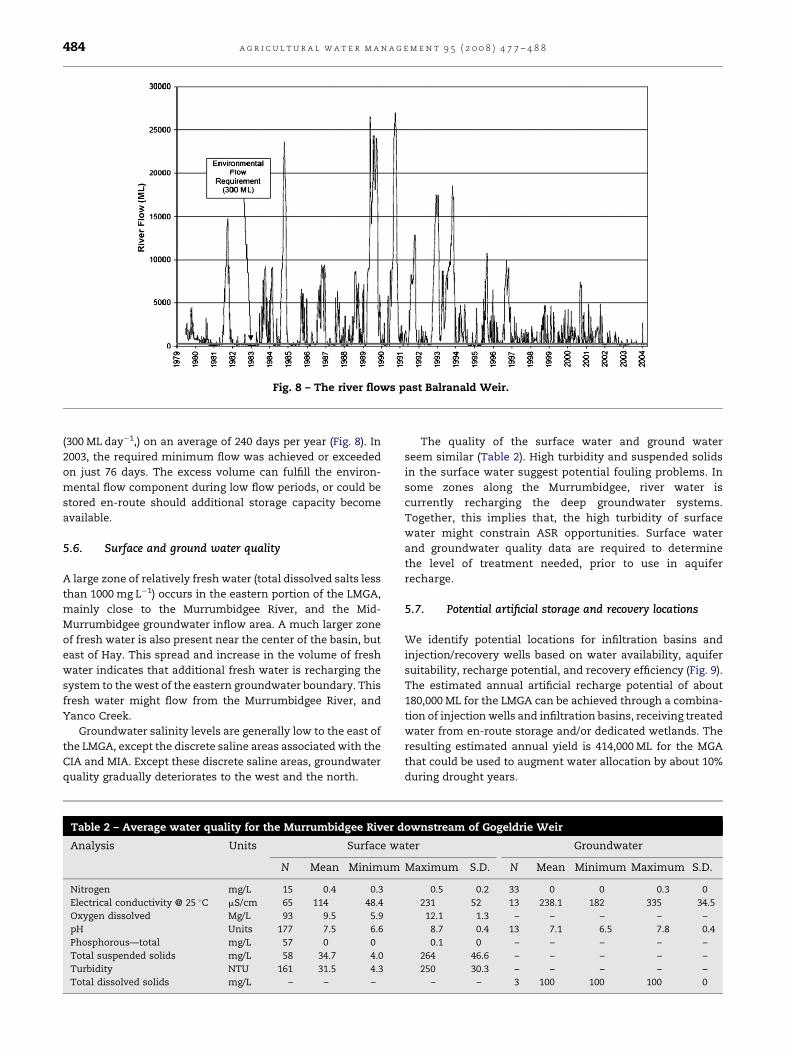
Fig. 8 – The river flows past Balranald Weir.
a g r i c u l t u r a l w a t e r m a n a g e m e n t 9 5 ( 2 0 0 8 ) 4 7 7 – 4 8 8484
(300 ML day�1,) on an average of 240 days per year (Fig. 8). In
2003, the required minimum flow was achieved or exceeded
on just 76 days. The excess volume can fulfill the environ-
mental flow component during low flow periods, or could be
stored en-route should additional storage capacity become
available.
5.6. Surface and ground water quality
A large zone of relatively fresh water (total dissolved salts less
than 1000 mg L�1) occurs in the eastern portion of the LMGA,
mainly close to the Murrumbidgee River, and the Mid-
Murrumbidgee groundwater inflow area. A much larger zone
of fresh water is also present near the center of the basin, but
east of Hay. This spread and increase in the volume of fresh
water indicates that additional fresh water is recharging the
system to the west of the eastern groundwater boundary. This
fresh water might flow from the Murrumbidgee River, and
Yanco Creek.
Groundwater salinity levels are generally low to the east of
the LMGA, except the discrete saline areas associated with the
CIA and MIA. Except these discrete saline areas, groundwater
quality gradually deteriorates to the west and the north.
Table 2 – Average water quality for the Murrumbidgee River d
Analysis Units Surface wa
N Mean Minimum
Nitrogen mg/L 15 0.4 0.3
Electrical conductivity @ 25 8C mS/cm 65 114 48.4
Oxygen dissolved Mg/L 93 9.5 5.9
pH Units 177 7.5 6.6
Phosphorous—total mg/L 57 0 0
Total suspended solids mg/L 58 34.7 4.0
Turbidity NTU 161 31.5 4.3
Total dissolved solids mg/L – – –
The quality of the surface water and ground water
seem similar (Table 2). High turbidity and suspended solids
in the surface water suggest potential fouling problems. In
some zones along the Murrumbidgee, river water is
currently recharging the deep groundwater systems.
Together, this implies that, the high turbidity of surface
water might constrain ASR opportunities. Surface water
and groundwater quality data are required to determine
the level of treatment needed, prior to use in aquifer
recharge.
5.7. Potential artificial storage and recovery locations
We identify potential locations for infiltration basins and
injection/recovery wells based on water availability, aquifer
suitability, recharge potential, and recovery efficiency (Fig. 9).
The estimated annual artificial recharge potential of about
180,000 ML for the LMGA can be achieved through a combina-
tion of injection wells and infiltration basins, receiving treated
water from en-route storage and/or dedicated wetlands. The
resulting estimated annual yield is 414,000 ML for the MGA
that could be used to augment water allocation by about 10%
during drought years.
ownstream of Gogeldrie Weir
ter Groundwater
Maximum S.D. N Mean Minimum Maximum S.D.
0.5 0.2 33 0 0 0.3 0
231 52 13 238.1 182 335 34.5
12.1 1.3 – – – – –
8.7 0.4 13 7.1 6.5 7.8 0.4
0.1 0 – – – – –
264 46.6 – – – – –
250 30.3 – – – – –
– – 3 100 100 100 0
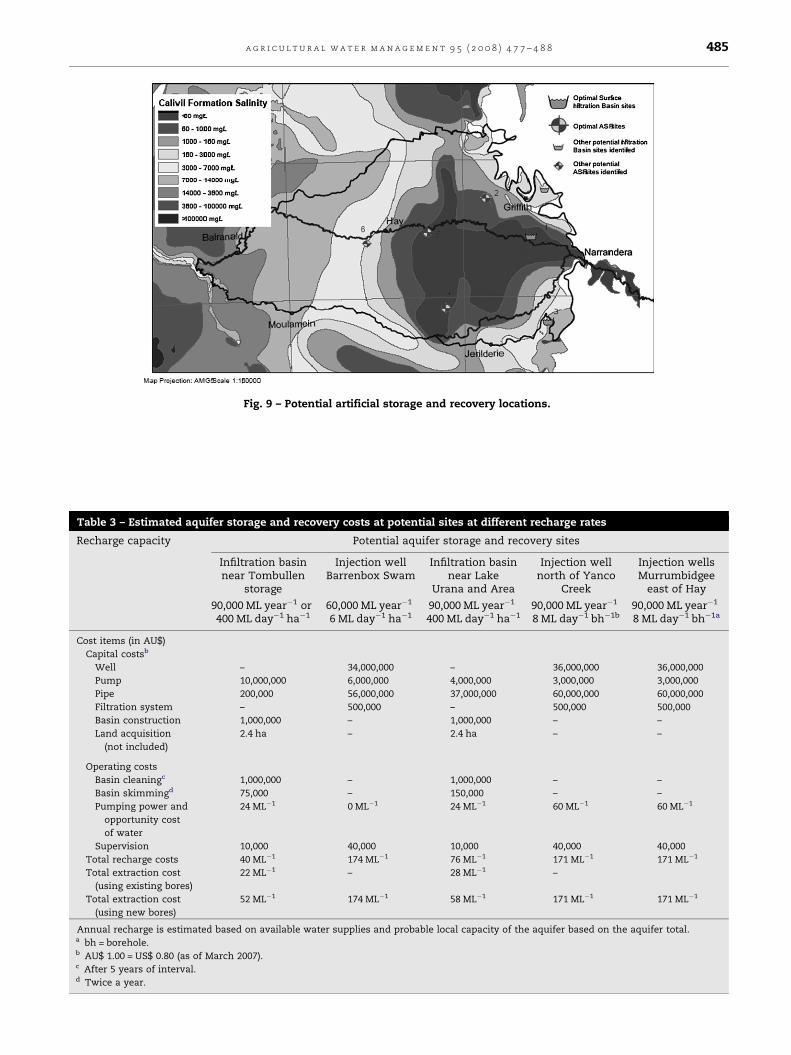
Fig. 9 – Potential artificial storage and recovery locations.
Table 3 – Estimated aquifer storage and recovery costs at potential sites at different recharge rates
Recharge capacity Potential aquifer storage and recovery sites
Infiltration basinnear Tombullen
storage
Injection wellBarrenbox Swam
Infiltration basinnear Lake
Urana and Area
Injection wellnorth of Yanco
Creek
Injection wellsMurrumbidgee
east of Hay
90,000 ML year�1 or400 ML day�1 ha�1
60,000 ML year�1
6 ML day�1 ha�190,000 ML year�1
400 ML day�1 ha�190,000 ML year�1
8 ML day�1 bh�1b90,000 ML year�1
8 ML day�1 bh�1a
Cost items (in AU$)
Capital costsb
Well – 34,000,000 – 36,000,000 36,000,000
Pump 10,000,000 6,000,000 4,000,000 3,000,000 3,000,000
Pipe 200,000 56,000,000 37,000,000 60,000,000 60,000,000
Filtration system – 500,000 – 500,000 500,000
Basin construction 1,000,000 – 1,000,000 – –
Land acquisition
(not included)
2.4 ha – 2.4 ha – –
Operating costs
Basin cleaningc 1,000,000 – 1,000,000 – –
Basin skimmingd 75,000 – 150,000 – –
Pumping power and
opportunity cost
of water
24 ML�1 0 ML�1 24 ML�1 60 ML�1 60 ML�1
Supervision 10,000 40,000 10,000 40,000 40,000
Total recharge costs 40 ML�1 174 ML�1 76 ML�1 171 ML�1 171 ML�1
Total extraction cost
(using existing bores)
22 ML�1 – 28 ML�1 –
Total extraction cost
(using new bores)
52 ML�1 174 ML�1 58 ML�1 171 ML�1 171 ML�1
Annual recharge is estimated based on available water supplies and probable local capacity of the aquifer based on the aquifer total.a bh = borehole.b AU$ 1.00 = US$ 0.80 (as of March 2007).c After 5 years of interval.d Twice a year.
a g r i c u l t u r a l w a t e r m a n a g e m e n t 9 5 ( 2 0 0 8 ) 4 7 7 – 4 8 8 485
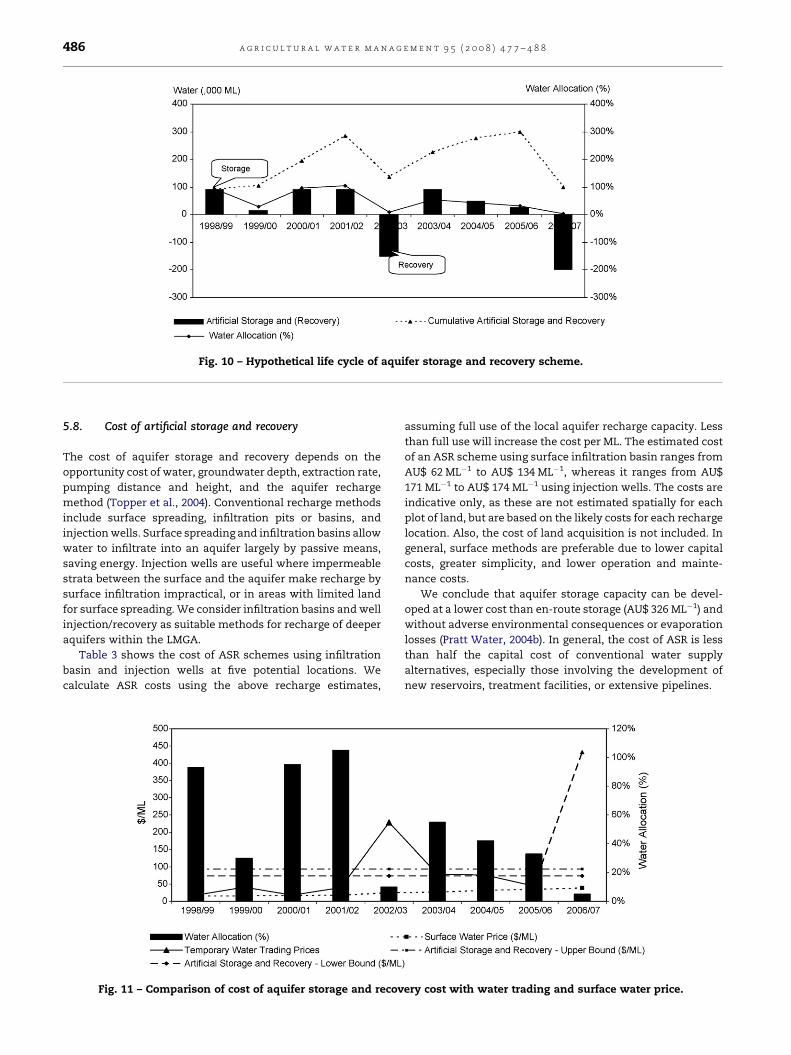
Fig. 10 – Hypothetical life cycle of aquifer storage and recovery scheme.
a g r i c u l t u r a l w a t e r m a n a g e m e n t 9 5 ( 2 0 0 8 ) 4 7 7 – 4 8 8486
5.8. Cost of artificial storage and recovery
The cost of aquifer storage and recovery depends on the
opportunity cost of water, groundwater depth, extraction rate,
pumping distance and height, and the aquifer recharge
method (Topper et al., 2004). Conventional recharge methods
include surface spreading, infiltration pits or basins, and
injection wells. Surface spreading and infiltration basins allow
water to infiltrate into an aquifer largely by passive means,
saving energy. Injection wells are useful where impermeable
strata between the surface and the aquifer make recharge by
surface infiltration impractical, or in areas with limited land
for surface spreading. We consider infiltration basins and well
injection/recovery as suitable methods for recharge of deeper
aquifers within the LMGA.
Table 3 shows the cost of ASR schemes using infiltration
basin and injection wells at five potential locations. We
calculate ASR costs using the above recharge estimates,
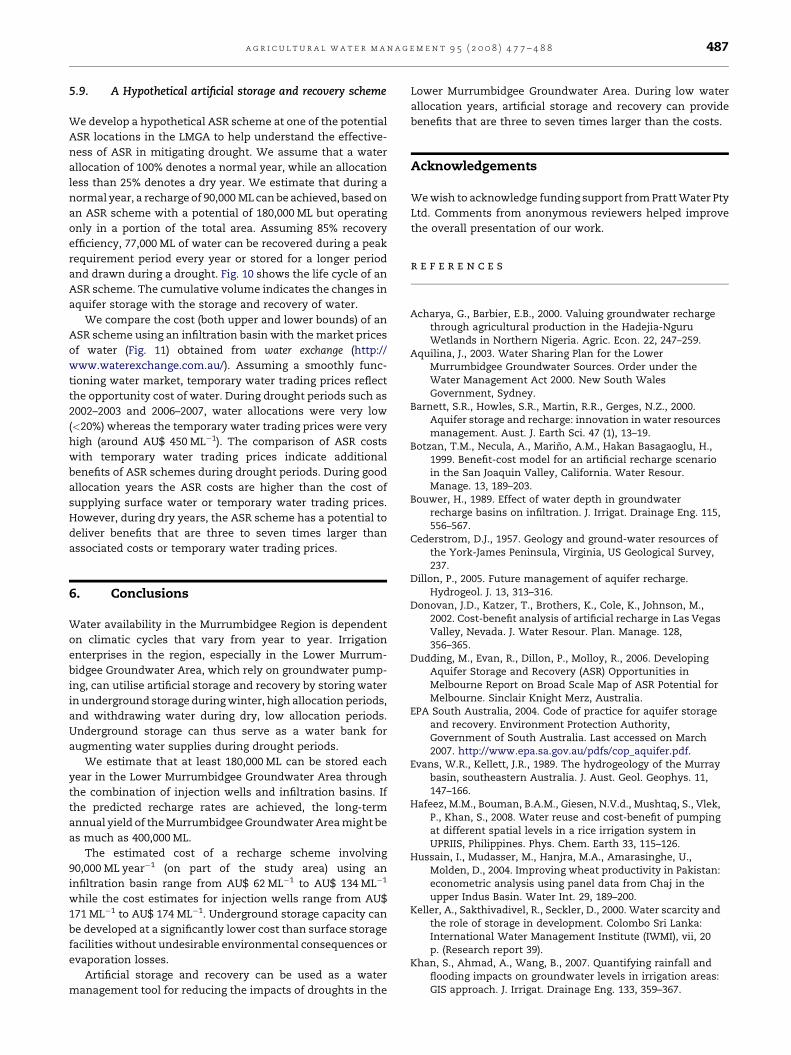
Fig. 11 – Comparison of cost of aquifer storage and recov
assuming full use of the local aquifer recharge capacity. Less
than full use will increase the cost per ML. The estimated cost
of an ASR scheme using surface infiltration basin ranges from
AU$ 62 ML�1 to AU$ 134 ML�1, whereas it ranges from AU$
171 ML�1 to AU$ 174 ML�1 using injection wells. The costs are
indicative only, as these are not estimated spatially for each
plot of land, but are based on the likely costs for each recharge
location. Also, the cost of land acquisition is not included. In
general, surface methods are preferable due to lower capital
costs, greater simplicity, and lower operation and mainte-
nance costs.
We conclude that aquifer storage capacity can be devel-
oped at a lower cost than en-route storage (AU$ 326 ML�1) and
without adverse environmental consequences or evaporation
losses (Pratt Water, 2004b). In general, the cost of ASR is less
than half the capital cost of conventional water supply
alternatives, especially those involving the development of
new reservoirs, treatment facilities, or extensive pipelines.
ery cost with water trading and surface water price.
a g r i c u l t u r a l w a t e r m a n a g e m e n t 9 5 ( 2 0 0 8 ) 4 7 7 – 4 8 8 487
5.9. A Hypothetical artificial storage and recovery scheme
We develop a hypothetical ASR scheme at one of the potential
ASR locations in the LMGA to help understand the effective-
ness of ASR in mitigating drought. We assume that a water
allocation of 100% denotes a normal year, while an allocation
less than 25% denotes a dry year. We estimate that during a
normal year, a recharge of 90,000 ML can be achieved, based on
an ASR scheme with a potential of 180,000 ML but operating
only in a portion of the total area. Assuming 85% recovery
efficiency, 77,000 ML of water can be recovered during a peak
requirement period every year or stored for a longer period
and drawn during a drought. Fig. 10 shows the life cycle of an
ASR scheme. The cumulative volume indicates the changes in
aquifer storage with the storage and recovery of water.
We compare the cost (both upper and lower bounds) of an
ASR scheme using an infiltration basin with the market prices
of water (Fig. 11) obtained from water exchange (http://
www.waterexchange.com.au/). Assuming a smoothly func-
tioning water market, temporary water trading prices reflect
the opportunity cost of water. During drought periods such as
2002–2003 and 2006–2007, water allocations were very low
(<20%) whereas the temporary water trading prices were very
high (around AU$ 450 ML�1). The comparison of ASR costs
with temporary water trading prices indicate additional
benefits of ASR schemes during drought periods. During good
allocation years the ASR costs are higher than the cost of
supplying surface water or temporary water trading prices.
However, during dry years, the ASR scheme has a potential to
deliver benefits that are three to seven times larger than
associated costs or temporary water trading prices.
6. Conclusions
Water availability in the Murrumbidgee Region is dependent
on climatic cycles that vary from year to year. Irrigation
enterprises in the region, especially in the Lower Murrum-
bidgee Groundwater Area, which rely on groundwater pump-
ing, can utilise artificial storage and recovery by storing water
in underground storage during winter, high allocation periods,
and withdrawing water during dry, low allocation periods.
Underground storage can thus serve as a water bank for
augmenting water supplies during drought periods.
We estimate that at least 180,000 ML can be stored each
year in the Lower Murrumbidgee Groundwater Area through
the combination of injection wells and infiltration basins. If
the predicted recharge rates are achieved, the long-term
annual yield of the Murrumbidgee Groundwater Area might be
as much as 400,000 ML.
The estimated cost of a recharge scheme involving
90,000 ML year�1 (on part of the study area) using an
infiltration basin range from AU$ 62 ML�1 to AU$ 134 ML�1
while the cost estimates for injection wells range from AU$
171 ML�1 to AU$ 174 ML�1. Underground storage capacity can
be developed at a significantly lower cost than surface storage
facilities without undesirable environmental consequences or
evaporation losses.
Artificial storage and recovery can be used as a water
management tool for reducing the impacts of droughts in the
Lower Murrumbidgee Groundwater Area. During low water
allocation years, artificial storage and recovery can provide
benefits that are three to seven times larger than the costs.
Acknowledgements
We wish to acknowledge funding support from Pratt Water Pty
Ltd. Comments from anonymous reviewers helped improve
the overall presentation of our work.
r e f e r e n c e s
Acharya, G., Barbier, E.B., 2000. Valuing groundwater rechargethrough agricultural production in the Hadejia-NguruWetlands in Northern Nigeria. Agric. Econ. 22, 247–259.
Aquilina, J., 2003. Water Sharing Plan for the LowerMurrumbidgee Groundwater Sources. Order under theWater Management Act 2000. New South WalesGovernment, Sydney.
Barnett, S.R., Howles, S.R., Martin, R.R., Gerges, N.Z., 2000.Aquifer storage and recharge: innovation in water resourcesmanagement. Aust. J. Earth Sci. 47 (1), 13–19.
Botzan, T.M., Necula, A., Marino, A.M., Hakan Basagaoglu, H.,1999. Benefit-cost model for an artificial recharge scenarioin the San Joaquin Valley, California. Water Resour.Manage. 13, 189–203.
Bouwer, H., 1989. Effect of water depth in groundwaterrecharge basins on infiltration. J. Irrigat. Drainage Eng. 115,556–567.
Cederstrom, D.J., 1957. Geology and ground-water resources ofthe York-James Peninsula, Virginia, US Geological Survey,237.
Dillon, P., 2005. Future management of aquifer recharge.Hydrogeol. J. 13, 313–316.
Donovan, J.D., Katzer, T., Brothers, K., Cole, K., Johnson, M.,2002. Cost-benefit analysis of artificial recharge in Las VegasValley, Nevada. J. Water Resour. Plan. Manage. 128,356–365.
Dudding, M., Evan, R., Dillon, P., Molloy, R., 2006. DevelopingAquifer Storage and Recovery (ASR) Opportunities inMelbourne Report on Broad Scale Map of ASR Potential forMelbourne. Sinclair Knight Merz, Australia.
EPA South Australia, 2004. Code of practice for aquifer storageand recovery. Environment Protection Authority,Government of South Australia. Last accessed on March2007. http://www.epa.sa.gov.au/pdfs/cop_aquifer.pdf.
Evans, W.R., Kellett, J.R., 1989. The hydrogeology of the Murraybasin, southeastern Australia. J. Aust. Geol. Geophys. 11,147–166.
Hafeez, M.M., Bouman, B.A.M., Giesen, N.V.d., Mushtaq, S., Vlek,P., Khan, S., 2008. Water reuse and cost-benefit of pumpingat different spatial levels in a rice irrigation system inUPRIIS, Philippines. Phys. Chem. Earth 33, 115–126.
Hussain, I., Mudasser, M., Hanjra, M.A., Amarasinghe, U.,Molden, D., 2004. Improving wheat productivity in Pakistan:econometric analysis using panel data from Chaj in theupper Indus Basin. Water Int. 29, 189–200.
Keller, A., Sakthivadivel, R., Seckler, D., 2000. Water scarcity andthe role of storage in development. Colombo Sri Lanka:International Water Management Institute (IWMI), vii, 20p. (Research report 39).
Khan, S., Ahmad, A., Wang, B., 2007. Quantifying rainfall andflooding impacts on groundwater levels in irrigation areas:GIS approach. J. Irrigat. Drainage Eng. 133, 359–367.

a g r i c u l t u r a l w a t e r m a n a g e m e n t 9 5 ( 2 0 0 8 ) 4 7 7 – 4 8 8488
Khan, S., Rana, T., Hanjra, M.A., 2008. A cross disciplinaryframework for linking farms with regional groundwater andsalinity management targets. Agric. Water Manage. 95 (1),35–47.
Khan, S., Paydar, Z., Rana, T., 2004a. Net recharge targets tomeet regional environmental goals. CSIRO Land and WaterTechnical Report, 14/2004.
Khan, S., Blackwell, J., Rana, T., Leitte, A., 2004b. Surface-groundwater and intra-aquifer interactions: how to establish andprotect sustainable potential of aquifers. The 9th Murray-Darling Basin Groundwater Workshop. February 17–19,Bendigo (on CD).
Khan, S., Akbar, S., Rana, T., Abbas, A., Robinson, D.,Dassanayke, D., Hirsi, I., Blackwell, J., Xevi, E., Carmichael,A., 2004c. Hydrologic economic ranking of water savingoptions in Murrumbidgee Valley: Water EfficiencyFeasibility Project. Consultancy Report to Pratt Water PtyLtd., Australia.
Kokic, P., Nelson, R., Meinke, H., Potgieter, A., Carter, J., 2007.From rainfall to farm incomes-transforming advice forAustralian drought policy. I. Development and testing of abioeconomic modelling system. Aust. J. Agric. Res. 58 (10),993–1003.
Kumar, N., 2002. Review of groundwater use and groundwaterlevel behaviour in the Lower Murrumbidgee, GroundwaterManagement Area 002. Groundwater Status Report Number6. Department of Land and Water Conservation,Murrumbidgee Region, Australia.
Lawson, S., Webb, E., 1998. Review of groundwater use andgroundwater level behaviour in the Lower MurrumbidgeeValley. Groundwater Status Report No. 5, Department ofLand and Water Conservation, Murrumbidgee Region,Technical Report No. 98/05.
McDonald, M.G., Harbaugh, A.W., 1988. MODFLOW: A modularthree-dimensional finite-difference groundwater flowmodel. U.S.G.S., Scientific Publications, Washington.
Pavelic, P., Dillon, P.J., Barry, E.K., Vanderzalm, J.L., Correll, R.L.,Rinck-Pfeiffer, S.M., 2007. Water quality effects on clogging
rates during reclaimed water ASR in a carbonate aquifer. J.Hydrol. 334, 1–16.
Pitman, C., 1999. ASR Economics; User perspectives andattitudes, In ‘‘Aquifer Storage and Recovery’’, Centre forGroundwater Studies and SA Artificial RechargeCoordinating Committee short course, Adelaide, October27–29.
Pratt Water, 2004a. Feasibility of Aquifer Storage and RecoveryMurrumbidgee Region. GHD Pty Ltd., Victoria, Australia.
Pratt Water, 2004b. Murrumbidgee En-route Storages Report.GHD Pty Ltd., Victoria, Australia.
Pratt Water, 2004c. The Business of Saving Water—The Reportof the Murrumbidgee Valley Water Efficiency Project.Published by Pratt Water, Victoria, Australia.
Proust, K., Dovers, S., Foran, B., Newell, B., Steffen, W., Troy, P.,2007. Climate, energy and water: accounting for the links.Discussion paper. Land & Water Australia, Canberra. http://www.lwa.gov.au/downloads/publications_pdf/ER071256.pdf.
Punthakey, J.F., Someratne, N.M., Prathapar, S.A., Merrick, N.P.,Lawson, S., Williams, R.M., 1994. Regional GroundwaterModelling of the Lower Murrumbidgee River Basin: ModelDevelopment and Calibration. Department of WaterResources Technical Services Division, MurrumbidgeeRegion, Leeton (TS 94.069).
Pyne, R.D.G., 1995. Groundwater Recharge and Wells: A Guide toAquifer Storage Recovery. Lewis Publishers, Boca Raton, FL.
Reese, R., 2002. Inventory and review of aquifer storageand recovery in Southern Florida. USGS Report,WRI 02-4036.
Sheng, Z., 2005. An aquifer storage and recovery system withreclaimed wastewater to preserve native groundwaterresources in El Paso, Texas. J. Environ. Manage. 75,367–377.
Topper, R., Barkmann, P.E., Bird, D.R., Sares, M,A., 2004. Artificialgroundwater recharge and management. State of the artwater supply practices. SEWRPC Technical Report No. 43.http://www.sewrpc.org/watersupplystudy/pdfs/tr-43_chapter-06_preliminary_draft.pdf.