Incomplete-market dynamics in a neoclassical production economy
Upload
independentCategory
view
1download
0
Estimating Average Precision withIncomplete and Imperfect Judgments
Emine Yilmaz, Javed A. Aslam∗
College of Computer and Information ScienceNortheastern University
360 Huntington Ave, #202 WVHBoston, MA 02115
{emine, jaa}@ccs.neu.edu
ABSTRACTWe consider the problem of evaluating retrieval systems us-ing incomplete judgment information. Buckley and Voorheesrecently demonstrated that retrieval systems can be effi-ciently and effectively evaluated using incomplete judgmentsvia the bpref measure [6]. When relevance judgments arecomplete, the value of bpref is an approximation to thevalue of average precision using complete judgments. How-ever, when relevance judgments are incomplete, the value ofbpref deviates from this value, though it continues to ranksystems in a manner similar to average precision evaluatedwith a complete judgment set. In this work, we proposethree evaluation measures that (1) are approximations toaverage precision even when the relevance judgments are in-complete and (2) are more robust to incomplete or imperfectrelevance judgments than bpref. The proposed estimates ofaverage precision are simple and accurate, and we demon-strate the utility of these estimates using TREC data.
Categories and Subject DescriptorsH.3.4 [Information Storage and Retrieval]: Systemsand Software – Performance evaluation (efficiency and ef-fectiveness)
General TermsTheory, Measurement, Experimentation
KeywordsEvaluation, Sampling, Incomplete Judgments, Average Pre-cision, Bpref
1. INTRODUCTION∗We gratefully acknowledge the support provided by NSFgrants CCF-0418390 and IIS-0534482.
Permission to make digital or hard copies of all or part of this work forpersonal or classroom use is granted without fee provided that copies arenot made or distributed for profit or commercial advantage and that copiesbear this notice and the full citation on the first page. To copy otherwise, torepublish, to post on servers or to redistribute to lists, requires prior specificpermission and/or a fee.CIKM ’06, November 5-11, 2006, Arlington, Virginia, USA.Copyright 2006 ACM 1-59593-433-2/06/0011 ...$5.00.
We consider the problem of evaluating retrieval systems.The test collection methodology adopted by TREC (theCranfield paradigm [9]) is one of the most commonly usedmethodologies in evaluating retrieval systems. In this testcollection methodology, the evaluation of retrieval systemstypically involves (1) assembling a document collection, (2)creating a set of information needs (topics), and (3) identi-fying the set of documents relevant to the topics.
There are several simplifying assumptions made by theCranfield paradigm. One of the main assumptions is thatthe relevance judgments are complete, i.e., for each topic, allrelevant documents in the document collection are identified.When the document collection is large, obtaining completerelevance judgments is problematic due to the need for sig-nificant human effort.
In order to avoid judging the entire document collection,TREC uses a technique called pooling, where in the case ofdepth-100 pooling, for example, only the top 100 documentsretrieved by the systems are judged and the rest of the doc-uments in the collection are assumed to be nonrelevant. Instandard TREC settings, depth-100 pools tend to includemany or most of the relevant documents, and depth-100pooling has been shown to be an effective way to evaluatethe relative performance of retrieval systems while avoidingjudging the entire collection [12, 17].
Much recent research has attempted to address the as-sessment effort required for large-scale retrieval evaluation.Soboroff et al. [15] describe a technique for ranking systemswithout relevance judgments, though it has been argued thatwithout any relevance assessments, such evaluations tend torank systems by “popularity” rather than “performance” [3].Cormack et al. [10] and Aslam et al. [2] describe greedy algo-rithms for creating pools likely to contain large numbers ofrelevant documents, but evaluations using such pools tend toproduce biased or unprovable estimates of standard retrievalmeasures, especially when the total number of judgments islimited.
In this paper, we consider the evaluation of retrieval sys-tems using incomplete relevance information. When thedocument collection is dynamic, as in the case of web re-trieval, documents are added to the collection over time.Hence, the relevance judgments become incomplete, and thejudged relevant documents become a smaller random sub-set of the entire relevant document set. Another problemassociated with dynamic collections is that as time passes,some documents may be deleted from the collection; one ex-ample of this is broken links in the case of the web. Even
102

though these documents are no longer in the collection, therelevance judgments will still include these documents. Suchrelevance judgment sets are said to be imperfect [14, 6].
When the document collection is large, there may be manyrelevant documents in the collection, and the depth-100 pool-ing method may not be able to identify all relevant doc-uments. Also, in the case of large collections, identifyingand judging all relevant documents becomes very expensive.Hence, the relevance judgments for large collections are alsousually incomplete. Therefore, in the case of dynamic orlarge document collections, if current pooling methodologiesare used to identify the relevant documents in a collection,an evaluation measure that is both robust with respect toincomplete and imperfect relevance information and that isalso highly correlated with standard measures of retrievalperformance is desirable. Such a measure would enable thesafe usage of dynamic or larger document collections usingthe current evaluation methodology.
Recently, Buckley and Voorhees showed that average pre-cision and other current evaluation measures are not robustto incomplete relevance judgments, and they proposed a newmeasure for efficiently and effectively evaluating retrievalsystems [6]. When complete relevance judgments are avail-able, this new measure, bpref, is shown to rank systems in amanner similar to average precision. Furthermore, bpref isshown to be relatively stable even when the relevance judg-ments are highly incomplete or imperfect. Thus, bpref holdspromise for the efficient and effective evaluation (ranking)of retrieval systems using large or dynamic document col-lections.
After bpref was proposed, it became a standard evalua-tion measure in trec eval (the evaluation program used inTREC), and it has been commonly used in places such asthe Terabyte track [8] and the HARD track [1]. When com-plete relevance judgments are present, the value of bpref isclose to average precision. However, when the judgment setis incomplete, the value of bpref deviates from the value ofaverage precision, both in absolute terms and in its abilityto rank systems via the evaluation returned.
Average precision is one of the most commonly used andcited system-oriented measures of retrieval effectiveness. Itis known to be a stable [5] and highly informative mea-sure [4]. If average precision is considered the “gold stan-dard” for evaluating retrieval effectiveness, an evaluationmeasure that is both highly correlated with average preci-sion and also robust to incomplete and imperfect relevancejudgments is desired.
In this paper, we propose three new evaluation measuresthat are both robust to incomplete and imperfect relevanceinformation and are also estimates of average precision it-self. In order of complexity and accuracy, these measuresare (1) Induced Average Precision, (2) Subcollection Aver-age Precision, and (3) Inferred Average Precision. Inducedaverage precision only considers the documents present inthe judged subsample, and computes the average precisionof the induced list once the unjudged documents are re-moved. Subcollection average precision also considers thosedocuments present in the judged subsample; additionally, itconsiders a random subsample of the non-pool documents,sampled at the same rate as the pool documents. Thus,a random subsample of the entire collection is effectivelyconsidered. Inferred average precision estimates the full col-lection average precision from the pool subsample directly.
Inferred average precision has the nice property that it isbased on defining average precision as the outcome of a ran-dom experiment. A derivation of average precision as theexpectation of this random experiment is shown, and it isfurther shown how to estimate this expectation using therandom pool subsample.
We show through the use of TREC data that when rel-evance judgments are incomplete or imperfect, these mea-sures provide closer estimates of average precision using thecomplete judgment set, both in absolute and ranking terms,than bpref.
In the sections that follow, we describe bpref and induced,subcollection, and inferred average precision in detail, andwe describe and discuss our extensive experiments with theTREC collections.
2. EVALUATION WITHINCOMPLETE JUDGMENTS
In this section, we describe bpref and our three proposedmeasures, and we discuss the results of experiments withthese measures using the TREC data collections. We beginby discussing our experimental design using TREC data,and we then discuss each measure in turn together withexperimental results.
2.1 Experimental SetupWe use TREC data to test how the proposed measures
perform when the relevance judgments are incomplete; forexample, if documents are added to a collection over time,the initial (effectively complete) judged set may be modeledas a random subset of the “new” collection. To imitate thiseffect of incomplete relevance judgments, we use a samplingstrategy effectively identical1 to one proposed by Buckleyand Voorhees [6]. For each TREC, we form incomplete judg-ment sets by randomly sampling from the entire depth-100pool over all submitted runs.2 This is done by selecting p%of the complete judgment set uniformly at random for eachtopic, where p ∈ {1, 2, 3, 4, 5, 10, 15, 20, 25, 30, 40, 50,60, 70, 80, 90, 100}. Note that especially for small samplingpercentages, the random sample may not contain any rele-vant documents. In this case, we remove the entire randomsample and pick another p% random sample until a randomsample with at least one relevant document is obtained.
In order to evaluate the proposed measures obtained us-ing incomplete relevance judgments and to compare themwith average precision using the entire judgment set (whichwe refer to as actual AP), we use three different statistics:Kendall’s τ , linear correlation coefficient ρ, and root meansquared (RMS) error.
Kendall’s τ evaluates how the ranking of systems usingthe estimated values compare to the ranking obtained fromthe actual values. It is related to the minimum number ofpairwise adjacent interchanges needed to convert one rank-ing into another. Kendall’s τ ranges from −1 (perfectlyanti-correlated) to +1 (perfectly correlated); a τ value of
1Buckley and Voorhees employ stratified random samplingwhile we employ standard random sampling; these are iden-tical in expectation. Other minor differences exist as well;see Buckley and Voorhees [6] for an exact description of theirsampling method.2Note that we consider all submitted runs rather than allpooled runs, these two sets may be different for some TRECs.
103

zero corresponds to no correlation. Pairs of rankings whoseKendall’s τ values are at or above 0.9 are often consideredeffectively equivalent [16]. The linear correlation coefficientρ evaluates how well the actual and estimated values fit toa straight line. As with Kendall’s τ , the linearly correlationcoefficient ρ ranges from −1 to +1 with similar interpreta-tions. RMS error is related to the standard deviation ofthe estimation error. Let (a1, a2, ...aN ) be actual values and(e1, e2, ...., eN ) be estimates of these values. Then the RMSerror of the estimation is computed as
RMS =
vuut 1
N
NXi=1
(ei − ai)2.
RMS error is measured in the same units as the underlyingdata (in our case, units of “average precision”).
In our experiments, we use data from TRECs 7, 8 and 10.We report detailed results for TREC8 and overall resultsfrom TRECs 7 and 10, due to space constraints.
2.2 BprefBuckley and Voorhees [6] show that commonly used eval-
uation measures such as average precision, R-precision andprecision-at-cutoff 10 are not robust to incomplete relevancejudgments. They propose another measure named bprefwhich is more robust to incomplete relevance judgments.
Given a query with R relevant documents, the bpref valueof a ranked list is calculated as follows
bpref =1
R
Xr
„1 − number of n above r
R
«(1)
where r is a relevant document and n is a nonrelevant doc-ument within the first R judged nonrelevant documents inthe output of the retrieval system.
However, when the number of relevance judgments is small,a variation of the measure named bpref-10 is preferred. Thebpref-10 measure is calculated as follows
bpref-10 =1
R
Xr
„1 − number of n above r
10 + R
«
where n is a nonrelevant document within the top 10 + Rjudged nonrelevant documents in the output of the system.
When the relevance judgments are incomplete, Buckleyand Voorhees [6] show that the rankings of systems ob-tained using bpref-10 are more robust and correlated withthe rankings of the systems obtained using average precisionand the complete judgment set than the rankings of systemsobtained using R-precision and precision-at-cutoff 10. How-ever, one potential drawback of bpref (or bpref-10) is thatthe value of bpref does not have a theoretical basis, as haveaverage precision (an approximation to the area under theprecision-recall curve) and R-precision (the break-even pointin the precision-recall curve). Buckley and Voorhees [6] showthat when the entire judgment set is used, the value of bprefis closely related to the value of average precision. How-ever, as the relevance judgment sets become more and moreincomplete, the value of bpref deviates from the value ofaverage precision computed using the entire judgment set.This behavior can be seen in Figure 1. The figure shows thevalue of mean bpref obtained using 30, 10, and 5% of theentire judgment set versus the value of mean average preci-sion using the entire judgment set. Each plot in the figure
reports the root mean squared (RMS) error, the Kendall’sτ correlation, and the linear correlation coefficient ρ. Theplots also include the line y = x for purposes of comparison.
Ideally, one might well prefer a measure that is both ro-bust to incomplete judgments and that has longstandingusage, a theoretical basis, and/or exhibits a high correlationto standard measures of retrieval effectiveness. In this pa-per, we propose three measures based on average precisionthat are approximations to average precision itself and thatare robust to incomplete relevance judgments.
2.3 Induced AP (indAP)The average precision of the output of a retrieval system is
the average of the precisions at each relevant document; theprecisions at unretrieved relevant documents are assumed tobe zero, by convention. It is known that average precisionis an approximation to the area under the precision-recallcurve.
Buckley and Voorhees [6] show that as the number of judg-ments is reduced, the average precision value decreases andthe rankings of the systems based on average precision alsochange. This can be explained by the fact that all unjudgeddocuments are assumed to be nonrelevant by average pre-cision in a typical evaluation setting such as TREC. There-fore, as the number of judgments is reduced, the numberof relevant documents retrieved before a relevant document,hence the precision at a relevant document, is also reduced.Therefore, average precision, the average of the precisionsat relevant documents, is reduced.
However, one can obtain a different version of averageprecision, which we call induced AP (indAP), that does notmake any assumption about the unjudged documents. Fora query with R relevant documents, induced AP can becalculated in exactly the same way as average precision witha slight difference: in induced AP, the documents that areunjudged are removed from the list and are not consideredin evaluation.
Once the unjudged documents are removed from the re-trieval system’s output, induced AP can be calculated inexactly the same way as traditional average precision. In-duced AP has the nice property that it is an approximationto the area under the precision-recall curve of the outputof a retrieval system when only the judged documents areconsidered.
Given a query with R judged relevant documents, inducedAP can be calculated as
indAP =1
R
Xr
number of relevants up to rank(r)
rank(r)
where r is a relevant document and rank(r) is the rank ofa document when only judged documents are considered.Note that the above formula can be written as a preferencebased measure:
indAP =1
R
Xr
„1 − number of n above r
rank(r)
«
where n is a nonrelevant document retrieved above a rel-evant document when only judged nonrelevant documentsare considered.
Note the similarity between induced AP and bpref (Equa-tion 1). In bpref, at each relevant document, the number ofnonrelevants above a relevant document is scaled by a fac-tor of 1/R (or with 1/(R + 10) in the case of bpref-10),
104

0 0.1 0.2 0.3 0.4 0.5 0.6 0.70
0.1
0.2
0.3
0.4
0.5
0.6
0.7
actual map
bpre
f
TREC 8 bpref vs. actual map,30% sample
RMS = 0.0695 τ = 0.8990 ρ = 0.9874
0 0.1 0.2 0.3 0.4 0.5 0.6 0.70
0.1
0.2
0.3
0.4
0.5
0.6
0.7
actual map
bpre
f
TREC 8 bpref vs. actual map,10% sample
RMS = 0.1477 τ = 0.8764 ρ = 0.9766
0 0.1 0.2 0.3 0.4 0.5 0.6 0.70
0.1
0.2
0.3
0.4
0.5
0.6
0.7
actual map
bpre
f
TREC 8 bpref vs. actual map,5% sample
RMS = 0.1974 τ = 0.8073 ρ = 0.9605
Figure 1: TREC-8 mean bpref-10 as the judgment set is reduced to (from left to right) 30, 10, and 5 percentversus the mean actual AP value (mean AP using the entire judgment set).
0 0.1 0.2 0.3 0.4 0.5 0.6 0.70
0.1
0.2
0.3
0.4
0.5
0.6
0.7
actual map
indu
ced
map
TREC 8 induced map vs. actual map, 30% sample
RMS = 0.0334 τ = 0.9130 ρ = 0.9933
0 0.1 0.2 0.3 0.4 0.5 0.6 0.70
0.1
0.2
0.3
0.4
0.5
0.6
0.7
actual map
indu
ced
map
TREC 8 induced map vs. actual map, 10% sample
RMS = 0.0802 τ = 0.9066 ρ = 0.9879
0 0.1 0.2 0.3 0.4 0.5 0.6 0.70
0.1
0.2
0.3
0.4
0.5
0.6
0.7
actual map
indu
ced
map
TREC 8 induced map vs. actual map, 5% sample
RMS = 0.1001 τ = 0.8235 ρ = 0.9758
Figure 2: TREC-8 mean induced AP as the judgment set is reduced to (from left to right) 30, 10, and 5percent versus the mean actual AP.
1234510152025304050607080901000.7
0.75
0.8
0.85
0.9
0.95
1
percentage
Ken
dall
τ
TREC 8
induced mapbpref−10
1234510152025304050607080901000.9
0.91
0.92
0.93
0.94
0.95
0.96
0.97
0.98
0.99
1
percentage
Line
ar c
orre
latio
n co
effic
ient
(ρ)
TREC 8
induced map
bpref−10
1234510152025304050607080901000
0.05
0.1
0.15
0.2
0.25
0.3
0.35
percentage
RM
S e
rror
TREC 8
induced map
bpref−10
Figure 3: Change in Kendall’s τ , linear correlation coefficient (ρ) and RMS errors of mean induced AP andbpref as the judgment sets are reduced, when compared to the mean actual AP.
where R is the total number of judged relevant documents,whereas in the case of induced AP, it is scaled by a fac-tor of 1/rank(r), where rank(r) is the rank of the relevantdocument when only the judged documents are considered.Also, while calculating the number of judged nonrelevantdocuments above a relevant document, bpref only consid-ers the top R (or R + 10) judged nonrelevant documents,whereas induced AP considers all such documents. Due tothis similarity, bpref can be considered as an approximationto induced AP.
We note that induced AP is an available (though seldom,if ever, used) evaluation measure in TREC’s trec eval pro-
gram. However, the robustness of induced AP with respectto incomplete relevance judgments has never been analyzed.In the following experiments, we describe the behavior ofinduced AP when the relevance judgments are incomplete.
Figure 2 shows how induced map (induced AP averagedover all topics) computed using 30, 10, and 5 percent ofthe judgments compares with actual map calculated usingthe complete relevance judgment set. In order to be fair incomparison, we create 10 different runs (samples) for eachpercentage and pick a sample on which the correlation ofinduced AP and average precision is close to the averageover all 10 samples in terms of RMS error. It can be seen
105

from this figure that induced AP is an over-approximationto actual AP since when removing the unjudged documentsfrom the depth-100 pool, we also remove the documents thatare not in the depth-100 pool, which are mostly nonrelevant.However, when compared to bpref using Figure 1, it can beseen that induced AP is always a better approximation toactual AP as seen by the RMS errors in the plots. Also,induced AP ranks systems closer to the ranking obtainedfrom actual AP than bpref does.
In Figure 3, for different percentages of random sampling,we demonstrate the behavior of induced AP in terms of allthree statistics. In these experiments, we produced ten dif-ferent runs (samples) for each sampling percentage and foreach retrieval system, we calculated the induced map aver-aged over all queries. We also calculated the bpref-10 mea-sure in the same way and using the same sample for com-parison purposes. Then, we calculated all three statisticsfor each run and report the average of these three statisticsfor each percentage. It can be seen from the plot on the leftthat the ranking obtained by induced AP is very close tothe ranking of systems using actual AP and the Kendall’sτ value of induced AP is almost always better than thatof bpref. The second plot shows that induced AP is highlycorrelated with actual AP in terms of linear correlation co-efficient. The rightmost plot shows via the RMS error thatthe value of induced map is close to the value of actual meanaverage precision, even when very few relevance judgmentsare used.
Note that induced AP is an approximation to average pre-cision, and it is highly robust with respect to incompletejudgment sets. However, one can obtain better estimates ofaverage precision that are still robust with respect to incom-plete judgments, as described below.
Note that both induced AP and bpref make use of onlythe judged documents. However, the unjudged documentsalso provide some information and one can obtain betterestimates of average precision using this additional informa-tion. The next two measures, subcollection AP and inferredAP makes use of this extra information provided by the un-judged documents.
2.4 Subcollection AP (subAP)Hawking and Robertson [13] show that average precision
is highly stable with respect to random sampling from theentire document collection. One can use this fact to derivea measure that is also robust with respect to incompleterelevance judgments. In our current setup, we randomlysample from the complete judgment set since this is sim-ilar to building larger test collections while the relevancejudgments are kept constant. The effect of sampling fromthe complete judgment set (depth-100 pool) and consider-ing only the judged documents is not exactly the same assampling documents from the entire document collection.While sampling documents from the entire document collec-tion, the documents that are unjudged, i.e., the documentsthat are not in the depth-100 pool, are also sampled. It isknown that even if the complete relevance judgment set wasavailable, these documents would be considered nonrelevant,since they are not in the depth-100 pool.
One can use this fact and the fact that average precisionis stable with respect to subsampling from the entire doc-ument collection to derive a new evaluation measure, sub-collection AP (subAP), which is a better approximation to
average precision. Note that in computing induced AP, weonly considered the judged documents. However, while cal-culating the average precision estimate for a p% judgmentset, instead of removing all documents that are not in thedepth-100 pool together with all documents that were notsampled from the depth-100 pool, one could keep the docu-ments that are not in the depth-100 pool with probability p,randomly and independently for each such document. Notethat this has the effect of sampling from the depth-100 poolwhile also sampling from the non- depth-100 pool, whichis equivalent to forming a p% subcollection from the entiredocument collection. Since average precision is highly stablewith respect to subcollections [13], subcollection AP is alsoexpected to be robust with respect to incomplete relevancejudgments.
Note that subcollection AP has the appealing propertythat when the complete relevance judgment set is available,it is exactly equivalent to average precision. We furthernote that to employ subcollection AP in practice, one needsknowledge of p; in the case of a dynamic (growing) collection,this is the relative size of the original vs. current collection.
Using the same setup for induced AP and the same ran-domly generated judgment sets, Figure 4 and Figure 5 showhow correlations of subcollection AP with respect to actualAP change as the judgment sets become more incomplete.Figure 4 illustrates that subcollection AP is a better approx-imation to actual AP than is induced AP. The plots showthat subcollection AP is much less biased when comparedto bpref and that it is less biased compared to induced AP.One can also see this by comparing the RMS error valuesin the rightmost plots in Figure 5 and Figure 3 since sub-collection AP has lower RMS value. In terms of Kendall’s τand linear correlation coefficient ρ, subcollection AP is alsobetter than induced AP and bpref.
2.5 Inferred AP (infAP)In order to derive our final robust measure of retrieval
effectiveness, we consider the following random experimentwhose expectation is average precision. Given a ranked listreturned with respect to a given topic:
1. Select a relevant document at random from the collec-tion, and let the rank of this relevant document in thelist be i (or ∞ if this relevant document is unretrieved).
2. Select a rank at random from among the set {1, . . . , i}.3. Output the binary relevance of the document at rank i.
In expectation, steps (2) and (3) effectively compute the pre-cision at a relevant document, and in combination step (1)effectively computes the average of these precisions. Onecan view average precision as the expectation of this randomexperiment, and in order to estimate average precision, onecan instead estimate this expectation using the given sam-pled relevance judgments.
Consider the first part of this random experiment, pickinga relevant document at random from the collection. Sincewe uniformly sample from the depth-100 pool (which con-tains all documents assumed to be relevant), the induceddistribution over relevant documents is also uniform, as de-sired. Now consider the expected precision at a relevantdocument retrieved at rank k. When computing the pre-cision at rank k by picking a document at random at orabove k, two cases can happen. With probability 1/k, we
106

0 0.1 0.2 0.3 0.4 0.5 0.6 0.70
0.1
0.2
0.3
0.4
0.5
0.6
0.7
actual map
subc
olle
ctio
n m
ap
TREC 8 subcollection map vs. actual map, 30% sample
RMS = 0.0218 τ = 0.9161 ρ = 0.9952
0 0.1 0.2 0.3 0.4 0.5 0.6 0.70
0.1
0.2
0.3
0.4
0.5
0.6
0.7
actual map
subc
olle
ctio
n m
ap
TREC 8 subcollection map vs. actual map, 10% sample
RMS = 0.0674 τ = 0.9020 ρ = 0.9873
0 0.1 0.2 0.3 0.4 0.5 0.6 0.70
0.1
0.2
0.3
0.4
0.5
0.6
0.7
actual map
subc
olle
ctio
n m
ap
TREC 8 subcollection map vs. actual map, 5% sample
RMS = 0.0866 τ = 0.8281 ρ = 0.9780
Figure 4: TREC-8 mean subcollection AP as the judgment set is reduced to (from left to right) 30, 10 and5 percent versus the mean actual AP.
1234510152025304050607080901000.7
0.75
0.8
0.85
0.9
0.95
1
percentage
Ken
dall
τ
TREC 8
subcollection mapbpref−10
1234510152025304050607080901000.9
0.91
0.92
0.93
0.94
0.95
0.96
0.97
0.98
0.99
1
percentage
Line
ar c
orre
latio
n co
effic
ient
(ρ)
TREC 8
subcollection map
bpref−10
1234510152025304050607080901000
0.05
0.1
0.15
0.2
0.25
0.3
0.35
percentage
RM
S e
rror
TREC 8
subcollection map
bpref−10
Figure 5: Change in Kendall’s τ , linear correlation coefficient (ρ) and RMS errors of mean subcollection APas the judgment sets are reduced, when compared to the mean actual AP.
may pick the current document, and since this document isknown to be relevant, the outcome is 1, by definition. Orwe may pick a document above the current document withprobability (k − 1)/k, and we calculate the expected preci-sion (or probability of relevance) within these documents.Thus, for a relevant document at rank k, the expected valueof precision at rank k can be calculated as:
E[precision at rank k] =1
k· 1 +
k − 1
kE[precision above k]
Now we need to calculate the expected precision above k.Within the k − 1 documents above rank k, there are twomain types of documents: documents that are not in thedepth-100 pool (non-d100 ), which are assumed to be non-relevant, and documents that are within the depth-100 pool(d100 ). For the documents that are within the depth-100pool, there are documents that are unsampled (unjudged)(non-sampled), documents that are sampled (judged) andrelevant (rel), and documents that are sampled and non-relevant (nonrel). While computing the expected precisionwithin these k − 1 documents, we pick a document at ran-dom from these k − 1 documents and report the relevanceof this document. With probability |non-d100|/(k − 1), wepick a document that is not in the depth-100 pool and theexpected precision within these documents is 0. With proba-bility |d100|/(k−1), we pick a document that is in the depth-100 pool. Within the documents in the depth-100 pool, weestimate the precision using the sample given. Thus, the ex-pected precision within the documents in the depth-100 pool
is |rel|/(|rel| + |nonrel|). Therefore, the expected precisionabove rank k can be calculated as:
E[precision above k] =
|non-d100 |(k − 1)
· 0 +|d100 |k − 1
· |rel|(|rel| + |nonrel|)
Thus, if we combine these two formulae, the expected preci-sion at a relevant document that is retrieved at rank k canbe computed as:
E[precision at rank k] =
1
k· 1 +
(k − 1)
k
„ |d100 |k − 1
· |rel|(|rel| + |nonrel|)
«
Note that it is possible to have no documents sampled aboverank k (|rel|+|nonrel| = 0). To avoid this 0/0 condition, weemploy Lidstone smoothing [7] where a small value ε is addedto both the number of relevant and number of nonrelevantdocuments sampled. Then, the above formula becomes:
E[precision at rank k] =
1
k· 1 +
(k − 1)
k
„ |d100 |k − 1
· |rel| + ε
(|rel| + |nonrel| + 2ε)
«
Since average precision is the average of the precisions ateach relevant document, we compute the expected precisionat each relevant document rank using the above formula andcalculate the average of them, where the relevant documentsthat are not retrieved by the system are assumed to have a
107

0 0.1 0.2 0.3 0.4 0.5 0.6 0.70
0.1
0.2
0.3
0.4
0.5
0.6
0.7
actual map
infe
rred
map
TREC 8 inferred map vs. actual map, 30% sample
RMS = 0.0188 τ = 0.9203 ρ = 0.9958
0 0.1 0.2 0.3 0.4 0.5 0.6 0.70
0.1
0.2
0.3
0.4
0.5
0.6
0.7
actual map
infe
rred
map
TREC 8 inferred map vs. actual map, 10% sample
RMS = 0.0269 τ = 0.8849 ρ = 0.9893
0 0.1 0.2 0.3 0.4 0.5 0.6 0.70
0.1
0.2
0.3
0.4
0.5
0.6
0.7
actual map
infe
rred
map
TREC 8 inferred map vs. actual map, 5% sample
RMS = 0.0459 τ = 0.8427 ρ = 0.9779
Figure 6: TREC-8 mean inferred AP as the judgment set is reduced to (from left to right) 30, 10, and 5percent versus the mean actual AP.
1234510152025304050607080901000.7
0.75
0.8
0.85
0.9
0.95
1
percentage
Ken
dall
τ
TREC 8
inferred mapbpref−10
1234510152025304050607080901000.9
0.91
0.92
0.93
0.94
0.95
0.96
0.97
0.98
0.99
1
percentage
Line
ar c
orre
latio
n co
effic
ient
(ρ)
TREC 8
inferred map
bpref−10
1234510152025304050607080901000
0.05
0.1
0.15
0.2
0.25
0.3
0.35
percentage
RM
S e
rror
TREC 8
inferred map
bpref−10
Figure 7: Change in Kendall’s τ , linear correlation coefficient (ρ) and RMS errors of mean inferred AP andbpref as the judgment sets are reduced, when compared with the mean actual AP.
precision of zero. We call this new measure that estimatesthe expected average precision inferred AP (infAP).
Note that in order to compute the above formula, we needto know which documents are in the depth 100-pool andwhich are not. However, the above formula has the advan-tage that it is a direct estimate of average precision.
Figure 6 shows how the inferred map compares with theactual map. It can be seen that with as few as 5% of thecomplete relevance judgments, inferred map is a reasonableapproximation to actual map. When 30% of the relevancejudgments are available, inferred map is a highly accurateapproximation to actual map as seen by the RMS error inthe plot. Also, based on the RMS error, one can see thatinferred map is a better approximation to actual map thanall previous measures.
Similarly, Figure 7 shows that the ranking of the systemsusing inferred map is very close to the ranking obtainedusing actual map (left plot), that inferred map is highlycorrelated with actual map (middle plot) and that inferredmap is a very close approximation to actual map (rightmostplot). Note that even at very small percentages when thejudgment sets are very incomplete inferred map is a veryclose approximation to actual map.
3. EVALUATION WITHIMPERFECT JUDGMENTS
In the case of dynamic collections such as web, as timepasses, some documents may be removed from the collec-
tion (e.g., broken links in the case of web). However, therelevance judgments for these documents are still available,although systems can no longer retrieve these documents.Such relevance judgment sets are referred to as imperfect [14].Buckley and Voorhees [6] show that standard evaluationmeasures such as precision-at-cutoff, R-precision, and av-erage precision as well as bpref are robust to imperfect rel-evance judgments.
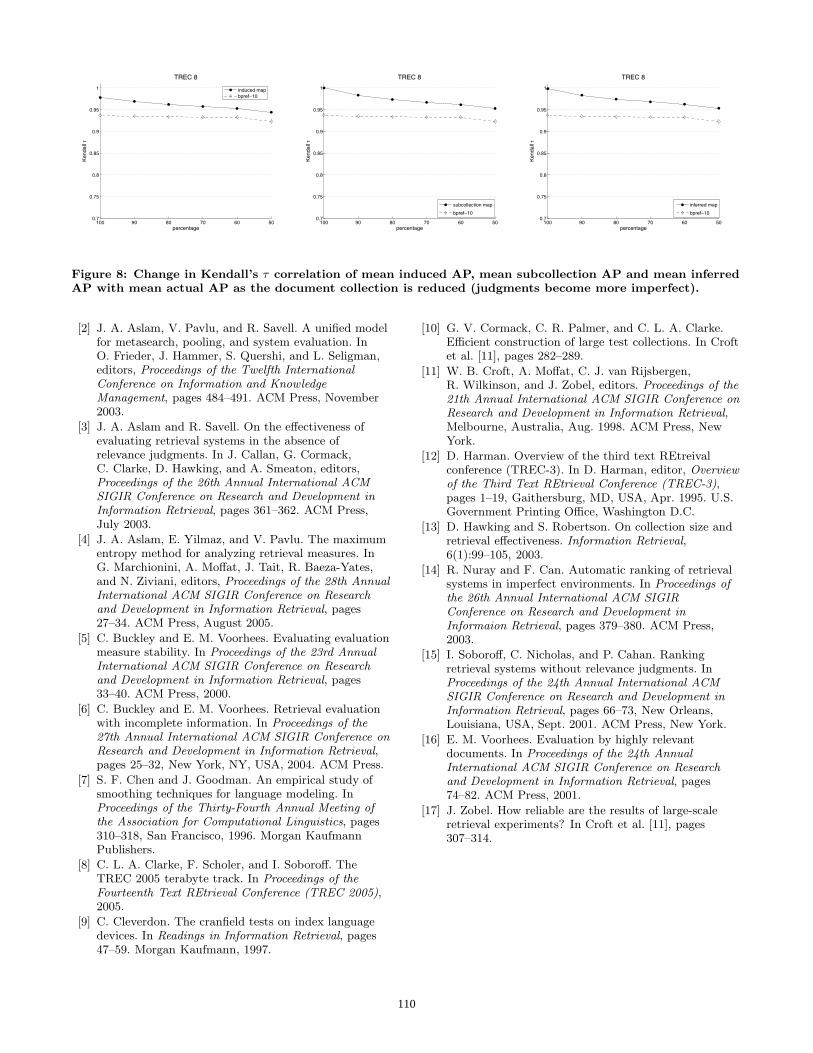
In this section, we test the behavior of the three pro-posed measures with respect to imperfect relevance judg-ments. To imitate the effect of imperfect judgments, weemploy an experimental setup similar to that proposed byBuckley and Voorhees [6]. First, we randomly form a p%sample of the complete document collection, where p ∈{50, 60, 70, 80, 90, 100}. Then, we remove the unsampleddocuments from the output of retrieval systems and eval-uate the three proposed measures using the judgment setfor the complete document collection. Finally, we comparethe mean values of these measures with the mean actual APin terms of their ability to properly rank the systems in ques-tion. Figure 8 shows the results of this experiment. It canbe seen that for all level of imperfectness, all three measuresas well as bpref have a Kendall’s τ correlation greater than0.9 when compared to actual mean average precision. How-ever, for all percentages, the proposed measures are morecorrelated with actual mean average precision than bpref.Hence, the proposed measures are more robust to imperfectrelevance judgments in terms of predicting the rankings ofsystems by actual average precision than bpref, with subcol-
108

lection and inferred AP being more robust than the inducedAP.
4. DISCUSSION AND SUMMARYWe propose three different evaluation measures induced
AP, subcollection AP and inferred AP for evaluation usingincomplete and imperfect relevance judgments. The pro-posed measures are estimates of average precision and are ro-bust to both incomplete and imperfect relevance judgments.In this section, we compare the proposed measures with re-spect to incomplete relevance judgments and summarize.
Figure 9 shows the comparison of the proposed three eval-uation measures and bpref in terms of Kendall’s τ (first row),linear correlation coefficient (second row), RMS error (thirdrow) and the change in average value over all topics (overall runs and all topics, i.e., a single value per TREC) forTRECs 7, 8 and 10 when the relevance judgments are in-complete. Note that it is important to have stability forthe per topic averages since different topics may have differ-ent level of incompleteness. In order for the mean values ofthe measures to have valid meanings, the measures shouldhave similar values even when there are different levels ofincompleteness. The plots in the last row of the figure areincluded to show how the proposed measures perform withrespect to different levels of incompleteness in terms of aver-age value. Note that the RMS error and per topic averageshave a similar trend as expected.
Among the three measures proposed, induced AP is thesimplest one. It uses the same underlying data and infor-mation as bpref, and yet it is more robust to incompleterelevance judgments. It can be seen in the plots in the firstand second row of Figure 9 that induced AP has a betterKendall’s τ and linear correlation with actual AP than hasbpref. Induced AP is also a better approximation to actualAP than is bpref. This can be seen in the plots in the thirdrow of the same figure. For all percentages, induced AP hasa lower RMS error than bpref. However, when the completejudgment set is available, the value of induced AP is slightlydifferent than actual AP since induced AP does not makeany assumptions about the unjudged documents. The plotsin the last row show that the value of induced AP increaseswhen the collection becomes highly incomplete and has asimilar trend to bpref.
Subcollection AP is slightly more complicated than in-duced AP. Compared to bpref and induced AP, subcollec-tion AP requires the additional knowledge of the documentsthat are in the depth-100 pool (even if they are not judged)and the percentage p of the depth-100 pool that is judged.However, subcollection AP is more robust to incomplete rel-evance judgments than both induced AP and bpref (firstand second rows of plots in Figure 9), and it is a betterapproximation to actual AP (third row plots in Figure 9).Subcollection AP is exactly equivalent to actual AP whencomplete relevance judgments are present. The plots in thelast row show that the value of subcollection AP increaseswhen the collection becomes highly incomplete and has asimilar trend to bpref.
Out of the three measures proposed, inferred AP is themost complex, yet it is the closest approximation to ac-tual average precision. In order to compute inferred AP,one needs the additional knowledge of the documents in thedepth-100 pool. However, it does not require knowledge ofthe percentage p of the depth-100 pool that is judged as
subcollection AP does. In terms of Kendall’s τ and linearcorrelation coefficient ρ, inferred AP has a similar perfor-mance to subcollection AP and is better than induced APand bpref (plots in the first and second rows of Figure 9).Inferred AP consistently has much less RMS error comparedto all the rest of the measures for all levels of incompleteness.Even when the number of judgments is very small (even assmall as 1%), inferred AP has an RMS error less than orequal to 0.05, which means that inferred AP is a very closeapproximation to actual average precision. As was the casewith subcollection AP, inferred AP is exactly equivalent toactual AP when complete relevance judgments are present,except for a slight difference due to the effect of smoothing.The value of inferred AP is also highly stable with respectto different levels of incompleteness and does not much varyeven if the collection becomes highly incomplete.
Considering these differences among the proposed threemeasures, one might prefer to use induced AP if the aim isto have a simple measure that is both an approximation toactual AP and is also robust with respect to incomplete rel-evance judgments. If one is looking for a simple but betterapproximations to actual AP, and one knows (or can esti-mate) the proportion of the size of incomplete judgment setas compared to the complete judgment set, then subcollec-tion AP might be preferred. If the aim is a measure thatis both robust and is a very close approximation to averageprecision, then inferred AP might be preferred.
5. CONCLUSIONSWhen document collections are large or dynamic, it is
more difficult to evaluate the retrieval systems since obtain-ing complete relevance judgments becomes more and moredifficult. Therefore, evaluation measures that are robust toincomplete and imperfect relevance judgments are needed.Buckley and Voorhees [6] show that most commonly usedevaluation measures such as average precision, R-precisionand precision-at-cutoff k are not robust to incomplete rele-vance judgments, and they propose another measure, bpref,which is more robust to incomplete relevance judgments.After bpref was proposed, it became a commonly used eval-uation measure in TREC, such as in the Terabyte and Hardtracks.
In this paper, we instead propose three different evalua-tion measures, namely induced AP, subcollection AP, andinferred AP. When compared to bpref, we show that allof these measures are more robust to both incomplete andimperfect relevance judgments than bpref in terms of bothpredicting the value of average precision and the rankingsof systems obtained by average precision. Apart from this,these measures have the nice property that they are dif-ferent approximations to average precision itself when com-puted using the entire judgment set (actual AP). Further-more, when complete judgments are available, the measuressubcollection AP and inferred AP are exactly equivalent toactual AP. Finally, we describe the cases where each of oneof these evaluation measures might well be preferred overone another.
6. REFERENCES[1] J. Allan. HARD track overview in TREC 2004: High
accuracy retrieval from documents. In Proceedings ofthe Thirteenth Text REtrieval Conference (TREC2004), 2004.
109
50607080901000.7
0.75
0.8
0.85
0.9
0.95
1
percentage
Ken
dall
τTREC 8
induced mapbpref−10
50607080901000.7
0.75
0.8
0.85
0.9
0.95
1
percentage
Ken
dall
τ
TREC 8
subcollection map
bpref−10
50607080901000.7
0.75
0.8
0.85
0.9
0.95
1
percentage
Ken
dall
τ
TREC 8
inferred map
bpref−10
Figure 8: Change in Kendall’s τ correlation of mean induced AP, mean subcollection AP and mean inferredAP with mean actual AP as the document collection is reduced (judgments become more imperfect).
[2] J. A. Aslam, V. Pavlu, and R. Savell. A unified modelfor metasearch, pooling, and system evaluation. InO. Frieder, J. Hammer, S. Quershi, and L. Seligman,editors, Proceedings of the Twelfth InternationalConference on Information and KnowledgeManagement, pages 484–491. ACM Press, November2003.
[3] J. A. Aslam and R. Savell. On the effectiveness ofevaluating retrieval systems in the absence ofrelevance judgments. In J. Callan, G. Cormack,C. Clarke, D. Hawking, and A. Smeaton, editors,Proceedings of the 26th Annual International ACMSIGIR Conference on Research and Development inInformation Retrieval, pages 361–362. ACM Press,July 2003.
[4] J. A. Aslam, E. Yilmaz, and V. Pavlu. The maximumentropy method for analyzing retrieval measures. InG. Marchionini, A. Moffat, J. Tait, R. Baeza-Yates,and N. Ziviani, editors, Proceedings of the 28th AnnualInternational ACM SIGIR Conference on Researchand Development in Information Retrieval, pages27–34. ACM Press, August 2005.
[5] C. Buckley and E. M. Voorhees. Evaluating evaluationmeasure stability. In Proceedings of the 23rd AnnualInternational ACM SIGIR Conference on Researchand Development in Information Retrieval, pages33–40. ACM Press, 2000.
[6] C. Buckley and E. M. Voorhees. Retrieval evaluationwith incomplete information. In Proceedings of the27th Annual International ACM SIGIR Conference onResearch and Development in Information Retrieval,pages 25–32, New York, NY, USA, 2004. ACM Press.
[7] S. F. Chen and J. Goodman. An empirical study ofsmoothing techniques for language modeling. InProceedings of the Thirty-Fourth Annual Meeting ofthe Association for Computational Linguistics, pages310–318, San Francisco, 1996. Morgan KaufmannPublishers.
[8] C. L. A. Clarke, F. Scholer, and I. Soboroff. TheTREC 2005 terabyte track. In Proceedings of theFourteenth Text REtrieval Conference (TREC 2005),2005.
[9] C. Cleverdon. The cranfield tests on index languagedevices. In Readings in Information Retrieval, pages47–59. Morgan Kaufmann, 1997.
[10] G. V. Cormack, C. R. Palmer, and C. L. A. Clarke.Efficient construction of large test collections. In Croftet al. [11], pages 282–289.
[11] W. B. Croft, A. Moffat, C. J. van Rijsbergen,R. Wilkinson, and J. Zobel, editors. Proceedings of the21th Annual International ACM SIGIR Conference onResearch and Development in Information Retrieval,Melbourne, Australia, Aug. 1998. ACM Press, NewYork.
[12] D. Harman. Overview of the third text REtreivalconference (TREC-3). In D. Harman, editor, Overviewof the Third Text REtrieval Conference (TREC-3),pages 1–19, Gaithersburg, MD, USA, Apr. 1995. U.S.Government Printing Office, Washington D.C.
[13] D. Hawking and S. Robertson. On collection size andretrieval effectiveness. Information Retrieval,6(1):99–105, 2003.
[14] R. Nuray and F. Can. Automatic ranking of retrievalsystems in imperfect environments. In Proceedings ofthe 26th Annual International ACM SIGIRConference on Research and Development inInformaion Retrieval, pages 379–380. ACM Press,2003.
[15] I. Soboroff, C. Nicholas, and P. Cahan. Rankingretrieval systems without relevance judgments. InProceedings of the 24th Annual International ACMSIGIR Conference on Research and Development inInformation Retrieval, pages 66–73, New Orleans,Louisiana, USA, Sept. 2001. ACM Press, New York.
[16] E. M. Voorhees. Evaluation by highly relevantdocuments. In Proceedings of the 24th AnnualInternational ACM SIGIR Conference on Researchand Development in Information Retrieval, pages74–82. ACM Press, 2001.
[17] J. Zobel. How reliable are the results of large-scaleretrieval experiments? In Croft et al. [11], pages307–314.
110

1234510152025304050607080901000.7
0.75
0.8
0.85
0.9
0.95
1
percentage
Ken
dall
τ
TREC 7
induced map
subcollection map
inferred map
bpref−10
1234510152025304050607080901000.7
0.75
0.8
0.85
0.9
0.95
1
percentageK
enda
ll τ
TREC 8
induced map
subcollection map
inferred map
bpref−10
1234510152025304050607080901000.7
0.75
0.8
0.85
0.9
0.95
1
percentage
Ken
dall
τ
TREC 10
induced map
subcollection map
inferred map
bpref−10
1234510152025304050607080901000.86
0.88
0.9
0.92
0.94
0.96
0.98
1
percentage
Line
ar c
orre
latio
n co
effic
ient
(ρ)
TREC 7
induced map
subcollection map
inferred map
bpref−10
1234510152025304050607080901000.9
0.91
0.92
0.93
0.94
0.95
0.96
0.97
0.98
0.99
1
percentage
Line
ar c
orre
latio
n co
effic
ient
(ρ)
TREC 8
induced map
subcollection map
inferred map
bpref−10
1234510152025304050607080901000.82
0.84
0.86
0.88
0.9
0.92
0.94
0.96
0.98
1
percentage
Line
ar c
orre
latio
n co
effic
ient
(ρ)
TREC 10
induced map
subcollection map
inferred map
bpref−10
1234510152025304050607080901000
0.05
0.1
0.15
0.2
0.25
0.3
0.35
percentage
RM
S e
rror
TREC 7
induced map
subcollection map
inferred map
bpref−10
1234510152025304050607080901000
0.05
0.1
0.15
0.2
0.25
0.3
0.35
percentage
RM
S e
rror
TREC 8
induced map
subcollection map
inferred map
bpref−10
1234510152025304050607080901000
0.05
0.1
0.15
0.2
0.25
0.3
0.35
0.4
0.45
percentage
RM
S e
rror
TREC 10
induced map
subcollection map
inferred map
bpref−10
123451015202530405060708090100
0.2
0.25
0.3
0.35
0.4
0.45
0.5
0.55
percentage
Ave
rage
mea
sure
ove
r al
l TR
EC
TREC 7
induced mapsubcollection mapinferred mapbpref−10
1234510152025304050607080901000.2
0.25
0.3
0.35
0.4
0.45
0.5
0.55
0.6
0.65
percentage
Ave
rage
mea
sure
ove
r al
l TR
EC
TREC 8
induced mapsubcollection mapinferred mapbpref−10
1234510152025304050607080901000.1
0.15
0.2
0.25
0.3
0.35
0.4
0.45
0.5
0.55
0.6
percentage
Ave
rage
mea
sure
ove
r al
l TR
EC
TREC 10
induced mapsubcollection mapinferred mapbpref−10
Figure 9: Comparison of induced map, subcollection map, inferred map, and bpref using Kendall’s τ (firstrow), linear correlation coefficient (second row), RMS error (third row) and per topic averages (fourth row)for TREC 7, 8 and 10.
111
Copyright © 2022 FDOKUMEN