Establishment of optimal control strategies to eliminate bovine ...
283
Establishment of optimal control strategies to eliminate bovine viral diarrhoea in New Zealand A thesis presented in partial fulfilment of the requirements for the degree of Doctor of Philosophy in Veterinary Epidemiology At Massey University, Manawatu, New Zealand Jun-Hee Han 2020
-
Upload
khangminh22 -
Category
Documents
-
view
0 -
download
0
Transcript of Establishment of optimal control strategies to eliminate bovine ...

Establishment of optimal control strategies
to eliminate bovine viral diarrhoea
in New Zealand
A thesis presented in partial fulfilment of the requirements for the degree of
Doctor of Philosophy
in
Veterinary Epidemiology
At Massey University, Manawatu, New Zealand
Jun-Hee Han
2020

ii
iii
Abstract
Although there has been a noticeable reduction in the prevalence of bovine viral
diarrhoea virus (BVDV) in New Zealand over the past decade, it is well recognised that
New Zealand will need a systematic compulsory programme to eliminate BVDV. The aims
of this thesis were to address the knowledge gaps around the epidemiology and economics
of BVDV to explore the cost-effectiveness of different national BVDV control frameworks.
First, the risk factors for BVDV infection were explored using data collected from cattle
herds across the country. A Bayesian network analysis revealed that animal contacts
between neighbouring farms significantly increased the risk of herds being seropositive for
BVDV. The second study used data collected from New Zealand commercial beef farms
to estimate the transmission rate of BVDV from extensively grazed persistently infected
(PI) animals. Using an approximate Bayesian computation method, the BVDV
transmission rate was estimated at 0.11 per PI animal per day, which was lower than
previously derived estimates for dairy herds and intensively farmed beef herds.
For the third study, BVDV simulation models were developed for New Zealand dairy
and beef farms to estimate the economic impacts of BVDV outbreak and to identify the
most cost-effective control strategies at an individual farm level. The direct losses due to
BVDV outbreak were estimated as NZ$ 22.22 per dairy cow per year and NZ$ 41.19 per
beef cow per year. Annual testing to cull identified PI calves and annual vaccination were
economically beneficial to control a BVDV outbreak for a dairy and beef breeding farm,
respectively. In the fourth study, BVDV transmission was simulated at a national scale with
the models, predicting that BVDV could be successfully and economically controlled by
requiring dairy farms to double fence boundaries and perform either annual calf testing or
herd-level screening test and requiring beef farms to conduct annual vaccination.
Overall, the findings from the thesis highlight that BVDV elimination is both technically
feasible and cost-efficient in New Zealand. The outputs of this thesis can be used to

iv
facilitate discussion with farmers and stakeholders about the benefits and feasibility of
national BVDV elimination in New Zealand.

v
Acknowledgements
I would like to express my sincere gratitude and thankfulness to my main supervisor,
Carolyn Gates. For the past years, you showed me endless energy and enthusiasm toward
research, and it stimulated me to keep pushing myself on this long academic journey of
PhD. Your brilliant insights on my (sometimes cryptic) research outcomes always clarified
what should be the highlights of the studies. I also learnt an important lesson from your
way of drafting a manuscript that we are conducting research not to satisfy ourselves but
to give scientific information to relevant “people” that it matters. It has been an absolute
honour for me being under your supervision.
I would like to extend my gratitude to my co-supervisors. Jenny, were it not for your
general understanding about the cattle industries in New Zealand, the aims and results of
the studies would have been something totally different and absurd. As an experienced
veterinarian, you devotedly shared your knowledge around the cattle management systems
or demographic structures in New Zealand with me. Because of the lack of accurate data
in New Zealand cattle demographics, your guidance was like a lighthouse in the uncharted
ocean of modelling the New Zealand cattle industries. I also appreciate for your effort to
improve my writing skills. Cord, including the Master’s course, you have been my
supervisor for 6 years. When I first came into New Zealand, I was a pessimistic soul worn
and torn by endless competitions in Korea. But during the past years, your natural optimism
definitely changed my perspective on our world into more hopeful and delightful one.
That’s something more valuable than a piece of advice on epidemiologic research. I am
really glad that you have been my mentor. I look forward to having you as my boss soon.
I would also like to thank to my friends, Alicia, Arata, Juan and Dani, Katja, Masako,
Meow, Milan, Nelly, Pintu, Sabrina, and Yuni, that I have met in EpiCentre. Especially, I
show my appreciations to my officemates. Arata, thank you for answering my endless
questions. We have had fruitful discussions around all different topics related to

vi
epidemiology, and it absolutely made me become a better epidemiologist. Without you, I
would not be here today. Sabrina, you are the most kind and beautiful soul that I have ever
met. Thank you for being patient with me and Arata’s nerdy conversations, and thank you
for answering all my silly questions around English grammar.
My appreciation also goes to Naomi Cogger, Chris Compton, Emilie Vallee, Art
Subharat, Simon Verschaffelt, and Chrisitne Cunningham, in EpiCenre. I also appreciate
Andrew Weir, Joanna Holter, John Moffat, Steve Morris, and Jason Archer, who have been
co-authors of or have helped my studies.
Finally, I would like to thank my family. To my father and mother, I could have not
achieved this much without your spiritual and financial support. It is entirely your loves
and devotions which carved me to stand here today. To my wife Geunyoung, thank you is
not enough to express my appreciation for all the sacrifices you have made to be with me.
I will do everything to make up for the pain you have endured. I thank you and I love you.
To Gian, my son. I am sorry that I could not spend more time with you for finishing my
PhD. But I want you to know that “becoming a father that my son would be proud of” has
been and will be my goal of life. Now, you and Geunyoug are the reason of my life. I love
you, son.
vii
List of Publications
Published
Han, J.-H., Weston, J.F., Heuer, C., Gates M.C., 2019. Estimation of the within-herd
transmission rates of bovine viral diarrhoea virus in extensively grazed beef cattle herds.
Veterinary Research 50, 103, 1-11. (Chapter 4)
Gates, M.C., Han J.-H., Evans, C.A., Weston, J.F., Heuer, C., 2019. Assessing the use of
diagnostic laboratory accession data to support national bovine viral diarrhoea control in New
Zealand. New Zealand Veterinary Journal 67,4, 194-202.
Han, J.-H., Holter, J., Moffat, J., Weston, J.F., Heuer, C., Gates M.C., 2018. Using Bayesian
network modelling to untangle farm management risk factors for bovine viral diarrhoea virus
infection. Preventive Veterinary Medicine 161, 75-82. (Chapter 3)
Han, J.-H., Weir, A.M., Weston, J.F., Heuer, C., Gates M.C., 2018. Elimination of bovine viral
diarrhoea virus in New Zealand: a review of research progress and future directions. New
Zealand Veterinary Journal 66,6, 273-280. (Chapter 2)
Accepted
Evans, C.A., Han, J.-H., Weston, J.F., Heuer, C., Gates, M.C., 2019. Serological evidence for
exposure to bovine viral diarrhoea virus in sheep co-grazed with beef cattle in New Zealand.
Accepted in New Zealand Veterinary Journal.
Gates M.C., Evans, C.A., Han, J.-H., Heuer, C., Weston, J.F., 2019. Practices and opinions of
New Zealand beef cattle farmers towards bovine viral diarrhoea control in relation to real and
perceived herd serological status. Accepted in New Zealand Veterinary Journal.
Prepared/Submitted
Han, J.-H., Weston, J.F., Heuer, C., Gates M.C., Economics of bovine viral diarrhoea virus
(BVDV) control in pastoral dairy and beef cattle herds. Prepared for Preventive Veterinary
Medicine. (Chapter 5)
Han, J.-H., Weston, J.F., Heuer, C., Gates M.C., Modelling the cost-effectiveness of national
bovine viral diarrhoea virus (BVDV) control in New Zealand. Prepared for Veterinary
Research. (Chapter 6)

viii
List of Presentations
Han, J.-H., Weston, J.F., Heuer, C., Gates M.C, 2018. Reconstruction of the cattle movement
network in New Zealand: exploring the underlying drivers of cattle trade. Presented at the
International Symposium of Veterinary Epidemiology and Economics, Chiang-Mai, Thailand.
Han, J.-H., Weston, J.F., Heuer, C., Gates M.C, 2018. Untangling farm management risk
factors for bovine viral diarrhoea virus infection using Bayesian network modelling. Presented
at the International Symposium of Veterinary Epidemiology and Economics, Chiang-Mai,
Thailand.
Han, J.-H., Gates, M.C., 2018. BVD control to New Zealand beef farmers. New Zealand
Veterinary Association conference, Hamilton, New Zealand.
ix
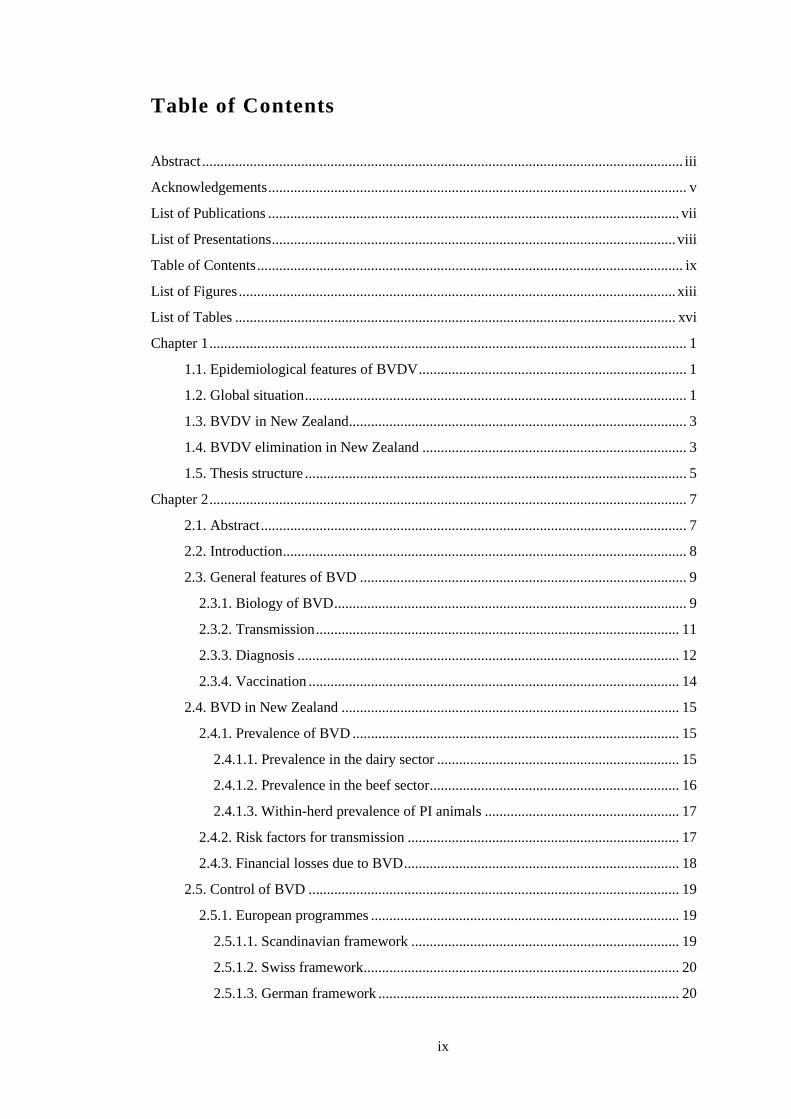
Table of Contents
Abstract ................................................................................................................................... iii
Acknowledgements .................................................................................................................. v
List of Publications ................................................................................................................ vii
List of Presentations .............................................................................................................. viii
Table of Contents .................................................................................................................... ix
List of Figures ....................................................................................................................... xiii
List of Tables ........................................................................................................................ xvi
Chapter 1 .................................................................................................................................. 1
1.1. Epidemiological features of BVDV ......................................................................... 1
1.2. Global situation ........................................................................................................ 1
1.3. BVDV in New Zealand ............................................................................................ 3
1.4. BVDV elimination in New Zealand ........................................................................ 3
1.5. Thesis structure ........................................................................................................ 5
Chapter 2 .................................................................................................................................. 7
2.1. Abstract .................................................................................................................... 7
2.2. Introduction .............................................................................................................. 8
2.3. General features of BVD ......................................................................................... 9
2.3.1. Biology of BVD ................................................................................................ 9
2.3.2. Transmission ................................................................................................... 11
2.3.3. Diagnosis ........................................................................................................ 12
2.3.4. Vaccination ..................................................................................................... 14
2.4. BVD in New Zealand ............................................................................................ 15
2.4.1. Prevalence of BVD ......................................................................................... 15
2.4.1.1. Prevalence in the dairy sector .................................................................. 15
2.4.1.2. Prevalence in the beef sector .................................................................... 16
2.4.1.3. Within-herd prevalence of PI animals ..................................................... 17
2.4.2. Risk factors for transmission .......................................................................... 17
2.4.3. Financial losses due to BVD ........................................................................... 18
2.5. Control of BVD ..................................................................................................... 19
2.5.1. European programmes .................................................................................... 19
2.5.1.1. Scandinavian framework ......................................................................... 19
2.5.1.2. Swiss framework ...................................................................................... 20
2.5.1.3. German framework .................................................................................. 20

x
2.5.2. Validity of diagnostic tests in New Zealand ................................................... 21
2.5.3. Validity of BVD vaccination in New Zealand ................................................ 22
2.5.4. Financial benefit of BVD control programmes ............................................... 23
2.6. Discussion .............................................................................................................. 24
2.7. Acknowledgements ................................................................................................ 27
Chapter 3 ................................................................................................................................ 29
3.1. Abstract .................................................................................................................. 29
3.2. Introduction ............................................................................................................ 30
3.3. Material and methods ............................................................................................. 32
3.3.1. Data collection ................................................................................................ 32
3.3.2. Data processing ............................................................................................... 34
3.3.3. Descriptive statistics ........................................................................................ 35
3.3.4. Multivariable logistic regression ..................................................................... 36
3.3.5. BN modelling .................................................................................................. 37
3.4. Results .................................................................................................................... 38
3.4.1. Descriptive statistics from the survey responses ............................................. 38
3.4.2. Multivariable regression analysis .................................................................... 45
3.4.3. Bayesian network analysis .............................................................................. 47
3.5. Discussion .............................................................................................................. 48
3.6. Conclusions ............................................................................................................ 53
3.7. Acknowledgement .................................................................................................. 53
Chapter 4 ................................................................................................................................ 55
4.1. Abstract .................................................................................................................. 55
4.2. Introduction ............................................................................................................ 56
4.3. Materials and methods ........................................................................................... 59
4.3.1. Data collection and extraction ......................................................................... 59
4.3.2. Simulation model ............................................................................................ 60
4.3.3. Estimation of within-herd BVDV transmission rates ...................................... 66
4.3.4. Validation of the estimated parameters ........................................................... 68
4.4. Results .................................................................................................................... 69
4.4.1. Longitudinal data............................................................................................. 69
4.4.2. Parameters estimation ..................................................................................... 70
4.4.3. Validation ........................................................................................................ 70
4.5. Discussion .............................................................................................................. 72
4.6. Conclusions ............................................................................................................ 77
4.7. Acknowledgements ................................................................................................ 77

xi
Chapter 5 ................................................................................................................................ 79
5.1. Abstract .................................................................................................................. 79
5.2. Introduction ............................................................................................................ 80
5.3. Material and methods ............................................................................................. 82
5.3.1. Demographics of dairy farms.......................................................................... 82
5.3.2. Demographics of beef farms ........................................................................... 88
5.3.3. Disease component ......................................................................................... 89
5.3.4. Production and economic component ............................................................. 96
5.3.5. BVDV control strategies ................................................................................. 97
5.3.6. Model initiation and BVDV outbreak ............................................................. 99
5.3.7. BVDV dynamics and economic analysis ...................................................... 100
5.3.8. Sensitivity analysis ....................................................................................... 102
5.4. Results .................................................................................................................. 105
5.4.1. Dynamics of BVDV and its economic impact .............................................. 105
5.4.2. Cost-benefit of BVDV control strategies ...................................................... 105
5.4.3. Sensitivity analysis ....................................................................................... 110
5.5. Discussion ............................................................................................................ 110
5.6. Conclusion ........................................................................................................... 116
Acknowledgements ..................................................................................................... 117
Chapter 6 .............................................................................................................................. 119
6.1. Abstract ................................................................................................................ 119
6.2. Introduction .......................................................................................................... 120
6.3. Material and methods ........................................................................................... 123
6.3.1. Data processing ............................................................................................. 123
6.3.1.1. Number of cattle farms .......................................................................... 126
6.3.1.2. Herd size ................................................................................................ 127
6.3.1.3. Planned start of mating .......................................................................... 128
6.3.1.4. Adjacent farms ....................................................................................... 129
6.3.1.5. Cattle movements................................................................................... 130
6.3.2. National model .............................................................................................. 132
6.3.2.1. Demographics of cattle within a farm .................................................... 132
6.3.2.2. Movement reconstruction ...................................................................... 137
6.3.2.3. BVDV transmission within a farm ........................................................ 138
6.3.2.4. BVDV transmission between farms ....................................................... 139
6.3.2.5. Model initiation ...................................................................................... 139
6.3.3. National BVDV control programmes ........................................................... 140
xii
6.3.3.1. Movement restriction ............................................................................. 141
6.3.3.2. Annual testing and culling ...................................................................... 141
6.3.3.3. Annual screening test ............................................................................. 141
6.3.3.4. Vaccination............................................................................................. 142
6.3.3.5. Double-fencing ....................................................................................... 142
6.3.4. Model Outputs ............................................................................................... 143
6.4. Results .................................................................................................................. 144
6.4.1. Effectiveness of national BVDV control programmes .................................. 144
6.4.2. Cost-benefit analysis of national BVDV control programmes...................... 150
6.5. Discussion ............................................................................................................ 151
6.6. Conclusions .......................................................................................................... 156
6.7. Acknowledgements .............................................................................................. 156
Chapter 7 .............................................................................................................................. 158
7.1. Overview of key findings ..................................................................................... 158
7.2. Risk factors for BVDV infection in New Zealand cattle farms ........................... 159
7.3. BVDV dynamics in extensively grazed herds ...................................................... 162
7.4. Economics of BVDV and its control .................................................................... 163
7.5. National BVDV control programmes .................................................................. 165
7.6. Methodological limitations .................................................................................. 167
7.7. Future work: feasibility of BVDV elimination in New Zealand .......................... 170
7.7.1. Accurate data ................................................................................................. 170
7.7.2. Social acceptability ....................................................................................... 171
7.7.3. Governmental support ................................................................................... 172
7.7.4. Other possible limitations .............................................................................. 173
7.8. Conclusion ............................................................................................................ 174
Bibliography ......................................................................................................................... 176
Appendix 1 ........................................................................................................................... 203
Appendix 2 ........................................................................................................................... 206
Appendix 3 ........................................................................................................................... 236
Appendix 4 ........................................................................................................................... 246

xiii
List of Figures
Figure 3. 1. Figure 3.1. Proportion of cattle farms actively infected with BVD. Note that no cattle farms
from three regions (Gisborne, Taranaki, and Nelson) were sampled. .................................................. 39
Figure 3. 2. Additive Bayesian network representing significant associations between farm management
risk factors on active infection with BVD virus. For each arc, the median odds ratio is reported, and
solid and dashed arcs indicate positive and negative associations, respectively. Blue arcs indicate
associations with beef farm, and red counterpart describing the one with dairy farms. Active BVD virus
infection status is highlighted in grey, and production type (beef and dairy) is described in rectangle
node. ..................................................................................................................................................... 46
Figure 4. 1. Description of within-herd simulation for estimating within-herd BVDV transmission rate.
Blue and red shaded areas indicate the breeding and calving periods, respectively. Red dotted arrow
represents the contribution to the force of BVDV infection................................................................. 64
Figure 4. 2. The posterior distribution of within-herd BVDV transmission rates for PI animals (𝛽𝑃).
The mode was 0.11 with a 95% highest posterior density interval between 0.03 and 0.34. ................ 71
Figure 4. 3. The posterior distribution of the estimated parameters for each herd. Left: the initial
proportion of BVDV seropositive animals (μ), Middle: the proportion of introduced PI animals (ρ),
Right: the day of PI animals being introduced (τ). The distributions of the first row illustrate the prior
distribution of each parameter. Green and red shaded areas indicate the first breeding and calving period,
respectively. Day FS indicates the day of first sampling. .................................................................... 72
Figure 5. 1. Schematic representation of demographic events in a dairy farm. C, YH, BH, and MA
indicate calf herd, young replacement heifer herd, breeding replacement heifer herd, and mixed-aged
cow herd, respectively. Filled and shaded area in the mating period indicate the period of artificial
insemination and natural mating with bulls, respectively. ................................................................... 85
Figure 5. 2. Schematic representation of demographic events in a beef farm. CH, CM, YH, BH, MA,
FH, and FS indicate calf herd from breeding heifers, calf herd from mixed-aged cow herd, young heifer
herd, breeding heifer herd, mixed-aged cow herd, fattening heifer herd, and fattening steer herd,
respectively. ......................................................................................................................................... 85
Figure 5. 3. Schematic representation of transition between BVDV infection status (top) and BVDV
infection status of new born calves (bottom). BVDV infection status consists of passively immunised
via maternal antibody (M), susceptible (S), transiently infected (TI), persistently infected (PI), recovered
(R), vaccinated insufficiently to prevent fetal infection (𝑉𝐼), and vaccinated sufficiently to prevent fetal
infection (𝑉𝑆). Top: Solid black arrows indicate the transition between BVDV infection status, blue
dotted arrows indicate the decay of immunity conferred by vaccination, and red dashed arrows illustrate
the force of BVDV infection. Bottom: Solid arrows indicate the BVDV infection status of calves
depending on the infection status of their dams. Dashed arrows from 𝑉𝐼 illustrate the BVDV infection
status of calves if 𝑉𝐼 dams were infected. ............................................................................................ 93
Figure 5. 4. The number of transiently and persistently infected animals during the simulation period in
New Zealand dairy (left) and beef (right) farms. ............................................................................... 103
xiv
Figure 5. 5. The economic impact of BVDV introduction on naïve dairy (left) and beef (right) farms in
New Zealand. Green and orange bars indicate the gross farm revenue without and with BVDV,
respectively. ........................................................................................................................................ 104
Figure 5. 6. Average annual benefit (green) and cost (red) of BVDV control strategies per mixed-age
cow for dairy (left) and beef (right) farms in New Zealand. Non-significant or negative benefits are not
presented in this figure, and any average benefit/cost ratio of >1 is written in red. TC, VC, AB, and DF
indicate testing and culling, vaccination, annual boosting, and double fencing, respectively. C, S, 1 and
2 indicate the annual testing of female breeding calves, annual screening test, vaccination starting before
one year old; and vaccination starting at one year old, respectively. .................................................. 109
Figure 6. 1. Description of data processing. Data between 2014 and 2016 were extracted from the
National Animal and Identification Tracing system in New Zealand. Only the data inside blue solid
squares were explicitly incorporated into the national model, while the one inside a grey dashed square
was indirectly modelled. † indicates the number of batches (i.e. a group of cattle moved from a source
farm to a destination farm in a given week). Key: PSM, planned start of mating; U, Uniform distribution
(lower, upper limit), N, normal distribution (mean, variance). ........................................................... 125
Figure 6. 2. Distribution of cattle farms in New Zealand (left) and the Canterbury region (right). Left &
Right: Red and blue dots indicate dairy and beef farms, respectively, with the size of dot was
proportional to the mixed-age cow herd size for each farm. Right: Grey lines in the Canterbury region
indicate aggregated animal movements via trade during 2014-2016 (direction was ignored for the
simplicity of illustration). .................................................................................................................... 130
Figure 6. 3. Illustration of demographic events in the New Zealand dairy and beef industries. SD, start
of dry-off period; OG, week to move from/to off-site grazing location; PSC, planned start of calving;
PSM, planned start of mating; Testing and culling, annual testing and culling of female breeding calves;
Screening test, annual screening of bulk tank milk (dairy) or serum samples of 15 young heifers (beef)
followed by a PI hunt; VX 1st, 2nd, and 3rd, the first, second, and third BVDV vaccination, respectively;
AB, annual boosting of BVDV vaccination. ....................................................................................... 133
Figure 6. 4. National prevalence of BVDV positive farms (black) with respect to implementing no
BVDV elimination programme, movement restrictions (P1), and annual testing and culling of breeding
female calves (P2) for both dairy and beef breeding farms. Red and blue lines indicate the contribution
of the dairy and beef industries, respectively, to the national BVDV prevalence. Solid line and shaded
area indicate the median and 95% prediction interval, respectively. .................................................. 146
Figure 6. 5. National prevalence of BVDV positive farms (black) with respect to implementing annual
screening test followed by a PI hunt (P3), double fencing (P4), and vaccination of breeding animals
with annual boosters (P5) for both dairy and beef breeding farms. Red and blue lines indicate the
contribution of the dairy and beef industries, respectively, to the national BVDV prevalence. Solid line
and shaded area indicate the median and 95% prediction interval, respectively. ................................ 147
Figure 6. 6. National prevalence of BVDV positive farms (black) with respect to implementing double
fencing (P6), annual testing and culling of breeding female calves with double fencing (P7), and annual
screening test followed by a PI hunt with double fencing (P8) for dairy farms. For all strategies,
vaccination of breeding animals with annual boosters was implemented for beef farms. Red and blue
xv
lines indicate the contribution of the dairy and beef industries, respectively, to the national BVDV
prevalence. Solid line and shaded area indicate the median and 95% prediction interval, respectively.
............................................................................................................................................................ 148
Figure 6. 7. Accumulated benefit (blue) and BVDV control cost (red) for different BVDV elimination
programmes over time. Solid line and shaded area indicate median and 95% prediction interval,
respectively. ....................................................................................................................................... 149
xvi
List of Tables
Table 3. 1. Description of survey responses and univariable logistic regression of farm management risk
factors for active infection with BVD virus from 304 New Zealand cattle herds. Median and interquartile
range of number of farms over 1,000 imputed datasets are also presented. Odds ratio with bold and
underlined characters shows p-value less than 0.2. ............................................................................... 41
Table 3. 2. Multivariable logistic regression of significant farm management risk factors on active
infection with BVD in 304 New Zealand cattle farms. ......................................................................... 44
Table 4. 1. Definition and value of parameters used for within-herd BVDV transmission model. ...... 65
Table 4. 2. Prior distribution of parameters estimated using ABC-SMC algorithm. ............................ 66
Table 4. 3. Mode (95% highest posterior density interval) of the estimated initial proportion of BVDV
seropositive animals (μ), the proportion of introduced PI animals (ρ), and the day of PI animals being
introduced (τ) for each studied farm. .................................................................................................... 71
Table 5. 1. Model parameters for demographic and BVDV components. ............................................ 86
Table 5. 2. Model parameters for production/economic and control components. ............................... 94
Table 5. 3. List of BVDV control options in three different categories. A BVDV control strategy was a
combination of three control options from each of category (30 strategies in total). .......................... 102
Table 5. 4. Parameter values used for the sensitivity analysis. ........................................................... 103
Table 5. 5. Benefit and cost of implementing BVDV testing and culling (TC), vaccination (VC)
with/without annual boosting (AB), and double fencing (DF) in New Zealand dairy farm. Benefit-cost
(B/C) ratios of control strategies with significant benefit are shown in bold. ..................................... 107
Table 5. 6. Benefit and cost of implementing BVDV testing and culling (TC), vaccination (VC)
with/without annual boosting (AB), and double fencing (DF) in New Zealand dairy farm. Benefit-cost
(B/C) ratios of control strategies with significant benefit are shown in bold. ..................................... 108
Table 6. 1. Description of parameter values used in the national BVDV simulation model. .............. 134
Table 6. 2. Description of the national BVDV control programmes. .................................................. 143
Table 6. 3. Median (95% prediction interval) of the % reduction in the number of BVDV positive farms
between the beginning and end of simulation period (i.e. % reduction) and the last week that the national
prevalence of BVDV positive farms being 2.0% (i.e. last week for 2.0%) with respect to implementing
different national BVDV control programmes. ................................................................................... 145
Table 6. 4. Median (95% prediction interval) of accumulated benefit (Benefit), BVDV control cost
(Cost), year of break-even point, and benefit/cost ratio with respect to implementing different national
BVDV control programmes. ............................................................................................................... 150

1
Chapter 1
Introduction
1.1. Epidemiological features of BVDV
Bovine viral diarrhoea virus (BVDV) is a pestivirus in the Flaviviridae family that can
have significant detrimental impacts on animal health and production performance (Lanyon
et al., 2014). Cattle infected with BVDV have a wide range of subclinical and clinical signs
including diarrhoea, respiratory illness, immunosuppression, congenital defects, and
abortion/stillbirth (Fray et al., 2000). The key characteristic of BVDV epidemiology is the
presence of persistently infected (PI) animals that shed large quantities of the virus
throughout their life time (Houe & Meyling, 1991). A PI calf can be generated if a heifer
or cow that is naïve to BVDV becomes infected during the risk period of early-to-mid
pregnancy and then subsequently gives birth to a live calf. PI calves are generally ill-thrifty
and have a short life expectancy, however, apparently normal looking PI calves can survive
for more than three years (Hill, Reichel, et al., 2010; Voges et al., 2006). Accordingly, the
most important risk factor for naïve cattle to be exposed to BVDV is through direct contacts
with PI animals (Houe & Meyling, 1991). In contrast to persistent infections, animals that
are transiently infected (TI) with BVDV shed lower levels of the virus for a limited time
(Thurmond, 2005) and typically recover within two to three weeks of infection (Duffell &
Harkness, 1985).
1.2. Global situation
BVDV is prevalent in most cattle producing countries worldwide (Anonymous, 2020).
A meta-analysis of global BVDV prevalence reported an average of 67.7% cattle herds
across 73 countries showing evidence of recent BVDV exposure with 27.2% of herds likely
containing PI animals (Scharnböck et al., 2018). Although the prevalence of PI animals
2
within an actively infected farm is generally less than 5% (Richter et al., 2019), previous
studies have shown that even small numbers of PI animals on a cattle farm could result in
the seroconversion of up to 97% of susceptible animals in the herd in a given year (Houe
& Meyling, 1991). Given the high infectious pressure of PI animals and their prevailing
presence across cattle industries, BVDV is known to have significant economic impacts.
According to Richter et al., (2017) who reviewed the estimated economic impacts of
BVDV in 15 endemic countries, the mean direct losses of BVDV infection was
approximately US$ 200 per dairy cow and US$ 170 per beef cow.
These significant economic losses due to BVDV infection have driven many countries
to implement regional or national BVDV control programmes with either voluntary,
compulsory, or phased voluntary to compulsory frameworks (Pinior et al., 2017). Several
countries in Europe including Sweden, Norway, Finland, and Denmark have already
successfully eliminated the disease within a decade using systematic compulsory strategies
tailored to their cattle production system. Follow-up studies have economically justified
that BVDV elimination programmes in these countries have incurred greater benefits than
costs (Richter et al., 2017). Yet, despite the successful examples from Europe, many
countries have not achieved elimination potentially due to the complexities of BVDV
epidemiology and/or the lack of a systematic and coordinated approach to disease control.
As highlighted by Wernike et al., (2017), the voluntary BVDV control programme
originally implemented in Germany was not able to successfully eliminate the disease and
the authors argued that systematic compulsory strategies should be adopted in countries
with high cattle densities and frequent animal movements. Nevertheless, many countries
with BVDV are still struggling to convince farmers and stakeholders to support transition
from voluntary to compulsory national BVDV control programme despite the well-
established returns on investment from implementing coordinated compulsory national
strategies (Richter et al., 2017; Wernike et al., 2017).
3
1.3. BVDV in New Zealand
BVDV has been endemic in New Zealand since at least the 1960s (Salisbury et al.,
1961), and almost 50% of both dairy and beef farms in the country have experienced recent
BVDV exposure (Gates, Han, et al., 2019). Although it has not been properly estimated,
the economic impact of BVDV infection on the New Zealand dairy industry is speculated
to be NZ$ 150 million per year (Anonymous, 2015) and its impact on the beef industry is
also believed to be significant.
BVDV control in New Zealand has been based on farmers’ voluntary engagement with
control measures without any financial support from the government of cattle industries.
Over the past decade, some progress has been made with current ad hoc voluntary scheme
especially in the dairy industry, reducing the national prevalence of BVDV positive dairy
farms from approximately 14% to 7% (Gates, Han, et al., 2019; Thobokwe et al., 2004).
However, the overall level of farmer compliance to recommended BVDV management
strategies in the current scheme is still low, with only ~30% of farmers with recent BVDV
exposure conducting a follow-up test to identify persistently infected (PI) animals (Gates,
Han, et al., 2019).
1.4. BVDV elimination in New Zealand
Dowdle, (1999) defined the disease control as a "reduction of incidence, prevalence,
morbidity or mortality to a locally acceptable level" whereas the elimination as a "reduction
to zero incidence in a defined geographical area", and emphasised that both control and
elimination are "the result of deliberate efforts" and require "continued intervention
measures to maintain the reduction". Therefore, a control or elimination of livestock
disease requires a successful implementation of intervention measures, which should be
based on the comprehensive understanding of the epidemiology and economics of the
disease in the particular population (Petra et al., 2015). In order to eliminate BVDV in New
4
Zealand, quality data should be collected (1) to quantify demographic structure (e.g.
number of herds, number of animals in a herd, and animal movements between farms) and
management features (e.g. planned start of mating, and age of weaning), (2) to quantify
important BVDV transmission routes between herds, (3) to measure seroconversion rates
to predict BVDV transmission dynamics within a herd, and (4) to benchmark the
production level of cattle farms depending on BVDV infection status (Perry et al., 2001).
BVDV simulation models can then be developed to examine the feasibility of BVDV
elimination and to justify the cost-effectiveness of eliminating the disease in the country
(E. Brooks-Pollock et al., 2015).
Given the significant economic impacts of BVDV infections, there has been growing
interest in evaluating the cost-effectiveness of national BVDV elimination in the New
Zealand cattle industries. However, it was recognised that there were also still many
questions to be answered about feasibility and the best approach to eliminate BVDV in the
New Zealand’s pastoral production systems. To help build the capacity to eliminate BVDV
from New Zealand, several research projects have been conducted. For example, MSD
Animal Health conducted the “Take the BVD Test Challenge” project from September
2015 to December 2016 to collect data about risk factors for BVDV infection on cattle
farms across New Zealand. Also, a three-year “BVD Free New Zealand” project was
launched in July 2017 to address the knowledge gaps, particularly with regards to the
epidemiology of BVDV in the beef industry. Although not designed specifically for
controlling BVDV, the national animal identification and tracing (NAIT) legislation also
provides support for national disease control efforts by requiring farmers to record all
movements of individual cattle as well as details about locations where the animals were
moved, which can enhance our understanding about cattle demographic structure in New
Zealand. Analysing these data could address the knowledge gaps about the epidemiology
and economics of BVDV and its control in the country to enrich our understanding about
BVDV elimination in the New Zealand cattle industries.

5
1.5. Thesis structure
By using the data described above, the aim of this thesis was to address the
epidemiological and economic knowledge gaps about BVDV infection in the New Zealand
cattle industries to evaluate the feasibility and economic justifiability of implementing
national BVDV control programmes. Specifically, in Chapter 2, the key epidemiological
features of BVDV were reviewed and the current state of knowledge about BVDV in New
Zealand was discussed. In Chapter 3, a risk factor analysis for BVDV infection in New
Zealand dairy and beef farms was conducted using data collected for the “Take the BVD
Test Challenge” project. This study suggested that local spread of BVDV between cattle
herds on neighbouring farms would be the most important route of BVDV transmission in
New Zealand. In Chapter 4, the BVDV transmission rate of persistently infected animals
on New Zealand beef farms was inferred based on a cohort study from “BVD Free New
Zealand” project that measured BVDV seroconversion rates among first-calving heifers
from 75 beef breeding farms. Chapter 5 described the development of within-farm BVDV
transmission models for a typical New Zealand dairy and beef farms. Different BVDV
control measures including annual test and cull of breeding calves, vaccination, and/or
double fencing were implemented within the models to evaluate the cost-effectiveness of
different BVDV control strategies for individual farms. By incorporating the findings from
the previous chapters on an inferred national cattle demographic structure from NAIT data,
a national BVDV simulation model was established in Chapter 6 to identify the most cost-
effective national control programmes to eliminate BVDV from the New Zealand cattle
industries. These studies altogether confirmed that BVDV elimination is both technically
feasible and cost-effective for New Zealand pastoral production system.
This thesis was structured as a series of five distinct research papers formatted for
publication. At the time of submission of the thesis, Chapter 2, 3, and 4 have been published
in peer-reviewed journals.

6

7
Chapter 2
Elimination of bovine viral diarrhoea virus in New Zealand: a review
of research progress and future directions
Jun-Hee Han1, Andrew M. Weir2, Jenny F. Weston3, Cord Heuer1, M. Carolyn Gates1
1 EpiCentre, School of Veterinary Science, Massey University, Private Bag 11-222,
Palmerston North, New Zealand
2 Eltham District Veterinary Services, PO Box 24, Eltham, New Zealand
3 School of Veterinary Science, Massey University, Private Bag 11-222, Palmerston North,
New Zealand
2.1. Abstract
The significant impacts of bovine viral diarrhoea (BVD) on cattle health and production
have prompted many countries to embark on national elimination programmes. These
programmes typically involve identifying and removing persistently infected (PI) cattle in
infected herds and implementing biosecurity measures such as vaccination and pre- or post-
movement testing to prevent the virus from spreading to pregnant dams at risk of creating
new PI calves. Although the same tools are available to the New Zealand cattle industries,
there are still many unanswered questions about how they should be implemented to
achieve the greatest benefits to the industries at the lowest cost to individual farms. The
epidemiological situation for BVD in New Zealand is unusual due to the extensive pasture-
based and seasonal nature of cattle production, the frequent movements of animal between
farms, and the potential role of sheep in disease transmission. In this manuscript, we briefly
review the key epidemiological features of BVD and the current state of knowledge about
BVD in New Zealand. We introduce the ongoing elimination programmes in Europe and
highlight the knowledge gaps that we are aiming to address with a new three-year research

8
programme to design national elimination strategies that could be implemented in New
Zealand.
2.2. Introduction
Bovine viral diarrhoea (BVD) is an OIE-listed disease of cattle that is present worldwide,
and is well known for its impact on cattle health and production (Anonymous, 2017c). The
significant financial impacts of BVD have prompted a number of European countries to
invest in either regional or national elimination programmes designed to fit with each
country’s unique BVD epidemiologic and social context (Houe et al., 2006). After
approximately 10 years from implementation, the Scandinavian countries have
demonstrated that elimination of the disease is achievable using systematic and coordinated
approaches (Ståhl & Alenius, 2012; Wernike et al., 2017).
Recognising the importance of this disease to New Zealand, the National BVD Steering
Committee, which has a primary objective to improve awareness of BVD among farmers
and veterinarians, was formed in 2005 with representatives from all veterinary groups in
the industry (Ellison, 2011). Over the past decade, significant progress, including
widespread use of routine BVD testing for service bulls, expansion of BVD diagnostic tests
offered by the commercial laboratories, and increased recognition amongst farmers of the
important production impacts of BVD, has been made (Stewart, 2013). Based on those
achievements, the committee developed a voluntary BVD control framework for the cattle
industries despite a lack of monetary subsidies or legislative support from the government.
Although anecdotal reports suggested that the proportion of dairy herds actively infected
with BVD virus (i.e. presence of or recent contact with animals that are persistently infected
with BVD virus) have decreased from 2010 to 2013 (Stewart et al., 2014), the estimated
economic burden of this disease is still in excess of NZ$ 150 million per year from direct
production losses alone (Anonymous, 2015). A lesson from the early phases of BVD

9
control in Germany was that a voluntary programme has only a limited effect (Wernike et
al., 2017), and it has been demonstrated that elimination of BVD in countries with high
animal density and movements is not possible without implementing a systematically
coordinated scheme (Moennig, Houe, et al., 2005). Therefore, a framework-shift from the
current ad hoc voluntary situation to a more systematic approach would be required to
eventually eliminate BVD in New Zealand.
In order to design a systematic national control programme that achieves the greatest
benefits to the industries at the lowest cost to individual farmers, an accurate understanding
of the epidemiology, economics, and social motivation for BVD control in New Zealand is
necessary. Although a number of BVD research projects have been undertaken in New
Zealand, there are still many questions that must be answered to design a cost-effective
systematic scheme to control the disease. This article reviews the current state of
knowledge about BVD in New Zealand and highlights the knowledge gaps that need to be
addressed. We first provide a brief review of the important epidemiological features of
BVD, and then describe current knowledge of prevalence, risk factors for transmission, and
financial impacts of BVD in New Zealand. BVD control frameworks from other European
countries are then discussed along with the validity of BVD diagnostic testing and
vaccination in New Zealand. Finally, we report the challenges that must be addressed to
design a cost-effective national control programme to eliminate BVD in New Zealand. To
help understanding of readers, all financial values are reported in NZ$ and standardised to
the year 2016 (Anonymous, 2016b, 2016a).
2.3. General features of BVD
2.3.1. Biology of BVD
BVD virus is a Pestivirus in the Flaviviridae family that primarily affects cattle, but can
also cause infection in small ruminant species (Evans, Pinior, et al., 2019). Classically,

10
BVD virus was divided into two genotypes, BVDV-1 and BVDV-2 (Yeşilbağ et al., 2017).
With the development of molecular analysis, however, novel strains of BVDV-like
pestiviruses, such as "HoBi-like pestivirus" (or BVDV-3), have been identified and studies
have shown the worldwide distribution of the strains (Weber et al., 2016). The virus is also
classified into two biotypes, cytopathic (cp) or non-cytopathic (ncp), based on the
occurrence of apoptosis in infected cells (Grummer et al., 2002).
While the severity of clinical signs varies between different BVD virus strains (i.e.
genotype or sub-genotype), most of the acute infections tend to be subclinical (Houe, 2005).
After the initial infection, BVD virus is cleared from the host within two to three weeks
and this is referred to as transient infection (TI) (Liebler-Tenorio et al., 2004; Müller-
Doblies et al., 2004). However, there have been several reports of the virus being
maintained in peripheral blood or testicular tissue for prolonged periods (Collins et al.,
2009; Voges et al., 1998). Recovered cattle maintain high levels of antibody against that
particular BVD virus strain for at least three years (Fredriksen et al., 1999).
Depending on the virulence of BVD virus strain, acutely infected cattle can show
clinical signs of fever, diarrhoea, haemorrhage, and immunosuppression which
subsequently lead to increased susceptibility to other infectious diseases, and the
combination of clinical signs and lethargy often results in reduced milk production, weight
loss, and/or reduced growth rates (Baker, 1995; Liebler-Tenorio et al., 2002). BVD virus
can also reduce the volume of semen and affect the fertility of female cattle (Kommisrud
et al., 1996; McGowan et al., 2003). Reproductive disorders, such as abortions/stillbirths,
congenital malformations, or the birth of unthrifty calves, can occur in pregnant cows or
heifers depending on the stage of gestation at the time of infection (Moennig & Liess, 1995).
Importantly, if pregnant cows or heifers are infected between approximately 30 to 125
days of gestation and successfully give birth, those calves can be persistently infected (PI)
with BVD virus (Grooms, 2004; Moennig & Liess, 1995). Only ncp strains of BVD virus
are capable of generating PI animals, as they inhibit the induction of type I interferon in the
11
fetus (Peterhans & Schweizer, 2013), causing the fetus to become immune-tolerant to the
infecting virus stain. Once born, the PI calf will continuously shed large quantities of the
BVD virus throughout its life time (Houe & Meyling, 1991). Generally, PI calves are weak,
ill-thrifty, and have reduced life expectancy (Houe, 1993), however, some can be clinically
normal and survive beyond three years of age (Voges et al., 2006).
Another feature related to the BVD virus biotype is the occurrence of mucosal disease
(MD), which is the result of PI animals becoming superinfected with a homologous cp
strain (Brownlie et al., 1984). While the recombination of an innate ncp strain with either
host RNA or a newly introduced heterologous cp strain can create a homologous cp strain
(Goens, 2002), MD can also be developed by a point-mutation of an innate ncp strain itself
(Kümmerer et al., 2000). Once this occurs, MD is invariably accompanied by serious
clinical manifestations of fever, anorexia, gastrointestinal erosions, severe diarrhoea and
eventually death (Houe, 2005). A more detailed review of the pathogenesis of BVD/MD
has been provided by Lanyon et al., (2014).
2.3.2. Transmission
Direct contact with PI animals is the most important route of BVD transmission in most
cattle herds (Houe, 2005; Moen et al., 2005). Introduction of a PI animal can result in
devastating consequences in a naïve herd as the virus can spread rapidly resulting in up to
97% of susceptible cows seroconverting (Houe & Meyling, 1991). BVD can also be
transmitted over the fence between neighbouring farms through direct nose-to-nose contact.
In Denmark, 67 cases of BVD virus introduction in dairy herds were investigated; the most
common transmission pathway was contact with PI animals in a neighbouring herd (36%),
followed by the purchase of PI animal (28%) (Bitsch et al., 2000). The purchase of Trojan
dam (i.e. a non-PI pregnant cow/heifer carrying a PI fetus) is another important BVDV
transmission pathway between farms, and the movement of Trojan cows has been estimated

12
to contribute less 10% of BVDV incidences under endemic situation (Graham et al., 2014;
Qi et al., 2019; Reardon et al., 2018). Grazing on common pastures with stock from other
properties also increases the risk of contact with PI animals. In Norway, the odds of having
active BVD virus infection was 5.1 (95% confidence interval: 1.97 ~ 13.19) times higher
in herds that grazed their heifers on shared pasture (Valle et al., 1999). Compared to PI
animals, TI animals are considered to have a limited impact on BVD transmission, as
several studies found that TI animals cannot propagate BVD in a herd, presumably due to
the short duration and significantly smaller amounts of virus being shed (Niskanen et al.,
2002; Niskanen & Lindberg, 2003). BVD transmission via other indirect routes is possible
through contaminated biological materials (e.g. vaccines), embryos, or semen (Bitsch et al.,
2000; Kommisrud et al., 1996; Niskanen & Lindberg, 2003). Likewise, contaminated
vehicles or equipment (e.g. needles, gloves or boots) may introduce the virus (Valle et al.,
1999).
2.3.3. Diagnosis
A variety of BVD diagnostic tests detecting either evidence of previous exposure (i.e.
antibodies against BVD) or active infection (i.e. BVD virus antigen or viral RNA), are
available (Lanyon et al., 2014). Depending on the purpose of the test, either individual
samples (e.g. identifying a PI animal) or pooled samples (e.g. assessing a herd’s BVD virus
infection status) can be tested. Currently, BVD antibody and antigen ELISA, and RT-PCR
are commonly used in New Zealand (Bradstock et al., 2018), and the performance of these
tests is generally reliable (Dubovi, 2013).
BVD antibody ELISA tests using serum or milk samples can detect previous exposure
to BVD virus in individual animals or groups of animals. BVD antibody ELISA test is
often used on pooled samples as a screening test to determine herd’s immune status against
BVD virus (Houe et al., 2006). Also, a highly positive bulk tank milk (BTM) antibody
13
ELISA, or a high proportion of seropositive individual serum samples from young stock
can be considered as an indicator of active BVD virus infection (Beaudeau, Belloc, Seegers,
Assié, Pourquier, et al., 2001; Houe, 1994). Although the BVD antibody ELISA test is a
cost-effective method to initially assess a herd’s immune status, the test cannot be used if
target herds are BVD vaccinated, or if calves are young enough to have maternal antibodies.
If an initial screening test indicates previous exposure to BVD virus, it is then necessary to
conduct further tests to identify any PI animals.
BVD antigen ELISA tests can be applied to milk, serum, or tissue samples to identify
PI animals, and has been demonstrated to be a rapid method with high test performance
(Kuhne et al., 2005; Saliki et al., 2000). However, serum is an inappropriate sample when
testing animals with maternal BVD antibodies as they can interfere with the reaction
process of the BVD antigen ELISA test (Fux & Wolf, 2012). The BVD antigen ELISA test
also has limited performance if it is used on pooled samples to detect PI animals (Bedekovi
et al., 2012; Cleveland et al., 2006).
RT-PCR is known to be highly sensitive to detect viral RNA, at up to 1:125 dilution of
serum and 1:600 dilution of milk samples of a PI animal being able to be detected by the
test (Bedekovi et al., 2012; Renshaw et al., 2000). However, it is important to recognise
that RT-PCR may not differentiate between persistent and transient infection due to its high
sensitivity (Torstein Sandvik, 2005). To differentiate between PI and TI animals, one can
retest with the antigen ELISA after three weeks to determine if the animal is still viraemic;
a TI animal would no longer be positive at the second test (Lanyon et al., 2014). Greater
detail about the different types of BVD diagnostic tests and their performance or caveats
are thoroughly described by Dubovi, (2013) and Lanyon et al., (2014).

14
2.3.4. Vaccination
The primary objective of BVD vaccination is to confer immunity to breeding cattle
before mating to prevent the creation of PI fetuses (Ridpath, 2013). Although the efficacy
of BVD vaccination to prevent fetal infection varies according to the timing of vaccination,
type of vaccine (e.g. modified-live or killed), or cross-reactivity between different BVD
virus strains (Kelling, 2004), a recent systematic review of 34 previous studies on BVD
vaccination reported that vaccines significantly lowered the risk of fetal infection by 85.7%
(Newcomer et al., 2015).
BVD vaccination could be beneficial in national control programmes, especially where
cattle farms are densely clustered with frequent movements between them (Moennig,
Eicken, et al., 2005). BVD vaccination can help prevent the creation of new PIs by keeping
a herd resistant to new introductions of BVD virus while clearing existing BVD virus
infections (Rypuła et al., 2013). However, vaccination can have some untoward side-effects
as the presence of vaccine-induced antibody interferes with the ability to estimate a herd’s
BVD exposure status using BVD antibody based test (Ridpath, 2013). Also, because of the
antigenic diversity of BVD virus, vaccine-induced immunity may not provide sufficient
protection against some field BVD virus strains (Brock & Cortese, 2001). Although it is
not commercially available anymore, one commercial vaccine was reported to induce a
fatal neonatal pancytopenia in calves of vaccinated dams (Jones et al., 2013). The use of
modified live vaccines on clinically normal PI animals may result in the occurrence of MD
(Ridpath & Bolin, 1995). The risk of BVD vaccines being contaminated with BVD virus
also exists (Ridpath, 2013). Most importantly, using a vaccine may give a false impression
of safety to farmers, making them less concerned about biosecurity (Lindberg et al., 2006).
With or without vaccination, the risk of BVD transmission from other herds still exists if
possible transmission pathways are not properly managed, and it has been pointed out that
biosecurity is the most important component of BVD control (Ståhl & Alenius, 2012).
15
Therefore, a vaccination-alone policy should be avoided to achieve successful BVD
elimination (Ridpath, 2013).
2.4. BVD in New Zealand
2.4.1. Prevalence of BVD
BVD was first recognised in New Zealand in the 1960s through a case report of mucosal
disease-like clinical signs in a herd of cattle (Salisbury et al., 1961). Subsequently, BVD
virus was isolated from multiple herds confirming active circulation of the virus within the
country (Fastier & Hansen, 1966; Jolly et al., 1967). More recent studies have provided
updated estimates of prevalence, further confirming that BVD is endemic and widespread
in both the dairy and beef sectors. Only one genotype, a sub-genotype of BVDV-1a, has
been reported in New Zealand (Packianathan et al., 2017; Vilček et al., 2001), however, no
studies investigating the genetic diversity of the virus in New Zealand have been published
during the last two decades (Vilček et al., 1998).
2.4.1.1. Prevalence in the dairy sector
It has been reported that a large proportion of New Zealand cattle herds are affected by
BVD. A study that reported BVD antibody ELISA results on BTM from 350 dairy herds
across New Zealand showed that 92.9% of the dairy herds had evidence of exposure to
BVD virus (Voges, 2008). Assuming that a higher reaction to the ELISA indicates higher
seroprevalence which could be driven by the presence of PI animals, the author concluded
that 37.5% of the dairy herds were actively infected with BVD virus. This study may have
overestimated the proportion of herds with PI animals since the study was not based on any
confirmation test on the presence of BVD virus. More recently, Weir et al., (2016)
conducted a similar study on BTM of 385 dairy herds, and applied Ab ELISA and RT-PCR

16
test to confirm the exposure to BVDV and presence of PI animals, respectively. With some
variation by year, the authors found that 63.1 ~ 70.1% of the dairy herds had evidence of
exposure to BVD virus. Based on RT-PCR, it was suggested that 8.6% of North Island
herds and 32.0% of South Island herds contained at least one PI animal. As pointed out by
the authors, one limitation of this study was that it was based on herds conveniently selected
from only some regions of the country, so the results may not be representative of other
parts of New Zealand.
2.4.1.2. Prevalence in the beef sector
Compared to the dairy sector, there have been fewer studies estimating the prevalence
of BVD virus infection in New Zealand beef herds due to the greater logistical challenges
of conducting diagnostic tests in extensively managed herds (Sanhueza et al., 2013). Heuer
et al., (2008) reported that 64.9% (61 out of 94) of beef herds in New Zealand had evidence
of previous exposure to BVD virus. Based on the seropositivity of young stock, the authors
implied that 46.8 ~ 50.7% of New Zealand beef herds were actively infected with BVD
virus. A similar estimate was reported by a recent study using the BVD antibody ELISA
test of individual serum samples. Assuming that more than 20% seropositivity in a sampled
herd indicates active BVD virus infection, W. Cuttance & Cuttance, (2014) estimated that
the proportion of beef herds in the North Island with at least one PI animal was 58.1%
(25/43). However, the estimated prevalence of actively infected beef herds may be
inaccurate because (1) none of the previous studies confirmed the presence of actively
circulating virus in the herds with evidence of exposure, and (2) only a small number of
beef farms participated in each study and these were either willing to test for BVD or had
a high index of suspicion for BVD, which makes these herds potentially non-representative
of the general population. Further studies including larger numbers of beef farms across
New Zealand and confirming the presence of BVD virus are required to accurately estimate
the prevalence.
17
2.4.1.3. Within-herd prevalence of PI animals
The prevalence of PI animals within BVD virus infected herds in New Zealand is
reported to be less than 2% for both dairy and beef herds (W. Cuttance & Cuttance, 2014;
Voges et al., 2006), similar to other countries (Fulton et al., 2009; Rüfenacht et al., 2000).
Even though PI animals often have a short life expectancy, there have been several reports
that PI cows can survive for at least three years under New Zealand farming conditions
(Hill, Reichel, et al., 2010; Voges et al., 2006).
2.4.2. Risk factors for transmission
Several studies have been conducted to identify the risk factors for BVD transmission
in New Zealand. Previous studies suggested that factors, such as the purchase of cattle,
grazing dams away from the home farm during early pregnancy, or contact with
neighbouring cattle, are significantly associated with active BVD virus infection (W.
Cuttance & Cuttance, 2014; Weir & Heuer, 2009). There is, however, conflicting evidence
that herd size is a risk factor with several studies suggesting that herd size was not a risk
factor for BVD virus infection in New Zealand (Thobokwe et al., 2004; Voges, 2008) and
another study showing significantly increased risk with increasing herd size (Weir & Heuer,
2009). Estimates of regional risk of BVD virus infection vary as well. Significant
geographical patterns in disease prevalence were observed for New Zealand dairy herds,
indicating that local spread and local trade networks may influence BVD transmission
(Voges, 2008). In contrast for beef herds, W. Cuttance & Cuttance, (2014) found that there
was no significant difference in herd level prevalence of active BVD virus infections in
beef herds across different regions. This discrepancy around the importance of region as a
risk factor could originate from the inherent differences in the management systems
between dairy and beef herds (Gates et al., 2014).
18
2.4.3. Financial losses due to BVD
As well as causing direct production losses in infected farms, the cost of preventive
measures on naïve farms, such as vaccination or diagnostic testing, significantly increases
the economic burden of BVD to the cattle industries (Richter et al., 2017). Many studies
have been conducted internationally to quantify the financial losses due to BVD infection.
A recent systematic review estimated that the direct losses due to BVD virus infection
ranged from NZ$ 3.45 to NZ$ 988.04 per animal (Richter et al., 2017). It should be noted
that the estimated losses greatly vary between studies as they applied different estimation
approaches (e.g. type of quantitative model, target population, study design, stock and
production values, or disease effects contributing to economic losses) as well as different
epidemiological settings (e.g. virulence of virus strain, duration of BVD, within- or
between-herd prevalence, or herd production level). Nevertheless, it is well recognised that
BVD causes substantial economic losses to cattle industries (Houe, 1999).
Given the widespread prevalence of BVD throughout New Zealand, it is likely that
BVD has a significant impact on the national economy. Accordingly, the economic impact
of BVD in New Zealand cattle herds has been estimated. Several studies have reported
significant growth retardation and reduced milk production in New Zealand cattle herds
containing PI animals (Compton & McDougall, 2005; Hill, Reichel, et al., 2010; Voges,
2008). Compton et al., (2006) suggested that infertility, abortion, and reduced milk
production induced by BVD virus infection caused an annual loss of NZ$ 109.30 per cow
in a dairy herd with PI animals. Assuming 304 cows per herd and 17% of national herds
carrying PI animals, the authors estimated the economic impact of BVD to be NZ$ 71.5
million in the dairy industry alone. Using modelling approaches, Heuer et al., (2007) also
analysed the financial loss in the New Zealand dairy industry due to BVD virus infection;
assuming an average dairy herd size of 215 with 14.6% of those herds having at least one
PI animal, the authors estimated losses to the dairy industry of NZ$ 52.8 million per year.
These studies likely underestimate the true cost of disease as indirect effects, such as
19
diagnostic testing, vaccination, and increased susceptibility to other infectious diseases,
were not considered. Another study calculated that acute infection caused NZ$ 91.10 per
adult dairy cow due to discarded milk, reduced conception and pregnancy rates, and extra
veterinary costs (Weir et al., 2016). In the New Zealand beef industry, one study suggested
that BVD virus infection resulted in a 5% decrease in pregnancy rate (Heuer et al., 2008).
However, no studies have been conducted to estimate the financial cost of BVD virus
infection in the beef sector.
2.5. Control of BVD
2.5.1. European programmes
The three critical principles of BVD control in cattle herds are (1) the timely
identification and elimination of PI animals to break the within-herd transmission cycle, (2)
improved herd biosecurity to prevent BVD virus introduction or re-introduction from
outside sources, and (3) continuous surveillance to early detect the re-introduction of
BVDV to farms that achieved freedom (Lindberg & Houe, 2005). The latter is why many
European countries (e.g. Sweden, Norway, Finland, Denmark, Austria, Switzerland,
Germany, the Netherland, Belgium, Scotland, and Ireland) have implemented regional or
national systematic BVD control programmes (Moennig & Becher, 2018; Richter et al.,
2017). The frameworks used to eliminate BVD in those countries can be generally
categorised into three different groups.
2.5.1.1. Scandinavian framework
This framework was adopted in Sweden, Norway, Denmark, and Austria (Houe et al.,
2006). The programme has three stages; (1) An initial BVD antibody screening test is
conducted for each herd using bulk tank milk (BTM). If positive, or in the case of beef
20
herds, targeted BVD antibody testing using individual serum from young stock is
performed to confirm recent exposure to BVD virus. (2) All individual animals and calves
born in the following year in BVD-positive herds are then tested for virus to identify and
eliminate PI animals. (3) Once PI animals have been eliminated, the herd’s BVD virus
infection status is continually monitored by targeting representative young stock, such as
weaned calves or replacement heifers. During the programme, movement restrictions for
PI animals or animals from infected herds can be imposed to prevent onward transmission.
2.5.1.2. Swiss framework
In the initial phase, all animals were individually tested for BVD virus using an ear
notch sample and/or serum sample. In the calf phase, after removal of existing PI animals,
any new born calves are screened with either the RT-PCR or the BVD antigen ELISA in
case there were Trojan cows at the time of initial screening. For herds with calves positive
on this screening test, movement of all pregnant females in the herd is restricted until all
the calves are born. In the monitoring phase, after the removal of all PI animals, each herd’s
BVD virus infection status is monitored with a BVD antibody test on BTM or serum
samples. Although the original plan was to end the calf phase by 2009, the phase was
continued until 2012 and an antibody-based monitoring programme has been in place since
2013 (Presi & Heim, 2010; Stalder et al., 2016).
2.5.1.3. German framework
This programme is similar to the Swiss framework in that it uses a BVD antigen test for
screening. However, rather than testing all cattle on the farm, only the new born calves are
tested within 6 months of birth. Another distinct feature is that, unlike other frameworks,
voluntary BVD vaccination is allowed. Ireland has also adopted this framework to control
BVD (Graham et al., 2014; Wernike et al., 2017).
21
Based on these frameworks, some modification can be applied depending on the
country’s epidemiological circumstances. For example, the initial screening process in
Norway had additional BVD antibody tests on BTM from primiparous cows and pooled
serum from young animals (Løken & Nyberg, 2013). The BVD programme in Belgium is
similar to the German framework, but extends the target animals to the dams of the tested
calves for initial screening (Steven, 2015). In Scotland, where BVD vaccination is allowed,
a BVD antibody test using serum samples from calves is conducted on negative herds for
monitoring while virus detection using serum or tissue samples from either all the calves
or all the animals in the herd is performed on non-negative herds (Anonymous, 2016c).
2.5.2. Validity of diagnostic tests in New Zealand
Several studies have validated the diagnostic tests used in New Zealand. Thobokwe et
al., (2004) compared the test results of the p80 antibody blocking ELISA (IDEXX BVDV
Total Ab Test; IDEXX Laboratories Inc., Westbrook MA, USA) on different samples of
different animal groups from 50 dairy farms in the North Island. The authors analysed the
results of the ELISA using BTM of milking cows and serum samples from 15 heifers on
each farm, and showed that there was a significant correlation between the results.
Assuming that (1) the presence of seropositive heifers indicates active infection of the herd
with BVD virus, and (2) heifers and milking cows are managed separately in New Zealand,
this study implied that a high level of BVD antibody detected in an ELISA on BTM can be
evidence of active infection of BVD virus in a dairy farm. Validation of the BVD antibody
test at individual cow level was conducted by Weir et al., (2013). Based on anecdotal
reports that the performance of the indirect antibody ELISA test (IDEXX BVDV Total Ab
Test; IDEXX Laboratories Inc., Westbrook MA, USA) on individual milk samples was
suboptimal, the authors analysed the test results of the ELISA using milk and serum
samples from 90 cows. This study suggested that the cut-off value for the test using milk
samples should be lowered to correctly identify exposed individual animals. With a

22
recalibrated cut-off value, the relative sensitivity and specificity for the milk sample
compared to the same test on serum samples were estimated as 0.99 and 1.00, respectively.
Hill et al., (2007) validated the BVD antigen ELISA test (IDEXX Ag-ELISA; IDEXX
Scandinavia, Österbybruk, Sweden) using skin and serum samples from 276 animals. For
30 PI animals confirmed by RT-PCR test, ELISA test results using both samples showed
complete agreement as well as with the RT-PCR test. This study indicated that using a skin
sample for the BVD antigen ELISA test could be a valid and cheaper approach to accurately
detect PI calves in New Zealand. RT-PCR on BTM has also been validated to be sensitive
to detect PI animals in New Zealand dairy herds. Hill et al., (2010b) demonstrated that RT-
PCR on BTM detected 2 PI animals among a herd of 800 cows. However, the test failed to
detect 1 PI animal among 800 cows, implying that RT-PCR on BTM was able to detect 1
PI animal among up to 400 negative cows in New Zealand. Based on the result, the authors
argued that RT-PCR on BTM was a reliable screening test in New Zealand dairy herds.
2.5.3. Validity of BVD vaccination in New Zealand
In New Zealand, McArthur, (2004) assessed the efficacy of fetal protection of a trivalent
vaccine and reported that two out of eight vaccinated cows produced PI calves and a further
cow aborted, resulting in a vaccine efficacy of 62.5%. A more recent study assessed the
efficacy of two commercially available BVD vaccines (BVDV-1a and BVDV-1c vaccines)
in New Zealand (Packianathan et al., 2017). Twenty-five heifers were vaccinated and
boosted against BVD virus, and the heifers were challenged with BVDV-1a after 6 months.
Of the 22 fetuses where the authors could retrieve fetal tissue, 15 were successfully
protected (e.g. 5 out of 8 for the type 1a vaccine, 10 out of 14 for the type 1c vaccine)
giving 62.5% (95% confidence interval: 29.0% ~ 96.0%) and 71.4% (95% confidence
interval: 47.8% ~ 95.1%) of fetal protection efficacy against BVDV-1a and BVDV-1c
strain, respectively.

23
2.5.4. Financial benefit of BVD control programmes
Many studies have been conducted worldwide to assess the financial cost and benefit of
implementing BVD control programmes. It should be noted that the estimated cost and
benefit of BVD control programmes varies greatly between studies depending on the
assumptions around the target populations, economic parameters, prevalence of BVD,
timescale, or type of control measures. However, a crucial point is that most of the previous
studies on the financial assessment of BVD prevention programmes worldwide concluded
that the implementation of a BVD control programme was economically beneficial (Pinior
et al., 2017).
The applicability of some control schemes has been financially evaluated for New
Zealand dairy farms. Reichel et al., (2008) conducted a cost-benefit analysis of three
different BVD control programmes (i.e. vaccination, test-and-cull, and increasing
biosecurity) with varying efficacy of protection, and found that increasing the biosecurity
(specifically screening purchased cattle for BVD and enhancing farm boundary biosecurity)
resulted in maximum benefit. Another study with a similar aim was conducted testing more
options for control schemes and concluded that the combination of double fencing,
screening of in-coming animals, and PI elimination was the most cost-effective option
(Weir et al., 2014). In both studies, the authors concluded that implementing any form of
control measure for BVD benefited farm profitability significantly more than doing nothing.
No studies to date have been conducted to estimate the financial benefit of BVD control
measures in the New Zealand beef industry. It will be crucial to generate good estimates
for both the beef and dairy sectors, given the high degree of contact between them
(Anonymous, 2017b).
24
2.6. Discussion
Today, many European countries are running BVD control programmes regionally or
nationally, and some of these countries have virtually eliminated the disease (Richter et al.,
2017). Although running a BVD control programme costs significant money, time, and
effort, there have been multiple simulation studies demonstrating that the benefits of BVD
elimination far out-weigh the cost of the disease control programme (Pinior et al., 2017).
An anecdotal report estimated that at least NZ$ 150 million per year is lost due to BVD in
the New Zealand cattle industries (Anonymous, 2015). Considering its major impact on the
industries, the general consensus on implementing a systematically coordinated national
BVD control programme should be built to increase the productivity of cattle farms.
Successful control of BVD will not only reduce the economic burden of the disease, but
also increase the animal welfare by preventing the stress and pain experienced by animals
infected with BVD virus.
In the past decade, the science around BVD in New Zealand has advanced significantly
and we now have the technical capability to eliminate the disease. However, there are still
some questions that should be answered before we can determine the most cost-effective
tools to employ for a national control programme.
Firstly, most studies on BVD in New Zealand have been conducted in the dairy industry
and there is limited knowledge about the disease in the beef sector. This is mainly because
beef herds in New Zealand are extensively grazed with few mustering events during the
production season (Geenty & Morris, 2017), which makes it difficult for researchers to
collect accurate epidemiological and economic data, such as live weight gain for
susceptible, TI, or PI animals (Sanhueza et al., 2013). Another epidemiological challenge
associated with extensive beef herds is that calves typically stay with their dams from birth
to weaning at approximately 6 months of age, which means there are limited opportunities
to identify and remove PI calves before they can expose susceptible dams during the next
mating period. This is particularly a concern if the contact rate between cattle in extensive

25
beef herds is not high enough to generate sufficient immunity to BVD before the start of
mating if there are PI calves in contact with the herd of breeding cows. Given that there are
twice as many beef herds (3.5 million animals from 31,000 herds) as dairy herds (6.5
million animals from 14,000 herds) in New Zealand (Anonymous, 2017a; Jewell et al.,
2016), knowledge of BVD epidemiology and its economic impact in the beef sector would
be a significant requirement for understanding BVD in the New Zealand cattle industries.
Secondly, to the best of our knowledge, the only analysis on the genotype of endemic
BVD virus strains in New Zealand was published in 1998 (Vilček et al., 1998), and there
is limited information about the genotypes of currently circulating strains. Given the variety
of virulence or antigenic diversity between BVD virus strains, knowledge around
genotypes of current BVD viruses should be updated. Molecular epidemiology has also
proven to be a useful tool to increase our understanding of BVD transmission and contact
patterns in countries that maintain molecular databanks of prevalent BVD virus strains
(Ståhl et al., 2005). For example. researchers can use the genetic similarity of BVD virus
sequences isolated from different farms to make inferences about the timing and direction
of transmission (Booth et al., 2013). By investigating these epidemiological links, we can
make better inferences about the most important routes of BVD transmission between cattle
farms in the industries as well as better biosecurity recommendations to individual farms
to help them target the specific pathways that are leading to BVD virus re-introduction.
Although BVD is typically a cattle disease, it has been demonstrated that other small
ruminants, like goat or sheep, can be infected with BVD virus (Passler & Walz, 2010).
Even though sheep are considered spill-over hosts of BVD virus infection, there was a
report of a PI ram being identified as the source of ongoing BVD virus circulation in a
Danish cattle herd for several years (Bitsch et al., 2000). In New Zealand, one recent case
report showed that BVD PI lambs in a Wairarapa sheep flock were generated by contact
with PI heifers (King, 2014). Considering that co-grazing with sheep, either concurrently
or successively, on the same pasture is common in the New Zealand beef industry, future

26
studies should determine if there is the potential for sheep to be contributing to BVD
transmission in New Zealand beef herds.
BVD transmission between herds via animal movements is another fundamental factor
that must be understood when establishing a BVD control scheme for New Zealand. In
2016, more than 2.6 million cattle were reported to move between farms in New Zealand
(Anonymous, 2017b). This is a significant amount of movement considering that the entire
cattle population is estimated to be 10 million (Anonymous, 2017a). Animal movement or
trade patterns between New Zealand cattle farms have been researched in relation to other
diseases, such as foot-and-mouth disease or bovine tuberculosis (Hidano et al., 2016;
Sanson, 2005), but the impact of cattle movement on BVD spread has never been studied.
Given that the most important risk factor for BVD virus infection is direct contact with PI
animals, the epidemiological role of a PI animal or a Trojan cow introduced via animal
movements on national BVD spread needs to be investigated.
New Zealand farmers’ opinion and their willingness to adopt BVD control measures
should be investigated as well. It has been shown that providing farmers with information
about the economic loss caused by a disease is not sufficient to make them implement any
control measures (van Asseldonk et al., 2010). In Ireland, nearly 30% of dairy farmers that
were confirmed as actively infected with BVD virus retained identified PI animals on the
farm even though some financial compensation was available for culling (Graham et al.,
2014). A recent study of English farmers’ behaviour around biosecurity to prevent the
introduction of BVD showed that the farmer’s affiliation to the voluntary BVD control
scheme was not associated with either their knowledge or level of concern about the disease
(Azbel-Jackson et al., 2018). International studies have shown that a variety of factors, such
as herd size, market-driven economic premiums, and social and cultural significance (e.g.
being recognised as “good farmer” by others), can drive farmers to implement biosecurity
measures (Garforth et al., 2013; McAloon et al., 2017; Nöremark et al., 2010). Therefore,
studies on the social science that elucidate what motivates New Zealand farmers to join and
27
comply with control schemes would highlight ways to increase participation among
individual farmers who currently have a low commitment to BVD control.
A three-year BVD research project (www.bvdfree.org.nz) sponsored by the Sustainable
Farming Fund, AGMARDT, and industry was launched in July 2017 to help build the
business case for BVD elimination in New Zealand. This involves field studies and national
surveys in the first two years to collect better data on general herd management, BVD
epidemiology (e.g. seroconversion rates, prevalence of PI calves, or decay rate of maternal
antibody on calves) and its economic impacts, efficacy of control measures (e.g. PI culling
or vaccination), and farmers’ opinions towards BVD control in New Zealand. The role of
sheep in BVD transmission will also be preliminarily investigated, and animal movement
patterns between cattle farms and genotypes of current BVD virus strains will be analysed
to identify important transmission routes between herds. Data gathered through the first
two years will be used to build a national disease simulation model to evaluate the long-
term cost-effectiveness of different national elimination options in New Zealand. We
expect that most of the epidemiological and economic questions will be answered through
the BVD research project, and it should lead to the most cost-effective national BVD
control strategy that is relevant to the New Zealand farming context.
2.7. Acknowledgements
J-H Han is supported by KNZACS, a joint scholarship programme between the
Republic of Korea and New Zealand, and by a Massey University Doctoral Scholarship.
The BVD Free New Zealand project is supported through grants from the Sustainable
Farming Fund, AGMARDT, MSD Animal Health, Zoetis, and Massey University.

28
29
Chapter 3
Using Bayesian network modelling to untangle farm management
risk factors for bovine viral diarrhoea virus infection
Jun-Hee Han1, Joanne Holter2, John Moffat2, Jenny F. Weston3, Cord Heuer1, M. Carolyn
Gates1
1 EpiCentre, School of Veterinary Science, Massey University, Private Bag 11-222,
Palmerston North, New Zealand
2 MSD Animal health, Private Bag 908, Upper Hutt, New Zealand
3 School of Veterinary Science, Massey University, Private Bag 11-222, Palmerston North,
New Zealand
3.1. Abstract
Understanding risk factors for bovine viral diarrhoea (BVD) transmission is important
for planning national disease control programmes. However, traditional statistical
approaches may miss important features of BVD epidemiology due to the highly correlated
nature of many farm-level risk factors. In this cross-sectional study, we used data collected
from 304 cattle herds in New Zealand during 2015/2016 to compare the results from
multivariable logistic regression with Bayesian network (BN) analysis. Blood samples
from 15 heifers from each farm were pooled and analysed with an antibody ELISA test to
classify BVD virus exposure status. Farmers were surveyed about their general
management practices, knowledge about BVD, and risk factors for disease transmission,
including onto- and off-farm movements, within- and between-farm contacts, and whether
they implemented BVD control measures for their service bulls. Multiple imputation was
used to infer missing values in the dataset prior to statistical analysis. The results showed
that 57/116 (49.1%) beef farms and 95/188 (50.5%) dairy farms were likely to be actively
30
infected with BVD virus. Almost 60% of farms had movements of heifers/cows onto the
premises and 13.8% of farmers reported contact with cattle from other farms. The results
of the multivariable logistic regression showed that farms where heifers/cows had been
moved onto the premises during all or most of the past five years were at higher risk of
being BVD seropositive than farms without those movements (odds ratio: 2.21, 95%
confidence interval: 1.29 ~ 4.24). Farms where cattle had occasional or rare contacts with
cattle on other farms were also at increased risk compared with farms without any animal
contacts between farms (Odds ratio: 2.63, 95% confidence interval: 1.33 ~ 5.41) although
this association was not frequency-dependent. Only close animal contacts between farms
was directly associated with BVD status in the BN model, however, this approach further
untangled other complex associations between correlated management factors, and
provided additional important insights into BVD epidemiology. Compared to other
countries with intensive production systems, over the fence contact appeared to play a more
important role in New Zealand pastoral-based production systems and should be considered
when developing strategies for a national BVD control programme.
3.2. Introduction
Bovine viral diarrhoea (BVD) is an OIE-listed cattle disease that exists worldwide and
is recognised for its significant impact on cattle health, welfare and production
(Anonymous, 2017c). A distinct characteristic of BVD epidemiology is that, if dams are
infected in early-mid gestation before the fetus has developed a competent immune system,
the fetus will become persistently infected (PI) with BVD virus and the resulting calf will
shed large quantities of the virus throughout its life-time (Fray et al., 2000). Control
schemes for BVD in many countries are therefore focused on identifying and eliminating
existing PI animals in a timely fashion and preventing the creation of new PI animals
through vaccination and improved herd biosecurity (Lindberg & Houe, 2005).
31
Many studies have used standard multivariable regression to explore risk factors for
BVD with the aim of identifying important transmission pathways to improve herd
biosecurity plans and national disease control programmes. In particular, the purchase of
heifers or cows, mean number and distance of neighbouring farms, sharing a common
pasture, or over-the-fence contacts between herds have been shown to significantly
increase the risk of BVD transmission (Ersbøll & Stryhn, 2000; Obritzhauser et al., 2005;
Valle et al., 1999), and the sharing of farming instruments or contaminated biologicals have
also been identified as possible transmission routes (Lindberg & Houe, 2005). These risk
factors for BVD transmission are generally highly correlated farm management factors
(Gates et al., 2013; Lewis & McCormick, 2012) and using multivariable approaches that
only consider the association of variables with one specific outcome of interest may restrict
our understanding of how general farm management practices influence BVD
epidemiology.
Considering the correlated nature of farm management factors, a multivariate analysis
capable of examining complex inter-relationships among all variables of interest may
provide a better understanding of BVD epidemiology, which is crucial for better
recommendations for BVD control. There are many multivariate techniques, such as factor
analysis or principal component analysis, to explore associations between variables, and
Bayesian network (BN) analysis is one such multivariate approach that illustrates
associations between variables as a directed acyclic graph (DAG) by estimating joint
probabilities (Nagarajan et al., 2013). BN modelling empirically discovers an optimal DAG,
or network structure, that best represents the associations between variables in a given
dataset and can be used to distinguish between indirect and direct associations with the
outcome of interest. Although it may require adequate sample size (Zuk et al., 2006), it is
generally accepted that BN is not restrained by small sample size (Uusitalo, 2007), meaning
that many variables can be considered simultaneously with a restricted number of
observations. BN analysis has been increasingly applied in the field of veterinary

32
epidemiology to analyse complex relationships among variables (Firestone et al., 2014;
Pittavino et al., 2017; Schemann et al., 2013) including one pioneering study to holistically
analyse BVD-related data (Lewis et al., 2011).
BVD has been endemic in New Zealand since at least the 1960s (Salisbury et al., 1961)
and its control currently depends on farmer’s voluntary uptake of recommended control
measures such as testing and vaccinating bulls and other replacement breeding stock (Han,
Weir, et al., 2018). As a part of ongoing efforts to evaluate the cost-efficiency of
implementing a coordinated national BVD control programme in New Zealand, the
importance of different farm management risk factors of BVD transmission should be
evaluated in New Zealand’s pastoral farming system. To date, only a limited number of
studies have been conducted to identify risk factors in New Zealand (W. Cuttance &
Cuttance, 2014; Weir et al., 2016). To address this knowledge gap, MSD Animal Health
conducted a “Take the BVD Test Challenge” project in 2015/2016 that surveyed farmers
about their current BVD status and management practices. In this study, we analysed the
data (1) to investigate risk factors for BVD under New Zealand pastoral farming conditions
and (2) to compare and contrast the inferences that can be made about BVD epidemiology
from the two different statistical modelling approaches.
3.3. Material and methods
We followed the guidelines from the STROBE-VET statement to report this study
(Sargeant et al., 2016).
3.3.1. Data collection
The study was based on cross-sectional data from the “Take the BVD Test Challenge”
project conducted by MSD Animal Health from September 2015 to December 2016. The
aim of the project was to update information about the prevalence of BVD and to collect
data about BVD risk factors from cattle farms across New Zealand. The initiative was

33
advertised to all veterinarians across New Zealand who were asked to collect whole blood
samples for BVD testing and administer a BVD risk factor survey whilst visiting an eligible
farm for other animal health reasons. The selection criteria were that the farms (1) were not
currently implementing a BVD control programme and (2) were not currently vaccinating
animals against BVD virus (with the exception of bulls) since vaccination is known to
interfere with antibody-based screening tests for BVD. The source population therefore
was New Zealand cattle farms that utilised veterinary services and were not implementing
BVD control measures. No restrictions were set on the total number of farms that could
participate.
For each enrolled farm, 15 apparently healthy animals between 1 and 2 years of age
were randomly selected from the replacement heifer herd. Serum samples were collected
from each animal and shipped to a commercial diagnostic laboratory for analysis using a
commercially available BVD antibody ELISA test (IDEXX BVDV Total Ab Test; IDEXX
Laboratories Inc., Westbrook MA, USA). Farms were inferred as being actively infected
with BVD virus if the S/P ratio for the pooled sample was greater than the validated cut-
off value of 0.75 (Hill, McCoy, et al., 2010). The laboratory testing fees were provided at
no cost to farmers as an incentive to participate.
During the sampling visit, a survey consisting of seven open and 33 closed questions
was administered to farmers to collect information about general farm management
practices. These included questions on the geographic region and production type of farm,
number of neighbouring cattle farms, frequency of off-farm movement of the replacement
heifers, frequency of close animal contacts within and between farms, and farmers’
awareness of important BVD epidemiological concepts including PI animals and Trojan
cows (i.e. a pregnant cow carrying PI fetus). Whether farmers shared cattle yards with
neighbour(s) or had onto-farm movements of heifers/cows, bulls, weaners/stores,
replacement heifers, or carry-overs (i.e. cows that failed to conceive but were kept in the
herd for breeding in the subsequent season) during the last five years were also asked. The

34
questionnaire also included a mating method (e.g. AI only, bull only, AI & bull, and not
available) used for the herd of replacement heifers, and three additional questions about
BVD prevention measures employed for service bulls (e.g. whether bulls were BVD
antigen-tested, certified BVD-free, or vaccinated against BVD) were further asked for
those who replied as either bulls only or AI & bull for the mating method. The same set of
questions (mating method and three BVD prevention measures employed for service bulls)
was also asked about the mating of mixed-age breeding cows. The survey was reviewed by
two local veterinarians to provide feedback on the questions and wording, but no pilot study
with farmers was conducted prior to the project. A copy of the survey is provided in
Appendix 1 (see Section 1).
3.3.2. Data processing
A total of 308 farmers were voluntarily recruited for the project during the study period.
Observations from four farms were discarded due to missing survey data or sampling the
wrong population of animals. Among the observations from the remaining 304 farms,
overall 5.8% of fields in the dataset were missing data and only 154 (50.7%) farmers
completed every question on the management survey. To avoid discarding observations
with missing data from the statistical models, we imputed missing values using multiple
imputation by chained equations (MICE). MICE creates multiple imputed datasets by
sequentially regressing missed values of a variable using other variables as explanatory
variables in an appropriate model (van Buuren, 2018). In this study, imputation models of
predictive mean matching, logistic regression, proportional odds model, and multinomial
logistic regression were used for imputing missing values of continuous, binary, ordinal,
and multinomial variables, respectively (White et al., 2011). Multiple imputation was
conducted in R using “mice” packages (van Buuren & Groothuis-Oudshoorn, 2011), and
1,000 imputed datasets were created to adjust for variation caused by imputation (van
Buuren, 2018). Imputed values of BVD prevention measures for the service bulls used with
35
the replacement heifers and mixed-age breeding cows were restricted to “Not available”
when the observation had either “AI only” or “Not available” for the mating method.
Similarly, imputed values for those variables were updated to “Unknown” if the imputed
values were “Not available” but the mating method specified the use of service bulls.
Following imputation, several variables were re-categorised and/or merged to simplify
the dataset. Responses of variables with more than three categories were re-grouped into
two or three categories. Given the fact that only farmers who used bulls for the mating
method were able to reply three variables of BVD prevention measures applied to service
bulls, these four variables for each group (e.g. replacement heifers and mixed-age breeding
cows) were merged, creating variables of “Implementing BVD control measures on service
bulls” for mating replacement heifers and mixed-age breeding cows with categories of
“Bulls not used”, “No”, and “Yes”. Details on re-categorising and the merging process are
provided in Appendix 1 (see Section 2).
3.3.3. Descriptive statistics
Before imputing missing values, basic descriptive statistics were generated using the
original dataset. Given the missing values, bi-variable descriptive statistics were conducted
in a pairwise deletion manner, which is using only available observations of variables for
comparison. For bi-variable comparison, statistical methods of Student’s t-test or chi-
square test were applied. To estimate the sampling coverage, the number of farms recruited
per production type was compared with the number of each type of cattle farms in New
Zealand based on census data from 2012 (Anonymous, 2017a).

36
3.3.4. Multivariable logistic regression
A multivariable logistic regression model was developed to identify risk factors
associated with active BVD virus infection. The outcome variable was whether the farm
was positive or negative for active BVD virus infection as determined by the S/P ratio from
pooled antibody testing, and 19 explanatory variables were evaluated as risk factors. In
order to adjust variation between imputed datasets, we stacked 1,000 imputed datasets and
applied a fixed weight for regression models (Wood et al., 2008). The weight was (1 – f)/M
for each observation, where f is the fraction of missing values across all variables in an
original dataset (i.e. 0.055) and M is the number of imputed datasets (i.e. 1,000).
We first performed univariable screening to identify variables that were associated with
the outcome at a P-value of likelihood ratio test ≤ 0.2. During the bi-variable comparison
using the original dataset, we observed significant correlation between the frequency of
close animal contacts between farms and both the number of neighbouring cattle farms and
sharing cattle yard with neighbour(s). Because all the three variables were identified as
significant in univariable screening, only the frequency of close animal contacts between
farms was considered for multivariable logistic regression. Significant variables from
univariable screening were entered in the multivariable model followed by a backward
stepwise selection method to identify the final multivariable model. Starting with the
highest P-value, any variable with a P-value of the log likelihood ratio test > 0.05 was
manually eliminated from the model. After each variable was dropped, we assessed
changes in the coefficients and standard error of other explanatory variables to identify
possible confounders. The criterion of confounding effect was set as 20%, however no
confounding effect was observed during the model building process in this study.
As one of our aims was to compare a multivariable logistic regression model with a BN,
interactions between explanatory variables were not considered in this multivariable
approach. The result of the final model was presented as odds ratios (OR) and 95%
37
confidence intervals (CI). All the regression modelling was conducted in R (R Core Team,
2016).
3.3.5. BN modelling
To further investigate associations between risk factors for active BVD virus infection
and to identify possible risk factors that were not captured by the multivariable approach,
we also constructed a BN model. Construction of a BN involves structure discovery and
parameter estimation. Structure discovery is the process of identifying an optimal DAG
showing best fit to a given dataset. Since we had 1,000 imputed datasets, an optimal DAG
was identified in two steps; (1) identify 1,000 network structures using imputed datasets
with a random restart greedy hill-climbing search (Bouckaert, 1995), and then (2) generate
an optimal DAG as a majority consensus network among the 1,000 structures (Wilson et
al., 2013). Given that the direction of the BN does not indicate causality (Lewis &
McCormick, 2012), the majority consensus network was set by retaining arcs with a
summed number of appearances over both directions being more than 50% of the 1,000
structures (e.g. undirected majority consensus network) (Poon et al., 2007a). Once an
optimal DAG was discovered, the DAG was translated into an additive BN, of which a
parameterisation process is similar to the multivariable generalized linear models, to
estimate the parameter of each arc in forms of OR (Benjamin J. J. McCormick et al., 2017).
For the calculation of OR, direction of undirected arcs in the optimal DAG was re-assigned
with the one that appeared at a greater frequency in the 1,000 structures (Poon et al., 2007b).
Then, the marginal distributions of every parameter on the optimal DAG were calculated
for each imputed dataset, resulting in 1,000 marginal distributions of OR for each arc on
the DAG. Those distributions were aggregated to estimate median and 95% credible
interval (CrI) of each OR, and an arc was treated as significant if the 95% CrI did not
overlap with one. Any arc that was not statistically significant was dropped.
38
For constructing a BN, all categorical variables with three response groups (except
variables of implementing BVD control measures on service bulls for mating the
replacement heifers and mixed-age breeding cows) were converted into binary variables in
such a way to fit responses into either “Never” or “Not-never”. Production type and
implementing BVD control measures on service bulls for heifers and mixed-age breeding
cows were split into binary dummy variables, each of which corresponded to the responses
of the original variable. For simplicity, the region was dropped as there was no plausible
explanation for regional differences. Overall, 24 variables were used for BN modelling,
and any arc between split variables was banned. Structure discovery was calculated in R
using “bnlearn” package (Scutari, 2009) and parameters were estimated in JAGS 4.3.0
(Plummer, 2013).
3.4. Results
3.4.1. Descriptive statistics from the survey responses
The “Take the BVD Test challenge” was completed by a total of 116 beef farmers and
188 dairy farmers during the study period. The studied farms represented 0.5% of beef and
1.5% of dairy farms in New Zealand. Overall, evidence of active BVD virus infection was
observed in 152/304 farms (50.0%, CI: 43.5 ~ 54.8%), including 57/116 beef farms (49.1%,
CI: 43.5 ~ 54.6%) and 95/188 dairy farms (50.5%, CI: 44.9 ~ 56.2%). As shown in Figure
3.1, active infection with BVD virus was prevalent in cattle farms in all regions of New
Zealand, and there were no obvious variations in prevalence by region.

39
Figure 3. 1. Figure 3.1. Proportion of cattle farms actively infected with BVD. Note that no cattle farms
from three regions (Gisborne, Taranaki, and Nelson) were sampled.

40
Survey responses from the 304 participating farms are summarised in Table 3.1. The
overall median number of replacement heifers was 90 animals (IQR 50 to 140) and the
number of heifers for dairy farms (median: 103, IQR: 70 ~ 168) were significantly greater
(P-value < 0.001) than for beef farm (median: 59, IQR: 30 ~ 100). It was common practice
for cattle farms to introduce at least one animal into the herd annually with only 6 out of
285 farmers (2.1%) that provided complete responses about onto-farm movements of cattle
reporting that they maintained completely closed herds. Among the 279 farms that
maintained open herds, 255 (91.4%) had onto-farm movement of any type of cattle
throughout all or most of the last five years. The most common type of cattle brought onto
the farm during the last five years was bulls (94.1%), followed by heifers/cows (30.2%),
replacement heifers (19.6%), weaners/stores (16.9%), and carry-overs (11.0%). Frequent
close animal contact between different management groups within a farm was observed on
72/284 farms (25.4%), while only 40/289 farmers (13.8%) reported to have frequent close
animal contacts between animals from different farms. Sharing cattle yards with
neighbouring farms was not a common management practice, reported by only 108/297
farmers (36.4%).

41
Table 3. 1. Description of survey responses and univariable logistic regression of farm management risk factors for active infection with BVD virus from 304 New Zealand
cattle herds. Median and interquartile range of number of farms over 1,000 imputed datasets are also presented. Odds ratio with bold and underlined characters shows p-value
less than 0.2.
Variable Level/units Total number of farms Number of farms
BVD (+) a, b
OR (95% CI)
Raw Imputed b
Region (n= 304) Northland 9 9 2 Reference
Auckland 15 15 6 2.33 (0.37 ~ 21.00)
Waikato & Bay of plenty 46 46 29 5.97 (1.22 ~ 46.54)
Hawke’s bay 24 24 12 3.50 (0.65 ~ 28.93)
Manawatu-Wanganui
& Wellington
18 18 10 4.38 (0.75 ~ 38.00)
West Coast 13 13 6 3.00 (0.46 ~ 27.74)
Canterbury 40 40 18 2.86 (0.57 ~ 22.43)
Otago 40 40 19 3.17 (0.64 ~ 24.80)
Southland 67 67 31 3.01 (0.64 ~ 22.84)
Tasman 6 6 3 3.50 (0.36 ~ 43.41)
Marlborough 26 26 16 5.60 (1.05 ~ 46.26)
Production type (n= 304) Dairy 188 188 95 Reference
Beef 116 116 57 1.06 (0.65 ~ 1.72)
Neighbouring farms (n= 274) Same or less than 2 105 119 (117 ~ 120) 51 (50 ~ 52) Reference
More than 2 169 185 (184 ~ 187) 101 (100 ~ 102) 1.61 (1.00 ~ 2.62)
Onto-farm movement of heifers/cows (n= 297) Never 121 122 (122 ~ 123) 54 (54 ~ 54) Reference
Occasionally/rarely 93 94 (94 ~ 95) 43 (43 ~ 43) 1.06 (0.60 ~ 1.86)
All/most years 83 87 (87 ~ 88) 55 (55 ~ 55) 2.15 (1.20 ~ 3.90)
Onto-farm movement of bulls (n= 302) Never 24 24 (24 ~ 25) 11 (11 ~ 11) Reference
Occasionally/rarely 24 24 (24 ~ 24) 14 (14 ~ 14) 1.66 (0.51 ~ 5.54)

42
All/most years 254 256 (255 ~ 256) 127 (127 ~ 127) 1.19 (0.50 ~ 2.91)
Onto-farm movement of weaners/stores (n= 294) Never 193 198 (197 ~ 199) 95 (94 ~ 95) Reference
Occasionally/rarely 56 59 (58 ~ 60) 33 (33 ~ 33) 1.38 (0.75 ~ 2.55)
All/most years 45 47 (46 ~ 47) 24 (24 ~ 25) 1.19 (0.61 ~ 2.33)
Onto-farm movement of replacement heifers (n= 291) Never 209 212 (212 ~ 213) 101 (101 ~ 102) Reference
Occasionally/rarely 29 30 (30 ~ 31) 18 (18 ~ 19) 1.67 (0.75 ~ 3.84)
All/most years 53 61 (60 ~ 62) 32 (32 ~ 33) 1.24 (0.68 ~ 2.25)
Onto-farm movement of carry-overs (n= 289) Never 230 236 (235 ~ 237) 114 (113 ~ 114) Reference
Occasionally/rarely 29 31 (30 ~ 32) 15 (14 ~ 15) 0.95 (0.43 ~ 2.08)
All/most years 30 37 (36 ~ 38) 24 (23 ~ 24) 1.88 (0.91 ~ 4.07)
Sharing cattle yards (n= 297) Never 189 192 (192 ~ 193) 90 (89 ~ 90) Reference
Occasionally/rarely 82 84 (84 ~ 85) 51 (50 ~ 51) 1.74 (1.01 ~ 3.00)
All/most years 26 27 (26 ~ 28) 11 (11 ~ 12) 0.83 (0.35 ~ 1.93)
Number of replacement heifers (n= 270) (Continuous) - - - 1.00 (1.00 ~ 1.00)
Off-farm movement of heifer herd (n= 298) No 152 155 (154 ~ 156) 76 (75 ~ 76) Reference
Yes 146 149 (148 ~ 150) 76 (76 ~ 77) 1.10 (0.69 ~ 1.76)
BVD control measures on service bulls for heifer herd
(n= 259)
Bulls not used 83 87 (86 ~ 89) 43 (42 ~ 44) Reference
No 42 52 (51 ~ 54) 30 (29 ~ 31) 1.36 (0.67 ~ 2.81)
Yes 134 164 (162 ~ 165) 78 (78 ~ 79) 0.93 (0.54 ~ 1.60)
Close animal contacts within a farm (n= 284) Never 46 50 (49 ~ 51) 20 (19 ~ 21) Reference
Occasional/rarely 166 176 (174 ~ 177) 92 (90 ~ 93) 1.59 (0.82 ~ 3.13)
Often 72 79 (78 ~ 80) 40 (39 ~ 41) 1.51 (0.72 ~ 3.23)
Close animal contacts between farms (n= 289) Never 43 47 (46 ~ 49) 16 (15 ~ 16) Reference
Occasional/rarely 206 215 (214 ~ 216) 119 (118 ~ 119) 2.44 (1.24 ~ 4.97)
Often 40 42 (41 ~ 42) 17 (17 ~ 18) 1.43 (0.58 ~ 3.55)
Off-farm movement of mixed-age cows (n= 272) No 171 187 (186 ~ 189) 94 (93 ~ 95) Reference

43
Yes 101 117 (115 ~ 118) 58 (57 ~ 59) 0.98 (0.60 ~ 1.59)
BVD control measures on service bulls for mixed-age
cows (n= 255)
Bulls not used 48 50 (49 ~ 50) 23 (22 ~ 23) Reference
No 46 57 (56 ~ 59) 34 (33 ~ 35) 1.72 (0.78 ~ 3.87)
Yes 161 197 (195 ~ 198) 96 (95 ~ 96) 1.13 (0.59 ~ 2.18)
Farmer’s awareness of BVD (n= 294) Not good 172 178 (177 ~ 179) 89 (88 ~ 90) Reference
Good 122 126 (125 ~ 127) 63 (62 ~ 64) 1.00 (0.63 ~ 1.62)
Farmer’s awareness of PI animals (n= 297) No 51 54 (53 ~ 54) 22 (21 ~ 23) Reference
Yes 246 251 (250 ~ 251) 130 (129 ~ 131) 1.55 (0.84 ~ 2.92)
Farmer’s awareness of Trojan cows (n= 289) No 203 212 (211 ~ 213) 101 (101 ~ 102) Reference
Yes 86 92 (91 ~ 93) 51 (50 ~ 51) 1.33 (0.80 ~ 2.22)
Key: IQR, interquartile range; OR, odds ratio; CI, confidence interval
a: actively infected with BVD.
b: values in parenthesis are interquartile range of number of farms across 1,000 imputed datasets.
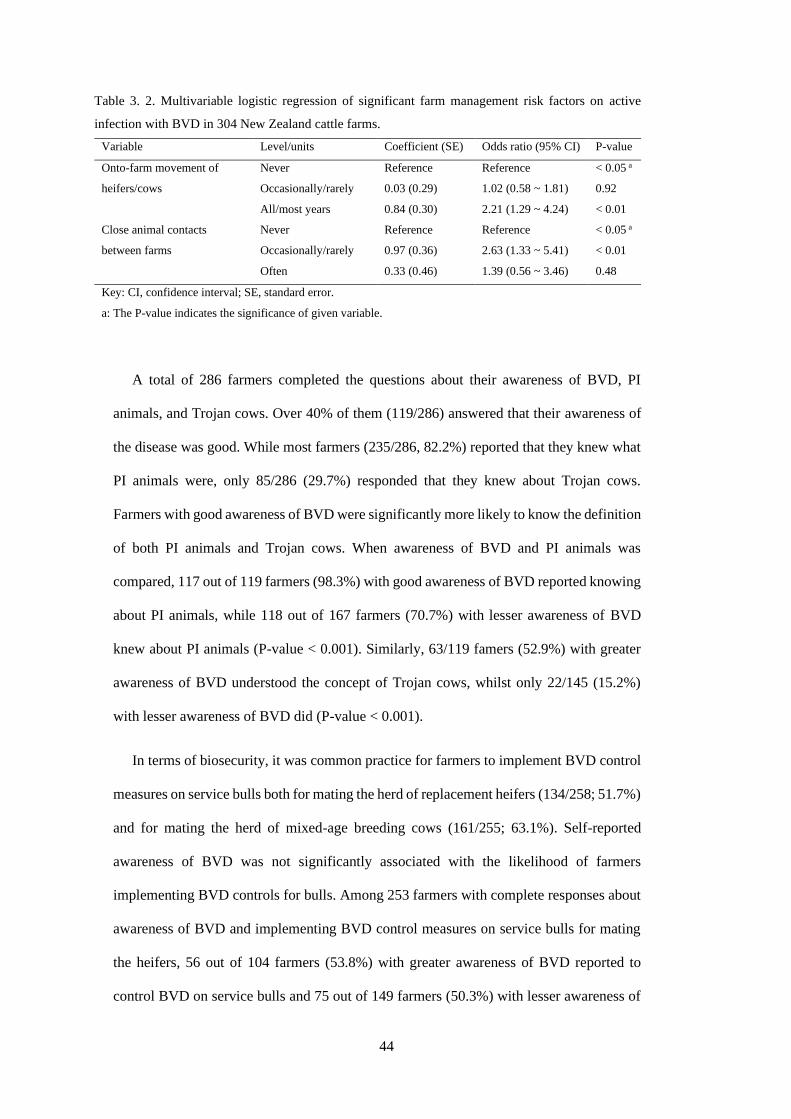
44
Table 3. 2. Multivariable logistic regression of significant farm management risk factors on active
infection with BVD in 304 New Zealand cattle farms.
Variable Level/units Coefficient (SE) Odds ratio (95% CI) P-value
Onto-farm movement of
heifers/cows
Never Reference Reference < 0.05 a
Occasionally/rarely 0.03 (0.29) 1.02 (0.58 ~ 1.81) 0.92
All/most years 0.84 (0.30) 2.21 (1.29 ~ 4.24) < 0.01
Close animal contacts
between farms
Never Reference Reference < 0.05 a
Occasionally/rarely 0.97 (0.36) 2.63 (1.33 ~ 5.41) < 0.01
Often 0.33 (0.46) 1.39 (0.56 ~ 3.46) 0.48
Key: CI, confidence interval; SE, standard error.
a: The P-value indicates the significance of given variable.
A total of 286 farmers completed the questions about their awareness of BVD, PI
animals, and Trojan cows. Over 40% of them (119/286) answered that their awareness of
the disease was good. While most farmers (235/286, 82.2%) reported that they knew what
PI animals were, only 85/286 (29.7%) responded that they knew about Trojan cows.
Farmers with good awareness of BVD were significantly more likely to know the definition
of both PI animals and Trojan cows. When awareness of BVD and PI animals was
compared, 117 out of 119 farmers (98.3%) with good awareness of BVD reported knowing
about PI animals, while 118 out of 167 farmers (70.7%) with lesser awareness of BVD
knew about PI animals (P-value < 0.001). Similarly, 63/119 famers (52.9%) with greater
awareness of BVD understood the concept of Trojan cows, whilst only 22/145 (15.2%)
with lesser awareness of BVD did (P-value < 0.001).
In terms of biosecurity, it was common practice for farmers to implement BVD control
measures on service bulls both for mating the herd of replacement heifers (134/258; 51.7%)
and for mating the herd of mixed-age breeding cows (161/255; 63.1%). Self-reported
awareness of BVD was not significantly associated with the likelihood of farmers
implementing BVD controls for bulls. Among 253 farmers with complete responses about
awareness of BVD and implementing BVD control measures on service bulls for mating
the heifers, 56 out of 104 farmers (53.8%) with greater awareness of BVD reported to
control BVD on service bulls and 75 out of 149 farmers (50.3%) with lesser awareness of
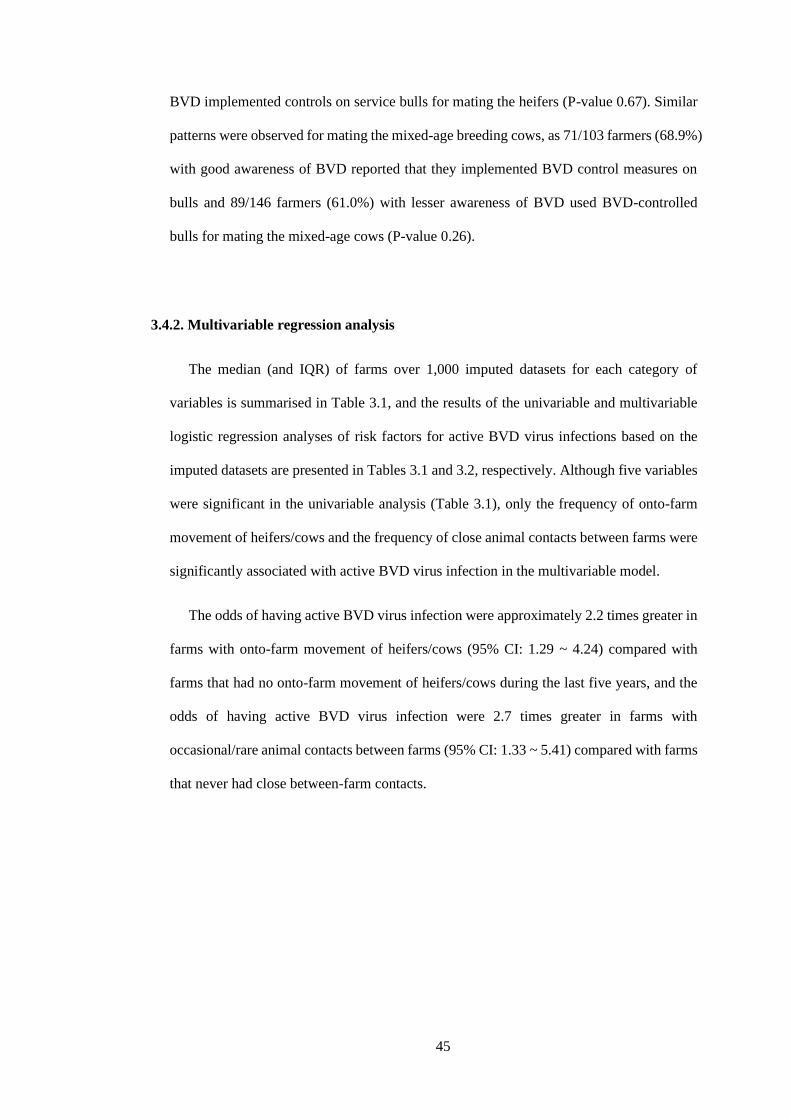
45
BVD implemented controls on service bulls for mating the heifers (P-value 0.67). Similar
patterns were observed for mating the mixed-age breeding cows, as 71/103 farmers (68.9%)
with good awareness of BVD reported that they implemented BVD control measures on
bulls and 89/146 farmers (61.0%) with lesser awareness of BVD used BVD-controlled
bulls for mating the mixed-age cows (P-value 0.26).
3.4.2. Multivariable regression analysis
The median (and IQR) of farms over 1,000 imputed datasets for each category of
variables is summarised in Table 3.1, and the results of the univariable and multivariable
logistic regression analyses of risk factors for active BVD virus infections based on the
imputed datasets are presented in Tables 3.1 and 3.2, respectively. Although five variables
were significant in the univariable analysis (Table 3.1), only the frequency of onto-farm
movement of heifers/cows and the frequency of close animal contacts between farms were
significantly associated with active BVD virus infection in the multivariable model.
The odds of having active BVD virus infection were approximately 2.2 times greater in
farms with onto-farm movement of heifers/cows (95% CI: 1.29 ~ 4.24) compared with
farms that had no onto-farm movement of heifers/cows during the last five years, and the
odds of having active BVD virus infection were 2.7 times greater in farms with
occasional/rare animal contacts between farms (95% CI: 1.33 ~ 5.41) compared with farms
that never had close between-farm contacts.
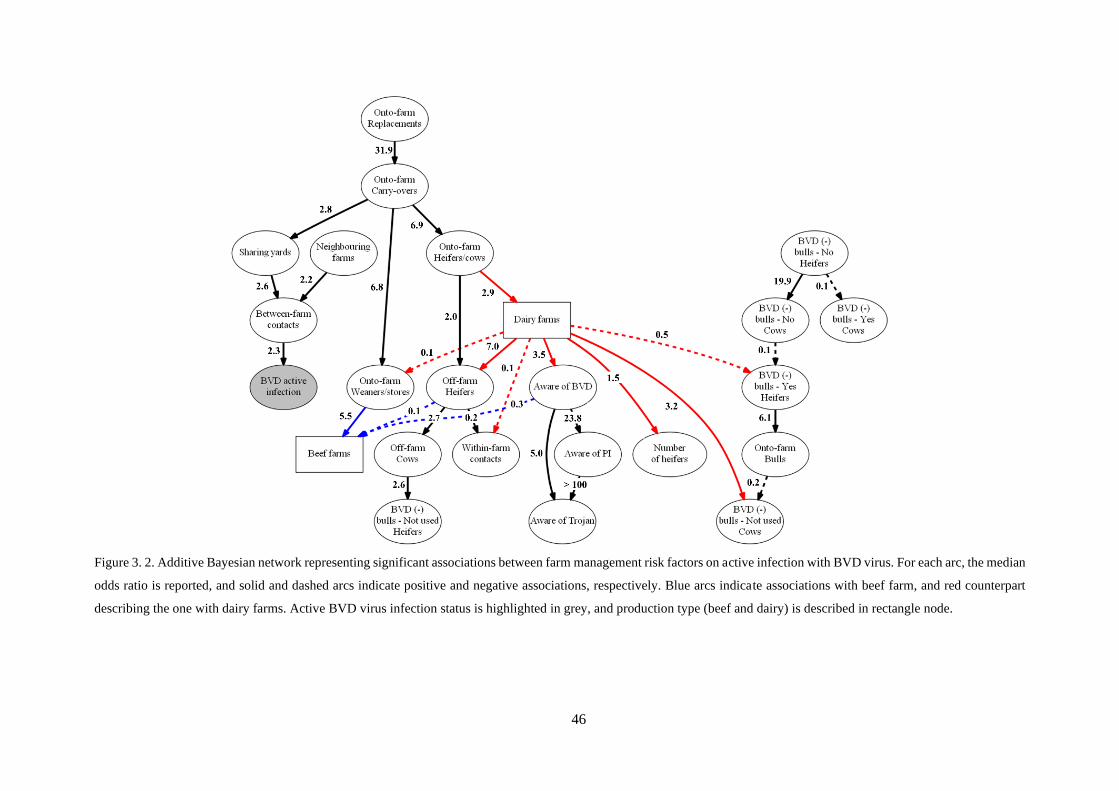
46
Figure 3. 2. Additive Bayesian network representing significant associations between farm management risk factors on active infection with BVD virus. For each arc, the median
odds ratio is reported, and solid and dashed arcs indicate positive and negative associations, respectively. Blue arcs indicate associations with beef farm, and red counterpart
describing the one with dairy farms. Active BVD virus infection status is highlighted in grey, and production type (beef and dairy) is described in rectangle node.
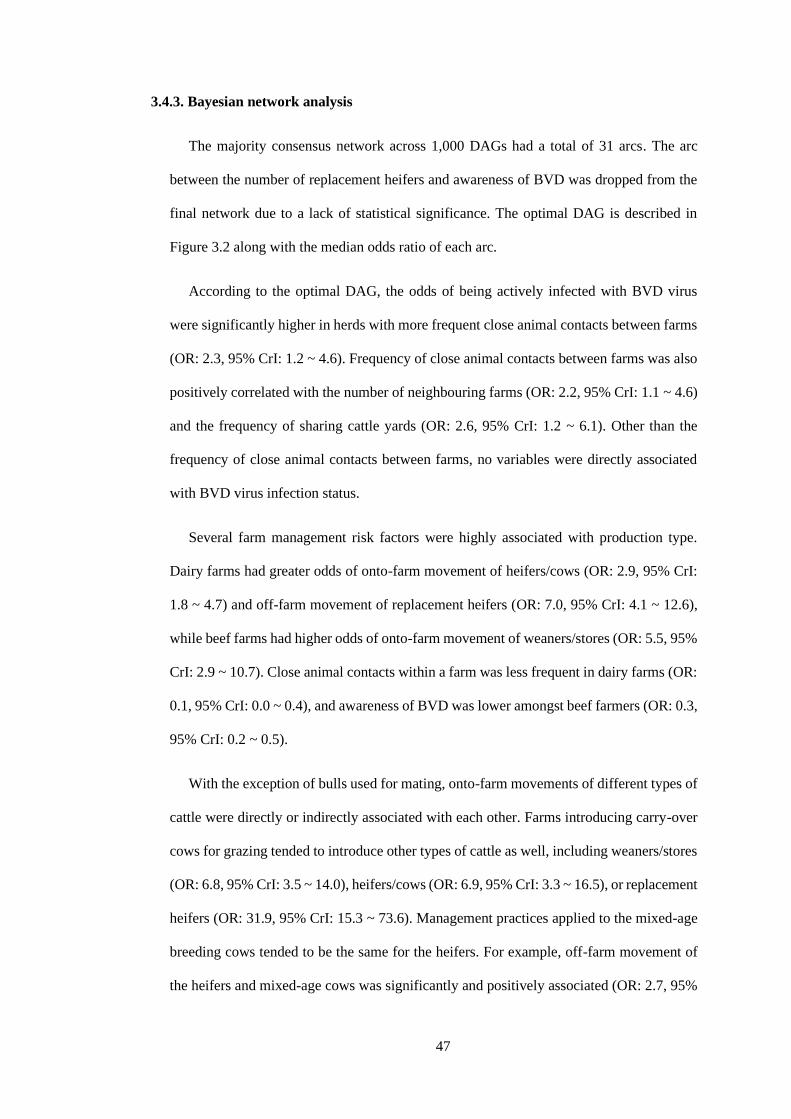
47
3.4.3. Bayesian network analysis
The majority consensus network across 1,000 DAGs had a total of 31 arcs. The arc
between the number of replacement heifers and awareness of BVD was dropped from the
final network due to a lack of statistical significance. The optimal DAG is described in
Figure 3.2 along with the median odds ratio of each arc.
According to the optimal DAG, the odds of being actively infected with BVD virus
were significantly higher in herds with more frequent close animal contacts between farms
(OR: 2.3, 95% CrI: 1.2 ~ 4.6). Frequency of close animal contacts between farms was also
positively correlated with the number of neighbouring farms (OR: 2.2, 95% CrI: 1.1 ~ 4.6)
and the frequency of sharing cattle yards (OR: 2.6, 95% CrI: 1.2 ~ 6.1). Other than the
frequency of close animal contacts between farms, no variables were directly associated
with BVD virus infection status.
Several farm management risk factors were highly associated with production type.
Dairy farms had greater odds of onto-farm movement of heifers/cows (OR: 2.9, 95% CrI:
1.8 ~ 4.7) and off-farm movement of replacement heifers (OR: 7.0, 95% CrI: 4.1 ~ 12.6),
while beef farms had higher odds of onto-farm movement of weaners/stores (OR: 5.5, 95%
CrI: 2.9 ~ 10.7). Close animal contacts within a farm was less frequent in dairy farms (OR:
0.1, 95% CrI: 0.0 ~ 0.4), and awareness of BVD was lower amongst beef farmers (OR: 0.3,
95% CrI: 0.2 ~ 0.5).
With the exception of bulls used for mating, onto-farm movements of different types of
cattle were directly or indirectly associated with each other. Farms introducing carry-over
cows for grazing tended to introduce other types of cattle as well, including weaners/stores
(OR: 6.8, 95% CrI: 3.5 ~ 14.0), heifers/cows (OR: 6.9, 95% CrI: 3.3 ~ 16.5), or replacement
heifers (OR: 31.9, 95% CrI: 15.3 ~ 73.6). Management practices applied to the mixed-age
breeding cows tended to be the same for the heifers. For example, off-farm movement of
the heifers and mixed-age cows was significantly and positively associated (OR: 2.7, 95%

48
CrI: 1.7 ~ 4.6). Also, implementing BVD control measures on service bulls for mating
heifers and mixed-age cows tended to be correlated (OR: 19.8, 95% CrI: 9.2 ~ 45.1).
3.5. Discussion
In the current study, approximately half of unvaccinated beef and dairy farms in New
Zealand showed evidence of active BVD virus infection based on the diagnostic criteria of
having an S/P ratio greater than 0.75 on the pooled BVD antibody ELISA test. Previous
research has shown that farms with a S/P ratio less than 0.75 on pooled serum sample from
15 to 16 animals are extremely unlikely to have PI animals and the probability of having
PI animals increased from 14.3% to 58.3% as the S/P ratio increased from 1.00 to 1.50
(Hill, McCoy, et al., 2010). Although it is possible that some of the positive farms were
therefore falsely classified as having active BVD virus infection with PI animals, the
prevalence of active BVD virus infection on beef farms in our study is in accordance with
previous research that reported a prevalence of active infection among beef herds in the
North Island of New Zealand was 58.1% (95% CI: 43.4 ~ 72.9%) based on BVD antibody
test (W. Cuttance & Cuttance, 2014). Interestingly, the prevalence of active BVD virus
infection on dairy farms in our study was higher than previous estimates of 8.6% to 32.0%
(varied by region) based on RT-PCR on bulk tank milk (Weir et al., 2016). This could
partly be explained by our sampling eligibility criterion, which included only farms that
were not implementing any BVD control measure such as vaccination or culling of PI
animals. Anecdotal reports from veterinarians suggest that more than 70% of dairy farms
are currently implementing at least one control measure for BVD (i.e. vaccination, test and
cull, or routine monitoring) compared with less than half of beef farms (Stewart, 2013;
Weir et al., 2016). Considering that implementing any BVD control measure is quite
common in the dairy industry, the prevalence of dairy farms being actively infected with
BVD virus in this study would be overestimated by selection bias. Nevertheless, a key
message of this study is that BVD is still endemic in both beef and dairy industries in New
49
Zealand, and the development of cost-effective BVD control programmes covering the
entire country is important to reduce the economic burden of the disease.
As missing values were spread unevenly over the data, the proportion of complete
observations in this study was approximately 50% even though overall proportion of data
fields with missing data was only 5.8%. Conducting analysis based on complete
observation would have not only restricted the use of full extent of the data but also reduced
statistical power. It is possible that some of missingness of variables could be correlated,
which would invalidate the assumption of “missing (completely) at random” for MICE
method. However, given the fact that complete observations comprised just half of the
entire dataset, we believe that the benefit of imputing missing values using MICE far
outweighed the advantage of using complete cases only even though the assumption may
not be fully met.
Cattle farm management in New Zealand is predominantly pasture-grazing with
seasonal calving, which may explain why the strength of associations in the multivariable
regression model differed slightly from other countries that practice more intensive farming.
In systems with intensively housed cattle, close contact over fences could be a relatively
minor transmission route and other management factors, including herd size, purchase of
animals, or use of artificial insemination, have been suggested to be important risk factors
for transmission (Almeida et al., 2013; Solis-Calderon et al., 2005; Van Campen, 2010). In
this study, we identified that close animal contacts between farms and onto-farm movement
of heifers/cows significantly increased the odds of farms having an active BVD infection.
Both between-farm contacts and introducing heifers have been suggested as risk factors for
generating PI calves, which is the most important risk factor for BVD transmission. In New
Zealand, studies have found that purchasing replacement heifers increased the odds of BVD
virus infection in beef herds (W. Cuttance & Cuttance, 2014) and contacts over the fence
with neighbouring cattle increased the herd BVD antibody level significantly in dairy herds
(Weir et al., 2016). Our findings are in accordance with those previous studies, which
50
highlights the importance of improving herd biosecurity through measures such as double
fencing or movement restrictions to prevent BVD transmission between farms.
Similar to the multivariable regression model, a direct association between active BVD
virus infection and the frequency of close animal contacts between farms was identified
using the BN. Moreover, a BN uncovered indirect associations between active infection
with BVD virus and both the number of neighbouring farms and the frequency of sharing
cattle yards via close animal contacts between farms. Importantly, it suggests that the close
between-farm animal contacts was actually a mediator variable of other two variables, and
that the variable should not be considered for multivariable logistic regression if the other
two variables would have been inserted. However, when the number of neighbouring farms
and the frequency of sharing cattle yards were considered for the multivariable logistic
regression instead of the frequency of close animal contacts between farms, neither of them
was significantly associated with active BVD virus infection status (not presented in the
study). It indicates that a multivariable regression method would not be the optimal choice
to identify indirect risk factors for BVD virus infection in this study, even though it is
logical that having multiple neighbouring farms or sharing cattle yards could further
increase the risk of BVD transmission by increasing the frequency of potentially infectious
between-farm contacts if PI animals were present on other farms (Bitsch et al., 2000; Presi
et al., 2011). Therefore, using a BN approach in this study provided a refined and more
holistic insight into interrelated risk factors for BVD virus infection in the New Zealand
cattle industries by revealing more plausible and statistically significant pathways between
them. It may further be implied that local spread could be an important BVD transmission
route in pasture-based farms in New Zealand.
Interestingly, we could not find any preventive effect of implementing BVD control
measures on service bulls in either analytical approach. This is contrary to findings from a
previous New Zealand study, which suggested that vaccinating newly introduced bulls
against BVD prevents active infection with BVD virus (W. Cuttance & Cuttance, 2014).

51
Consequently, using BVD accredited bulls for mating has been a key message to farmers
for controlling the disease (Ellison & Weir, 2017), while relatively less emphasis was
placed on preventing other ways of BVD virus introduction. According to the optimal DAG,
farms with onto-farm movement of bulls tended to implement BVD control measures on
service bulls for mating heifers. Therefore, a plausible explanation on the lack of a
preventive effect would be that controlling BVD on service bulls has already been a
common management feature prior to the study, irrespective of BVD virus infection status.
Without controlling for the confounding effects of other routes of BVD transmission, such
as allowing between-herd contacts or purchasing replacement heifers with an unknown
disease status, the absence of an effect of applying BVD controls on service bulls could be
overwhelmed by such factors, and hence confounded to zero.
Another interesting point with regard to the optimal DAG is that there was no direct
association between current BVD virus infection status and onto-farm movement of
heifers/cows even though this was observed in the multivariable logistic regression. One
explanation for this discrepancy between multivariable and multivariate approaches might
be a Yule-Simpson paradox that an observed association between two variables can
disappear or even be reversed when confounding variable is controlled-for. However, this
is a less likely explanation since introducing replacement heifers is a well-known and
highly plausible risk factor for BVD and has already been demonstrated in the New Zealand
farming context (W. Cuttance & Cuttance, 2014; Weir & Heuer, 2009). Another possible
explanation is that the correlation between variables was reduced by generating a consensus
network from multiple imputed datasets (Wilson et al., 2013). As the optimal DAG in this
study was constructed by retaining only the arcs that were commonly observed over 1,000
structures, the DAG was a conservative network that could have missed some significant
associations that did not appear repeatedly across 1,000 networks. It is also possible that
the strength of an exposure was reduced by merging two categories into one (e.g. “All/most
years” and “Occasional/rarely” became one group) resulting in a weaker association.

52
Using BN modelling, we identified that beef and dairy farms had different set of risk
factors. Dairy farms reported much more frequent onto-farm movement of heifers/cows
and off-farm movement of heifers, but fewer within-farm animal contacts between different
management groups. This may suggest that dairy farms are at greater risk of introducing
BVD virus through cattle movement. In beef farms, onto- and off-farm movement of
heifers were less common, but farmers’ awareness of BVD epidemiology was also lower,
which may make it more difficult to convince farmers of the importance of implementing
BVD control measures. Although we could not find any direct or indirect associations
between production type and BVD virus infection status, our findings indicate that different
risks for BVD virus introduction exist across enterprise types and approaches for farmer
education or enhancing biosecurity to control BVD should be tailored to the production
type (Gates et al., 2014).
It has previously been shown that the attitude of farmers towards biosecurity can be
influenced by their knowledge about the disease (Garforth et al., 2013). However, in our
study, we found no significant association between self-reported farmer knowledge of
BVD, PI animals or Trojan cows and implementing BVD control measures on service bulls.
This may be explained by the fact that New Zealand farmers’ awareness of BVD primarily
increased after their herds were directly affected by the disease (W. Cuttance & Cuttance,
2014). Furthermore, although many farms in New Zealand have been reported to
implement at least one control or preventive measure against BVD, less than 10% of farms
implement the full series of interventions (i.e. PI identification and elimination, monitoring
BVD status, and BVD vaccination if it is necessary) which is necessary to successfully
control the disease (Stewart, 2013). Given that about half of all dairy and beef farms in
New Zealand are actively infected with BVD virus, it is prudent to increase efforts to
educate farmers about the epidemiology and economic consequences of BVD virus
infection to highlight the need for BVD control.

53
3.6. Conclusions
Based on the results from conveniently sampled cattle farms not using any BVD control
measures, close animal contacts between farms appears to be an important BVD
transmission pathway in the New Zealand pastoral production system. Herds surrounded
by more neighbouring farms or shared cattle yards more frequently are more likely to have
between-farm contact. Moreover, onto-farm movement of heifers/cows poses another risk
of introducing BVD virus onto the farm. These risk factors can be mitigated with enhanced
biosecurity, however, New Zealand farmers may not see the economic benefit of
implementing biosecurity measures. Increasing farmer education and awareness of BVD is
likely to be a crucial component of future national disease control efforts.
3.7. Acknowledgement
We are grateful to New Zealand cattle farmers and veterinarians who participated in the
“Take the BVD Test Challenge” project.

54
55
Chapter 4
Estimation of the within-herd transmission rates of bovine viral
diarrhoea virus in extensively grazed beef cattle herds
Jun-Hee Han1, Jenny F. Weston2, Cord Heuer1, M. Carolyn Gates1
1 EpiCentre, School of Veterinary Science, Massey University, Private Bag 11-222,
Palmerston North, New Zealand
2 School of Veterinary Science, Massey University, Private Bag 11-222, Palmerston North,
New Zealand
4.1. Abstract
With the widespread prevalence and significant economic impacts of bovine viral
diarrhoea virus (BVDV), many research groups have developed mathematical models to
simulate the dynamics of BVDV infections in cattle herds. However, most models use
estimates for within-herd BVDV transmission rates that are either based on expert opinion
or adapted from other dairy herd simulation models presented in the literature. There is
currently little information on the transmission rates for BVDV in extensively grazed beef
herds partly due to the logistical challenges in obtaining longitudinal data of individual
animal’s seroconversion, and it may not be appropriate to apply the same transmission rates
from intensive dairy herds given the significant differences in herd demographics and
management. To address this knowledge gap, we measured BVDV antibody levels in 15
replacement heifers in each of 75 New Zealand beef breeding farms after their first calving
and again at pregnancy scanning or weaning to check for seroconversion during the early
pregnancy period. Among these, data from 9 farms were used in a BVDV simulation model
to infer the within-herd BVDV transmission rate with an approximate Bayesian
computation method. The most probable within-herd BVDV transmission rate was

56
estimated as 0.11 per persistently infected (PI) animal per day with a 95% highest posterior
density interval between 0.03 ~ 0.34. This suggests that BVDV transmission in extensively
grazed beef herds is generally slower than in dairy herds where the transmission rate has
been estimated at 0.50 per PI animal per day and therefore may not be sufficient to ensure
that all susceptible breeding females gain adequate immunity to the virus before the risk
period of early pregnancy for generating new PI calves.
4.2. Introduction
Bovine viral diarrhoea virus (BVDV) is recognised for its significant impacts on cattle
health, welfare and production worldwide (Anonymous, 2018b). An important
epidemiological feature of BVDV is that if susceptible dams are infected in early-mid
gestation before the fetus has developed a competent immune system, the fetus will become
persistently infected (PI) with BVDV and the resulting calf will shed large quantities of the
virus throughout its life-time (Fray et al., 2000). Since PI animals act as the primary
reservoir for BVDV transmission in cattle populations, most BVDV control programmes
are therefore focused on identifying and eliminating existing PI animals in a timely fashion
as well as preventing the creation of new PI animals (Lindberg & Houe, 2005). This can
be accomplished through various interventions such as conducting animal- or herd-level
diagnostic testing, vaccinating susceptible animals, and improving farm biosecurity (Evans,
Pinior, et al., 2019).
To appraise the economic argument for implementing BVDV control measures, several
research groups have developed mathematical simulation models to explore BVDV
transmission dynamics and its impact on production at varying scales (e.g. in a farm or
multiple farms in a region/country) (Cherry et al., 1998; Innocent et al., 1997; Viet et al.,
2004). In these models, the infection of a susceptible individual is determined by the force
of infection, which is a function of the numbers of PI and transiently infected (TI)

57
individuals at a given time and the transmission rates (β) for both types of infected cattle.
Given the definition of transmission rate is per capita rate at which two individuals have an
effective contact (physically close contact with sufficient time that disease transmission
could occur if there was an infectious individual) (Vynnycky & White, 2010), PI animals
are typically assigned larger β value than TI animals due to their higher viral shedding rates.
Consequently, the predictions of simulation models are often highly sensitive to the β value
for PI animals (Damman et al., 2015).
An interesting point about BVDV modelling studies with respect to the transmission
rates for PI animals is that most studies used parameter values based on either expert
opinion or the values assumed by other simulation models (Viet et al., 2007). One of the
most commonly used within-herd BVDV transmission rates for PI animals was suggested
by Viet et al., (2004) who set the value to 0.5 per PI animal per day (using frequency-
dependent assumption) based on other reports (Moerman et al., 1993; Radostits &
Littlejohns, 1988). Although it was not estimated from empirical data, the suggested value
successfully explained the BVDV spread on a dairy farm, and their method has been
reproduced and adopted by subsequent modellers who simulated BVDV spread under their
own epidemiological circumstances (Damman et al., 2015; Foddai et al., 2014; Gates et al.,
2014; B. J. J. McCormick et al., 2010; Sekiguchi et al., 2018). However, as briefly pointed
out in the original paper, a robust transmission rate should be estimated based on
longitudinal observations of individual BVDV infection status while considering other
management factors, such as production type, population size or density, or herd structure,
since those factors can affect BVDV transmission rates within individual herds (Gates et
al., 2014; Han, Holter, et al., 2018). Therefore, applying the same β value for simulating
BVDV transmission in other populations with substantially different management features
such as extensively grazed beef cattle may not be appropriate.
To date, most of the reports on BVDV seroconversion have been based on the dairy
industry, whereas only a limited number of studies have focused on the extensively grazed

58
beef industry due in part to the logistical challenges that make it difficult to collect serial
samples of individual animals to measure their seroconversion status (Han, Weir, et al.,
2018). The transmission of BVDV in extensively grazed beef herds is expected to be
different than in intensive dairy herds since (1) the beef cattle are commonly grazed over a
vast area and not often gathered during a year so that the chance of having effective contacts
is likely to be lower, while (2) new born calves stay with their dams until weaning (6 ~ 7
months), hence susceptible dams could receive continued exposure to new born PI calves
during the breeding period, which likely increases the chance of generating new PI calves
in the following calving season.
As part of a larger research programme to address the knowledge gaps around BVDV
transmission in extensively grazed New Zealand beef herds, we conducted a panel study to
measure BVDV antibody levels in 15 first-calf heifers (replacement heifers immediately
after their first calving and before being mixed to the adult cow herd) before and after
subsequent breeding period to check for the evidence of seroconversion. Although BVDV
transmission rates can be roughly estimated by fitting the change in number of BVDV
antibody positive animals over time with a generalised linear regression model (Hage et al.,
1996), this method requires detection of all seroconversions based on a series of
observations on every animal’s BVDV infection status in a herd (Moerman et al., 1993).
Given the limited number of sampled animals and sampling occasions in our study, we
estimated the transmission rate using an approximate Bayesian computation (ABC)
methods. Briefly, ABC is a set of Bayesian methods that infer the posterior distribution of
parameters by randomly drawing a sample of the parameters from an initial distribution to
simulate data and accepting only the sample of which the simulated data is close enough to
the observed data according to a pre-defined distance (or tolerance) (Toni et al., 2009).
Using the seroconversion data from our field studies, the objectives of this current study
was to infer the within-herd BVDV transmission rate for PI animals (𝛽𝑃) in beef breeding
59
farms using an ABC method while accounting for differences in the herd management
structures.
4.3. Materials and methods
4.3.1. Data collection and extraction
A panel study was conducted from September 2017 to September 2018 to estimate the
proportion of first-calf heifers that were still susceptible to BVDV prior to their second
breeding and to estimate the rates of seroconversion to BVDV during the breeding/early
pregnancy period. A total of 75 commercial beef breeding farms from different regions
across New Zealand were recruited by convenience sampling through 10 participating
veterinary clinics. The selection criteria were that the farms (1) were not currently
vaccinating replacement breeding females against BVDV since vaccination is known to
interfere with antibody-based screening tests for BVDV, (2) had at least 15 replacement
heifers due to calve in the 2017/2018 calving season (generally between August 2017 and
November 2017), and (3) were willing to yard animals at two time points for sampling
(once prior to the second breeding (i.e. first sampling event) and again at pregnancy
scanning or weaning (i.e. second sampling event)).
For each enrolled farm, a participating veterinarian collected blood samples from 15
randomly selected first-calf heifers with calves at-foot before the breeding period and
recorded the ear tag IDs for each individual animal. The samples were then transported to
a commercial veterinary diagnostic laboratory and analysed individually using a BVDV
antibody ELISA test (IDEXX BVDV Total Ab Test; IDEXX Laboratories Inc., Westbrook
MA, USA). The samples were considered as BVDV antibody test-positive if the sample to
positive (S/P) ratio was > 0.17 which was determined by the laboratory (cut-off value by
the manufacturer was 0.2). A survey was administered to farmers at the time of sampling
to collect information about general management practices including the date of
60
management events (breeding, weaning, and calving) and demographic features (herd
structure, herd size, and age of heifers when they first calve). A copy of the complete survey
is provided in Appendix 2 (see Section 1).
Based on the test results from the first sampling event, BVDV antibody negative heifers
were identified, and the participating veterinarians were asked to re-collect blood sample
from each negative animal at either pregnancy scanning or weaning. The samples were
transported to the same diagnostic laboratory for analysis using the same ELISA test, and
the same cut-off value (S/P > 0.17) was used to identify whether animals had become
BVDV antibody positive. We assumed that a change in status from negative to positive
indicated seroconversion to BVDV, so only the results of farms with increased number of
BVDV test-positive heifers in the second sampling event were extracted for further study.
4.3.2. Simulation model
In order to estimate the 𝛽𝑃 values using an ABC algorithm, we first developed a
stochastic individual-based BVDV transmission simulation model to replicate BVDV
dynamics in a typical extensively-grazed New Zealand beef herd. For most New Zealand
beef farms, weaning occurs at approximately 6 to 7 months of age (Geenty & Morris, 2017).
Initial breeding occurs at approximately 14 to 15 months of age with first calving at
approximately 24 months of age on most of beef farms, while some farmers breed heifers
for the first time at approximately 26 to 27 months old with them calving at approximately
36 months old. The breeding period usually lasts from 8 to 12 weeks. Based on the survey
result, most farmers kept the replacement heifer herd separate from the adult breeding cows
even after their first calving.
Since the exact mixing date of replacement breeding heifers with adult breeding cows
for each eligible farm was unknown, we assumed that the mixing coincided with pregnancy
scanning of replacement breeding heifers (and weaning of their first calves) so that the
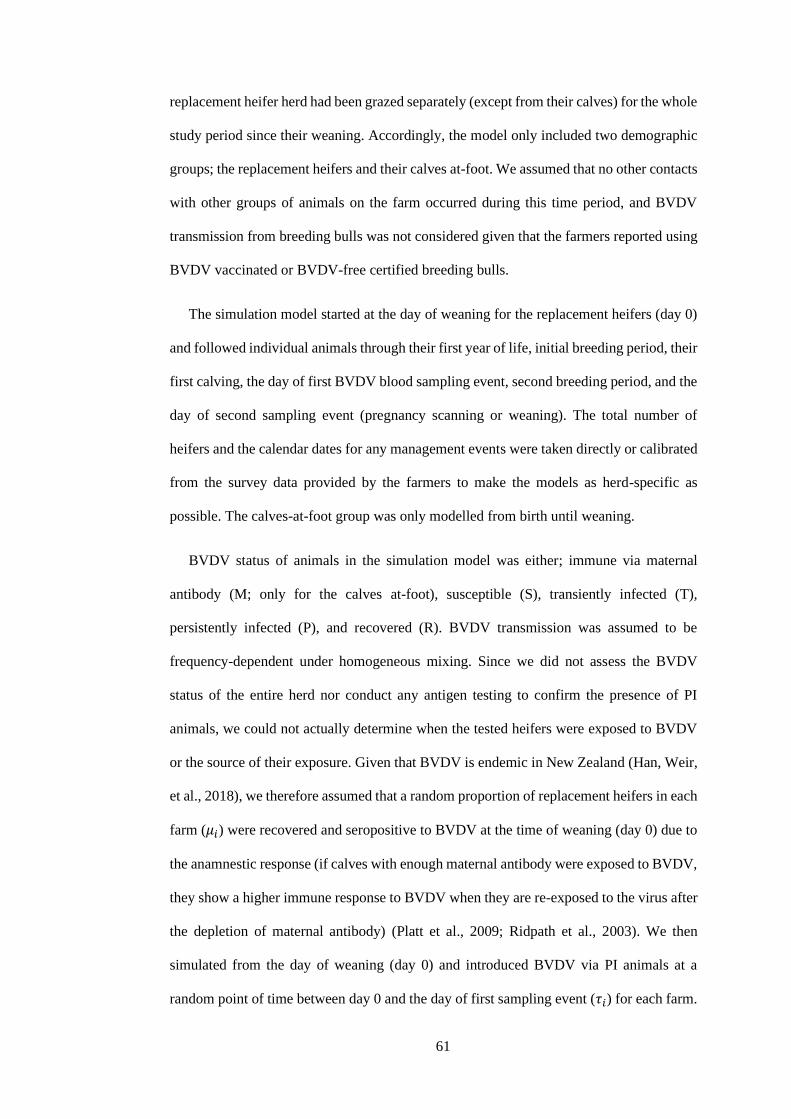
61
replacement heifer herd had been grazed separately (except from their calves) for the whole
study period since their weaning. Accordingly, the model only included two demographic
groups; the replacement heifers and their calves at-foot. We assumed that no other contacts
with other groups of animals on the farm occurred during this time period, and BVDV
transmission from breeding bulls was not considered given that the farmers reported using
BVDV vaccinated or BVDV-free certified breeding bulls.
The simulation model started at the day of weaning for the replacement heifers (day 0)
and followed individual animals through their first year of life, initial breeding period, their
first calving, the day of first BVDV blood sampling event, second breeding period, and the
day of second sampling event (pregnancy scanning or weaning). The total number of
heifers and the calendar dates for any management events were taken directly or calibrated
from the survey data provided by the farmers to make the models as herd-specific as
possible. The calves-at-foot group was only modelled from birth until weaning.
BVDV status of animals in the simulation model was either; immune via maternal
antibody (M; only for the calves at-foot), susceptible (S), transiently infected (T),
persistently infected (P), and recovered (R). BVDV transmission was assumed to be
frequency-dependent under homogeneous mixing. Since we did not assess the BVDV
status of the entire herd nor conduct any antigen testing to confirm the presence of PI
animals, we could not actually determine when the tested heifers were exposed to BVDV
or the source of their exposure. Given that BVDV is endemic in New Zealand (Han, Weir,
et al., 2018), we therefore assumed that a random proportion of replacement heifers in each
farm (𝜇𝑖) were recovered and seropositive to BVDV at the time of weaning (day 0) due to
the anamnestic response (if calves with enough maternal antibody were exposed to BVDV,
they show a higher immune response to BVDV when they are re-exposed to the virus after
the depletion of maternal antibody) (Platt et al., 2009; Ridpath et al., 2003). We then
simulated from the day of weaning (day 0) and introduced BVDV via PI animals at a
random point of time between day 0 and the day of first sampling event (𝜏𝑖) for each farm.

62
The introduction of PI animals in the simulation model was conducted by converting a
random proportion of heifers as PI (𝜌𝑖). The introduction of BVDV via TI animals was not
considered as they have been demonstrated to have a limited role in BVDV transmission
(Niskanen et al., 2000). Also, it was assumed that the introduction of PI animals occurred
at a single time only, and that 50% of the introduced PI animals had been removed annually
from the point of introduction (Innocent et al., 1997).
The probability of BVDV infection for each susceptible animal (Prob) at a given day
was;
𝑃𝑟𝑜𝑏 = 1 − 𝑒−𝜆𝑡
𝜆𝑡 = 𝛽𝑃 𝑃𝑡
𝑁+ 𝛽𝑇
𝑇𝑡
𝑁
where 𝜆𝑡 is the force of BVDV infection at day t, 𝑃𝑡 and 𝑇𝑡 are the number of PI and TI
animals, respectively, at day t, N is the herd size, and 𝛽𝑇 is the within-herd BVDV
transmission rate for TI animals. Since our aim was to estimate 𝛽𝑃, 𝛽𝑇 was assumed to be
proportionally (0.05) lower than 𝛽𝑃 with the proportion being calibrated based on other
studies (Smith et al., 2014; Viet et al., 2007). One should note that the meaning of
transmission rates above is actually the number of effective contacts per infectious
individual per day (i.e. effective contact rate), which is different from the classic definition
of transmission rate (i.e. per capita rate at which two individuals have an effective contact
per unit time) (Vynnycky & White, 2010). However, we used the effective contact rate and
transmission rate interchangeably for the coherence with other BVDV modelling works. TI
animals were assumed to recover and became seropositive after x days of infection, where
x was randomly chosen between 10 and 20 days (Liebler-Tenorio et al., 2004; Müller-
Doblies et al., 2004; T. Sandvik et al., 1997). Once recovered, animals were assumed to
have protective immunity against BVDV for the remainder of the simulation given the short
duration of simulation.

63
Each simulation started by establishing a female herd of 𝑁𝑖 weaned animals, where N
was the reported herd size of replacement breeding heifers via survey for farm i. Puberty
in heifers was assumed to start at 380 days of age (McNaughton et al., 2002) with oestrus
cycles occurring every 18 to 24 days thereafter until the animal became pregnant. When a
pregnant heifer calved or had an abortion, the next oestrus was assumed to occur after 15
to 49 days (Olds & Seath, 1953) and assumed to be a silent oestrus. When the simulation
reached to the start date of initial breeding period which was calibrated based on the date
of breeding and age of heifers to calve in the survey, heifers were mated with bulls and
only the heifers in oestrus were conceived with the probability of 62.0% during the
breeding period (McFadden et al., 2005). The gestation period was 281 days and the natural
abortion rate was set at 0.0001 per day over the whole gestation period to achieve a total
abortion rate of 3.5% for the season (Hickson et al., 2012; Weston et al., 2012). For each
new born calves from heifers, 0.0009 per day of natural mortality rate was applied until
weaning (86.7% of calves surviving to 180 days) (C. A. Morris et al., 1986).
The probability of abortion of replacement heifers due to BVDV infection was varied
by the days of pregnancy at the time of infection (Table 4.1). Likewise, the BVDV infection
status of new born calves was determined by the stage of pregnancy the heifers were in
when they became infected with BVDV. The period of maternal BVDV antibody
protection for individual calves born to recovered replacement heifers was randomly
selected from a normal distribution with the mean and standard deviation of 155 and 31
days, respectively (Coria & McClurkin, 1978; Kendrick & Franti, 1974) (see Section 2 of
Appendix 2).
At the day of first sampling event, 15 individuals were selected randomly from the
simulated heifers and BVDV ELISA antibody test-positivity of each individual was
probabilistically determined based on each animal’s BVDV infection status, test sensitivity
(0.99), and specificity (0.81) (Beaudeau et al., 2001). Each simulation ended when it
reached the day of second sampling event, where similar to the field studies, any of the
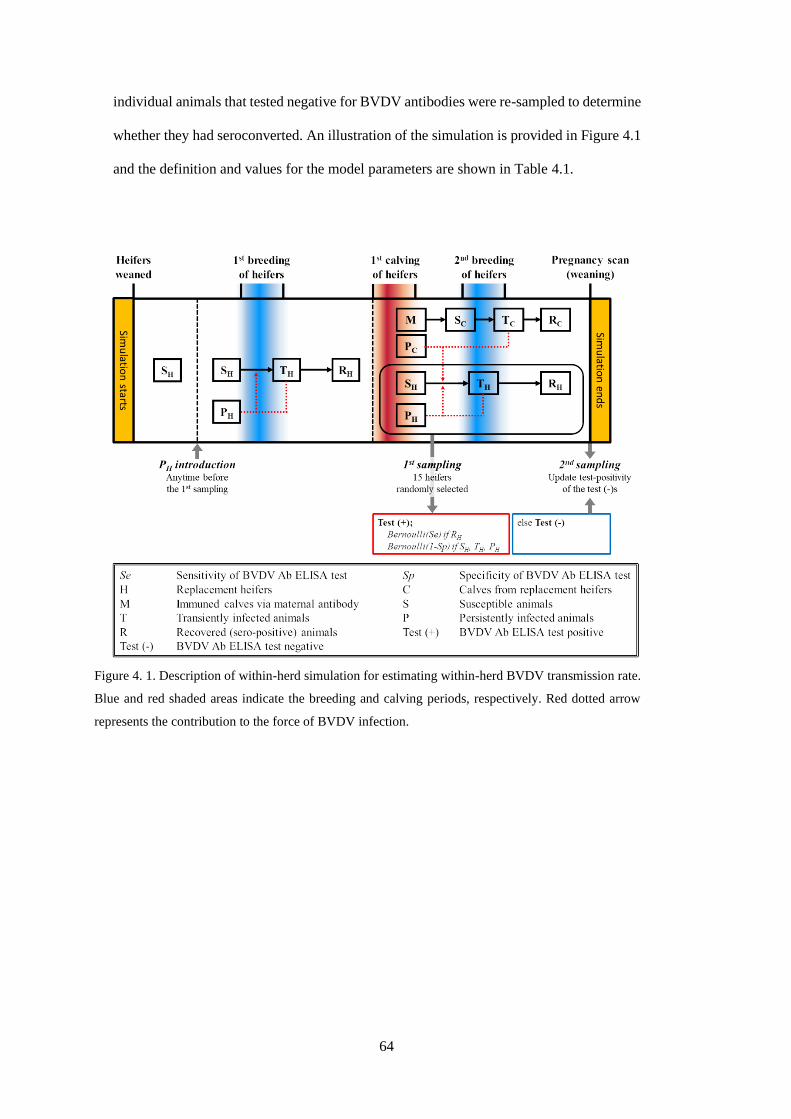
64
individual animals that tested negative for BVDV antibodies were re-sampled to determine
whether they had seroconverted. An illustration of the simulation is provided in Figure 4.1
and the definition and values for the model parameters are shown in Table 4.1.
Figure 4. 1. Description of within-herd simulation for estimating within-herd BVDV transmission rate.
Blue and red shaded areas indicate the breeding and calving periods, respectively. Red dotted arrow
represents the contribution to the force of BVDV infection.
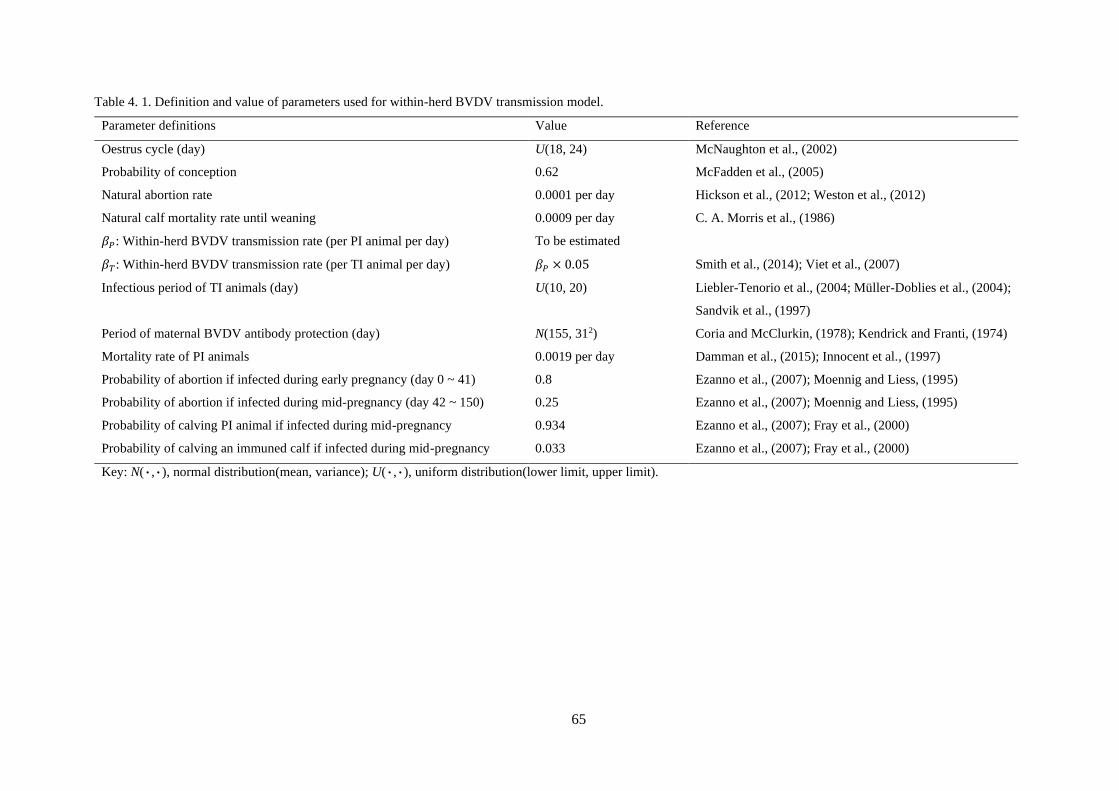
65
Table 4. 1. Definition and value of parameters used for within-herd BVDV transmission model.
Parameter definitions Value Reference
Oestrus cycle (day) U(18, 24) McNaughton et al., (2002)
Probability of conception 0.62 McFadden et al., (2005)
Natural abortion rate 0.0001 per day Hickson et al., (2012; Weston et al., (2012)
Natural calf mortality rate until weaning 0.0009 per day C. A. Morris et al., (1986)
𝛽𝑃: Within-herd BVDV transmission rate (per PI animal per day) To be estimated
𝛽𝑇: Within-herd BVDV transmission rate (per TI animal per day) 𝛽𝑃 × 0.05 Smith et al., (2014); Viet et al., (2007)
Infectious period of TI animals (day) U(10, 20) Liebler-Tenorio et al., (2004; Müller-Doblies et al., (2004);
Sandvik et al., (1997)
Period of maternal BVDV antibody protection (day) N(155, 312) Coria and McClurkin, (1978); Kendrick and Franti, (1974)
Mortality rate of PI animals 0.0019 per day Damman et al., (2015); Innocent et al., (1997)
Probability of abortion if infected during early pregnancy (day 0 ~ 41) 0.8 Ezanno et al., (2007); Moennig and Liess, (1995)
Probability of abortion if infected during mid-pregnancy (day 42 ~ 150) 0.25 Ezanno et al., (2007); Moennig and Liess, (1995)
Probability of calving PI animal if infected during mid-pregnancy 0.934 Ezanno et al., (2007); Fray et al., (2000)
Probability of calving an immuned calf if infected during mid-pregnancy 0.033 Ezanno et al., (2007); Fray et al., (2000)
Key: N(·,·), normal distribution(mean, variance); U(·,·), uniform distribution(lower limit, upper limit).
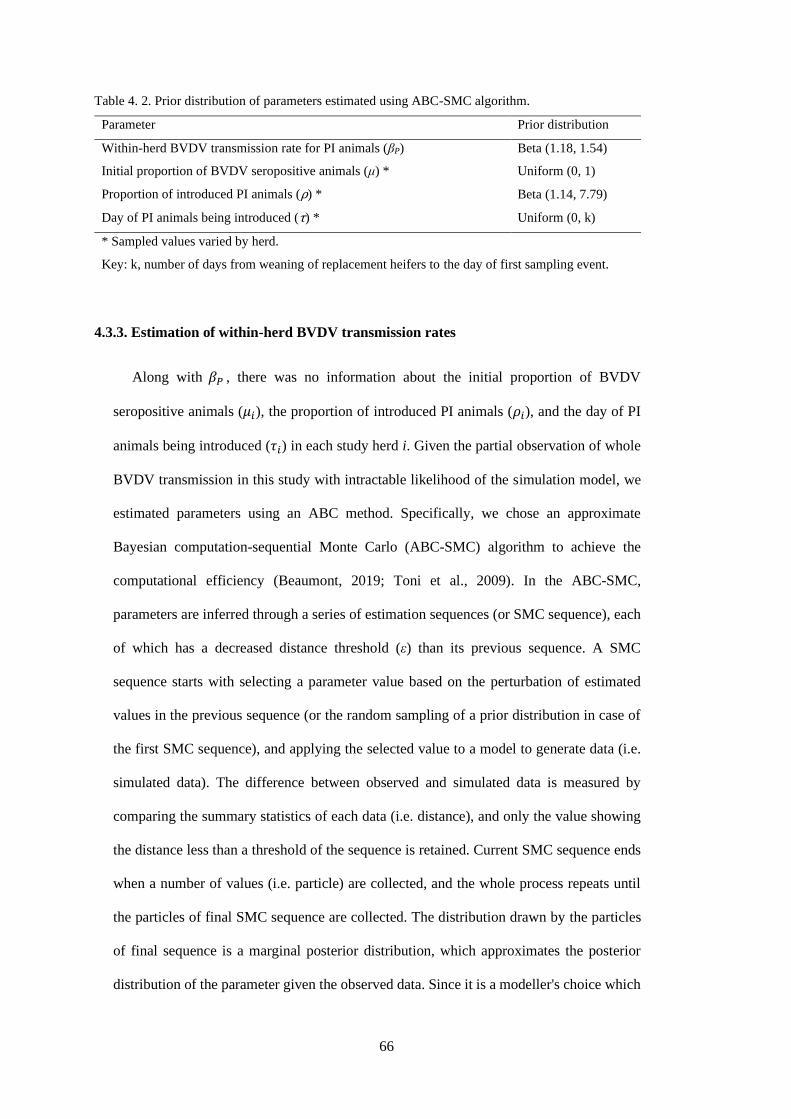
66
Table 4. 2. Prior distribution of parameters estimated using ABC-SMC algorithm.
Parameter Prior distribution
Within-herd BVDV transmission rate for PI animals (βP) Beta (1.18, 1.54)
Initial proportion of BVDV seropositive animals (μ) * Uniform (0, 1)
Proportion of introduced PI animals (ρ) * Beta (1.14, 7.79)
Day of PI animals being introduced (τ) * Uniform (0, k)
* Sampled values varied by herd.
Key: k, number of days from weaning of replacement heifers to the day of first sampling event.
4.3.3. Estimation of within-herd BVDV transmission rates
Along with 𝛽𝑃 , there was no information about the initial proportion of BVDV
seropositive animals (𝜇𝑖), the proportion of introduced PI animals (𝜌𝑖), and the day of PI
animals being introduced (𝜏𝑖) in each study herd i. Given the partial observation of whole
BVDV transmission in this study with intractable likelihood of the simulation model, we
estimated parameters using an ABC method. Specifically, we chose an approximate
Bayesian computation-sequential Monte Carlo (ABC-SMC) algorithm to achieve the
computational efficiency (Beaumont, 2019; Toni et al., 2009). In the ABC-SMC,
parameters are inferred through a series of estimation sequences (or SMC sequence), each
of which has a decreased distance threshold (ε) than its previous sequence. A SMC
sequence starts with selecting a parameter value based on the perturbation of estimated
values in the previous sequence (or the random sampling of a prior distribution in case of
the first SMC sequence), and applying the selected value to a model to generate data (i.e.
simulated data). The difference between observed and simulated data is measured by
comparing the summary statistics of each data (i.e. distance), and only the value showing
the distance less than a threshold of the sequence is retained. Current SMC sequence ends
when a number of values (i.e. particle) are collected, and the whole process repeats until
the particles of final SMC sequence are collected. The distribution drawn by the particles
of final sequence is a marginal posterior distribution, which approximates the posterior
distribution of the parameter given the observed data. Since it is a modeller's choice which

67
summary statistics to use to measure the distance, the chosen summary statistics should
contain sufficient information about the parameter because it affects the posterior
distribution of the parameter with only the reduced information of each data (Bertorelle et
al., 2010). The detailed algorithm for the ABC-SMC is provided in Appendix 2 (see Section
3).
We assumed that all study herds shared the common distribution of 𝛽𝑃 while other
parameters varied by the herds. For the prior distribution of within-herd BVDV
transmission rate for PI animals (π(𝛽𝑃)), we assumed that the value was less than 0.5 with
mode of 0.25 (with 60% certainty). The mode of the prior distribution was set to achieve
60% of susceptible animals being infected by a PI animal in a year (Gunn et al., 2004),
however, the distribution was still wide enough to cover various values between 0 and 1.
A uniform prior between 0 and 1 was used for the initial proportion of BVDV seropositive
animals (π(𝜇𝑖)). The prior distribution of the proportion of introduced PI animals (π(𝜌𝑖))
followed a beta distribution, with a certainty of 50% that the chosen value was less than
0.1 (with the mode at 0.02). The prior of the day of PI animals being introduced (π(𝜏𝑖))
followed a uniform distribution, as it was randomly selected between 0 (i.e. PI animals had
been co-grazed with the heifers from their weaning onward) and the number of days from
day 0 to the day of first sampling event (i.e. PI animals were introduced at the day of first
sampling event). All priors were assumed to be independent.
For the perturbation kernel, a component-wise Gaussian kernel with the variance as 0.68
times of the variance of particles in the previous SMC sequence was used (Ellen Brooks-
Pollock et al., 2014). We used two summary statistics to estimate the distance (𝐷𝑘) between
the observed and simulated data; (1) the observed (𝑂𝑏𝑠1) and simulated (𝑆𝑖𝑚1) number of
test positive heifers in the first sampling round (𝐷1), and (2) the observed (𝑂𝑏𝑠2) and
simulated (𝑆𝑖𝑚2) number of test positive heifers (among those were test negative at the
first round) in the second sampling round (𝐷2). Each summary statistics was calculated as
below;

68
𝐷𝑘 = √∑(𝑂𝑏𝑠𝑘𝑖 − 𝑆𝑖𝑚𝑘
𝑖 )2
𝑛
𝑖=1
where n was the number of herds in this study. For each SMC sequence, the simulation
model was iterated until 2,000 acceptable particles were generated, and the acceptable
distance thresholds were set as 50th percentile of the distances of accepted particles in the
previous sequence. The marginal posterior distribution of each parameter was achieved
after 15 SMC sequences.
4.3.4. Validation of the estimated parameters
Once the posterior distributions were retrieved, we inspected the fitness of the estimated
parameters by reproducing BVDV transmission within study herds with the estimated
parameter values while considering management features of each herd. To do this, we
randomly sampled 2,000 sets of parameter values from the respective posterior
distributions, and applied to the simulation model to draw a distribution of simulated
summary statistics (𝑆𝑖𝑚1 and 𝑆𝑖𝑚2). We then visually examined whether the observed
statistics located within a 95% prediction interval of the simulated summary statistics
(Bertorelle et al., 2010; Sunnåker et al., 2013).
We also conducted a sensitivity analysis to investigate the impact of using different
prior distribution of unknown parameters. Before the sensitivity analysis, we preliminarily
examined which parameter affected the most to the summary statistics in an individual farm.
It showed that the statistics were the most sensitive to the values of μ and ρ, while other
parameters had only a limited impact (see Section 4 of Appendix 2). Since there was a lack
of information to estimate an informative π(𝜇𝑖) in this study, we tested two different
distributions (e.g. uniform distribution between 0 and 1, and normal distribution with mean
of 0.3 and standard deviation of 0.1) of only the π(𝜌𝑖) for the sensitivity analysis. The

69
disease simulations were implemented in the C programming language and ABC-SMC
algorithm was run in R (R Core Team, 2018).
4.4. Results
4.4.1. Longitudinal data
Overall, blood samples from 1,116 individual heifers on 75 farms were collected at the
first sampling event, and, of these, all heifers from 12 farms were BVDV antibody positive
and 729 heifers from 63 farms tested negative for BVDV antibodies. Farms where all
sampled heifers tested positive were excluded from follow-up, and we were only able to
obtain the second blood samples from 673/729 heifers (92.3%) located on 55/63 farms due
to logistical issues with being able to yard the same animals for re-sampling (one to five
heifers were unavailable to follow-up on 19 of the 63 farms).
From the 55 re-sampled farms, all heifers from 25 farms were BVDV antibody test-
negative for both sampling events, indicating no circulation of BVDV before and during
the study period. Test results from 17 farms showed no additional BVDV antibody test-
positive heifers possibly due to early culling/moving of PI animals, and only the 13
remaining farms indicated BVDV seroconversion. The data from these 13 farms were
retained for further use in this study, however, records from 4 of these farms were discarded
either because some of the animals were later found to have been BVDV vaccinated or
because the second sampling event took place outside of the time-window specified for the
study. Overall, test results of 133 heifers from 9 farms were used to estimate 𝛽𝑃 values.
Descriptive statistics on the number of sampled and test-positive heifers at each sampling,
and other management features, such as herd size, breeding period, and day of both
sampling events, for each farm are provided in an additional file (see Section 5 of Appendix
2).

70
4.4.2. Parameters estimation
The posterior distribution of 𝛽𝑃 is illustrated in Figure 4.2 and the evolution of 𝛽𝑃
values over 15 ABC-SMC sequences is provided in Appendix 2 (see Section 6). The mode
of posterior 𝛽𝑃 was 0.11 with a 95% highest posterior density (HPD) interval between 0.03
and 0.34 per PI animal per day. The posterior distributions of estimated μ, ρ, and τ are
illustrated in Table 4.3 and Figure 4.3, and the evolution of parameter values along the
SMC sequences is provided in Appendix 2 (see Section 6). The distributions of μ and ρ
varied between herds, with the mode of μ ranged between 0.07 and 0.84, and the mode of
ρ between 0.03 and 0.16. The estimated day when PI animals were first introduced varied
by herd as well. The most probable (mode) day for Farms 1, 3, 6, and 7 occurred during or
immediately after the first calving period, while the day for Farm 2 and 9 were during the
first breeding period. The estimated day for the remaining farms were widely dispersed
between the day of heifers being weaned and the first breeding period.
4.4.3. Validation
The observed and simulated summary statistics for each study herd are provided in
Appendix 2 (see Section 6). For both 𝑆𝑖𝑚1 and 𝑆𝑖𝑚2, observed summary statistics for all
9 herds were located within a 95% prediction interval of the simulated summary statistics.
Most of the observed summary statistics were located near the mode of simulated summary
statistics, however, the observed 𝑆𝑖𝑚2 of some but not all herds were located near the
margin of 95% prediction interval (see Section 6 of Appendix 2). In the sensitivity analysis,
some but not all parameters showed different posterior distributions when either a uniform
or normal distribution of π(𝜌𝑖) were used. Especially, the posterior distribution of 𝜌𝑖 was
generally affected by the prior distribution of itself, indicating that the parameter 𝜌𝑖 in our
model was not identifiable in general (see Section 7 of Appendix 2).
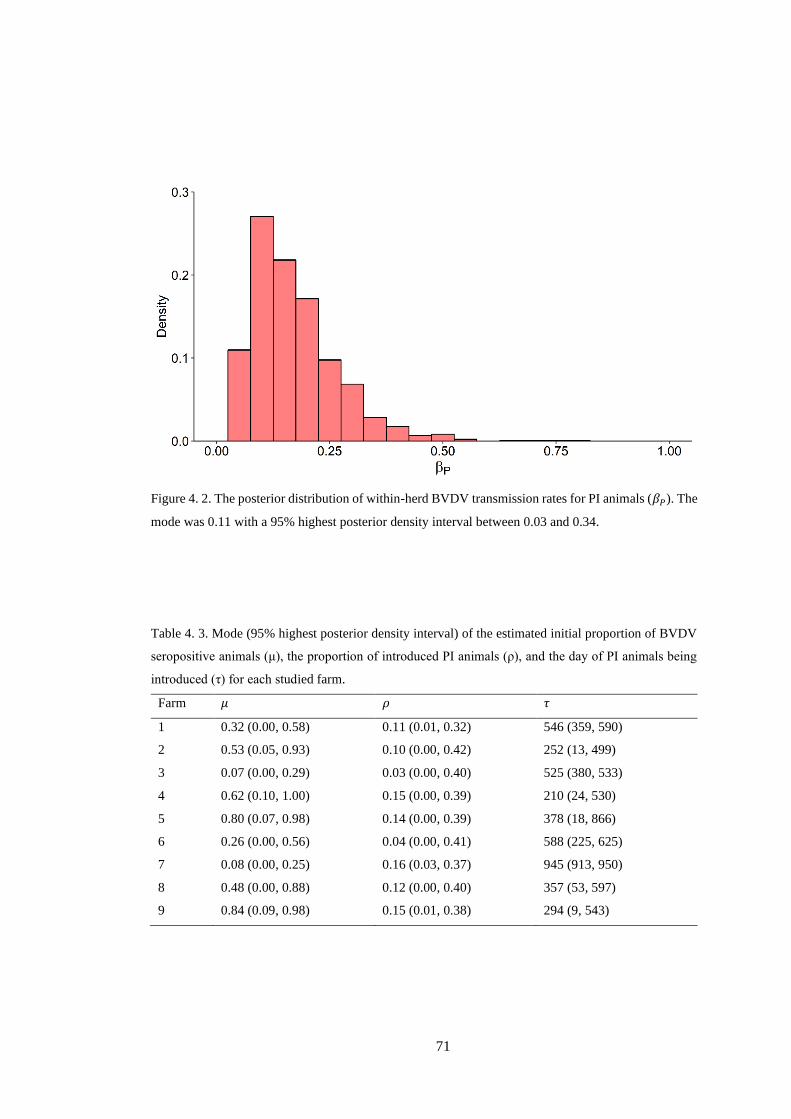
71
Figure 4. 2. The posterior distribution of within-herd BVDV transmission rates for PI animals (𝛽𝑃). The
mode was 0.11 with a 95% highest posterior density interval between 0.03 and 0.34.
Table 4. 3. Mode (95% highest posterior density interval) of the estimated initial proportion of BVDV
seropositive animals (μ), the proportion of introduced PI animals (ρ), and the day of PI animals being
introduced (τ) for each studied farm.
Farm 𝜇 𝜌 𝜏
1 0.32 (0.00, 0.58) 0.11 (0.01, 0.32) 546 (359, 590)
2 0.53 (0.05, 0.93) 0.10 (0.00, 0.42) 252 (13, 499)
3 0.07 (0.00, 0.29) 0.03 (0.00, 0.40) 525 (380, 533)
4 0.62 (0.10, 1.00) 0.15 (0.00, 0.39) 210 (24, 530)
5 0.80 (0.07, 0.98) 0.14 (0.00, 0.39) 378 (18, 866)
6 0.26 (0.00, 0.56) 0.04 (0.00, 0.41) 588 (225, 625)
7 0.08 (0.00, 0.25) 0.16 (0.03, 0.37) 945 (913, 950)
8 0.48 (0.00, 0.88) 0.12 (0.00, 0.40) 357 (53, 597)
9 0.84 (0.09, 0.98) 0.15 (0.01, 0.38) 294 (9, 543)

72
Figure 4. 3. The posterior distribution of the estimated parameters for each herd. Left: the initial
proportion of BVDV seropositive animals (μ), Middle: the proportion of introduced PI animals (ρ),
Right: the day of PI animals being introduced (τ). The distributions of the first row illustrate the prior
distribution of each parameter. Green and red shaded areas indicate the first breeding and calving period,
respectively. Day FS indicates the day of first sampling.
4.5. Discussion
Using an ABC-SMC algorithm, we estimated the within-herd BVDV transmission rates
for PI animals based on field data collected from extensively grazed beef herds. Although
the ABC method has been used to estimate the transmission rate of other animal diseases,
such as bovine tuberculosis (Ellen Brooks-Pollock et al., 2014), Peste des petits ruminants
(Fournié et al., 2018), and African swine fever (Guinat et al., 2018), our study is the first
attempt to use this method for estimating 𝛽𝑃 values to the best of our knowledge. This is
most likely due to the paucity of BVDV seroconversion data, especially in extensively
73
grazed beef herds. Other studies have used a commonly reported 𝛽𝑃 value from intensively
managed dairy herds to explain BVDV spread (Damman et al., 2015; Foddai et al., 2014;
Gates et al., 2014; B. J. J. McCormick et al., 2010; Sekiguchi et al., 2018). However, more
efforts should be made to estimate robust 𝛽𝑃 values based on empirical data that take into
consideration other herd-level management factors that can affect BVDV transmission.
Estimation of 𝛽𝑃 values was based on only 9 out of 75 initially recruited farms, and we
acknowledge the possibility of selection bias in this study. While it is possible that the 12
farms that were not followed-up at the second sampling event had higher 𝛽𝑃 values than
the estimated values in this study, it is also plausible that the heifers on those farms had
been exposed to the virus for much longer time periods (e.g. co-grazed with PI calves from
birth) or that there were a larger number of PI animals compared to other farms that could
have led to more efficient within-herd BVDV transmission. The fact that none of the heifers
on 17 of the re-sampled farms seroconverted to BVDV was most likely due to the death or
removal of PI animals before the first sampling event rather than very low BVDV
transmission rates for co-mingled PI animals. Even under extensive beef farming
conditions in New Zealand, we believe that the duration between sampling events (127 to
177 days; see Additional file 5) was sufficient for susceptible heifers to have effective
contacts with PI animals if PI animals were actually present in the herd. In future studies
with more available resources, it would be useful to track the serological status of
replacement heifers from an earlier age and perform whole herd BVDV testing to determine
the presence of PI animals as this would allow more accurate estimation of 𝛽𝑃.
Different values of 𝛽𝑃 have been suggested in the literature, but cannot be directly
compared given that each group used different modelling structures and assumptions.
However, the values can be indirectly compared by estimating the cumulative numbers of
infected animals after one year of a PI animal being introduced to 100 susceptible animals
in a closed herd while ignoring transmission by TI animals (Viet et al., 2007). Using the
previously reported 𝛽𝑃 values, the cumulative numbers of infected animals ranged from

74
approximately 30 (Gunn et al., 2004; Innocent et al., 1997) to 100 (Cherry et al., 1998;
Pasman et al., 1994; Sørensen et al., 1995) with some intermediate estimations of 60 (Gunn
et al., 2004) and 84 (Viet et al., 2004). When applying the same setting to 𝛽𝑃 values
estimated in this study, it was equivalent to seroconvert 33 susceptible animals (mode) with
a range between 10 and 71 animals (95% HPD interval). Our estimates are somewhat lower
than those based on the previously reported 𝛽𝑃 values, indicating that using previous 𝛽𝑃
values to extensively grazed New Zealand beef farms may overestimate the transmission
of BVDV. Given the fact that previous 𝛽𝑃 values were estimated based on either expert
opinion or data from dairy herds, our estimate of 𝛽𝑃 would be more suitable for modelling
BVDV in pasture-based beef industries.
In addition to estimating 𝛽𝑃 values, we also discovered several interesting features of
BVDV epidemiology from this study. First, the most probable proportion of introduced PI
animals was estimated between 3% and 16%, which varied between farms. An anecdotal
report showed that the prevalence of PI animals within a cattle herd in New Zealand varied
between 2% and 12% (Thompson, 2005), and so our estimate of proportion of introduced
PI animals was in accordance with the previously reported range. Second, by considering
the management feature, such as breeding and calving events, of replacement heifer herds,
we were able to infer BVDV transmissions from introduced PI animals as well as any new
born PI calves. In particular, Farms 1, 3, 6, and 7 showed that the estimated day of PI
animals being introduced was during or immediately after the first calving period. This
indicates that the introduced PI animals were actually new born PI calves either from
heifers infected during early-mid pregnancy or potentially other purchased pregnant
replacement heifers carrying a PI calf (Trojan dam). On the other hand, the most probable
day of PI animals being introduced for Farms 2 and 9 was during the first breeding period,
possibly indicating young PI replacement heifers were purchased for breeding.
Unfortunately, we did not have detailed information on each farm’s purchasing history to
confirm our speculations. However, these results still highlight that the ABC-SMC

75
algorithm is a useful tool to infer unknown BVDV-related parameters, such as the timing
and type of BVDV introductions, even with a limited amount of data.
In our simulation model, 𝛽𝑇 was assumed to be the product of 𝛽𝑃 and a proportion (0.05)
that quantifies the reduced chance of the effective contacts with TI animals compared to PI
animals, given that TI animals shed lower quantities of virus and likely require longer
periods of time and closer contacts to cause transmission. Although we relied on other
studies to calibrate this proportion, our preliminary investigation indicated that the
proportion would have no marked impact on the estimated 𝛽𝑃 values, further implying that
the uncertainty about 𝛽𝑇 could be negligible for estimating 𝛽𝑃 . We also conducted a
sensitivity analysis using a uniform and normal prior distribution of 𝜌𝑖 . The sensitivity
analysis showed that the posterior distributions of some parameters were highly affected
by the prior distribution of 𝜌𝑖 (see Section 7 of Appendix 2). It indicates that some
parameters, especially 𝜌𝑖, were not identifiable under the current model setting, possibly
due to the lack of data and/or complex model structure, and the accurate estimation of
parameter values in this study was generally dependent upon the precise information of
π(𝜌𝑖). Although we argue that our estimated parameter values were valid considering that
the prior of 𝜌𝑖 in this study well-matched to the reported prevalence of new-born PI calves
under New Zealand farming context (Thompson, 2005), more observations — the number
of tests as well as the sample size of each test — per farm should be warranted in the future
study to mitigate the non-identifiability issue.
We consider several potential limitations to the study methods that could influence the
accuracy of our estimates for 𝛽𝑃. First, the ABC-SMC algorithm was applied to data on
only two sequential BVDV antibody ELISA tests for the subset of sampled animals in each
herd. Even though we only accepted the parameters which were able to simulate data that
closely matched the observed test results while adjusting for the test sensitivity and
specificity, two sampling events may be regarded as insufficient. A lack of enough data
points as well as errors introduced by the random sampling of heifers in this study might
76
have increased the variability of the posterior distribution of not only 𝛽𝑃 but also other
parameters (Gelman et al., 2013). More precise estimation could be achieved by conducting
future longitudinal studies that sample more animals at more frequent intervals and test
individual animals to confirm the presence and identity of PI animals. However, the
logistical challenges of conducting sampling on extensively grazed beef herds will still
remain as an obstacle, particularly since beef farmers are often reluctant to yard dams with
calves at-foot due to the risk of injury to calves (Han, Weir, et al., 2018). Second, in our
simulation model, we ignored any virus introduction from different management groups
within the same farm or from other external sources (e.g. co-grazed sheep), which may
have led to an overestimation of 𝛽𝑃 values. However, considering that tested heifers were
grazed extensively, it is less likely that the heifers had frequent effective contacts with
animals from different herds. Also, our current research about BVDV transmission between
co-grazed cattle and sheep in New Zealand beef farms suggests that the transmission
between two species is a rare event (unpublished). Finally, we assumed that PI animals
were introduced at only one time point. However, based on unpublished observations from
the national animal movement data in New Zealand and data from the management surveys
completed by farmers, it is unlikely that many beef farmers are purchasing replacement
heifers at multiple time points. The most likely alternate source of PI animals is through
the birth of PI calves from susceptible animals that were exposed to BVDV during
pregnancy. Therefore, we believe that the posterior distribution of 𝛽𝑃 in this study provides
valid estimates of the most likely values.
Overall, the study findings have important clinical implications for the control of BVDV
especially since the estimated 𝛽𝑃 values indicated that BVDV transmission is likely to be
slow in extensively grazed beef herds. A similar finding was reported in a New Zealand
cattle farm by Thompson, (2005), who observed that approximately 20% of animals
remained susceptible to BVDV even after being directly co-grazed with PI animals for up
to 600 days. These findings strongly suggest that using PI animals as a “natural” BVDV
77
vaccination source (i.e. purposely exposing PI animals to susceptible animals to replicate
the protective effect of BVDV vaccination) is likely to fail in the beef herds. On the
contrary, this practice has a high risk of generating new PI calves in the next calving season
with the risk of causing a BVDV outbreak in such extensively grazed beef cattle farms.
Under these circumstances, effective prevention of BVDV should be based on test-and-cull
of identified PI animals, vaccination of susceptible animals, and improvement of farm
biosecurity (Evans, Pinior, et al., 2019).
4.6. Conclusions
By measuring the BVDV seroconversion of first-calf heifers during the mating period,
we inferred that the within-herd BVDV transmission rate of a PI beef animal in extensively
grazed herds was 0.11 per day which is lower than the one in dairy herds or herds with
intensive farming system. This finding indicates that the calving of PI animals in
extensively grazed New Zealand beef farms would not confer adequate herd immunity for
naïve dams that co-grazed with new-born calves. This slow dynamics of BVDV
transmission should be considered in establishing BVDV control strategies for the New
Zealand cattle industries.
4.7. Acknowledgements
We are grateful to New Zealand beef farmers, veterinarians, and laboratory technicians
who participated in the “BVD Free New Zealand” project. We also extend gratitude to
anonymous reviewers for their comments.

78
79
Chapter 5
Economics of bovine viral diarrhoea virus control in pastoral dairy
and beef cattle herds
Jun-Hee Han1, Jenny F. Weston2, Cord Heuer1, M. Carolyn Gates1
1 EpiCentre, School of Veterinary Science, Massey University, Private Bag 11-222,
Palmerston North, New Zealand
2 School of Veterinary Science, Massey University, Private Bag 11-222, Palmerston North,
New Zealand
5.1. Abstract
Bovine viral diarrhoea virus (BVDV) is a prevalent pathogen in the New Zealand cattle
industries, yet few studies to date have evaluated the economics of BVDV in pastoral dairy
and beef herds to help inform management decisions. To address this knowledge gap, we
developed stochastic individual-based simulation models to represent the transmission
dynamics of BVDV in typical spring-calving dairy and beef farms in New Zealand. The
models conservatively estimated the direct losses due to a BVDV outbreak at NZ$ 22.22
and NZ$ 41.19 per mixed-age cow per year for a naïve dairy and beef farm, respectively,
over a 5-year period. The greatest economic impacts for the dairy farm occurred when a
persistently infected replacement heifers joined the lactating cow group and caused
transient infection of cows to drop in milk production, whereas the greatest impacts for the
beef farm was through the loss of fattening stock for sale due to lowered pregnancy rates.
Various combinations of diagnostic testing, vaccination, and biosecurity measures were
then explored to evaluate the cost-efficiency of different strategies for controlling BVDV
at the farm-level. We identified that the annual testing of breeding calves with or without
double fencing on dairy farms and the vaccination of breeding animals with annual booster

80
on beef farms were economically beneficial. Providing farmers with the estimates of
economic impacts of BVDV in their herds may further encourage the uptake of control
measures, but close collaboration with a veterinarian to determine the optimal strategy for
their unique farm circumstances is still required.
5.2. Introduction
Bovine viral diarrhoea virus (BVDV) causes a wide spectrum of subclinical and clinical
manifestations in affected cattle including infertility, abortion, reduced milk production,
diarrhoea, and immunosuppression (Houe, 1999). In New Zealand, BVDV has been
endemic since at least the 1960s (Salisbury et al., 1961), and, according to recent studies,
nearly half of New Zealand cattle farms have evidence of recent exposure to BVDV with
an estimated 10% of farms possibly harbouring persistently infected (PI) animals (Gates,
Han, et al., 2019; Han, Holter, et al., 2018). Due to its high prevalence in New Zealand,
BVDV is believed to cause significant economic losses for the cattle industries as a whole,
although less is known about the impacts of BVDV in individual herds, particularly with
extensive beef farms where it is more logistically challenging to yard cattle at the
appropriate times to collect data (Han, Weir, et al., 2018).
Currently, there is no compulsory national BVDV control programme in New Zealand,
and any uptake of control measures such as testing and vaccinating replacement breeding
cattle is at the discretion of individual farmers (Han, Weir, et al., 2018). It has been reported
that fewer than 10% of New Zealand dairy farmers routinely test for and cull identified PI
animals (Stewart, 2013), although as many as 65% of dairy farms may be performing
routine annual bulk tank milk testing (Gates, Han, et al., 2019). In the beef sector, less than
30% of New Zealand farmers had tested their herds for BVDV during the last 5 years,
which is believed to be due to the low perceived impact of BVDV or the high perceived
cost of BVDV control (Gates, Evans, et al., 2019). Internationally, it has been demonstrated
81
that farmer’s implementation of BVDV control depends on a variety of factors with
economic incentives being one of those motivations (Heffernan et al., 2016). Therefore,
providing New Zealand farmers with information about the direct losses attributable to
BVDV and the cost-benefit of BVDV control could help influence their biosecurity
decisions.
Given the time and cost of conducting field studies to evaluate the impact of BVDV and
the difficulties of accounting for the effects of different control measures in cattle
populations on different scales (i.e. farm-level, regional, or national), simulation modelling
approaches are often used as an alternative method (Damman et al., 2015; Sekiguchi et al.,
2018; Smith et al., 2014). While there have been numerous published BVDV modelling
studies in the literature, the reported results such as the production loss or efficiency of
control often cannot be directly applied to other cattle industries due to the difference in
herd sizes, industry demographic structure, or efficacy of intervention measures under
different farming system constraints (Damman et al., 2015; Smith et al., 2014). To provide
more accurate information to farmers, BVDV simulation models should reflect the unique
farming characteristics of the target population (e.g. seasonal calving vs. year-round
calving, or intensive vs. extensive farming).
To the best of our knowledge, there have been no published simulation studies to date
evaluating the epidemiology and economics of BVDV control in New Zealand pastoral
dairy and beef herds. Using novel stochastic individual animal-based BVDV simulation
models, the aims of this study were to (1) estimate the direct losses due to a BVDV outbreak
on New Zealand dairy and beef farms, and (2) investigate the cost-benefit of BVDV control
strategies for farms of each production type.
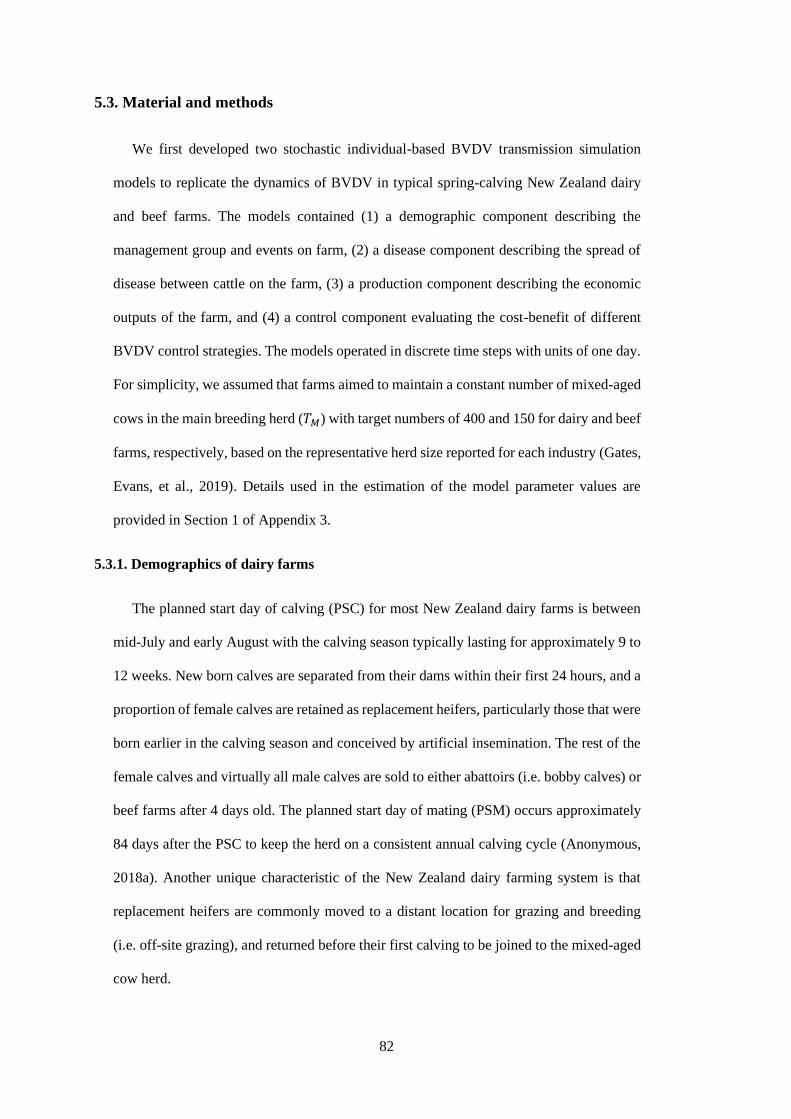
82
5.3. Material and methods
We first developed two stochastic individual-based BVDV transmission simulation
models to replicate the dynamics of BVDV in typical spring-calving New Zealand dairy
and beef farms. The models contained (1) a demographic component describing the
management group and events on farm, (2) a disease component describing the spread of
disease between cattle on the farm, (3) a production component describing the economic
outputs of the farm, and (4) a control component evaluating the cost-benefit of different
BVDV control strategies. The models operated in discrete time steps with units of one day.
For simplicity, we assumed that farms aimed to maintain a constant number of mixed-aged
cows in the main breeding herd (𝑇𝑀) with target numbers of 400 and 150 for dairy and beef
farms, respectively, based on the representative herd size reported for each industry (Gates,
Evans, et al., 2019). Details used in the estimation of the model parameter values are
provided in Section 1 of Appendix 3.
5.3.1. Demographics of dairy farms
The planned start day of calving (PSC) for most New Zealand dairy farms is between
mid-July and early August with the calving season typically lasting for approximately 9 to
12 weeks. New born calves are separated from their dams within their first 24 hours, and a
proportion of female calves are retained as replacement heifers, particularly those that were
born earlier in the calving season and conceived by artificial insemination. The rest of the
female calves and virtually all male calves are sold to either abattoirs (i.e. bobby calves) or
beef farms after 4 days old. The planned start day of mating (PSM) occurs approximately
84 days after the PSC to keep the herd on a consistent annual calving cycle (Anonymous,
2018a). Another unique characteristic of the New Zealand dairy farming system is that
replacement heifers are commonly moved to a distant location for grazing and breeding
(i.e. off-site grazing), and returned before their first calving to be joined to the mixed-aged
cow herd.

83
In our model, the cattle population for a dairy farm was divided into 4 management
groups: calves (C: from birth until 4 days old), young replacement heifers (YH: from 4
days old to moving off-site for grazing), breeding replacement heifers (BH: heifers at the
off-site grazing location until returning and joining the mixed-age cow herd), and mixed-
age cows (MA: all breeding female cows that have delivered at least one calf). In this study,
the PSC was August 1st and all calves were separated from their dams when they were born
and joined C group. All male calves were culled at 4 days old, and the first 88 female calves
(22% of 𝑇𝑀) that reached 4 days old were retained as YHs while the rest were culled (at 4
days old). To adjust for natural mortality, 90.5% animals were assumed to survive through
weaning (at 70 days old) (E. Cuttance et al., 2017). YHs were moved to an off-site grazing
location on May 1st when they were approximately 9 months old and returned on May 1st
of the following year when they were approximately 21 ~ 22 months old. We assumed that
only the pregnant BHs were returned and mixed with the MA group, while the rest were
culled.
Puberty in heifers was assumed to start at 380 days of age (McNaughton et al., 2002)
with oestrus cycles occurring every 18 to 24 days thereafter until the animal became
pregnant. When a pregnant animal calved or aborted, the next oestrus was assumed to occur
after 15 to 49 days (Olds & Seath, 1953) and was assumed to be silent. For simplicity, the
PSM for both the MA and BH herds started on October 24th and the mating period lasted
for 12 weeks. During the first 6 weeks, animals in oestrus were artificially inseminated.
The probability of oestrus detection was set at 78.6% (Anonymous, 2018a) and the
probability of conception to artificial insemination was set at 60.0%. For the last 6 weeks,
animals in oestrus were naturally mated with breeding bulls with conception probability of
45.0%. This resulted in 66.1% of cows artificially bred during the first 6 weeks being
pregnant and 15.0% of cows remaining non-pregnant after 12 weeks of mating period
(Anonymous, 2018a).

84
The gestation period was set at 281 days. A natural abortion rate of 0.00013 per day was
applied over the whole gestation period to achieve an overall abortion probability of 3.5%
(Weston et al., 2012). Pregnancy scanning was conducted on February 28th for MAs only
and all non-pregnant cows were culled at the start day of the drying-off period (May 1st).
We assumed that all returning BHs that were pregnant joined the MA herd on May 1st, and
we kept the MA herd size constant by (1) selling x number of pregnant MAs older than 6
years where x was the surplus of MAs compared to 𝑇𝑀, or (2) purchasing x number of
replacement heifers where x was the shortage of MAs compared to 𝑇𝑀. We assumed that
any purchased heifers were susceptible to BVDV. The herd of breeding bulls was not
considered in the simulation model since it is common practice for bulls to be present on
farm only for the duration of the mating period and for most bulls to be tested for and
vaccinated against BVDV (Han, Holter, et al., 2018). An illustration of demographic events
for the dairy model is provided in Figure 5.1, and the parameters for transition between
demographic groups are described in Table 5.1.
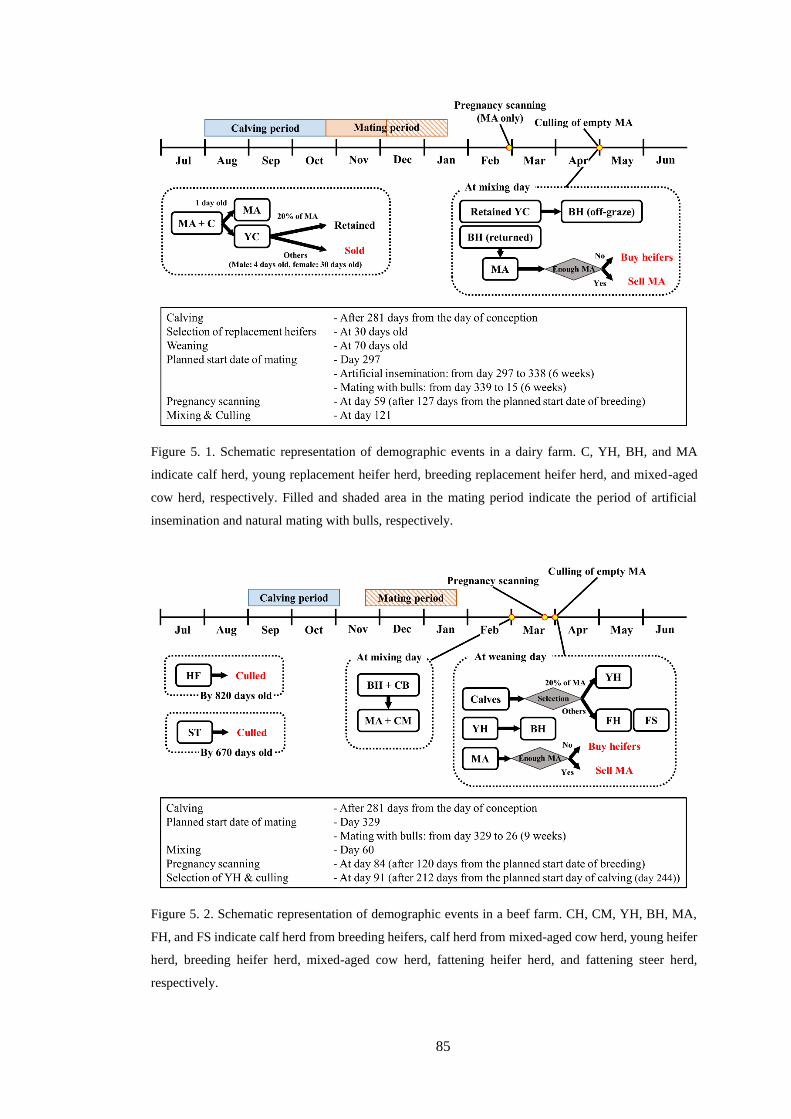
85
Figure 5. 1. Schematic representation of demographic events in a dairy farm. C, YH, BH, and MA
indicate calf herd, young replacement heifer herd, breeding replacement heifer herd, and mixed-aged
cow herd, respectively. Filled and shaded area in the mating period indicate the period of artificial
insemination and natural mating with bulls, respectively.
Figure 5. 2. Schematic representation of demographic events in a beef farm. CH, CM, YH, BH, MA,
FH, and FS indicate calf herd from breeding heifers, calf herd from mixed-aged cow herd, young heifer
herd, breeding heifer herd, mixed-aged cow herd, fattening heifer herd, and fattening steer herd,
respectively.
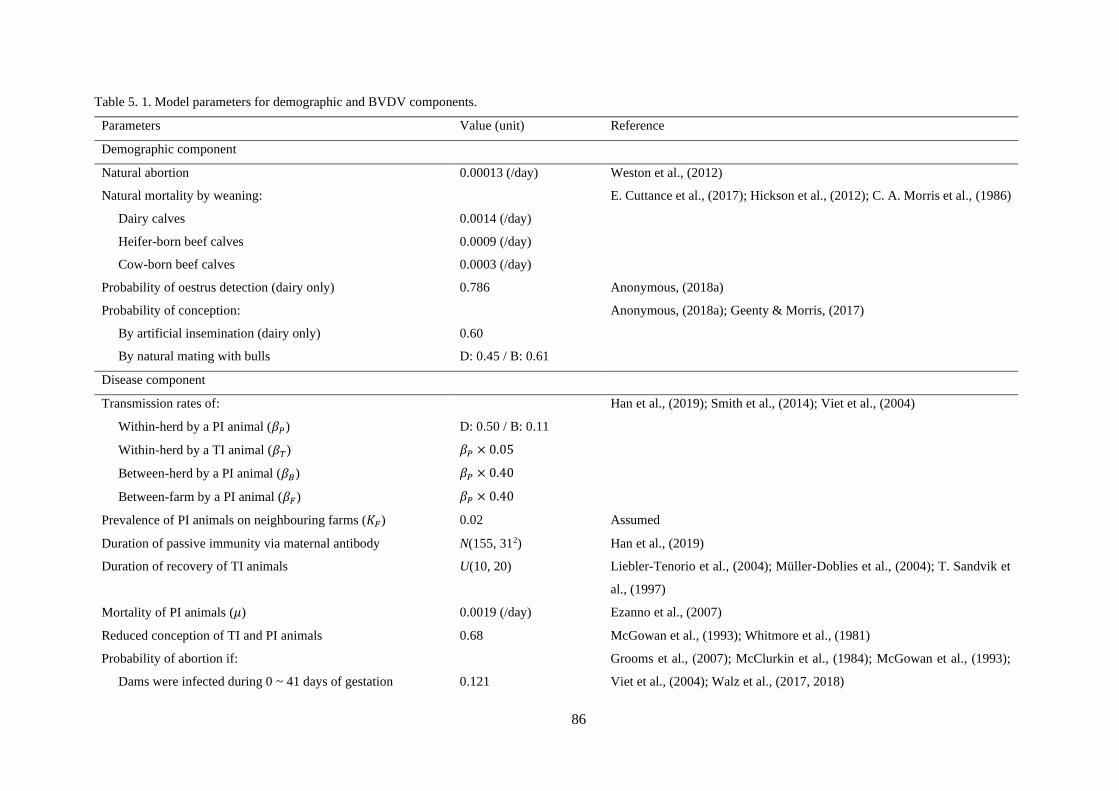
86
Table 5. 1. Model parameters for demographic and BVDV components.
Parameters Value (unit) Reference
Demographic component
Natural abortion 0.00013 (/day) Weston et al., (2012)
Natural mortality by weaning:
Dairy calves
Heifer-born beef calves
Cow-born beef calves
0.0014 (/day)
0.0009 (/day)
0.0003 (/day)
E. Cuttance et al., (2017); Hickson et al., (2012); C. A. Morris et al., (1986)
Probability of oestrus detection (dairy only) 0.786 Anonymous, (2018a)
Probability of conception:
By artificial insemination (dairy only)
By natural mating with bulls
0.60
D: 0.45 / B: 0.61
Anonymous, (2018a); Geenty & Morris, (2017)
Disease component
Transmission rates of:
Within-herd by a PI animal (𝛽𝑃)
Within-herd by a TI animal (𝛽𝑇)
Between-herd by a PI animal (𝛽𝐵)
Between-farm by a PI animal (𝛽𝐹)
D: 0.50 / B: 0.11
𝛽𝑃 × 0.05
𝛽𝑃 × 0.40
𝛽𝑃 × 0.40
Han et al., (2019); Smith et al., (2014); Viet et al., (2004)
Prevalence of PI animals on neighbouring farms (𝐾𝐹) 0.02 Assumed
Duration of passive immunity via maternal antibody N(155, 312) Han et al., (2019)
Duration of recovery of TI animals U(10, 20) Liebler-Tenorio et al., (2004); Müller-Doblies et al., (2004); T. Sandvik et
al., (1997)
Mortality of PI animals (𝜇) 0.0019 (/day) Ezanno et al., (2007)
Reduced conception of TI and PI animals 0.68 McGowan et al., (1993); Whitmore et al., (1981)
Probability of abortion if:
Dams were infected during 0 ~ 41 days of gestation
0.121
Grooms et al., (2007); McClurkin et al., (1984); McGowan et al., (1993);
Viet et al., (2004); Walz et al., (2017, 2018)
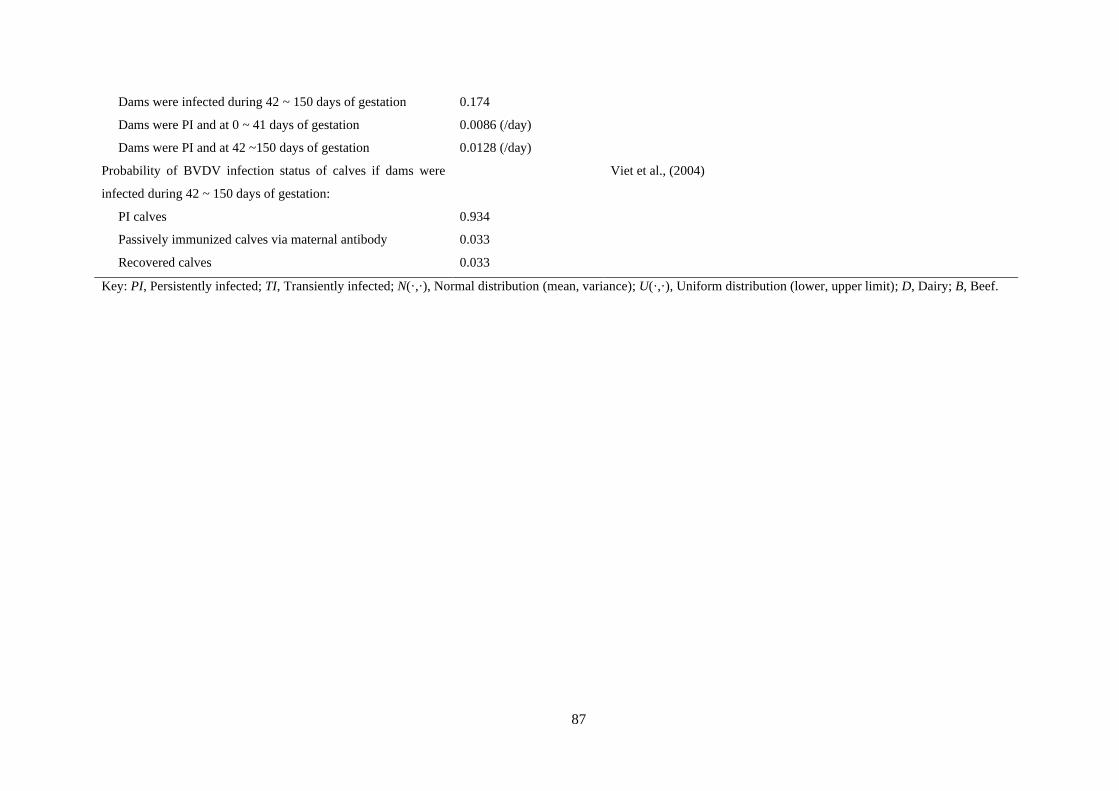
87
Dams were infected during 42 ~ 150 days of gestation
Dams were PI and at 0 ~ 41 days of gestation
Dams were PI and at 42 ~150 days of gestation
0.174
0.0086 (/day)
0.0128 (/day)
Probability of BVDV infection status of calves if dams were
infected during 42 ~ 150 days of gestation:
PI calves
Passively immunized calves via maternal antibody
Recovered calves
0.934
0.033
0.033
Viet et al., (2004)
Key: PI, Persistently infected; TI, Transiently infected; N(·,·), Normal distribution (mean, variance); U(·,·), Uniform distribution (lower, upper limit); D, Dairy; B, Beef.

88
5.3.2. Demographics of beef farms
The typical calving season for beef farms in New Zealand is between August and
November with the PSM between early November and early December. More than half of
farms have a mating period of 9 weeks or less (McFadden et al., 2005). Calves are weaned
and separated from their dams at approximately 6 to 7 months of age at which time a
proportion of female calves are selected to become replacement heifers while the others
heifer calves and all male calves are raised or sold for finishing. Generally, heifers deliver
their first calf at approximately 24 months of age, but some farmers breed heifers for the
first time at approximately 26 to 27 months of age with first calving at approximately 36
months of age (McFadden et al., 2005). Most farmers mix the replacement heifers with the
MA herd after the heifers’ first calving (Hickson et al., 2012).
For the simulation model, we divided the beef population into 7 management groups:
Fattening heifers (FH) and steers (FS) for finishing, young replacement heifers (YH: heifers
in this herd are bred for the first time), breeding replacement heifers (BH: heifers in this
herd calve for the first time and are bred for the second time) and their calves (CH), and
mixed-age cows (MA) and their calves (CM).
The start of puberty, oestrus cycle, gestation period, and natural abortion rate were
assumed to be the same as dairy heifers/cows (Hickson et al., 2012). The PSM was
November 25th, and cows/heifers were grazed with breeding bulls for 9 weeks of the mating
period. For animals in oestrus, the probability of conception by naturally mating with
breeding bulls was 62.0% (Geenty & Morris, 2017). Off-site grazing was not considered
in the beef model since it is not a common practice in the beef industry.
As beef cattle in New Zealand are infrequently handled compared with dairy cattle, we
assumed that most of the transitions between demographic management groups occurred
on April 1st, which was the day of weaning. We also assumed that the natural mortality rate
of calves until weaning differed between CHs and CMs with 14.3% and 5.0%, respectively

89
(Hickson et al., 2012; C. A. Morris et al., 1986). When the calves were weaned, up to 33
female calves (22% of 𝑇𝑀) were selected from those who were born during the first 3 weeks
of the calving period and transferred to the YH group. Other calves were transferred to
either FH or FS depending on their sex, and slaughtered when they reached 820 or 670
days of age, respectively (Geenty & Morris, 2017). Transition of YHs into BHs also
occurred on the day of weaning, and it was assumed that all BHs joined the MA herd on
March 1st which was between the end of the mating period and pregnancy scanning. On
March 25th (one week before the day of weaning), pregnancy scanning of MAs was
performed and any empty MAs were tagged. We kept the herd size constant by either (1)
selling some of the pregnant (i.e. non-tagged) MAs older than 6 years if the number of MAs
(= non-tagged MAs + joined BHs) was larger than 𝑇𝑀 , or (2) purchasing (BVDV
susceptible) replacement heifers if the number of MAs (= non-tagged MAs + joined BHs)
was lower than 𝑇𝑀. As in the dairy model, the demographic group of breeding bulls was
not included in the beef model. Figure 5.2 illustrates the demographic events of the beef
model, and the parameters for transition between demographic groups are described in
Table 5.1.
5.3.3. Disease component
For the disease simulation component, the BVDV infection status of individual animals
was categorised into the following five mutually exclusive disease states: passively
immunized via ingestion of maternal antibodies through colostrum (M), susceptible (S),
transiently infected (TI), persistently infected (PI), or recovered (R). In the simulation, the
probability of BVDV infection for each susceptible animal (𝑃𝑖𝑛𝑓) was determined by the
numbers of PI and TI animals within the same group, PI animals in different groups on the
same farm, and PI animals on neighbouring farms which could be a source of infection.
The occurrence of BVDV infection in an individual animal was determined with a random

90
Bernoulli event, with the probability of a susceptible individual in a group i being infected
on a given day was
𝑃𝑖𝑛𝑓 = 1 − 𝑒(−𝜆𝑖)
𝜆𝑖 = 𝛽𝑃
𝑃𝐼𝑖
𝑁𝑖+ 𝛽𝑇
𝑇𝐼𝑖
𝑁𝑖+ 𝛽𝐵 ∑
𝑃𝐼𝑗
𝑁𝑖𝑁𝑗
𝑛
𝑗
+ 𝛽𝐹
𝐾𝐹
𝑁𝑖, (𝑖 ≠ 𝑗)
where λ was the force of BVDV infection in group i at a given day, 𝛽𝑃 and 𝛽𝑇 were within-
group transmission rates by a PI and TI animal, respectively, 𝛽𝐵 and 𝛽𝐹 were between-
group and between-farm transmission rates by a PI animal, respectively, 𝑁𝑖, 𝑃𝐼𝑖, and 𝑇𝐼𝑖
were the group size, the number of PI and TI animals in group i on a given day, respectively,
and n was the number of groups on a farm on a given day. Given the endemic situation of
BVDV, we also considered the local transmission of BVDV by incorporating the overall
prevalence of PI animals on the neighbouring farms (𝐾𝐹) to the force of BVDV infection.
We assumed that 𝛽𝑇 , 𝛽𝐵, and 𝛽𝐹 were proportionally lower than 𝛽𝑃 based on our
estimation and other published studies (Smith et al., 2014; Viet et al., 2007). Dams and
their calves were assumed to be one management group from calving to weaning in the
beef model for the purpose of modelling BVDV transmission. Also, since animals in the
BH herd in the dairy model were grazed at an off-site location, any between-group
transmission to and from these animals (except from neighbouring farms) was not
considered in the dairy model.
TI animals recovered and became seropositive after x days of infection, where x was
randomly chosen from a uniform distribution between 10 and 20 days (Liebler-Tenorio et
al., 2004; Müller-Doblies et al., 2004; T. Sandvik et al., 1997). Once recovered, animals
were assumed to have developed life-long immunity against BVDV. We assumed the daily
mortality rate of 0.0006/day for PI animals (μ), which indicated an annual survival
probability of 50.0% (Ezanno et al., 2007).
91
We assumed that the duration of protection against BVDV infection via maternal
antibodies followed a normal distribution with mean and standard deviation of 155 and 31
days, respectively (Han et al., 2019). Several studies have shown that BVDV can still
replicate and induce cell-mediated immune responses in calves with maternal antibodies
without causing them to show clinical signs, and that these calves develop stronger immune
responses (i.e. an anamnestic response) when they were re-exposed to the virus following
the depletion of maternal antibodies (if the initial exposure to the virus was after
approximately 14 days old) (Platt et al., 2009; Ridpath et al., 2003). To incorporate the
anamnestic immune response of passively immunised calves, we assumed that calves in M
status (only over 14 days old) transferred to R status with the probability of 𝑃𝑖𝑛𝑓 per day.
It is well-known that BVDV decreases the fertility of infected animals, and we
parameterised that the probability of conception (both by artificial insemination and by
mating with bulls) was 0.68 times that of normal animals in both PI and TI animals
(McGowan et al., 1993; Whitmore et al., 1981). We also considered the probability of
BVDV-induced embryonic loss or abortion, which varied by the stage of gestation at the
time of BVDV infection. The probability of embryonic loss was assumed to be 12.1% if
animals were infected with BVDV during early gestation (0 ~ 41 days) (McGowan et al.,
1993). If BVDV infection occurred during mid-gestation (42 ~ 150 days), the probability
of abortion was 17.4% (Grooms et al., 2007; McClurkin et al., 1984; Viet et al., 2004; Walz
et al., 2017, 2018). Finally, we assumed that no abortion occurred if animals were infected
with BVDV after 150 days of gestation. For simplicity, any TI animals that aborted were
assumed to abort on the day of infection. However, the abortion of PI animals was applied
as daily rates during the gestation periods (0 ~ 41 days: 0.86%/day, 42 ~ 150 days:
1.28%/day) given the possible persistence of BVDV in uterine tissue (Liebler-Tenorio,
2005).
If animals did not abort, the infection status of their calf was determined by the stage of
gestation when the dams were infected. We assumed that a PI dam always produced a PI
92
calf, and all calves were M or R if their dams were infected with BVDV during 0 ~ 41 or
> 150 days of gestation, respectively (Viet et al., 2004). For the calves from dams infected
between 42 and 150 days of gestation, the probability of becoming PI was 93.4%, and the
rest became either M or R (3.3% for each) (Viet et al., 2004). Schematic representations of
transition between BVDV infection status and the BVDV infection status of new born
calves are illustrated in Figure 5.3. Parameters related to BVDV infection are provided in
Table 5.1.

93
Figure 5. 3. Schematic representation of transition between BVDV infection status (top) and BVDV
infection status of new born calves (bottom). BVDV infection status consists of passively immunised
via maternal antibody (M), susceptible (S), transiently infected (TI), persistently infected (PI), recovered
(R), vaccinated insufficiently to prevent fetal infection (𝑉𝐼), and vaccinated sufficiently to prevent fetal
infection (𝑉𝑆). Top: Solid black arrows indicate the transition between BVDV infection status, blue
dotted arrows indicate the decay of immunity conferred by vaccination, and red dashed arrows illustrate
the force of BVDV infection. Bottom: Solid arrows indicate the BVDV infection status of calves
depending on the infection status of their dams. Dashed arrows from 𝑉𝐼 illustrate the BVDV infection
status of calves if 𝑉𝐼 dams were infected.

94
Table 5. 2. Model parameters for production/economic and control components.
Parameters Value (unit) Reference
Production and economic component
Production of milk solid of:
Primiparous cows
Multiparous cows
1.33 (kg/day)
1.76 (kg/day)
Anonymous, (2018a)
Reduced production of milk solid in PI cows 0.478 Voges et al., (2006)
Reduced live-weight gain per day of:
PI animals
TI animals
0.81
0.92
Moffat & Bruere, (2018); Voges et al., (2006)
Price of milk solid 6.79 (NZ$/kg) Anonymous, (2018a)
Price of cattle: Anonymous, (2019b)
Bobby calf
Pregnant mixed-age cow
Replacement heifer
40.00 (NZ$)
1,700.00 (NZ$)
1,300.00 (NZ$)
Price of carcass of:
Calf or young heifer
Fattening steer or heifer, and breeding heifer
Mixed-age cow
3.45 (NZ$/kg)
5.76 (NZ$/kg)
4.41 (NZ$/kg)
Anonymous, (2019c)
Cost of artificial insemination 31.85 (NZ$) Anonymous, (2019a)
Cost of treatment 27.00 (NZ$) Our estimation
Cost of BVDV RT-PCR test on bulk tank milk 170.90 (NZ$) Anonymous, (2019d)
Cost of BVDV antigen ELISA 17.09 (NZ$) * Reichel et al., (2008)
Cost of BVDV vaccination 6.74 (NZ$) * Reichel et al., (2008)
Cost of double fencing
1.80 (NZ$/m) † Anonymous, (2016d)

95
Control component
Test performance:
Sensitivity of BVDV RT-PCR test
Specificity of BVDV RT-PCR test
Sensitivity of BVDV antigen ELISA
Specificity of BVDV antigen ELISA
0.999
0.999
0.835
0.994
Lanyon et al., (2013)
Probability of vaccination outcome (after second dose)
Vaccine failure
Insufficient fetal protection (𝑉𝐼)
Sufficient fetal protection (𝑉𝑆)
0.193
0.735
0.072
Estimated
(see Section 3 of Appendix 3)
Probability of abortion if:
𝑉𝐼 dams were infected during 0 ~ 41 days of gestation
𝑉𝐼 dams were infected during 42 ~ 150 days of gestation
0.077
0.076
Estimated
(see Section 3 of Appendix 3)
Probability of BVDV infection status of calves if 𝑉𝐼 dams were
infected during 42 ~ 150 days of gestation:
PI calves
Passively immunised calves via maternal antibody
Recovered calves
0.232
0.559
0.209
Estimated
(see Section 3 of Appendix 3)
* Monetary values were standardised using 1.9% inflation rate from the year of original publication (NZ$ 7.90 was added to the cost of ELISA for veterinary service).
† The distance of double fencing was estimated based on the total herd size with the circular farm area of 2.84 hectare/cattle. It resulted the cost of installing double fencing
for both dairy and beef farms as NZ$ 4,608.52.
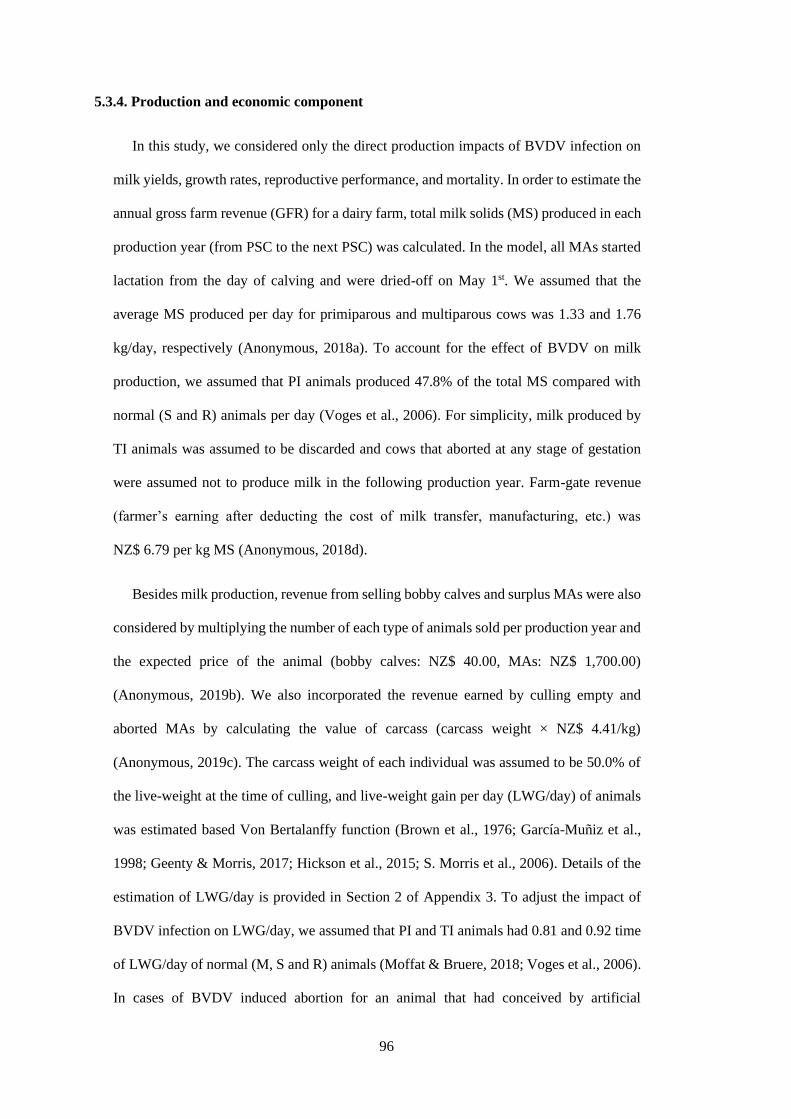
96
5.3.4. Production and economic component
In this study, we considered only the direct production impacts of BVDV infection on
milk yields, growth rates, reproductive performance, and mortality. In order to estimate the
annual gross farm revenue (GFR) for a dairy farm, total milk solids (MS) produced in each
production year (from PSC to the next PSC) was calculated. In the model, all MAs started
lactation from the day of calving and were dried-off on May 1st. We assumed that the
average MS produced per day for primiparous and multiparous cows was 1.33 and 1.76
kg/day, respectively (Anonymous, 2018a). To account for the effect of BVDV on milk
production, we assumed that PI animals produced 47.8% of the total MS compared with
normal (S and R) animals per day (Voges et al., 2006). For simplicity, milk produced by
TI animals was assumed to be discarded and cows that aborted at any stage of gestation
were assumed not to produce milk in the following production year. Farm-gate revenue
(farmer’s earning after deducting the cost of milk transfer, manufacturing, etc.) was
NZ$ 6.79 per kg MS (Anonymous, 2018d).
Besides milk production, revenue from selling bobby calves and surplus MAs were also
considered by multiplying the number of each type of animals sold per production year and
the expected price of the animal (bobby calves: NZ$ 40.00, MAs: NZ$ 1,700.00)
(Anonymous, 2019b). We also incorporated the revenue earned by culling empty and
aborted MAs by calculating the value of carcass (carcass weight × NZ$ 4.41/kg)
(Anonymous, 2019c). The carcass weight of each individual was assumed to be 50.0% of
the live-weight at the time of culling, and live-weight gain per day (LWG/day) of animals
was estimated based Von Bertalanffy function (Brown et al., 1976; García-Muñiz et al.,
1998; Geenty & Morris, 2017; Hickson et al., 2015; S. Morris et al., 2006). Details of the
estimation of LWG/day is provided in Section 2 of Appendix 3. To adjust the impact of
BVDV infection on LWG/day, we assumed that PI and TI animals had 0.81 and 0.92 time
of LWG/day of normal (M, S and R) animals (Moffat & Bruere, 2018; Voges et al., 2006).
In cases of BVDV induced abortion for an animal that had conceived by artificial
97
insemination, the cost of artificial insemination (NZ$ 31.85) was deducted from GFR
(Anonymous, 2019a). We also deducted the cost of purchasing replacement heifers
(NZ$ 1,300.00/heifer) and treatment for TI animals (lactating MA only) (NZ$ 27.00/TI
animal) from GFR (Anonymous, 2019b). For the beef model, we assumed that GFR for
each production year was only affected by the overall carcass weight of culled and
slaughtered animals (FH and FS: NZ$ 5.76/kg, MA: NZ$ 4.41/kg) and the number of
surplus MAs sold, however, we did not consider the treatment of TI animals in the beef
model (Anonymous, 2019c). Parameters related to production and economic components
are provided in Table 5.2.
5.3.5. BVDV control strategies
In this study, we examined different BVDV control strategies as a combination of
different control options in three categories: (1) annual BVDV testing and culling of
identified PI animals, (2) vaccination of breeding animals, and (3) increasing biosecurity
by double fencing. We assumed that a BVDV control strategy was continually performed
during the simulation once it was implemented.
For annual BVDV testing and culling, we considered two sub-options (i) testing all
female calves selected as replacement heifers using BVDV antigen (Ag) ELISA on ear
notch sample, followed by culling of confirmed PI animals, or (ii) screening of BVDV
using RT-PCR on bulk tank milk (BTM) for the dairy farm or using individual BVDV Ag
ELISA on serum samples from randomly chosen 15 YHs for the beef farm, followed by a
PI hunt (i.e. testing all breeding animals using BVDV Ag ELISA with culling of any test-
positive animals) of all breeding animals if the screening test was positive. It was assumed
that all female calves were tested (i.e. initial test) at 4 days old for dairy calves and on the
day of weaning for beef calves. All test positive calves were re-tested (i.e. subsequent test)
28 days after the initial test to confirm their infection status as PI, and all confirmed PI

98
calves were culled immediately. When the subsequent test was conducted, the dam of the
tested calves was also sampled and tested using the Ag ELISA and culled immediately if
the result was positive. For annual screening, RT-PCR on BTM for the dairy farm was
conducted at the PSM, and sampling of the 15 YHs on a beef farm occurred on March 1st.
Similar to the testing calves, a PI hunt was conducted 28 days after the screening test if RT-
PCR of BTM (Ag ELISA of at least one animal among 15 YHs) was test positive for a
dairy (beef) farm. When animals were culled due to the test positivity, the carcass value of
the animals were added to GFR.
For vaccination, we considered the use of killed-vaccines as they are the only type
available in New Zealand. We assumed that (1) the duration of protection after the second
dose of BVDV vaccination was 6 months, whereas the duration after the third dose (and
thereafter) was 12 months, and (2) BVDV vaccination after the second dose (and thereafter)
resulted in three outcomes (i) not enough immunity to prevent clinical diseases (vaccine
failure: 19.3%), (ii) enough immunity to prevent clinical disease but insufficient to
guarantee the prevention of fetal infection (𝑉𝐼, insufficient fetal protection: 73.5%), and (iii)
sufficient immunity to prevent fetal infection ( 𝑉𝑆 , sufficient fetal protection: 7.2%)
(Downey-Slinker et al., 2016; McArthur, 2004; Newcomer et al., 2015; Packianathan et al.,
2017; Ridpath, 2013). The efficacy of BVDV vaccination of 𝑉𝐼 animals against fetal
infection was assumed to vary according to the stage of gestation at the time of infection
(Table 5.2). We also assumed that the first vaccination had no protective effect and there
was no effect of BVDV vaccination on TI or PI animals. Detailed information about the
parameterisation of BVDV vaccine efficacy is provided in Appendix 3 (see Section 3), and
the graphical illustration of reproductive outcomes following BVDV infection on 𝑉𝐼 dams
is provided in Figure 5.3.
As the duration of BVDV protection was dependent on the number of vaccine doses
given, we considered four vaccination programmes that administering to breeding animals:
a programme that administering three doses before the first mating (V1), and a programme
99
that administering two doses before the first mating (V2), each of which could involve
annual boosting (V1AB, V2AB). For the V1 of the dairy model, all replacement heifers in
the YH herd were vaccinated for the first time on April 1st and the second time on May 1st
to immunise animals before being grazed on off-site. The third dose was administered on
September 26th which was 4 weeks before the PSM. For the V2 of the dairy model, all
animals in the BH herd were first vaccinated on August 31st and the second time on
September 26th. Dairy cows in the MA herd were assumed to be vaccinated on September
26th for annual boosting for V1AB and V2AB. For the V1 of the beef model, the first
vaccination was administered to calves on the day of weaning. The second and third doses
were given on May 1st and October 29th (4 weeks before the PSM), respectively, to YHs.
For the V2 programme, the first and second doses of the beef farm were administered to
YHs on October 1st and 29th, respectively. The annual booster was administered on October
29th to all breeding females in MA and BH herds for both V1AB and V2AB. The cost of
BVDV vaccination was NZ$ 6.74 per animal per vaccination (Reichel et al., 2008). Table
5.2 provides model parameters related to control measures.
We assumed that double fencing totally prevented the transmission of BVDV from
neighbouring farms. The cost for installing double fencing varied by farm, and was
calculated at NZ$ 1.80/metre (Anonymous, 2016d) where the fencing distance was
estimated based on the total herd size with the circular farm area of 2.84 hectare/cattle
(Anonymous, 2018a). The cost of installing double fencing only applied in the first year of
simulation, and 10% of the cost was assumed to be spent in following years for maintenance.
5.3.6. Model initiation and BVDV outbreak
We initiated the dairy model with 400 pregnant MAs and 80 BHs. In the beef model,
the initial population consisted of 150 pregnant MAs, 30 pregnant BHs, and 30 YHs. The
simulations started on the day of the PSC, and the occurrence of demographic events (e.g.
100
natural mortality, conception, abortion, oestrous detection) was determined based on
conducting Bernoulli trials with the relevant probability for each individual on each day of
the simulation. We first ran the models for 5 years as a burn-in period to stabilise the
population demography, then introduced female PI calves into the farm at the beginning of
year 6 to mimic BVDV outbreak. PI calves were introduced by converting x number of
susceptible new born female calves into PI, where x was 4.0% of 𝑇𝑀 (ρ) (Thompson, 2005).
When PI calves were introduced, their dam’s infection status was also converted to R
(recovered) as it was assumed that the BVDV outbreak was due to purchasing Trojan cows
(i.e. a dam carrying a PI fetus). Local transmission was also allowed from the beginning of
year 6 until the end of simulation by assuming the overall prevalence of PI animals on
neighbouring farms (𝐾𝐹) as 2.0%. We ran the simulation model for an additional 5 years
to monitor BVDV dynamics and the economic impacts of applying different BVDV control
strategies. The simulation period of 5 years was chosen to estimate the economic impacts
of a single incursion event on BVDV naïve farms and producing a realistic timeframe for
farmers to consider the economics of investing in BVDV control.
5.3.7. BVDV dynamics and economic analysis
First, we simulated the models both with and without BVDV (i.e. both ρ and 𝐾𝐹 being
zero) for 1,000 iterations each while implementing no control measures to estimate the
economic impacts of a BVDV outbreak on dairy and beef farms. The output measures for
the model were (1) the number of TI and PI animals per year, and (2) the loss of total GFR
due to BVDV to estimate the dynamics and economic impact of BVDV in naïve farms.
The total GFR was calculated as a sum of annual GFRs during the simulation period while
adjusting for 1.9% of discounting rate per year.
Next, we evaluated the economic impact of different control strategies by running 30
different scenarios for both dairy and beef models. Each scenario was a combination of

101
different test and cull, vaccination, and double fencing options (Table 5.3), and was iterated
1,000 times to adjust for the variation caused by stochasticity, resulting in 30,000
simulations for each of the dairy and beef models. For each simulation, we calculated the
total GFR and total cost of BVDV control during the simulation period (i.e. cumulative
cost while discounting by 1.9% per year). We then established a multivariable linear
regression model with the total GFR as an outcome and the various BVDV control
strategies as explanatory variables. The constant of the multivariable model represented the
total GFR without any control measures, and the coefficients were the average benefits (i.e.
surplus in total GFR) by adapting relevant control strategies. Coefficients of the model
were used to analyse the benefit/cost ratio of BVDV control strategies, which was
calculated as a ratio of the coefficient to the total cost of BVDV control strategies. Given
the amount of output data, we only considered any variable that had P value < 0.01 as
statistically significant in multivariable models. Since the purpose of the regression models
was to estimate the economic impact or efficacy of all control strategies, we examined only
the full models that considered all the explanatory variables, and therefore did not use any
type of model selection process based on statistical significance. The simulation models in
this study were coded in the C programming language and were called in R (version 3.5.2)
to substitute the varying parameter values (R Core Team, 2018). All analyses of the
simulation results were performed in R.
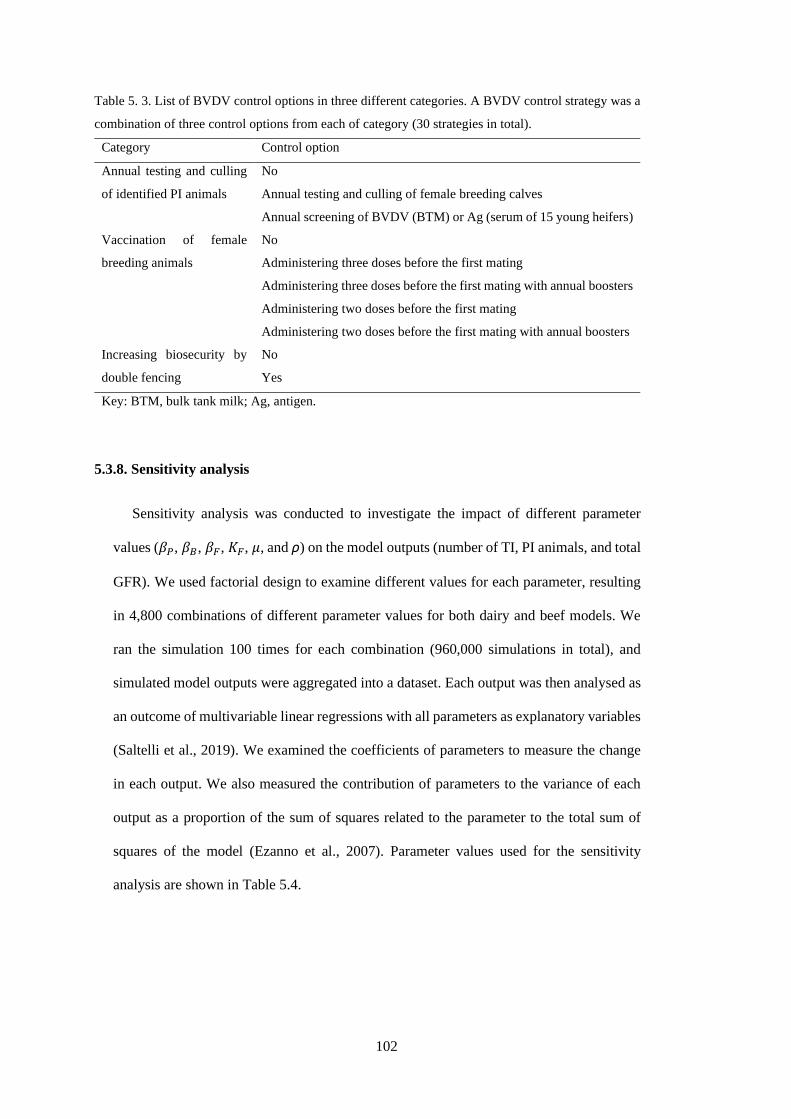
102
Table 5. 3. List of BVDV control options in three different categories. A BVDV control strategy was a
combination of three control options from each of category (30 strategies in total).
Category Control option
Annual testing and culling
of identified PI animals
No
Annual testing and culling of female breeding calves
Annual screening of BVDV (BTM) or Ag (serum of 15 young heifers)
Vaccination of female
breeding animals
No
Administering three doses before the first mating
Administering three doses before the first mating with annual boosters
Administering two doses before the first mating
Administering two doses before the first mating with annual boosters
Increasing biosecurity by
double fencing
No
Yes
Key: BTM, bulk tank milk; Ag, antigen.
5.3.8. Sensitivity analysis
Sensitivity analysis was conducted to investigate the impact of different parameter
values (𝛽𝑃, 𝛽𝐵, 𝛽𝐹, 𝐾𝐹, 𝜇, and ρ) on the model outputs (number of TI, PI animals, and total
GFR). We used factorial design to examine different values for each parameter, resulting
in 4,800 combinations of different parameter values for both dairy and beef models. We
ran the simulation 100 times for each combination (960,000 simulations in total), and
simulated model outputs were aggregated into a dataset. Each output was then analysed as
an outcome of multivariable linear regressions with all parameters as explanatory variables
(Saltelli et al., 2019). We examined the coefficients of parameters to measure the change
in each output. We also measured the contribution of parameters to the variance of each
output as a proportion of the sum of squares related to the parameter to the total sum of
squares of the model (Ezanno et al., 2007). Parameter values used for the sensitivity
analysis are shown in Table 5.4.
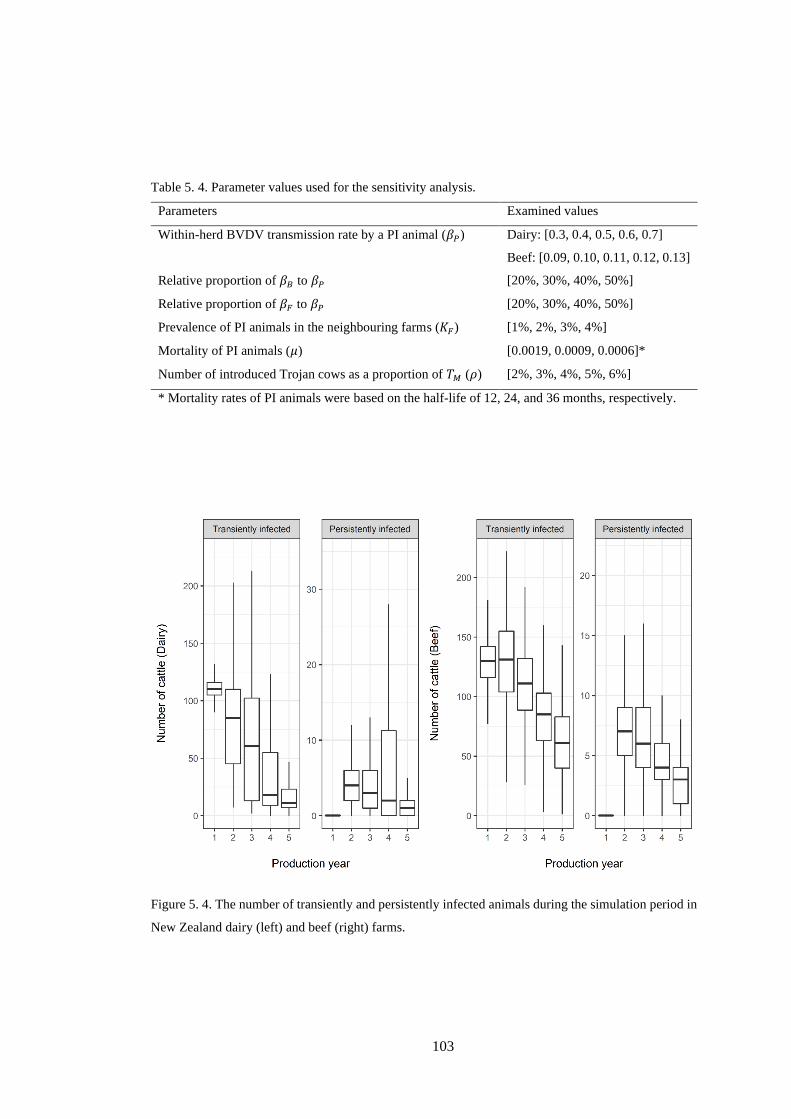
103
Table 5. 4. Parameter values used for the sensitivity analysis.
Parameters Examined values
Within-herd BVDV transmission rate by a PI animal (𝛽𝑃) Dairy: [0.3, 0.4, 0.5, 0.6, 0.7]
Beef: [0.09, 0.10, 0.11, 0.12, 0.13]
Relative proportion of 𝛽𝐵 to 𝛽𝑃 [20%, 30%, 40%, 50%]
Relative proportion of 𝛽𝐹 to 𝛽𝑃 [20%, 30%, 40%, 50%]
Prevalence of PI animals in the neighbouring farms (𝐾𝐹) [1%, 2%, 3%, 4%]
Mortality of PI animals (𝜇) [0.0019, 0.0009, 0.0006]*
Number of introduced Trojan cows as a proportion of 𝑇𝑀 (𝜌) [2%, 3%, 4%, 5%, 6%]
* Mortality rates of PI animals were based on the half-life of 12, 24, and 36 months, respectively.
Figure 5. 4. The number of transiently and persistently infected animals during the simulation period in
New Zealand dairy (left) and beef (right) farms.

104
Figure 5. 5. The economic impact of BVDV introduction on naïve dairy (left) and beef (right) farms in
New Zealand. Green and orange bars indicate the gross farm revenue without and with BVDV,
respectively.

105
5.4. Results
5.4.1. Dynamics of BVDV and its economic impact
The number of transiently and persistently infected animals on both dairy and beef farms
during the 5 years are illustrated in Figure 5.4. On average, the number of PI animals
(excluding initially introduced PI calves) on both dairy and beef farms was highest one
year after initial introduction. By the end of the simulation period (year 5), BVDV had
almost been eliminated naturally on the dairy farm, whereas some TI and PI animals still
persisted on the beef farm.
Figure 5.5 illustrates the annual GFR during the simulation period with and without
BVDV. The largest reduction in GFR was observed during year 2 ~ 3 on the dairy farm,
whereas it was at year 3 on the beef farm. The annual GFR was restored to the level of year
1 at the final year (year 5) on the dairy farm, however, it continued to be affected on the
beef farm indicating that the economic impact of BVDV in a beef farm would last longer
than 5 years. Mean (standard deviation) losses in total GFR were approximately
NZ$ 44,400 (1,555) and NZ$ 30,900 (912) on dairy and beef farms, respectively. Dividing
the total loss by the number of MAs on each farm, the economic losses per MA (95%
confidence interval) were NZ$ 22.22 (20.69 ~ 23.74) per year for the dairy farm and
NZ$ 41.19 (38.81 ~ 43.58) per year for the beef farm.
5.4.2. Cost-benefit of BVDV control strategies
Table 5.5 and 5.6 show the results of multivariable linear regression models on total
GFR, and the cost and benefit of implementing BVDV control are illustrated in Figure 5.6
with benefit/cost ratio. On both types of farm, the highest benefit was incurred when annual
testing of breeding calves was implemented with the vaccination programme that
administering three doses before the first mating and annual boosters (NZ$ 22,864.65 for
dairy, NZ$ 21,582.50 for beef farms).
106
In a dairy farm, only the BVDV control strategies of annual testing of female calves
incurred significantly higher benefit compared to its cost (B/C ratio of 2.02). Other
strategies, such as the annual testing of calves with double fencing, generated marginally
higher benefit than the control cost. In a beef farm, any control strategies that included
vaccination with ongoing annual boosters being administered (either V1AB or V2AB)
incurred higher benefit than cost as long as double fencing was not considered in the
strategies. The highest benefit/cost ratio of 2.02 was observed when only a vaccination
programme consisting of two doses before first mating with annual boosting was
implemented. Some BVDV control strategies, such as annual screening only, vaccination
only without administering annual boosters, or double fencing only, were not economically
beneficial on dairy or beef farms based on our models.
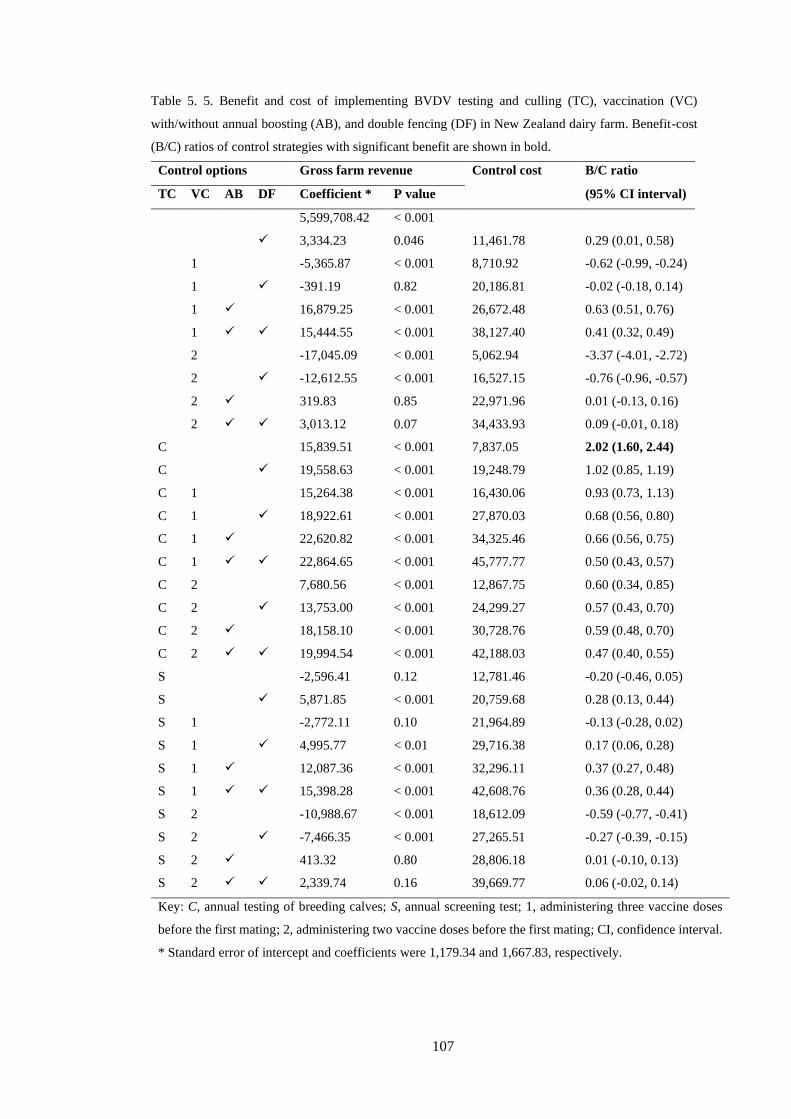
107
Table 5. 5. Benefit and cost of implementing BVDV testing and culling (TC), vaccination (VC)
with/without annual boosting (AB), and double fencing (DF) in New Zealand dairy farm. Benefit-cost
(B/C) ratios of control strategies with significant benefit are shown in bold.
Control options Gross farm revenue Control cost B/C ratio
TC VC AB DF Coefficient * P value (95% CI interval)
5,599,708.42 < 0.001
✓ 3,334.23 0.046 11,461.78 0.29 (0.01, 0.58)
1 -5,365.87 < 0.001 8,710.92 -0.62 (-0.99, -0.24)
1 ✓ -391.19 0.82 20,186.81 -0.02 (-0.18, 0.14)
1 ✓ 16,879.25 < 0.001 26,672.48 0.63 (0.51, 0.76)
1 ✓ ✓ 15,444.55 < 0.001 38,127.40 0.41 (0.32, 0.49)
2 -17,045.09 < 0.001 5,062.94 -3.37 (-4.01, -2.72)
2 ✓ -12,612.55 < 0.001 16,527.15 -0.76 (-0.96, -0.57)
2 ✓ 319.83 0.85 22,971.96 0.01 (-0.13, 0.16)
2 ✓ ✓ 3,013.12 0.07 34,433.93 0.09 (-0.01, 0.18)
C 15,839.51 < 0.001 7,837.05 2.02 (1.60, 2.44)
C ✓ 19,558.63 < 0.001 19,248.79 1.02 (0.85, 1.19)
C 1 15,264.38 < 0.001 16,430.06 0.93 (0.73, 1.13)
C 1 ✓ 18,922.61 < 0.001 27,870.03 0.68 (0.56, 0.80)
C 1 ✓ 22,620.82 < 0.001 34,325.46 0.66 (0.56, 0.75)
C 1 ✓ ✓ 22,864.65 < 0.001 45,777.77 0.50 (0.43, 0.57)
C 2 7,680.56 < 0.001 12,867.75 0.60 (0.34, 0.85)
C 2 ✓ 13,753.00 < 0.001 24,299.27 0.57 (0.43, 0.70)
C 2 ✓ 18,158.10 < 0.001 30,728.76 0.59 (0.48, 0.70)
C 2 ✓ ✓ 19,994.54 < 0.001 42,188.03 0.47 (0.40, 0.55)
S -2,596.41 0.12 12,781.46 -0.20 (-0.46, 0.05)
S ✓ 5,871.85 < 0.001 20,759.68 0.28 (0.13, 0.44)
S 1 -2,772.11 0.10 21,964.89 -0.13 (-0.28, 0.02)
S 1 ✓ 4,995.77 < 0.01 29,716.38 0.17 (0.06, 0.28)
S 1 ✓ 12,087.36 < 0.001 32,296.11 0.37 (0.27, 0.48)
S 1 ✓ ✓ 15,398.28 < 0.001 42,608.76 0.36 (0.28, 0.44)
S 2 -10,988.67 < 0.001 18,612.09 -0.59 (-0.77, -0.41)
S 2 ✓ -7,466.35 < 0.001 27,265.51 -0.27 (-0.39, -0.15)
S 2 ✓ 413.32 0.80 28,806.18 0.01 (-0.10, 0.13)
S 2 ✓ ✓ 2,339.74 0.16 39,669.77 0.06 (-0.02, 0.14)
Key: C, annual testing of breeding calves; S, annual screening test; 1, administering three vaccine doses
before the first mating; 2, administering two vaccine doses before the first mating; CI, confidence interval.
* Standard error of intercept and coefficients were 1,179.34 and 1,667.83, respectively.
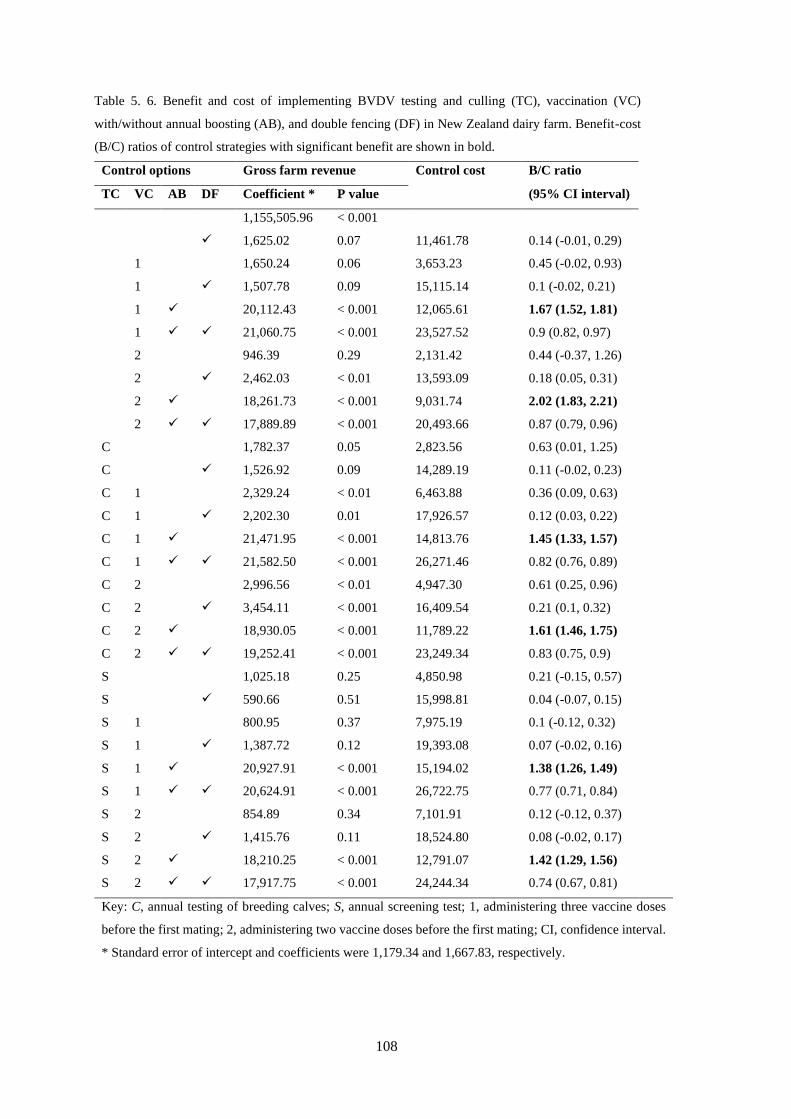
108
Table 5. 6. Benefit and cost of implementing BVDV testing and culling (TC), vaccination (VC)
with/without annual boosting (AB), and double fencing (DF) in New Zealand dairy farm. Benefit-cost
(B/C) ratios of control strategies with significant benefit are shown in bold.
Control options Gross farm revenue Control cost B/C ratio
TC VC AB DF Coefficient * P value (95% CI interval)
1,155,505.96 < 0.001
✓ 1,625.02 0.07 11,461.78 0.14 (-0.01, 0.29)
1 1,650.24 0.06 3,653.23 0.45 (-0.02, 0.93)
1 ✓ 1,507.78 0.09 15,115.14 0.1 (-0.02, 0.21)
1 ✓ 20,112.43 < 0.001 12,065.61 1.67 (1.52, 1.81)
1 ✓ ✓ 21,060.75 < 0.001 23,527.52 0.9 (0.82, 0.97)
2 946.39 0.29 2,131.42 0.44 (-0.37, 1.26)
2 ✓ 2,462.03 < 0.01 13,593.09 0.18 (0.05, 0.31)
2 ✓ 18,261.73 < 0.001 9,031.74 2.02 (1.83, 2.21)
2 ✓ ✓ 17,889.89 < 0.001 20,493.66 0.87 (0.79, 0.96)
C 1,782.37 0.05 2,823.56 0.63 (0.01, 1.25)
C ✓ 1,526.92 0.09 14,289.19 0.11 (-0.02, 0.23)
C 1 2,329.24 < 0.01 6,463.88 0.36 (0.09, 0.63)
C 1 ✓ 2,202.30 0.01 17,926.57 0.12 (0.03, 0.22)
C 1 ✓ 21,471.95 < 0.001 14,813.76 1.45 (1.33, 1.57)
C 1 ✓ ✓ 21,582.50 < 0.001 26,271.46 0.82 (0.76, 0.89)
C 2 2,996.56 < 0.01 4,947.30 0.61 (0.25, 0.96)
C 2 ✓ 3,454.11 < 0.001 16,409.54 0.21 (0.1, 0.32)
C 2 ✓ 18,930.05 < 0.001 11,789.22 1.61 (1.46, 1.75)
C 2 ✓ ✓ 19,252.41 < 0.001 23,249.34 0.83 (0.75, 0.9)
S 1,025.18 0.25 4,850.98 0.21 (-0.15, 0.57)
S ✓ 590.66 0.51 15,998.81 0.04 (-0.07, 0.15)
S 1 800.95 0.37 7,975.19 0.1 (-0.12, 0.32)
S 1 ✓ 1,387.72 0.12 19,393.08 0.07 (-0.02, 0.16)
S 1 ✓ 20,927.91 < 0.001 15,194.02 1.38 (1.26, 1.49)
S 1 ✓ ✓ 20,624.91 < 0.001 26,722.75 0.77 (0.71, 0.84)
S 2 854.89 0.34 7,101.91 0.12 (-0.12, 0.37)
S 2 ✓ 1,415.76 0.11 18,524.80 0.08 (-0.02, 0.17)
S 2 ✓ 18,210.25 < 0.001 12,791.07 1.42 (1.29, 1.56)
S 2 ✓ ✓ 17,917.75 < 0.001 24,244.34 0.74 (0.67, 0.81)
Key: C, annual testing of breeding calves; S, annual screening test; 1, administering three vaccine doses
before the first mating; 2, administering two vaccine doses before the first mating; CI, confidence interval.
* Standard error of intercept and coefficients were 1,179.34 and 1,667.83, respectively.
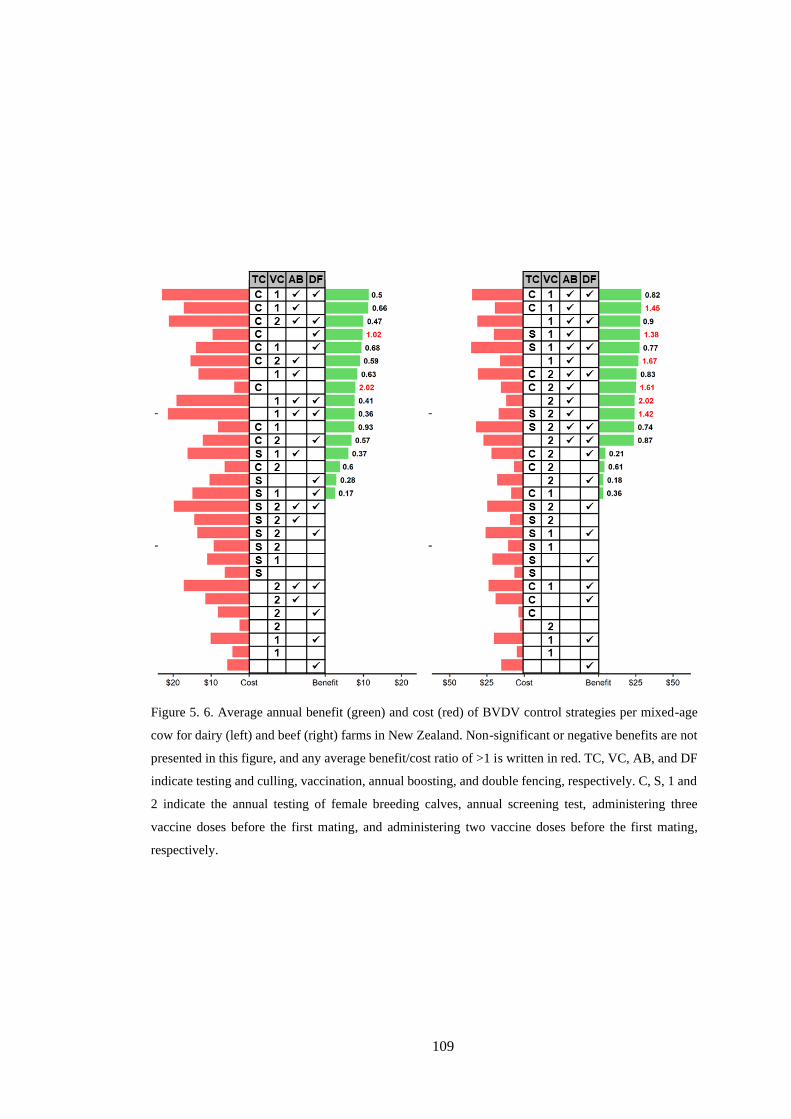
109
Figure 5. 6. Average annual benefit (green) and cost (red) of BVDV control strategies per mixed-age
cow for dairy (left) and beef (right) farms in New Zealand. Non-significant or negative benefits are not
presented in this figure, and any average benefit/cost ratio of >1 is written in red. TC, VC, AB, and DF
indicate testing and culling, vaccination, annual boosting, and double fencing, respectively. C, S, 1 and
2 indicate the annual testing of female breeding calves, annual screening test, administering three
vaccine doses before the first mating, and administering two vaccine doses before the first mating,
respectively.
110
5.4.3. Sensitivity analysis
For the dairy farm, the largest variation in the number of TI animals was explained by
the within-herd BVDV transmission rate by a PI animal (43.4%), followed by mortality of
PI animals (25.6%) and number of introduced Trojan cows (21.6%). The number of PI
animals was mostly affected by the mortality of PI animals (35.3%), number of introduced
Trojan cows (31.7%), and within-herd BVDV transmission rate by a PI animal (24.6%).
For the beef farm, the variation of both the number of TI and PI animals was mainly
explained by the mortality of PI animals (70.3% and 68.5%, respectively). The decrease in
GFR due to BVDV infection was dominated by the number of introduced Trojan cows in
both dairy and beef farm (66.4% and 66.8%, respectively). Detailed results from the
sensitivity analysis are provided in Section 4 of Appendix 3.
5.5. Discussion
In this study, we estimated the economic impacts of BVDV in New Zealand dairy and
beef pastoral farming systems using an individual-based modelling approach. We used an
individual-based modelling approach because the demographic characteristics of
individual animals (e.g. age, sex, and production type) infected with BVDV could have a
significant impact on the magnitude of production losses (Richter et al., 2017). Furthermore,
New Zealand cattle farming systems are highly seasonal with management events
occurring at single, discrete time points, rather than continuously across the year, so it is
more difficult to capture by using a traditional compartmental modelling approach. Using
an individual-animal based simulation approach, we believe the direct economic losses due
to BVDV for typical dairy and beef farms in New Zealand were properly estimated.
Based on this study, the total direct losses caused by BVDV outbreak on the dairy farm
was NZ$ 22.22 per dairy MA per year and NZ$ 41.19 per beef MA per year. Interestingly,
the total direct losses per cow due to BVDV in other countries have been reported to be
111
generally lower in the beef industry compared to the dairy industry (Richter et al., 2017).
This discordant result from our study compared to other countries was possibly due to the
unique management characteristics in the New Zealand dairy industry; a narrow seasonal
breeding period which limits the risk period for generating PI calves, selling/culling most
calves at approximately 4 days old, grazing heifers off-site, and lower average milk yields
per cow. We suspect that the early removal of new born PI calves from the property and
the limited within-farm transmission due to off-site grazing of replacement heifers likely
protect against more severe BVDV outbreaks. Consequently, the reduced infectious
pressure in this production type would have limited impact on reproduction and lactation,
which are the main contributors to economic losses in dairy farms. Although it suggests
that the relative economic impact of BVDV in the New Zealand dairy industry might not
be as strong as in other countries, it should be noted that the total direct losses will vary
between farms depending on the infectious burden of BVDV (e.g. introduced number of PI
animals) or the time or duration of BVDV introduction, as well as other farm management
factors, such as the duration of the mating period or the proportion of MAs being replaced
(Damman et al., 2015).
Several modelling studies have been conducted to estimate the economic losses of
BVDV on New Zealand dairy farms. Previously, Heuer et al., (2007) estimated that the
economic losses due to BVDV was NZ$ 109.05 per cow per year (adjusted for inflation
rate since original publication). In a long-term period, Reichel et al., (2008) calculated the
total loss of BVDV infection as NZ$ 43.28 per cow per year (adjusted for inflation rate
since original publication). Our estimation of total direct loss per dairy cow per year
(NZ$ 22.22) was lower than these previously estimated values, however, we believe the
previously reported values would be overestimated as the previous studies were based on
the average performance of BVDV infected herds, where the low performance of BVDV
infected herds would not be entirely contributed to BVDV infection (Heuer et al., 2007;
Reichel et al., 2008). Compared to those studies, our results would be more conservative
112
estimates as we considered the direct impact of BVDV infection on the production of each
individual animal. However, it is worth noting that the estimated total losses in this study
did not incorporate other indirect impacts, such as increased susceptibility to other diseases
among infected animals.
To the best of our knowledge, no studies have been conducted to estimate the direct
losses due to a BVDV outbreak on New Zealand beef farms. This is mainly due to the
logistic challenges of handling extensively grazed herds, which makes it difficult to
monitor production (e.g. live weight gain per day) and the infection status of individual
animals on a regular basis (Han, Weir, et al., 2018). Therefore, we used a disease simulation
approach to estimate the economic impact of BVDV outbreak on New Zealand beef farms
assuming BVDV infection would affect the live-weight gain per day of infected animals.
However, the estimated loss based on BVDV simulation models highly depends on the
modelling assumptions, such as demographic structure or parameter values (Damman et
al., 2015). For example, Gunn et al., (2004) measured the annual economic loss due to
BVDV outbreak in Scottish beef herds as NZ$ 129.96 per cow (adjusting for inflation rate
from the year of original publication), however, this figure was calculated by counting the
number of TI or PI animals generated while ignoring the BVDV status of other animals (i.e.
whether they were susceptible, immune, or recovered). A more recent study modelled the
decrease of production due to BVDV outbreak in French beef herds (Damman et al., 2015).
This study revealed that the production loss was the highest after one year of BVDV
introduction, due to the increased number of abortions. Although a high number of
abortions was also observed in the second year of our beef model (data not shown), the
economic loss in our study was highest at year 3, when the increased number of abortions
in year 1 and 2 resulted in a decreased number of fattening stocks able to be sold. Other
factors, such as the culling age or price of fattening cattle, should also be noted when
interpreting the direct losses of BVDV outbreak based on modelling studies.

113
The simulation models also provided valuable information on the anticipated
benefit/cost ratios for different combinations of BVDV control options in dairy and beef
farms. For the dairy farm, the annual testing of replacement breeding calves to find and
eliminate PI animals showed the best benefit/cost ratio to control BVDV. Similar results
haves been reported in another study (Weir et al., 2014), and, indeed, testing and culling of
PI animals as early as possible has been suggested as one of the most effective ways to
rapidly eliminate BVDV within a farm (Houe et al., 2006). However, the testing and culling
of PI breeding calves alone did not result in the highest benefits, which was likely because
there was still significant risk of BVDV introductions onto the farm via contacts with
infected stock on neighbouring farms or at off-site grazing locations for heifers. Therefore,
implementing the annual testing of breeding calves with improving farm biosecurity
through control measures, such as double fencing or movement restrictions, would be the
most cost-efficient strategy for New Zealand dairy farms to control BVDV. Furthermore,
improving farm biosecurity is likely to have positive benefits in reducing the between-farm
transmission of other pathogens besides BVDV.
For the beef farm, the highest benefit/cost ratio was observed when a vaccination
programme that involved administering only two doses before the first mating with annual
boosting was implemented. However, this was due to the relatively low cost of control and
it only resulted in a limited amount of benefit. Interestingly, additional control measures,
such as annual testing or screening were not found to provide significant returns on
investment for New Zealand beef farmers. This was because the annual testing or screening
in this study was scheduled at the time of weaning. By the time PI calves were identified
and culled, susceptible animals in the breeding herd had been exposed to those PI calves
during the time window with the greatest risk of reproductive losses and generating PI
calves. However, it is highly likely for most of beef farmers being reluctant to yard cows
with calves at-foot prior to weaning due to the risk of injury to calves. Also, control
measures, such as double fencing all farm boundaries, may not be logistically feasible for
114
all New Zealand beef farmers given the extensive farming conditions (Gates, Evans, et al.,
2019). Therefore, we argue that vaccinating breeding stock for three doses before their first
mating and maintaining immunity with annual boosters is likely to be a more economically
beneficial and logistically feasible approach to control BVDV on New Zealand beef farms,
even though it is still important to identify and remove PI animals from the herd and to
prevent local transmission from neighbouring farms.
The model results also highlighted several strategies that were unlikely to be cost-
effective for the typical New Zealand dairy and beef farms. A previous unpublished
modelling study estimated the cost-benefit of different BVDV control options in New
Zealand dairy farms and found that implementing almost any option would be
economically beneficial for BVDV infected farms compared to doing nothing (Weir et al.,
2014). The discrepancy between the previous and our current study was likely due to
different model assumptions, such as the initial BVDV status of modelled animals (e.g.
totally naïve or partially immune), type of animals that initially introduced BVDV (e.g.
Trojan cows, PI cows, or calves), or conditions of BVDV introduction (e.g. endemic only,
BVDV incursion only, or BVDV incursion under endemic condition). Therefore, one
should consider the general context of BVDV introduction/infection when comparing the
cost-benefit of different BVDV control options. Double fencing alone, for example,
generated only a limited amount of benefit, however, we argue that this was due to the
study design of forcing the PI animals to be initially present on the farm. Under
circumstances where BVDV introduction via animal purchases was well-controlled and PI
animals on neighbouring farms were the only source of transmission, double fencing alone
could be one of the most cost-effective options to control BVDV (Reichel et al., 2008).
Our results showed that most BVDV control strategies involving annual screening tests
were not economically beneficial for both dairy and beef farms. It suggests that a BVDV
screening test based on BTM or blood samples from young heifers to detect either the virus
or BVDV Ag would have poor performance to capture a recent BVDV outbreak on New

115
Zealand cattle farms. However, we evaluated the cost-efficiency of those strategies under
the circumstance that BVDV outbreak occurred in a naïve farm due to the introduction of
PI animals via Trojan cows. According to a recent study that analysed the laboratory
submission data for testing BVDV in New Zealand, less than 12% of cattle farms showed
the active circulation of the virus while more than 50% showed the evidence of recent
exposure to BVDV (Gates, Han, et al., 2019). Therefore, the cost-efficiency of annual
screening tests, especially at a national level, would likely be different given its low control
cost and the majority of farms showing the lack of active circulation of BVDV with
possibly high level of herd immunity. Currently, research work is in progress to estimate
the benefit-cost ratios of different BVDV control strategies on a national scale.
There are several potential limitations in the model structure and assumptions that may
have influenced the accuracy of our estimates. As with other modelling studies, our results
were significantly affected by some model parameter values in the sensitivity analysis (see
Section 4 of Appendix 3). For instance, several studies, including ours, have demonstrated
that the mortality rate of PI animals had a significant impact on BVDV simulation results
(Damman et al., 2015; Ezanno et al., 2007), and, interestingly, an observational report
suggested that PI animals in New Zealand may survive longer than in other countries
(Voges et al., 2006). Although we calibrated model parameters to be specific to the New
Zealand cattle industries, we acknowledge that our results may not perfectly reflect the
reality and rely heavily on model assumptions, such as the number of introduced Trojan
cows, and within-herd BVDV transmission rate by a PI animal, as well as the values of
some economic parameters, including reduced milk solid production in PI cows, and
reduced live-weight gain per day in TI and PI animals. Nevertheless, we developed our
model in such a way that any modelling settings (e.g. parameter values or management
dates) can be flexibly modified for future applications. Another limitation was that we only
considered a single BVDV control strategy being continually implemented during the 5-
year simulation period. In reality, however, a farmer’s biosecurity decisions can be

116
motivated by different factors, such as a farmer’s knowledge about the disease, market-
driven economic premiums or social and cultural significance (Garforth et al., 2013;
Kristensen & Jakobsen, 2011; McAloon et al., 2017), which would affect their continual
uptake of control strategies (e.g. shifting between different strategies or intermittent
implementation of strategies). In future research, the efficiency of different control
strategies could be investigated while considering other internal/external factors that would
affect farmers’ implementation of BVDV control measures.
5.6. Conclusion
Given that the economic impacts of BVDV outbreaks in naïve cattle herds in New
Zealand have been estimated at NZ$ 22.22 per MA per year on dairy farms and NZ$ 41.19
per MA per year on beef farms, it is likely that the economic impacts of BVDV at the
national level would be significant with the current high prevalence of BVDV infected
cattle farms. The models suggest that BVDV control strategies involving the annual testing
of breeding calves on dairy farms and the vaccination of heifers with annual boosters on
beef farms are the most cost-effective control strategies at the farm-level although we
acknowledge that farmers should still collaborate with veterinarians to determine the
optimal strategy for their unique farm circumstances. Considering the importance of
economic incentives for farmers to implement BVDV control, we believe that the findings
of this study may facilitate the uptake of BVDV control measures among New Zealand
cattle farmers by showing an economic benefit to BVDV control.

117
Acknowledgements
We are grateful to New Zealand beef farmers, veterinarians, and laboratory technicians
who participated in the “BVD Free New Zealand” project. We also extend gratitude to
anonymous reviewers for their comments.

118

119
Chapter 6
Modelling the cost-effectiveness of bovine viral diarrhoea virus
elimination in New Zealand
Jun-Hee Han1, Jenny F. Weston2, Cord Heuer1, M. Carolyn Gates1
1 EpiCentre, School of Veterinary Science, Massey University, Private Bag 11-222,
Palmerston North, New Zealand
2 School of Veterinary Science, Massey University, Private Bag 11-222, Palmerston North,
New Zealand
6.1. Abstract
Bovine viral diarrhoea virus (BVDV) is a widespread and economically important
disease for most cattle producing countries worldwide. Several European countries have
already implemented successful compulsory regional or national BVDV elimination
programmes, which have led to complete elimination or significant reduction in disease
prevalence. BVDV is currently under voluntary control in New Zealand and there is
growing interest in evaluating whether national BVDV elimination would be cost-effective
for the predominantly extensive pastoral production system. In this study, a stochastic
individual-based metapopulation model was developed to simulate BVDV transmission
within and between cattle herds and to explore the cost-effectiveness of different potential
national BVDV elimination programmes. The model results suggest that BVDV
transmission in New Zealand is maintained in an endemic state primarily through local
spread between cattle herds grazed in adjacent pastures with direct farm-to-farm cattle
movements contributing less to transmission events. The most cost-effective national
BVDV elimination programmes involved (1) double fencing of shared boundaries for dairy
farms accompanied by either annual testing and culling of persistently infected (PI) female

120
breeding calves or annual herd-level screening tests followed by a PI hunt, and (2) annual
vaccination of breeding animals for beef breeding farms. The estimated benefit/cost ratio
of the national BVDV elimination programmes ranged from 1.04 to 1.99 with the median
time until reaching the break-even point ranging from 7 to 11 years depending on the
programme, which highlights that BVDV elimination is both technically feasible and cost-
effective for New Zealand pastoral production systems.
6.2. Introduction
Similar to many cattle producing countries worldwide, bovine viral diarrhoea virus
(BVDV) is a widespread and economically important endemic disease in the New Zealand
cattle industries (Anonymous, 2020). According to a recent analysis of BVDV diagnostic
laboratory accession data, more than half of approximately 12,000 New Zealand dairy
herds had high bulk tank milk (BTM) antibody levels indicating recent exposure to BVDV
whilst approximately 7% also identified as RT-PCR positive implying active circulation of
the virus within the milking herd (Gates, Han, et al., 2019). In the beef industry, several
field studies have estimated that 40 to 60% of approximately 9,200 commercial farms have
evidence of recent BVDV exposure with 22% likely containing persistently infected (PI)
animals that actively shed BVDV throughout their lives (W. Cuttance & Cuttance, 2014;
Gates, Han, et al., 2019; Han, Holter, et al., 2018). Given the high prevalence of exposed
and actively infected farms, it is believed that BVDV causes significant economic impacts
for the New Zealand cattle industries (Han, Weir, et al., 2018). Consequently, there has
been growing interest in understanding whether implementing a national BVDV
elimination programme could result in similar financial benefits to those observed in
European countries with compulsory programmes.
The cornerstone of any national BVDV elimination programme is to remove PI animals
from the cattle population through testing and culling in positive herds as well as enhancing

121
farm biosecurity to prevent the introduction/reintroduction of BVDV in negative herds
(Lindberg et al., 2006). There are many different frameworks that can be used to achieve
these goals based on the unique epidemiological, economic, and social circumstances
present in each country. In Germany, for example, all calves must be tested for BVDV
antigen (Ag) within 6 months of age to identify and remove any PI calves and farmers may
also voluntarily choose to vaccinate their cattle against BVDV to protect against the
formation of new PI calves (Moennig & Becher, 2018). Scotland, in contrast, uses annual
herd-level screening of BVDV antibody (Ab) in serum samples of youngstock to identify
herds with evidence of recent exposure and then performs a follow-up test of individual
animals in positive herds to identify and remove PI animals. (Moennig & Becher, 2018).
Regardless of the programme design, it is well-established that it is difficult to achieve
meaningful reductions in BVDV prevalence without a high level of farmer compliance with
disease control recommendations (Wernike et al., 2017). Therefore, a shift from the current
ad hoc voluntary scheme to a compulsory systematic approach is necessary in order to
eliminate BVDV in New Zealand.
It has been reported that the uptake of BVDV control measures in New Zealand is
relatively low under the current voluntary scheme (Stewart, 2013). For example, a recent
study suggested that only 1,600 beef farms in New Zealand are conducting annual
screening tests for BVDV Ab (Gates, Han, et al., 2019). Although almost 75% of dairy
farms are currently using breeding bulls that are either BVDV vaccinated or certified as
BVDV free (Han, Holter, et al., 2018) and nearly 65% are currently conducting annual
screening test of BVDV Ab using BTM (Gates, Han, et al., 2019), it is unknown what
proportion of herds are taking additional measures to eliminate existing PI animals and
prevent the formation of new PI calves. Possible barriers to control include farmers’ poor
awareness of BVDV, the logistical challenges of conducting sampling in beef herds, the
low perceived impact of BVDV, and the high perceived cost of BVDV control (Gates,
Evans, et al., 2019). Therefore, there is a recognised need to have a better estimation on the

122
cost-efficiency of national BVDV elimination in order to convince farmers and
stakeholders of the value of BVDV elimination.
Disease simulation modelling is a common tool for exploring the transmission dynamics
of BVDV in cattle populations (Damman et al., 2015; Viet et al., 2004) and for evaluating
the cost-effectiveness of BVDV control programmes to provide decision-makers with
guidance about the feasibility of BVDV elimination (Gethmann et al., 2019; Sekiguchi et
al., 2018; Thulke et al., 2018). For instance, a recent simulation study suggested that a
control programme based on Ag testing of all new born calves to identify and cull PI
animals would reduce national BVDV prevalence to 0.01% with acceptable benefit/cost
ratio in Germany (Gethmann et al., 2019). However, it is difficult to adopt the findings
from models developed for one country to others with different farming systems because
different demographic structures and contact patterns within cattle populations can
significantly influence model results.
Although BVDV has been prevalent in New Zealand with its substantial economic
impacts (Han, Weir, et al., 2018), there have been no published studies to simulate the
transmission of BVDV or to evaluate the cost-effectiveness of national BVDV elimination
programmes under a unique extensive pastoral cattle production system of New Zealand.
With the aid of our recent studies about BVDV infection or transmission on New Zealand
beef farms (Gates, Evans, et al., 2019; Han et al., 2019; Han, Holter, et al., 2018), we
therefore aimed in this study (1) to develop a stochastic individual-based simulation model
to explore the transmission dynamics of BVDV in the New Zealand cattle industries, and
(2) to evaluate the cost-effectiveness of different approaches for national BVDV
elimination.

123
6.3. Material and methods
To simulate the transmission dynamics of BVDV in the New Zealand cattle industries,
we developed a stochastic individual-based metapopulation model with components to
describe (1) the transition of individual animals between demographic and disease status
within each farm (or subpopulation), (2) the spread of BVDV between farms through cattle
movements and local spread from adjacent farms, and (3) the efficiency of different
potential national BVDV elimination programmes. As there is currently no national
database that provides complete information about the cattle population in New Zealand,
we inferred the demographic structure of the New Zealand cattle industry (e.g. numbers of
cattle farms and their location, herd size of each cattle farm, calving and mating dates of
each cattle farm, and animal movements between those farms) by using available data in
the National Animal Identification and Tracing (NAIT) system data. The model was
developed using the C programming language, and the model was operated in a discrete
time step of one week with a year consisted of 52 weeks (e.g. week 1: first week of January,
week 52: last week of December).
6.3.1. Data processing
An extract of data from the NAIT system containing all known records from 01 January
2014 through 31 December 2016 was used to inform the demographic structure of cattle
farms in New Zealand for the simulation model. The NAIT system has been in operation
since 2012 with legislation requiring that all cattle owners or managers in New Zealand
record the movements of individual cattle between different premises on the NAIT system
within 48 hours of the movement occurring. Along with demographic details about the
individual animals (e.g. animal ID, sex, date of birth), the owners or managers are also
required to record other information about the movements including the premise ID,
movement date, geo-coordinates of premises (as a point location), location type of the
source and destination premises (e.g. farm, sale-yard, abattoir), and the farm type of the
source and destination farms (e.g. dairy or beef farm). However, there are known issues
124
with the completeness and quality of these data due to the low level of compliance of New
Zealand farmers (Edge & Kavalali, 2018; Jewell et al., 2016). Furthermore, there are
currently no data fields to capture the total number of cattle on each farm, the size or
boundary of farms, farm management information (e.g. planned start date of mating and
calving), whether a farm is a commercial or hobby farm, the detailed production type of
beef farms (e.g. beef breeding, beef fattening, bull breeding), and the purpose for the cattle
movements (e.g. trade, show, bulls leased for breeding, heifer agistment).
To inform the demographic components of the simulation model, we therefore had to
make inferences from the available data to (1) estimate the total number of active cattle
farms in New Zealand, (2) allocate a herd size and planned start date of mating to each
dairy and beef breeding farm, and (3) assign a point location to each farm to identify those
that are likely adjacent to each other and therefore at risk of BVDV transmission through
local spread. We also used the historical data on individual between-farm cattle movements
to model BVDV spread in New Zealand through animal movements. Figure 6.1 provides a
general overview of the data processing steps.
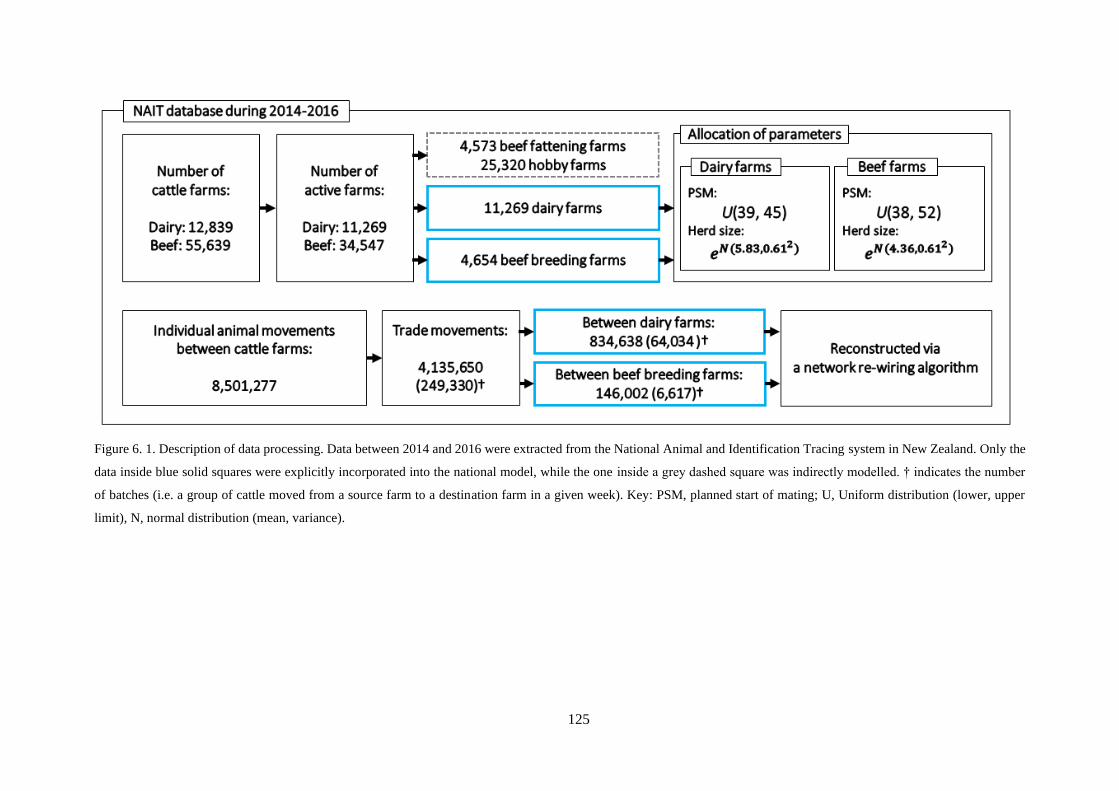
125
Figure 6. 1. Description of data processing. Data between 2014 and 2016 were extracted from the National Animal and Identification Tracing system in New Zealand. Only the
data inside blue solid squares were explicitly incorporated into the national model, while the one inside a grey dashed square was indirectly modelled. † indicates the number
of batches (i.e. a group of cattle moved from a source farm to a destination farm in a given week). Key: PSM, planned start of mating; U, Uniform distribution (lower, upper
limit), N, normal distribution (mean, variance).
126
6.3.1.1. Number of cattle farms
The primary farms of interest for modelling the epidemiology and economics of BVDV
are active commercial cattle farms with pregnant animals capable of generating new PI
calves. Although farms that maintain only dry stock for grazing or fattening (including non-
commercial or “hobby” farms) can also spread BVDV to neighbouring farms through
fence-line contacts or other mechanisms of local transmission such as shared facilities and
equipment (Niskanen & Lindberg, 2003), new PI animals cannot be generated on those
farms, so the infections tend to be self-limiting. Therefore, the cattle farms that explicitly
modelled in this study were dairy and beef breeding farms due to the presence of pregnant
animals.
Some registered locations in the NAIT system only hold cattle temporarily and therefore
have no current animals on the premises. However, the NAIT database does not contain a
specific field to indicate whether a location is actively farming or grazing cattle. We
therefore made the simplifying assumption that cattle farms were active if at least one
animal was sent from the location to an abattoir from 01 January 2014 to 31 December
2016. This resulted in an estimate of 11,269 active dairy farms and 34,547 active beef farms.
All dairy farms were assumed to be commercial since the estimate was close to the number
of dairy farms in New Zealand reported by other sources (Jewell et al., 2016; Van Andel et
al., 2018).
Currently, it is believed that there are approximately 9,200 commercial beef farms, with
nearly half of them being beef breeding farms and the rest being beef fattening farms (pers.
comm. Rob Davison). We therefore identified the commercial beef farms from 34,547
active beef farms on the NAIT database based on the number of cattle slaughtered (i.e. sent
to abattoirs). We first assumed that commercial beef farms were those with (1) at least one
animal slaughtered per year, and (2) more than x number of animals slaughtered between
2014 and 2016. We then adjusted the value of x until the number of identified commercial
beef farms was approximately 9,200. Following these assumptions, 9,227 farms (26.7%)

127
were categorised as commercial beef farms and they each sent > 75 animals to abattoirs
during 2014-2016. The remaining beef farms (25,320; 73.3%) were categorised as hobby
farms. For the rest of this article, dairy and beef farms indicate commercial dairy and beef
farms, respectively. To further categorise beef farms into breeding or fattening farms, we
explored the patterns of movements onto these farms during 2014-2016. In the New
Zealand cattle industries, it is common for beef fattening farms to purchase male dairy
calves and surplus female dairy calves to raise for slaughter, whereas it would be relatively
uncommon for beef breeding operations to purchase these cattle. Therefore, we categorised
the farm as a beef fattening farm if any animals from dairy farms were moved to the beef
farm during 2014-2016. Based on this assumption, 4,654 beef farms (50.4%) were
categorised as beef breeding farms and 4,573 farms (49.6%) were categorised as beef
fattening farms. The number of categorised beef breeding farms was well-matched to
industry estimates of the number of commercial beef breeding farms.
Rather than explicitly modelling the animals on beef fattening and hobby farms, the
impact of those farms on national BVDV transmission was indirectly incorporated into the
model by assuming that all fattening and dry stock on those farms contributed to the
background prevalence of PI animals in New Zealand, and therefore, contributed to the risk
of BVDV transmission through local spread on dairy or beef breeding farms or at off-site
grazing locations (i.e. distant premises where dairy replacement heifers are sent for grazing
and breeding). Details about how animals on beef fattening or hobby farms were modelled
is provided in Appendix 4 (see Section 1).
6.3.1.2. Herd size
To allocate a realistic herd size to each dairy and beef breeding farm in the study, we
assumed that the distribution of number of mixed-age cows (MA) in New Zealand dairy
and beef farms followed the exponential distribution of a random variable that normally
distributed (i.e. 𝑒𝑁(𝜇𝐷,𝜎2) and 𝑒𝑁(𝜇𝐵,𝜎2) , respectively), where N(·,·) was the normal
distribution of random variable, 𝜇𝐷 and 𝜇𝐵 were the mean of the normal distribution for
128
dairy and beef farms, respectively, and σ was the standard deviation of the normal
distribution. We inferred the value of 𝜇𝐷 , 𝜇𝐵, and σ as 5.83, 5.02, and 0.61, respectively,
by fitting the simulated MA herd sizes to the reported distribution of MA herd size in the
dairy industry (Anonymous, 2018a) and to the reported total number of MAs in the beef
industry (Anonymous, 2018c) using an approximate Bayesian computation-sequential
Monte Carlo method (Ellen Brooks-Pollock et al., 2014; Toni et al., 2009). Using the
inferred distributions, we generated 11,269 random MA herd size numbers for the dairy
farms and 4,654 random MA herd size numbers for the beef farms, and then sorted each
list in descending order from largest to smallest. Next, we ranked the dairy and beef farms
from largest to smallest based on the number of cattle sent to abattoirs from 2014 to 2016,
and then matched them to the MA herd size with the same rank (e.g. assigning the largest
MA herd size to the farm with the largest number of animals sent to abattoirs). This was
based on the assumption that the number of animals sent to abattoirs from each farm was a
proxy for the total cattle population on the farm. We further assumed that the allocated MA
herd size for each dairy and beef breeding farm was constant during the simulation period.
Detailed information about the process for inferring herd size distributions is provided in
Appendix 4 (see Section 2).
6.3.1.3. Planned start of mating
To allocate the planned start of mating (PSM) to dairy and beef breeding farms, we first
generated the distribution of week of conception for all New Zealand dairy and beef cattle
by (1) extracting the birth week of all individual dairy and beef cattle, respectively, via
available NAIT data, and (2) calculating back 40 weeks from the reported birth week.
Given the mostly seasonal nature of the New Zealand cattle farming industries,
approximately 95% of the conceptions occurred from late September to early January
(week 39 ~ week 2) for dairy cattle and from mid-September to late February (week 38 ~
week 9) for beef cattle. We assumed conception mostly occurred during the first 9 weeks
of the mating period for both dairy and beef cows, so the PSM should start at least 9 weeks

129
before the end of the period for most conceptions to occur. Based on this assumption, the
PSM was randomly chosen between week 39 and week 45 (reversing 9 weeks from week
2) for a dairy farm and between week 38 and week 52 (reversing 9 weeks from week 9) for
a beef breeding farm.
6.3.1.4. Adjacent farms
To identify farms that were at risk of BVDV transmission through local spread, we
needed to calculate the Euclidean distance between farm locations. Among the active cattle
farms, 1,452 (12.9%) of 11,269 dairy farms, 572 (12.3%) of 4,654 beef breeding farms,
609 (13.3%) of 4,573 beef fattening farms, and 2,785 (11.0%) of 25,320 hobby farms did
not have a recorded point location in the NAIT system. Rather than exclude them from the
analysis, we randomly allocated coordinates for these farms based on the overall spatial
distribution of cattle farms with respective production type in New Zealand. The spatial
distribution of dairy and beef breeding farms in New Zealand is illustrated in Figure 6.2.
Once all cattle farms had a unique point location, we defined two farms as being adjacent
if the Euclidean distance between point locations was ≤ 3.0 km, where the distance of 3.0
km was calibrated to meet the simulated prevalence of BVDV positive farms to the reported
prevalence (see Section 2 in Appendix 4).

130
Figure 6. 2. Distribution of cattle farms in New Zealand (left) and the Canterbury region (right). Left &
Right: Red and blue dots indicate dairy and beef farms, respectively, with the size of dot was
proportional to the mixed-age cow herd size for each farm. Right: Grey lines in the Canterbury region
indicate aggregated animal movements via trade during 2014-2016 (direction was ignored for the
simplicity of illustration).
6.3.1.5. Cattle movements
Given that cattle movements for temporary grazing are often unrecorded in the NAIT
system (Edge & Kavalali, 2018), we focused only on the movement of cattle for trade
purposes. However, the impact of off-site grazing movements on BVDV transmission was
implicitly incorporated into the model (see “6.3.2.3. BVDV transmission within a farm”
and “6.3.2.4. BVDV transmission between farms” sections). Winter grazing (i.e. when
dried-off, pregnant dairy cows are temporarily grazed on a distant location for several
weeks during winter) was ignored because any pregnant cattle would be outside the
gestational risk period for generating PI animals even if they were exposed to BVDV at the
distant location.

131
To identify the trade movements, we first extracted all individual cattle movements
between any cattle farms where the source and destination farms had a different premise
ID. If an individual animal returned to the source farm in a subsequent movement, both
movements were classified as non-trade movements and discarded. Next, we aggregated
the individual cattle movements into weekly batch level movements (i.e. a group of cattle
moved from a source farm to a destination farm in a given week), and further discarded
any batches where the total number of cattle moved from a source farm to a destination
farm during May and June was > 50. This was done to avoid including any possible
migration movements of “sharemilkers” (farmers who own only the cattle and lease land
for grazing, therefore they move between farm-premises periodically – generally around
June 1st). Finally, we extracted only the movements between dairy farms and beef breeding
farms since these movements potentially involved the movement of breeding animals. We
ignored any movements between farms where pregnant animals cannot exist.
According to the NAIT database during 2014-2016, there were 834,638 individual cattle
movements (in 64,034 batches) between dairy farms, 146,002 individual cattle movements
(in 6,617 batches) between beef breeding farms, and 28,509 individual cattle movements
(in 2,517 batches) from beef breeding to dairy farms. From these movements, we discarded
those that occurred from beef breeding to dairy farms since these were most likely beef
breeding bulls that were hired only for the mating period, and a high proportion of breeding
bulls are BVDV tested and vaccinated (Han, Holter, et al., 2018). We then used the
information about the number of farms that moved cattle and the number of cattle moved
between farms with the same production type over the 3 years (156 weeks in total) for the
network re-wiring algorithm to reconstruct the cattle movements in the national model (see
Section 2 in Appendix 4).
132
6.3.2. National model
6.3.2.1. Demographics of cattle within a farm
Most cattle farms in New Zealand are seasonal calving herds. The planned start of
calving (PSC) is generally between mid-July and early August for dairy farms and between
August and November for beef breeding farms. Calving season lasts for approximately 9
to 12 weeks for dairy farms, while ≤ 9 weeks is common for beef farms. Off-site grazing
is relatively common practice only for dairy farms.
We used the within-farm models that were developed in Chapter 5 with some modified
parameter values due to the difference in time units (day vs. week). For a dairy farm, all
cattle were divided into 4 management groups in the within-farm model: calves (C: from
birth to until 1 week old), young replacement heifer (YH: from 1 week old to off-site
grazing), breeding replacement heifers (BH: heifers at the off-site grazing location), and
mixed-aged cows (MA). We assumed that a number of female calves that equivalent to
approximately 20.0% of allocated MA herd size was retained as YHs, and the rest of female
calves and all male calves were either culled (i.e. bobby calves) or sold to beef fattening
farms or hobby farms (see Section 1 in Appendix 4). The duration of off-site grazing was
assumed to be 52 weeks, and the week for YHs (or BHs) to be sent for (or returned from)
off-site grazing was randomly chosen between weeks 18 and week 22 (between late April
and late May) for each dairy farm. For simplicity of modelling, we also assumed that the
dry period for MAs on each dairy farm started at the same week when BHs were returned
from off-site grazing. For the within-farm model of beef breeding farms, we divided the
beef population into 7 management groups: fattening heifers (FH) and steers (FS) for
fattening, young replacement heifers (YH: heifers in this herd are bred for the first time),
breeding replacement heifers (BH: heifers in this herd calve for the first time and are bred
for the second time) and their calves (CH), and mixed-age cows (MA) and their calves
(CM). We assumed that most of the transitions between beef management groups occurred
on the week of weaning (31 weeks after the PSC), however, all BHs joined the MA herd

133
three weeks before the week of weaning and pregnancy scanning was performed one week
before the week of weaning. Breeding bulls were not considered in the simulation models
for both dairy and beef farms since most of them are tested for, and vaccinated against,
BVDV (Han, Holter, et al., 2018). Parameter values for the national model are provided in
Table 6.1. More detailed information about the demographic structure and events of within-
farm models is provided in Appendix 4 (see Section 2) and Chapter 5. Description of
demographic events in both dairy and beef farms in the national model is provided in Figure
6.3.
Figure 6. 3. Illustration of demographic events in the New Zealand dairy and beef industries. SD, start
of dry-off period; OG, week to move from/to off-site grazing location; PSC, planned start of calving;
PSM, planned start of mating; Testing and culling, annual testing and culling of female breeding calves;
Screening test, annual screening of bulk tank milk (dairy) or serum samples of 15 young heifers (beef)
followed by a PI hunt; VX 1st, 2nd, and 3rd, the first, second, and third BVDV vaccination, respectively;
AB, annual boosting of BVDV vaccination.

134
Table 6. 1. Description of parameter values used in the national BVDV simulation model.
Parameters Value (unit) Reference
Demographic component
Natural abortion 0.001 (/week) Hickson et al., (2012; Weston et al., (2012)
Natural mortality by weaning;
Dairy calves
Heifer-born beef calves
Cow-born beef calves
0.010 (/week)
0.006 (/week)
0.002 (/week)
E. Cuttance et al., (2017); Hickson et al., (2012); C. A. Morris et al., (1986)
Start of puberty 54 (weeks old) Hickson et al., (2012); McNaughton et al., (2002)
Length of oestrus cycle 3 (weeks) Hickson et al., (2012); Olds & Seath, (1953)
Probability of oestrus detection (dairy only) 0.786 Anonymous, (2018a)
Probability of conception;
By artificial insemination (dairy only)
By natural mating with bulls
0.72
D: 0.50 / B: 0.72
Anonymous, (2018a); Geenty & Morris, (2017)
Disease component
Transmission rates of;
Within-herd by a PI animal (𝛽𝑃)
Within-herd by a TI animal (𝛽𝑇)
Between-herd by a PI animal (𝛽𝐵)
Between-farm by a PI animal (𝛽𝐹)
D: 0.50 / B: 0.11
𝛽𝑃 × 0.05
𝛽𝑃 × [0.10, 0.20, 0.40] *
𝛽𝑃 × [0.10, 0.20, 0.40] *
Han et al., (2019); Smith et al., (2014); Viet et al., (2004)
Euclidean distance for adjacent farms (d) [2.0, 3.0, 4.0] *(km)
Duration of passive immunity via maternal antibody N(22, 4) Han et al., (2019)
Duration of recovery of TI animals U(1, 3) Liebler-Tenorio et al., (2004); Müller-Doblies et al., (2004); T. Sandvik et al., (1997)
Mortality of PI animals 0.013 (/week) Ezanno et al., (2007)
Reduced conception of TI and PI animals 0.68 McGowan et al., (1993); Whitmore et al., (1981)
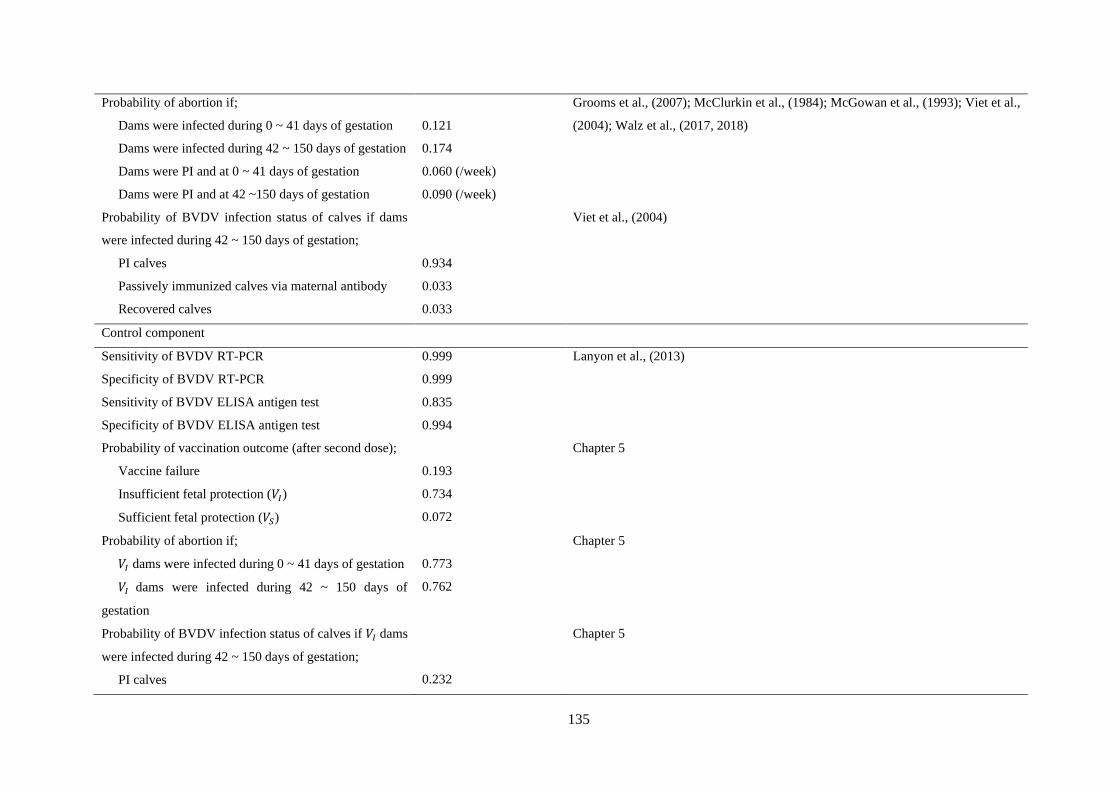
135
Probability of abortion if;
Dams were infected during 0 ~ 41 days of gestation
Dams were infected during 42 ~ 150 days of gestation
Dams were PI and at 0 ~ 41 days of gestation
Dams were PI and at 42 ~150 days of gestation
0.121
0.174
0.060 (/week)
0.090 (/week)
Grooms et al., (2007); McClurkin et al., (1984); McGowan et al., (1993); Viet et al.,
(2004); Walz et al., (2017, 2018)
Probability of BVDV infection status of calves if dams
were infected during 42 ~ 150 days of gestation;
PI calves
Passively immunized calves via maternal antibody
Recovered calves
0.934
0.033
0.033
Viet et al., (2004)
Control component
Sensitivity of BVDV RT-PCR
Specificity of BVDV RT-PCR
Sensitivity of BVDV ELISA antigen test
Specificity of BVDV ELISA antigen test
0.999
0.999
0.835
0.994
Lanyon et al., (2013)
Probability of vaccination outcome (after second dose);
Vaccine failure
Insufficient fetal protection (𝑉𝐼)
Sufficient fetal protection (𝑉𝑆)
0.193
0.734
0.072
Chapter 5
Probability of abortion if;
𝑉𝐼 dams were infected during 0 ~ 41 days of gestation
𝑉𝐼 dams were infected during 42 ~ 150 days of
gestation
0.773
0.762
Chapter 5
Probability of BVDV infection status of calves if 𝑉𝐼 dams
were infected during 42 ~ 150 days of gestation;
PI calves
0.232
Chapter 5

136
Passively immunised calves via maternal antibody
Recovered calves
0.559
0.209
* Values in square bracket were tested for the parameter calibration. Bold italic values were the calibrated parameter values that used for the national model.
Key: PI, Persistently infected; TI, Transiently infected; N, Normal distribution; U, Uniform distribution; D, Dairy; B, Beef.
137
6.3.2.2. Movement reconstruction
When we incorporated the real movement data directly into the model to add or remove
individual cattle from a herd, the size of the cattle populations on some farms often either
increased or decreased substantially over time. To address this problem, we used a network
re-wiring algorithm that connected pairs of farms that moved cattle in any given week based
on the procedure described below.
For a given week, the same number of dairy (or beef breeding) source and destination
farms were selected in a random order. The number of selected farms was chosen as the
larger number between the numbers of dairy (or beef breeding) source and destination
farms in the relevant week. For the first source farm, the probability of trading with each
destination farm was calculated based on a multivariable logistic regression model that
considered the distance, herd size, and tuberculosis movement restriction status (see
Section 2 in Appendix 4); we then assumed that animals were sold to the destination farm
with the highest probability. Once those two farms were connected, the algorithm moved
on to the next source farm, calculated the probability of trading with each of the remaining
destination farms, and connected it to the farm with the highest probability. The re-wiring
process for a given week was finished once there were no remaining farms to either sell or
purchase cattle.
Once the farms trading cattle were paired in each week, animals from a source farm
were randomly selected and moved to a destination farm regardless of their BVDV
infection status. However, we assumed that calves from both dairy and beef breeding farms
and BHs from dairy farms were not eligible for trade due to their age and off-site grazing,
respectively. The probability of an individual animal being selected for trade from a source
farm was assumed to be the same for every animal (except those that were not eligible)
from all the source farms in a given week, and varied between weeks to match the total
number of animals traded in a given week in the simulation to the number of cattle traded
per week in a relevant week from NAIT data.
138
6.3.2.3. BVDV transmission within a farm
To simulate BVDV transmission on each farm, we categorised the BVDV infection
status of individual animals into the following five mutually exclusive disease status:
passively immunized via ingestion of maternal antibodies through colostrum (M),
susceptible (S), transiently infected (TI), persistently infected (PI), or recovered (R). In the
simulation, the probability of BVDV infection for each susceptible animal was determined
by the numbers of PI and TI animals within the same management group, PI animals in
different groups on the same farm, PI animals on adjacent farms, and the background
prevalence of PI animals. The probability of a susceptible individual in a group i being
infected on a given week (𝑃𝑖𝑛𝑓) was;
𝑃𝑖𝑛𝑓 = 1 − 𝑒−(𝜆𝑖𝑤+𝜆𝑖
𝑏)
𝜆𝑖𝑤 = 𝛽𝑃
𝑃𝐼𝑖
𝑁𝑖+ 𝛽𝑇
𝑇𝐼𝑖
𝑁𝑖+ 𝛽𝐵 ∑
𝑃𝐼𝑗
𝑁𝑖𝑁𝑗
𝑛
𝑗
, (𝑖 ≠ 𝑗)
where 𝜆𝑖𝑤 was the force of within-farm BVDV infection for an animal in group i, 𝛽𝑃
and 𝛽𝑇 were within-group transmission rates by a PI and TI animal, respectively, 𝛽𝐵 was a
between-group transmission rate by a PI animal, 𝑁𝑖, 𝑃𝐼𝑖, and 𝑇𝐼𝑖 were the group size, the
number of PI and TI animals in group i on a given week, respectively, and 𝑛 was the
number of groups in a farm. The value of 𝛽𝑃 for dairy and beef farms was 0.50 and 0.11,
respectively (Han et al., 2019; Viet et al., 2004), and we assumed that 𝛽𝑇 was 0.05 times
of 𝛽𝑃 . We calibrated the value of 𝛽𝐵 as 0.40 times of 𝛽𝑃 based on a sub-model that
simulated BVDV transmission within cattle farms in the Canterbury region (see Section 3
in Appendix 4). Since animals in the BH herd on dairy farms were grazed at an off-site
location, we assumed that any between-herd transmission to and from these animals could
not occur. Parameter values for BVDV transmission are provided in Table 6.1, and detailed
information about BVDV transmission is provided in Chapter 5.
139
6.3.2.4. BVDV transmission between farms
The contribution of cattle movements to between-farm BVDV transmission was
explicitly modelled by moving individual animals to another farm and updating the force
of infection on the destination farm at the following week according to the demographic
group and BVDV infection status of the animals that were moved. For local spread, we
assumed that any PI animals on adjacent dairy or beef breeding farms affect BVDV
infection of individuals on a given farm. The impact of BVDV transmission of beef
fattening or hobby farms to local spread was also incorporated by accounting for the total
number of those farms that adjacent to a given farm. For an individual animal in group i on
a given farm, the force of between-farm BVDV infection (𝜆𝑖𝑏) was calculated as:
𝜆𝑖𝑏 = 𝛽𝐹 ∑
ℙ𝑘
𝑁𝑖ℕ𝑘
𝑙
𝑘
+ 𝛽𝐹
𝑟𝜌𝐵
𝑁𝑖
where 𝛽𝐹 was a between-farm transmission rate by a PI animal, 𝑁𝑖 was the number of
animals in group i on a given week, l was the number of adjacent dairy and beef breeding
farms, ℕ𝑘 and ℙ𝑘 were the total number of cattle and PI animals on an adjacent dairy or
beef breeding farm k on a given week, respectively, 𝑟 was the total number of adjacent beef
fattening and hobby farms, and 𝜌𝐵 was the background prevalence of PI animals in New
Zealand on a given week. Off-site grazed dairy BH herds were assumed to be exposed to
𝜌𝐵 only (with r = 1), and we calibrated the value of 𝛽𝐹 as 0.20 times of 𝛽𝑃 based on the
result of sub-model for the Canterbury region. Details about the estimation of 𝛽𝐹 and 𝜌𝐵 is
provided in Appendix 4 (see Section 3).
6.3.2.5. Model initiation
We started the simulations of the national model by generating an initial population for
each farm. For a dairy farm, x number of pregnant MAs, y number of pregnant BHs, and y
number of YHs were generated at the beginning of the simulation where x and y were 100.0%
and 20.0% of allocated MA herd size, respectively. For a beef breeding farm, we initialised
140
the model with x number of pregnant MAs, y number of pregnant BHs, y number of YHs,
and z number of both CMs and CHs where x, y and z were 100.0%, 20.0% and 91.0% of
the allocated MA herd size, respectively. Those proportions of initial animals on each farm
was determined based on the national statistics for cattle populations in New Zealand
(Anonymous, 2018c).
Simulations started on week 1 of year 1, and the model was run for 5 years as a
demographic burn-in period to stabilise the population demography. We then introduced
BVDV to 796 randomly selected farms (5% of sum of dairy and beef breeding farms) by
converting one new born calf to a PI animal (dam of the calf was then converted to
recovered) for each farm. The model was then run for another 40 years (from year 6 to year
45) to allow BVDV to establish an equilibrium state across New Zealand reflective of the
current endemic situation on New Zealand cattle farms. Outputs from the last 15 years of
simulation were visually inspected to confirm the stability of the population demographics.
We also confirmed that the observed prevalence of BVDV positive farms (i.e. proportion
of cattle farms carrying at least one PI animal) matched estimates of the national disease
prevalence during the last 15 years (Gates, Han, et al., 2019). The overall modelling process
is illustrated as a flow chart in Appendix 4 (see Section 4).
6.3.3. National BVDV elimination programmes
In this study, we examined eight different national BVDV elimination programmes
(Table 6.2). Since we confirmed the equilibrium state of BVDV between year 31 and year
45, we implemented each programme continually from week 1 of year 31 onward and the
effect of the programme was monitored over the following 15 years which encompassed
the timeframe reported for the elimination of BVDV in European countries (Ståhl &
Alenius, 2012). Each possible programme was a combination of five different potential
control options: (1) movement restriction, (2) annual testing of female calves selected for
141
replacement heifers and culling of identified PI animals, (3) annual screening test using
bulk tank milk (for dairy farms) or serum samples of 15 YHs (for beef breeding farms),
followed by a PI hunt (i.e. identifying and culling of possible PI animals) of all breeding
female animals if the screening test was positive, (4) vaccination of breeding animals with
annual boosting, and (5) double fencing (Table 6.2).
6.3.3.1. Movement restriction
For the movement restriction option, female breeding animals were tested using a
BVDV Ag ELISA before departing the source farm, and only the negative animals were
moved to destination farms. We also restricted the movement of off-site grazing (both
sending and returning) by conducting BVDV Ag ELISA testing four weeks before the week
of off-site grazing and only allowing the movement of test negative heifers.
6.3.3.2. Annual testing and culling
The same Ag ELISA was used for the annual testing of female breeding calves, and the
test was conducted at 1 week old for dairy calves and at weaning for beef calves. When
animals were tested using the BVDV Ag ELISA (in both movement restriction and annual
test and cull of breeding calves), test positive animals were re-tested after 4 weeks (i.e.
follow-up test) using the same ELISA, and culled immediately if the result of the follow-
up test was positive. When the follow-up test was conducted, dams of the positive animals
were also tested using the BVDV Ag ELISA, and culled immediately if the result was
positive. Sensitivity and specificity of the BVDV Ag ELISA was assumed to be 83.5% and
99.4%, respectively (Lanyon et al., 2013).
6.3.3.3. Annual screening test
Given the endemic status of BVDV, the annual screening test was aimed at detecting
BVDV using RT-PCR on bulk tank milk (BTM) for dairy farms or BVDV Ag using the
ELISA on individual serum samples from 15 randomly chosen YHs for beef farms. If the
RT-PCR test of BTM (dairy farms) or the Ag ELISA of at least one serum sample (beef
142
breeding farms) was positive, a PI hunt was conducted after 4 weeks (dairy farms) or 3
weeks (beef breeding farms) from the initial screening test. The screening test was
conducted at the PSM for dairy farms and 3 weeks before the week of weaning for beef
breeding farms. We assumed the sensitivity and specificity of RT-PCR to detect BVDV on
BTM was perfect (Table 6.2) (Lanyon et al., 2013).
6.3.3.4. Vaccination
Given that only killed BVDV vaccines are available in New Zealand, we assumed that
the length of fetal protection after the second and third dose (and thereafter) of BVDV
vaccination were 26 and 52 weeks, respectively, and the efficacy of vaccination differed
according to the number of doses that had been given (i.e. no effects after the first dose,
and partial protective effect after the second dose and thereafter). We scheduled BVDV
vaccination to confer 52 weeks of immunity to female breeding animals before their first
mating. On dairy farms, all YHs were vaccinated for the first time 4 weeks before being
sent for off-site grazing, the second time at the week they were sent to off-site grazing, and
the third time 4 weeks before the PSM. On beef breeding farms, the first BVDV vaccination
was administered to calves at weaning, the second vaccination 4 weeks later, and the third
time 4 weeks before the PSM. Annual boosters were administered to MAs (and BHs in
case of beef farms) at 4 weeks before the PSM for both dairy and beef farms. Parameter
values related to BVDV vaccination are provided in Table 6.1, and detailed information
about the parameterisation of BVDV vaccination is provided in Chapter 5
6.3.3.5. Double-fencing
We assumed that the double fencing option prevented any local spread of BVDV from
PI animals on adjacent farms as well as from the exposure to background prevalence of PI
animals.
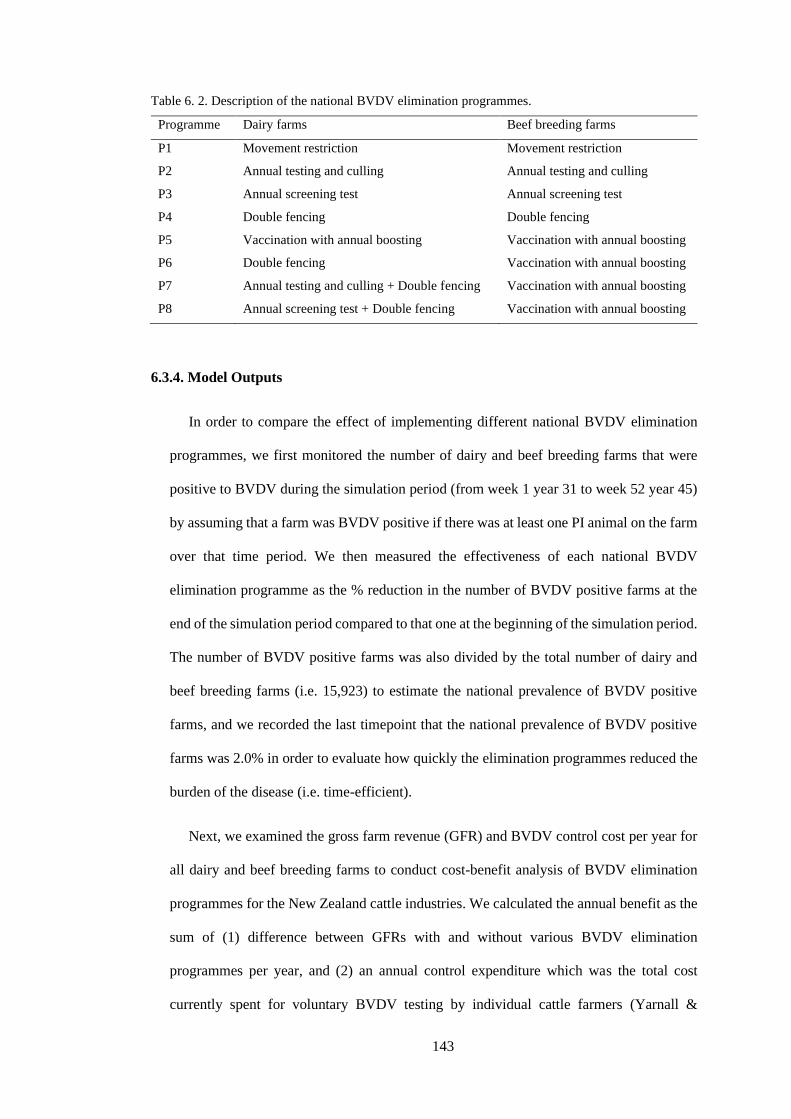
143
Table 6. 2. Description of the national BVDV elimination programmes.
Programme Dairy farms Beef breeding farms
P1 Movement restriction Movement restriction
P2 Annual testing and culling Annual testing and culling
P3 Annual screening test Annual screening test
P4 Double fencing Double fencing
P5 Vaccination with annual boosting Vaccination with annual boosting
P6 Double fencing Vaccination with annual boosting
P7 Annual testing and culling + Double fencing Vaccination with annual boosting
P8 Annual screening test + Double fencing Vaccination with annual boosting
6.3.4. Model Outputs
In order to compare the effect of implementing different national BVDV elimination
programmes, we first monitored the number of dairy and beef breeding farms that were
positive to BVDV during the simulation period (from week 1 year 31 to week 52 year 45)
by assuming that a farm was BVDV positive if there was at least one PI animal on the farm
over that time period. We then measured the effectiveness of each national BVDV
elimination programme as the % reduction in the number of BVDV positive farms at the
end of the simulation period compared to that one at the beginning of the simulation period.
The number of BVDV positive farms was also divided by the total number of dairy and
beef breeding farms (i.e. 15,923) to estimate the national prevalence of BVDV positive
farms, and we recorded the last timepoint that the national prevalence of BVDV positive
farms was 2.0% in order to evaluate how quickly the elimination programmes reduced the
burden of the disease (i.e. time-efficient).
Next, we examined the gross farm revenue (GFR) and BVDV control cost per year for
all dairy and beef breeding farms to conduct cost-benefit analysis of BVDV elimination
programmes for the New Zealand cattle industries. We calculated the annual benefit as the
sum of (1) difference between GFRs with and without various BVDV elimination
programmes per year, and (2) an annual control expenditure which was the total cost
currently spent for voluntary BVDV testing by individual cattle farmers (Yarnall &
144
Thrusfield, 2017). The annual control expenditure was estimated as NZ$ 12.7 million per
year based on the total number of BVDV-related laboratory tests during 2016-2017 (Gates,
Han, et al., 2019). The parameter values to estimate the annual GFR and BVDV control
cost for New Zealand dairy and beef breeding farms are provided in Chapter 5. For each
programme, we accumulated the annual benefit and BVDV control cost with a discounting
rate of 1.9%, and examined (1) whether or when a BVDV elimination programme had a
break-even point (i.e. a timepoint that the accumulated benefit was the same as or larger
than the accumulated BVDV control cost), and (2) the benefit/cost ratio of BVDV
elimination programmes. The benefit/cost ratio was calculated as the accumulated benefit
divided by the accumulated BVDV control cost in the final year. Due to the high
computational burden of running a national model, each elimination programme was
iterated only 100 times, however, we confirmed that the 100 iterations adequately captured
the variation caused by the stochasticity (see Section 5 in Appendix 4).
6.4. Results
6.4.1. Effectiveness of national BVDV elimination programmes
The effectiveness of different national BVDV elimination programmes is provided in
Table 6.3, and the national prevalence of BVDV positive farms over the simulation period
is illustrated in Figure 6.4, 6.5, and 6.6. Implementing the BVDV elimination programmes
of movement restriction, annual testing and culling, and annual screening test for both dairy
and beef farms (P1, P2, and P3, respectively) was not effective as sole control strategies to
reduce the national prevalence of BVDV infections. Any programme that involved double
fencing almost eliminated BVDV from the New Zealand dairy industry (Table 6.3). For
the beef breeding farms, any elimination programme that included vaccination was
generally effective in reducing BVDV infections, with the lowest number of BVDV
positive farms being observed when P7 was implemented (Table 6.3).

145
The last week that the national prevalence of BVDV positive farms being 2.0% with
respect to different national BVDV elimination programmes is provided in Table 6.3. The
most time-efficient BVDV elimination programmes were P7 and P8 with the median of 7
years (364 and 365 weeks, respectively) to reach national BVDV prevalence of 2.0%, and
this was followed by P6 (median of 7.2 years or 372 weeks) and P5 (median of 8.9 years
or 463 weeks).
Table 6. 3. Median (95% prediction interval) of the % reduction in the number of BVDV positive farms
between the beginning and end of simulation period (i.e. % reduction) and the last week that the national
prevalence of BVDV positive farms being 2.0% (i.e. last week for 2.0%) with respect to implementing
different national BVDV elimination programmes.
Programme % reduction Last week for 2.0%
Dairy (%) Beef breeding (%)
P1 38.0 (37.8, 38.3) 4.6 (4.4, 4.7) -
P2 71.7 (69.5. 73.3) 1.8 (1.3, 2.4) -
P3 20.7 (20.4, 21.0) 5.7 (4.7, 5.8) -
P4 99.8 (99.4, 100.0) 69.7 (68.5, 70.6) -
P5 89.5 (88.6, 91.2) 89.6 (88.8, 90.4) 563 (463, 772)
P6 99.8 (99.3, 100.0) 89.8 (88.6, 93.7) 411 (372, 419)
P7 100.0 (100.0, 100.0) 98.7 (94.3, 99.4) 364 (372, 414)
P8 100.0 (99.9, 100.0) 93.6 (89.3, 98.4) 365 (375, 414)

146
Figure 6. 4. National prevalence of BVDV positive farms (black) with respect to implementing no
BVDV elimination programme, movement restrictions (P1), and annual testing and culling of breeding
female calves (P2) for both dairy and beef breeding farms. Red and blue lines indicate the contribution
of the dairy and beef industries, respectively, to the national BVDV prevalence. Solid line and shaded
area indicate the median and 95% prediction interval, respectively.
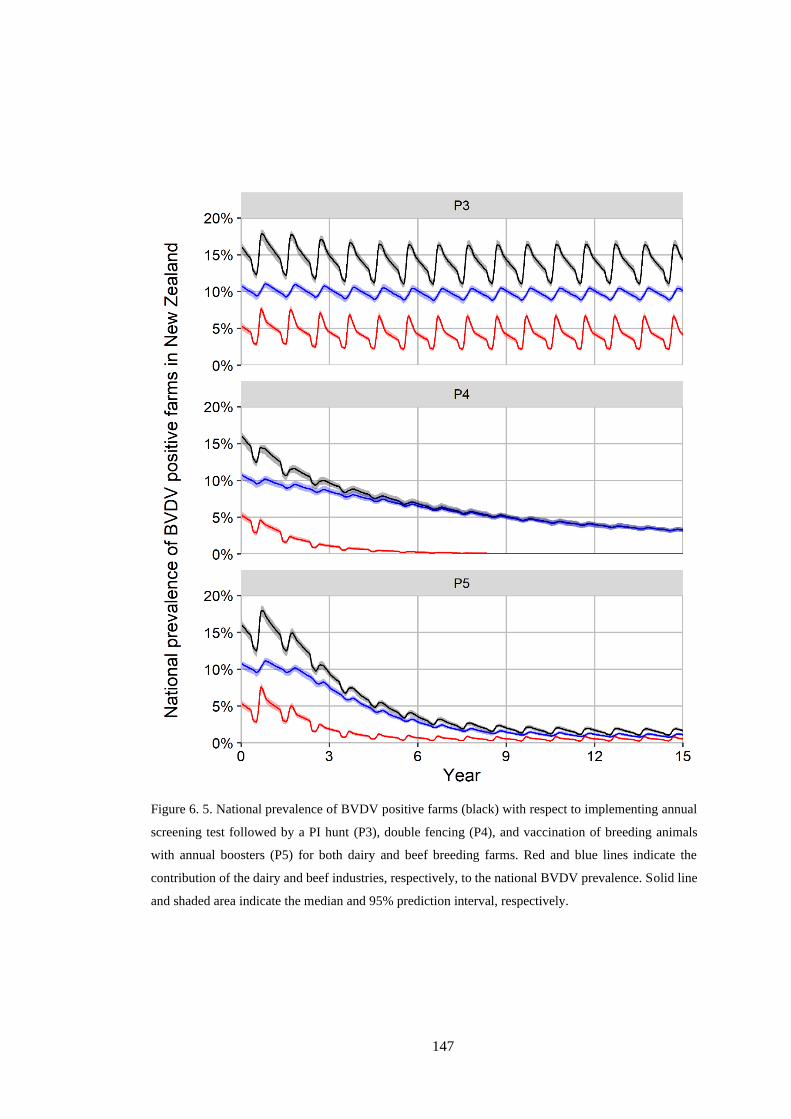
147
Figure 6. 5. National prevalence of BVDV positive farms (black) with respect to implementing annual
screening test followed by a PI hunt (P3), double fencing (P4), and vaccination of breeding animals
with annual boosters (P5) for both dairy and beef breeding farms. Red and blue lines indicate the
contribution of the dairy and beef industries, respectively, to the national BVDV prevalence. Solid line
and shaded area indicate the median and 95% prediction interval, respectively.

148
Figure 6. 6. National prevalence of BVDV positive farms (black) with respect to implementing double
fencing (P6), annual testing and culling of breeding female calves with double fencing (P7), and annual
screening test followed by a PI hunt with double fencing (P8) for dairy farms. For all strategies,
vaccination of breeding animals with annual boosters was implemented for beef farms. Red and blue
lines indicate the contribution of the dairy and beef industries, respectively, to the national BVDV
prevalence. Solid line and shaded area indicate the median and 95% prediction interval, respectively.

149
Figure 6. 7. Accumulated benefit (blue) and BVDV control cost (red) for different BVDV elimination
programmes over time. Solid line and shaded area indicate median and 95% prediction interval,
respectively.

150
6.4.2. Cost-benefit analysis of national BVDV elimination programmes
The accumulated benefit and BVDV control cost over time is shown in Figure 6.7 and
Table 6.4. Implementing P7 resulted in the highest benefit with the median (95%
predication interval (PrI)) accumulated benefit estimated to be NZ$ 650.3 million
(NZ$ 583.6 to 731.1 million) over a 15-year period. P5 was the most expensive BVDV
elimination programme with the median cost of NZ$ 815.5 million (95% PrI: NZ$ 815.3
to 815.7 million).
The benefit/cost ratio of different elimination programmes is provided in Table 6.4. At
the end of the simulation period, BVDV elimination programmes of P4, P6, P7, and P8
incurred a significantly larger benefit than cost with the median (95% PrI) benefit/cost ratio
of 1.97 (1.75 ~ 2.18), 1.95 (1.78 ~ 2.14), 1.16 (1.04 ~ 1.30), and 1.80 (1.63 ~ 1.99),
respectively. For each of these programmes, a break-even point was observed after the
median (95% PrI) of 7 years (6 to 8), 6 years (5 to 8), 11 years (8 to 14), and 7 years (6 to
8), respectively, from the implementation of the elimination programme.
Table 6. 4. Median (95% prediction interval) of accumulated benefit (Benefit), BVDV control cost
(Cost), year of break-even point, and benefit/cost ratio with respect to implementing different national
BVDV elimination programmes.
Programme Benefit (million NZ$) Cost (million NZ$) Break-even (yr) Benefit/cost ratio
P1 222.6 (155.4, 308.1) 525.9 (525.6, 526.1) - 0.42 (0.30, 0.59)
P2 223.9 (154.3, 282.9) 272.4 (272.3, 272.5) - ** 0.82 (0.57, 1.04)
P3 103.5 (-43.6, 223.2) 158.1 (156.2, 159.6) - ** 0.65 (-0.28, 1.41)
P4 571.5 (505.9, 631.3) 289.7 * 7 (6, 8) 1.97 (1.75, 2.18)
P5 449.8 (377.9, 516.9) 815.5 (815.3, 815.7) - 0.55 (0.46, 0.63)
P6 644.4 (588.4, 708.8) 330.6 (330.5, 330.6) 6 (5, 8) 1.95 (1.80, 2.14)
P7 650.3 (583.6, 731.2) 560.4 (560.2, 560.5) 11 (8, 14) 1.16 (1.04, 1.30)
P8 645.0 (585.0, 710.8) 357.8 (357.4, 358.3) 7 (6, 8) 1.80 (1.63, 1.99)
Key: yr, Year.
* Accumulated BVDV control cost did not vary between simulations.
** Break-even point was beyond the simulation period for the median and upper limit of 95%
prediction interval.
151
6.5. Discussion
This study is the first to develop a stochastic individual-based simulation model of
BVDV transmission dynamics within and between New Zealand cattle farms to evaluate
the cost-effectiveness of implementing a national BVDV elimination programme. The
results not only highlight the important features of the epidemiology of BVDV in New
Zealand, but also identify several possible approaches that can be used to eliminate BVDV
with significant economic net benefits to the dairy and beef industries.
The model results highlighted key differences between the New Zealand dairy and beef
industries with respect to how BVDV transmission is maintained within a farm. In dairy
farms, BVDV was effectively controlled by preventing local spread via double fencing,
which indicates that constant re-introduction of BVDV from external sources is required
for the disease to persist. This is most likely due to the unique demographic structure of
New Zealand dairy herds whereby almost all male calves and any female calves not being
kept as replacements are typically sold within the first week of life, as this would eliminate
any potential PI calves in these groups without the need for additional testing. It is also a
common practice for replacement heifers to be grazed at off-site locations until a few
months before first calving, which reduces the potential for BVDV transmission to the
milking herd. It was therefore unsurprising that double fencing was an effective national
control option to prevent BVDV transmission to naïve dairy stock. Although vaccination
can also be used to mitigate the effects of local spread, vaccine efficacy is not perfect and
it is more expensive than double-fencing since all breeding animals are required for annual
boosting (Smith et al., 2014). Furthermore, double-fencing will effectively prevent local
spread of other infectious diseases, such as Leptospirosis, Mycoplasma bovis, or Johne’s
disease, as well, and it will likely lead to greater long-term benefits than predicted in this
study.
For the New Zealand beef industry, neither double fencing nor movement restrictions
were sufficient to eliminate BVDV. We conducted a post hoc analysis about the cause of
152
ineffectiveness of double fencing on reducing the number of BVDV positive beef breeding
farms (see Section 6 in Appendix 4), which suggested that larger herds (> 500 assigned
MA herd size) were more likely to become endemic with BVDV. This is not surprising
given that beef calves typically remain with their dams until weaning (6 ~ 7 months of age)
and therefore any PI calves born into the herd have the potential to expose naïve dams
during the subsequent breeding season, particular in large extensive herds where BVDV
may not spread rapidly enough to confer adequate herd immunity. Lower rates of BVDV
self-clearance have been reported in other studies as well (Lindberg & Houe, 2005). Given
that it is logistically challenging for beef farmers to collect samples from calves at-foot to
remove PI animals in a timely fashion (Han, Weir, et al., 2018), vaccination is likely to be
the most practical and effective approach to control BVDV in the New Zealand beef
industry. However, it is still important to prevent re-introduction of BVDV through
contacts with neighbouring farms, especially since BVDV vaccines available in New
Zealand have shown limited efficacy to prevent fetal infections (Packianathan et al., 2017).
Across the different national elimination programmes examined in this study,
implementing double fencing for dairy farms and vaccination for beef breeding farms (P6)
substantially reduced the national prevalence of BVDV positive farms. However, it should
be noted that the prevalence plateaued after approximately 10 years of control and
additional annual tests of breeding calves (P7) or annual herd-level screening tests (P8) on
dairy farms was required for further reduction of national BVDV prevalence. This finding
was related to the dynamics in the assumed background prevalence of PI animals, which
contributed to local transmission in the simulation model. The background prevalence
declined more rapidly when dairy breeding herds were tested or screened for BVDV
because fewer non-breeding dairy PI calves were moved to beef fattening or hobby farms
which would then contribute to the risk of local spread to beef breeding farms. This “spill-
over” like phenomenon of BVDV transmission from the dairy industry to the beef sector
indicates the necessity of additional BVDV testing or screening on dairy farms to eliminate
153
BVDV in New Zealand. Although it was not modelled in this study, there is always a risk
of transmission from the beef industry back to the dairy sector through local spread and/or
the movement of PI or TI breeding bulls. This is of significant concern since the levels of
natural immunity in dairy herds have been decreasing over the past decade as more herds
have taken measures to eliminate active BVDV infections (Gates, Han, et al., 2019;
Thobokwe et al., 2004). Therefore, the model results highlight the need for both industries
to work together to effectively control BVDV.
Based on the current situation in New Zealand, we therefore believe that either P7 or P8
would offer the most cost-effective and practical framework for successfully elimination
of BVDV in New Zealand. However, it should be noted that neither approach was able to
completely eliminate BVDV from New Zealand within a time period of 15 years. This was
due to the imperfect BVDV vaccine efficacy resulting in the continued creation of PI
animals in beef herds. This highlights the need to view an elimination programme as a
dynamic process where regulations may need to change as the epidemiology changes. For
instance, the BVDV control programme in Switzerland required all new-born calves to be
tested against BVDV Ag at the beginning, then this changed to Ab based screening tests to
monitor BVDV incidences as the national prevalence gradually decreased (Stalder et al.,
2016). Given the BVDV transmission model in a national scale of New Zealand has been
developed in this study, different elimination programmes that constantly changing over
time with respect to the epidemiological situation of BVDV in individual farms can be
examined in future researches. It would even be possible to switch the programme to a
more risk-based elimination programme similar to the approach used for bovine
tuberculosis control in New Zealand (Hidano et al., 2016) whereby farms with a higher risk
of BVDV introductions are targeted for more intensive surveillance and control.
We acknowledge several limitations that might affect the validity of this study. First,
BVDV simulation of this study was based on poor-quality data about the number, boundary,
and location of cattle farms in New Zealand. This is most likely to affect the estimates of
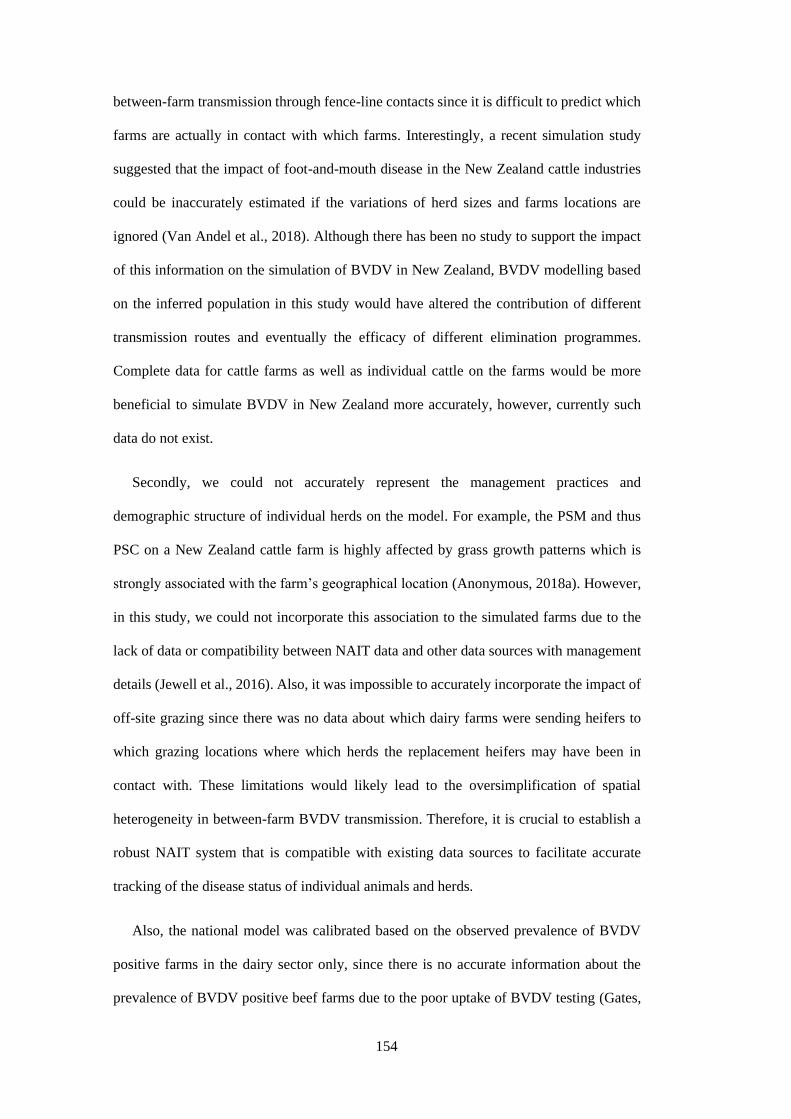
154
between-farm transmission through fence-line contacts since it is difficult to predict which
farms are actually in contact with which farms. Interestingly, a recent simulation study
suggested that the impact of foot-and-mouth disease in the New Zealand cattle industries
could be inaccurately estimated if the variations of herd sizes and farms locations are
ignored (Van Andel et al., 2018). Although there has been no study to support the impact
of this information on the simulation of BVDV in New Zealand, BVDV modelling based
on the inferred population in this study would have altered the contribution of different
transmission routes and eventually the efficacy of different elimination programmes.
Complete data for cattle farms as well as individual cattle on the farms would be more
beneficial to simulate BVDV in New Zealand more accurately, however, currently such
data do not exist.
Secondly, we could not accurately represent the management practices and
demographic structure of individual herds on the model. For example, the PSM and thus
PSC on a New Zealand cattle farm is highly affected by grass growth patterns which is
strongly associated with the farm’s geographical location (Anonymous, 2018a). However,
in this study, we could not incorporate this association to the simulated farms due to the
lack of data or compatibility between NAIT data and other data sources with management
details (Jewell et al., 2016). Also, it was impossible to accurately incorporate the impact of
off-site grazing since there was no data about which dairy farms were sending heifers to
which grazing locations where which herds the replacement heifers may have been in
contact with. These limitations would likely lead to the oversimplification of spatial
heterogeneity in between-farm BVDV transmission. Therefore, it is crucial to establish a
robust NAIT system that is compatible with existing data sources to facilitate accurate
tracking of the disease status of individual animals and herds.
Also, the national model was calibrated based on the observed prevalence of BVDV
positive farms in the dairy sector only, since there is no accurate information about the
prevalence of BVDV positive beef farms due to the poor uptake of BVDV testing (Gates,
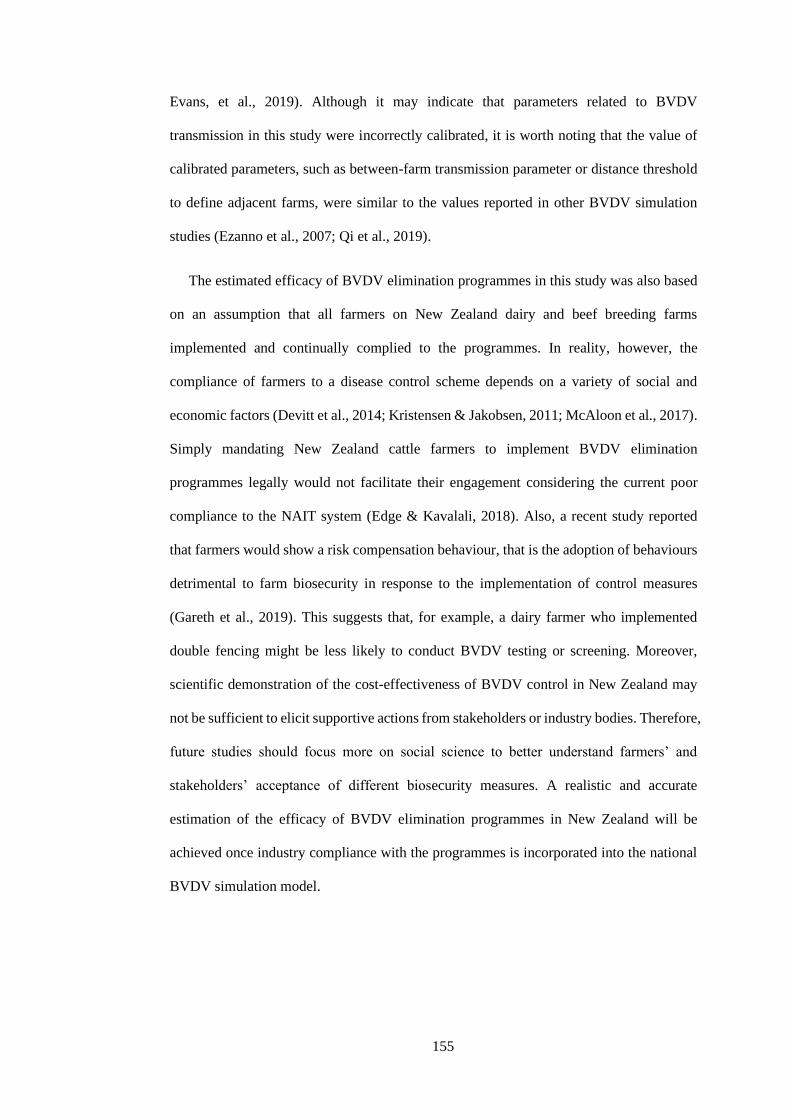
155
Evans, et al., 2019). Although it may indicate that parameters related to BVDV
transmission in this study were incorrectly calibrated, it is worth noting that the value of
calibrated parameters, such as between-farm transmission parameter or distance threshold
to define adjacent farms, were similar to the values reported in other BVDV simulation
studies (Ezanno et al., 2007; Qi et al., 2019).
The estimated efficacy of BVDV elimination programmes in this study was also based
on an assumption that all farmers on New Zealand dairy and beef breeding farms
implemented and continually complied to the programmes. In reality, however, the
compliance of farmers to a disease control scheme depends on a variety of social and
economic factors (Devitt et al., 2014; Kristensen & Jakobsen, 2011; McAloon et al., 2017).
Simply mandating New Zealand cattle farmers to implement BVDV elimination
programmes legally would not facilitate their engagement considering the current poor
compliance to the NAIT system (Edge & Kavalali, 2018). Also, a recent study reported
that farmers would show a risk compensation behaviour, that is the adoption of behaviours
detrimental to farm biosecurity in response to the implementation of control measures
(Gareth et al., 2019). This suggests that, for example, a dairy farmer who implemented
double fencing might be less likely to conduct BVDV testing or screening. Moreover,
scientific demonstration of the cost-effectiveness of BVDV control in New Zealand may
not be sufficient to elicit supportive actions from stakeholders or industry bodies. Therefore,
future studies should focus more on social science to better understand farmers’ and
stakeholders’ acceptance of different biosecurity measures. A realistic and accurate
estimation of the efficacy of BVDV elimination programmes in New Zealand will be
achieved once industry compliance with the programmes is incorporated into the national
BVDV simulation model.
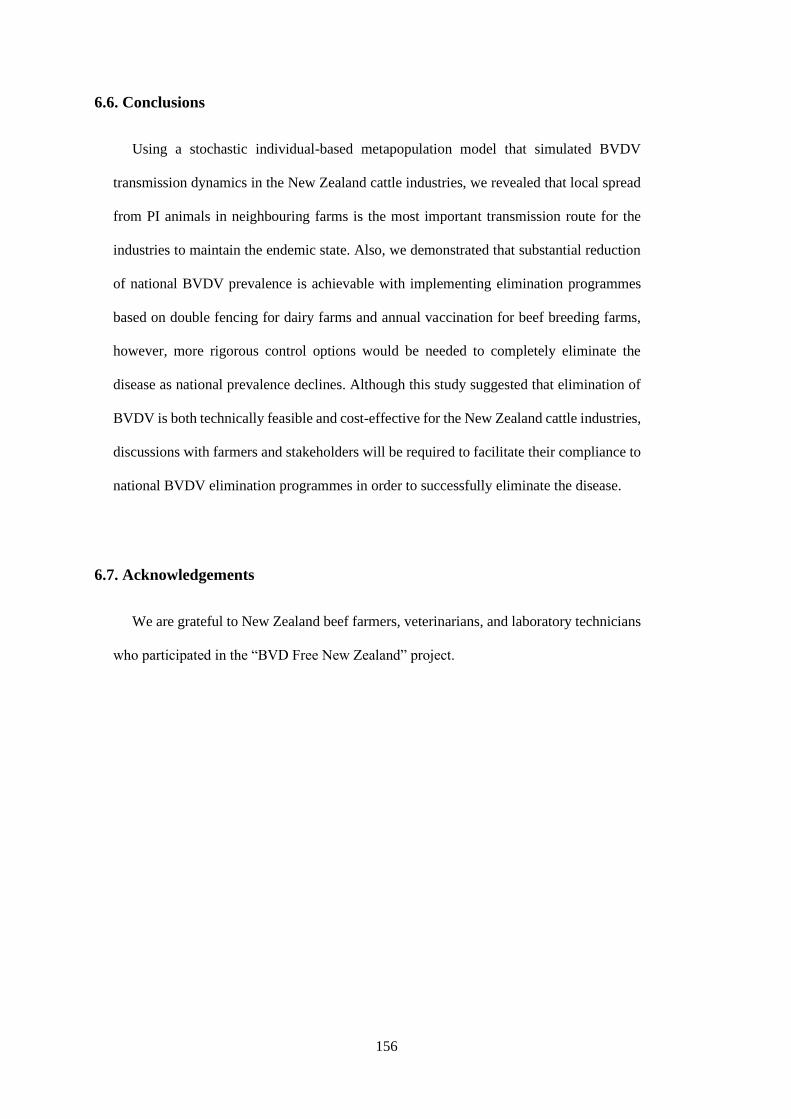
156
6.6. Conclusions
Using a stochastic individual-based metapopulation model that simulated BVDV
transmission dynamics in the New Zealand cattle industries, we revealed that local spread
from PI animals in neighbouring farms is the most important transmission route for the
industries to maintain the endemic state. Also, we demonstrated that substantial reduction
of national BVDV prevalence is achievable with implementing elimination programmes
based on double fencing for dairy farms and annual vaccination for beef breeding farms,
however, more rigorous control options would be needed to completely eliminate the
disease as national prevalence declines. Although this study suggested that elimination of
BVDV is both technically feasible and cost-effective for the New Zealand cattle industries,
discussions with farmers and stakeholders will be required to facilitate their compliance to
national BVDV elimination programmes in order to successfully eliminate the disease.
6.7. Acknowledgements
We are grateful to New Zealand beef farmers, veterinarians, and laboratory technicians
who participated in the “BVD Free New Zealand” project.

157
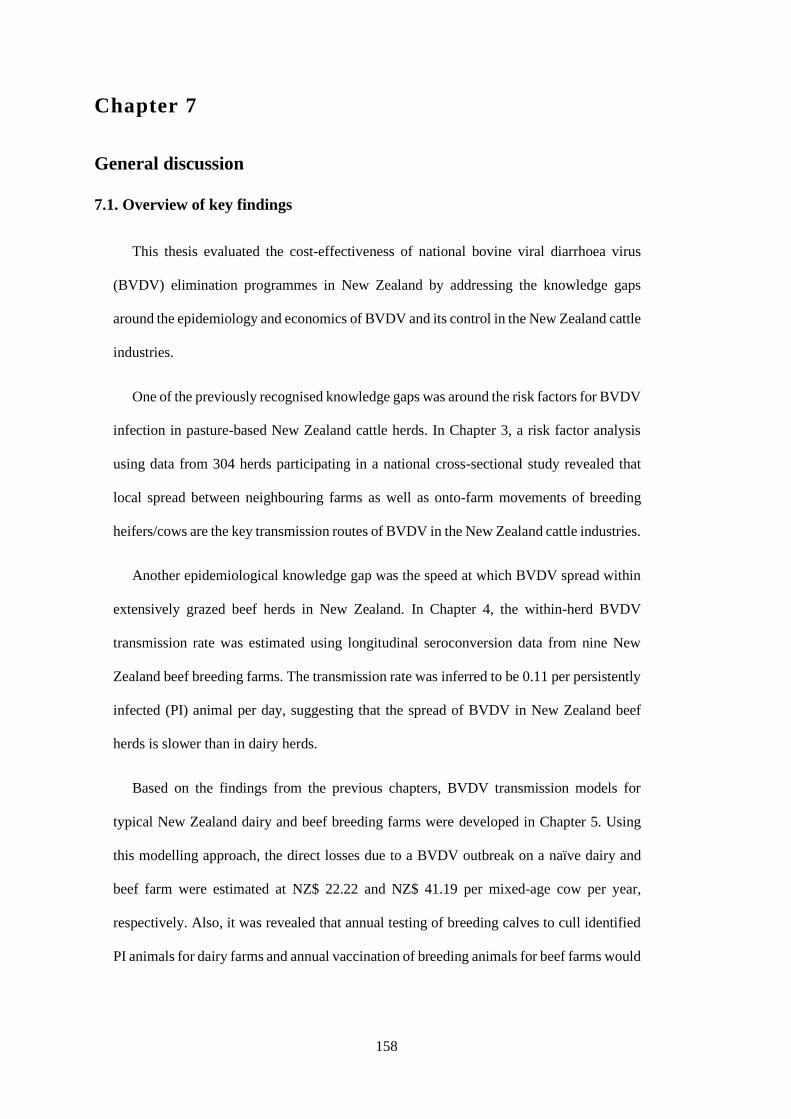
158
Chapter 7
General discussion
7.1. Overview of key findings
This thesis evaluated the cost-effectiveness of national bovine viral diarrhoea virus
(BVDV) elimination programmes in New Zealand by addressing the knowledge gaps
around the epidemiology and economics of BVDV and its control in the New Zealand cattle
industries.
One of the previously recognised knowledge gaps was around the risk factors for BVDV
infection in pasture-based New Zealand cattle herds. In Chapter 3, a risk factor analysis
using data from 304 herds participating in a national cross-sectional study revealed that
local spread between neighbouring farms as well as onto-farm movements of breeding
heifers/cows are the key transmission routes of BVDV in the New Zealand cattle industries.
Another epidemiological knowledge gap was the speed at which BVDV spread within
extensively grazed beef herds in New Zealand. In Chapter 4, the within-herd BVDV
transmission rate was estimated using longitudinal seroconversion data from nine New
Zealand beef breeding farms. The transmission rate was inferred to be 0.11 per persistently
infected (PI) animal per day, suggesting that the spread of BVDV in New Zealand beef
herds is slower than in dairy herds.
Based on the findings from the previous chapters, BVDV transmission models for
typical New Zealand dairy and beef breeding farms were developed in Chapter 5. Using
this modelling approach, the direct losses due to a BVDV outbreak on a naïve dairy and
beef farm were estimated at NZ$ 22.22 and NZ$ 41.19 per mixed-age cow per year,
respectively. Also, it was revealed that annual testing of breeding calves to cull identified
PI animals for dairy farms and annual vaccination of breeding animals for beef farms would
159
be the most economically beneficial strategies for controlling a BVDV outbreak on New
Zealand dairy farms and beef farms, respectively.
In Chapter 6, the BVDV simulation modelling approach was scaled up to the national
level using data from the national animal identification and tracing (NAIT) system to infer
the demographics of the New Zealand cattle industries as well as between-farm BVDV
transmission through animal movements and neighbourhood contacts. This study
highlighted that the endemic state of BVDV infection in New Zealand is primarily
maintained through local spread between cattle herds on adjacent farms. This study also
demonstrated that a substantial reduction in national BVDV prevalence could be achieved
in a cost-effective manner by requiring all dairy farms for double fencing of boundaries
with either annual testing and culling or annual herd-level screening and all beef breeding
farms for annual vaccination of every female breeding animal.
7.2. Risk factors for BVDV infection in New Zealand cattle farms
The risk factor analysis for BVDV infection in this thesis (chapter 3) revealed that
having close contacts with animals on neighbouring farms significantly increased the risk
of BVDV infection on New Zealand cattle farms. Local spread through nose-to-nose
contact over fence-lines has been identified as a common transmission route of BVDV in
many countries (Bitsch et al., 2000; Valle et al., 1999) and a previous study from New
Zealand also showed that over-the-fence contacts with cattle on neighbouring farms
resulted in increased BVDV antibody (Ab) titres in bulk tank milk (BTM) samples from
dairy herds (Weir et al., 2016). These findings were corroborated through the national
simulation model (chapter 6), which indicated that local spread is the primary reason for
BVDV remains endemic in the New Zealand dairy industry. A similar finding has been
reported in France where an estimated 93.1% of BVDV incidences at a farm-level were
attributable to neighbourhood contacts (Qi et al., 2019). The importance of biosecurity
160
measures to prevent local spread has been repeatedly highlighted by Scandinavian
countries where BVDV has been eliminated (Ståhl & Alenius, 2012). Given that double
fencing of shared boundaries can prevent the spread of many other infectious diseases, this
control measure should be strongly considered for inclusion as part of any national disease
control programme in New Zealand.
The study also identified onto-farm movements of breeding heifers/cows as a significant
risk factor for BVDV infection in New Zealand cattle herds, which is similar to findings
from previous studies. Using RT-PCR on BTM from New Zealand dairy herds, Weir et al.,
(2016) showed that herds had purchased cows with unknown BVDV status were 2.2 times
more likely to have active circulation of BVDV. In beef farms, W. Cuttance & Cuttance,
(2014) reported that purchasing replacement heifers significantly increased the odds of
BVDV infection although the study suffered from a lack of precision. The movement of
animals between cattle farms is a well-established risk factor for BVDV infection (Valle et
al., 1999). In particular, there is a significant risk that purchasing pregnant female breeding
animals with unknown BVDV infection status would result in the introduction of BVDV
through the birth of a PI calf. Although it is possible to assess the BVDV infection status
of a fetus prior to the purchase of pregnant animals, it is very labour-intensive and may
induce abortion as it requires fetal fluid for testing (Callan et al., 2002). Another approach
to diagnose Trojan dams (i.e. non-PI dams that carrying PI fetus) is to use BVDV Ab
ELISA test, however, the test is valid only after 7 months of gestation period with moderate
specificity (0.7) (Lindberg et al., 2001). Therefore, national control programmes that
restrict the movement of cattle with unknown BVDV status are likely to be practical and
effective in reducing the between-farm BVDV transmission in New Zealand. In cases
where movement restrictions are not feasible, the calves of any purchased pregnant dams
should be tested for BVDV as early as possible after birth.
In the New Zealand dairy industry, it is common practise for farmers to send
replacement heifers to off-site locations for grazing and breeding before they return to the
161
mixed-age cow herd just prior to delivering their first calf (i.e. off-site grazing). This carries
substantial risk of introducing BVDV to the milking herd through the birth of PI calves if
naïve heifers were exposed to BVDV during the risk period of pregnancy, particularly if
they were unvaccinated or if there was poor biosecurity at the off-site location. It has
previously been reported that BVDV BTM Ab titres of New Zealand dairy farms that
grazed heifers off-site were higher than the ones that raised heifers on farm (Weir et al.,
2016), suggesting that there is greater exposure to BVDV at off-site locations. A study from
Switzerland also reported a similar finding that grazing animals at a distant location
increased the risk of BVDV infection (Presi et al., 2011). Although it was not possible to
confirm that the off-farm movements of either replacement heifers or cows increased the
risk of BVDV infection in Chapter 3, off-site grazing still poses a risk of BVDV
introduction for New Zealand dairy herds given the endemic status of BVDV in New
Zealand. Considering the current high background prevalence of BVDV in New Zealand,
vaccinating heifers before off-site grazing and testing the calves of the heifers would be
recommended.
Overall, this study suggests that local spread over fence-lines and the movements of
female breeding animals with unknown BVDV infection status should be targeted to
eliminate BVDV in New Zealand cattle farms. However, the Bayesian network (BN)
approach in Chapter 3 revealed that onto- and off- farm movements of heifers are frequent
in New Zealand dairy farms whereas beef farms were less prone to these risk factors. The
BN approach also discovered that New Zealand beef farmers had lower awareness of
BVDV, which may make it more difficult to convince farmers to conduct BVDV control
measures, such as annual BVDV testing to identify and cull PI animals, given the logistical
challenges of routinely gathering animals for identifying and sampling (Gates, Evans, et
al., 2019). These findings indicate that movement restrictions that require a rigorous
process of testing individual animals may be more suitable and effective in the dairy
industry. This speculation was supported by the national BVDV simulation study (chapter

162
6), which showed that implementing national movement restriction reduced up to 38.0%
of BVDV positive farms in the dairy sector yet only resulted in a 4.6% decrease in BVDV
positive farms in the beef industry. Conclusively, these findings imply that BVDV
transmission between cattle farms in New Zealand would be better controlled with the
application of industry-specific control measures.
7.3. BVDV dynamics in extensively grazed herds
One of the significant contributions of this thesis was estimating the rate of BVDV
transmission in extensive beef breeding herds by using longitudinal data from a field study
to measure the seroconversion of first-calf heifers over the mating and early gestation
period (chapter 4). Many research groups have developed BVDV simulation models to suit
their own epidemiological circumstances, and Viet et al., (2004) reviewed the BVDV
dynamics of different modelling studies by comparing the number of animals that
seroconverted during a year following the introduction of a single PI animal in a herd of
100 susceptible animals. The authors found that 30 to 100 animals seroconverted in that
year with most herds in the study being intensive dairy herds. The estimate of 33 animals
infected per PI animal per year for New Zealand beef herds (chapter 4) confirms the general
belief of that BVDV transmission in extensively grazed beef herds is slower than in herds
that are more intensively managed and grazed.
An important implication of this low transmission rate is that the presence of PI animals
in extensively grazed beef herds is not necessarily sufficient to ensure that naïve animals
will be naturally exposed to BVDV prior to the start of mating and therefore protected
against producing new PI calves. A similar finding was reported in an extensively grazed
dairy herd where approximately 20% of replacement heifers remained susceptible to
BVDV even after being directly co-grazed with PI animals for up to 600 days (Thompson,
2005). This strongly suggests that using PI animals as a “natural” BVDV vaccination
163
source (i.e. purposely exposing PI animals to susceptible animals to replicate the protective
effect of BVDV vaccination) is likely to fail in extensively grazed cattle herds in New
Zealand.
Another implication of this finding with respect to BVDV control in New Zealand is
that detecting a recent BVDV introduction in a naïve beef herd by conducting a spot test
(i.e. BVDV Ab ELISA using a pooled serum sample of 10 to 15 animals) may have poor
sensitivity if there has not been sufficient time for enough animals to be exposed to the
virus. In European countries where BVDV has been systematically controlled, spot tests
using blood samples from 10 to 15 youngstock are often used as an inexpensive screening
test to make inferences about farm-level BVDV infection status to determine if a PI hunt
is warranted (Houe et al., 2006). Given the slower BVDV dynamics in extensively grazed
beef farms in New Zealand, the application of a similar spot test is unlikely to be a reliable
indicator of BVDV infection status at a herd-level, so future studies should be conducted
to explore the sensitivity and specificity of using Ab-based spot test to detect active
circulation of BVDV.
7.4. Economics of BVDV and its control
In New Zealand, the direct losses from a BVDV outbreak on typical dairy and beef
breeding farms were estimated to be NZ$ 22.22 and NZ$ 41.19 per mixed-age cow per
year, respectively (chapter 5). These estimated losses were relatively lower than estimates
from other countries, which have ranged from NZ$ 4 to 4,512 per dairy animal and from
NZ$ 41 to 504 per beef animal (Richter et al., 2017). Although the economic impacts of
BVDV depend on a variety of factors, such as the value of cattle or cattle products,
production level, and management features, these findings imply that the current impacts
of BVDV infection in the New Zealand cattle industries may be less than in other countries
due to (1) the unique management characteristics of the dairy industry; a narrow seasonal
164
breeding period, selling/culling most calves at approximately 4 days old, grazing heifers
off-site, and lower average milk yields per cow, and (2) a slower BVDV transmission rate
caused by extensive grazing with a lack of frequent gathering events in the beef sector
(chapter 4). However, it is worth noting that most of the previous studies estimated the
economic impacts by comparing the difference in average production levels or reproductive
performances between herds with and without BVDV. It is likely that herds with BVDV
have other infectious disease or management issues on farm that could be contributing to
their poor performance. Given that the estimation in Chapter 5 was based on the direct
impact of BVDV at an animal-level, it is likely a reasonable and conservative estimate of
the economic impacts of BVDV in New Zealand.
The within-herd simulation models in Chapter 5 revealed that control of BVDV on a
naïve dairy farm was economically beneficial for some, but not all combinations of
available control measures. The highest benefit/cost ratio of 2.02 occurred with
implementing annual testing of female breeding calves to identify and remove PI animals.
Adding double fencing to the annual testing also incurred marginally greater benefit than
the cost of control (benefit/cost ratio of 1.02). Other strategies were not economically
beneficial, which was in contrast to a study by Reichel et al., (2008) who suggested that
implementing any type of control measures incurred more benefits than costs for a typical
New Zealand dairy farm. However, the previous study likely overestimated the economic
impacts of BVDV infection as it assumed the continuous presence of PI animals in the herd
for the 10 years of the study period. Considering the high self-clearance rate of BVDV
infection in New Zealand dairy herds (Gates, Han, et al., 2019), it is more likely that not
all BVDV control options would be economical for New Zealand dairy farms.
Several strategies that based on the annual vaccination of breeding female animals were
identified as being cost-effective to control a BVDV outbreak on a typical New Zealand
beef breeding farm (chapter 5). Interestingly, implementing additional control measures on
top of vaccination, such as annual testing of breeding calves or performing annual screening
165
tests to determine if a PI hunt was warranted generated only limited benefits. This was
likely due to the model assumption that testing or screening was conducted around when
calves were weaned. Since calves were co-grazed with dams for 6 to 7 months before
weaning in the model to reflect common practises in the beef industry, there was ample
opportunity for susceptible dams to be exposed to new-born PI calves during the risk period
of pregnancy for generating a new PI fetus. However, the time of weaning is the most
logistically convenient time for beef farmers to conduct sampling especially given the risk
of injuries of calves at-foot would be an obstacle to conduct early testing and culling of PI
beef calves (Gates, Evans, et al., 2019; Han, Weir, et al., 2018). These results indicate that
vaccination would be the most practical and effective approach to control BVDV in the
New Zealand beef industry unless farmers are willing to test and cull PI calves prior to the
start of the next mating period.
7.5. National BVDV elimination programmes
In the national scale model (chapter 6), any elimination programmes that required all
dairy farms to double-fence shared boundaries with either annual testing and culling of all
breeding calves or annual herd-level screening tests followed by a PI hunt and all beef herds
to vaccinate every female breeding animal before the mating period effectively reduced
national BVDV prevalence in New Zealand with the median of benefit/cost ratios ranging
from 1.16 to 1.80 and the time until break-even ranging from 7 to 11 years (median).
Interestingly, this is similar to the estimated break-even points of 2 to 15 years in other
European countries with either regional or national elimination programmes (Richter et al.,
2017). This highlights that eliminating BVDV on a national scale in New Zealand is
technically feasible with a similar level of cost-efficiency compared with other countries
even though the economic impact of BVDV infection on individual farms is generally
lower in New Zealand.
166
A challenge for national BVDV elimination in New Zealand is the strong linkage
between the dairy and beef industries due to the estimated 0.8 million dairy calves that are
sold annually to the beef industry for fattening purpose (per. comm. Steve Morris).
Considering the cost and labour of BVDV antigen (Ag) testing to identify PI calves, it is
uncommon for New Zealand dairy farmers to test calves before selling them to beef farms,
which means that a substantial number of PI calves are likely moved from the dairy to beef
fattening farms. Given that the persistence of BVDV in the dairy industry was mainly due
to local spread from PI animals on neighbouring farms (chapter 6), this “spill-over” like
phenomenon of PI animals poses a great risk of BVDV transmission from the beef sector
back to the dairy industry via neighbourhood contacts. This highlights the need for the dairy
and beef industries to work together simultaneously to eliminate BVDV in New Zealand.
Due to the imperfect efficacy of vaccination programmes implemented in beef breeding
herds, the simulation model in Chapter 6 predicted that none of the national elimination
programmes that were examined in the model would completely eliminate BVDV from
New Zealand within 15 years although the national prevalence could still be substantially
reduced. This indicates that any BVDV elimination programmes implemented in New
Zealand will likely need to evolve over time as the epidemiologic situation changes. In
Ireland, for example, a recent study suggested a legislative change to mandate farmers to
cull PI animals sooner than initially required to achieve further reduction in the national
BVDV prevalence with an attractive benefit/cost (Thulke et al., 2018). One important point
to note is that the cost-effectiveness of BVDV elimination programmes often decreases
substantially during the final phase of BVDV elimination due to the high costs of rigorous
searching for any remaining PI animals in the small number of actively infected herds. As
an alternative, the implementation of risk-based approaches that selectively target farms
with a high anticipated risk of BVDV introduction may prove more beneficial. However,
this approach has never been applied in other countries possibly due to the uncertainties
167
around accurately predicting which farms may be infected, so questions still remain about
the efficacy of such programmes.
7.6. Methodological limitations
As with many research studies, there were limitations in both the data and
methodological approaches used in this thesis although every effort was made to ensure
accuracy and validity of the results.
The study in Chapter 3 was based on secondary data collected from a convenience
sample of 304 New Zealand cattle farms, therefore, the study was inherently influenced by
selection bias. However, although the magnitude and direction of the bias is unknown, the
selection bias likely had a limited impact given that the estimated prevalence of active
BVDV infection on New Zealand cattle farms was consistent with those reported from
other studies that had a wider sampling frame (Gates, Han, et al., 2019; Weir et al., 2016).
One approach that could have been applied to adjust the selection bias is a quantitative bias
analysis, which adjusts the coefficients of explanatory variables (or exposure) by
considering the probability of being sampled depending on the status of exposure and
outcome of cattle farms (Lash et al., 2011). However, the method is only available to the
univariable approach and application to multivariable framework is still limited.
Another limitation is that farms were considered actively infected with BVDV if the S/P
ratio from the pooled serum BVDV antibody (Ab) ELISA was > 0.75. This cut-off value
was based on a previous study showing that it was extremely unlikely for herds with an S/P
ratio less than 0.75 to have any PI animals present on farm (Hill, McCoy, et al., 2010).
However, the results from the panel study in beef herds provided empirical evidence of
BVDV seroconversion occurring in herds with low S/P ratios (Gates, Evans, et al., 2019),
which indicates that classifying a farm’s active BVDV infection status using BVDV Ab
ELISA on a pooled sample is not completely accurate. Unfortunately, given the nature of

168
secondary data, it was not possible to confirm whether BVDV was actively circulating on
the 304 sampled farms. Considering that approximately half of dairy farms were
categorised as actively infected with BVDV in the study while it has been recently
estimated as approximately 7% (Gates, Han, et al., 2019), it would indicate that the large
number of farms with active BVDV infection in Chapter 3 was false positive, which
possibly drove most of coefficients of explanatory variables into the null. The survey design
could affect the association between the explanatory and outcome variables even worse,
since the survey captured the risk of BVDV introduction or incidence during the past 5
years while the outcome measured the possible evidence of current BVDV persistence
within farms. Future studies on risk factor analysis for BVDV infection should be based on
more evident outcomes such as the confirmation of BVDV Ag or presence of PI animals.
In Chapter 4, an approximate Bayesian computation-sequential Monte Carlo method
was used to infer the value of model parameters that related to BVDV transmission in
extensively grazed beef herds in New Zealand (e.g. BVDV transmission rate, initial
proportion of BVDV seropositive animals, proportion of introduced PI animals, and day of
PI animals being introduced) with empirical data on the seroconversion of first-calf heifers
between two sampling events. With this relatively limited data, particularly without
knowing how many PI animals were present in the herds, it was not possible to accurately
estimate all unknown model parameters. Future studies should track the serological status
of the whole herd across more sampling points to better estimate seroconversion rates.
However, as previously highlighted, it is logistically challenging and expensive to perform
intensive sampling in extensive New Zealand beef farms since cattle are infrequently
handled.
The stochastic individual-based BVDV simulation models developed in Chapter 5 were
based on many assumptions about the demographic structure of an average dairy or beef
farm in New Zealand as well as assumptions around the impact and cost of BVDV
outbreaks. For example, the model assumed that beef farmers would only conduct annual
169
screening tests of breeding calves at weaning, which was not a cost-effective strategy since
the removal of PI calves was too late to break the BVDV transmission cycle. It is possible
that this strategy would have been more cost-effective if farmers were willing to yard and
test calves prior to the start of the next mating period. The model results of economic
impacts were also highly dependent on both the number of Trojan cows (i.e. non-PI dams
carrying a PI fetus) that were introduced to seed the outbreak and the mortality rate of PI
animals, and the value of these parameters used in this study may not accurately reflect the
true epidemiological situation for all individual herds in New Zealand. As another future
direction for research, it would be interesting to use longitudinal data about production
performance, such as milk yield and live-weight gain, of individual animals with their
BVDV infection status over time and then fit the models to more accurately predict the
economic benefits of controlling BVDV.
The stochastic individual-based metapopulation model developed for Chapter 6 was
significantly limited by the lack of complete and accurate data on the demographics of
individual cattle and cattle farms in the NAIT system as well as the lack of information on
the true BVDV status of individual cattle. Given that the simulation model was based on
inferred demographic structures, it is likely that the dynamics of BVDV transmission in the
New Zealand cattle population differ in the real world. Furthermore, the cattle trade
movements for the model were also simulated from NAIT data, which has known issues
with underreporting of movements, particularly those involving the temporary movement
of animals to off-site locations (Edge & Kavalali, 2018). The contribution of animal
movements to between-farm BVDV transmission may therefore be underestimated in the
national model, leading to a further underestimation in the cost-effectiveness of movement
restriction as a strategy to control BVDV in New Zealand. However, it is worth noting that
less than 9% of PI animals generated in Irish herds were attributable to cattle movements
(Reardon et al., 2018), so it is possible that the impact of underestimated animal movements
on national BVDV transmission in New Zealand might also be negligible. Regardless,
170
future effort should be made to establish a database that effectively collects the
demographics and movement of individual cattle and records their BVDV infection status
in order to better understand between-farm BVDV transmission in the country.
7.7. Future work: feasibility of BVDV elimination in New Zealand
Largely due to efforts by the BVD Steering Committee in providing extension resources
to veterinarians, there has been significant progress towards increasing awareness of
BVDV and the uptake of control measures in the New Zealand cattle industries (Stewart,
2013). It has led to the reduction of overall prevalence of farms with active BVDV infection
over the last 10 years (Gates, Han, et al., 2019; Thobokwe et al., 2004). Once BVDV is
eliminated from New Zealand, it would be relatively easy for the country to maintain the
freedom given the remote geographic location with strict biosecurity measures at the border.
However, the readiness of BVDV elimination for the New Zealand cattle industries is
still in question. According to Dowdle, (1999), three preconditions — (1) an effective
measure to intervene the transmission of the host, (2) practical diagnostic tests with high
sensitivity and specificity, and (3) a lack of other reservoir hosts that amplify the disease
in the environment — are crucial to eliminate a disease. Although this thesis has generated
additional insights into the cost-effectiveness of different BVDV elimination programmes
designed with commercially available and reliable diagnostic tests to intervene the
transmission of BVDV in New Zealand, there are still knowledge gaps that should be
targeted as a part of future research for the New Zealand cattle industry to meet these
preconditions.
7.7.1. Accurate data
First, there is a general lack of accurate data about the demographics of New Zealand
cattle, particularly in the beef sector. In order to support future disease control efforts, data
recording systems need to capture the current list or number of animals within each farm,

171
number of active or commercial beef farms, boundary or exact location of cattle farms, and
the production type of cattle farms (e.g. beef breeding, beef fattening, or bull breeding).
Moreover, animal movements between different premises are not properly captured due to
the lack of compliance of farmers, and it is obscure how many animals are grazed off-site
at which locations, or how often animals owned by share-milkers are moved between
different premises. Also, only the overall production data of the country (i.e. national milk
solid production per year, total weight of exported beef meat, or total number of slaughtered
animals per month) is available, and information about the production performance of
individual herds is either not recorded or recorded without tracking their infection status of
BVDV or other diseases. Although there are some platforms (e.g. AgriBase, FarmsOnLine,
MINDA, or NAIT) that have the capacity to capture some of this information, the data
collected via these systems are not generally up-to-date and there is a lack of compatibility
between the different databases that impedes data aggregation (Jewell et al., 2016). Poor
demographic data quality is known to have a significant impact on simulation model results.
For instance, Van Andel et al., (2018) showed that disease modelling based on inaccurate
demographic information led to different estimates of the length and severity of foot-and-
mouth disease epidemics in New Zealand compared with models based on a “true” dataset.
This highlights the necessity of establishing a database system with accurate demographic
and production information and disease status to track epidemiological situation over time.
7.7.2. Social acceptability
Although the simulation models predicted that BVDV control would be cost-effective
at both the herd and national level, gaining social acceptance for implementing a national
BVDV control is likely to be a significant hurdle. Previous studies have shown that a
variety of factors, including farmers’ knowledge about the disease, herd size, market-driven
economic premiums, or social and cultural significance (e.g. recognised as “good farmer”
by others), are complexly associated with their decision to participate in control
programmes (Garforth et al., 2013; Kristensen & Jakobsen, 2011; McAloon et al., 2017;
172
Nöremark et al., 2010). In New Zealand, a recent study of beef cattle farmer opinions
towards BVDV control noted that animal health concerns such as parasite infections or
mineral deficiencies were higher on the list of farmer priorities than BVDV (Gates, Evans,
et al., 2019). Also, this thesis showed that there was no significant correlation between New
Zealand farmers’ knowledge about BVDV and their implementation of biosecurity
measures to prevent the disease (chapter 3). Therefore, it is unlikely that simply providing
farmers and industry stakeholders with information about the economic incentives for
eliminating a disease would be sufficient to make them implement any control measures
(van Asseldonk et al., 2010). Further research into the social science of understanding what
motivates New Zealand farmers and stakeholders to join a control programme are needed
to identify more effective strategies to engage farmers, veterinarians, and industry
stakeholders to implement a systematic control programme that meets their needs.
7.7.3. Governmental support
Under the current legislative framework in New Zealand, any costs related to
government veterinary services for “endemic disease control and eradication” are covered
by livestock owners rather than the Ministry for Primary Industries (Lawrence, 2001).
Accordingly, since BVDV has been endemic since at least the 1960s (Salisbury et al., 1961),
there have been no government subsidies to control BVDV in the New Zealand cattle
industry. However, it has been noted in the European countries with formal BVDV control
programmes that legislative and financial support for farmers from governments is essential
to successful BVDV control (Bitsch et al., 2000; Lindberg et al., 2006). Farmers in Ireland
receive financial compensation for culling identified PI animals on their farms (Graham et
al., 2014), and subsidies from the government for testing, vaccinating, and culling animals
to control BVDV may help facilitate farmer compliance with national BVDV control
programmes in New Zealand.

173
7.7.4. Other possible limitations
Although RT-PCR of BVDV is commonly used in the commercial diagnostic laboratory,
there is limited knowledge of the genotypes of endemic BVDV strains in New Zealand
with the last reported study conducted in 1998 (Vilček et al., 1998). It has been proven in
countries with genetic databanks of prevalent BVDV strains that molecular epidemiology
is a useful tool to increase the understanding of BVDV transmission (Booth et al., 2013;
Ståhl et al., 2005). By conducting phylogenetic analysis to investigate the epidemiological
links between field BVDV strains collected from different cattle farms, better
understanding about the important routes of BVDV transmission between New Zealand
herds could be achieved.
Finally, the role of sheep in BVDV transmission in the New Zealand cattle industries
also warrants further investigation, especially given the large number of New Zealand beef
herds are co-grazed with sheep. Even though sheep are considered spill-over hosts of
BVDV from cattle populations, a recent study found serological evidence of BVDV
infection in sheep flocks that were co-grazed on New Zealand cattle farms where active
BVDV circulation was highly suspected (Evans, Han, et al., 2019). Also, a case report has
shown that BVDV PI lambs can be generated through close contact with PI heifers (King,
2014). Although no studies have yet demonstrated BVDV transmission from PI sheep back
to naïve cattle on New Zealand farms, there has been a report in the literature of a PI ram
serving as the source of BVDV circulation on some Danish cattle farms (Bitsch et al., 2000).
Accounting for the epidemiological and economic impacts of BVDV in sheep could
potentially make national BVDV control even more cost-effective for New Zealand cattle
farms.
174
7.8. Conclusion
BVDV is prevalent in cattle farms in New Zealand, and its economic impacts including
direct and indirect losses and current expenses for voluntary controls on the whole cattle
industries are believed to be significant. To propose cost-effective national BVDV control
programmes for elimination of the disease, the studies in this thesis analysed the risk factors
for BVDV infection and estimated the within-herd BVDV transmission rate to better
understand the epidemiology of BVDV in the New Zealand cattle industries. Also, the
direct losses of a BVDV outbreak and cost-effectiveness of BVDV control in New Zealand
dairy and beef breeding farms were measured to address the economic knowledge gaps
around BVDV and its control in New Zealand. Finally, it was demonstrated that some
control programmes could substantially reduce national BVDV prevalence with attractive
benefit/cost ratios. With these findings, this thesis delivers a key message that successful
BVDV control is technically feasible and economically beneficial in the New Zealand
cattle industries.
Although these results support the technical feasibility of successful control of BVDV,
it should be noted that, in countries where BVDV has been eliminated, the implementation
of BVDV control programmes was initiated by farmers and their representative groups
(Lindberg et al., 2006). Thus, elimination of BVDV in New Zealand will not be achievable
without the compliance and cooperation of farmers and industry stakeholders. Eliciting
support for national BVDV control programmes from farmers and industry stakeholders is
likely to be a challenging task given the current low uptake of voluntary control measure
among New Zealand farmers. Therefore, I sincerely hope the findings of this thesis ignite
farmers, veterinarians, and stakeholders to further engage in discussions about the value
and achievability of national BVDV elimination in the New Zealand farming context.

175

176
Bibliography
Almeida, L. L., Miranda, I. C. S., Hein, H. E., Neto, W. S., Costa, E. F., Marks, F. S.,
Rodenbusch, C. R., Canal, C. W., & Corbellini, L. G. (2013). Herd-level risk factors
for bovine viral diarrhea virus infection in dairy herds from Southern Brazil. Research
in Veterinary Science, 95(3), 901–907.
Anonymous. (2015). BVD, or bovine viral diarrhoea, is probably the most important viral
disease of cattle in New Zealand. BVD Steering Committee.
http://www.controlbvd.org.nz/
Anonymous. (2016a). Consumer price index (2010 = 100). World Bank.
https://data.worldbank.org/indicator/FP.CPI.TOTL?end=2016&start=2002
Anonymous. (2016b). Official exchange rate (LCU per US$, period average). World Bank.
https://data.worldbank.org/indicator/PA.NUS.FCRF
Anonymous. (2016c). The Scottish BVD Eradication Scheme. Scottish Government, Scotland.
http://www.gov.scot/Topics/farmingrural/Agriculture/animal-
welfare/Diseases/disease/bvd/eradication/Manannualscreening/Mintestmethods
Anonymous. (2016d). Stock exclusion costs report (MPI Technical Paper No. 2017/11).
Ministry of primiary industries.
Anonymous. (2017a). Compendium of New Zealand: Farm facts 2017 (No. 41; pp. 1–28).
Beef + Lamb New Zealand.
Anonymous. (2017b). National animal identification and tracing (NAIT). OSPRI, New
Zealand.
Anonymous. (2017c). OIE-Listed diseases, infections and infestation in force in 2017. World
Organisation for Animal Health. http://www.oie.int/animal-health-in-the-world/oie-
listed-diseases-2017/
Anonymous. (2018a). New Zealand dairy statistics 2017-18. Livestock Improvement
Coporation Limited & DairyNZ limited.
https://www.dairynz.co.nz/media/5790451/nz-dairy-statistics-2017-18.pdf

177
Anonymous. (2018b). OIE-Listed diseases, infections and infestation in force in 2018. World
Organisation for Animal Health. http://www.oie.int/animal-health-in-the-world/oie-
listed-diseases-2018/
Anonymous. (2018c, June 30). Livestock numbers by regional council.
http://nzdotstat.stats.govt.nz/wbos/Index.aspx?_ga=2.230301020.1335478094.15781
79419-1784335288.1578179419
Anonymous. (2018d, September 13). Farmgate milk prices. Fonterra.
https://www.fonterra.com/nz/en/investors/farmgate-milk-prices.html
Anonymous. (2019a, September 3). Artificial breeding technician service. LIC.
https://www.lic.co.nz/products-and-services/artificial-breeding/artificial-breeding-
technician-service/
Anonymous. (2019b, September 3). Livestock for sale. AgOnline.
https://www.agonline.co.nz/Livestock-for-Sale
Anonymous. (2019c, September 3). Price trend graphs. Beef+Lamb New Zealand.
https://beeflambnz.com/data-tools/price-trend-graphs
Anonymous. (2019d, September 30). Bovine viral diarrhoea testing. LIC.
https://www.lic.co.nz/products-and-services/animal-health-and-dna-testing/bovine-
viral-diarrhoea-testing/
Anonymous. (2020). OIE-Listed diseases, infections and infestation in force in 2020. World
Organisation for Animal Health. http://www.oie.int/animal-health-in-the-world/oie-
listed-diseases-2018/
Azbel-Jackson, L., Heffernan, C., Gunn, G., & Brownlie, J. (2018). Exploring the role of
voluntary disease schemes on UK farmer bio-security behaviours: Findings from the
Norfolk-Suffolk Bovine Viral Diarrhoea control scheme. PLoS ONE, 13(2).
http://dx.plos.org/10.1371/journal.pone.0179877
Baker, J. C. (1995). The clinical manifestations of bovine viral diarrhea infection. Veterinary
Clinics of North America: Food Animal Practice, 11(3), 425–445.
178
Baszler, T. V., Evermann, J. F., Kaylor, P. S., Byington, T. C., & Dilbeck, P. M. (1995).
Diagnosis of Naturally Occurring Bovine Viral Diarrhea Virus Infections in
Ruminants Using Monoclonal Antibody-based Immunohistochemistry. Veterinary
Pathology, 32(6), 609–618. https://doi.org/10.1177/030098589503200601
Beaudeau, F., Belloc, C., Seegers, H., Assié, S., Pourquier, P., & Joly, A. (2001). Informative
value of an indirect enzyme‐linked immunosorbent assay (ELISA) for the detection
of bovine viral diarrhoea virus (BVDV) antibodies in milk. Journal of Veterinary
Medicine, Series B, 48(9), 705–712.
Beaudeau, F., Belloc, C., Seegers, H., Assié, S., Sellal, E., & Joly, A. (2001). Evaluation of a
blocking ELISA for the detection of bovine viral diarrhoea virus (BVDV) antibodies
in serum and milk. Veterinary Microbiology, 80(4), 329–337.
Beaumont, M. A. (2019). Approximate Bayesian Computation. Annual Review of Statistics
and Its Application, 6(1), 379–403.
Bedekovi, T., Jemerši, L., Lojki, I., Lemo, N., Keros, T., Balatinac, J., Brni, D., Ivkovi, T. C.,
& Madi, J. (2012). Bovine viral diarrhoea: Ag ELISA and reverse transcription
polymerase chain reaction as diagnostic tools in pooled serum samples from
persistently infected cattle—Short communication. Journal Veterinarski Arhive, 82(3),
295–301.
Bertorelle, G., Benazzo, A., & Mona, S. (2010). ABC as a flexible framework to estimate
demography over space and time: Some cons, many pros. Molecular Ecology, 19(13),
2609–2625.
Bitsch, V., Hansen, K. E. L., & Rønsholt, L. (2000). Experiences from the Danish programme
for eradication of bovine virus diarrhoea (BVD) 1994–1998 with special reference to
legislation and causes of infection. Veterinary Microbiology, 77(1), 137–143.
Booth, R. E., Thomas, C. J., El-Attar, L. M. R., Gunn, G. J., & Brownlie, J. (2013). A
phylogenetic analysis of bovine viral diarrhoea virus (BVDV) isolates from six
different regions of the UK and links to animal movement data. Veterinary Research,
44(1). http://www.veterinaryresearch.org/content/44/1/43
179
Bouckaert, R. R. (1995). Bayesian belief networks: From construction to inference [Ph.D.,
Utrecht University]. http://dspace.library.uu.nl/handle/1874/845
Bradstock, M., Watts, J., & Peacock, L. (2018, March). Quarterly review of diagnostic cases:
October to December 2017. Surveillance, New Zealand, 45(1), 5–14.
Brock, K. V., & Cortese, V. S. (2001). Experimental fetal challenge using type II bovine viral
diarrhea virus in cattle vaccinated with modified-live virus vaccine. Veterinary
Therapeutics : Research in Applied Veterinary Medicine, 2(4), 354–360.
Brooks-Pollock, E., de Jong, M. C. M., Keeling, M. J., Klinkenberg, D., & Wood, J. L. N.
(2015). Eight challenges in modelling infectious livestock diseases. Epidemics, 10, 1–
5.
Brooks-Pollock, Ellen, Roberts, G. O., & Keeling, M. J. (2014). A dynamic model of bovine
tuberculosis spread and control in Great Britain. Nature, 511(7508), 228–231.
Brown, J. E., Fitzhugh, H. A., & Cartwright, T. C. (1976). A Comparison of Nonlinear Models
for Describing Weight-Age Relationships in Cattle. Journal of Animal Science, 42(4),
810–818. https://doi.org/10.2527/jas1976.424810x
Brownlie, J., Clarke, M. C., & Howard, C. J. (1984). Experimental production of fatal mucosal
disease in cattle. The Veterinary Record, 114(22), 535–536.
Callan, R. J., Schnackel, J. A., Campen, H. V., Mortimer, R. G., Cavender, J. A., & Williams,
E. S. (2002). Percutaneous collection of fetal fluids for detection of bovine viral
diarrhea virus infection in cattle. Journal of the American Veterinary Medical
Association, 220(9), 1348–1352. https://doi.org/10.2460/javma.2002.220.1348
Cherry, B. R., Reeves, M. J., & Smith, G. (1998). Evaluation of bovine viral diarrhea virus
control using a mathematical model of infection dynamics. Preventive Veterinary
Medicine, 33(1), 91–108.
Cleveland, S. M., Salman, M. D., & Van Campen, H. (2006). Assessment of a bovine viral
diarrhea virus antigen capture ELISA and a microtiter virus isolation ELISA using
pooled ear notch and serum samples. Journal of Veterinary Diagnostic Investigation,
18(4), 395–398.

180
Collins, M. E., Heaney, J., Thomas, C. J., & Brownlie, J. (2009). Infectivity of pestivirus
following persistence of acute infection. Veterinary Microbiology, 138(3), 289–296.
Compton, C. W. R., & McDougall, S. (2005). Survey of bulk tank milk BVDV antibody tests
and reproductive performance in 141 Waikato dairy herds. 87–95.
Compton, C. W. R., McDougall, S., & Heuer, C. (2006). Bovine viral diarrhoea virus in dairy
cattle in New Zealand- studies on its prevalence, biologic and economic impact.
Proceedings of the New Zealand Society of Animal Production, 66, 162–167.
Coria, M. F., & McClurkin, A. W. (1978). Duration of active and colostrum-derived passive
antibodies to bovine viral diarrhea virus in calves. Canadian Journal of Comparative
Medicine, 42(2), 239–243.
Cuttance, E., Mason, W. A., McDermott, J., Laven, R. A., McDougall, S., & Phyn, C. V. C.
(2017). Calf and replacement heifer mortality from birth until weaning in pasture-
based dairy herds in New Zealand. Journal of Dairy Science, 100(10), 8347–8357.
Cuttance, W., & Cuttance, E. (2014). Analysis of individual farm investigations into bovine
viral diarrhoea in beef herds in the North Island of New Zealand. New Zealand
Veterinary Journal, 62(6), 338–342.
Damman, A., Viet, A.-F., Arnoux, S., Guerrier-Chatellet, M.-C., Petit, E., & Ezanno, P. (2015).
Modelling the spread of bovine viral diarrhea virus (BVDV) in a beef cattle herd and
its impact on herd productivity. Veterinary Research, 46(1), 12.
Devitt, C., Graham, D. A., Coughlan, S., & O’Flaherty, J. (2014). Herd owner experiences of
the voluntary phase of a BVD eradication programme: TABLE 1: Veterinary Record,
174(19), 479.1-479.
Dowdle, W. R. (1999, December 31). The principles of disease elimination and eradication.
The Principles of Disease Elimination and Eradication.
https://www.cdc.gov/mmwr/preview/mmwrhtml/su48a7.htm
Downey, E. D., Tait, R. G., Mayes, M. S., Park, C. A., Ridpath, J. F., Garrick, D. J., & Reecy,
J. M. (2013). An evaluation of circulating bovine viral diarrhea virus type 2 maternal

181
antibody level and response to vaccination in Angus calves. Journal of Animal Science,
91(9), 4440–4450.
Downey-Slinker, E. D., Ridpath, J. F., Sawyer, J. E., Skow, L. C., & Herring, A. D. (2016).
Antibody titers to vaccination are not predictive of level of protection against a BVDV
type 1b challenge in Bos indicus—Bos taurus steers. Vaccine, 34(42), 5053–5059.
Dubovi, E. J. (2013). Laboratory diagnosis of bovine viral diarrhea virus. Biologicals, 41(1),
8–13.
Duffell, S. J., & Harkness, J. W. (1985). Bovine virus diarrhoea-mucosal disease infection in
cattle. Veterinary Record, 117(10), 240–245. https://doi.org/10.1136/vr.117.10.240
Edge, M., & Kavalali, B. (2018). NAIT review: Final report on the recommendations (pp. 1–
58). OSPRI.
Ellison, R. S. (2011). Bovine viral diarrhoea (BVD): A framework for control in dairy and
beef herds. Proceedings of the Society of Sheep and Beef Cattle Veterinarians of the
New Zealand Veterinary Association, Annual Seminar 2011, 2.30.1-2.30.7.
Ellison, R. S., & Weir, A. M. (2017, February). Keeping control of BVD. Vetscript, New
Zealand, 30(1), 14–15.
Ersbøll, A. K., & Stryhn, H. (2000). Epidemiological modeling of infectious diseases in
animals: Bovine virus diarrhoea in Danish dairy herds. International Symposia on
Veterinary Epidemiology and Economics Proceedings, Infectious disease modeling:
Respiratory disease&mastitis in cattle session, 498.
http://www.sciquest.org.nz/node/71334
Evans, C. A., Han, J.-H., Weston, J. F., Heuer, C., & Gates, M. C. (2019). Serological evidence
for exposure to bovine viral diarrhoea virus in sheep co-grazed with beef cattle in New
Zealand: New Zealand Veterinary Journal: Vol 0, No ja. New Zealand Veterinary
Journal, XX(X), XX–XX.
Evans, C. A., Pinior, B., Larska, M., Graham, D., Schweizer, M., Guidarini, C., Decaro, N.,
Ridpath, J., & Gates, M. C. (2019). Global knowledge gaps in the prevention and
182
control of bovine viral diarrhoea (BVD) virus. Transboundary and Emerging Diseases,
66(2), 640–652.
Ezanno, P., Fourichon, C., Viet, A.-F., & Seegers, H. (2007). Sensitivity analysis to identify
key-parameters in modelling the spread of bovine viral diarrhoea virus in a dairy herd.
Preventive Veterinary Medicine, 80(1), 49–64.
Fastier, L. B., & Hansen, N. F. (1966). The occurrence of antibodies to bovine virus diarrhoea,
infectious bovine rhinotracheitis and parainfluenza 3 viruses in sera from New
Zealand cattle. New Zealand Veterinary Journal, 14(3–4), 27–32.
Firestone, S. M., Lewis, F. I., Schemann, K., Ward, M. P., Toribio, J.-A. L. M. L., Taylor, M.
R., & Dhand, N. K. (2014). Applying Bayesian network modelling to understand the
links between on-farm biosecurity practice during the 2007 equine influenza outbreak
and horse managers’ perceptions of a subsequent outbreak. Preventive Veterinary
Medicine, 116(3), 243–251.
Foddai, A., Enøe, C., Krogh, K., Stockmarr, A., & Halasa, T. (2014). Stochastic simulation
modeling to determine time to detect bovine viral diarrhea antibodies in bulk tank milk.
Preventive Veterinary Medicine, 117(1), 149–159.
Fournié, G., Waret-Szkuta, A., Camacho, A., Yigezu, L. M., Pfeiffer, D. U., & Roger, F.
(2018). A dynamic model of transmission and elimination of peste des petits
ruminants in Ethiopia. Proceedings of the National Academy of Sciences, 115(33),
8454–8459.
Fray, M. D., Paton, D. J., & Alenius, S. (2000). The effects of bovine viral diarrhoea virus on
cattle reproduction in relation to disease control. Animal Reproduction Science, 60–
61, 615–627.
Fredriksen, B., Sandvik, T., Loken, T., & Odegaard, S. A. (1999). Level and duration of serum
antibodies in cattle infected experimentally and naturally with bovine virus diarrhoea
virus. The Veterinary Record, 144(5), 111–114.
Fulton, R. W., Whitley, E. M., Johnson, B. J., Ridpath, J. F., Kapil, S., Burge, L. J., Cook, B.
J., & Confer, A. W. (2009). Prevalence of bovine viral diarrhea virus (BVDV) in

183
persistently infected cattle and BVDV subtypes in affected cattle in beef herds in south
central United States. Canadian Journal of Veterinary Research, 73(4), 283–291.
Fux, R., & Wolf, G. (2012). Transient elimination of circulating bovine viral diarrhoea virus
by colostral antibodies in persistently infected calves: A pitfall for BVDV-eradication
programs? Veterinary Microbiology, 161(1), 13–19.
García-Muñiz, J. G., Holmes, C. W., Garrick, D. J., López-Villalobos, N., Wickham, B. W.,
Wilson, G. F., Brookes, I. M., & Purchas, R. W. (1998). Growth curves and
productivity of Holstein-Friesian cows bred for heavy or light mature live weight.
Proceedings of the New Zealand Society of Animal Production, 58, 6.
Gareth, E., Damian, M., Rhiannon, N., Lucy, B., Sara, H. D., & Christl, A. D. (2019). An
assessment of risk compensation and spillover behavioural adaptions associated with
the use of vaccines in animal disease management. Vaccine, XX(XX), X–X.
Garforth, C. J., Bailey, A. P., & Tranter, R. B. (2013). Farmers’ attitudes to disease risk
management in England: A comparative analysis of sheep and pig farmers. Preventive
Veterinary Medicine, 110(3), 456–466.
Gates, M. C., Evans, C. A., Han, J.-H., Heuer, C., & Weston, J. F. (2019). Practices and
opinions of New Zealand beef cattle farmers towards bovine viral diarrhoea control in
relation to real and perceived herd serological status. New Zealand Veterinary Journal,
68(2), 92–100.
Gates, M. C., Han, J.-H., Evans, C. A., Weston, J. F., & Heuer, C. (2019). Assessing the use
of diagnostic laboratory accession data to support national bovine viral diarrhoea
control in New Zealand. New Zealand Veterinary Journal, 67(4), 194–202.
Gates, M. C., Humphry, R. W., Gunn, G. J., & Woolhouse, M. E. J. (2014). Not all cows are
epidemiologically equal: Quantifying the risks of bovine viral diarrhoea virus (BVDV)
transmission through cattle movements. Veterinary Research, 45(110), 1–15.
Gates, M. C., Woolhouse, M. E. J., Gunn, G. J., & Humphry, R. W. (2013). Relative
associations of cattle movements, local spread, and biosecurity with bovine viral

184
diarrhoea virus (BVDV) seropositivity in beef and dairy herds. Preventive Veterinary
Medicine, 112(3–4), 285–295.
Geenty, K., & Morris, S. (2017). Guide to New Zealand cattle farming. Beef + Lamb.
Gelman, A., Carlin, J. B., Stern, H. S., Dunson, D. B., Vehtari, A., Rubin, D. B., Carlin, J. B.,
Stern, H. S., Dunson, D. B., Vehtari, A., & Rubin, D. B. (2013). Bayesian Data
Analysis (3rd ed.). Chapman and Hall/CRC.
Gethmann, J., Probst, C., Bassett, J., Blunk, P., Hövel, P., & Conraths, F. J. (2019). An
Epidemiological and Economic Simulation Model to Evaluate Strategies for the
control of Bovine Virus Diarrhea in Germany. Frontiers in Veterinary Science, 6(406),
1–14.
Goens, S. D. (2002). The evolution of bovine viral diarrhea: A review. The Canadian
Veterinary Journal, 43(12), 946–954.
Graham, D. A., Lynch, M., Coughlan, S., Doherty, M. L., O’Neill, R., Sammin, D., &
O’Flaherty, J. (2014). Development and review of the voluntary phase of a national
BVD eradication programme in Ireland. The Veterinary Record, 174(3), 67–67.
Grooms, D. L. (2004). Reproductive consequences of infection with bovine viral diarrhea virus.
The Veterinary Clinics of North America: Food Animal Practice, 20(1), 5–19.
Grooms, D. L., Bolin, S. R., Coe, P. H., Borges, R. J., & Coutu, C. E. (2007). Fetal protection
against continual exposure to bovine viral diarrhea virus following administration of
a vaccine containing an inactivated bovine viral diarrhea virus fraction to cattle.
American Journal of Veterinary Research, 68(12), 1417–1422.
Grummer, B., Bendfeldt, S., & Greiser‐Wilke, I. (2002). Apoptosis inhibitors delay the
cytopathic effect of bovine viral diarrhoea virus (BVDV). Journal of Veterinary
Medicine, Series B, 49(6), 298–303.
Guinat, C., Porphyre, T., Gogin, A., Dixon, L., Pfeiffer, D. U., & Gubbins, S. (2018). Inferring
within‐herd transmission parameters for African swine fever virus using mortality
data from outbreaks in the Russian Federation. Transboundary and Emerging
Diseases, 65(2), e264–e271.

185
Gunn, G. J., Stott, A., & Humphry, R. W. (2004). Modelling and costing BVD outbreaks in
beef herds. The Veterinary Journal, 167(2), 143–149.
Hage, J. J., Schukken, Y. H., Barkema, H. W., Benedictus, G., Rijsewijk, F. A. M., & Wentink,
G. H. (1996). Population dynamics of bovine herpesvirus 1 infection in a dairy herd.
Veterinary Microbiology, 53(1), 169–180.
Han, J.-H., Holter, J., Moffat, J., Weston, J. F., Heuer, C., & Gates, M. C. (2018). Using
Bayesian network modelling to untangle farm management risk factors for bovine
viral diarrhoea virus infection. Preventive Veterinary Medicine, 161, 75–82.
Han, J.-H., Weir, A. M., Weston, J. F., Heuer, C., & Gates, M. C. (2018). Elimination of bovine
viral diarrhoea virus in New Zealand: A review of research progress and future
directions. New Zealand Veterinary Journal, 66(6), 273–280.
Han, J.-H., Weston, J. F., Heuer, C., & Gates, M. C. (2019). Estimation of the within-herd
transmission rates of bovine viral diarrhoea virus in extensively grazed beef cattle
herds. Veterinary Research, 50(1), 103.
Heffernan, C., Azbel-Jackson, L., Brownlie, J., & Gunn, G. (2016). Farmer attitudes and
livestock disease: Exploring citizenship behaviour and peer monitoring across two
BVD control schemes in the UK. PLoS ONE, 11(3), e0152295.
https://doi.org/10.1371/journal.pone.0152295
Heuer, C., Healy, A., & Zerbini, C. (2007). Economic effects of exposure to bovine viral
diarrhea virus on dairy herds in New Zealand. Journal of Dairy Science, 90(12), 5428–
5438.
Heuer, C., Tattersfield, G., West, D. M., & Olson, W. O. (2008). Effect of reproductive
pathogens on pregnancy rates in beef herds (Neospora caninum, BVD virus and
Leptospira sv. Hardjo and Pomona). Proceedings of the Society of Sheep and Beef
Cattle Veterinarians of the NZVA, 141–147.
Hickson, R. E., Anderson, W. J., Kenyon, P. R., Lopez-Villalobos, N., & Morris, S. (2012). A
survey detailing the calving performance of primiparous 2-year-old beef heifers and
outcomes of assisted calving. New Zealand Veterinary Journal, 60(1), 35–41.

186
Hickson, R. E., Zhang, I. L., & McNaughton, L. R. (2015). BRIEF COMMUNICATION:
Birth weight of calves born to dairy cows in New Zealand. Proceedings of the New
Zealand Society of Animal Production, 75, 257–259.
Hidano, A., Carpenter, T. E., Stevenson, M. A., & Gates, M. C. (2016). Evaluating the efficacy
of regionalisation in limiting high-risk livestock trade movements. Preventive
Veterinary Medicine, 133, 31–41.
Hill, F. I., McCoy, R., Lanyon, S. R., & Reichel, M. P. (2010). Predicting BVDv infection
status with pooled sera testing. Vetscript, 23(4), 38–39.
Hill, F. I., Reichel, M. P., McCoy, R. J., & Tisdall, D. J. (2007). Evaluation of two commercial
enzyme-linked immunosorbent assays for detection of bovine viral diarrhoea virus in
serum and skin biopsies of cattle. New Zealand Veterinary Journal, 55(1), 45–48.
Hill, F. I., Reichel, M. P., & Tisdall, D. J. (2010). Use of molecular and milk production
information for the cost-effective diagnosis of bovine viral diarrhoea infection in New
Zealand dairy cattle. Veterinary Microbiology, 142(1), 87–89.
Houe, H. (1993). Survivorship of animals persistently infected with bovine virus diarrhoea
virus (BVDV). Preventive Veterinary Medicine, 15(4), 275–283.
Houe, H. (1994). Bovine virus diarrhoea virus: Detection of Danish dairy herds with
persistently infected animals by means of a screening test of ten young stock.
Preventive Veterinary Medicine, 19(3), 241–248.
Houe, H. (1999). Epidemiological features and economical importance of bovine virus
diarrhoea virus (BVDV) infections. Veterinary Microbiology, 64(2), 89–107.
Houe, H. (2005). Risk assessment. In Bovine viral diarrhea virus: Diagnosis, management,
and control (1st ed., pp. 35–64). Blackwell Publishing.
Houe, H., Lindberg, A., & Moennig, V. (2006). Test strategies in bovine viral diarrhea virus
control and eradication campaigns in Europe. Journal of Veterinary Diagnostic
Investigation, 18(5), 427–436.
187
Houe, H., & Meyling, A. (1991). Prevalence of bovine virus diarrhoea (BVD) in 19 Danish
dairy herds and estimation of incidence of infection in early pregnancy. Preventive
Veterinary Medicine, 11(1), 9–16.
Innocent, G., Morrison, I., Brownlie, J., & Gettinby, G. (1997). A computer simulation of the
transmission dynamics and the effects of duration of immunity and survival of
persistently infected animals on the spread of bovine viral diarrhoea virus in dairy
cattle. Epidemiology and Infection, 119(1), 91–100.
Jewell, C. P., Van Andel, M., Vink, W. D., & McFadden, A. M. (2016). Compatibility between
livestock databases used for quantitative biosecurity response in New Zealand. New
Zealand Veterinary Journal, 64(3), 158–164.
Jolly, R. D., Fastier, L. B., & McAllum, H. J. F. (1967). Bovine virus diarrhoea (mucosal
disease): Case report and virus isolation. New Zealand Veterinary Journal, 15(10),
178–180.
Jones, B. A., Sauter-Louis, C., Henning, J., Stoll, A., Nielen, M., Van Schaik, G., Smolenaars,
A., Schouten, M., Uijl, I. den, Fourichon, C., Guatteo, R., Madouasse, A., Nusinovici,
S., Deprez, P., De Vliegher, S., Laureyns, J., Booth, R., Cardwell, J. M., & Pfeiffer,
D. U. (2013). Calf-level factors associated with bovine neonatal pancytopenia—A
multi-country case-control study. PLoS ONE, 8(12).
http://dx.plos.org/10.1371/journal.pone.0080619
Kelling, C. L. (2004). Evolution of bovine viral diarrhea virus vaccines. Veterinary Clinics of
North America: Food Animal Practice, 20(1), 115–129.
Kendrick, J. W., & Franti, C. E. (1974). Bovine viral diarrhea: Decay of colostrum-conferred
antibody in the calf. American Journal of Veterinary Research, 35(4), 589–591.
King, C. (2014). BVDV in sheep, diagnosis and control. Proceedings of the Society of Sheep
and Beef Cattle Veterinarians of the New Zealand Veterinary Association, Annual
Seminar 2014, 6.23.1-6.23.6.
Kommisrud, E., Vatn, T., Lang-Ree, J. R., & Løken, T. (1996). Bovine virus diarrhoea virus
in semen from acutely infected bulls. Acta Veterinaria Scandinavica, 37(1), 41–47.
188
Kristensen, E., & Jakobsen, E. B. (2011). Danish dairy farmers’ perception of biosecurity.
Preventive Veterinary Medicine, 99(2), 122–129.
Kuhne, S., Schroeder, C., Holmquist, G., Wolf, G., Horner, S., Brem, G., & Ballagi, A. (2005).
Detection of bovine viral diarrhoea virus infected cattle–testing tissue samples derived
from ear tagging using an Erns capture ELISA. Journal of Veterinary Medicine, Series
B, 52(6), 272–277.
Kümmerer, B. M., Tautz, N., Becher, P., Thiel, H.-J., & Meyers, G. (2000). The genetic basis
for cytopathogenicity of pestiviruses. Veterinary Microbiology, 77(1), 117–128.
Lanyon, S. R., Anderson, M. L., Bergman, E., & Reichel, M. P. (2013). Validation and
evaluation of a commercially available ELISA for the detection of antibodies specific
to bovine viral diarrhoea virus (bovine pestivirus). Australian Veterinary Journal,
91(1–2), 52–56.
Lanyon, S. R., Hill, F. I., Reichel, M. P., & Brownlie, J. (2014). Bovine viral diarrhoea:
Pathogenesis and diagnosis. The Veterinary Journal, 199(2), 201–209.
Lash, T. L., Fox, M. P., & Fink, A. K. (2011). Applying Quantitative Bias Analysis to
Epidemiologic Data. Springer Science & Business Media.
Lawrence, D. S. (2001). Reform and decentralization of agricultural services: A policy
framework. FAO Agricultural Policy and Economic Development Series, 7.
http://www.fao.org/3/y2006e/y2006e00.htm#Contents
Lewis, F. I., Brülisauer, F., & Gunn, G. J. (2011). Structure discovery in Bayesian networks:
An analytical tool for analysing complex animal health data. Preventive Veterinary
Medicine, 100(2), 109–115.
Lewis, F. I., & McCormick, B. J. J. (2012). Revealing the complexity of health determinants
in resource-poor settings. American Journal of Epidemiology, 176(11), 1051–1059.
Liebler-Tenorio, E. M. (2005). Pathogenesis. In Bovine viral diarrhea virus: Diagnosis,
management, and control (1st ed., pp. 91–104). Blackwell Publishing.
Liebler-Tenorio, E. M., Ridpath, J. F., & Neill, J. D. (2002). Distribution of viral antigen and
development of lesions after experimental infection with highly virulent bovine viral
189
diarrhea virus type 2 in calves. American Journal of Veterinary Research, 63(11),
1575–1584.
Liebler-Tenorio, E. M., Ridpath, J. F., & Neill, J. D. (2004). Distribution of viral antigen and
tissue lesions in persistent and acute infection with the homologous strain of
noncytopathic bovine viral diarrhea virus. Journal of Veterinary Diagnostic
Investigation, 16(5), 388–396.
Lindberg, A., Brownlie, J., Gunn, G. J., Houe, H., Moennig, V., Saatkamp, H. W., Sandvik,
T., & Valle, P. S. (2006). The control of bovine viral diarrhoea virus in Europe: Today
and in the future. Revue Scientifique et Technique (International Office of Epizootics),
25(3), 961–979.
Lindberg, A., Groenendaal, H., Alenius, S., & Emanuelson, U. (2001). Validation of a test for
dams carrying foetuses persistently infected with bovine viral-diarrhoea virus based
on determination of antibody levels in late pregnancy. Preventive Veterinary Medicine,
51(3), 199–214. https://doi.org/10.1016/S0167-5877(01)00229-X
Lindberg, A., & Houe, H. (2005). Characteristics in the epidemiology of bovine viral diarrhea
virus (BVDV) of relevance to control. Preventive Veterinary Medicine, 72(1), 55–73.
Løken, T., & Nyberg, O. (2013). Eradication of BVDV in cattle: The Norwegian project. The
Veterinary Record, 172(25), 661–661.
McAloon, C. G., Macken-Walsh, Á., Moran, L., Whyte, P., More, S. J., O’Grady, L., &
Doherty, M. L. (2017). Johne’s disease in the eyes of Irish cattle farmers: A qualitative
narrative research approach to understanding implications for disease management.
Preventive Veterinary Medicine, 141, 7–13.
McArthur, M. J. (2004). Foetal protection provided by Viracare 3 vaccine in seronegative
heifers when challenged with a New Zealand strain of bovine viral diarrhoea virus.
Proceedings of the Society of Sheep and Beef Cattle Veterinarians of the New Zealand
Veterinary Association, Annual Seminar 2004, 109–119.
190
McClurkin, A. W., Littledike, E. T., Cutlip, R. C., Frank, G. H., Coria, M. F., & Bolin, S. R.
(1984). Production of cattle immunotolerant to bovine viral diarrhea virus. Canadian
Journal of Comparative Medicine, 48(2), 156–161.
McCormick, B. J. J., Stott, A. W., Brülisauer, F., Vosough Ahmadi, B., & Gunn, G. J. (2010).
An integrated approach to assessing the viability of eradicating BVD in Scottish beef
suckler herds. Veterinary Microbiology, 142(1), 129–136.
McCormick, Benjamin J. J., Van Breda, L. K., & Ward, M. P. (2017). Bayesian network
analysis of piglet scours. Scientific Reports, 7(1), 6202.
McFadden, A. M., Heuer, C., Jackson, R., West, D. M., & Parkinson, T. J. (2005).
Reproductive performance of beef cow herds in New Zealand. New Zealand
Veterinary Journal, 53(1), 39–44.
McGowan, M. R., Kafi, M., Kirkland, P. D., Kelly, R., Bielefeldt-Ohmann, H., Occhio, M. D.,
& Jillella, D. (2003). Studies of the pathogenesis of bovine pestivirus-induced ovarian
dysfunction in superovulated dairy cattle. Theriogenology, 59(3–4), 1051–1066.
McGowan, M. R., Kirkland, P. D., Richards, S. G., & Littlejohns, I. R. (1993). Increased
reproductive losses in cattle infected with bovine pestivirus around the time of
insemination. The Veterinary Record, 133(2), 39–43.
McNaughton, L. R., Morgan, S. R., Gore, P., Verkerk, G. A., Holmes, C. W., & Parkinson, T.
J. (2002). Monitoring onset of puberty in three genetic strains of Holstein-Friesian
dairy cattle. Proceedings of the New Zealand Society of Animal Production, 62, 30–
33.
Moen, A., Sol, J., & Sampimon, O. (2005). Indication of transmission of BVDV in the absence
of persistently infected (PI) animals. Preventive Veterinary Medicine, 72(1), 93–98.
Moennig, V., & Becher, P. (2018). Control of Bovine Viral Diarrhea. Pathogens, 7(1).
http://www.mdpi.com/2076-0817/7/1/29
Moennig, V., Eicken, K., Flebbe, U., Frey, H.-R., Grummer, B., Haas, L., Greiser-Wilke, I.,
& Liess, B. (2005). Implementation of two-step vaccination in the control of bovine
viral diarrhoea (BVD). Preventive Veterinary Medicine, 72(1), 109–114.

191
Moennig, V., Houe, H., & Lindberg, A. (2005). BVD control in Europe: Current status and
perspectives. Animal Health Research Reviews, 6(01), 63–74.
Moennig, V., & Liess, B. (1995). Pathogenesis of intrauterine infections with bovine viral
diarrhea virus. Veterinary Clinics of North America: Food Animal Practice, 11(3),
477–487.
Moerman, A., Straver, P. J., de Jong, M. C., Quak, J., Baanvinger, T., & van Oirschot, J. T.
(1993). A long term epidemiological study of bovine viral diarrhoea infections in a
large herd of dairy cattle. The Veterinary Record, 132(25), 622–626.
Moffat, J., & Bruere, S. B. (2018). Do BVD vaccinated beef calves lose weight when exposed
to PI animals. Proceedings of the Society of Sheep and Beef Cattle Veterinarians of
the New Zealand Veterinary Association, 103–108.
Morris, C. A., Bennett, G. L., Baker, R. L., & Carter, A. H. (1986). Birth weight, dystocia and
calf mortality in some New Zealand beef breeding herds. Journal of Animal Science,
62(2), 327–343.
Morris, S., Morel, P. C. H., & Kenyon, P. R. (2006). The effect of individual liveweight and
condition of beef cows on their reproductive performance and birth and weaning
weights of calves. New Zealand Veterinary Journal, 54(2), 96–100.
https://doi.org/10.1080/00480169.2006.36619
Müller-Doblies, D., Arquint, A., Schaller, P., Heegaard, P. M. H., Hilbe, M., Albini, S., Abril,
C., Tobler, K., Ehrensperger, F., Peterhans, E., Ackermann, M., & Metzler, A. (2004).
Innate immune responses of calves during transient infection with a noncytopathic
strain of bovine viral diarrhea virus. Clinical and Diagnostic Laboratory Immunology,
11(2), 302–312.
Nagarajan, R., Scutari, M., & Lèbre, S. (2013). Bayesian networks in R - with applications in
systems biology. Springer. https://www.springer.com/gp/book/9781461464457
Newcomer, B. W., Walz, P. H., Givens, M. D., & Wilson, A. E. (2015). Efficacy of bovine
viral diarrhea virus vaccination to prevent reproductive disease: A meta-analysis.
Theriogenology, 83(3), 360-365.e1.

192
Niskanen, R., & Lindberg, A. (2003). Transmission of bovine viral diarrhoea virus by
unhygienic vaccination procedures, ambient air, and from contaminated pens. The
Veterinary Journal, 165(2), 125–130.
Niskanen, R., Lindberg, A., & Alenius, S. (2000). Lack of virus transmission from bovine viral
diarrhoea virus infected calves to susceptible peers. Acta Veterinaria Scandinavica,
41(1), 93–100.
Niskanen, R., Lindberg, A., & Tråvén, M. (2002). Failure to spread bovine virus diarrhoea
virus infection from primarily infected calves despite concurrent infection with bovine
coronavirus. The Veterinary Journal, 163(3), 251–259.
Nöremark, M., Frössling, J., & Lewerin, S. S. (2010). Application of routines that contribute
to on‐farm biosecurity as reported by Swedish livestock farmers. Transboundary and
Emerging Diseases, 57(4), 225–236.
Obritzhauser, W., Klemens, F., & Josef, K. (2005). BVDV infection risk in the course of the
voluntary BVDV eradication program in Styria/Austria. Preventive Veterinary
Medicine, 72(1), 127–132.
Olds, D., & Seath, D. M. (1953). Repeatability, heritability and the effect of level of milk
production on the occurrence of first estrus after calving in dairy cattle. Journal of
Animal Science, 12(1), 10–14.
Packianathan, R., Clough, W. J., Hodge, A., Holz, D. K., Huang, J., Bryant, G. L., & Colantoni,
C. (2017). Prevention of fetal infection in heifers challenged with bovine viral
diarrhoea virus type 1a by vaccination with a type 1c or type 1a vaccine. New Zealand
Veterinary Journal, 65(3), 134–139.
Pasman, E. J., Dijkhuizen, A. A., & Wentink, G. H. (1994). A state-transition model to
stimulate the economics of bovine virus diarrhoea control. Preventive Veterinary
Medicine, 20(4), 269–277.
Passler, T., & Walz, P. H. (2010). Bovine viral diarrhea virus infections in heterologous
species. Animal Health Research Reviews, 11(02), 191–205.
193
Perry, B., McDermott, J., & Randolph, T. (2001). Can epidemiology and economics make a
meaningful contribution to national animal-disease control? Preventive Veterinary
Medicine, 48(4), 231–260. https://doi.org/10.1016/S0167-5877(00)00203-8
Peterhans, E., & Schweizer, M. (2013). BVDV: A pestivirus inducing tolerance of the innate
immune response. Biologicals, 41(1), 39–51.
Petra, K., Sebastian, F., Deirdre, H., C. Jessica, E. M., & Katie, H. (2015). Six challenges in
the eradication of infectious diseases. Epidemics, 10, 97–101.
Pinior, B., Firth, C. L., Richter, V., Lebl, K., Trauffler, M., Dzieciol, M., Hutter, S. E.,
Burgstaller, J., Obritzhauser, W., Winter, P., & Käsbohrer, A. (2017). A systematic
review of financial and economic assessments of bovine viral diarrhea virus (BVDV)
prevention and mitigation activities worldwide. Preventive Veterinary Medicine, 137,
77–92.
Pittavino, M., Dreyfus, A., Heuer, C., Benschop, J., Wilson, P., Collins-Emerson, J., Torgerson,
P. R., & Furrer, R. (2017). Comparison between generalized linear modelling and
additive Bayesian network; identification of factors associated with the incidence of
antibodies against Leptospira interrogans sv Pomona in meat workers in New Zealand.
Acta Tropica, 173, 191–199.
Platt, R., Widel, P. W., Kesl, L. D., & Roth, J. A. (2009). Comparison of humoral and cellular
immune responses to a pentavalent modified live virus vaccine in three age groups of
calves with maternal antibodies, before and after BVDV type 2 challenge. Vaccine,
27(33), 4508–4519.
Plummer, M. (2013). JAGS: a Program for analysis of Bayesian graphical models using Gibbs
sampling. Proceedings of the 3rd International Workshop on Distributed Statistical
Computing, 125, 1–10.
Poon, A. F. Y., Lewis, F. I., Pond, S. L. K., & Frost, S. D. W. (2007a). An Evolutionary-
Network Model Reveals Stratified Interactions in the V3 Loop of the HIV-1 Envelope.
PLoS Computational Biology, 3(11), e231.
194
Poon, A. F. Y., Lewis, F. I., Pond, S. L. K., & Frost, S. D. W. (2007b). Evolutionary
Interactions between N-Linked Glycosylation Sites in the HIV-1 Envelope. PLoS
Computational Biology, 3(1), e11.
Presi, P., & Heim, D. (2010). BVD eradication in Switzerland–a new approach. Veterinary
Microbiology, 142(1), 137–142.
Presi, P., Struchen, R., Knight-Jones, T., Scholl, S., & Heim, D. (2011). Bovine viral diarrhea
(BVD) eradication in Switzerland—Experiences of the first two years. Preventive
Veterinary Medicine, 99(2), 112–121.
Qi, L., Beaunée, G., Arnoux, S., Dutta, B. L., Joly, A., Vergu, E., & Ezanno, P. (2019).
Neighbourhood contacts and trade movements drive the regional spread of bovine
viral diarrhoea virus (BVDV). Veterinary Research, 50(1), 30.
R Core Team. (2016). R: A language and environment for statistical computing. R Foundation
for Statistical Computing. https://www.R-project.org/
R Core Team. (2018). R: A language and environment for statistical computing. R Foundation
for Statistical Computing. https://www.R-project.org/
Radostits, O. M., & Littlejohns, I. R. (1988). New concepts in the pathogenesis, diagnosis and
control of diseases caused by the bovine viral diarrhea virus. The Canadian Veterinary
Journal, 29(6), 513–528.
Reardon, F., Graham, D. A., Clegg, T. A., Tratalos, J. A., O’Sullivan, P., & More, S. J. (2018).
Quantifying the role of Trojan dams in the between-herd spread of bovine viral
diarrhoea virus (BVDv) in Ireland. Preventive Veterinary Medicine, 152, 65–73.
Reichel, M. P., Hill, F. I., & Voges, H. (2008). Does control of bovine viral diarrhoea infection
make economic sense? New Zealand Veterinary Journal, 56(2), 60–66.
Renshaw, R. W., Ray, R., & Dubovi, E. J. (2000). Comparison of virus isolation and reverse
transcription polymerase chain reaction assay for detection of bovine viral diarrhea
virus in bulk milk tank samples. Journal of Veterinary Diagnostic Investigation, 12(2),
184–186.

195
Richter, V., Kattwinkel, E., Firth, C. L., Marschik, T., Dangelmaier, M., Trauffler, M.,
Obritzhauser, W., Baumgartner, W., Käsbohrer, A., & Pinior, B. (2019). Mapping the
global prevalence of bovine viral diarrhoea virus infection and its associated
mitigation programmes. Veterinary Record, 184(23), 711–711.
https://doi.org/10.1136/vr.105354
Richter, V., Lebl, K., Baumgartner, W., Obritzhauser, W., Käsbohrer, A., & Pinior, B. (2017).
A systematic worldwide review of the direct monetary losses in cattle due to bovine
viral diarrhoea virus infection. The Veterinary Journal, 220, 80–87.
Ridpath, J. F. (2013). Immunology of BVDV vaccines. Biologicals, 41(1), 14–19.
Ridpath, J. F., & Bolin, S. R. (1995). Delayed onset postvaccinal mucosal disease as a result
of genetic recombination between genotype 1 and genotype 2 BVDV. Virology,
212(1), 259–262.
Ridpath, J. F., Neill, J. D., Endsley, J., & Roth, J. A. (2003). Effect of passive immunity on
the development of a protective immune response against bovine viral diarrhea virus
in calves. American Journal of Veterinary Research, 64(1), 65–69.
Rüfenacht, J., Schaller, P., Strasser, M., Peterhans, E., & Audige, L. (2000). Prevalence of
cattle infected with bovine viral diarrhoea virus in Switzerland. The Veterinary Record,
147(15), 413–417.
Rypuła, K., Płoneczka-Janeczko, K., Bania, J., Wałecka, E., Bierowiec, K., & Rozpędek, W.
(2013). Reduction of prevalence of persistent BVDV infection in cattle herds by long-
term vaccination program (preliminary clinical study). Polish Journal of Veterinary
Sciences, 16(2), 381–383.
Saliki, J. T., Huchzermeier, R., & Dubovi, E. J. (2000). Evaluation of a new sandwich ELISA
kit that uses serum for detection of cattle persistently infected with BVD Virus. Annals
of the New York Academy of Sciences, 916(1), 358–363.
Salisbury, R. M., Hartley, W. J., McIntosh, I. G., Hansen, N. F., Te Punga, W. A., & Jamieson,
S. (1961). A mucosal diseaes-like syndrome of cattle in New Zealand. Bulletin - Office
International Des Epizooties, 56, 62–78.
196
Saltelli, A., Aleksankina, K., Becker, W., Fennell, P., Ferretti, F., Holst, N., Li, S., & Wu, Q.
(2019). Why so many published sensitivity analyses are false: A systematic review of
sensitivity analysis practices. Environmental Modelling & Software, 114, 29–39.
Sandvik, T., Fredriksen, B., & Løken, T. (1997). Level of viral antigen in blood leucocytes
from cattle acutely infected with bovine viral diarrhoea virus. Journal of Veterinary
Medicine, Series B, 44(1–10), 583–590.
Sandvik, Torstein. (2005). Selection and use of laboratory diagnostic assays in BVD control
programmes. Preventive Veterinary Medicine, 72(1), 3–16.
Sanhueza, J. M., Heuer, C., & West, D. (2013). Contribution of Leptospira, Neospora caninum
and bovine viral diarrhea virus to fetal loss of beef cattle in New Zealand. Preventive
Veterinary Medicine, 112(1), 90–98.
Sanson, R. L. (2005). A survey to investigate movements off sheep and cattle farms in New
Zealand, with reference to the potential transmission of foot-and-mouth disease. New
Zealand Veterinary Journal, 53(4), 223–233.
Sargeant, J. M., O’Connor, A. M., Dohoo, I. R., Erb, H. N., Cevallos, M., Egger, M., Ersbøll,
A. K., Martin, S. W., Nielsen, L. R., Pearl, D. L., Pfeiffer, D. U., Sanchez, J., Torrence,
M. E., Vigre, H., Waldner, C., & Ward, M. P. (2016). Methods and processes of
developing the strengthening the reporting of observational studies in epidemiology –
veterinary (STROBE-Vet) statement. Zoonoses and Public Health, 63(8), 651–661.
Scharnböck, B., Roch, F.-F., Richter, V., Funke, C., Firth, C. L., Obritzhauser, W.,
Baumgartner, W., Käsbohrer, A., & Pinior, B. (2018). A meta-analysis of bovine viral
diarrhoea virus (BVDV) prevalences in the global cattle population. Scientific Reports,
8(1), 1–15. https://doi.org/10.1038/s41598-018-32831-2
Schemann, K., Lewis, F. I., Firestone, S. M., Ward, M. P., Toribio, J.-A. L. M. L., Taylor, M.
R., & Dhand, N. K. (2013). Untangling the complex inter-relationships between horse
managers’ perceptions of effectiveness of biosecurity practices using Bayesian
graphical modelling. Preventive Veterinary Medicine, 110(1), 37–44.
197
Scutari, M. (2009). Learning Bayesian networks with the bnlearn R package. Journal of
Statistical Software, 35(3), 1–22.
Sekiguchi, S., Presi, P., Omori, R., Staerk, K., Schuppers, M., Isoda, N., Yoshikawa, Y.,
Umemura, T., Nakayama, H., Fujii, Y., & Sakoda, Y. (2018). Evaluation of bovine
viral diarrhoea virus control strategies in dairy herds in Hokkaido, Japan, using
stochastic modelling. Transboundary and Emerging Diseases, 65(1), e135–e144.
Smith, R. L., Sanderson, M. W., Jones, R., N’Guessan, Y., Renter, D., Larson, R., & White,
B. J. (2014). Economic risk analysis model for bovine viral diarrhea virus biosecurity
in cow-calf herds. Preventive Veterinary Medicine, 113(4), 492–503.
Solis-Calderon, J. J., Segura-Correa, V. M., & Segura-Correa, J. C. (2005). Bovine viral
diarrhoea virus in beef cattle herds of Yucatan, Mexico: Seroprevalence and risk
factors. Preventive Veterinary Medicine, 72(3), 253–262.
Sørensen, J. T., Enevoldsen, C., & Houe, H. (1995). A stochastic model for simulation of the
economic consequences of bovine virus diarrhoea virus infection in a dairy herd.
Preventive Veterinary Medicine, 23(3), 215–227.
Ståhl, K., & Alenius, S. (2012). BVDV control and eradication in Europe—An update.
Japanese Journal of Veterinary Research, 60(Supplement), S31–S39.
Ståhl, K., Kampa, J., Baule, C., Isaksson, M., Moreno-López, J., Belák, S., Alenius, S., &
Lindberg, A. (2005). Molecular epidemiology of bovine viral diarrhoea during the
final phase of the Swedish BVD-eradication programme. Preventive Veterinary
Medicine, 72(1), 103–108.
Stalder, H., Hug, C., Zanoni, R., Vogt, H.-R., Peterhans, E., Schweizer, M., & Bachofen, C.
(2016). A nationwide database linking information on the hosts with sequence data of
their virus strains: A useful tool for the eradication of bovine viral diarrhea (BVD) in
Switzerland. Virus Research, 218, 49–56.
Steven, S. (2015). Epidemiological reflections on bovine viral diarrhoea virus control in
Belgian cattle herds based on experimental infections and observational studies
198
[Ph.D.]. Department of Reproduction, Obstetrics and Herd Health, Faculty of
Veterinary Medicine, Ghent University.
Stewart, P. (2013, August). BVD: we are the champions. Vetscript, New Zealand, 26(7), 40–
42.
Stewart, P., Hill, F., Bruère, S., Holter, J., Roger S., E., Weir, A. M., & Pickering, J. (2014,
November). Boning up on BVD. Vetscript, New Zealand, 27(8), 47–51.
Sunnåker, M., Busetto, A. G., Numminen, E., Corander, J., Foll, M., & Dessimoz, C. (2013).
Approximate Bayesian Computation. PLoS Computational Biology, 9(1), e1002803.
Thobokwe, G., Heuer, C., & Hayes, D. P. (2004). Validation of a bulk tank milk antibody
ELISA to detect dairy herds likely infected with bovine viral diarrhoea virus in New
Zealand. New Zealand Veterinary Journal, 52(6), 394–400.
Thompson, C. (2005, July). “Natural” BVD vaccination—The way to go? Vetscript, New
Zealand, 18(6), 24–26.
Thulke, H.-H., Lange, M., Tratalos, J. A., Clegg, T. A., McGrath, G., O’Grady, L., O’Sullivan,
P., Doherty, M. L., Graham, D. A., & More, S. J. (2018). Eradicating BVD, reviewing
Irish programme data and model predictions to support prospective decision making.
Preventive Veterinary Medicine, 150, 151–161.
Thurmond, M. C. (2005). Virus transmission. In Bovine viral diarrhea virus: Diagnosis,
management, and control (1st ed., pp. 91–104). Blackwell Publishing.
Toni, T., Welch, D., Strelkowa, N., Ipsen, A., & Stumpf, M. P. H. (2009). Approximate
Bayesian computation scheme for parameter inference and model selection in
dynamical systems. Journal of The Royal Society Interface, 6(31), 187–202.
Uusitalo, L. (2007). Advantages and challenges of Bayesian networks in environmental
modelling. Ecological Modelling, 203(3), 312–318.
Valle, P. S., Martin, S. W., Tremblay, R., & Bateman, K. (1999). Factors associated with being
a bovine-virus diarrhoea (BVD) seropositive dairy herd in the Møre and Romsdal
county of Norway. Preventive Veterinary Medicine, 40(3), 165–177.
199
Van Andel, M., Hollings, T., Bradhurst, R., Robinson, A., Burgman, M., Gates, M. C.,
Bingham, P., & Carpenter, T. (2018). Does size matter to models? Exploring the effect
of herd size on outputs of a herd-level disease spread simulator. Frontiers in
Veterinary Science, 5(78), 1–11.
van Asseldonk, M. A. P. M., Renes, R. J., Lam, T. J. G. M., & Hogeveen, H. (2010).
Awareness and perceived value of economic information in controlling somatic cell
count. The Veterinary Record, 166(9), 263–267.
van Buuren, S. (2018). Flexible imputation of missing data (2nd ed.). Chapman and Hall/CRC.
https://doi.org/10.1201/9780429492259
van Buuren, S., & Groothuis-Oudshoorn, K. (2011). mice: Multivariate imputation by chained
equations in R. Journal of Statistical Software, 45(3), 1–67.
https://doi.org/10.18637/jss.v045.i03
Van Campen, H. (2010). Epidemiology and control of BVD in the U.S. Veterinary
Microbiology, 142(1–2), 94.
Viet, A.-F., Fourichon, C., & Seegers, H. (2007). Review and critical discussion of
assumptions and modelling options to study the spread of the bovine viral diarrhoea
virus (BVDV) within a cattle herd. Epidemiology and Infection, 135(5), 706–721.
Viet, A.-F., Fourichon, C., Seegers, H., Jacob, C., & Guihenneuc-Jouyaux, C. (2004). A model
of the spread of the bovine viral-diarrhoea virus within a dairy herd. Preventive
Veterinary Medicine, 63(3), 211–236.
Vilček, š., Björklund, H. V., Horner, G. W., Meers, J., & Belák, S. (1998). Genetic typing of
pestiviruses from New Zealand. New Zealand Veterinary Journal, 46(1), 35–37.
Vilček, š., Paton, D. J., Durkovic, B., Strojny, L., Ibata, G., Moussa, A., Loitsch, A.,
Rossmanith, W., Vega, S., Scicluna, M. T., & Palfi, V. (2001). Bovine viral diarrhoea
virus genotype 1 can be separated into at least eleven genetic groups. Archives of
Virology, 146(1), 99–115.

200
Voges, H. (2008). A national study of BVD exposure amongst New Zealand dairy herds based
on bulk milk testing by antibody ELISA. Proceedings of the Society of Dairy Cattle
Veterinarians of the NZVA, 51–58.
Voges, H., Horner, G. W., Rowe, S., & Wellenberg, G. J. (1998). Persistent bovine pestivirus
infection localized in the testes of an immuno-competent, non-viraemic bull.
Veterinary Microbiology, 61(3), 165–175.
Voges, H., Young, S., & Nash, M. (2006, September). Direct adverse effects of persistent
BVDv infection in dairy heifers–a retrospective case control study. Vetscript, New
Zealand, 19(8), 22–25.
Vynnycky, E., & White, R. G. (2010). An introduction to infectious disease modelling. Oxford
University Press.
Walz, P. H., Givens, M. D., Rodning, S. P., Riddell, K. P., Brodersen, B. W., Scruggs, D.,
Short, T., & Grotelueschen, D. (2017). Evaluation of reproductive protection against
bovine viral diarrhea virus and bovine herpesvirus-1 afforded by annual revaccination
with modified-live viral or combination modified-live/killed viral vaccines after
primary vaccination with modified-live viral vaccine. Vaccine, 35(7), 1046–1054.
Walz, P. H., Riddell, K. P., Newcomer, B. W., Neill, J. D., Falkenberg, S. M., Cortese, V. S.,
Scruggs, D. W., & Short, T. H. (2018). Comparison of reproductive protection against
bovine viral diarrhea virus provided by multivalent viral vaccines containing
inactivated fractions of bovine viral diarrhea virus 1 and 2. Vaccine, 36(26), 3853–
3860.
Weber, M. N., Mósena, A. C. S., Simões, S. V. D., Almeida, L. L., Pessoa, C. R. M.,
Budaszewski, R. F., Silva, T. R., Ridpath, J. F., Riet‐Correa, F., Driemeier, D., &
Canal, C. W. (2016). Clinical Presentation Resembling Mucosal Disease Associated
with ‘HoBi’-like Pestivirus in a Field Outbreak. Transboundary and Emerging
Diseases, 63(1), 92–100. https://doi.org/10.1111/tbed.12223
Weir, A. M., & Heuer, C. (2009). Economics of BVD in dairy herds. Proceedings of the
Society of Dairy Cattle Veterinarians of the NZVA Annual Conference, 225–230.

201
Weir, A. M., Heuer, C., & McDougall, S. (2016). Epidemiology of BVD in New Zealand dairy
herds [Ph.D.]. EpiCentre, Institute of Veterinary, Animal and Biomedical Sciences,
Massey University.
Weir, A. M., Heuer, C., & McDougall, S. (2014). Least-cost approach to the control of bovine
viral diarrhoea evaluated through simulation modelling. Proceedings of the Food
Safety, Animal Welfare & Biosecurity, Epidemiology & Animal Health Management,
and Industry Branches of the NZVA, 25–28.
Weir, A. M., Heuer, C., McDougall, S., & Voges, H. (2013). Use of an enzyme-linked
immunosorbent assay for detecting bovine viral diarrhoea virus antibodies in
individual cow milk samples. New Zealand Veterinary Journal, 61(5), 305–309.
Wernike, K., Gethmann, J., Schirrmeier, H., Schröder, R., Conraths, F. J., & Beer, M. (2017).
Six years (2011–2016) of mandatory nationwide bovine viral diarrhea control in
Germany–a success story. Pathogens, 6(4), 50.
Weston, J. F., Heuer, C., Parkinson, T. J., & Williamson, N. B. (2012). Causes of abortion on
New Zealand dairy farms with a history of abortion associated with Neospora caninum.
New Zealand Veterinary Journal, 60(1), 27–34.
White, I. R., Royston, P., & Wood, A. M. (2011). Multiple imputation using chained equations:
Issues and guidance for practice. Statistics in Medicine, 30(4), 377–399.
Whitmore, H. L., Zemjanis, R., & Olson, J. (1981). Effect of bovine viral diarrhea virus on
conception in cattle. Journal of the American Veterinary Medical Association,
178(10), 1065–1067.
Wilson, A. J., Ribeiro, R., & Boinas, F. (2013). Use of a Bayesian network model to identify
factors associated with the presence of the tick Ornithodoros erraticus on pig farms in
southern Portugal. Preventive Veterinary Medicine, 110(1), 45–53.
Wood, A. M., White, I. R., & Royston, P. (2008). How should variable selection be performed
with multiply imputed data? Statistics in Medicine, 27(17), 3227–3246.

202
Yarnall, M. J., & Thrusfield, M. V. (2017). Engaging veterinarians and farmers in eradicating
bovine viral diarrhoea: A systematic review of economic impact. The Veterinary
Record, 181(13), 347.
Yeşilbağ, K., Alpay, G., & Becher, P. (2017). Variability and global distribution of
subgenotypes of bovine viral diarrhea virus. Viruses, 9(6), 128.
Zimmerman, A. D., Boots, R. E., Valli, J. L., & Chase, C. C. L. (2006). Evaluation of
protection against virulent bovine viral diarrhea virus type 2 in calves that had
maternal antibodies and were vaccinated with a modified-live vaccine. Journal of the
American Veterinary Medical Association, 228(11), 1757–1761.
https://doi.org/10.2460/javma.228.11.1757
Zuk, O., Margel, S., & Domany, E. (2006). On the number of samples needed to learn the
correct structure of a Bayesian network. Proceedings of the Twenty-Second
Conference on Uncertainty in Artificial Intelligence, 560–567.
http://arxiv.org/abs/1206.6862

203
Appendix 1
Section 1. Original survey form
204
Section 2. Merging and re-categorising variables
We reduced the dimensionality of the imputed dataset by re-categorising responses of
variables. Production type was divided into either “Dairy” or “Beef” farms. Variables of
neighbouring farms and awareness of BVD were re-categorised by aggregating responses
of “3” and “4+” into one group and other responses into another group. Frequencies of
close animal contacts within and between farms were categorised into either “Often”,
“Occasionally/rarely” or “Never”. Off-farm movements of heifers and mixed-age breeding
cows were grouped in such a way to fit responses into either “None” or “Not-none”. Mating
methods for both heifers and mixed-age cows were re-categorising as “Bulls used” or
“Bulls not used”.
Also, for the purpose of decreasing the degree of freedom of regression models, a
variable of mating method and three variables of BVD prevention measures of service bulls
were merged for each two group (e.g. herds of replacement heifers and mixed-age breeding
cows). Given that the variables of BVD prevention measures of service bulls were nested
variables that only allowed to group of farmers responded as “Bulls used” in respective
mating methods, we integrated each of mother and daughter variable set in two-fold. First,
for each group, three variables of BVD tested, certified, and vaccinated service bulls were
aggregated as a new variable of “BVD prevention status of bulls”. Responses of the new
variables were set in a way that (1) if response of any variable for merging was “All”, then
the response of the new variable became “All prevented”, (2) when all variables for
merging showed “None/unknown”, then the response of the new variable became
“None/unknown”, and (3) responses of the rest observations were treated as “Partially
prevented”. Then, the responses of the new variable were integrated into dichotomised
mating method, creating another new variable of “Implementing BVD control measures on
service bulls”. Three responses of the new variables were set as (1) “Bulls not used” if
respective mating method was “Bulls not used”, (2) “No” if respective mating method was
“Bulls used” but respective BVD prevention status of bulls was not “All prevented”, (3)

205
“Yes” if respective mating method was “Bulls used” and respective BVD prevention status
of bulls was “All prevented”.
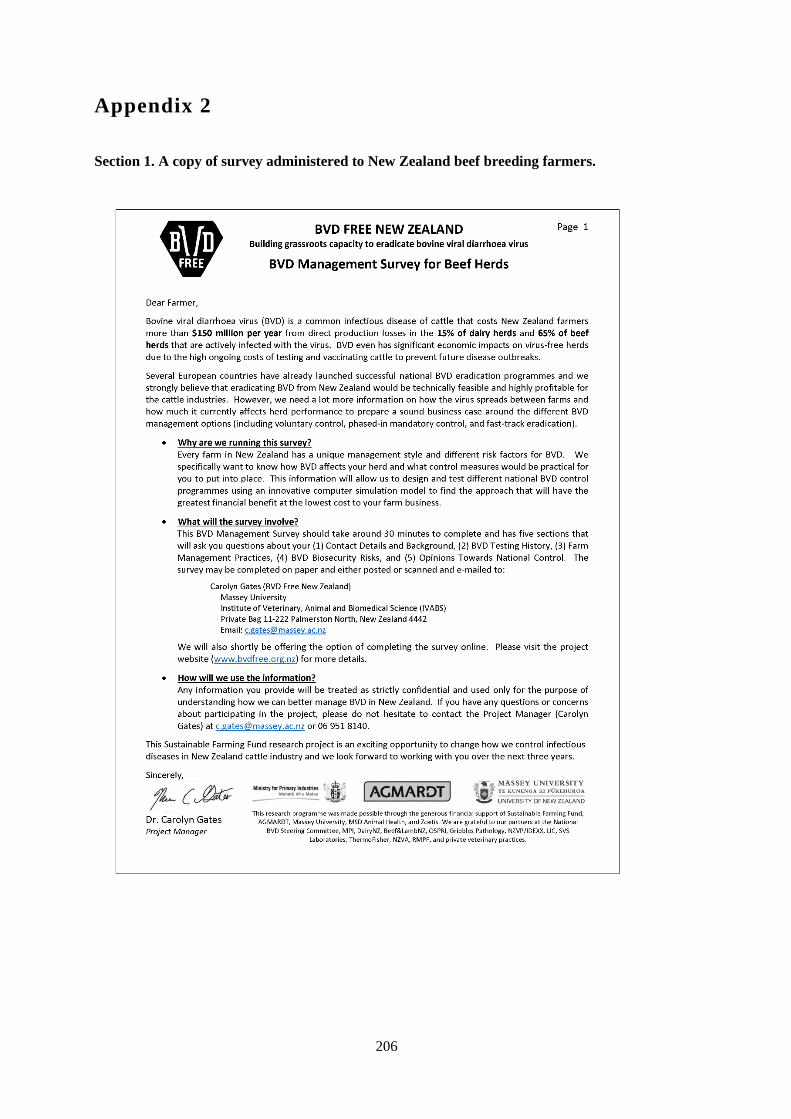
206
Appendix 2
Section 1. A copy of survey administered to New Zealand beef breeding farmers.

207

208

209
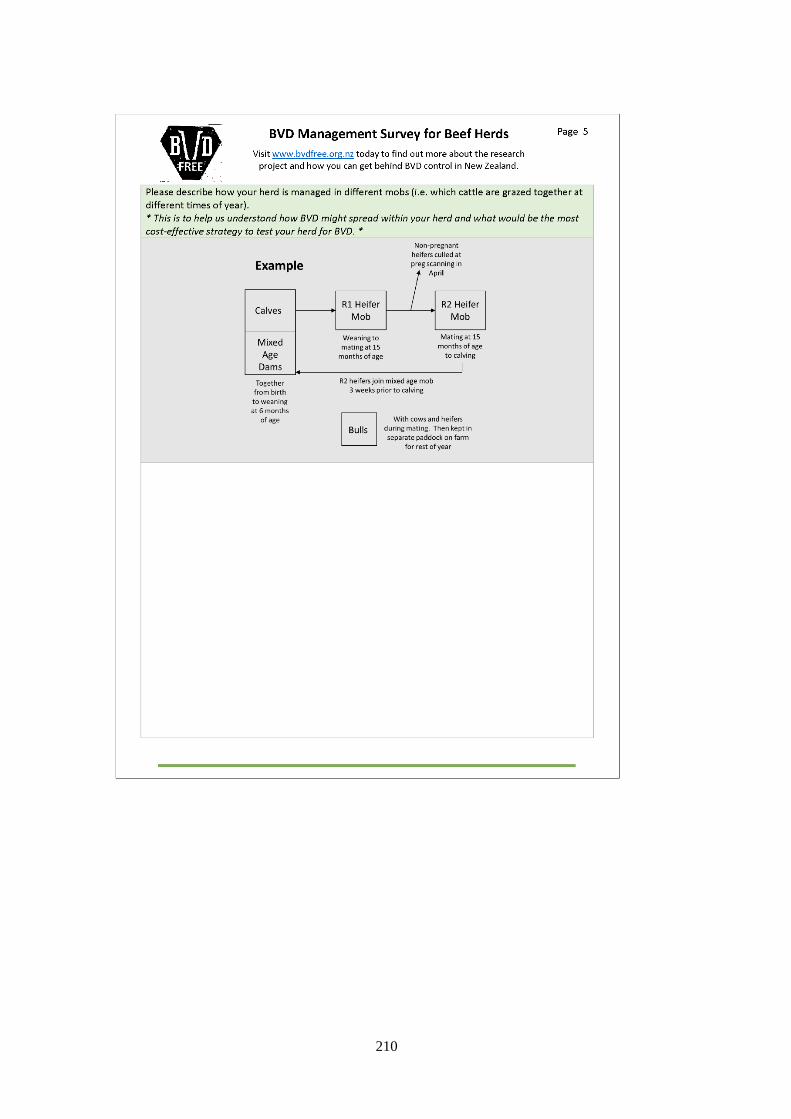
210

211

212

213
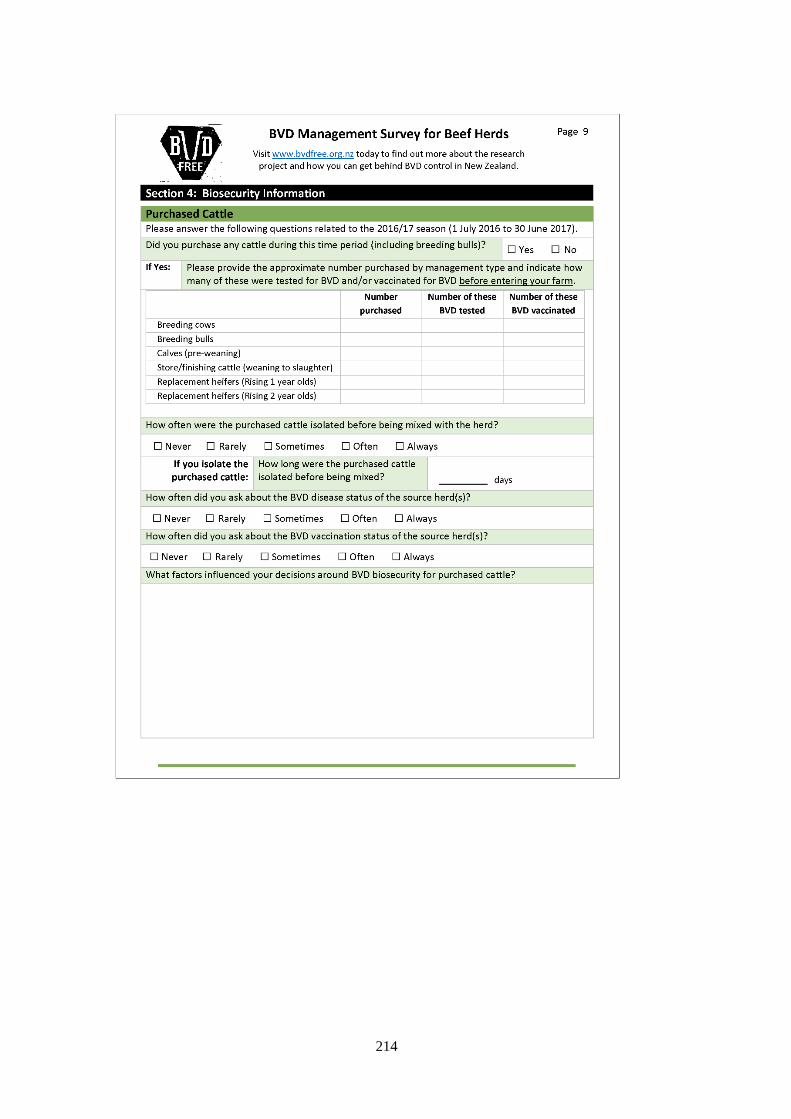
214
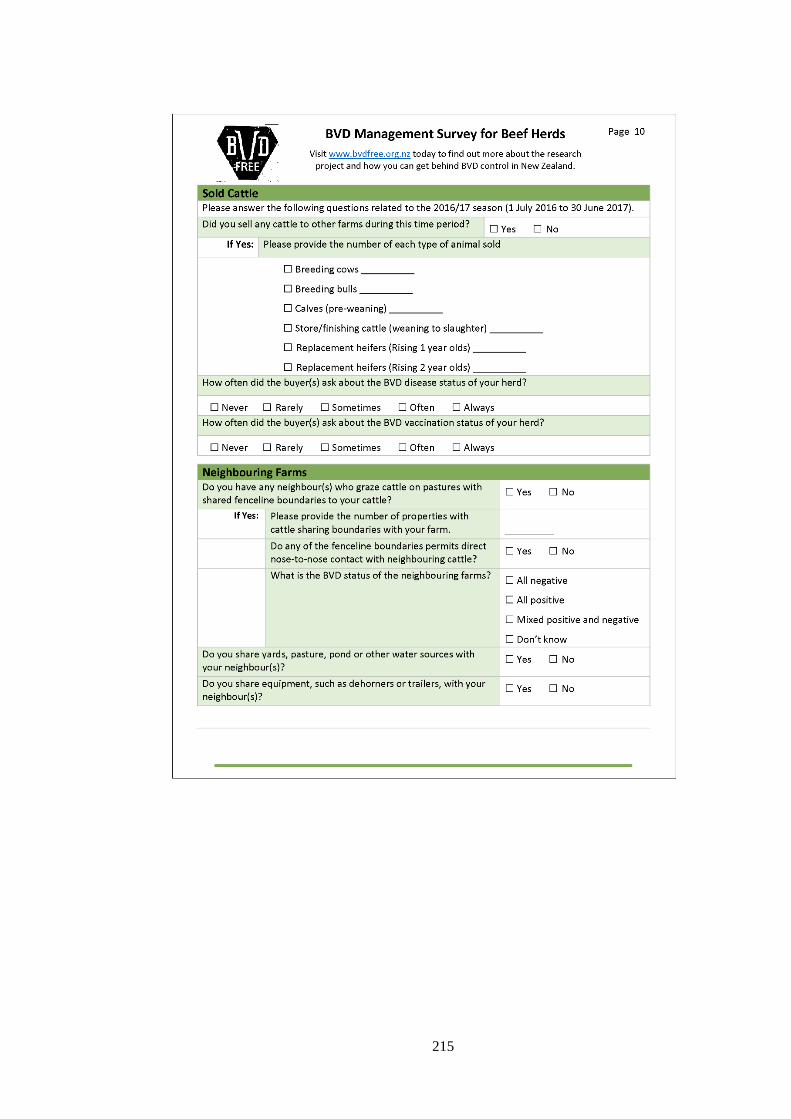
215

216
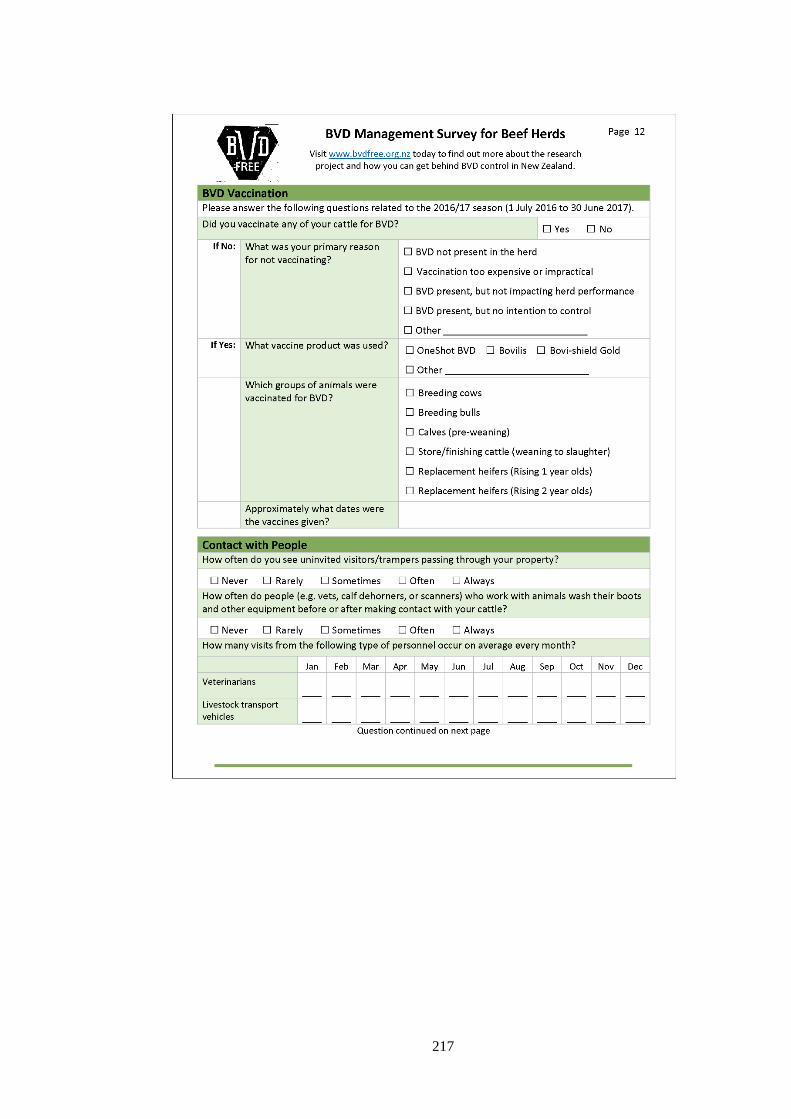
217
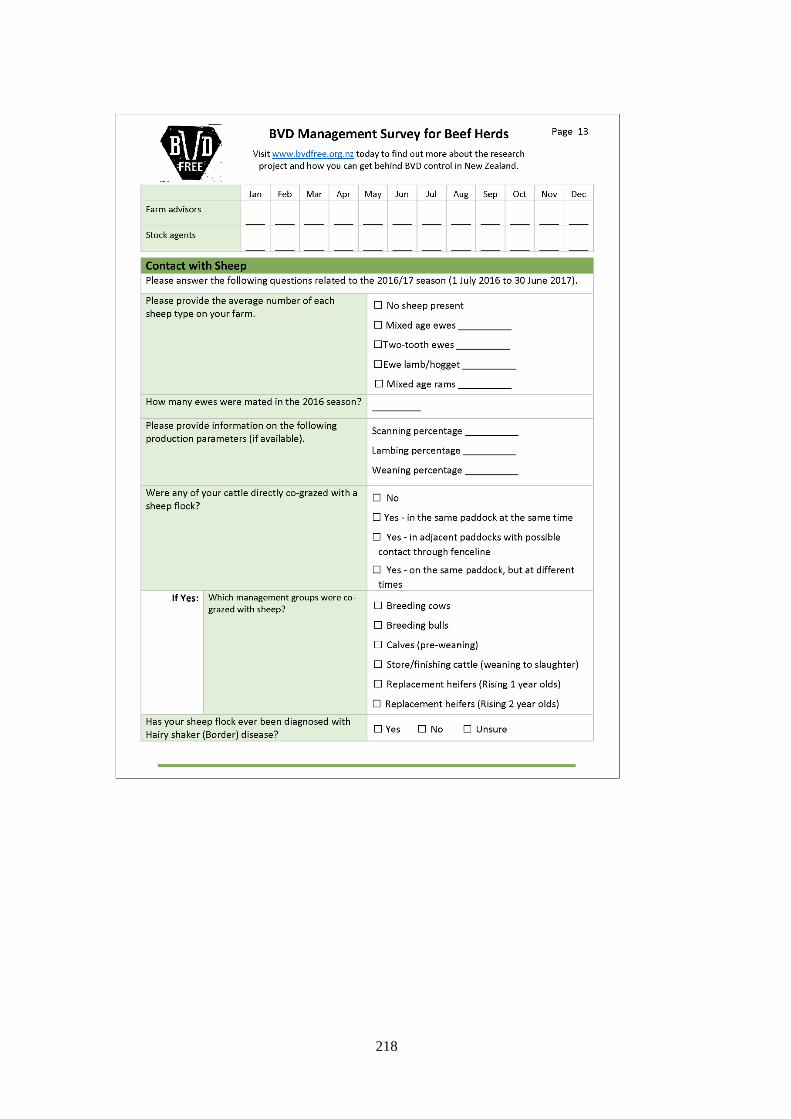
218
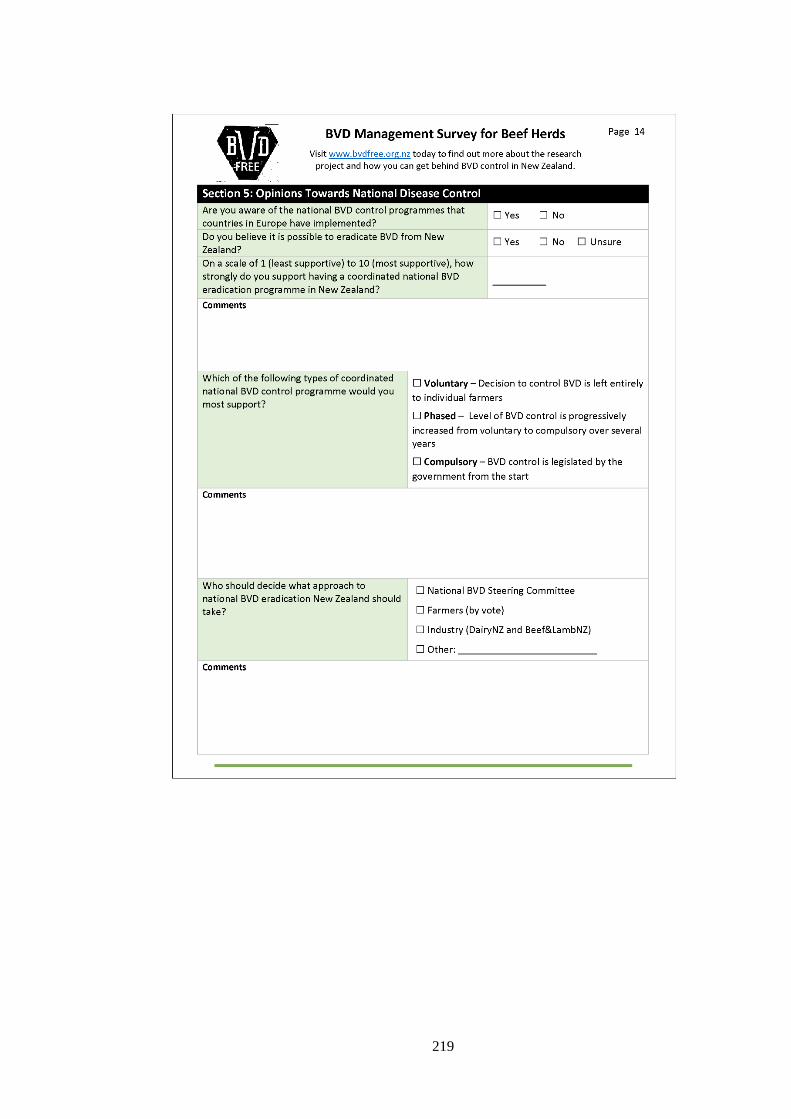
219

220

221
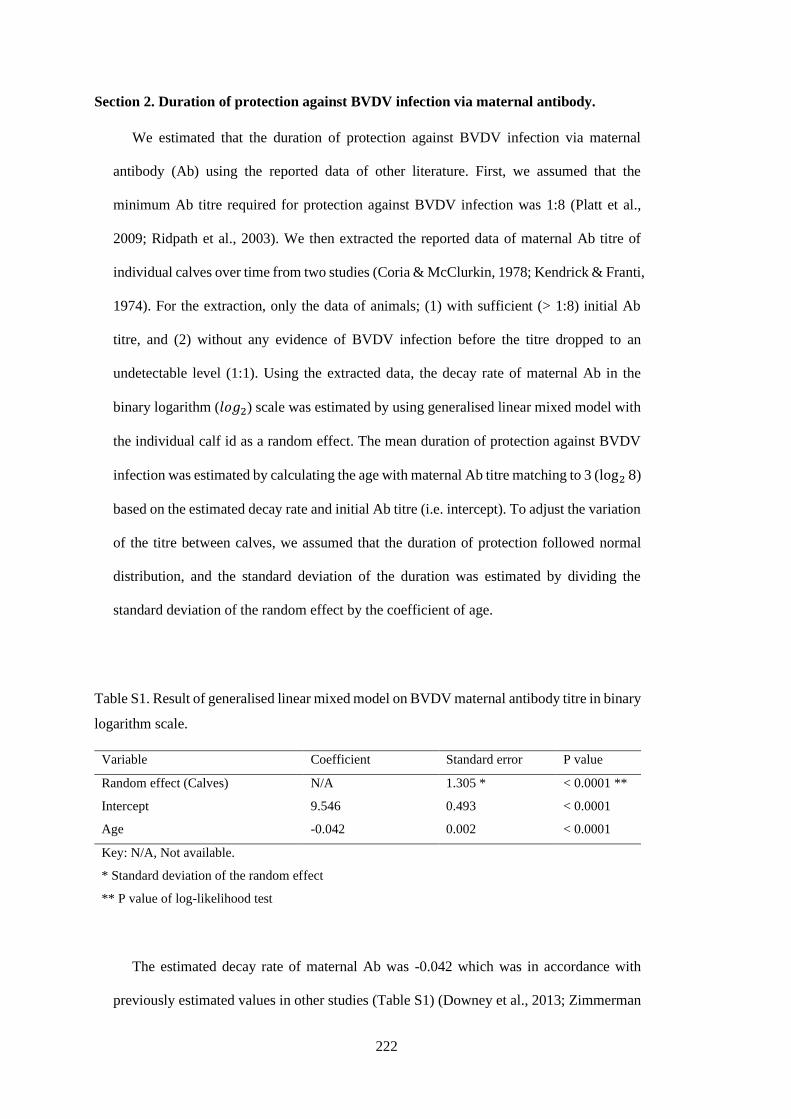
222
Section 2. Duration of protection against BVDV infection via maternal antibody.
We estimated that the duration of protection against BVDV infection via maternal
antibody (Ab) using the reported data of other literature. First, we assumed that the
minimum Ab titre required for protection against BVDV infection was 1:8 (Platt et al.,
2009; Ridpath et al., 2003). We then extracted the reported data of maternal Ab titre of
individual calves over time from two studies (Coria & McClurkin, 1978; Kendrick & Franti,
1974). For the extraction, only the data of animals; (1) with sufficient (> 1:8) initial Ab
titre, and (2) without any evidence of BVDV infection before the titre dropped to an
undetectable level (1:1). Using the extracted data, the decay rate of maternal Ab in the
binary logarithm (𝑙𝑜𝑔2) scale was estimated by using generalised linear mixed model with
the individual calf id as a random effect. The mean duration of protection against BVDV
infection was estimated by calculating the age with maternal Ab titre matching to 3 (log2 8)
based on the estimated decay rate and initial Ab titre (i.e. intercept). To adjust the variation
of the titre between calves, we assumed that the duration of protection followed normal
distribution, and the standard deviation of the duration was estimated by dividing the
standard deviation of the random effect by the coefficient of age.
Table S1. Result of generalised linear mixed model on BVDV maternal antibody titre in binary
logarithm scale.
Variable Coefficient Standard error P value
Random effect (Calves) N/A 1.305 * < 0.0001 **
Intercept 9.546 0.493 < 0.0001
Age -0.042 0.002 < 0.0001
Key: N/A, Not available.
* Standard deviation of the random effect
** P value of log-likelihood test
The estimated decay rate of maternal Ab was -0.042 which was in accordance with
previously estimated values in other studies (Table S1) (Downey et al., 2013; Zimmerman
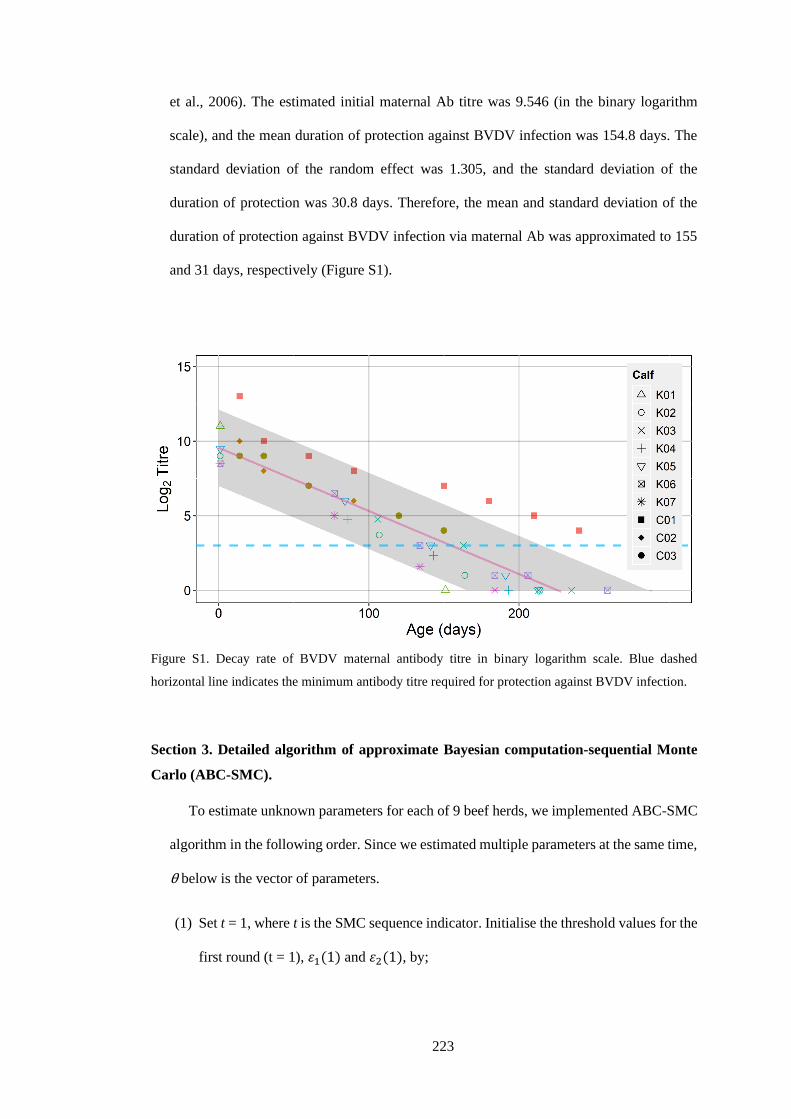
223
et al., 2006). The estimated initial maternal Ab titre was 9.546 (in the binary logarithm
scale), and the mean duration of protection against BVDV infection was 154.8 days. The
standard deviation of the random effect was 1.305, and the standard deviation of the
duration of protection was 30.8 days. Therefore, the mean and standard deviation of the
duration of protection against BVDV infection via maternal Ab was approximated to 155
and 31 days, respectively (Figure S1).
Figure S1. Decay rate of BVDV maternal antibody titre in binary logarithm scale. Blue dashed
horizontal line indicates the minimum antibody titre required for protection against BVDV infection.
Section 3. Detailed algorithm of approximate Bayesian computation-sequential Monte
Carlo (ABC-SMC).
To estimate unknown parameters for each of 9 beef herds, we implemented ABC-SMC
algorithm in the following order. Since we estimated multiple parameters at the same time,
θ below is the vector of parameters.
(1) Set t = 1, where t is the SMC sequence indicator. Initialise the threshold values for the
first round (t = 1), 𝜀1(1) and 𝜀2(1), by;
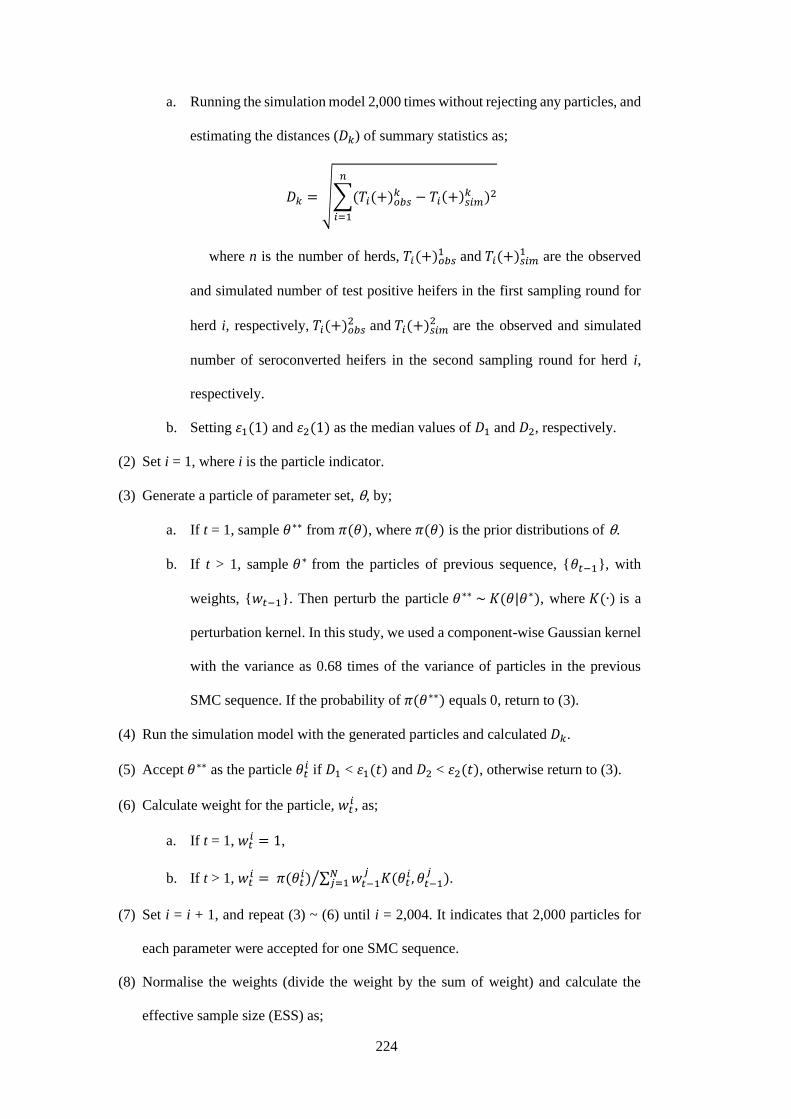
224
a. Running the simulation model 2,000 times without rejecting any particles, and
estimating the distances (𝐷𝑘) of summary statistics as;
𝐷𝑘 = √∑(𝑇𝑖(+)𝑜𝑏𝑠𝑘 − 𝑇𝑖(+)𝑠𝑖𝑚
𝑘 )2
𝑛
𝑖=1
where n is the number of herds, 𝑇𝑖(+)𝑜𝑏𝑠1 and 𝑇𝑖(+)𝑠𝑖𝑚
1 are the observed
and simulated number of test positive heifers in the first sampling round for
herd i, respectively, 𝑇𝑖(+)𝑜𝑏𝑠2 and 𝑇𝑖(+)𝑠𝑖𝑚
2 are the observed and simulated
number of seroconverted heifers in the second sampling round for herd i,
respectively.
b. Setting 𝜀1(1) and 𝜀2(1) as the median values of 𝐷1 and 𝐷2, respectively.
(2) Set i = 1, where i is the particle indicator.
(3) Generate a particle of parameter set, θ, by;
a. If t = 1, sample 𝜃∗∗ from 𝜋(𝜃), where 𝜋(𝜃) is the prior distributions of θ.
b. If t > 1, sample 𝜃∗ from the particles of previous sequence, {𝜃𝑡−1}, with
weights, {𝑤𝑡−1}. Then perturb the particle 𝜃∗∗ ~ 𝐾(𝜃|𝜃∗), where 𝐾(∙) is a
perturbation kernel. In this study, we used a component-wise Gaussian kernel
with the variance as 0.68 times of the variance of particles in the previous
SMC sequence. If the probability of 𝜋(𝜃∗∗) equals 0, return to (3).
(4) Run the simulation model with the generated particles and calculated 𝐷𝑘.
(5) Accept 𝜃∗∗ as the particle 𝜃𝑡𝑖 if 𝐷1 < 𝜀1(𝑡) and 𝐷2 < 𝜀2(𝑡), otherwise return to (3).
(6) Calculate weight for the particle, 𝑤𝑡𝑖, as;
a. If t = 1, 𝑤𝑡𝑖 = 1,
b. If t > 1, 𝑤𝑡𝑖 = 𝜋(𝜃𝑡
𝑖) ∑ 𝑤𝑡−1𝑗
𝐾(𝜃𝑡𝑖, 𝜃𝑡−1
𝑗)𝑁
𝑗=1⁄ .
(7) Set i = i + 1, and repeat (3) ~ (6) until i = 2,004. It indicates that 2,000 particles for
each parameter were accepted for one SMC sequence.
(8) Normalise the weights (divide the weight by the sum of weight) and calculate the
effective sample size (ESS) as;

225
𝐸𝑆𝑆 =1
∑ (�̅�𝑖)220001
where �̅�𝑖 was normalised weight.
(9) Calculate new threshold for the next sequence, 𝜀1(𝑡 + 1) and 𝜀2(𝑡 + 1) from the
median values of 𝐷1 and 𝐷2, respectively, and set t = t + 1. Return to (1) until t = 15.
In total, we sampled approximately 97.2 million particles and ESS of any parameter
during the whole sequence was between 795 and 2,000.
Section 4. General sensitivity analysis of model behaviour.
Since the simulation model in this study was newly developed, we investigated the
model behaviour with respect to different parameter values. The sensitivity analysis was
conducted using a complete factorial design on five unknown parameters; (1) within-herd
BVDV transmission rate for PI animals ( 𝛽𝑃 ), (2) the initial proportion of BVDV
seropositive animals (𝜇), (3) the proportion of introduced PI animals (𝜌), (4) the day of PI
animals being introduced (𝜏), and (5) the proportional difference of 𝛽𝑇 compared to 𝛽𝑃.
Five values (0.1, 0.3, 0.5, 0.7, and 0.9) were tested for all parameters except 𝜏, and the days
equivalent to 10th, 30th, 50th, 70th, and 90th percentile of the duration between the day of
weaning (day 0) and the day of first sampling were used for 𝜏, resulting in testing 3,125
different scenarios. Each scenario was simulated for 1,000 times to adjust the variation
caused by stochasticity. For each simulation, we stored the parameter values used and the
number of seropositive heifers at the first and second sampling events. Once whole
simulation was over, a dataset of 3,125,000 observations was created, and the numbers of
seropositive heifers were separately analysed using multivariable Poisson regression with
the parameters as explanatory variables. For the simplicity, the analysis was conducted
under the management features of Farm 1 only.

226
Table S2. Multivariable Poisson regression on the number of seropositive heifers at two sampling events.
Number of seropositive heifers at;
Variable First sampling Second sampling
Odds ratio (95% CI) P-value Odds ratio (95% CI) P-value
Intercept 0.688 (0.687, 0.689) < 0.0001 0.764 (0.763, 0.765) < 0.0001
𝛽𝑃 1.050 (1.049, 1.052) < 0.0001 1.025 (1.024, 1.026) < 0.0001
μ 1.756 (1.753, 1.758) < 0.0001 1.525 (1.523, 1.526) < 0.0001
ρ 0.595 (0.594, 0.595) < 0.0001 0.659 (0.658, 0.660) < 0.0001
τ 1.000 (1.000, 1.000) < 0.0001 1.000 (1.000, 1.000) < 0.0001
K 1.014 (1.013, 1.015) < 0.0001 1.005 (1.004, 1.006) < 0.0001
Key: CI, confidence interval; K, the proportional difference of 𝛽𝑇 compared to 𝛽𝑃.
Table S2 illustrates the results of multivariable Poisson regression models. Not
surprisingly, the number of seropositive heifers at both the first and second sampling were
the most sensitive to 𝜇, followed by 𝜌. Compared to 𝜇 or 𝜌, 𝛽𝑃 , 𝜏 and the proportional
difference of 𝛽𝑇 compared to 𝛽𝑃 had only a limited impact on the number of seropositive
heifers in both sampling occasions. This result indicates that the posterior distribution of
𝛽𝑃 using ABC-SMC in this study is expected to be mainly affected by the values of 𝜇 and
𝜌 since the estimation of 𝛽𝑃 in ABC-SMC of this study depended on the number of
seropositive heifers at the first sampling and the number of seroconverted heifers at the
second sampling events.
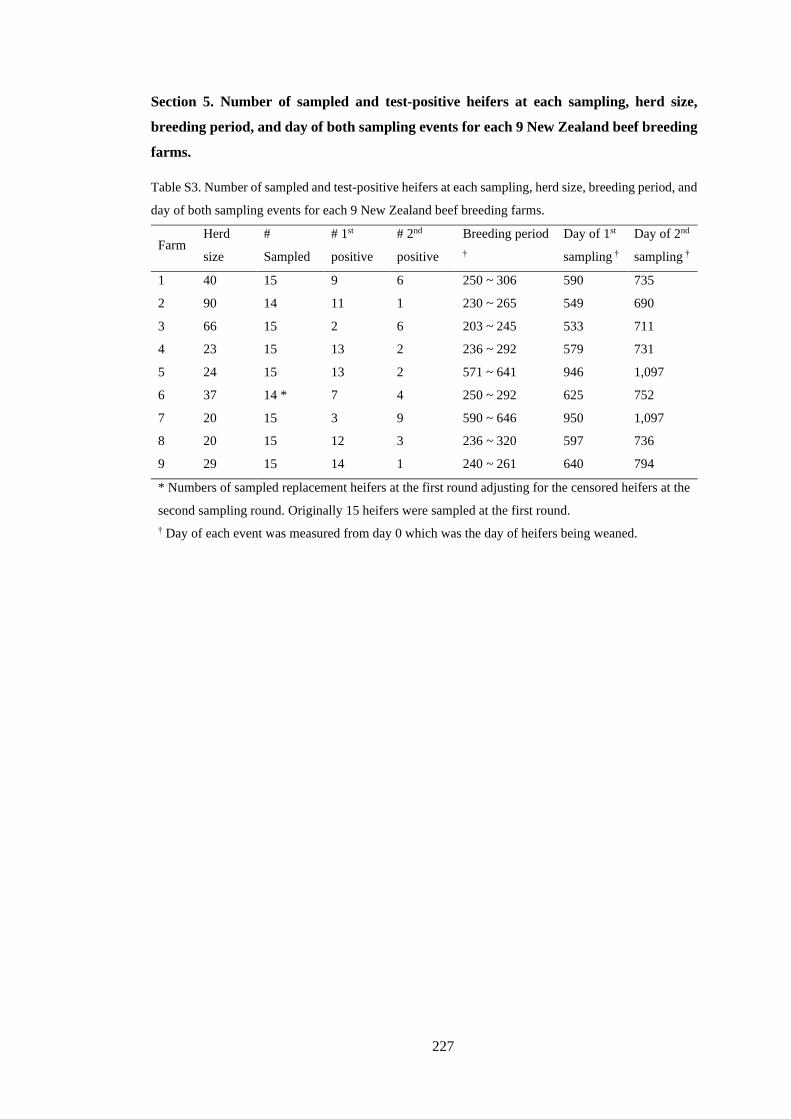
227
Section 5. Number of sampled and test-positive heifers at each sampling, herd size,
breeding period, and day of both sampling events for each 9 New Zealand beef breeding
farms.
Table S3. Number of sampled and test-positive heifers at each sampling, herd size, breeding period, and
day of both sampling events for each 9 New Zealand beef breeding farms.
Farm Herd
size
#
Sampled
# 1st
positive
# 2nd
positive
Breeding period
†
Day of 1st
sampling †
Day of 2nd
sampling †
1 40 15 9 6 250 ~ 306 590 735
2 90 14 11 1 230 ~ 265 549 690
3 66 15 2 6 203 ~ 245 533 711
4 23 15 13 2 236 ~ 292 579 731
5 24 15 13 2 571 ~ 641 946 1,097
6 37 14 * 7 4 250 ~ 292 625 752
7 20 15 3 9 590 ~ 646 950 1,097
8 20 15 12 3 236 ~ 320 597 736
9 29 15 14 1 240 ~ 261 640 794
* Numbers of sampled replacement heifers at the first round adjusting for the censored heifers at the
second sampling round. Originally 15 heifers were sampled at the first round.
† Day of each event was measured from day 0 which was the day of heifers being weaned.
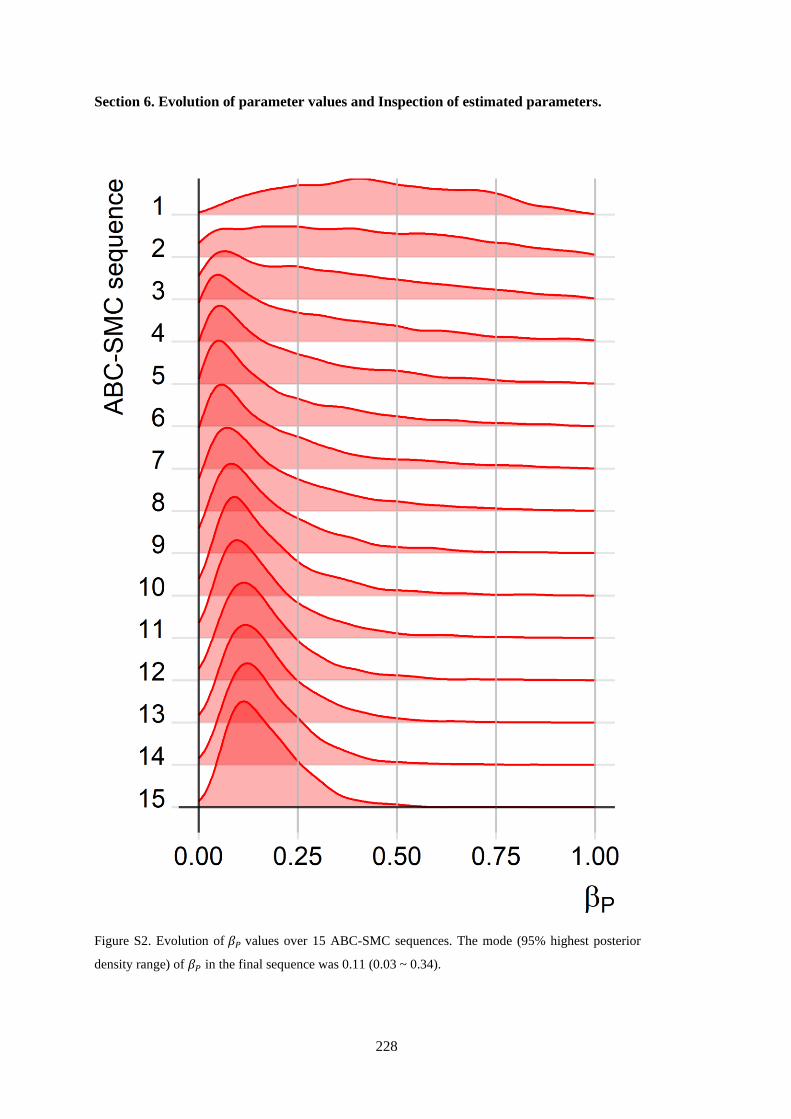
228
Section 6. Evolution of parameter values and Inspection of estimated parameters.
Figure S2. Evolution of 𝛽𝑃 values over 15 ABC-SMC sequences. The mode (95% highest posterior
density range) of 𝛽𝑃 in the final sequence was 0.11 (0.03 ~ 0.34).
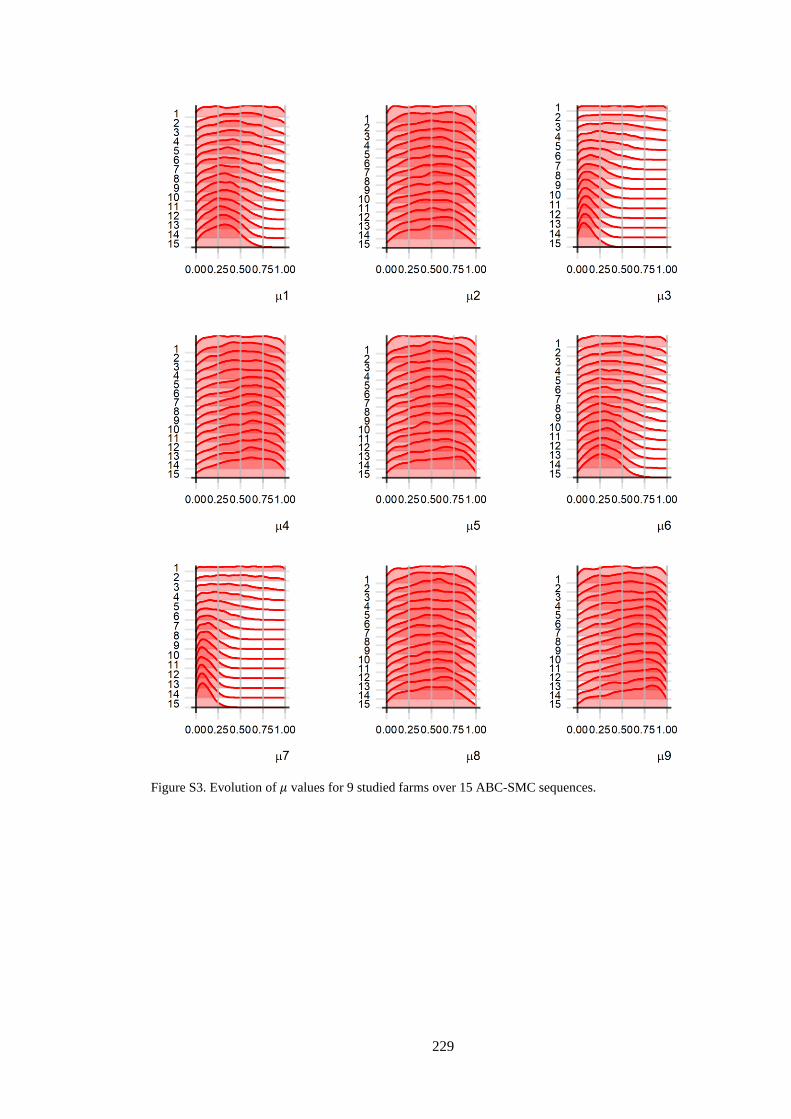
229
Figure S3. Evolution of 𝜇 values for 9 studied farms over 15 ABC-SMC sequences.

230
Figure S4. Evolution of 𝜌 values for 9 studied farms over 15 ABC-SMC sequences.

231
Figure S5. Evolution of 𝜏 values for 9 studied farms over 15 ABC-SMC sequences.
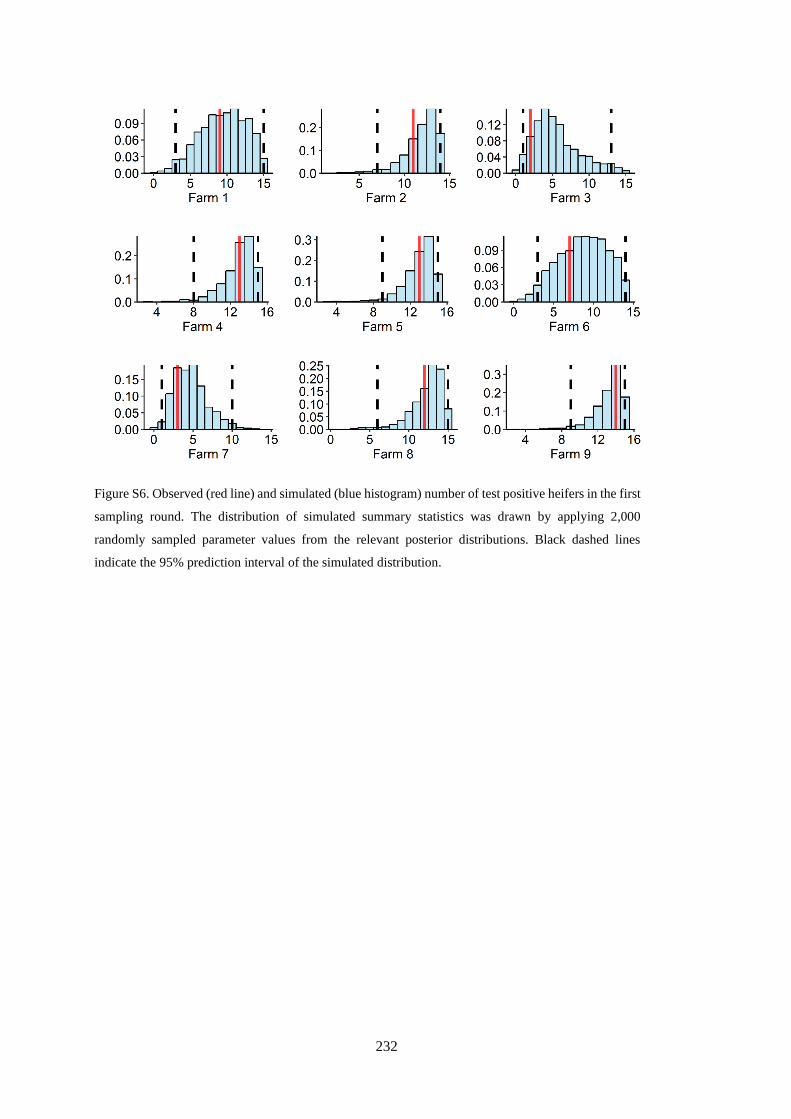
232
Figure S6. Observed (red line) and simulated (blue histogram) number of test positive heifers in the first
sampling round. The distribution of simulated summary statistics was drawn by applying 2,000
randomly sampled parameter values from the relevant posterior distributions. Black dashed lines
indicate the 95% prediction interval of the simulated distribution.
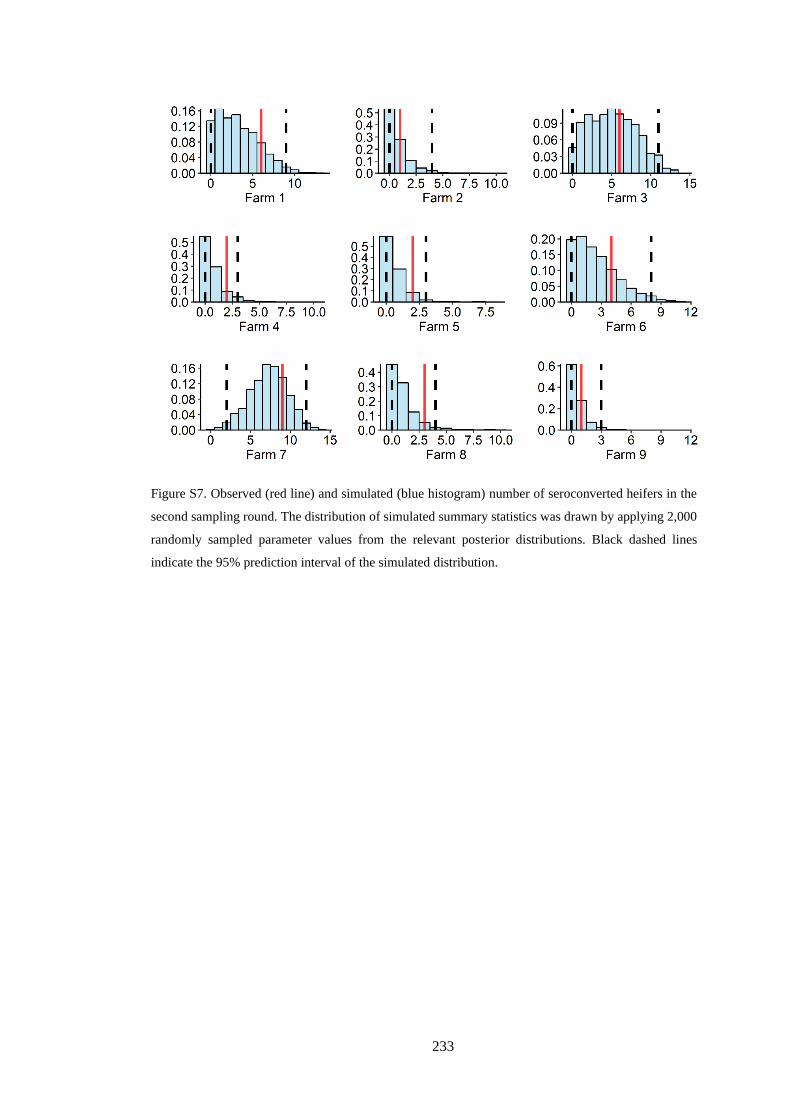
233
Figure S7. Observed (red line) and simulated (blue histogram) number of seroconverted heifers in the
second sampling round. The distribution of simulated summary statistics was drawn by applying 2,000
randomly sampled parameter values from the relevant posterior distributions. Black dashed lines
indicate the 95% prediction interval of the simulated distribution.
234
Section 7. Sensitivity analysis.
We investigate the impact of using a uniform prior of the proportion of introduced PI
animals (π(ρ)) in this study. Given the purpose was to measure the impact of uniform prior,
we collected 1,000 particles for each parameter for the sake of computational efficiency.
Compared to using an informative π(ρ), some but not all parameters showed different
posterior distribution (Table S4). Especially, the posterior distributions of ρ were
overestimated in general compared to the original study. This result of sensitivity analysis
would indicate that our model was not identifiable with current information (i.e. data and
priors). We believe that the identifiability issue was due to the lack of enough observation
— the number of tests as well as the sample size of each test — per farm, which could be
warranted in the future study.
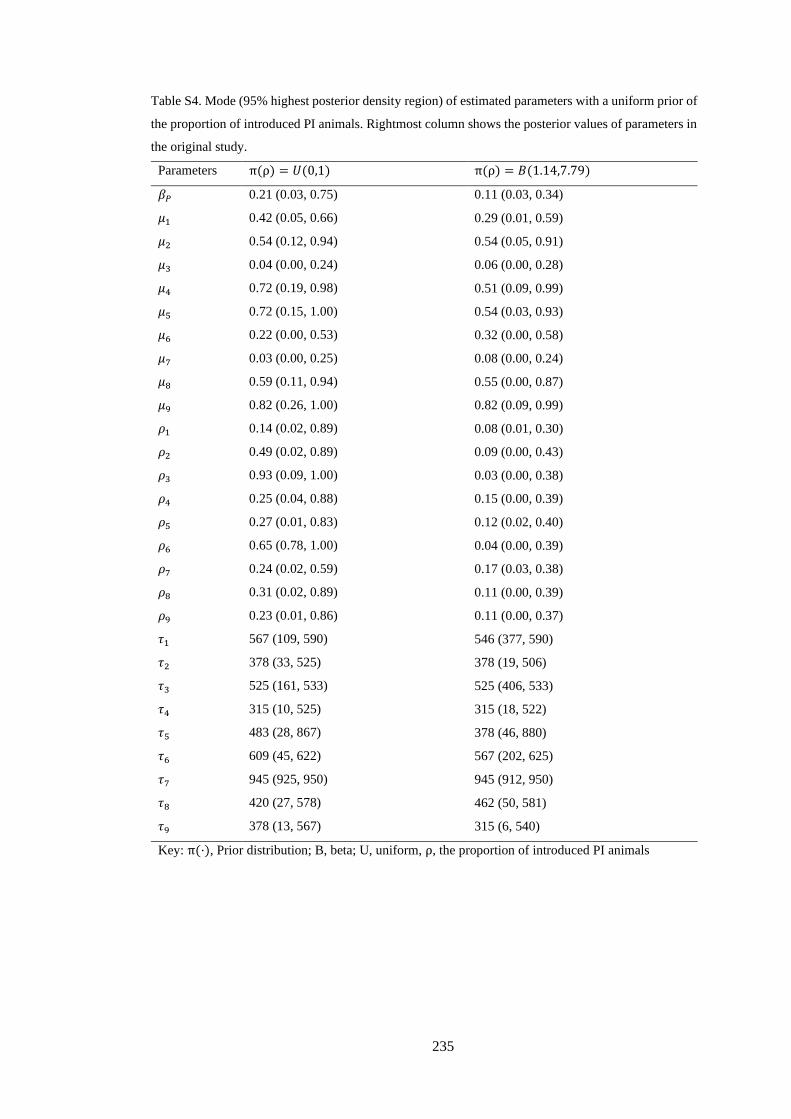
235
Table S4. Mode (95% highest posterior density region) of estimated parameters with a uniform prior of
the proportion of introduced PI animals. Rightmost column shows the posterior values of parameters in
the original study.
Parameters π(ρ) = 𝑈(0,1) π(ρ) = 𝐵(1.14,7.79)
𝛽𝑃 0.21 (0.03, 0.75) 0.11 (0.03, 0.34)
𝜇1 0.42 (0.05, 0.66) 0.29 (0.01, 0.59)
𝜇2 0.54 (0.12, 0.94) 0.54 (0.05, 0.91)
𝜇3 0.04 (0.00, 0.24) 0.06 (0.00, 0.28)
𝜇4 0.72 (0.19, 0.98) 0.51 (0.09, 0.99)
𝜇5 0.72 (0.15, 1.00) 0.54 (0.03, 0.93)
𝜇6 0.22 (0.00, 0.53) 0.32 (0.00, 0.58)
𝜇7 0.03 (0.00, 0.25) 0.08 (0.00, 0.24)
𝜇8 0.59 (0.11, 0.94) 0.55 (0.00, 0.87)
𝜇9 0.82 (0.26, 1.00) 0.82 (0.09, 0.99)
𝜌1 0.14 (0.02, 0.89) 0.08 (0.01, 0.30)
𝜌2 0.49 (0.02, 0.89) 0.09 (0.00, 0.43)
𝜌3 0.93 (0.09, 1.00) 0.03 (0.00, 0.38)
𝜌4 0.25 (0.04, 0.88) 0.15 (0.00, 0.39)
𝜌5 0.27 (0.01, 0.83) 0.12 (0.02, 0.40)
𝜌6 0.65 (0.78, 1.00) 0.04 (0.00, 0.39)
𝜌7 0.24 (0.02, 0.59) 0.17 (0.03, 0.38)
𝜌8 0.31 (0.02, 0.89) 0.11 (0.00, 0.39)
𝜌9 0.23 (0.01, 0.86) 0.11 (0.00, 0.37)
𝜏1 567 (109, 590) 546 (377, 590)
𝜏2 378 (33, 525) 378 (19, 506)
𝜏3 525 (161, 533) 525 (406, 533)
𝜏4 315 (10, 525) 315 (18, 522)
𝜏5 483 (28, 867) 378 (46, 880)
𝜏6 609 (45, 622) 567 (202, 625)
𝜏7 945 (925, 950) 945 (912, 950)
𝜏8 420 (27, 578) 462 (50, 581)
𝜏9 378 (13, 567) 315 (6, 540)
Key: π(·), Prior distribution; B, beta; U, uniform, ρ, the proportion of introduced PI animals
236
Appendix 3
Section 1. Estimation of demographic parameters
1.1. Probabilities of conception in normal, TI, and PI animals
1.1.1. Material and method
We estimated the probabilities of conception by artificial insemination (AI) and by
mating with bulls by using a stochastic individual-based model of simulating reproduction
of 100 dairy cows. In the simulation, the oestrus cycle of each cow was randomly selected
between 18 and 24 days for each cycle, and animals either calved or had abortion were
assumed to have their first “detectable” oestrus after 15 ~ 49 days plus any days between
18 and 24 days. Gestation period was 281 days, and a natural abortion rate of 0.0001 per
day during the whole gestation period was applied to achieve 3.5% of abortion probability
that not potentially due to any disease in New Zealand dairy farms (Weston et al., 2012).
Each model was iterated 1,000 times to adjust the variability caused by stochasticity.
Since the dairy cows were artificially inseminated for the first 6 weeks, we first
estimated the probability of conception by AI. Initially, we assumed all cows were empty
and in oestrus at the planned start day of calving (day 0). From day 84 to day 125 (6 weeks),
animals in oestrus were detected with 78.6% probability (Anonymous 2018b), and only
detected animals were conceived with x% of probability where x was manually searched.
We ran the simulation for 8 years, where the first 3 year was treated as a burn-in period to
minimise the effect of initial condition. We compared the mean proportion of cows calved
for each calving period during the last 5 years of simulation to the industry-reported value
(66.1% of cows bred being pregnant by 6 weeks) (Anonymous 2018b), and repeated the
process with varying x% until the mean proportion approximately matched to the 66.1%.
Once the probability of conception by AI was estimated, the probability of conception
by mating with bulls for the next 6 weeks was also estimated using the same method. After
the period of AI, animals in oestrus were conceived with y% for the next 6 weeks (breeding
237
period with bulls). We repeated the process until the mean proportion of cows calved for
each calving period during the last 5 years with y% of conception probability being matched
to approximately 15.0% of cows bred being empty by the calving period (Anonymous
2018b).
We applied the same method to 100 beef cows to estimate the probability of conception
by mating with bulls with the same natural abortion rate (Hickson et al., 2012). The only
differences were; (1) breeding period started 81 days after the planned start date of calving,
(2) breeding period was from day 81 to day 143 (9 weeks), and (3) the probability of
conception was searched to match approximately to 91.0% of cows bred being pregnant by
pregnancy scanning which was on day 186 (McFadden et al., (2015).
To estimate the risk of conception in transiently infected (TI) animals, we analysed the
reported data from two experimental studies that challenged BVDV before/after breeding
(McGowan et al., 1993; Whitmore et al., 1981). Using the data, we calculated the risk ratio
of conception of each test group, and estimated the weighted-mean using the number of
samples and controls for each ratio. For the conception of persistently infected (PI) animals,
we assumed that the risk ratio of conception in PI animals is equivalent to the one in TI
animals.
1.1.2 Results
The probability of conception by AI in dairy cows was estimated as 60.0%. The
estimated probability of conception by mating with bulls was 45.0%. In beef cows, the
estimated probability of conception by mating with bulls was 61.0%.
Whitmore et al., (1981) challenged BVDV to 3 groups of cows after 35 days from the
day of breeding, and observed 60.0% (9/15), 27.0% (4/15), and 67.0% (10/15) of
conception probability depending on the challenge method, while reporting 67.0% (10/15)
of conception probability in the control group. The risk ratio of conception in these groups
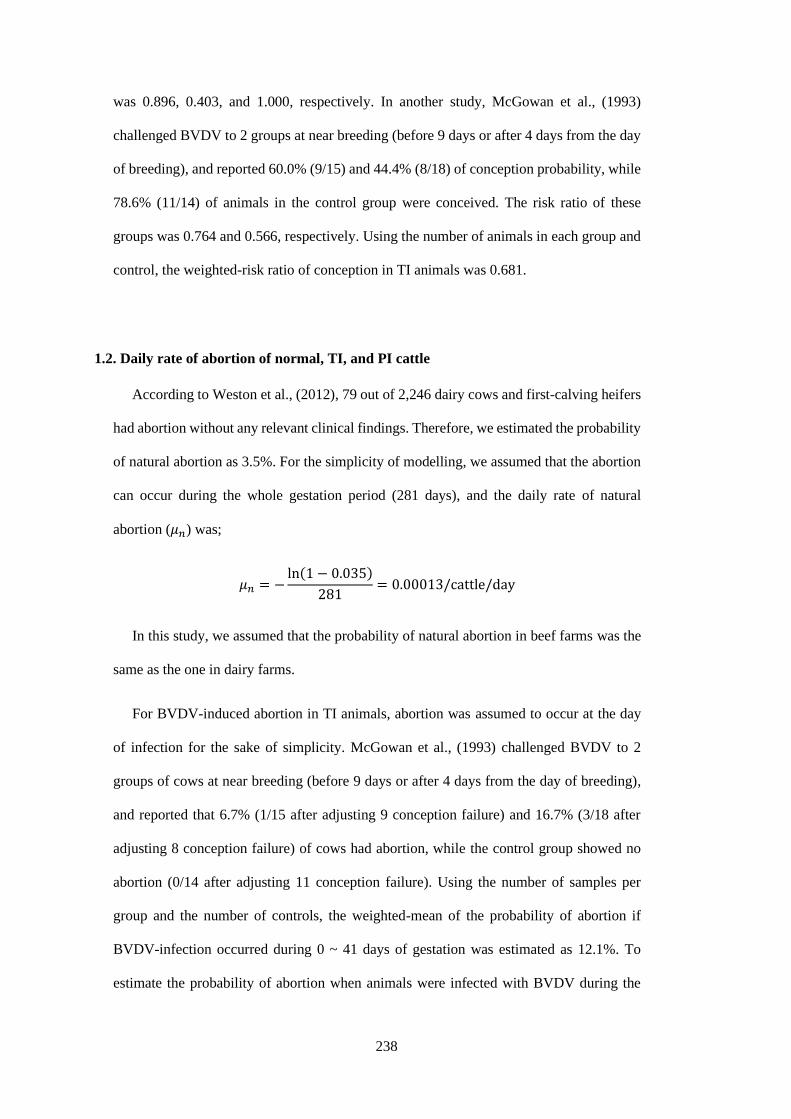
238
was 0.896, 0.403, and 1.000, respectively. In another study, McGowan et al., (1993)
challenged BVDV to 2 groups at near breeding (before 9 days or after 4 days from the day
of breeding), and reported 60.0% (9/15) and 44.4% (8/18) of conception probability, while
78.6% (11/14) of animals in the control group were conceived. The risk ratio of these
groups was 0.764 and 0.566, respectively. Using the number of animals in each group and
control, the weighted-risk ratio of conception in TI animals was 0.681.
1.2. Daily rate of abortion of normal, TI, and PI cattle
According to Weston et al., (2012), 79 out of 2,246 dairy cows and first-calving heifers
had abortion without any relevant clinical findings. Therefore, we estimated the probability
of natural abortion as 3.5%. For the simplicity of modelling, we assumed that the abortion
can occur during the whole gestation period (281 days), and the daily rate of natural
abortion (𝜇𝑛) was;
𝜇𝑛 = −ln(1 − 0.035)
281= 0.00013/cattle/day
In this study, we assumed that the probability of natural abortion in beef farms was the
same as the one in dairy farms.
For BVDV-induced abortion in TI animals, abortion was assumed to occur at the day
of infection for the sake of simplicity. McGowan et al., (1993) challenged BVDV to 2
groups of cows at near breeding (before 9 days or after 4 days from the day of breeding),
and reported that 6.7% (1/15 after adjusting 9 conception failure) and 16.7% (3/18 after
adjusting 8 conception failure) of cows had abortion, while the control group showed no
abortion (0/14 after adjusting 11 conception failure). Using the number of samples per
group and the number of controls, the weighted-mean of the probability of abortion if
BVDV-infection occurred during 0 ~ 41 days of gestation was estimated as 12.1%. To
estimate the probability of abortion when animals were infected with BVDV during the

239
mid-gestation period (42 ~ 150 days), we used the same method to the reported data of 5
studies (Grooms et al., 2007; McClurkin et al., 1984; Viet et al., 2004; Walz et al., 2017,
2018). Also, we treated calves with congenital defect as abortion for the convenience of
the simulation by assuming that calves with congenital defects died when they were born.
The reported probabilities of abortion in the previous studies were; 20.0% (3/15) for
McClurkin et al., (1984), 6.7% (1/15) for Grooms et al., (2007), 13.3% (2/15) for (Walz et
al., 2017), and 12.5% (2/16) for (Walz et al., 2018). The weighted-mean probability was
11.9%. On the estimated probability of abortion, we added 6.3% which was the probability
of calves (if dams were infected during their mid-gestation but did not have abortion)
expected to be born with congenital defects based on (Viet et al., 2004). Therefore, the
overall probability of abortion if BVDV-infection occurred during 42 ~ 150 days of
gestation was 17.4%. Finally, we assumed that no abortion occurred when animals were
BVDV infected after 150 days of gestation.
It has been speculated that BVDV induces mild placental lesions in dams which causes
damage to fetus and eventually results in abortion (Baszler et al., 1995; Liebler-Tenorio,
2005). Based on this speculation, abortion can occur any day of early-mid pregnancy as
long as BVDV persists in uterine tissue, which makes plausible that the probability of
abortion in PI animals be higher than in TI animals since the virus only exists temporarily
in TI animals. Therefore, in order to parameterise the abortion of PI animals, the
probabilities of abortion in TI animals were converted into daily abortion rates using the
average days of infection (15 days). The converted rates were applied to PI animals during
the gestation period (0~41 days: 0.0086/cattle/day, 42~150 days: 0.0128/cattle/day), which
was equivalent to 92.5% of abortion probability until 150 days of gestation (excluding the
natural abortion).
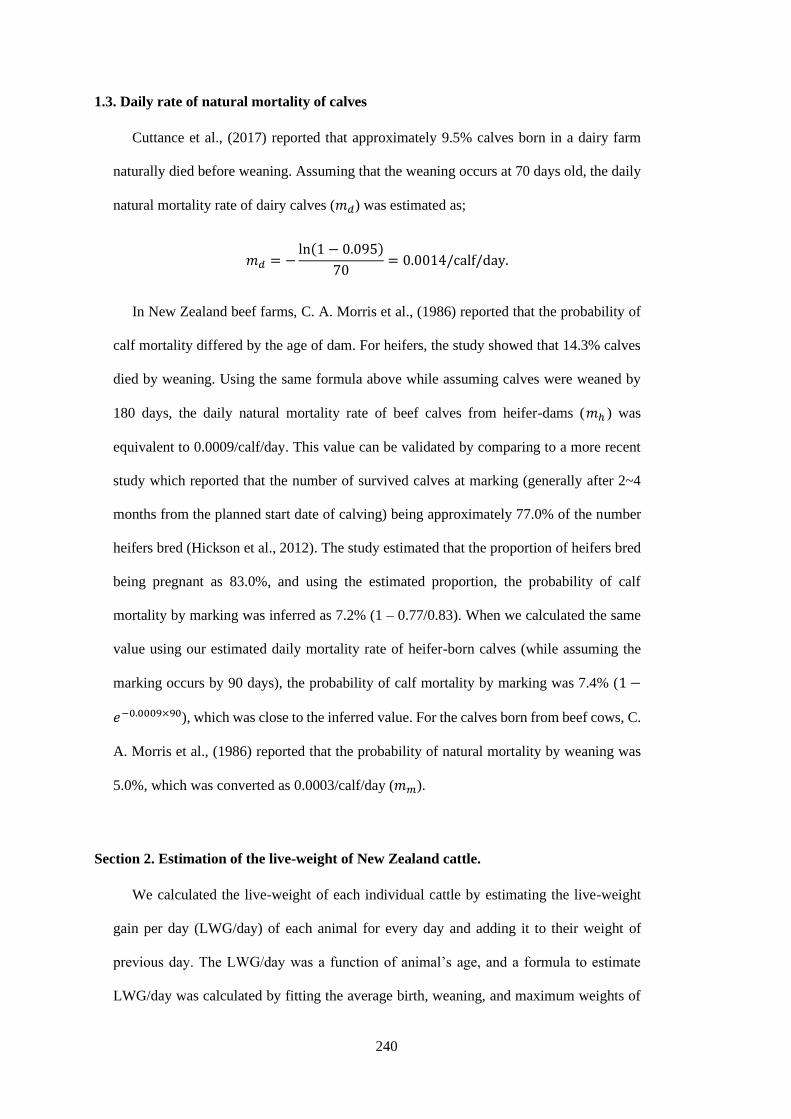
240
1.3. Daily rate of natural mortality of calves
Cuttance et al., (2017) reported that approximately 9.5% calves born in a dairy farm
naturally died before weaning. Assuming that the weaning occurs at 70 days old, the daily
natural mortality rate of dairy calves (𝑚𝑑) was estimated as;
𝑚𝑑 = −ln(1 − 0.095)
70= 0.0014/calf/day.
In New Zealand beef farms, C. A. Morris et al., (1986) reported that the probability of
calf mortality differed by the age of dam. For heifers, the study showed that 14.3% calves
died by weaning. Using the same formula above while assuming calves were weaned by
180 days, the daily natural mortality rate of beef calves from heifer-dams (𝑚ℎ ) was
equivalent to 0.0009/calf/day. This value can be validated by comparing to a more recent
study which reported that the number of survived calves at marking (generally after 2~4
months from the planned start date of calving) being approximately 77.0% of the number
heifers bred (Hickson et al., 2012). The study estimated that the proportion of heifers bred
being pregnant as 83.0%, and using the estimated proportion, the probability of calf
mortality by marking was inferred as 7.2% (1 – 0.77/0.83). When we calculated the same
value using our estimated daily mortality rate of heifer-born calves (while assuming the
marking occurs by 90 days), the probability of calf mortality by marking was 7.4% (1 −
𝑒−0.0009×90), which was close to the inferred value. For the calves born from beef cows, C.
A. Morris et al., (1986) reported that the probability of natural mortality by weaning was
5.0%, which was converted as 0.0003/calf/day (𝑚𝑚).
Section 2. Estimation of the live-weight of New Zealand cattle.
We calculated the live-weight of each individual cattle by estimating the live-weight
gain per day (LWG/day) of each animal for every day and adding it to their weight of
previous day. The LWG/day was a function of animal’s age, and a formula to estimate
LWG/day was calculated by fitting the average birth, weaning, and maximum weights of

241
cattle in each production type into the Von Bertalanffy function (Brown et al., 1976;
García-Muñiz et al., 1998).
According to the Von Bertalanffy function, the weight of cattle in day t (𝑊𝑡) is defined
as;
𝑊𝑡 = 𝐴 ∙ (1 − 𝐵 ∙ 𝑒−𝐾∙𝑡)3
where A is asymptotic or population-average maximum weight, and B and K are the
parameters to be estimated. By differentiating the formula above by t, weight gain or
growth rate per t can be calculated as;
3 ∙ 𝐾 ∙ 𝑡 ∙ (𝐵 ∙ 𝑒−𝐾∙𝑡
1 − 𝐵 ∙ 𝑒−𝐾∙𝑡).
For dairy cattle, the birth weight was assumed to be 36.1kg (Hickson et al., 2015) with
asymptotic maximum weight of 540kg (Anonymous, 2018a). With these assumptions, B
was estimated as 0.5941. By further assuming that the dairy cattle reach 90kg by 70 days
old, we calculated K as 0.0040. Therefore, the formula to estimate LWG/day for dairy cattle
was;
0.0119 ∙ 𝐴𝑔𝑒 ∙ (0.5941 ∙ 𝑒−0.0040∙𝐴𝑔𝑒
1 − 0.5941 ∙ 𝑒−0.0040∙𝐴𝑔𝑒).
To add variability of live-weight between animals, we assumed that the birth weight of
the calves was normally distributed. For female dairy calves, the mean and standard
deviation of birth weight were 38.4 and 0.5kg, respectively (Hickson et al., 2015). For the
male calves, the counterparts were 41.8 and 0.5kg, respectively (Hickson et al., 2015).
The same method was applied to beef cattle with 39.2kg of birth weight (S. Morris et
al., 2006), 570kg of asymptotic maximum weight, and 228kg of weaning weight (180 days
old) (Geenty & Morris, 2017). With these assumptions, the formula to estimate LWG/day
for beef cattle was;
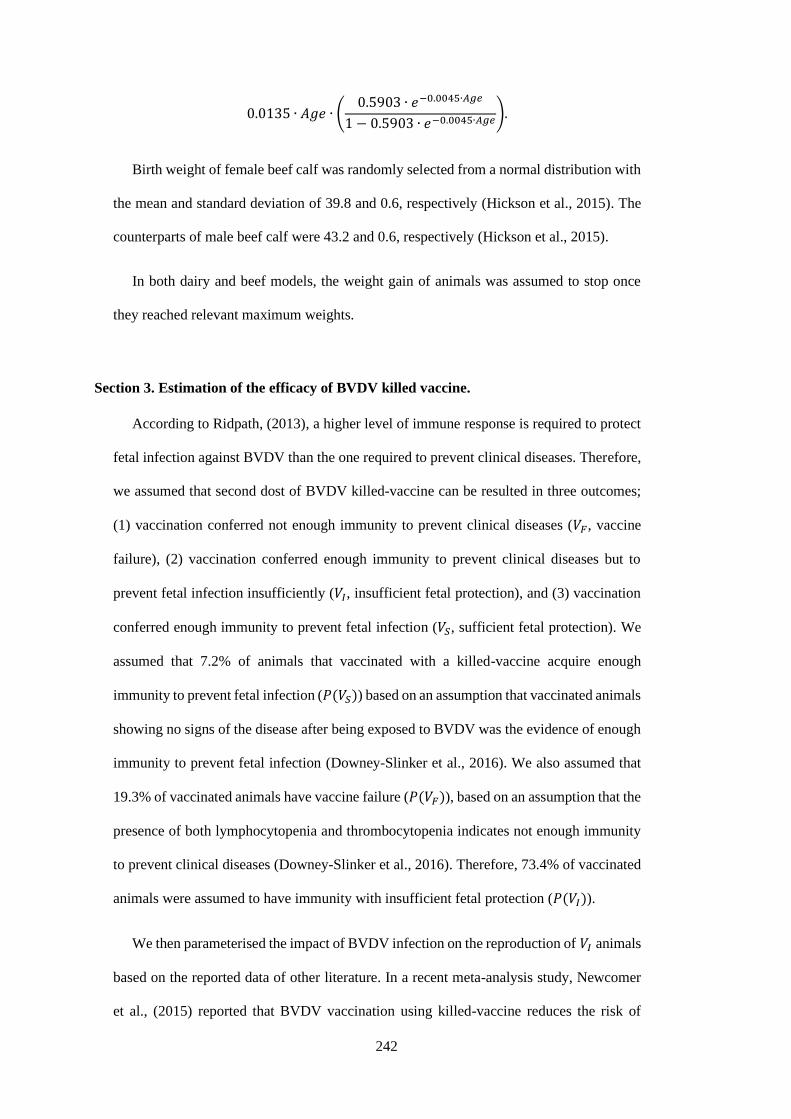
242
0.0135 ∙ 𝐴𝑔𝑒 ∙ (0.5903 ∙ 𝑒−0.0045∙𝐴𝑔𝑒
1 − 0.5903 ∙ 𝑒−0.0045∙𝐴𝑔𝑒).
Birth weight of female beef calf was randomly selected from a normal distribution with
the mean and standard deviation of 39.8 and 0.6, respectively (Hickson et al., 2015). The
counterparts of male beef calf were 43.2 and 0.6, respectively (Hickson et al., 2015).
In both dairy and beef models, the weight gain of animals was assumed to stop once
they reached relevant maximum weights.
Section 3. Estimation of the efficacy of BVDV killed vaccine.
According to Ridpath, (2013), a higher level of immune response is required to protect
fetal infection against BVDV than the one required to prevent clinical diseases. Therefore,
we assumed that second dost of BVDV killed-vaccine can be resulted in three outcomes;
(1) vaccination conferred not enough immunity to prevent clinical diseases (𝑉𝐹, vaccine
failure), (2) vaccination conferred enough immunity to prevent clinical diseases but to
prevent fetal infection insufficiently (𝑉𝐼, insufficient fetal protection), and (3) vaccination
conferred enough immunity to prevent fetal infection (𝑉𝑆, sufficient fetal protection). We
assumed that 7.2% of animals that vaccinated with a killed-vaccine acquire enough
immunity to prevent fetal infection (𝑃(𝑉𝑆)) based on an assumption that vaccinated animals
showing no signs of the disease after being exposed to BVDV was the evidence of enough
immunity to prevent fetal infection (Downey-Slinker et al., 2016). We also assumed that
19.3% of vaccinated animals have vaccine failure (𝑃(𝑉𝐹)), based on an assumption that the
presence of both lymphocytopenia and thrombocytopenia indicates not enough immunity
to prevent clinical diseases (Downey-Slinker et al., 2016). Therefore, 73.4% of vaccinated
animals were assumed to have immunity with insufficient fetal protection (𝑃(𝑉𝐼)).
We then parameterised the impact of BVDV infection on the reproduction of 𝑉𝐼 animals
based on the reported data of other literature. In a recent meta-analysis study, Newcomer
et al., (2015) reported that BVDV vaccination using killed-vaccine reduces the risk of

243
abortion by 0.662 times. Since BVDV infection during 0 ~ 41 days of gestation was
assumed to cause abortion with 12.1% of probability in this study (Section 1 of Appendix
3), we calculated the overall probability of abortion if an animal was infected during 0 ~
41 days of gestation given the animal was vaccinated (𝑃𝐸(𝐴𝑏𝑜𝑟𝑡|𝑉𝑎𝑐𝑐)) as 8.0% (0.121 ×
0.662). Assuming that BVDV-induced abortion only occurred in 𝑉𝐹 and 𝑉𝐼 ,
𝑃𝐸(𝐴𝑏𝑜𝑟𝑡|𝑉𝑎𝑐𝑐) was described as;
𝑃𝐸(𝐴𝑏𝑜𝑟𝑡|𝑉𝑎𝑐𝑐) = 𝑃𝐸(𝐴𝑏𝑜𝑟𝑡|𝑉𝐹) ∙ 𝑃(𝑉𝐹) + 𝑃𝐸(𝐴𝑏𝑜𝑟𝑡|𝑉𝐼) ∙ 𝑃(𝑉𝐼) = 0.080
where 𝑃𝐸(𝐴𝑏𝑜𝑟𝑡|𝑉𝑋) was the probability of abortion in vaccinated animals with the
vaccination outcome of x (either complete failure or insufficient protection), and 𝑃(𝑉𝐹)
and 𝑃(𝑉𝐼) were the probabilities of vaccine failure (0.193) and insufficient fetal protection
(0.734), respectively, among vaccinated animals. Since the animals with vaccine failure are
no different to susceptible animals with respect to BVDV infection, we assumed that
𝑃𝐸(𝐴𝑏𝑜𝑟𝑡|𝑉𝐹) was 12.1%, therefore, 𝑃𝐸(𝐴𝑏𝑜𝑟𝑡|𝑉𝐼) was estimated as 7.7%.
For BVDV infection during 42 ~ 150 days of gestation, the probability of abortion was
estimated as 11.9% (Section 1 of Appendix 3), and the overall probability of abortion if an
animal was infected during 42 ~ 150 days of gestation given the animal was vaccinated
(𝑃𝑀(𝐴𝑏𝑜𝑟𝑡|𝑉𝑎𝑐𝑐)) was calculated as 7.9% (0.119 × 0.662). Using the same approach as
above, 𝑃𝑀(𝐴𝑏𝑜𝑟𝑡|𝑉𝑎𝑐𝑐) was then;
𝑃𝑀(𝐴𝑏𝑜𝑟𝑡|𝑉𝑎𝑐𝑐) = 𝑃𝑀(𝐴𝑏𝑜𝑟𝑡|𝑉𝐹) ∙ 𝑃(𝑉𝐹) + 𝑃𝑀(𝐴𝑏𝑜𝑟𝑡|𝑉𝐼) ∙ 𝑃(𝑉𝐼) = 0.079
, and 𝑃𝑀(𝐴𝑏𝑜𝑟𝑡|𝑉𝐼) was estimated as 7.6%.
We also assumed that PI calves can be born if dams were 𝑉𝐼. (Newcomer et al., 2015)
reported that the risk of fetal infection in animals inoculated with killed-vaccine was 0.236
times lower than the one without vaccination. Since PI animals can be generated if dams
were infected during 42 ~ 150 days but did not have abortion, we described the risk ratio
of fetal infection in the vaccinated animals as;
244
𝑃(𝑃𝐼|𝑁𝑜 𝑎𝑏𝑜𝑟𝑡, 𝑉𝑎𝑐𝑐) × 𝑃(𝑁𝑜 𝑎𝑏𝑜𝑟𝑡, 𝑉𝑎𝑐𝑐)/𝑃(𝑃𝐼|𝑁𝑜 𝑎𝑏𝑜𝑟𝑡, 𝑁𝑜 𝑣𝑎𝑐𝑐) ×
𝑃(𝑁𝑜 𝑎𝑏𝑜𝑟𝑡, 𝑁𝑜 𝑣𝑎𝑐𝑐).
Assuming 87.5% of calves born from dams that infected with BVDV during 42 ~ 150
days of gestation become PI animals (Viet et al., 2004), the denominator of the formula
above was 0.875 × (1 − 0.119) = 0.771. Also, 𝑃(𝑁𝑜 𝑎𝑏𝑜𝑟𝑡, 𝑉𝑎𝑐𝑐) in the numerator can
be expressed as;
𝑃𝑀(𝑁𝑜 𝑎𝑏𝑜𝑟𝑡|𝑉𝐹) ∙ 𝑃(𝑉𝐹) + 𝑃𝑀(𝑁𝑜 𝑎𝑏𝑜𝑟𝑡|𝑉𝐼) ∙ 𝑃(𝑉𝐼)
= (1 − 0.119) ∙ 0.193 + (1 − 0.076) ∙ 0.734 = 0.849.
Therefore, 𝑃(𝑃𝐼|𝑁𝑜 𝑎𝑏𝑜𝑟𝑡, 𝑉𝑎𝑐𝑐) was 21.4% (= 0.236 × 0.771 ÷ 0.849).
According to Grooms et al., (2007), 3 out of 11 non-PI new born calves from vaccinated
dams that were BVDV-infected during 52 ~ 150 days of gestation had detectable level of
BVDV antibody titre. Therefore, we assumed that 27.3% (3/11) of new born calves from
𝑉𝐼 that infected during 42 ~ 150 days of gestation were already BVDV-recovered when
they were born (if they were not PI animals), and the rest of calves were assumed to have
passive immunity via maternal antibody. The probability of congenital defect of calf from
𝑉𝐼 animals was ignored as it has been rarely reported from other studies (Walz et al., 2018).
With our parameterisation, the overall probability of vaccinated dams to calve a PI
animal was 30.6%, which was similar to the reported BVDV vaccine efficacy that
commercially available in New Zealand (McArthur, 2004; Packianathan et al., 2017).
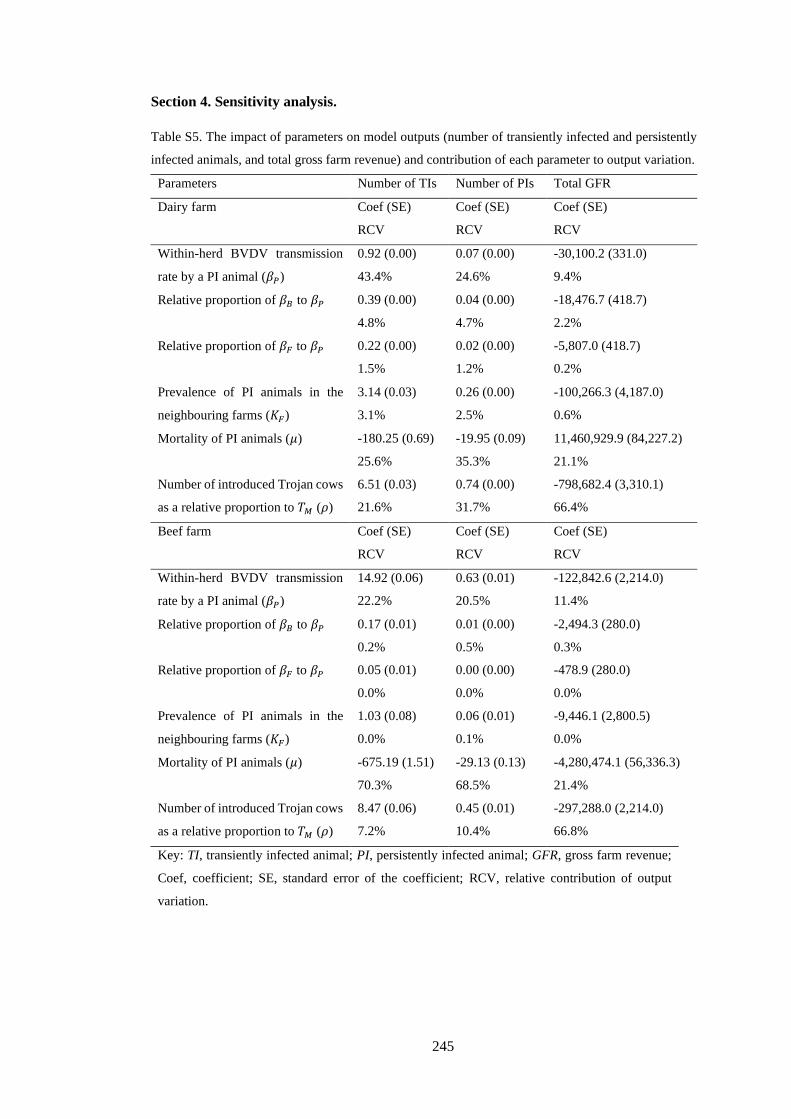
245
Section 4. Sensitivity analysis.
Table S5. The impact of parameters on model outputs (number of transiently infected and persistently
infected animals, and total gross farm revenue) and contribution of each parameter to output variation.
Parameters Number of TIs Number of PIs Total GFR
Dairy farm Coef (SE)
RCV
Coef (SE)
RCV
Coef (SE)
RCV
Within-herd BVDV transmission
rate by a PI animal (𝛽𝑃)
0.92 (0.00)
43.4%
0.07 (0.00)
24.6%
-30,100.2 (331.0)
9.4%
Relative proportion of 𝛽𝐵 to 𝛽𝑃 0.39 (0.00)
4.8%
0.04 (0.00)
4.7%
-18,476.7 (418.7)
2.2%
Relative proportion of 𝛽𝐹 to 𝛽𝑃
0.22 (0.00)
1.5%
0.02 (0.00)
1.2%
-5,807.0 (418.7)
0.2%
Prevalence of PI animals in the
neighbouring farms (𝐾𝐹)
3.14 (0.03)
3.1%
0.26 (0.00)
2.5%
-100,266.3 (4,187.0)
0.6%
Mortality of PI animals (𝜇) -180.25 (0.69)
25.6%
-19.95 (0.09)
35.3%
11,460,929.9 (84,227.2)
21.1%
Number of introduced Trojan cows
as a relative proportion to 𝑇𝑀 (𝜌)
6.51 (0.03)
21.6%
0.74 (0.00)
31.7%
-798,682.4 (3,310.1)
66.4%
Beef farm Coef (SE)
RCV
Coef (SE)
RCV
Coef (SE)
RCV
Within-herd BVDV transmission
rate by a PI animal (𝛽𝑃)
14.92 (0.06)
22.2%
0.63 (0.01)
20.5%
-122,842.6 (2,214.0)
11.4%
Relative proportion of 𝛽𝐵 to 𝛽𝑃 0.17 (0.01)
0.2%
0.01 (0.00)
0.5%
-2,494.3 (280.0)
0.3%
Relative proportion of 𝛽𝐹 to 𝛽𝑃 0.05 (0.01)
0.0%
0.00 (0.00)
0.0%
-478.9 (280.0)
0.0%
Prevalence of PI animals in the
neighbouring farms (𝐾𝐹)
1.03 (0.08)
0.0%
0.06 (0.01)
0.1%
-9,446.1 (2,800.5)
0.0%
Mortality of PI animals (𝜇) -675.19 (1.51)
70.3%
-29.13 (0.13)
68.5%
-4,280,474.1 (56,336.3)
21.4%
Number of introduced Trojan cows
as a relative proportion to 𝑇𝑀 (𝜌)
8.47 (0.06)
7.2%
0.45 (0.01)
10.4%
-297,288.0 (2,214.0)
66.8%
Key: TI, transiently infected animal; PI, persistently infected animal; GFR, gross farm revenue;
Coef, coefficient; SE, standard error of the coefficient; RCV, relative contribution of output
variation.

246
Appendix 4
Section 1. Modelling of animals on beef fattening or hobby farms
Due to the lack of data about the management characteristics of individual beef fattening
or hobby farms, the demographic and BVDV transmission status of animals on each of
these farms could not be explicitly modelled. To address this, we generated a virtual
location that all dairy-beef animals (i.e. fattening beef cattle with dairy origin) were moved
at 1 week old from every simulated dairy farm, and assumed that the animals on the virtual
location represented the animals on all beef fattening and hobby farms across New Zealand.
Same as the beef fattening stock on beef breeding farms, we assumed that female and male
dairy-beef animals were slaughtered when they reached 118 or 98 weeks old, respectively.
BVDV transmission among dairy-beef animals in the virtual location was also assumed
with the probability of BVDV infection for a susceptible dairy-beef animal on a given week
(𝑃𝑖𝑛𝑓𝑑𝑏 ) as;
𝑃𝑖𝑛𝑓𝑑𝑏 = 1 − 𝑒−𝜆𝑑𝑏
; 𝜆𝑑𝑏 = 𝛽𝑃𝜌𝐵
where 𝜌𝐵 was the prevalence of PI animals in the virtual location.
Since the animals on beef fattening or hobby farms were implicitly modelled, the impact
of those farms on national BVDV transmission was indirectly incorporated into the national
model by assuming that (1) the prevalence of PI animals on all beef fattening and hobby
farms across New Zealand was the same to 𝜌𝐵, and (2) adjacent beef fattening and hobby
farms contributed to local spread on dairy or beef breeding farms. A beef fattening or hobby
farm was assumed be adjacent to a given dairy or beef breeding farm if the Euclidean
distance between two farms were ≤ 3.0 km (see Section 3 in Appendix 4). With these
assumptions, we treated 𝜌𝐵 as the background prevalence of PI animals in New Zealand.
247
Section 2. Modelling of animals on beef fattening or hobby farms
2.1. Inferring herd size distributions
2.1.1. Dairy farms
We assumed that the distribution of number of mixed-age cows (MA) in New Zealand
dairy farms followed 𝑒𝑁(𝜇𝐷,𝜎2), where N(·,·) was a normal distribution, and 𝜇𝑑 and σ were
unknown mean and standard deviation, respectively. We used an approximate Bayesian
computation-sequential Monte Carlo (ABC-SMC) method to infer the unknown 𝜇𝐷 and σ.
ABC-SMC is a Bayesian method to infer the parameter values through a series of
estimation sequences (or SMC sequence), each of which has a decreased distance threshold
than its previous sequence (Toni et al., 2009). A SMC sequence starts with selecting a
parameter value (e.g. 𝜇𝐷 and σ) based on the perturbation of estimated values in the
previous sequence (or the random sampling of a prior distribution in case of the first SMC
sequence), and applying the selected value to a model (i.e. 𝑒𝑁(𝜇𝐷,𝜎2)) to generate data (i.e.
simulated data). The difference between observed and simulated data is measured by
comparing the summary statistics of each data (i.e. distance), and only the value showing
the distance less than a threshold of the sequence is retained. Current SMC sequence ends
when a number of values (i.e. particle) are collected, and the whole process repeats until
the particles of final SMC sequence are collected. The distribution drawn by the particles
of final sequence is a marginal posterior distribution, which approximates the posterior
distribution of the parameter given the observed data. More detailed information about
ABC-SMC method can be found in elsewhere (Toni et al., 2009).
In this study, a random MA herd size was generated based on the selected 𝜇𝐷 and σ for
each dairy farm, and the farm was allocated to one of 24 intervals of MC herd size ((0,50],
(50,100], (100,150],…, (950,1000], (1000,1100], (1100,1200], (1200,1500], [1500,2000))
according to the generated herd size. The distance was measured once all MC herd sizes of
11,269 farms were allocated to the relevant interval, and the selected 𝜇𝐷 and σ were either
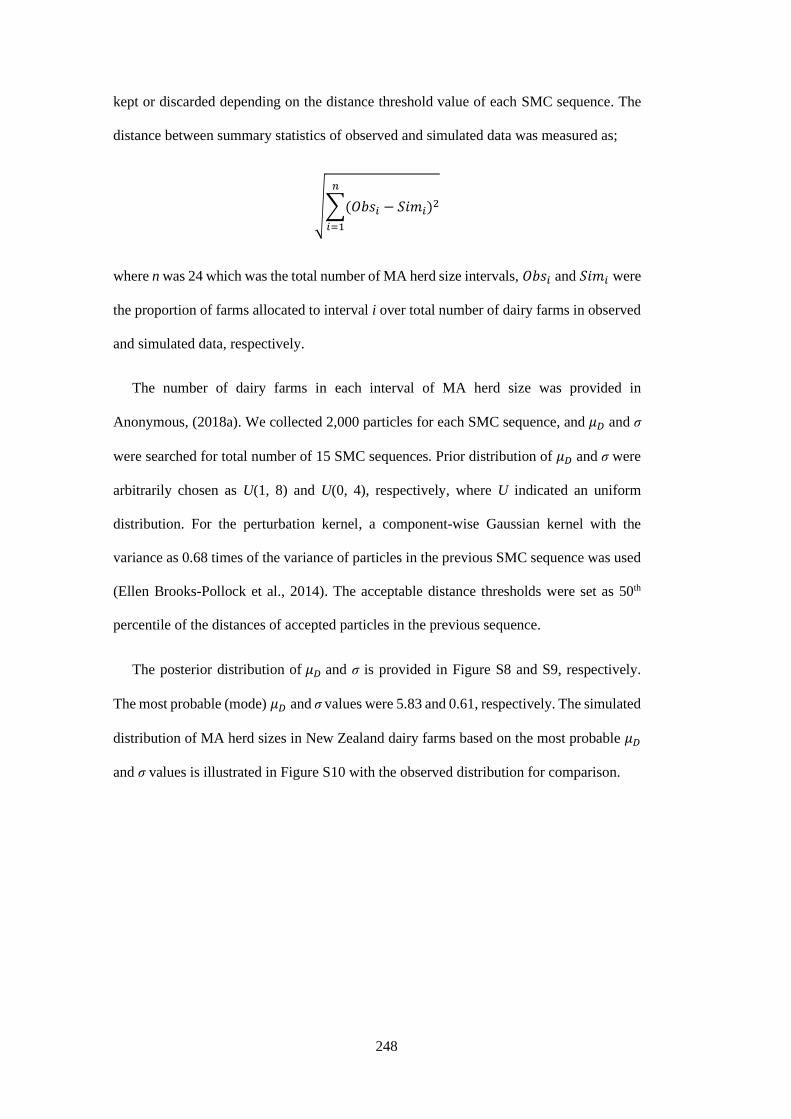
248
kept or discarded depending on the distance threshold value of each SMC sequence. The
distance between summary statistics of observed and simulated data was measured as;
√∑(𝑂𝑏𝑠𝑖 − 𝑆𝑖𝑚𝑖)2
𝑛
𝑖=1
where n was 24 which was the total number of MA herd size intervals, 𝑂𝑏𝑠𝑖 and 𝑆𝑖𝑚𝑖 were
the proportion of farms allocated to interval i over total number of dairy farms in observed
and simulated data, respectively.
The number of dairy farms in each interval of MA herd size was provided in
Anonymous, (2018a). We collected 2,000 particles for each SMC sequence, and 𝜇𝐷 and σ
were searched for total number of 15 SMC sequences. Prior distribution of 𝜇𝐷 and σ were
arbitrarily chosen as U(1, 8) and U(0, 4), respectively, where U indicated an uniform
distribution. For the perturbation kernel, a component-wise Gaussian kernel with the
variance as 0.68 times of the variance of particles in the previous SMC sequence was used
(Ellen Brooks-Pollock et al., 2014). The acceptable distance thresholds were set as 50th
percentile of the distances of accepted particles in the previous sequence.
The posterior distribution of 𝜇𝐷 and σ is provided in Figure S8 and S9, respectively.
The most probable (mode) 𝜇𝐷 and σ values were 5.83 and 0.61, respectively. The simulated
distribution of MA herd sizes in New Zealand dairy farms based on the most probable 𝜇𝐷
and σ values is illustrated in Figure S10 with the observed distribution for comparison.

249
Figure S8. Posterior distribution of 𝜇𝐷.
Figure S9. Posterior distribution of σ.

250
Figure S10. Observed and simulated distribution of mixed-age herd size of 11,269 dairy farms in New
Zealand.
2.1.2. Beef breeding farms
Unlike the dairy sector where a brief illustration of national MA herd size exists, there
was no equivalent information in the beef sector in New Zealand. The only information
available was the total number of MAs in New Zealand beef farms (approximately 850,000)
(Anonymous, 2018c). Therefore, we assumed that the distribution of MA herd size in beef
farms followed 𝑒𝑁(𝜇𝑏,𝜎2), where σ was 0.61 which was estimated in the dairy sector. We
used an ABC-SMC method to infer the unknown 𝜇𝐵 while restricting the MA herd size as
bigger than or equal to 10. A random MA herd size was generated based on the selected
𝜇𝐵 and σ for all 4,654 beef farms, and we calculated the total number of MA cows which
was the summary statistics. Details of the ABC-SMC method was the same as in the dairy
farms, except the distance was measured as the absolute difference between the observed
and simulated summary statistics.
The posterior distribution of 𝜇𝐵 is provided in Figure S11, and the most probable (mode)
𝜇𝐵 was 5.02. The simulated distribution of MA herd sizes in New Zealand beef farms is

251
provided in Figure S12. Unfortunately, we were not aware of any data or reference to
validate the simulated distribution of MA herd size of beef breeding farms in New Zealand.
However, the median of the simulated distribution was 150, which was in great accordance
with the reported median herd size of beef MA from a study in New Zealand (McFadden
et al., 2005).
Figure S11. Posterior distribution of 𝜇𝐵.
Figure S12.Simulated distribution of mixed-age herd size of 4,654 beef breeding farms in New Zealand.
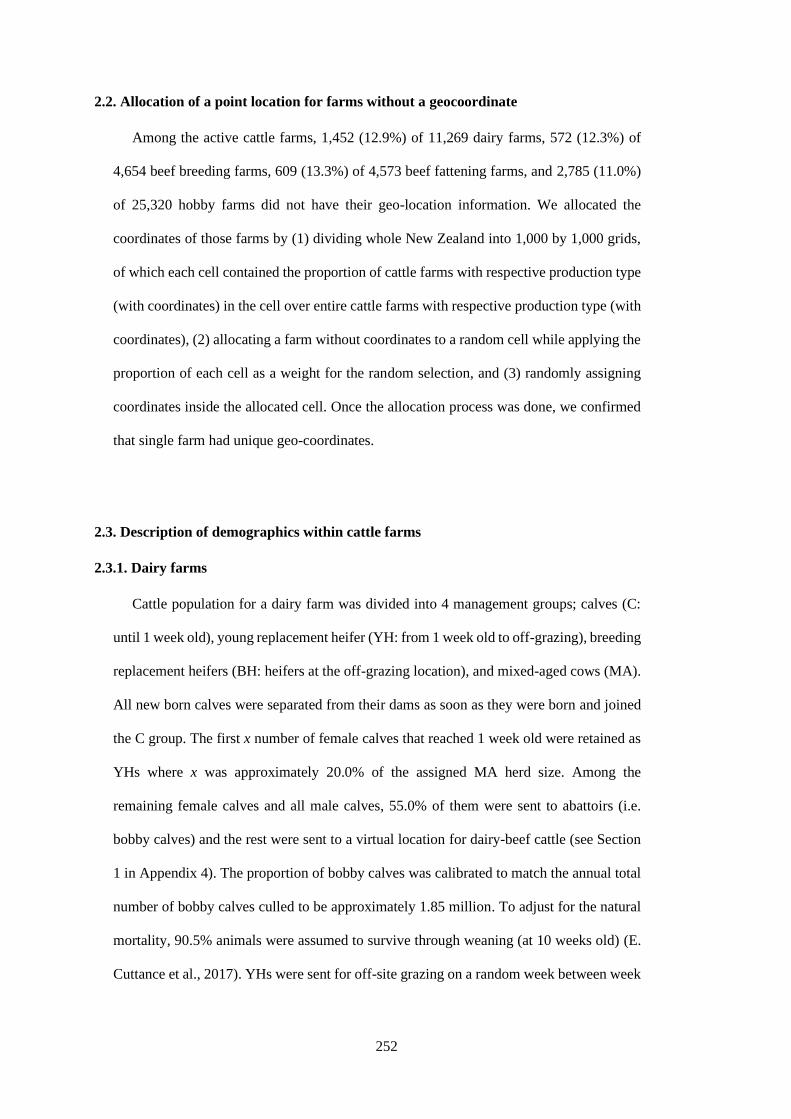
252
2.2. Allocation of a point location for farms without a geocoordinate
Among the active cattle farms, 1,452 (12.9%) of 11,269 dairy farms, 572 (12.3%) of
4,654 beef breeding farms, 609 (13.3%) of 4,573 beef fattening farms, and 2,785 (11.0%)
of 25,320 hobby farms did not have their geo-location information. We allocated the
coordinates of those farms by (1) dividing whole New Zealand into 1,000 by 1,000 grids,
of which each cell contained the proportion of cattle farms with respective production type
(with coordinates) in the cell over entire cattle farms with respective production type (with
coordinates), (2) allocating a farm without coordinates to a random cell while applying the
proportion of each cell as a weight for the random selection, and (3) randomly assigning
coordinates inside the allocated cell. Once the allocation process was done, we confirmed
that single farm had unique geo-coordinates.
2.3. Description of demographics within cattle farms
2.3.1. Dairy farms
Cattle population for a dairy farm was divided into 4 management groups; calves (C:
until 1 week old), young replacement heifer (YH: from 1 week old to off-grazing), breeding
replacement heifers (BH: heifers at the off-grazing location), and mixed-aged cows (MA).
All new born calves were separated from their dams as soon as they were born and joined
the C group. The first x number of female calves that reached 1 week old were retained as
YHs where x was approximately 20.0% of the assigned MA herd size. Among the
remaining female calves and all male calves, 55.0% of them were sent to abattoirs (i.e.
bobby calves) and the rest were sent to a virtual location for dairy-beef cattle (see Section
1 in Appendix 4). The proportion of bobby calves was calibrated to match the annual total
number of bobby calves culled to be approximately 1.85 million. To adjust for the natural
mortality, 90.5% animals were assumed to survive through weaning (at 10 weeks old) (E.
Cuttance et al., 2017). YHs were sent for off-site grazing on a random week between week

253
18 and week 22, and returned on the same week of the following year. Among returned
BHs, only the pregnant heifers were mixed to the MA group while the rest were culled.
Puberty in heifers was assumed to start at 54 weeks old (McNaughton et al., 2002) with
oestrus cycles occurring every 3 weeks thereafter until the animal became pregnant. When
a pregnant animal calved or aborted, the next oestrus was assumed to occur after two to
seven weeks (Olds & Seath, 1953) and was assumed to be silent. For simplicity, the planned
start of mating (PSM) for both the MA and BH herds started on the same week (randomly
chosen between week 39 and 45) and lasted for 12 weeks. During the first 6 weeks, animals
in oestrus were artificially inseminated. The probability of oestrus detection was set at 78.6%
and the probability of conception to artificial insemination was set at 72.0%. For the last 6
weeks, animals in oestrus were naturally mated with breeding bulls with the conception
probability at 50.0%. These probabilities were calibrated based on 66.1% of cows
artificially bred for the first 6 weeks being pregnant and 15.0% of cows remaining non-
pregnant after the 12 weeks of mating period (Anonymous, 2018a).
The gestation period was set at 40 weeks. A natural abortion rate of 0.0007 per week
was applied over the whole gestation period to achieve an overall abortion probability of
3.5% (Weston et al., 2012). Pregnancy scanning was conducted after 18 weeks from the
PSM for MAs only. Non-pregnant cows were culled immediately unless they were lactating,
in which case the cows were scheduled to be culled at the start of drying-off period. For
simplicity, we assumed that the start of drying-period coincided with the week of off-site
grazing. We assumed that only the pregnant BHs joined the MA herd, and we kept the MA
herd size constant by (1) culling x number of pregnant MAs older than 6 years where x was
the surplus of MAs compared to the assigned MA herd size, or (2) keeping x number of
empty MAs where x was the shortage of MAs compared to the assigned MA herd size. The
herd of breeding bulls was not considered in the simulation model since it is common
practice for breeding bulls to be present on farm only for the duration of the mating period
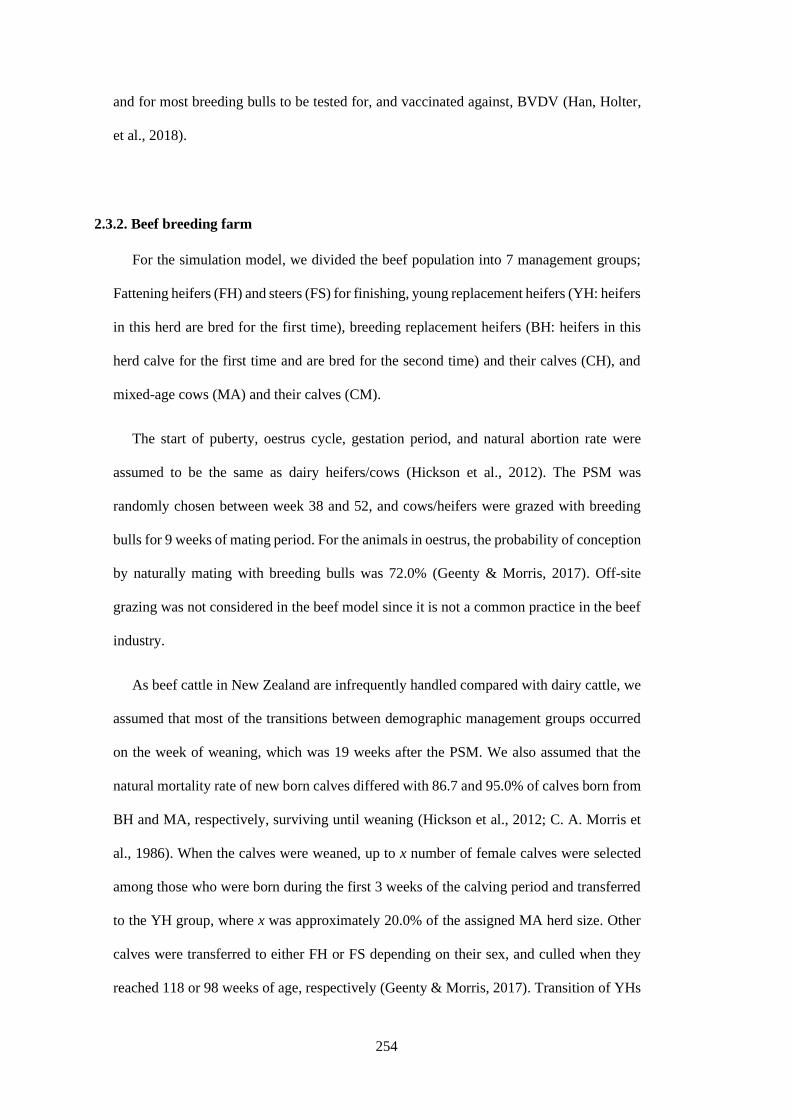
254
and for most breeding bulls to be tested for, and vaccinated against, BVDV (Han, Holter,
et al., 2018).
2.3.2. Beef breeding farm
For the simulation model, we divided the beef population into 7 management groups;
Fattening heifers (FH) and steers (FS) for finishing, young replacement heifers (YH: heifers
in this herd are bred for the first time), breeding replacement heifers (BH: heifers in this
herd calve for the first time and are bred for the second time) and their calves (CH), and
mixed-age cows (MA) and their calves (CM).
The start of puberty, oestrus cycle, gestation period, and natural abortion rate were
assumed to be the same as dairy heifers/cows (Hickson et al., 2012). The PSM was
randomly chosen between week 38 and 52, and cows/heifers were grazed with breeding
bulls for 9 weeks of mating period. For the animals in oestrus, the probability of conception
by naturally mating with breeding bulls was 72.0% (Geenty & Morris, 2017). Off-site
grazing was not considered in the beef model since it is not a common practice in the beef
industry.
As beef cattle in New Zealand are infrequently handled compared with dairy cattle, we
assumed that most of the transitions between demographic management groups occurred
on the week of weaning, which was 19 weeks after the PSM. We also assumed that the
natural mortality rate of new born calves differed with 86.7 and 95.0% of calves born from
BH and MA, respectively, surviving until weaning (Hickson et al., 2012; C. A. Morris et
al., 1986). When the calves were weaned, up to x number of female calves were selected
among those who were born during the first 3 weeks of the calving period and transferred
to the YH group, where x was approximately 20.0% of the assigned MA herd size. Other
calves were transferred to either FH or FS depending on their sex, and culled when they
reached 118 or 98 weeks of age, respectively (Geenty & Morris, 2017). Transition of YHs

255
into BHs also occurred on the week of weaning, and it was assumed that all BHs joined the
MA herd at 3 weeks before the week of weaning. At one week before the week of weaning,
pregnancy scanning of MAs was performed and any empty MAs were tagged. We kept the
herd size constant by either (1) selling some of the pregnant (i.e. non-tagged) MAs older
than 6 years if the number of MAs (= non-tagged MAs + joined BHs) was larger than the
assigned MA herd size, or (2) keeping empty (i.e. tagged) MAs if the number of MAs (=
non-tagged MAs + joined BHs) was lower than the assigned MA herd size. As in the dairy
model, the demographic group of breeding bulls was not included in the beef model.
2.4. Probability of having a cattle trade between two farms
We reconstructed the cattle trade movements between dairy farms and between beef
breeding farms using a network re-wiring algorithm based on the observed trade data
during 2014-2016. The network re-wiring algorithm is a method to connect a pair of farms
based on the probability of whether a trade was likely to occur between two farms.
To predict the probability of a trade between two dairy (or beef breeding) farms, we
first developed a multivariable logistic regression model. Using the extracted trade data,
we generated: (1) a list of farms sold and purchased cattle, and (2) the number of animals
sold and purchased per farm, for every week. Then, we created a contingency dataset that
contained all possible dairy (or beef breeding) cattle trades that could had occurred. For
example, if actual trades occurred between farms A and B, C and D, and E and B (sold and
purchased) in a given week, the contingency dataset was created with the trades between
A and B, A and D, C and B, C and D, E and B, and E and D, while only the ones actually
occurred were tagged as positive for the outcome of the logistic regression. For each trade
in the contingency dataset, the Euclidean distance, (absolute) difference in the number of
cattle traded, and whether two farms were located in the same bovine tuberculosis control
area were investigated, and used as the explanatory variables of univariable logistic
regression. For the Euclidean distance and difference in the number of cattle traded,
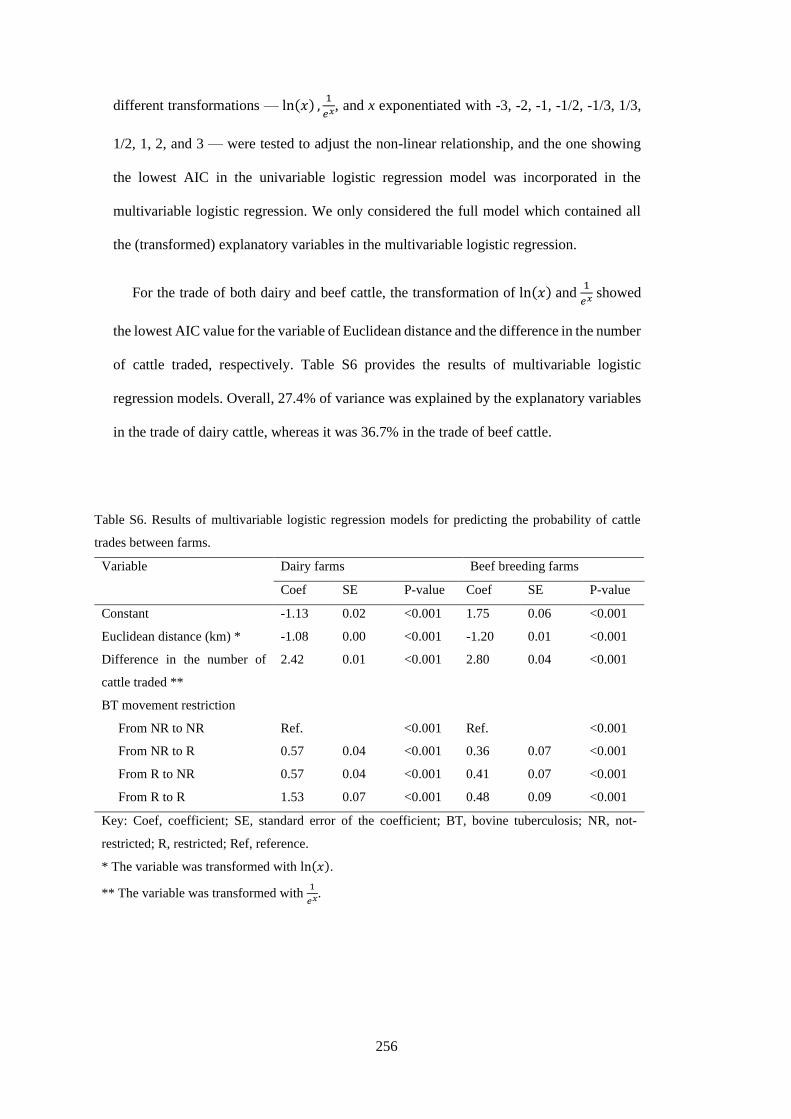
256
different transformations — ln(𝑥) ,1
𝑒𝑥, and x exponentiated with -3, -2, -1, -1/2, -1/3, 1/3,
1/2, 1, 2, and 3 — were tested to adjust the non-linear relationship, and the one showing
the lowest AIC in the univariable logistic regression model was incorporated in the
multivariable logistic regression. We only considered the full model which contained all
the (transformed) explanatory variables in the multivariable logistic regression.
For the trade of both dairy and beef cattle, the transformation of ln(𝑥) and 1
𝑒𝑥 showed
the lowest AIC value for the variable of Euclidean distance and the difference in the number
of cattle traded, respectively. Table S6 provides the results of multivariable logistic
regression models. Overall, 27.4% of variance was explained by the explanatory variables
in the trade of dairy cattle, whereas it was 36.7% in the trade of beef cattle.
Table S6. Results of multivariable logistic regression models for predicting the probability of cattle
trades between farms.
Variable Dairy farms Beef breeding farms
Coef SE P-value Coef SE P-value
Constant -1.13 0.02 <0.001 1.75 0.06 <0.001
Euclidean distance (km) * -1.08 0.00 <0.001 -1.20 0.01 <0.001
Difference in the number of
cattle traded **
2.42 0.01 <0.001 2.80 0.04 <0.001
BT movement restriction
From NR to NR Ref. <0.001 Ref. <0.001
From NR to R 0.57 0.04 <0.001 0.36 0.07 <0.001
From R to NR 0.57 0.04 <0.001 0.41 0.07 <0.001
From R to R 1.53 0.07 <0.001 0.48 0.09 <0.001
Key: Coef, coefficient; SE, standard error of the coefficient; BT, bovine tuberculosis; NR, not-
restricted; R, restricted; Ref, reference.
* The variable was transformed with ln(𝑥).
** The variable was transformed with 1
𝑒𝑥.

257
Section 3. Calibration of parameters related to between-farm BVDV transmission
In this study, we assumed that between-herd transmission rate (𝛽𝐻) and between-farm
transmission rate (𝛽𝐹) of a PI animal were proportionally (𝑚1 and 𝑚2, respectively) lower
than within-herd transmission rate of a PI animal (𝛽𝑃). We calibrated the values of 𝑚1 and
𝑚2 as well as the distance threshold to determine adjacency between farms (d) by
comparing the simulated prevalence of BVDV positive farms to the reported prevalence.
To estimate the parameter values while achieving computational efficiency, we
developed a sub-model which included only the cattle farms (1,212 of dairy farms and 873
of beef farms) in the Canterbury. We selected Canterbury region since it contained
approximately 10% of all commercial cattle farms in this study. Trade movements between
farms in Canterbury region were extracted to estimate the total number of cattle traded per
week and total number of farms sold and purchased cattle per week inside the region, and
we ignored any trade from (or to) farms in the region to (or from) farms in other regions.
In the sub-model, we ran the first 5 years as a burn-in period to stabilise the population
demographics, introduced BVDV to randomly chosen 104 farms (5% of farms in the
Canterbury), and simulated the model for the next 40 years to measure the proportion of
dairy farms carrying at least one either TI or PI animals in mixed-age cow herd (𝑃𝑟𝑒𝑣+𝐷).
The 𝑃𝑟𝑒𝑣+𝐷 was a proxy of the proportion of positive farms to bulk tank milk (BTM)
BVDV antigen ELISA or RT-PCR test. We assumed that the median of 𝑃𝑟𝑒𝑣+𝐷 during the
last 15 years should approximate at 7.5% (Gates, Han, et al., 2019), and identified the 𝑚1,
𝑚2, and d values that satisfying the assumption by (1) applying different combination of
values (𝑚1, and 𝑚2: 0.10, 0.20, and 0.40 for each; d: 2.0 km, 3.0 km, and 4.0 km) into the
sub-model (resulting in 27 scenarios), and (2) repeating the (1) process for 50 times to
generate the distribution of 𝑃𝑟𝑒𝑣+𝐷 with respect to different combinations of 𝑚1, 𝑚2, and
d values. We then visually examined the generated distributions, and chose the parameter
values that the median of the distribution was located approximately 7.5%. If the median
of 𝑃𝑟𝑒𝑣+𝐷 for the multiple combinations of 𝑚1, 𝑚2, and d values approximated to the 7.5%,
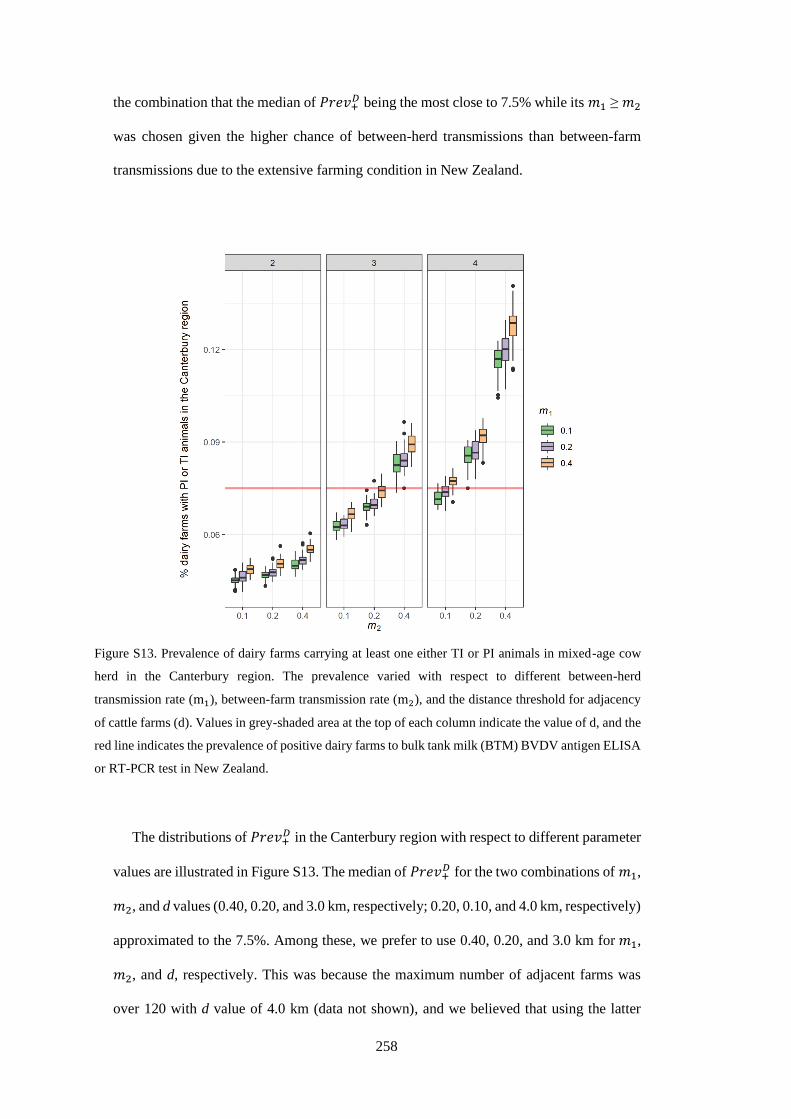
258
the combination that the median of 𝑃𝑟𝑒𝑣+𝐷 being the most close to 7.5% while its 𝑚1 ≥ 𝑚2
was chosen given the higher chance of between-herd transmissions than between-farm
transmissions due to the extensive farming condition in New Zealand.
Figure S13. Prevalence of dairy farms carrying at least one either TI or PI animals in mixed-age cow
herd in the Canterbury region. The prevalence varied with respect to different between-herd
transmission rate (m1), between-farm transmission rate (m2), and the distance threshold for adjacency
of cattle farms (d). Values in grey-shaded area at the top of each column indicate the value of d, and the
red line indicates the prevalence of positive dairy farms to bulk tank milk (BTM) BVDV antigen ELISA
or RT-PCR test in New Zealand.
The distributions of 𝑃𝑟𝑒𝑣+𝐷 in the Canterbury region with respect to different parameter
values are illustrated in Figure S13. The median of 𝑃𝑟𝑒𝑣+𝐷 for the two combinations of 𝑚1,
𝑚2, and d values (0.40, 0.20, and 3.0 km, respectively; 0.20, 0.10, and 4.0 km, respectively)
approximated to the 7.5%. Among these, we prefer to use 0.40, 0.20, and 3.0 km for 𝑚1,
𝑚2, and d, respectively. This was because the maximum number of adjacent farms was
over 120 with d value of 4.0 km (data not shown), and we believed that using the latter

259
combination (0.20, 0.10, and 4.0 km for 𝑚1, 𝑚2, and d, respectively) would overestimate
local spread of BVDV transmission. Therefore, we concluded the value of 𝛽𝐵 and 𝛽𝐹 as
0.40 and 0.20 times of 𝛽𝑃, respectively, and the distance threshold for adjacency of cattle
farms as 3.0 km well represented the parameters for BVDV transmission in the New
Zealand cattle industries.
Section 4. Overall modelling process
At the beginning of each week, farms were randomly selected as either source or
destination farms for animal trade movements, and paired based on a network re-wiring
algorithm. For each farm of a given week, the probability of BVDV infection for individual
animals was calculated for each herd initially. Then, demographic and BVDV infection
status of each individual animal in each herd were updated. Once the demographic and
BVDV infection status were updated, the animal was probabilistically determined to be
whether traded or not if the farm was on the list of source farms. After the simulation of all
animals for all farms was completed for the given week, the model moved on to the next
week until the end of simulation period. The overall modelling process is illustrated in
Figure S14.
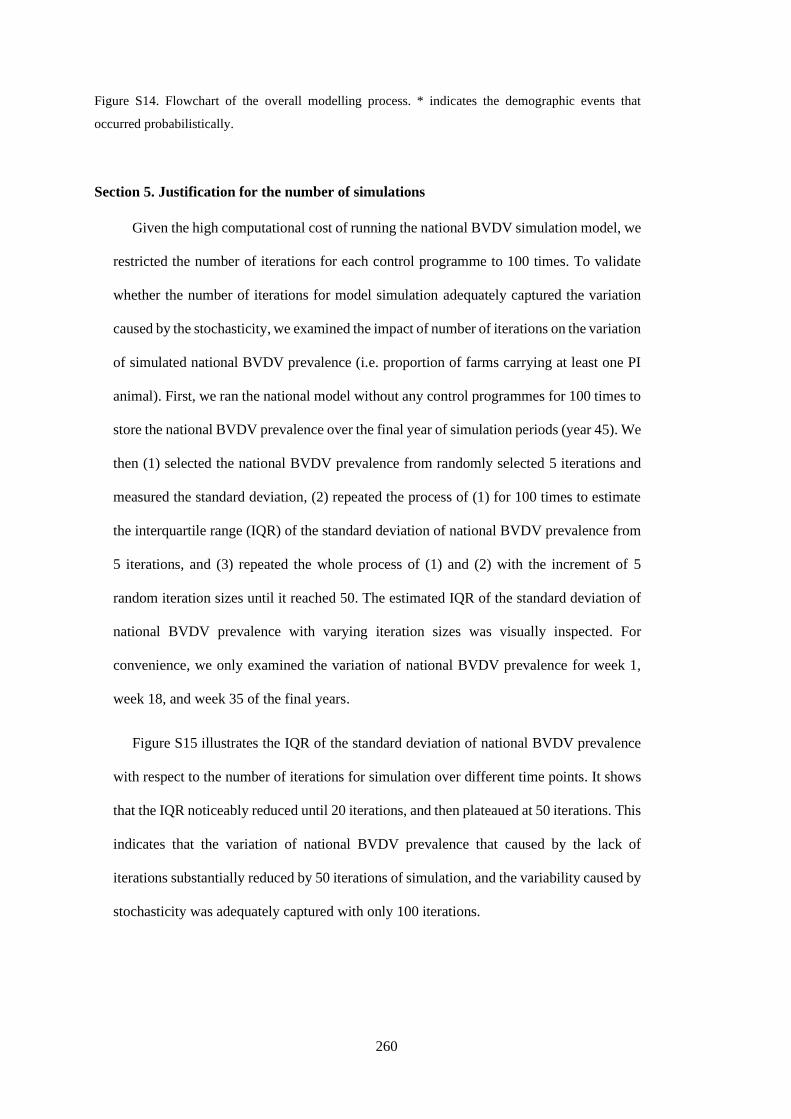
260
Figure S14. Flowchart of the overall modelling process. * indicates the demographic events that
occurred probabilistically.
Section 5. Justification for the number of simulations
Given the high computational cost of running the national BVDV simulation model, we
restricted the number of iterations for each control programme to 100 times. To validate
whether the number of iterations for model simulation adequately captured the variation
caused by the stochasticity, we examined the impact of number of iterations on the variation
of simulated national BVDV prevalence (i.e. proportion of farms carrying at least one PI
animal). First, we ran the national model without any control programmes for 100 times to
store the national BVDV prevalence over the final year of simulation periods (year 45). We
then (1) selected the national BVDV prevalence from randomly selected 5 iterations and
measured the standard deviation, (2) repeated the process of (1) for 100 times to estimate
the interquartile range (IQR) of the standard deviation of national BVDV prevalence from
5 iterations, and (3) repeated the whole process of (1) and (2) with the increment of 5
random iteration sizes until it reached 50. The estimated IQR of the standard deviation of
national BVDV prevalence with varying iteration sizes was visually inspected. For
convenience, we only examined the variation of national BVDV prevalence for week 1,
week 18, and week 35 of the final years.
Figure S15 illustrates the IQR of the standard deviation of national BVDV prevalence
with respect to the number of iterations for simulation over different time points. It shows
that the IQR noticeably reduced until 20 iterations, and then plateaued at 50 iterations. This
indicates that the variation of national BVDV prevalence that caused by the lack of
iterations substantially reduced by 50 iterations of simulation, and the variability caused by
stochasticity was adequately captured with only 100 iterations.
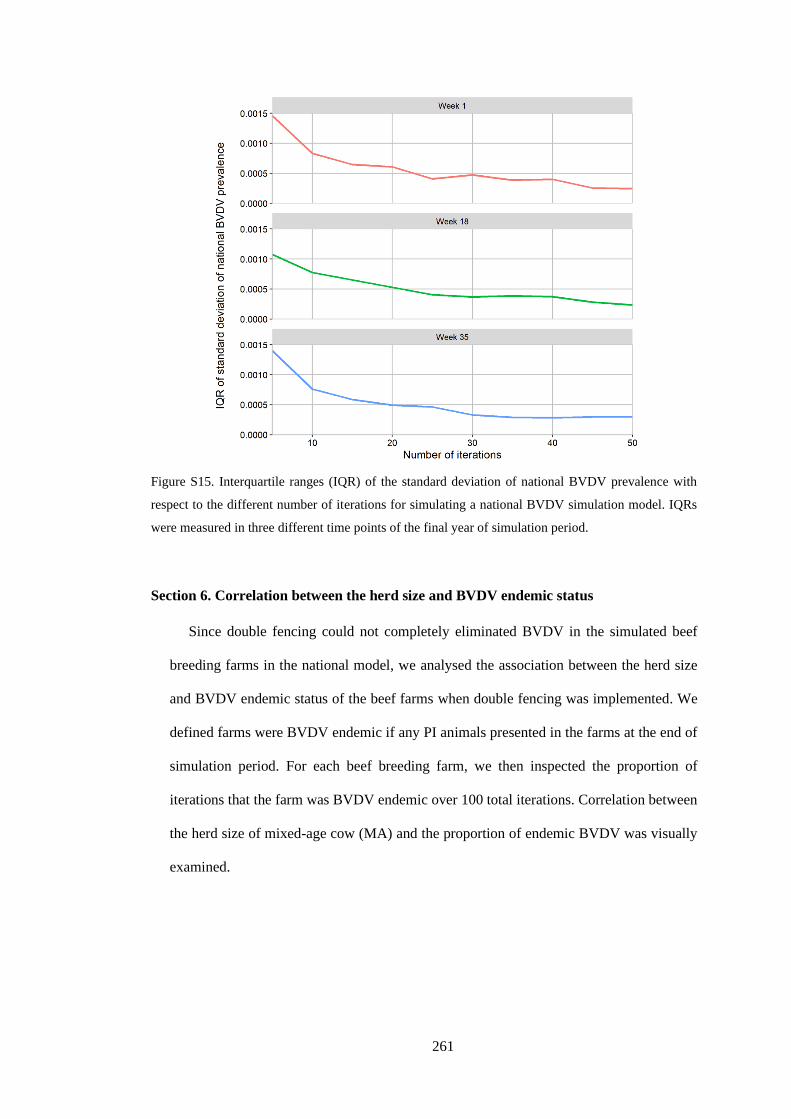
261
Figure S15. Interquartile ranges (IQR) of the standard deviation of national BVDV prevalence with
respect to the different number of iterations for simulating a national BVDV simulation model. IQRs
were measured in three different time points of the final year of simulation period.
Section 6. Correlation between the herd size and BVDV endemic status
Since double fencing could not completely eliminated BVDV in the simulated beef
breeding farms in the national model, we analysed the association between the herd size
and BVDV endemic status of the beef farms when double fencing was implemented. We
defined farms were BVDV endemic if any PI animals presented in the farms at the end of
simulation period. For each beef breeding farm, we then inspected the proportion of
iterations that the farm was BVDV endemic over 100 total iterations. Correlation between
the herd size of mixed-age cow (MA) and the proportion of endemic BVDV was visually
examined.

262
Figure S16. Correlation between the herd size and proportion of endemic BVDV in 4,654 simulated
beef breeding farms.
Figure S16 illustrates the association between the herd size and proportion of BVDV
endemic status for 4,654 beef breeding farms. BVDV persisted until the end of simulation
period in approximately 50% of iterations if farms had more than 500 MA herd size. It
shows that the endemic status of simulated beef breeding farms was highly correlated with
their herd size.