
Essential role for eIF4GI overexpression in the pathogenesis of inflammatory breast cancer
15
LETTERS Essential role for eIF4GI overexpression in the pathogenesis of inflammatory breast cancer Deborah Silvera 1 , Rezina Arju 1 , Farbod Darvishian 2 , Paul H. Levine 3 , Ladan Zolfaghari 3 , Judith Goldberg 4 , Tsivia Hochman 4 , Silvia C. Formenti 5,6 and Robert J. Schneider 1,6 Inflammatory breast cancer (IBC) is the most lethal form of primary breast cancer 1 . IBC lethality derives from generation of tumour emboli, which are non-adherent cell clusters that rapidly spread by a form of continuous invasion known as passive metastasis 2–5 . In most cancers, expression of E-cadherin, an epithelial marker, is indicative of low metastatic potential 6,7 . In IBC, E-cadherin is overexpressed 8 and supports formation of tumour emboli by promoting tumour cell interactions rather than adherence to stroma 2,3,9 . E-cadherin, a surface component of adherens junctions, is anchored by interaction with p120 catenin (p120). We show that the unique pathogenic properties of IBC result in part from overexpression of the translation initiation factor eIF4GI in most IBCs. eIF4GI reprograms the protein synthetic machinery for increased translation of mRNAs with internal ribosome entry sites (IRESs) that promote IBC tumour cell survival and formation of tumour emboli. Overexpression of eIF4GI promotes formation of IBC tumour emboli by enhancing translation of IRES-containing p120 mRNAs. These findings provide a new understanding of translational control in the development of advanced breast cancer. Although alterations in translational control have not been studied exten- sively in human malignancies 10 , overexpression of the translation initia- tion factor eIF4E occurs in some human cancers 11–14 . eIF4E, eIF4A and eIF4GI, form a complex (eIF4F) that recruits ribosomes to the capped end of mRNA to initiate cap-dependent translation 15 . Cap-dependent mRNA translation is regulated by the eIF4E-sequestering protein 4E-BP1, which in turn is controlled by the kinase mTOR 15 . Overexpression of eIF4E pref- erentially increases translation of mRNAs containing stable 5´ second- ary structures 10,16 . A small number of mRNAs continue to be translated during stresses when cap-dependent translation is impaired. These dual function mRNAs contain a cap as well as IRES elements that direct their translation in a cap-independent manner 17,18 . eIF4E, eIF4GI and 4E-BP1 levels were examined in 37 IBC tumour biopsies, 30 stage III (T3, ≥5cm) non-IBC tumours and 10 normal breast epithelium specimens (Fig. 1a; Supplementary Information, Table S1). eIF4GI was markedly overexpressed in nearly 80% of IBC specimens, compared with weak expression in normal breast epithelium (P < 0.001). A small number of IBC specimens overexpressed eIF4E, although with no statistical significance (~20%, P = 0.174), and even fewer overex- pressed 4E-BP1 (~15%, P = 0.089), also without statistical significance. Analysis of the two additional eIF4G family members, eIF4GII and DAP5, showed that neither was overexpressed in IBC specimens or normal tissue (Supplementary Information, Table S1). Expression of eIF4GI, eIF4E and 4E-BP1 was different in stage III (T3) invasive duc- tal carcinomas, which overexpressed eIF4GI and 4E-BP1 in 69% and 87% of tumours, respectively (Supplementary Information, Table S2), as observed previously 17 . Logistic regression analysis demonstrated that of all translation factors examined, eIF4GI overexpression was the only significant predictor of IBC. Moreover, there was no association between eIF4GI overexpression in IBC and levels of eIF4E (P = 0.30) or 4E-BP1 (P = 0.71). E-cadherin was previously shown to be overexpressed in all of the IBC specimens examined here by more than 2-fold, with a mean of 4-fold, compared with normal breast epithelium 19 . The role of overexpressed eIF4GI in IBC was examined in the SUM149 cell line 20 , which is well established as a model for IBC 21 . Compared with normal human mammary epithelial (HME) cells, SUM149 cells overex- pressed eIF4GI and E-cadherin, whereas 4E-BP1, eIF4A and eIF4E levels were equivalent (Fig. 1b). In addition, a substantial amount of eIF4GI was free and unbound to eIF4E, because IBC cells have a high proportion of their 4E-BP1 protein in the hypophosphorylated (activated) state and bound to eIF4E, compared with a mammary epithelial cell line (MCF10A) that has similar levels of eIF4GI and total 4E-BP1 (Supplementary Information, Fig. S1). To study the role of high levels of eIF4GI in IBC, we silenced it with short hairpin RNAs (shRNAs) in SUM149 cells. Silencing reduced eIF4GI protein levels by at least 90%, compared with control cells (Fig. 1c), but only slightly decreased overall protein synthesis (15%, Fig. 1d), had no effect on cell viability, and only slightly impaired cell proliferation (data not shown). This is consistent with the previously reported small reduction in protein synthesis on eIF4GI depletion 18 . 1 Department of Microbiology and 2 Department of Pathology, New York University School of Medicine, New York, New York, 10016, USA. 3 George Washington University School of Public Health, Washington, District of Columbia, 20037, USA. 4 Department of Environmental Medicine, Division of Biostatistics, 5 Department of Radiation Oncology and 6 NYU Cancer Institute, New York University School of Medicine, New York, New York, 10016, USA. Correspondence should be addressed to R.J.S. (e‑mail: [email protected]) Received 5 February 2009; accepted 12 March 2009; published online 14 June 2009; DOI: 10.1038/ncb1900 NATURE CELL BIOLOGY ADVANCE ONLINE PUBLICATION 1 © 2009 Macmillan Publishers Limited. All rights reserved.
-
Upload
independent -
Category
Documents
-
view
1 -
download
0
Transcript of Essential role for eIF4GI overexpression in the pathogenesis of inflammatory breast cancer

L E T T E R S
Essential role for eIF4GI overexpression in the pathogenesis of inflammatory breast cancer Deborah Silvera1, Rezina Arju1, Farbod Darvishian2, Paul H. Levine3, Ladan Zolfaghari3, Judith Goldberg4, Tsivia Hochman4, Silvia C. Formenti5,6 and Robert J. Schneider1,6
Inflammatory breast cancer (IBC) is the most lethal form of primary breast cancer1. IBC lethality derives from generation of tumour emboli, which are non-adherent cell clusters that rapidly spread by a form of continuous invasion known as passive metastasis2–5. In most cancers, expression of E-cadherin, an epithelial marker, is indicative of low metastatic potential6,7. In IBC, E-cadherin is overexpressed8 and supports formation of tumour emboli by promoting tumour cell interactions rather than adherence to stroma2,3,9. E-cadherin, a surface component of adherens junctions, is anchored by interaction with p120 catenin (p120). We show that the unique pathogenic properties of IBC result in part from overexpression of the translation initiation factor eIF4GI in most IBCs. eIF4GI reprograms the protein synthetic machinery for increased translation of mRNAs with internal ribosome entry sites (IRESs) that promote IBC tumour cell survival and formation of tumour emboli. Overexpression of eIF4GI promotes formation of IBC tumour emboli by enhancing translation of IRES-containing p120 mRNAs. These findings provide a new understanding of translational control in the development of advanced breast cancer.
Although alterations in translational control have not been studied exten-sively in human malignancies10, overexpression of the translation initia-tion factor eIF4E occurs in some human cancers11–14. eIF4E, eIF4A and eIF4GI, form a complex (eIF4F) that recruits ribosomes to the capped end of mRNA to initiate cap-dependent translation15. Cap-dependent mRNA translation is regulated by the eIF4E-sequestering protein 4E-BP1, which in turn is controlled by the kinase mTOR15. Overexpression of eIF4E pref-erentially increases translation of mRNAs containing stable 5´ second-ary structures10,16. A small number of mRNAs continue to be translated during stresses when cap-dependent translation is impaired. These dual function mRNAs contain a cap as well as IRES elements that direct their translation in a cap-independent manner17,18.
eIF4E, eIF4GI and 4E-BP1 levels were examined in 37 IBC tumour biopsies, 30 stage III (T3, ≥5cm) non-IBC tumours and 10 normal breast
epithelium specimens (Fig. 1a; Supplementary Information, Table S1). eIF4GI was markedly overexpressed in nearly 80% of IBC specimens, compared with weak expression in normal breast epithelium (P < 0.001). A small number of IBC specimens overexpressed eIF4E, although with no statistical significance (~20%, P = 0.174), and even fewer overex-pressed 4E-BP1 (~15%, P = 0.089), also without statistical significance. Analysis of the two additional eIF4G family members, eIF4GII and DAP5, showed that neither was overexpressed in IBC specimens or normal tissue (Supplementary Information, Table S1). Expression of eIF4GI, eIF4E and 4E-BP1 was different in stage III (T3) invasive duc-tal carcinomas, which overexpressed eIF4GI and 4E-BP1 in 69% and 87% of tumours, respectively (Supplementary Information, Table S2), as observed previously17. Logistic regression analysis demonstrated that of all translation factors examined, eIF4GI overexpression was the only significant predictor of IBC. Moreover, there was no association between eIF4GI overexpression in IBC and levels of eIF4E (P = 0.30) or 4E-BP1 (P = 0.71). E-cadherin was previously shown to be overexpressed in all of the IBC specimens examined here by more than 2-fold, with a mean of 4-fold, compared with normal breast epithelium19.
The role of overexpressed eIF4GI in IBC was examined in the SUM149 cell line20, which is well established as a model for IBC21. Compared with normal human mammary epithelial (HME) cells, SUM149 cells overex-pressed eIF4GI and E-cadherin, whereas 4E-BP1, eIF4A and eIF4E levels were equivalent (Fig. 1b). In addition, a substantial amount of eIF4GI was free and unbound to eIF4E, because IBC cells have a high proportion of their 4E-BP1 protein in the hypophosphorylated (activated) state and bound to eIF4E, compared with a mammary epithelial cell line (MCF10A) that has similar levels of eIF4GI and total 4E-BP1 (Supplementary Information, Fig. S1). To study the role of high levels of eIF4GI in IBC, we silenced it with short hairpin RNAs (shRNAs) in SUM149 cells. Silencing reduced eIF4GI protein levels by at least 90%, compared with control cells (Fig. 1c), but only slightly decreased overall protein synthesis (15%, Fig. 1d), had no effect on cell viability, and only slightly impaired cell proliferation (data not shown). This is consistent with the previously reported small reduction in protein synthesis on eIF4GI depletion18.
1Department of Microbiology and 2Department of Pathology, New York University School of Medicine, New York, New York, 10016, USA. 3George Washington University School of Public Health, Washington, District of Columbia, 20037, USA. 4Department of Environmental Medicine, Division of Biostatistics, 5Department of Radiation Oncology and 6NYU Cancer Institute, New York University School of Medicine, New York, New York, 10016, USA.Correspondence should be addressed to R.J.S. (e‑mail: [email protected])
Received 5 February 2009; accepted 12 March 2009; published online 14 June 2009; DOI: 10.1038/ncb1900
nature cell biology advance online publication 1
© 2009 Macmillan Publishers Limited. All rights reserved.

L E T T E R S
Despite the marginal requirement for elevated levels of eIF4GI in over-all protein synthesis, eIF4GI might be required for IBC tumour growth. In the nude mouse xenograft model, tumours derived from eIF4GI-silenced SUM149 cells were less than half the size of those from control cells (Fig. 1e). TUNEL assay revealed no difference in the viability of
tumour cells after eIF4GI silencing (data not shown). Silencing of eIF4GI was retained by tumours during growth in nude mice (Fig. 1f) without reduction in expression of control eIF4A (data not shown). Similar data were obtained for tumours grown in the chick chorioallantoic membrane (CAM; Supplementary Information, Fig. S2). Thus, silencing of eIF4GI impairs IBC tumour growth independently of a significant reduction in overall protein synthesis.
We investigated whether there is a link between the poor growth of eIF4GI-silenced IBC tumours and E-cadherin expression. E-cadherin protein levels were modestly reduced in cell lines and strongly reduced in SUM149 tumours with eIF4GI silencing (Fig. 2a). There was no corresponding change in E‑cadherin mRNA levels, but E-cadherin protein was destabilized (Supplementary Information, Fig. S3a, b).
a
IBC
eIF4GI 4E-BP1 eIF4E
eIF4GI
eIF4A
eIF4E
4E-BP1
HM
E
SU
M14
9b
eIF4GIdays p.i.
eIF4A
eIF4GIAd-NS7 2 4 7
c
Rel
ativ
e p
rote
insy
nthe
sis
activ
ity
0.0
0.20.40.6
0.81.0
1.2d
shRNA
*
shRNA
E-Cad
e
Tum
our
size
(mg)
In s
itutu
mou
rs
NS
eIF4
GI
shR
NA
0
10
20
30
*
eIF4
GI
f
Normalbreast
epithelium
NS
eIF4
GI
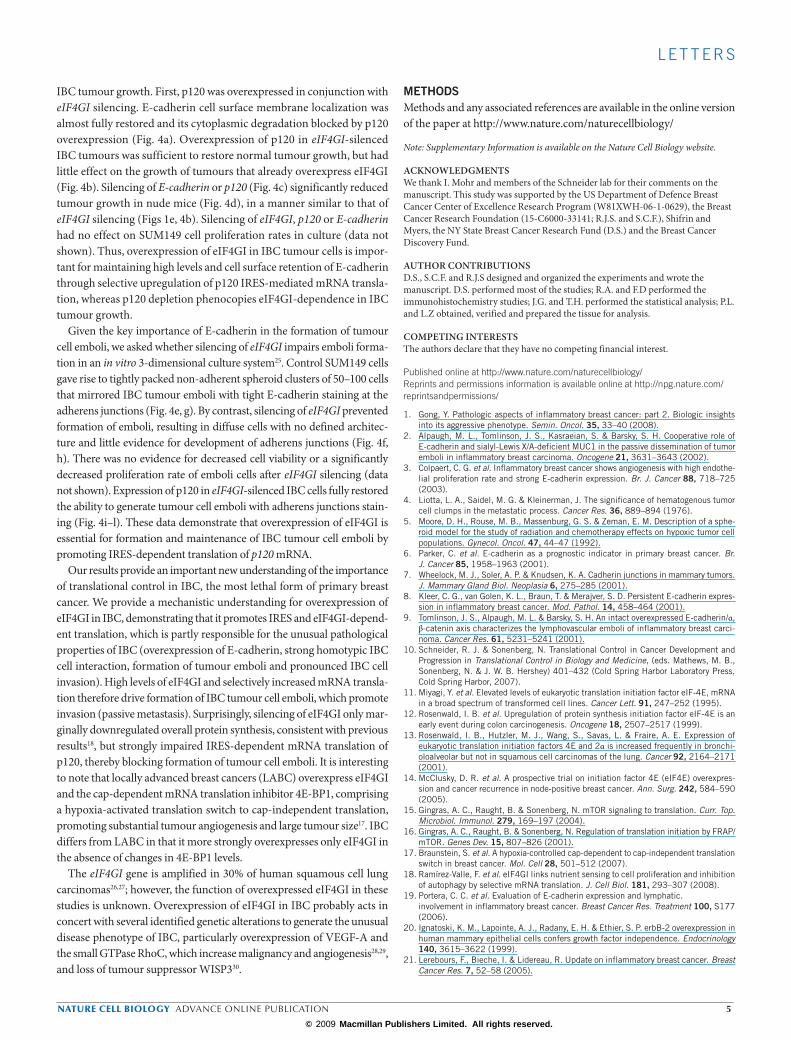
Figure 1 eIF4GI overexpression in IBC drives tumour growth. (a) Immunohistochemical staining of representative IBC tumour specimens (n = 37) and normal breast epithelium (n = 10) for eIF4GI, 4E‑BP1 and eIF4E. eIF4GI shown corresponds to +2 intensity in Supplementary Information, Table S1. Scale bar 100 μm. (b) Immunoblot analysis of indicated proteins using equal protein amounts from whole‑cell extracts of SUM149 (IBC) and normal control human mammary epithelium (HME). A representative blot is shown. (c) shRNA silencing of eIF4GI in SUM149 cells. SUM149 cells were infected three times over 7 days with non‑silencing (NS) or eIF4GI‑silencing (eIF4GI) Adenovirus (Ad) shRNA vectors. Equal amounts of protein lysates from cells 2, 4 and 7 days after final infection were probed with antibodies to eIF4GI and eIF4A (as a loading control). A representative blot of 5 independent experiments is shown. (d) Global protein synthesis in eIF4GI‑silenced cells. SUM149 cells were labelled with 35S‑methionine and protein synthesis rates determined. Standard deviation was derived from the mean of four independent experiments. *P < 0.001, paired t‑test. (e) Tumour growth in nude mice is inhibited by eIF4GI silencing in SUM149 cells. Mice were injected subcutaneously in both flanks with 3 × 10⁶ NS or eIF4GI‑silenced cells. After 7 days, tumours were photographed, excised, weighed and fixed. *P < 0.001, paired t‑test. (f) Tumours grown in mice retain reduced levels of eIF4GI protein expression. Tumours excised from nude mice were fixed in formalin and embedded in paraffin before immunostaining. Scale bar, 40 μm.
SUM149 Tumours
eIF4GI
eIF4GI
eIF4A
NS
NS
4G 4GNS shRNA
NS 4G 4GNS shRNA
E-Cad
E-C
adhe
rin
p53
eIF4A
eIF4GI
E-Cad
Solubleprotein
a
Rel
ativ
e p
rote
in
synt
hesi
s ac
tivity
0.0
0.2
0.4
0.6
0.8
1.0
1.2
bE-Cadherin
d
c
e
NS
eIF4
GI shRNA
Membrane/insolubleprotein
eIF4GINSshRNA
1 mm slices
shRNA
Figure 2 Silencing of eIF4GI in SUM149 cells is associated with internalization and destabilization of E‑cadherin. (a) E‑cadherin protein levels are reduced after silencing of eIF4GI in both SUM149 cells and tumours. Equal amounts of eIF4GI and NS SUM149 cell tumour and cell protein lysates were resolved by SDS–PAGE and proteins identified by immunoblot analysis with the indicated antibodies. (b) De novo translation of E‑cadherin is not reduced after eIF4GI silencing in SUM149 cells. E‑cadherin from 35S‑methionine metabolically labelled NS and eIF4GI‑silenced SUM149 cells was immunoprecipitated, resolved by SDS–PAGE followed by autoradiography and quantified by densitometry. Data shown are mean ± s.d. of three independent experiments. (c) Internalization of E‑cadherin in eIF4GI‑silenced cells. NS and eIF4GI‑silenced cells were immunolabeled with antibodies directed against E‑cadherin (TRITC‑conjugated antibodies, red). Shown are 1‑μm z‑stack slices through the central plane of cells. Scale bar, 10 μm. (d) Association of E‑cadherin to the membrane fraction is reduced after eIF4GI silencing in SUM149 cells. Equal amounts of soluble and insoluble lysates from NS or eIF4GI‑silenced cells were analysed by SDS–PAGE and immunoblotted with the indicated antibodies. (e) Reduction of E‑cadherin levels in eIF4GI‑silenced SUM149 tumours is associated with internalization and loss of the protein. eIF4GI‑silenced or control tumours grown in mice were immunohistochemically labelled using an antibody against E‑cadherin. Scale bar, 20 μm.
2 nature cell biology advance online publication
© 2009 Macmillan Publishers Limited. All rights reserved.

L E T T E R S
Furthermore, there was no decrease in E‑cadherin mRNA translation rates in eIF4GI-silenced cells, beyond that of the slight reduction in overall protein synthesis (Fig. 2b). eIF4GI silencing caused a marked reduction in E-cadherin associated with the cell surface, accompanied by relocalization of E-cadherin to the cytoplasm, as shown by serial opti-cal sections of control and silenced cells (Fig. 2c). This was confirmed by biochemical fractionation (Fig. 2d), as E-cadherin levels associated with the insoluble protein fraction were sharply reduced. Examination of tumours by immunohistochemistry further confirmed the reduction of E-cadherin protein levels with eIF4GI silencing in tumours, where its absence at adherens junctions was apparent (Fig. 2e).
The association of E-cadherin with the cell membrane blocks its degra-dation, and is mediated by E-cadherin interaction with p120 (refs 22, 23). Levels of p120 protein were significantly reduced in SUM149 cells and tumours after eIF4GI silencing, with loss of staining at adherens junc-tions (Fig. 3a), as well as in other mammary epithelial cell lines (Fig. 3b). p120 mRNA levels (Supplementary Information, Fig. S3a) and stability of p120 protein were not significantly affected by eIF4GI silencing (data
not shown). However, translation of the p120 mRNA in eIF4GI-silenced IBC cells was reduced by about 60% (Fig. 3c).
The p120 gene encodes alternatively spliced mRNAs that generate the four major protein isoforms24. These mRNAs contain 5´ untrans-lated regions (5´UTRs) of varying lengths, from 263 to 590 nucleotides. The major isoforms of p120 5´UTRs expressed in SUM149 cells were not altered as a result of eIF4GI silencing (Supplementary Information, Fig. S4a). We therefore tested whether the p120 5´UTRs contain IRES elements that might require high levels of eIF4GI for efficient translation. The 5´UTRs of the five major forms of p120 mRNAs in IBC cells were cloned and inserted into bicistronic mRNA expression vectors17. All p120 5´UTRs enabled translation of the second cistron (Fig. 3d) and main-tained full-length intact mRNAs (Supplementary Information, Fig. S4b), indicating IRES activity. The p120 5´UTRs showed a remarkably strong concentration-dependence of eIF4GI for translation (Fig. 3e). Thus, the p120 5´UTRs contain a strongly active, highly eIF4GI-dependent IRES element that drives efficient p120 mRNA translation in IBC cells. Other IRES-containing mRNAs, such as pro-angiogenic, survival vascular
NS 4GSUM149 cells
SU
M14
9 tu
mor
sp120
Em
pty 1.2
2.3
3.2
3.3
3.4
p12
0 5'
UTR
IRE
S a
ctiv
ity
0
5
10
15
20
25
30
35
10.40
26.09
3.90 3.225.14
a
d e
Rel
ativ
e p
120
synt
hesi
s
0.0
0.2
0.4
0.6
0.8
1.0
1.2
*
c
*
p120
NS
eIF4
GI
NS eIF4GI NS+p120
eIF4GI+p120
p120 E-cad
shRNA
eIF4GINS
eIF4GINS
shRNA
p120 isoforms
1.22.33.23.33.4
p1205'UTRsplicedforms
0.0
0.2
0.4
0.6
0.8
1.0
3.3 5'UTR mRNA
IRE
S-d
epen
den
t tr
ansl
atio
naf
ter
eIF4
GI s
ilenc
ing
β-tubulin
eIF4GI
shRNA
p120
NS 4G NS 4GSUM149 MCF10A
NS 4GHTB20
b
shRNA
f
0.0
0.2
0.4
0.6
0.8
1.0
1.2
1.4
Cell invasion through Matrigel
Rel
ativ
e nu
mb
erof
mig
ratin
g ce
lls
shRNAcDNA
Figure 3 Internalization and destabilization of E‑cadherin after eIF4GI silencing results from specific reduction in the translation of p120 mRNA. (a) p120 protein levels are reduced after silencing of eIF4GI in SUM149 cells and tumours. Equal amounts of eIF4GI and NS whole cell lysates were examined by SDS–PAGE and immunoblotting with the p120 antibody (top panel). Tumours were stained with p120 antibody by immunohistochemistry (bottom panel). Representative fields are shown. Scale bar, 20 μm. (b) Levels of p120 protein are reduced in eIF4GI‑silenced mammary cell lines. Immunoblot analysis of equal amounts of protein from SUM149, MCF10A (immortalized human mammary epithelial cells) and HTB20 (human highly transformed mammary carcinoma) cell lines after eIF4GI silencing. (c) Translation rates of p120 are reduced after eIF4GI silencing in SUM149 cells. Newly synthesized p120 protein was immunoprecipitated from equal amounts of extracts from NS and eIF4GI‑silenced SUM149 cells metabolically labelled for 2 h with 35S‑methionine, resolved by SDS–PAGE and autoradiographed. Levels of newly synthesized p120 protein were quantified by densitometry. Data shown are mean ± s.d
of three independent experiments. *P < 0.01, paired t‑test. (d) p120 5´UTRs (insert) direct internal initiation of translation. SUM149 cells were transfected with bicistronic reporters containing a cap‑dependent Renilla luciferase followed by a firefly luciferase driven by the indicated p120 5´UTRs24. Results are shown as p120 5´UTR‑dependent firefly translation divided by Renilla translation, normalized to the empty vector, and are the mean ± s.d. of five independent experiments. *P < 0.05; paired t‑test. (e) Strong concentration‑dependence of eIF4GI for p120 IRES‑mediated translation. NS and eIF4GI‑silenced cells expressing the 3.3 5´UTR p120 bicistronic mRNA reporter described above. *P < 0.01, paired t‑test. Results are firefly luciferase activity divided by the Renilla luciferase activity normalized to the same values for the NS control. (f) Overexpression of eIF4GI promotes IBC cell invasion through increased p120 mRNA translation. Migration of indicated cells through Matrigel was quantified by counting ten separate fields per filter. Results are normalized to the number of control, non‑silenced SUM149 cells and are the mean ± s.d. of three independent experiments.
nature cell biology advance online publication 3
© 2009 Macmillan Publishers Limited. All rights reserved.

L E T T E R S
endothelial growth factor (VEGF-A) also showed eIF4GI dependence for translation in IBC cells without alteration of mRNA levels (Supplementary Information, Fig. S5a, b). Indeed, eIF4GI silencing resulted in a 2.5-fold reduction in VEGF-A-mediated neo-vascularization over a period of only three days when tested in the chick CAM assay (Supplementary Information, Fig. S5c).
A hallmark of IBC tumour cells is efficient invasion, which promotes the lymphodermal infiltration of tumour cell emboli. Wild-type IBC SUM149 cells showed strong invasion through a semi-permeable mem-brane in Matrigel (Fig. 3f). Invasion was diminished 2-fold by eIF4GI
silencing, 3-fold by p120 silencing and less so by E‑cadherin silencing because of an inability to reduce its expression as fully. Overexpression of p120 in wild-type cells had no effect, but in eIF4GI-silenced cells invasiveness was fully restored to the levels of control, non-silenced cells (Fig. 3f). Thus, promotion of IRES-dependent p120 mRNA translation by eIF4GI overexpression promotes IBC cell invasion. To investigate whether reduced IBC tumour growth results in large part from reduced E-cadherin protein levels resulting from the decrease in p120 mRNA translation in eIF4GI-silenced SUM149 cells, we performed a series of overexpression and silencing experiments and assessed their effects on
p120
1.00 0.67 1.30 0.98 1.00 0.50 0.80 0.85
E-Cadherin
NS 4G NS 4GControl p120
NS 4G NS 4GControl p120
Membrane/insoluble
p120
eIF4A
E-Cadherin
eIF4G
SUM149 cellsN
S
4G E-C
ad
p12
0
0.0
0.2
0.4
0.6
0.8
1.0
1.2
NS 4G 4G+p120
Rel
ativ
e tu
mor
siz
e
a
c
b*
d
Soluble protein
shRNA
shRNA
e fNon-silenced eIF4GI-silenced
g heIF4GI-silenced
TO-P
RO
-3 +
eIF
4GI
+ E
-cad
herin
sta
ined
TO-PRO-3 E-cadherin (TRITC) eIF4GI (FITC)3 mm sections
p53
E-cadherin levels
TO-P
RO
-3 s
tain
ed
ieIF4GI-silenced
j k leIF4GI-silenced + p120 Non-silenced + p120Non-silenced
Non-silenced
TO-PRO-3 p120 (TRITC)
0.0
0.2
0.4
0.6
0.8
1.0
1.2
NS E-cad p120
Rel
ativ
e tu
mor
siz
e
shRNA
*
NS+p120
shRNAcDNA
Figure 4 Role of eIF4GI overexpression in tumour growth and tumour cell emboli formation. (a) Overexpression of p120 stabilizes E‑cadherin expression and localization to the cell surface in eIF4GI‑silenced cells. NS and eIF4GI cells were co‑infected with p120 or GFP adenoviruses, insoluble and soluble fractions were detected with indicated antibodies. E‑cadherin levels were quantified by densitometry analysis and normalized to levels of the NS control for each fraction. Numbers indicate the relative levels of E‑cadherin in each lane. Typical results of three independent experiments are shown. (b) Overexpression of p120 in eIF4GI‑silenced SUM149 cells increases tumour growth in nude mice. SUM149 cells subjected to NS or eIF4GI silencing were co‑infected with an adenovirus vector expressing either p120 or GFP, followed by implantation into opposite flanks of nude mice. Tumours were grown for 7 days, excised and weighed. Results are the mean ± s.d. of three independent experiments, normalized to the growth of non‑silenced tumours in the absence of p120 overexpression. *P < 0.01, paired t‑test. (c) Immunoblot of whole‑cell lysates from cells infected with the
indicated adenovirus vectors and detected with the indicated antibodies. (d) Silencing of p120 or E‑cadherin in SUM149 cells decreases tumour growth. SUM149 cells silenced with the indicated shRNAs were implanted into opposite flanks of nude mice. Tumours were excised 7 days after implantation and weighed. Results are the mean ± s.d. of three independent experiments and are normalized to the NS control. (e–l) Emboli formation requires increased p120 mRNA translation promoted by eIF4GI overexpression. (e–h) SUM149 cells silenced with Ad NS or eIF4GI shRNAs were grown on Matrigel, fixed, and immunostained with indicated antibodies (eIF4GI, FITC; E‑cadherin, TRITC). Nuclei were stained with TO‑PRO‑3 (blue). Resulting structures were examined by confocal microscopy. A series of 3‑μm z‑stack images representative of typical results are shown. SUM149 cells expressing NS or eIF4GI shRNAs stained with TO‑PRO‑3 (e, f), or with TO‑PRO‑3, eIF4GI (FITC) and E‑cadherin (TRITC) (g, h); for (i–l), control and eIF4GI‑silenced cells were infected with a p120 expression adenovirus vector (i, k) or a vector expressing GFP (j, l), and stained as indicated. Scale bars, 40 μm.
4 nature cell biology advance online publication
© 2009 Macmillan Publishers Limited. All rights reserved.
L E T T E R S
IBC tumour growth. First, p120 was overexpressed in conjunction with eIF4GI silencing. E-cadherin cell surface membrane localization was almost fully restored and its cytoplasmic degradation blocked by p120 overexpression (Fig. 4a). Overexpression of p120 in eIF4GI-silenced IBC tumours was sufficient to restore normal tumour growth, but had little effect on the growth of tumours that already overexpress eIF4GI (Fig. 4b). Silencing of E‑cadherin or p120 (Fig. 4c) significantly reduced tumour growth in nude mice (Fig. 4d), in a manner similar to that of eIF4GI silencing (Figs 1e, 4b). Silencing of eIF4GI, p120 or E‑cadherin had no effect on SUM149 cell proliferation rates in culture (data not shown). Thus, overexpression of eIF4GI in IBC tumour cells is impor-tant for maintaining high levels and cell surface retention of E-cadherin through selective upregulation of p120 IRES-mediated mRNA transla-tion, whereas p120 depletion phenocopies eIF4GI-dependence in IBC tumour growth.
Given the key importance of E-cadherin in the formation of tumour cell emboli, we asked whether silencing of eIF4GI impairs emboli forma-tion in an in vitro 3-dimensional culture system25. Control SUM149 cells gave rise to tightly packed non-adherent spheroid clusters of 50–100 cells that mirrored IBC tumour emboli with tight E-cadherin staining at the adherens junctions (Fig. 4e, g). By contrast, silencing of eIF4GI prevented formation of emboli, resulting in diffuse cells with no defined architec-ture and little evidence for development of adherens junctions (Fig. 4f, h). There was no evidence for decreased cell viability or a significantly decreased proliferation rate of emboli cells after eIF4GI silencing (data not shown). Expression of p120 in eIF4GI-silenced IBC cells fully restored the ability to generate tumour cell emboli with adherens junctions stain-ing (Fig. 4i–l). These data demonstrate that overexpression of eIF4GI is essential for formation and maintenance of IBC tumour cell emboli by promoting IRES-dependent translation of p120 mRNA.
Our results provide an important new understanding of the importance of translational control in IBC, the most lethal form of primary breast cancer. We provide a mechanistic understanding for overexpression of eIF4GI in IBC, demonstrating that it promotes IRES and eIF4GI-depend-ent translation, which is partly responsible for the unusual pathological properties of IBC (overexpression of E-cadherin, strong homotypic IBC cell interaction, formation of tumour emboli and pronounced IBC cell invasion). High levels of eIF4GI and selectively increased mRNA transla-tion therefore drive formation of IBC tumour cell emboli, which promote invasion (passive metastasis). Surprisingly, silencing of eIF4GI only mar-ginally downregulated overall protein synthesis, consistent with previous results18, but strongly impaired IRES-dependent mRNA translation of p120, thereby blocking formation of tumour cell emboli. It is interesting to note that locally advanced breast cancers (LABC) overexpress eIF4GI and the cap-dependent mRNA translation inhibitor 4E-BP1, comprising a hypoxia-activated translation switch to cap-independent translation, promoting substantial tumour angiogenesis and large tumour size17. IBC differs from LABC in that it more strongly overexpresses only eIF4GI in the absence of changes in 4E-BP1 levels.
The eIF4GI gene is amplified in 30% of human squamous cell lung carcinomas26,27; however, the function of overexpressed eIF4GI in these studies is unknown. Overexpression of eIF4GI in IBC probably acts in concert with several identified genetic alterations to generate the unusual disease phenotype of IBC, particularly overexpression of VEGF-A and the small GTPase RhoC, which increase malignancy and angiogenesis28,29, and loss of tumour suppressor WISP330.
METHODSMethods and any associated references are available in the online version of the paper at http://www.nature.com/naturecellbiology/
Note: Supplementary Information is available on the Nature Cell Biology website.
ACKNOWLEDGMENTSWe thank I. Mohr and members of the Schneider lab for their comments on the manuscript. This study was supported by the US Department of Defence Breast Cancer Center of Excellence Research Program (W81XWH-06-1-0629), the Breast Cancer Research Foundation (15-C6000-33141; R.J.S. and S.C.F.), Shifrin and Myers, the NY State Breast Cancer Research Fund (D.S.) and the Breast Cancer Discovery Fund.
AUTHOR CONTRIBUTIONSD.S., S.C.F. and R.J.S designed and organized the experiments and wrote the manuscript. D.S. performed most of the studies; R.A. and F.D performed the immunohistochemistry studies; J.G. and T.H. performed the statistical analysis; P.L. and L.Z obtained, verified and prepared the tissue for analysis.
COMPETING INTERESTSThe authors declare that they have no competing financial interest.
Published online at http://www.nature.com/naturecellbiology/ Reprints and permissions information is available online at http://npg.nature.com/reprintsandpermissions/
1. Gong, Y. Pathologic aspects of inflammatory breast cancer: part 2. Biologic insights into its aggressive phenotype. Semin. Oncol. 35, 33–40 (2008).
2. Alpaugh, M. L., Tomlinson, J. S., Kasraeian, S. & Barsky, S. H. Cooperative role of E‑cadherin and sialyl‑Lewis X/A‑deficient MUC1 in the passive dissemination of tumor emboli in inflammatory breast carcinoma. Oncogene 21, 3631–3643 (2002).
3. Colpaert, C. G. et al. Inflammatory breast cancer shows angiogenesis with high endothe‑lial proliferation rate and strong E‑cadherin expression. Br. J. Cancer 88, 718–725 (2003).
4. Liotta, L. A., Saidel, M. G. & Kleinerman, J. The significance of hematogenous tumor cell clumps in the metastatic process. Cancer Res. 36, 889–894 (1976).
5. Moore, D. H., Rouse, M. B., Massenburg, G. S. & Zeman, E. M. Description of a sphe‑roid model for the study of radiation and chemotherapy effects on hypoxic tumor cell populations. Gynecol. Oncol. 47, 44–47 (1992).
6. Parker, C. et al. E‑cadherin as a prognostic indicator in primary breast cancer. Br. J. Cancer 85, 1958–1963 (2001).
7. Wheelock, M. J., Soler, A. P. & Knudsen, K. A. Cadherin junctions in mammary tumors. J. Mammary Gland Biol. Neoplasia 6, 275–285 (2001).
8. Kleer, C. G., van Golen, K. L., Braun, T. & Merajver, S. D. Persistent E‑cadherin expres‑sion in inflammatory breast cancer. Mod. Pathol. 14, 458–464 (2001).
9. Tomlinson, J. S., Alpaugh, M. L. & Barsky, S. H. An intact overexpressed E‑cadherin/α, β‑catenin axis characterizes the lymphovascular emboli of inflammatory breast carci‑noma. Cancer Res. 61, 5231–5241 (2001).
10. Schneider, R. J. & Sonenberg, N. Translational Control in Cancer Development and Progression in Translational Control in Biology and Medicine, (eds. Mathews, M. B., Sonenberg, N. & J. W. B. Hershey) 401–432 (Cold Spring Harbor Laboratory Press, Cold Spring Harbor, 2007).
11. Miyagi, Y. et al. Elevated levels of eukaryotic translation initiation factor eIF‑4E, mRNA in a broad spectrum of transformed cell lines. Cancer Lett. 91, 247–252 (1995).
12. Rosenwald, I. B. et al. Upregulation of protein synthesis initiation factor eIF‑4E is an early event during colon carcinogenesis. Oncogene 18, 2507–2517 (1999).
13. Rosenwald, I. B., Hutzler, M. J., Wang, S., Savas, L. & Fraire, A. E. Expression of eukaryotic translation initiation factors 4E and 2α is increased frequently in bronchi‑oloalveolar but not in squamous cell carcinomas of the lung. Cancer 92, 2164–2171 (2001).
14. McClusky, D. R. et al. A prospective trial on initiation factor 4E (eIF4E) overexpres‑sion and cancer recurrence in node‑positive breast cancer. Ann. Surg. 242, 584–590 (2005).
15. Gingras, A. C., Raught, B. & Sonenberg, N. mTOR signaling to translation. Curr. Top. Microbiol. Immunol. 279, 169–197 (2004).
16. Gingras, A. C., Raught, B. & Sonenberg, N. Regulation of translation initiation by FRAP/mTOR. Genes Dev. 15, 807–826 (2001).
17. Braunstein, S. et al. A hypoxia‑controlled cap‑dependent to cap‑independent translation switch in breast cancer. Mol. Cell 28, 501–512 (2007).
18. Ramírez‑Valle, F. et al. eIF4GI links nutrient sensing to cell proliferation and inhibition of autophagy by selective mRNA translation. J. Cell Biol. 181, 293–307 (2008).
19. Portera, C. C. et al. Evaluation of E‑cadherin expression and lymphatic. involvement in inflammatory breast cancer. Breast Cancer Res. Treatment 100, S177
(2006).20. Ignatoski, K. M., Lapointe, A. J., Radany, E. H. & Ethier, S. P. erbB‑2 overexpression in
human mammary epithelial cells confers growth factor independence. Endocrinology 140, 3615–3622 (1999).
21. Lerebours, F., Bieche, I. & Lidereau, R. Update on inflammatory breast cancer. Breast Cancer Res. 7, 52–58 (2005).
nature cell biology advance online publication 5
© 2009 Macmillan Publishers Limited. All rights reserved.

L E T T E R S
22. Bryant, D. M. & Stow, J. L. The ins and outs of E‑cadherin trafficking. Trends Cell Biol. 14, 427–434 (2004).
23. Xiao, K., Oas, R. G., Chiasson, C. M. & Kowalczyk, A. P. Role of p120‑catenin in cadherin trafficking. Biochim. Biophys. Acta 1773, 8–16 (2007).
24. Keirsebilck, A. et al. Molecular cloning of the human p120ctn catenin gene (CTNND1): expression of multiple alternatively spliced isoforms. Genomics 50, 129–146 (1998).
25. Lee, G. Y., Kenny, P. A., Lee, E. H. & Bissell, M. J. Three‑dimensional culture mod‑els of normal and malignant breast epithelial cells. Nature Methods 4, 359–365 (2007).
26. Bauer, C. et al. Overexpression of the eukaryotic translation initiation factor 4G (eIF4G‑1) in squamous cell lung carcinoma. Int. J. Cancer 98, 181–185 (2002).
27. Comtesse, N. et al. Frequent overexpression of the genes FXR1, CLAPM1 and EIF4G located on amplicon 3q26–27 in squamous cell carcinoma of the lung. Int. J. Cancer 120, 2538–2544 (2007).
28. van Golen, K. L., Wu, Z. F., Qiao, X. T., Bao, L. & Merajver, S. D. RhoC GTPase over‑expression modulates induction of angiogenic factors in breast cells. Neoplasia 2, 418–425 (2000).
29. van Golen, K. L., Wu, Z. F., Qiao, X. T., Bao, L. W. & Merajver, S. D. RhoC GTPase, a novel transforming oncogene for human mammary epithelial cells that partially recapitulates the inflammatory breast cancer phenotype. Cancer Res. 60, 5832–5838 (2000).
30. van Golen, K. L. et al. A novel putative low‑affinity insulin‑like growth factor‑binding protein, LIBC (lost in inflammatory breast cancer), and RhoC GTPase correlate with the inflammatory breast cancer phenotype. Clin. Cancer Res. 5, 2511–2519 (1999).
6 nature cell biology advance online publication
© 2009 Macmillan Publishers Limited. All rights reserved.

DOI: 10.1038/ncb1900 M E T H O D S
METHODSCells. MCF10A cells were obtained from the American Type Culture Collection and grown in the recommended medium. 293 cells were maintained in DMEM medium supplemented with 10% FBS and 25 μg ml–1 gentamicin. SUM149 and HME cell lines were provided by Stephen Ethier (Karmanos Cancer Institute, Wayne State University, MI, USA) and grown in Ham’s F12 medium supplemented with 5% FBS, 1 mg ml–1 hydrocortisone, 5 μg ml–1 gentamycin and 5 μg ml–1 insu-lin. For SUM149 and HME cells, medium also contained 10 μg ml–1 EGF and for HME cells only, 100 μg ml–1 cholera toxin.
Immunofluorescence studies. Cells grown in multi-well teflon-coated glass slides (Polysciences) were washed twice with PBS, then fixed with 4% paraformaldehyde in PBS. Cells were permeabilized by incubation in 0.25% Triton-X in PBS, blocked in 3% BSA and incubated with the indicated primary antibodies overnight at 4°C, washed 3 times in PBS and incubated for 1 h with FITC or Texas Red-conjugated secondary antibodies (Jackson ImmunoResearch). Cells were mounted using Vectashield mounting medium with DAPI (Vector Laboratories). Image acquisi-tion was performed by confocal microscopy using a Zeiss Axiophot microscope.
Tumour growth in nude mice. For mouse xenograft experiments, 3 × 10⁶ cells were injected subcutaneously into the flanks of female NCR nude mice (Taconic) aged 4–6 weeks. Tumours were allowed to grow for one week before being excised and weighed before either protein extraction by homogenization or fixation over-night in 4% formaldehyde and paraffin embedding.
Immunohistochemistry. All kits and developing substrates were obtained from Vector Laboratories. Paraffin-embedded patient samples were deparaffinized, rehydrated and subjected to antigen retrieval using ARS solution. Sections were incubated in 5% hydrogen peroxide for 30 min before staining using the Universal Vectastain-ABC horseradish peroxidase kit and incubated with the indicated anti-bodies. Slides were developed with the DAB substrate kit. Sections from mouse tumours were deparaffinized, rehydrated and subjected to antigen retrieval using ARS solution, followed by immunostaining using the Vectastain ABC-AP kit. Stain was developed using the Vector Blue substrate kit. Sections were mounted using VectaMount permanent mounting medium.
Transfections and luciferase assays. Cells were transfected using Lipofectin in combination with PLUS reagent (Invitrogen). For bicistronic constructs, cells were collected two days after transfection and extracted in passive lysis buffer fol-lowed by dual luciferase assays (Promega) using a 96-well plate luminometer.
Emboli formation in Matrigel cultures and confocal microscopy analysis. SUM149 cells that had been silenced for the indicated proteins using shRNA adeno-virus vectors were overlaid onto 8-well chamber slides coated in 100 μl Matrigel (BD Biosciences), as described previously25. Medium containing 4% Matrigel was added to the cells and changed every two days. After 12 days, the resulting emboli were fixed in 2% paraformaldehyde, permeabilized in 0.5% Triton PBS buffer, stained with the indicated primary antibodies and fluorescence-labelled secondary antibodies. Nuclei were stained with TO-PRO-3 (Stratagene). Confocal immunofluorescence microscopy and image acquisition were carried out at room temperature using a Zeiss LSM 510 meta confocal scanning laser microscope. Images were acquired using Lasersharp 2000 software (Carl Zeiss) and converted into TIF files, pseudo-coloured and merged for image processing with Photoshop 7 software.
Cell invasion assays. Invasion assays were performed using the Biocoat Matrigel invasion chambers (BD Biosciences). 1 × 10⁵ SUM149 cells that had been silenced for the indicated proteins using shRNA adenovirus vectors were plated onto each chamber in serum-free growth medium. Chambers were placed in wells contain-ing growth medium with 10% FBS to act as a chemoattractant. After incubation for 24 h, migrating cells were fixed with methanol and stained with crystal violet. Ten fields per chamber were counted using a ×40 objective lens in a light micro-scope. Results are the mean of three independent experiments.
Statistical analyses. For analysis of experimental data, comparison of categorical data was carried out by Student’s t-test. Data are presented as the mean ± s.d. All P-values are two-sided. A P-value <0.05 was considered statistically significant in all experiments. The distributions of eIF4G, 4E-BP1 and eIF4E levels in IBC specimens were compared to control specimens using cross-tabulation methods.
Fisher’s exact tests (2-sided) were used to assess the differences between and among groups. Logistic regression models were proposed to examine the multivariable nature of the differences between the cases and controls; these models did not con-verge because of the low variability in biomarker levels in the controls. To address this issue, we developed a regression tree in ‘R’ using the rpart function.
Antibodies. Antibodies to eIF4E, 4E-BP1 and p53 were purchased from Cell Signaling Technologies. E-cadherin and p120 antibodies were obtained from BD Transduction Laboratories. Antibody to eIF4A was provided by William Merrick (Case Western Reserve University, Cleveland, OH). Polyclonal eIF4GI antibod-ies were generated by immunization of rabbits against the C-terminal portion of eIF4GI, as described previously31. Horseradish peroxidase-conjugated donkey anti-rabbit or sheep anti-mouse secondary antibodies were from Amersham. All primary antibodies were used at a 1:1,000 dilution; secondary antibodies were used at a 1:10,000 dilution.
Tumour growth in the chick CAM. To perform the CAM assays, 2.5 × 10⁶ cells were collected by trypsinization and resuspended in 40 μl of RPMI medium before implanting into 10-day old chick embryos. Eggs were incubated in a humidified chamber at 37 °C for 6 days after implantation, collected and photographed before dissection from CAM membranes, weighed and fixed in zinc fixation buffer for 48 h followed by embedding in paraffin.
Branch formation assay. Branch formation assays in the chick CAM were per-formed as described previously32. Briefly, filter discs soaked in 48-h conditioned medium from SUM149 cells that had been silenced for the indicated proteins using shRNA adenovirus vectors were placed on 10-day old chick CAMs. Three days later discs were excised, photographed and new branch formation was quan-tified by counting ten different fields per disc.
Immunoblot and protein extracts. Cells were washed twice in cold PBS and resus-pended in NP-40 lysis buffer (50 mM Hepes, pH 7.0, 150 mM NaCl, 2 mM EDTA, 0.5% NP-40, 25 mM β-glycerophosphate, 2 mM sodium vanadate and complete protease inhibitor cocktail (Roche)), incubated for 10 min on ice and centrifuged. Protein concentrations were determined using the Biorad protein assay. For Triton-soluble and insoluble extract preparation, cells were resuspended in Triton buffer (0.5% Triton X-100, 300 mM sucrose, 10 mM PIPES, pH 6.8, 50 mM NaCl, and 3 mM MgCl2) and incubated for 30 min at 4 °C in a rotator. Soluble and insoluble fractions were separated by centrifugation. Insoluble protein/membrane pellets were resuspended in RIPA buffer (150 mM NaCl, 50 mM Tris-HCl, pH 8.0, 1% NP-40, 0.5% sodium deoxycholate, 0.1% SDS, 1 mM EDTA, 25 mM β-glycerophosphate, 2 mM sodium vanadate and complete protease inhibitor cocktail (Roche)). Protein concentrations were determined by Biorad DC protein assay. Tumours were extracted by homogenization in RIPA buffer using a Tekmar tissumizer and centrifuged at 13,000g for 10 min at 4 °C to remove insoluble material. Protein concentration was determined using the Biorad DC protein assay. To determine the total levels of specific proteins, equal amounts of protein from lysates were resolved by sodium dodecyl sulfate–polyacrylamide gel electrophoresis (SDS–PAGE) and analysed by protein immunoblotting with specific antibodies.
Adenovirus vectors. shRNA adenovirus vectors were constructed using the pShut-tle-KO vector, generated by ligation of a knockdown cassette from pLKO.1puro33 into pShuttle using XhoI to generate the DNA fragments. Synthetic double-stranded DNA oligonucleotides (IDT DNA) were phosphorylated using T4 PNK kinase and ligated to linearized pShuttle-KO vector digested with MluI and AgeI. Positive clones were then recombined with the pAdEasy plasmid and purified according to manufacturer instructions (Stratagene). To generate viruses, 10 μg pAd-KO plasmids were linearized with PacI and transfected into 293 cells. Cells were col-lected approximately 10 days later (after cytopathic effect was observed). Pellets were sonicated to release virus and used for stock production by re-infection of 293 cells, followed by CsCl gradient purification. Adenoviruses expressing p120 and the control virus were provided by Andrew Kowalczyk34 (Emory University, Atlanta, GA). For silencing studies, SUM149 cells were infected three times 3 days apart at a multiplicity of infection (MOI) of 100. For combination silencing/overexpression studies, the cells were infected twice with the p120 or E-cadherin viruses (on days 5 and 6) after the initial infection with the Ad-KO viruses. The sequences of cloning and shRNA oligonucleotides are listed in the Supplementary Information.
nature cell biology advance online publication 7
© 2009 Macmillan Publishers Limited. All rights reserved.

M E T H O D S DOI: 10.1038/ncb1900
Protein synthesis analysis. Cells were incubated with 20 μCi of 35S-methionine per ml (Easytag Express protein labelling mix; Dupont/NEN) in methionine-free DMEM for 1 h, washed twice with ice-cold phosphate-buffered saline (PBS) and lysed by incubation in 0.5% NP-40 lysis buffer (0.5% NP-40, 50 mM HEPES, pH 7.0, 250 mM NaCl, 2 mM EDTA, 2 mM sodium orthovanadate, 25 mM glycerophosphate and complete protease inhibitor (Roche)) for 10 min at 4°C. Lysates were clarified by centrifugation at 13,000g for 10 min. Specific activity of methionine incorporation was determined by trichloroacetic acid precipitation onto GF/C filters and liquid scintillation counting. All assays were conducted in duplicate and repeated at least three times.
Real-time quantitative RT–PCR analysis of endogenous mRNAs. Total RNA was extracted from cells with Trizol reagent, according to the manufacturer’s instructions (Gibco). Equal amounts of total RNA from each sample (25 ng) were then reversed-transcribed and amplified using the SYBR green quantita-tive RT–PCR kit from Sigma using the indicated oligonucleotides.
35S-methionine incorporation into newly synthesized proteins. Cells were labelled for 2 h with 50 μCi of 35S-methionine per ml (Easytag Express protein labelling mix; Dupont/NEN) in methionine-free DMEM, washed with cold PBS and lysed in RIPA buffer. Immunoprecipitations were carried out by incubation
overnight in a rotator at 4 °C with the indicated antibodies in buffer PLB (PBS, 0.1% SDS, 0.1% Triton X-100, 0.05% sodium azide, 1% sodium deoxycholate). Protein A-agarose beads (Santa Cruz Biotechnology) were added and the mixture further incubated for 1 h at 4°C. Beads were washed twice with buffer H-PLB (BDB containing 500 mM NaCl) and three times with PLB, resuspended in SDS–loading buffer and resolved by SDS–PAGE. Gels were fixed in 25% isopro-panol/10% acetic acid followed by incubation in amplify reagent (GE Healthcare) and drying under vacuum. Dried gels were exposed to film and bands were quan-tified by densitometry using the GS800 scanner and software. For determination of E-cadherin half-life after eIF4GI silencing, cells were labelled as above but for a 4-h period, washed twice with cold medium, collected at the indicated time-points and immunoprecipitated as described above.
31. Cuesta, R., Laroia, G. & Schneider, R. J. Chaperone hsp27 inhibits translation during heat shock by binding eIF4G and facilitating dissociation of cap‑initiation complexes. Genes Dev. 14, 1460–1470 (2000).
32. Brooks, P. C., Montgomery, A. M. & Cheresh, D. A. Use of the 10‑day‑old chick embryo model for studying angiogenesis. Methods Mol. Biol. 129, 257–269 (1999).
33. Stewart, S. A. et al. Lentivirus‑delivered stable gene silencing by RNAi in primary cells. RNA 9, 493–501 (2003).
34. Xiao, K. et al. p120‑Catenin regulates clathrin‑dependent endocytosis of VE‑cadherin. Mol. Biol. Cell. 16, 5141–5151 (2005).
PCR and RT–PCR analysis of endogenous and introduced p120 constructs
Primer Application Sequence (5´ to 3´)
KO-4GF Cloning CGCGTAAAAAGTAGTGTGATGTGTCTGAACTCTCGAGAGTTCAGACACATCACACTAC
KO-4GR Cloning CCGGGTAGTGTGATGTGTCTGAACTCTCGAGAGTTCAGACACATCACactacttttta
KO-NSR Cloning CGCGTAAAAAAATTCTCCGAACGTGTCACGTCTCGAGACGTGACACGTTCGGAGAATT
KO-ECDF Cloning ccggGGAGAGCGGTGGTCAAAGAGCctcgagGCTCTTTGACCACCGCTCTCCttttta
KO-ECDR Cloning cgcgtaaaaaGGAGAGCGGTGGTCAAAGAGCctcgagGCTCTTTGACCACCGCTCTCC
KO-p120F Cloning ccggGCCAGAGGTGGTTCGGATATActcgagTATATCCGAACCACCTCTGGCttttta
KO-p120R Cloning cgcgtaaaaaGCCAGAGGTGGTTCGGATATActcgagTATATCCGAACCACCTCTGGC
p120-5’F Cloning, RT–PCR TGAATTACTAGTCTCCAGATCAGTTTGTCACC
p120-iso1R Cloning TGAATTGAATTCGAAGGTAAGGGGCGGAGCCGC
p120-iso2R Cloning TGAATTGAATTCGAGTGGGTTGGCATCTTGTGG
p120-iso2R Cloning TGAATTGAATTCCCTGGGGATGGTGCTATATAG
p120-iso2R Cloning TGAATTGAATTCTGTCTTCATAGCTCCTCAAAT
ECDHF4 qRT-PCR CGACCCAACCCAAGAATCTA
ECDHR4 qRT-PCR AGGCTGTGCCTTCCTACAGA
p120F qRT-PCR TCCAGCAAACGATACAGTGG
p120R qRT-PCR GAACCACCTCTGGCTGAAAT
FireflyR RT-PCR AGGAACCAGGGCGTATCTCTTCAT
EX1F5 RT-PCR TGCCCTGCTGGATTTGTCTT
EX5R5 RT-PCR CGAGTGGTCCCATCATCTG
8 nature cell biology advance online publication
© 2009 Macmillan Publishers Limited. All rights reserved.

s u p p l e m e n ta ry i n f o r m at i o n
www.nature.com/naturecellbiology 1
DOI: 10.1038/ncb1900
Figure S1 A substantial amount of eIF4GI remains unbound to eIF4E in SUM149 cells. 500 mg of lysates from SUM149 or MCF10A cells were bound to 7-Methyl-G coupled Sepharose beads (cap p.d. panels) and
examined by immunoblot analysis with the indicated antibodies. Panels on the right show the initial levels of the indicated proteins in equal amounts of lysates.
eIF4GI
eIF4A
eIF4E
4E-BP1
Input Cap p.d.
MC
F10A
SU
M149
MC
F10A
SU
M149
Supplementary Figure S1 Silvera et al.
© 2009 Macmillan Publishers Limited. All rights reserved.

s u p p l e m e n ta ry i n f o r m at i o n
2 www.nature.com/naturecellbiology
Figure S2 Tumor growth in the chick chorioallantoic membrane (CAM) is reduced by eIF4GI silencing. NS or eIF4GI-silenced SUM149 cells (2.5x10⁶ cells) were implanted on the CAM of 10 d old chick embryos.
Tumors were excised 6 d post-implantation, photographed and weighed. Results are the average of four independent experiments. * P<0.001; paired t-test.
Supplementary Figure S2 Silvera et al.
a
0
10
20
30
40
50
Tum
or
Siz
e (
mg)
In situ tumors
*
NS eIF4GI shRNA
eIF4GINS
CA
M
bshRNA
0.0
0.5
1.0
1.5
2.0
control p120
Rela
tive t
um
or
siz
e
NSeIF4GI
0.0
0.2
0.4
0.6
0.8
1.0
1.2
NS 4G p120 E-cad
Rela
tive t
um
or
siz
e
c
*
dshRNA
shRNA
*
© 2009 Macmillan Publishers Limited. All rights reserved.
s u p p l e m e n ta ry i n f o r m at i o n
www.nature.com/naturecellbiology 3
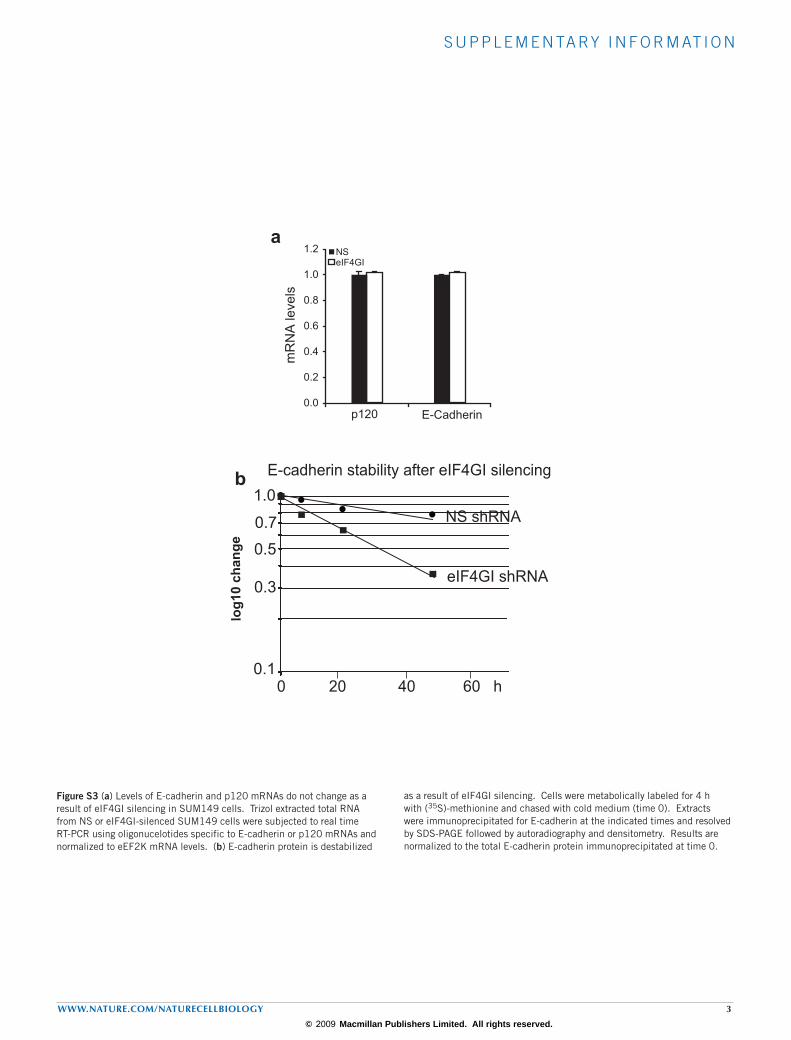
Figure S3 (a) Levels of E-cadherin and p120 mRNAs do not change as a result of eIF4GI silencing in SUM149 cells. Trizol extracted total RNA from NS or eIF4GI-silenced SUM149 cells were subjected to real time RT-PCR using oligonucelotides specific to E-cadherin or p120 mRNAs and normalized to eEF2K mRNA levels. (b) E-cadherin protein is destabilized
as a result of eIF4GI silencing. Cells were metabolically labeled for 4 h with (35S)-methionine and chased with cold medium (time 0). Extracts were immunoprecipitated for E-cadherin at the indicated times and resolved by SDS-PAGE followed by autoradiography and densitometry. Results are normalized to the total E-cadherin protein immunoprecipitated at time 0.
0.0
0.2
0.4
0.6
0.8
1.0
1.2
p120 E-Cadherin
mR
NA
levels
NSeIF4GI
Supplementary Figure S3 Silvera et al.
a
b
log
10
ch
an
ge
0 20 40 60 h 0.1
1.0
0.5
0.3
0.7
eIF4GI shRNA
NS shRNA
E-cadherin stability after eIF4GI silencing
© 2009 Macmillan Publishers Limited. All rights reserved.
s u p p l e m e n ta ry i n f o r m at i o n
4 www.nature.com/naturecellbiology
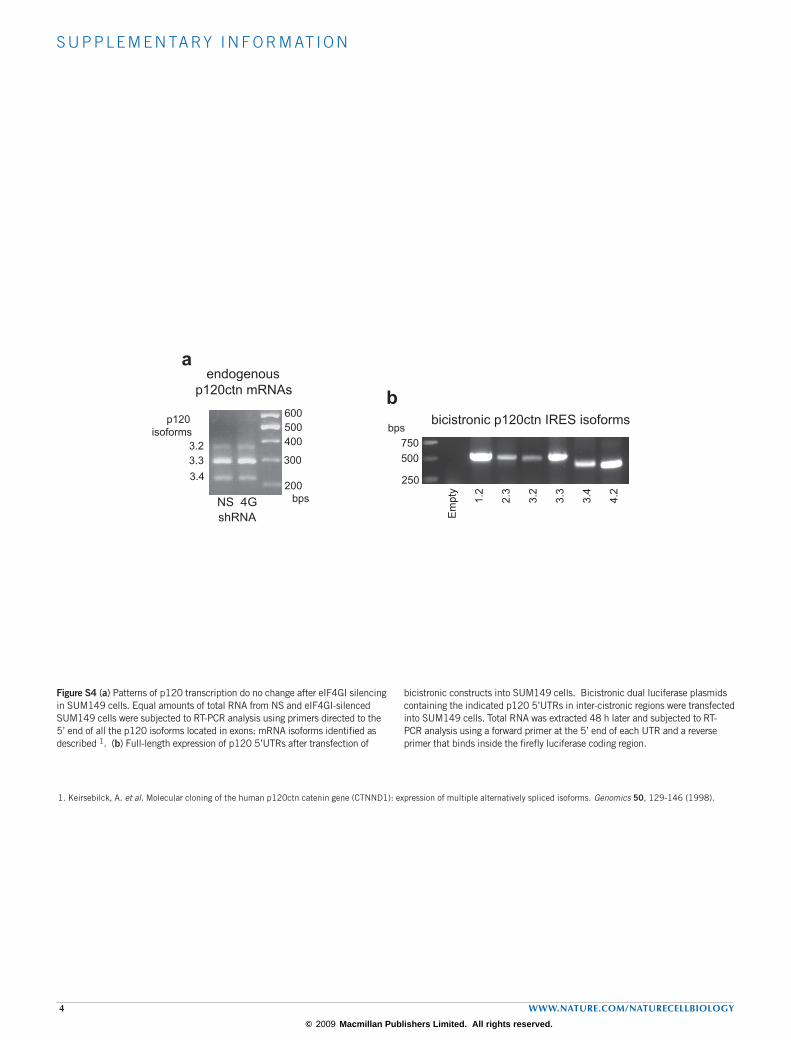
Figure S4 (a) Patterns of p120 transcription do no change after eIF4GI silencing in SUM149 cells. Equal amounts of total RNA from NS and eIF4GI-silenced SUM149 cells were subjected to RT-PCR analysis using primers directed to the 5’ end of all the p120 isoforms located in exons: mRNA isoforms identified as described 1. (b) Full-length expression of p120 5’UTRs after transfection of
bicistronic constructs into SUM149 cells. Bicistronic dual luciferase plasmids containing the indicated p120 5’UTRs in inter-cistronic regions were transfected into SUM149 cells. Total RNA was extracted 48 h later and subjected to RT-PCR analysis using a forward primer at the 5’ end of each UTR and a reverse primer that binds inside the firefly luciferase coding region.
NS 4G
300
200
400
500
600
500
250
750E
mpty
1.2
2.3
3.2
3.3
3.4
4.2
a
b
Supplementary Figure S4 Silvera et al.
endogenous
p120ctn mRNAs
bicistronic p120ctn IRES isoforms
shRNA
bps
3.2
3.3
3.4
p120
isoforms bps
1. Keirsebilck, A. et al. Molecular cloning of the human p120ctn catenin gene (CTNND1): expression of multiple alternatively spliced isoforms. Genomics 50, 129-146 (1998).
© 2009 Macmillan Publishers Limited. All rights reserved.
s u p p l e m e n ta ry i n f o r m at i o n
www.nature.com/naturecellbiology 5
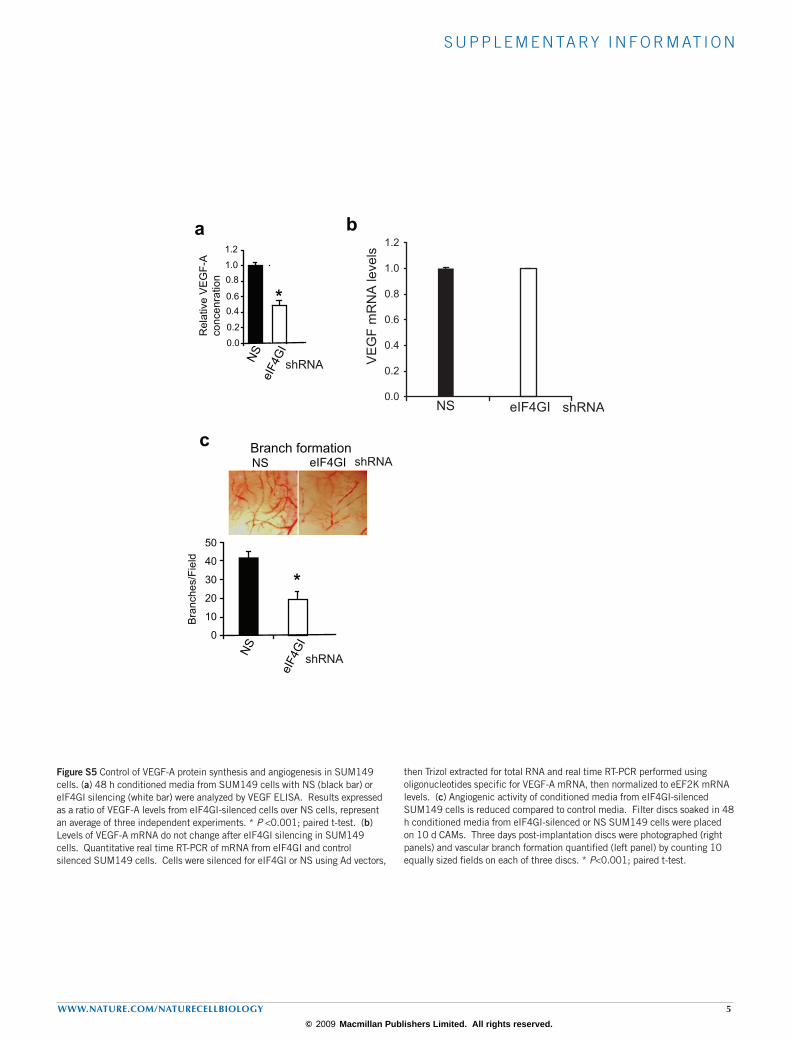
Figure S5 Control of VEGF-A protein synthesis and angiogenesis in SUM149 cells. (a) 48 h conditioned media from SUM149 cells with NS (black bar) or eIF4GI silencing (white bar) were analyzed by VEGF ELISA. Results expressed as a ratio of VEGF-A levels from eIF4GI-silenced cells over NS cells, represent an average of three independent experiments. * P <0.001; paired t-test. (b) Levels of VEGF-A mRNA do not change after eIF4GI silencing in SUM149 cells. Quantitative real time RT-PCR of mRNA from eIF4GI and control silenced SUM149 cells. Cells were silenced for eIF4GI or NS using Ad vectors,
then Trizol extracted for total RNA and real time RT-PCR performed using oligonucleotides specific for VEGF-A mRNA, then normalized to eEF2K mRNA levels. (c) Angiogenic activity of conditioned media from eIF4GI-silenced SUM149 cells is reduced compared to control media. Filter discs soaked in 48 h conditioned media from eIF4GI-silenced or NS SUM149 cells were placed on 10 d CAMs. Three days post-implantation discs were photographed (right panels) and vascular branch formation quantified (left panel) by counting 10 equally sized fields on each of three discs. * P<0.001; paired t-test.
Rela
tive V
EG
F-A
concenra
tion
0.0
0.2
0.4
0.6
0.8
1.0
1.2N
SeIF
4G
I
a
*
b
Supplementary Figure S5 Silvera et al.
shRNA
0
10
20
30
40
50
Bra
nches/F
ield
*
Branch formation
NS
eIF
4G
I
shRNA
eIF4GINS
c
shRNA
0.0
0.2
0.4
0.6
0.8
1.0
1.2
VE
GF
mR
NA
levels
NS eIF4GI shRNA
© 2009 Macmillan Publishers Limited. All rights reserved.

s u p p l e m e n ta ry i n f o r m at i o n
6 www.nature.com/naturecellbiology
Figure S6 Full scans of gels used in all figures.
220150 220100 15050
36
25 503620
Fig1b
eIF4GI
E-cadherin
eIF4A
eIF4E
4E-BP1
Fig1c
eIF4GI
eIF4A
220
150
100
50
36
150100
50
150100
50
25
220
150100
50
75
20Fig2a Fig2b Fig2d
eIF4GI
E-cadherin
eIF4A
E-cadherineIF4GI
E-cadherin
eIF4A
p53
150100
75
50
75
50
Fig3a/b Fig3cFig3e
220
150
75
50
36
p120ctnp120ctn
eIF4GI
β-tubulin
220150
Fig4a
Fig4c
150
10075
150
100
150
100
75
50
150
10075
50
p120ctn
E-cadherin
eIF4GI
eIF4A
p120ctn
p53
E-cadherin
Supplementary Figure S6 Silvera et al.
eIF4GI
eIF4A
eIF4E
4E-BP1
22015010050
252014
MCF10A
SUM149
MCF10A
SUM149
FigS1
© 2009 Macmillan Publishers Limited. All rights reserved.
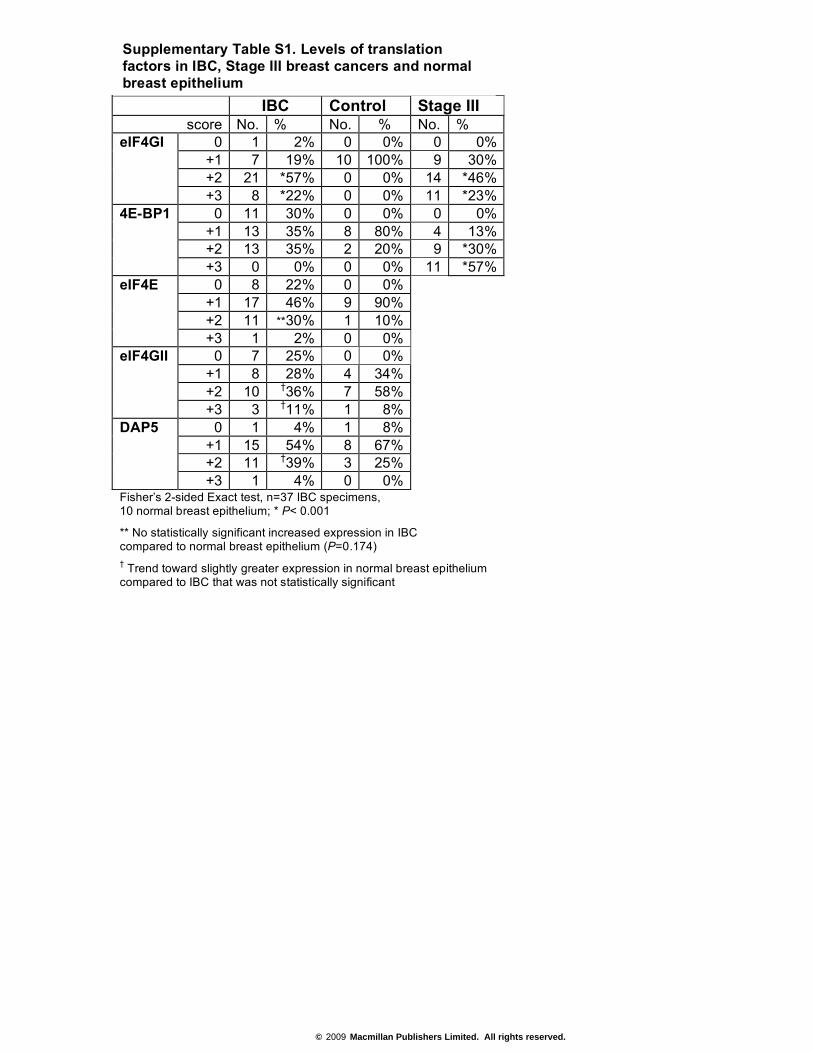
IBC Control Stage III score No. % No. % No. %
0 1 2% 0 0% 0 0% +1 7 19% 10 100% 9 30% +2 21 *57% 0 0% 14 *46%
eIF4GI
+3 8 *22% 0 0% 11 *23% 0 11 30% 0 0% 0 0%
+1 13 35% 8 80% 4 13% +2 13 35% 2 20% 9 *30%
4E-BP1
+3 0 0% 0 0% 11 *57% 0 8 22% 0 0%
+1 17 46% 9 90% +2 11 **30% 1 10%
eIF4E
+3 1 2% 0 0% 0 7 25% 0 0%
+1 8 28% 4 34% +2 10 †36% 7 58%
eIF4GII
+3 3 †11% 1 8% 0 1 4% 1 8%
+1 15 54% 8 67% +2 11 †39% 3 25%
DAP5
+3 1 4% 0 0% Fisher’s 2-sided Exact test, n=37 IBC specimens, 10 normal breast epithelium; * P< 0.001
** No statistically significant increased expression in IBC compared to normal breast epithelium (P=0.174) † Trend toward slightly greater expression in normal breast epithelium compared to IBC that was not statistically significant
Supplementary Table S1. Levels of translation factors in IBC, Stage III breast cancers and normal breast epithelium
© 2009 Macmillan Publishers Limited. All rights reserved.