esa s -291 - International Nuclear Information System (INIS)
298
O esa s -291 TR 9 ooom —g*? a Proceedings of the Ninth ESA/PAC Symposium jointly organised by the Deutsche Forschungsanstalt furLuft- und Raumfahrt and the European Space Agency and held at Lahnstein, Federal Republic of Germany, on 3 - 7 April 1989. BMFT
-
Upload
khangminh22 -
Category
Documents
-
view
3 -
download
0
Transcript of esa s -291 - International Nuclear Information System (INIS)
O
esa s -291TR 9 ooom — g*? a
Proceedings of the Ninth ESA/PACSymposium jointly organised by theDeutsche Forschungsanstalt furLuft- undRaumfahrt and the European SpaceAgency and held at Lahnstein, FederalRepublic of Germany, on 3 - 7 April 1989.
BMFT
TO PREPARE FORTHE 21ST CENTURY25 YEARS OF EUROPEANCOOPERATION IN SPACE
25 ANS DE COOPERATIONSPATIALE EUROPEENNEPOUR PREPARERLE 21EME SIECLE
esa sp-291June 1989
European Rocket and BalloonProgrammes and RelatedResearch*
Proceedings of the Ninth ESA/PACSymposium jointly organised by theDeutsche Forschungsanstalt fur Luft- undRaumfahrt and the European SpaceAgency. and held at Lahnstein, FederalRepublic of Germany, on 3 - 7 April 1989.
89-
european space agency / agence spatiale européenne8-10, rue Mario-Nikis, 75738 PARIS CEDEX 15, France

PROGRAMME COMMITTEE
Chairman
Professor U. von Zahn,Physikalisch Institut,University of Bonn,FRG
Members
Dr. A. Brekke,University of Tromse,Norway
Dr. L. Eliasson,Institute of Space Physics,Kiruna,Sweden
Dr. D. Huguenin,Observatoire de Genève,Switzerland
Dr. J.P. Jegou,Centre National d'EtudesSpatiales,Paris,France
Mr. O. Rôhrig,Deutsche Forschungsanstalt furLuft- und Raumfahrt,PT-TN,Linder Hôhe,KoIn,FRG
Mr. W.R. Burke,EPD/ESTEC,Noordwijk,The Netherlands
Mr. [. Stevenson,ESA/HQ,Paris,France
Mr. L. Jansson,ESA/HQ,Paris,France
COLOPHON
Proceedings publishedand distributed by
compiled by
printed in
Cover by
Price code
International Standard Serial Number
International Standard Book Number
Copyright
ESA Publications DivisionESTEC, Noordwijk, The Netherlands
W.R. Burke
The Netherlands
C. Haakman
E3
ISSN 0379 - 6566
ISBN 92-9092-006-8
© 1988 by European Space Agency
Ill
CONTENTS
Session 1: National ReportsChairman: M. Otterbein, Germany
1.1 Swiss scientific balloon and sounding-rocket experiments: 1987-1989 3D. Huguenin, Observatoire de Genève, Sauverny, Switzerland
1.2 The French balloon programme and related scientific research 7/. Sadoumy, CNES, Paris, France
1.3 The Norwegian scientific balloon, sounding-rocket and ground-based programme for 1989-92 13B.N. Andersen and A. Gundersen, Norwegian Space Centre, Smestad, Norway
1.4 The Swedish sounding-rocket and balloon programme 17K.A.L. Lundahl, Swedish Space Corporation, Sweden
1.5 The German scientific balloon and sounding-rocket programme 23F. DaM, Executive Dept. for Space Projects, DLR, KoIn, FRGM. Otterbein, Federal Ministry for Research & Technology, Bonn, FRG
Session 2: Overall IntroductionChairman: U. von Zahn, Germany
2.1 Enhanced electron density layers in the high-latitude lower ionosphere 35 _S. Kirkwood, L. Eliasson & I. Hàggstrôm, Swedish Institute of Space Physics, Kiruna, SwedenP.N. Collis, EISCAT Scientific association, Kiruna, Sweden
Session 3: Middle AtmosphereChairman: M.L. Chanin, France
3.1 Mesures in situ d'humidité dans l'atmosphère moyenne 43J. Ovarlez, J. Capus, M. Forichon & H. Ovarlez, Laboratoire de Météorologie Dynamique duCNRS, Ecole Polytechnique, Palaiseau, France
3.2 New calculations of photodissociation cross sections on thé O2 Schumann-Runge system 49O.P. Murtagh, Department of Meteorology, Arrhenius Laboratory, University of Stockholm, Sweden
3.5 Evidence for accurate temperatures from the inflatable falling sphere 55FJ. Schmidlin, NASA GSFC/Wallops Flight Facility, Wallops Island, Virginia, USAH.S. Lee, SM Systems & Research Corp., iMndover, Maryland, USAW. Michel, Univ. Dayton Research Institute, Wallops Island, Virginia, USA
3.7 Observation of wind corners in the middle atmosphere over Andenes 69° N during Winter 1983/84,Summer '87 and Summer '88 59H.U. Widdel, MPI fur Aeronomie, Katlenburg/Lindau, FRG

iv TABLE OF CONTENTS
3.8 Near-mesopause temperatures at 69° N latitude in late summer 63U. von Zahn and H. Kurzawa, Physikalisches Institut der Universtàt Bonn, FRG
Session 4: Ionosphere/MagnetosphereChairman: L. Block, Sweden
4.0 Invited SpeakerElectrodynamics of the Polar ionosphere with special emphasis on the dayside cleft region 69 -A. Egeland, Institute of Physics, University of Oslo, Norway
4.2 Some remarks on the working principle of the rocketborne nose-tip DC probes in the D-region ofthe ionosphere 79H. U. Widdel, MPl fur Aeronomie, Katlenburg/Lindau, FRG
4.3 Resonance-cone diagnostics in the mid-latitude ionosphere 85A. Piel, Institut fur Experimentalphysik, Universitât Kiel, FRGH. Thiemann, Physikalisch-Technische Studien GmbH, Freiburg, FRGK.I. Oyama, ISAS, 3-1-I Yoshinodai, Sagamihara, Kanagawa 229, Japan
Session 5: Viking-related ResultsChairman: L. Eliasson, Sweden
5.2 Auroral particle acceleration by DC and low-frequency electric fields 93 -LP. Block and C.-G. Falthammar, Dept. of Plasma Physics, The Royal Institute of Technology,Stockholm, Sweden
5.3 Observation of EHC waves and electric-field fluctuations near one Hz in auroral accelerationregions 97A.I. Eriksson and Georg Gustafsson, Swedish Institute of Space Physics, Uppsala, Sweden
5.4 The auroral current/voltage relationship 103K. Bruning, Dept. of Plasma Physics, The Royal Institute of Technology, Stockholm, Sweden
Session 6: New Techniques I InstrumentsChairmen: D. Huguenin, France
B.N. Andersen, Norway
6.1 High-precision rocket-altitude reconstruction using star sensor and magnetometer data 111A. Muschinski and H. Liihr, Institut Jur Geophysik und Météorologie, Technische UniversitâtBraunschweig, FRG
6.2 The Supernova 1987A attitude control system 117J. Turner, Hauptabteilung Angewandte Datentechnik, DLR, Oberpfaffenhofen, FRG
6.4 SOPHIA - stratospheric observatory for infrared astronomy: a 3 m class airborne telescope 123A.F. DaM, R. Ewald & A. Himmes, DLR. KoIn, FRG
6.5 Design and technical aspects of the Solly instrument 125M. Boison & E. Weber, Dornier GmbH, Friedrichshafen, FRG
TABLE OF CONTENTS v
6.7 A double-focusing mass spectrometer for simultaneous ion measurements in the stratosphere 129R.Moor, E. Kopp, H. Ramseyer & U. Walchli, Physikalisches Institut, Universitât Bern, SwitzerlandE. Arijs, D. Nevejans, J. Ingels & D. Fussen, Belgian Institute for Space Aeronomy, Brussels,BelgiumA. Barassin & C. Reynaud, L.P.C.E., C.N.R.S., Orléans, France
6.10 Application of an optimal filter for inflatable sphere data processing 135H.S. Lee, SM Systems & Research Corp., Landover, Maryland, USAFJ. Schmidlin, NASA GSFC/Wallops Flight Facility, Wallops Island, Virginia, USAW. Michel, Univ. Dayton Research institute, Wallops Island, Virginia, USA
Session 7; Ionosphere/MagnetosphereChairman: J. Rôttger, Sweden
7.1 Preliminary results of the rocket and scatter experiments 'ROSE': measurements with the newlydesigned spherical probe 141G. Rose, MPl fur Aeronomie, Katlenburg-Lindau, FRG
7.3 Electric-field measurements on board the ROSE payloads 149K. Rinnert, MPl fur Aeronomie, Katlenburg/Lindau, FRG
7.4 Preliminary results of electron-density fluctuation measurements during the ROSE rocket flights 151K. Schlegel, MPI fur Aeronomie, Katlenburg-Lindau, FRG
7.5 Background electrodynamics measured by EISCAT during the NEED campaign 153C. Hall & A. Brekke, University of Tromse, NorwayM.T. Rietveld & U.P. Lovhaug, EISCATScientific Association, Ramfjordbotn, NorwayB.N. Mtehlum, Norwegian Defence Research Establishment, Kjeller, Norway
Session S: Upper AtmosphereChairman: E.V. Thrane
8.1 The effects of gravity waves on horizontal layers: simulation and interpretation 161U. P. Hoppe, Norwegian Defence Research Establishment, Kjeller, Norway
8.2 A consistent model of the most common nightglow emissions 167D, Murtagh, Arrhenius Laboratory, University of Stockholm, Sweden
8.4 INTERZODIAK II: observation of EUV-resonance radiation 173G. Lay, Astronomische Institute der Universitât Bonn, Germany
Session 9: Middle AtmosphereChairman: E.V. Thrane, Norway
9.3 Neutral air turbulance in the middle and upper atmosphere observed during the MAC/EPSILONcampaign 179W. Hillert and F.-J. Lubken, Physikalisches Institut der Universitât Bonn, FRG
9.4 Modulations in the Polar mésosphère summer echoes and associated atmospheric gravity wavesobserved by EISCAT 187P. J. S. Williams, Department of Physics, University College of Wales, Aberystwyth, UKA.P. van Eyken, Southampton University, UKC. Hall, Nordlysobservatoriet, Tromse, NorwayJ. Rôttger, EISCAT Scientific Association, Kiruna, Sweden.

vi TABLE OF CONTENTS
Session 10: Range FacilitiesChairman: D. Offermann, Germany
10.1 Operational activity in France and a new method of balloon temperature piloting 195P. Faucon, CNES, Toulouse, France
10.2 Large heavy-duty balloons in Europe 201A. Soubrier, CNES, Toulouse, France
10.3 And0ya rocket range - new installations, future plans and investments 203K. Adolfsen, P. A. Mikalsen and I. Nyheim, Andeya Rocket Range, Norway
10.5 Qualification du propulseur quatrième étage du lanceur Brésilien - VLS: une nouvelle fusée sonde 209J. Boscov & W.K. Toyama, Centra Técnico Aérospatial, Institute de Atividades Espaciais, Sâo Josédos Campos, Brazil
10.6 The Brazilian space programme: actual state of the art 213J. Boscov, A.C.F. Pedrosa & T.S. Ribeiro, Centra Técnico Aérospatial, Instituto de AtividadesEspaciais, Sào José dos Campos, Brazil
Session 11; Astronomy and AstrophysicsChairmen: J.M. Lamarre, France
H.J. Fahr, Germany
11.0 Invited SpeakerInterstellar medium and infrared emission of the galactic disc 221G. Serra, CESR, Toulouse, France
11.1 • ;ptical observation of interplanetary pick-up ions 229H.J. Fahr, C.Lay andH.U. Nafi, Astronomische Institute der Universitcit Bonn, FRG
11.2 Interplanetary dust close to the sun (Fraunhofer-Corona): its observation in the visual and infraredspectral ranges by rocketborne coronograph 233B. Kneissel, I. Mann and H. van der Meer, Ruhr-Universitât Bochum, FRG
11.3 Deep detection of hot star populations at balloon ultraviolet wavelengths 237B. Milliard, M. Laget, J. Donas, D. Burgarella & H. Moulinée, Laboratoire d'Astronomie Spatiale,Les Trois Lacs, Marseille, FranceD. Huguenin, Observatoire de Genève, Sauverny, Switzerland
11.4 Project Supernova 1987 239H. Hippmann, MPI fiir Physik und Astrophysik, Garching, FRG
11.5 The X-ray mirror and the PSPC of the Supernova rocket project 241U. Briel, E. Pfeffermann, H. Bàuninger, W. Burkert, G. Ketienring and G. Metzner, MPI fur Physikund Astrophysik, Garching, FRG
11.7 Observation of the solar Lyman-alpha line 245H. U. Nafi, G. Lay and HJ. Fahr, Astronoinische Institute der Universitat Bonn, FRG

TABLE OF CONTENTS vii
Session 13: Polar Trace ConstituentsChairman: F. Arnold, Germany
13.4 Diurnal variation of the sodium layer at polar latitudes in summer 253H. Kurzawa and U. von Zahn, Physikalisches Institut der Universitat Bonn, FRG
Session 14: Future ProjectsChairman: E. Kopp, Switzerland
14.2 The DYANA campaign 1990 259D. Offermann, Department of Physics, Wuppertal University, FRG
14.3 The Skylark sounding-rocket programme and future launcher developments by British Aerospace(Space Systems) Ltd. 269J.A. Ellis, British Aerospace (Space Systems) Ltd., Bristol, UK
Poster Session
P. 1 Telemetry monitoring and storage 275B. Ljung, Swedish Space Corporation, Solna, Sweden
P.2 Prediction of the 10 cm flux index 277P. Lantos, Observatoire de Paris-Meudon, France
P.3 The German space science programme 279F. DaM, PT-WRF/WRT, DLR, KoIn, FRGM. Otterbein, BMFT, Bonn, FRG
P.5 Long-duration balloon flights in the middle stratosphere 285P. Malaterre, Division Ballons, CNES, Toulouse, France
P. 7 SN 1987A telemetry decoding system 2895. Miiller, MPIfUr extraterrestrische Physik, Garching, FRG
P. 8 Esrange 293J. England, A. Helger, A. Wikstrotn & L. Marcus, Swedish Space Corporation, Esrange, Sweden
P. 10 ALIS: an auroral large imaging system in northern Scandinavia 299A. Steen, Swedish Institute of Space Physics, Kiruna, Sweden
Conclusion
Concluding remarks 307U. von Zahn, Physikalisches Institut der Universitat Bonn, FRG

VlI l
PAGE INTENTIONALLY LEFT BLANK
IX
LIST OF PARTICIPANTS
J. AbeleDornier GmbHPostfach 1420D-7990 FriedrichshafenFRG
P. BeckerDLRPT-TN2D-5000 KoIn 90FRG
U. BrielMPI fur Physik und AstrophysikInstitut fur extraterrestrische PhysikGiessenbachstralieD-8046 Garching b. MiinchenFRG
K. AdolfsenNorwegian space CentreAnd0ya Rocket RangeP.O. Box 60N-8480 AndenesNorway
P. AimedieuService d'Aéronomie du CNRSBoîte Postale 3F-91371 Verrières-le-BuissonFrance
M. BitlnerBergische UniversitàtGesamthochschule WuppertalPostfach 10 Ol 27GauBstr. 20D-5600 Wuppertal 1FRG
L.G. BjornSwedish Space CorporationAlbygatan 107S-17154 SolnaSweden
K. BrùningDepartment of Plasma PhysicsThe Royal Institute of TechnologyS-IOO 44 StockholmSweden
D. BurgarellaLaboratoire Astronomie SpatialeTraverse du SiphonLes Trois LacsF-13012 MarseilleFrance
Bo Nyborg AndersenNorwegian space CentreP.O. Box 85SmestadN-0309 Oslo 3Norway
B. AschenbachMPI fur Physik und AstrophysikInstitut fur extraterrestrische PhysikGiefienbachstrafieD-8046 GarchingFRG
T. BHxNorwegian Defence ResearchEstablishmentDivision for ElectronicsP.O. Box 25N-2007 KjellerNorway
L.P. BlockRoyal Institute of TechnologyDepartment of Plasma PhysicsS-10044 StockholmSweden
W.R. BurkeESA Publications DivisionESA/ESTECPostbus 299NL-2200 AG NoordwijkThe Netherlands
MX. ChaninService d'Aéronomie du CNRSBP 3F-91371 Verrières-le-BuissonFrance
H. AuchterMBB GmbHPostfach 80 11 69D-8000 Miinchen 80FRG
J. BoscovInstitute de Atividades Espaciais(CTA)Rua Paraibuna S/No - 12225Sâo José dos Campos - SPBrasil
A. ClochetMatra ToulouseRue des CosmonautesZI du PalaysF-3I077 Toulouse CedexFrance

LIST OF PARTICIPANTS
Y. CohenLab. de Géomag, interneInst. de Physique du Globe de Paris4, place JussieuF-75252 Paris Cedex 05France
A.I. ErikssonSwedish Institute of Space PhysicsUppsala DivisionS-75591 UppsalaSweden
K.U. GrossmannDepartment of PhysicsUniversitat WuppertalGaufi-StralJe 20D-5600 Wuppertal 1FRG
F. DahlDFVLR-BPTLinder HôheD-5000 KoIn 90FRG
HJ. FahrAstronomische Institute derUniversitat BonnAuf dem Huge! 71D-5300 Bonn 1FRG
A. GundersenNorwegian space CentreP.O. Box 85SmestadN-0309 Oslo 3Norway
A. EgelandInstitute of PhysicsUniversity of OsloP.O. Box 1048BlindernN-0316 Oslo 3Norway
L. EliassonSwedish Institute of Space Physics(IRF)P.O. Box 812S-98128 KirunaSweden
P. FauconCNESCentre de BallonsBP 157F-40800 Aire-sur-1'AdourFrance
B. FrankeMBB/ERNO, Dept. OX 23HiinefeldstraBe 1-5D-2800 Bremen 1FRG
C. HallThe Auroral ObservatoryUniversity of Troms0P.O. Box 953N-9001 TromsoNorway
L.H. HallSAAB Space ABS-58188 LinkôpingSweden
J.A. EllisBritish AerospaceSpace and CommunicationsDivision, FPC 331P.O. Box 5Filton, Bristol BS12 7QWUK
R.M. EndersonApplied Technology DivisionRaven Industries Inc.Box 1007Sioux Falls, SD 57117USA
M. FriedrichTechnische Universitat GrazInffeldgasse 12A-8010 GrazAustria
P. von der GathenPhysikalisches Institut derUniversitat BonnNussallee 12D-5300 Bonn 1FRG
G. HansenAnd0ya Rocket RangeP.O. Box 60N-8480 AndenesNorway
G. HansenPhysikalisches InstitutUniversitat BonnNuBallee 12D-5300 Bonn 1FRG
J. EnglundSwedish Space CorporationEsrangeP.O. Box 802S-89128 KirunaSweden
R.A. GoldbergLaboratory for ExtraterrestrialPhysicsNASA/Goddard Space Flight CenterCode 696Greenbelt, MD 20771USA
A. HelgerSwedish Space CorporationEsrangeP.O. Box 802S-98128 KirunaSweden
LIST OF PARTICIPANTS Xl
W. HillertPhysikalisches Institut derUniversitât BonnNussallee 12D-5300 Bonn 1FRG
A. HimmesDFVLR-RF-TN2Linder Ho'hePostfach 90 60 58D-5000 KoIn 90FRG
M. HinadaInstitute of Space & AstronauticalScience (ISAS)Ministry of Education3-1-1 YoshinodaiSagamifiara-shi 229Japan
H. HippmannMPI fur Physik und AstrophysikInstitut fur extraterrestrische PhysikGiefienbachstraBeD-8046 Garching b. MunchenFRG
D.N. HoareAerospace Consultant6 SeawallsSea Wells RoadSneyd ParkBristol BS9 IPGUK
D. HomannBergische UniversitâtGesamthochschule WuppertalPostfach 10 Ol 27GauBstrafie 20D-5600 Wuppertal 1FRG
U.-P. HoppeDivision for ElectronicsNorwegian Defence ResearchEstablishmentP.O. Box 25N-2007 KjellerNorway
D. HugueninObservatoire de GeneveCh. des MaiJlettes 51CH-1290 SauvernySwitzerland
L.O. JanssonEOM/SRPAC SecretariatEuropean space agency8-10, rue Mario-NikisF-75738 Paris CedexFrance
X.M. KalteisDFVLR-RF-RM-MRPost wesslingD-803I OberpfaffenhofenFRG
B. KneiltelBereich Extraterrestrische PhysikRuhr-Universitât BochumUniversitatsstrafie 150Postfach 10 21 48D-4630 Bochum 1FRG
H. KohlMPI fur AeronomieMax-Planck-Strafie 2Postfach 20D-3411 Katlenburg/Lindau 3FRG
E. KoppInstitut de Physique de l'Universitéde BerneSidlerstralîe 5CH-3012 BerneSwitzerland
H. KoskinenFinnish Meteorological InstituteP.O. Box 503SF-OOlOl HelsinkiFinland
H. KurzawaPhysikalisches Institut derUniversitât BonnNussallee 12D-5300 Bonn 1FRG
H. von HomerVon Hôrner & Sulger ElectronicGmbHSchloflplatz 8D-6630 SchwetzwgenFRG
S, KemiSwedish Space CorporationEsrangeP.O. Box 802S-98128 KirunaSweden
J. M. LamarreService d'Aéronomie du CNRSBP 3F-91371 Verrières-le-Buisson CedexFrance
J. HoffmannMPI fur KernphysikPostfach 10 39 80D-6900 Heidelberg 1FRG
S. KirkwoodSwedish Institute of Space Physics(IRF)P.O. Box 812S-98128 KirunaSweden
P. LantosCentre de PrévisionsObservatoire de Paris-MeudonF-92195 Meudon CedexFrance

XlI LIST OF PARTICIPANTS
G. LayAstronomische Institute derUniversitat BonnAuf dem Hugel 71D-5300 Bonn 1FRG
P. MalaterreCNES - DRT/BA/LD18, av. Edouard BelinF-31055 Toulouse CedexFrance
S. MailerMPI fur Physik und AstrophysikInilitut fur extraterrestrische PhysikGieftenbach stralîeD-8046 Garching b. MunchenFRG
H.S. LeeSM Systems and Research Corp.8401 Corporate Dr.,Suite 450Landover, MD 20785USA
L. MarcusSwedish Space corporationEsrangeP.O. Box 802S-98128 KirunaSweden
O.P. MurtaghDepartment of MeteorologyArrhenius LaboratoryUniversity of StockholmS-10691 StockholmSweden
G. LehmacherPhysikalisches Institut derUniversitàt BonnNuBallee 12D-5300 Bonn 1FRG
B. LehtinenSwedish Space CorporationEsrangeP.O. Box 802S-98128 KirunaSweden
M. de MazièreInstitut d'Aéronomie Spatiale deBelgique3, av. CirculaireB-1180 BruxellesBelgium
W.R. MichelResearch InstituteUniversity of DaytonNASA-GSFC-WFFWallops Island, VA 23337USA
A. MuschinskiInstitut fur Geophysik undMétéorologie der TechnischenUniversitàt Carolo-WilhelminaMendelssohnstrafie 3D-3300 BraunschweigFRG
M. NaudEOMEuropean Space Agency8-10, rue Mario-NikisF-75738 Paris CedexFrance
B. LjungDepartment of Sounding RocketsSwedish Space CorporationAlbygatan 107P.O. Box 4207S-17104 SolnaSweden
F.-J. LûbkenPhysikalisches Institut derUniversitàt BonnNussallee 12D-5300 Bonn 1FRG
P.À. MikalsenAndeya Rocket RangeP.O.Box 60N-8480 AndenesNorway
R. MoorPhysikalisches InstitutUniversity of BernSidlerstraGe 5CH-3012 BernSwitzerland
U. NaBAstronomische Institute derUniversitàt BonnAuf dem Hugel 71D-5300 Bonn 1FRG
I. NyheimAnd0ya Rocket RangeP.O. Box 60N-8480 AndenesNorway
K.A.L. LundahlDepartment of Sounding RocketsSwedish Space CorporationAlbygatan 107P.O. Box 4207S-17104 SolnaSweden
H. MoulinéeLaboratoire Astronomie SpatialeTraverse du SiphonLes Trois LacsF-13012 MarseilleFrance
D.T. O'ConnorBristol Aerospace LtdP.O. Box 874Winnipeg, MA R3C 2S4Canada
LIST OF PARTICIPANTS XlIl
D. OffermannDepartment of PhysicsUniversitàt WuppertalGauB-StraBe 20Postfach 10 Ol 27D-5600 Wuppertal 1FRG
K. OkamaThe Geophysics Research Lab.University of TokyoBunkyo-kuTokyo 113Japan
K. RinnertMPI fur AeronomieMax-Planck-StraBe 2Postfach 20D-34I1 Katlenburg/LindauFRG
O. RôhrigDLRPT-TN2Linder HôheD-5000 KoIn 90FRG
K. SchlegelMPI fur AeronomieMax-Planck-StraBe 2Postfach 20D-3411 Katlenburg/LindauFRG
G. SchmidkeInstitut f. Physikalische MeBtechnikHeidenhofctr. 8D-7800 Freiburg i. Br.FRG
M. OtterbeinBMFTD-5300 BonnFRG
J. RottgerEISCAT Scientific AssociationP.O. Box 812S-98128 KirunaSweden
F.J. SchmidlinNASA GSFC/Wallops FlightFacilityWallops Island, VA 23337USA
J. OvarlezLaboratoire de MétéorologieDynamique du CNRSEcole PolytechniqueF-91128 Palaiseau CedexFrance
V. RohdeExperimentalphysikUniversitàt KielOlshausenstr. 40D-2300 KielFRG
U. SchmidtInstitut fur Atmosphârische ChemieKFA-JûlichPostfach 1913D-5170 JiilichFRG
K. PfeilstickerInstitut fur Atmosphârische ChemieICH-2KFA-JùlichPostfach 1913D-5170 JûlichFRG
À. PielInstitut fur Experimentalphysik IIRuhr-Universitât BochumPostfach 1021 48D-4630 BochumFRG
G. RoséMPI fiir AeronomieMax-Planck-StraBe 2Postfach 20D-3411 Katlenburg/LindauFRG
1. SadournyDivision des Science de l'UniversCNES2, place Maurice QuentinF-75039 Paris Cedex OlFrance
P. SeidlPhysikalisch Technische StudienGmbHLeinenweberstr. 16D-7800 Freiburg i. Br.FRG
G. SerraCESR11, av. du Colonel RocheBP 4346F-31029 Toulouse CedexFrance
H. RantaGeophysical ObservatorySF-99600 SodankylFinland
H. SchlagerMPI fur KernphysikPostfach 10 39 80D-6900 HeidelbergFRG
A. SoreideChristian Michelsens InstituteFantoftveien, 38N-5036 FantoftNorway

xiv LIST OF PARTICIPANTS
A. SoubrierCNES18, av. Edouard BelinF-31055 Toulouse cédexFrance
j.P. TreilhouCESRtUPS9, av. du Col. RocheBP 4346F-31029 Toulouse CedexFrance
O. WidellSwedish Space CorporationEsrangeP.O. Box 802S-98128 KirunaSweden
A. SteenSwedish Institute of Space PhysicsP.O. Box 812S-981 28 KirunaSweden
J. TurnerHauptabteilung angewandteDatentechnikDFVLR, WT-DA-PKPost WeBlingD-8031 OberpfaffenhofenFRG
A. WikstromSwedish Space CorporationEsrangeP.O. Box 802S-98128 KirunaSweden
I. StevensonEOM-DSEuropean Space Agency8-10, rue Mario-NikisF-75738 Paris CedexFrance
J.C. UlwickStewart Radiance LaboratoryUtah State UniversityLogan, UT 84322USA
G. WittUniversity of StockholmDepartment of MeteorologyArrhenius LaboratoryS-10691 StockholmSweden
M.J. TaylorDepartment of PhysicsThe University of SouthamptonSouthampton, Hants. SO9 5NHUK
J. VuagnatDA/FINEuropean Space Agency8-10, rue Mario-NikisF-75738 Paris CedexFrance
Y.-F. WuMPI fur AeronomiePostfach 20D-3411 Katlenburg/Lindau 3FRG
H. ThiemannPhysikalisch Technische StudienGmbHLeinenweberstr. 16D-7800 FreiburgFRG
H. WaldmannMBB GmbHPostfach 80 11 69D-8000 Mimchen 80FRG
U. von ZahnPhysikalisches Institut derUniversitât BonnNussallee 12D-5300 Bonn 1FRG
H. ThomassenAndeya Rocket RangeP.O. Box 60N-8480 AndenesNorway
E. WeberDornier-System GmbHPostfach 1360D-7990 FriedrichshafenFRG
E.V. ThraneNDRE Division for ElectronicsP.O. Box 25N-2007 KjellerNorway
H.-U. WiddelMPI fur AeronomiePostfach 20D-3411 Katlenburg/Lindau 3FRG

XV
OPENING ADDRESS
Dr. H. StrubHead of Aerospace Programmes
Federal Ministry of Research and TechnologyBonn, Federal Republic of Germany
Ladies and Gentlemen!
Welcome to Germany, where you last held a symposiumin the series on European Rocket and Balloon Programmesand Related Research thirteen years ago.
I welcome you not only on my own behalf, but also on thatof the German Federal Minister for Research andTechnology, Dr Riesenhuber, who has asked me to conveyto you his greetings and best wishes for a successfulsymposium. We hope the discussions will be fruitful andhave no doubt that the results of scientific programmes androcket and balloon campaigns will be most interesting.
Looking through the programme of the Symposium, I amstruck by the wide variety of fields dealt with; most areasof extraterrestrial research will be covered. All this workis in addition to and complementary to what is being donewith satellites. Rocket- and balloon-borne research isperhaps less spectacular than the satellite work, but it isalso a lot less expensive. It strikes me as a very cost-effective and efficient method of performing research —well worth the money spent on it.
Helping scientists to achieve good scientific results is oneof the aims of the German Space Programme, and we hopeto go on doing so during the fifth period of thisprogramme, which is now in preparation. It will be basedon the guidelines established by the Government inpreparation for the endorsement of the European LongTerm Space Plan 'Horizon 2000', which was put forwardat the ESA Council Meeting at ministerial level at TheHague in November 1987. The new German programmewill lay strong emphasis on international co-operation — asits predecessors did — and will endeavour to ensure theachievement of German aims in space both throughparticipation in the programmes managed by the EuropeanSpace Agency and by means of the vigorous execution ofits own complementary national programmes. One of theproblems encountered in preparing these programmes has
been to tune them to the amount of public funds available.In this regard, I am very happy that during the ESACouncil meeting last December we were able to getapproval for increasing the ESA Science Programmebudget by 5% each year until 1992. This will help toensure the continuity of the work of the space scientists,who were the ones mainly responsible for getting space
technology moving in the first place.
It was in 1962 - five years after Sputnik - that the GermanFederal Government decided to establish a spaceprogramme and plan the funding of activities in space.Right from the outset, this programme was based oninternational co-operation.
In the first period, extraterrestrial research in the Germanspace programme took the form of sounding rocket flights:the first launch took place at NASA's launch site 'WhiteSands' in November 1964 and the rocket was an Aerobee.
Sounding rockets were the only means of makingmeasurements in situ at altitudes between 40 and 150 km.They proved to be an efficient research instrument thatpermitted a single programme to be performed in arelatively short time. This is still a strong argument forusing sounding rockets as a tool for university research andthe initiating and training of young scientists. Most youngpeople working for a diploma or thesis cannot spend theamount of' time at university that is required for thedevelopment of a satellite experiment and the subsequentmission. Sounding rocket campaigns, however, with theirmuch shorter preparation time and the rapidity with whichtheir results can be evaluated are an ideal training groundfor young space scientists.
Another feature of sounding rocket work is the opportunityit gives to test instrumentation for long-duration missionsin an efficient and inexpensive manner. For example, thescientific instruments designed for the first Germansatellites, AZUR and AEROS, were subjected to prelim-
Proc. Ninth ESAIPAC Symposium on 'European Rocket and Balloon Programmes and Related Research ', Lahnstein, FRG, 3—7 April 1989SP-291, June 1989)

XVl
inary testing during ballistic rocket flights. In recent years,sounding rockets have repeatedly shown how useful theycan be in permitting short-term microgravity experimentsto be carried out.
In view of these proven advantages, the German FederalGovernment is willing to continue its support for theperformance of space research by means of soundingrockets and balloons. And, as a result, the FederalRepublic is considering agreeing to a further prolongation
of the Special Esrange Agreement, which is due forrenewal in 1990. Together with the other participatingESA Member States, it feels that continued utilisation ofthe launching sites in Kiruna (Sweden) and Andoya(Norway) should be guaranteed.
In conclusion, I wish you a successful and interestingsymposium and trust that you will have a pleasant stay inthe healthful and beautiful surroundings for whichLahnstein is justly famous.

XVH
OPENING ADDRESS
Dr. N. KiehneHead of Project Management division
Deutsche Forschungsanstalt fur Luft- und RaumfahrtCologne, Federal Republic of Germany
Ladies and Gentlemen!
On behalf of the Deutsche Forschungsanstalt fur Luft- undRaumfahrt — now beginning to be known as 'DLR' — itis a great pleasure for me to welcome all of you to the 9thESA/PAC Symposium on European Rocket and BalloonProgrammes and Related Research.
There have been times when the usefulness of activities inthis field (i.e. rocket and balloon programmes) has beenquestioned, when its role and importance in the Europeanspace programme had to be defended more strongly thanusual in the competitive environment of space budgets. Iam pretty well convinced that this symposium, like theones that have preceded it, will show the soundness andvalue of the rocket and balloon programmes and theirrelated research activities.
What are the reasons for this success? Listening to thoseinvolved in the programmes, you will generally hear thefollowing arguments, in addition to other more specificones:— lack of other flight opportunities;— short lead times;— low safety and quality requirements;— low cost.
I would prefer to express it differently: These programmes
are user friendly!
User friendliness as an essential objective is requested inmany programmes. Unjustifiedly, it is used as a salesargument in others. But it is a matter of fact in many of therocket and balloon programmes. User friendliness herestands for direct and easy access. It also means that theseprogrammes offer what is required and that they adapt tousers' needs without overwhelming the users with'goodies' they are not looking for. And, finally, it meansthat these programmes deliver fast, directly andrepeatedly, where required.
For the implementation of the big European space pro-grammes, i.e. Columbus, Ariane 5 and Hermes, there ismuch to be learned from the rocket and balloon pro-grammes — and I don't just mean as regards user friendli-ness. Unfortunately, this does not safeguard rocket andballoon programmes against a risk to which such 'small'space projects and those activities usually summarisedunder the heading 'utilisation' seem to be particularlyliable. This risk stems from the enormous size of the biginfrastructure projects, their inherent high risks and thehigh priority that is attached to their implementation. As isimmediately obvious, the big projects develop a strongappetite for budget money and knowledgeable people.Please do not misunderstand me: I am not calling the bigeuropean space infrastructure programmes into question.But we do have to find a way of defining and guaranteeinga sound balance between 'big' and small' projects,between the development of space systems and theirutilisation. This is a problem that has not yet found asolution.
The organisational relations in the field of rocket andballoon programmes are specific. I am very impressed bytheir structures and features. They give room for sufficientco-ordination, they foster co-operation and they allow fordirect and unbureaucratic implementation of the individualprojects. For the benefit of implementation, managementis kept to a satisfactorily low level. Of course, there aredifferent constraints in other fields of space activity, butwhy shouldn't one aim in the same direction there, too.
Ladies and gentlemen, you are participating in this sym-posium to exchange information on rocket and balloonprogrammes and related research, to discuss results, shareexperience and compare plans. The programme for thesymposium as well as the broad and excellent participationwill assure fruitful meetings. The beautiful location willprovide the right and enjoyable environment. Please acceptmy best wishes for a successful week.
Proc. Ninth ESA/PAC Symposium on 'European Rocket and Balloon Programmes and Related Research', Lahnslein, FRG, 3—7 April I9S9
(ESA SP-291, June 1989)
IIIXlX
XX
OPENING ADDRESS
Lars Ove JANSSON
Esrange Special Project OfficeESA HQ, PARIS
Mr Chairman, Ladies and Gentlemen,
On behalf of the European Space Agency,I have the pleasure to cordially welcomeyou to the 9th ESA Symposium on EuropeanRocket and Balloon Programmes andRelated Research.
The Director of Earth Observation andMicrogravity, Mr Philip Goldsmith, hasasked me to forward, to all parti-cipants, the best wishes for aninteresting and successful symposium. Heis at present participating in aninternational Earth Observation meetingbetween the world space organizations inOttawa, Canada, which unfortunatelycoincides with cur Symposium here inLahnstein.
This fact also reminds me to convey aspecial welcome to the participants fromthe countries who are not participatingin the ESA Special Project concerningthe launching of sounding rockets, andin particular to the participants fromthe non-ESA member states who in somecases have undertaken a considerablejourney to join us here this week.
Having joined the Esrange SpecialProject office at ESA-HQ in Paris onlyone month ago, after spending more thanfour years at the Microgravity Instru-mentation area at the ESA establishmentESTEC in the Netherlands, I am personal-ly looking forward to this week withgreat excitement and expectation todeepen my insight in the variety ofresearch topics carried out usingsounding rockets and balloons, and inparticular to meet and establishcontacts with the scientific usercommunity represented here.
During my time at ESA, I have beenfortunate to be involved in the micro-gravity sounding rocket projects at atime when these projects have expe-rienced a greater attention and aconsiderable increase in both the numberof launches and the level of sophis-tication of experimental facilities.
At the present time, there is anotherarea of research which for environmentalreasons, matches or even surpassesmicrogravity as a research area whichdemands an increase in the number ofcampaigns at our two ranges Andoya andEsrange, namely ozone research. Thisfact emphasizes the need for establishedsounding rocket launch and balloonrelease ranges existing in Europe. It ismy sincere hope, as the personresponsible at ESA for the EsrangeSpecial Project, that we will in theimmediate future be able to turn thisincreased attention for rocket andballoon research into an increase in thenumber of ESA member states partici-pating in the Esrange Special Project.The five countries presently partici-pating in the Special Project areSwitzerland, France, Germany, Norway,and Sweden. During the coming year wewill negotiate the prolongation of theAgreement of the Esrange Special Projectand chis is also the perfect time forother countries to join.
As a conclusion, I would like to referto another opening address made sixyears ago at the 6th Symposium, where itwas stated that the "Golflen Age" ofsounding rockets and balloons was past.Considering that these activities havetoday matured and proven themselves asresearch facilities on their own meritsand considering the increase in thenovel research areas of microgravity andozone research, I wonder if thesedevelopments would not motivate the useof the name "the Platinum Age".
Finally, I would like to thank theGerman Authorities and the OrganizingCommittee for their work in preparingthis Symposium here on the beautifulriver-beds of the Rhine.
I thank you for your attention.
Proc. Ninth ESA/PAC Symposium on 'European Rockei and Balloon Programmes and Related Research', Luhmtein, PRG, 3—7April 1989(ESA SP-29 I .June 1989)

XXl
OPENING ADDRESS
Herrn Oberburgermeister GroBMayor of Lahnstein
Federal Republic of Germany
Meine sehr geehrten Damen und Herren!
Mit Ihrer Tagung knupfen Sie an eine bis ins Mittelalterund damit auf die Kurfursten zuriickgehende Tradition an.Die Tatsache, dafi hier vier der insgesamt sieben Kurfiir-stentûmer, namlich KoIn, Mainz, Trier und Pfalz aneinan-dergrenzten, HeB Lahnstein zum haufigen Tagungsortwerden. Der noch heute zu besichtigende Kônigstuhl aufder gegeniiberliegenden Site in Rhens erinnert an dieseZeit. Hier wurden die in Frankfurt gewâhlten Konige vor-gestellt, bevor sie in Aachen gekrônt wurden.
Ihre heute zu behandelnden, sicherlich hochinteressantenund auch fur die Menschheit wichtigen Fragen, sind wohlkaum vergleichbar mit denen des Mittelalters, dennochgingen auch damais, insbesondere fur den politischen Be-reich, impulse und Entscheidungen fur ganz Europa aus.Dies wunsche ich Ihnen auch fur Ihre Tagung; môgen dieErkenntnisse Ihrer Forschung und der Austausch dieser er-kenntnisse Wissenschaft und Technik weiterbringen zumWohle der Menschen in einer gesicherten und fried] ichenZukunft.
Einige Daten zu unserer Stadt.
Sie ist durch ihr Alter (1324 Stadtrechte) und die Land-schaft, aber auch durch die Aktivitât der letzten
Jahre, geprâgt. Vor 20 Jahren entstand sie aus den StadtenNieder- und Oberlahnstein. Der grofle, durch kilometer-lange Wege erschlossene Stadtwald liegt im NaturparkNassau. Neben dem Naturdenkmal 'Ruppertsklamm1 unddem durch den Stadtwald fiihrende Rômerwall 'Limes'gibt es fiir Burger und Besucher viele Freizeit-Einrichtungen und Grûnanlagen mit aus gebauten Rad- undWanderwegen an Rhein und Lahn.
Neben einigen Industriebetrieben und Gewerbebetriebenverschiedenster Branchen hat Lahnstein eine Vielzahl ga-stronomischer Betriebe, ein Kurgebiet mit Thermalbad,Tenniscenter, mehrere Sporthallen, ein Hallen- und Frei-bad und die Môglichkeit, in fast alien Sportarten Sport zubetreiben.
An historischen Bauten seien nur einige erwàhnt wie: BurgLahneck, Hexenturn, MartinsschloB, Salhof und Wirts-haus an der Lahn, Johanneskloster und die Jakobus-Kapelle.
Es lohnt sich, unsere Stadt und die reizvolle Umgebungdurch einen kurzen oder langeren Aufenthalt zu erkunden.
Der Veranstaltung wunsche ich viel Erfolg.
Proc. Ninth ESA/PAC Symposium on 'European Rocket and Balloon Programmes and Related Research', Lahnstein, FRG, 3—7April 1989(ESA SP-291, June 1989)

XXIl)
Members of the Programme Committee

SESSION 1NATIONAL REPORTS
Chairmen:M. OtterbeinU. von Zahn
SWISS SCIENTIFIC BALLOON AND SOUNDING ROCKET EXPERIMENTS 1987-1989
D. HUGUENIN
Observatoire de Ge.nève., Sawit:riiy, Switzerland
ABSTRACT
Swiss laboratories participate yearly in one rocket flightand four to five balloon flights, mostly in cooperation withforeign institutes. The fields covered are chemistry andcomposition of the middle atmosphere, astrophysics (sun,stars, interstellar matter) and life science. A continuationof these programmes on the base of bilateral agreementswith Belgium, France, Sweden and the U.S.A. is consid-ered.
a) C'oir.position of the middle atmosphere and lower iono-sphere.
b) Astrophysics. Galactic and extragalactic studies in theUV and submillimeter ranges. Solar constant andsismology.
c) Remote sensing of the Earth.
d) Biological experiments in space.
The following Swiss groups are participating in rocket andballoon research;
Scientificdiscipline
Key words: balloon - rocket - Switzerland
I. INTRODUCTION
Swiss space research is performed in different fields by var-ious laboratories of the cantonal universities, the FederalInstitute of Technology and the World Radiation Cen-ter. Switzerland does not have its own rocket or balloonprogramme. The laboratories and institutions can par-ticipate in the different fields of space research as partof the ESA scientific programme (including the EsrangeSpecial Project) and in bilateral or multilateral coopera-tion with other countries. Cooperation with the US Na-tional Aeronautics and Space Administration (NASA), theFrench Centre National d'Etudes Spatiales (CNES) andthe Swedish Space Corporation is acknowledged.
The experiments for soundings with rockets and balloons,as well as related research in Switzerland cover the follow-ing main areas:
UB/PIPhysikalisches Insti tutUniversity of BernCH-3012'Bern
UB/IAPInstitute ofApplied PhysicsUniversity of BernCH-3012'Bern
GOGeneva ObservatoryCH-1290 Sauverny '
FIT/IPLFederal Institute ofTechnology (ETH)Infrared PhysicsLaboratoryCH-8092 Zurich
FIT/LETFederal Inst i tute ofTechnology (ETH)Laboratorium fiirBiotechnologieCH-8093 Zurich
WRCWorld Radiation Cent. Dr. C. FrôhlichPhysikalisch-Meteorolo-gisches ObservatoriumCH-7260 Dorf
Prof. P. EberhardtDr. E. Kopp
Prof. E. SchandaDr. N. Kampfer
Prof. M. GolayDr. D. Huguenin
Prof. F. KneubûhlDr. C. Degiacomi
Dr. A. Cogoli
a,b.c
PIW:. Ninth ESAIPAC Symposium on 'European Rocket and Balloon Programmes and Related Research', Lahnslein, FRG, 3—7April 1989(ESASP-291, June 1989)
D. HUGUENIN
The field of research is supported by the Swiss NationalScience Foundation.
2. ROCKETS
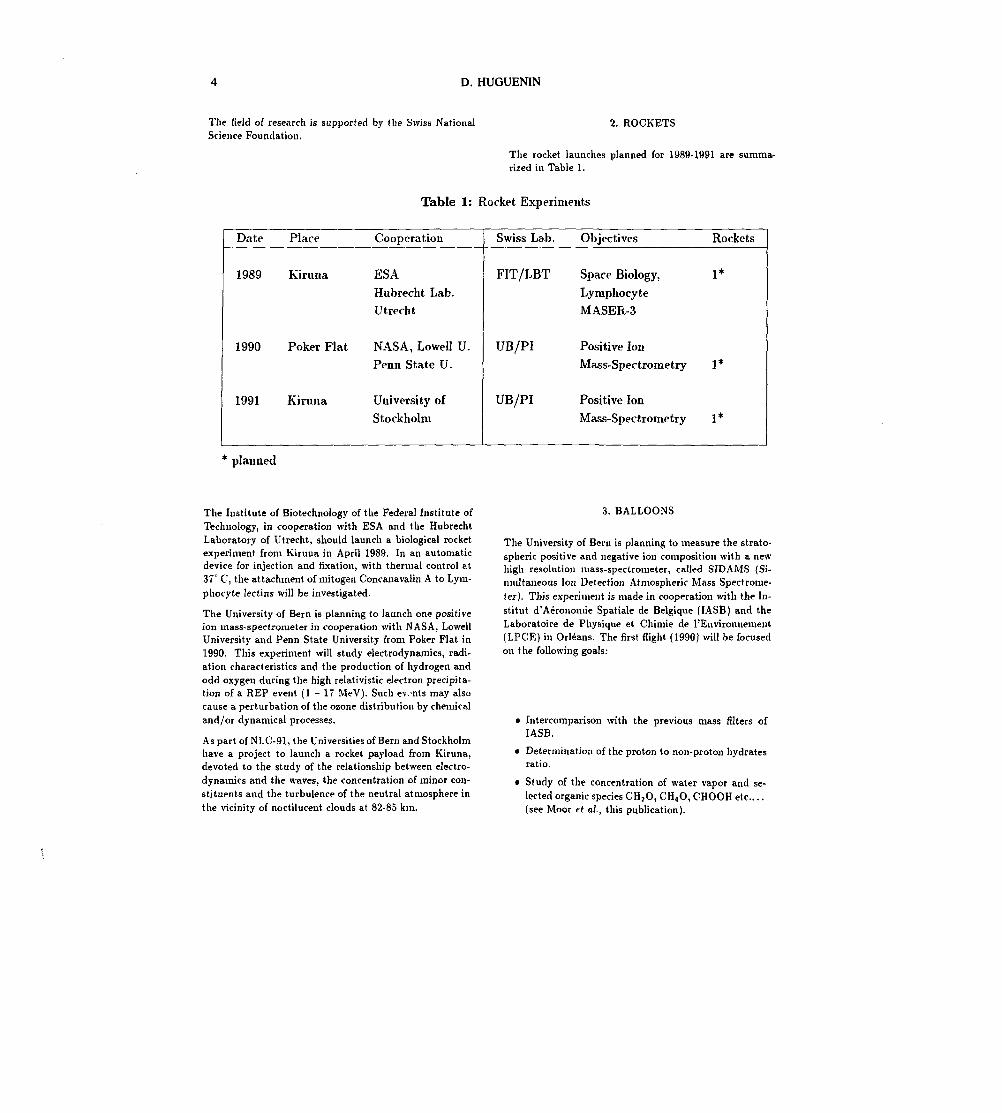
The rocket launches planned for 1989-1991 are summa-rized in Table 1.
Table 1: Rocket Experiments
Date Place
1989 Kiruna
1990 Poker Flat
1991 Kiruna
Cooperation
ESAHubrecht Lab.Utrecht
NASA, Lowell U.Penn State U.
University ofStockholm
Swiss Lab.
FIT/LET
UB/PI
UB/PI
Objectives
Space Biology,LymphocyteMASER-3
Positive IonMass-Spectrometry
Positive IonMass-Spectrometry
Rockets
1*
1*
1*
* planned
The Institute of Biotechnology of the Federal Institute ofTechnology, in cooperation with ESA and the HubrechtLaboratory of Utrecht, should launch a biological rocketexperiment from Kiruna in April 1989. In an automaticdevice for injection and fixation, with thermal control at37° C1 the attachment of mitogen Concanavalin A to Lym-phocyte lectins will be investigated.
The University of Bern is planning to launch one positiveion mass-spectrometer in cooperation with NASA, LowellUniversity and Penn State University from Poker Flat in1990. This experiment will study electrodynamics, radi-ation characteristics and the production of hydrogen andodd oxygen during the high relativistic electron precipita-tion of a REP event (1-17 MeV). Such events may alsocause a perturbation of the ozone distribution by chemicaland/or dynamical processes.
As part of NLC-91, the Universities of Bern and Stockholmhave a project to launch a rocket payload from Kiruna,devoted to the study of the relationship between electro-dynamics and the waves, the concentration of minor con-stituents and the turbulence of the neutral atmosphere inthe vicinity of noctilucent clouds at 82-85 km.
3. BALLOONS
The University of Bern is planning to measure the strato-spheric positive and negative ion composition with a newhigh resolution mass-spectrometer, called SIDAMS (Si-multaneous Ion Detection Atmospheric Mass Spectrome-ter). This experiment is made in cooperation with the In-stitut d'Aéronomie Spatiale de Belgique (IASB) and théLaboratoire de Physique et Chimie de l'Environnement(LPCE) in Orléans. The first flight (1990) will be focusedon the following goals:
• Intel-comparison with the previous mass filters ofIASB.
• Determination of the proton to non-proton hydratesratio.
• Study of the concentration of water vapor and se-lected organic species CH2O, CH4O, CHOOH etc....(see Moor et al, this publication).
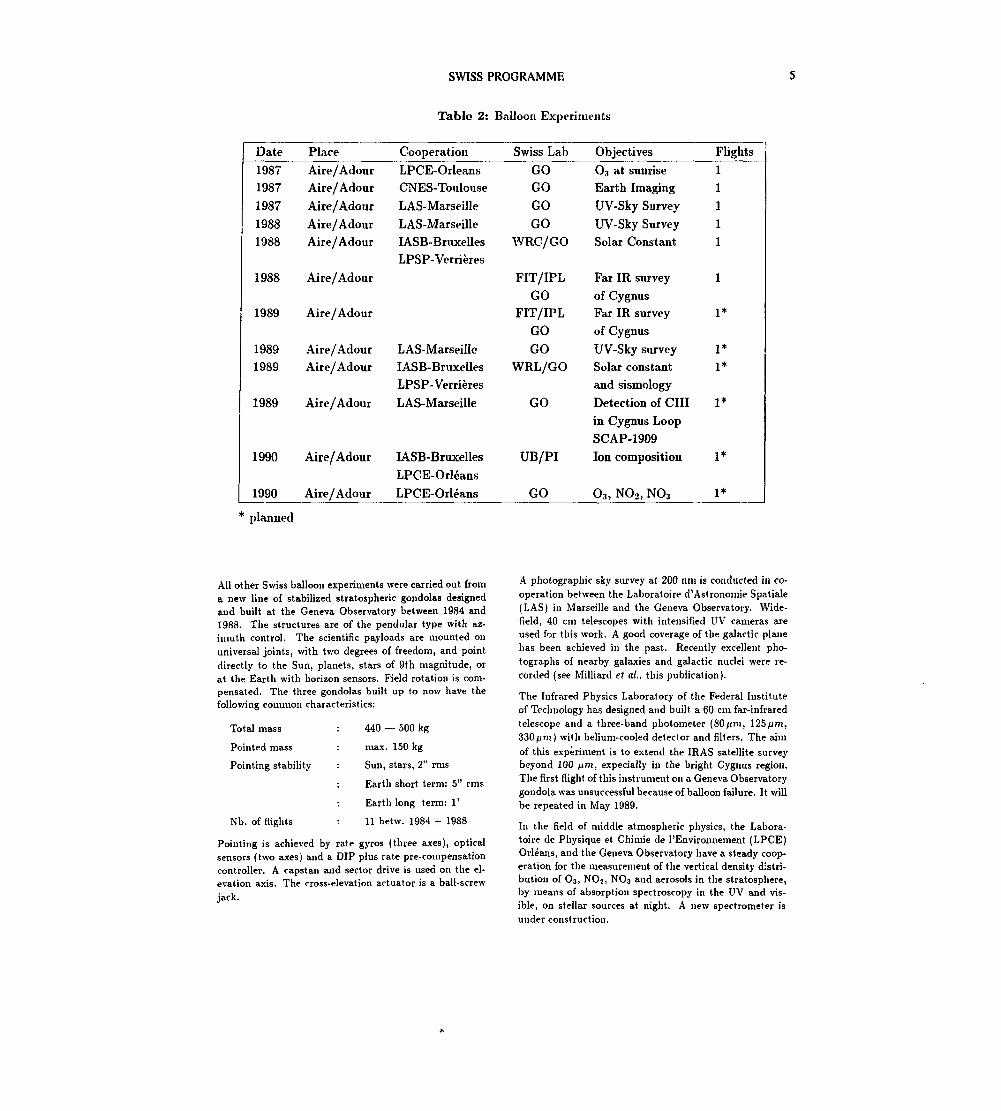
SWISS PROGRAMME
Table 2: Balloon Experiments
Date19871987198719881988
1988
1989
19891989
1989
1990
1990
PlaceAire/AdourAire/AdourAire/AdourAire/AdourAire/Adour
Aire/Adour
Aire/Adour
Aire/AdourAire/Adour
Aire/Adour
Aire/Adour
Aire/Adour
CooperationLPCE-OrleansCNES-ToulouseLAS-MarseilleLAS-MarseilleIASB-BruxellesLPSP-Verrieres
LAS-MarseillelASB-BruxellesLPSP-VerrièresLAS-Marseille
lASB-BruxellesLPCE-OrléansLPCE-Orleans
Swiss LabGOGOGOGO
WRC/GO
FIT/IPLGO
FIT/IPLGOGO
WRL/GO
GO
UB/PI
GO
ObjectivesO3 at sunriseEarth ImagingUV-Sky SurveyUV-Sky SurveySolar Constant
Far IR surveyof CygnusFar IR surveyof CygnusUV-Sky surveySolar constantand sismologyDetection of CIIIin Cygnus LoopSCAP-1909Ion composition
O3, NO2, NO3
Flights11111
1
1*
1*1*
1*
1*
1*
* planned
All other Swiss balloon experiments were carried out froma new line of stabilized stratospheric gondolas designedand built at the Geneva Observatory between 1984 and1988. The structures are of the pendular type with az-imuth control. The scientific payloads are mounted onuniversal joints, with two degrees of freedom, and pointdirectly to the Sun, planets, stars of 9th magnitude, orat the Earth with horizon sensors. Field rotation is com-pensated. The three gondolas built up to now have thefollowing common characteristics:
Total mass
Pointed mass
Pointing stability
Nb. of flights
440 — 500 kg
max. 150 kg
Sun, stars, 2" rms
Earth short term: 5" rms
Earth long term: 1"
11 betw. 1984 + 1988
Pointing is achieved by rate gyros (three axes), opticalsensors (two axes) and a DIP plus rate pre-compensationcontroller. A capstan and sector drive is used on the el-evation axis. The cross-elevation actuator is a ball-screwjack.
A photographic sky survey at 200 nm is conducted in co-operation between the Laboratoire d'Astronomie Spatiale(LAS) in Marseille and the Geneva Observatory. Wide-field, 40 cm telescopes with intensified UV cameras areused for this work. A good coverage of the galactic planehas been achieved in the past. Recently excellent pho-tographs of nearby galaxies and galactic nuclei were re-corded (see Milliard et al., this publication).
The Infrared Physics Laboratory of the Federal Instituteof Technology has designed and built a 60 cm far-infraredtelescope and a three-band photometer (80/(TU, 125JUT?!,33OfJm) with helium-cooled detector and fillers. The aimof this experiment is to extend the IRAS satellite surveybeyond 100 fim, expecially in the bright C'ygnus region.The first flight of this instrument on a Geneva Observatorygondola was unsuccessful because of balloon failure. It willbe repeated in May 1989.
In the field of middle atmospheric physics, the Labora-toire de Physique et Chimie de l'Environnement (LPCE)Orléans, and the Geneva Observatory have a steady coop-eration for the measurement of the vertical density distri-bution of Os, NOj, NOa and aerosols in the stratosphere,by means of absorption spectroscopy in the UV and vis-ible, on stellar sources at night. A new spectrometer isunder construction.

D. HUGUENIN
The Geneva Observatory, upon request of the CNES Tou-louse, has designed a stabilized gondola for terrestrial ob-servations. The purpose of this work was to demonstratethe possibility of simulating the observational conditionsof push-broom Earth sensors mounted on satellites. TheEarth- pointing payload is stabilized on the local verti-cal by two pairs of sky radiance sensors. Long-term driftis removed by inclinometers. A pointing stability of a fewarc-seconds can be reached by this method. The first flighttook place in 1987.
The World Radiation Center in Davos has flown one Bal-loon experiment in 1988 in cooperation with the Institutd'Aéronomie Spatiale de Belgique (IASB) and thé Labo-ratoire de Physique Stellaire et Planétaire (LPSP) in Ver-rières, France, on a Geneva Observatory gondola. TheSwiss contribution to this payload was active cavity so-lar radiometers and photometers for the determination ofthe solar constant and a part of the IPHIR French-Swissheliosismology experiment presently flying on the SovietPHOBOS probes. The next flight is scheduled for 1990.
The Institute of Applied Physic', of the University of Bernis engaged in the development of new microwaves soundersfor the measurement of atmospheric O3. CLO, H2O in ajoint programme with the Max Planck Insti tut fur Aerono-mie, Lindau and the University of Bremen. Participationin rocket or aircraft campaigns will resume next year.
THE FRENCH BALLOON PROGRANWE
AND RELATED SPACE RESEARCH
The balloon is a space vehicle which makes itpossible to carry within the terrestrialenvironment or high above the dense layers of theatmosphere a variety of scientific instruments. Ithas played for more than 20 years a very specificand original part within space research. This isthe reason why CNES has maintained and developed avery active balloon programme for both French andforeign users.
Medium weight paylpad open stratosphericballoons : me disciplines concerned are aeronomy,astronomy, atmospheric dynamics. The balloons havea volume of 35 000 to 330 000 m3 for 50 to 500 Kgpayloads flying at altitudes varying between 30 to40 Km. These balloons can be equipped with asystem allowing vertical excursions of theballoon. Launches take place from France, at highlatitudes or from the Southern Hemisphere.
1. THE PROGRAMME COMPONENTS
The CNES balloon programme is based on :
- a Balloon Division located in the Toulouse SpaceCenter and integrated by 40 people. They haveacquired a unique competence in Europe coveringall aspects of ballooning activities :laboratory for envelope materials, balloonstructure and shape calculations, flightsimulation, telemetry, telecommand - preciselocation - data collection equipment,technological sensors, operational launchingfacilities and teams...
- an industry specialized in balloon manufactu-ring : ZODIAC - ESPACE working in close coope-ration with CNES,
- a community of scientific users coming from abouttwenty groups form national institutes (CNRS,universities) and foreign users (FRG,Switzerland, United Kingdom, USA, Japan, Italy,Spain).
2. THE MEANS DEVELOPED BY CNES
2.1 Balloons
In order to meet the request expressed byscientists, CNES flies different type ofballoons presenting specific flightcharacteristics.
flights are essentially intended for astronomyexperiments and take place from Trapani in Sicilyor in the Southern Hemisphere (Australia). Thevolume of balloons ranges from 400 000 to800 000 m3, and sometimes 1 million m3, forpayloads of up to 2.2 tons at 40 Km altitude forflights of about 24 hours.
Long-duration balloons : These balloons areessentially used for atmospheric physics anddynamics experiments as well as for the detectionof crustal magnetic anomalies. They are eitherpressurized or infrared hot air balloons(mongolfières). Small pressurized balloons aremore often used for low-altitude flights and smallpayloads (a few Kg) whereas hot-air balloons flyat about 30 Km with 50 Kg payloads for periods ofa few weeks.
Planetary exploration balloon : CNES teams aredeveloping a new type of bai loon adapted toplanetary exploration in view of the future SovietMars 94 mission.
2.2 Launching ranges
The launching ranges used by CUES are eitherpermanent or occasional.
In France, CNES owns two ranges : Aire-sur-TAdourfor spring and autumn campaigns and Gap forsummer campaigns of medium-payload openstratospheric balloons.
Proc. Ninth ESA/PAC Symposium on 'European Rocket and Balloon Programmes and Related Research', Lahnstein, FRG, 3—7April 1989
(ESA. SP-291, June 1989)
I. SADOURNY
For heavy payload stratospheric balloons andlonger flights, the Italian Trapani range inSicily is used for transmediterranean flights incooperation with Italy and Spain.
Balloon campaigns are also carried out from nonpermanent ranges in order to meet the requirementsexpressed by scientists : in the SouthernHemisphere from South Africa and Australia and athigh latitudes from ESRANGE.
3. RESEARCH PROGRAMMES
3.1 Scientific disciplines
Balloon experiments are performed in the follo-wing research fields, the first two disciplinesbeing by far the most important in terms of bothscientists involved and programmes.
(a) Astronomy and Solar Physics
. Solar Physics (UV)
. Hot star populations (UV)
. Dense objects/super novae ( )
. Star-formation regions and interstellar medium(IR and submm)
. Cosmology and extragalactic astronomy (IR andsubmm)
In astronomy, programmes are very much dependenton existing satellites.
(b) Atmospheric sciences
Programmes are related to a different use ofballoons, considered either as tracers ofatmospheric motions or as vehicles for in situmeasurements.. Atmospheric dynamics(turbulence, gravity waves, vertical transfers,large-scale circulation)
. Physics and chemistry(abundance and distribution of mean constituentswater vapor, sulfur, ozone...)
. Radiative budget(model and satellite data validation)
(c) Radiobiology
(effects of cosmics radiation on livingorganisms in the presence of gravity)
(d) Magnetospheric research
(Detection of crustal magnetic anomalies).
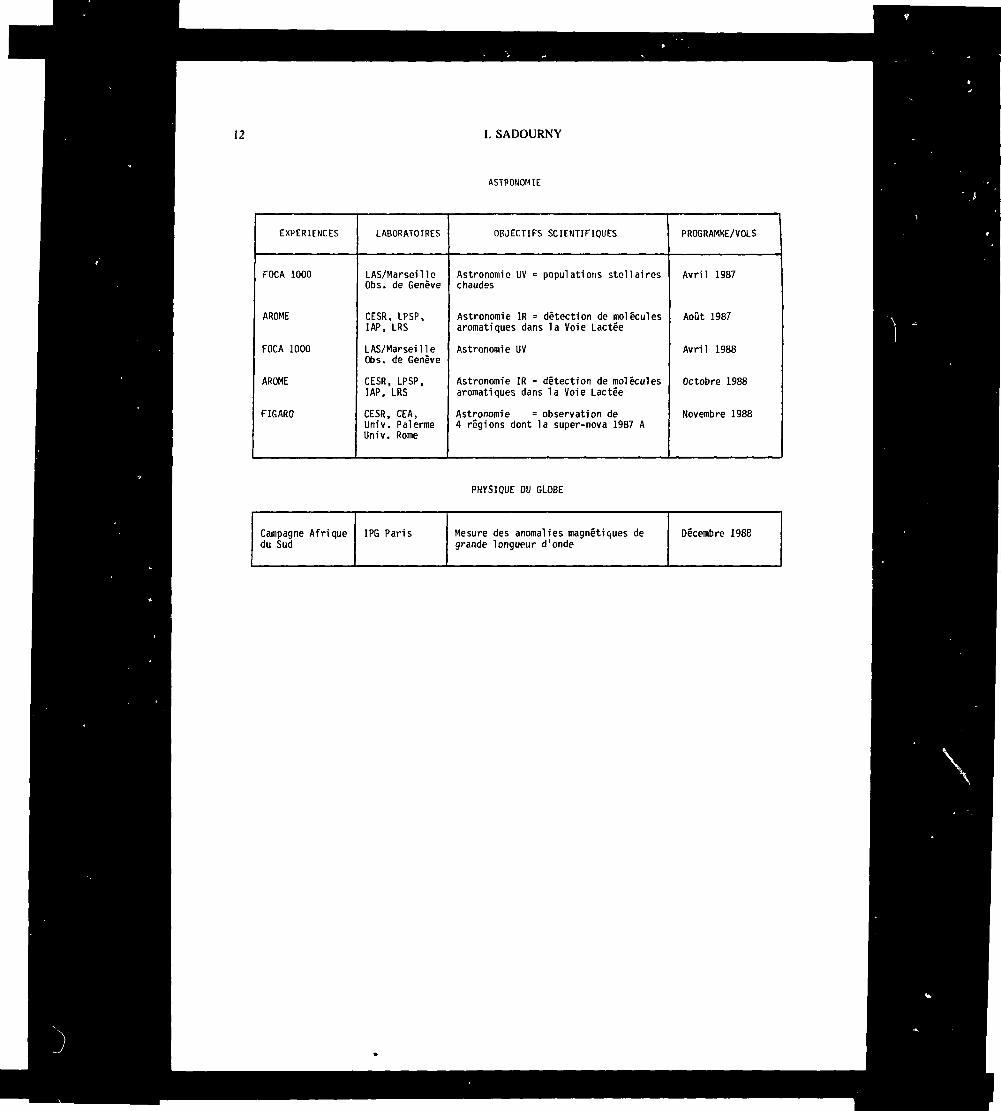
3.2 Research programmes : 1987-1989
Appended to this paper is the complete list ofexperiments flown during the past two years.However, the last three campaigns performed byCNES teams should be singled out.
The Australian Campaign (October-November 1988)organized in cooperation with the Australian SpaceOffice. Its scientific objective was the study ofastronomy sources in the southern hemisphere sky,especially the super-nova 1987-A. A 400 000 m3balloon carrying a 1 ton IR astronomy experiment(AROME) prepared by CNRS institutes successfullyflew for 19 1/2 hours at an altitude of 38 Km. Asecond balloon of 800 000 m3, carrying a 2.2 tongamma-ray experiment in cooperation between CNRSteams and Italian institutes (Figaro) also flewsuccessfully for more than 23 1/2 hours at analtitude of 38 Km.
The long duration balloons campaign (November 1988)involved the launching in tne Southern Hemisphereof six 36 000 m3 infrared hot-air balloons carryingpayloads of 40 and 80 Kg up into the middleatmosphere.
The scientific objectives of these flights werestratospheric water vapor measurements, one of themost important elements in the physico-chemicalequilibrium of the lower stratosphere, and thedetection of large-scale crustal magnetic anomaliesover the Atlantic and Pacific Oceans. Bothinstruments operated nominally.
All six flights were successfull, with a meanlifetime of 4 weeks. Two balloons circled the globeonce and one of them did so twice in a flightlasting 53 days.
Both the technological and the scientificobjectives of the campaign were reached beyondexpectations.
THE TECHNOPS CAMPAIGN (January 1989)
This mainly technological campaign was carried outin January 1989 from ESRANGE (SWEDEN) with the aimof testing at very low temperatures (-8O0C) the newenvelope material used for manufacturing theballoons. Taking advantage of the planned flights,a certain number of scientific instruments wereflown for the study of the atmospheric ozone layerdepletion over polar regions, by institutes fromFrance, Germany, USA, Japan and New Zealand.
AIi 4 balloons (35 000 to 100 000 m3) weresuccessfully launched and encountered temperaturesas low as -86,60C. All scientific instrumentsoperated nominally providing extremely interestingdata on the decrease of ozone between 20 an 25 Kmaltitude.
This achievement will make it possible to organisein the near future (winter of 1990) a newinternational campaign for the ozone study.
4. FUTURE PROGRAMMES
A seminar on medium and long-term balloon researchprogrammes was held in October 1.987 which made itpossible to assess the interest of scientists inballoon flights. The great number of scientificallywell motivated projects that came out of thisseminar permits the prediction that balloon
FRENCH PROGRAMME
experimentation will continue not only to bemaintained at its present level but will evenincrease. Two projects are singled out below thatrepresent examples of heavy balloon projects.
PRONAOS
This is an IR and submillimeter astronomy programmeset up around a 2 meter telescope which will allowobservations in a region of the spectrum that isalmost unexplored because of technologicaldifficulties. The project has now reached itsfinal phase with a first flight planned for 1990and a second flight as early as 1991. The totalmass of gondola and payload will be about Z tons.The observation programme is being prepared by ascientific consortium of 10 CNRS institutes.
STRATEOLE
This programme is intended to study the mediumand large-scale chemistry and dynamics of thestratosphere with two objectives :- the Southern Hemisphere quasi 2 D dynamics ofthe winter vortex and associated distribution ofimportant chemical constituents,
- data collection of sufficient time and spaceresolutions to be analyzed by ECMWF (EuropeanCenter for Medium term weather Forecasts).
This experiment requires a considerable effortsince it involves the launching of about 100 long-duration balloons in the Southern Hemisphere.Cooperation with various partners is beingenvisaged. Data will be correlated to thoseobtained from the NASA UARS satellite (1992).
The Mars 94 Mission Balloon
In the frame of the Soviet "Mars 94" planetarymission, CNES is studying the concept of a newballoon for the study of both the soil andatmosphere of Mars. The lifetime of the balloonwill be about 10 days for a trajectory of severalthousand Kilometers and daily landings on theplanet.Data will be transmitted through the sovietorbiter and the NASA Mars observer probe.
In addition to these future big programmes,scientists have expressed a strong desire forregular flights of improved and new instruments inall disciplines as well as for the possibilityoffered by balloons of flying at very short noticeto meet urgent and unexpected needs.
Balloon programmes are open to internationalcooperation.

10 I. SADOURNY
PROGRAMME FRANÇAIS EN BALLONS 1987 - 1989
AERONOMIE ET STRATOSPHERE
EXPERIENCES
Ozone et oxydesd ' azote(International)
Ozone strato.
KR85
Hygromètre
AMETHYSTE
Absorb ti onUV/Visible
RADIBAL
PIRAT
Spectre Universeld'Ondes
MIRVENT
Spectro.UV/Visible
LABORATOIRES
SA/CNRSU. NAGOYAPEL/DSIRU. HOUSTONU. DENVER
SA/CNRS
CFR/CEA
LMD/CNRS
LMD/CNRS
LPCE/CNRSObs. Genève
LOA/CNRS
LOA/CNRS
SA/CNRS
SA/CNRS
SA/CNRS
OBJECTIFS SCIENTIFIQUES
Equilibre chimique de l'ozone dansla haute stratosphère (40 Km)
Transport vertical dans la stratos-phère ; étude d'un tracement radioactif
Profils verticaux d'humidité dans latroposphère et la stratosphère
Profils verticaux dans la stratosphèrevariabilité à méso-échelle dansl'Hémisphère Sud
Profils verticaux de composésminoritaires stratosphëriques
Profils verticaux des aérosolsstratosphëriques et polarimètre
Etude de l'intensité et du taux depolarisation du rayonnement solairediffusé
Détermination suivant l'altitude duspectre universel des ondes atmosphé-riques et de la turbulence(U', V, W, T1)
Variations spatio-temporelles deU, V, W et T à méso-échelle
Profils verticaux de composésmi non' tai res stratosphëri ques
PROGRAMME/VOLS
BSO - 17/09/87
BSO - 18/06/88
BSO - 1/10/8728/10/87
BSO - 17/10/8723/10/872/06/887/06/889/06/88
MIR - 13/11/8820/11/88
BSO - 1/10/87+ 2 vols enprintemps 87
BSO - 30/10/8730/06/88
BSO - 07/88
BSO -
MIR - /87
BSO - Automne 88

FRENCH PROGRAMME 11
PROGRAMME FRANÇAIS EN BALLONS 1987 - 1989
AERONOMIE ET STRATOSPHERE
EXPERIENCES
Ab sorb ti on IRBOMEM
Ozonomètre
CHEOPS II(International)
H
TECHNOPS(International)
LABORATOIRES
LPMA/CNRS
LPCE/CNRS
SA/CRNS
LOA/CNRS
SA/CNRSU. NAGOYAPEL/DSIRU. HOUSTONU. WYOMINGU. DENVER
OBJECTIFS SCIENTIFIQUES
Profils verticaux de composésminoritaires stratosphériques
Profils verticaux de 03 dans lahaute stratosphère avec une trèsbonne précision
Chimie de l'Ozone Polaire
Ozonomètre à Chimi luminescenceProfils verticaux
PoI ari mètre et profils des aérosolsstratosphëriques(+ expériences sol du SA)
Profils d'ozone, oxydes d'azote,acide nitrique et aérosols
PROGRAMME/VOLS
BSO - Automne 88
BSO - 4/05/8829/09/88
BSO - 29/01/88
BSO - 28/01/88
BSO - 23/01/89
12 I. SADOURNY
ASTRONOMIE
EXPERIENCES
FOCA 1000
AROME
FOCA 1000
AROME
FIGARO
LABORATOIRES
LAS/MarseilleObs. de Genève
CESR, LPSP,IAP, LRS
LAS/MarseilleObs. de Genève
CESR, LPSP,IAP, LRS
CESR, CEA,Univ. Pal erneUni v. Rome
OBJECTIFS SCIENTIFIQUES
Astronomie UV = populations stellaireschaudes
Astronomie IR = détection de moléculesaromatiques dans la Voie Lactée
Astronomie UV
Astronomie IR = détection de moléculesaromatiques dans la Voie Lactée
Astronomie = observation de4 régions dont la super-nova 1987 A
PROGRAMME/VOLS
Avril 1987
Août 1987
Avril 1988
Octobre 1988
Novembre 1988
PHYSIQUE DU GLOBE
Campagne Afriquedu Sud
IPG Paris Mesure des anomalies magnétiques degrande longueur d'onde
Décembre 1986

13
THE NORWEGIAN BALLOON AND SOUNDING ROCKETPROGRAMME 1989-1992
B.N. Andersen and A. Gundersen
Norwegian Space CentreP.O. Box 85, Smestad,
N-0309 Oslo 3
ABSTRACT
The Norwegian sounding rocket and balloon programme
comprises mainly of launches from And0ya Rocket Range forinvestigations in ionospheric and magnetospheric processes.These investigations are supplemented by a wide range ofground based support instrumentation.
In the near future tests with recovery of payloads will be carriedout at And0ya, partly as preparation for microgravityexperiments.
The overall program for the period 1989-1992 will be reviewed.
The turnaround time for satellite investigations is so long that theeducational aspect is reduced as compared to the Andoya related
activities. In addition the costs for satellite experiments isgenerally much higher than for sounding rockets. The use ofsounding rocket experiments is a cost effective means to gainessential experience before embarking on larger satellite
experiments. Furthermore several fundamental aspects ofmagnetospheric and atmospheric physics cannot be studied withsatellite experiments alone.
2. THE SOUNDING ROCKET PROGRAMME
Keywords: Sounding Rockets, Balloons, Ionosphere,Magnetosphere, Recovery.
1. INTRODUCTION
The Norwegian space science programme has historically beenfounded on data collected by sounding rockets and balloonslaunched from And0ya Rocket Range. With the expanding in-ternational cooperation and Norways full membership in ESA
from 1987 the basis for space science has grown to threeelements:
- Projects within the ESA science programme.
- Bilateral cooperation on satellite investigations.- Sounding rockets and balloons programme.
The increased activity in the satellite investigations is achievedby an increase in funding in connection with the ESA member-ship, thus the emphasis on the sounding rocket and balloonprogramme will not be decreased due to the increased satelliteactivity. The activity at And0ya is considered a necessarysupplement to the ESA and bilateral programmes, bothscientifically and programatically.
The scientific investigations within the Norwegian soundingrocket programme may be grouped in three major areas:
- Physics of the ionosphere and magnetosphere.- Active modification experiments of the polar ionosphere.- Processes and dynamics of the high altitude neutral
atmosphere.
All the rocket activity from And0ya is carried out in close
collaboration with the extensive network of ground basedsupport instrumentation situated in northern Scandinavia and onSvalbard. These facilities include the EISCAT (European Inco-herent SCATter facilities), PRE (Partial Reflection Experiment),several LIDAR observatories, optical photometers and a SOUSYVHF radar.
NEED II (Non-Maxwellian Electron EnergyDistributions)
Project scientist:Type of rocket:Launch site/date:
B N Méehlum, NDRE, NorwayBlack Brant VCAndoya, Nov 1989-Jan 1990
Proc. Ninth ESAIPAC Symposium on 'European Rocket anil Balloon Programmes and Related Research '. Lahnstein, FKG. 3—7 April 1989
fESA SP-™1 Juno 1989)
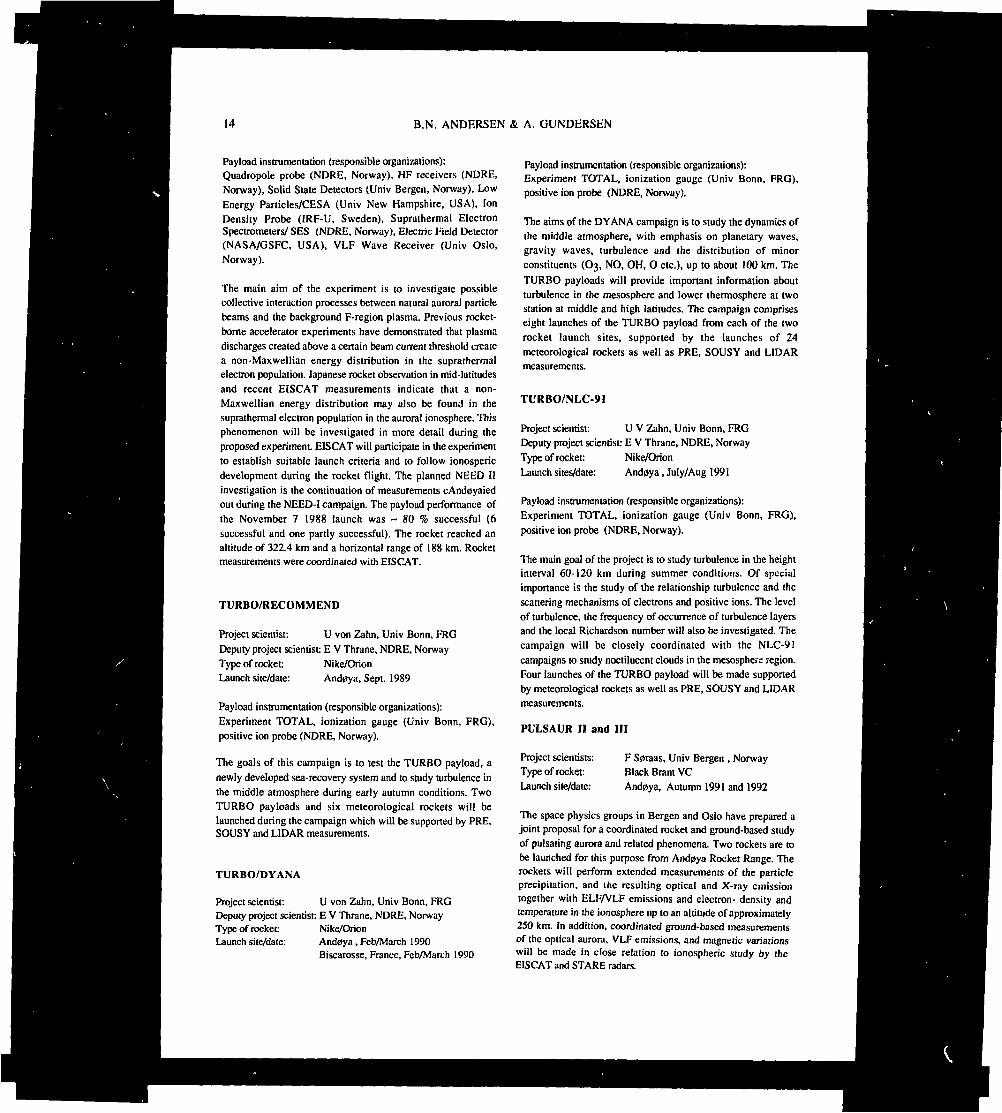
14 B.N. ANDERSEN & A. GUNDERSEN
Payload instrumentation (responsible organizations):Quadropole probe (NDRE, Norway), HF receivers (NDRE,Norway), Solid State Detectors (Univ Bergen, Norway), LowEnergy Pariicles/CESA (Univ New Hampshire, USA), IonDensity Probe (IRF-U, Sweden), Suprathermal ElectronSpectrometers/ SES (NDRE, Norway), EJectric Field Detector(NASA/GSFC, USA), VLF Wave Receiver (Univ Oslo,Norway).
The main aim of the experiment is to investigate possiblecollective interaction processes between natural auroral particlebeams and the background F-region plasma. Previous rocket-borne accelerator experiments have demonstrated that plasmadischarges created above a certain beam current threshold createa non-Maxwellian energy distribution in the supratherrnalelectron population. Japanese rocket observation in mid-latitudesand recent EISCAT measurements indicate that a non-Maxwellian energy distribution may also be found in thesuprathermal electron population in the auroral ionosphere. Thisphenomenon will be investigated in more detail during theproposed experiment. EISCAT will participate in the experimentto establish suitable launch criteria and to follow ionospericdevelopment during the rocket flight. The planned NEED IIinvestigation is the continuation of measurements cAndoyaiedout during the NEED-I campaign. The payload performance ofthe November 7 1988 launch was - 80 % successful (6successful and one partly successful). The rocket reached analtitude of 322.4 km and a horizontal range of 188 km. Rocketmeasurements were coordinated with EISCAT.
TURBO/RECOMMEND
Project scientist: U von Zahn, Univ Bonn, FRGDeputy project scientist: E V Thrane, NDRE, Norway-Type of rocket: Nike/OrionLaunch site/date: And0ya, Sept. 1989
Payload instrumentation (responsible organizations):Experiment TOTAL, ionization gauge (Univ Bonn, FRG),positive ion probe (NDRE, Norway).
The goals of this campaign is to test the TURBO payload, anewly developed sea-recovery system and to study turbulence inthe middle atmosphere during early autumn conditions. TwoTURBO payloads and six meteorological rockets will belaunched during the campaign which will be supported by PRE,SOUSY and LIDAR measurements.
TURBO/DYANA
Project scientist: U von Zahn, Univ Bonn, FRGDeputy project scientist: E V Thrane, NDRE, NorwayType of rocket: Nike/OrionLaunch site/date: And0ya , Feb/March 1990
Biscarosse, France, Feb/March 1990
Payload instrumentation (responsible organizations):Experiment TOTAL, ionization gauge (Univ Bonn, FRG),positive ion probe (NDRE, Norway).
The aims of the DYANA campaign is to study the dynamics ofthe middle atmosphere, with emphasis on planetary waves,gravity waves, turbulence and the distribution of minorconstituents (03, NO, OH, O etc.), up to about 100 km. The
TURBO payloads will provide important information aboutturbulence in the mésosphère and lower thermosphère at twostation at middle and high latitudes. The campaign compriseseight launches of the TURBO payload from each of the tworocket launch sites, supported by the launches of 24meteorological rockets as well as PRE, SOUSY and LIDARmeasurements.
TURBO/NLC-91
Project scientist: U V Zahn, Univ Bonn, FRGDeputy project scientist: E V Thrane, NDRE, NorwayType of rocket: Nike/OrionLaunch sites/date: Andoya, July/Aug 1991
Payload instrumentation (responsible organizations):Experiment TOTAL, ionization gauge (Univ Bonn, FRG),positive ion probe (NDRE, Norway).
The main goal of the project is to study turbulence in the heightinterval 60-120 km during summer conditions. Of specialimponance is the study of the relationship turbulence and thescattering mechanisms of electrons and positive ions. The levelof turbulence, the frequency of occurrence of turbulence layersand the local Richardson number will also be investigated. Thecampaign will be closely coordinated with the NLC-91campaigns to study noctilucent clouds in the mésosphère region.Four launches of the TURBO payload will be made supportedby meteorological rockets as well as PRE, SOUSY and LIDARmeasurements.
PULSAUR II and III
Project scientists:Type of rocket:Launch site/date:
F S0raas, Univ Bergen , NorwayBlack Brant VCAndpya, Autumn 1991 and 1992
The space physics groups in Bergen and Oslo have prepared ajoint proposal for a coordinated rocket and ground-based studyof pulsating aurora and related phenomena. Two rockets are tobe launched for this purpose from And0ya Rocket Range. Therockets will perform extended measurements of the particleprecipitation, and the resulting optical and X-ray emissiontogether with ELF/VLF emissions and electron- density andtemperature in the ionosphere up to an altitude of approximately250 km. In addition, coordinated ground-based measurementsof the optical aurora, VLF emissions, and magnetic variationswill be made in close relation to ionospheric study by fheEISCAT and STARE radars.
NORWEGIAN PROGRAMME 15
3. THE BALLOON PROGRAMME
.'(-AIE Il (X-Ray Auroral Imager Experiment)
Project scientist: J Stadsnes, Univ Bergen, Norway
Balloon volume: 68000 nr*Launch site/date: TBDInstrumentation: X-ray imager, X-ray spectrometer,
Univ Bergen, NorwayThe main purpose of this project is to study the small-scalespatial distribution of the energetic electron precipitation byusing an imaging X-ray instrument. This instrument is a"pinhole" camera with a Xenon filled pressurized multiwireproportional counter as sensor unit. Referring to the altitude ofthe X-ray producing layer at approximately 100 km theinstrument will have a field of 80x80 km. This project will becoordinated with EISCAT and other ground-based auroralmeasurements.
The X-ray imager has been developed at the University ofBergen, Norway and is part of the plan to produce two-dimensional imaging X-ray detectors for ESA and NASAsatellite investigations.
4. GROUND BASED STUDIES
The network of ground-based instrumentation is either usedindependently is scientific investigations or is utilized as supportfor rocket and balloon campaigns. This support consists of bothdetermining the launch criteria and to measure supplementaryparameters during flight. Typical examples are the use ofEISCAT in connection with the NEED campaigns and theSOUSY, LIDAR and PRE facilities during the different TURBOactivities.
EISCAT
The incoherent scattering techniques is generally the superiorground-based method for studies of the ionosphere.TheEISCAT UHF and VHF radars have proven to be very efficienttools in the overall and detailed study of the ionosphere.
Through the Norwegian membership in EISCAT, a uniqueopportunity is offered for exploration of the polar ionosphere.Today EISCAT plays a vital role in space physics at the Univer-sity of Troms0, both separately and in connection with balloon,satellite and rocket experiments. It is expected that EISCAT willremain a key facility for ionospheric research in northernScandinavia Tor the rest of this century.
Most of the current interesting projects will be continuedthroughout the period to 1992. The cooperation with flightinstrumentation for coordinated observing campaigns will bestrenghtened.
The VHF radar is being upgraded with a second klystron andfurther tecnical work is in progress. A chirp synthesizer will beput into operation to enable the instrument to track plasma lineswith very high temporal- and spatial resolution.
CUSP studies
In cooperation with groups from the the Geophysical Institute,University of Alaska, AFGL, USA, Geophysical Research Lab-oratory, University of Tokyo, Japan, MPAE, FRG, and theUniversities in Oslo and Troms0, Norway are engaged instudies of dayside aurora, polar cap aeronomy, and relatedphenomena. This programme will continue with measurementsfrom Ny-Alesund, Longyearbyen, Hornsund and on Bj0rn0ya.The main instrumentation consists of meridian scanningphotometers, spectrometers, auroral TV, all-sky cameras andmagnetometers. Observations are conducted mainly on acampaign basis in the period around winter solstice.
Combined electron and proton energy spectra can be used toextract information on the plasma source and plasma accelerationmechanisms associated with the actual auroral structures. Thisinformation provides the basis for discussing the relationshipwith plasma entry and electrodynamic coupling mechanisms inthe boundary layers of the dayside magnetosphere.
The investigation of magnetic pulsations and electrodynamicemissions in the polar cleft at ELF and VLF frequencies is beingextended with upgraded receiving stations. This is a col-laboration between groups at the Universities of Oslo, Norwayand Tokyo, Japan.
The EISCAT VHF system will support the cusp studies. TheVHF will provide valuable data from the long rangescorresponding to the F-layers above Svalbard. Coordinated withthe ground based observations and polar orbiting satellites theseobservations provide an important basis for the understanding ofthe electrodynamics of the polar cusp ionosphere.
Ozone Studies
The ground-based observations carried out by scientists from theUniversity of Oslo, Norway will continue in cooperation withthe satellite observations from the TIROS-IO satellite. The totalamount of ozone and the atmospheric temperature profiles arederived from the combined observations. The observations willbe extended with LIDAR measurements from New Alesund onSvalbard to gei more information on the vertical distribution ofozone. This is a cooperation with the Alfred-Wegner Institut,FRG. Further international collaboration is planned with groupsin France and FRG.
In addition the very long time series of ozone measurementsfrom Svalbard and Troms0 by the University of Troms0,Norway will be extended by further observations.

16 B.N. ANDERSEN & A. GUNDERSEN
5. CONCLUSION
Even though the Norwegian space science programme isexpanding it is still small in absolute terms. This makes theefficient use of the overall resources essential. A few selectedareas can be given high priority and thereby sufficient resourcesto ensure high quality of the science. The main area of prioritythe next years will be in the field of Solar Terrestrial Physics
with active participation in the first cornerstone, STSP, of ESA.This activity may be viewed as the natural extension of theexisting rocket and balloon programmes.
The ground-based instrumentation and the launching facilities atAnd0ya will be developed to their mutual independent benefitand to expand the activity to complement the satellite activity.
The And0ya site currently being studied as a possible launch sitefor small polar orbiting or Sun synchronous satellites. Togetherwith a tracking station situated on Svalbard such a facility wouldbe a compact unit providing an inexpensive and efficient servicefor European customers. By using a tracking station on Svalbard
it would be possible to cover a polar orbiting satellite on everyorbit with a single station.
17
THE SWEDISH SOUNDING ROCKET AND BALLOON PROGRAMME
K LUNDAHL
Swedish Space CorporationP.O. Box 4207, S-171 04 Solna, Sweden
ABSTRACT
The Swedish Sounding Rocket and Balloon
programme comprises sounding rockets and
balloon launches every year from Esrange.
The investigations relate to geophysical
disciplines, astrophysics and micro-
gravity research.
Future scientific projects using sounding
rockets and balloons are planned for
infrared observations of interstellar
medium and studies on Nitrogen and Oxygen
photochemistry and transport in the upper
atmosphere. Continued studies on auroral
electrodynamics has been proposed and a
continued investigation on the structure
and dynamics of the middle atmosphere
above the northern polar region during
summer has been discussed.
These studies will require increased
technical capabilities with respect to
payload design, rocket performance and
ground support as compared with the
current programme.
Of special interest is the Joint German-
Swedish HAXUS program for the launching
of sounding rockets up to 900 km altitude
giving 15 minutes of microgravity. A
MAXUS-test flight will take place in
December 1989 with the launch of a 3-
stage, 17 inch sounding rocket from
Esrange. The purpose is to qualify a new
guidance system and new ground based and
rocket borne TT&C equipment. The first
operational MAXUS flight will take place
late 1990 with the launch of a single
stage, 40 inch rocket based on a Castor
IV B TVC motor.
1 INTRODUCTION
The Swedish sounding rocket and balloon
programme is concentrated on four main
areas :
a) Magnetospheric and ionospheric phys-
ics, including measurements of charg-
ed particles and electric and magne-
tic fields.
b) Upper atmospheric physics and chemis-
try, including studies of the com-
position of the atmosphere at alti-
tudes of 80-150 km.
c) Astrophysics, comprising for example
studies of stars and galaxies in the
ultraviolet and infrared parts of the
spectrum.
d) Microgravity, comprising material
science, protein crystallization and
bioscience experiments.
Authority for the Swedish sounding rocket
and balloon program is the Swedish Board
Proc. Ninth ESA/PAC Symposium on 'European Kockei and Balloon Programmes and Related Research ', Lahnslein, FRG, 3—7 April 1989(ESA SP-291. June 1989)
18 K.A.L. LUNDAHL
for Space Activities. The Swedish Space
Corporation is responsible for the tech-
nical execution of the projects as well
as the operation of Esranqe.
Scientific groups participating in the
Swedish sounding rocket and balloon
programme are the following:
scientific
discipline
(see above)
IRF-K Institute for Space a
Physics, Kiruna
Box 704
S-981 27 KIRUNA
coordinated with measurements made by the
EISCAT facility.
In addition to the activities described
in this paper, it should be noted, that
Swedish scientific groups participate
within programmes of other nations.
2 ON-GOING PROJECTS
The presentation below covers launches
performed as from 1989. For additional
information see the attached Table 1 and
the Time schedule.
2.1 PIROG
MISU University of Stockholm
Department of Meteorology
The Arrhenius Laboratory
S-106 91 STOCKHOLM
The Pointed jrnf raged Observing Gondola,
the first Swedish balloon project, was
launched in 1986. Since then one PIROG
payload has been launched every year.
RIT-P Royal Institute of Tech- a
nology, Department of
Plasma Physics
S-IOO 44 STOCKHOLM
SOS Stockholm Observatory c
S-133 OO SALTSJOBADEN
IRF-U Institute for Space a
Physics, Uppsala
S-755 90 UPPSALA
RIT-M Royal Institute of Tech- d
nology,
Department of Casting of
Metals
S-IOO 44 STOCKHOLM
CUT Charniers University of d
Technology,
S-412 96 GO'TEBORG
- Department of Physical Chemistry
- Department of Inorganic Chemistry
- Department of Engineering Metals
The programme comprises several launches
every year from Esrange. Many of the
sounding rocket and balloon campaigns are
The scientific objective is to study, by
observation of far infrared emissions,
the characteristics of the diffuse,
interstellar medium and star formations.
A new second generation payload weighing
300 kg will be launched to 40 km altitude
in August-September 1989 as PIROG 4.
ESTEC participates in the project.
2.2 MASER
In the MASER programme SSC offers micro-
gravity flight services for the inter-
national microgravity community. SSC also
offers design work and manufacturing of
specific experiment modules. By using a
Black Brant IX rocket around seven minut-
es of microgravity can be provided for a
payload comprising a maximum of 230 kg
experiment module weight.
The first MASER rocket was launched on
March 19, 1987 and MASER 2 was launched
on February 29, 1988. The MASER 3 launch
is planned for April 7, 1989. The MASER
pay loads up to date have included experi-
ments within material science, bioscience
SWEDISH PROGRAMME 19
and life science.
2.3 Aurora 90
Project Aurora 90 comprises the launch of3 payloads in February-March 1990. Studi-es of Nitrogen-Oxygen production andcirculation in the atmosphere of theauroral zone will be performed.
The principal investigator is MISU. USgroups participate with experiments and
ground based observations.
2.4 COSMIC
The scientific objective of COSHIC (Coor-dinated Study of Magnetospheric Ionos-pheric Coupling) is to increase theunderstanding of acceleration processesin aurora. Participation of Swedish andforeign scientific groups is envisaged.
Due to problems with the selection oflaunch vehicle and also funding theproject has been postponed.
2.5 MAXUS
ESA has requested Interim Flight Oppor-tunities utilizing sounding rocket tech-nology to give microgravity payloads 15minutes of microgravity. A German-Swedishjoint project has been started in orderto establish such a launch service in aprogram designated MAXUS.The Castor IV BTVC by Thiokol has been selected as therocket motor.
The MAXUS launch service has been offeredto ESA, to the German and Swedish nation-al programs and to others. The market hasbeen estimated to require 2-3 launchesper year for microgravity and 1 for otherapplications. The vehicle will be idealalso for high altitude Space Scienceexperiments and for technology demonstra-tion and qualification programs.
MBB/ERNO is responsible for rocket motor
procurement and payload AIT. SSC isresponsible for rocket systems and launchoperations. Both parties will offerexperiment modules and flight tickets tothe user community.
The MAXUS launch vehicle in the launchtower at Esrange is shown in Figure 1.The first launch is scheduled for late1990.
The Castor IV B TVC motor gives the 600kg payload an apogee of 800-900 km corre-sponding to 14-15 minutes of micrograv-ity. MAXUS is equipped with a modifiedSPINRAC system where the cold gas jetsystem has been replaced by Thrust VectorControl. The guidance system operatesfrom lift-off to end of burn of thesingle stage rocket at approx 55 s or 60km altitude.
2.6 MAXUS-test
The MAXUS guidance system utilizes partof the SPINRAC system e.g. the InertialMeasurement System and the GuidanceProcessing Unit. In order to qualifySPINRAC as well as onboard and groundbased TTsC and Safety Operation systemsa MAXUS-test flight will be carried outfrom Esrange in December 1989. A Skylark12 will be launched to 460 km altitudegiving more than 9 minutes of microgravi-ty for the 2 experiment modules onboard.The experiments are flown by ESA and DLR.
3.1
PROPOSED NEW PROJECTS
MASER 4
The next payload in the MASER programmeis planned to be launched in April, 1990.This payload is planned to include fiveexperiment modules from Europe and Japan.The experiment modules will containexperiments within bioscience, lifescience, electrophoretic orientation andinterfacial tension. They will alsocontain experiment equipment for process-
T :
20 K.A.L. LUNDAHL
ing of superconductivity materials and a
laser interferontetry observation system
for studies of crystallization processes.
3.2 PIROG 5
The PIROG project continues with the
launch of PIROG 5 from Esrange in August-
September, 1990. A water vapour experi-
ment from Estec will be added.
4 DISCUSSED FUTURE PROJECS
4.1 NLC 91/DECIMALS
In the series of rocket experiments for
the study of the cold summer mesopause
two projects are discussed. The NLC 91
has been proposed by a US-experimenter as
a US-Swedish cooperative project. The
study would be performed in the summer of
1991 but is still not approved by NASA.
The other project, which has been propos-
ed to be performed as a Swedish-Swiss
cooperative project, is DECIMALS (Dynami-
cal, Electrical and Chemical Interactions
near the Mesopause at Arctic Latitudes
during Summer). The intension is to fly
a number of rockets (possibly incorpo-
rating NLC 91 if approved) in the summer
of 1991 for the study of the high latitu-
de mesopause. The proposing scientific
groups are MISO and the University of
Bern.
4.2 Auroral Turbulence
RIT-P, proposes in cooperation with the
Cornell University the launch of a pay-
load comprising a mother and two daught-
ers for simultaneous measurements in an
active aurora. The campaign is planned
for December 1991 from Esrange with a 3-
stage Black Brant 10 to 800 km altitude.
This will be the first launch of a Black
Brant 10 from Esrange and it will utilize
the SPINRAC system and a 3-canard S19
system.
5 TECHNICAL DEVELOPMENT PROGRAM
5.1 High altitude rocket guidance system
It has since several years been a strong
requirement from different users to fly
sounding rockets to much higher altitudes
than is now possible from Esrange. This
would facilitate auroral studies at high
altitude with the advantage of land
recovery of expensive experiments and it
would provide a longer processing time
for microgravity experiments. SSC has
therefore decided to develop the necessa-
ry systems to allow sounding rocket
launchings to 900 km.
However, the launching of rockets to 900
km from Esrange poses nontrivial problems
of rocket guidance. The horizontal extent
of the rocket trajectory is limited to
less than 70 km with a 1-sigma dispersion
value of 15 km. Therefore, Sweden has
undertaken to develop an advanced guidan-
ce system for high altitude rockets,
SPINRAC (Spinning Rocket Attitude Con-
trol) which uses a gas jet system for
attitude control. The system will be
delivered in the spring of 1989.
A modified version of SPINRAC, using the
Inertial Measurement Unit and the Guidan-
ce Processing Unit but interfacing to .1
TVC system instead of the cold-gas system
will be developed during 1989 and will be
used to guide the MAXUS rockets.
A 3-canard S19 Boost Guidance system will
also be developed. The present 4-canard
system is well-proven. The new system
will utilize the existing design and will
make it possible to launch guided rockets
from the Skylark tower at Esrange.
Finally, as a part of the development ofthe MAXUS program a major upgrading of
the Esrange facilities has started. In
addition to a new launcher and a new
blockhouse, new laboratories and an
extensive instrumentation :or safety
operation and TT&C are being installed.

Pnic, Ninth ESA/PAC Symposium on 'European Rocket anil Balloon Programmes and Related Research', Lahnstein, FRG, 3—7 April 1989(ESASP-291, June 1989)
SWEDISH PROGRAMME 21
5.2 Telemetry and Command System IDNG DURATION SOUNDING ROCKETS
In order to meet new demands for higher
telemetry data speed and more command
channels for telescience applications,
SSC is currently developing a new teleme-
try and command system including both a
flight unit and a complete line of ground
support equipment.
The flight unit comprises a master TM/-
Command unit, and a set of subunits which
distributes TM and Command signals around
the payload. Master and subunits are
connected in a network which enables not
only normal TM/Command data flow but also
direct communication between subunits.
SOVIIiT UNION
Ground support equipment are all based on
standard PCs s which are tailored to
specific tasks by dedicated HW and SW.
Main functions include PCM decommutation,
various types of data presentation on
screen and printer, wordselection, TM
data storage and command generation.
The first step will be a study on trans-
fer quality and cost for a 15 Mbit/s
telemetry link at Esrange and design of
a ?CM encoder for bitrates up to 15Mbit/s. The encoder uses a so called
local data network for onboard data
transmission.
MAXUS OH THE LAUNCH PAD
FIGURE 1
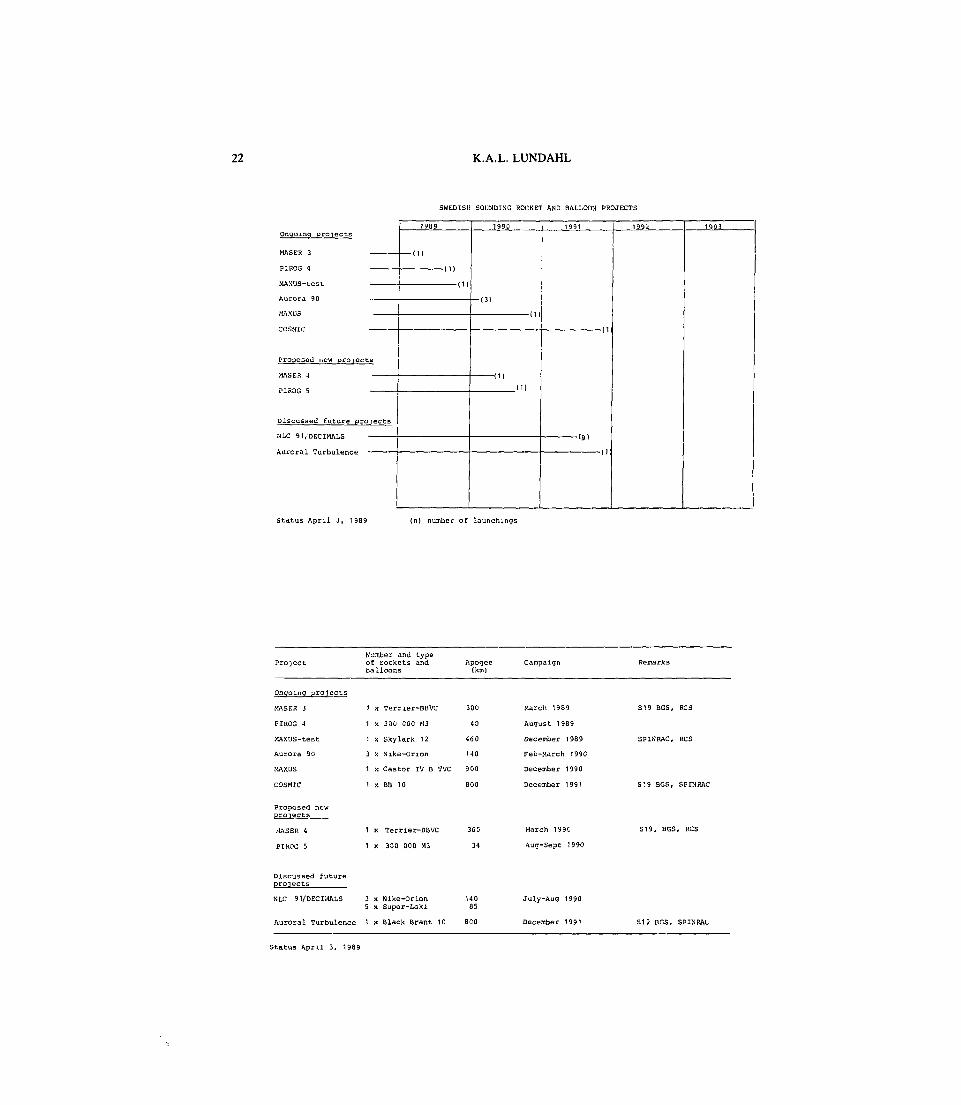
22 K.A.L. LUNDAHL
SWEDISH SOUNDINO ROCKET AND BALLOON PROJECTS
Proposed new projects
Discussed future projects
1989 1990
(D
1991
n
1992 1993
Status April 3, 1989 (n) number of launchlngs
Project
Ongoing projects
MASER 3
PIROG 4
MAXUS-test
Aurora 90
MAXUS
COSMIC
Proposed newprojects
.•1A3ER 4
PIkOG 5
Discussed futureprojects
NLC 91/DECIMALS
Auroral Turbulence
Number and typeof rockets andballoons
1 Jt
1 x
1 x
3 x
1 x
1 x
1 x
1 x
3 x5 x
1 x
Terner-BBVC
300 000 M3
Skylark 12
Nike-Orion
Castor IV B TVC
BB 10
Terrier-BBVC
300 000 M3
Nike-OrionSuper-Loki
Black Brant 10
Apogee(km)
300
40
460
140
900
800
300
34
14085
SOO
Campaign
March 1989
August 1989
December 1989
Feb-March 1990
December 1990
December 1991
March 199C
Aug-Sept 1990
July-Aug 1990
December 1991
Remarks
S19 BGS, RCS
SPINRAC, RCS
S' 9 BGS, SPINRAC
S19, BGS, RCS
S19 BCS, SPINRAL
Status April 3, 1989
23
The German Scientific Balloon and Sounding Rocket Programme
A. F. DahlDLR, Executive Department for Space Projects, KoIn, FR Germany
M. OtterbeinFederal Ministry for Research and Technology, Bonn, FR Germany
ABSTRACT
The scientific balloon and sounding rocketprojects form a very successful part ofthe German space research programme. Thisreport provides some information onsounding rocket projects in the scientificfields of astronomy, aeronomy, magneto-spheric research, and microgravity re-search .The scientific balloon projects are per-formed with emphasis on astronomical andaeronomical research.Previous projects undertaken after thelast Symposium 1987 in Sunne/S and prepa-rations and plans for the future until1992 are identified.
Keywords: Extraterrestrial Research,Sounding Rocket, Balloon, Experiments,Germany, Astronomy, Aeronomy, Magneto-sphere, Microgravity Research.
1. INTRODUCTION
In the following a survey is given of theongoing and planned projects with soundingrockets and balloons within the GermanSpace Science Programme, distinguishingbetween astronomy and exploration of thesolar system.
The German Space Research Programme dis-tinguishes between national, bilateral andEuropean projects. Overall programme au-thority resides with the Federal Ministerfor Research and Technology BMFT. TheGerman Aerospace Research EstablishmentDLR with its Executive Department forSpace Projects is acting on behalf ofBMFT.
The extraterrestrial research programme aspresented in Sunne 1987 is shown with up-dated figures in the poster presentationand printed elsewhere in these proceed-ings .
During the coming sessions you will heardetailed information about most of theprojects mentioned in our national reportby the scientists themselves.
2. SOUNDING ROCKET AND BALLOON PROGRAMME
2.1 Overview
The German sounding rocket programmecovers the following scientific disci-plines: astronomy, aeronomy, magneto-spheric research, microgravity research.Most of the projects are funded by BMFT,the Federal Minister for Research andTechnology through DLR, the GermanAerospace Research Establishment, whilesome of the German balloon projects arefunded through DFG, the German ResearchSociety, and GSF, the German NationalCenter for Environmental Sciences.
During the Symposium, many papers will bepresented showing scientific results,technological achievements of past pro-jects in some of these research fields. Inspecial project meetings future scientificcampaigns will be discussed.
In Fig. 1 an overview is given about theGerman sounding rocket and balloon pro-gramme showing some links to airborne ex-periments and Space Shuttle activities.The projects are grouped in the disci-plines and arranged by the flight levels,according to the carrier systems aircraft,balloon, Space Shuttle and soundingrocket.In a separate list the scientific institu-tes and experimenters who currently per-form the projects with sounding rocketsand balloons are identified.
2.2 Astronomy
The appearance of the Supernova SN 1987Aon February 23, 1987 has produced somemajor balloon and sounding rocket acti-vities in Germany.
With a spark chamber as payload the bal-loon SN 1987A/1 searched for high energygamma rays from the Super Nova 1987A. Thelaunch campaign was performed as coopera-tive project between the AstronomicalInstitute of the University of Tubingenand researchers from Australia, Italy,
Proc. Ninth ESAIPAC Symposium on 'European Rocket and Balloon Programmes and Related Research', Lahnsiein, FRC, 3—7April 1989(ESA SP-291, June 1989)
24 F. DAHL & M. OTTERBEIN
England, and USA on April 19, 1987 inAlice Springs, Australia.
A balloon gondola named SN 1987A/2 andequipped with cooled Ge-detectors to studythe SN 1987A in high energy X-rays, laun-ched on November 18, 1987 was not success-ful.But the spark chamber payload of 500 kgfor the study of the Super Nova in highenergy gamma rays prepared in the samecooperation as SN 1987A/1 was successfullylaunched as SN 1987A/3 from Alice Springson April 4, 1988 and reached an altitudeof 40 km.
The isotopic composition of cosmic raynuclei was measured with the balloon-borneinstrument ALICE, a Cerenkow-range expe-riment of about 2500 kg. The University ofSiegen together with the Goddard SpaceFlight Center, Greenbelt, USA, performed asuccessful campaign in Prince Albert,Canada, in 1987. The 27 million cubic feetballoon came to a float altitude of118,000 feet.
The sounding rocket payload A4/2 with animaging 32 cm Wolter telescope and aposition sensitive proportional counterhad been successfully launched and re-covered in 1979. After maintenance andcalibration, for the same payload. nowwith the name SUPER NOVA, a launch wasperformed August 24, 1987, in Woomera,Australia.
The Max-Planck-Institut for Physics andAstrophysics, Institute for extraterre-strial Physics, Garching, had prepared theexperiment. DLR was responsible formanufacturing of the attitude controlsystem supported by a TV-System for coarsepointing, and DLR-MORABA (Deutsche For-schungsanstalt fur Luft- und Raumfahrt,Mobile Raketenbasis) for the recoverysystem, logistics, rocket and launch.Cornier System had deliverd the structureand the payload systems. All this was donewith support from BMFT and DLR ExecutiveDepartment for Space projects in an extra-ordinary short time of 6 months. The aimof the mission was to collect X-ray dataof the Super Nova 1987A. More details willbe given in the Super Nova session.In the light of all the Super Nova re-search activities the High Energy X-rayexperiment HEXE, built by the Max PlanckInstitute for Extraterrestrial Physics(MPE) and the Astronomical Institute ofthe University of Tubingen (AIT) should bementioned. HEXE is a low backgroundphoswich detector system and derived fromthe balloon payloads flown for many yearsby the MPE/AIT groups. HEXE was launchedwith the Soviet Kvant module and docked tothe MIR Station in March/April 1987 andmeantime has given excellent informationabout the x-ray emissions of the SN 1987A.
For the University of Bonn a second launchof the INTERZODIAK payload on a Skylark-12rocket in Natal, Brazil, on September 3,1988 was successful. Measurements of the
EUV radiation of the interplanetary spaceand the geocorona were performed around58.4 nm and 121.6 nm by pressure-modulatedresonance-absorption cells incorporatedinto an extremely lightweight payload.
In the frame of a cooperation with theUniversity of Southern California and theInstitute for Astrophysics and Extrater-restrial Research (IAEF) of the Universityof Bonn the SOLLY experiment was launchedon board a Black Brant IX rocket fromWhite Sands Missile Range, USA, on October24, 1988. Measurements of the scatteredLyman Alpha photons and the total intensi-ties of the solar photons near 1216 A weresuccessfully performed. The instrumenta-tion comprised hydrogen and oxygen cellsand was manufactured by Dornier System ina contract of the University of Bonn. Thedevelopments from the ASTRO-HEL (1979) andINTERZODIAK (1988) projects were a basisfor the SOLLY instrument. The Universityof Bonn was invited for a reflight ofSOLLY in 1989.
Besides this the IAEF of the University ofBonn is planning a new scientific rocketmission, called HELLY, which will be de-voted to the observation of solar He II-30.4 nm photons resonantly scattered ofinterplanetary He II-pick-up ions from thecore-shadow region of the earth. Thelaunch of the rocket is wanted for 1992.
A team of the Ruhr-University of Bochum isstudying a rocket-borne coronograph formeasurements of the interplanetary dustclose to the sun (Fraunhofer corona) inthe visual and infrared spectral range.They will get support from the Max PlanckInstitute for Kernphysik and the Univer-sity of Nurnberg-Erlangen and are planninga sounding rocket campaign in 1992.
The Max Planck Institute for Extrater-restrial Physics (MPE) is planning twosounding rocket launches in 1990 and 1991under the project name ASTRO-IO. Highenergy imaging of galactic x-ray sourcesusing an Imaging Wolter telescope with aCCD-camera as payload on a Skylark 7rocket is anticipated. Woomera, Australiacould be the Rocket Range.
A high energy X-ray imaging instrumentwith a rotation-modulation-collimator(RMC) is in development at the Astro-nomical Institute of the University ofTubingen. They are planning, in coope-ration with the National ScientificBalloon Facility, USA, one balloon flightin 1991 in Australia. The payload weightas estimated today is 1000 kg. The balloonwith a volume of about 600 000 m3 shouldreach an altitude of about 40 km.
2.3 Aeronomv
Under the aeronomy programme severaldifferent instruments have been developedsince 1980 by the Max-Planck-Institut fiirKernphysik:
GERMAN PROGRAMME 25
ACIMS Active Chemical lonization MassSpectrometer
GIA Gas and Ion AnalyzerGIAA Gas, Ion and Aerosol AnalyzerSTRAFAM (Stratospharen Fallschirm Massen-
spektrometer)parachute borne drop sonde massspectrometer
They have been tested with several air-craft, balloon and rocket flights andprovided excellent sets of stratosphericdata. Zodiac balloons and Orion rocketshave been used.
As part of the CHEOPS (chemistry of ozonein the polar stratosphere) campaign aSTRAFAM-2 payload was successfully laun-ched in February 3987.
Within the CHEOPS programme the Kernfor-schungsanlage JuIich has performed in-situmeasurements in the arctic winter stra-tosphere using a balloon-borne cryogenicwhole air sampler. Three balloons werelaunched from ESRANGE, S, in February 1987and 1988. The analyzed samples have giveninformations about long-lived trace gasesand chlorofluorocarbons. The balloonflights were executed in close cooperationwith CNES and SSC. For the future similarballoon flights with the same instrumen-tation are planned.
The Kernforschungsanlage Jiilich and theUniversity of Essen have developed andflown twice aboard balloon gondolas aphotometer to measure the incident photonfluxes integrated over a solid angle of2 TT. The measurements of the photon inten-sities are used in photochemical models.
On January 30, 1989 in nearly parallelflights, excellent scientific data wereobtained at ESRANGE, S, from a STRAFAM-ACIMS scnde which was flown on board of asounding rocket, built and launched by theDLR MORABA and from a balloon-borne ACIMSinstrument. Extreme low stratospherictemperatures provided ideal scientificconditions. The combined STRAFAM andballoon measurements on the same dayresulted in a unique set of data whichsupport the investigations of theprocesses causing the so called "ozonehole".Another STRAFAM-ACIMS flight is delayeduntil summer 1989.
For spring and fall 1989 two ballonflights with the cooled Michelson interferometer, the MPIAS of Kernforschungs-anlage Karlsruhe and the University ofMunich are planned, also for measurementsof stratospheric trace constituents. TheZodiac-balloon will carry the 360 kgpayload to an altitude of about 33 and 40km from Aire-sur-1'Adour, France.The aeronomy sounding rocket programme wascontinued in the framework of the interna-tional Middle Atmosphere Cooperation (MAC)programme. A MAC-SINE (Summer in NorthernEurope) campaign and a MAC-EPSILON (EPSI-LON stands for the turbulence parameter)campaign were performed in 1987. These two
campaigns are scientific successors of theWinter Anomaly (1975/76), Energy Budget(1980/81) and MAP-WINE (1983/84) cam-paigns, with their common goal of gettinga better understanding of our mésosphèreand stratosphere by improved and coordi-nated methods.Under a contract between DFVLR and NTNF,NTNF has manufactured the main payloads ofthe MAC-SINE and MAC-EPSILON campaigns,equipped with the German instrumentsBUGATTI (Bonn University Gas Analyzer forTurbopause and Turbulence Investigations)and IOMAS (Ion Mass Spectrometer).
For the MAC-SINE campaign 26 inflatableFalling Sphere payloads on Viper 3A/Dartand 22 Chaff payloads on stretched Super-Loki/Dart were supplied by the Universityof Bonn and the MPI for Aeronomy inKatlenburg-Lindau and were launched fromAndoya Rocket Range, N, between June 10,and July 19, 1987.
The MAC-SINE/-EPSILON campaigns were ex-tended with the launches of meteorologicalrockets in the MAC-SODIUM campaign insummer 1988. The University of Bonnoperated a Na Lidar System at AndoyaRocket Range during the campaign in orderto measure the temperature profiles in thealtitude region 80 to 110 km. In day andnighttime measurements significant diurnalvariations of the Sodium layer at polarlatitudes in summer have been determined.
With RASMUS, a Rocket-borne Air Samplerfor the Mésosphère and upper Stratosphere,a cryo sampling technique which has beenproven during several balloon flights wasused in 2 rocket launches. The aim is tomeasure the vertical distribution of tracegases. The 2 launches with ORION rocketsand recovery systems were successful onMay 6, 1987 and December 6, 1988.The payloads with the samples taken fromapogee downwards in equidistance between60 and 30 km were recoverd after approx.50 minutes flight time. One flight peryear is planned until 1992.
INDRA was first an Indo-German idea for asounding rocket instrument, to be used forin-situ calibration of the German expe-riment ASSI on the Italian satellite SANMARCO D. ASSI is an Airglow Solar Spec-trometer Instrument. The ASSI SpectralCalibration (ASC) was performed by measu-ring the flux density of protons andelectrons in the KeV region and airglow inthe wavelength region between 50 and 700nm on a Black Brant rocket launched fromWhite Sands Missile Range, USA, in closecooperation with NASA/GSFC in November1988.
As a new project DYANA (DYnamic s -AdaptedNetwork for the Atmosphere) was proposedin 1987 to the scientific community. About55 teams of scientists in 21 countrieshave announced their interest to parti-cipate in the worldwide campaign. Thescientific goal of the project is thestudy of middle atmosphere phenomena onvarious spatial and temporal scales. In
26 F. DAHL & M. OTTERBEIN
collaboration with China, France, India,Japan, Norway, Spain, Sweden, USA and USSRa mixture of groundbased, balloon androcket borne experiments is planned for acampaign between January and March 1990.
Also the TURBO payloads will be launchedin the DYANA campaign. TURBO is a specialdiagnostic instrument developed for theinvestigation of turbulences and waves inthe atmosphere between 60 and 120 km.Instruments and payloads are under prepa-ration. Sea recovery at Andoya RocketRange is under investigation. For theTURBO payloads 4 campaigns are planned: 1.TURBO recommend in October 1989; 2.parallel with DYANA A in Andoya, N,January-February 1990; 3. with DYANA B inBiscarosse, F, at the same time and 4.TURBO in August 1990 in Andoya, N.
Another new project is SISSI (Spectros-copic Infrared Structures SignaturesInvestigation). Structures of trace gasdistributions in the polar sunlit méso-sphère and lower thermosphère are to bestudied with the SISSI instrumentationwi ch comprises an IR-Spectrometer, anIR-radiometer, a nitric oxide -bandphotometer and an atomic oxygen resonancefluorescence experiment. The campaigns areplanned for summer 1989, spring and summer1990 in Esrange, S, using 4 payloads withmultiple recovery.
A noctilucent cloud project NLC 91 pre-pared by NASA and the Universiy of Bern,CH, offers a good chance to the Universityof Bonn to participate in 1991 with groundbased LIDAR measurements, meteorologicalrockets and some of the TURBO rockets. Adetailed planning regarding the distribu-tion of activities at the rocket rangesAndoya and Kiruna is a task for the nearfuture.
2.4 Maqnetospheric Research
After the CAESAR project in January 1985the magnetosphere programme was continuedwith the ROSE project (Rocket and ScatterExperiment).
The four payloads with 9 diagnostic ex-periments each were coordinated withground-based EISCAT and STARE measurementsfor the study of the auroral E-region.
During 1986 and 1987, the four payloadswere manufactured and tested by thesounding rocket team of MBB Ottobrunn.Successful launches were performed afterseveral countdowns at Andoya Rocket Range,N, for Fl on November, 26., 1988 and F2 onDecember, 5., 1988. The other payloadswere launched in ESRANGE, Kiruna, S; F3 onFebruary, 7., 1989 and F4 on February, 9.,1989. The carrier for all four payloadswere Skylark 2 rockets which performedexcellently. More details about the veryfirst results will be given by thesientists in the relevant session.
In a Japanese-German cooperation theCOREX-Experiment to measure electrondensity and temperature in the midlatitudeionosphere has been flown from KagoshimaSpace Center, Japan. It is used theresonance cone technique, a high-frequencymethod which allows to derive the ambientplasma parameters.
On the German side the Ruhr UniversityBochum supplied the COREX instrument,which was successfully launched on January25, 1988.
The German scientists are planning twofuture launches of COREX II, using reso-nance cones for diagnosing non thermalplasma properties at mid latitudes. Thefirst campaign is planned in a cooperationwith the Chinese Academy of Sciences. Thepayload would be launched end of 1990 witha VEGA 2 rocket from Hainan, China, to analtitude of approximately 170 km. Thesecond campaign will repeat the coopera-tion with ISAS, Japan. The payload shouldbe launched on a K-9M rocket mid 1991 fromKagoshima, Japan, up to an altitude ofapproximately 360 km.
Within the Indo-German cooperative projectSPREAD-F a sounding rocket payload carry-ing a resonance cone experiment, a Lang-muir-probe and a plasma potential probewas launched into the equatorial iono-sphere near Shar, India on May, 4., 1987.The cooperation has been arranged betweenthe Physikalisch Technische Studien (PTS)group, Freiburg, DFVLR, and ISRO, India.
Within an international cooperation theMax-Planck-Institute for ExtraterrestrialPhysics is preparing the CRIT II payloadto be launched on a Black Brant X soundingrocket in Wallops Island, USA, up to analtitude of approximately 490 km. CRIT IIis an active-experimental test of theAlfven Critical lonization velocityeffect. The payload has a mother-daughterconfiguration. Two chemical canisters willbe ejected and create a neutral bariumjet. The cooperation consisting of scien-tists of the University of Alabama inHuntsville, Cornell University, Utah StateUniversity, USA, the Danish Space ResearchInstitute, Denmark, and the above mentio-ned Max-Planck-Institute, F.R. Germany,will also deliver two electron electro-static analyzers (5eV-3KeV), one ionelectrostatic analyzer (2eV-2KeV), twophotometers, two orthogonal E-field booms,one sweep frequency analyzer (0-5 MHz),Langmuir probe, plasma frequency probe anda 3-axis magnetometer. The launch isplanned for April-May 1989.
2.5 Mlcroaravitv Research
In the research field of materials scienceTEXUS (Technological experiments underreduced gravity) started as a cooperativeprogramme of the Federal Minister forResearch and Technology BMFT and theGerman Aerospace Research EstablishmentDLR for the implementation of short-term
GERMAN PROGRAMME 27
space experiments under near weigthless-ness. Detailed information about TEXUS areto be found in the proceedings of theearlier Symposia.
Numerous German experiments for microgra-vity research in the field of materialsscience were flown on TEXUS campaigns.
Since 1978 a total of 20 flights, of which18 successfully, have been accomplished,with more than 175 experiments. The in-vestigations have been carried out withemphasis on chemistry and processingtechnology, interface and convectionphenomena, metallurgy, crystal growth,basic physics and biology. TEXUS is usedfor some life sciences experiments withgood results. Regardless the short micro-gravity time (~ 6 min) electrophoresis andyeast protoplasts experiments were per-formed on TEXUS flights in 1987.
In the field of microgravity research theTEXUS programme meanwhile has become aninternational research programme withvarious participating organizations. TEXUSwas commercialized in 1988 and fourflights per year are planned.
It. is planned to extend the duration ofmicrogravity from 6 minutes given by theGerman TEXUS and/or the Swedish MASERprogramme to 15 minutes in the cooperativeMAXUS programme. An experimental time ofthis duration could enormously improve theattraction of the sounding rocket pro-gramme for Micro-gravity.
A new instrument for microgravity researchis MIKROBA (Microgravity Balloon) suppor-ted by BMFT/DLR and under development atindustry. By means of a balloon a dropcapsule will be brought up to a height ofapproximately 45 km and then dropped. Theaerodynamic resistance will be compensatedby additional thrust. About 60 seconds ofmicrogravity (£ 10 g) are possible.MIKROBA is a low-cost approach for micro-gravity research especially for technologydevelopment, test of fluid physics in-struments, combustion and solidificationexperiments. The first test flights weresuccessful in May 1986 (MIKROBA 1) andApril 1989 (MIKROBA 2) in Kiruna, S. Afterthe third testflight planned for April1989 the operational phase will begin withdual launches in autumn 1989 and spring1990. Cooperation is envisaged with China(spring 1990) and the USSR.
2.6 Project Hilestc nd Resources
In Fig. 2 and 3 the project milestones ofthe sounding rocket projects until 1992are shown.
Fig. 4 is showing the timespan between thefirst Symposium in Germany, which was heldin Schlofl Elmau 1976 and the second Sym-posium of this day. The main soundingrocket campaigns in the three disciplinesare identified with the expenses spent byBMFT national and to the ESRANGE special
project. Information about all of the pastprojects in Fig. 4 can be found in theproceedings of the former ESA symposiaabout European programmes on soundingrocket and balloon research. Fig. 5 showsthe distribution of the resources forsounding rocket projects to the threedisciplines.
For many of the sounding rocket projectsdescribed in this report the DLR MobileRocket Base carried out campaign planningand launch operations together with therange authorities.Besides this, hardware development andtests have been performed by DLR on therecovery system for STRAFAM, the modulefor the television transmission board-to--ground system for TEXUS, and the attitudecontrol system for the INTERZODIAK andSuper Nova payloads.
3. SOFIA
To the NASA Project SOFIA - StratosphericObservatory for Infrared Astronomy - ahardware contribution (telescope) is underdiscussion in order to enable German sci-entists to participate in the utilizationof this airborne observatory. Two studiesabout the main mirror technology werefinished end of April 1987. The defini-tion phase which started end of 1988 willbe finished with a detailed design of thetelescope with a main mirror diameter of2,5 m mid 1989. (More information will begiven in a separate presentation.)
4. CONCLUSION
The time needed for preparation andexecution of a scientific sounding rocketand balloon project until the final dataevaluation with documentation is shortwhen compared with the time needed forSpacelab and satellite projects. A goodexample is the Supernova project.
Besides the excellent scientific findingsto be gained by this means, this is also agood opportunity for education of studentsand training of junior scientists andengineers in the field of extraterrestrialand microgravity research at universities,in spite of the natural high fluctuationrate of personnel there.
Therefore the German scientists still havea considerable interest in future activi-ties with scientific sounding rocket andballoon experiments and thus it is plannedto maintain these activities as a basicand important part of the German space re-search programme.
28 F. DAHL & M. OTTERBEIN
LIST OF SCIENTIFIC INSTITUTES AND EXPERIMENTERS WHO CURRENTLY PERFORMPROJECTS WITH SOUNDING ROCKETS AND BALLOONS
1. ASTRONOMY
Institut fur Astrophysik und Extra-terrestr. Forschung, Universitât BonnInstitut fur Extraterrestr. Physik,MPI - Physik u. Astrophysik, GarchingFachbereich Physik, Universitât Ge-samthochschule SiegenAstronomisches Institut, UniversitâtTUbingen
Prof. Fahr (INTERZODIAK 2,SOLLY, HELLY)Prof.Trumper, Dr.Brauninger(SUPER NOVA)Prof. Simon (ALICE)
Prof. Staubert(SN 1987A/1/2/3)
2. AERONOHT
- MPI - Kernphysik, Heidelberg
- MPI - Aeronomie, Katlenburg-Lindau
- Fachbereich Physik, Universitât Ge-samthochschule Wuppertal
- Physikalisches Institut, UniversitâtBonn
- Institut fiir Astrophysik u. extra-terrestrische Forschung, Univer-sitât Bonn
- Institut fiir Atmosph. Chemie, KFAJulien
- KFA Karlsruhe- Meteorolog. Institut, UniversitâtMunchen
- Institut fur Phys. Chemie, Univer-sitât Essen
Dr. Krankowsky (MAC-EPSILONDr. Arnold (STRAFAM/ACIMS,CHEOPS/ACIMS)Widdel (MAC-SINE/-SODIUM)Dr. Fabian (RASMUS)Prof. Offermann (MAP/GLOBUS,DYAMA)Prof. Grofîmann (SISSI)Prof. v.Zahn (MAC-SINE/-EPSILON/-SODIUM, TURBO,NLC 91, LIDAR)Dr. LUbken (MAC-SINE/-EPSILON)Prof. Rômer, (INDRA)
Dr. Schmidt (CHEOPS)
Prof. Fischer (MIPAS)Dr. Rabus (MIPAS)
Dr. Roth (CHEOPS)
3. MAGNETOSPHERE
- Institut f. Extraterrestr. Physik,MPI - Physik u. Astrophysik, Garching
- MPI - Kernphysik, Heidelberg
- Physikalisches Institut, UniversitâtBonn
- MPI - Aeronomie, Katlenburg-Lindau
- Institut fur Geophysik und Météoro-logie, Techn. Universitât Braunschweig
- Institut fur Nachrichtentechnik,Techn. Universitât Braunschweig
- Institut fur Experimentalphysik,Universitët Kiel
Prof. Haerendel (CRIT)
Dr. Lammerrahl,Dr. Krankowsky (ROSE)Prof. v. Zahn, Dr. Liibken(ROSE)Dr. Rosé, Dr. Rinnert,Dr. Kohl, Dr.Schlegel (ROSE)Dr. Luhr (ROSE)
Dr. Dehmel (ROSE)
Dr. Piel (COREX)
4. MICROGRAVITY RESEARCH
- Lehrstuhl fur Ingenieurwissenschaf-ten, Universitât Hamburg
- 55 different institutions
Prof. Ahlborn (présentproject scientist TEXUS)Address information can begiven on request by DLRproject management
(MPI = Max-Planck-Institut; KFA = Kernforschungsanlage)
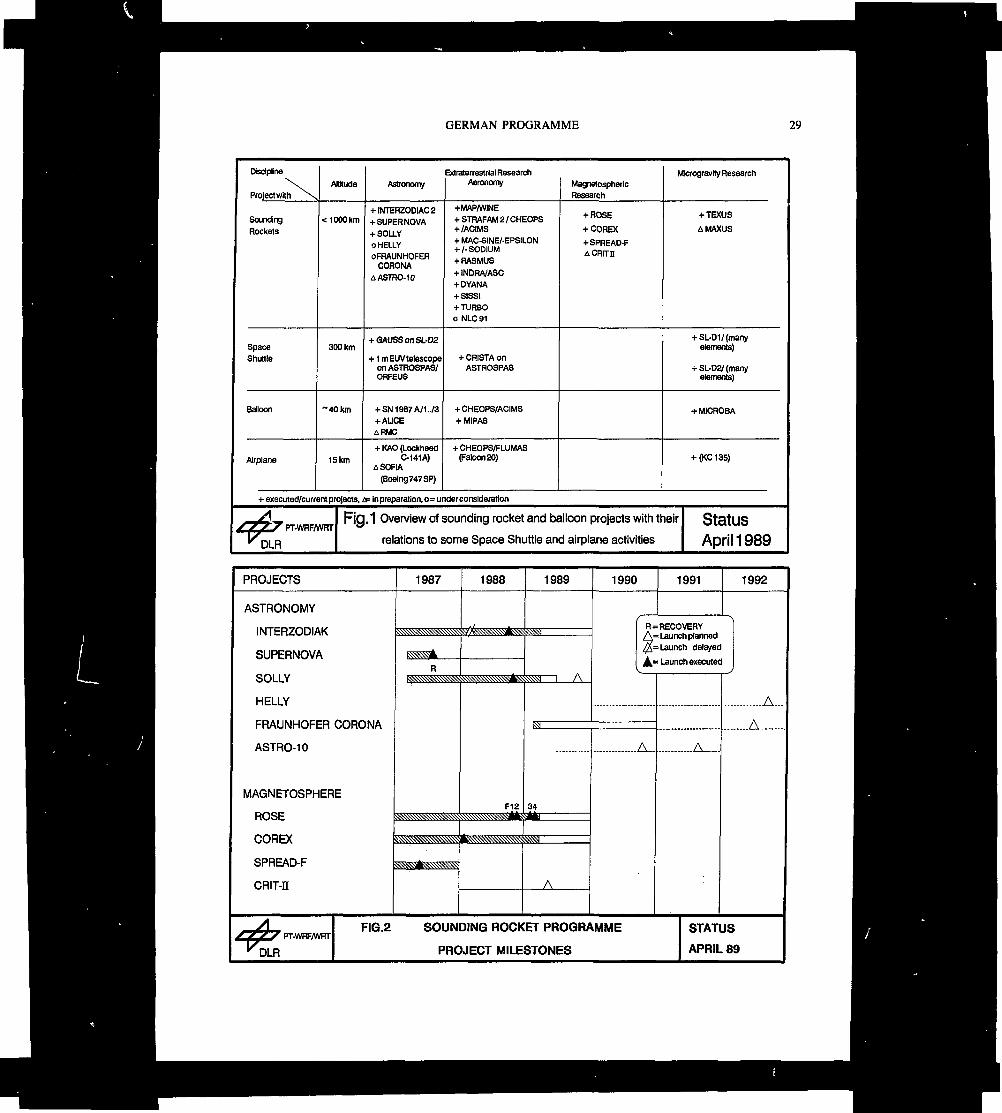
GERMAN PROGRAMME 29
Discipline
Project with ^x
SoundingRockets
SpaceShuttle
Balloon
Airplane
Altitude
< 1000 km
300km
"40 km
15km
Astronomy
+ INTERZODIAC 2+ SUPERNOVA+ SOLLYo HELLYOFHAUNHOFER
CORONAuASTRO-10
+ GAUSS on SL-DZ
+ ImEUV telescopeon ASTROSPAS/ORFEUS
+ SN 1987 A/1. ./3+ ALICEû RMC
+ KAO (LockheedC-141A)
û SOFIA(Boeing 747 SP)
Extraterrestrial ResearchAeronomy
+MAP/WINE+ STRAFAM 2 / CHEOPS+ /ACIMS+ MAC-SINEAEPSILON+ /-SODIUM+ RASMUS+ INDFWASC+ DYANA+ SISSI+ TURBOo NLC 91
+ CRISTA onASTROSPAS
+ CMEOPS/ACIMS+ MIPAS
+ CHEOPS/FLUMAS(Falcon 20)
MagnetospherlcResearch
+ ROSE
+ COREX
+ SPREAD-FACR(TE
Mlcrogravfty Research
+ TEXUS
û MAXUS
+ SL-D1/(manyelements)
+ SL-D2/ (manyelements)
+ MICROBA
+ (KC 135)
+ executed/current projects, t& impréparation, 0= underconsideratlon
^ Fig. 1 Overview of sounding rocket and balloon projects with their Status
MDLR relations to some Space Shuttle and airplane activities April 1 989
PROJECTS
ASTRONOMY
INTERZODIAK
SUPERNOVA
SOLLY
HELLY
FRAUNHOFER
ASTRO-10
MAGNETOSPHER
ROSE
PClOCY
SPREAD-F
CRIT-H
V yV* J PT.WHF/UUPT
^DLR
CORONA
E
1987
»»»«»«»»»»•
ESSS a
RR »SS««!SS
«««•NSSSSSS;
1988
J-L/ A./ SN^^Njfjf
>N«*»»«««sAi
F12^ W.V.W.J**j
•
1989
NSSSI
mi i A
KSi
34VE*1
1990
R =
$>
A=V
A
1991 1992
•\RECOVERY
= Launch planned= Launch delayed
s Launch executedJ
A_
. . A .
A
FIG.2 SOUNDING ROCKET PROGRAMME STATUS
PROJECT MILESTONES APRIL 89
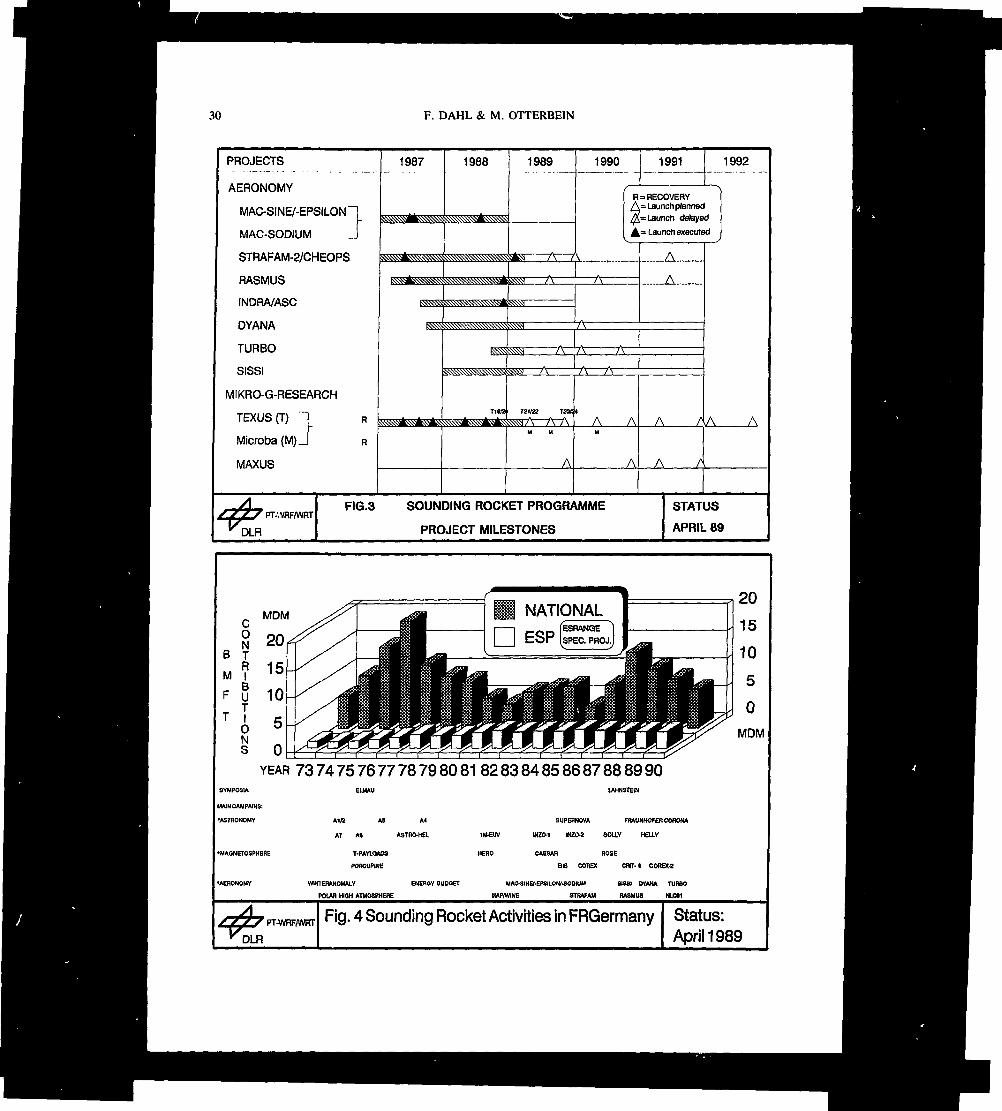
30 F, DAHL & M. OTTERBEIN
PROJECTS
AERONOMY
MAC-SINE/-EPSILON"
MAC-SODIUM
STRAFAM-2/CHEOPS
RASMUS
INDRA/ASC
DYANA
TURBO
SISSI
MIKRO-G-RESEARCH
TEXUS (T) ~) °
Microba (M) _l
MAXUS
SSSS PT-WRF/WRT\f
1987
ï>N£W«ïjA»;COiWN'>
t i wte^s^^^
1988
x v ^;itBÈ;N:>;^;>;:'
1989
^^^^^^^ • l / \ /
.IIS^ài Sô^^^^SÏ ^^^^^ /\
_Jt ^^v^W ïrs' W^Bï'N'
1 T
^^^^^^^^ •A^H^OifCvw vw- W W
R
1990 1991 1992
/- -v
R = RECOVERYa= Launch planned
= Launch delayed
A= Launch executedv J
r * -
A
£_
A- —
A
RSSjSSS) /\ /\ /\
I-5»»S»»S» »»»M A /N /\
TIOT
«SSS? «SS? ^SSt^yA A AM M
A
4
AM
A
r
A /
A
FIG.3 SOUNDING ROCKET PROGRAMME STATUS
PROJECT MILESTONES APRIL 89
YEAR 73 74 75 76 77 78 79 80 81 82 83 84 Q5 86 87 88 89 90SYMPOSIA
MAINCAMPAlNS:
•ASTRONOMY
•MAQNETOSPHEP.E
MlZ AB A4
Kl At ASTRO-HEL
T-PAYlOAOS
PORCUPINE
WINTERANOMALY EHEBOY SUDOET
POLAR HIOH ATMOSPHERE
SUPERNOVA FRAUNKOFERCOnONA
IM-EUV INZO-I WZO-2 SOUY KELLY
HERO CAESAR ROSE
BIB COREX CB(T-I COROM
MAO-SINB-EPSILOW-SODIUM SISSI BYANA TURBO
MAP/WINE STRVAM RASMUS NLCSI
PT-WRF/WRT Fig. 4 Sounding Rocket Activities in FRGermanyDLR
Status:April 1989
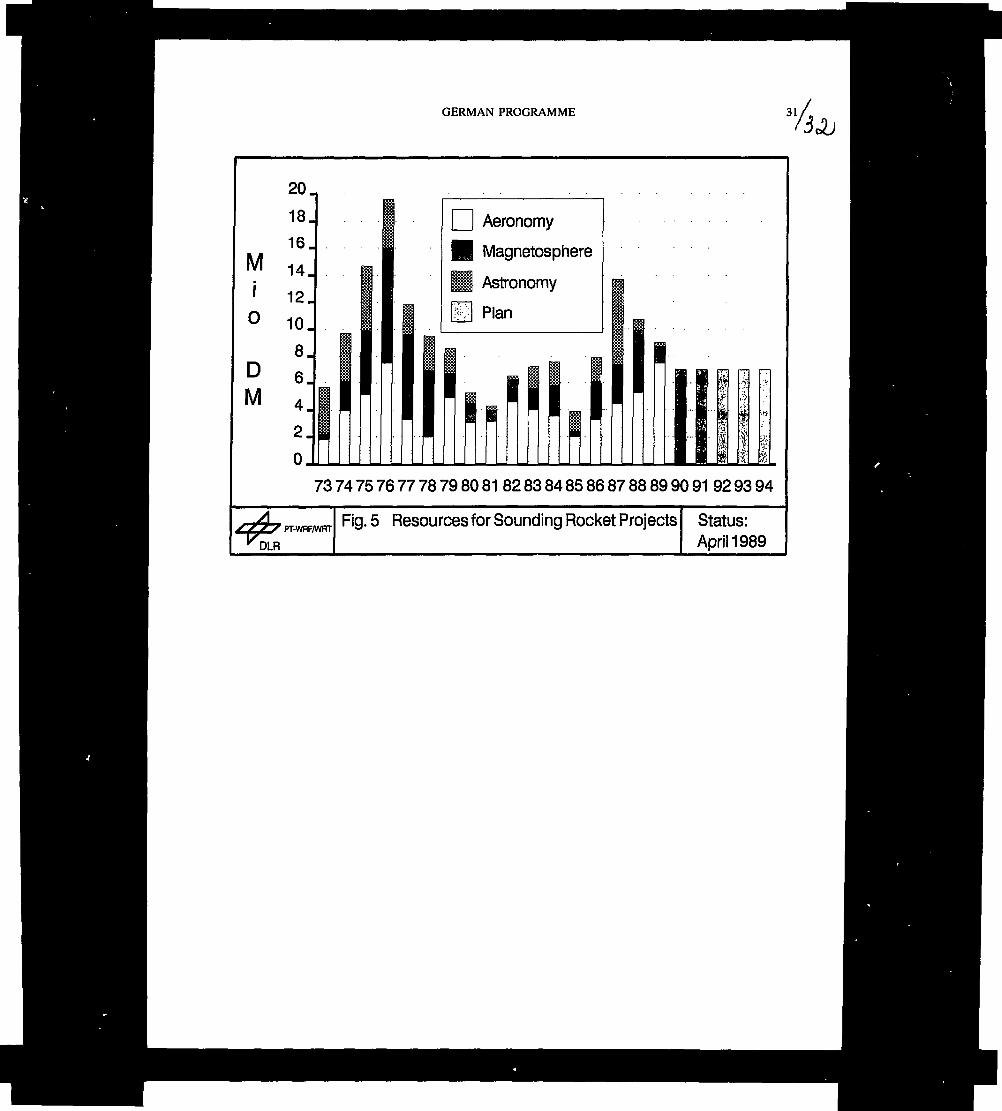
GERMAN PROGRAMME
Mjo
DM
20
181614,12,
10.
8.
6.
4.
2.
O.
Aeronomy
Magnetosphere
Astronomy
Plan
73 74 75 76 77 78 79 80 81 82 83 84 85 86 87 88 89 90 91 92 93 94
PT-WRF/WHT
DLR
Fig. 5 Resources for Sounding Rocket Projects Status:April 1989

SESSION 2COMMENCEMENT
Chairman:U. von Zahn
33/
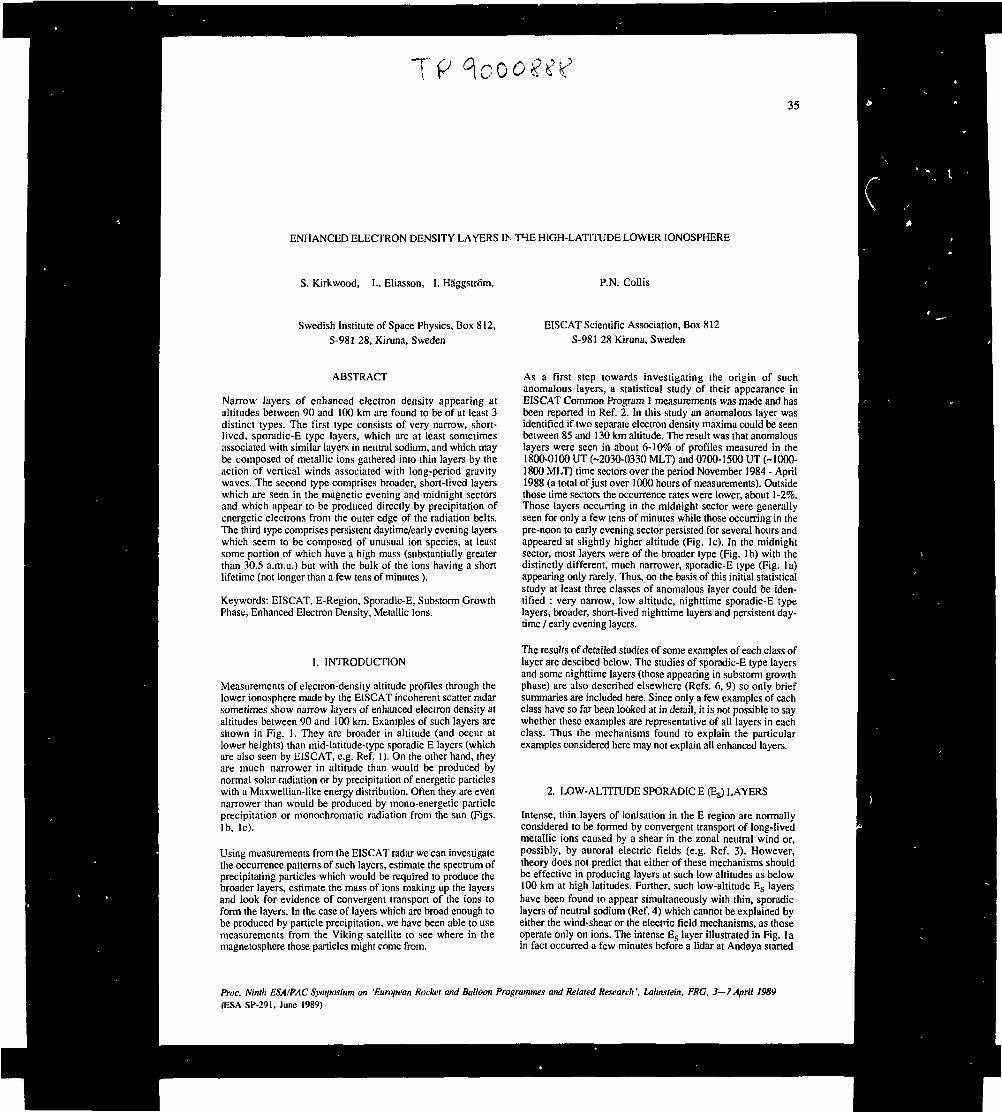
35
ENHANCED ELECTRON DENSITY LAYERS IN THE HIGH-LATITUDE LOWER IONOSPHERE
S. Kirkwood, L. Eliasson, I. Haggstrôm, P.N. Collis
Swedish Institute of Space Physics, Box 812,S-981 28, Kiruna, Sweden
EISCAT Scientific Association, Box 812
S-981 28 Kiruna, Sweden
ABSTRACT
Narrow layers of enhanced electron density appearing ataltitudes between 90 and 100 km are found to be of at least 3distinct types. The first type consists of very narrow, short-lived, sporadic-E type layers, which are at least sometimesassociated with similar layers in neutral sodium, and which maybe composed of metallic ions gathered into thin layers by theaction of vertical winds associated with long-period gravitywaves. The second type comprises broader, short-lived layerswhich are seen in the magnetic evening and midnight sectorsand which appear to be produced directly by precipitation ofenergetic electrons from the outer edge of the radiation belts.The third type comprises persistent daytime/early evening layerswhich seem to be composed of unusual ion species, at leastsome portion of which have a high mass (substantially greaterthan 30.5 a.m.u.) but with the bulk of the ions having a shortlifetime (not longer than a few tens of minutes ).
Keywords: EISCAT, E-Region, Sporadic-E, Substorm GrowthPhase, Enhanced Electron Density, Metallic Ions.
1. INTRODUCTION
Measurements of electron-density altitude profiles through thelower ionosphere made by the EISCAT incoherent scatter radarsometimes show narrow layers of enhanced electron density ataltitudes between 90 and 100 km. Examples of such layers areshown in Fig. 1. They are broader in altitude (and occur atlower heights) than mid-latitude-type sporadic E layers (whichare also seen by EISCAT, e.g. Réf. 1). On the other hand, theyare much narrower in altitude than would be produced bynormal solar radiation or by precipitation of energetic particleswith a Maxwellian-like energy distribution. Often they are evennarrower than would be produced by mono-energetic particleprecipitation or monochromatic radiation from the sun (Figs.Ib, Ic).
Using measurements from the EISCAT radar we can investigatethe occurrence patterns of such layers, estimate the spectrum ofprecipitating particles which would be required to produce thebroader layers, estimate the mass of ions making up the layersand look for evidence of convergent transport of the ions toform the layers. In the case of layers which are broad enough tobe produced by particle precipitation, we have been able to usemeasurements from the Viking satellite to see where in themagnetosphere those particles might come from.
As a first step towards investigating the origin of suchanomalous layers, a statistical study of their appearance inEISCAT Common Program 1 measurements was made and hasbeen reported in Réf. 2. In this study an anomalous layer wasidentified if two separate electron density maxima could be seenbetween 85 and 130 km altitude. The result was that anomalouslayers were seen in about 6-10% of profiles measured in the1800-0100 UT (-2030-0330 MLT) and 0700-1500 UT (-1000-1800 MLT) time sectors over the period November 1984 - April1988 (a total of just over 1000 hours of measurements). Outsidethose time sectors the occurrence rates were lower, about 1-2%.Those layers occurring in the midnight sector were generallyseen for only a few tens of minutes while those occurring in thepre-noon to early evening sector persisted for several hours andappeared at slightly higher altitude (Fig. Ic). In the midnightsector, most layers were of the broader type (Fig. Ib) with thedistinctly different, much narrower, sporadic-E type (Fig. Ia)appearing only rarely. Thus, on the basis of this initial statisticalstudy at least three classes of anomalous layer could be iden-tified : very narrow, low altitude, nighttime sporadic-E typelayers, broader, short-lived nighttime layers and persistent day-time/early evening layers.
The results of detailed studies of some examples of each class oflayer are descibed below. The studies of sporadic-E type layersand some nighttime layers (those appearing in substorm growthphase) are also described elsewhere (Refs. 6, 9) so only briefsummaries are included here. Since only a few examples of eachclass have so far been looked at in detail, it is not possible to saywhether these examples are representative of all layers in eachclass. Thus the mechanisms found to explain the particularexamples considered here may not explain all enhanced layers.
2. LOW-ALTITUDE SPORADIC E (Es) LAYERS
Intense, thin layers of ionisation in the E region are normallyconsidered to be formed by convergent transport of long-livedmetallic ions caused by a shear in the zonal neutral wind or,possibly, by auroral electric fields (e.g. Réf. 3). However,theory does not predict that either of these mechanisms shouldbe effective in producing layers at such low altitudes as below100 km at high latitudes. Further, such low-altitude E5 layershave been found to appear simultaneously with thin, sporadiclayers of neutral sodium (Réf. 4) which cannot be explained byeither the wind-shear or the electnc field mechanisms, as thoseoperate only on ions. The intense E5 layer illustrated in Fig. Iain fact occurred a few minutes before a lidar at Andoya started
Proc. Ninth ESAIPAC Symposium on 'European Rocket and Balloon Programmes and Related Research ', Lahnstein, FRG, 3—7 April 1989(ESA SP-291. June 1989)
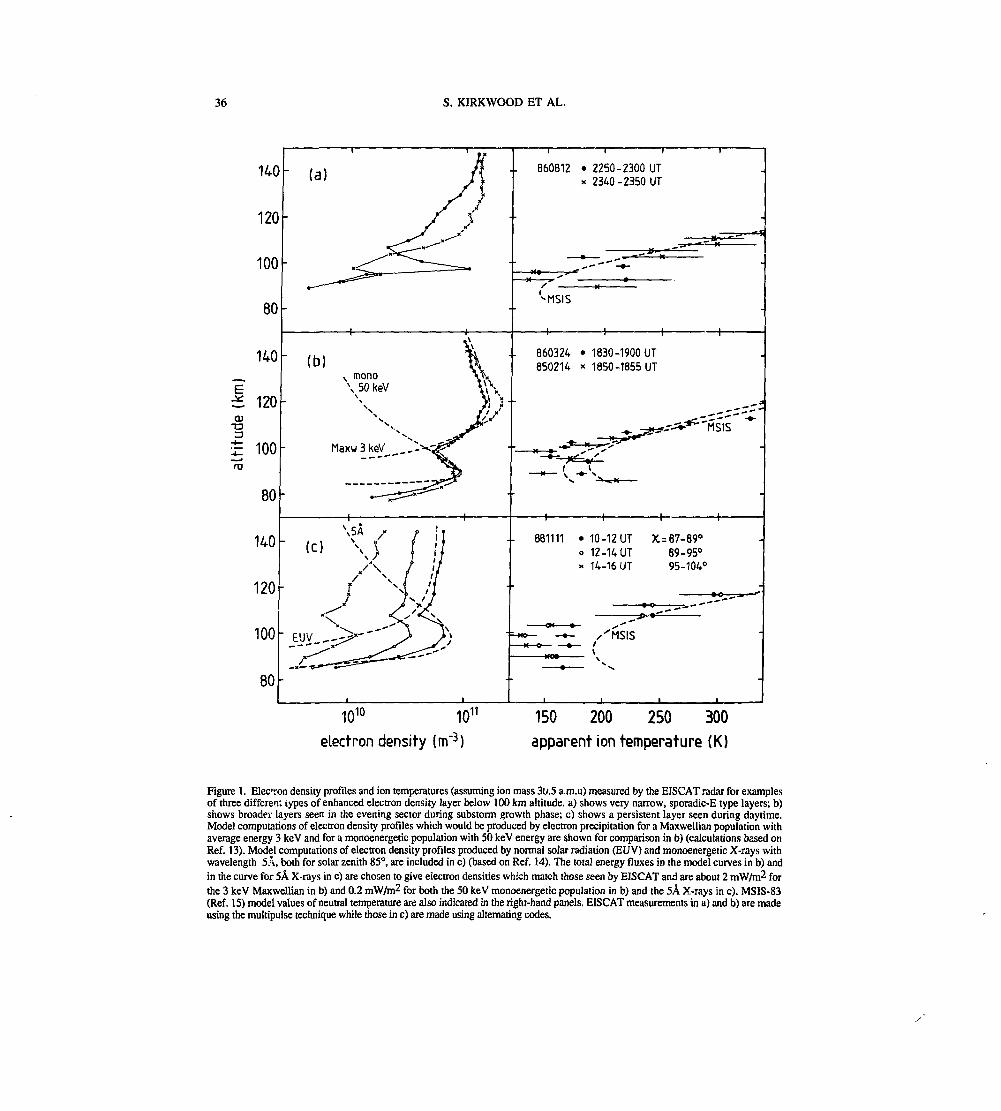
36 S. KIRKWOOD ET AL.
140
120
100
80
140
I 120Ol•a
I 100
80
140
120
100
80
(a)
(b)
MaxwSkeV
. 860812 • 2250-2300 UTx 2340-2350 UT
(c)
^MSIS
-H
860324850214
1830 -1900 UT1850 -1655 UT
MSIS
-f-
- - 881111 • 10-12 UT X = 87-69°12-14 UT 89-95°14-16 UT 95-104°
« o ^ — -"
. i\— \
10io 10n
electron density {rrf3)150 200 250 300apparent ion temperature (K)
Figure 1. Electon density profiles and ion temperatures (assuming ion mass 31/.5 a.m.u) measured by the EISCAT radar for examplesof three different types of enhanced electron density layer below 100 km altitude, a) shows very narrow, sporadic-E type layers; b)shows broader layers seen in the evening sector during substorm growth phase; c) shows a persistent layer seen during dayiime.Model computations of electron density profiles which would be produced by electron precipitation for a Maxwellian population withaverage energy 3 keV and for a monoenergetic population with 50 keV energy are shown for comparison in b) (calculations based onRéf. 13). Model computations of electron density profiles produced by normal solar radiation (EUV) and monoenergetic X-rays withwavelength 5Â, both for solar zenith 85°, are included inc) (based on Réf. 14). The total energy fluxes in the model curves in b) andin the curve for 5Â X-rays in c) are chosen to give electron densities which match those seen by EISCAT and are about 2 mW/m2 forthe 3 keV Maxwellian in b) and 0.2 mW/m2 for both the 50 keV monoenergetic population in b) and the 5A X-rays in c). MSIS-83(Réf. 15) model values of neutral temperature are also indicated in the right-hand panels. EISCAT measurements in a) and b) are madeusing the multipulse technique while those in c) are made using alternating codes.
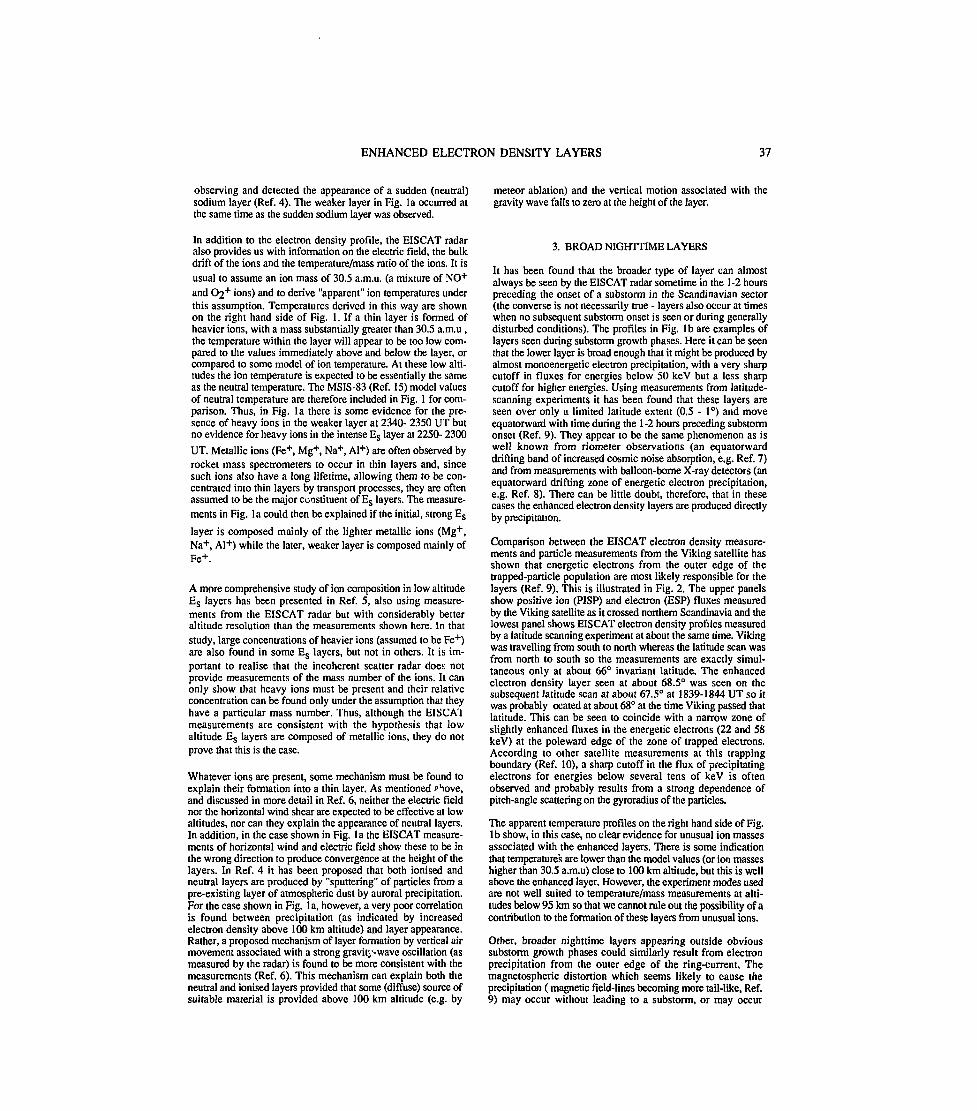
ENHANCED ELECTRON DENSITY LAYERS 37
observing and detected the appearance of a sudden (neutral)sodium layer (Réf. 4). The weaker layer in Fig. Ia occurred atthe same time as the sudden sodium layer was observed.
In addition to the electron density profile, the EISCAT radaralso provides us with information on the electric field, the bulkdrift of the ions and the temperature/mass ratio of the ions. It isusual to assume an ion mass of 30.5 a.m.u. (a mixture of NO+
and O2+ ions) and to derive "apparent" ion temperatures underthis assumption. Temperatures derived in this way are shownon the right hand side of Fig. 1, If a thin layer is formed ofheavier ions, with a mass substantially greater than 30.5 a.m.u ,the temperature within the layer will appear to be too low com-pared to the values immediately above and below the layer, orcompared to some model of ion temperature. At these low alti-tudes the ion temperature is expected to be essentially the sameas the neutral temperature. The MSIS-83 (Réf. 15) model valuesof neutral temperature are therefore included in Fig. 1 for com-parison. Thus, in Fig. Ia there is some evidence for the pre-sence of heavy ions in the weaker layer at 2340- 2350 UT butno evidence for heavy ions in the intense Es layer at 2250- 2300
UT. Metallic ions (Fe+, Mg+, Na+, Al+) are often observed byrocket mass spectrometers to occur in thin layers and, sincesuch ions also have a long lifetime, allowing them to be con-centrated into thin layers by transport processes, they are oftenassumed to be the major constituent of E8 layers. The measure-ments in Fig. Ia could then be explained if the initial, strong E5
layer is composed mainly of the lighter metallic ions (Mg+,Na+, Al+) while the later, weaker layer is composed mainly ofFe+.
A more comprehensive study of ion composition in low altitudeEs layers has been presented in Réf. 5, also using measure-ments from the EISCAT radar but with considerably betteraltitude resolution than the measurements shown here. In thatstudy, large concentrations of heavier ions (assumed to be Fe+)are also found in some Es layers, but not in others. It is im-portant to realise that the incoherent scatter radar does notprovide measurements of the mass number of the ions. It canonly show that heavy ions must be present and their relativeconcentration can be found only under the assumption that theyhave a particular mass number. Thus, although the EISCAlmeasurements are consistent with the hypothesis that lowaltitude Es layers are composed of metallic ions, they do notprove that this is the case.
Whatever ions are present, some mechanism must be found toexplain their formation into a thin layer. As mentioned phove,and discussed in more detail in Réf. 6, neither the electric fieldnor the horizontal wind shear are expected to be effective at lowaltitudes, nor can they explain the appearance of neutral layers.In addition, in the case shown in Fig. Ia the EISCAT measure-ments of horizontal wind and electric field show these to be inthe wrong direction to produce convergence at the height of thelayers. In Réf. 4 it has been proposed that both ionised andneutral layers are produced by "sputtering" of particles from apre-existing layer of atmospheric dust by auroral precipitation.For the case shown in Fig. Ia, however, a very poor correlationis found between precipitation (as indicated by increasedelectron density above 100 km altitude) and layer appearance.Rather, a proposed mechanism of layer formation by vertical airmovement associated with a strong gravity-wave oscillation (asmeasured by the radar) is found to be more consistent with themeasurements (Réf. 6). This mechanism can explain both theneutral and ionised layers provided that some (diffuse) source ofsuitable material is provided above 100 km altitude (e.g. by
meteor ablation) and the vertical motion associated with thegravity wave falls to zero at the height of the layer.
3. BROADNIGHTTIMELAYERS
It has been found that the broader type of layer can almostalways be seen by the EISCAT radar sometime in the 1-2 hourspreceding the onset of a substorm in the Scandinavian sector(the converse is not necessarily true - layers also occur at timeswhen no subsequent substorm onset is seen or during generallydisturbed conditions). The profiles in Fig. Ib are examples oflayers seen during substorm growth phases. Here it can be seenthat the lower layer is broad enough that it might be produced byalmost monoenergetic electron precipitation, with a very sharpcutoff in fluxes for energies below 50 keV but a less sharpcutoff for higher energies. Using measurements from latitude-scanning experiments it has been found that these layers areseen over only a limited latitude extent (0.5 - 1°) and moveequatorward with time during the 1-2 hours preceding substormonset (Réf. 9). They appear to be the same phenomenon as iswell known from riometer observations (an equatorwarddrifting band of increased cosmic noise absorption, e.g. Réf. 7)and from measurements with balloon-borne X-ray detectors (anequatorward drifting zone of energetic electron precipitation,e.g. Réf. 8). There can be little doubt, therefore, that in thesecases the enhanced electron density layers are produced directlyby precipitation.
Comparison between the EISCAT electron density measure-ments and particle measurements from the Viking satellite hasshown that energetic electrons from the outer edge of thetrapped-particle population are most likely responsible for thelayers (Réf. 9). This is illustrated in Fig. 2. The upper panelsshow positive ion (PISP) and electron (ESP) fluxes measuredby the Viking satellite as it crossed northern Scandinavia and thelowest panel shows EISCAT electron density profiles measuredby a latitude scanning experiment at about the same time. Vikingwas travelling from south to north whereas the latitude scan wasfrom north to south so the measurements are exactly simul-taneous only at about 66° invariant latitude. The enhancedelectron density layer seen at about 68.5° was seen on thesubsequent latitude scan at about 67.5° at 1839-1844 UT so itwas probably ocated at about 68° at the time Viking passed thatlatitude. This can be seen to coincide with a narrow zone ofslightly enhanced fluxes in the energetic electrons (22 and 58keV) at the poleward edge of the zone of trapped electrons.According to other satellite measurements at this trappingboundary (Réf. 10), a sharp cutoff in the flux of precipitatingelectrons for energies below several tens of keV is oftenobserved and probably results from a strong dependence ofpitch-angle scattering on the gyroradius of the particles.
The apparent temperature profiles on the right hand side of Fig.Ib show, in this case, no clear evidence for unusual ion massesassociated with the enhanced layers. There is some indicationthat temperatures are lower than the model values (or ion masseshigher than 30.5 a.m.u) close to 100 km altitude, but this is wellabove the enhanced layer. However, the experiment modes usedare not well suited to temperature/mass measurements at alti-tudes below 95 km so that we cannot rule out the possibility of acontribution to the formation of these layers from unusual ions.
Other, broader nighttime layers appearing outside obvioussubstorm growth phases could similarly result from electronprecipitation from the outer edge of the ring-current. Themagnetospheric distortion which seems likely to cause theprecipitation ( magnetic field-lines becoming more tail-like, Réf.9) may occur without leading to a substorm, or may occur
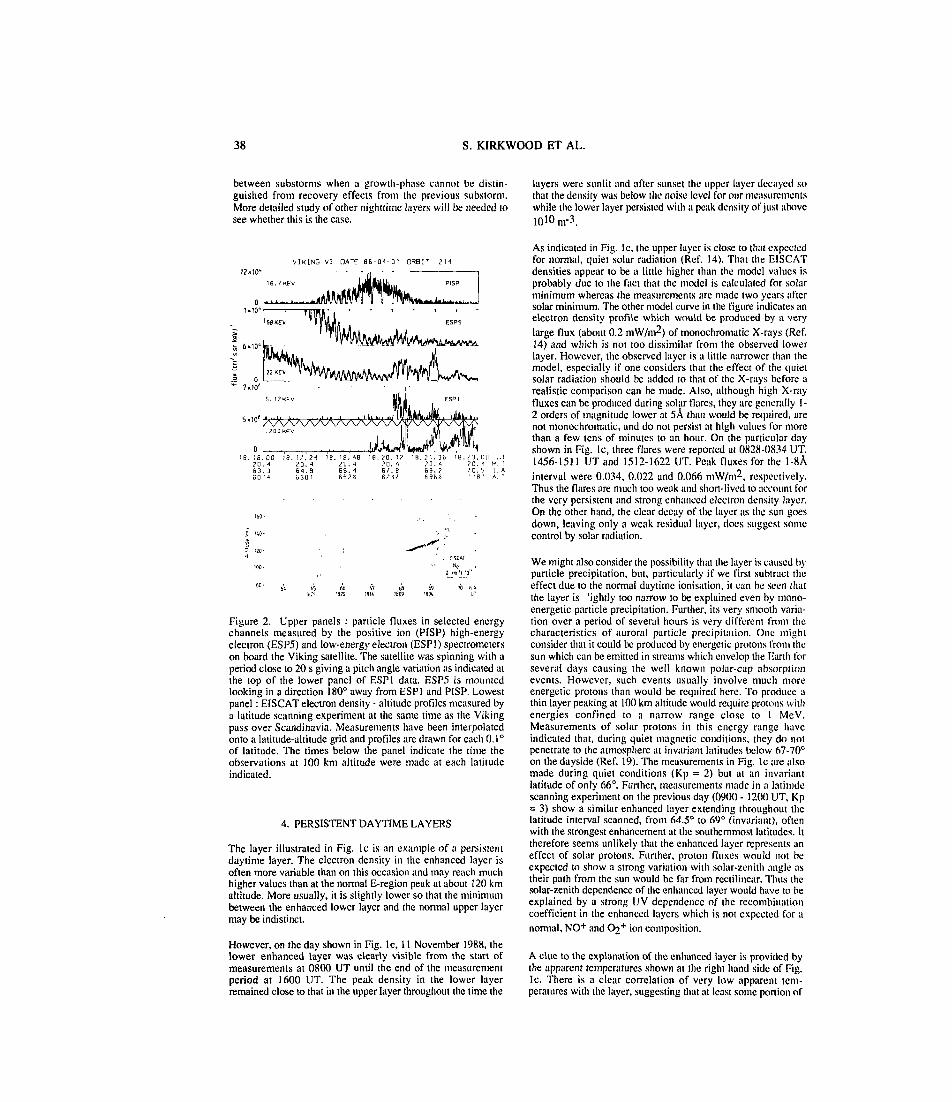
38 S. KIRKWOOD ET AL.
between substorms when a growth-phase cannot be distin-guished from recovery effects from the previous substorm.More detailed study of other nighttime layers will be needed 10see whether this is the case.
layers were sunlit and after sunset the upper layer decayed sothat the density was below the noise level for our measurementswhile the lower layer persisted with a peak density of just above
-3
VIKING V3 DATE 86-01-01 ORBIT 211
16. 7 Kf v
1 6 . 0 0 1 8 . 1 -7 . 2 •!?0. 1 20. 46 3 . 3 6 4 . 8S O ? 4 5 3 0 1
.20. 166. 46 S ? 6
1 8 . 3 0 . 1 ??0. 16/ . 86 / 4 /
. 2 1 . 36?0. 46 9 . ?fi 9 5 E
8. ? 3. C (I?0. 4
As indicated in Fig. Ic, the upper layer is close to that expectedfor normal, quiet solar radiation (Réf. 14). That the EISCATdensities appear to be a little higher than the model values isprobably due to the fact that the model is calculated for solarminimum whereas the measurements are made two years aftersolar minimum. The other model curve in the figure indicates anelectron density profile which would be produced by a verylarge flux (about 0.2 mW/m2) of monochromatic X-rays (Réf.14) and which is not too dissimilar from the observed lowerlayer. However, the observed layer is a little narrower than themodel, especially if one considers that the effect of the quietsolar radiation should be added to that of the X-rays before arealistic comparison can be made. Also, although high X-rayfluxes can be produced during solar flares, they are generally I-2 orders of magnitude lower at 5Â than would be required, arenot monochromatic, and do not persist at high values for morethan a few tens of minutes to an hour. On the particular dayshown in Fig. Ic, three flares were reported at 0828-0834 UT,1456-151 1 UT and 1512-1622 UT. Peak fluxes for the 1-8Âinterval were 0.034, 0.022 and 0.066 mW/m2, respectively.Thus the flares are much too weak and short-lived to account forthe very persistent and strong enhanced electron density layer.On the other hand, the clear decay of the layer as the sun goesdown, leaving only a weak residual layer, does suggest somecontrol by solar radiation.
70 U 4
Figure 2. Upper panels : panicle fluxes in selected energychannels measured by the positive ion (PISP) high-energyelectron (ESP5) and low-energy electron (ESPl) spectrometerson board the Viking satellite. The satellite was spinning with aperiod close to 20 s giving a pitch angle variation as indicated atthe top of the lower panel of ESPl data. ESP5 is mountedlooking in a direction 180° away from ESPl and PISP. Lowestpanel : ElSCAT electron density - altitude profiles measured bya latitude scanning experiment at the same time as the Vikingpass over Scandinavia. Measurements have been interpolatedonto a latitude-altitude grid and profiles are drawn for each 0.1°of latitude. The times below the panel indicate the time theobservations at 100 km altitude were made at each latitudeindicated.
4. PERSISTENTDAYTIMELAYERS
The layer illustrated in Fig. Ic is an example of a persistentdaytime layer. The electron density in the enhanced layer isoften more variable than on this occasion and may reach muchhigher values than at the normal E-region peak at about 120 kmaltitude. More usually, it is slightly lower so that the minimumbetween the enhanced lower layer and the normal upper layermay be indistinct.
However, on the day shown in Fig. Ic, 11 November 1988, thelower enhanced layer was clearly visible from the start ofmeasurements at 0800 UT until the end of the measurementperiod at 1600 UT. The peak density in the lower layerremained close to that in the upper layer throughout the time the
We might also consider the possibility that the layer is caused byparticle precipitation, but, particularly if we first subtract theeffect due to the normal daytime ionisation, it can be seen thatthe layer is 'ightly too narrow to be explained even by mono-energetic particle precipitation. Further, its very smooth varia-tion over a period of several hours is very different from thecharacteristics of auroral panicle precipitation. One mightconsider that it could be produced by energetic protons from thesun which can be emitted in streams which envelop the Earth forseveral days causing the well known polar-cap absorptionevents. However, such events usually involve much moreenergetic protons than would be required here. To produce athin layer peaking at 100 km altitude would require protons withenergies confined to a narrow range close to 1 MeV.Measurements of solar protons in this energy range haveindicated that, during quiet magnetic conditions, they do notpenetrate to the atmosphere at invariant latitudes below 67-70°on the dayside (Ref, 19). The measurements in Fig. Ic are alsomade during quiet conditions (Kp = 2) but at an invariantlatitude of only 66°. Further, measurements made in a latitudescanning experiment on the previous day (0900 - 1200 UT, Kp= 3) show a similar enhanced layer extending throughout thelatitude interval scanned, from 64.5° to 69° (invariant), oftenwith the strongest enhancement at the southernmost latitudes. Ittherefore seems unlikely that the enhanced layer represents aneffect of solar protons. Further, proton fluxes would not beexpected to show a strong variation with solar-zenith angle astheir path from the sun would be far from rectilinear. Thus thesolar-zenith dependence of the enhanced layer would have to beexplained by a strong UV dependence of the recombinationcoefficient in the enhanced layers which is not expected for anormal, NO+ and Qi+ ton composition.
A clue to the explanation of the enhanced layer is provided bythe apparent temperatures shown at the right hand side of Fig.Ic. There is a clear correlation of very low apparent tem-peratures with the layer, suggesting that at least some portion of
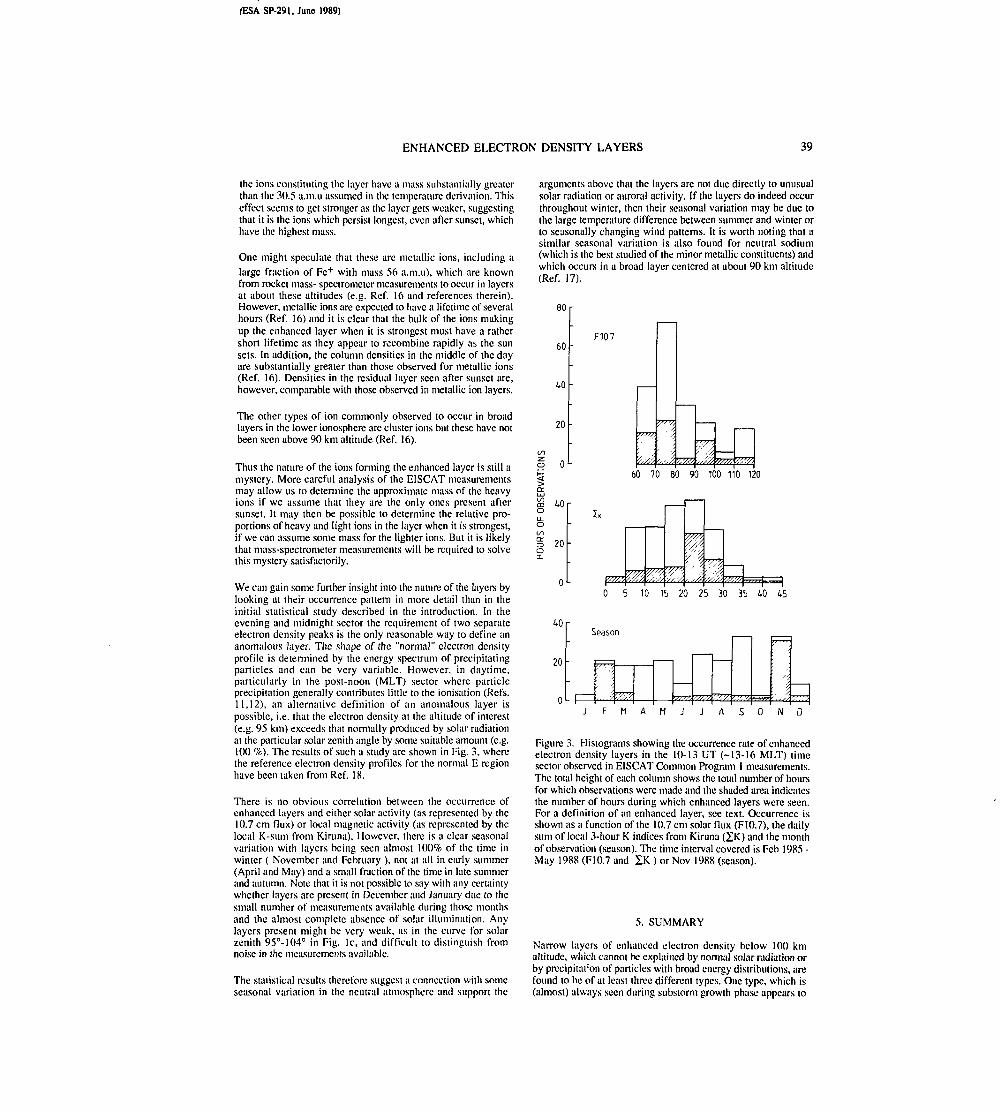
(ESA SP-291, June 1989)
ENHANCED ELECTRON DENSITY LAYERS 39
the ions constituting the layer have it mass substantially greaterthan the 30.5 a.m.u assumed in the temperature derivation. Thiseffect seems to get stronger as the layer gets weaker, suggestingthat it is the ions which persist longest, even after sunset, whichhave the highest mass.
One might speculate that these are metallic ions, including a
large fraction of Fe+ with mass 56 a.m.u), which are knownfrom rocket mass- spectrometer measurements to occur in layersat about these altitudes (e.g. Réf. 16 and references therein).However, metallic ions are expected to have a lifetime of severalhours (Réf. 16) and it is clear that the bulk of the ions makingup the enhanced layer when it is strongest must have a rathershort lifetime as they appear to recombine rapidly as the sunsets. In addition, the column densities in the middle of the dayare substantially greater than those observed for metallic ions(Réf. 16). Densities in the residual layer seen after sunset are,however, comparable with those observed in metallic ion layers.
The other types of ion commonly observed to occur in broadlayers in the lower ionosphere are cluster ions but these have notbeen seen above 90 km altitude (Réf. 16).
Thus the nature of the ions forming the enhanced layer is still amystery. More careful analysis of the EISCAT measurementsmay allow us to determine the approximate mass of the heavyions if we assume that they are the only ones present aftersunset. It may then be possible to determine the relative pro-portions of heavy and light ions in the layer when it is strongest,if we can assume some mass for the lighter ions. But it is likelythat mass-spectrometer measurements will be required to solvethis mystery satisfactorily.
We can gain some further insight into the nature of the layers bylooking at their occurrence pattern in more detail than in theinitial statistical study described in the introduction. In theevening and midnight sector the requirement of two separateelectron density peaks is the only reasonable way to define ananomalous layer. The shape of the "normal" electron densityprofile is determined by the energy spectrum of precipitatingparticles and can be very variable. However, in daytime,particularly in the post-noon (MLT) sector where particleprecipitation generally contributes little to the ionisation (Refs.11,12), an alternative definition of an anomalous layer ispossible, i.e. that the electron density at the altitude of interest(e.g. 95 km) exceeds that normally produced by solar radiationat the particular solar zenith angle by some suitable amount (e.g.100 %). The results of such a study are shown in Fig. 3, wherethe reference electron density profiles for the normal E regionhave been taken from Réf. 18.
There is no obvious correlation between the occurrence ofenhanced layers and either solar activity (as represented by the10.7 cm flux) or local magnetic activity (as represented by thelocal K-sum from Kiruna). However, there is a clear seasonalvariation with layers being seen almost 100% of the time inwinter ( November and February ), not at all in early summer(April and May) and a small fraction of the time in late summerand autumn. Note that it is not possible to say with any certaintywhether layers are present in December and January due to thesmall number of measurements available during those monthsand the almost complete absence of solar i l luminat ion. Anylayers present might be very weak, as in the curve for solarzenith 95°-104° in Fig. Ic1 and difficult to distinguish fromnoise in the measurements available.
The statistical results therefore suggest a connection with someseasonal variation in the neutral atmosphere and support the
arguments above that the layers are not due directly to unusualsolar radiation or auroral activity. If the layers do indeed occurthroughout winter, then their seasonal variation may be due tothe large temperature difference between summer and winter orto seasonally changing wind patterns. It is worth noting that asimilar seasonal variation is also found for neutral sodium(which is the best studied of the minor metallic constituents) andwhich occurs in a broad layer centered at about 90 km altitude(Réf. 17).
BOr
60
20
F107
§CC
OLLOC/ïetô
60 70 90 100 110 120
20
20
0L
O 5 10 15 20 25 30 35 40
Season
M J J S O N D
Figure 3. Histograms showing the occurrence rate of enhancedelectron density layers in the 10-13 UT (-13-16 MLT) timesector observed in EISCAT Common Program 1 measurements.The total height of each column shows the total number of hoursfor which observations were made and the shaded area indicatesthe number of hours during which enhanced layers were seen.For a definition of an enhanced layer, see text. Occurrence isshown as a function of the 10.7 cm solar flux (F10.7), the dailysum of local 3-hour K indices from Kiruna (ZK) and the monthof observation (season). The time interval covered is Fcb 1985 -May 1988 (F10.7 and IK ) or Nov 1988 (season).
5. SUMMARY
Narrow layers of enhanced electron density below 100 kmaltitude, which cannot be explained by normal solar radiation orby precipitai'on of panicles with broad energy distributions, arefound to be of at least three different types. One type, which is(almost) always seen during substorm growth phase appears to
40 S. KIRKWOOD ET AL.
be directly produced by electron precipitation with a sharp cut-off in fluxes for energies below a few tens of keV. A secondtype, much too narrow to be produced even by monoenergelicparticle precipitation, is seen simultaneously with similar layersin neutral sodium and may be caused by dynamic convergenceof metallic atoms and ions into thin layers by vertical neutral airmotions associated with strong gravity waves. A third type,which is seen primarily during winter daytime but which canpersist at a weaker level into the early evening, seems 10 becaused by the presence of unusual ion species (i.e. not NO+ orO2+). At least some portion of the ions present appear to have amass substantially greater than 30.5 a.m.u. but their exactnature is as yet unknown.
6. ACKNOWLEDGEMENTS
The EISCAT Scientific Association is supported by the CentreNational de la Recherche Scientifique of France, SuomenAkatemia of Finland, Max Planck Gesellschaft of WestGermany, Norges Almenvitenskaplige Forskningsrad ofNorway, Naturvetenskapliga Forskningsradet of Sweden andthe Science and Engineering Research Council of Great Britain.The Viking project was managed by the Swedish SpaceCorporation under contract from the Swedish Board for SpaceActivities. The work of S.K. is supported by the NFR ofSweden.
7. REFERENCES
1. Collis P N & Turunen T 1987, Horizontal extent and verticalmotions of a mid-latitude sporadic E layer observed byEISCAT, Physica Scripts 35,883-886.
2. Collis P N & Kirkwood S C !989, Discrete layers of D-region ionisation in the high-latitude ionosphere, Adv.Space Res., in press.
3. Nygren T et al 1984, The role of electric field and neutralwind in the formation of sporadic E layers, /. Atmos. Terr.Phys. 46, 373-381.
4. von Zahn U & Hansen T L 1988, Sudden neutral sodiumlayers : a strong link to sporadic E layers, J. Atmos. Terr.Phys. 50, 93-104.
5. Huuskonen A et al 1988, Ion composition in sporadic Elayers measured by the EISCAT UHF radar, J. Geophys.Res. 93, 14603-14610.
6. Kirkwood S & Collis P N 1989, Gravity wave generation ofsimultaneous auroral sporadic E layers and sudden neutralsodium layers, J. Atmos. Terr. Phys., in press.
7. Ranta H et al 1981, Development of the auroral absorptionsubstorm : studies of pre-onset phase and sharp onset usingan extensive riometer network, Planet. Space Sd. 29,1287-1304.
8. Pytte T et al 1976, On the morphology of energetic (>30keV) electron precipitation during the growth phase ofmagnetospheric substorms, J. Almas. Terr. Phys. 38, 739-755.
9. Kirkwood S & Eliasson L 1989, Energetic particle pre-cipitation in the substorm growth phase measured byEISCAT and Viking, submitted to J. Geophys. Res.
lO.Imhof W L 1988, Fine resolution measurements of the L-dependent energy threshold for isotropy at the trappingboundary, J. Geophys. Res. 93, 9743-9752.
1 !.Hardy D A et al 1985, A statistical model of auroral electronprecipitation, J. Geophys. Res. 90, 4229-4248.
12.Hardy D A et al 1989, A statistical model of auroral ionprecipitation, J. Geophys. Res. 94, 370-392.
13.Rees M H 1963, Auroral ionisation and excitation byincident energetic electrons, Planet. Space Set. 11, 1209-1218.
14.Ohshio M 1978, Ionospheric D region disturbances causedby solar X-ray flares. Radio Research Laboratories,Ministry of Posts and Telecommunications, Tokyo
IS.Hedin A E 1983, A revised thermospheric model based onmass spectrometer and incoherent scatter data: MSIS-83, J.Geophys. Res. 88, 10170-10188.
lo.Kopp E & Hermann U 1984, Ion composition in the lowerionosphere, Ann. Geophys. 2, 83-94.
17.Jegou J P et al 1985, General theory of the alkali metalspresent in the Earth's upper atmosphere. II. Seasonal andmeridional variations, Ann. Geophys. 3, 299-312.
18.Kirkwood S & Collis P N 1987, The high-latitude lowerionosphere observed by EISCAT, Adv. Space Res. 1 (6),83-86.
19,Stone E C 1964, Local time dependence of non - St0rmercutoff for 1.5 MeV protons in quiet magnetic field, J.Geophys. Res. 3577 - 3582.
SESSION 3MTODLE ATMOSPHERE
Chairmen:U. von ZahnM.L. Chanin
C. Hall
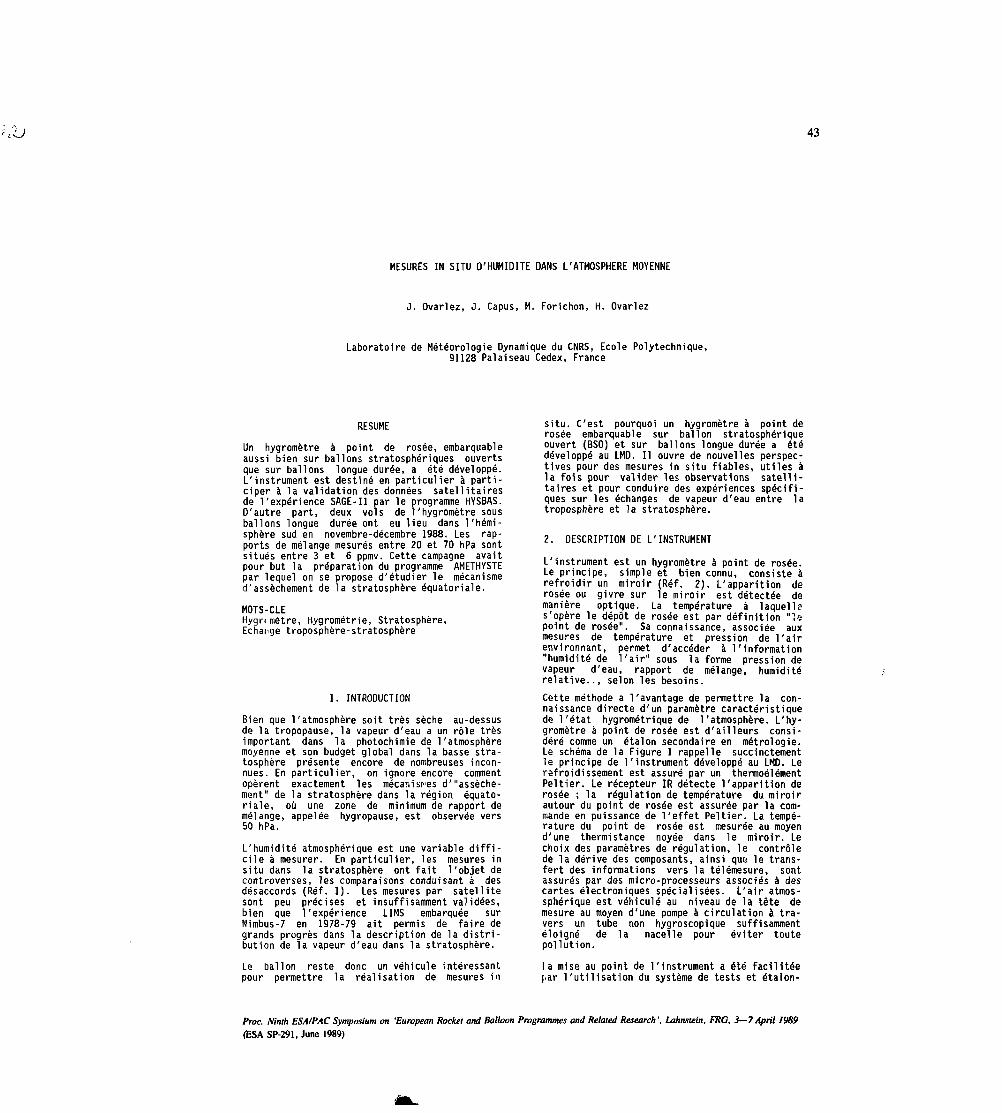
43
MESURES IN SITU D'HUMIDITE DANS L'ATMOSPHERE MOYENNE
J. Ovarlez, J. Capus, H. Forichon, H. Ovarlez
Laboratoire de Météorologie Dynamique du CNRS, Ecole Polytechnique,91128 Pal ai seau Cedex, France
RESUME
Un hygromètre à point de rosée, embarquableaussi bien sur ballons stratosphériques ouvertsque sur ballons longue durée, a été développé.L'instrument est destiné en particulier à parti-ciper à la validation des données satellitairesde l'expérience SAGE-II par le programme HYSBAS.D'autre part, deux vols de l'hygromètre sousballons longue durée ont eu lieu dans l'hémi-sphère sud en novembre-décembre 1988. Les rap-ports de mélange mesurés entre 20 et 70 hPa sontsitués entre 3 et 6 ppmv. Cette campagne avaitpour but la préparation du programme AMETHYSTEpar lequel on se propose d'étudier le mécanismed'assèchement de la stratosphère équatoriale.
MOTS-CLEHygn mètre, Hygrométrie, Stratosphère,Echange troposphère-stratosphère
1. INTRODUCTION
Bien que l'atmosphère soit très sèche au-dessusde la tropopause, la vapeur d'eau a un rôle trèsimportant dans la photochimie de 1'atmosphèremoyenne et son budget global dans la basse stra-tosphère présente encore de nombreuses incon-nues. En particulier, on ignore encore commentopèrent exactement les mécanisnes d'"assèche-ment" de la stratosphère dans la région équato-riale, où une zone de minimum de rapport demélange, appelée hygropause, est observée vers50 hPa.
L'humidité atmosphérique est une variable diffi-cile à mesurer. En particulier, les mesures insitu dans la stratosphère ont fait l'objet decontroverses, les comparaisons conduisant à desdésaccords (Réf. 1). Les mesures par satellitesont peu précises et insuffisamment validées,bien que l'expérience LIMS embarquée surNimbus-7 en 1978-79 ait permis de faire degrands progrès dans la description de la distri-bution de la vapeur d'eau dans la stratosphère.
Le ballon reste donc un véhicule intéressantpour permettre la réalisation de mesures in
situ. C'est pourquoi un hygromètre à point derosée embarquable sur ballon stratosphériqueouvert (BSO) et sur ballons longue durée a étédéveloppé au LMD. Il ouvre de nouvelles perspec-tives pour des mesures in situ fiables, utiles àla fois pour valider les observations satelli-taires et pour conduire des expériences spécifi-ques sur les échanges de vapeur d'eau entre latroposphère et la stratosphère.
2. DESCRIPTION DE L'INSTRUMENT
L'instrument est un hygromètre à point de rosée.Le principe, simple et bien connu, consiste àrefroidir un miroir (Réf. 2). L'apparition derosée ou givre sur le miroir est détectée demanière optique. La température à laquelles'opère le dépôt de rosée est par définition "~i«point de rosée". Sa connaissance, associée auxmesures de température et pression de l'airenvironnant, permet d'accéder à l'information"humidité de l'air" sous la forme pression devapeur d'eau, rapport de mélange, humiditérelative.., selon les besoins.Cette méthode a l'avantage de permettre la con-naissance directe d'un paramètre caractéristiquede l'état hygrométrique de l'atmosphère. L'hy-gromètre à point de rosée est d'ailleurs consi-déré comme un étalon secondaire en métrologie.Le schéma de la Figure 1 rappelle succinctementle principe de l'instrument développé au LHD. Lerefroidissement est assuré par un thermoélémentPeltier. Le récepteur IR détecte l'apparition derosée ; la régulation de température du miroirautour du point de rosée est assurée par la com-mande en puissance de l'effet Peltier. La tempé-rature du point de rosée est mesurée au moyend'une thermistance noyée dans le miroir. Lechoix des paramètres de régulation, le contrôlede la dérive des composants, ainsi quy le trans-fert des informations vers la télémesure, sontassurés par des micro-processeurs associés à descartes électroniques spécialisées. L'air atmos-sphérique est véhiculé au niveau de la tête demesure au moyen d'une pompe à circulation à tra-vers un tube non hygroscopique suffisammentéloigné de la nacelle pour éviter toutepollution.
la mise au point de l'instrument a été facilitéepar l'utilisation du système de tests et étalon-
Proc. Ninth ESAIPAC Symposium on 'European Rocket and Balloon Programmes and Related Research', Lahnslein, FKG, 3—7April IV89
(ESA SP-291, June 1989)
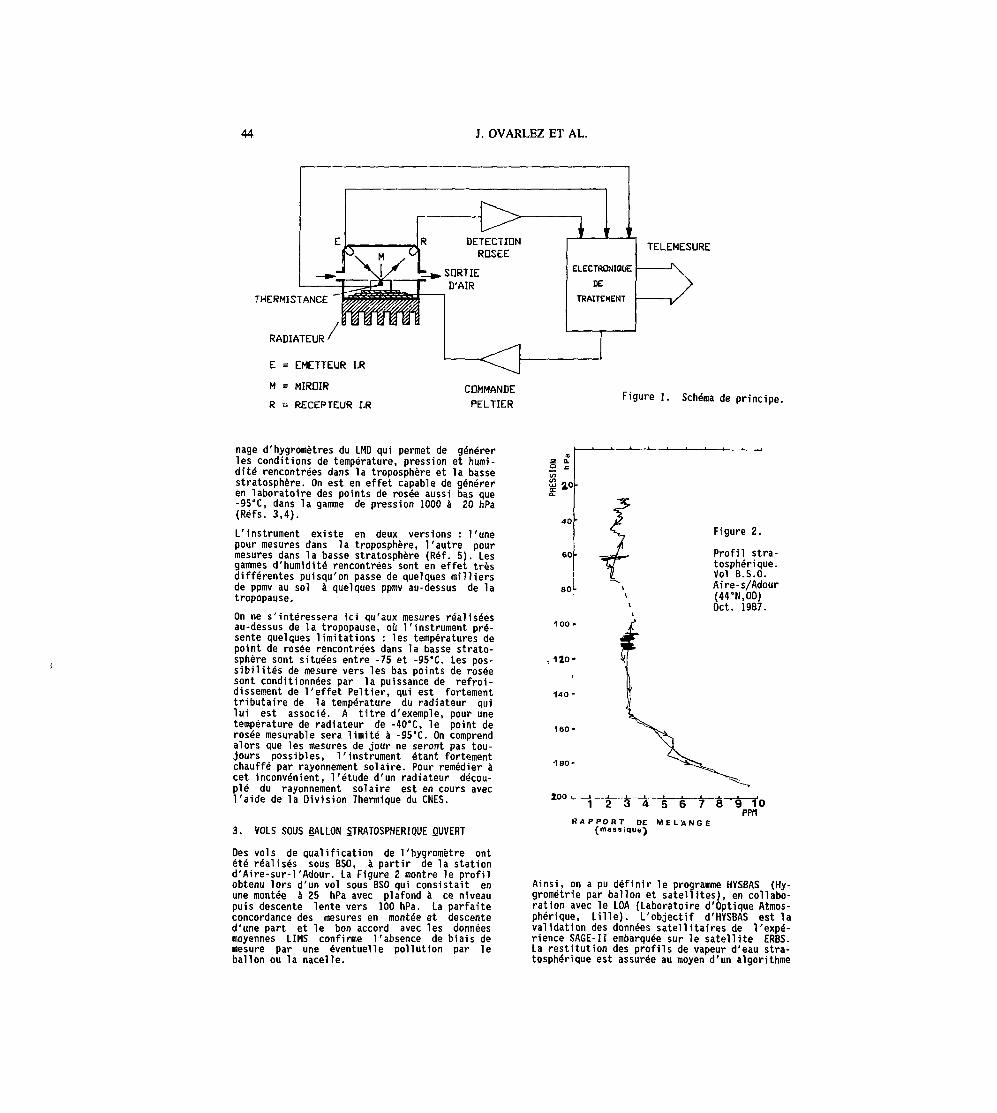
44 J. OVARLEZ ET AL.
TELEMESURE
THERMISTANCE
RADIATEUR
E = EMETTEUR I.R
M = MIROIR
R = RECEPTEUR I.R
COMMANDE
PELTIERFigure I. Schéma de principe.
nage d'hygromètres du LMD qui permet de générerles conditions de température, pression et humi-dité rencontrées dans la troposphère et la bassestratosphère. On est en effet capable de généreren laboratoire des points de rosée aussi bas que-950C, dans la gamme de pression 1000 à 20 hPa(Réfs. 3,4).
L'instrument existe en deux versions : Tunepour mesures dans la troposphère, l'autre pourmesures dans la basse stratosphère (Réf. 5). Lesgammes d'humidité rencontrées sont en effet trèsdifférentes puisqu'on passe de quelques milliersde ppmv au sol à quelques ppmv au-dessus de latropopause.
On ne s'intéressera ici qu'aux mesures réaliséesau-dessus de la tropopause, où l'instrument pré-sente quelques limitations : les températures depoint de rosée rencontrées dans la basse strato-sphère sont situées entre -75 et -950C. Les pos-sibilités de mesure vers les bas points de roséesont conditionnées par la puissance de refroi-dissement de l'effet Peltier, qui est fortementtributaire de la température du radiateur quilui est associé. A titre d'exemple, pour unetempérature de radiateur de -4O0C, le point derosée mesurable sera limité à -95°C. On comprendalors que les mesures de jour ne seront pas tou-jours possibles, l'instrument étant fortementchauffé par rayonnement solaire. Pour remédier àcet inconvénient, l'étude d'un radiateur décou-plé du rayonnement solaire est en cours avecl'aide de la Division Thermique du CNES.
3. VOLS SOUS BALLON STRATOSPHERIQUE OUVERT
Des vols de qualification de l'hygromètre ontété réalisés sous BSO, à partir de la stationd'Aire-sur-TAdour. La Figure 2 montre le profilobtenu lors d'un vol sous BSO qui consistait enune montée à 25 hPa avec plafond à ce niveaupuis descente lente vers 100 hPa. La parfaiteconcordance des mesures en montée et descented'une part et le bon accord avec les donnéesmoyennes LIMS confirme l'absence de biais demesure par une éventuelle pollution par leballon ou la nacelle.
2 î<S>
a a
40
80
100
Figure 2.
Profil stra-tosphérique.Vol B.S.O.Aire-s/Adour(440N,00)Oct. 1987.
« A P P O R T DE MEL » NGH(massique)
PPfI
Ainsi, on a pu définir le programme HYSBAS (Hy-grométrie par ballon et satellites), en collabo-ration avec le LOA (Laboratoire d'Optique Atmos-phérique, Lille). L'objectif d'HYSBAS est lavalidation des données satellitaires de l'expé-rience SAGE-II embarquée sur le satellite ERBS.La restitution des profils de vapeur d'eau stra-tosphérique est assurée au moyen d'un algorithme
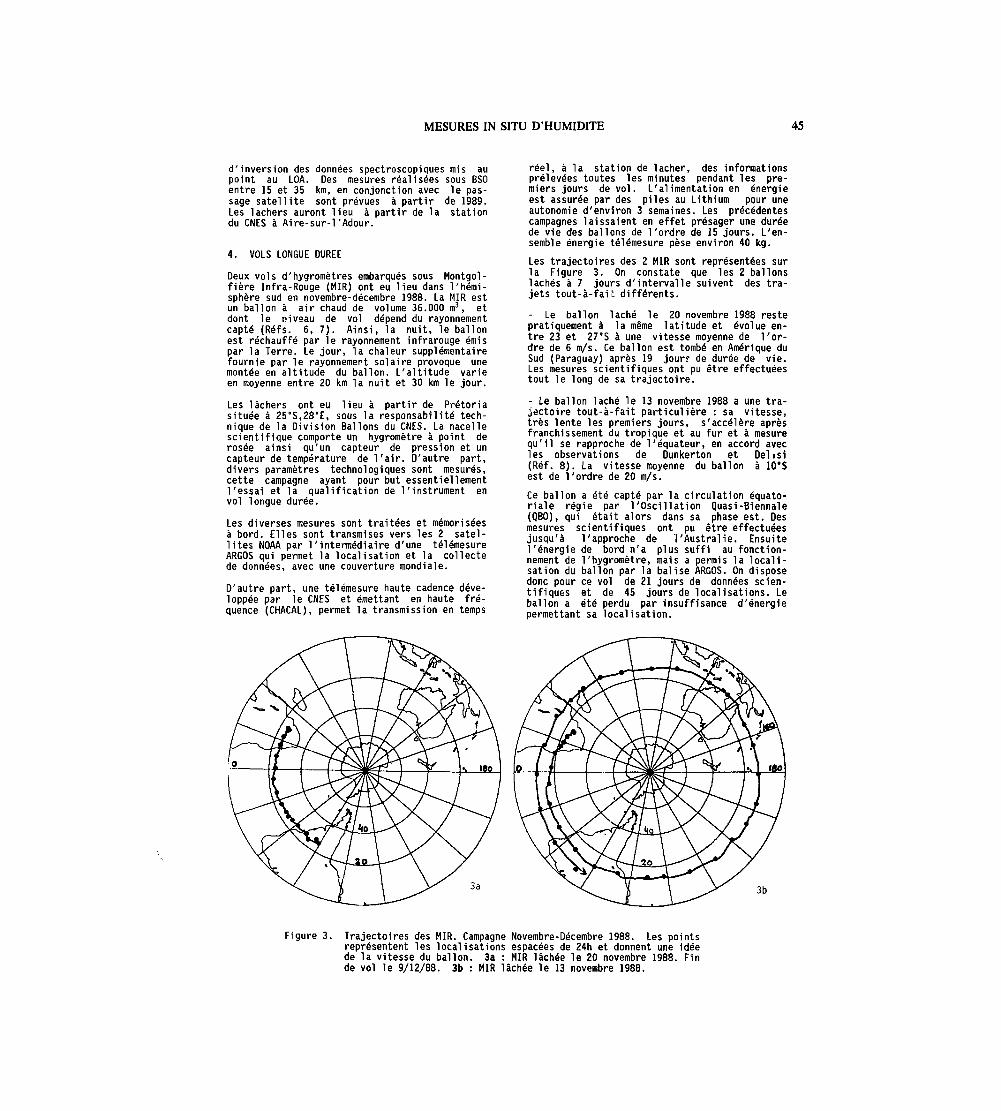
MESURES IN SITU D'HUMIDITE 45
d'inversion des données spectroscopiques mis aupoint au LOA. Des mesures réalisées sous BSOentre 15 et 35 km, en conjonction avec le pas-sage satellite sont prévues à partir de 1989.Les lâchers auront lieu à partir de la stationdu CNES à Aire-sur-1'Adour.
4. VOLS LONGUE DUREE
Deux vols d'hygromètres embarqués sous Montgol-fière Infra-Rouge (MIR) ont eu lieu dans l'hémi-sphère sud en novembre-décembre 1988. La MIR estun ballon à air chaud de volume 36.000 m3, etdont le niveau de vol dépend du rayonnementcapté (Réfs. 6, 7). Ainsi, la nuit, le ballonest réchauffé par le rayonnement infrarouge émispar la Terre. Le jour, la chaleur supplémentairefournie par le rayonnement solaire provoque unemontée en altitude du ballon. L'altitude varieen moyenne entre 20 km la nuit et 30 km le jour.
Les lâchers ont eu lieu à partir de Pretoriasituée à 25°S,28°E, sous la responsabilité tech-nique de la Division Ballons du CNES. La nacellescientifique comporte un hygromètre à point derosée ainsi qu'un capteur de pression et uncapteur de température de l'air. D'autre part,divers paramètres technologiques sont mesurés,cette campagne ayant pour but essentiellementl'essai et la qualification de l'instrument envol longue durée.
Les diverses mesures sont traitées et mémoriséesà bord. Elles sont transmises vers les 2 satel-lites NOAA par l'intermédiaire d'une télémesureARGOS qui permet la localisation et la collectede données, avec une couverture mondiale.
D'autre part, une télémesure haute cadence déve-loppée par le CNES et émettant en haute fré-quence (CHACAL), permet la transmission en temps
réel, à la station de lâcher, des informationsprélevées toutes les minutes pendant les pre-miers jours de vol. L'alimentation en énergieest assurée par des piles au Lithium pour uneautonomie d'environ 3 semaines. Les précédentescampagnes laissaient en effet présager une duréede vie des ballons de Tordre de 15 jours. L'en-semble énergie télémesure pèse environ 40 kg.
Les trajectoires des 2 MIR sont représentées surla Figure 3. On constate que les 2 ballonslâchés à 7 jours d'intervalle suivent des tra-jets tout-à-faii différents.
- Le ballon lâché le 20 novembre 1988 restepratiquement à la même latitude et évolue en-tre 23 et 27°S à une vitesse moyenne de l'or-dre de 6 m/s. Ce ballon est tombé en Amérique duSud (Paraguay) après 19 jourr de durée de vie.Les mesures scientifiques ont pu être effectuéestout le long de sa trajectoire.
- Le ballon lâché le 13 novembre 1988 a une tra-jectoire tout-à-fait particulière : sa vitesse,très lente les premiers jours, s'accélère aprèsfranchissement du tropique et au fur et à mesurequ'il se rapproche de l'équateur, en accord avecles observations de Dunkerton et Dell si(Réf. 8). La vitesse moyenne du ballon à 10'Sest de l'ordre de 20 m/s.
Ce ballon a été capté par la circulation équato-riale régie par l'Oscillation Quasi-Biennale(QBO), qui était alors dans sa phase est. Desmesures scientifiques ont pu être effectuéesjusqu'à l'approche de l'Australie. Ensuitel'énergie de bord n'a plus suffi au fonction-nement de l'hygromètre, mais a permis la locali-sation du ballon par la balise ARGOS. On disposedonc pour ce vol de 21 jours de données scien-tifiques et de 45 jours de localisations. Leballon a été perdu par insuffisance d'énergiepermettant sa localisation.
3b
Figure 3. Trajectoires des MIR. Campagne Novembre-Décembre 1988. Les pointsreprésentent les localisations espacées de 24h et donnent une idéede la vitesse du ballon. 3a : MIR lâchée le 20 novembre 1988. Finde vol le 9/12/88. 3b : MIR lâchée le 13 novembre 1988.
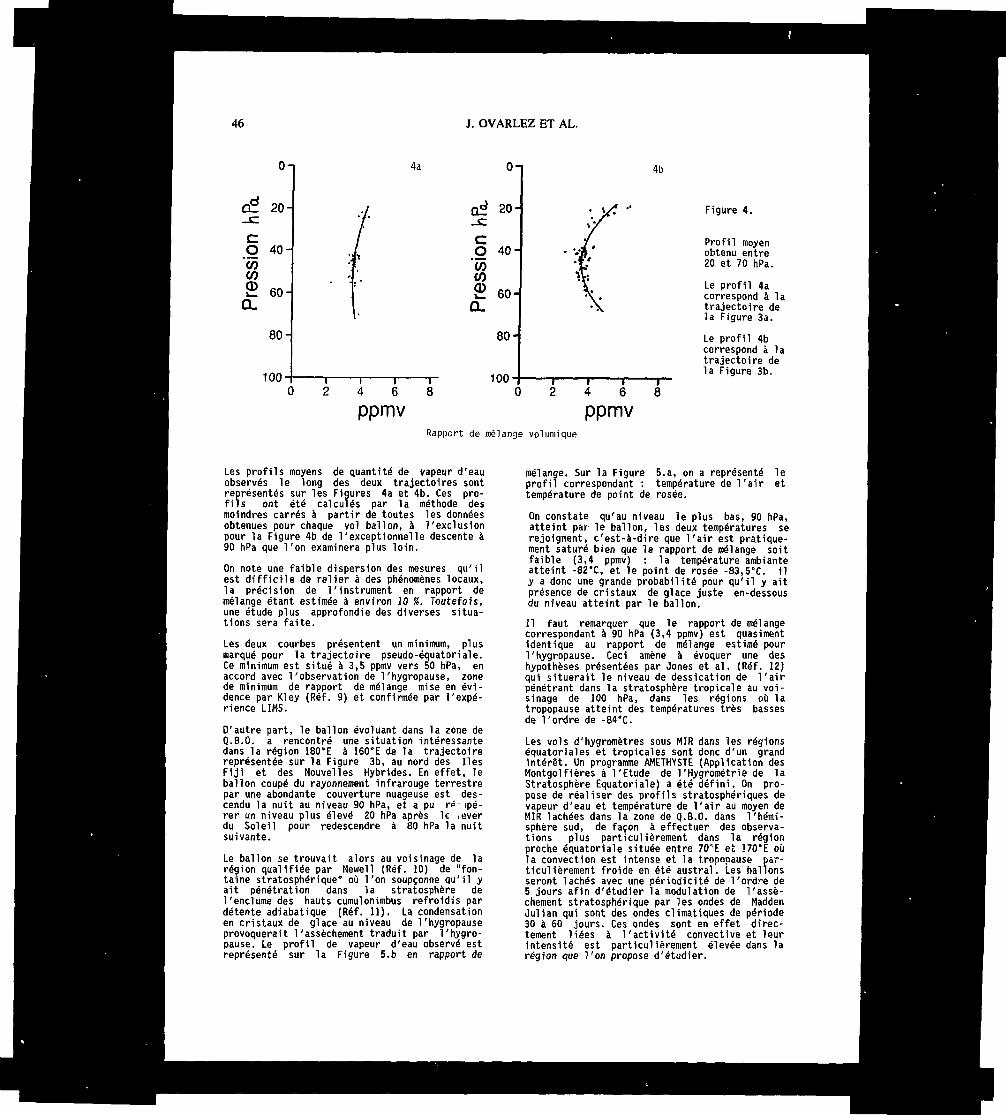
46 J. OVARLEZ ET AL.
C40-
O) K n ,60-
80-
100'
4a On
OS 20-
CO 40-'(O
2 6OH
80-
4 6 8
ppmv
100'
4b
1 I6 8
ppmv
Figure 4.
Profil moyenobtenu entre20 et 70 hPa.
Le profil 4acorrespond à latrajectoire dela Figure 3a.
Le profil 4bcorrespond à latrajectoire dela Figure 3b.
Rapport de mélange volumique
Les profils moyens de quantité de vapeur d'eauobservés le long des deux trajectoires sontreprésentés sur les Figures 4a et 4b. Ces pro-fils ont été calculés par la méthode desmoindres carrés à partir de toutes les donnéesobtenues pour chaque vol ballon, à l'exclusionpour la Figure 4b de l'exceptionnelle descente à90 hPa que l'on examinera plus loin.
On note une faible dispersion des mesures qu'ilest difficile de relier à des phénomènes locaux,la précision de l'instrument en rapport demélange étant estimée à environ 10 %. Toutefois,une étude plus approfondie des diverses situa-tions sera faite.
Les deux courbes présentent un minimum, plusmarqué pour la trajectoire pseudo-équatoriale.Ce minimum est situé à 3,5 ppmv vers 50 hPa, enaccord avec l'observation de l'hygropause, zonede minimum de rapport de mélange mise en évi-dence par Kley (Réf. 9) et confirmée par l'expé-rience LIMS.
D'autre part, le ballon évoluant dans la zone deQ.B.O. a rencontré une situation intéressantedans la région 180'E à 160°E de la trajectoirereprésentée sur la Figure 3b, au nord des IlesFiji et des Nouvelles Hybrides. En effet, leballon coupé du rayonnement infrarouge terrestrepar une abondante couverture nuageuse est des-cendu la nuit au niveau 90 hPa, et a pu ré ipé-rer un niveau plus élevé 20 hPa après le .everdu Soleil pour redescendre à 80 hPa la nuitsuivante.
Le ballon se trouvait alors au voisinage de larégion qualifiée par Newell (Réf. 10) de "fon-taine stratosphérique" où l'on soupçonne qu'il yait pénétration dans la stratosphère del'enclume des hauts cumulonimbus refroidis pardétente adiabatique (Réf. 11). La condensationen cristaux de glace au niveau de l'hygropauseprovoquerait l'assèchement traduit par l'hygro-pause. Le profil de vapeur d'eau observé estreprésenté sur la Figure 5.b en rapport de
mélange. Sur la Figure 5.a, on a représenté leprofil correspondant : température de l'air ettempérature de point de rosée.
On constate qu'au niveau le plus bas, 90 hPa,atteint par le ballon, les deux températures serejoignent, c'est-à-dire que l'air est pratique-ment saturé bien que le rapport de mélange soitfaible (3,4 ppmv) : la température ambianteatteint -82"C, et le point de rosée -83,5"C. ily a donc une grande probabilité pour qu'il y aitprésence de cristaux de glace juste en-dessousdu niveau atteint par le ballon.
Il faut remarquer que le rapport de mélangecorrespondant à 90 hPa (3,4 ppmv) est quasimentidentique au rapport de mélange estimé pourThygropause. Ceci amène à évoquer une deshypothèses présentées par Jones et al. (Réf. 12)qui situerait le niveau de dessication de l'airpénétrant dans la stratosphère tropicale au voi-sinage de 100 hPa, dans les régions où latropopause atteint des températures très bassesde Tordre de -84°C.
Les vols d'hygromètres sous MIR dans les régionséquatoriales et tropicales sont donc d'un grandintérêt. Un programme AMETHYSTE (Application desMontgolfières à l'Etude de 1'Hygrométrie de laStratosphère Equatoriale) a été défini. On pro-pose de réaliser des profils stratosphériques devapeur d'eau et température de l'air au moyen deMIR lâchées dans la zone de Q.B.O. dans l'hémi-sphère sud, de façon à effectuer des observa-tions plus particulièrement dans la régionproche équatoriale située entre 70''E et !70"E oùla convection est intense et la tropopause par-ticulièrement froide en été austral. Les ballonsseront lâchés avec une périodicité de Tordre de5 jours afin d'étudier la modulation de l'assè-chement stratosphérique par les ondes de MaddenJulian qui sont des ondes climatiques de période30 à 60 jours. Ces ondes sont en effet direc-tement liées à l'activité convective et leurintensité est particulièrement élevée dans larégion que Ton propose d'étudier.
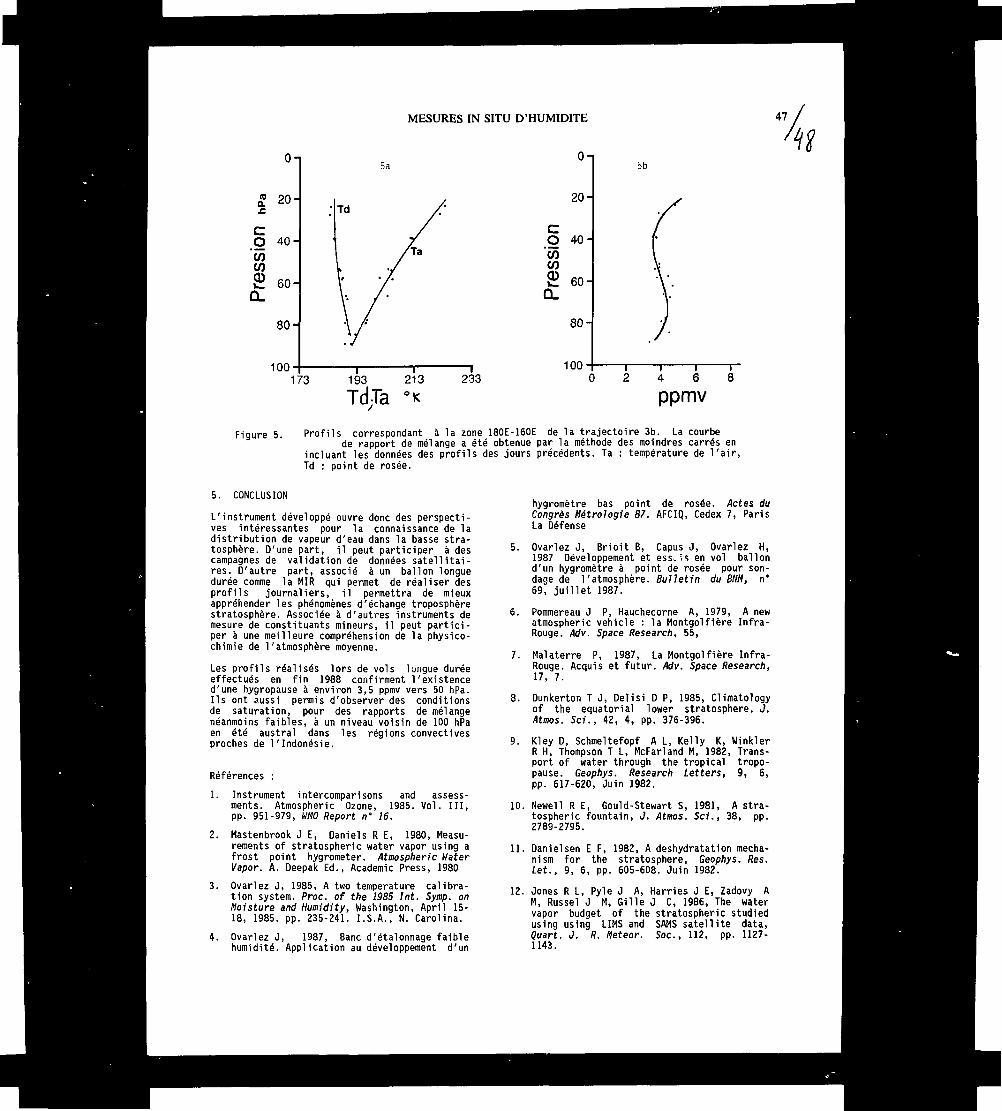
0-
£ 20
CO 40'
'(OCOCD
Q.60-
80-
100
5a
MESURES IN SITU D'HUMIDITE
O
20
CCD 40'coco£ 60
CL
80-
47
100
5b
173 193
TdTa2130K
233 2 4 6 8
ppmv
Figure 5. Profils correspondant à Ia zone 180E-160E de la trajectoire 3b. La courbede rapport de mélange a été obtenue par la méthode des moindres carrés en
incluant les données des profils des jours précédents. Ta : température de l'air,Td : point de rosée.
5. CONCLUSION
L'instrument développé ouvre donc des perspecti-ves intéressantes pour la connaissance de ladistribution de vapeur d'eau dans la basse stra-tosphère. D'une part, il peut participer à descampagnes de validation de données satellitai-res. D'autre part, associé à un ballon longuedurée comme la MIR qui permet de réaliser desprofils journaliers, il permettra de mieuxappréhender les phénomènes d'échange troposphèrestratosphère. Associée à d'autres instruments demesure de constituants mineurs, il peut partici-per à une meilleure compréhension de la physico-chimie de l'atmosphère moyenne.
Les profils réalisés lors de vols longue duréeeffectués en fin 1988 confirment l'existenced'une hygropause à environ 3,5 ppmv vers 50 hPa.Ils ont aussi permis d'observer des conditionsde saturation, pour des rapports de mélangenéanmoins faibles, à un niveau voisin de 100 hPaen été austral dans les régions convectivesproches de l'Indonésie.
Références :
1. Instrument intercomparisons and assess-ments. Atmospheric Ozone, 1985. Vol. III,pp. 951-979, WWO Report n° 16.
2. Mastenbrook J E, Daniels R E, 1980, Measu-rements of stratospheric water vapor using afrost point hygrometer. Atmospheric HaterVapor. A. Deepak Ed., Academic Press, 1980
3. Oyarlez J, 1985, A two temperature calibra-tion system. Proc. of the 1985 Int. Symp. onMoisture and Humidity, Washington, April IB-IS, 1985. pp. 235-241. I.S.A., N. Carolina.
4. Ovarlez J, 1987, Banc d'étalonnage faiblehumidité. Application au développement d'un
6.
7.
hygromètre bas point de rosée. Actes duCongrès Métrologie 87. AFCIQ, Cedex 7, ParisLa Défense
Ovarlez J, Brioit B, Capus J, Ovarlez H,1987 Développement et essais en vol ballond'un hygromètre à point de rosée pour son-dage de l'atmosphère. Bulletin du BNH, n*69, juillet 1987.
Pommereau J P, Hauchecorne A, 1979, A newatmospheric vehicle : la Montgolfière Infra-Rouge. Adv. Space Research, 55,
Malaterre P, 1987, La Montgolfière Infra-Rouge. Acquis et futur. Adv. Space Research,17, 7.
8. Dunkerton T J, Delisi D P, 1985, Climatologyof the equatorial lower stratosphere. J.Atmos. Sd., 42, 4, pp. 376-396.
9. Kley D, Schmeltefopf A L, Kelly K, WinklerR H, Thompson T L, McFarland M, 1982, Trans-port of water through the tropical tropo-pause. Geophys. Research Letters, 9, 6,pp. 617-620, Juin 1982.
10. Newell R E, Gould-Stewart S, 1981, A stra-tospheric fountain, J. Atmos. Sd., 38, pp.2789-2795.
11. Daniel sen E F, 1982, A deshydratation mecha-nism for the stratosphere, Geophys. Res.Let., 9, 6, pp. 605-608. Juin 1982.
12. Jones R L, PyIe J A, Harries J E, Zadovy AM, Russel J M, Gille J C, 1986, The watervapor budget of the stratospheric studiedusing using LIMS and SAMS satellite data,Quart. J. R. Meteor. Soc., 112, pp. 1127-1143.
49
NEW CALCULATIONS OF PHOTODISSOCIATION CROSS-SECTIONS IN THE O2 SCHUMANN-RUNGE SYSTEM
Oonal P. Murtagh
Department of MeteorologyArrhenius Laboratory
University of StockholmS-106 91 Stockholm
Sweden
ABSTRACT
The large amount of new spectroscopic information that hasbecome available in recent years makes recalculation of atomicoxygen production rates by photodissociation in the Schumann-Runge band region necessary. The results of such a calculationindicate that, on the whole, the new spectroscopic data do not giverise to large changes from the existing recommendations of theWorld Meteorological Organisation. However they do indicatehigher atmospheric transmission in the region 194 to 200 nm, asobserved by recent balloon experiments. Parameterlsatlon of theresults is also considered and a method based upon O2 columndensity and local atmospheric temperature is presented. Thisparameterisatlon Is accurate to better than 5% for a wide range ofsolar zenith angles and atmospheric conditions.
Keywords: Schumann-Runge, Oxygen cross-sections. Oxygenphotodissociation.
!.INTRODUCTION
Photodissociation of O2 in the region of the Schumann-Runge (SR)bands (175-200 nm) Is the dominant source of odd oxygen in themésosphère and an important contributor to the stratosphericproduction. Its proper representation In photochemical models ofthe middle atmosphere is therefore an important consideration.However the complex band structure prohibits a detailed treatmentin such models because of the computational expense involved.Accordingly a simplified parameterisation Is necessary. Thisusually involves dividing the region into a manageable number ofspectral Intervals which in standard modelling practice are500 cm'1 wide and 17 in number (Réf. 1). Effective cross-sectionsand transmissions for each Interval as a function of penetrationdepth Into some standard atmosphere are then calculated andtabulated. These can be used directly as suggested by Frederick inthe World Meteorological Organisation's (WMO's) 1986 report onatmospheric ozone (Réf. 2) or be fitted with polynomial functions asdone by Allen and Frederick (Réf. 3). The latter authors have alsolooked at the effect of solar zenith angle. This effect arises as aresult of the temperature dependence of the absorption cross-section and the fact that the temperature profile as a function ofabsorption path length is dependent on the direction of penetration.
Since these studies were carried out a large amount of newspectroscopic information has become available regarding linepositions, line widths and band oscillator strengths (Refs. 4, 5, 6).These new data led Murtagh (Réf. 7) to perform new detailedcalculations. As a result of this work the author realised thatexisting parameterisatlons were not applicable to arbitrary modelatmospheres without Introducing errors on the order of 20% In the
photodissociation rates. This paper will briefly review the newcalculations and will present a scheme for parameterlsing the SRband photodissociation that is accurate for a variety of zenithangles and atmospheric conditions.
2. THE CALCULATIONS
2.1 The absorption spectra
Absorption cross-sections were calculated with a resolution of 0.02cm*1 for the 17 spectral regions. Each of the over 7000 individuallines encompassed by bands with v' = 0-19, v' = 0-1 and A/' =1,3,5 31 was allowed to contribute to every spectral region sincethe quasi-contlnuum formed by the overlapping wings of the Voigtline profiles Is non-negligible. The computations were made for fourtemperatures (150, 200, 250, 300 K). Figure 1 shows a section ofthe absorption cross-section in the region between 51 000 and 51500 cm'1 for the two extremes of temperature. The presence of the6-1 band at the higher temperature should be noted. This is aresult of the thermal population of the v* = 1 state although itsprominence, since the fractional population Is very low, arises fromthe order of magnitude larger band oscillator strengths fortransitions from this state (Réf. 7).
2.1.1 The underlying continua. Apart from the quasi-continuumformed by the overlapping of the line wings there are two othermain continua underlying the SR bands. These are the Herzbergcontinuum which dominates at the long-wavelength end and thetemperature dependent SR continuum which contributes stronglyat wavelengths below 185 nm. In this work the formula of Nicoletand Kennes (Réf. 8) has been used to describe the wavelengthdependence of the Herzberg continuum. The strong temperaturedependence of the SR continuum in the region arises because theabsorption relies upon thermal population of rotational andvibrations! states above ground state (v" = O, N" = 1). Theabsorption threshold for the ground state itself is 174.5 nm andtherefore it does not contribute. A model for the absorption due tothis process was constructed using relevant data from Refs. 7,9and 10. Full details of this and the other calculations have beengiven in Ref 11.
2.2 Atmospheric transmission and effective cross-sections.
The calculation of transmlttances and effective cross-sectionsinvolves following the absorption of solar radiation down into theatmosphere at full resolution and evaluation of the relevantquantities at each atmospheric level. For these calculations theatmosphere from 120 to 20 km was divided Into layers 5 km thick.Densities and temperatures were taken from the US StandardAtmosphere (Réf. 12) for the standard case. Computations were
PTOC. Ninth ESAIPAC Symposium on 'European Rocket and Balloon Programmes and Related Research', Lahnstein, FRG, 3—7 April 1989(ESA. SP-291, June 1989)
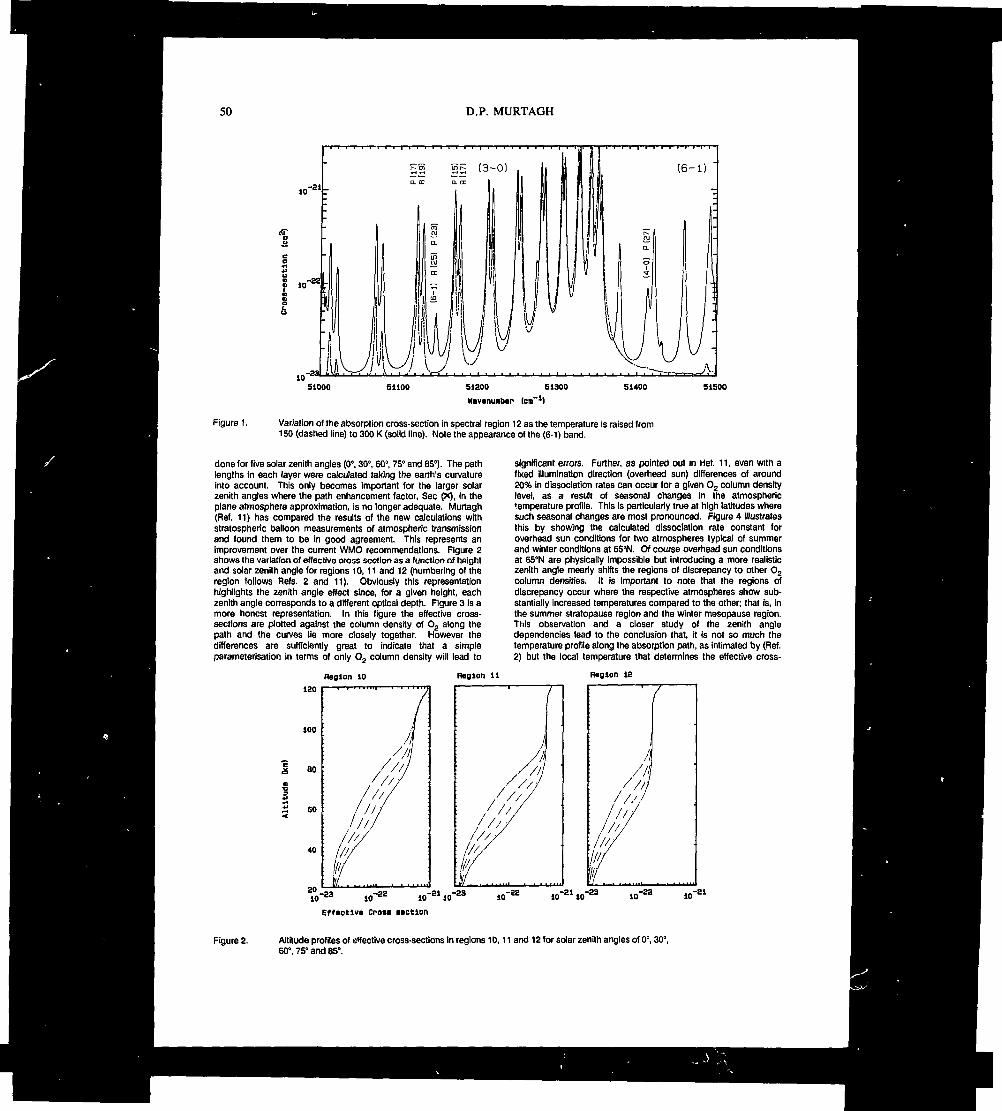
50 O.P. MURTAGH
«-si
1
10
10-23l
SlOOO SIiOO SlSOO 51300
Wovonuibop (cm'1)
51400 51500
Figure 1. Variation of the absorption cross-section in spectral région 12 as the temperature is raised from150 (dashed line) to 300 K (solid line). Note the appearance of the (6-1) band.
done for five solar zenith angles (0°, 30°, 60°, 75° and 85°). The pathlengths in each layer were calculated taking the earth's curvatureinto account. This only becomes important for the larger solarzenith angles where the path enhancement factor, Sec (X), in theplane atmosphere approximation, Is no longer adequate. Murtagh(Réf. 11) has compared the results of the new calculations withstratospheric balloon measurements of atmospheric transmissionand found them to be in good agreement. This represents animprovement over the current WMO recommendations. Figure 2shows the variation of effective cross-section as a function of heightand solar zenith angle for regions 10,11 and 12 (numbering of theregion follows Refs. 2 and 11). Obviously this representationhighlights the zenith angle effect since, for a given height, eachzenith angle corresponds to a different optical depth. Figure 3 is amore honest representation. In this figure the effective cross-sections are plotted against the column density of O2 along thepath and the curves lie more closely together. However thedifferences are sufficiently great to indicate that a simpleparameterlsation In terms of only O2 column density will lead to
Region 10 Region 11
120
100
I BO
S BO
significant errors. Further, as pointed out in HeI. 11, even with afixed illumination direction (overhead sun) differences of around20% in dissociation rates can occur for a given O2 column densitylevel, as a result of seasonal changes in the atmospherictemperature profile. This is particularly true at high latitudes wheresuch seasonal changes are most pronounced. Figure 4 Illustratesthis by showing the calculated dissociation rate constant foroverhead sun conditions for two atmospheres typical of summerand winter conditions at 65°N. Of course overhead sun conditionsat 650N are physically Impossible but introducing a more realisticzenith angle mearly shifts the regions of discrepancy to other O2
column densities. It Is Important to note that the regions ofdiscrepancy occur where the respective atmospheres show sub-stantially Increased temperatures compared to the other; that is, inthe summer stratopause region and the winter mesopause region.This observation and a closer study of the zenith angledependencies lead to the conclusion that, it is not so much thetemperature profile along the absorption path, as intimated by (Réf.2) but the local temperature that determines the effective cross-
Region 12
„-23 'aa«T™ 10
Effective cr-oie eectlonlO' 10-22 10,-81
Figure 2. Altitude profiles of effective cross-sections in regions 10,11 and 12 for solar zenith angles of 0°, 30°,60°, 75° and 85°.
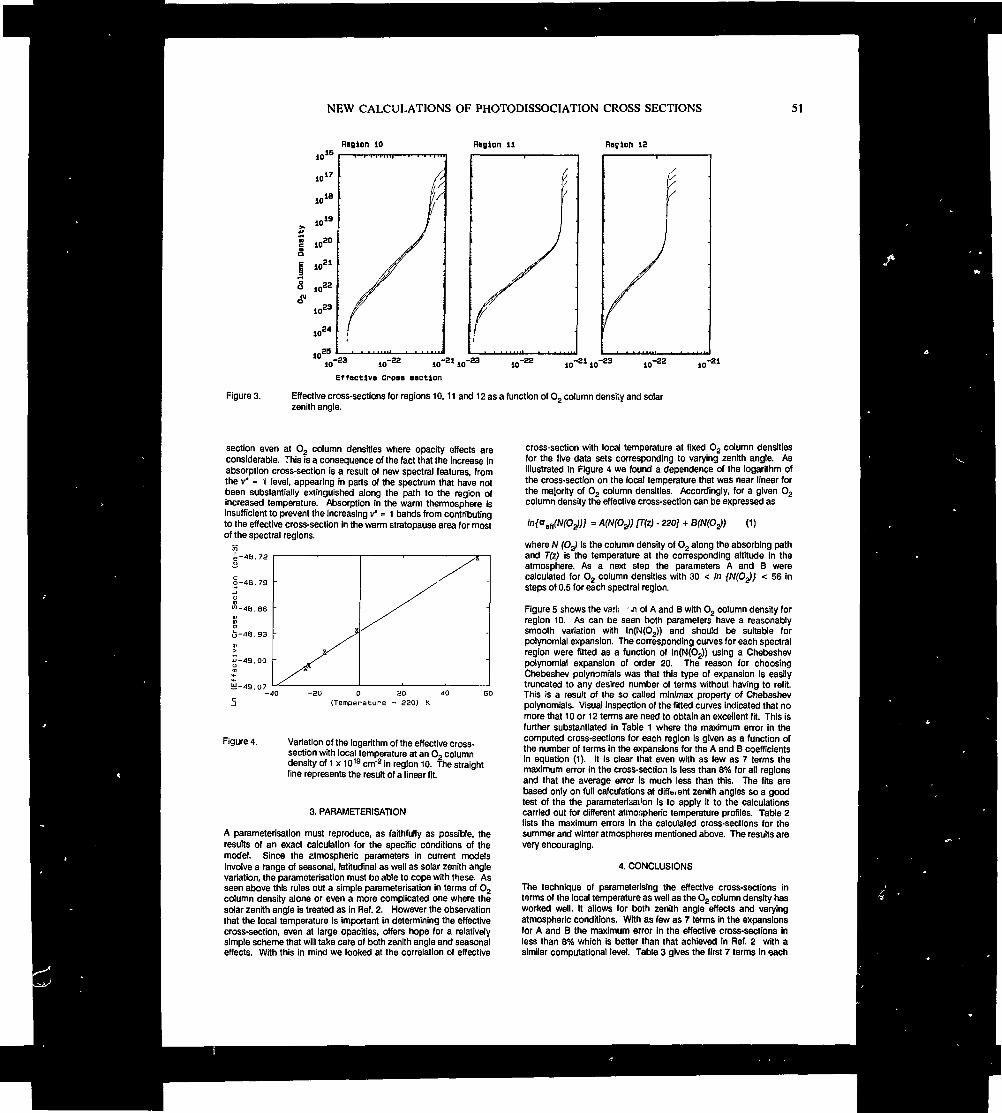
NEW CALCULATIONS OF PHOTODISSOCIATION CROSS SECTIONS 51
RiOion 10101
101
10.16
10.19
.20
.21
10
10"=
.22
Region Il fission 13
10M
io25
10" 10 „-22 «-22
Effective CPOBB section
Figure 3. Effective cross-sections for regions 10,11 and 12 as a function of O2 column density and solarzenith angle.
section even at O2 column densities where opacity effects areconsiderable. This is a consequence of the fact that the increase inabsorption cross-section is a result of new spectral features, fromthe v' = 1 level, appearing In parts of the spectrum that have notbeen substantially extinguished along the path to the region ofincreased temperature. Absorption in the warm thermosphère isInsufficient to prevent the Increasing v' = 1 bands from contributingto the effective cross-section in the warm stratopause area for mostof the spectral regions.
-"18.72
-46.79
-48. BB
-48.93
-49.00
M-49.07-4
S
-/S
/" -
//
'
-
O -20 O 20 40 6C(Temperature - 220) K
Figure 4. Variation of the logarithm of the effective cross-section with local temperature at an O2 columndensity of 1 x 1019 cm'2 in region 10. The straightline represents the result of a linear fit.
3. PARAMETERISATION
A parameterisation must reproduce, as faithfully as possible, theresults of an exact calculation for the specific conditions of themodel. Since the atmospheric parameters in current modelsinvolve a range of seasonal, latitudinal as well as solar zenith anglevariation, the parameterisation must be able to cope with these. Asseen above this rules out a simple parameterisation in terms of O2
column density alone or even a more complicated one where thesolar zenith angle Is treated as In Réf. 2. However the observationthat the local temperature Is important In determining the effectivecross-section, even at large opacities, offers hope for a relativelysimple scheme that will take care of both zenith angle and seasonaleffects. With this in mind we looked at the correlation of effective
cross-section with local temperature at fixed O2 column densitiesfor the five data sets corresponding to varying zenith angle. Asillustrated In Figure 4 we found a dependence of the logarithm ofthe cross-section on the local temperature that was near linear forthe majority of O2 column densities. Accordingly, for a given O2
column density the effective cross-section can be expressed as
ln<a A(N(O1)) [T(Z) - 220] + BfWfO2); (1 >
where W (OJ is the column density of O2 along the absorbing pathand T(Z) is the temperature at the corresponding altitude In theatmosphere. As a next step the parameters A and B werecalculated for O2 column densities with 30 < In /NfO2); < 56 insteps of 0.5 for each spectral region.
Figure 5 shows the vari; .n of A and B with O2 column density forregion 10. As can be seen both parameters have a reasonablysmooth variation with In(N(O2)) and should be suitable forpolynomial expansion. The corresponding curves for each spectralregion were fitted as a function of In(N(O2)) using a Chebeshevpolynomial expansion of order 20. The reason for choosingChebeshev polynomials was that this type of expansion is easilytruncated to any desired number of terms without having to refit.This Is a result of the so called minimax property of Chebeshevpolynomials. Visual inspection of the fitted curves indicated that nomore that 10 or 12 terms are need to obtain an excellent fit. This isfurther substantiated in Table 1 where the maximum error in thecomputed cross-sections for each region Is given as a function ofthe number of terms in the expansions for the A and B coefficientsIn equation (1). It is clear that even with as few as 7 terms themaximum error in the cross-section is less than 8% for all regionsand that the average error Is much less than this. The fits arebased only on full calculations at diffe.ent zenith angles so a goodtest of the the parameterisai'on is to apply it to the calculationscarried out for different atmospheric temperature profiles. Table 2lists the maximum errors in the calculated cross-sections for thesummer and winter atmosphères mentioned above. The results arevery encouraging.
4. CONCLUSIONS
The technique of parameterlslng the effective cross-sections interms of the local temperature as well as the O2 column density hasworked well. It allows for both zenith angle effects and varyingatmospheric conditions. With as few as 7 terms in the expansionsfor A and B the maximum error in the effective cross-sections inless than 8% which Is better than that achieved In Réf. 2 with asimilar computational level. Table 3 gives the first 7 terms in each
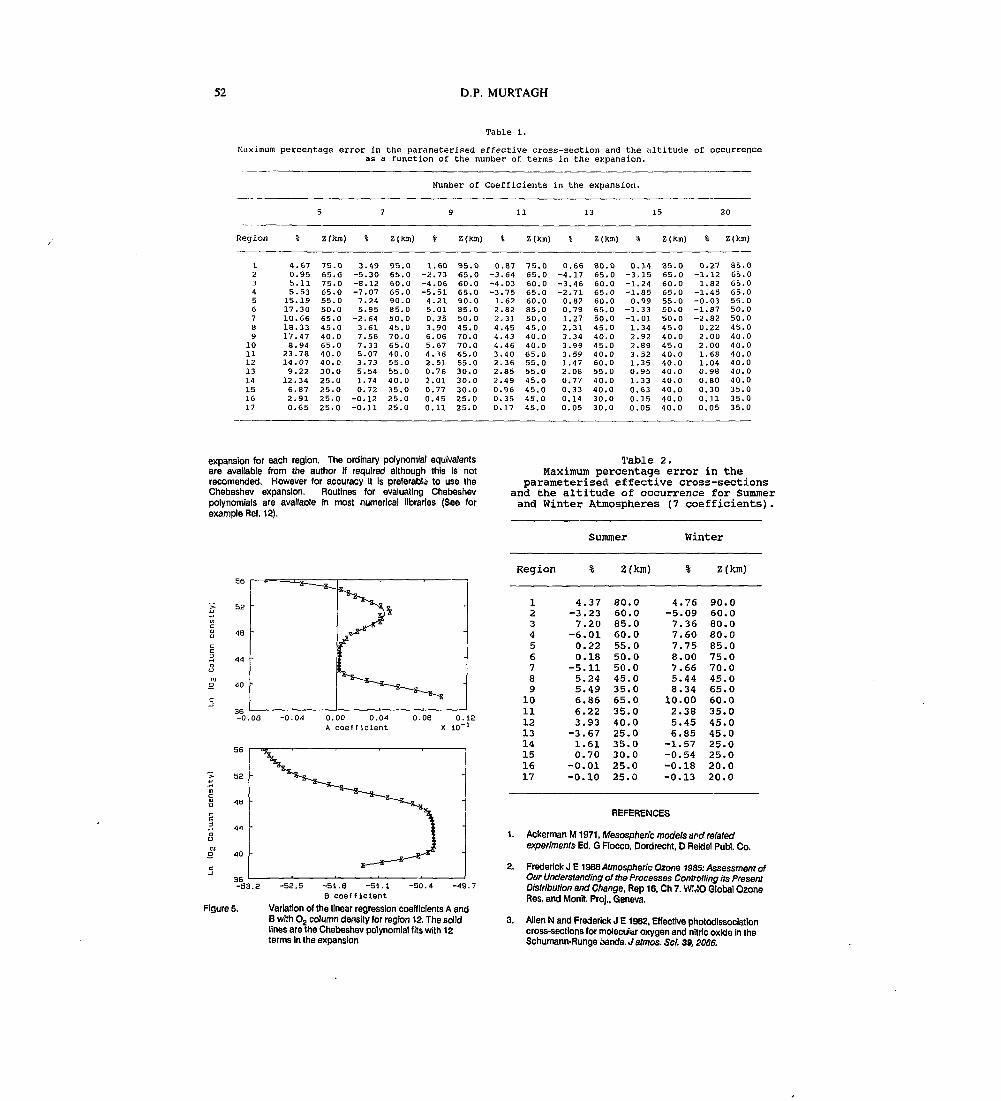
52 O.P. MURTAGH
Table 1.
Max imum percentage error in the paranteterised effective cross-section and the altitude Ol occurrenceas a function of the number of terms in the expansion.
Number of
Region
1234567891011121314151617
%
4.670.955.11S. 53
15.1917.3010.6618.3317.478.9423.7814.079.22
12.346.872.910.65
5
Z(km)
75.065.075.065.055.050.065.045.040.065.040.040.030.025.025.025.025.0
7
%
3.49-5.30-8.12-7.077.245.95
-2.643.617.567.335.073.735.541.740.72-0.12-0.11
Z (km)
95.065.060.065.090.085.050.045.070.065.040.055.055.040.035.025.025.0
9
%
1.60-2.73-4.06-5.514.215.010.353.906.065.674.362.510.761.010.770.450.11
Z (km)
95.065.060.065.090.085.050.045.070.070.065.055.030.030.030.025.025.0
Coefficients
11
%
0.87-3.64-4.03-3.751.622.822.314.454.434.463.402.362.852.490.960.350.17
Z (km)
75.065.060.065.060.085.050.045.040.040.065.055.055.045.045.045.045.0
in the expansion.
13
%
0.66-4.17-3.46-2.710.820.791.272.313.343.993.591.472.080.770.330.140.05
Z (km)
80.065.060.065.060.065.050.045.040.045.040.060.055.040.040.030.030.0
O-3-1-1O
-1-112231O1OOO
15
%
.14
.15
.24
.85
.99
.33
.01
.34
.92
.89
.52
.35
.95
.33
.63
.15
.05
Z (km)
35.065.060.065.055.050.050.045.040.045.040.040.040.040.040.040.040.0
20
%
0.27-1.121.82
-1.45-0.03-1.87-2.820.222.002.001.681.040.980.800.300.110.05
Z (km)
85.065.065.065.055.050.050.045.040.040.040.040.040.040.035.035.035.0
expansion for each region. The ordinary polynomial equivalentsare available from the author if required although this Is notrecomended. However for accuracy it Is preferable to use theChebeshev expansion. Routines for evaluating Chebeshevpolynomials are avallaole in most numerical libraries (See forexample Réf. 12).
0.00 0.04A coeff ic ient
0.08 0.12X 10"1
o 40
Figure 5.
-52.5 -Sl.8 -Sl.1B coef f ic ien t
-50.4
Variation of the linear regression coefficients A andB with O2 column density for region 12. The solidlines are the Chebeshev polynomial fits with 12terms In the expansion
Table 2.Maximum percentage error in the
parameterised effective cross-sectionsand the altitude of occurrence for Summerand Winter Atmospheres (7 coefficients).
Summer
Region
1234567891011121314151617
%
4.37-3.237.20
-6.010.220.18
-5.115.245.496.866.223.93-3.671.610.70
-0.01-0.10
2 (km)
80.060.085.060.055.050.050.045.035.065.035.040.025.035.030.025.025.0
Winter
%
4.76-5.097.367.607.758.007.665.448.3410.002.385.456.85
-1.57-0.54-0.18-0.13
Z (km)
90.060.080.080.085.075.070.045.065.060.035.045.045.025.025.020.020.0
REFERENCES
1. Ackerman M1971, Mesospheric models and relatedexperiments Ed. G Fiocco, Dordrecht, D ReWeI PuW. Co.
2. Frederick J E -(98G Atmospheric Ozone 1985: Assessment ofOur Understanding of the Processes Controlling its PresentDistribution and Change, Rep 16, Ch 7. W;V!0 Global OzoneRes. and Monit. Pro]., Geneva.
3. Allen N and Frederick J E1982, Effective photodissociationcross-sections for molecuiur oxygen and nitric oxide in theSchumann-Runge oands. Jatmos. ScI. 3», 2066.
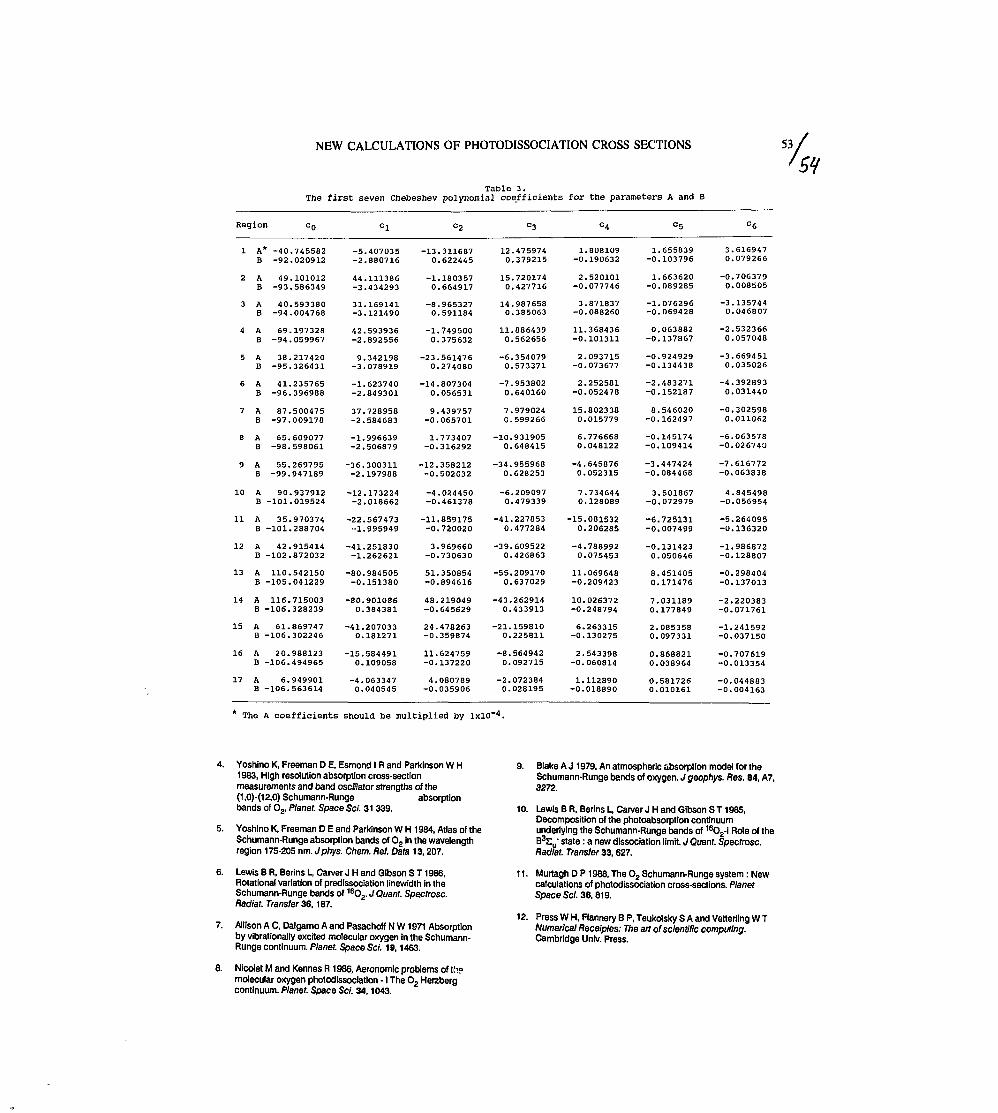
NEW CALCULATIONS OF PHOTODISSOCIATION CROSS SECTIONS
Table 3.The first seven Chebeshev polynomial coefficients for the parameters A and B
Region C0
1
2
3
4
5
6
7
a
9
10
11
12
13
14
15
16
17
A* -40.745582B -92.020912
A 49.101012B -93.586349
A 40.593380B -94.004768
A 69.197328B -94.059967
A 38.217420B -95.326431
A 41.235765B -96.396988
A 87.500475B -97.009178
A 65.609077B -98.598061
A 55.269795B -99.947189
A 90.937912B -101.019524
A 35.970374B -101.288704
A 42.915414B -102.872032
A 110.542150B -105.041229
A 116.715003B -106.328239
A 61.869747B -106.302246
A 20.988123B -106.494965
A 6.949901B -106.563614
cl
-5.407035-2.880716
44.111386-3.434293
31.169141-3.121490
42.593936-2.892556
9.342198-3.078919
-1.623740-2.849301
37.728958-2.584683
-1.996639-2.506879
-36.300311-2.197988
-12.173224-2.018662
-22.567473-1.995949
-41.251830-1.262621
-80.984505-0.151380
-80.9010860.384381
-41.2070330.181271
-15.5844910.109058
-4.0633470.040545
°2
-13.3116870.622445
-1.1803570.664917
-8.9653270.591184
-1.7495000.375632
-23.5614760.274080
-14.8073040.056531
9.439757-0.065701
1.773407-0.316292
-12.358212-0.502032
-4.024450-0.461378
-11.859175-0.720020
3.969660-0.730630
51.350854-0.894616
48.219049-0.645629
24.478263-0.359874
11.624759-0.137220
4.080789-0.035906
°3
12.4759740.379215
15.7201740.427716
14.9876580.385063
11.8864390.562656
-6.3540790.573371
-7.9538020.640160
7.9790240.599266
-10.9319050.648415
-34.9559680.628253
-6.2090970.479339
-41.2278530.477284
-39.6095220.426863
-55.2091700.637029
-43.2629140.433913
-21.1598100.225811
-8.5649420.092715
-2.0723840.028195
°4
1.808109-0.190632
2.520101-0.077746
3.B71837-0.088260
11.368436-0.101311
2.093715-0.073677
2.252581-0.052478
15.8023380.015779
6.7766680.048122
-4.6458760.052315
7.7346440.128089
-15.0815320.206285
-4.7889920.075453
11.069648-0.209123
10.026372-0.248794
6.263315-0.130275
2.543398-0.060814
1.112890-0.018890
°5
1.655839-0.103796
1.663620-0.089285
-1.076296-0.069428
0.063882-0.137867
-0.924929-0.134438
-2.483271-0.152187
8.546020-0.162497
-0.145174-0.109414
-3.447424-0.084468
3.501867-0.072979
-6.725131-0.007499
-0.1314230.050646
8.4514050.171476
7.0311890.177849
2.0853580.097331
0.8688210.038964
0.5817260.010161
C6
3.6169470.079266
-0.7063790.008505
-3.1357440.046807
-2.5323660.057048
-3.6694510.035026
-4.3928930.031440
-0.3025980.011062
-6.063578-0.026740
-7.616772-0.063838
4.845498-0.056954
-5.264095-0.136320
-1.986872-0.128807
-0.298404-0.137013
-2.220383-0.071761
-1.241592-0.037150
-0.707619-0.013354
-0.044883-0.004163
* The A coefficients should be multiplied by IxIO"4.
4. Yoshino K, Freeman D E, Esmond IR and Parkinson W H1983, High resolution absorption cross-sectionmeasurements and band oscillator strengths of the(1,0)-(12,0) Schumann-Runge absorptionbands of O2, Planet. Space Sd. 31339.
5. Yoshino K, Freeman D E and Parkinson W H 1984, Atlas of theSchumann-Runge absorption bands of O2 in the wavelengthregion 175-205 nm. Jphys. Chem. Réf. Data 13,207.
6. Lewis B R, Berins L, Carver J H and Gibson S T 1986,Rotational variation of predissociation linewidth in theSchumann-Runge bands of 16O2. J Quant. Speptrosc.Radiât. Transfer 36,187.
7. Allison A C, Dalgarno A and Pasachoff N W1971 Absorptionby vibrationally excited molecular oxygen in the Schumann-Runge continuum. Planet. Space Sd. 19,1463.
8. Nicolet M and Kennes R 1986, Aeronomic problems of thpmolecular oxygen photodissociation -1 The O2 Herzbergcontinuum. Planet. Space Sd. 34,1043.
9. Blake A J 1979, An atmospheric absorption model for theSchumann-Runge bands of oxygen. J geophys. Res. 84, A7,3272.
10. Lewis B R, Berins L, Carver J H and Gibson ST1985,Decomposition of the photoabsorption continuumunderlying the Schumann-Runge bands of 16O2-I Role of theB3S1,- state : a new dissociation limit. J Quant. Spectrosc.Radiât. Transfer 33,627.
11. Murtagh D P1988, The O2 Schumann-Runge system : Newcalculations of photodissociation cross-sections. PlanetSpace Sc/. 3$, 819.
12. Press W H, Flannery B P, Teukolsky S A and Vettertlng W TNumerical Receipies: The an of scientific computing.Cambridge UnIv. Press.

55
EVIDENCE FOR ACCURATE TEMPERATURES FROM THE INFLATABLE FALLING SPHERE
F. J. SchmidlinNASA GSFC/Wallops Flight FacilityWallops Island, Virginia 23337 USA
H. S. LeeSM Systems and Research Corp.Landover, Maryland 20785 USA
W. MichelUniv. Dayton Research Institute
Wallops Island, Virginia 23337 USA
Abstract
In recent years there has been increasing interestin the utilization of the inflatable falling sphere techniquefor middle atmosphere studies. It is a potentially highlyaccurate and independent source of temperature measure-ment and could qualify as an intrinsic method for estab-lishing accuracy of other atmospheric measurement tech-niques. We show through theoretical derivation, simula-tions, and actual measurements that the sphere's tempera-ture data s?e accurate in spite of possible bias that maybe present in the primary measurements of density. Wedemonstrate that retrieved temperatures from fallingspheres are not significantly affected by linear bias indensity caused by uncertainties in sphere mass, volume,or cross-sectional area. Case studies are used to illustratethe sphere's capability to produce accurate temperatures.Comparisons with Datasonde temperature measurementsobtained close in time and space are shown to agreebelow 60 km. Differences above 60 km are explained ascoming from insufficient correction to the Datasondetemperatures.
Introduction
One instrument used to gather middle atmospheretemperature data is the small meteorological rocketsonde.While satellite techniques provide global coverage theydo not provide the vertical detail necessary for describingatmospheric temperature structure. Two rocketsondesystems extensively used are the Datasonde and theinflatable sphere. Questions often are asked about thesesystems' measurement accuracy and precision. Althoughstatements of accuracy have been difficult to obtain,studies have indicated that the Datasonde's temperaturemeasurement repeatability is about 0.90K (Miller andSchmidlin, 1971; Schmidlin, 19Sl) and its precision about0.60K (Schmidlin, 1981) to near 55 km altitude. Com-parisons with other instruments (e.g., rocketsondes ofother manufacturers, acoustic grenades, pilot probes, lidar,and satellites) generally report temperature measurementswithin an envelope of 2-50K. This agreement has beentaken as an estimate of accuracy (Schmidlin, 1986).However, more precise statements are needed to satisfycurrent analysis of globalwide temperature trends (Angell,1987).
The inflatable sphere's reliability, once suspect,has improved considerably within the past few years. As
a result, inflatable sphere launchings currently exceed a99 percent success rate. Sphere measurements are un-affected by external forces (except vertical winds) makingit potentially more accurate than other in situ measure-ments presently in use. Recent data simulations andflights of spheres made at Wallops Island reveal thatproperly performing spheres are capable of providinghighly accurate temperatures. The falling sphere is anindependent source of temperature measurement and, aswe will show, might also be an intrinsic method usefulfor establishing the accuracy of other techniques.
Measurement Theory
The temperature profile may be extracted from theretrieved atmospheric density using the hydrostatic equa-tion and the equation of state which can be approximatedfor the temperature retrieval as
T _Tz - / [1]
where p, is the density at altitude z, p. is density atreference altitude a, M0 the molecular weight of dry air,R the gas constant, and T is the temperature. Note thatthe source of temperature error in the calculation is theuncertainty in the retrieved density value. This error indensity is comprised of high and low spatial frequencycomponents. The high frequency component may arisefrom many sources, such as measurement error, computa-tional error, or atmospheric variability and reveals asomewhat random feature. On the other hand, the lowfrequency component, including a bias and linear varia-tion, may be related to the actual atmospheric featuresand indistinguishable from the measurement error.
In spite of any density errors that may arise bythe nature of the physical circumstances, the temperaturecalculation is virtually unaffected by the bias and linearcomponents of the density error. This unique character-istic enables us to use the sphere technique as an inde-pendent measurement standard for comparison of highaltitude temperature measurements. This system maythen be utilized to establish an accuracy assessment ofany other high altitude temperature measurement system,such as the Datasonde, satellite-borne sensors, and otherground based remote methods, such as lidar.
Proc. Ninth ESAIPAC Symposium on 'European Rocket and Balloon Programmes and Related Research ', Lahnslein, FRG, 3—7 April 1989(ESA SP-291, June 1989)

56 F.J. SCHMIDLIN ET AL.
We show below that the derived temperature isfree from constant bias and the first order time-varyingnoise component. To study the density bias effect on thetemperature retrieval, the bias can be modeled as
) (1 + a + bz + cz2 + . . . ) [2]
where p(z) is the true density and a, b, and c are con-stants. Uncertainties in other physical parameters of theexperiment, such as sphere size, mass, and drag coeffi-cient may be a source of the constant bias represented bythe 2nd term in Eq. [2]. The remaining low frequencycontribution to the bias may originate from a slowlyleaking sphere, sphere deformation, uncertainty in dragcoefficient, or other complex sources. Only the firstthree terms in Eq. [2] are considered for simplicity.
From Equations [1] and [2] and the standardatmospheric density profile we may obtain
T2 = g a P0 e-2/ff
[3]
densities at the same altitudes. Figure 1 shows theretrieved temperatures following Eq. [1] and comparesthem with the US76 temperatures. As can be seen, theagreement is exact down to 60 km., below 60 km. thereduced temperatures differ slightly from the standard.
Figure 2 presents similar results after applying abias of ten percent to the standard densities. Below 60km, some temperature variations occur. However, thesimulations have shown that the bias can be substantiallylarge (e.g., greater than 20%) before there is a significanttemperature error. The implication of our simulationsand analysis is that the temperature retrievals from fallingspheres are not significantly affected by biases in densitycaused by uncertainties in sphere mass, volume, or cross-sectional area (i.e., the primary sources of linear effects).
The simulations and analysis have shown that theinflatable sphere can provide accurate high altitude tem-peratures and could serve to establish the accuracy ofother high altitude temperature sensors.
where a is the density scale height and p0 is the mea-sured density at the reference point. The temperatureretrieved from the sphere density will be free from biasas Eq. [3] clearly indicates.
Simulation Flight Data
The unique characteristics of the temperatureretrieval was subjected to tests using simulation methodsdesigned to study the inflatable sphere technique. TheUS76 Standard Atmosphere density (COESA, 1976) wasused as the baseline atmosphere. The simulations werecarried out by releasing standard weight spheres (-160grams) from an assumed altitude of 120 kilometers. Theequation of motion for a falling object is solved as thesphere falls. Radar angles and slant ranges are succes-sively derived at time increments of 0.1 second corre-sponding to the falling sphere's positions. The densitydata reduced from the simulated radar data and the oper-ational program (Luers, 1970) were found equivalent tothe baseline atmosphere density (i.e., US76 standardatmosphere) used in the simulation as shown in Figure 1.The density is presented as a ratio (i.e., p/p,6) for sim-plicity, thus, a ratio of 1 indicates that the retrieveddensities are the same value as the standard atmosphere
s <o
I ,.
.r i ,D E N S I T Y R A T I O
Figure 2. Same as Fig. 1 except a ten-percent bias has beenadded to the simulated densities.
Actual Flight Measurements
Two case studies demonstrating the inflatablesphere's capability to produce accurate temperatures arediscussed below.
OEHSlTT R A T I O
Figure 1. Comparison of simulated densities and temperatures withUS76 Standard Atmosphere densities and temperatures.
Case Study: April 22. 1987
In the example shown, the sphere measurementsbegin near 85 km with sphere collapse occurring near 35km. The Datasonde measurements, on the other hand,begin near 70 km and end at 20 km. Figure 3a, com-pares the density ratios determined from the measure-ments made by each system. A bias of about 6 percentis noted to exist between these measurements below 60km. However, both curves follow similar lapse rates asemphasized particularly by the similarity of the featuresobserved between 54 km. and 40 km., as well as thefeature at 35 km. Following our previous postulationthat the temperature profiles would agree in spite ofdensity disagreement, we see from Figure 3b, that thetemperatures do indeed agree. The sphere, Datasonde,and radiosonde observations were made within approxi-mately 2 hours of each other.

ACCURATE TEMPERATURES FROM FALLING SPHERE 57
UALLQI1S ISLAND, VA,00 ,-7—7 |—J , 1 ,-
04/22/804/22/87 I at 4 UT
UAUUPS ISLAND. VA
TImTTTTTTTmTm nil
I so
g so
1 UALLUPS ISLAND. V A
- Cc)
\{
-145604/?2/|, ,8,5 U,
I j I I I I i I i
OENSITT RATIO TEMPERATURE CK) DENSITY RATin
Figure 3. a) Comparison of density ratios from sphere and Datasondc measurements showing a six-percent bias; b) sphereand Datasonde temperatures showing agreement between the levels of sphere collapse and 60 km; c) newcomparison of density ratios showing agreement after sphere temperatures were used to recalculate densities.
The sphere temperatures also compare well withthe radiosonde temperatures near 35 km (fortunately, theballoon burst above 36 km and the sphere began tocollapse just below 35 km) and clearly agree with theDatasonde temperatures below 60 km. After recalculatingdensities for the sphere by solving the hypsometric equa-tion using the Datasonde density and sphere temperatureas initializing data, we find in Figure 3c that the densityratios disagree at altitudes higher than 60 km, whereasFigure 3a had shown agreement. Figure 3b, however,shows temperature disagreement above 60 km. Thissuggests that, if our argument is valid that sphere mea-surements produce good temperatures regardless of errorsin the densities, then the Datasondes temperature mea-surements at altitudes above 60 km. must be in error and,hence, so must density. Indeed, this is the region where
the thermistor dimensions are smaller than the atmo-spheric molecular mean-free-path and where temperaturecorrections are least reliable (Krumins and Lyons, 1972).This suggests that the sphere temperature profiles mightbe used as a standard from which improvement of tem-perature measurements from other instruments could bemade, or at least better understood.
Case Study: April 23. 1981s
The second example described here also presentsfurther evidence that the processing of temperatures fromsphere derived densities is generally correct. In Figure4a, density r.uio profiles of the spheres and Datasondesare in good agreement below 60 km. with the atmo-
UALLOPS ISLAND. VA
i—i—rWALLOPS ISLAND. VA
04/23/87 IQOI UT
(a)I I I I I I I I I
WALLOPS ISLAND. VA
DENSITY R A T I O
»0 240 210 210 270 ZIO 210 3
TEMPERATURE (1KI
I I I T
(C)
I I I
04/23/87 1750 UT
oJ/jj/sV Hoi ur
DENSITY RATIO
Figure 4. a) Same as Figure 4a, except very small bias observed between sphere and Datasonde; b) same as Figure 4b;c) same as Figure 4c, except density ratios reveal same values as given in original data.

58 FJ. SCHMIDLIN ET AL.
spheric features becween 46 km. and 60 km. similarlyportrayed by each system. Below 46 km., mean densityagreement is evident, however, the sphere exhibits pertur-bations not observed with the Datasonde which we be-lieve are due to vertical winds. The corresponding tem-perature profiles, Figure 4b, also indicate good agreementbelow 60 km. with similar perturbations present in bothprofiles down to 46 km. Nevertheless, at altitudes above60 km. a serious bias is seen between the temperatureprofiles of each observing technique.
After recalculating densities for the spheres fol-lowing the same method used in the previous case study,we find in Figure 4c little change in the original spheremeasured densities. This second example shows then,that when recalculated densities are not greatly differentfrom the original densities, the sphere data initially werequite correct.
Conclusions
Through theoretical derivation, simulations, andactual measurements we have shown the capability offalling sphere observations to provide accurate tempera-ture data in spite of bias in the primary measurement ofdensity. As Eq. ( I ] illustrates, the method of derivingtemperature depends on the gas equation and takes theratio of the pressure and density. Considering that theerrors in pressure and density are of similar magnitude,they cancel. This is the reason, therefore, why biaserrors in the density have no effect on temperature.
Discrepancies between sphere and Datasondetemperatures above 60 km lead to a conclusion that themeasurements made with the present Datasonde instru-ment above this altitude may be deficient, especiallywhen it is considered that the thermistor corrections areextrapolations. More work is needed, but the size of thecorrection needed at these higher altitudes could possiblybe determined given sufficient measurement pairs. Inaddition, the sphere temperatures, because of their greateraltitude coverage, can be compared more effectively withresearch satellite data such as will be available withUARS, EOS, and others. Finally, considering the in-herent accuracy of the sphere temperatures a better under-standing of the vertical winds can be obtained from theperturbations present in the sphere data.
References
Angell, J, K., 1987: Rocketsonde evidence for a strato-spheric temperature decrease in the western hemisphereduring 1973- 85. Mon. Wea. Rev. Vol. 115. pp 2569-2577.
COESA (1976), U. S. Standard Atmosphere, 1976. USGovernment Printing Office, Washington, DC.
Krumins, M. V., and W. C. Lyons, 1972: Corrections forthe upper atmosphere temperatures using a thin film loopmount. Naval Ordnance Lab., White Oak, Silver Spring,Md. NOLTR 72-152, 52pp.
Luers, J. K., 1970: A method of computing winds, den-sity, temperature, pressure, and their associated errorsfrom the high altitude ROBIN sphere using an optimumfilter. Univ. of Dayton Research Institute Contract No.F19628-C-0102. AFCRL-70-0366.
Miller, A. J. and F. J. Schmidlin, 1971: Rocketsonderepeatability and stratospheric variability. J. Appl. Meteor.VoI 10. No 2, pp 320-327.
Schmidlin, F. J. 1981: Repeatability and measurementuncertainty of the United States meteorological rocket-sonde. J. Geophys. Res., 86, pp 9599-9603,
Schmidlin, F. J., 1986: Rocket techniques used to mea-sure the nf.ddle atmosphere, in Middle Atmosphere Pro-gram, Handbook for MAP Volume 19, Ed. R. A. Gold-berg, pp 1-33.
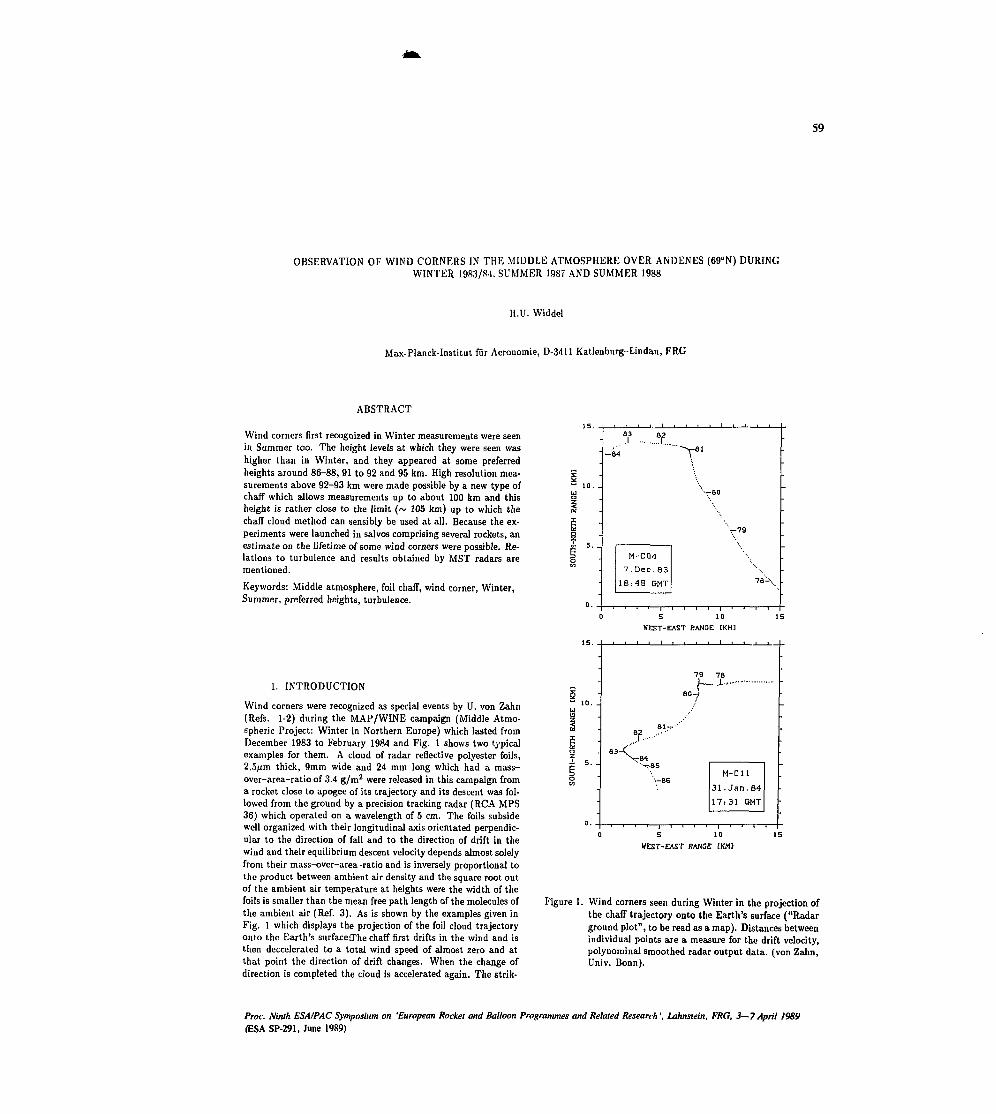
59
OBSERVATION OF WIND CORNERS IN THE MIDDLE ATMOSPHERE OVER ANDENES (690N) DURINGWINTER 1983/8-1. SUMMER 1987 AND SUMMER 1988
H.U. Widdel
Max-Planck-Institut fiir Aeronomie, D-3411 Katlenburg-Lindau, FRG
ABSTRACT
Wind corners first recognized in Winter measurements were seenin Summer too. The height levels at which they were seen washigher than in Winter, and they appeared at some preferredheights around 86-88, 91 to 92 and 95 km. High resolution mea-surements above 92-93 km were made possible by a new type ofchaff which allows measurements up to about 100 km and thisheight is rather close to the limit (~ 105 km) up to which thechaff cloud method can sensibly be used at all. Because the ex-periments were launched in salvos comprising several rockets, anestimate on the lifetime of some wind corners were possible. Re-lations to turbulence and results obtained by MST radars arementioned.
Keywords: Middle atmosphere, foil chaff, wind corner, Winter,Summer, preferred heights, turbulence.
1. INTRODUCTION
Wind corners were recognized as special events by U. von Zahn(Refs. 1-2) during the MAP/WINE campaign (Middle Atmo-spheric Project: Winter in Northern Europe) which lasted fromDecember 1983 to February 1984 and Fig. 1 shows two typicalexamples for them. A cloud of radar reflective polyester foils,2,5/im thick, 9mm wide and 24 mm long which had a mass-over-area-ratio of 3.4 g/m2 were released in this campaign froma rocket close to apogee of its trajectory and its descent was fol-lowed from the ground by a precision tracking radar (RCA MPS36) which operated on a wavelength of 5 cm. The foils subsidewell organized with their longitudinal axis orientated perpendic-ular to the direction of fall and to the direction of drift in thewind and their equilibrium descent velocity depends almost solelyfrom their mass-over-area-ratio and is inversely proportional tothe product between ambient air density and the square root outof the ambient air temperature at heights were the width of thefoils is smaller than the mean free path length of the molecules ofthe ambient air (Réf. 3). As is shown by the examples given inFig. 1 which displays the projection of the foil cloud trajectoryonto the Earth's surface;The chaff first drifts in the wind and isthen decelerated to a total wind speed of almost zero and atthat point the direction of drift changes. When the change ofdirection is completed the cloud is accelerated again. The strik-
83
5 10
WEST-EAST RANGE IKH:
82J--"'
5 10
WEST-EAST RANGE [KM]
Figure 1. Wind corners seen during Winter in the projection ofthe chaff trajectory onto the Earth's surface ("Radarground plot", to be read as a map). Distances betweenindividual points are a measure for the drift velocity,polynominal smoothed radar output data, (von Zahn,Univ. Bonn).
Proc. Ninth ESAIPAC Symposium on 'European Rocket and Balloon Programmes and Related Research', Lahnstein, FRG, 3—7April 1989
(ESA SP-291, June 1989)
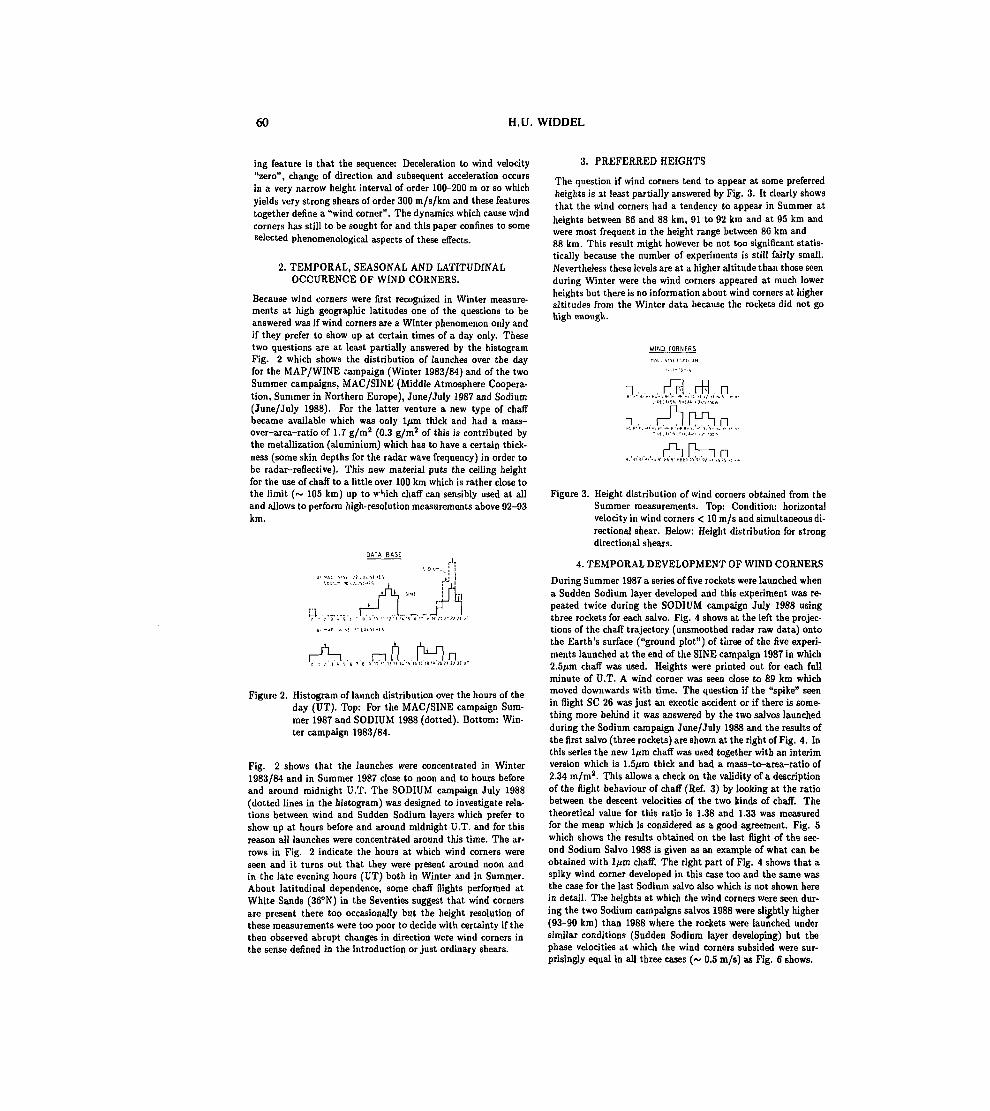
60 H. U. WIDDEL
ing feature is that the sequence: Deceleration to wind velocity"zero", change of direction and subsequent acceleration occursin a very narrow height interval of order 100-200 m or so whichyields very strong shears of order 300 m/s/km and these featurestogether define a "wind corner". The dynamics which cause windcorners has still to be sought for and this paper confines to someselected phenomenological aspects of these effects.
2. TEMPORAL, SEASONAL AND LATITUDINALOCCURENCE OF WIND CORNERS.
Because wind corners were first recognized in Winter measure-ments at high geographic latitudes one of the questions to beanswered was if wind corners are a Winter phenomenon only andif they prefer to show up at certain times of a day only. Thesetwo questions are at least partially answered by the histogramFig. 2 which shows the distribution of launches over the dayfor the MAP/WINE campaign (Winter 1983/84) and of the twoSummer campaigns, MAC/SINE (Middle Atmosphere Coopera-tion, Summer in Northern Europe), June/July 1987 and Sodium(June/July 1988). For the latter venture a new type of chaffbecame available which was only 1/un thick and had a mass-over-area-ratio of 1.7 g/m2 (0.3 g/m2 of this is contributed bythe metallization (aluminium) which has to have a certain thick-ness (some skin depths for the radar wave frequency) in order tobe radar-reflective). This new material puts the ceiling heightfor the use of chaff to a little over 100 km which is rather close tothe limit (~ 105 km) up to vhich chaff can sensibly used at alland allows to perform high-resolution measurements above 92-93km.
Figure 2. Histogram of launch distribution over the hours of theday (UT). Top: For the MAC/SINE campaign Sum-mer 1987 and SODIUM 1988 (dotted). Bottom: Win-ter campaign 1983/84.
Fig. 2 shows that the launches were concentrated in Winter1983/84 and in Summer 1987 close to noon and to hours beforeand around midnight U.T. The SODIUM campaign July 1988(dotted lines in the histogram) was designed to investigate rela-tions between wind and Sudden Sodium layers which prefer toshow up at hours before and around midnight U.T. and for thisreason all launches were concentrated around this time. The ar-rows in Fig. 2 indicate the hours at which wind corners wereseen and it turns out that they were present around noon andin the late evening hours (UT) both in Winter and in Summer.About latitudinal dependence, some chaff flights performed atWhite Sands (360N) in the Seventies suggest that wind cornersare present there too occasionally but the height resolution ofthese measurements were too poor to decide with certainty if thethen observed abrupt changes in direction were wind corners inthe sense defined in the introduction or just ordinary shears.
3. PREFERREDHEIGHTS
The question if wind corners tend to appear at some preferredheights is at least partially answered by Fig. 3. It clearly showsthat the wind corners had a tendency to appear in Summer atheights between 86 and 88 km, 91 to 92 km and at 95 km andwere most frequent in the height range between 86 km and88 km. This result might however be not too significant statis-tically because the number of experiments is still fairly small.Nevertheless these levels are at a higher altitude than those seenduring Winter were the wind corners appeared at much lowerheights but there is no information about wind corners at higheraltitudes from the Winter data because the rockets did not gohigh enough.
WlMO CORNERS
fOl • IfJf I '.GfItUM
Figure 3. Height distribution of wind corners obtained from theSummer measurements. Top: Condition: horizontalvelocity in wind corners < 10 m/s and simultaneous di-rectional shear. Below: Height distribution for strongdirectional shears.
4. TEMPORAL DEVELOPMENT OF WIND CORNERS
During Summer 1987 a series of five rockets were launched whena Sudden Sodium layer developed and this experiment was re-peated twice during the SODIUM campaign July 1988 usingthree rockets for each salvo. Fig. 4 shows at the left the projec-tions of the chaff trajectory (unsmoothed radar raw data) ontothe Earth's surface ("ground plot") of three of the five experi-ments launched at the end of the SINE campaign 1987 in which2.5^m chaff was used. Heights were printed out for each fullminute of U.T. A wind corner was seen close to 89 km whichmoved downwards with time. The question if the "spike" seenin flight SC 26 was just an excotic accident or if there is some-thing more behind it was answered by the two salvos launchedduring the Sodium campaign June/July 1988 and the results ofthe first salvo (three rockets) are shown at the right of Fig. 4. Inthis series the new I/urn chaff was used together with an interimversion which is 1.5/tm thick and had a mass-to-area-ratio of2.34 m/m2. This allows a check on the validity of a descriptionof the flight behaviour of chaff (Réf. 3) by looking at the ratiobetween the descent velocities of the two kinds of chaff. Thetheoretical value for this ratio is 1.38 and 1.33 was measuredfor the mean which is considered as a good agreement. Fig. 5which shows the results obtained on the last flight of the sec-ond Sodium Salvo 1988 is given as an example of what can beobtained with 1^m chaff. The right part of Fig. 4 shows that aspiky wind corner developed in this case too and the same wasthe case for the last Sodium salvo also which is not shown herein detail. The heights at which the wind corners were seen dur-ing the two Sodium campaigns salvos 1988 were slightly higher(93-90 km) than 1988 where the rockets were launched undersimilar conditions (Sudden Sodium layer developing) but thephase velocities at which the wind corners subsided were sur-prisingly equal in all three cases (~ 0.5 m/s) as Fig. 6 shows.

WIND CORNERS IN MIDDLE ATMOSPHERE 61
is. July ar
SC 25 83.8 ./" \ / I
/ 89.8 -
21.20 - 21.2T ;' 83'2UT '.-Breakup
22.04-22.10 rv
4 92.»
SC 28 88.3 j
Partial^ - '"' -.L .S
M'y\:-&«-6 "^84.1^ f Breakup
" i
«.33^22.38 ^20
SC 27 !1,80.3....-Ti
y' '85.2
14. Juna 88 «>4Nl(B^;s
.Xi.e
X ^S
11.38-11.41 /UT S
21.13 - 21.1«
. _>»/«-»». |J"-T
f< T^1^*
'X"l~Breakup
19.15 - 11.30 ?V*5'3
-*^5»2i
^jt^^* \ flrftT
^XT "''X»=-
Figure 4. Wind corners seen in Summer. Radar ground plotsas in Fig. 1, but unsmoothed radar raw data. Gapspartly caused by printing out error-free data only.Heights are printed out at 1 min intervals of UT. Bythis a crude estimate of the descent velocity is pos-sible. Left: Measurements taken with 2.5pm chaff.Right: Measurements taken with 1.5/un and 1pm chafflaunched alternatively. Poor quality of picture due toreproduction process from original plots.
71 7? 71 71 77 73 77 73
Figure 5. Example for a flight performed with 1/im-chaff. Inthis experiment the cloud comprised 3000 foils onlyand the wiggles seen are caused by small-scale motionssuperimposed to the drift which change transiently theorientation of the foils in respect to the polarizationplane of the radar wave. The plot covers an area 20km x 20 km.
Figure 6. Phase velocities of descent of the wind corners seen inthe three Sodium salvos. This phase velocity turns outto be fairly uniform inall three cases.
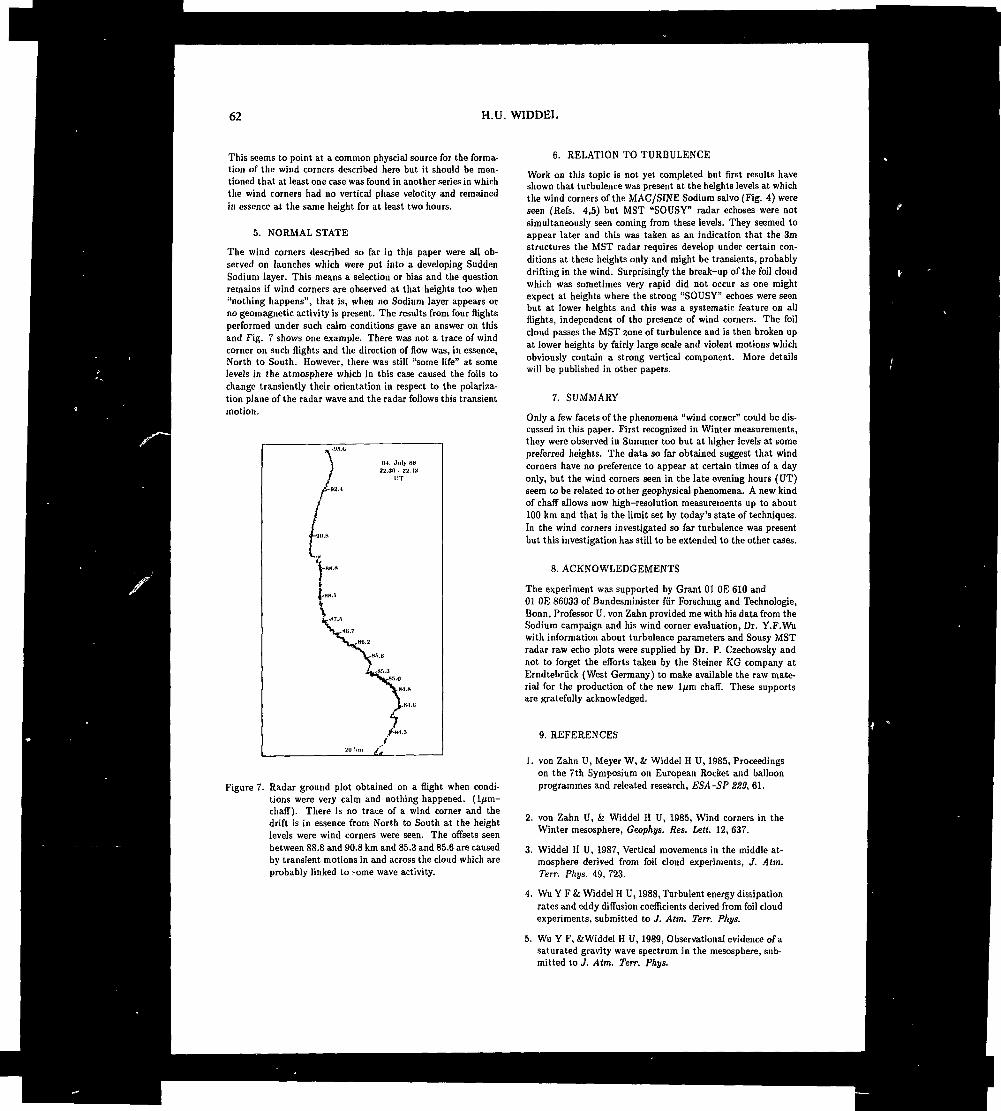
62 H.U. WIDDEL
This seems to point at a common physcial source for the forma-tion of the wind corners described here but it should be men-tioned that at least one case was found in another series in whichthe wind corners had no vertical phase velocity and remainedin essence at the same height for at least two hours.
5. NORMAL STATE
The wind corners described so far in this paper were all ob-served on launches which were put into a developing SuddenSodium layer. This means a selection or bias and the questionremains if wind corners are observed at that heights too when"nothing happens", that is, when no Sodium layer appears orno geomagnetic activity is present. The results from four flightsperformed under such calm conditions gave an answer on thisand Fig. 7 shows one example. There was not a trace of windcorner on such flights and the direction of flow was, in essence,North to South. However, there was still "some life" at somelevels in the atmosphere which in this case caused the foils tochange transiently their orientation in respect to the polariza-tion plane of the radar wave and the radar follows this transientmotion.
Figure 7. Radar ground plot obtained on a flight when condi-tions were very calm and nothing happened. (1/im-chaff). There is no trace of a wind corner and thedrift is in essence from North to South at the heightlevels were wind corners were seen. The offsets seenbetween 88.8 and 90.8 km and 85.3 and 85.6 are causedby transient motions in and across the cloud which areprobably linked to ?ome wave activity.
6. RELATION TO TURBULENCE
Work on this topic is not yet completed but first results haveshown that turbulence was present at the heights levels at whichthe wind corners of the MAC/SINE Sodium salvo (Fig. 4) wereseen (Refs. 4,5) but MST "SOUSY" radar cchoses were notsimultaneously seen coming from these levels. They seemed toappear later and this was taken as an indication that the 3mstructures the MST radar requires develop under certain con-ditions at these heights only and might be transients, probablydrifting in the wind. Surprisingly the break-up of the foil cloudwhich was sometimes very rapid did not occur as one mightexpect at heights where the strong "SOUSY" echoes were seenbut at lower heights and this was a systematic feature on allflights, independent of the presence of wind corners. The foilcloud passes the MST zone of turbulence and is then broken upat lower heights by fairly large scale and violent motions whichobviously contain a strong vertical component. More detailswill be published in other papers.
7. SUMMARY
Only a few facets of the phenomena "wind corner" could be dis-cussed in this paper. First recognized in Winter measurements,they were observed in Summer too but at higher levels at somepreferred heights. The data so far obtained suggest that windcorners have no preference to appear at certain times of a dayonly, but the wind corners seen in the late evening hours (UT)seem to be related to other geophysical phenomena. A new kindof chaff allows now high-resolution measurements up to about100 km and that is the limit set by today's state of techniques.In the wind corners investigated so far turbulence was presentbut this investigation has still to be extended to the other cases.
8. ACKNOWLEDGEMENTS
The experiment was supported by Grant Ol OE 610 andOl OE 86033 of Bundesminister fur Forschung and Technologie,Bonn, Professor U. von Zahn provided me with his data from theSodium campaign and his wind corner evaluation, Dr. Y.F.Wuwith information about turbulence parameters and Sousy MSTradar raw echo plots were supplied by Dr. P. Czechowsky andnot to forget the efforts taken by the Steiner KG company atErndtebriick (West Germany) to make available the raw mate-rial for the production of the new 1/jm chaff. These supportsare gratefully acknowledged.
9. REFERENCES
von Zahn U, Meyer W, & Widdel H U, 1985, Proceedingson the 7th Symposium on European Rocket and balloonprogrammes and releated research, ESA-SP 829, 61.
2. von Zahn U, & Widdel H U, 1985, Wind corners in theWinter mésosphère, Geophys. Res. Lett. 12, 637.
3. Widdel H U, 1987, Vertical movements in the middle at-mosphere derived from foil cloud experiments, J. Aim.Terr. Phys. 49, 723.
4. Wu Y F& Widdel H U, 1988, Turbulent energy dissipationrates and eddy diffusion coefficients derived from foil cloudexperiments, submitted to J. Atm. Terr. Phys.
5. Wu Y F, & Widdel H U, 1989, Observational evidence of asaturated gravity wave spectrum in the mésosphère, sub-mitted to J. Atm. Terr. Phys.
63
NEAR-MESOPAU5E TEMPERATURES AT 690N LATITUDE IN LATE SUMMER
U. von Zahn and H. Kurzawa
Physikalisches Institut der Univarsitât BonnHussallee 12, 5300 Bonn 1, Fed. Rep. of Germany
ABSTRACT
The University of Bonn operates a Na LIDARat the Andeya Rocket Range (690N, 160E) inorder to measure temperature profiles inthe altitude region 80 to 110 km by probingthe Doppler width of the laser-excited Dzresonance line of free sodium atoms. Theattempt to apply this method to measure-ments in summer at 690N encounters threedifficulties: (1) lack of a sufficientsodium density below 88 km altitude, (2)strongly enhanced background due to scat-tered solar radiation, and (3) potentialNa saturation effects. We have obtainedtrial observations in 12 nights of Augustand with solar depression angles as smallas -4°. During these nights temperaturesdown to 120 K have been observed.
Keywords: Atmosphere, Mesopause, Summer,Temperatures, Polar Latitude, LIDAR
1. INTRODUCTION
In the mesopause region above the summer-pole, the atmosphere becomes extremelycold. In fact, here we find the lowest am-bient temperatures occurring anywhere in-side the Earth, on Earth or in the near-Earth environment. Although this particu-lar state of our atmosphere attracts widescientific interest, we have to realizethat the measurement of temperatures inthis altitude region is still a difficulttask. Hence our firm knowledge about themesopause temperatures occurring above thesummerpole is still rather limited. Allrecently published Reference Atmospherespredict for these conditions temperaturesbetween 140 and 156 K, whereas the avail-able observations average at 128' K (vonZahn, 1989).
Knowledge about the genuine polar mesopausetemperatures is absolutely essential for anunderstanding of the formation of noctilu-cent clouds CNLC'), polar mesosphericclouds ('PMC'), the formation of heavywater cluster ions in the mesopause region,and of the life cycle of many neutral trace
constituents. In going from 145 K to 128 Kthe water vapor saturation pressure dropsfrom about 2-10-8 mbar by more than 2 or-ders of magnitude (Jansco et al., 1970).While the formation of NLC and PMC is un-likely at temperatures of 145 K, it isvery probable at and below 130 K (e.g.Jensen and Thomas, 1988; Garcia, 1989).In addition a multitude of ion-moleculereactions taking place in the D-region arestrongly dependent on the ambient tempera-ture: e.g. conversion of NO* ions to clu-ster ions, the growth rate of water clu-ster ions, ion-induced nucleation of watervapor and others (e.g. Arnold, 1980).Reaction rates for almost all these pro-cesses and those of many neutral 3-bodyreactions increase rapidly with decreasingtemperature. For these processes a dropfrom 145 K to 128 K implies a significantchange of environmental conditions.
Because of the great paucity of measuredtemperature profiles in the mesopause re-gion we have initiated the measurement ofa series of such profiles by means of aground-based lidar located at the And«iyaRocket Range (690N latitude). So far,this experiment has yielded more than 700temperature profiles during the time peri-od December through March (Neuber et al.,1988). Application of this measurementtechnique during summertime and hence indaylight is, however, not an easy taskfor reasons outlined below. To advancetowards this goal we have taken a step-by-step approach for the required improve-ments. Here we report on trial observa-tions performed in the month of August.
2. INSTRUMENT
We derive the temperature profiles fromthe measurement of the Doppler width ofthe laser-excited sodium D: resonance lineof free sodium atoms in the 80 to 110 kmaltitude range (Fricke and von Zahn, 1985)The main elements of our instrument are anarrow-band tunable dye laser, which ispumped by an UV excimer laser, a wave-length meter, a receiving telescope inCassegrain mounting, a photon countingdetector and electronics controlling the
Proc. Ninth ESAIfAC Symposium on 'European Rocket and Balloon Programmes and Related Research ', Lahnstein, FRG, 3—7 April 1989(ESA SP-291, June 1989)

64 U. VON ZAHN & H. KURZAWA
synchronization of the instrument's com-ponents, the altitude resolution, and thestorage of data. The laser system is run ata repetition rate of 15 pulses per second.The dye laser emits pulses with an energyof about 15 mJ and a spectral width of0.12 pm. The wavelength can be tuned byvariation of the pressure in the laserresonator and in an external étalon (aFabry-Perot interferometer which deter-mines the spectral width). A small percen-tage of the emitted intensity is directedinto the wavelength meter which measuresboth the wavelength of each laser pulserelative to the Na Da hyperfine structurelines as well as its spectral width. Weintegrate the photon counts received overa time span of 10 roin for the calculationof individual temperature profiles. Fornighttime observations we estimate theabsolute uncertainty of our temperaturevalues to be less than ± 5 K between 85 and95 km altitude and slightly higher aboveand below.
As mentioned above the instrument is in-stalled in a purpose-built observatory atthe Andsiya Rocket Range near Ar.denes, Nor-way (69.30N, 16.O0E).
3. WHY ARE OBSERVATIONS IN POLARSUMMER DIFFICULT ?
Any attempt to apply our measurement tech-nique in summer meets at our observationsite with three difficulties: (1) lack of asufficient sodium density below 88 km alti-tude, (2) strongly enhanced background dueto scattered solar radiation because thesun is not setting at the observation sitein summer, and (3) potential Na saturationeffects due to the high energy density in alaser beam of small divergence. We willbriefly discuss these topics in turn.
3.1. Low Sodium Densities
Successful remote sensing of temperatureprofiles via our Na lidar technique requi-res a sufficient Na atom density. For ourmeasurements performed in darkness thisvalue is approximately 100 cm-3, whereasfor twilight conditions it is closer to500 cm-3. During the long nights in winterat Andjiya th°se criteria are almost alwaysmet throughout the altitude region 81 to105 km and frequently up to 108 km (Tilgnerand von Zahn, 1988). In winter this altitu-de region also contains the mesopause, thetemperature of which can therefore be meas-ured comfortably with our Na lidar instru-ment (Neuber et al., 1988). Although it isknown for some time that in summer the Nalayer becomes thinner towards higher lati-tudes, the full extent of this decreasehas only recently been revealed by thefirst measurements of Na densities in sum-mer at polar latitudes (von Zahn et al.,1988; Gardner et al., 1988). The measure-ments by Kurzawa and von Zahn (1989) can beused to properly evaluate the altitude re-gion where e.g. in July the Na density islarger than 500 cm-3. Different from winterconditions the density exceeds this valuein summer only from 88 to 96 km altitude.This range barely includes the mean alti-
tude of the summer mesopause (von Zahn,1989). Hence, the natural dilution of thesodium layer in polar summer considerablycurtails our capabilities to measure thegenuine mesopause temperature under theseconditions.
3.2. Enhanced Background
At Andsiya permanent daylight lasts fromearly May until late July. The telescopeof the instrument receives under theseconditions an enormous amount of sunlightscattered by air molecules, aerosoles, andcloud particles (e.g. from thin cirrus).These photons must not be allowed to reachthe photon-counting multiplier or otherwisethe laser-induced photons would be swampedentirely by background photons. In orderto reduce the background two obvious mea-sures can be taken: (a) employing narrow-band filters tuned to the Na D2 line infront of the multiplier and (b) reducingthe effective field of view of the teles-cope. Measure (a) is reasonably straightforward as long as the passbands of thefilters are kept large in comparison tothe total width of the Na 02 line (approx.3 pm). So far we have observed this condi-tion because this avoids a complex decon-volution of the measured resonance lineshape with the exact transmission curvesof the filters. Application of measure (b)requires on the one hand a coincident re-duction in the divergence of the laserbeam. On the other hand, this measureleads to higher beam intensities which canproduce substantial saturation effects inthe sodium layer. The latter are clearlyundesirable (see section 3.3).
3.3. Saturation Effects
If the energy density in the laser beambecomes very high, our temperature mea-surements can be effected by differentdegrees of Na saturation at different la-ser wavelengths. Laser pulses at the maxi-mum of the Na Dz line cause a higher de-gree of saturation than those at the in-termediate minimum of the absorption crosssection. This effect is due to the finitespectral width of the laser pulse. It tendsto bias the derived temperatures towardstoo high values. As shown by von der Gathen(1989) quantitative evaluation of Nasaturation effects puts the minimum usefuldivergence for our lidar instrument atapproximately 0.1 mrad which at the sametime sets a limit for the telescope f.o.v.at about 0.15 mrad.
4. OBSERVATIONS
For reasons given in chapter 3 we have notyet achieved Na temperature measurementswith our lidar instrument at Andsiya duringJune or July (although Na densities havebeen measured routinely). It is only in thelast week of July that near local midnightthe sun starts to set below the horizon,at, which time the scattered sunlight de-creases quite significantly. We have there-fore attempted to determine temperaturesthroughout the sodium layer in early Augustand report on our results below.
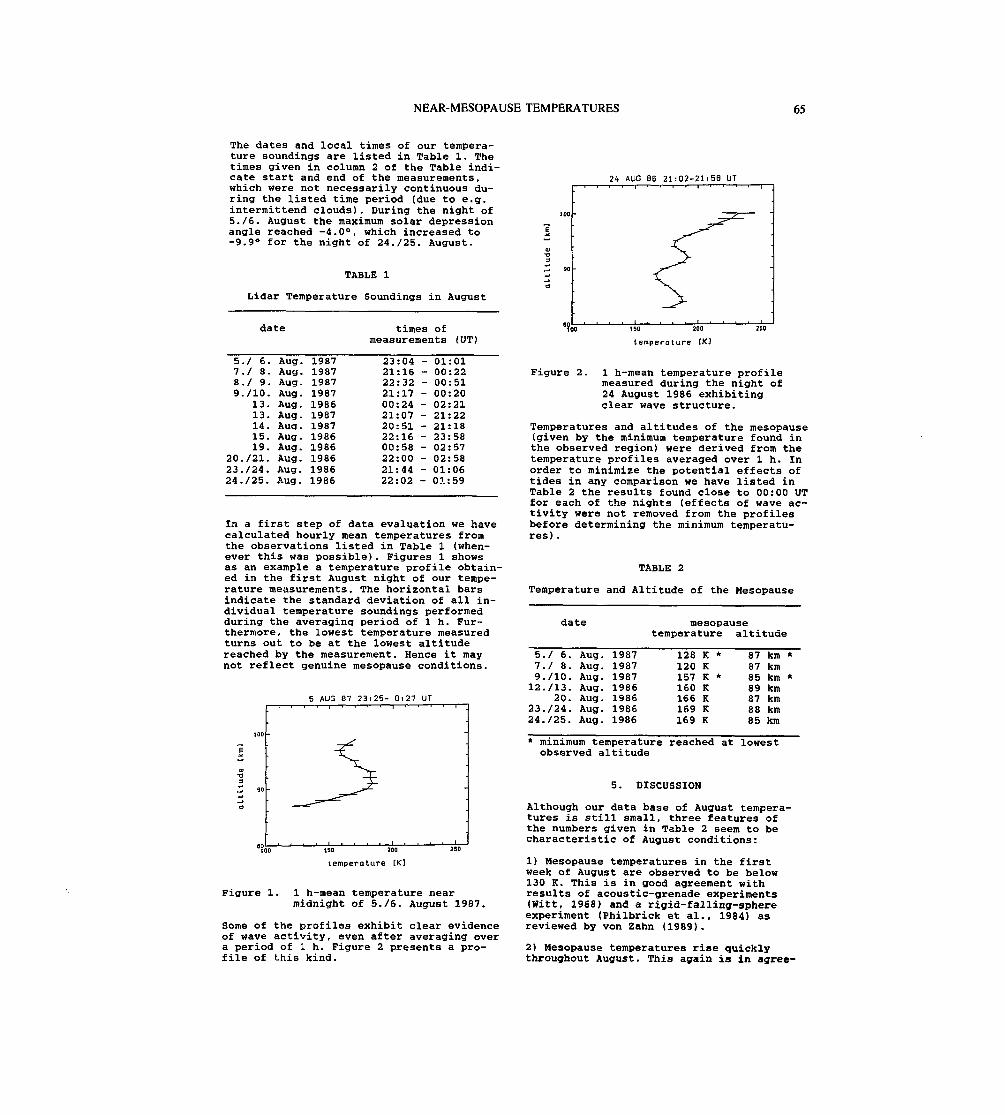
NEAR-MESOPAUSE TEMPERATURES 65
The dates and local times of our tempera-ture soundings are listed in Table 1. Thetimes given in column 2 of the Table indi-cate start and end of the measurements,which were not necessarily continuous du-ring the listed time period (due to e.g.intermittend clouds). During the night of5./6. August the maximum solar depressionangle reached -4.0°, which increased to-9.9° for the night of 24./25. August.
TABLE 1
Lidar Temperature Soundings in August
date times ofmeasurements (UT)
5./ 6.1.1 8.8./ 9.9./1O.
13.13.14.15.19.
20. /21.23. /24.24. /25.
Aug.Aug.Aug.Aug.Aug.Aug.Aug.Aug.Aug.Aug.Aug.Aug.
198719871987198719861987198719861986198619861986
23:0421:1622:3221:1700:2421:0720:5122:1600:5822:0021:4422:02
- 01:01- 00:22- 00:51- 00:20- 02:21- 21:22- 21:18- 23:58- 02:57- 02:58- 01:06- 01:59
In a first step of data evaluation we havecalculated hourly mean temperatures fromthe observations listed in Table 1 (when-ever this was possible). Figures 1 showsas an example a temperature profile obtain-ed in the first August night of our tempe-rature measurements. The horizontal barsindicate the standard deviation of all in-dividual temperature soundings performedduring the averaging period of 1 h. Fur-thermore, the lowest temperature measuredturns out to be at the lowest altitudereached by the measurement. Hence it maynot reflect genuine mesopause conditions.
5 AUG 87 23:25- Qi 27 UT
"too iso :oo 250
temperature [K]
Figure 1. 1 h-mean temperature nearmidnight of 5./6. August 1987.
Some of the profiles exhibit clear evidenceof wave activity, even after averaging overa period of I h. Figure 2 presents a pro-file of this kind.
24 AUG 86 21:02-21:58 UT
150 201
t empera ture CK]
Figure 2. 1 h-mean temperature profilemeasured during the night of24 August 1986 exhibitingclear wave structure.
Temperatures and altitudes of the mesopause(given by the minimum temperature found inthe observed region) were derived from thetemperature profiles averaged over 1 h. Inorder to minimize the potential effects oftides in any comparison we have listed inTable 2 the results found close to 00:00 UTfor each of the nights (effects of wave ac-tivity were not removed from the profilesbefore determining the minimum temperatu-res) .
TABLE 2
Temperature and Altitude of the Mesopause
date mesopausetemperature altitude
5.7.9.12.
23.24.
/ 6./ 8./10./13.20.
/24./25.
Aug.Aug.Aug.Aug.Aug.Aug.Aug.
1987198719871986198619861986
128120157160166169169
K *KK *KKKK
87878589878885
kmkmkmkmkmkmkm
*
*
* minimum temperature reached at lowestobserved altitude
5. DISCUSSION
Although our data base of August tempera-tures is still small, three features ofthe numbers given in Table 2 seem to becharacteristic of August conditions:
1) Mesopause temperatures in the firstweek of August are observed to be below130 K. This is in good agreement withresults of acoustic-grenade experiments(Witt, 1968) and a rigid-falling-sphereexperiment (Fhilbrick et al., 1984) asreviewed by von Zahn (1989).
2) Mesopause temperatures rise quicklythroughout August. This again is in agree-
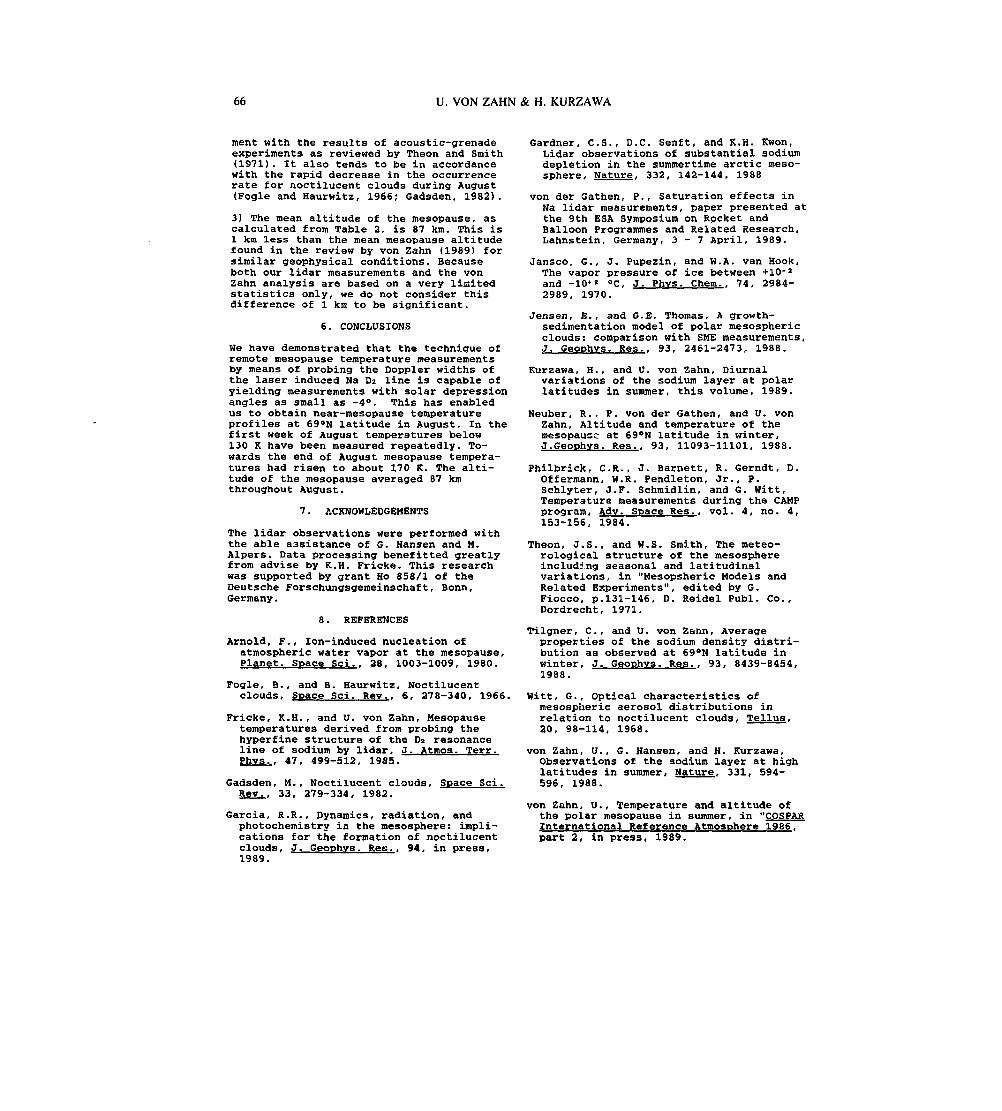
66 U. VON ZAHN & H. KURZAWA
ment with the results of acoustic-grenadeexperiments as reviewed by Theon and Smith(1971). It also tends to be in accordancewith the rapid decrease in the occurrencerate for noctilucent clouds during August(Fogle and Haurwitz, 1966; Gadsden, 1982).
3) The mean altitude of the mesopause, ascalculated from Table 2, is 87 km. This is1 km less than the mean mesopause altitudefound in the review by von Zahn (1989) forsimilar geophysical conditions. Becauseboth our lidar measurements and the vonZahn analysis are based on a very limitedstatistics only, we do not consider thisdifference of 1 km to be significant.
6. CONCLUSIONS
We have demonstrated that the technique ofremote mesopause temperature measurementsby means of probing the Doppler widths ofthe laser induced Na Dz line is capable ofyielding measurements with solar depressionangles as small as -4°. This has enabledus to obtain near-mesopause temperatureprofiles at 690N latitude in August. In thefirst week of August temperatures below130 K have been measured repeatedly. To-wards the end of August mesopause tempera-tures had risen to about 170 K. The alti-tude of the mesopause averaged 87 kmthroughout August.
7. ACKNOWLEDGEMENTS
The lidar observations were performed withthe able assistance of G. Hansen and M.Alpers. Data processing benefitted greatlyfrom advise by K.H. Fricke. This researchwas supported by grant Ho 858/1 of theDeutsche Forschungsgemeinschaft, Bonn,Germany.
8. REFERENCES
Arnold, F., Ion-induced nucleation ofatmospheric water vapor at the mesopause,Planet. Space Sci.. 28, 1003-1009, 1980.
Fogle, B., and B. Haurwitz, Noctilucentclouds. Space Sei. Rev.. 6, 278-340, 1966.
Fricke, K.H., and U. von Zahn, Mesopausetemperatures derived from probing thehyperfine structure of the Dz resonanceline of sodium by lidar, J. Atmoa. Terr.Phvs.. 47, 499-512, 1985.
Gadsden, M., Noctilucent clouds, Space Sci.Rev.. 33, 279-334, 1982.
Garcia, R.R., Dynamics, radiation, andphotochemistry in the mésosphère: impli-cations for the formation of noctilucentclouds, J. Geophvs. Res.. 94, in press,1989.
Gardner, C.S., D.C. Senft, and K.H. Kwon,Lidar observations of substantial sodiumdepletion in the summertime arctic méso-sphère. Nature. 332, 142-144, 1988
von der Gathen, P., Saturation effects inNa lidar measurements, paper presented atthe 9th ESA Symposium on Rocket andBalloon Programmes and Related Research,Latinstein, Germany, 3 - 7 April, 1989.
Jansco, G., J. Pupezin, and W.A. van Hook,The vapor pressure of ice between +10-2
and -10*« 0C, J. Phvs. Chem.. 74, 2984-2989, 1970.
Jensen, E-, and G.E. Thomas, A growth-sedimentation model of polar mesosphericclouds: comparison with SME measurements,J. Geophys. Res.. 93, 2461-2473, 1988.
Kurzawa, H., and U. von Zahn, Diurnalvariations of the sodium layer at polarlatitudes in summer, this volume, 1989.
Neuber, R., P. von der Gathen, and U. vonZahn, Altitude and temperature of themesopausc at 690N latitude in winter,J.Geophys. Res.. 93, 11093-11101, 1988.
Philbrick, C.R., J. Barnett, R. Gerndt, D.Offermann, W.R. Pendleton, Jr., P.Schlyter, J.F. Schmidlin, and G. Witt,Temperature measurements during the CAMPprogram. Adv. Space Res.. vol. 4, no. 4,153-156, 1984.
Theon, J.S., and W.S. Smith, The meteo-rological structure of the mésosphèreincluding seasonal and latitudinalvariations, in "Mesopsheric Models andRelated Experiments", edited by G.Fiocco, p.131-146, D. Reidel Publ. Co.,Dordrecht, 1971.
Tilgner, C., and U. von Zann, Averageproperties of the sodium density distri-bution as observed at 690N latitude inwinter, J. Geophvs. Res.. 93, 8439-8454,1988.
Witt, G., Optical characteristics ofmesospheric aerosol distributions inrelation to noctilucent clouds, Tellus.20, 98-114, 1968.
von Zahn, U., G. Hansen, and H. Kurzawa,Observations of the sodium layer at highlatitudes in summer. Nature. 331, 594-596, 1988.
von Zahn, U., Temperature and altitude ofthe polar mesopause in summer, in "COSPARInternational Reference Atmosphere 1986.part 2, in press, 1989.

SESSION 4IONOSPHERE/MAGNETOSPHERE
Chairman:L. Block
<Uf

69
THE ELECTRODYNAMICS OF THE POLAR IONOSPHEREWITH SPECIAL EMPHASIZE ON THE DAYSIDE CLEFT REGION
A. Egeland,Department of Physics,University of Oslo.
ABSTRACT
After a brief review of the basic equationsgoverning the electrodynamics of the dynamoregions in the ionosphere, the Harangdiscontinuity in the premidnight auroralzone is discussed. The conclusion is thatthis is a dynamic region which requiresfurther combined ground and in situ obser-vations. Special emphasize is laid on thelarge and small scale dynamics of thedayside cusp/cleft aurora and their rela-tions to the interplanetary magnetic field,particle precipitations, ionospheric elec-tric fields and Birkeland currents. Theadvantage of continuous ground-based obser-vations is pointed out, and the need forfurther coordinated ground, balloon androcket measurements poleward of 70° invari-ant latitudes is stressed.
1. INTRODUCTION
According to my encyclopedia, electrodyna-mics is "electricity in motion; a sciencethat treats the actions of electric cur-rents, on themselves, on one another, andon magnets". Thus, when Kr. Birkelandaround the turn of our century explainedthe variations of the Earth's magneticfield by three dimentional ionosphericcurrents, the electrodynamics of the polarionosphere was by definition introduced.
The electrodynamics of the ionosphereinclude both small and large scale as wellas worldwide variations on different timescales. Furthermore, a detailed presenta-tion of the electrodynamics requires bothcoordinated, ground-space observations,theories and/or model calculations. Such adetailed review is outside the scope ofthis paper. It will be demonstrated thatonly ground observations allow continuousmonitoring and thereby detailed studieswith high resolution in both space andtime.
I will mainly stick to the electrodynamicsof the dayside cleft and polar cap regions,because that is a subject which has beenlargely neglected up to recently. For adetailed review the reader is referred tothe recent Proceedings on the "Electrodyna-mics of the Polar Clefts and Caps", editedby Sandholt and Egeland (Réf. 16). Ques-tions concerning dynamics of the nightsideauroral oval and its interaction with thenightside magnetosphere and the plasma-sheet have been studied in detail (cf. e.g.Réf. 1 and 18). A brief review of the basicequations of ionospheric electrodynamicswill first be given. Only one event fromthe nightside auroral oval - related to theHarang discontinuity - will be discussed.
2. PARTICLE MOTIONS, CONDUCTIVITIESAND FIELDS
The input parameters are height variationsof electron and ion collision frequency( Le , Li ), electron and ion gyrofrequency(wee , we i ) and electron and ion plasmafrequency (u>Pe, up i ) . The mobility of elec-trons above " 80 km is controlled by thegeomagnetic field. Collisions dominate theion motion below approximately " 150 km.The neutral winds will cause redistribu-tions of the F-region ionization (cf. e.g.Réf. 19). In the E region (also called thedynamo region), where uice > Le n and me i "L i n , the differential streaming betweenions and electrons causes plasma insta-bilities (cf. e.g. Réf. 2 and 5).
A k particle with velocity Vk moves on theaverage a distance Vk/Ln between eachcollision. This distance, called the meanfree path, can be obtained from the expres-sion
2 1/2(1)
where K is the Boltzmann's constant and Tkis the temperature. The ratio rck/r\k (rckis the gyro radius) contains informationabout the influence of the magnetic fieldrelative to collisions.
Proc. Ninth ESA/PAC Symposium on 'European Rocket and Balloon Programmes and Related Research', Lahnstein. FRG, 3—7 April 1989(ES\ SP-291, June 1989)

70 A. EGELAND
An electric field E will set the chargedparticles into notion, so the ionizationwill start to drift and electric currentsdetermined by the charged particle's densi-ties and their mobilities. Charge neutra-lity is assumed (i.e. Nc = Ni) and weneglect effects from negative ions. Mecha-nical forces acting in this medium are alsoneglected. Between collisions, the k par-ticle is therefore only affected by E and Bfields, and its equation of motion will be
— -k dt= q (E + v
k kX B) , (2)
where vt is the velocity relative to theneutral gas. The B field is directed alongthe z-axis, while the E field is in the xzplane, and both are assumed homogeneous.The velocity difference between the ionizedand neutral gas is given by (cf. e.g. Réf.2)
(3)
. + an x B) x B g,<_
where £k = qt/|qk|, Vn = velocity of theneutral gas and the indices and referto components parallel and perpendicualr tothe magnetic field.
The directions and magnitudes of the velo-city component traverse to B are given by
ai, =
, = sin Ok x /B) (4)
Above " 180 km where Lk n « uic k we have ae" K I " 90° . Thus, Ve " v i = E x B./B2 (cf.Eqs. 3 and 4). If, on the other hand, 1/kn >luck , as is the case below 80 km, the ionswill move nearly parallel and the electronsantiparallel to the E field and the velo-city becomes small as the collision freque-ncy is very large (cf. Eqs. 3 and 4).
The current density (i.e., Ne = Ni and onlysingle charged ions) is given by
x B.) (5)x B)/ B + (TnEn
The conductivities Oe , du , and <J arecalled respectively Pedersen, Hall, andparallel conductivity. We find
-fc "?„ + "a
'-['
S l (66)
(6c)
Notice that cfp and Ou are different fromzero just because collisions occur. Furthe-rmore, currents in the direction of the Efield (Pedersen-currents) add, whereasthose perpendicular to E (corresponding toOa ) subtract.
50 100ALTITUDE [km]
Fig. 1: Altitude profiles of Pedersen andHall conductivity for a plasma density of106 nr3 and an assumed averaged ion mass of30 (Sears et al., 1974).
The conductivity per electron and per ion(i.e. (î'p = af /Nk and ff'u. = ffn /Nk calcula-ted from Eqs. (6a) and (6b) are shown inFig. 1. The actual Pedersen and Hall con-ductivity can then be estimated from Fig. 1when we know the height profiles of elec-trons and ions. This figure clearly showsthat the Pedersen conductivity for elec-trons in the E region is almost entirelydue to the positive ions. On the otherhand, the ionospheric Hall conductivity ismainly caused by the electrons.
In the ionosphere, a is much larger thanthe perpendicular components, and conse-quently E_ » E . Oftan the geomagneticfield lines mav be considered perfectly

ELECTRODYNAMICS OF POLAR IONOSPHERE 71
conductive and then E becomes almostheight-independent. For ff " -, the E-fieldcan be obtained straightforward from the B-field observations.
If the ionospheric layers are effectivelycoupled together, one may use the conceptheight-integrated conductivities
3. THE HARANG DISCONTINUITY
The name "Harang discontinuity" was givenby Heppner (Réf. 7) to the reversal of thehorizontal disturbance in magnetic fields(cf. Fig. 2) found in the premidnightauroral zone by Harang in 1946. Based onstatistical analysis of the magnetic dis-turbance at a number of observatories,Harang found that the H-component changedfrom positive to negative at a magneticlocal time between 21h and midnight, withthe change taking place first at the high-est latitudes. Harang1s speculation thatthis change in the magnetic disturbancemight be accompanied by a correspondingdiscontinuity in the auroral display wasconfirmed by Heppner (Réf. 7). The majorchange occurred when the comparativelyquiet, usually homogeneous aurora nearmidnight broke into bright, rapidly moving,rayed aurora (i.e. auroral breakup). Thisdiscontinuity is also related to the patt-ern of convective plasma flow in the magne-tosphere.
Fig. 2: Contours of equalHarang's (1946) Rangelevels: Solid lines (+AH,dotted lines (-AH, -AZ,dashed lines for AH andcenter of the current
AH, AD, £& forIII disturbance+AZf West dec.),East dec.), heavy&Z indicate thesystem. Original
coordinates are magnetic latitude and solarlocal time. The magnetic local time scaleis added for AH.
The primary physical relationship is be-tween the plasma flow, the electric fields
and the currents. The E-field reversal hasbeen seen both by rockets and satellitesobservations (cf. Refs. 10 and 6) and byradars (Refs. 21 and 11). The dynamicalbehaviour connected with the Harang discon-tinuity is complex and not completelymapped.
In order to investigate this structure, andto resolve spatial from temporal varia-tions, two rockets were launched into aregion where an assessment of the ground-based optical and magnetic records indica-ted that the Harang discontinuity ought tobe.
The investigation is based on electricfields and precipitating particle measurem-ents from the rockets launched simultan-eously from And0ya Rocket Range on 27November 1976. One payload, on a Terrier-Malemute (F-38), attained a peak altitude
of 531 km and the other on a Nike-Tomahawk(F-39) reached 208 km. The rockets traversea range of 300 km while introducing alti-tude separations of up to 440 km. Separa-tions between the ionospheric feet of thefield lines through the two rockets reachedup to 100 km. The data set was particularlyvaluable for studies of the fine structureand dynamics of auroral phenomena in gene-ral and the Harang discontinuity in parti-cular (Réf. 6).
4.THE E-FIELD CHARACTERISTIC IN RELATION TOOPTICAL AURORA, PARTICLE PRECIPITATIONAND MAGNETIC DISTURBANCES
The AH variations recorded near launchshow negative bays at each station north ofLycksâle (Fig. 3). The bay reached maximum- 130 nT at the Range. The magnetometertraces at Troms0 and Anduya returned tosmall positive values and then decreasedagain (cf. Fig. 3) .
MAGNETIC RECORDINGS27 NOVEMBER 1976
Fig. 3: Horizontal geomagnetic disturbancesat the Range and at thres other localstations vs UT and flight time. The loca-tions of these magnetic observatories areplotted on the map as functions of geogra-phic and geomagnetic coordinates.

72 A. EGELAND
The most pronounced auroral forms at seveninstances after launch - as seen by theAndoya all-sky camera - are mapped in Fig.4. The locations of the rockets relative tothe aurora are also plotted, together withthe instantaneous magnitude and directionof the ionospheric electric fields. Basedon the electric fields observed on bothrockets, the flight has been divided intothree intervals (cf. Fig. 5). The charac-teristics of these intervals are presentedin the following subsections.
4.1. Stage I summary
Initially, the E-field on F-38 was basical-ly southward, while a southwestward fieldwas observed on F-39. On both rockets themaximum amplitudes are approximately 20 mVm-'. The field decreased and near 143 sinto the flight its direction reversed tonorthward. This reversal was observed onboth rockets within 1 s of each other whenthe projected positions of the two payloadswere 25-30 km apart. The east-west compo-nent at both rockets was small « 3 mV nr1). There was no dramatic change in parti-cle characteristics coincident with theelectric field reversal at 143 s.
From 145 to 180 s the northward E-field onF-38 and F-39 increased to roughly 20 mV nr1 , a value first reached at F-39, therocket furthest to the north. Thus, theionospheric electric field was similar bothin magnitude and direction on both pay-loads, which were then horizontally separa-ted by 40 km (at 180 s). The electronprecipitation prior to 180 s was character-ized by very variable fluxes (over scalesize of less than 10 km), particularly forenergies below 1 keV.
The net field-aligned current (integratedover both up- and downward fluxes) is shownfor both suprathermal (6 eV < £ < 450 eV)and energetic (450 eV < E < 25 keV) elec-trons in Fig. 6.
Currents are only shown for altitudesgreater than 200 km, where effects such asabsorption and horizontal currents arenegligible. The current density reflectsthe burst-like nature of the precipitation.The total magnitudes of the field alignedcurrents of between 1 and 15 uA nrz aretypical (Réf. 20).Note that currents carried by the thermalplasma are not included.
4.2. Stage II summary
The F-39 rocket penetrated an auroral bandand then 25 s later observed the electricfield to reverse from northward to south-ward. The electron spectra within the bandrevealed an inverted V structure whichreached a peak simultaneously with a brigh-tening of the aurora. F-38, not reachingthe band, encountered only extremely weakprecipitation and an approximately northw-ard field.
Fig. 4: The locations of the auroral formsat 7 instances during the flight, as scaledfrom the And0ya all-sky photographs, areplotted vs. geographic coordinates. Thelower auroral border was assumed to be at110 km, and the shaded areas indicate thehorizontal direction in which the auroraextends. The rocket locations together withthe magnitude and direction of the electricfields for the corresponding times are alsoplotted. The auroral form observed by theDMSP satellite before the flight has beenincluded on the plots for 130 s, as the twoopen loops tracing the edges of the forms.
4.3. Stage III summary
Stage III covers the period in which thehorizontal magnetic disturbance on the
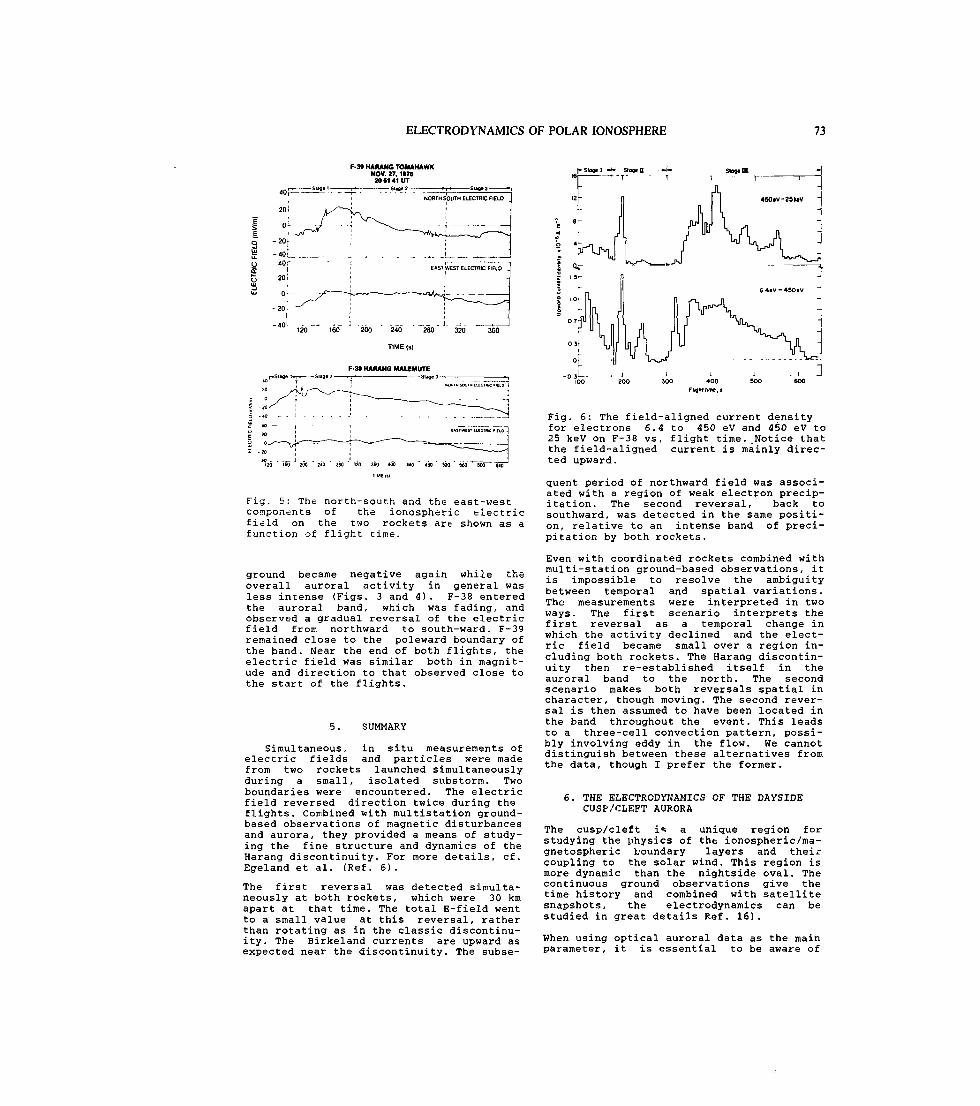
ELECTRODYNAMICS OF POLAR IONOSPHERE 73
F-3» HARANG TOMAHAWKNOV. 27, 197620 51 41 UT
sug«2
SlogtUX
120 160 200 240 280 320 360
120 ISO 200 2*0 ' 260 ' 320 ' 360 «00 «40 4BO ' 520 ' "S6Ô"~~6»1ÎÔ
Fig. 5: The north-south and the east-westcomponents of the ionospheric electricfield on the two rockets are shown as afunction of flight time.
ground became negative again while theoverall auroral activity in general wasless intense (Figs. 3 and 4). F-38 enteredthe auroral band, which was fading, andobserved a gradual reversal of the electricfield from northward to south-ward. F-39remained close to the poleward boundary ofthe band. Near the end of both flights, theelectric field was similar both in magnit-ude and direction to that observed close tothe start of the flights.
5. SUMMARY
Simultaneous, in situ measurements ofelectric fields and particles were madefrom two rockets launched simultaneouslyduring a small, isolated substorm. Twoboundaries were encountered. The electricfield reversed direction twice during theflights. Combined with multistation ground-based observations of magnetic disturbancesand aurora, they provided a means of study-ing the fine structure and dynamics of theHarang discontinuity. For more details, cf.Egeland et al. (Réf. 61.
The first reversal was detected simulta-neously at both rockets, which were 30 kmapart at that time. The total E-field wentto a small value at this reversal, ratherthan rotating as in the classic discontinu-ity. The Birkeland currents are upward asexpected near the discontinuity. The subse-
Fig. 6: The field-aligned current densityfor electrons 6.4 to 450 eV and 450 eV to25 keV on F-38 vs, flight time. Notice thatthe field-aligned current is mainly direc-ted upward.
quent period of northward field was associ-ated with a region of weak electron precip-itation. The second reversal, back tosouthward, was detected in the same positi-on, relative to an intense band of preci-pitation by both rockets.
Even with coordinated rockets combined withmulti-station ground-based observations, itis impossible to resolve the ambiguitybetween temporal and spatial variations.The measurements were interpreted in twoways. The first scenario interprets thefirst reversal as a temporal change inwhich the activity declined and the elect-ric field became small over a region in-cluding both rockets. The Harang discontin-uity then re-established itself in theauroral band to the north. The secondscenario makes both reversals spatial incharacter, though moving. The second rever-sal is then assumed to have been located inthe band throughout the event. This leadsto a three-cell convection pattern, possi-bly involving eddy in the flow. We cannotdistinguish between these alternatives fromthe data, though I prefer the former.
6. THE ELECTRODYNAMICS OF THE DAYSIDECUSP/CLEFT AURORA
The cusp/cleft i^ a unique region forstudying the iihysics of the ionospheric/ma-gnetospheric boundary layers and theircoupling to the solar wind. This region ismore dynamic than the nightside oval. Thecontinuous ground observations give thetime history and combined with satellitesnapshots, the electrodynamics can bestudied in great details Réf. 16).
When using optical auroral data as the mainparameter, it is essential to be aware of

74 A. EGELAND
the different plasma sources according tospectral properties, location and dynamicalcharacteristics. This is illustrated by thephotometer traces of the red and greenoxygen lines in Fig. 7 and summarized in
JAN. 23,1965
SWLBA8D PHOTOMETERS
r "° muum j
I • 'V • /.,,,.J.... ; v^
06.11.91
OS.15.1«
H 40 O 40 *
IENITH «HOLE
Fig. 7: North-south meridian scanningphotometer traces of red and green oxygenlines in dayside high-latitude auroras.Notice the cusp-like auroral signaturesouth of zenith, dominated by the red line.A different spectral composition is obser-ved around or slightly north of zenith, aswell as near the southern horizon.
Table I (Réf. 13). Notice the cusp-likeauroral signature south of zenith, with adifferent spectral composition [I(630)/(55-7,7) " 1] near zenith as well as in thesouthern horizon. The discrete aurora onthe poleward side occurred during a short
interval with IMF Be > O within a longerperiod with negative Bz. The simultaneousDMSP F7 pass, recorded soft (Eav " 100 eV)between 73-75° K consistent with the reddominated broad arc in Fig. 7. More energe-tic electrons (" 1 HeV) were observed near76° h, corresponding to the discrete auroraat zenith. Plasmasheet-like particles (1-10keV) were recorded south of 73° à, consist-ent with the enhanced green line intensity(cf. also Table I).
Cusp-like precipitation was seen between 68and 70» ,>>. The IMF amplification at 0745 UTwas followed by a strong intensification ofthe aurora.
The poleward expansion started " 15 minafter Bz went positive. Notice that thelonglasting, poleward boundary expandedsignificantly more than the equatorwardboundary, i.e. a wider cusp region duringBj > O. Cusp-like electrons were observedbetween 70 and- 76" ,'. at 0905 UT. The pole-ward boundary of the cleft arc shows astronger response of IMF 82 than the equa-torward boundary.
The transition to due northward IMF orien-tation at 0930 UT caused a significantreduced auroral intensity, and a narrow
auroral belt close to 80° /•..
Based on this and similar events, it can beconcluded that the width, the location andmovements of the dayside oval are verysensitive to the solar wind and IMF varia-tions (cf. also Refs. 14 and 15).
6.2. Smaller-scale dynamics
Auroral structures with dimensions lessthan a few hundred km in events lastingless than 10-15 min. were presented at the8th ESA Symposium in 1987 (cf. Sandholt andEgeland, Réf. 14). The reader is referredto this paper for a review.
Cate- Spectral ratio;gory 630.0nm/557.7nm
1 < 1
2 » 2*
3 > 1
4 < 1
Latitudinallocation
poleward ofcusp
cusp
equatorwardof cusp
equatorwardof cleft
Typical energyof precipitatingelectrons
- 1 keV
< 200 eV*
0.2-1 keV
1 - 1 0 keV
Plasmasource
polar cap/plasma mantle
polar cusp/magnetosheath
LLBL
Dayside ex-tention ofplasmawheath
Also transient discrete forms with higher green line intensities (Rand electron energies.
< 2)

ELECTRODYNAMICS OF POLAR IONOSPHERE 75
Fig. 8: Relationship between the interpla-netary magnetic field (IMF) (left threepanels) and the midday polar cusp auroraabove Svalbard. Intensity vs zenith angleand time is shown in the middle panel, aswell as the geomagnetic disturbance fieldrecorded at three Svalbard stations (rightthree panels). The data recorded on theground have been shifted by 15 min relativeto the IMF trace, in order to take into ac-count the time delay between the IMF signaldetected by the satellite (ISEE-2) in thesolar wind and the geophysical responseobserved on the ground. Arrows in the time-scale to the right mark two successive DMSPF-7 passes above the cusp aurora. The firstpass occurred 1 hr to the west of Svalbardand the second one along the east-coast ofGreenland.
Fig. 9: Electron precipitation measurementsduring two successive passes of DMSP F-7between Svalbard and Greenland on January4, 1984. The polar cusp, marked by verticalfull lines, is characterized by enhancedflux (J) (exceeding " 10° el .cm-2 s-' sr-' )and decreased average energy ((tAi) (bdlow
200 eV). Compare the opticaldata inFiggure 6)
The up-to-date cnaracteristics are listedin Table II
6.1. Larg-i-scale dynamics
According to present merging/reconnectiontheories of solar-terrestrial coupling, thelatitudinal location and movement of thepolar cusp/cleft is the net result ofdayside merging and nightside reconnection;i.e. the whole magnetospheric convectioncycle is involved (cf. e.g. Réf. 3). Whendayside merging dominates, the cusp/cleftis displaced equatorward, associated withthe net transport of magnetic flux towardsthe nightside. If nightside reconnectiondominates, the cusp moves poleward, ac-cording to the flux transfer concept (Réf.8) .
The relation between the location and widthof the cusp/cleft aurora and the IMF willbe illustrated by the one event plotted inFig. 8. The two arrows - to the right-mark two successive DMSP F-7 passes. Thefirst occurred 1 hr to the west of ourstation, while the second one was along theeast-cost of Greenland. The response to anIMF transition from a large negative to alarge positive B^ value is illustrated inFig. 9. During the negative Bz (before 03UT) , the aurora was located near 70° ;..
TABLE II. Cusp/cleft auroral structures
Characteristics
1. 1-5" poleward motion acrossthe cusp/cleft
2. Longitudinal motion relatedto IMF Bv
3. Latitudinal width: Ls "50-100 km
4. Longitudinal extension:L» » Lx
5. Lifetime: " 3-10 min.
6. Series of events - recurr-ence time: " 3-15 min.
7. Occurrence: IMF Bz < O
8. Northward E-field (IMF By >O) : ' 100-300 mV/m.
9. Electron acceleration:_V ' 0.1-1,5 keV
10. iH on the ground; single,monopolar deflection (if y> 1 keV)
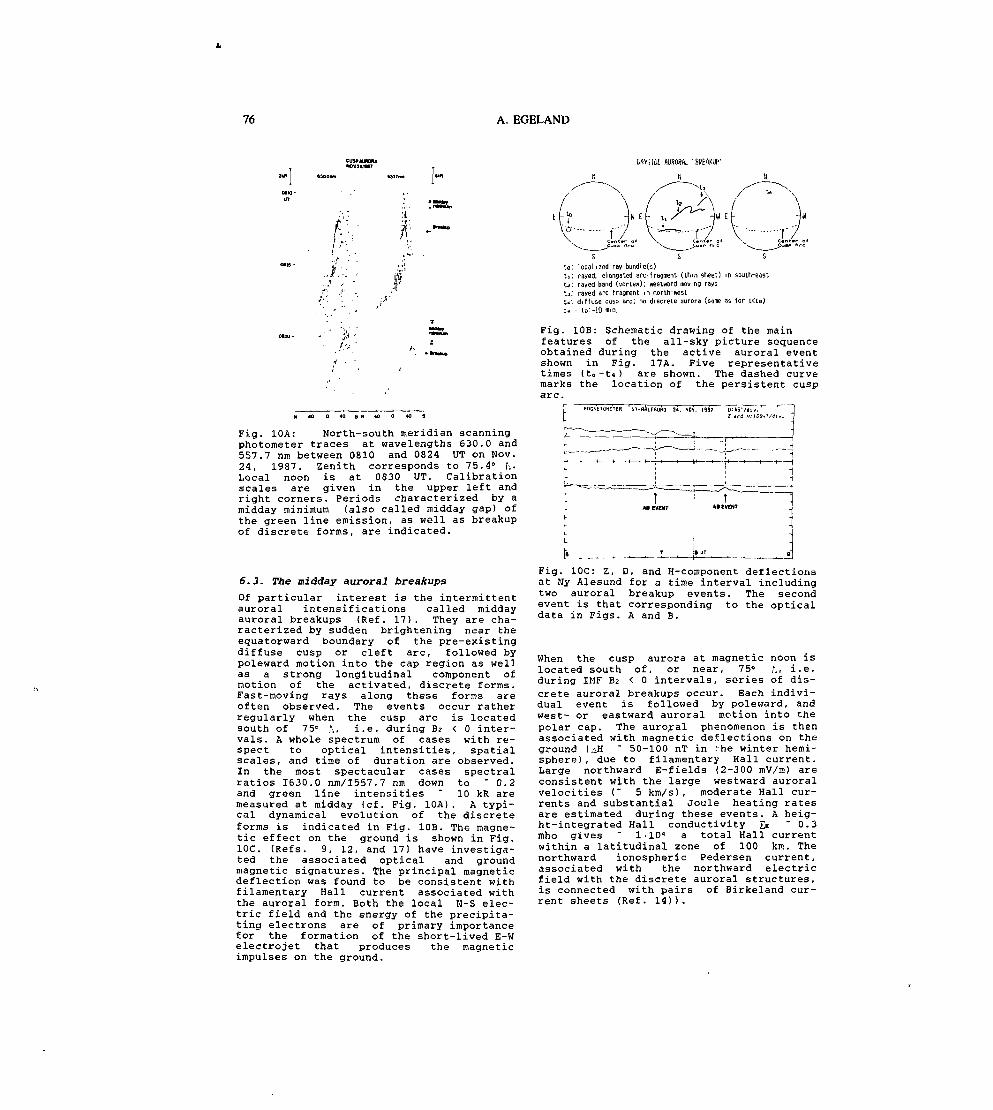
76 A. EGELAND
WVSlOE HSiUM. 1
f-
Fig. 1OA: North-south meridian scanningphotometer traces at wavelengths 630.0 and5S7.7 nm between 0810 and 0824 UT on Nov.24, 1987. Zenith corresponds to 75.4" f-..Local noon is at 0830 UT. Calibrationscales are given in the upper left andright corners. Periods characterized by amidday minimum (also called midday gap) ofthe green line emission, as well as breakupof discrete forms, are indicated.
6.3. The midday auroral breakups
Of particular interest is the intermittentauroral intensifications called middayauroral breakups (Réf. 17). They are cha-racterized by sudden brightening near theequatorward boundary of the pre-existingdiffuse cusp or cleft arc, followed bypoleward motion into the cap region as wellas a strong longitudinal component ofmotion of the activated, discrete forms.Fast-moving rays along these forms areoften observed. The events occur ratherregularly when the cusp arc is locatedsouth of 75° A., i.e. during Bz < O inter-vals. A whole spectrum of cases with re-spect to optical intensities, spatialscales, and time of duration are observed.In the most spectacular cases spectralratios 1630.0 nm/I557.7 nm down to "0.2and green line intensities " 10 kR aremeasured at midday (cf. Fig. 1OA). A typi-cal dynamical evolution of the discreteforms is indicated in Fig. 1OB. The magne-tic effect on the ground is shown in Fig.1OC. (Refs. 9, 12, and 17) have investiga-ted the associated optical and groundmagnetic signatures. The principal magneticdeflection was found to be consistent withfilamentary Hall current associated withthe auroral form. Both the local N-S elec-tric field and the energy of the precipita-ting electrons are of primary importancefor the formation of the short-lived E-Welectrojet that produces the magneticimpulses on the ground.
rayed, elongated arc-fragrent (Ihm sheet) in south-eastrayed band (vortex): westward noving raysrayed arc fragment m north-westdi f fuse cusp arc; no discrete aurora (same as for KIu)
- IB:-10 mm.
Fig. 1OB: Schematic drawing of the mainfeatures of the all-sky picture sequenceobtained during the active auroral eventshown in Fig. 17A. Five representativetimes (to-ti) are shown. The dashed curvemarks the location of the persistent cusparc.
MBGNETOHETER N'-flflLESUNO !4. NOV. 1987 DMBVdIv.
~
! ~~~*
î
• *
--,
A» EVENT *• S
"ENT
-î' î
1-\
"
J
Fig. 1OC: Z, D, and H-component deflectionsat Ny Alesund for a time interval includingtwo auroral breakup events. The secondevent is that corresponding to the opticaldata in Figs. A and B.
When the cusp aurora at magnetic noon islocated south of, or near, 75° /., i.e.during IMF Bz < O intervals, series of dis-crete auroral breakups occur. Each indivi-dual event is followed by poleward, andwest- or eastward auroral motion into thepolar cap. The auroral phenomenon is thenassociated with magnetic deflections on theground ( &H " 50-100 nT in Mie winter hemi-sphere), due to filamentary Hall current.Large northward E-fields (2-300 mV/ro) areconsistent with the large westward auroralvelocities (" 5 km/s), moderate Hall cur-rents and substantial Joule heating ratesare estimated during these events. A heig-ht-integrated Hall conductivity IH "0.3mho gives " 1-1O" a total Hall currentwithin a latitudinal zone of 100 km. Thenorthward ionospheric Pedersen current,associated with the northward electricfield with the discrete auroral structures,is connected with pairs of Birkeland cur-rent sheets (Réf. 14)).

ELECTRODYNAMICS OF POLAR IONOSPHERE
The results presented here indicate theimportant roles of transient magneticreconnection together with the transfer ofmagnetic flux, momentum, and energy betweenthe solar wind and the polar cusp/cleft. Toestablish the plasma dynamics/accelerationmechanisms related to the present auroraland magnetic observations (cf. Tables 1 &ID) further measurements are needed. Abetter statistics on the relationships withthe interplanetary magnetic field is alsorequired. Future models of plasma dynamicsin the dayside magnetopause boundary layersconnected to the flux tubes in the cusp/-cleft should, however, be consistent withthese observations.
7. SUMMARY AND CONCLUSIONS
Clear responses are observed in the polarcusp and cleft auroras during intervals ofIMF north-south transitions. A linearrelationship between the latitude of thecusp equatorward boundary and IMF Bz hasbeen established. The poleward boundary ofthe cusp/cleft arc shows a much strongerresponse than the equatorward boundary. Asa consequence, the cusp/cleft is oftenbroader during B^ > O periods compared toB^ < O conditions.
1.
2.
3.
4.
5.
6.
7.
8.
9.
10.
11.
12.
13.
14.
15.
16.
17.
18.
19.
20.
21.
REFERENCES
Akasofu S-I 1977, Physics of Magneto-spheric Substorms, D.Reidel Publ. Co,Dordrecht, Holland.Bostrom R, 1973, p. 151 in CosmicalGeophysics, Universitetsforlaget.Cowley S W H 1984, Eur. Space AgencySpec. Publ, ESA SF-217, 483.'
99 in AtmospheresD. Reidel p'u'bi ~.
61 inESRO.
29,
et al 1986, J. Geophys.
1988, J. Geomagn.
Egeland A 1975, p.of Earth and Planets,Co, Dordrecht, Holland.Egeland A & Holtet J 1972, pEuropean Res, at High LatitudesSP-97.Egeland A et al 1985, J. Atm_. Ter r.Phys. 47, 693.Heppner J P 1972, Geophys. Publ.105.HoltzerRes. 91, 3287Kokubun S et alGeoelectr. 40, 537Maynard N C 1974, J. Geophys. Res. 79,4620.Nielsen E & Greenwald R A 1979, J_=.Geophys. Res. 84, 4189.Oguti T et al 1988, J. Geomagn. Geo-electr. 40, 387.Sandholt P E 1989, Adv. in Space Res.(in press)Sandholt P E S Egeland A 1987, ESASP-270, 255.Sandholt P E S Egeland A 1988, Astro-phys. Space Sci 144, 171.Sandholt P E & Egeland A1989, Electro-dynamics of the Polar Cusp and Clefts(Eds.) D. Reidel Publ. Co, Dordrecht,Holland.Sandholt PGeoelectr.Shepherd G G etRes. 85, 4587.Smith R 1985, p. 243 in The PolarCusp (Holtet, J A and Egeland A, eds.)NATO, Ser. C, Vol. 145, Reidel Publ.Co, Dordrecht Holland.Sugiura M et al 1984, p. 96 in Magne-tospheric Currents (T.A. Potemra, ed)AGU Monograph, 28.Wedde T et al. 1977, J. Geophys. Res.82, 2743.
E et al 1989,(in press).
al 1980,
J. Geomagn.
J. Geophys.
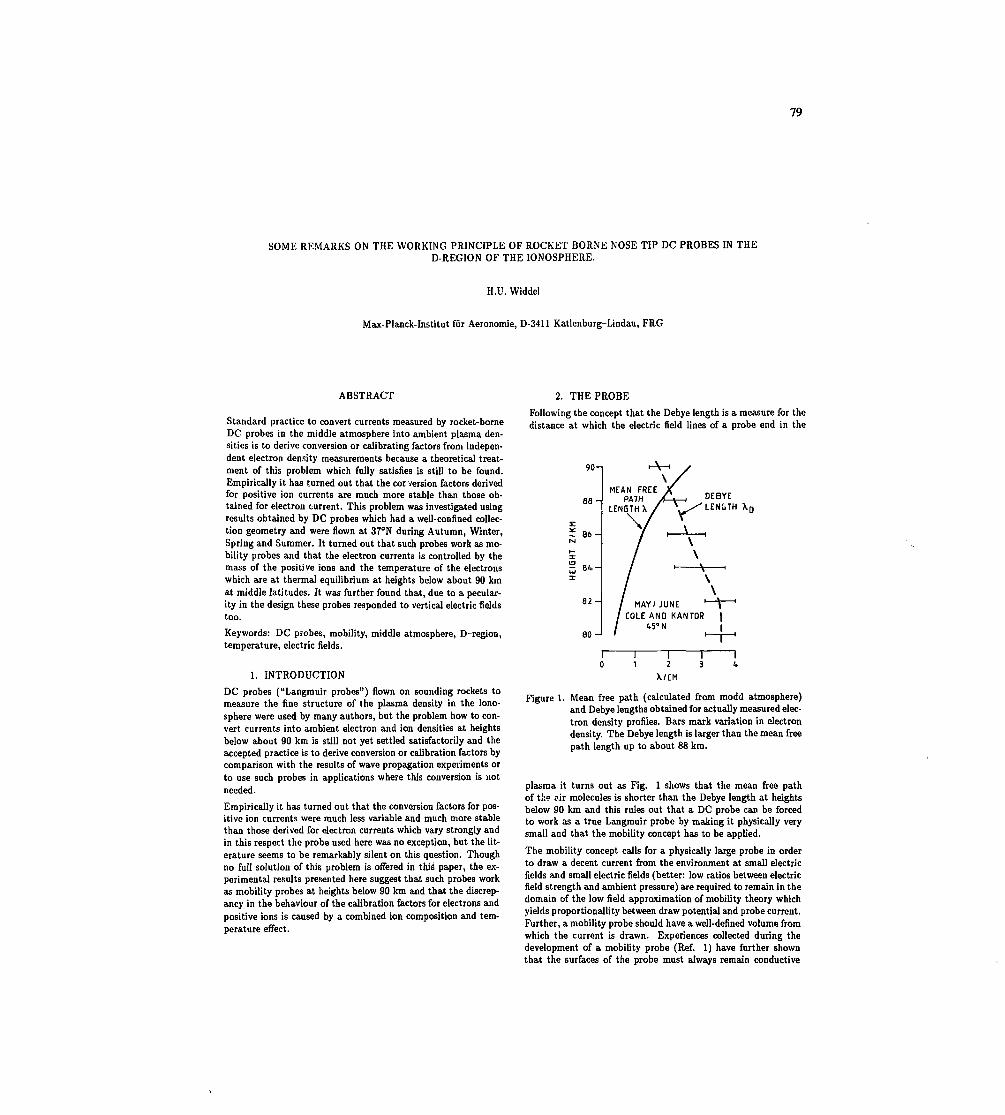
79
SOME REMARKS ON THE WORKING PRINCIPLE OF ROCKET BORNE NOSE TIP DC PROBES IN THED-REGION OF THE IONOSPHERE.
H.U. Widdel
Max-Planck-Institut fur Aeronomie, D-3411 Katlenburg-Lindau, FRG
ABSTRACT
Standard practice to convert currents measured by rocket-borneDC probes in the middle atmosphere into ambient plasma den-sities is to derive conversion or calibrating factors from indepen-dent electron density measurements because a theoretical treat-ment of this problem which fully satisfies is still to be found.Empirically it has turned out that the cor version factors derivedfor positive ion currents are much more stable than those ob-tained for electron current. This problem was investigated usingresults obtained by DC probes which had a well-confined collec-tion geometry and were flown at 370N during Autumn, Winter,Spring and Summer. It turned out that such probes work as mo-bility probes and that the electron currents is controlled by themass of the positive ions and the temperature of the electronswhich are at thermal equilibrium at heights below about 90 kmat middle latitudes. It was further found that, due to a pecular-ity in the design these probes responded to vertical electric fieldstoo.
Keywords: DC probes, mobility, middle atmosphere, D-region,temperature, electric fields.
1. INTRODUCTION
DC probes ("Langmuir probes") flown on sounding rockets tomeasure the fine structure of the plasma density in the iono-sphere were used by many authors, but the problem how to con-vert currents into ambient electron and ion densities at heightsbelow about 90 km is still not yet settled satisfactorily and theaccepted practice is to derive conversion or calibration factors bycomparison with the results of wave propagation experiments orto use such probes in applications where this conversion is notneeded.
Empirically it has turned out that the conversion factors for pos-itive ion currents were much less variable and much more stablethan those derived for electron currents which vary strongly andin this respect the probe used here was no exception, but the lit-erature seems to be remarkably silent on this question. Thoughno full solution of this problem is offered in this paper, the ex-perimental results presented here suggest that such probes workas mobility probes at heights below 90 km and that the discrep-ancy in the behaviour of the calibration factors for electrons andpositive ions is caused by a combined ion composition and tem-perature effect.
2. THEPROBEFollowing the concept that the Debye length is a measure for thedistance at which the electric field lines of a probe end in the
90-i
88-1
! 86 -
82-
80-"
DEBYEL E N G T H X0
MAY/JUNE '—V"COLE AND KANTOR |
(.50N I
12
X./CM
Figure 1. Mean free path (calculated from modd atmosphere)and Debye lengths obtained for actually measured elec-tron density profiles. Bars mark variation in electrondensity. The Debye length is larger than the mean freepath length up to about 88 km.
plasma it turns out as Fig. 1 shows that the mean free pathof the air molecules is shorter than the Debye length at heightsbelow 90 km and this rules out that a DC probe can be forcedto work as a true Langmuir probe by making it physically verysmall and that the mobility concept has to be applied.
The mobility concept calls for a physically large probe in orderto draw a decent current from the environment at small electricfields and small electric fields (better: low ratios between electricfield strength and ambient pressure) are required to remain in thedomain of the low field approximation of mobility theory whichyields proportionallity between draw potential and probe current.Further, a mobility probe should have a well-defined volume fromwhich the current is drawn. Experiences collected during thedevelopment of a mobility probe (Réf. 1) have further shownthat the surfaces of the probe must always remain conductive
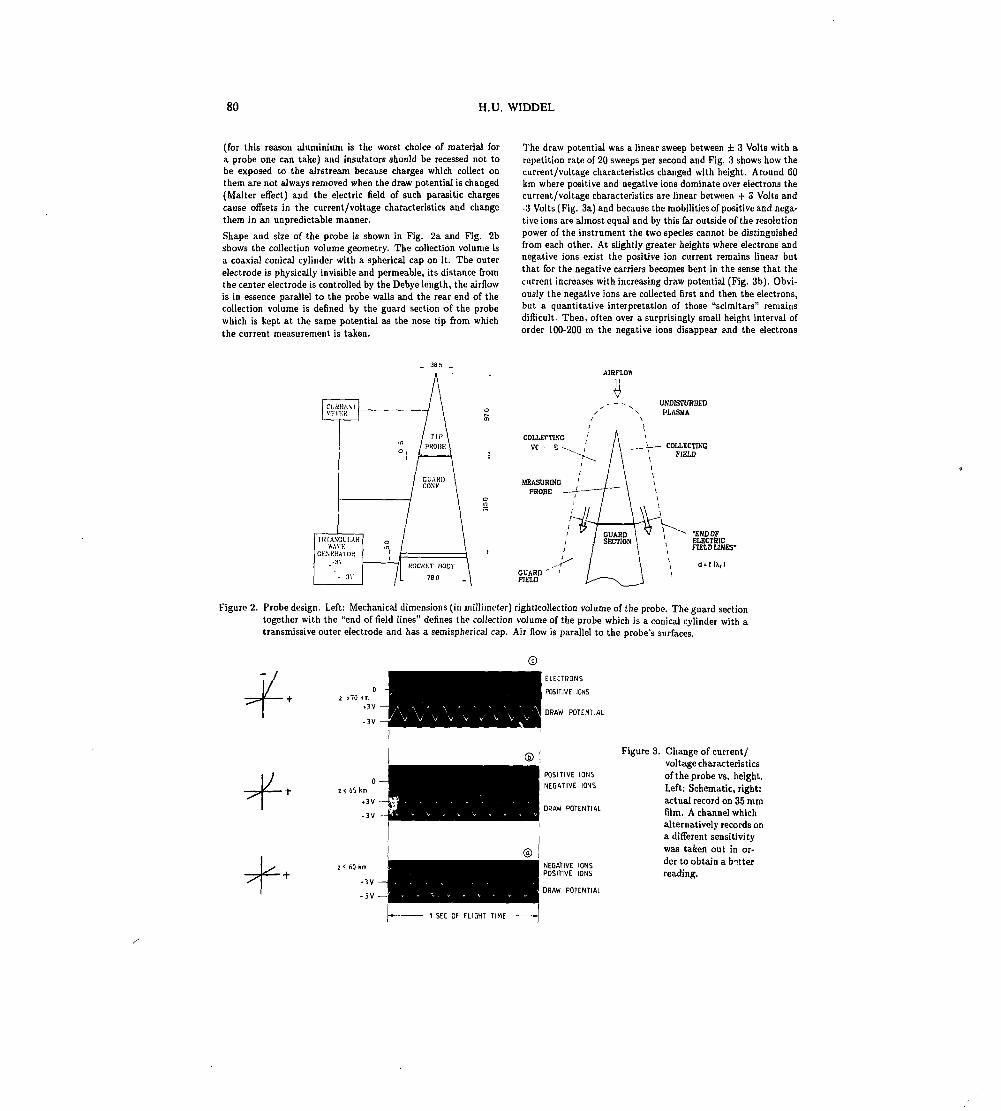
80 H.U. WIDDEL
(for this reason aluminium is the worst choice of material fora probe one can take) and insulators should be recessed not tobe exposed to the airstream because charges which collect onthem are not always removed when the draw potential is changed(Matter effect) and the electric field of such parasitic chargescause offsets in the current/voltage characteristics and changethem in an unpredictable manner.
Shape and size of the probe is shown in Fig. 2a and Fig. 2bshows the collection volume geometry. The collection volume isa coaxial conical cylinder with a spherical cap on it. The outerelectrode is physically invisible and permeable, its distance fromthe center electrode is controlled by the Debye length, the airflowis in essence parallel to the probe walls and the rear end of thecollection volume is defined by the guard section of the probewhich is kept at the same potential as the nose tip from whichthe current measurement is taken.
The draw potential was a linear sweep between ± 3 Volts with arepetition rate of 20 sweeps per second and Fig. 3 shows how thecurrent/voltage characteristics changed with height. Around 60km where positive and negative ions dominate over electrons thecurrent/voltage characteristics are linear between + 3 Volts and-3 Volts (Fig. 3a)and because the mobilities of positive and nega-tive ions are almost equal and by this far outside of the resolutionpower of the instrument the two species cannot be distinguishedfrom each other. At slightly greater heights where electrons andnegative ions exist the positive ion current remains linear butthat for the negative carriers becomes bent in the sense that thecurrent increases with increasing draw potential (Fig. 3b). Obvi-ously the negative ions are collected first and then the electrons,but a quantitative interpretation of those "scimitars" remainsdifficult. Then, often over a surprisingly small height interval oforder 100-200 m the negative ions disappear ?,nd the electrons
UNDISTURBEDPLASMA
f (Xn)
Figure 2. Probe design. Left: Mechanical dimensions (in millimeter) rightlcollection volume of the probe. The guard sectiontogether with the "end of field lines" defines the collection volume of the probe which is a conical cylinder with atransmissive outer electrode and has a semispherical cap. Air flow is parallel to the probe's surfaces.
z < 6 0 k m
DRAW POTENTIAL
Figure 3. Change of current/voltage characteristicsof the probe vs. height.Left: Schematic, right:actual record on 35 mmfilm. A channel whichalternatively records ona different sensitivitywas taken out in or-der to obtain a betterreading.
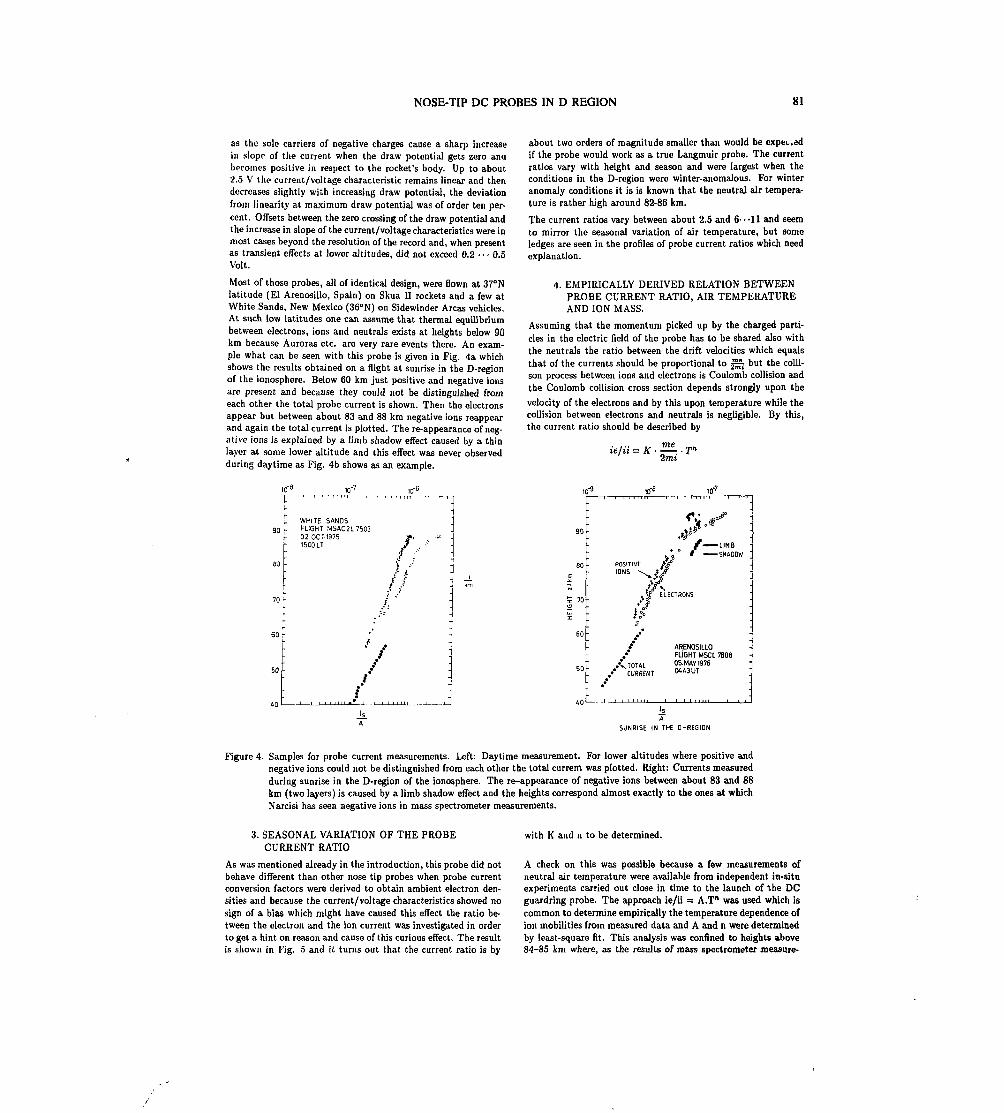
NOSE-TIP DC PROBES IN D REGION 81
as the sole carriers of negative charges cause a sharp increasein slope of the current when the draw potential gets zero andbecomes positive in respect to the rocket's body. Up to about2.5 V the current/voltage characteristic remains linear and thendecreases slightly with increasing draw potential, the deviationfrom linearity at maximum draw potential was of order ten per-cent. Offsets between the zero crossing of the draw potential andthe increase in slope of the current/voltage characteristics were inmost cases beyond the resolution of the record and, when presentas transient effects at lower altitudes, did not exceed 0.2 ••• 0.5Volt.
Most of those probes, all of identical design, were flown at 370Nlatitude (El Arenosillo, Spain) on Skua II rockets and a few atWhite Sands, New Mexico (360N) on Sidewinder Areas vehicles.At such low latitudes one can assume that thermal equilibriumbetween electrons, ions and neutrals exists at heights below 90km because Auroras etc. are very rare events there. An exam-ple what can be seen with this probe is given in Fig. 4a whichshows the results obtained on a flight at sunrise in the D-regionof the ionosphere. Below 60 km just positive and negative ionsare present and because they could not be distinguished fromeach other the total probe current is shown. Then the electronsappear but between about 83 and 88 km negative ions reappearand again the total current is plotted. The re-appearance of neg-ative ions is explained by a limb shadow effect caused by a thinlayer at some lower altitude and this effect was never observedduring daytime as Fig. 4b shows as an example.
about two orders of magnitude smaller than would beif the probe would work as a true Langmuir probe. The currentratios vary with height and season and were largest when theconditions in the D-region were winter-anomalous. For winteranomaly conditions it is is known that the neutral air tempera-ture is rather high around 82-86 km.
The current ratios vary between about 2.5 and 6"-11 and seemto mirror the seasonal variation of air temperature, but someledges are seen in the profiles of probe current ratios which needexplanation.
4. EMPIRICALLY DERIVED RELATION BETWEENPROBE CURRENT RATIO, AIR TEMPERATUREAND ION MASS.
Assuming that the momentum picked up by the charged parti-cles in the electric field of the probe has to be shared also withthe neutrals the ratio between the drift velocities which equalsthat of the currents should be proportional to ^^ but the colli-son process between ions and electrons is Coulomb collision andthe Coulomb collision cross section depends strongly upon the
velocity of the electrons and by this upon temperature while thecollision between electrons and neutrals is negligible. By this,the current ratio should be described by
... „/zt = K . T"1**
ID'6
WHITE SANOSFLIGHT MSAC2L750302 OCT.19751500 LT
to-9
/—LIMBt 3 ° * ——SHADOW
f ARENOSILLOFLIGHT MSCL 760805.MAV1976ATOTAU O*M««
• CURRENT W43UT
JsA
SUNRISE IN THE D-REQION
Figure 4. Samples for probe current measurements. Left: Daytime measurement. For lower altitudes where positive andnegative ions could not be distinguished from each other the total current was plotted. Right: Currents measuredduring sunrise in the D-region of the ionosphere. The re-appearance of negative ions between about 83 and 88km (two layers) is caused by a limb shadow effect and the heights correspond almost exactly to the ones at whichNarcisi has seen negative ions in mass spectrometer measurements.
3. SEASONAL VARIATION OF THE PROBECURRENT RATIO
As was mentioned already in the introduction, this probe did notbehave different than other nose tip probes when probe currentconversion factors were derived to obtain ambient electron den-sities and because the current/voltage characteristics showed nosign of a bias which might have caused this effect the ratio be-tween the electron and the ion current was investigated in orderto get a hint on reason and cause of this curious effect. The resultis shown in Fig. 5 and it turns out that the current ratio is by
with K and n to be determined.
A check on this was possible because a few measurements ofneutral air temperature were available from independent in-situexperiments carried out close in time to the launch of the DCguardring probe. The approach ie/ii = A.T" was used which iscommon to determine empirically the temperature dependence ofion mobilities from measured data and A and n were determinedby least-square fit. This analysis was confined to heights above84-85 km where, as the results of mass spectrometer measure-
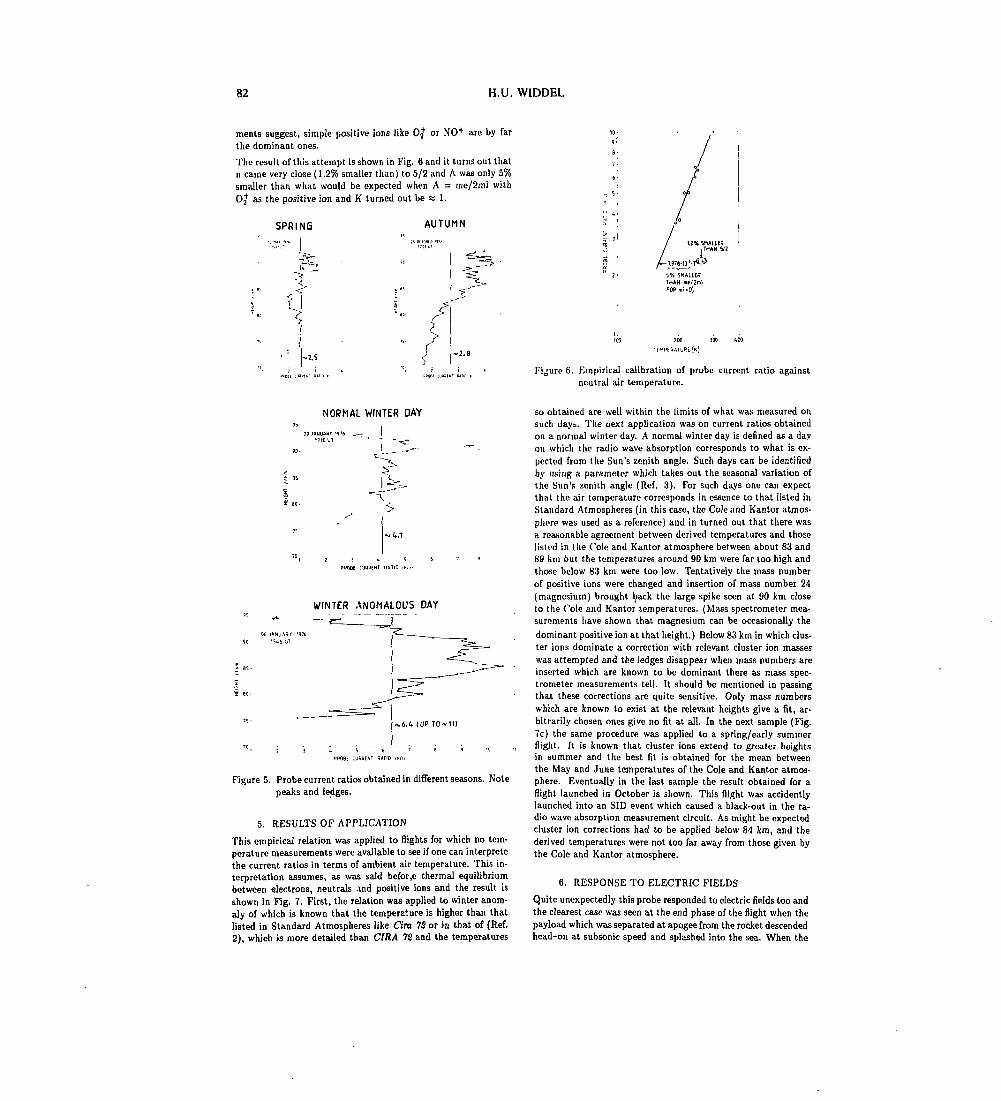
82 H.U. WIDDEL
ments suggest, simple positive ions like Oj or NO+ are by farthe dominant ones.
The result of this attempt is shown in Fig. 6 and it turns out thatn came very close (1.2% smaller than) to 5/2 and A was only 5%smaller than what would be expected when A = me/2mi withOj" as the positive ion and K turned out be « 1.
SPRING AUTUMN
Figure 6. Empirical calibration of probe current ratio againstneutral air temperature.
NORMAL WINTER DAY
PODBE CURO[NT RATIO ' * > >
WINTER ANOMALOUS DAY
06 JANUABr 1976
I•* so
PROSE CURRCM RATIO
Figure 5. Probe current ratios obtained in different seasons. Notepeaks and ledges.
5. RESULTS OF APPLICATION
This empirical relation was applied to flights for which no tem-perature measurements were available to see if one can interprètethe current ratios in terms of ambient air temperature. This in-terpretation assumes, as was said befor,e thermal equilibriumbetween electrons, neutrals and positive ions and the result isshown in Fig. 7. First, the relation was applied to winter anom-aly of which is known that the temperature is higher than thatlisted in Standard Atmospheres like Cira 72 or in that of (Réf.2), which is more detailed than CIRA 7S and the temperatures
so obtained are well within the limits of what was measured onsuch days. The next application was on current ratios obtainedon a normal winter day. A normal winter day is defined as a dayon which the radio wave absorption corresponds to what is ex-pected from the Sun's zenith angle. Such days can be identifiedby using a parameter which takes out the seasonal variation ofthe Sun's zenith angle (Réf. 3). For such days one can expectthat the air temperature corresponds in essence to that listed inStandard Atmospheres (in this case, the Cole and Kantor atmos-phere was used as a reference) and in turned out that there wasa reasonable agreement between derived temperatures and thoselisted in the Cole and Kantor atmosphere between about 83 and89 km but the temperatures around 90 km were far too high andthose below 83 km were too low. Tentatively the mass numberof positive ions were changed and insertion of mass number 24(magnesium) brought back the large spike seen at 90 km closeto the C'ole and Kantor temperatures. (Mass spectrometer mea-surements have shown that magnesium can be occasionally the
dominant positive ion at that height.) Below 83 km in which clus-ter ions dominate a correction with relevant cluster ion masseswas attempted and the ledges disappear when mass numbers areinserted which are known to be dominant there as mass spec-trometer measurements tell. It should be mentioned in passingthat these corrections are quite sensitive. Only mass numberswhich are known to exist at the relevant heights give a fit, ar-bitrarily chosen ones give no fit at all. In the next sample (Fig.7c) the same procedure was applied to a spring/early summerflight. It is known that cluster ions extend to greater heightsin summer and the best Mt is obtained for the mean betweenthe May and June temperatures of the Cole and Kantor atmos-phere. Eventually in the last sample the result obtained for aflight launched in October is shown. This flight was accidentlylaunched into an SID event which caused a black-out in the ra-dio wave absorption measurement circuit. As might be expectedcluster ion corrections had to be applied below 84 km, and thederived temperatures were not too far away from those given bythe Cole and Kantor atmosphere.
6. RESPONSE TO ELECTRIC FIELDS
Quite unexpectedly this probe responded to electric fields too andthe clearest case was seen at the end phase of the flight when thepayload which was separated at apogee from the rocket descendedhead-on at subsonic speed and splashed into the sea. When the

NOSE-TIP DC PROBES IN D REGION 83 84
ISO 200 2*0 300 150 200
TEMPEHATuRE !«]
S O C T O B E R 19721208 UT
Figure 7. Conversion of current ratios into neutral air temper-atures.m Below 85 km, cluster ion mass correctionshave to applied in order to get the derived tempera-tures into the vicinity of the model temperatures. Nosuch corrections were applied to winter anomaly days.
END PHASE OF FLIGHT
ZERO LINE OF CURRENT
Z ~ 5 k m
Figure 8. End phase of flight. Left: response of the probe toelectric fair weather field over the sea: The probe re-sponds to the field with a constant current for one po-larity which increases with decreasing height and witha sharp "spike" when the polarity of the draw poten-tial is reversed. Right: Explanation. A) Draw poten-tial vs. time. B) current response to be expected whenthe displacement compensation gets out of balance. C)Observation. D) Explanation: When the probe col-bets a charge, (this charge is symbolized by a batterywith a high internal resistance) the effective capacityof the probe appears to be reduced and consequentlyonly a smaller displacement current can flow whilethe compensation capacitor delivers the compensationcurrent to which it was set, and the current meter am-plifiers the difference. When the polarity is reversedthe "battery" is immediately shortened and the shortcircuit current is seen as a sharp and transient "spike"ID: Displacement current, i/t-: Compensation current.
ENTRY INTORADIO SHADOW
OR SPLASHINTO SEA
2-3 DECADESOF PROBE CURRENT
IVARIABLEI
84 H.U. WIDDEL
payload had reached a certain height above the sea (estimatesvary between 1 and 3 km, there was no radar tracking) a con-stant positive current was seen which increased with decreasingheight as is shown schematically in Fig. 8 and on reversed po-larity a sharp spike appeared before the current settled to zero.This response was caused by a pecularity in the design of thecurrent meter. At a sweep repetition rate of 20 Hz as was usedon this probe one has to care about displacement currents whichwere of order of some 10"9A which was the most sensitive rangethe current amplifier (a FET op. amplifier) was set to and it wasdecided to use a compensation circuit which delivered a currentof opposite sign to cancel the displacement current. (Simplifieddiagram Fig. 8, bottom right). This works well when the ca-pacitor formed by the nose tip and the payload body carries nocharges. If there is a charge on the nose tip, which is equivalent toa battery with a large resistor in series across the probe capacity,the effective probe capacity appears to be reduced and less dis-placement current is drawn. The compensation circuit however,separated from the outside world, still delivers the compensatingcurent to which it was set to and the current amplifier amplifiesthe difference. When the polarity reverses, the battery is justshort -circuit and the short-circuited current is seen as a sharp,transient spike. Observations of this kind were not confined tothe downleg but were made on the upleg too and, in retrospectinterpreted as vertical electric fields, fairly large field strengthswere seen occasionally in the upper stratosphere but were notrecognized as such.
7. SUMMARY
The results presented here show that one can distinguish with DCprobes between positive ions, negative ions and electrons and thatsuch probes work as mobility probes. The variation of the ratiobetween electron and ion current with height and season was ex-plained empirically as a combined ion composition/temperatureeffect based upon the mobility concept which has not yet treatedtheoretically.
8. ACKNOWLEDGEMENTS
This work was supported by Grant WRK 90 of Bundesministerfur Forschung and Technologie, Bonn, and ERO Grant DAERO75-G076. Air temperature data were kindly supplied byProfessor Dr. D. Offermann, University of Wuppertal and R.O.Olsen, White Sands, New Mexico which is gratefully acknowl-edged.
9. REFERENCES
1. Widdel H U, Rose G, & Borchers R, 1971, Results of con-centration and mobility measurements of positively andnegatively charged particles taken by a rocket-borne para-chuted aspiration (Gerdien) probe in the height region from72 to 29 km, Pageoph 84, 154-160.
2. Cole A E & Kantor A J, US Air Force Reference Atmo-spheres, Air Force Geophysics Laboratory, Hanscom AFB,Mass. 01131, AFGL-TR-78-0051.
3. Rose G & Widdel H U, 1977, D-region radio wave propaga-tion experiments, their significance and results during theWestern European Winter Anomaly Campaign 1975/76,J. Geophys., 44, 15-26.

85
RESONANCE CONE DIAGNOSTICS IN THE MID-LATITUDE IONOSPHERE
A. Piel
Institut fur Experimentalphysik, Universitât Kiel, Kiel, Germany
H. Thiemann
Physikalisch-Technische Studien GmbH, Freiburg, Germany
K.I. Oyaroa
ISAS, 3-1-1 Yoshinodai, Sagamihara, Kanagawa 229, Japan
ABSTRACT
Within the German-Japanese cooperation COREX anovel resonance cone (r.c.) instrument was de-veloped, which measures electron density Ne,temperature Te, and non-thermal plasma properties.COREX was launched on Jan-25, 1989, ll:00h JSTaboard the K-9M-81 rocket from Kagoshima SpaceCenter, Japan. Results for Ne and Te profiles arereported for the mid-latitude ionosphere. Non-reciprocity effects that may be related to non-Maxwellian distribution functions are discussed.Non-thermal plasma properties could not be detectedin agreement with the absence of the typicaltemperature anomaly around 90-120 km.
Keywords: plasma diagnostics, temperature anomaly,resonance cone.
formed by the antenna and whose axis is alignedwith the magnetic field. The cone half-angle •S.axis sensitive to the plasma frequency and cantherefore be used as a measure for the electrondensity. In a warm plasma the resonance cone showsan internal structure (Fig. 1) due to theinterference of wavelets from the cold-plasma andwarm-plasma part of the dispersion surface. Theposition flmi of the interference peak can be usedfor determining electron temperature.
The radiation field of a point-like antenna has beencalculated within the kinetic theory of a hot plasmausing the electrostatic approximation (Réf. 5). Fromthese calculations a set of universal evaluationcharts for determining electron density andtemperature from two measured angles <9«x andflint have been derived. The normalized quantities R= r/'ri and QP = upe/uce are used, with r being thedistance of antenna and field point, n. =(kBTe/me)"2/uce the electron thermal gyro-radius,UP» the electron plasma frequency, and u» theelectron gyro-frequency.
1. INTRODUCTION
The electron temperature in the mid-latitudeionosphere shows a winter-time anomaly at altitudesof 100-120km (Réf. 1). T. values exceeding theexpected neutral gas temperature by factors of 2 -3 have been reported. Since the anomaly iscorrelated with the location of the focus of the Sq-current system it was hypothesized that currentdriven instabilities might be involved in theelectron heating mechanism. Measurements of theelectron distribution function (Réf. 2), which showedhigh energy tails in addition to the temperatureincrease, support this hypothesis. Probemeasurements, however, could not distinguishisotropic (Bi-Maxwellian) distributions fromanisotropic (beam-plasma) distributions. Such adecision can be made by the resonance conetechnique (Refs. 3-7).
1.1 The resonance cone technique
The radiation field of a small antenna in amagnetized plasma, which is operated at a frequencybelow electron gyro- and plasma frequency, isresonantly enhanced for certain angles of wavepropagation. This lower oblique resonance Is locatedon the surface of a double cone, whose apex is
Amplitude/dB
40°
Figure 1 Laboratory measurement of a resonancecone in a thermal plasma
1.2 Non-thermal effects
In a plasma with a field-aligned motion of theentire electron population the electrons experience adoppler-shifted wave frequency. Therefore the two
PTOC. Ninth ESAIPAC Symposium on 'European Rocket and Balloon Programmes and Related Research', Lahnstein, FRG, 3—7April 1989(ESA SP-291, June 1989)
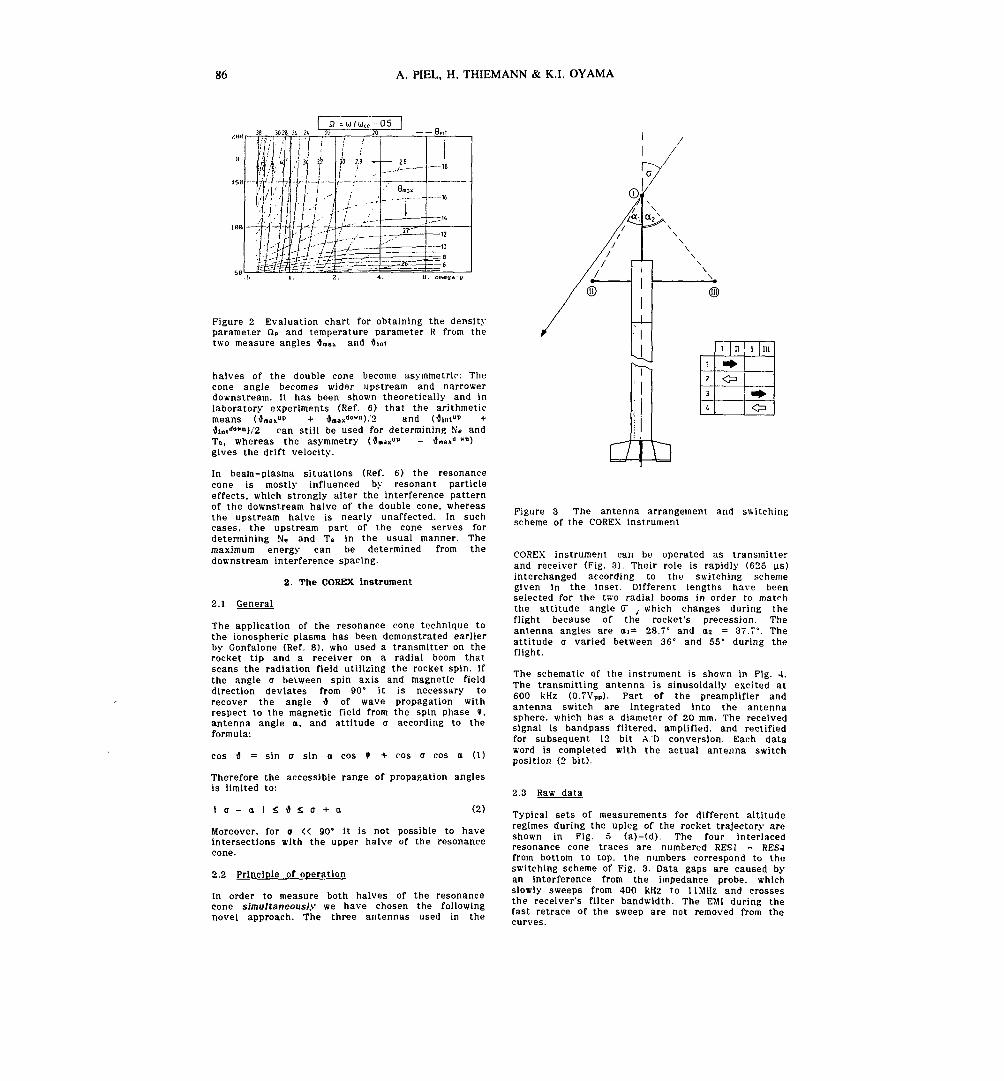
86 A. PIEL, H. THIEMANN & K.I. OYAMA
Figure 2 Evaluation chart for obtaining the densityparameter QP and temperature parameter R from thetwo measure angles Umax and -Jim
halves of the double cone become asymmetric: Thecone angle becomes wider upstream and narrowerdownstream. It has been shown theoretically and inlaboratory experiments (Réf. 6) that the arithmeticmeans Umax"" + flnax*01"1).^ and (•Smt'"' +flln,do«n}/2 can still be used for determining Ne andTe, whereas the asymmetry (^«a\u p - Umax11 "")gives the drift velocity.
In beam-plasma situations (Réf. 6) the resonancecone is mostly influenced by resonant particleeffects, which strongly alter the interference patternof the downstream halve of the double cone, whereasthe upstream halve is nearly unaffected. In suchcases, the upstream part of the cone serves fordetermining Ne and Te in the usual manner. Themaximum energy can be determined from thedownstream interference spacing.
2. The COREX instrument
2.1 General
The application of the resonance cone technique tothe ionospheric plasma has been demonstrated earlierby Gonfalone (Réf. 8), who used a transmitter on therocket tip and a receiver on a radial boom thatscans the radiation field utilizing the rocket spin. Ifthe angle CT between spin axis and magnetic fielddirection deviates from 90° it is necessary torecover the angle fl of wave propagation withrespect to the magnetic field from the spin phase »,antenna angle o, and attitude CT according to theformula:
cos fl = sin CT sin o cos » + cos CT cos a (1)
Therefore the accessible range of propagation anglesis limited to:
Moreover, for CT « 90° it is not possible to haveintersections with the upper halve of the resonancecone.
2.2 Principle of operation
In order to measure both halves of the resonancecone simultaneously we have chosen the followingnovel approach. The three antennas used in the
Figure 3 The antenna arrangement and switchingscheme of the COREX instrument
COREX instrument can be operated as transmitterand receiver (Fig. 3). Their role is rapidly (625 us)interchanged according to the switching schemegiven in the inset. Different lengths have beenselected for the two radial booms in order to matchthe attitude angle (T ,. which changes during theflight because of the rocket's precession. Theantenna angles are 01= 28.7° and <n = 37.7°. Theattitude CT varied between 36° and 55° during theflight.
The schematic of the instrument is shown in Fig. 4.The transmitting antenna is sinusoidally excited at600 kHz (0.7VPp). Part of the preamplifier andantenna switch are integrated into the antennasphere, which has a diameter of 20 mm. The receivedsignal is bandpass filtered, amplified, and rectifiedfor subsequent 12 bit A/D conversion. Each dataword is completed with the actual antenna switchposition (2 bit).
2.3 Raw data
Typical sets of measurements for different altituderegimes during the upleg of the rocket trajectory areshown in Fig. 5 (a)-(d). The four interlacedresonance cone traces are numbered RESl - RES-)from bottom to top, the numbers correspond to theswitching scheme of Fig. 3. Data gaps are caused byan interference from the impedance probe, whichslowly sweeps from 400 kHz to 11 MHz and crossesthe receiver's f i l ter bandwidth. The EMI during thefast retrace of the sweep are not removed from thecurves.
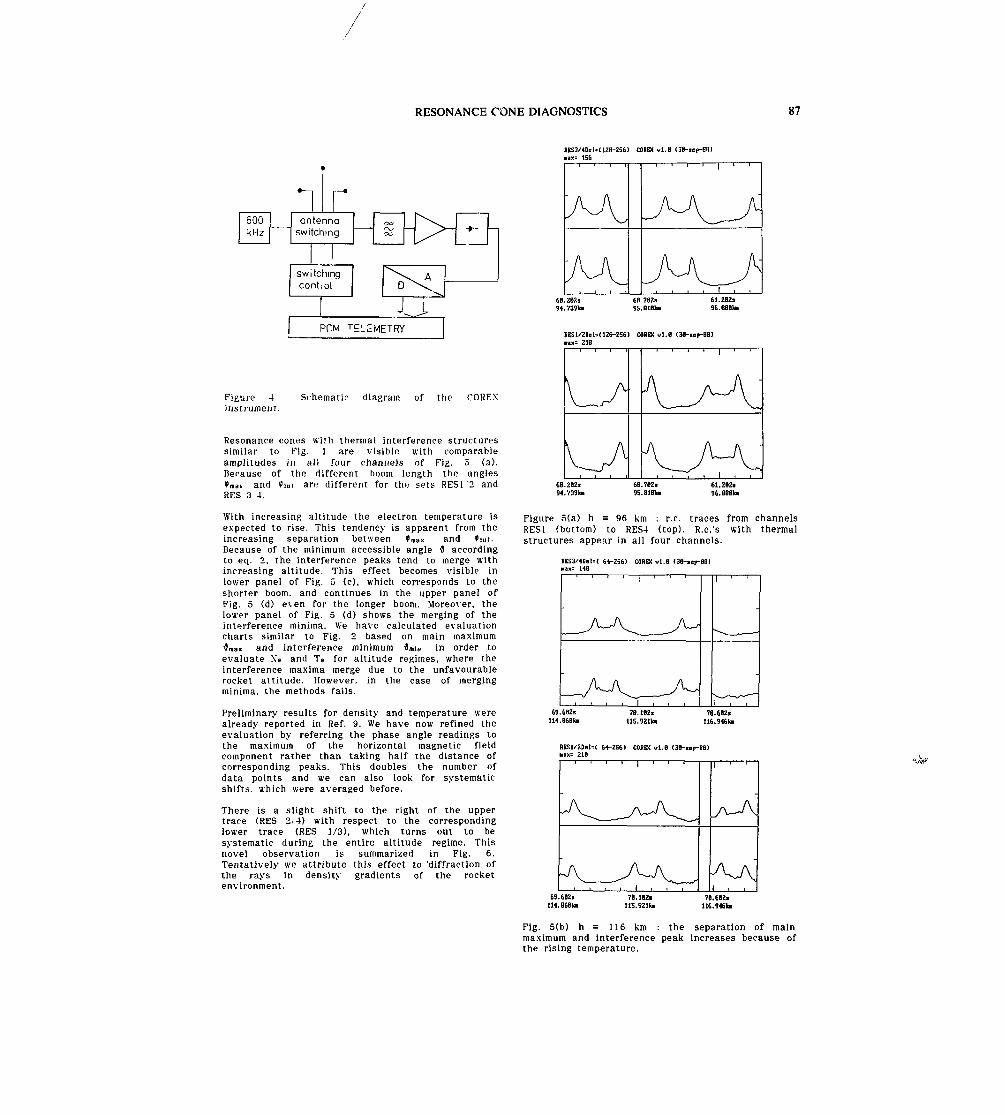
RESONANCE CONE DIAGNOSTICS 87
Figure 4instrument.
Su-hématie diagram of the COREX
Resonance cones wi th thermal interference structuressimilar to Fig. 1 are visible with comparableamplitudes in all four channels of Fig. 5 (a).Because of the different boom length the angles»mai, and Vim are different for the sets RESl 2 andRES 3 4.
RES3<MDi!l5< 128-256) C O B E X v I . B <«x= 156
66.ZBZa94.739k»
68 7BZa95.8161«
61.29ZJ96.88BlO
BESl/2Dol=(12B-Z56) CORK vl.8 (38-icp-BS)«•»= Z18
6B.ZB2J91.7391«
68.76Zj95.BlBIa
61.ZBZa96.BBBkIi
With increasing a l t i tude the electron temperature isexpected to rise. This tendency is apparent from theincreasing separation between V m a x and »im.Because of the minimum accessible angle $ accordingto eq. 2, the interference peaks tend to merge withincreasing a l t i tude . This effect becomes visible inlower panel of Fig. û (c), which corresponds to theshorter boom, and continues in the upper panel ofFig. 5 (d) even for the longer boom. Moreover, thelower panel of Fig. 5 (d) shows the merging of theinterference minima. We have calculated evaluationcharts similar to Fig. 2 based on main maximum•imax and interference minimum flmm in order toevaluate Xe and Te for altitude regimes, where theinterference maxima merge due to the unfavourablerocket attitude. However, in the case of mergingminima, the methods fails.
Preliminary results for density and temperature werealready reported in Réf. 9. We have now refined theevaluation by referring the phase angle readings tothe maximum of the horizontal magnetic fieldcomponent rather than taking half the distance ofcorresponding peaks. This doubles the number ofdata points and we can also look for systematicshifts, which were averaged before.
There is a slight shift to the right of the uppertrace (RES 2,4) with respect to the correspondinglower trace (RES 1/3), which turns out to besystematic during the entire altitude regime. Thisnovel observation is summarized in Fig. 6.Tentatively we attribute this effect to 'diffraction ofthe rays in density gradients of the rocketenvironment.
Figure ô(a) h = 96 km : r.c. traces from channelsRESl (bottom) to RES4 (top). R.c.'s with thermalstructures appear in all four channels.
BES3/<Do[=< 64-256) COREX vl.B OB-iap-SB)•ax= 146
69.6BZsIH. BtBk.
76.182s115.921k»
78.6BZs116.9461«
BESl/2Dn!=< 64-256) CODEX vl.B OB-iop-l«>x= ZlB
T 1 1 1 1 1 T
yx-A
69.6BZaIH. 8681.
7B.1B21US. 921k.
71.6BZt116.946k.
Fig. 5(b) h = 116 km : the separation of mainmaximum and interference peak increases because ofthe rising temperature.

88 A. PIEL, H. THIEMANN & K.I. OYAMA
«ES3.MDol=< 32-256) C08KX ul.8 <38-iep-OD>•ix= ZZB
73.692llZ3.585ta
71.3821IZI.5381«
71.8BZJ125.5551«
MSI/2lel=( 32-256) COREX vl.B (38-.Bp-BB)•in; 161
73.882s123.585k.
74.39Za124.538k.
74.6821125.555k.
Fig. 5<c) h = 124 km : due to unfavourable rocketattitude the interference peaks begin to merge inRES 1/2.
RES3/«ol=< 32-256) COBEX vl .B (38-iop-afl)«•X= 212
79.682»135.39<k.
88.6925137.3B7ta
BESl/2DcI=( 32-256) COUEX vl.B (3B-IOp-BB)•ax= 186
79.6121135.391k.
St. IKl136.4891«
SB.6»2l137.387k.
Fig. 5(d) h = 136 km : with further increas ingtemperature the maxima merge in RL'S 3 4 whereaseven the minima merge in RES 1.'2.
UJQ
E
oinOO
oom
oin
— i : r — r
~ Jy
!1x SKX
x SX *
X *
*~ + ^ *x * M
~~ x *x X
X x *
X * *
x * x *
X
X
^
I *x **m
1 I I I
— I — I — I I 1
I rX +* I * *
4-
Ï. t* +
i•t- X
+ X
i*+++ X —
+ X
S+ * _
I I I I t
10
O
oO
4. x i i i i i i iJK
8 +
•*• X
«
j - 1 i i i i2 4 6 8 10
SHIFT (channels)
Figure 6 Apparent "right-shift" of the curve in theupper panel (RES 2 '4 ) wi th respect to the lowerpanel (RES 1 ;3) for the entire al t i tude regime h =90-350 km.
3. RESULTS AND DISCUSSION
3.1 Electron derisit.s
The altitude profile of electron density is shown inFig. 7 in comparison with the results of theimpedance probe (Réf. 10). Only the larger of thetwo angle readings in each r.c. was used, i.e.. thpleft peak in the lower and the right peak in theupper panel , because the shift mentioned above hasa strongly asymmetric influence on the densityevaluation due to the approach of a resonancecondit ion. This effect becomes apparent from the•9mas curves in Fig. 3. which : isj .mpti>tirallyapproach a horizontal . Hence, for large QP a s l ight lylarger angle reading leads to a tolerable decrease ofQP . but a smaller angle reading lets Op tond toinf ini ty .
At the lowest alt i tude, close agreement w i t h theimpedance probe data is found. The r.c. data show asimilar , but s l i gh t ly larger density increase, andfinally a saturat ion close to the impedance probevalues. The expected aocurncy of HIP r.c. techniqueis typical ly ±20°o at Ne = H)10Cm-3 arid decreasesto roughly a factor of two uncer ta inty at 1O11Cm"'.
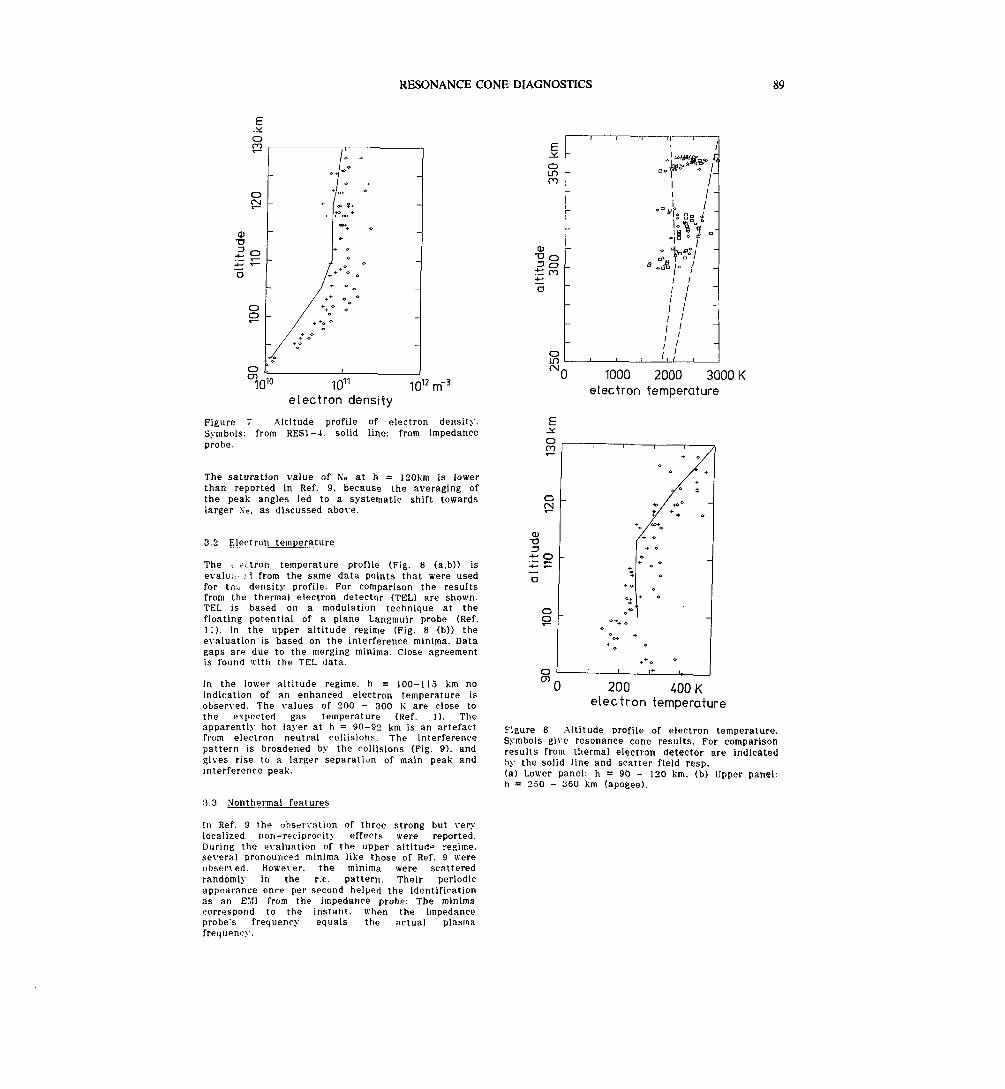
RESONANCE CONE DIAGNOSTICS 89
1010 1011
electron densitym- 3
Figure 7 Alt i tude profile of electron density.Symbols: from RESl-4. solid line: from impedanceprobe.
The saturation value of N"e at h = 120km is lowerthan reported in Réf. 9, because the averaging ofthe peak angles led to a systematic shift towardslarger \e, as discussed above.
3.2 Electron temperature
The - ectron temperature profile (Fig. 8 (a ,b)) isevalu:!'."1 from the same data points that were usedfor tr,^ density profile. For comparison the resultsfrom the thermal electron detector (TEL) are shown.TEL is based on a modulat ion technique at thefloating potential of a plane Langmuir probe (Réf.11). In the upper al t i tude regime (Fig. 8 (b)) theevaluation is based on the interference minima. Datagaps are due to the merging min ima. Close agreementis found wi th the TEL data.
In the lower a l t i tude regime, h = 100-115 km noindication of an enhanced electron temperature isobserved. The values of 200 - 300 K are close tothe expected gas temperature (Réf. 1). Theapparently hot layer at h = 90-92 km is an artefactfrom electron neutral coliisions. The interferencepattern is broadened by the collisions (Fig. 9). andgives rise to a larger separation of main peak andinterference peak.
3.3 Nonthermal features
Oinm
Q)
? §
O
(N
I /
O 1000 2000 300OKelectron temperature
o(N
O)"O
±: °-4— o
OO
Oa>
-i —r 1 r
200 400 Kelectron temperature
Figure 8 Al t i tude profile of electron temperature.Symbols give resonance cone results. For comparisonresul t s from thermal electron detector are indicatedby the solid line and scatter field resp.(a) Lower panel; h = 90 - 120 km, (b) Upper panel:h = 250 - 360 km (apogee).
In Réf. 9 the observation of three strong but verylocalized non-reciprocity effects were reported.Dur ing the evaluat ion of the upper a l t i t u d » regime,several pronounced minima l ike those of Réf. 9 wereobserved. However, the minima were scatteredrandomly in the r.c. pattern. Their periodicappearance once per second helped the Identif icat ionas an EMI from the impedance probe: The minimacorrespond to the ins tan t , when the impedanceprobe's frequency equals the actual plasmafrequency.
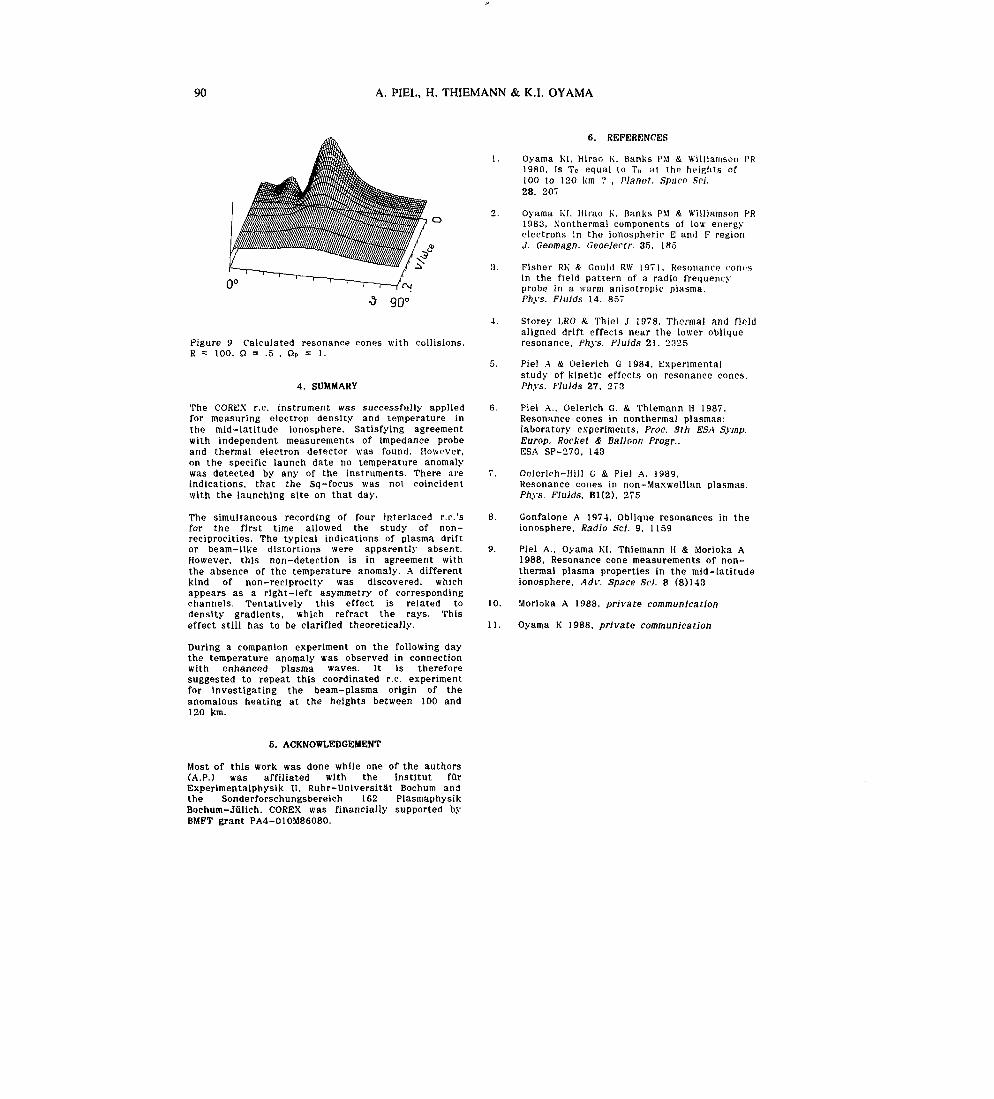
90 A. PIEL, H. THIEMANN & K.I. OYAMA
Figure 9 Calculated resonance cones with collisions.R = 1 0 0 . Q = .5 , Qp = 1.
4. SUMMARY
The COREX r.e. instrument was successfully applied 6.for measuring electron density and temperature inthe mid-latitude ionosphere. Satisfying agreementwith independent measurements of impedance probeand thermal electron detector was found. However,on the specific launch date no temperature anomalywas detected by any of the instruments. There are 7.indications, that the Sq-focus was not coincidentwith the launching site on that day.
The simultaneous recording of four interlaced r.c.'s 8.for the first time allowed the study of non-reciprocities. The typical indications of plasma driftor beam-like distortions were apparently absent. 9.However, this non-detection is in agreement withthe absence of the temperature anomaly. A differentkind of non-reciprocity was discovered, whichappears as a right-left asymmetry of correspondingchannels. Tentatively this effect is related to 10.density gradients, which refract the rays. Thiseffect still has to be clarified theoretically. 11.
During a companion experiment on the following daythe temperature anomaly was observed in connectionwith enhanced plasma waves. It is thereforesuggested to repeat this coordinated r.c. experimentfor investigating the beam-plasma origin of theanomalous heating at the heights between 100 and120 km.
6. REFERENCES
Oyama KI, Hirao K, Banks PM & Wi l l i amson PR1980, Is Te equal to Tn at the he igh t s of100 to 120 km ? , Planet. Space ScL28, 207
Oyama KI, Hirao K. Banks PM & Will iamson PR1983, Nonthermal components of low energyelectrons in the ionospheric E and F regionJ. Geomagn. Geoelectr. 35, 185
Fisher RK & Gould RW 1971, Resonance conusin the field pattern of a radio frequencyprobe in a warm anisotropic plasma.Phys. Fluids 14. 857
Storey LRO & Thiel J 1978, Thermal and fieldaligned drift effects near the lower obliqueresonance, Phys. Fluids 21. 2325
Pie! A & Oelerich G 1984, Experimentalstudy of kinetic effects on resonance cones.Phys. Fluids 27, 273
Piel A., Oelerich G. & Thiemann H 1987.Resonance cones in nonthermal plasmas:laboratory experiments, Proc. 8th ESA Symp.Europ. Rocket S Balloon Progr..ESA SP-270, 143
Oelerich-Hill G & Pie! A. 1989,Resonance cones in non-Maxwel l ian plasmas.Phys. Fluids. Bl(2), 275
Gonfalone A 1974, Oblique resonances in theionosphere, Radio Sd. 9, 1159
Pie! A., Oyama KI, Thiemann H & Morioka A1988, Resonance cone measurements of non-thermal plasma properties in the mid-latitudeionosphere. Adv. Space Sd. 8 (8)143
Morioka A 1988, private communication
Oyama K 1988, private communication
5. ACKNOWLEDGEMENT
Most of this work was done while one of the authors(A.P.) was affiliated with the Institut furExperimentalphysik II, Ruhr-Universitât Bochum andthe Sonderforschungsbereieh 162 PlasmaphysikBochum-Julich. COREX was financially supported byBMFT grant PA4-010M86080.

SESSION 5VIKING-RELATED RESULTS
Chairman:L. Eliasson
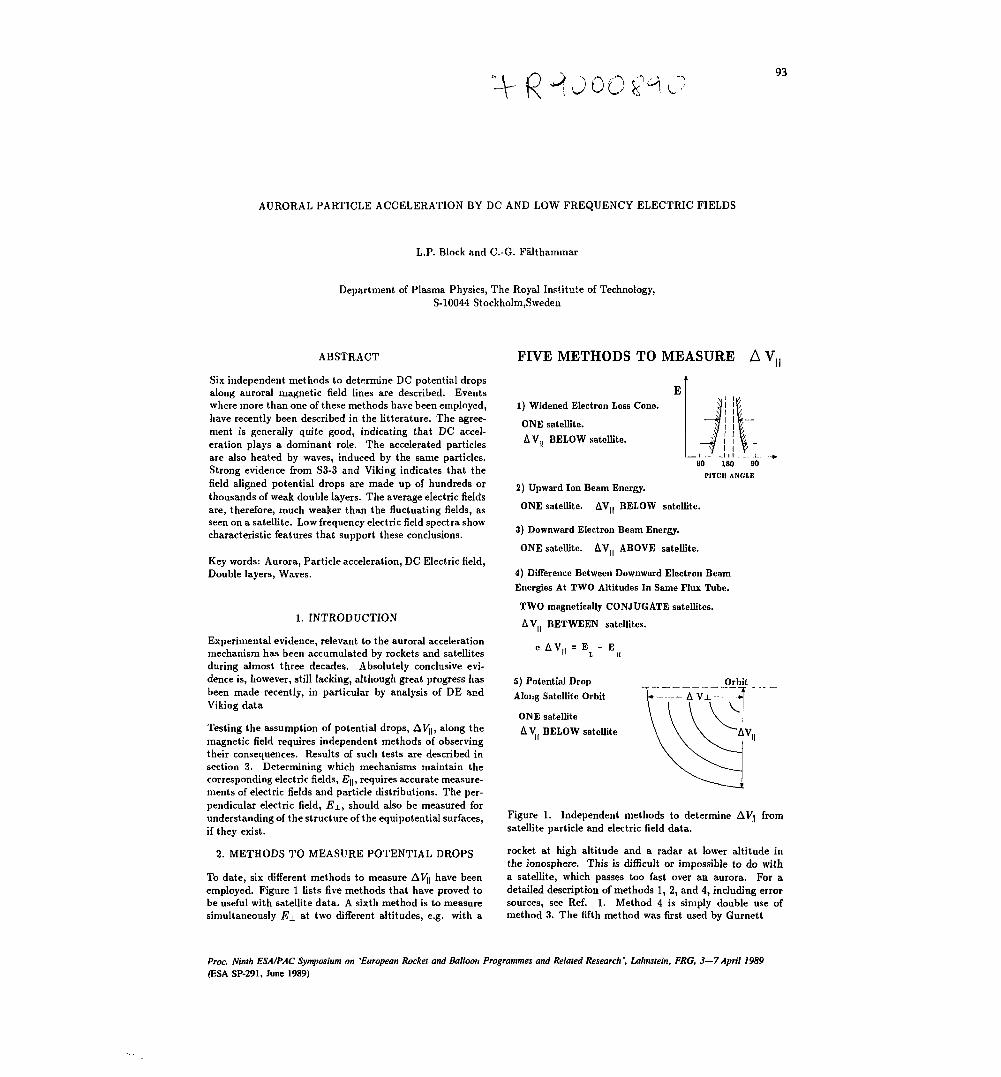
93
AURORAL PARTICLE ACCELERATION BY DC AND LOW FREQUENCY ELECTRIC FIELDS
L.P. Block and C.-G. Fàlthammar
Department of Plasma Physics, The Royal Institute of Technology,S-10044 Stockholm.Sweden
ABSTRACT
Six independent methods to determine DC potential dropsalong auroral magnetic field lines are described. Eventswhere more than one of these methods have been employed,have recently been described in the littérature. The agree-ment is generally quite good, indicating that DC accel-eration plays a dominant role. The accelerated particlesare also heated by waves, induced by the same particles.Strong evidence from S3-3 and Viking indicates that thefield aligned potential drops are made up of hundreds orthousands of weak double layers. The average electric fieldsare, therefore, much weaker than the fluctuating fields, asseen on a satellite. Low frequency electric field spectra showcharacteristic features that support these conclusions.
Key words: Aurora, Particle acceleration, DC Electric field,Double layers, Waves.
1. INTRODUCTION
Experimental evidence, relevant to the auroral accelerationmechanism has been accumulated by rockets and satellitesduring almost three decades. Absolutely conclusive evi-dence is, however, still lacking, although great progress hasbeen made recently, in particular by analysis of DE andViking data
Testing the assumption of potential drops, AV||, along themagnetic field requires independent methods of observingtheir consequences. Results of such tests are described insection 3. Determining which mechanisms maintain thecorresponding electric fields, E^, requires accurate measure-ments of electric fields and particle distributions. The per-pendicular electric field, E±, should also be measured forunderstanding of the structure of the equipotential surfaces,if they exist.
2. METHODS TO MEASURE POTENTIAL DROPS
To date, six different methods to measure AV|| have beenemployed. Figure 1 lists five methods that have proved tobe useful with satellite data. A sixth method is to measuresimultaneously E± at two different altitudes, e.g. with a
FIVE METHODS TO MEASURE A VIl
E1) Widened Electron Loss Cone.
ONE satellite.
AV1, BELOW satellite.
OO 180
PITCH ANCiLF.
2) Upward Ion Beam Energy.
ONE satellite. AV,, BELOW satellite.
3) Downward Electron Beam Energy.
ONE satellite. AV( | ABOVE satellite.
4) Difference Between Downward Electron BeamEnergies At TWO Altitudes In Same Flux Tube.
TWO magnetically CONJUGATE satellites.
AV BETWEEN satellites.
c A V n = E - E11 i ii
5) Potential DropAlong Satellite Orbit
ONE satelliteA V, BELOW satellite
Figure 1. Independent methods to determine AVj| fromsatellite particle and electric field data.
rocket at high altitude and a radar at lower altitude inthe ionosphere. This is difficult or impossible to do witha satellite, which passes too fast over an aurora. For adetailed description of methods 1, 2, and 4, including errorsources, see Réf. 1. Method 4 is simply double use ofmethod 3. The fifth method was first used by Gurnett
Proc. Ninth ESAIPAC Symposium on 'European Rocket and Balloon Programmes and Related Research', Lahnstein, FRG, 3—7April 1989(ESA. SP-291, June 1989)
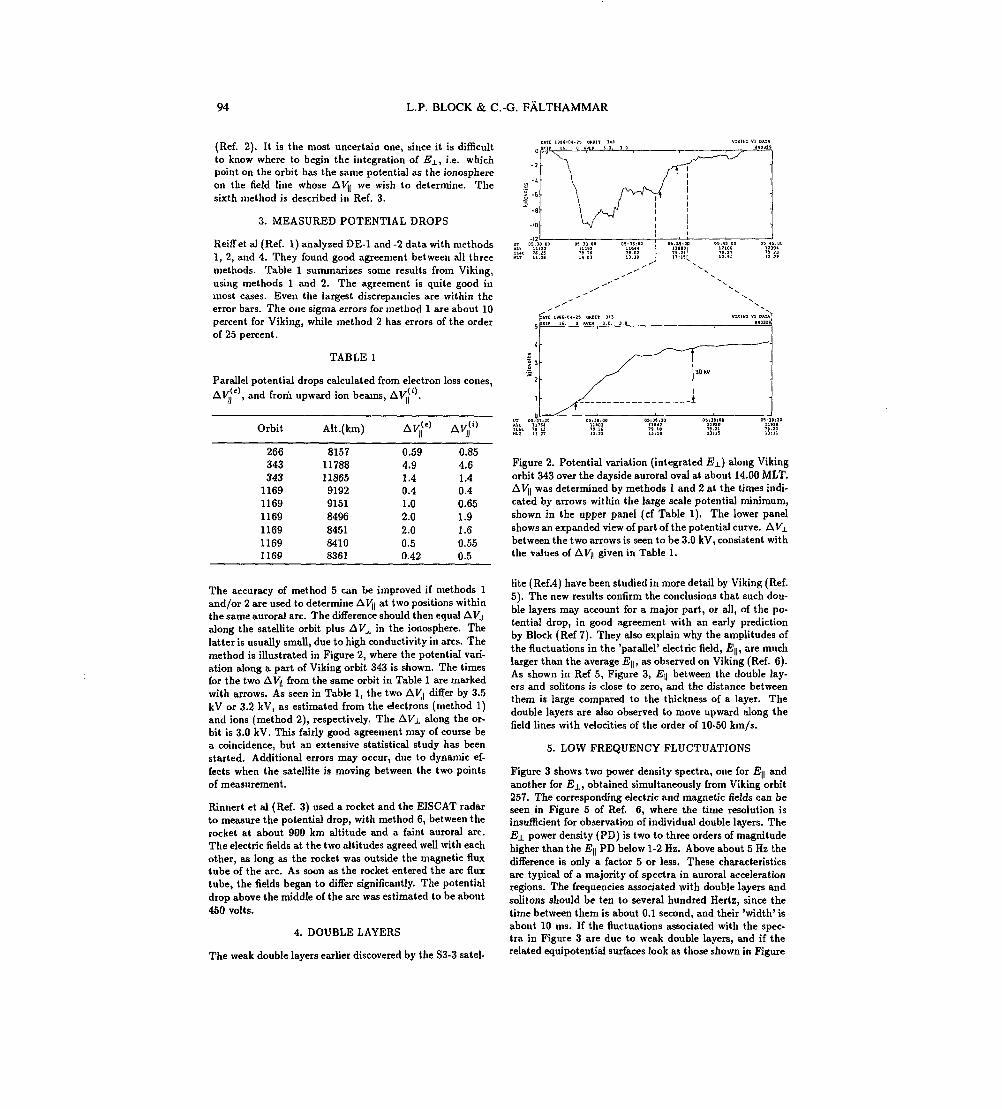
94 L.P. BLOCK & C.-G. FALTHAMMAR
(Réf. 2). It is the most uncertain one, since it is difficultto know where to begin the integration of Ej_, i.e. whichpoint on the orbit has the same potential as the ionosphereon the field line whose AVj| we wish to determine. Thesixth method is described in Réf. 3.
3. MEASURED POTENTIAL DROPS
Reiff et al (Réf. 1) analyzed DE-I and -2 data with methods1, 2, and 4. They found good agreement between all threemethods. Table 1 summarizes some results from Viking,using methods 1 and 2. The agreement is quite good inmost cases. Even the largest discrepancies are within theerror bars. The one sigma errors for method 1 are about 10percent for Viking, while method 2 has errors of the orderof 25 percent.
TABLE 1
Parallel potential drops calculated from electron loss cones,, and from upward ion beams, AV .
Orbit Alt.(km)
266343343116911691169116911691169
81571178811865919291518496845184108361
0.594.91.40.41.02.02.00.50.42
0.854.61.40.40.651.91.60.550.5
The accuracy of method 5 can be improved if methods 1and/or 2 are used to determine A Vj| at two positions withinthe same auroral arc. The difference should then equal AVj.along the satellite orbit plus AVj. in the ionosphere. Thelatter is usually small, due to high conductivity in arcs. Themethod is illustrated in Figure 2, where the potential vari-ation along a part of Viking orbit 343 is shown. The timesfor the two AVj] from the same orbit in Table 1 are markedwith arrows. As seen in Table 1, the two AVj| differ by 3.5kV or 3.2 kV, as estimated from the electrons (method 1)and ions (method 2), respectively. The AVj. along the or-bit is 3.0 kV. This fairly good agreement may of course bea coincidence, but an extensive statistical study has beenstarted. Additional errors may occur, due to dynamic ef-fects when the satellite is moving between the two pointsof measurement.
Rinnert et al (Ref. 3) used a rocket and the EISCAT radarto measure the potential drop, with method 6, between therocket at about 900 km altitude and a faint auroral arc.The electric fields at the two altitudes agreed well with eachother, as long as the rocket was outside the magnetic fluxtube of the arc. As soon as the rocket entered the arc fluxtube, the fields began to differ significantly. The potentialdrop above the middle of the arc was estimated to be about450 volts.
4. DOUBLE LAYERS
The weak double layers earlier discovered by the S3-3 satel-
IUt 19 13 '» It '9-1B 79.21 'B. 23HIT 1] JT 13:23 11:19 13-15 13:11
Figure 2. Potential variation (integrated 15j_) along Vikingorbit 343 over the dayside auroral oval at about 14.00 MLT.AVJi was determined by methods 1 and 2 at the times indi-cated by arrows within the large scale potential minimum,shown in the upper panel (cf Table 1). The lower panelshows an expanded view of part of the potential curve. AVxbetween the two arrows is seen to be 3.0 kV, consistent withthe values of AV|| given in Table 1.
lite (Ref.4) have been studied in more detail by Viking (Ref.5). The new results confirm the conclusions that such dou-ble layers may account for a major part, or all, of the po-tential drop, in good agreement with an early predictionby Block (Ref 7). They also explain why the amplitudes ofthe fluctuations in the 'parallel' electric field, E^, are muchlarger than the average E\\, as observed on Viking (Ref. 6).As shown in Ref 5, Figure 3, E\\ between the double lay-ers and solitons is close to zero, and the distance betweenthem is large compared to the thickness of a layer. Thedouble layers are also observed to move upward along thefield lines with velocities of the order of 10-50 km/s.
5. LOW FREQUENCY FLUCTUATIONS
Figure 3 shows two power density spectra, one for E\\ andanother for EX > obtained simultaneously from Viking orbit257. The corresponding electric and magnetic fields can beseen in Figure 5 of Ref. 6, where the time resolution isinsufficient for observation of individual double layers. TheEX power density (PD) is two to three orders of magnitudehigher than the EU PD below 1-2 Hz. Above about 5 Hz thedifference is only a factor 5 or less. These characteristicsare typical of a majority of spectra in auroral accelerationregions. The frequencies associated with double layers andsolitons should be ten to several hundred Hertz, since thetime between them is about 0.1 second, and their 'width' isabout 10 ms. If the fluctuations associated with the spec-tra in Figure 3 are due to weak double layers, and if therelated equipotential surfaces look as those shown in Figure
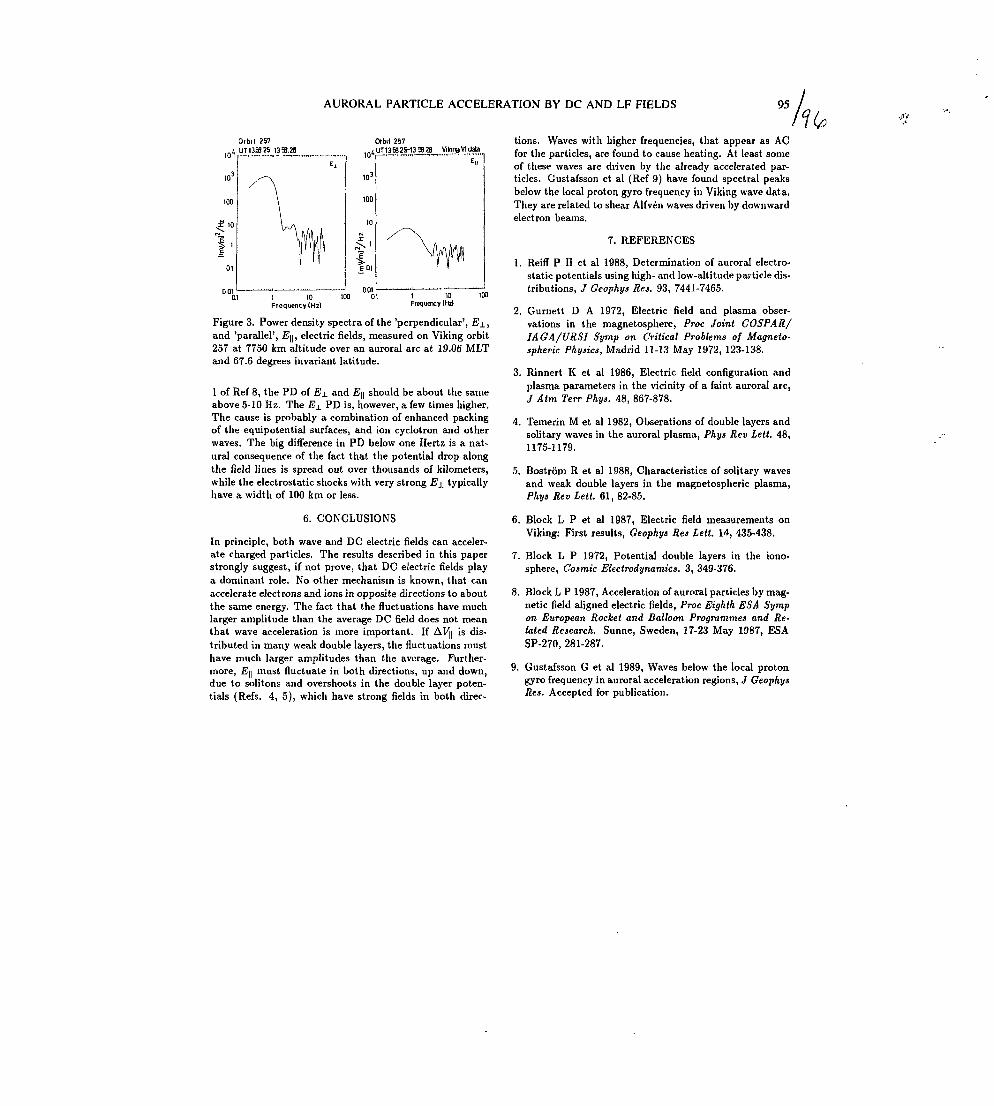
AURORAL PARTICLE ACCELERATION BY DC AND LF FIELDS 95
Orbit 257; UTI35B25 1358.28
IO i •- ~—,-
1 10Frequency (Hz)
10*
W3
100
IO
ï001l
Ol
Orbit ?57UT135825-135628
1 10Frequency (HzI
Figure 3. Power density spectra of the 'perpendicular', E±,and 'parallel', E\\, electric fields, measured on Viking orbit257 at 7750 km altitude over an auroral arc at 19.06 MLTand 67.6 degrees invariant latitude.
1 of Ref 8, the PD of E± and E\\ should be about the sameabove 5-10 Hz. The E± PD is, however, a few times higher.The cause is probably a combination of enhanced packingof the equipotential surfaces, and ion cyclotron and otherwaves. The big difference in PD below one Hertz is a nat-ural consequence of the fact that the potential drop alongthe field lines is spread out over thousands of kilometers,while the electrostatic shocks with very strong Ej. typicallyhave a width of 100 km or less.
6. CONCLUSIONS
In principle, both wave and DC electric fields can acceler-ate charged particles. The results described in this paperstrongly suggest, if not prove, that DC electric fields playa dominant role. No other mechanism is known, that canaccelerate electrons and ions in opposite directions to aboutthe same energy. The fact that the fluctuations have muchlarger amplitude than the average DC field does not meanthat wave acceleration is more important. If AVj| is dis-tributed in many weak double layers, the fluctuations musthave much larger amplitudes than the average. Further-more, E\\ must fluctuate in both directions, up and down,due to solitons and overshoots in the double layer poten-tials (Refs. 4, 5), which have strong fields in both direc-
tions. Waves with higher frequencies, that appear as ACfor the particles, are found to cause heating. At least someof these waves are driven by the already accelerated par-ticles. Gustafsson et al (Ref 9) have found spectral peaksbelow the local proton gyro frequency in Viking wave data.They are related to shear Alfvén waves driven by downwardelectron beams.
7. REFERENCES
1. Reiff P H et al 1988, Determination of auroral electro-static potentials using high- and low-altitude particle dis-tributions, J Geophys Res. 93, 7441-7465.
2. Gurnett D A 1972, Electric field and plasma obser-vations in the magnetosphere, Proc Joint COSPAR/IAGA/VRSI Symp on Critical Problems of Magneto-spheric Physics, Madrid 11-13 May 1972, 123-138.
3. Rinnert K et al 1986, Electric field configuration andplasma parameters in the vicinity of a faint auroral arc,J Atm Terr Phys. 48, 867-878.
4. Temerin M et al 1982, Obserations of double layers andsolitary waves in the auroral plasma, Phys Rev Lett. 48,1175-1179.
5. Bostrôm R et al 1988, Characteristics of solitary wavesand weak double layers in the magnetospheric plasma,Phys Rev Lett. 61, 82-85.
6. Block L P et al 1987, Electric field measurements onViking: First results, Geophys Res Lett. 14, 435-438.
7. Block L P 1972, Potential double layers in the iono-sphere, Cosmic Electrodynamics. 3, 349-376.
8. Block L P 1987, Acceleration of auroral particles by mag-netic field aligned electric fields, Proc Eighth ESA Sympon European Rocket and Balloon Programmes and Re-lated Research. Sunne, Sweden, 17-23 May 1987, ESASP-270, 281-287.
9. Gustafsson G et al 1989, Waves below the local proton,gyro frequency in auroral acceleration regions, J GeophysRes. Accepted for publication.
97
OBSERVATIONS OF ELECTROSTATIC HYDROGEN CYCLOTRONWAVES AND ELECTRIC FIELD FLUCTUATIONS
NEAR ONE Hz IN AURORAL ACCELERATION REGIONS
Anders I. Eriksson and Georg Gustafsson
Swedish Institute of Space Physics, Uppsala DivisionS - 755 91 Uppsala, Sweden
ABSTRACT
Electrostatic hydrogen cyclotron waves and electric field fluctua-tions below the oxygen gyrofrequency (a few Hz) are closely re-lated to the acceleration of ions and are therefore of great im-portance. The observations reported here are from Viking in thealtitude range 7000-13000 km of the electric field in two frequencyranges, 0.2 - 2 Hz and /^ - 1.9 /cp. Wave data from seven orbitspassing through the mid-altitude acceleration region have beenstudied in detail. A close correlation between the power in thetwo frequency ranges was observed, in particular during ion conicevents, but also in ion beam events. The amount of power, the de-tailed correlation, and the power ratio between the two frequencyranges indicate the possibility that the low frequency fluctuationsmay be a source of ion acceleration.
Keywords: Electrostatic hydiogen cyclotron wave, low frequencyelectric fields, ion acceleration, ion beams, ion conies
1. INTRODUCTION
Our view of the composition of the Earth's magnetosphere hasundergone a fundamental change in the last 10 to 15 years. Theview of the magnetospheric plasma as being primarily of solarwind origin has changed to a view where the plasma is largely ofionospheric origin. Satellite observations of energetic ion compo-sition have shown an outflow of energetic H+, O+, and sometimesother ions from the ionosphere up to the magnetosphere, and alsothat these ions are accelerated to energies in the keV range (forreview, see references 1 and 2). Acceleration processes operatingboth parallel and transverse to the magnetic field are required toexplain the observations. The parallel acceleration is commonlyattributed to electrostatic acceleration in a potential drop (e.g.,rsfs. 3, 4), while various wave processes have been inferred toexplain the transverse energisation (e.g. refs. 5, 6, 7, 8). It wasdemonstrated by the S3-3 satellite, and first reported by Sharpet al (réf. 5), that transverse acceleration of ions produces pitchangle distributions known as conies. The conies are sometimeselevated so that the ions with lowest energy are magnetic fieldaligned, which indicates a possible combination of parallel andperpendicular acceleration processes (e.g. refs. 9, 10, Ii).
The transverse acceleration of ions is a very common phenomenon,which for instance was observed on almost every orbit on Viking.
Hence it is of great interest to study and explain this process. Sev-eral mechanisms have been proposed, including electrostatic hy-drogen cyclotron (EHC) waves (refs. 12, 13), narrow oblique po-tential structures (réf. 14), lower hybrid waves (réf. 15), electro-magnetic ion cyclotron resonance with left-hand polarised broadband waves (réf. 16), and a magnetic moment pumping process(réf. 17). None of the theories seem to be able to explain allfeatures of transverse ion energisation. For example, Peterson etal (réf. 18) were unable to establish any event where there wasclear evidence for the ion energisation from plasma waves despitea detailed study of a large amount of high resolution plasma datafrom the Dynamics Explorer 1. On the other hand, there are notsufficient observations to rule out any of the proposed processes.It should be kept in mind that, when studying ion waves, bothions and electrons must be considered as potential sources of freeenergy as well as damping sinks for many of the wave modes (e.g.ref 19).
Recently, it has been found from measurements on Viking (refs.20,21) that ion beams and conies occur in regions with very strongelectric field turbulence in the frequency region below a few Hz,i.e. below all characteristic frequencies of the plasma. The presentstudy has been carried out as a, first step towards establishing therelative importance of these low frequency electric fluctuations(LEF:s) and the electrostatic hydrogen cyclotron waves (EHC:s).VVe will not provide any theoretical treatment of the observationswe present, but only indicate some possible conclusions of thepresented data.
2. OBSERVATIONS
In this report we study the correlation between the power in theEHC:s and in the LEF:s as measured by the V4L low frequencyelectric field experiment on yiking. This experiment measuredthe electric field with spherical probes mounted on four 40 m wirebooms (i.e. 80 m tip to tip). Data from one of the boom pairsare used in this study. The observations presented here are fromseven Viking orbits from April to September 1986 with differentaltitudes and other characteristics, as can be seen in Table 1. As ameasure of the power in the EHC:s and LEF:s, we have integratedthe power spectra of the E-field. For the EHC the integration areais between the proton cyclotron frequency, /^, and 1.9 f^,, whilethe frequency range chosen for the LEF is from 0.2 Hz to 2 Hz.When we use expressions like " the power in the EHC" or " the LEFpower", what we really mean is the power in the correspondingfrequency ranges. The upper frequency range was chosen so as toinclude all contributions from the fundamental frequency of theEHC (Figure 1). The lower limit of the LEF frequency range waschosen because we wanted to avoid possible effects of the satellite
Proc. Ninth ESAIPAC Symposium on 'European Socket and Balloon Programmes and Related Research', lahnstein, FRG, 3—7April 1989(ESA SP-291, June 1989)
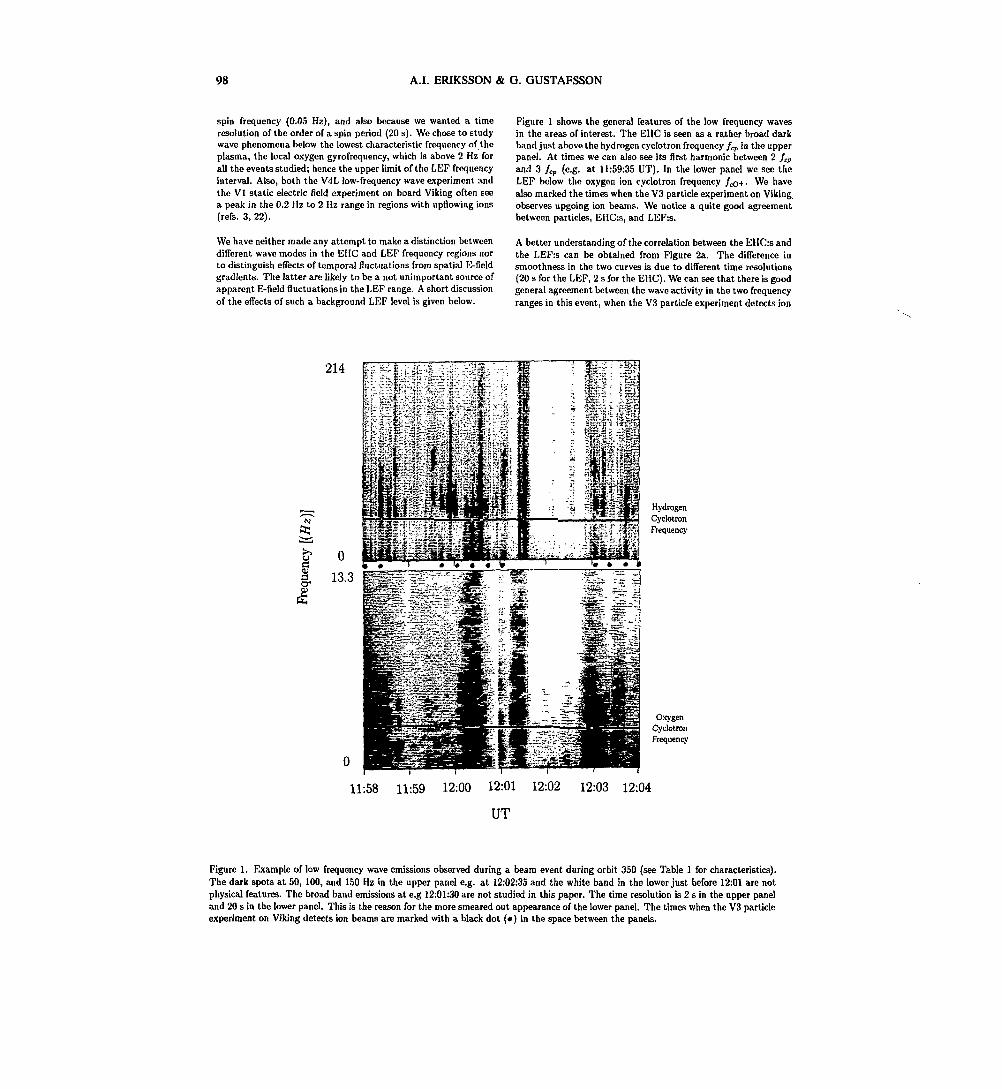
98 A.I. ERIKSSON & G. GUSTAFSSON
spin frequency (0.05 Hz), and also because we wanted a timeresolution of the order of a spin period (20 s). We chose to studywave phenomena below the lowest characteristic frequency of theplasma, the local oxygen gyrofrequency, which is above 2 Hz forall the events studied; hence the upper limit of the LEF frequencyinterval. Also, both the V4L low-frequency wave experiment andthe Vl static electric field experiment on board Viking often seea peak in the 0.2 Hz to 2 Hz range in regions with upflowing ions(refs. 3,22).
We have neither made any attempt to make a distinction betweendifferent wave modes in the EHC and LEF frequency regions norto distinguish effects of temporal fluctuations from spatial E-fieldgradients. The latter are likely to be a not unimportant source ofapparent E-field fluctuations in the LEF range. A short discussionof the effects of such a background LEF level is given below.
Figure 1 shows the general features of the low frequency wavesin the areas of interest. The EHC is seen as a rather broad darkband just above the hydrogen cyclotron frequency /cp in the upperpanel. At times we can also see its first harmonic between 2 fcf
and 3 /cp (e.g. at 11:59:35 UT). In the lower panel we sec theLEF below the oxygen ion cyclotron frequency /co+. We havealso marked the times when the V3 particle experiment on Viking,observes upgoing ion beams. We notice a quite good agreementbetween particles, EHC:s, and LEF:s.
A better understanding of the correlation between the EHC:s andthe LEF:s can be obtained from Figure 2a. The difference insmoothness in the two curves is due to different time resolutions(20 s for the LEF, 2 s for the EHC). We can see that there is goodgeneral agreement between the wave activity in the two frequencyranges in this event, when the V3 particle experiment detects ion
HydrogenCyclotronFrequency
OxygenCyclotronFrequency
O
11:58 11:59 12:00 12:01 12:02 12:03 12:04
UT
Figure 1. Example of low frequency wave emissions observed during a beam event during orbit 350 (see Table 1 for characteristics).The dark spots at 50, 100, and 150 Hz in the upper panel e.g. at 12:02:35 and the white band in the lower just before 12:01 are notphysical features. The broad band emissions at e.g 12:01:30 are not studied in this paper. The time resolution is 2 s in the upper paneland 20 s in the lower panel. This is the reason for the more smeared out appearance of the lower panel. The times when the V3 particleexperiment on Viking detects ion beams are marked with a black dot (•) in the space between the panels.

EHC WAVES AND ELECTRIC FIELD FLUCTUATIONS 99
S.
Orbit 1199, Sept 27, 1986
10+5
1-
10-5- T I I 1 I 1 1 1 T
20:10 20:15UT
LEF
EHC
20.08 20.13
Time(UT)
20.18
Figure 2a. Example of LEF and EHC power spectral densities for Figure 2b. LEF power and some ion parameters for the samean ion conic event. event as in figure 2a, From Lundin et al 1989 (réf. 22).
conies. We have not used particle data in any quantitative sensein this study, but only to state qualitatively whether there areupflowing ions present or not. In an earlier study (réf. 22) wehave studied correlations between particle parameters and EHCand LEF power. Figure 2b is shown here in order to demonstratethe connection between the LEF:s and the particles. Notice thegood correlation between the LEF power spectral density and thetemperature of the upflowing ions.
Another example of the relationship between the waves can beseen in Figure 3a. Here the EHC power versus the LEF poweris plotted in a scatterplot where subsequent points (2 s betweeneach dot) have been joined with a line. This gives us an im-pression of the time evolution of the power in the two frequencyregions. In this log-log diagram the points seem to line up verynicely on a straight line between 04:48 and 04:49 UT, and on an-other line after 04:50 UT. The correlation between the power inthe two wave modes is obviously very good for this event. Noticein particular the correlation between 04:48 and 04:49 UT, whenthe dots line up almost perfectly. In fact, Figure 3a also contains
information on the intimate relationship between waves and par-ticles. Between 04:49 and 04:50 UT the V3 particle experimentobserves a distinct drop in ion temperature (R Lundin, privatecommunication). Hence the decrease in LEF power by a powerof ten between 04:49 and 04:50 occurs at the same time as theparticle characteristics change. The behaviour of other particleparameters and their correlation with the wave power during thistime period will be the subject of a further study.
Figures 3b, 3c, and 3d show similar scatterplots as Figure 3a (butwith distinct points marked) for events with ion conies, eventswith beams, and events with neither beams nor conies but inthe close vicinity of the beams, respectively. Events from orbitswith very different characteristics (see table 1) have been broughttogether in the same plot. Bearing this in mind, the correlationmust be considered very good for conic and beam events (figs. 3band 3c). The points are least scattered in the conies plot (fig.3b). When we go from higher to lower power values in Figure 3bthe points at first group very well around a straight line with aslope of about 1, but at an LEF power between 1 (mV/m)2 and
Orbit Date UT MLT Inv lat Altitude (km) Particles
247350518586111311691199
April 7April 26May 27June 8Sept 12Sept 22Sept 27
18:21 -11:53-00:36 -09:20 -04:48 -09:48 -20:10-
18:2812:0900:5809:3705:0110:0720:18
20:06 -17:18-16:23 -15:18-10:50 -10:56-09:32 -
20:0316:2113:4414:5810:4523:5209:01
72-74-75-69-66-84-71-
77818175698273
7600-10200-10600 -11600-13100 -9500-
12200 -
860011800124001270012500680011500
beamsbeamsconiesbeamsconiesbeamsconies
Table 1. Characteristicsof the time intervalsstudied in this paper.
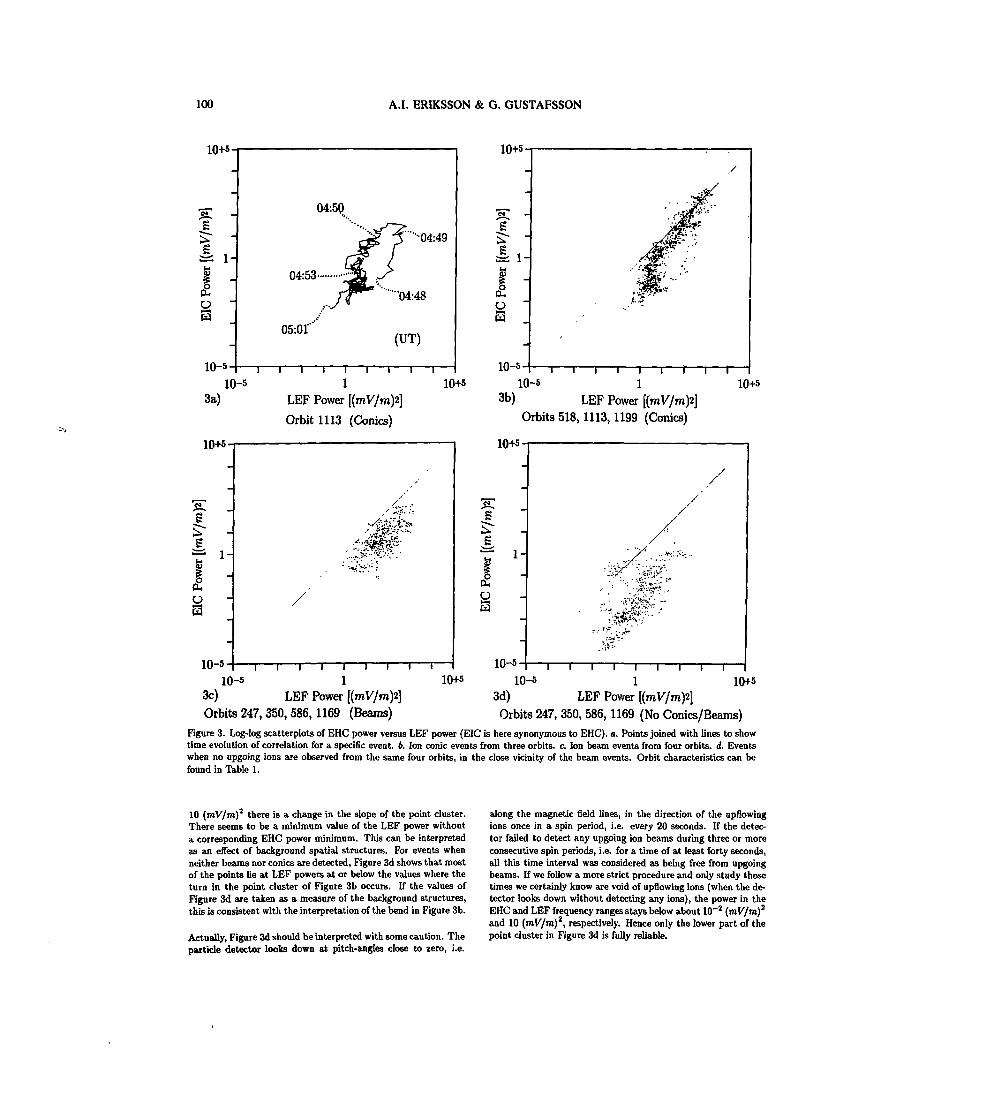
100 A.I. ERIKSSON & G. GUSTAFSSON
JS.
o&
10-5
04:50*
04:53
05:01"'
-04:49
I I I
10+s
I i i10-5 1
3a)
10+5
LEF Power [(mV/mp]
Orbit 1113 (Conies)
10-5-
10-5 1
3b) LEF Power [(mV/m)*Orbits 518,1113,1199 (Conies)
lO-i-5
cuUS
10-5-10-5 1
3c) LEF Power [(mV/m)*Orbits 247,350,586,1169 (Beams)
10+s
1-
OH
10+5
10-5-
10-5 1 10+53d) LEF Power [(mV/m)2]Orbits 247, 350, 586, 1169 (No Conies/Beams)
Figure 3. Log-log scatterplots of EHC power versus LEF power (EIC is here synonymous to EHC). a. Points joined with lines to showtime evolution of correlation for a specific event, b. Ion conic events from three orbits, c. Ion beam events from four orbits, à. Eventswhen no upgoing ions are observed from the same four orbits, in the close vicinity of the beam events. Orbit characteristics can befound in Table 1.
10 (mV/m)2 there is a change in the slope of the point cluster.There seems to be a minimum value of the LEF power withouta corresponding EHC power minimum. This can be interpretedas an effect of background spatial structures. For events whenneither beams nor conies are detected, Figure 3d shows that mostof the points lie at LEF powers at or below the values where theturn in the point cluster of Figure 3b occurs. If the values ofFigure 3d are taken as a measure of the background structures,this is consistent with the interpretation of the bend in Figure 3b.
Actually, Figure 3d should be interpreted with some caution. Theparticle detector looks down at pitch-angles close to zero, i.e.
along the magnetic field lines, in the direction of the upflowingions once in a spin period, i.e. every 20 seconds. If the detec-tor failed to detect any upgoing ion beams during three or moreconsecutive spin periods, i.e. for a time of at least forty seconds,all this time interval was considered as being free from upgoingbeams. If we follow a more strict procedure and only study thosetimes we certainly know are void of upflowing ions (when the de-tector looks down without detecting any ions), the power in theEHC and LEF frequency ranges stays below about 10~2 (mV/m)2
and 10 (roV/m)2, respectively. Hence only the lower part of thepoint cluster in Figure 3d is fully reliable.
EHC WAVES AND ELECTRIC FIELD FLUCTUATIONS 101
3. SUMMARY AND DISCUSSION
The observations presented in this report have been summarizedin Table 2. From this table, and from Figure 3, we observe thefollowing:
• The power in the LEF and EHC frequency ranges are muchhigher when upgoing ion beams or conies are present ascompared to periods when no such ions are observed.
• The power in the LEF is higher than the power in the EHC.The power ratio LEF/EHC is lowest for conies, higher forbeams, and still higher when neither beams nor conies arepresent.
• The correlation of the power in the EHC and LEF frequencyranges is very good for conic events, not so good for beams,and worse still at times when no upgoing ions are detected.
• The slope k of a regression line fitted to scatterplots of thetype shown in Figure 3 is the exponent in an equation ofthe form Power(EHC) ~ [Power(LEF)]*. For the orbitsstudied, k is between O and 1 for conies, between 1 and2 for beams, and anything between O and 2 for "empty"events. We do not comment on the possible meaning ofthose different fc-values in this paper.
It is beyond the scope of this paper to present any thorough dis-cussion on the possible interpretations of these results. Here wewill just indicate how the results could be interpreted in termsof interactions between the particles and the waves/fluctuations.Making the fairly safe assumption that the correlation betweenthe EHC and LEF power is a real effect and not a very unlikelycoincidence, we have in principle five interpretation schemes:
1. Energy is transfered from the particles to both the EHC andLEF wave modes.2. Energy is transfered from the EHC:s to the particles, which intheir turn transfer energy to the LEF:s.3. Energy flows from the LEF:s to the particles, which then trans-fer energy to the EHC:s.4. There is a direct coupling between the EHC:s and the LEF:s.Energy can flow between the wave modes by some non-linear pro-cess.5. Some other process/structure transfers energy to the particles,the LEF:s, and the EHC:s simultaneously.
Disregarding the fourth and fifth possibilities in this paper, weare left with three wave-particle interaction schemes. The factthat the correlation between EHC and LEF power is highest inareas with ion conies is interesting. Ion conies are locally accel-erated, and hence we are closer to the region where the particlesgained energy when ion conies are detected than when beams areseen. If alternative number one, i.e. that the beams excite bothEHC:s and LEF:s, were correct, there is no a priori reason forthis higher correlation in ion acceleration/heating regions. Theresults presented in this paper seem to be more consistent withalternatives number 2 and 3 in the list above. In particular, thethird suggestion, i.e. energy transfer from LEF:s over the parti-cles to the conies, is a possible interpretation. If we have a veryefficient process transfering energy from the LEF to the particleswe should expect to have a high damping of the LEF in the ionacceleration areas, and we can see that the power ratio LEF/EHChas its lowest value here (ion conic events in Table 2).
Particles: Conies Beams Neither
EIC power IQ-2 - 103 HT1 - 102 HT4 - 1
LEF power(mV/mf
Power ratioLEF/EIC(typical)
Power CorrelationEHC to LEF
1 - 103
~3
0.89
1 - 103 10~2 - 10
~30 ~300
0.72 0.61
0 < k<0.7
0<k K f c < 2(typical) 1.4 (1.1)
Table 2. Summary of observations. The power correlation refersto a fitting Power(EIC) ~ [PoweT(LEF)]k, i.e. fitting of astraight line to the scatterplots in Figure 3. The range of value fork refers to values obtained from single events, while the typicalvalues refers to the summary plots in Figure 3. The value 1.1 inparenthesis is obtained if only the points with Power(EHC) >l(mV/m)2 in Figure 3b is used.
4. ACKNOWLEDGEMENTS
This work has been supported by the Swedish Board for SpaceActivities (SBSA). The Viking satellite project was managed bythe Swedish Space Corporation under contract from the SBSA.
5. REFERENCES
1. Shelley E G 1986, Magnetospheric energetic ions from theEarth's ionosphere, Adv Space Res 6, 121.
2. Yau A W and Lockwood M 1988, Vertical ion flow in thepolar ionosphere, in Modeling Magnetospheric Plasma, ed. MooreT E and Waite J H Jr, Geophysical Monograph 44, AmericanGeophysical Union, Washington, D.C., 229-240.
3. Block L P and FSlthammar C-G 1989, Auroral particle acceler-ation by DC and low frequency electric fields, Proc 9th ESA/PACSymposium on European Rocket and Balloon Programmes andRelated Research, Lahnstein 3 - 7 April 1989, ESA SP-291.
4. Shelley E G et al 1976, Satellite observations of an ionosphericacceleration mechanism, Geophys Res Lett 3, 654.
5. Sharp R D et al 1977, Observations of an ionospheric accelera-tion mechanism producing energetic (keV) ions primarily normalto the geomagnetic field direction, J Geophys Res 82, 3324.
6. Klumpar D M 1979, Transversely accelerated ions: An iono-spheric source of hot magnetospheric ions, J Geophys Res 84,4229.
7. Kintner P M et al 1979, Simultaneous observations of ener-getic (keV) upstreaming ions and electrostatic hydrogen cyclotronwaves, J Geophys Res 84, 7201.
8. Ungstrup E D et al 1979, Low altitude acceleration of iono-spheric ions, J Geophys Res 84, 4289.

102 A.I. ERIKSSON & G. GUSTAFSSON
9. KIumpar D M et al 1984, Direct evidence for two-stage (bi-modal) acceleration of ionospheric ions, J (leophys Res 89, 10779.
10. Tcmcrin M 1986, Evidence for a large bulk ion conic heatingregion, Geophys Res Lett 13, 1059.
11. Horwitz J L 1986, Velocity filter mechanism for ion bowldistributions (Bimodal conies), J Geophys Res 91, 4513.
12. Lysak R L et al 1980, Ion heating by strong electrostatic ioncyclotron turbulence, J Geophys Res 85, 678.
13. Ashour-Abdalla M and Okuda H 1984, Turbulent heating ofheavy ions on auroral field lines, J Geophys Res SO, 2235.
14. Borovsky J E 1984, The production of ion conies by obliquedouble layers, J Geophys Res 89, 2251.
15. Chang T and Coppi B 1981, Lower hybrid acceleration andion evolution in the suprauroral region, Geophys Res Lett 8,1253.
16. Chang T et al 1986, Transverse acceleration of oxygen ionsby electromagnetic ion cyclotron resonance with broad band left-hand polarized waves, Geophys Res Lett 13, 636.
17. Lundin R and Hultqvist B 1989, Ionospheric plasma escapeby high-altitude electric fields: Magnetic moment pumping, inpress in J Geophys Res.
18. Peterson W K et al 1988, Transverse ion energization andlow-frequency plasma waves in the mid-altitude auroral zone: Acase study, J Geophys Res 93, 11405.
19. Kaufmann R t, and Kintner P M 1982, Upgoing ion beams:1. Microscopic analysis, J Geophys Res 87, 10487.
20. Hultqvist B et al 1988, Simultaneous observations of upwardmoving field aligned energetic electrons and ions on auroral zonefield lines, J Geophys Res 93, 9765.
21. Falthammar C-G et al 1987, Preliminary results from theD.C. electric field experiment on Viking, Annales Geophysicae 5,171.
22. Lundin R et al 1989, On the importance of high-altitude low-frequency electric fluctuations for the escape of ionospheric ions,submitted to J Geophys Res.
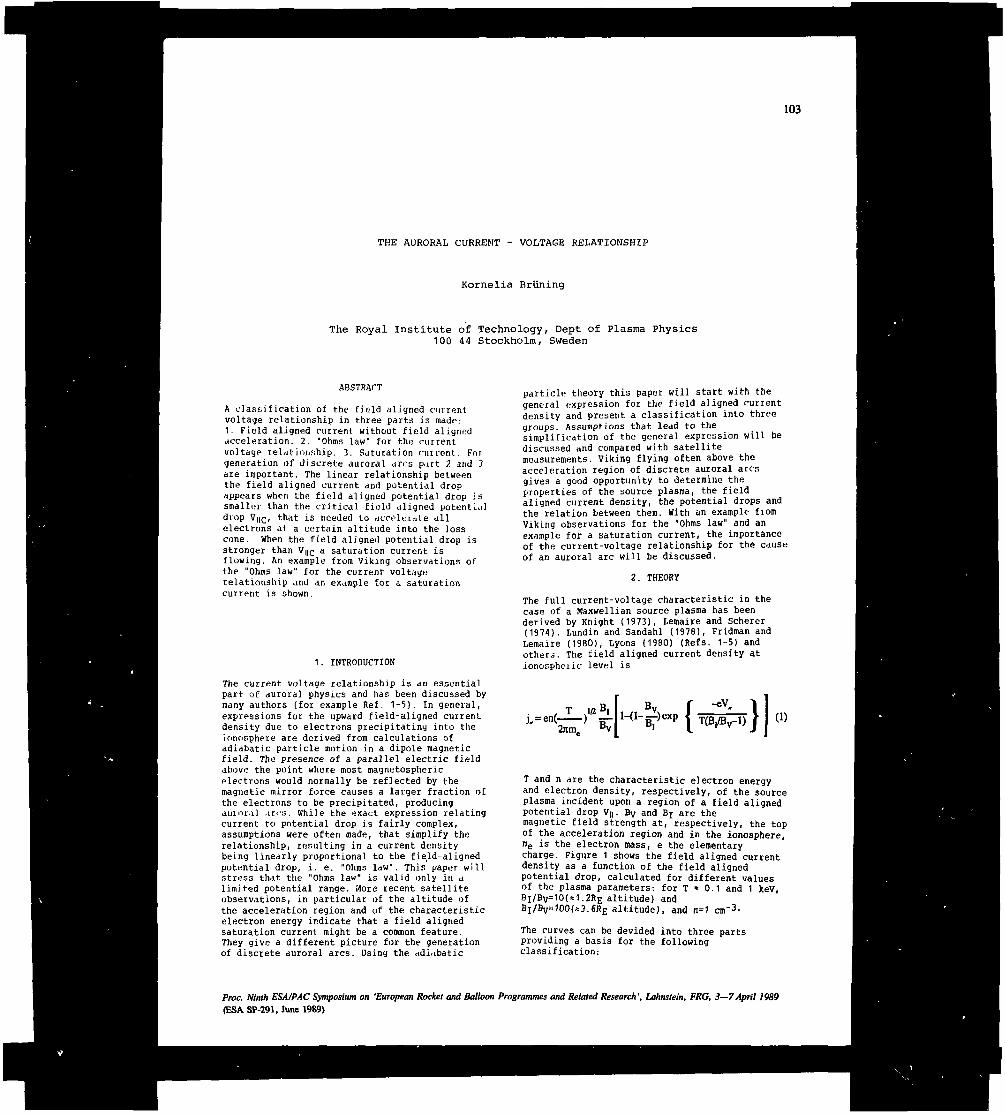
103
THE AURORAL CURRENT - VOLTAGE RELATIONSHIP
Kornelia Briining
The Royal Institute of Technology, Dept of Plasma Physics100 44 Stockholm, Sweden
ABSTRACT
A classification of the field aligned currentvoltage relationship in three parts is made:1. Field aligned current without field alignedacceleration. 2. "Ohms law" for the currentvoltage relritkinship. 3. Saturation current. Forgeneration of discrete auroral arcs part 2 and 3are important. The linear relationship betweenthe field aligned current and potential dropappears when the fic;ld aligned potential drop issmallur than the critical field aligned potentialdrop V ne, that is needed to dcci'-liuale allelectrons at a certain altitude into the losscone. When the field aligned potential drop isstronger than Vue a saturation current isflowing. An example from Viking observations ofthe "Ohms law" for the current- voltagurelationship and an example for a saturationcurrent is shown.
1 . INTRODUCTION
The current voltage relationship is an essentialpart of auroral physics and has been discussed bymany authors (for example Réf. 1-5). In general,expressions for the upward field-aligned currentdensity due to electrons precipitating into theionosphere are derived from calculations ofadiabatic particle motion in a dipole magneticfield. The presence of a parallel electric fieldabove the point where most magnetosphericelectrons would normally be reflected by themagnetic mirror force causes a larger fraction ofthe electrons to be precipitated, producingauior.il .in1:;. While the exact expression relatingcurrent to potential drop is fairly complex,assumptions were often made, that simplify therelationship, resulting in a current densitybeing linearly proportional to the field-alignedpotential drop, i. e. "Ohms law". This paper willstress that the "Ohms law" is valid only in alimited potential range. More recent satelliteobservations, in particular of the altitude ofthe acceleration region and of the characteristicelectron energy indicate that a field alignedsaturation current might be a common feature.They give a different picture for the generationof discrete duroral arcs. Using the «di.ibatic
particle theory this paper will start with thegeneral expression for the field aligned currentdensity and present a classification into threegroups. Assumptions that lead to thesimplification of the general expression will bediscussed and compared with satellitemeasurements. Viking flying often above theacceleration region of discrete auroral arcsgives a good opportunity to determine theproperties of the source plasma, the fieldaligned current density, the potential drops andthe relation between them. With an example fiomViking observations for the "Ohms law" and anexample for a saturation current, the importanceof the current-voltage relationship for the causeof an auroral arc will be discussed.
2. THEORY
The full current-voltage characteristic in thecase of a Maxwellian source plasma has beenderived by Knight (1973), Lemaire and Scherer(1974). Lundin and Sandahl (1978), Fridman andLemaire (1980), Lyons (1980) (Refs. 1-5) andotherô. The field aligned current density ationospheric level is
l,=en(2Jimc
!(8,/Bv-I) f 0>
1 1
I
T and n are the characteristic electron energyand electron density, respectively, of the sourceplasma incident upon a region of a field alignedpotential drop V||. BV and B1 are themagnetic field strength at, respectively, the topof the acceleration region and in the ionosphere,itie is the electron mass, e the elementarycharge. Figure 1 shows the field aligned currentdensity as a function of the field alignedpotential drop, calculated for different valuesof the plasma parameters: for T = 0.1 and 1 KeV,Bi/Bv=10(*1.2RE altitude) andBr/Bv=100(*3.6RE altitude), and n=1 cm'
3-
The curves can be devided into three partsproviding a basis for the followingclassification:
Proc. Ninth ESAIPAC Symposium on 'European Rocket and Balloon Programmes and Related Research ', lahnslein, FRG, 3—7 April 1989(ESA SP-291, June 1989)

104 K. BRÙNING
1. Field aligned current without significantfield aligned acceleration: For eV|| « TEq.1 reduces to
Table 1.
,en(Ifl
2îinv
2. 'Ohms law" for the current voltagerelationship: For eVB/T « Bj;/Bv Eq. 1reduces to
j. = en (—)I/2 (!+!£)
„(2)
(3)
showing a linear relationship between J j and
3. Saturation current: For eVj/TEq. 1 reduces to
T 1/2 BiB
(4)
which means, that the current density isindependent of the field aligned potential dropand a saturation current is flowing.
Figure 1. Field aligned current density as afunction of the field aligned potentialdrop calculated forT = 1keV (thick lines) andT = 0.1 KeV (thin lines) for eachcase with
= 10 (solid lines) and= 100 (dashed lines).
Figure 1 shows that with increasingor/and increasing characteristic electronenergies T1 the part of the curves where "Ohmslaw" is applicable moves to higher field alignedpotential drops.
2.1 Field aligned current without field alignedacceleration
It can be seen from Figure 1 and according toEq. 2 that a small current can flow without apotential drop or a potential drop much smallerthan the characteristic electron energy.The maximum current density at ionospheric levelof such a current is summerized in Table 1.
ionospheric
nfcm-3|
TIeV]
electrons
1(>3-105
0.176
ions(0+)
103-105
0.176
mignciosphcric
electrons
10-1 - 10°
102-103
ions(H+)
10-1 -IflO
102 - 104
j|| U I)Wm2J 10-103 10-*. 10-2
JH It [(Wm2j 7-10-2 - 7-100 3-10-2 - 9-10-1
Satellites and rockets frequently observed upwardand downward currents of several pA/m^ in theauroral zones (see for example Wilhelra et al.1981, Réf. 6, Briining 1983, Eef. 7). Table 1shows that downward current can be carried byionospheric electrons without any field alignedpotential drop. The main carriers of upwardcurrent in discrete auroral arcs areprecipitating electrons. It is generally believedthat they originate from the magnetosphere(plasmasheet or boundary layers). As the densityis small, a field aligned potential drop isrequired to increase the number of electrons inthe loss cone.
2.2 "Ohms law" for the current voltagerelationship
The applicability o£ "Ohms law" or the linearrelationship (Eq. 3) between the field alignedcurrent density and the potential drop has beenpointed out by many authors (for exampleFàlthammar, 1978; Réf. 8, Lyons 1980, Réf. 5)and has been confirmed by satellite and rocketobservations (for example Lyons et al. 1979,RfI. 9, Lyons 1981, Réf. 10, Menietti and Burch1981, Réf. 11). AE field aligned potential dropsoften appear at a reversal of the electric fieldperpendicular to the magnetic field lines, it wassuggested (for ex. Lyons 1980, Réf. 5) that anauroral arc is caused by the reversal of theconvection elertric field in the magnetosphere.The electric field maps down into the ionosphere,where it drives horizontal currents, which alsoreverse sign. The divergent horizontal currentsrequire a field-aligned current, that can bestronger than the maximum current that ran becarried by magnetospheric electrons withoutsignificant potential drops (see Table 1). Tomaintain current continuity field-alignedpotential drops have to occur to increase theamount of electrons in the loss cone. The fieldaligned potential drop increases theprecipitating energy flux into the ionosphere andthus causes the appearance of an auroral arc.With a field aligned potential drop the mappingof the electric field is not perfect anymore.However, a selfconsistent system between fieldaligned current, potential drop and electricfield will be built up.
2.3 Saturation current
An upper limit for the field aligned currentdensity will be reached when at a certain

AURORAL CURRENT/VOLTAGE RELATIONSHIP 105
altitude of the accélération region (or at agiven Bj/By) the field aligned potential dropis sufficiently strong to <K-LV! crate allelectrons into the loss cone.Assuming conservation of the first invariant theloss cone for electrons with kinetic energy E canbe calculated (see for example Lin and Hoffman,198?. Rpf. 12)
2 BV eV>sin a = —(1+—)B1 h
(5)
For a - 90° all electrons with energies « E getinto the loss i:one and reach the ionosphere.Then Eq. 5 heroines
eV,
~Ë~(6)
Inserting Eq. 6 into Eq. 1 and putting E=T givesan approximate limit to which a field alignedcurrent density can increase with the potentialdrop for a given Bi/By. When this limit isreached the linear relationship between the fieldaligned current density and the field-alignedpotential drop (Eq. 3) is not valid anymore. Thinmeans that the current increases very slowly withthe potential drop, because the number ofelectrons decreases exponentionally for E>T. Inthat case Eq. 4 becomes a good approximation,where the current is independent of the potentialdrop. In other words
(7)
is the critical field aligned potential drop forwhich a majority of the electrons are acceleratedinto the loss cone.
3. OHMS LAW AND SATURATION CURRENT
Ï.1 General observations
Most papers thai discuss the current voltagerelationship deal with the .'inear relationship(for example (Falthammar 1973, Réf. 8, Fridmanand Lemaire 1980, Réf. 4, Lyons 1980, Réf. 5) oreven use it as fundamental assumptions from whichconclusion:; are drawn (for example Weimer 1997,Réf. 13). In fact, if the top of the accelerationregion Js several earth radii away from the earthfor example at Bj/By=IOO at about 3.6 Rj;or/and for high characteristic electron energiesT = 1keV (see Figure 1) the linear relationshipis a good approximation of Eq. 1. However recentsatellite measurements indicate that theacceleration region is often below 2 earth radii(Bi/Bv=27) and that characteristic electronenergy is often smaller than 1 keV.
3.1.1 Altitude of the acceleration region
Pottelette et al. 1988 (Réf. 14) for examplefound from measurements of Auroral KiJometricRadiation (AKR) on board the Viking satellitethat the acceleration region was located near andbelow about one earth radius for the eventsstudied by them. A K R is supposed to begenerated in the acceleration region near theelectron gyrofrequency cutoff (see for exampleBahnsen et al. 1988, Réf. 15 and references init). When Viking is flying above the acceleration
region the top and bottom of the accelerationregion can be determined from the lowest andhighest observed frequency cutoff. Henietti andBurch 1981 (Réf. 16) determined the top of theacceleration region from electron spectrameasured below the acceleration region by theAtmosphere Explorer D satellite. From 160 studiedcases they found that BJ/BV was typicallyabout 4.
3.1.2 Characteristic electron energy
The characteristic electron energy seems to besmaller for dayside than for nightside auroralarcs. Evans 1984 (Réf. 16) studied 84 individualpasses by the TIROS-N satellite near 850 kmaltitude through the 14-15 MLT auroral sector. Hefound that the characteristic electron energy wastypically of the order of 150 eV and the parallelelectric field acceleration was about 1 to 3keV. This value for the characteristic electronenergy is typical for magnetosheet.h plasma.
Observations of plasma parameters associated withnightside aurora reveal generally one, but attimes two components. Some authors like Briininget al. 1986 (Réf. 17) or Kitayama et al. 1988(Réf. 18) found from rocket or satellitemeasurements below the acceleration regioncharacteristic energies of the order of 1 to 3keV. Another group of authors (for exampleSandahl ct al. 1980; Réf. 19, Tanskanen et al.1981, Réf. 20) determined from the acceleratedpart of the electron spectra 2 sourcepopulations. Sandahl et al. 1980, (Réf. 19) foundfrom rocket observations one population withcharacteristic energies between 200 and 500 eV,that might originate from the plasmashfetboundary layer or perhaps even from themagnetosheeth and a second population withplasmasheet energies of the order of severalkeV. Observations by the DE satellites (Reiff Rtal. 1988, Réf. 21) above and below theacceleration region show characteristic energiesof only a few hundred eV with higher energies
below the acceleration region, indicating thatthe population was heated in the accelerationregion.
3.1.3 The critical field aligned potential drop
For field aligned potential drops V||«VncJII is proportional to VN, and for
vn»V||ca saturation current is flowing. For daysideaurora with T=150 eV and assuming the top of theacceleration region to be located at about 1RE,V||C is according to Eq. 7 aboi't 1 keV. However,only precipitating electrons with energies above1keV can reach altitudes below 150 km (Rees,1963, Réf. 22) where they producediscrete aurora, frequently observed on thedayside (for example Murphree, 1981, réf. 23).Evans observations (Réf. 16) of the 14 HLT sectorshowed parallel electric field acceleration of 1to 3 keV. This indicates that in this sectoreither V|| > VUQ and a saturation current isoften flowing or the top of the accelerationregion is located at much higher altitudes. Thelatter, however, seems not to be typical asdiscussed in 3.1.1. However if the characteristicelectron energy is of the order of 1 keV assometimes observed for nightside arcs, V|C is 7keV (with BI/BV=8) and an "Ohms law" can beexpected for the current voltage relationship.
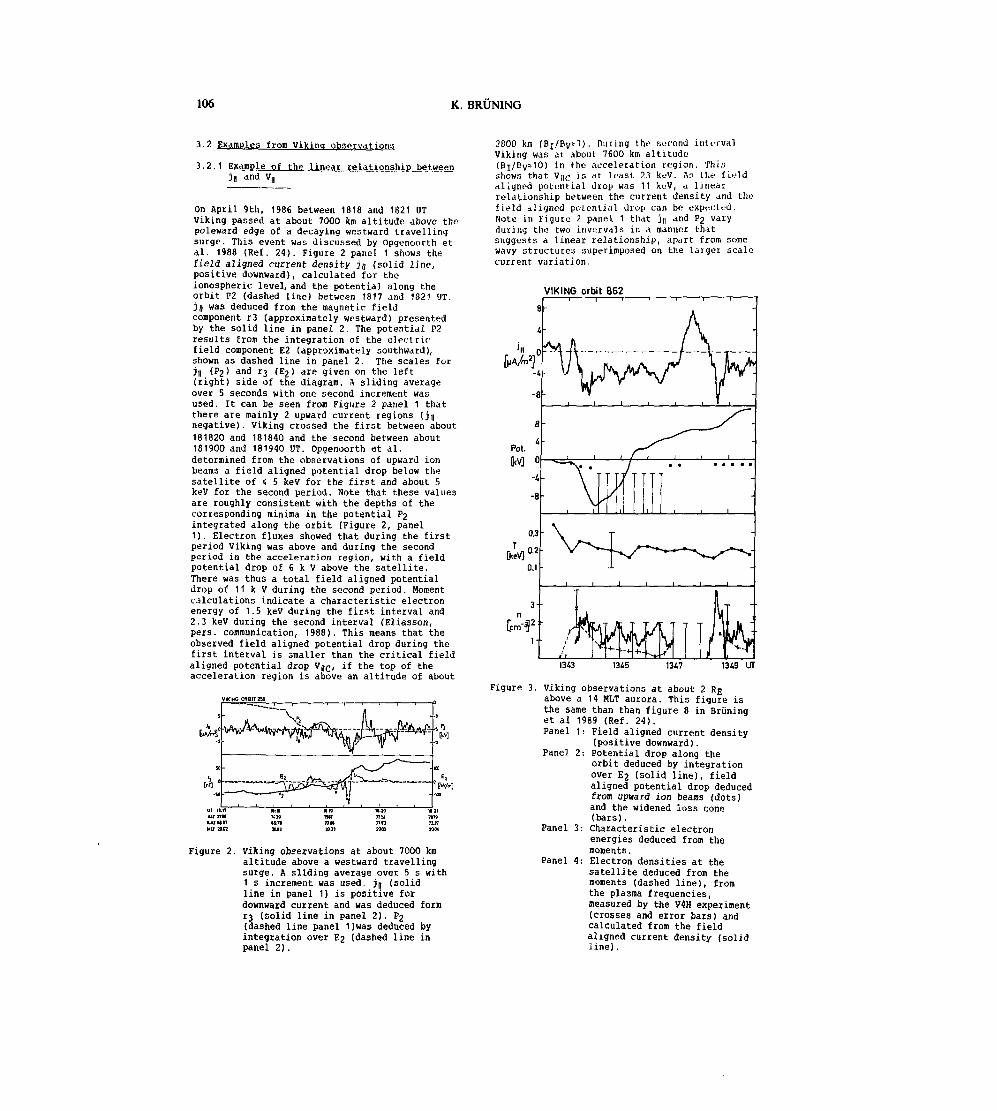
106 K. BRÛNING
3.2 Examples from Viking observations
3.2.1 Example of the linear relationship betweenJn and V||
On April 9th, 1986 between 1818 and 1821 UTViking passed at about 7000 km altitude above thepoleward edge of a decaying westward travellingsurge. This event W<JK discussed by Opgenoorth etal. 1988 (Réf. 24). Figure 2 panel 1 shows thefield aligned current density Jn (solid line,positive downward), calculated for theionospheric level, and the potential along theorbit P2 (dashed line) between 1817 and 1821 UT.JII was deduced from the magnetic fieldcomponent r3 (approximately westward) presentedby the solid line in panel 2. The potential P2results from the integration of the electric-field component E2 (approximately southward),shown as dashed line in panel 2. The scales forJII (?2) and r3 (£2) are given on the left(right) side of the diagram. i\ sliding averageover 5 seconds with one second increment wasused. It can be seen from Figure 2 panel 1 thatthere are mainly 2 upward current regions (Junegative). Viking crossed the first between about181820 and 181840 and the second between about181900 and 181940 OT. Opgenoorth et al.determined from the observations of upward ionbeams a field aligned potential drop below thesatellite of « 5 keV for the first and about 5keV for the second period. Note that these valuesare roughly consistent with the depths of thecorresponding minima in the potential ?2integrated along the orbit (Figure 2, panel1). Electron fluxes showed that during the firstperiod Viking was above and during the secondperiod in the acceleration region, with a fieldpotential drop of 6 k V above the satellite.There was thus a total field aligned potentialdrop of 11 k V during the second period. Momentcalculations indicate a characteristic electronenergy of 1.5 keV during the first interval and2.3 keV during the second interval (Eliasson,pers. communication, 1988). This means that theobserved field aligned potential drop during thefirst interval is smaller than the critical fieldaligned potential drop V||C, if the top of theacceleration region is above an altitude of about
VIKING MBIT aa
Figure 2. Viking observations at about 7000 kmaltitude above a westward travellingsurge. A sliding average over 5 s with1 s increment was used. j|j (solidline in panel 1) is positive fordownward current and was deduced formr3 (solid line in panel 2). $2(dashed line panel 1)was deduced byintegration over £2 (dashed line inpanel 2).
2800 km (BI/BV*I). During the second intervalViking was at about 7600 km altitude(Bi/Bv*10) in the acceleration region. Thisshows that V|ic is at least ?.3 K-V. An tlie fieldaligned potential drop was 11 KeV, <i linearrelationship between the current density and thefield aligned potential Orop can be expected.Note in Figure 2 panel 1 that jj and P2 varyduring the two invervals in A manner thatsuggests a linear relationship, apart from somewavy structures superimposed on the larger scalecurrent variation.
VIKING orbit 862
-8
Pot.
[keV]
I °-4-8
0.3
0.2
O.I
r- T\ IWTI
1343 1315 1347 1349 UT
Figure 3. Viking observations at about 2 REabove a 14 MLT aurora. This figure isthe same than than figure 8 in Briininget al 1989 (Réf. 24).Panel 1: Field aligned current density
(positive downward).Panel 2: Potential drop along the
orbit deduced by integrationover £2 (solid line), fieldaligned potential drop deducedfrom upward ion beams (dots)and the widened loss cone(bars).
Panel 3: Characteristic electronenergies deduced from themoments.
Panel 4: Electron densities at thesatellite deduced from themoments (dashed line), fromthe plasma frequencies,measured by the V4H experiment(crosses and error bars) andcalculated from the fieldaligned current density (solidline).
AURORAL CURRENT/VOLTAGE RELATIONSHIP 107
3.2.2. Example of a saturation current
On July 28, 198« between about 1343 and 1352 OTViking traversed an intense aurora at about 2RE altitude in the 14 HLT sector. This eventwas discussed by Bruning et al. 1989 (Réf. 25).In Figure 3 the field aligned current density(panel 1) is shown for comparison with thepotential drop (panel 2), the characteristicenergies (panel 3) and the electron densities(panel 4.). The solid line in panel 2 shows thepotential deduced from integration over theperpendicular electric field. It is perpendicularat Viking but some of the variations may equalVH, if some of the equipotentials close abovethe ionosphere. The dots represent the fieldaligned potential drop deduced from upward ionbeams. The bars indicate that the field alignedpotential drop is higher than 3 keV as seen fromthe electron loss cones. The characteristicenergies (panel 3) were determined from themoments of the electron spectra. When Vikingenters the region above the aurora near 1343 UTthey decrease to about 200 eV and stay constantwithin the error bars during the whole timeinterval studied. The electron densities in panel4 were determined from the moments of thespectra, (I, dashed line), fron the field alignedcurrent (solid line) and the electrons plasmafrequency (x and bars). See Bruning et al. 1989(Réf. 25) for further details. They found fromAKR observations and the widened loss cone ofupward flowing electrons (on Viking) that the topof the acceleration region was located at analtitude of about one earth radius, whereBI/BV is 8. With these values and thecharacteristic electron energy of 200 eV (Figure3, panel 3) a critical field aligned potentialdrop V||(- of 1.4 kV results from Eq. 7. Aroundthat energy (eVnc) upward ion beams wereobserved to split into conies. From the widenedloss cone a field aligned potential drop that wasat least 3 kV was deduced between 1344 and 134630UT. (See bars in Figure 3, panel 2). Thisindicates that a saturation current was flowingin the region that Viking passed during thisperiod.
4. SUMMARY AND DISCUSSION
Using adiabatic particle theory the field alignedcurrent behaviour was classified into threegroups: 1. Field aligned current without fieldaligned acceleration. 2. "Ohms law" for thecurrent voltage relationship. 3. Saturationcurrent. While downward field-aligned current canbe carried by ionospheric electrons without afield aligned potential drop (group 1) upwardcurrents of several pA/m^ require a fieldaligned potential drop. Over a certain potentialrange the field aligned current increasesproportional to the field aligned potentialdrop. This potential range depends on thecharacteristic electron energy and the altitudeof the top of the acceleration region. An upperlimit for the field aligned current density isreached when the field aligned potential drop canaccelerate all available electrons into the losscone. When this critical field aligned potentialdrop V||£ is reached the acceleration region hasto move to higher altitude to reach moreelectrons or a saturation current will flow.
An example from Viking observations at 7000 kmaltitude above and in the acceleration region of
a westward travelling surge indicated a linearrelationship between the field aligned currentdensity and the field aligned potential dropbelow the satellite. The characteristic electronenergy was about 1keV.
An example from Viking observations at 2 REaltitude above the acceleration region of a 14MLT aurora showed that the acceleration regiondid not move to altitudes above 1Rg. The fieldaligned potential drop was stronger than thecritical field aligned potential drop that isneeded to accelerate the available electrons at!RE with T x 200 eV into the loss cone. Thisindicated that a saturation current was flowing.
As in auroral regions characteristic electronenergy of only few hundreds eV is not anexception and the top of the acceleration regionwas often found to be located near 1Rg or evenbelow, a saturation current might be a commonfeature in discrete auroral arcs, produced byprecipitating electrons of several keV.
In the case of a linear relationship between thefield aligned current density and potential drop,the strongest current density can be expected inthe region of the strongest field alignedpotential drop, which would be for a 17 and Vshaped potential in the center of the arc.Observations however show often an enhancedfield aligned current density at the edge and amaximum of the field aligned potential drop inthe center of an auroral arc (for example Arnoldyet al. 1974, Réf. 26; Kintner et al. 1974, Réf.27; Bruning and Goertz 1985, Réf. 28). This iswhat one would expect when a saturation currentis flowing. The strong field aligned potentialdrop (stronger than VK;) in the center of anarc causes an enhanced ionospheric conductivity.Conductivity gradients at the edge of theprecipitation region cause either an electricpolarisation field or/and a divergent ionosphericcurrent that drives the field aligned current(see for example Marklund 1984, Réf. 29; Bruninget al. 1985, Réf. 20). An enhanced field alignedcurrent at the edge of the arc can be carried,because the electron source density is higherthan in the center of the arc. This can be seenfrom Figure 3. The strongest field alignedcurrent density (panel 1) and enhanced electronsource densities (panel 4) were observed between134330 and 1344 UT, when Viking passed above theequatorward edge of the current sheet. The fieldaligned potential drop (panel 2) was strongestbetween about 1344 and 134630 UT, where theelectron source density was reduced.
Open questions arising with the observation of -asaturation current are*. How can the potentialdrop increase above VUQ? Why does the top ofthe field aligned potential drop not move tohigher altitudes which could increase VHJ; andthe current density?
5. ACKNOWLEDGEMENTS
This work was supported by an ESA fellowship.The Viking project was managed and operated bythe Swedish Space Corporation under contract fromthe Swedish Board for Space Activities. Theauthor thanks L. P. Block for helpful discussionsand T. A. Potemra for providing the magneticfield data. The Viking magnetic field experimentis supported by the office of Naval Research.

108 K. BRÙNING
6. REFERENCES
1. Knight S 1973, Parallel electric fields,Planet. Space Sci. 21, 741-750.
2. Lemaire J & Scherer H 1974,lonosphere-plasmasheet field-aligned currentsand parallel electric fields, Planet. SpaceSci. 22, 1485-1490.
3. Lundin R Ei Sandahl I 1978, Somecharacteristics of the parallel electricfield acceleration of electrons over discreteauroral arcs as observed from two rocketflights, ESA SP- 13, 125-136.
4. Fridman M & Lemaire J 1980, Relationshipbetween auroral electron fluxes andfield-aligned electric potential differences,J. Ceophvs. Res. 85, 664-670.
5. Lyons L R 1980, Generation of large-scaleregions of auroral currents, electricpotentials and precipitation by thedivergence of the convection electric field,J. Geophvs. Res. 8j>, 17-24.
6. Wilhelm K et al 1981, Observations offield-aligned current sheets above discreteauroral arcs, J. Geophvs. 49, 128-137.
7. Bruning K 1983, Zusammenhang feldlinien •paralleler Strôme mit den elektrischenFeldparametern und der Polarlichtteil-chenpopulation in diskretenPolarlichtbogen, Dissertation Univ. Munster.
8. Fàlthammar C-G 1978, Problems related tomacroscopic electric fields in themagnetosphere, Astrophvs. Space. Sci.. 55,179-201.
9. Lyons L R et al 1979, An observed relationbetween magnetic field aligned electricfields and downward electron energy fluxes inthe vicinity of auroral forms, J. Geophys.Res., 84, 457-461.
10. Lyons L R 1981, Discrete aurora as the directresult of an inferred high-altitudegeneration potential distribution, J.Geoehvs . Reg. 86, 1-8.
11. Menietti JDS, Burch J L 1981, A s,investigation of energy flux and inferredpotential drop in auroral electronenergy spectra, Geophvs. Res. Lett 8,1095-1098.
12. Lin C S S, Hoffman R A 1982, Observations ofinverted-V electron precipitation, SpaceSci. Rev. 33, 415-457.
13. Weiraer, D R et al 1987, The current- voltagerelationship in auroral current sheets, J.Geophys. Res., 92, 187-194.
14. Pottelette R H et al 1988, Vikingobservations of bursts of intense broadbandnoise in the source regions of auroralkilometric radiation, Annales Geophvsicae.6, 573-586.
15. Bahnsen A et ai 1987, Auroral hiss andkilometric radiation measured from the Vikingsatellite, Ceophvs. Res. Lett., 14. 471-474.
16. Evans D S 1984, The characteristics of apersistent auroral arc at high latitude inthe 1400 MLT sector, in : Polar Cusp, Ed. J AHoltet and A Egeland NATO ASI Series C:145,pp. 99-109.
17. Bruning K et al 1986, Dynamics of a discreteauroral arc, J. Geophvs. Res. 91, 7057-7064.
18. Kitayama et al 1988, Observational evaluationof a mechanism of the auroral electronacceleration, XXVII plenary meeting OE theCOSPAR conference, Espoo, Finland.
19. Sandahl I et al 1980. Electron spectra OVKJdiscrete auroras as measured by thesubstorm-GEOS rockets, ESA-SP-154. 257-262.
20. Tanskanen P J et al 1981, Spectralcharacteristics of precipitating electronsassociated with visible aurora in thepreraidnight oval during periods of substormactivity, J . Geophys. Res. 86, 1379-1395.
21. Reiff P H et al 1988, Determination ofauroral electrostatic potentials using highand low-altitude particle distributions, .LCeophvs. Res., 93, 7441-7465.
22. Rees M H, 1983, Auroral ionization andexcitation by incident energetic electrons,Planet. Space Sci. 11, 1209-1218.
23. Murphree J S et al 1981, Characteristics ofthe instantaneous auroral oval in the1200-1800 HLT sector, J. Geophvs. Res. 86,7657-7668.
24. Opgenoorth H J et al 1988, Coordinatedobservations with EISCAT and the VikingSatellite - The decay of a westwardtravelling surge, subm. to J. Geophvs. Res.
25. Bruning K et al 1989, Viking observationsabove a post noon aurora, subm. to J_.Geophys. Res. 94.
26. Marklund G 1984, Auroral arc classificationscheme based on the observed arc associatedelectric field pattern, Planet Space Sci..32, 193-211.
27. Bruning, K et al 1985, Why does theperpendicular electric field increase at theedge of auroral arcs? Adv. Space Res. 5,79-82.
28. Arnoldy R L 1977, The relationship betweenfield-aligned current carried by suprathermalelectrons, and the auroral arc, Geouhvs.Res. Lett. 4, 407 -410.
29. Kiritner, P M Jr et al 1974, Current system inan auroral substorm, J Geophvs. Res. 79,4326-4330.
30. Bruning, K E< Goertz, C K 1985, Influence ofthe electron source distribution on fieldaligned currents, GeoDhvs. Res. Lett., 12,53-56.
If)Q/1 J 7 , .
SESSION 6NEW TECHNIQUES & INSTRUMENTS
Chairmen:D. Huguenin
B.N. Andersen
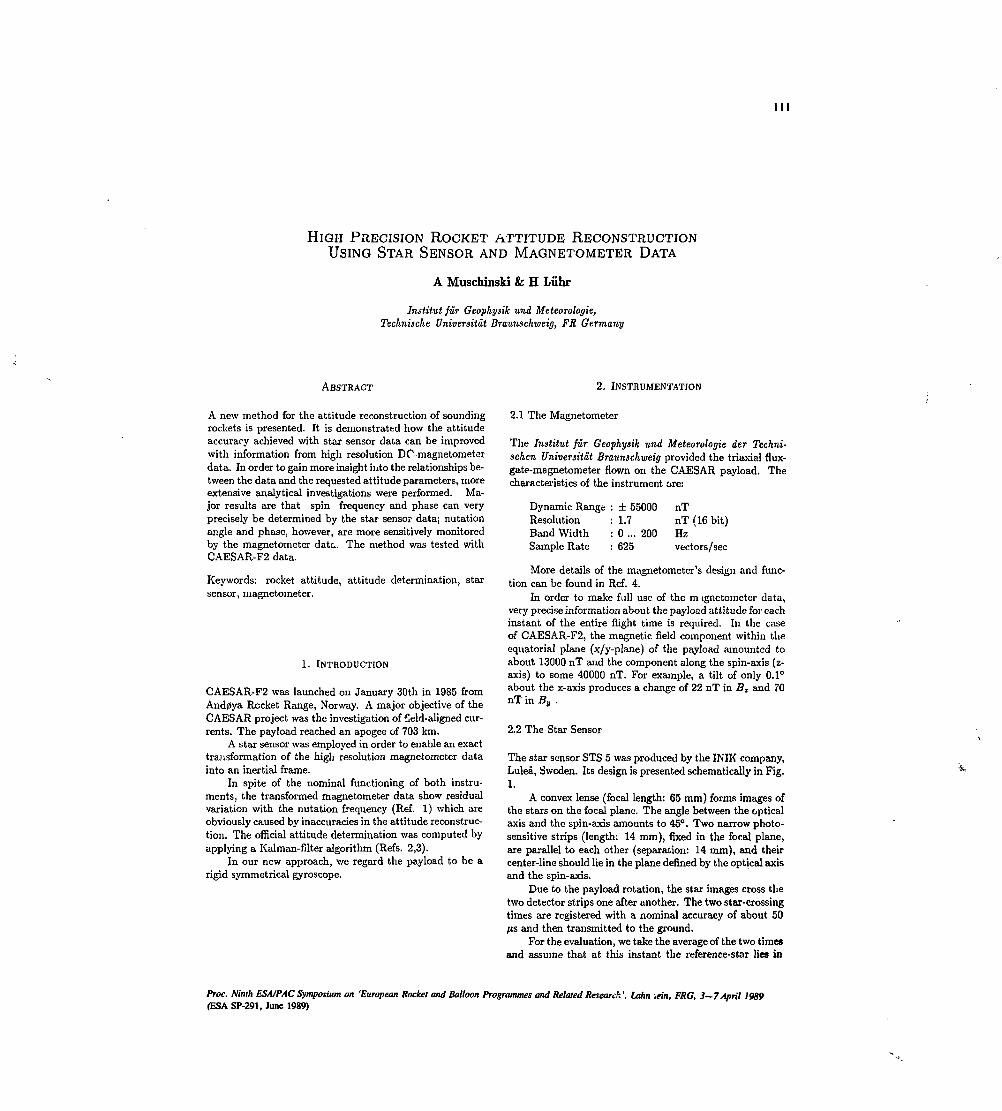
I l l
HIGH PRECISION ROCKET ATTITUDE RECONSTRUCTIONUSING STAR SENSOR AND MAGNETOMETER DATA
A Muschinski & H Liihr
Institut fur Geophysik und Météorologie,Technische Universitdt Braunschweig, FR Germany
ABSTRACT 2. INSTUUMENTATION
A new method for the attitude reconstruction of soundingrockets is presented. It is demonstrated how the attitudeaccuracy achieved with star sensor data can be improvedwith information from high resolution DO-magnetometerdata. In order to gain more insight into the relationships be-tween the data and the requested attitude parameters, moreextensive analytical investigations were performed. Ma-jor results are that spin frequency and phase can veryprecisely be determined by the star sensor data; nutationangle and phase, however, are more sensitively monitoredby the magnetometer data. The method was tested withCAESAR-F2 data.
Keywords: rocket attitude, attitude determination, starsensor, magnetometer.
1. INTRODUCTION
CAESAR-F2 was launched on January 30th in 1985 fromAnd0ya Rocket Range, Norway. A major objective of theCAESAR project was the investigation of field-aligned cur-rents. The payload reached an apogee of 703 km.
A star sensor was employed in order to enable an exacttransformation of the high resolution magnetometer datainto an inertial frame.
In spite of the nominal functioning of both instru-ments, the transformed magnetometer data show residualvariation with the nutation frequency (Réf. 1) which areobviously caused by inaccuracies in the attitude reconstruc-tion. The official attitude determination was computed byapplying a Kalman-filter algorithm (Refs. 2,3).
In our new approach, we regard the payload to be arigid symmetrical gyroscope.
2.1 The Magnetometer
The Institut fur Geophysik und Météorologie der Techni-schen Vniversitat Braunschweig provided the triaxial flux-gate-magnetometer flown on the CAESAR payload. Thecharacteristics of the instrument ore:
Dynamic RangeResolutionBand WidthSample Rate
: ± 55000 nT: 1.7 nT (16 bit): O ... 200 Hz: 625 vectors/sec
More details of the magnetometer's design and func-tion can be found in Réf. 4.
In order to make Rill use of the magnetometer data,very precise information about the payload attitude for eachinstant of the entire flight time is required. In the caseof CAESAR-F2, the magnetic field component within theequatorial plane (x/y-plane) of the payload amounted toabout 13000 nT and the component along the spin-axis (z-axis) to some 40000 nT. For example, a tilt of only 0.1°about the x-axis produces a change of 22 nT in B1 and 70nT in By .
2.2 The Star Sensor
The star sensor STS 5 was produced by the INIK company,Luleâ, Sweden. Its design is presented schematically in Fig.1.
A convex lense (focal length: 65 mm) forms images ofthe stars on the focal plane. The angle between the opticalaxis and the spin-axis amounts to 45°. Two narrow photo-sensitive strips (length: 14 mm), fixed in the focal plane,are parallel to each other (separation: 14 mm), and theircenter-line should lie in the plane defined by the optical axisand the spin-axis.
Due to the payload rotation, the star images cross thetwo detector strips one after another. The two star-crossingtimes are registered with a nominal accuracy of about 50/<s and then transmitted to the ground.
For the evaluation, we take the average of the two timesand assume that at this instant the reference-star lies in
Proc. Ninth ESAIPAC Symposium on 'European Rocket and Balloon Programmes and Related Research', LaHn iein, FRG. 3—7 April 1989(ESA SP-291, June 1989)

112 A. MUSCHINSKI
the plane defined by the center-line of the strips and theoptical axis. Henceforth, this plane is called the "star sensorplane".
OPT» CAl-
FIGURE 1. Design of the star sensor STS 5 (INIK).
3. THE MATHEMATICAL MODEL
To describe the motion of a payload as a symmetrical rigidgyroscope mathematically, we introduce the space-fixedLRST-system and the payload-fixed J5T3M-system as follows(see Fig. 2):
The z-axis of the space-fixed £55r-system is parallelto the angular momentum vector, and its equatorial planeis oriented in a way that the reference-star lies in the x/z-plane. The angle between the beam to the star and theequatorial plane of LRST is called the "aspect angle" 7 .
The payload-fixed .ffîM-frame is defined by the mainaxes of inertia. The z-axis is identical to the axis of thesmallest moment of inertia. Since the ellipsoid of inertiais assumed to be symmetrical relative to this axis, we canorient the equatorial plane of the HTA in a way that itsz/z-plane is identical to the nominal star sensor plane.
It may be necessary to introduce a second payload-fixed frame which defines the attitude of the real star sensorplane with respect to the nominal one. This frame is calledthe star sensor frame STS, and we obtain it by inclining theHTA-îrame about its x-axis through a small misalignmentangle K. Therefore, the i/z-plane of STS is identical to thereal star sensor plane.
The attitude of the 5IT5-frame relative to the space-fixed LRST-frame is given by the following time-dependentmatrix:
where
</>(*) = ftt + Voi9 = const.
r)(t) = ui + 770K = const.
(1)
(2)(3)(4)(5)
The matrix is composed of four single rotations. V de-notes the nutation phase ang!a variing with the nutationfrequency ft, rf the half-angle of the nutation cone (shorter"coning angle") and t] the body rotation phase angle whichvaries with the body rotation frequency o>. The first threerotations (through ^, $ and ri) describe the well-knownspin and nutation motion of a symmetrical gyroscope. Thefourth rotation corrects the star sensor misalignment.
Whenever the reference-star is seen by the star sensor,the star lies in the x/z-plane of STS, and the y-componentof the star location in the STS-hame must vanish:
ysrs(ti) = O, (6)
where i; denotes the detection time within the zth rotation.Furthermore, two subconditions have to be fulfilled be-
cause the field of view is limited to an approximately 12°wide range in elevation. The x- and z-components of thestar location both have to be positive:
XSTS(Ii) > O
*srs(ti) > O(7)(8)
The coordinates of the reference-star with respect toLRST are given by the definitions of LRST itself and theaspect angle 7:
'cos 7= I O
LRST sin 7
Using Eq. 1 and Eq. 9, we can construct the time-depen-dent t/srs-coniponent of the reference-star as a function ofthe five angles 7, /c, TJ, i? and V>-
We used an approximative solution for the requesteddetection times ti which provides sufficient accuracy forsmall coning angles $:
[ sin 0 tan 7! / tanK . A . .+ - TrT^ (c o s^~: - smtH . (10)[ w + fi J V tan7 /
The approximation error of Eq. 10 can be estimated by
fqPprox f .
* *Sin2»?
(11)
In the case of CAESAR-F2, the approximation error issmaller than 14 fis. A detailed derivation of Eq. 10 canbe found in Réf. 5.
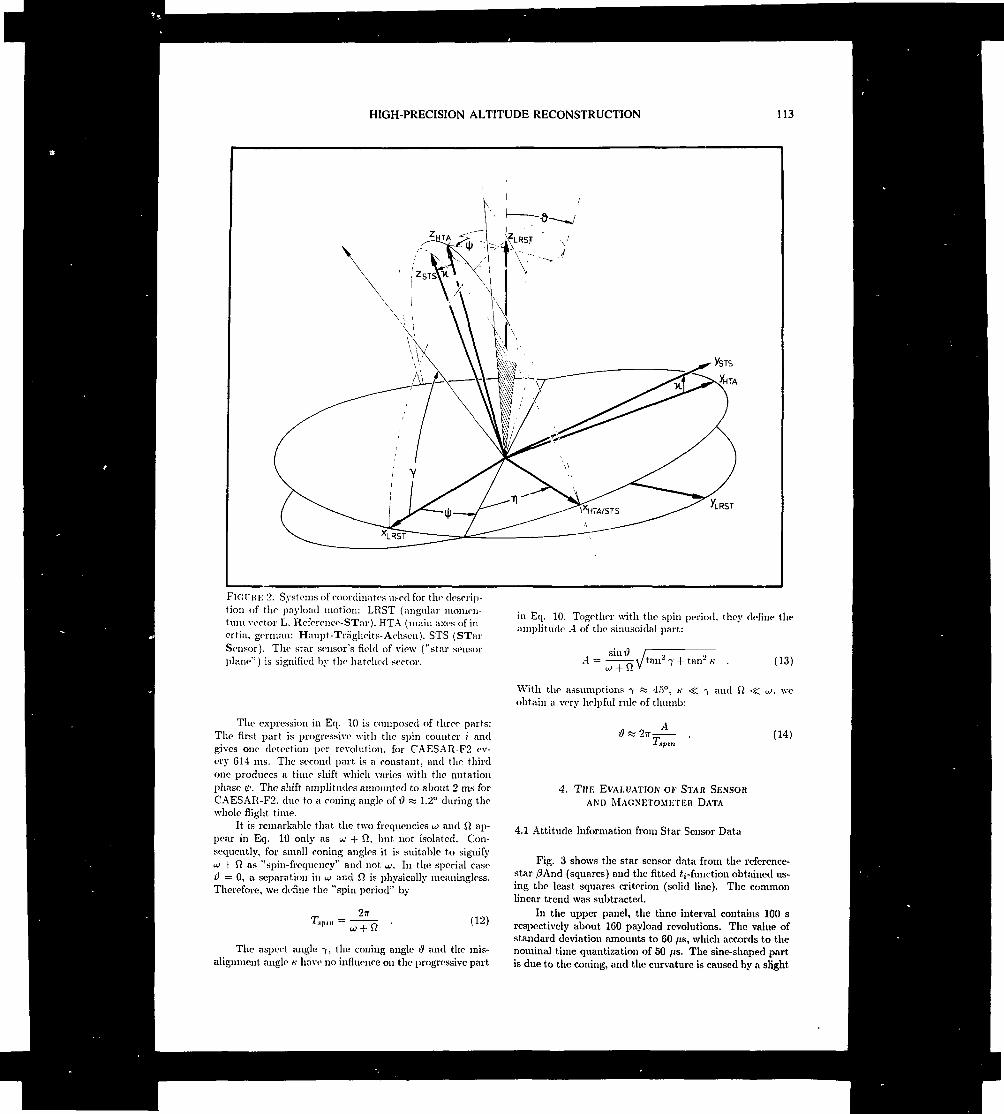
HIGH-PRECISION ALTITUDE RECONSTRUCTION 113
^LRST
FlCiUHF, 2. Systems of coordinates used for the descrip-tion of the payload motion: LRST (angular momen-tum vector L. Rcfercncc-STar). HTA (main axes of in-ertia, gennan: Haupt-Tragheits-Achsen). STS (STarSensor). The star sensor's field of view ("star sensorplane") is signified by the hatched sector.
The expression in Eq. 10 is composed of three parts:The first part is progressive with the spin counter i andgives one detection per revolution, for CAESAR-F2 ev-ery 614 ms. The second part is a constant, and the thirdone produces a time shift which varies with the nutationphase <l<. The shift amplitudes «mounted to about 2 ms forCAESAR-F2. due to a coning angle of ô K 1.2° during thewhole flight time.
It is remarkable that the two frequencies u> and Q ap-pear in Eq. 10 only as u; + fi, but not isolated. Con-sequently, for small coning angles it is suitable to signifyuJ + fl as ''spin-frequency" and not u. In the special caseû = O, a separation in ui and fi is physically meaningless.Therefore, we define the "spin period" by
in Eq. 10. Together with the spin period, they define theamplitude A of the sinusoidal part:
A =sint?
/tan2 7+ tan1 K . (13)
With the assumptions 7 « 45°, K <S 7 and Q -^ ui, weobtain a very helpful rule of thumb:
(14)T•*• apin
T.n,n = (12)
The aspect angle 7, the coning angle i? and the mis-alignment angle K have no influence on the progressive part
4. THK EVALUATION or STAR SENSORAND MAGNETOMETER DATA
4.1 Attitude Information from Star Sensor Data
Fig. 3 shows the star sensor data from the reference-star /3And (squares) and the fitted 2,-function obtained us-ing the least squares criterion (solid line). The commonlinear trend was subtracted.
In the upper panel, the time interval contains 100 srespectively about 160 payload revolutions. The value ofstandard deviation amounts to 60 /is, which accords to thenominal time quantization of 50 /is. The sine-shaped partis due to the coning, and the curvature is caused by a slight
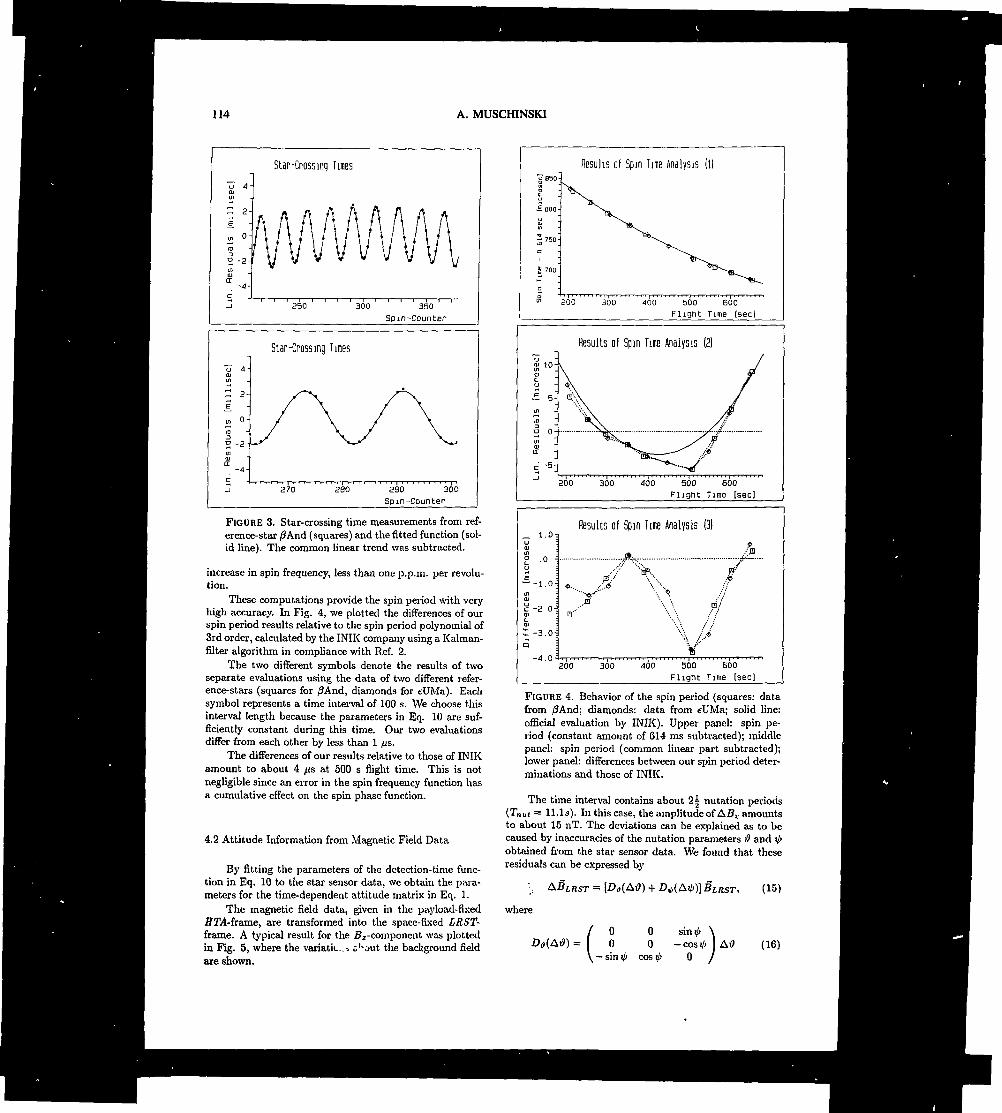
114 A. MUSCHINSKI
Star-Crossing Tinesu AOJen
H 2-
ZL
B, O-
ru13
H -2-inQ)Œ
-4-
250 300 350Spin-Counter
Star-Crossing fines
270 280 290 300Spin-Counter
FIGURE 3. Star-crossing time measurements from ref-erence-star /JAnd (squares) and the fitted function (sol-id line). The common linear trend was subtracted.
increase in spin frequency, less than one p.p.m. per revolu-tion.
These computations provide the spin period with veryhigh accuracy. In Fig. 4, we plotted the differences of ourspin period results relative to the spin period polynomial of3rd order, calculated by the INIK company using a Kalman-filter algorithm in compliance with Réf. 2.
The two different symbols denote the results of twoseparate evaluations using the data of two different refer-ence-stars (squares for /3And, diamonds for eUMa). Eachsymbol represents a time interval of 100 s. We choose thisinterval length because the parameters in Eq. 10 are suf-ficiently constant during this time. Our two evaluationsdiffer from each other by less than 1 ,us.
The differences of our results relative to those of INIKamount to about 4 fis at 500 s flight time. This is notnegligible since an error in the spin frequency function hasa cumulative effect on the spin phase function.
4.2 Attitude Information from Magnetic Field Data
By fitting the parameters of the detection-time func-tion in Eq. 10 to the star sensor data, we obtain the para-meters for the time-dependent attitude matrix in Eq. 1.
The magnetic field data, given in the payload-fixedHTA-hame, are transformed into the space-fixed LRST-frame. A typical result for the fix-component was plottedin Fig. 5, where the variati<-..-> s^out the background fieldare shown.
Results of Spin lime Analysis
200 300 400 500 600
Flight Time (sec!
Results of Spin THE Analysis (2)a 10-
£ 5-
200 300 400 500 600Flight Time [seel
~ 1.0-
•0 ]
~ -1.0-
-2 O-
Results of Spin Time Analysis (3)
X--'
..- .«
V"200 300 400 500 BOO
Flignt Time tsecl
FIGURE 4. Behavior of the spin period (squares: datafrom /ÎAnd; diamonds: data from «UMa; solid line:official evaluation by INIK). Upper panel: spin pe-riod (constant amount of 614 ms subtracted); middlepanel: spin period (common linear part subtracted);lower panel: differences between our spin period deter-minations and those of INIK.
The time interval contains about 2 5 nutation periods(Taut = ll.ls). In this case, the amplitude of AB1. amountsto about 15 nT. The deviations can be explained as to becaused by inaccuracies of the nutation parameters & and 0obtained from the star sensor data. We found that theseresiduals can be expressed by
where
(=
\
[Da( Arf) + Z>v,(A0)] BLKST, (15)
O O sin0 \O O - cos 0 I AiJ (16)
~sin0 cos0 O /
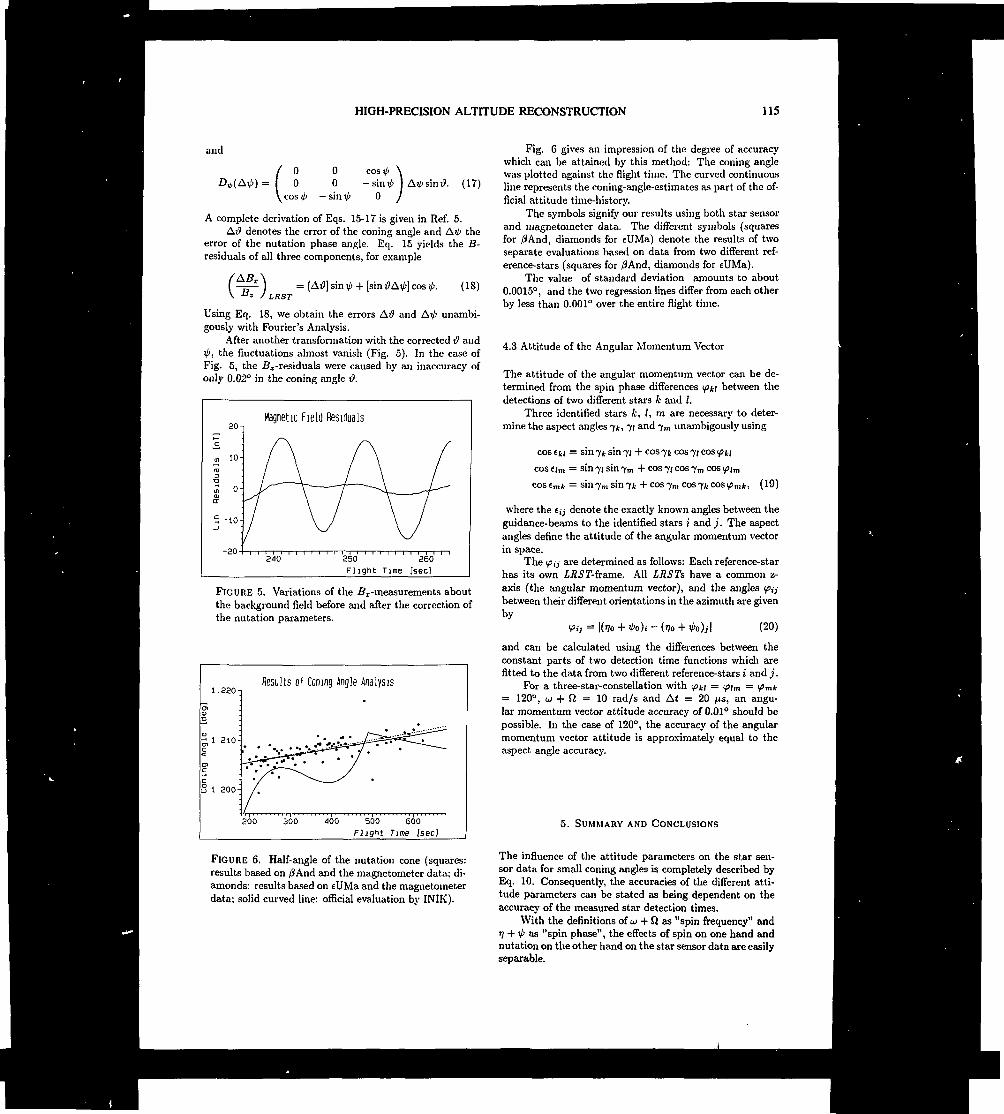
HIGH-PRECISION ALTITUDE RECONSTRUCTION 115
and
O cos t/> \
O -sinî/> I- sin 0 O /
'• (17)
A complete derivation of Eqs. 15-17 is given in Réf. 5.Ai) denotes the error of the coning angle and A^> the
error of the nutation phase angle. Eq. 15 yields the B-residuals of all three components, for example
-=-î J = [Ai9] sin^ + [sinOA^] cos i/>. (IS)"' /LRST
Using Eq. 18, we obtain the errors At? and AÎ/> unambi-gously with Fourier's Analysis.
After another transformation with the corrected t? andV>, the fluctuations almost vanish (Fig. 5). In the case ofFig. 5, the Bx-residuals were caused by an inaccuracy ofonly 0.02° in the coning angle rf.
Magnetic Field Residuals
-30240 250 260
Flight Time [sec]
FIGURE 5. Variations of the fix-measurements aboutthe background field before and after the correction ofthe nutation parameters.
1.220-,
- 1 210-
o 1 200-
Hesults of Coning Angle Analysis
200 300 400 500 EOO
Flignt Time [sec]
FIGURE 6. Half-angle of the nutation cone (squares:results based on /JAnd and the magnetometer data; di-amonds: results based on eUMa and the magnetometerdata; solid curved line: official evaluation by INIK).
Fig. 6 gives an impression of the degree of accuracywhich can be attained by this method: The coning anglewas plotted against the flight time. The curved continuousline represents the coning-angle-estimates as part of the of-ficial attitude time-history.
The symbols signify our results using both star sensorand magnetometer data. The different symbols (squaresfor /JAnd, diamonds for eUMa) denote the results of twoseparate evaluations based on data from two different ref-erence-stars (squares for /JAnd, diamonds for eUMa).
The value of standard deviation amounts to about0.0015°, and the two regression lines differ from each otherby less than 0.001° over the entire flight time.
4.3 Attitude of the Angular Momentum Vector
The attitude of the angular momentum vector can be de-termined from the spin phase differences (fu between thedetections of two different stars k and /.
Three identified stars k, I, m are necessary to deter-mine the aspect angles 71;., 71 and 7,,, unambigously using
cos EK = sin jii sin 71 + cos 74. cos 71 cos tpu
cos elm = sin -/, sin 7m + cos 71 cos -ym cos tflm
cos Em* = sin 7m sin 71. + cos 7m cos 7* cos <pmi,, (19)
where the etj denote the exactly known angles between theguidance-beams to the identified stars z and j. The aspectangles define the attitude of the angular momentum vectorin space.
The <fij are determined as follows: Each reference-starhas its own LRST-ha.me. All LRSTs have a common z-axis (the angular momentum vector), and the angles ^ybetween their different orientations in the azimuth are givenby
Vi1 = lO/o + ^o )i - (T]O + V-o )j I (20)
and can be calculated using the differences between theconstant parts of two detection time functions which arefitted to the data from two different reference-stars i and j.
For a three-star-constellation with <pu = <fi,n = <pmii= 120°, u; + O = 10 rad/s and At = 20 ps, an angu-lar momentum vector attitude accuracy of 0.01° should bepossible. In the case of 120°, the accuracy of the angularmomentum vector attitude is approximately equal to theaspect angle accuracy.
5. SUMMARY AND CONCLUSIONS
The influence of the attitude parameters on the star sen-sor data for small coning angles is completely described byEq. 10. Consequently, the accuracies of the different atti-tude parameters can be stated as being dependent on theaccuracy of the measured star detection times.
With the definitions of w + ft as "spin frequency" andT) + V> as "spin phase", the effects of spin on one hand andnutation on the other hand on the star sensor data are easilyseparable.
116 A. MUSCHINSKI
The parameters concerning the nutation are resolvedmore sensitively by the magnetometer than by the star sen-sor (compare Eq. 10 and Eq. 18).
We think that these results are interesting not onlyfor the interpretation of magnetometer data. The systemstar sensor/magnetometer is an effective tool for investigat-ing the dynamical behavior of sounding rockets in general,especially for studying "small" effects such as boom oscilla-tions, slight changes in the mass distribution (for examplecontraction due to the cooling, see Fig. 4), deviations froma symmetrical ellipsoid of inertia, air drag and gravity drift.
We plan to apply the described evaluation methodto the star sensor and magnetometer data from the fourROSE-payloads which were flown from And0ya (Norway)and Esrange (Sweden) in winter 1988/89.
6. REFERENCES
1 WlLHELM K ET AL. 19S7, CAESAR investigations -Final report on the scientific aspects, MPAE-W47-87-13,29-41, Max-Planck-Institut fur Aeronomie, Lindau.
2 SCHMIDTBAUEH B 1978, High-accuracy soundingrocket attitude estimation using star sensor data,IEEE Trans. Aerosp. Electr. Syst. AE S-14, 891-898.
3 GUSTAFSSON T 1986, Attitude reconstitution of CAE-SAR-F2 based on star sensor information, INIK, Lu-leâ, Sweden.
4 THEILE B, LUIIR H 1976, Magnetfeldmessungen anBord von Hôhenforschungsraketen, RaumfahrtfoT-schung 20, 301-305.
5 MUSCHINSKI A 1989, Lagebestimmung von Hohenfor-schungsraketen mit SternsensoT- und Magnetometer-daten (Diplomarbeit), Institut fur Geophysik und Mé-téorologie der Technischen Universitat Braunschweig.
117
THE SN 1937A ATTITUDE CONTROL SYSTEM
J. Turner ** Under DFVLR contract
DFVLR OberpfaffenhofenHauptabteilung Angewandte Datentechnik
ABSTRACT
The German Supernova 1987A sounding rocketmission required the development of an attitudecontrol system and the refurbishment and launchof a payload within a period of less than sixmonths. The ACS comprised an inertial platformwith a star tracker and two stellar TV cameraswith ground based interactive telecommand forupdate and fine pointing. The ground and flighttelecommand systems were based on the 8052 and8031 microcontrollers respectively and providedprecise offsets for the various manoeuvres,automatic mode control and the facility for in-flight corrections and the remote selection ofredundant operational modes. This report coversthe development, test, operation and flightperformance of the ACS for the project SUPERNOVA.
Keywords: Supernova 1987A, sounding rocket,attitude control, telecommand, stellar television
1. Introduction
The discovery of supernova 1987 A on the 23rd ofFebruary '87 marked the beginning of considerableactivity by scientists around the world, togather first hand data on the development of thisphenomenon, and presented the sounding rocketcommunity with a unique opportunity todemonstrate that even for astronomy, soundingrockets still have a part to play. The currentlack of operational spacecraft with telescopesfor EUV and X-ray detection meant that the onlypossibility for exoatmospheric research with highresolution, position resolving detectors, duringthe most interesting first few months of thedevelopment of the supernova, was to refurbish,modify and launch existing sounding rockethardware. On the 2nd of March, the. Max PlanckInstitute for Astronomy in Garching suggested thepossibility of refurbishing the ASTRO 4/2 payloadwhich comprised a 32 cm Wolter telescope with aposition resolving, low energy X-ray detector.This payload had been constructed in 1977/78 andlaunched from Woomera Australia in February 1979to obtain X-ray images of Puppis and the Crabnebula. The attitude control system (ACS) forthis payload had been developed by the DFVLR and
comprised an inertial platform with star tracker,star television and telecommand system. Thequestion was whether this payload could berefurbished and modified for a launch as early asJuly or August of the same year.
2. System Requirements
The Supernova ACS was required to point theWolter telescope of the refurbished ASTRO 4/2payload accurately (< 2 arc minutes) at thesupernova 1987A. It was also decided to make ashort observation of the nearby X-ray sourceLMC-Xl to provide a positive test and calibrationof the telescope, detector and pointing system,in case an unexpectedly low X-ray activity of thesupernova should cast doubt on the correctfunctioning of the flight systems.
Although the original ACS could have beenrefurbished, for a number of reasons it wasdecided to develop a new system, despite theextremely short preparation time from projectstart in early April until launch at the end ofAugust. This decision was a tradeoff between therisks of developing and constructing a totallynew system in less than a third of the timenormally available, and that of refurbishing andmodifying a ten year old system. A furtherconsideration was the fact that, in the event ofinteresting scientific results, this payload andexperiment was likely to be reflown several timesand many of the subsystems developed by us overthe past ten years could be readily modified for,this mission and would result in a better andmore reliable system and particularly an easiersystem to calibrate, launch and refurbish.
3. Design Constraints
The choice of sensors was limited to thoseavailable in house or obtainable within one totwo months. The sensors in question included aMIDAS Analog inertial platform, a 3 axis rategyro package, an ITT star tracker (17 years oldand 6 flights) and a low light TV camera. As theaccuracy of the MIDAS platform is typically 1-2degrees, over a normal flight period, the use ofoptical sensors for star updating was essential.
Proc. Ninth ESAiPAC Symposium on 'European Rocket and Balloon Programmes and Related Research ', Lahnstein, FRG, 3—7 April 1989(ESA SP-291, June 1989)

118 J. TURNER
The nearest suitable guide star to the supernova(brighter than magnitude +3.5) w-s Alpha Pictorand this was approximately 10.4 degrees from thetwo targets. This offset between the target andguide star meant that with the star trackerlocked on the guide star, any motion or pointingerror in the roll axis would significantlydegrade the target pointing performance. The rollmotion effect on the target pointing was roughly10 arc minutes per degree of roll error. Thiscross coupling effect is illustrated in Figure 1together with the ACS coordinate system.
dynamic performance was previously limited to alimit cycle amplitude of about 1 degree p-pbecause of a dead band in the MIDAS platform rollservo loop. This would have resulted in a rollgenerated, coupled lateral limit cycle motionerror of 10 arc minutes p-p which would have beenunacceptable. A solution to this problem wasprovided by the generation of a corrected rollsignal using a composite of the MIDAS roll servoand pickoff signals. This modification requiredadditional electronics which was not available inthe ASTRO 4/2 system.
«d TAURUS «CPICTOB 1887 A
* TABGET•
VIEWSTAR ^~-%~^ LOOKING AFT
TBACKEH + VAWBOLL TV
QUIOE STAR
*
+ VAWROLL TV
\0.4 Degrees
EFFECT OF ROLL MOTION ABOUT GUIDE STAB ON TABGET POINTING
Fig.l ACS Coordinate System
The only solution to this problem was to use twostars roughly 90 degrees apart and two opticalsensors. As only one star tracker was available,a TV camera with ground based interactive controlwas chosen as the second optical sensor element.This technique uses an operator to generate amanual correction of the platform drift from a TVstar image in real time and had been successfullyapplied on ASTRO 4/2. Although the absolute errorand particularly the dynamic performance is notas good as an automatic star tracker, the use ofthis method for the less sensitive roll axisoffered an adequate performance. Canopus, a muchbrighter star, would have been better for thestar tracker but was almost 20 degrees away andwould have resulted in an even greater rollcoupling problem and was therefore not used. Theguide star selected for TV roll control was AlphaTaurus.
In addition, the forementioned coupling problemdemanded a dramatic improvement in the rolldynamic performance of the ACS to avoiddisturbance of the fine lateral loops whichnormally provide a pointing stability of 20 arcseconds p-p with the star tracker. The roll
4. TV and Telecommand System
The ASTRO 4/2 TV camera was state of the art in1978 and used a vidicon tube with a single stageintensifier and comprised a pressurized camerahead and a separate signal processing unit. Thecomplete camera occupied a volume of about 5litres, weighed 8 kg and consumed 40 watts ofpower. This camera also operated with a non-standard scan rate of 5 frames per second becauseof the limited gain-bandwidth of the L-bandtelemetry previously used.
With the current availability of high bandwidthS-band telemetry, it was decided to investigatethe suitability of standard commerciallyavailable CCD cameras. After successful testingon real and simulated stars, a camera type wasselected and modified for flight use. In fact,two cameras were fitted, one with a 10 x 7.5° fovfor roll correction, and the other with a 6.6 x5° fov for possible lateral control in the eventof star tracker problems and supposing that thesupernova might still be bright enough for directboresighting. The physical (dimensions and powerconsumption of each of these cameras were lessthan 10% of those of the ASTRO 4/2 camera.
The flight telecommand system from ASTRO 4/2 wasalso state of the art in 1978 and comprised 6analog channels each with 10 bit resolution and 4target stores and consisted of 7 PCB cards. Theground encoder was based on an Intel 8080 micro-processor, which was no longer complete. It wasdecided to modify our 8031 flight processor,designed and successfully flown on INTERZODIAK I,to incorporate a modem link for input of theserial telecommand data from the 407.1 MHzreceiver. The resulting flight card consisted ofonly one single Europa card and provided 8 analogoutput channels of 12 bit resolution, multipletarget stores, 8 analog input channels also with12 bit resolution, 8 bit digital output and inputchannels, a backup target timer and the thresholdlogic for star tracker enable and coarse/fineswitching.
The ground system was also specially developedfor this mission and was based on a computerdesigned by the Telemetry Group of MORABA andwhich comprised an 8052 microprocessor, programm-able in BASIC and a terminal for entry ofdiscrete command offsets. A control console with5 "joy-sticks" for correction of the threeinertial and two star tracker offsets wasconstructed with additional switches for targetload enable, coarse/fine override, trackerdisable and target selection.
The ground equipment for the television comprisedsignal correctors, synch pulse separators and
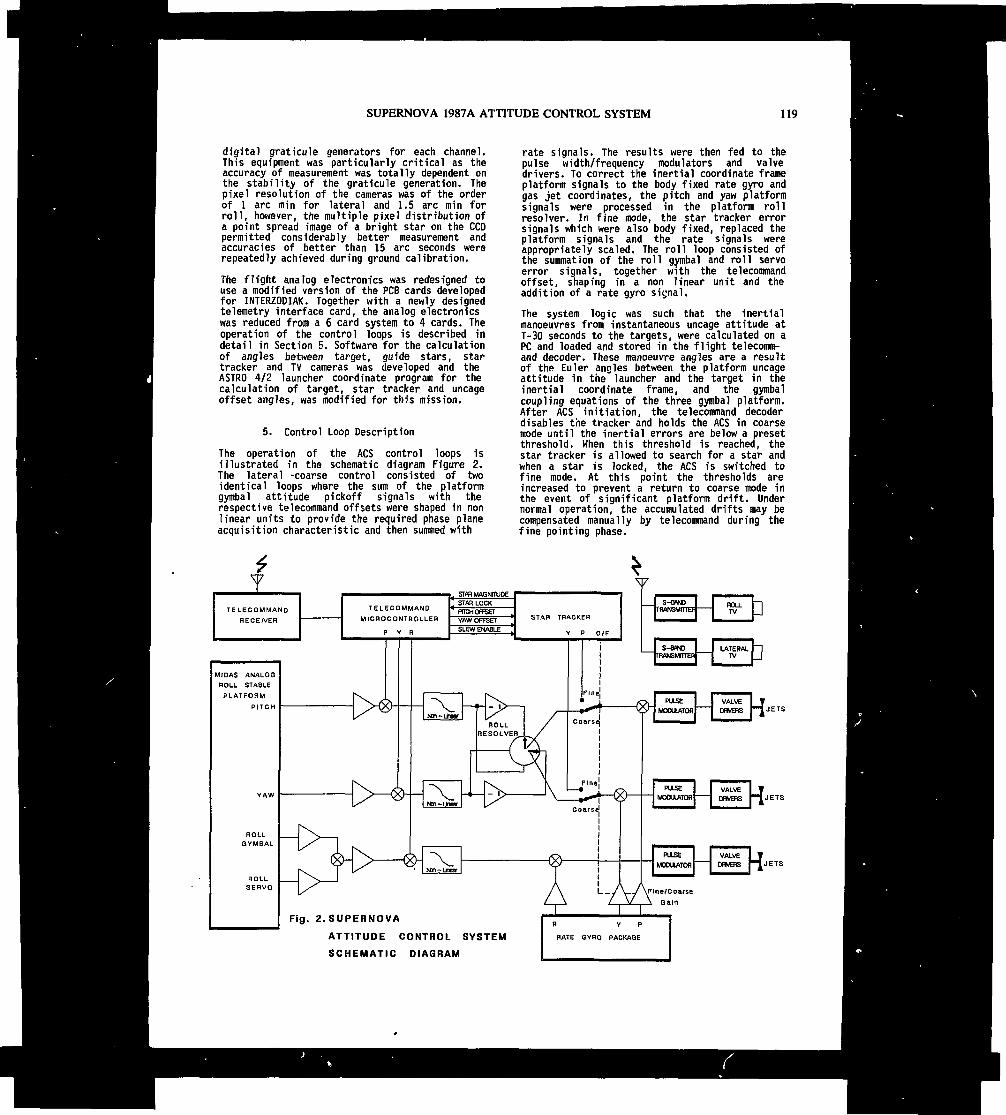
SUPERNOVA 1987A ATTITUDE CONTROL SYSTEM 119
digital graticule generators for each channel.This equipment was particularly critical as theaccuracy of measurement was totally dependent onthe stability of the graticule generation. Thepixel resolution of the cameras was of the orderof 1 arc min for lateral and 1.5 arc min forroll, however, the multiple pixel distribution ofa point spread image of a bright star on the CCDpermitted considerably better measurement andaccuracies of better than 15 arc seconds wererepeatedly achieved during ground calibration.
The flight analog electronics was redesigned touse a modified version of the PCB cards developedfor INTERZODIAK. Together with a newly designedtelemetry interface card, the analog electronicswas reduced from a 6 card system to 4 cards. Theoperation of the control loops is described indetail in Section 5. Software for the calculationof angles between target, guide stars, startracker and TV cameras was developed and theASTRO 4/2 launcher coordinate program for thecalculation of target, star tracker and uncageoffset angles, was modified for this mission.
5. Control Loop Description
The operation of the ACS control loops isillustrated in the schematic diagram Figure 2.The lateral -coarse control consisted of twoidentical loops where the sum of the platformgymbal attitude pickoff signals with therespective telecommand offsets were shaped in nonlinear units to provide the required phase planeacquisition characteristic and then summed with
rate signals. The results were then fed to thepulse width/frequency modulators and valvedrivers. To correct the inertial coordinate frameplatform signals to the body fixed rate gyro andgas jet coordinates, the pitch and yaw platformsignals were processed in the platform rollresolver. In fine mode, the star tracker errorsignals which were also body fixed, replaced theplatform signals and the rate signals wereappropriately scaled. The roll loop consisted ofthe summation of the roll gymbal and roll servoerror signals, together with the telecommandoffset, shaping in a non linear unit and theaddition of a rate gyro signal.
The system logic was such that the inertialmanoeuvres from instantaneous uncage attitude atT-30 seconds to the targets, were calculated on aPC and loaded and stored in the flight telecomm-and decoder. These manoeuvre angles are a resultof the Euler angles between the platform uncageattitude in the launcher and the target in theinertial coordinate frame, and the gymbalcoupling equations of the three gymbal platform.After ACS initiation, the telecommand decoderdisables the tracker and holds the ACS in coarsemode until the inertial errors are below a presetthreshold. When this threshold is reached, thestar tracker is allowed to search for a star andwhen a star is locked, the ACS is switched tofine mode. At this point the thresholds areincreased to prevent a return to coarse mode inthe event of significant platform drift. Undernormal operation, the accumulated drifts may becompensated manually by telecommand during thefine pointing phase.
Fig. 2.SUPERNOVA
ATTITUDE CONTROL SYSTEM
SCHEMATIC DIAGRAM
R
RATE
Y P
QYRO PACKAGE
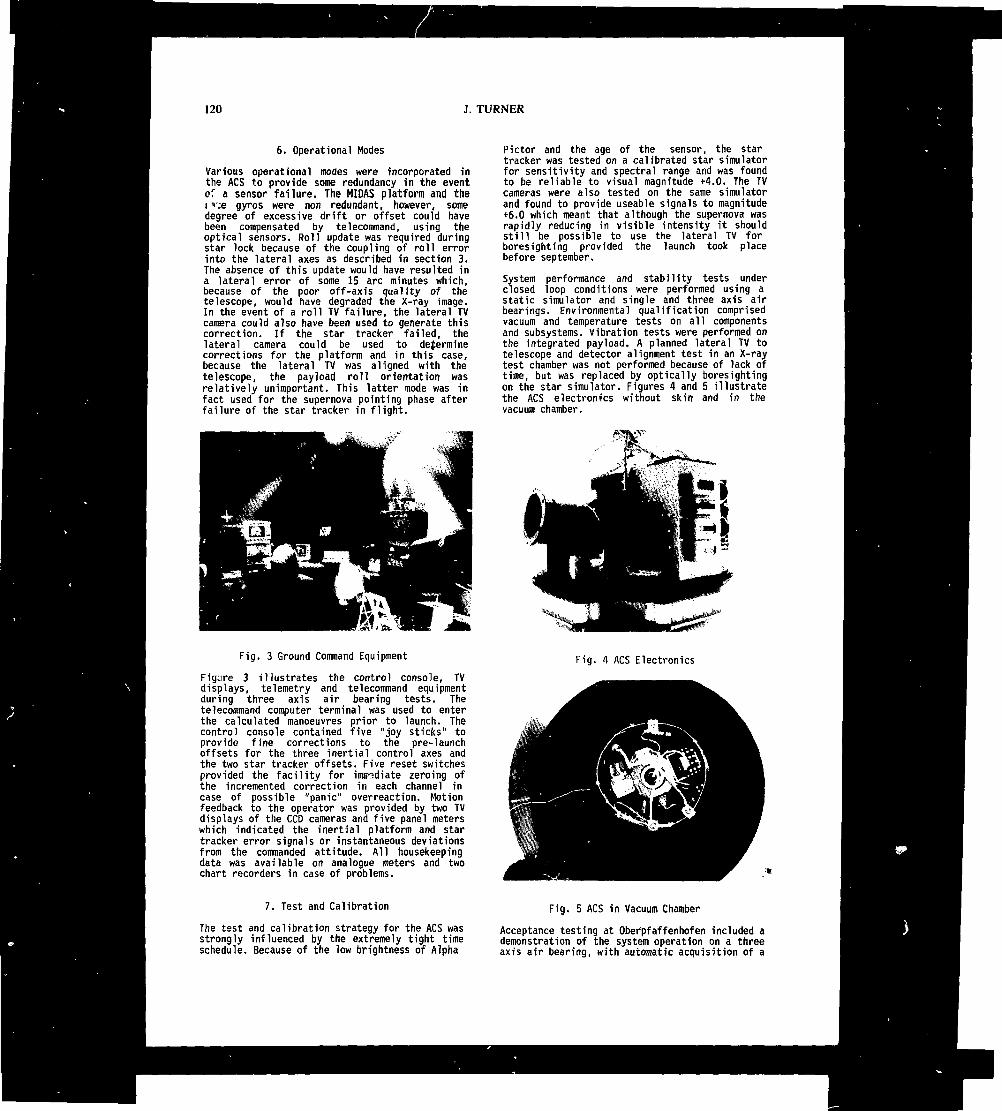
120 J. TURNER
6. Operational Modes
Various operational modes were incorporated inthe ACS to provide some redundancy in the eventof a sensor failure. The MIDAS platform and thei =>';e gyros were non redundant, however, somedegree of excessive drift or offset could havebeen compensated by telecommand, using theoptical sensors. Roll update was required duringstar lock because of the coupling of roll errorinto the lateral axes as described in section 3.The absence of this update would have resulted ina lateral error of some 15 arc minutes which,because of the poor off-axis quality of thetelescope, would have degraded the X-ray image.In the event of a roll TV failure, the lateral TVcamera could also have been used to generate thiscorrection. If the star tracker failed, thelateral camera could be used to determinecorrections for the platform and in this case,because the lateral TV was aligned with thetelescope, the payload roll orientation wasrelatively unimportant. This latter mode was infact used for the supernova pointing phase afterfailure of the star tracker in flight.
Pictor and the age of the sensor, the startracker was tested on a calibrated star simulatorfor sensitivity and spectral range and was foundto be reliable to visual magnitude +4.0. The TVcameras were also tested on the same simulatorand found to provide useable signals to magnitude+6.0 which meant that although the supernova wasrapidly reducing in visible intensity it shouldstill be possible to use the lateral TV forboresighting provided the launch took placebefore September.
System performance and stability tests underclosed loop conditions were performed using astatic simulator and single and three axis airbearings. Environmental qualification comprisedvacuum and temperature tests on all componentsand subsystems. Vibration tests were performed onthe integrated payload. A planned lateral TV totelescope and detector alignment test in an X-raytest chamber was not performed because of lack oftime, but was replaced by optically boresightingon the star simulator. Figures 4 and 5 illustratethe ACS electronics without skin and in thevacuum chamber.
Fig. 3 Ground Command Equipment
Figure 3 illustrates the control console, TVdisplays, telemetry and telecommand equipmentduring three axis air bearing tests. Thetelecommand computer terminal was used to enterthe calculated manoeuvres prior to launch. Thecontrol console contained five "joy sticks" toprovide fine corrections to the pre-launchoffsets for the three inertial control axes andthe two star tracker offsets. Five reset switchesprovided the facility for imrîdiate zeroing ofthe incremented correction In each channel incase of possible "panic" overreaction. Motionfeedback to the operator was provided by two TVdisplays of the CCD cameras and five panel meterswhich indicated the inertial platform and startracker error signals or instantaneous deviationsfrom the commanded attitude. All housekeepingdata was available on analogue meters and twochart recorders in case of problems.
Fig. 4 ACS Electronics
7. Test and Calibration
The test and calibration strategy for the ACS wasstrongly influenced by the extremely tight timeschedule. Because of the low brightness of Alpha
Fig. 5 ACS in Vacuum Chamber
Acceptance testing at Oberpfaffenhofen included ademonstration of the system operation on a threeaxis air bearing, with automatic acquisition of a
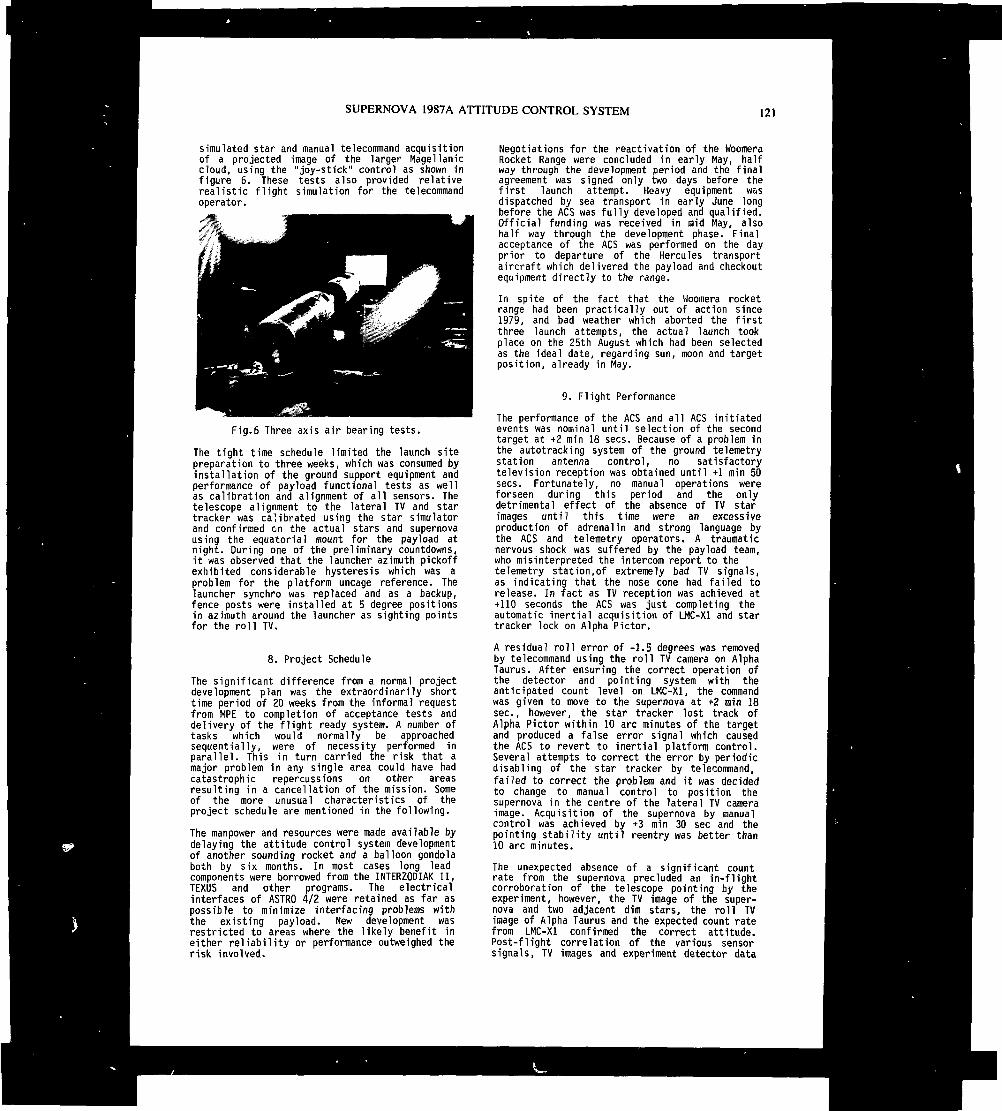
SUPERNOVA 1987A ATTITUDE CONTROL SYSTEM 121
simulated star and manual telecommand acquisitionof a projected image of the larger Magellaniccloud, using the "joy-stick" control as shown infigure 6. These tests also provided relativerealistic flight simulation for the telecommandoperator.
Fig.6 Three axis air bearing tests.
The tight time schedule limited the launch sitepreparation to three weeks, which was consumed byinstallation of the ground support equipment andperformance of payload functional tests as wellas calibration and alignment of all sensors. Thetelescope alignment to the lateral TV and startracker was calibrated using the star simulatorand confirmed on the actual stars and supernovausing the equatorial mount for the payload atnight. During one of the preliminary countdowns,it was observed that the launcher azimuth pickoffexhibited considerable hysteresis which was aproblem for the platform uncage reference. Thelauncher synchro was replaced and as a backup,fence posts were installed at 5 degree positionsin azimuth around the launcher as sighting pointsfor the roll TV.
8. Project Schedule
The significant difference from a normal projectdevelopment plan was the extraordinarily shorttime period of 20 weeks from the informal requestfrom MPE to completion of acceptance tests anddelivery of the flight ready system. A number oftasks which would normally be approachedsequentially, were of necessity performed inparallel. This in turn carried the risk that amajor problem in any single area could have hadcatastrophic repercussions on other areasresulting in a cancellation of the mission. Someof the more unusual characteristics of theproject schedule are mentioned in the following.
The manpower and resources were made available bydelaying the attitude control system developmentof another sounding rocket and a balloon gondolaboth by six months. In most cases long leadcomponents were borrowed from the INTERZODIAK II,TEXUS and other programs. The electricalinterfaces of ASTRO 4/2 were retained as far aspossible to minimize interfacing problems withthe existing payload. New development wasrestricted to areas where the likely benefit ineither reliability or performance outweighed therisk involved.
Negotiations for the reactivation of the WoomeraRocket Range were concluded in early May, halfway through the development period and the finalagreement was signed only two days before thefirst launch attempt. Heavy equipment wasdispatched by sea transport in early June longbefore the ACS was fully developed and qualified.Official funding was received in mid May, alsohalf way through the development phase. Finalacceptance of the ACS was performed on the dayprior to departure of the Hercules transportaircraft which delivered the payload and checkoutequipment directly to the range.
In spite of the fact that the Woomera rocketrange had been practically out of action since1979, and bad weather which aborted the firstthree launch attempts, the actual launch tookplace on the 25th August which had been selectedas the ideal date, regarding sun, moon and targetposition, already in May.
9. Flight Performance
The performance of the ACS and all ACS initiatedevents was nominal until selection of the secondtarget at +2 min 18 sees. Because of a problem inthe autotracking system of the ground telemetrystation antenna control, no satisfactorytelevision reception was obtained until +1 min 50sees. Fortunately, no manual operations wereforseen during this period and the onlydetrimental effect of the absence of TV starimages until this time were an excessiveproduction of adrenalin and strong language bythe ACS and telemetry operators. A traumaticnervous shock was suffered by the payload team,who misinterpreted the intercom report to thetelemetry station,of extremely bad TV signals,as indicating that the nose cone had failed torelease. In fact as TV reception was achieved at+110 seconds the ACS was just completing theautomatic inertial acquisition of LMC-Xl and startracker lock on Alpha Pictor.
A residual roll error of -1.5 degrees was removedby telecommand using the roll TV camera on AlphaTaurus. After ensuring the correct operation ofthe detector and pointing system with theanticipated count level on LMC-Xl, the commandwas given to move to the supernova at +2 min 18sec., however, the star tracker lost track ofAlpha Pictor within 10 arc minutes of the targetand produced a false error signal which causedthe ACS to revert to inertial platform control.Several attempts to correct the error by periodicdisabling of the star tracker by telecommand,failed to correct the problem and it was decidedto change to manual control to position thesupernova in the centre of the lateral TV cameraimage. Acquisition of the supernova by manualcontrol was achieved by +3 min 30 sec and thepointing stability until reentry was better than10 arc minutes.
The unexpected absence of a significant countrate from the supernova precluded an in-flightcorroboration of the telescope pointing by theexperiment, however, the TV image of the super-nova and two adjacent dim stars, the roll TVimage of Alpha Taurus and the expected count ratefrom LMC-Xl confirmed the correct attitude.Post-flight correlation of the various sensorsignals, TV images and experiment detector data

122 J. TURNER
from LMC-Xl as described in the followingsections, provided an attitude reconstitution tobetter than 2 arc minutes.
10. Attitude Reduction
The failure of the star tracker on the secondtarget necessitated the use of TV camera data forthe pointing accuracy analysis. Both camerasignals were recorded on UMATIC video recorders,however, the noise level of the recorded signalcoupled with the low brightness of the supernovaresulted in some difficulty in the post flightanalysis of individual frames. Noise reductionwas first performed by producing a second videotape from the master but with contrast enhance-ment and averaging of sequential frame pairs.This tape provided a much clearer image of thesupernova position. The processed video-tape wasthen fed through a titnebase corrector to a framefreezer on the VAX/IDL image processing systemdeveloped for the Giotto images. The relativepixel location of the supernova was determinedfor each second of operation in the controlledphase and was accurate to better than 2 arcminutes. From this it is apparent that thesupernova was within less than 10 arc minutes ofthe centre of the 40 arc minute field of view ofthe experiment detector for a period of fourminutes and the attitude reduction permits aposition correction of all photon counts to anaccuracy of the order of two arc minutes.
11. X-ray Image Correlation
Analysis of the photon count data from thedetector and their correlation with the motion ofthe payload was complicated by the the degradedoptical performance of the telescope whichresulted in a point spread function of severalarc minutes, particularly for off axis targets.In the case of the LMC-Xi pointing phase, thephoton count was relatively high in comparison tothe cosmic background. Also the limit cycleamplitude of guide star pointing was of the orderof 20 arc seconds peak to peak, so that thepointing error on the target was limited to theroll coupled motion element as the platform rollerror was corrected by telecommand. In effect, afirst order correction to the order of a few arcminutes was possible at the range with simplemeans and the high count rate produced an obviousimage of the LMC-Xl source.
The confirmation of possible supernova photonswas considerably more difficult and the correl-ation of the total of 152 photons during theperiod from 3 min 38 seconds to 7 min 36 seesproduced a random distribution over the 40 arcminute field of view of the detector and noobvious statistical concentration as was to beexpected from a bright point source. From thisresult and the fact that the detector andpointing system had been calibrated and proven tofunction correctIy on the well known LMC-Xlsource, only an upper limit for the radiationlevel of the supernova can be determined. Evenso, the scientific purpose of the experiment andperformance of the payload can be considered assuccessful as the lack of measureable soft X-rayradiation, indicated an unexpected process in thedevelopment of the supernova.
12. Conclusion
The SUPERNOVA project illustrated just what canbe achieved when enough people are sufficientlymotivated and enthusiastic about a task andsufficient resources can be made available. Therefurbishment of the payload and development ofthe ACS was a typical case of sounding rocket adhoc solutions to obtain the maximum perform- ancefrom available components, within extremly tighttime scale and cost restraints. The use ofinteractive remote control and star TV cameras asa backup to automatic systems, enabled thesubstitution of the faulty star tracker functionby manual control and resulted in the rescue ofthe mission. At a time when the use of soundingrockets for astronomy research in Europe hadalmost come to an end, the supernova provided arare opportunity to demonstrate the uniqueadvantages of this technology over other forms ofspace vehicles for quick, effective and cheapsolutions.
13. References
Supernova Attitude Control System Flight ReportDFVLR Hauptabteilung Angewandte DatentechnikTN 3/87 Dec '87
ASTRO 4/2 Flight ReportDornier System GmbH, MPE Garching, DFVLR-OPOct. '79
A Search for soft X-rays from SN 1987 AAschenbach et al, MPE Garching, Oct. '87
14. Acknowledgements
The development and construction of the SUPERNOVAattitude control system was carried out undercontract to the Max Planck Institute forAstronomy in Garching. The design, development,production and successful operation of such acomplex system in an extremely short time periodwould not have been possible without theenthusiastic cooperation of a number of peopleand departments, especially Eckhart Krieg, JohnHow, Robert Dausch, Peter Turner, Horst Nailerand the Mobile Rocketbase of the DFVLR and HorstHippmann and Dr. Ulrich Briel of the MPE.
123
SOFIA - STRATOSPHERIC OBSERVATORY FOR INFRARED ASTRONOMYA 3m CLASS AIRBORNE TELESCOPE
A.F. Dahl, R. Ewald, A. Himmes,
German Aerospace Research Establishment (DLR)Linder HOhe, 5000 Koeln 90, FRG
ABSTRACT
In cooperation with NASA, the German Minister forResearch and Technology, BMFT, conducts studies toprovide a 3m class airborne telescope for SOFIA, asuccessor to the extremely successful Gerard KuiperAirborne Observatory, KAO. In the next two decades,SOFIA could provide a continuing and readily dé-ployable observation possibility at heigths above12.5km for sophisticated instrumentation from thesubnm well into the optical spectral range.After studying feasible telescope concepts BMFT hasnow proceeded into the telescope system definitionphase.
Keywords: Airborne Astronomy, Observatories,Submm-FIR-IR techniques, Large lightweight mirrors
1. AIRBORNE ASTRONOMY
Starting with a CV-990 aircraft in the 1960's, NASAnow has the experience of almost a quarter of acentury in airborne astronomy. A 30cm open-porttelescope in a Lear Jet paved the way for theGerard Kuiper Airborne Observatory, KAO, with its91cm diameter telescope, that provides up to nowthe only permanent observation facility for infra-red astronomy above the tropopause, leaving behindthe water vapour layer of Earth's atmosphere. Plansfor a "Large Airborne Telescope" finally led to theinitiation of feasibility studies for a 3m classopen-port telescope in a Boeing 747 aircraft, whichwill be named SOFIA. In 1986 NASA invited theGerman Minister for Research and Technology, BMFT,to contribute the telescope system to this observa-tory, acknowledging the high standard of astronomyand telescope technology in the FRG and the greatinterest shown in the participation in the KAO pro-gram. After the feasibility of a 3m class telescopein a 747 has been proven in phase A studies, NASAand BMFT are now conducting definition studies forthe required aircraft modifications and the tele-
scope system in parallel. If funds are provided,SOFIA'S development can have a new start in 1991with the aim of beginning astronomy operations in1994. Thus the successful, but ageing KAO will havea much more powerful successor to natch the evergrowing interest in this up to now only poorlyexploited field of subrran & infrared astronomy aswell as to provide a larger number of scienceflights to the now numerous groups with sophisti-cated instrumentation. With an anticipated lifetimeof more than 20 years and 120 annual flights SOFIAnot only will serve submm & infrared astronomerswell into the next millenium thus bridging the gapto the planned satellite observatories LDR andFIRST, but also will be complementary to the cryo-genically cooled though much smaller infraredsatellites SIRTF and ISO which are currentlydeveloped.
2. THE OBSERVATORY
The definition study concept foresees a very thinZerodur meniscus parabolic mirror of now 2.7m dia-meter and 60mm thickness as primary mirror. Themirror has to be very fast with a focal ratio off/1.2 in order to have no parts of the telescopeexposed to the ambient air flow outside the cavity.The optical configuration is of Ritchey-Chretientype in Nasmyth arrangement with a chopping light-weight secondary and dichroic tertiary mirror toallow focal plane tracking simultaneously withinfrared observations. The telescope will bebalanced with a spherical air bearing supported bya vibration isolation system mounted to an aftbulkhead that separates the pressurized cabin fromthe open cavity thus taking over the well provenKAO design, which allows inflight access to thescience instruments.The new technology for the fast thin mirror, thebearing concept and the vibration isolation areprimary concerns for the study conducted in Germanywhile the US side will define the necessary modifi-cations to the aircraft of choice, a Boeing 747-SP,other critical mission aspects as f.«. the controlof shear layer streaming over the cavity causing
Proc. Ninth ESAIPAC Symposium on 'European Rocket and Balloon Programmes and Related Research', Lahnstein, FRC, 3—7April 1989(ESA SP-291, June 1989)
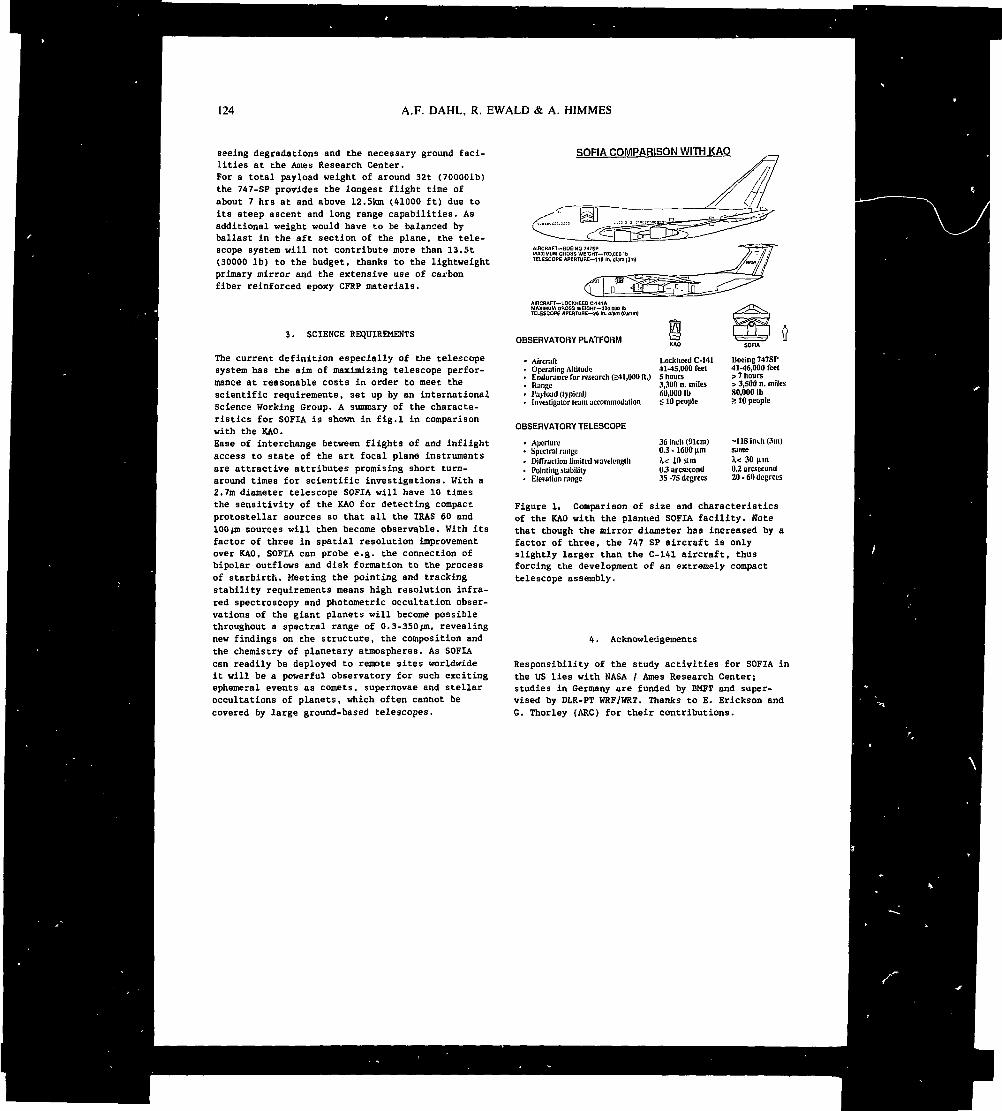
124 A.F. DAHL, R. EWALD & A. HIMMES
seeing degradations and the necessary ground faci-lities at the Ames Research Center.For a total payload weight of around 32t (70000Ib)the 747-SP provides the longest flight time ofabout 7 hrs at and above 12.5km (41000 ft) due toits steep ascent and long range capabilities. Asadditional weight would have to be balanced byballast in the aft section of the plane, the tele-scope system will not contribute more than 13.5t(30000 Ib) to the budget, thanks to the lightweightprimary mirror and the extensive use of carbonfiber reinforced epoxy CFRP materials.
3. SCIENCE REQUIREMENTS
The current definition especially of the telescopesystem has the aim of maximizing telescope perfor-mance at reasonable costs in order to meet thescientific requirements, set up by an internationalScience Working Group. A summary of the characte-ristics for SOFIA is shown in fig.l in comparisonwith the KAO.Ease of interchange between flights of and inflightaccess to state of the art focal plane instrumentsare attractive attributes promising short turn-around times for scientific investigations. With a2.7m diameter telescope SOFIA will have 10 timesthe sensitivity of the KAO for detecting compactprotostellar sources so that all the IRAS 60 and100fin sources will then become observable. With itsfactor of three in spatial resolution improvementover KAO, SOFIA can probe e.g. the connection ofbipolar outflows and disk formation to the processof starbirth. Meeting the pointing and trackingstability requirements means high resolution infra-red spectroscopy and photometric occultation obser-vations of the giant planets will become possiblethroughout a spectral range of 0.3-350/jn, revealingnew findings on the structure, the composition andthe chemistry of planetary atmospheres. As SOFIAcan readily be deployed to remote sites worldwideit will be a powerful observatory for such excitingephemeral events as comets, supernovae and stellaroccultations of planets, which often cannot becovered by large ground-based telescopes.
SOFIA COIVlPARiSON WITH KAO
AIRCRAFT-BOEING 747SPMAXIMUM CROSS WEIGHT—703.000 IbTELESCOPE APERTURE-llfl In. dlam (3m)
AIRCRAFT—LOCKHEED C-141AMAXIMUM GROSS WEIGHT—320.000 111TELESCOPE APERTUHE—36 In. alun {O.gtmf
OBSERVATORY PLATFORM
Aircraft Lockheed C-141 Boeing 747SPOperating Altitude 41-45,000 feet 41-46,000 feelEndurance for research (241,000 ft.) 5 hours > 7 hoursRanee 3,300 n. miles > 3,500 n. milesI'ajtaid (typical) 6U1OOOIb 80,000 IbInvestigator team accommodation < 10 people 210 people
OBSERVATORY TELESCOPE
Aperture 36 inch (91cm) -118 inili (3m)Spectral range 0.3 -1600 \aa sameDiflraclion limited wavelength X< 10 (im (U 30 JimPointing stability 0.3arcsccond O.ZarcseconUElevation range 35-75 degrees 20-60 degrees
Figure 1. Comparison of size and characteristicsof the KAO with the planned SOFIA facility. Notethat though the mirror diameter has increased by afactor of three, the 747 SP aircraft is onlyslightly larger than the C-141 aircraft, thusforcing the development of an extremely compacttelescope assembly.
4. Acknowledgements
Responsibility of the study activities for SOFIA inthe US lies with NASA / Ames Research Center;studies in Germany are funded by BMFT and super-vised by DLR-PT WRF/WRT. Thanks to E. Erickson andG. Thorley (ARC) for their contributions.
125
DESIGN AND TECHNICAL ASPECTS OF THE SOLLY INSTRUMENT
M. Boison E. Weber
Dornier GmbHSpace DivisionScience Payloads & ExperimentsP.O. BOX 14 20D-7990 Friedrichshafen 1West Germany
ABSTRACT
SOLLY (Solar Lyman-Alpha Spectroscopy) isthe name of a new type of resonancespectrometer. It was successfullylaunched aboard a BLACK BRANT rocket onOctober 24, 1988 and recovered byparachute. This flight served as a firstexperimental and technical improvement ofthe new instrument , which was designedto measure the solar line profile andintensity within the core of the solarLyman-Alpha line at 121.6 nm. Theinstrument comprises sequentiallyarranged hydrogen and oxygen cells withtwo independent detectors.
A brief technical description of theinstrument design and layout will bepresented.
Keywords: resonance spectrometer, detec-tion of solar Lyman-Alpha line profile(121.6 nm), hydrogen gas cell, oxygen gascell, channeltron detector,
2. EXPERIMENT CONCEPT
1. INTRODUCTION
Solly was successfully flown as part ofan American sounding rocket iayload.Thescientific goal and the experimentconsisting of a hydrogen cell and anoxygen cell with data electronics weredefined by the University of Bonn(Institut fur Astrophysik und extra-terrestr-ische Forschung, IAEF).
Dornier built the instrument (sensor) byorder of the University of Bonn. PTS(Freiburg) was responsible of' the NBS-diode and the data electronics.
Owing to a very good cooperation betweenthe industry and MPAE (Katlenburg) asconcerns the procurement of componentsfor the cells and know-how transfer, theinstrument could be developed, built,tested and supplied within a period ofonly 5 months.
Figure i shows the experiment concept.SOLLY consists of two sequentiallyarranged gas cells (containing Ha and Ojat low pressure) with two independentdetector systems (channeltron module andNBS-diode), several baffle systems, dataelectronics and power supplies.
The NBS-diode detects the direct solarLy-ot radiation at the rear of the oxygencell which is filled with O2 gas of about'O mbar. The radiation enters thehydrogen cell via the entry baffle, istransmission-modulated by means ol"different hydrogen partial pressures andis narrow-band filtered in the oxygencell. The MgF2 windows gastightly sealingthe cells and provide for a broad-bandprefiltering of the solar radiation.
The channeltron detector system laterallyarranged on the hydrogen cell detects thesolar Ly-oC. photons that are resonantlyscattered on the hydrogen atoms. In thisconnection, the intensity depends on thehydrogen _oartiai pressure (rangingbetween 10 and 10 mbar) which isvaried by the heated filament current in.the hydrogen cell. The molecular hydrogenis thus dissociated into an atomichydrogen.
The preamplifier is directly installed inthe NBS diode housing. The channeltronmodule (CEM) consists of a specialceramic channeltron (MPAE), chargeamplifier and a matching electronics forthe data electronics. A separateconverter generates the high voltage forthe CEM. The data electronics controlsthe heated filament of the hydrogen cell,processes the NBS-diode current andcounting pulses of the CEM. The processeddata are collected by a PCM encoder (partof sounding rocket) and transmitted tothe ground station via telemetry.
PTOC. Ninth ESA/PAC Symposium on 'European Rocket and Balloon Programmes and Related Research', Lahnstein, FRC, 3—7April 19S9
(ESA SP-291, June 1989)
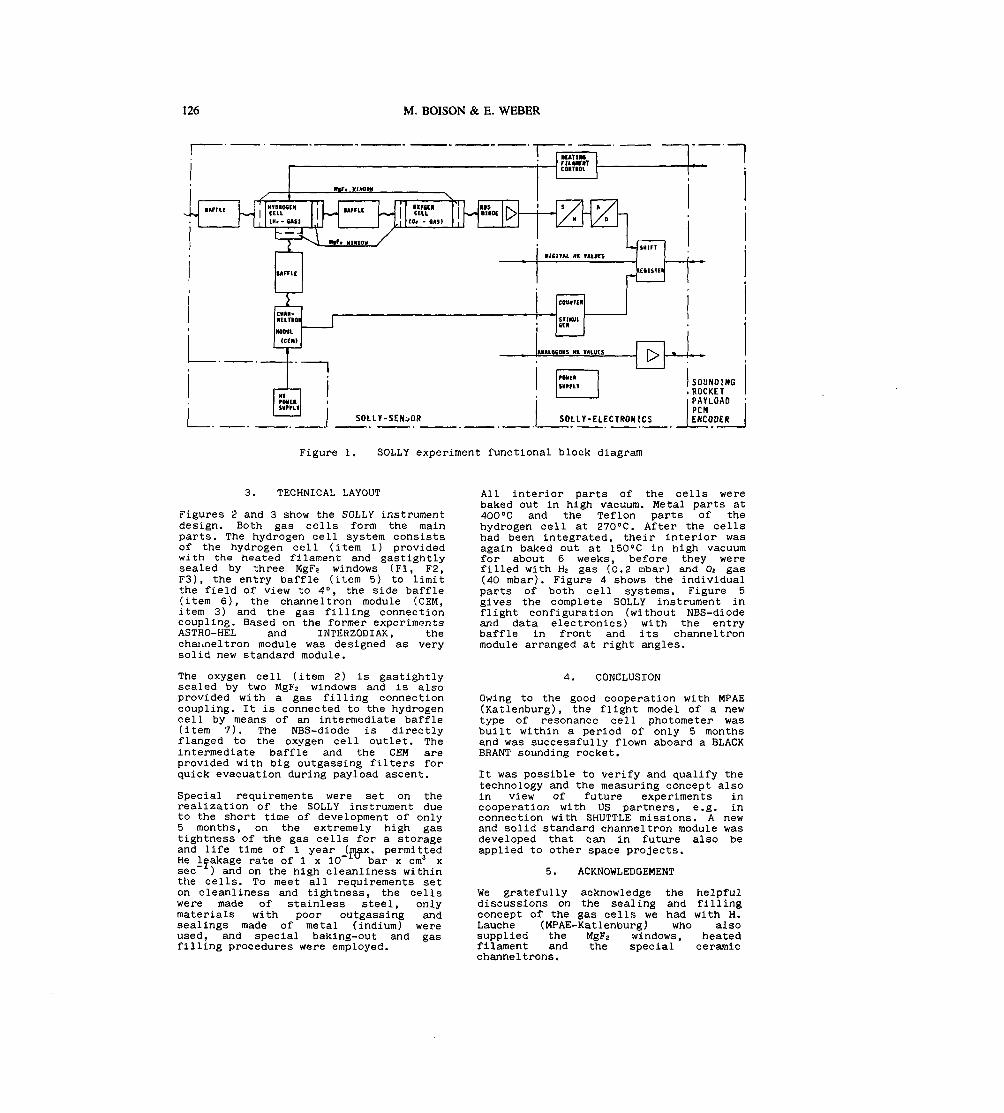
126 M. BOISON & E. WEBER
/MF1 VIM»»
N' HVDKOCCNI CELL, (H. - MSI
I.|
-> *
IKFFU~ I
,1
«ircc*CClL
(O. - US)II
*s*UiDIODt O
MtTlWniwciTCOIITKOL
-
I
Xy~^V\ KjF. wnnoy
SOLLY-SEHiOR
Figure 1. SOLLY experiment functional block diagram
3. TECHNICAL LAYOUT
Figures 2 and 3 show the SOLLY instrumentdesign. Both gas cells form the mainparts. The hydrogen cell system consistsof the hydrogen cell (item 1) providedwith the heated filament and gastightlysealed by three MgFa windows (Fl, F2,F3), the entry baffle (item 5) to limitthe field of view to 4°, the side baffle(item 6), the channeltron module (CEM,item 3) and the gas filling connectioncoupling. Based on the former experimentsASTRO-HEL and INTERZODIAK, thechaiineltron module was designed as verysolid new standard module.
The oxygen cell (item 2) is gastightlysealed by two MgFa windows and is alsoprovided with a gas filling connectioncoupling. It is connected to the hydrogencell by means of an intermediate baffle(item 7). The NBS-diode is directlyflanged to the oxygen cell outlet. Theintermediate baffle and the CEM areprovided with big outgassing filters forquick evacuation during payload ascent.
Special requirements were set on therealization of the SOLLY instrument dueto the short time of development of only5 months, on the extremely high gastightness of the gas cells for a storageand life time of 1 year (.max. permittedHe leakage rate of 1 x 10 bar x cm3 xsec ) and on the high cleanliness withinthe cells. To meet all requirements seton cleanliness and tightness, the cellswere made of stainless steel, onlymaterials with poor outgassing andsealings made of metal (indium) wereused, and special baking-out and gasfilling procedures were employed.
All interior parts of the cells werebaked out in high vacuum. Metal parts at40O0C and the Teflon parts of thehydrogen cell at 27O0C. After the cellshad been integrated, their interior wasagain baked out at 15O0C in high vacuumfor about 6 weeks, before they werefilled with Ha gas (0.2 mbar) and Oz gas(40 mbar). Figure 4 shows the individualparts of both cell systems. Figure 5gives the complete SOLLY instrument inflight configuration (without NBS-diodeand data electronics) with the entrybaffle in front and its channeltronmodule arranged at right angles.
4. CONCLUSION
Owing to the good cooperation with MPAE(Katlenburg), the flight model of a newtype of resonance cell photometer wasbuilt within a period of only 5 monthsand was successfully flown aboard a BLACKBRANT sounding rocket.
It was possible to verify and qualify thetechnology and the measuring concept alsoin view of future experiments incooperation with US partners, e.g. inconnection with SHUTTLE missions. A newand solid standard channeltron module wasdeveloped that can in future also beapplied to other space projects.
5. ACKNOWLEDGEMENT
We gratefully acknowledge the helpfuldiscussions on the sealing and fillingconcept of the gas cells we had with H.Lauche (MPAE-Katlenburg) who alsosupplied the MgF2 windows, heatedfilament and the special ceramicchanneltrons.
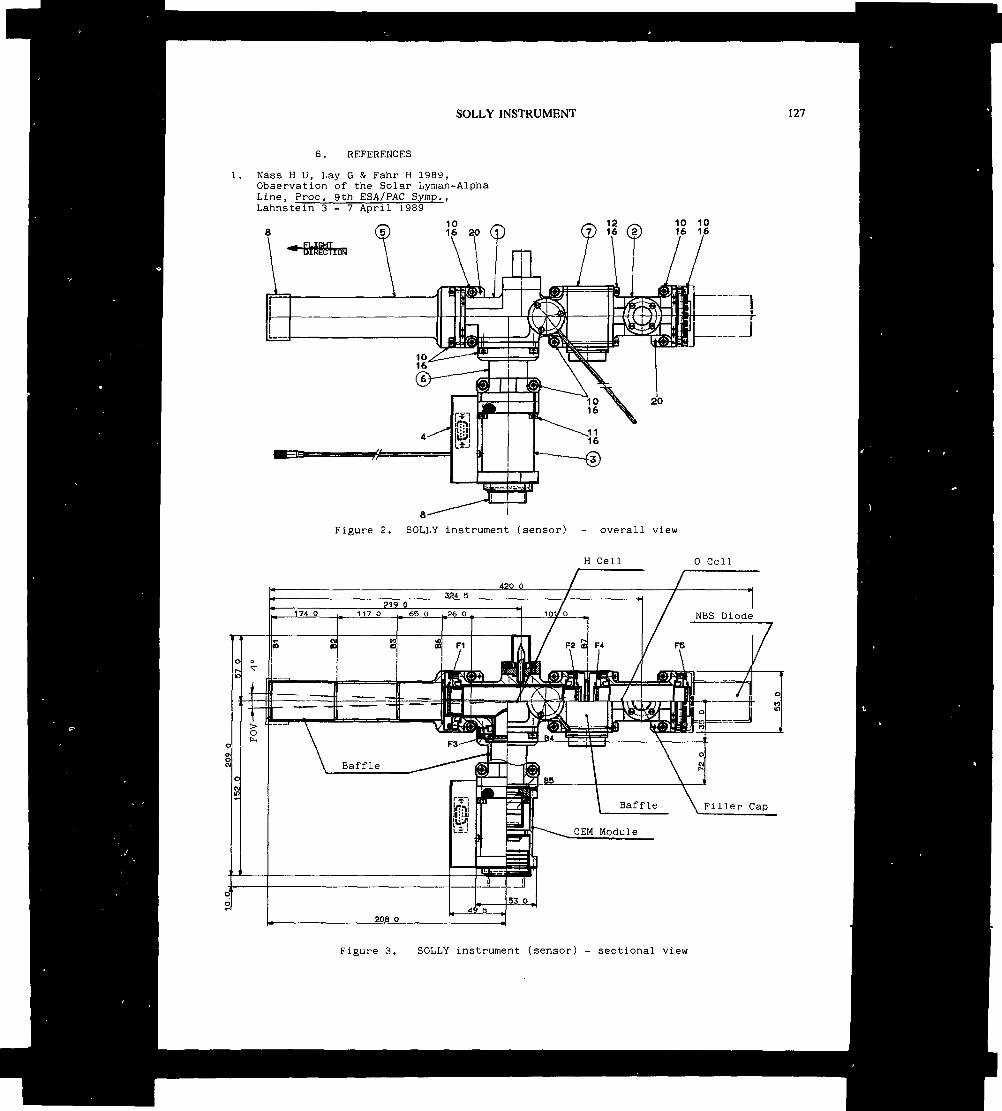
SOLLY INSTRUMENT 127
6. REFERENCES
1. Nass H U, Lay G & Fahr H 1989,Observation of the Solar Lyman-AlphaLine, Proc. 9th ESA/PAC Symp.,Lahnstein 3 - 7 April 1989
Figure 2. SOLLY instrument (sensor) - overall view
H Cell O Cell
Figure 3. SOLLY instrument (sensor) - sectional view
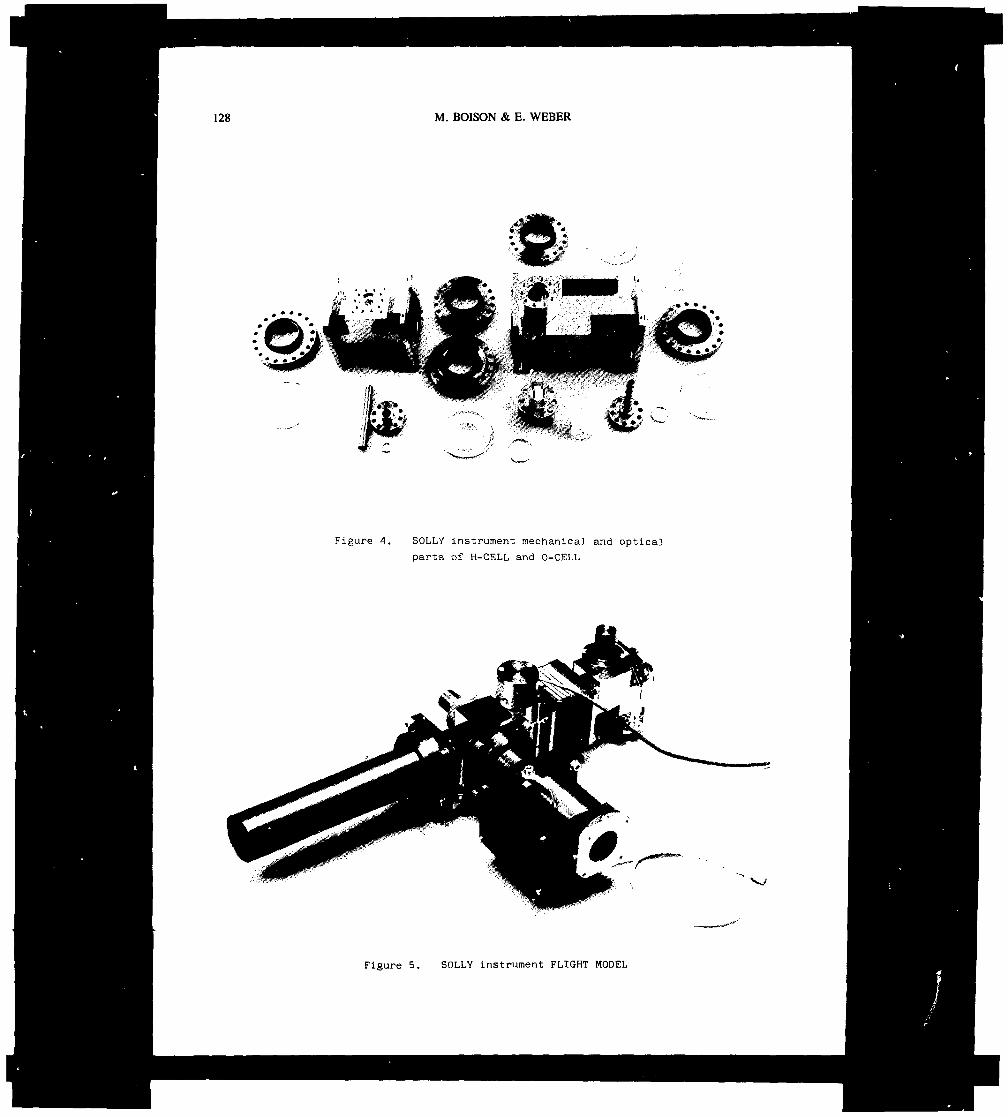
128 M. BOISON & E. WEBER
Figure 4. SOLLY instrument mechanical and optical
parts of H-CELL and 0-CELL
Figure 5. SOLLY instrument FLIGHT MODEL
129
A DOUBLE FOCUSSING MASS-SPECTROMETER FOR SIMULTANEOUS ION MEASUREMENTS IN THE STRATOSPHERE
R. Moor, E. Kopp, U. Jenzert H. Ramseyer, U. Wâlchli
E. Arijs, D. NevejansJ. Ingels, D. Fussen
A. Barassin,C. Reynaud
Physikalischas InstitutUniversity of BernCH-3012 BernSwitzerland
Belgian Institute forSpace AeronomyIi-1180 BrusselsBelgium
L.P.C.E.C.N.R.S.F-45071 OrléansFrance
ABSTRACT
The identification of less abundant stratosphericions requires an improvement of mass resolutionand sensitivity of the instruments in use. Amodified Mattauch-Herzog analyzer was developedfor positive ion measurements in the mass range12 to 500 u and will be upgraded for negativeions. The main characteristics, design parametersand first laboratory test results obtained withit are described here. The ions are mass- sepa-rated in combined toroidal electrostatic andconstant magnetic fields. The simultaneous mea-surement of a spectrum part is achieved with theuse of two detectors. They consist of a 1-inchmicrochannel plate, an attached phosphor screen,a fiberoptic seal and a linear position sensitivelight detector. Ambient atmospheric ions aresampled through a small orifice. The atmosphericair density is reduced in the inlet region of theinstrument with a liquid helium cryopump. Anoctopole HF-field was integrated into the ionoptics in order to reduce the ion loss.
KEYWORDS: Mass spectrometers, electro-opticaldevices, atmospheric density, stratosphere.
1. INTRODUCTION
The nature and abundance of positive and negativeion species in the stratosphere and mésosphèrecan only be determined by means of in situ massspectrometer measurements. In the mésosphère ionswere measured with a detection limit of 1-10 cmby Narcisi et al. (3965), Krankowsky et al.(1972) and Zbinden et al. (1975), by using cryo-genic pumping. Although the very first massspectrornetric measurements of positive ions inthe stratosphere were performed with rocket borneinstruments by Arnold et al. (1977), the use ofballoons turned out to be a much more appropriatemeans for stratospheric ion sampling. Balloon-borne instruments for stratospheric ion measure-ments were developed and successfully flown byArijs et al. (1978) and Arnold et al. (1978). Theknowledge of the nature and abundance profiles ofmesospheric and stratospheric ions is essentialfor the understanding of atmospheric electricity,in particular the formation and loss mechanismsof free electrons and positive and negative ion
t Current address: Electrowatt, CH-8008 Zurich
clusters. All these parameters strongly depend onthe ion composition. Stratospheric ion measure-ments by Arnold et al. (1980) , Arijs et al.(1983a, b) and Viggiano and Arnold (1983)revealed the possibility to detect trace gaseswith very low concentrations. Ions of the middleatmosphere may also play an important role in theformation of aerosols and they can provide addi-tional support for the laboratory investigationof thermoehemical and kinetic ion-molecule reac-tion constants (see e.g. Arnold et. al., 1901).
So far only quadrupole mass filters have beenused successfully for stratospheric ion measure-ments [for description and performance of instru-ments see Nevejans et al. (1985) and referencestherein]. Although such insturments have provideda wealth of data on the major positive and nega-tive ions in the altitude range 20 to 45 km andgave a rather consistent insight into the majorstratospheric ion chemistry [for recent refer-ences see reviews by Arnold (1982), Arijs (1983),Arijs et al. (1984) and Arijs and Brasseur(1986)] there still remain some questions aboutthe less abundant positive and negative ions inthe stratosphere. A lowering of the ion detectionlimit, an increase of the mass resolution, andthe decrease of the integration time to build upion spectra during a balloon flight are necessaryto allow detailed investigations of small-scalestructures in the ion composition. Such struc-tures may originate from dynamical and electro-dynamical variations or from rapid fluctuationsof neutral minor constituents and the aerosolformation. Furthermore, an improvement of sensi-tivity and mass resolution is needed to extent!the number of trace gas species which can beinferred from ion composition measurements.
With these objections in mind we aimed to developa new balloon-borne mass analyzer with a massrange of 12-500 u, a mass resolution M/AM = 250at the 1% level, a sensitivity of lo"1 cm"3 with100 s integration time and an altitude resolutionof 100 m. The instrument should also allow us tomeasure minor ion species because of the enhanceddynamic range 1:105 (100 s intégration).
We have investioated three basic types of instru-ment, the time of flight (TOFS), quadrupole massfilter (QMFS) and the double focussing magneticmass spectrometer (DFMS). All three instrumenttypes have been used in acronoaiic measurements in
Proc. Ninth ESA/PAC Symposium on 'European Rocket and Balloon Programmes and Related Research', Lahnstein, FRG, 3—7April 1989(ESA SP-291, June 1989)
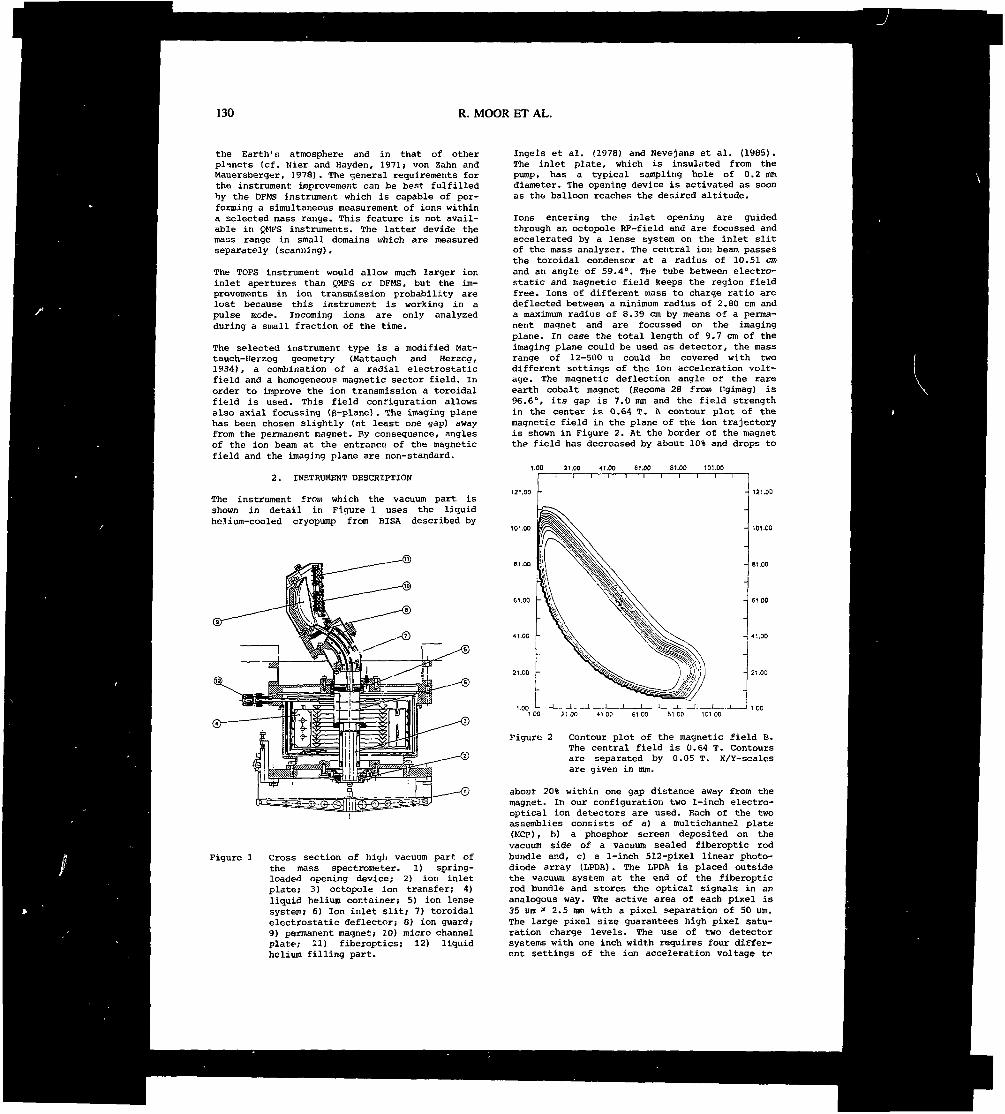
130 R. MOOR ET AL.
the Earth ' s atmosphere and in that of otherplanets (cf. Nier and Hayden, 1971; von Zahn andMauersberger, ]978). The general requirements forthe instrument improvement can be best fulfilledby the DFHS instrument which is capable of per-forming a simultaneous measurement of ions withina selected mass range. This feature is not avail-able in QMPS instruments. The latter dévide themass range in small domains which are measuredseparately (scanning).
The TOFS instrument would allow much larger ioninlet apertures than QMFS or DFHS, but the im-provements in ion transmission probability arelost because this instrument is working in apulse mode. Incoming ions are only analyzedduring a small fraction of the time.
The selected instrument type is a modified Mat-tauch-Herzog geometry (Mattauch and Herzog,1934), a combination of a radial electrostaticfield and a homogeneous magnetic sector field. Inorder to improve the ion transmission a toroidalfield is used. This field configuration allowsalso axial focussing (g-plane). The imaging planehas been chosen slightly (at least one gap) awayfrom the permanent magnet. By consequence, anglesof the ion beam at the entrance of the magneticfield and the imaging plane are non-standard.
2. INSTRUMENT DESCRIPTION
The instrument from which the vacuum part isshown in detail in Figure 1 uses the liquidhelium-cooled cryopump from EISA described by
Figure 1 Cross section of high vacuum part ofthe mass spectrometer. 1) spring-loaded opening device; 2) ion inletplate; 3) octopole ion transfer; 4)liquid helium container; 5) ion lensesystem; 6) Ion inlet slit; 7) toroidalelectrostatic deflector; 8) ion guard;9) permanent magnet; 10) micro channelplate; 11) fiberoptics; 12) liquidhelium filling part.
Ingels et al. (1978) and Mevejans et al. (1985).The inlet plate, which is insulated from thepump, has a typical sampling hole of 0.2 mmdiameter. The opening device is activated as soonas the balloon reaches the desired altitude.
Ions entering the inlet opening are guidedthrough an octopole RF-field and are focussed andaccelerated by a lense system on the inlet slitof the mass analyzer. The central ion beam passesthe toroidal condensor at a radius of 10.51 cmand an angle of 59.4°. The tube between electro-static and magnetic field keeps the region fieldfree. Ions of different mass to charge ratio aredeflected between a minimum radius of 2.80 cm anda maximum radius of 8.39 cm by means of a perma-nent magnet and are focussed on the imagingplane. In case the total length of 9.7 cm of theimaging plane could be used as detector, the massrange of 12-500 u could be covered with twodifferent settings of the ion acceleration volt-age. The magnetic deflection angle of the rareearth cobalt magnet (Recoma 28 from tigimag) is96.6°, its gap is 7.0 mm and the field strengthin the center is 0.64 T. A contour plot of themagnetic field in the plane of the ion trajectoryis shown in Figure 2. At the border of the magnetthe field has decreased by about 10% and drops to
61 OO
Figure 2 Contour plot of the magnetic field B.The central field is 0.64 T. Contoursare separated by 0.05 T. X/Y-scalesare given in mm.
about 20% within one gap distance away from themagnet. In our configuration two 1-inch electro-optical ion detectors are used. Each of the twoassemblies consists of a) a multichannel plate(MCP), b) a phosphor screen deposited on thevacuum side of a vacuum sealed fiberoptic rodbundle and, c) a 1-inch 512-pixel linear photo-diode array (LPDA). The LPDA is placed outsidethe vacuum system at the end of the fiberopticrod bundle and stores the optical signals in ananalogous way. The active area of each pixel is35 VIK * 2.5 mm with a pixel separation of 50 urn.The large pixel size guarantees high pixel satu-ration charge levels. The use of two detectorsystems with one inch width requires four differ-ent settings of the ion acceleration voltage to

MASS SPECTROMETER FOR SIMULTANEOUS ION MEASUREMENTS 131
cover the mass range of 12-500 u as shown inTable 1.
Similar instruments based on the Mattauch-Herzoggeometry which are operating with linear arraydetectors for simultaneous detection of a massspectrum have been developed and investigated byGiffin et al. (1974), Murphy and Mauersberger(1985), Krankowsky et al. (19B6) and otherauthors cited in their references.
Table 1 Mass ranges of the two detectors fordifferent ion acceleration voltage (IAV)
Det. A(U)
12 - 2828 - 6542 - 9864 - 148
Det. B(U)
63 - 95147 - 221J21 - 334333 - 504
IAV(V)
1340576382253
3. DETECTOR
A schematic view of the electron optical iondetector is shown in Figure 3. The ions leavingthe magnetic field are accelerated towards theentrance of the two MCPs. In this experimentC-type MCPs with 25 urn curved channels (GalileoElectro-Optics) are used. The details of theperformance of MCPs can be found in the papers byWiza (1979) and Timothy (1981). An ion strikingthe front of the MCP causes an electron pulse ofthe order of 106 electrons leaving the MCP. Theseelectrons are accelerated towards a conductiveP20 phosphor layer (AEG Telefunken) which isdeposited on the front surface of a fiberopticrod bundle (Galileo Electro Optics). The fiber-optic rod bundle has fibers of 6 Um diameter andan overall maximum diameter of 35 mm at itsreverse side. Two solid state optical imagedetectors, each consisting of a 512 pixel self-scanned linear photodiode array (HamaraatsuS 2304-512F) fitted to a fiber optic rod bundleare used for the recording of mass spectra. Thetwo LPDA-arrays are read out simultaneously in
L O W P R E S S U R E(< lOE-e mbtr)
photon»
LL
— MICROCHANNEL PLATE
PHOSPHOR SCREEN
— FIBEROPTICS
•I. ctiltg*
Figure 3
— PHOTODIODES
- INTEGRATED SEMICONDUCTORDEVICE
Elements of the linear electro-opticalarray detector. The fiberoptics sepa-rate the high vacuum part from theelectronic part at atmospheric pres-sure.
54 ms and their serial analog video output sig-nals are digitised by an ADC having a 12 bitresolution.
Prior to the use of a new MCP in the detector atleast a three day period of extensive heat treat-ment in vacuum at 30O0C was applied. After theheat treatment the MCPs were burnt in with a lowintensity ion beam for about 10 hours, using1000 V as the MCP-voltage at room temperature.Our MCPs were at pressures below 2 x 10 6 mbarand at a nominal supply voltage of 1.6 kV.
We have tested the ion optical detector configu-ration in a homogeneous ion beam with constantion energy, different intensities and uniformmass to charge ratio. Figure 4 shows a linearityplot for N2 ions with a nominal impact angle of50°. The plot is an average of over 100 read-outstaken from the 200 center pixels out of the 512.A value of 1550 V is used for the MCP voltage and2200 V for the electron acceleration at the out-put of the MCP towards the phosphor screen. Acurrent density of 8000 ions/mm2 s resulted in3323 ADC charge counts being accumulated from asingle !,PDA-pixel during an integration time of54 ms. The results show that in this configura-tion one ion gave rise to an average number of88 ADC-counts. The slight bending of the lineari-ty plot is an artifact which originates from thebeam measurements with a reference detectionsystem.
5000
Figure 4 Linearity plot of the detectormeasured with Nj ions with 2.5 kVenergy, 1.55 kV MCP voltage. The scaleof the LPDA read-out is given in unitsof 500 with maximum ADC counts of 3323at 8000 ions/mm2 s.
The 25 mm C-plate MCP (Galileo Electro OpticsNo. 1034-201-012) has been tested similarly forthe investigation of the overall gain homogene-ity. Again Na ions with an energy of 3000 eV anda current density of 2500 ram * s"1 have beenused. Figure 5 displays the variability of ADCcounts of the Hamamatsu LPDA against the localpixel position. The gain variability is for this
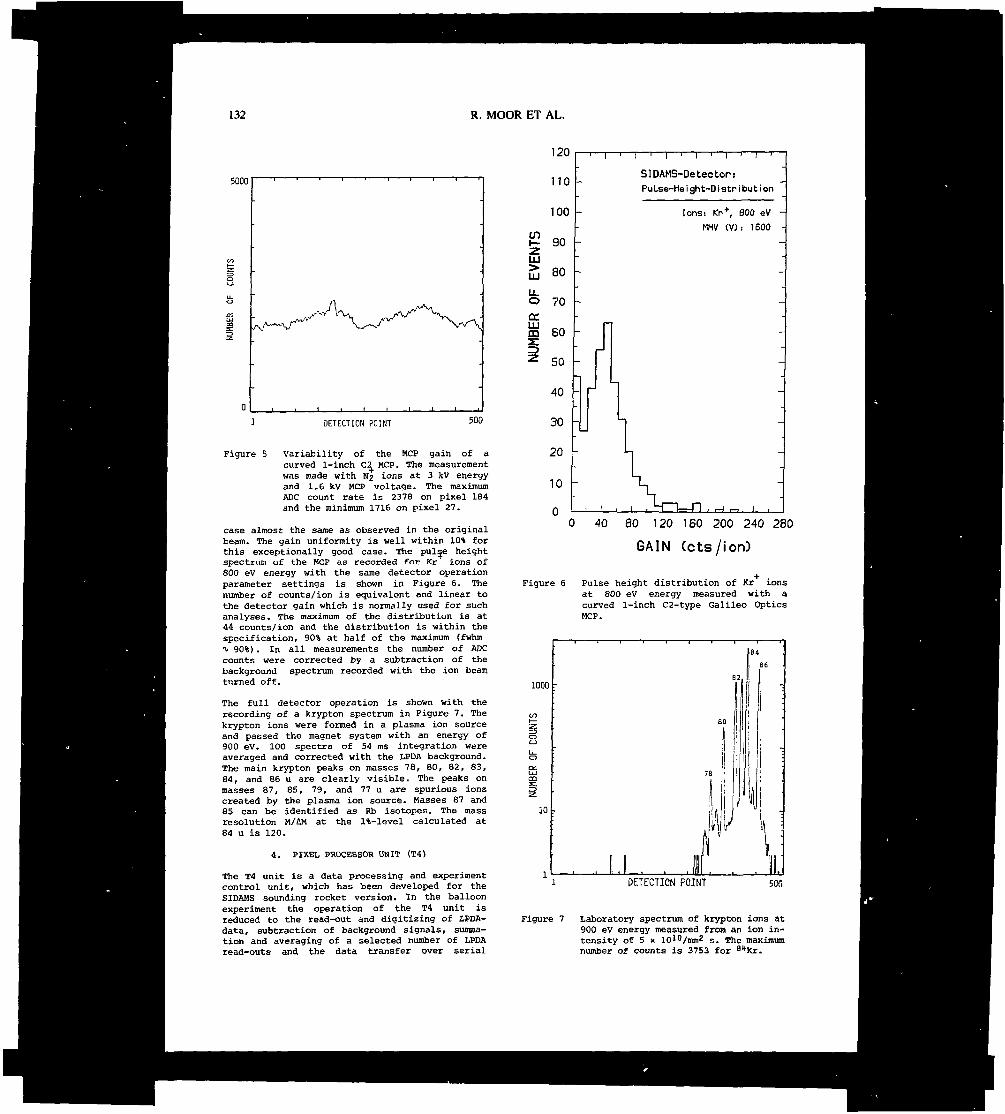
132 R. MOOR ET AL.
5000
DETECTION POINT 500
Figure 5 Variability of the HCP gain of acurved 1-inch C^ MCP. The measurementwas made with «2 ions at 3 kv energyand 1.6 kv MCP voltage. The maximumM)C count rate is 2378 on pixel 184and the minimum 1716 on pixel 27.
case almost the same as observed in the originalbeam. The gain uniformity is well within 10% forthis exceptionally good case. The puls_e heightspectrurc of the MCP as recorded for Kr ions of800 eV energy with the same detector operationparameter settings is shown in Figure 6. Thenumber of counts/ion is equivalent and linear tothe detector gain which is normally used for suchanalyses. The maximum of the distribution is at44 counts/ion and the distribution is within thespecification, 90% at half of the maximum (fwhm"\, 90%) . In all measurements the number of ADCcounts were corrected by a subtraction of thebackground spectrum recorded with the ion beamturned off.
The full detector operation is shown with therecording of a krypton spectrum in Figure 7. Thekrypton ions were formed in a plasma ion sourceand passed the magnet system with an energy of900 eV. 100 spectra of 54 ms integration wereaveraged and corrected with the LPDA background.The main krypton peaks on masses 78, 80, 82, 83,84, and 86 u are clearly visible. The peaks onmasses 87, 85, 79, and 77 u are spurious ionscreated by the plasma ion source. Masses 87 and85 can be identified as Eb isotopes. The massresolution M/ÛM at the 1%-level calculated at84 u is 120.
4. PIXEL PROCESSOR UNIT (T4)
The T4 unit is a data processing and experimentcontrol unit, which has been developed for theSIDAMS sounding rocket version. In the balloonexperiment the operation of the T4 unit isreduced to the read-out and digitizing of LPDA-data, subtraction of background signals, summa-tion and averaging of a selected number of LPDAread-outs and the data transfer over serial
120
110
100
g 90
IUJ 80
u.O 70
m so
50
40
30
20
10
-| i |— Y i -i -j -j | i
SIDAMS-Detecton:Pulse-Height-Distribution
tons: Kr+, 600 eV
MHV CV) : 1600
Figure 6
40 80 120 160 200 240 280
GAIN Ccts/ion)
Pulse height distribution of Kr ionsat 800 eV energy measured with acurved 1-inch C2-type Galileo OpticsMCP.
1000
10 -
DETECTION POINT son
Figure 7 Laboratory spectrum of krypton ions at900 eV energy measured from an ion in-tensity of 5 x 10¹⁰/mm2 s. The maximumnumber of counts is 3753 for 8l*Kr.
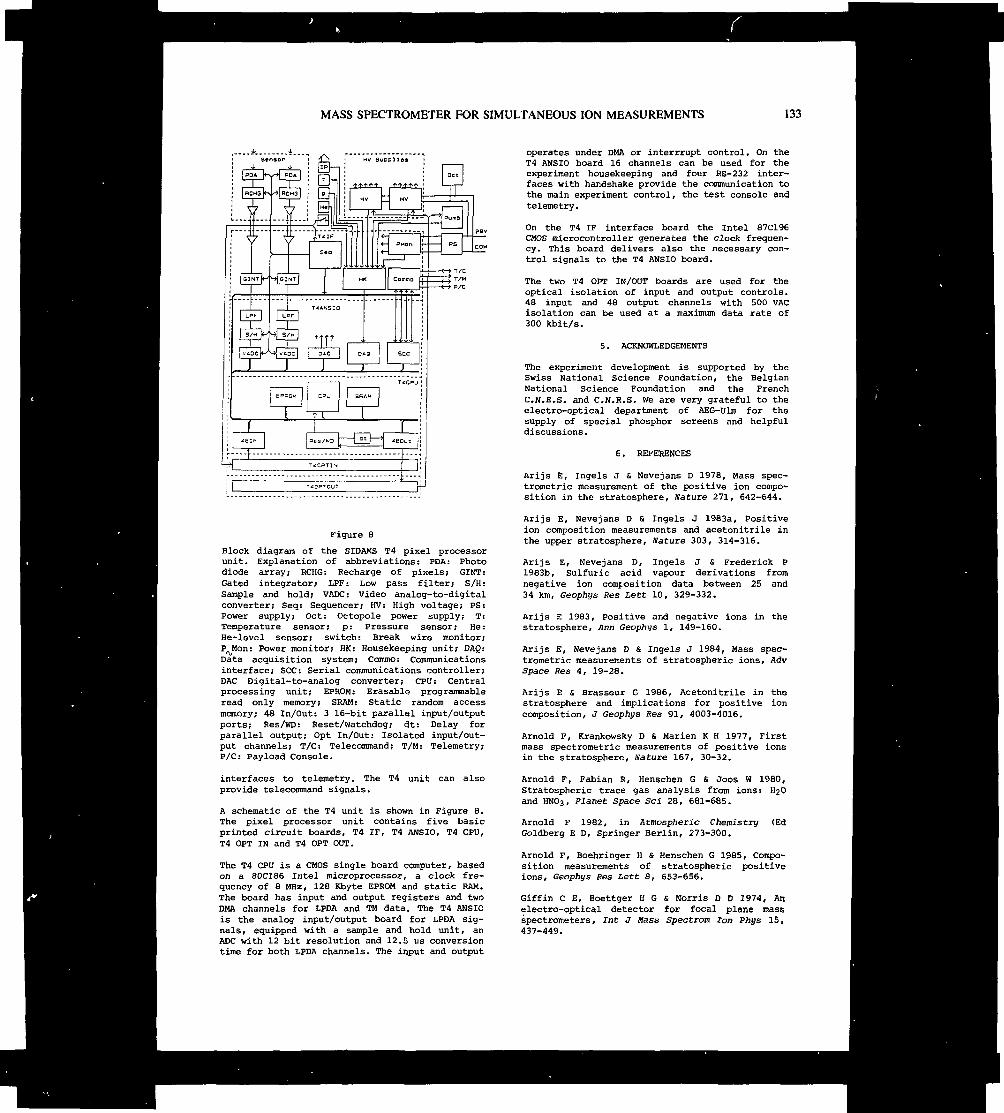
MASS SPECTROMETER FOR SIMULTANEOUS ION MEASUREMENTS 133
Figure 8
Block diagram of the SIDAHS T4 pixel processorunit. Explanation of abbreviations: PDA: Photodiode array; RCHG: Recharge of pixels; GINT:Gated integrator; LPF: Low pass filter; S/H:Sample and hold; VADC: Video analog-to-digitalconverter; Seq: Sequencer; HV: High voltage; PS:Power supply; Oct: Octopole power supply; T:Temperature sensor; p: Pressure sensor; He:He-level sensor; switch: Break wire monitor;P1xMOn: Power monitor; HK: Housekeeping unit; DSg:Data acquisition system; Commo: Communicationsinterface; SCC: Serial communications controller;DAC Digital-to-analog converter; CPU: Centralprocessing unit; EPROM: Erasable programmableread only memory; SRAM: Static random accessmemory; 48 In/Out: 3 16-bit parallel input/outputports; Res/WD: Reset/Watchdog; dt: Delay forparallel output; Opt In/Out: Isolated input/out-put channels; T/C: Telecommand; T/M: Telemetry;P/C: Payload Console.
interfaces to telemetry. The T4 unit can alsoprovide telecommand signals.
A schematic of the T4 unit is shown in Figure 8.The pixel processor unit contains five basicprinted circuit boards, T4 IF, T4 ANSIO, T4 CPU,T4 OPT IN and T4 OPT OUT.
The T4 CPU is a CMOS single board computer, basedon a 80C186 Intel microprocessor, a clock fre-quency of 8 MHz, 128 Kbyte EPROM and static RAM.The board has input and output registers and twoDMA channels for LPDA and TM data. The T4 ANSIOis the analog input/output board for LPDA sig-nals, equipped with a sample and hold unit, anADC with 12 bit resolution and 12.5 us conversiontime for both LPDA channels. The input and output
operates under DMA or interrrupt control. On theT4 ANSIO board 16 channels can be used for theexperiment housekeeping and four RS-232 inter-faces with handshake provide the communication tothe main experiment control, the test console andtelemetry.
On the T4 IF interface board the Intel 87C196CMOS microcontroller generates the clock frequen-cy. This board delivers also the necessary con-trol signals to the T4 ANSIO board.
The two T4 OPT IN/OUT boards are used for theoptical isolation of input and output controls.48 input and 48 output channels with 500 VACisolation can be used at a maximum data rate of300 kbit/s.
5. ACKNOWLEDGEMENTS
The experiment development is supported by theSwiss National Science Foundation, the BelgianNational Science Foundation and the FrenchC.N.E.S. and C.N.R.S. We are very grateful to theelectro-optical department of AEG-UIm for thesupply of special phosphor screens and helpfuldiscussions.
6. REFERENCES
Arijs E, Ingels J S Nevejans D 1978, Mass spec-trometric measurement of the positive ion compo-sition in the stratosphere, Nature 271, 642-644.
Arijs E, Nevejans D S Ingels J 1983a, Positiveion composition measurements and acetonitrile inthe upper stratosphere. Nature 303, 314-316.
Arijs E, Nevejans D, Ingels J S Frederick P1983b, SuIfuric acid vapour derivations fromnegative ion composition data between 25 and34 km, Geophys Res Lett 10, 329-332.
Arijs E 1983, Positive and negative ions in thestratosphere, Ann Geophys 1, 149-160.
Arijs E, Nevejans D S Ingels J 1984, Mass spec-trometric measurements of stratospheric ions, AdvSpace Res 4, 19-28.
Arijs E S Brasseur G 1986, Acetonitrile in thestratosphere and implications for positive ioncomposition, J Geophys Res 91, 4003-4016.
Arnold F, Krankowsky D S Marien K H 1977, Firstmass spectrometric measurements of positive ionsin the stratosphere, Mature 167, 30-32.
Arnold F, Fabian R, Henschen G S Joos W 1980,Stratospheric trace gas analysis from ions: HsOand HNO3, Planet Space Sd 28, 681-685.
Arnold F 1982, in Atmospheric Chemistry (EdGoldberg E D, Springer Berlin, 273-300.
Arnold F, Boehringer H & Henschen G 1985, Compo-sition measurements of stratospheric positiveions, Geophys Res Lett 8, 653-656.
Gif fin C E, Boettger H G S Norris D D 1974, Anelectro-optical detector for focal plane massspectrometers, Int J Mass Spectrom Ion Phys 15,437-449.
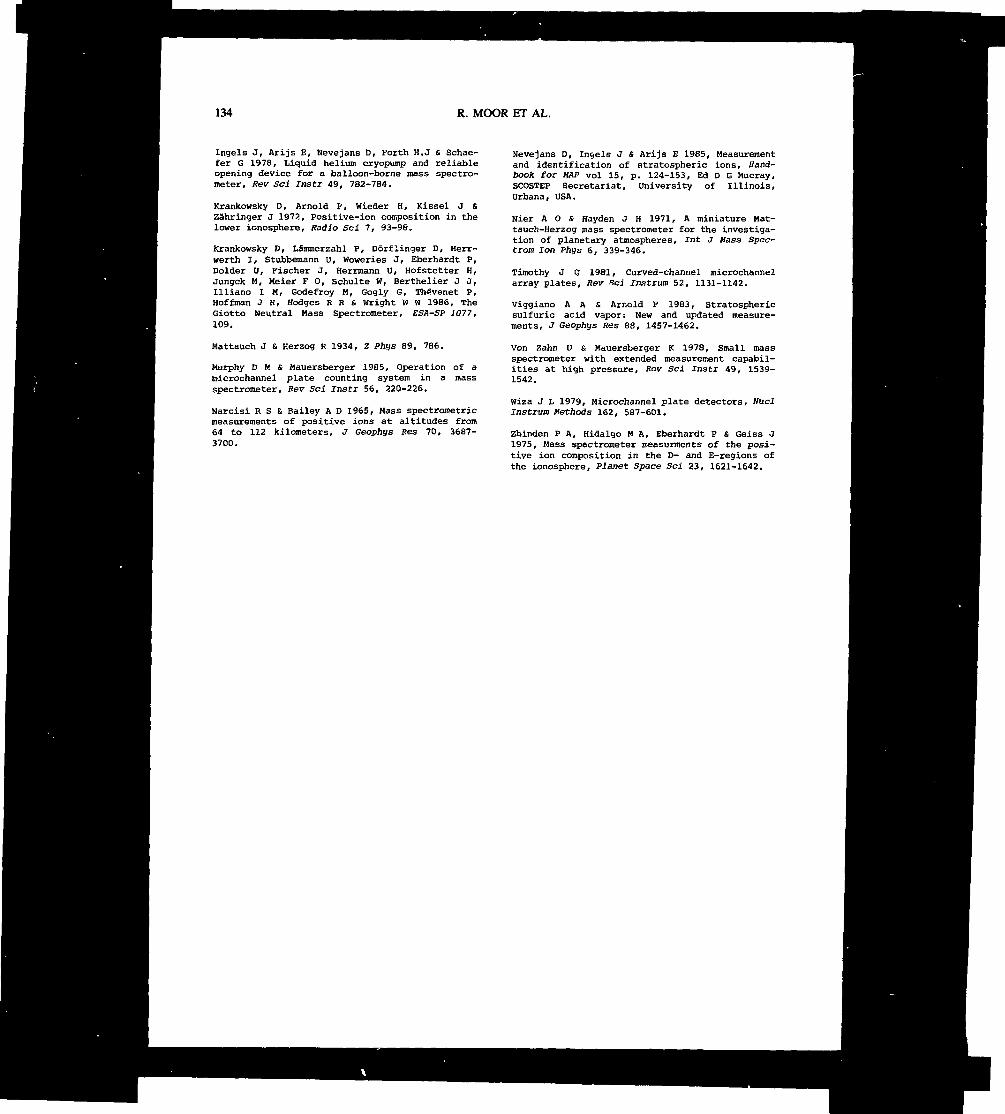
134 R. MOOR ET AL.
Ingels J, Arijs E, Nevejans D, Forth H.J & Schae-fer G 1978, Liquid helium cryopump and reliableopening device for a balloon-borne mass spectro-meter, Rev Sd Instr 49, 782-784.
Krankowsky D, Arnold P, Wieder H, Kissel J &Zâhringer J 1972, Positive-ion composition in thelower ionosphere, Radio Sd 7, 93-98,
Krankowsky D, LSmmerzahl P, Dorflinger D, Herr-werth I, Stubbemann U, Woweries J, Eberhardt P,Dolder U, Fischer J, Herrmann U, Hofstetter H,Jungck M, Meier F O, Schulte W, Berthelier J J,Illiano I M, Godefroy M, Gogly G, Thêvenet P,Hoffman J H, Hodges R R S Wright W W 1986, TheGiotto Neutral Mass Spectrometer, ESR-SP 1077,109.
Mattauch J S Herzog R 1934, Z Phys 89, 786.
Murphy D M S Mauersberger 1985, Operation of amicrochannel plate counting system in a massspectrometer, Rev Sd Instr 56, 220-226.
Narcisi R S S Bailey A D 1965, Mass spectrometricmeasurements of positive ions at altitudes from64 to 112 kilometers, J Geophys Res 70, 3687-3700.
Nevejans O1 Ingels J S Arijs E 1985, Measurementand identification of stratospheric ions. Hand-book for AHP vol 15, p. 124-153, Ed D G Mucray,SCOSTEP Secretariat, University of Illinois,Urbana, USA.
Nier A O S Hayden J H 1971, A miniature Mat-tauch-Herzog mass spectrometer for the investiga-tion of planetary atmospheres, Int J Mass Spec-trom Jon Phys 6, 339-346.
Timothy J G 1981, Curved-channel microchannelarray plates. Key «cd Jnstrura 52, 1131-1142.
Viggiano A A S Arnold F 1983, Stratosphericsulfuric acid vapor: New and updated measure-ments, J Geophys Res 88, 1457-1462.
Von Zahn U S Mauersberger K 1978, Small massspectrometer with extended measurement capabil-ities at high pressure. Rev Sd Instr 49, 1539-1542.
Wiza J L 1979, MicroChannel plate detectors, WuclInstium .Methods 162, 587-601.
Zbinden P A, Hidalgo M A, Eberhardt P s Geiss J1975, Mass spectrometer measurments of the posi-tive ion composition in the D- and E-regions ofthe ionosphere, Planet Space Sd 23, 1621-1642.
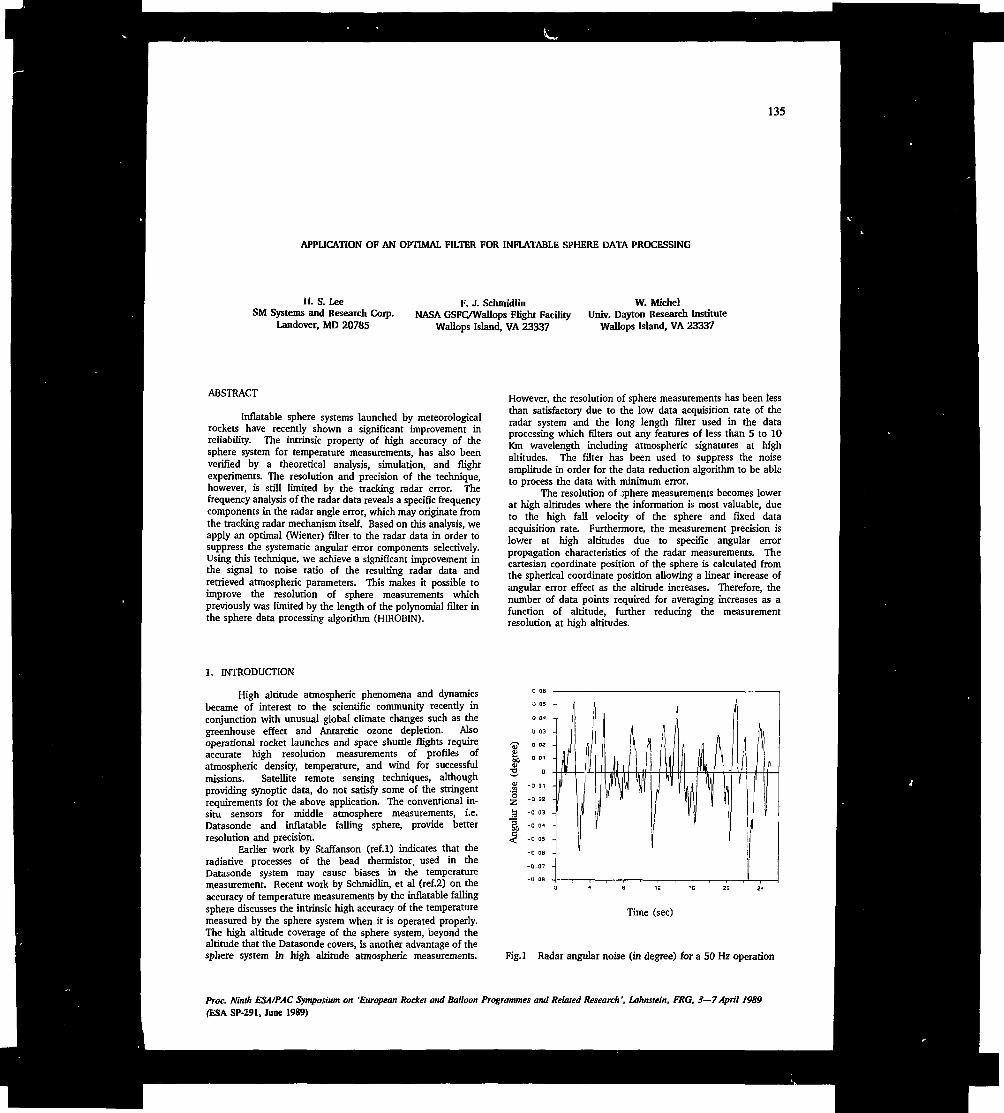
135
APPLICATION OF AN OPTIMAL FILTER FOR INFLATABLE SPHERE DATA PROCESSING
H. S. LeeSM Systems and Research Corp.
Landover, MD 20785
F. J. SchmidlinNASA GSFC/Wallops Flight Facility
Wallops Island, VA 23337
W. MichelUniv. Dayton Research Institute
Wallops Island, VA 23337
ABSTRACT
Inflatable sphere systems launched by meteorologicalrockets have recently shown a significant improvement inreliability. The intrinsic property of high accuracy of thesphere system for temperature measurements, has also beenverified by a theoretical analysis, simulation, and flightexperiments. The resolution and precision of the technique,however, is still limited by the tracking radar error. Thefrequency analysis of the radar data reveals a specific frequencycomponents in the radar angle error, which may originate fromthe tracking radar mechanism itself. Based on this analysis, weapply an optimal (Wiener) filter to the radar data in order tosuppress the systematic angular error components selectively.Using this technique, we achieve a significant improvement inthe signal to noise ratio of the resulting radar data andretrieved atmospheric parameters. This makes it possible toimprove the resolution of sphere measurements whichpreviously was limited by the length of the polynomial filter inthe sphere data processing algorithm (HIROBlN).
However, the resolution of sphere measurements has been lessthan satisfactory due to the low data acquisition rate of theradar system and the long length filter used in the dataprocessing which filters out any features of less than 5 to 10Km wavelength including atmospheric signatures at highaltitudes. The filter has been used to suppress the noiseamplitude in order for the data reduction algorithm to be ableto process the data with minimum error.
The resolution of sphere measurements becomes lowerat high altitudes where the information is most valuable, dueto the high fall velocity of the sphere and fixed dataacquisition rate. Furthermore, the measurement precision islower at high altitudes due to specific angular errorpropagation characteristics of the radar measurements. Thecartesian coordinate position of the sphere is calculated fromthe spherical coordinate position allowing a linear increase ofangular error effect as the altitude increases. Therefore, thenumber of data points required for averaging increases as afunction of altitude, further reducing the measurementresolution at high altitudes.
1. INTRODUCTION
High altitude atmospheric phenomena and dynamicsbecame of interest to the scientific community recently inconjunction with unusual global climate changes such as thegreenhouse effect and Antarctic ozone depletion. Alsooperational rocket launches and space shuttle flights requireaccurate high resolution measurements of profiles ofatmospheric density, temperature, and wind for successfulmissions. Satellite remote sensing techniques, althoughproviding synoptic data, do not satisfy some of the stringentrequirements for the above application. The conventional in-situ sensors for middle atmosphere measurements, i.e.Datasonde and inflatable falling sphere, provide betterresolution and precision.
Earlier work by Staffanson (ref.l) indicates that theradiative processes of the bead thermistor, used in theDatasonde system may cause biases in the temperaturemeasurement. Recent work by Schmidlin, et al (ref.2) on theaccuracy of temperature measurements by the inflatable fallingsphere discusses the intrinsic high accuracy of the temperaturemeasured by the sphere system when it is operated properly.The high altitude coverage of the sphere system, beyond thealtitude that the Datasonde covers, is another advantage of thesphere system in high altitude atmospheric measurements.
Time (sec)
Fig.l Radar angular noise (in degree) for a SO Hz operation
Proc. Ninth ESA/PAC Symposium on 'European Socket and Balloon Programmes and Related Research', Lahnstein, FKG, 3—7April 1989(ESA SP-291, June 1989)
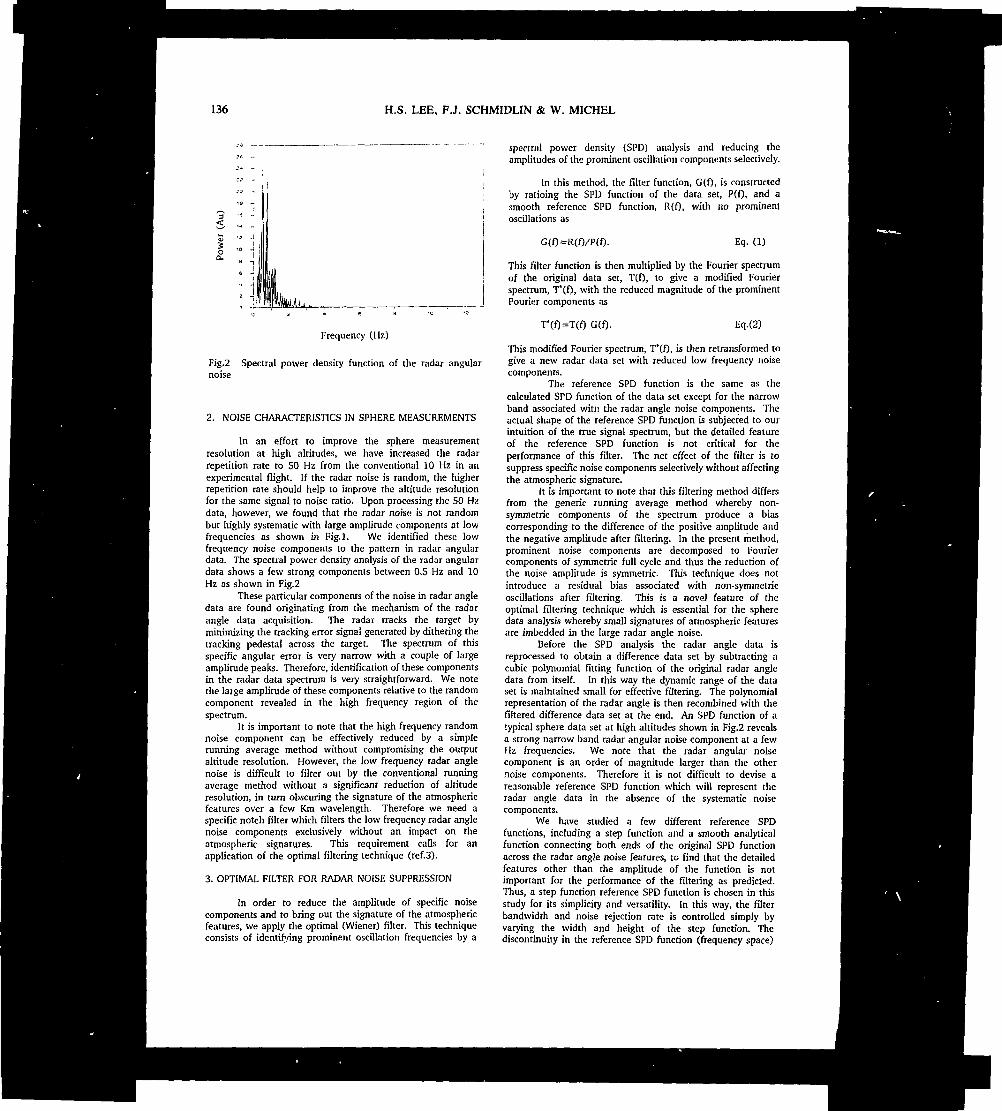
136 H.S. LEE, FJ. SCHMIDLIN & W. MICHEL
ICL.
Frequency (Hz)
Fig.2 Spectral power density function of the radar angularnoise
2. NOISE CHARACTERISTICS IN SPHERE MEASUREMENTS
In an effort to improve the sphere measurementresolution at high altitudes, we have increased the radarrepetition rate to 50 Hz from the conventional 10 Hz in anexperimental flight, [f the radar noise is random, the higherrepetition rate should help to improve the altitude resolutionfor the same signal to noise ratio. Upon processing the 50 Hzdata, however, we found that the radar noise is not randombut highly systematic with large amplitude components at lowfrequencies as shown in Fig.l. We identified these lowfrequency noise components to the pattern in radar angulardata. The spectral power density analysis of the radar angulardata shows a few strong components between 0.5 Hz and 10Hz as shown in Fig.2
These particular components of the noise in radar angledata are found originating from the mechanism of the radarangle data acquisition. The radar tracks the target byminimizing the tracking error signal generated by dithering thetracking pedestal across the target. The spectrum of thisspecific angular error is very narrow with a couple of largeamplitude peaks. Therefore, identification of these componentsin the radar data spectrum is very straightforward. We notethe large amplitude of these components relative to the randomcomponent revealed in the high frequency region of thespectrum.
It is important to note that the high frequency randomnoise component can be effectively reduced by a simplerunning average method without compromising the outputaltitude resolution. However, the low frequency radar anglenoise is difficult to filter out by the conventional runningaverage method without a significant reduction of altituderesolution, in turn obscuring the signature of the atmosphericfeatures over a few Km wavelength. Therefore we need aspecific notch filter which filters the low frequency radar anglenoise components exclusively without an impact on theatmospheric signatures. This requirement calls for anapplication of the optimal filtering technique (ref.3).
3. OPTIMAL FILTER FOR RADAR NOISE SUPPRESSION
In order to reduce the amplitude of specific noisecomponents and to bring out the signature of the atmosphericfeatures, we apply the optimal (Wiener) filler. This techniqueconsists of identifying prominent oscillation frequencies by a
spectral power density (SPD) analysis and reducing theamplitudes of the prominent oscillation components selectively.
In this method, the filter function, G(O, is constructedby ratioing the SPD function of the data set, P(f), and asmooth reference SPD function, R(f), with no prominentoscillations as
G(f)=R(f)/P(f). Eq. (1)
This filter function is then multiplied by the Fourier spectrumof the original data set, T(f), to give a modified Fourierspectrum, T*(f), with the reduced magnitude of the prominentFourier components as
G(f). Eq.(2)
This modified Fourier spectrum, T'(f), is then retransformed togive a new radar data set with reduced low frequency noisecomponents.
The reference SPD function is the same as thecalculated SPD function of the data set except for the narrowband associated with the radar angle noise components. Theactual shape of the reference SPD function is subjected to ourintuition of the true signal spectrum, but the detailed featureof the reference SPD function is not critical for theperformance of this filter. The net effect of the filter is tosuppress specific noise components selectively without affectingthe atmospheric signature.
It is important to note that this filtering method differsfrom the generic running average method whereby non-symmetric components of the spectrum produce a biascorresponding to the difference of the positive amplitude andthe negative amplitude after filtering. In the present method,prominent noise components are decomposed to Fouriercomponents of symmetric full cycle and thus the reduction ofthe noise amplitude is symmetric. This technique does notintroduce a residual bias associated with non-symmetricoscillations after filtering. This is a novel feature of theoptimal filtering technique which is essential for the spheredata analysis whereby small signatures of atmospheric featuresare imbedded in the large radar angle noise.
Before the SPD analysis the radar angle data isreprocessed to obtain a difference data set by subtracting acubic polynomial fitting function of the original radar angledata from itself. In this way the dynamic range of the dataset is maintained small for effective filtering. The polynomialrepresentation of the radar angle is then recombined with thefiltered difference data set at the end. An SPD function of atypical sphere data set at high altitudes shown in Fig.2 revealsa strong narrow band radar angular noise component at a fewHz frequencies. We note that the radar angular noisecomponent is an order of magnitude larger than the othernoise components. Therefore it is not difficult to devise areasonable reference SPD function which will represent theradar angle data in the absence of the systematic noisecomponents.
We have studied a few different reference SPDfunctions, including a step function and a smooth analyticalfunction connecting both ends of the original SPD functionacross the radar angle noise features, to find that the detailedfeatures other than the amplitude of the function is notimportant for the performance of the filtering as predicted.Thus, a step function reference SPD function is chosen in thisstudy for its simplicity and versatility. In this way, the filterbandwidth and noise rejection rate is controlled simply byvarying the width and height of the step function. Thediscontinuity in the reference SPD function (frequency space)

INFLATABLE SPHERE DATA PROCESSING FILTER 137
ANOOYA, NORWAY
ILLFrequency (Hz)
Fig.3 Reference power density function used in the optimalfilter
has no direct effect in the reconstructed sphere data (timespace) in terms of continuity of the data set. We design theoptimum reference SPD function by adjusting the width andheight of the step function to filter the prominent radar anglenoise peaks exclusively to the level comparable to thebackground amplitude in the high frequency region as shownin Fig.3. Using this reference SPD function, we suppress theradar angle noise component by as much as ten fold.
4. SPATIAL RESOLUTION AND FILTER CHARACTERISTICS
The filter characteristics are governed by the referenceSPD function shape which is prescribed by the step functionacross the radar angle noise peaks. The location and width ofthis step function must be designed to suppress the radar anglenoise components exclusively without affecting the atmosphericfeatures of interest. Nevertheless this requirement is notalways met throughout the entire altitude range of coveragedue to the varying fall speed of the sphere as a function ofaltitude as shown in Fig.4. When the sphere is released nearthe apogee of the rocket trajectory (approximately 120 Km),the sphere accelerates to attain the terminal velocity. As thesphere falls further down, the terminal velocity decreases at thelower altitudes due to the increasing atmospheric density. Fora typical flight, the peak fall velocity reaches as high as 450m/sec near 80 Km altitude and decreases down to 50 m/secor less at 30 Km altitude. With this large dynamic range offall velocity a variable filter function is required in order toobtain a uniform altitude resolution.
Considering that the typical notch filter covers a rangebetween 0.5 Hz and 10 Hz and the peak fall speed is as highas 450 m/sec, the lower bound of the filter covers up to 2 Kmwavelength near the peak fall velocity. Consequently anyatmospheric features of 2 Km or smaller wavelength also willbe filtered in the vicinity of 80 Km altitude. This limitationbecomes relaxed at other altitudes where the fall velocity issubstantially lower, enabling retrieval of shorter wavelengthatmospheric features. Considering the specific filtercharacteristics and the apogee and terminal velocityrelationship, one may be able to design the experiment tocover a specific altitude range of interest with a high spatialresolution.
100
90
80
60
O SO
30
to
11/12/87 0041 UT
40 280 420 560
FALL VELOCITY (M/S)
TOO
Fig.4 Fall speed of a ROBIN of a typical flight as a functionof altitude
5. APPLICATION TO FLIGHT DATA
We apply the optimal filtering technique to anexperimental flight taken with the 50 Hz data acquisition rate.This data was taken at Andoya, Norway as a part of the MACEpsilon campaign during October, 1987. This data set wasfirst processed using the conventional ROBIN program (ref.4)which uses 10 Hz data to verify the data quality- The originaldata set was, therefore, convened to a 10 Hz data set byselecting one data point out of a successive five points. Theresult of this processing is shown in Fig.5. After this processwe have tried unsuccessfuly to process the 50 Hz data usingconventional ROBIN program with appropriate modification toaccount for the 50 Hz data rate. Later it was discovered thatthe magnitude of radar angle noise discussed above is so largeand the frequency of it so low that the polynomial filter usedin ROBIN program did not function properly, resulting inexcessive oscillation in the velocity and accelerationcalculations. The polynomial filter was not very useful inhandling the low frequency radar angle noise as discussedabove. Consequently, the reduced time interval (.02 sec)amplified the acceleration noise component by a factor of 25from the conventional 10 Hz data result.
The optimal filter was then successfully applied toprocess the 50 Hz data throughout the entire altitude rangefrom 100 km to 30 km. For the accuracy required the entiredata set was subdivided into 5 subsets with sufficient overlap

138 H.S. LEE, F.J. SCHMIDLIN & W. MICHEL
tooANDOYA. NORWAY
ANDOYA. NORWAY
I I I I I I I I I I I I I I I I I I I I
180 200 220 240 260
TEMPERATURE (0K)ISO 200 220 240 260
TEMPERATURE (0K)
280 300
Fig.5 Atmospheric temperature profile from operationalROBIN program (10 Hz)
points between successive sets which could then be filtered bythe optimal filter individually. The resulting subsets were thenfurther filtered using a Henning filter algorithm. The length ofthe Kenning filter was adjusted for each subset to providecomparable altitude resolutions throughout the entire set.Therefore the ultimate altitude resolution of the data will begoverned by the combination of the optimal filter and theHenning filter.
The resulting subsets of data are then recombined to afinal data set. The data points at the overlap regions arereconstructed by summing the two segments of data sets usinga weighting function which is linearly varying from one end ofthe overlap segment tc the other. In this way, the secondderivative of the data set becomes free of artificial biasoriginating from the averaging of the overlap data sets, thusproviding a continuity in the retrieved atmospheric parametersacross the overlap region. A preliminary result of 50 Hz spheredata reduced using the optimal filter and successive short filtersin the ROBIN program is shown in Fig.6. As one can notice bycomparing Fig.5 and Fig.6, the optimal filter offers a possibilityof improving the resolution of the sphere technique at highaltitudes. The optimal filter technique enables us to processthe 50 Hz data suggesting a possibility of improving the signalto noise ratio and consequently improving the altituderesolution.
Fig.6 Atmospheric temperature profile from a preliminaryoptimal filter algorithm (50 Hz)
REFERENCES
1. F.L. Staffanson, "Evaluation and Calibration of a NovelB îdiation-Diversity Rocket Meteorological Temperature Sensor",NASA Progress Report, Contract NAS5-2627, Oct. 1976.
2. F.J. Schmidlin, H.S. Lee, and W. Michel, "Evidence forAccurate Temperatures from the Inflatable Falling Sphere",Proc. 9th ESA Symposium on European Rocket and BalloonProgrammes and Related Research, Lahnstein, FRG, April, 1989.
3. L.R. Rabiner, and B. Gold, "Theory and Application ofDigital Signal Processing", Pretice-Hall, 1975.
4. J.K. Luers, "A Method of Computing Wind, Density,Temperature, Pressure, and Their Associated Errors from theHigh Altitude ROBIN Sphere Using an Optimum FUter", Univ.of Dayton Research Institute Contract Report No. F19628-C-0102. AFCRL-70-0366, 1970.

SESSION 7IONOSPHERE/MAGNETOSPHERE
Chairman:J. Rôttger
141
PRELIMINARY RESULTS OF THE ROCKET AND SCATTER EXPERIMENTS "ROSE"-MEASUREMENTS WITH THE NEWLY DESIGNED SPHERICAL PROBE-
G. Rose
Max-Planck-Institut fur Aeronomie, D-3411 Katlenburg-Lindau, FRG
ABSTRACT
The ROcket and Scatter Experiments (ROSE) were designed tomeasure at the same time in-situ and together with STARE andEISCAT the parameters characterizing the modified two-streamand the gradient drift instabilities occurring under radar auro-ral conditions in the polar E-region between about 90 km and120 km. Four rockets were instrumented and launched success-fully, two from Andenes: Nov. 26, 1988, 17:00 UT, and Dec. 5,'1988,22:33 UT, and two from ESRANGE-Kiruna:F»6. 7,1989,23:36:30 UT1 ancf Fefc. 9,1989,23:42 UT. Each rocket contained'nine different experiments and a star sensor. Because the exper-iments were carried out very recently, only a few preliminaryresults can be communicated by some of the individual exper-imenters yet. This paper mainly deals with some of the totalA.C. E-field measurements in the frequency range from 120 Hzto 3.5 kHz obtained with the small (0=23cm), newly designedspherical probe. A joint paper taking into account all the resultsfrom the individual measurements will be published in time.
Keywords: Rocket Experiments, Plasma Instabilities, AuroralE-region, Coherent and Incoherent Backscatter.
1. THE MEASURED INSTABILITIES AND THEACQUISITION OF THE LAUNCH CRITERIA
The scientific payload with the different instruments, as well asthe scientific aim of the combined ground-based and in-situ mea-surements have been described earlier already (Réf. 1). There-fore only a short summary is given here.
There are two important instabilities occurring under radar au-roral conditions in the E-region: the modified two-stream andthe gradient drift instability, (Réf. 2).
If there is a difference in the bulk velocity of the electrons rela-tive to the ions, a deviation from the Maxwell-distribution mayoccur, such that the electrons -in the frame of the ions- havea "bump in the tail" with the number densities N(V) increas-ing in a certain velocity range, say, from VD to VI (v\ > VQ). Itcan easily be shown that there are more particles present in thisrange, feeding energy into the always present weak oscillationsof the plasma, than energy is fed from these weak waves to theparticles.
To excite the modified two-stream instability the drift velocitydifference has to exceed a certain threshold velocity perpendicu-lar to the earth magnetic field which is of the order of the velocityof the ion acoustic waves which is normally between 350 and 400m/s in the E-region.
Because the B-field is (nearly) vertical in the auroral region,a sufficiently large horizontal E-field causes an ExB drift and,the threshold drift vector velocity difference perpendicular tothe earth magnetic field can be exceeded. The drift velocitydifference again is due to the different mobilities of the electronsand ions caused by the collisions with the neutrals. The unstablewaves excited by this instability propagate within a small cone atnearly right angles relative to the B-field. The associated wave-lengths are of the order 0.5-5 m, the frequencies are roughlywithin about 50Oa-1 - SOOOs"1.
In case of the gradient drift instability a density gradient has tobe present in the plasma. The destabilizing force is again an ExBdrift. For the gradient drift instability nothing like a thresholdexists. Both the dispersion relations of these two instabilities arethe same. The frequencies of the associated unstable waves areroughly of the order 2s"1 — 20Os"1 and the wavelengths rangefrom roughly about 10 m to 1000 m, (Réf. 2, 3).
The unstable waves produced by these instabilities can be de-tected by suitable VHF radars as e.g. by the STARE sys-tem, (Réf. 4). The Scandinavian Twin Auroral Radar SystemSTARE, consisting of two radar stations at Malvik/ Norway andHankasalmi/Finland, is able to monitor an area of 230,000 km2
over northern Scandinavia, (Ref.4). The data can be transmittedvia modems by telephone to the launching site.
A quasi on-line data evaluation by a suitable computer at therelevant site enables to observe the phase velocity vectors of themeasured Im irregularities on screen in the whole range of obser-vation at a spatial resolution of 15x15 km2 and at a temporal of20s. If desired, the measurements of each of the individual twoSTARE stations can be observed alone to obtain the measuredphase velocity components along the 8 adjacent individual beamdirections of the station, and the field-strength distributions ofthe received signals backscattered from the observed wave pat-terns at the same time.
The STARE vector observations and a phone connection to EIS-CAT/Troms0 during the hot phase preceding each launch -thedrift velocity vector observations above the prospected rocketapogee of the three EISCAT stations were communicated- de-termined the go or no go condition, provided that all the otherparameters were ok, e.g. the winds were small enough.
The wanted launch conditions aimed at a homogenious phasevector velocity distribution around the rocket trajectory at sig-nificant speeds: at medium (about 300-500m/s) and high speeds(above 600-700m/s), if possible.
Proc. Ninth ESA/PAC Symposium on 'European Rocket and Balloon Programmes and Related Research', Lahnstein. FRG, 3—7April 1989(ESA SP-291, June 1989)
142 G. ROSE
2. THE MKASUHED PAHAMETEIlS, IN-SlTU ANDGROUND-BASED
The spatial arrangement of the nine different experiments con-tained in the payload, as well as the in-situ and ground-based-partly redundantly- measured parameters have been publishedearlier already, see Réf. 1. The measured parameters included:the D.C. and A.C. E- and B-fields, electron density and electrontemperature along the rocket trajectory at a high temporal res-olution, the ion mass distribution and the density of the neutralair.
The ground-based observations included, from STARE: The scat-tering intensities, the mean vector Doppler velocities and thespectral distributions of the scattered signals; and from EISCAT:The ion drifts, ion temperatures and the profile of electron den-sity, lonosonde and the earth magnetic field data were availablefrom both launching sites. Riometer observations were more orless disturbed from time to time at both the stations.
3. SCIENTIFIC AIM OF THE PROJECT
Plasma instabilities play an important role in the physics of thehigh latitude E-region. Despite the fact that they have beenstudied quite along time from the experimental and theoreticalpoint of view, many problems still remain. Some of the questionsto be solved by the Rocket and Scatter Experiments are thefollowing:
(a) Of the three parameters measured by STARE -the ampli-tudes of the scattered waves, the Doppler shifts, and the spec-tral distributions of the backscattered signals- the Doppler shiftis the best understood. Therefore it is widely used. Startingwith a simplified wave dispersion relation based on fluid theoryit is possible, to obtain the drifts from the observed phase veloc-ities as determined by the Doppler shifts. The drift velocities onthe other hand are proportional to the underlying E-fields whichcan thus be determined at the same time.
Comparisons between the EISCAT and STARE measurementshave shown, however, that the drift velocities obtained from bothobservations do not agree at higher speeds (Réf. 5, Réf. 6),because the phase velocities measured by STARE appear to belimited at velocities not much above the ion acoustic speed.
A more rigorous dispersion relation based on plasma theory,however, contains more parameters which must simultaneouslybe known, if again the E-fields shall be obtained at a higher accu-racy. It is one of the aims of the rocket and scatter experimentsto combine the ground-based and rocket observations with the-ory to obtain more information about this problem, e.g. on thequestion: what governs the phase velocity of the unstable wavesin the unstable cone?
(b) Another question is related to the true E-field amplitude dis-tribution, especially of the short scale two-stream waves, whichcould up to now not be observed without severe attenuationcaused by the large E-field probes used so far, having dimen-sions of typically 3-5 m.Using the newly designed spherical probe, measurements havebeen performed of these waves up to a frequency of 3500 Hzcontinuously during the four rocket flights. First results of thesein-situ observations are presented further down.(c) As far as the STARE amplitudes of the backscattered signalsand the spectral shapes of these echoes are concerned there isnot yet a suitable theoretical formulation available. Of course,data analyses (Réf. 7) show that the spectral width dependson the drift velocity. Theoretical simulations (Réf. 8) confirmthis. Moreover a strong dependence of the spectral shape on theangle between the radar line of sight and the direction of theearth magnetic field -the aspect angle- seems to exist. Together
with our combined ground-based and in-situ measurements it isprobable to obtain again more information about the relevantrelations.
4. T H E S P H E R I C A L PROBEIn the acoustic range, from 120 Hz up to 3.5 kHz, the A.C.electric fields of the unstable electrostatic waves, produced bythe modified two-stream and the gradiejit-drift instabilities, havebeen determined with a newly designed spherical probe (=KugeI-sonde: "KUSO"): The frequency range was limited by well tunedactive 10-pole, 0.1 dB Chebychef filters in each of the 3 channels.The surface of a hollow, metallized plastic sphere (4> = 23 cm)is divided into G separated, largest spherical segments with theangles at their centres being very nearly 90 degrees. Each twoof the diametrically located segments, forming a dipole, are con-nected to a symmetrical input current pre-amplifier of low inputimpedance inside the sphere. The remaining 8 spherical trianglesare connected to the common point of neutral reference. Thusthe sphere as a whole is conducting and equivalent to three elec-tric dipoles perpendicular to each other at the same time. Inthe following the sphere is assumed to be on floating potentialin the plasma.
Because of the very low input impedance of the amplifiers rela-tive to the prevailing impedance within the E-layer'of the sur-rounding ( t h i n ) ion sheath, connecting each of the 6 segments tothe plasma, the sphere can theoretically be treated in the sameway as an ideally conducting sphere (Réf. 9, Rcf 10). If, there-fore, the abo- : sphere is placed into a homogenious A.C. E-fieldof a plane r ectrostatic wave with the associated wave-lengthslarge compared to the diameter of the sphere, and with the ionsheath thin compared to it, the resulting displacement currentamplitude through a dipole of this sphere is:
/o ~ wF Eg cos a (D
a being the angle between the wave normal and the relevantdipole axis (= the line connecting tfie centres of two oppositespherical segments), F is the area of the spherical segment pro-jected into the direction of the associated dipole axis, EO isthe E-field amplitude in the plasma without thasphere present,w = 2?r/ the frequency, and /o the amplitude of the generateddisplacent current through the dipole under consideration. Thefactor of proportionality can be shown to be Se0. The factor 3is a consequence of the spherical geometry.
If there were only displacement currents present, then A/|, thesquare of the effective displacement current in A/ is:
A/2 = 4 (2)
The mentioned factor of 3 has to be considered in the above equa-tion by taking F three times the projected area of one sphericalsegment.
If the surrounding plasma is conductive, conductivity currentsare flowing at the same time through the spherical probe. If thesphere is on floating potential, the relation between the conduc-tivity current and the associated electric field in the free plasmacan be estimated in the foiling way:
The potential on the surface of the sphere is given by R,IC (R,is the resistivity of the ion sheath at the surface (x = O) ofthe sphere, if it is on floating potential, and if ln(im/me) >
R, = (3)
/c is the total conductivity current flowing into F, uf = 2)r/p theplasma frequency). The course of the potential as a function of

ROSE SPHERICAL PROBE 143
the radial distance x from the (large) sphere within the (small)ion sheath is given by:
= 00exp(-|i|/Aw).
AD is the Debye length:
A0 = (tre/me
(4)
(5)
(6)
Assuming the free plasma E-field equal to E = E(x = pAjj) oneobtains:
and E(X) is given by:
E =AD exp(p) ' (7)
Adding the sqares: A/2 + A/j = A/2 and solving for Eejf(f) =2, one finally arrives at the total field:
...I >
The factor exp(2p) can later on be determined experimentally bycomparing E(f) with the final results of the D.C. E-field probe,because that instrument covers a part of the lower frequencyrange up to several hundred Hertz at the same time. For themoment, p was assumed arbitrarily: p = 3, and m, = 5 • 10~26 kgwas used. A more accurate theoretical evaluation of the reac-tion of the spherical probe to the unstable waves along its waythrough the ionospheric E-layer is intended to be used later on.
The experimental results obtained so far are encouraging asshown below.
5. SOME PRILIMINARY EXPERIMENTAL RESULTS
All the four instrumented rockets were successfully launched. Inthe following some preliminary results obtained from the secondand the fourth launch, F2 and F4, are briefly communicated.
F2 was launched on Dec. 5, 1988 at 22:33 UT from Andenes.Fig. 1 shows two STARE records obtained 100 s and 140 s afterlaunch when the rocked had reached heights of about 85.3 kmand 106. 8km on upleg. The phase velocities around the prospect-ed rocket trajectory, indicated in Fig. 1 , were between about200m/s up to about 500 m/s at the most. The velocities weregenerally directed to the east with some smaller components tothe south.
The following STARE phase velocity measurements -which arenot shown here- pointed to decreasing scattering intensities ofthe 2m STARE waves after the rocket had passed the E-layer.As a result, some of the velocity vectors around the northernpart of the rocket trajectory disappeared shortly after the flight,because the scattering intensities were too low to be correctlyindicated at that position.
In the record of the earth magnetic field, see Fig. 2, the momentof lift-off is indicated by an arrow.
The ionogram of Fig. 3 was obtained when the rocket was just ondownleg, passing a height of about 113.2 km. Unfortunately, theprospected apogee of 125 km was not reached. Due to a certaintip-off angle of the rocket when leaving the launcher, the apogeedid not exceed a height of about 113.3 km. It shall be noted,that the critical E-layer frequency was about 4 MHz during theflight.
STARE
1988-12-05 22:34:40 1000m/s= »
w ri
Q
LA
TIT
Uo I
•
• .. •-. • • \ m. • «-._».., •.,. ».._ ».__ • •, _ «...«-. • »... *.. •
\ ••-• *• *-. Y*- *-."- •••• "•-• "•- •-<•••>. *-. *•- ••*.*-.." *--,.*-*••. •-, •.. X *.. ».. •.. ». «^ «.s * "-. •. _•..._•... »... •. •_.
_ m
» 15 16 17 It » 21 21 12 i) 11
LONGITUDE
1988-12-05 22:35:20 1000m/s= "
g
LONGITUDE
Figure 1: Two STARE phase velocity vector presentations ob-tained during the F2 flight. Temporal resolution: 20s,sample separation: 15 km. The starting points of thevectors are marked by dots.
The effective total current I-eff [A] measured in the frequencyrange from 120 Hz to 3500 Hz by the spherical probe in the E-layer during the F2 flight is plotted in Fig. 4. Each individualI-eff current represents a total of 8704 individual measurementpoints obtained during 1.088 s.The ion drift velocities during this flight as deduced from theEISCAT observations were reported to be between about 400 m/s
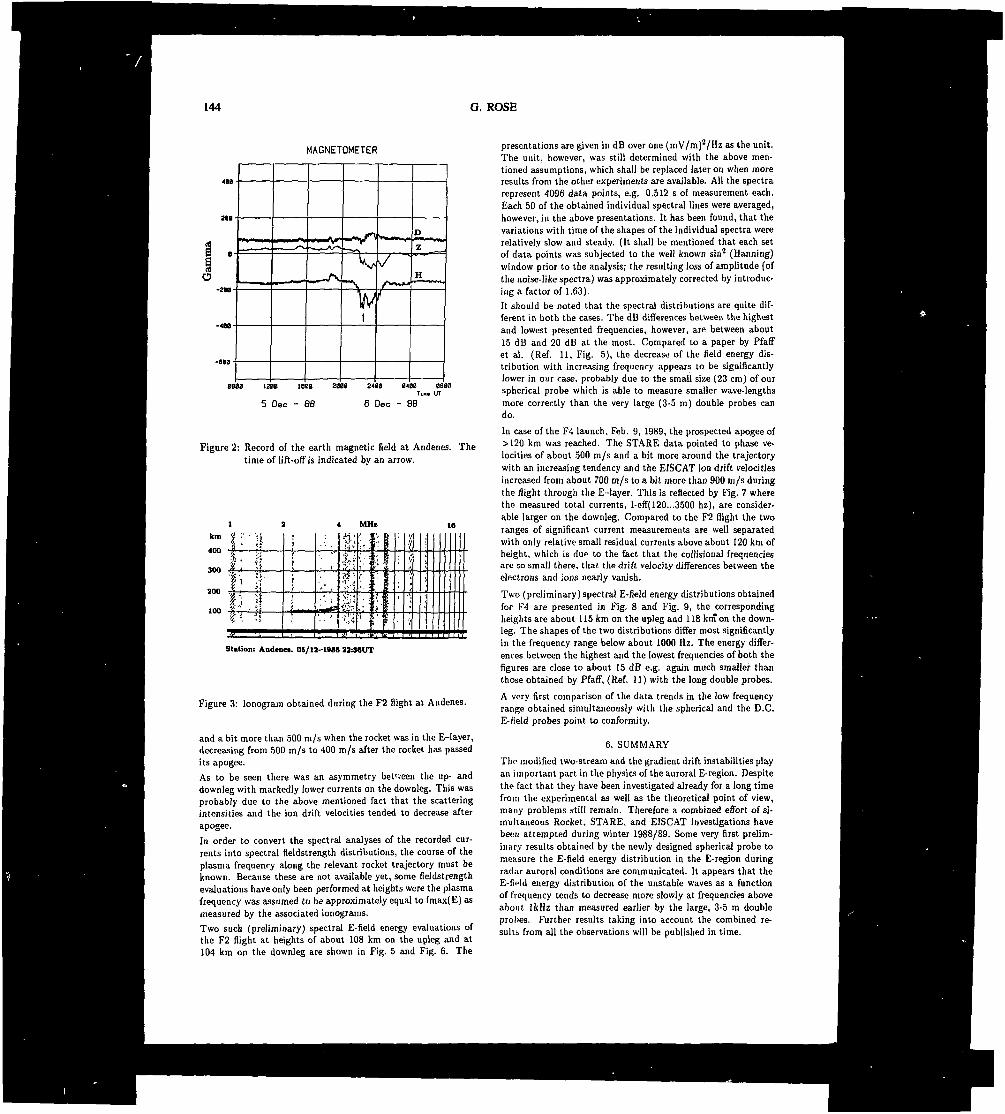
144 G. ROSE
MAGNETOMETER
IO
1210 loos zeee urn
5 Deo - 8B 6 Dec - SB
Figure 2: Record of the earth magnetic field at Andenes. Thetime of lift-off is indicated by an arrow.
Station: Andenn. 08/12-188« 22:MUT
Figure 3: lonogram obtained during the F2 flight at Andenes.
and a bit more than 500 m/s when the rocket was in the E-layer,decreasing from 500 m/s to 400 m/s after the rocket has passedits apogee.As to be seen there was an asymmetry between the up- anddownleg with markedly lower currents on the downleg. This wasprobably due to the above mentioned fact that the scatteringintensities and the ion drift velocities tended to decrease afterapogee.In order to convert the spectral analyses of the recorded cur-rents into spectral fieldstrength distributions, the course of theplasma frequency along the relevant rocket trajectory must beknown. Because these are not available yet, some fieldstrengthevaluations have only been performed at heights were the plasmafrequency was assumed to be approximately equal to fmax(E) asmeasured by the associated ionograms.Two such (preliminary) spectral E-field energy evaluations ofthe F2 flight at heights of about 108 km on the upleg and at104 km on the downleg are shown in Fig. 5 and Fig. 6. The
presentations are given in dB over one (mV/m)2 /Hz as the unit.The unit, however, was still determined with the above men-tioned assumptions, which shall be replaced later on when moreresults from the other experiments are available. All the spectrarepresent 4096 data points, e.g. 0.512 s of measurement each.Each 50 of the obtained individual spectral lines were averaged,however, in the above presentations. It has been found, that thevariations with time of the shapes of the individual spectra wererelatively slow and steady. (It shall be mentioned that each setof data points was subjected to the well known sin2 (Banning)window prior to the analysis; the resulting loss of amplitude (ofthe noise-like spectra) was approximately corrected by introduc-ing a factor of 1.63).It should be noted that the spectral distributions are quite dif-ferent in both the cases. The dB differences between the highestand lowest presented frequencies, however, are between about15 dB and 20 dB at the most. Compared to a paper by Pfaffet al. (Réf. 11, Fig. 5), the decrease of the field energy dis-tribution with increasing frequency appears to be significantlylower in our case, probably due to the small size (23 cm) of ourspherical probe which is able to measure smaller wave-lengthsmore correctly than the very large (3-5 m) double probes cando.
In case of the F4 launch, Feb. 9, 1989, the prospected apogee of>120 km was reached. The STARE data pointed to phase ve-locities of about 500 m/s and a bit more around the trajectorywith an increasing tendency and the EISCAT ion drift velocitiesincreased from about 700 m/s to a bit more than 900 m/s duringthe flight through the E-layer. This is reflected by Fig. 7 wherethe measured total currents, I-eff(120...3500 hz), are consider-able larger on the downleg. Compared to the F2 flight the tworanges of significant current measurements are well separatedwith only relative small residual currents above about 120 km ofheight, which is duo to the fact that the collisional frequenciesarc so small there, that the drift velocity differences between theelectrons and ;ons nearly vanish.
Two (preliminary) spectral E-field energy distributions obtainedfor F4 are presented in Fig. 8 and Fig. 9, the correspondingheights are about 115 km on the upleg and 118 km on the down-leg. The shapes of the two distributions differ most significantlyin the frequency range below about 1000 Hz. The energy differ-ences between the highest and the lowest frequencies of both thefigures are close to about 15 dB e.g. again much smaller thanthose obtained by Pfaff, (Réf. 11) with the long double probes.
A very first comparison of the data trends in the low frequencyrange obtained simultaneously with the spherical and the D.C.E-field probes point to conformity.
6, SUMMARY
The modified two-stream and the gradient drift instabilities playan important part in the physics of the auroral E-region. Despitethe fact that they have been investigated already for a long timefrom the experimental as well as the theoretical point of view,many problems still remain. Therefore a combined effort of si-multaneous Rocket, STARE, and EISCAT investigations havebeen attempted during winter 1988/89. Some very first prelim-inary results obtained by the newly designed spherical probe tomeasure the E-field energy distribution in the E-region duringradar auroral conditions are communicated. It appears that theE-fii-ld energy distribution of the unstable waves as a functionof frequency tends to decrease more slowly at frequencies aboveabout IkHz than measured earlier by the large, 3-5 m doubleprobes. Further results taking into account the combined re-sults from all the observations will be published in time.

ROSE SPHERICAL PROBE 145
h - [km]no
E-9
1.2E-9
8E-IO
eC. E-10
E-IO
2E-10
*+-H-
+ -H +
+
t v
F2: DEC. 5, 1988START: 22:33 UT
120 ISO 200 220Flugnit [j]
240
Figure 4: Total currents I-eff(120 Hz - 3500 Hz) measured by the 23 cm spherical probe during the F2 flight on Dec. 5,1988at Andenes. (8704 samples= 1.088s per point).
60 70 80 90 100 110
h - [km]
120 100 90
E-9
3E-9
£ 2g E-9
E-9
F4: FEB. 9, 1989START: 23:42 UT
+
+
-H*-*
+
+
•f
60 80 100 120 140 160 180 200 220 240Flugzeit [*]•
260 280
Figure 7: Total currents I-eff (120 Hz - 3500 Hz) measured during the F4 flight on Feb. 9,1989 at Esrange.
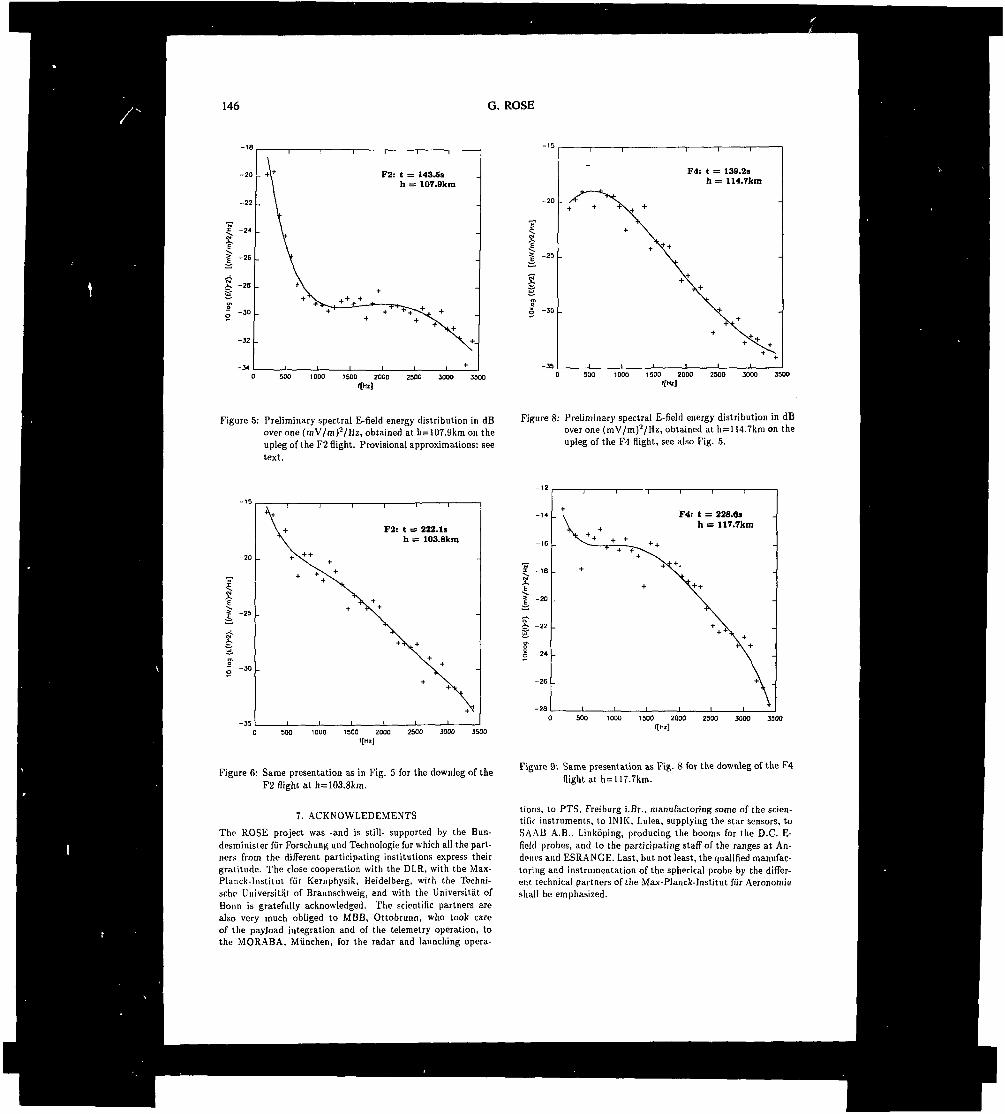
146 G. ROSE
r24
I.ȣ -28
1 1 r
F2: t = 143.Ssh = 107.9km
s5 -30
F4: t = 139.2sh = 114.7km
SOO 1000 ISOO 2000 2500 3000 3500
'[Hz]
Figure 5: Preliminary spectral E-field energy distribution in dBover one (mV/tn)2/Hz, obtained at h=107.9km on theupleg of the F2 flight. Provisional approximations: seetext.
Figure 8: Preliminary spectral E-field energy distribution in dBover one (mV/m)2 /Hz, obtained at h=114.7km on theupleg of the F4 flight, see also Fig. 5.
500 1ODD 1500 2000 2500 3000 3500
Figure 6: Same presentation as in Fig. 5 for the downleg of theF2 flight at h=103.8km.
7. ACKNOWLEDEMENTS
The ROSE project was -and is still- supported by the Bun-desrninister fur Forschung und Technologie for which all the part-ners from the different participating institutions express theirgratitude. The close cooperation with the DLR, with the Max-Planck-Insti tut fiir Kernphysik, Heidelberg, wi th the Techni-schc Universitat of Braunschweig, and with the Universitat ofBonn is gratefully acknowledged. The scientific partners arealso very much obliged to MBB, Ottobrunn, who took careof the payload integration and of the telemetry operation, tothe MORABA, Miinchen, for the radar and launching opera-
Figure 9: Same presentation as Fig. 8 for the downleg of the F4flight at h=117.7km.
lions, to PTS, Freiburg i.Br., manufacturing some of the scien-tific instruments, to INIK, Lulea, supplying the star sensors, toSAAB A.B., Linkôping, producing the booms for the D.C. E-fielcl probes, and to the participating staff of the ranges at An-dcnes and ESRANGE. Last, but not least, the qualified manufac-turing and instrumentation of the spherical probe by the differ-ent technical partners of the Max-Planck-lnstitut fiir Aeronomieshall be emphasized.
ROSE SPHERICAL PROBE 147
5.
8. REFERENCES
Rose G1 The rocket and scatter experiment 'ROSE', -presen-tation of the scientific payload, Proceedings of the 8th ESASymposium on European Rocket and Balloon Programmesand Related Research, Sunne, Sweden, 17- 23 May 1987(ESA SP270 ,Aug. 1987). 405-409.
Fejer B G & Kelly M C 1980, Ionospheric irregularitiesin the ionosphere, Rev. Geophys. Space Phys. Res. 18,401-454.
Schlegel K 1985, Plasma instabilities in the auroral E-region, Proceedings on European Rocket and Balloon Pro-grammes and Related Research, Leon, Norway, 5-11 May1985 (EsaSP-229, July 1985).
Greenwald R A, Weiss W, Nielsen E & Thomson N R 1978,STARE: A new radar auroral backscatter experiment innorthern Scandinavia, Radio Science 13,1021-1039.
Nielsen E & Schlegel K 1984, Coherent radar doppler mea-surements and their relationship to the ionospheric elec-tron drift velocity, J. Geophys. Res. 90, 3498-3504.
10.
11.
Nielsen E & Schlegel K 1985, A first comparison of STAREand EISCAT electron drift velocity measurements, J. Geo-pht/s. RfS. 88, 5745-5750.
Haldoupis C I, Nielsen E & lerkic 1984, STARE Doppjerspectral studies of westward electro jet radar aurora, Planet.Space Sd., 1291-1300.
St-Maurice J P & Schlegel K 1983, A theory of coherentradar spectra in the auroral E-region, J. Geophys Res. 88,4087-4095.
Becker R. 1944, Théorie der Klektrizital, Band I, B.C.Teubner-Verlag. Leipzig und Berlin 12. und 13. Auflage.
Rose G 1986, Eine Kugelsonde sur In-situ-Messung elek-trostatischer Plasmawellen in Radar-Nordlichtern, Inter-nal Report MPAE-W-46-86-19, 1-20.
PfaffR F, Kelley M C, Fejer B G, Kudeki E, Carlson C W,Pedersen A & Hausler B, Electric field and plasma densitymeasurements in the aurora] electrojet, J. Geophys. Res.89, 236-244.

ELECTRIC FIELD MEASUREMENTS ON BOARD THE ROSE PAYLOADS
Klaus Rinnert
Max-Planck-Institut fiir Aeronomie, D-3411 Katlenburg-Lindau, FRG
The main scientific objective of the ROSE project is tounderstand the details of plasma wave generation in thehigh latitude E-region as a result of d.c. electric fields (two-stream instabilities and gradient drift instabilities). Theseplasma waves are responsible for the echoes of r.f. wavesused in auroral radars such as STARE. In-situ measurementof d.c. and a.c. electric fields is an important subject inthis project. The electric field measuring instrument was a"floating double probe" system utilizing two crossed boompairs. The deployed tip-to-tip distance was 3.6 m and thetwo boom pairs were mounted 2 m apart. The potentialdifference between any two sensors mounted on the boomends was measured simultaneously and sampled with a rateof 4 kHz and an amplitude resolution correspondig to 0.1mV/m. Because the attitude information obtained from astar sensor is not yet available the data reduction could notyet be performed. The following brief report is supposed togive a rough impression of the measured a.c. electric fields.
ROSE F4, Konol 1, 9. Feb. 1989
500 -
„ 400 .
300 -
200 . •
100 .
!2O
80
20
50 100 150 200 250 300
FLIGHT TIME [s] START 23:42:00 UT
Wave activity measured on board ROSE paytoad F4.(For further details see text.)
For instance, "Kanal 1" provides the potential differencebetween the two probes of the upper boom pair. The a.c.signal of this channel has been divided into 250 ms inter-vals, which is about 1/3 of a spin period, and subjected toa FFT. The amplitude spectra of four consecutive intervalshave been added yielding 1-second averages as a measureof the wave activity versus flight time. The figure shows acontour plot of data: spectral amplitude in arbitrary scaleversus frequency and nighttime for the fourth flight. Theasterisks indicate the altitude of the payload versus flighttime. Between about 95 km and 115 km of altitude the pay-load has passed a region of wave activity. The occurrenceof wave fields is very limited in altitude, and in this casethe measurements are similar for upleg and downleg whichoccurred about 30 km apart. Another peculiarity is that inthe lower part of this region of wave activity the signal isdominated by low frequency waves with frequencies aroundthe cyclotron frequency of the dominant ions.
All four flights provided interesting data and it is expectedthat the final evaluation will yield insight into the detailsof these plasma instabilities.
Proc. Ninth ESA/PAC Symposium on 'European Rocket and Balloon Programmes and Related Research'. Lahnstein FRG 3-7Anril 19X9(ESA SP-291, June 1989) ' ^

PRELIMINARY RESULTS OF ELECTRON DENSITY FLUCTUATIONMEASUREMENTS DURING THE ROSE ROCKET FLIGHTS
K. Schlegel
Max-Planck-Institut fur Aeronomie, Katlenburg-Lindau, FRG
In this rocket experiment a retarding potential analyzerwas used in the saturation mode in which the currentthrough the grid system onto the collector is proportionalto the ambient electron density. A fast sampling of thiscurrent allowed to measure density samples every 0.25 ms,a FFT of one second intervals thus yielding density fluctu-ations in the range of 0-2000 Hz. Two sensors have beenused, one looking along the rocket spin axis, the secondperpendicular to it. During all four ROSE flights the ex-periment worked well and supplied excellent data. Sincethe detailed evaluation depends crucially on the rocket at-titude and spin information which was not available yet,only some preliminary results are given below.
1. The height range where enhanced density fluctuationscaused by the modified two stream plasma instabilityhave been observed extends from about 95 km to about110 km and is thus slightly below the region whereechoes from the same instability have been detectedwith auroral radars. The maximal relative density fluc-tuations are of the order of a few percent in agreementwith similar earlier rocket experiments.
2. The frequency spectra of the density fluctuations showthat the power is mainly concentrated in the range of afew Hz to about 500 Hz. A new and interesting resultwas that the average frequency of the fluctuations withthe highest power levels increased with altitude.Assuming that the unstable waves propagate with theion acoustic velocity c,, this average frequency can beinterpreted as an average wavelength. We thus foundthat the average wavelength of the irregularities is de-creasing with altitude. This has probably to do withthe ion-neutral collision frequency responsible for thedamping of the unstable waves.
3. Using the above mentioned results an estimate of thek-spectrum of the unstable waves is possible. In therange of 0.5 < k < 10 m~' (0.6 < A < 12 m) the k-spectrum can be approximated by a power law with anexponent n = 0.52.
Detailed evaluations and interpretations of the experimen-tal results will be published in a forthcoming paper.
Proc. Ninth ESA/PAC Symposium on 'European Rocket and Balloon Programmes and Related Research ', Lahnstein, FRG, 3—7 April 1989
(ESA SP-291, June 1989)
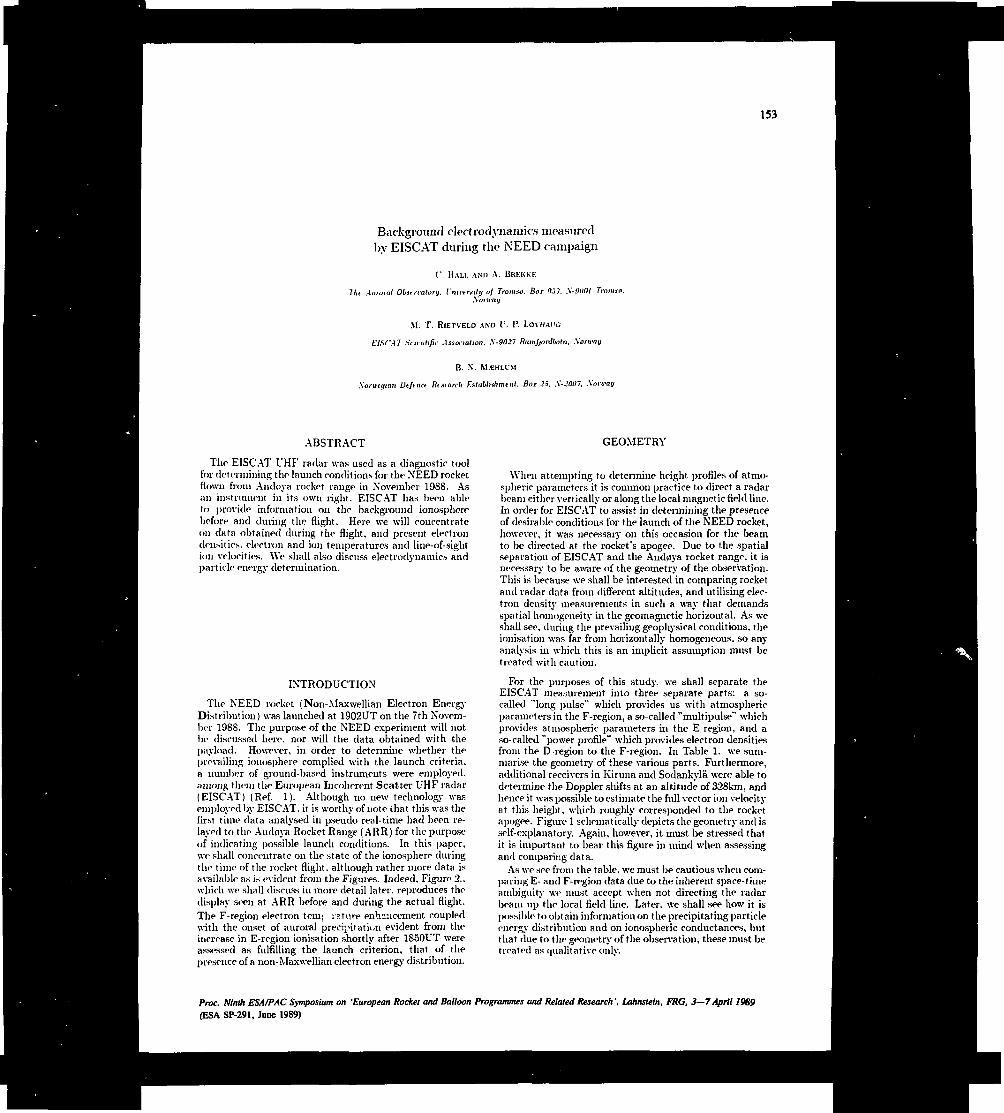
153
Background electrodynamics measuredby EISCAT during the NEED campaign
C. HAU. AND A. B R E K K K
'Hit Aiiiornl Ot>i<realory, I'nmmty oj Tromso. Bar .9,13. S-9UOI Tromia.\orway
M. T. RrETVELD AND V. P. LoVHAI'G
t'lfif'Al Scientific Astociatwn, .V-9027 Ramfjorilbotn. .\oru-aij
B. N. MfHLL-M
Xortregmn Uffuict Rtstairh Establishment. BOI 25. .V-.W7, .Voru'O!)
ABSTRACT
TIw EISCAT UHF radar was used as a diagnostic toolfor determining the launch conditions for the NEED rocketflown from Andoya rocket range in November 19S8. Asan instrument in its own right. EISC'AT has been ableto provide information on the background ionospherebefore and during the flight. Here we will concentrateon data obtained during the flight, and present electrondensities, electron and ion temperatures and line-of-sightion velocities. \Ve shall also discuss electrodynamics andparticle energy determination.
INTRODUCTION
The NEED rocket (Non-Maxwellian Electron EnergyDistribution) was launched at 1902UT on the 7th Novem-ber 1988. The purpose of the NEED experiment will notbe discussed here, nor will the data obtained with thepayload. However, in order to determine whether theprevailing ionosphere complied with the launch criteria,a number of ground-based instruments were employed,among them the European Incoherent Scatter UHF radar(EISC'AT) (Réf. 1). Although no new technology wasemployed by EISCAT. it is worthy of note that this was thefirst time data analysed in pseudo real-time had been re-layed to the Andoya Rocket Range (ARR) for the purposeof indicating possible launch conditions. In this paper,we shall concentrate on the state of the ionosphere duringthe time of the rocket flight, although rather more data isavailable as is evident from the Figures. Indeed, Figure 2..which we shall discuss in more detail later, reproduces thedisplay seen at ARR before and during the actual flight.The F-region electron terni i-nture enhancement coupledwith the onset of auroral precipitation evident from theincrease in E-region ionisation shortly after 1850UT wereassessed as fulfilling the launch criterion, that of thepresence of a non-Maxwellian electron energy distribution.
GEOMETRY
When attempting to determine height profiles of atmo-spheric parameters it is common practice to direct a radarbeam either vertically or along the local magnetic field line.In order for EISCAT to assist in determining the presenceof desirable conditions for the launch of the NEED rocket,however, it was necessary on this occasion for the beamto be directed at the rocket's apogee. Due to the spatialseparation of EISCAT and the Andoya rocket range, it. isnecessary to be aware of the geometry of the observation.This is because we shall be interested in comparing rocketand radar data from different altitudes, and utilising elec-tron density measurements in such a way that demandsspatial homogeneity in the geomagnetic horizontal. As weshall sec. during the prevailing geophysical conditions, theionisation was far from horizontally homogeneous, so anyanalysis in which this is an implicit assumption must betreated with caution.
For the purposes of this study, we shall separate theEISCAT measurement into three separate parts: a so-called "long pulse" which provides us with atmosphericparameters in the F-region, a so-called "multipulse" whichprovides atmospheric parameters in the E-region, and aso-called "power profile" which provides electron densitiesfrom the D-region to the F-region. In Table 1. we sum-marise the geometry of these various parts. Furthermore,additional receivers in Kirima and Sodankylà were able todetermine the Doppler shifts at an altitude of 328km, andhence it was possible to estimate the full vector ion velocityat this height, which roughly corresponded to the rocketapogee. Figure 1 schematically depicts the geometry and isself-explanatory. Again, however, it must be stressed thatit is important to bear this figure in mind when assessingand comparing data.
As we see from the table, we must be cautious when com-paring E- and F-region data due to the inherent space-timeambiguity we must accept when not directing the radarbeam up the local field line. Later, we shall see how it ispossible to obtain information on the precipitating particleenergy distribution and on ionospheric conductances, butthat due to the geometry of the observation, these must betreated as qualitative only.
Proc. Ninth ESA/PAC Symposium on 'European Rocket and Balloon Programmes and Related Research', Lahnstein, FRG, 3—7April 1989
(ESA SP-291, June 1989)
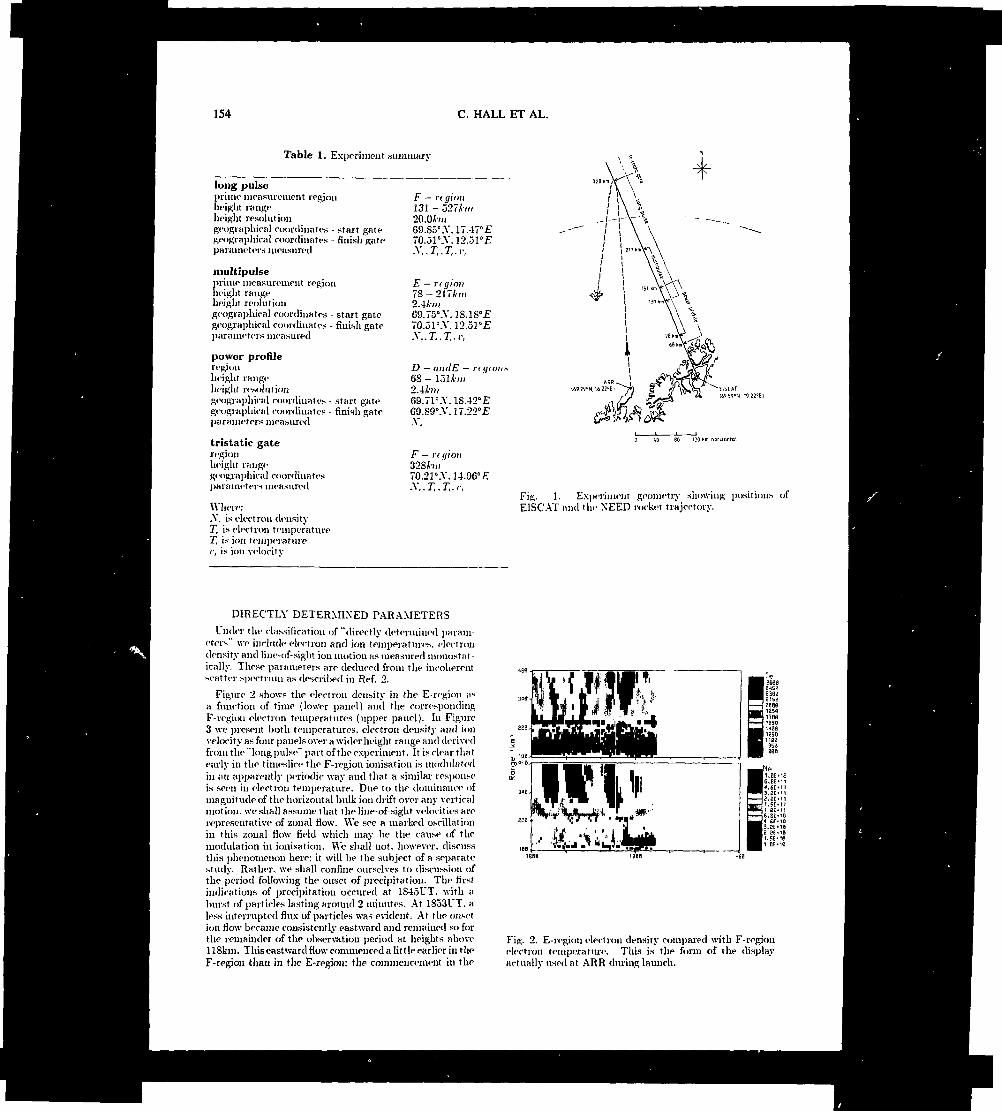
154 C. HALL ET AL.
Table 1. Experiment summary
i'f yon
long pulseprime measurement region Jp — r< (jitmheight range 131 - 327A-mheight resolution '20Mmgeographical coordinates - start gate 69.85°.Y. 17.470Egeographical coordinates - finish gate 70.51°.Y. 12.51".Eparameters measured .Y, ,T,,T,.r,
multipulseprime measurement region E —height range 78 —height reolutjon '2Aknigeogra]>hical coordinates - start gate 09.75°.Y. 18.IS0Egeographical coordinates - finish gate 70.31°.Y. 12.510Eparameters measured .Y,.T,.T,.i;
power profileregion D - andE - rdjioheight range 68 - 131&i/iheight resolution 2.4/'???geographical coordinates - start gate 69.71".Y. 18.420Egeographical coordinates - finish gate G9.S9°.Y. 17.220Eparameters measured .V,
tristatic gateregion F - n i/iouheight range 328A1Iugeographical coordinates 70.21°.Y. 14.9C0Eparameters measured .Y,. T,. T1. r,
Where:-Y. is electron densityT, is electron temperatureT, is ion temperaturer. is ion velocity
Fig. 1. Experiment geometry showing position*EISCAT and the XEED rocket trajectory.
DIRECTLY DETERMIXED PARAMETERS
Inder the classification of "directly determined param-eters we include electron and ion temperatures, electrondensity and line-of-sight ion motion as measured monostnt-ically. These parameters are deduced from the incoherentscatter spectrum as described in Réf. 2.
Figure 2 shows the electron density in the E-region asa function of time (lower panel) and the correspondingF-region electron temperatures (upper panel). In Figure3 we present both temperatures, electron density and ionvelocity as four panels over a wider height range and derivedfrom the "long pulse" part of the experiment. It is clear thatearly in the timeslice the F-region ionisation is modulatedin an apparently periodic way and that a similar responseis seen in electron temperature. Due to the dominance ofmagnitude of the horizontal bulk ion drift over any verticalmotion, we shall assume that the line-of-sight velocities arerepresentative of zonal flow. We see a marked oscillationin this zonal flow field which may be the cause of themodulation in ionisation. We shall not. however, discussthis phenomenon here; it will be the subject of a separatestudy. Rather, we shall confine ourselves to discussion ofthe period following the onset of precipitation. The firstindications of precipitation occured at 1S45UT. with aburst of particles lasting around 2 minutes. At 1S33UT. aless interrupted flux of particles was evident. At the onsetion flow became consistently eastward and remained so forthe remainder of the observation period at heights above118km. This eastward flow commenced a lit tie earlier in theF-region than in the E-region: the commencement in the
Fig. 2. E-region electron density compared with F-regionelectron temperature. This is the form of the displayactually used at ARR during launch.

BACKGROUND ELECTRODYNAMICS 155
Fig. 3. Electron density, electron ami ion temperatures;in<l ion line-of-sight velocity.

1S6 C. HALL ET AL.
E-region coinciding exactly with the precipitationPrior to this, ion flow had .been westward at all E-regionheights, with the line of sight velocity exceeding GOm/-''at 11 Skiu. Below llSkiu. the flow remained westward orvariable. indicating a well-marked shear in the cast-westdirection at around llSkm. apparently associated with theprecipitation. Variation iu electron temperature duringthis period was essentially confined to altitudes above theE-region and with enhancements reaching perhaps 300OKat times.
DERIVED PARAMETERS
The scattered signal from the so-called "common vol-ume" provides us with a tri-static measurement and hencethe possibility to determine the full vector velocity. Byemploying a model value for the geomagnetic field, we arethen able to estimate the electric field. The results of thiscalculation are shown in Figure4 (upper panel). The lowerpanel of Figure 4 shows the corresponding H-componentof thi' geomagnetic field. We see how the electric fieldis consistently south-west until about 1902UT, turning tothe west thereafter. The field strength was unremarkable:of the order of 20mV/m at the beginning of the period anddecreasing. During the same period a modest negativebay developed in the H-component reaching a maximumof almost 30OnT at around 1900UT.
EISCAT TROMSO CP-1From 881107. Height 326.2 km
During the period all-sky TV indicated considerablestructure in ionisation. This may be taken as an indicationof the danger inherent iu attempting to interpret themeasurements of electron density along the radar beam asa height, or rather field-line, profile. Nevertheless, we have!it tempted to estimate the Hall and Pedersen conductancesas functions of time. The metho.l is described in Ref 3in some detail. The two time-series ni'f shown in FigureO. The initial values of around lOniliO are primarilydue to photoionisation. The sharp incease at 1S47UTC(>rres]>onds to the discrete injection of paricles seen atthe same time on the electron density plot. A 4-mIiiutequiet period follows, and then the conductances Increaseto over 2OmIiO. YVe do not, however, detect any dramaticand consistent tendency toward higher Hall conductances,which would have indicated hard precipitation. We mayfurther investigate this aspect by inverting the electrondensity "profiles" in order to estimate the precipitatingelectron energy distribution. This method is describedin Réf. 4. Again, as for the conductances, these resultsmust be taken as being somewhat qualitative due to thecombination of experiment geometry and non-homogeneityof the ionisation. The results are shown in Figure O where.
EISCAT TROMSQ CP-IFrom 861107. Height 1569 km
WOO
3600
3000
t 2400
1800
1200-
600-
O -
° Hall Conductance ( 1HI• Pedfirsen Conductance (
17W 1755 1810 1825 1840 1855
TIME (UTI
Fig. 3. Estimated Hall and Pederseii conductances.
ENERGY FROM EISCAT CP-1WaI energy (W/m ! » KT"! RMS energy IkeV)From 198811 07
Fig. 4. East and north components of electric field(geomagnetic frame).
Fig. 6. Estimated precipitating particle eurgy flux andcharacteristic energies.
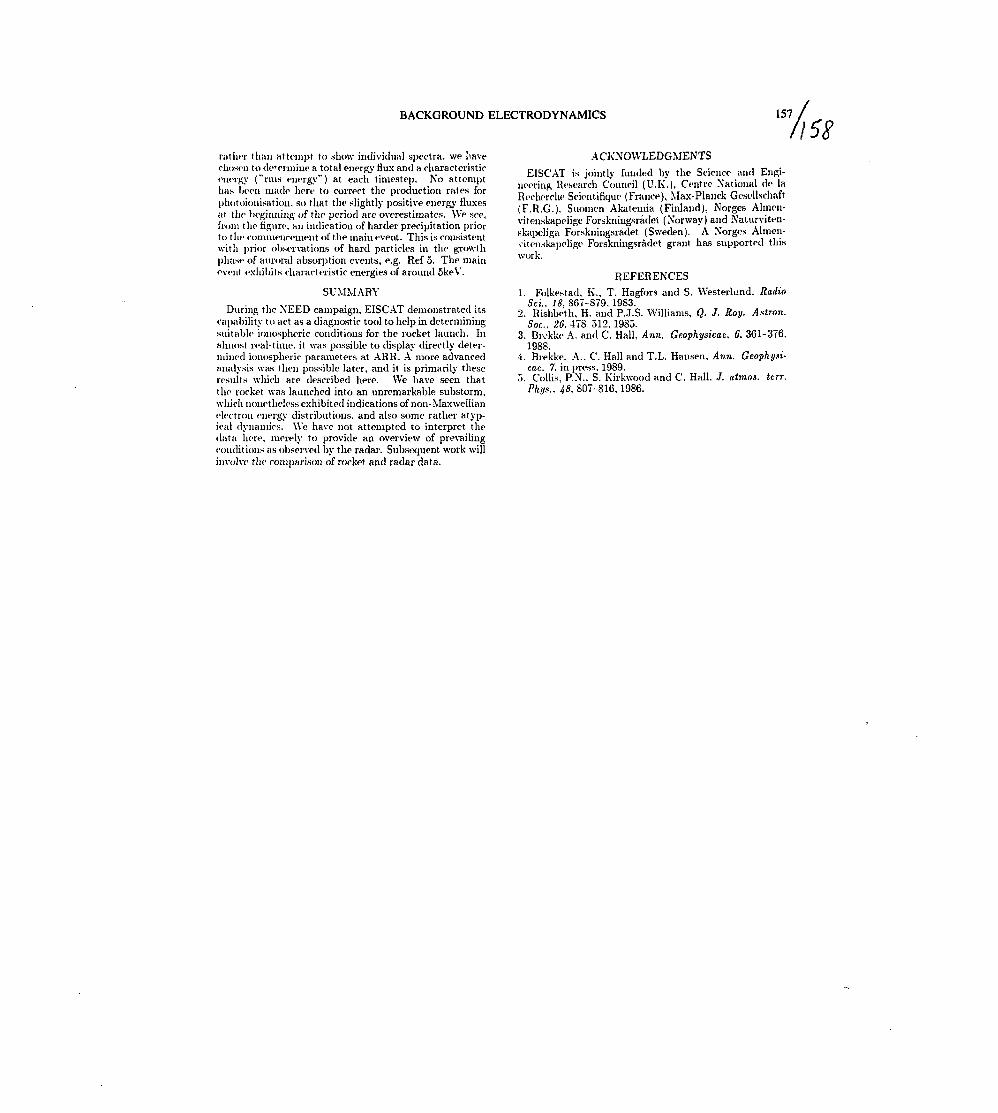
BACKGROUND ELECTRODYNAMICS
rather than attempt to show individual spectra, we Ivaverhosc-n to de'ermine a total energy flux and a characteristicenergy ("mis energy") at each timestep. No attempthas been made here to correct the production rates forphotoionisation, so that the slightly positive energy fluxesat the beginning of the period are overestimates. We see,from the figure, an indication of harder precipitation priorto the commencement of the main event. This is consistentwith prior observations of hard particles in the growthphase of auroral absorption events, e.g. Ref 5. The main(•vent exhibits characteristic energies of around 5keV.
SUMMARY
During the XEED campaign, EISCAT demonstrated itscapability to act as a diagnostic tool to help in determiningsuitable ionospheric conditions for the rocket launch. Inalmost real-time, it was possible to display directly deter-mined ionospheric parameters at ARR. A more advancedanalysis was then possible later, and it is primarily theseresults which are described here. We have seen thatthe rocket was launched into an unremarkable substorm.which nonetheless exhibited indications of non-Maxwellianelectron energy distributions, and also some rather atyp-ical dynamics. We have not attempted to interpret thedata here1, merely to provide an overview of prevailingconditions as observed by the radar. Subsequent work willinvolve the coiiiparison of rocket and radar data.
157/
//
ACKNOWLEDGMENTS
EISCAT is jointly funded by the Science and Engi-neering Research Council (U.K.) , Centre National de laRecherche Scientifique (France), Max-Planck Gesellsclmft(F.R.G.). Suomen Akatemia (Finland), Norges Almen-vitenskapelige Forskningsrâdet (Norway) and Naturviten-skapeliga Forskningsrâdet (Sweden). A Norges Almen-atenskapelige Forskningsrâdet grant has supported thiswork.
REFERENCES1. Folkestad, K., T. Hagfors and S. Westermnd. Radio
Sd., 18, 867-879,1983.2. Rishbeth, H. and P..I.S. Williams, Q. J. Roy. Astron.
Soc... 26. 478 512,1980.3. Brekke A. and C. Hall, Ann. Geophysicae, 6, 361-376,
1988.4. Brekke. A.. C. Hall and T.L. Hansen, Ann. Geophysi-
car:. 7. in press, 1989.5. Collis, RN.. S. Kirkwood and C. Hall, .7. atmos. ttrr,
Phyf., 48. 807-816,1986.
ISg

SESSION 8UPPER ATMOSPHERE
Chairman:H. Kohl
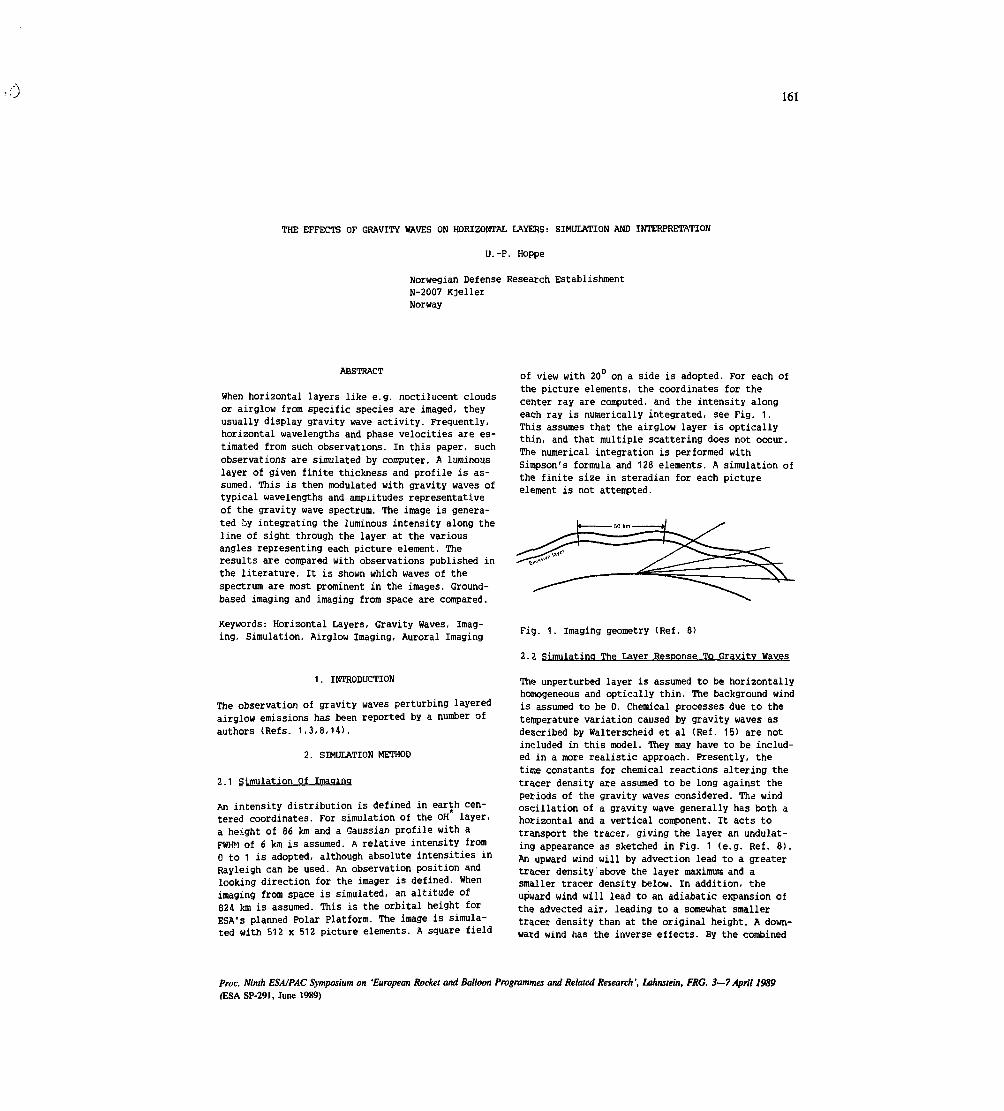
161
THE EFFECTS OF GRAVITY WAVES ON HORIZONTAL LAYERS: SIMULATION AND INTERPRETATION
U.-P. Hoppe
Norwegian Defense Research EstablishmentN-2007 Kjeller
Norway
ABSTRACT
When horizontal layers like e.g. noctilucent cloudsor airglow from specific species are imaged, theyusually display gravity wave activity. Frequently,horizontal wavelengths and phase velocities are es-timated from such observations. In this paper, suchobservations are simulated by computer. A luminouslayer of given finite thickness and profile is as-sumed. This is then modulated with gravity waves oftypical wavelengths and amplitudes representativeof the gravity wave spectrum. The image is genera-ted by integrating the luminous intensity along theline of sight through the layer at the variousangles representing each picture element. Theresults are compared with observations published inthe literature. It is shown which waves of thespectrum are most prominent in the images. Ground-based imaging and imaging from space are compared.
Keywords: Horizontal Layers, Gravity Waves, Imag-ing, Simulation, Airglow Imaging, Auroral Imaging
1. INTRODUCTION
The observation of gravity waves perturbing layeredairglow emissions has been reported by a number ofauthors (Refs. 1,3,8,14).
2. SIMULATION METHOD
2.1 Simulation Of Imaging
An intensity distribution is defined in earth cen-tered coordinates. For simulation of the OH layer,a height of 86 km and a Gaussian profile with aFWHfI of 6 km is assumed. A relative intensity fromO to 1 is adopted, although absolute intensities inRayleigh can be used. An observation position andlooking direction for the imager is defined. Whenimaging from space is simulated, an altitude of824 km is assumed. This is the orbital height forESA's planned Polar Platform. The image is simula-ted with 512 x 512 picture elements. A square field
of view with 20 on a side is adopted. For each ofthe picture elements, the coordinates for thecenter ray are computed, and the intensity alongeach ray is numerically integrated, see Fig. 1.This assumes that the airglow layer is opticallythin, and that multiple scattering does not occur.The numerical integration is performed withSimpson's formula and 128 elements. A simulation ofthe finite size in steradian for each pictureelement is not attempted.
Fig. 1. Imaging geometry (Réf. 8)
2.2 Simulating The Laver Response To Gravity Waves
The unperturbed layer is assumed to be horizontallyhomogeneous and optically thin. The background windis assumed to be O. Chemical processes due to thetemperature variation caused by gravity waves asdescribed by Walterscheid et al (Réf. 15) are notincluded in this model. They may have to be includ-ed in a more realistic approach. Presently, thetime constants for chemical reactions altering thetracer density are assumed to be long against theperiods of the gravity waves considered. The windoscillation of a gravity wave generally has both ahorizontal and a vertical component. It acts totransport the tracer, giving the layer an undulat-ing appearance as sketched in Fig. 1 (e.g. Réf. 8).An upward wind will by advection lead to a greatertracer density above the layer maximum and asmaller tracer density below. In addition, theupward wind will lead to an adiabatic expansion ofthe advected air, leading to a somewhat smallertracer density than at the original height. A down-ward wind has the inverse effects. By the combined
Proc. Ninth ESA/PAC Symposium on 'European Rocket and Balloon Programmes and Related Research ', Lahnstein, FRG. 3—7 April J9S9(ESA. SP-29I, June 1989)
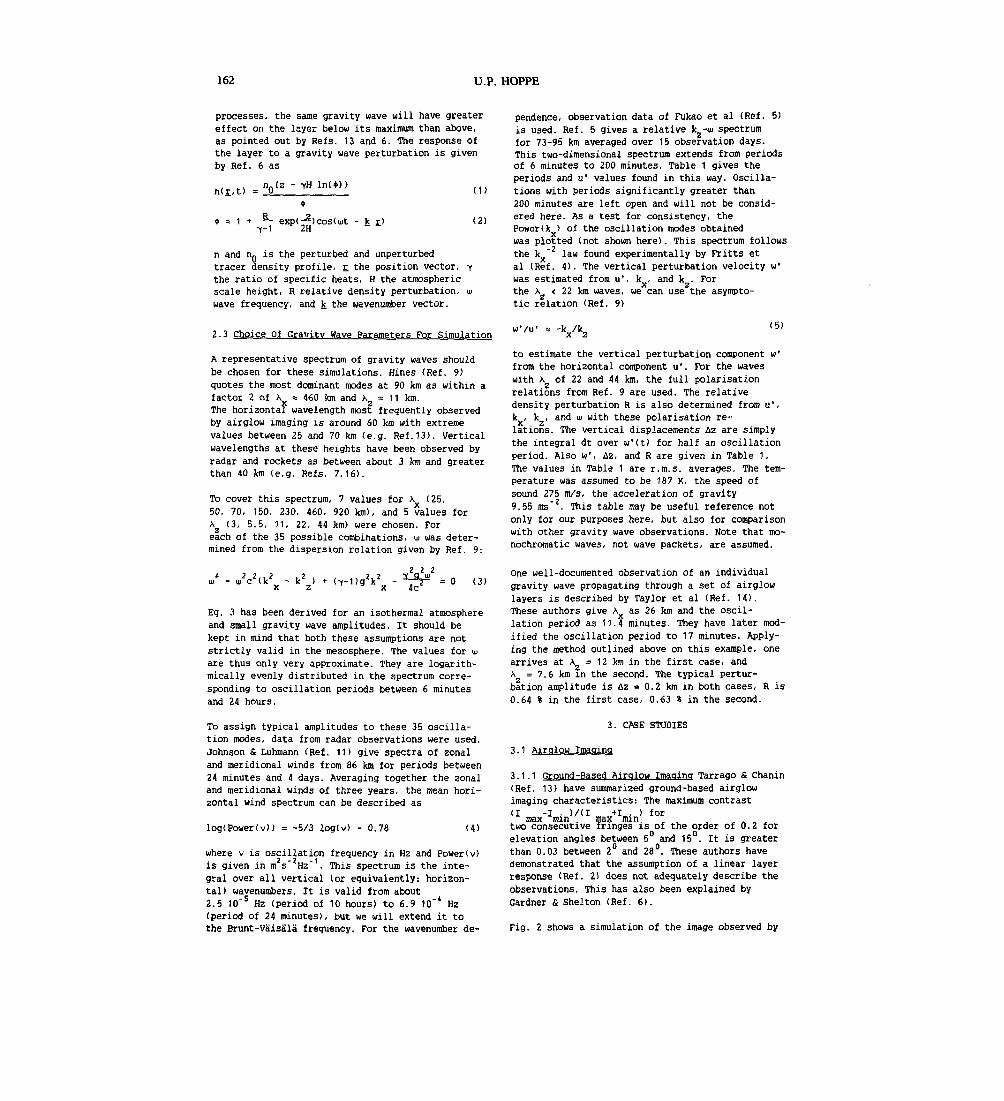
162 U.P. HOPPE
processes, the same gravity wave will have greatereffect on the layer below its maximum than above,as pointed out by Refs. 13 and 6. The response ofthe layer to a gravity wave perturbation is givenby Réf. 6 as
n(r_,t)
» = 1 + — expC-^lcosdut - k r) (2)f-1 2H
n and n» is the perturbed and unperturbedtracer density profile, r the position vector, Ythe ratio of specific heats, H the atmosphericscale height, R relative density perturbation, u>wave frequency, and k the wavenumber vector.
2.3 Choice Of Gravity Wave Parameters For Simulation
A representative spectrum of gravity waves shouldbe chosen for these simulations. Hines (Réf. 9)quotes the most dominant modes at 90 km as within afactor 2 of A » 460 km and AZ * 11 km.The horizontal wavelength most frequently observedby airglow imaging is around 60 km with extremevalues between 25 and 70 km (e.g. Réf.13). Verticalwavelengths at these heights have been observed byradar and rockets as between about 3 km and greaterthan 40 km (e.g. Refs. 7,16).
To cover this spectrum, 7 values for A (25,50, 70, 150, 230, 460, 920 km), and 5 values forAZ (3, 5.5, 11, 22, 44 km) were chosen. Foreach of the 35 possible combinations, ui was deter-mined from the dispersion relation given by Réf. 9:
(3)
Eq. 3 has been derived for an isothermal atmosphereand small gravity wave amplitudes. It should bekept in mind that both these assumptions are notstrictly valid in the mésosphère. The values for tuare thus only very approximate. They are logarith-mically evenly distributed in the spectrum corre-sponding to oscillation periods between 6 minutesand 24 hours.
pendence, observation data of Fukao et al (Réf. 5)is used. Réf. 5 gives a relative k -tu spectrumfor 73-95 km averaged over 15 observation days.This two-dimensional spectrum extends from periodsof 6 minutes to 200 minutes. Table 1 gives theperiods and u' values found in this way. Oscilla-tions with periods significantly greater than200 minutes are left open and will not be consid-ered here. As a test for consistency, thePower(k ) of the oscillation modes obtainedwas plotted (not shown here). This spectrum followsthe k "2 law found experimentally by Fritts etal (Réf. 4). The vertical perturbation velocity w'was estimated from u', k , and k . Forthe A < 22 km waves, we can use the asympto-tic relation (Réf. 9)
w'/u' 'Vkz(5)
to estimate the vertical perturbation component w'from the horizontal component u'. For the waveswith A2 of 22 and 44 km, the full polarisationrelations from Réf. 9 are used. The relativedensity perturbation R is also determined from u',k , k , and a with these polarisation re-lations. The vertical displacements tsz are simplythe integral dt over w'(t) for half an oscillationperiod. Also w', Az, and R are given in Table 1.The values in Table 1 are r.m.s. averages. The tem-perature was assumed to be 187 K, the speed ofsound 275 m/s, the acceleration of gravity9.55 ms"2. This table may be useful reference notonly for our purposes here, but also for comparisonwith other gravity wave observations. Note that mo-nochromatic waves, not wave packets, are assumed.
One well-documented observation of an individualgravity wave propagating through a set of airglowlayers is described by Taylor et al (Réf. 14).These authors give A as 26 km and the oscil-lation period as 11.4 minutes. They have later mod-ified the oscillation period to 17 minutes. Apply-ing the method outlined above on this example, onearrives at A = 12 km in the first case, andA = 7.6 km in the second. The typical pertur-bation amplitude is A2 = 0.2 km in both cases, R is0.64 % in the first case, 0.63 % in the second.
To assign typical amplitudes to these 35 oscilla-tion modes, data from radar observations were used.Johnson & Luhmann (Réf. 11) give spectra of zonaland meridional winds from 86 km for periods between24 minutes and 4 days. Averaging together the zonaland meridional winds of three years, the mean hori-zontal wind spectrum can be described as
log(Power(v» = -5/3 log(v) - 0.78 (4)
where v is oscillation frequency in Hz and Power(v)is given in m2s"2Hz"1. This spectrum is the inte-gral over all vertical (or equivalently: horizon-tal) wavenumbers. It is valid from about2.5 10"s Hz (period of 10 hours) to 6.9 10~4 Hz(period of 24 minutes), but we will extend it tothe Brunt-Vaisâla frequency. For the wavenumber de-
3. CASE STUDIES
3.1 Airglow Imaging
3.1.1 Ground-Based Airglow Imaging Tarrago £ Chanin(Réf. 13) have summarized ground-based airglowimaging characteristics: The maximum contrast
max ma*+Imin> '« fc „ , „ , ,two consecutive fringes is of the order of 0.2 forelevation angles between 5° and 15°. It is greaterthan 0.03 between 2° and 28°. These authors havedemonstrated that the assumption of a linear layerresponse (Réf. 2) does not adequately describe theobservations. This has also been explained byGardner & Shelton (Réf. 6).
Fig. 2 shows a simulation of the image observed by
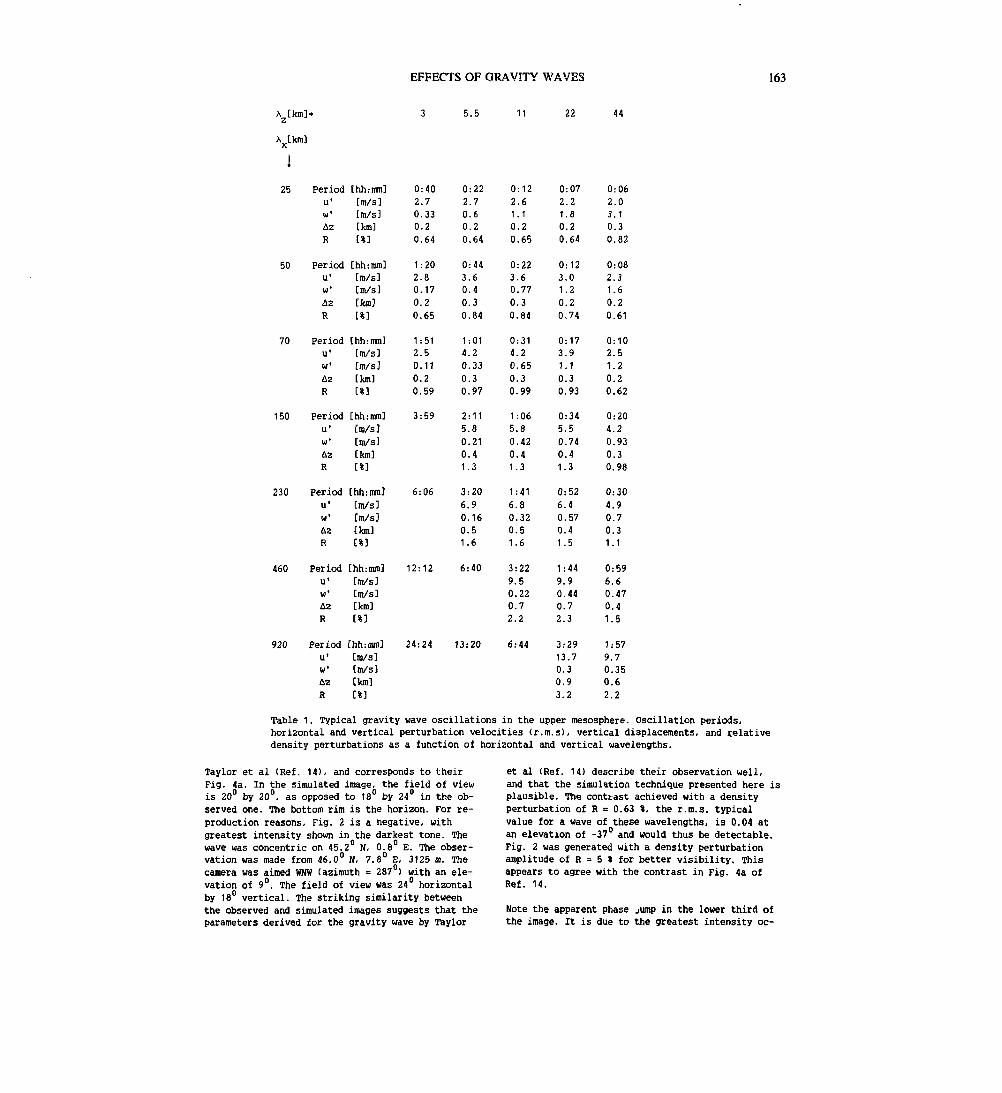
EFFECTS OF GRAVITY WAVES 163
5.5 11 22 44
25 Period [hh:mm]u' [m/s]W [m/s]Az [km]R [%]
0:402.70.330.20.64
0:22
2.70.60.20.64
0:12
2.61.10.20.65
0:07
2.21.80.20.64
0:06
2.03.10.30.82
50 Period [hh:mm]u' [m/s]w' [m/s]Az [km]R [%]
1:202.80.17
0.20.65
0:44
3.60.40.30.84
0:22
3.60.77
0.30.84
0:12
3.01.20.20.74
0:08
2.31.60.20.61
70
150
230
Period [hh:mm]u' [m/s]w' [m/s]uz [km]R [%]
1:512.50.110.20.59
1:014.20.330.30.97
0:314.20.650.30.99
0:17
3.91.10.30.93
0:10
2.51.20.20.62
Period [hh:mm]u' [m/s]w1 [m/s]Az [km]R [%]
Period [hh:mm]u' [m/s]
[m/s][km]
w'AzR [*]
3:59
6:06
2:115.80.21
0.41.3
1:06
5.8
0.420.41.3
0:345.50.740.41.3
0:204.20.930.30.98
3:206.90.160.51.6
1:416.80.320.51.6
0:526.40.570.41.5
0:304.90.70.31.1
460 Period [hh:iran]u1 [m/s]w1 [m/s]A3 [km]R [%]
12:12 6:40 3:22
9.50.22
0.7
2.2
1:44
9.9
0.44
0.7
2.3
0:59
6.6
0.47
0.4
1.5
920 Period [hh:mmJu' [m/s]w' [m/s]Uz C km]R [*]
24:24 13:20 6:44 3:29
13.7
0.3
0.9
3.2
1:57
9.7
0.35
0.6
2.2
Table 1. Typical gravity wave oscillations in the upper mésosphère. Oscillation periods,horizontal and vertical perturbation velocities (r.m.s), vertical displacements, and relativedensity perturbations as a function of horizontal and vertical wavelengths.
Taylor et al (Réf. 14), and corresponds to theirFig. 4a. In the simulated image, the field of viewis 20° by 20°, as opposed to 18° by 24° in the ob-served one. The bottom rim is the horizon. For re-production reasons, Fig. 2 is a negative, withgreatest intensity shown in the darkest tone. Thewave was concentric on 45.2° N, 0.8C E. The obser-vation was made from 46.0° N, 7.8° E, 3125 m. Thecamera was aimed WNW (azimuth = 287 ) with an ele-vation of 9°. The field of view was 24 horizontalby 18C vertical. The striking similarity betweenthe observed and simulated images suggests that theparameters derived for the gravity wave by Taylor
et al (Réf. 14) describe their observation well,and that the simulation technique presented here isplausible. The contrast achieved with a densityperturbation of R = 0.63 *, the r.m.s. typicalvalue for a wave of these wavelengths, is 0.04 atan elevation of -37° and would thus be detectable.Fig. 2 was generated with a density perturbationamplitude of R = 5 * for better visibility. Thisappears to agree with the contrast in Fig. 4a ofRéf. 14.
Note the apparent phase jump in the lower third ofthe image. It is due to the greatest intensity oc-

164 U.P. HOPPE
Fig. 2, Simulation of a ground-based airglowobservation. See text for details.
curring at those viewing angles where the integra-ted line of sight intersects the densest parts ofthe perturbed layer. Because of the wavefronts'curvature and, to a lesser degree, because of theOH -layer's curvature, these maxima do not occur atthe sams phases of the wave. The effect is visible,though not as apparent, also in Fig. 4a of Réf. 14.In Fig. 6a of Réf. 14, there appears to be a smallbut significant systematic deviation of the great-est intensity from the best-fit circles. This devi-ation is due to just that geometrical effect.
3.1.2 Airglow Imaging From Space The feasibility ofimaging airglosi structures modified by gravitywaves has been demonstrated from space by Hersé(Réf. 8). It has been proposed for ESA's PolarPlatform by Réf. 10. Fig. 3 is a simulation of thesame wave as in Fig. 2, but seen from an orbit of824 km. The azinurch of observation is the same forboth images, the elevation angle for the center ofFig. 3 is -40°. The position of the space platformwas chosen such that the centers of Figs. 2 and 3coincide at 86 km.
It is obvious that a much larger portion of thewave field is visible from space, and that it isless distorted. Just as it is unlikely that thereal wave pattern was as regular and coherent asthis simulation may suggest, an observation of thereal degree of coherence over the entire field ofview could give valuable information on the excita-tion mechanism and on the propagation of the wave.The real perturbation amplitude would also be ofgreat interest in order to determine the degree ofsaturation of the wave. If the imager is properlycalibrated and the vertical wavelength is known,the perturbation amplitude can be determined fromthe image.
Fig. 3. Simulation of the same wave as in Fig. 2,but seen from an orbit of 824 km.
3.2 Auroral Imaging
The imaging simulation method presented above mayalso be used to demonstrate auroral imaging asproposed for ESA's Polar Platform by Réf. 12.
4. SPECTRAL SENSITIVITY
In order to evaluate the sensitivity of airglowimaging to different likely combinations of hori-zontal and vertical wavelengths, the 28 combina-tions of Table 1 were simulated. The propagationdirection was taken in the plane of the observationazimuth. The maximum contrast, (I max-Imin>/<I max
+Imin>-
and the elevation angle for which it occurs weredetermined for observation from the ground and fromspace. The results are compiled in Table 2 forground-based observations, and in Table 3 for ob-servations from 824 km. The best elevation anglesare rounded to the full 5 .
For ground-based observations of gravity wavespassing through airglow layers, an elevation angleof 5° to 20° seems to be optimal. This agrees withmany observations. The maximum contrast for ar.m.s. wave is between .06 and .36 for waves of ho-rizontal wavelengths shorter that 460 ton, and it isbest for the shortest horizontal wavelengths. Haveswith horizontal wavelengths of 460 km and morecannot be detected at these amplitudes. It must beadded that individual waves may have substantiallylarger amplitudes than the r.m.s values used hers,and thus may show greater contrast. Also, wavepackets may appear to have greater amplitudes thanthe monochromatic waves simulated here.
For the observation of gravity waves passingthrough airglow layers from a space-based platform,an elevation angle of -30° is clearly optimal. From
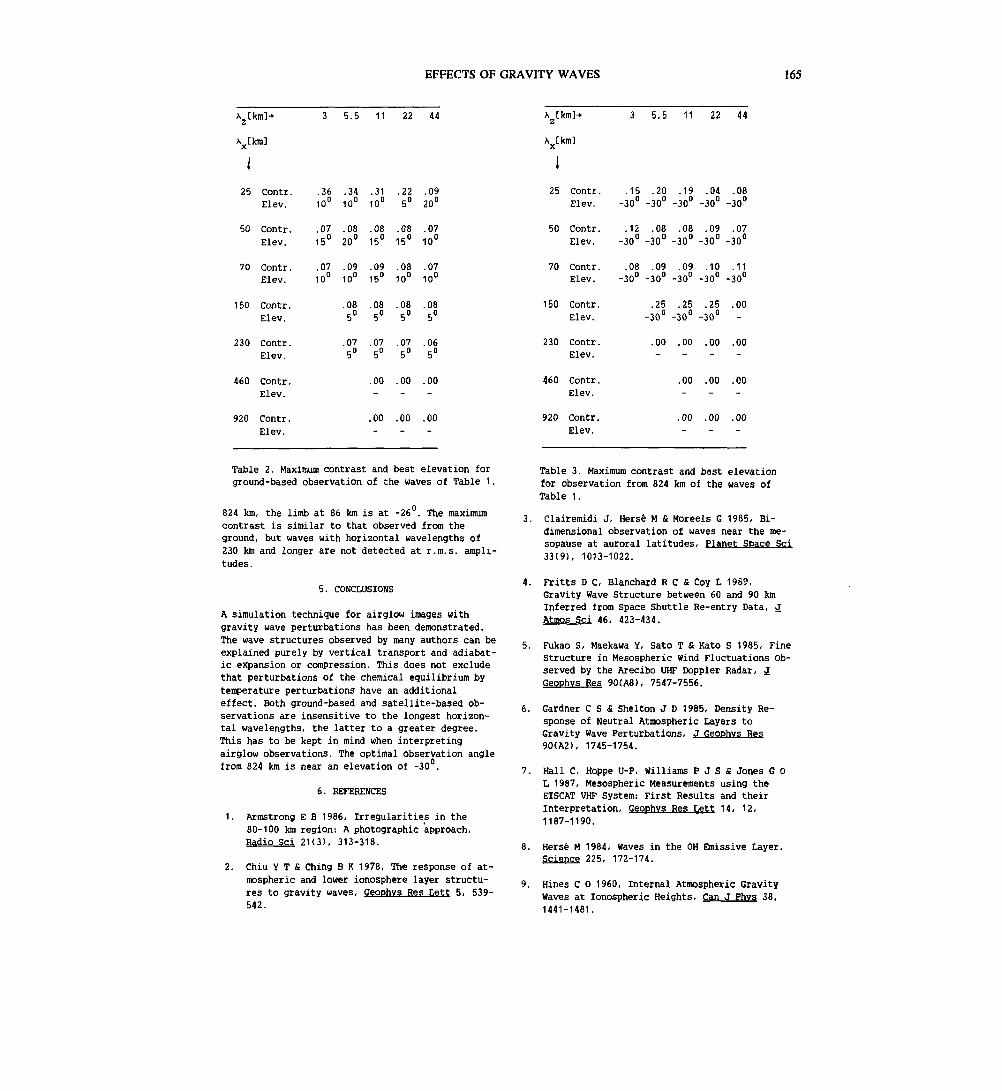
EFFECTS OF GRAVITY WAVES 165
A2CKmI- 5.5 11 22 44 5.5 11 22 44
25
50
70
150
230
460
920
Contr.Elev.
Contr .Elev.
Contr .Elev.
Contr.Elev.
Contr .Elev.
Contr .Elev.
Contr .Elev.
.36 .3410D 10°
.07 .0815° 20°
.07 .0910° 10°
.085°
.075°
.3110°
.0815°
.0915°
.085°
.075°
.00-
.00~
.225°
.0815°
.0810°
.085°
.075°
.00-
.00~
.0920°
.0710°
.0710°
.085°
.065°
.00-
.00~
Table 2. Maximum contrast and best elevation forground-based observation of the waves of Table 1.
824 Km, the limb at 86 Km is at -26°. The maximumcontrast is similar to that observed from theground, but waves with horizontal wavelengths of230 km and longer are not detected at r.m.s. ampli-tudes.
5. CONCLUSIONS
A simulation technique for airglow images withgravity wave perturbations has been demonstrated.The wave structures observed by many authors can beexplained purely by vertical transport and adiabat-ic expansion or compression. This does not excludethat perturbations of the chemical equilibrium bytemperature perturbations have an additionaleffect. Both ground-based and satellite-based ob-servations are insensitive to the longest horizon-tal wavelengths, the latter to a greater degree.This has to be Kept in mind when interpretingairglow observations. The optimal observation anglefrom 824 Km is near an elevation of -30 .
6. REFERENCES
1. Armstrong E B 1986, Irregularities in the80-100 km region: A photographic approach,Radio Sci 21(3), 313-318.
2. Chiu Y T & Ching B K 1978, The response of at-mospheric and lower ionosphere layer structu-res to gravity waves, Geophvs Res Lett 5, 539-542.
25
50
70
150
230
460
920
Contr .Elev.
Contr.Elev.
Contr .Elev.
Contr .Elev.
Contr .Elev.
Contr .Elev.
Contr.Elev.
.15 .20-30° -30°
.12 .08-30° -30°
.08 .09-30° -30°
.25-30°
.00-
.19-30°
.08-30°
.09-30°
.25-30°
.00-
.00-
.00~
.04-30°
.09-30"
.10-30°
.25-30°
.00-
.00-
.00~
.08-30°
.07-30C
.11-30°
.00
.00-
.00-
.00~
Table 3. Maximum contrast and best elevationfor observation from 824 Km of the waves ofTable 1.
3. Clairemidi J, Hersé M & Moreels G 1985, Bi-dimensional observation of waves near the me-sopause at auroral latitudes, Planet Space Sci33(9), 1013-1022.
4. Fritts D C, Blanchard R C fi Coy L 1989,Gravity Wave Structure between 60 and 90 KmInferred from Space Shuttle Re-entry Data, JAtmos Sci 46, 423-434.
5. Fukao S, Maekawa Y, Sato T fi Kato S 1985, FineStructure in Mesospheric Wind Fluctuations Ob-served by the Arecibo UHF Doppler Radar, JGeophvs Res 90(A8), 7547-7556.
6. Gardner C S & Shelton J D 1985, Density Re-sponse of Neutral Atmospheric Layers toGravity Wave Perturbations, J Geophvs Res90(A2), 1745-1754.
7. Hall C, Hoppe U-P, Williams P J S & Jones G OL 1987, Mesospheric Measurements using theEISCAT VHF System: First Results and theirInterpretation, Geophvs Res Lett 14, 12,1187-1190.
8. Hersé M 1984, Waves in the OH Emissive Layer,Science 225, 172-174.
9. Hines C O 1960, Internal Atmospheric GravityWaves at Ionospheric Heights, Can J Phvs 38,1441-1481.
166 U,P. HOPPE
10. Hoppe U-P & Thrane E V 1986, An Infrared 13.Imager on the Polar Platform for the Observa-tion of Dynamics in the Mesopause Region, ProcESA/BHSC/CHES Workshop on Solar-TerrestrialPhysics on Space Station/Columbus, RutherfordAppleton !Laboratory 14-15 October 1986, 143- 14.145.
11. Johnson R M fi Luhmann J G 1985, Neutral WindSpectra at the Auroral Zone Mesopause: Geomag-netic Effect?, J Geoohvs Res 90(A2), 1735-1743. 15.
12. Stadsnes J et al 1987, AORIO - a proposal forflying an AURoral Imaging Observatory on thePolar Platform in the Space Station/ColumbusProgramme, Proc Eighth ESA Symposium on 16.Europe an Rocket and Balloon Programmes andBelated Research, Sunne 17-23 May 1987, ESASP-270, 401-404.
Tarrago A fi Chanin M-L 1982, Interpretation interms of gravity waves of structures observedat the mesopause level by photograrametry andLidar, Planet Space Sci 30(6), 611-616.
Taylor M J, Hapgood M A & Rothwell P 1987, Ob-servations of gravity wave propagation in theOI (557.7 nm), Na (689.2 run) and the near in-frared OH nightglow emissions, Planet SpaceSci 35(4), 413-427.
Walterscheid R L, Schubert G & Straus J M1987, A Dynamical-Chemical Model of Wave-Driven Fluctuations in the OH Nightglow, JGeophvs Res 92(A2), 1241-1254.
Widdel H U 1987, Vertical Movements in theMiddle Atmosphere Derived from Foil CloudExperiments, J Atmos Terr Phvs 49, 723-741.
167
A SELF-CONSISTENT MODEL OF THE MOST COMMON NIGHTGLOW EMISSIONS
Donal P. Murtagh
Department of MeteorologyArrhenius Laboratory
University of StockholmS-10691 Stockholm
Sweden
ABSTRACT
While many of the details of the excitation mechanisms for thenightglow emissions are still the subject of discussion, an empiricalapproach has allowed us to develop a model which is self-consistent under a wide variety of geophysical conditions. A Earthmechanism Is assumed for the excitation of 0(1S) and a similarmechanism, with O2 as the transfer agent, is used for theproduction of 02(b
1£g+). In these cases laboratory rates are used
for the quenching of the emitting states by atmosphericconstituents while empirical coefficients were derived for theproduction and loss of the precursor states. A rigorous test of themodel was provided by other rocket observations made under verydifferent geophysical conditions, in these flights the atomic oxygengreen line intensity varied from JQ to 400 Rayleighs. The modelwas used to derive an atomic oxvoen profile by inversion of the (O-O) atmospheric band measurement and the expected heightprofiles of the other emissions calculated. The agreement withobservation was founa to be very satisfactory.
Keywords: Airglow, Nightglow, Green line, AtmosphericBand, Meinel bands, Herzberg bands.
1. INTRODUCTION
The light of the night sky consists of many components (Réf. 1 ) butit is the airglow that can give us information about the outerreaches of our atmosphere. However, although quantativemeasurements of the light intensities Involved have been madefrom the ground, since 1930 (Réf. 2), and from rockets, since 1956(Réf. 3), no fully consistent model of the numerous emissions hasbeen produced. This is mainly due to disagreements about theexcitation mechanisms for the various emitting species. Inaddition, laboratory measurements of the rate constants, necessaryfor the valid interpretation of observations, are very difficult. Thearticle by Bates (Réf. 4) on the oxygen green line is an excellentexposé of the problems and pitfalls.
During the late 1970's and early 1980's some of the more importantquenching rates for the emitting species have been established inthe laboratory (Réf. 5,6,7). By combining these with carefull rocketstudies of the various emissions' height distribution'it was possible,as a first step, to establish the correctness of one proposedexcitation mechanism over another (Réf. 8-10) and, at a later stagewhen more complete measurements were available, to derivet
empirical values for some of the unknown reaction rate constants(Réf. 11-13). It is by combining the results of these studies that aconsistent model of at least four of the common nightglowemissions, namely; the atomic oxygen green line, the O2 Herzbergbands, the O2 Atmospheric bands and the OH radical's vibration-
rotation bands, can be obtained.
2. THE MODEL
The model presented here is based almost exclusively on theresults of one rocket campaign, ETON. This campaign wasdesigned to study Energy Transfer In the Oxygen Nightglow andtook place from South Uist (57.40N, 7.38°W) in the Outer Hebredies,Scotland. The results of the ETON measurements have alreadybeen presented in a number of publications (Réf. 11 -15).
The excitation energy for all the emissions discussed with theexception of the OH Meinel bands comes from the recombinationof atomic oxygen in the presence of a third body to produce excited
O + O +• M —> O2 + M (1)
The O2 can then either emit, be quenched or transfer its excitationenergy to another atom or molecule which can subsequently emitthe observed radiation.
2.1 The atmospheric bands
The atmospheric band emissions occur at wavelengths of 720 nm(0-0) and 864 nm (0-1). The (0-0) band cannot be studied from theground because it undergoes self-absorption between the emittinglayer and the observer. The emissions originate from anapproximately 10 km thick layer centred at about 94 km altitude (inthe dynamically undisturbed atmosphere). This Is a few kilometersbelow the other main oxygen emissions discussed here which,combined with earlier laboratory evidence (Réf. 16), led Gréer et al.(Réf. 9) to suggest that the emitting state is excited via an energytransfer mechanism with O2 as the transfer agent:
O2*+ O2 "00-, + O2(D1S9
+) (2)
Allowing for the quenching of the precursor state and O2Cb1E+)by various atmospheric constituents McDade et al. (Réf. 12)obtained the following expression for the volume emission rate
{A2+k2° [N2]+k2°[0]}{C°' [02]+C°[0]}
The coefficients C0z and C° that represent the quenching of theprecursor state were derived empirically from the ETONmeasurements and are given along with the other rate constants inTable 1 . Since the rate constant for the quenching of 02(b
1S.+) byO atoms, k2°, is somewhat uncertain for the conditions in theemission region two limiting values were assumed in Réf. 10 andtwo sets of empirical coefficients derived. Both sets of coefficients
PTOC. Ninth ESAIPAC Symposium on 'European Rocket and Balloon Programmes and Related Research', Lahnstein, FRC, 3—7April 1989(ESA SP-291, June 1989)
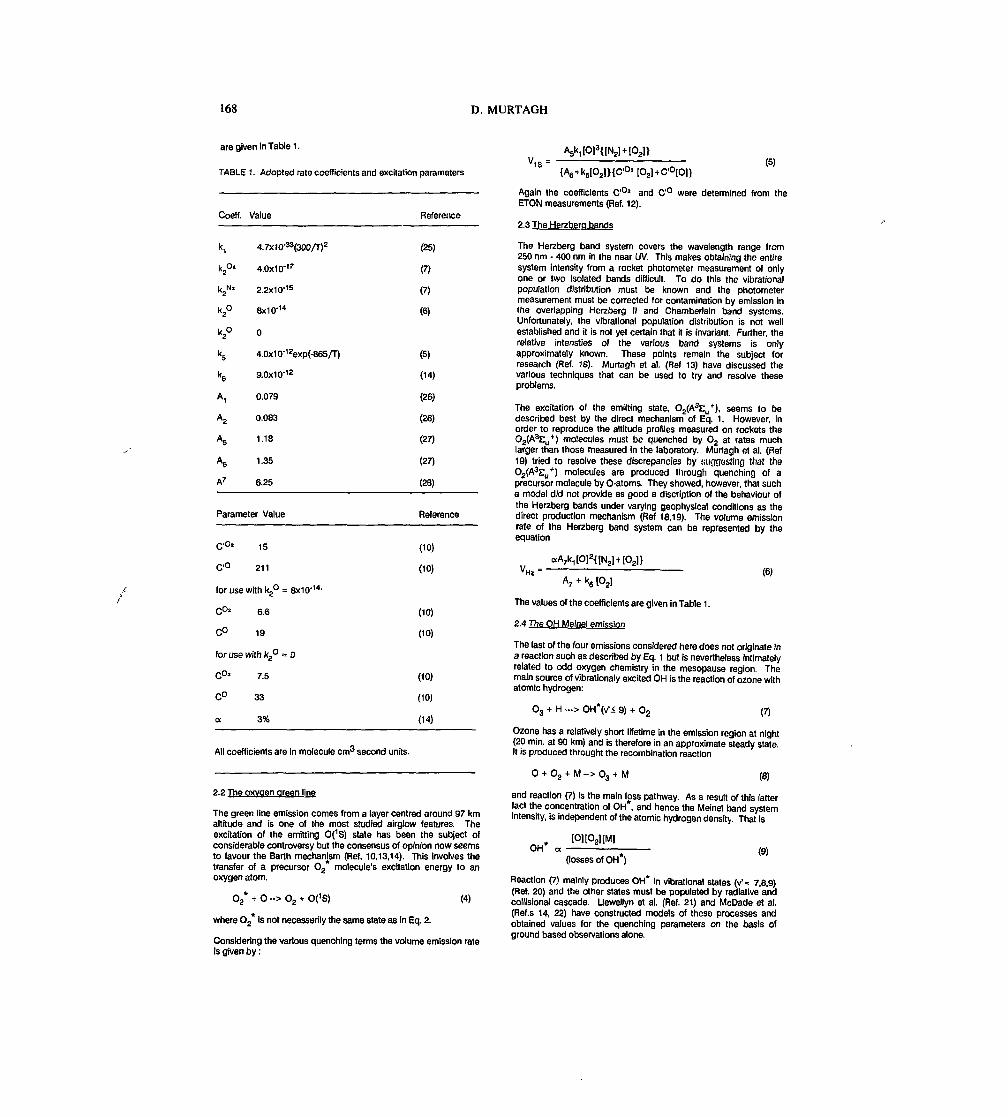
168 D. MURTAGH
are given In Table 1.
TABLE 1. Adopted rate coefficients and excitation parameters
Coeff. Value
k, 4.7XJO-33POOXT)2
K20' 4.0x1 Q-'7
k2Nz 2.2x1 0'15
k2° 8x1 0-14
K20 O
k5 4.0x10⁻¹²exp(-865/T)
k6 9.0X10'12
A, 0.079
A2 0.083
A5 1.18
A6 1.35
A7 6.25
Parameter Value
C'°! 15
C'° 211
for use withk2° = 8x1 0'14-
C°2 6.6
C° 19
for use with k2° = o
C°2 7.5
C° 33
ot 3%
Reference
(25)
(7)
(7)
(6)
(5)
(14)
(26)
(26)
(27)
(27)
(28)
Reference
(10)
(10)
(10)
(10)
(10)
(10)
(14)
All coefficients are in molecule cm3 second units.
2.2 The oxvaen green line
The green line emission comes from a layer centred around 97 kmaltitude and is one of the most studied airglow features. Theexcitation of the emitting 0(1S) state has been the subject ofconsiderable controversy but the consensus of opinion now seemsto favour the Barm mechanism (Réf. 10,13,14). This Involves thetransfer of a precursor O2* molecule's excitation energy to anoxygen atom.
O2* + O -> O2 + Q(1S) (4)
where O2* Is not necessarily the same state as in Eq. 2.
{Aa+k5[02]HC'°'[02](5)
Again the coefficients C'°* and C'° were determined from theETON measurements (Réf. 12).
2.3 The Herzberg bands
The Herzberg band system covers the wavelength range from250 nm - 400 nm in the near UV. This makes obtaining the entiresystem intensity from a rocket photometer measurement of onlyone or two Isolated bands difficult. To do this the vibratfonalpopulation distribution must be known and the photometermeasurement must be corrected for contamination by emission inthe overlapping Herzberg Il and Chamberlain band systems.Unfortunately, the vlbrational population distribution is not wellestablished and it is not yet certain that it is invariant. Further, therelative intensties of the various band systems is onlyapproximately known. These points remain the subject forresearch (Réf. 18). Murtagh et al. (Ref 13) have discussed thevarious techniques that can be used to try and resolve theseproblems.
The excitation of the emitting state, O2(A3E1/), seems to be
described best by the direct mechanism of Eq. 1. However, inorder to reproduce the altitude profiles measured on rockets theO2(A
3E11+) molecules must be quenched by O2 at rates much
larger than those measured in the laboratory. Murtagh et al. (Ref19) tried to resolve these discrepancies by «uggestfng that theO2(A
3E11+) molecules are produced through quenching of a
precursor molecule by 0-atoms. They showed, however, that sucha model did not provide as good a dlscription of the behaviour ofthe Herzberg bands under varying geophysical conditions as thedirect production mechanism (Ref 18,19). The volume emissionrate of the Herzberg band system can be represented by theequation
(6)A7^k6[O2]
The values of the coefficients are given in Table 1.
2.4 The OH Melnel emission
The last of the four emissions considered here does not originate ina reaction such as described by Eq. 1 but is nevertheless intimatelyrelated to odd oxygen chemistry in the mesopause region. Themain source of vibrationaly excited OH is the reaction of ozone withatomic hydrogen:
O3 + H -> OH*(v'< 9) + O2 (7)
Ozone has a relatively short lifetime in the emission region at night(20 min. at 90 km) and is therefore in an approximate steady state.It is produced through! the recombination reaction
O + O M-> O3 + M (8)
and reaction (7) is the main loss pathway. As a result of this latterfact the concentration of OH , and hence the Meinel band systemintensity, is independent of the atomic hydrogen density. That is
OH*[O][O2][M]
(losses of OH )
Considering the various quenching terms the volume emission rateis given by :
Reaction (7) mainly produces OH* In vlbratlonal states (V= 7,8,9)(Ref. 20) and the other states must be populated by radiative andcollisional cascade. Llewellyn et al. (Ref. 21) and McDade et al.(Ref.s 14, 22) have constructed models of these processes andobtained values for the quenching parameters on the basis ofground based observations alone.

CONSISTENT MODEL OF NIGHTGLOW EMISSIONS 169
TABLE 2. DETAILS OF THE ANALYZED AIRGLOW MEASUREMENTS
Identifier Site Date Measured zenith intensities
Green line Atmospheric band
OXYGEN/335
S310.10"
Esrange,Sweden.67.9N, 21.IE
Uchinoura,Japan.31.2N, 131.IE
ETON P229H South Uist,Scotland.57.4N, 7.4W
OASIS
SOAP/WINE
White Sands,New Mexico.32.4N, 106.3W
Esrange,Sweden.67.9N, 21.IE
07/2/1981
24/8/1981
23/3/1982
11/6/1983
10/2/1984
400 R
180 R
150 R
300 R
30 R
11.0 kR
6.7 KR
4.0 kR
6.8 kR
2.2 kR
Ogawa et al. (1987)
3. TESTING THE MODEL
As stated in section 2 the model is based almost entirely onmeasurements during one rocket campaign and it is thereforedesirable to test it with other data. Table 2 lists a number ofdifferent campaigns where some or all of the emissions weremeasured. It is clear from the range of intensities that thegeophysical conditions were widely varying. This is furtherillustrated in Fig. 1 which shows the measured A-band and greenline profiles.
The test procedure adopted has been described by Murtagh et al.(Réf. 23). By inverting Eq. 2, the Atmospheric band profile wasused to derive the atomic oxygen density profile. This was thenused to calculate the green line, and Herzberg emission profilesthat should be expected If the parameterisations are self-consistent.Direct comparison of the results with the measurements constitutesthe test.
Fig. 2 illustrates the results for the OASIS and OXYGEN/835
rockets. The agreement is remarkable. In the OXYGEN/835 casethe discrepancy around 90 km is in part due to the suppression ofthe lower peak in the measurement. This occurred because of thelow altitude resolution of the measurement and the data reductiontechniques used to produce the profile. Similar results areobtained for the Herzberg bands but are not shown. In theSOAP/WINE case the modelled emission profile was about 40%more intense than the measurement as seen in Fig. 3. This figurealso illustrates the importance of using an appropriate backgroundatmosphere for the calculations. The best results were obtainedusing the temperature and densities measured near the time of theflight (see Réf. 23 for details). Using the MSIS-86 model (Réf. 24),without regard to the dynamically disturbed state of theatmosphere, increased the discrepancy to over 100%.
The OH Meinel band model of McDade et al. (Réf. 14) is adequatelytested with the ETON data alone since it is not based on thosemeasurements. The modelled and measured profiles are shown inFig. 4. It Is worth noting that the earlier model of Llewellyn et al.also gives excellent results.
120
115
110
105
100
95
90
65
IaI
600.0 0.2 0.4 0.6 0.8 1.0 1.2
Volume Emission Rate (Photons cii-3 s-ll X 10too 200 300 mVolume Emission Rate (Pilotons cn-3 s-1)
500
Figure 1. Collected airglow profiles used In this study (a) Atmospheric band, (b) Green line, -OASIS, OXYGEN/835, 8310.10, SOAP/WINE.
-ETONP229H,
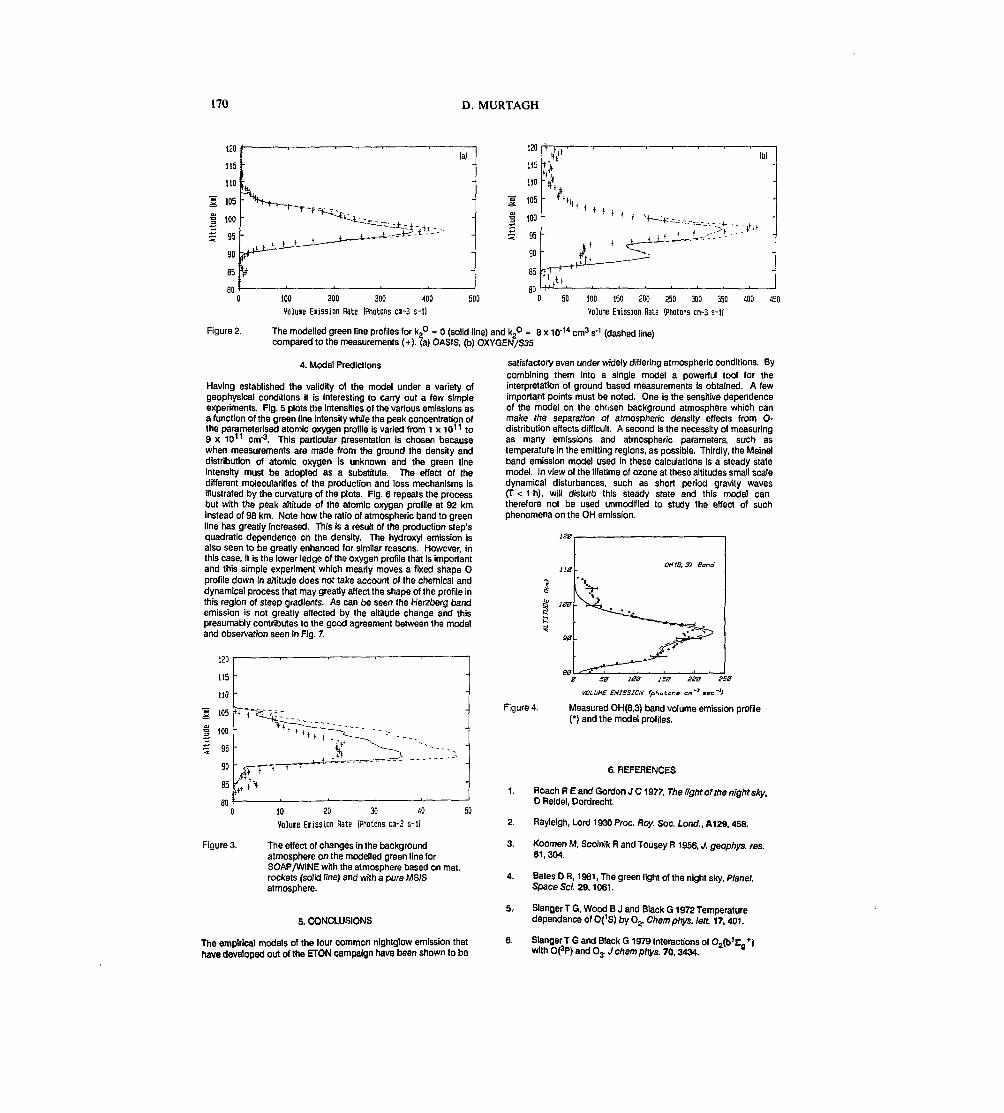
170 D. MURTAGH
120
115
110
I 105
I 10°S 95
90
85
Ia)
o
i:3
KV
115
110
105
100
95
90
85
an
ifT.
V- ft t t
*~~~^~r~^~~^ - : :4*' (aL— — 2
?r^
Figure 2.
100 200 300 400Volme Emission Rate (Photons cn-3 s-1)
:0 = ,
500 100 150 200 250 300 350 400Voluie Emission Bate (Photons cii-3 s-ll
450
The modelled green line profiles (or ka° = O (solid line) and k2° = 8 x 1O-14 cm3 s-1 (dashed line)compared to the measurements (+). (a) OASIS, (b) OXYGEN/835
4. Model Predictions
Having established the validity of the model under a variety ofgeophysical conditions it is interesting to carry out a few simpleexperiments. FIg. 5 plots the intensities of the various emissions asa function of the green line Intensity while the peak concentration ofthe parameterised atomic oxygen profile is varied from 1 x 10¹¹ to9 x 1011 cm'3. This particular presentation is chosen becausewhen measurements are made from the ground the density anddistribution of atomic oxygen is unknown and the green lineIntensity must be adopted as a substitute. The effect of thedifferent molecularities of the production and loss mechanisms isillustrated by the curvature of the plots. Fig. 6 repeats the processbut with the peak altitude of the atomic oxygen profile at 92 kminstead of 98 km. Note how the ratio of atmospheric band to greenline has greatly increased. This is a result of the production step'squadratic dependence on the density. The hydroxyl emission isalso seen to be greatly enhanced for similar reasons. However, inthis case, it is the lower ledge of the oxygen profile that is importantand this simple experiment which meariy moves a fixed shape Oprofile down in altitude does not take account of the chemical anddynamical process that may greatly affect the shape of the profile inthis region of steep gradients. As can be seen the Herzberg bandemission is not greatly affected by the altitude change and thispresumably contributes to the good agreement between the modeland observation seen in Fig. 7.
10 20 30 40 !Volune Emission Rate (Photons ca-3 s-1)
Figure 3. The effect of changes in the backgroundatmosphere on the modelled green line forSOAP/WINE with the atmosphere based on met.rockets (solid line) and with a pure MS)Satmosphere.
5. CONCLUSIONS
The empirical models of the four common nlghtglow emission thathave developed out of the ETON campaign have been shown to be
satisfactory even under widely differing atmospheric conditions. Bycombining them into a single model a powerful tool for theinterpretation of ground based measurements is obtained. A fewimportant points must be noted. One Is the sensitive dependenceof the model on the chosen background atmosphere which canmake the separation of atmospheric density effects from O-distribution effects difficult. A second is the necessity of measuringas many emissions and atmospheric parameters, such astemperature in the emitting regions, as possible. Thirdly, the Meinelband emission model used in these calculations Is a steady statemodel. In view of the lifetime of ozone at these altitudes small scaledynamical disturbances, such as short period gravity waves(T < 1 h), will disturb this steady state and this model cantherefore not be used unmodified to study the effect of suchphenomena on the OH emission.
VOLUME EMISSION (pttatons cm"3 e:
Figure 4. Measured OH(8,3) band volume emission profile(*) and the model profiles.
6. REFERENCES
1. Roach R E and Gordon J C1977, The light ot'the night sky,D Reldel, Dordrecht.
2. Rayleigh, Lord 1930 Proc. Roy. Soc. Lond., A129,458.
3. Koomen M, Scolnik R and Tousey R1956, J. geophys. res61, 304.
4. Bates D R, 1981, The green light of the night sky. Planet.Space Sc/. 29,1061.
SlangerT G, Wood B J and Black G 1972 Temperaturedépendance OfO(1S) by O2, Chemphys. lett. 17,401.
6. SlangerT G and Black G 1979 interactions of O2(b'£*)with D(3P) and O3. J chem phys. 70,3434.
5,
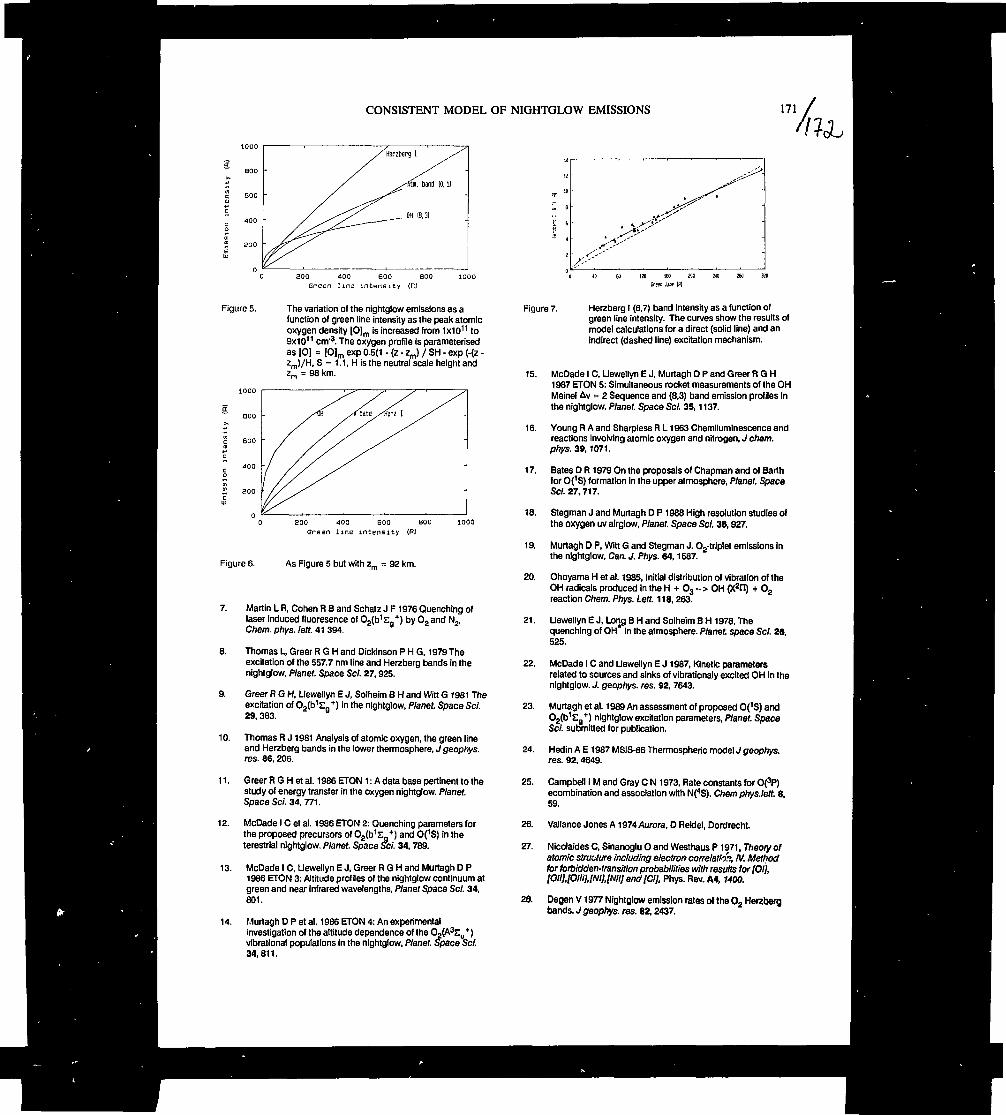
CONSISTENT MODEL OF NIGHTGLOW EMISSIONS 171
Figure 5.
200 100 600 800 1000Green line intensity (R)
The variation of the nightglow emissions as afunction of green line intensity as the peak atomicoxygen density [0]m is increased from 1x10¹¹ to9x1011 cm'3. The oxygen profile Is parameterisedas [O] = [0]m exp 0.5(1 - (z - zj / SH - exp (-(z -2m)/H, S = 1.1, H is the neutral scale height andz_ = 98 km.
aoo
600
400
BOO
200 400 600 BOO 1000Green line intensity (R)
Figure 6. As Figure 5 but with z = 92 km.
7. Martin L R, Cohen R B and Schatz J F1976 Quenching oflaser induced fluoresence of 02(b
1£*) by O2 and N2,Cnern. pfiys. lett. 41 394.
8. Thomas L, Greer R G H and Dickinson PHG, 1979 Theexcitation of the 557.7 nm line and Herzberg bands in thenightglow, Planet. Space Sd. 27,925.
9. Greer RGH, Llewellyn E J, Solheim B H and Witt G 1981 Theexcitation of O2Jb1S0
+) in the nightglow, Planet. Space Sd.29,383.
10. Thomas R J 1981 Analysis of atomic oxygen, the green lineand Herzberg bands in the lower thermosphère, J geophys.res. 86,206.
11. Greer R G H et al. 1986 ETON 1 : A data base pertinent to thestudy of energy transfer in the oxygen nightglow. Planet.Space Sd. 34,771.
12. McDade IC et al. 1986 ETON 2: Quenching parameters forthe proposed precursors of 02(b
1£_+) and 0(1S) in theterestrial nightglow. Planet. Space Sd. 34,789.
13. McDade IC, Llewellyn E J, Greer R G H and Murtagh D P1986 ETON 3: Altitude profiles of the nightglow continuum atgreen and near infrared wavelengths, Planet Space Sd. 34,801.
14. Murtagh D P et al. 1986 ETON 4: An experimentalinvestigation of the altitude dependence of the O2(A
3E11 * )vibrational populations in the nightglow, Planet. Space Sd.34,811.
a to SB IEO vaGreen line [R]
Figure 7. Herzberg I (6,7) band Intensity as a function ofgreen line intensity. The curves show the results ofmodel calculations for a direct (solid line) and anindirect (dashed line) excitation mechanism.
15. McDade I C, Llewellyn E J, Murtagh D P and Greer RGH1987 ETON 5: Simultaneous rocket measurements of the OHMeinel AV = 2 Sequence and (8,3) band emission profiles Inthe nightglow. Planet. Space ScI. 35,1137.
16. Young R A and Sharpless R L1963 Chemlluminescence andreactions Involving atomic oxygen and nitrogen, J chem.phys. 39.1071.
17. Bates D R 1979 On the proposals of Chapman and of Barthfor 0(1S) formation in the upper atmosphere, Planet. SpaceScI. 27,717.
18. Stegman J and Murtagh D P 1988 High resolution studies ofthe oxygen uv alrglow, Planet. Space ScI. 36,927.
19. Murtagh D P, Witt G and Stegman J. 02-triplet emissions Inthe nightglow, Can. J. Phys. 64,1587.
20. Ohoyama H et al. 1985, Initial distribution of vibration of theOH radicals produced In the H + O3 --> OH (X2Il) + O2
reaction Chem. Phys. Lett. 118,263.
21. Llewellyn E J, Long B H and Solheim B H 1978, Thequenching of OH in the atmosphere. Planet, space Sd. 26,525.
22. McDade IC and Llewellyn E J1987, Kinetic parametersrelated to sources and sinks of vibrationaly excited OH In thenightglow. J. geophys. res. 92, 7643.
23. Murtagh et al. 1989 An assessment of proposed 0(1S) and02(b
1S +) nightglow excitation parameters, Planet. SpaceSd. submitted for publication.
24. Hedin A E1987 MSIS-86 Thermospheric model J geophys.res. 92,4649.
25. Campbell I M and Gray C N 1973, Rate constants for 0(3P)ecombination and association with N(4S). Chem phys.lett. 8,59.
26. Vallance Jones A1974 Aurora, D ReWeI, Dordrecht.
27. Nicolaides C, Sinanoglu O and Westhaus P1971, Theory ofatomic structure including electron correlation, IV. Methodfor forbidden-transition probabilities with results for [01],[Olll,lOI!il,[Nll,lNII]and[CI], Phys. Rev. A4, MOO.
28. Degen V1977 Nightglow emission rates of the O2 Herzbergbands. J geophys. ras. B2,2437.
m

173
INTERZODIAK II : OBSERVATION OF EUV-RESONANCE RADIATION
G. Lay H. J. Fahr H. U. Nass
Institut fur Astrophysik und Extraterrestrische ForschungUniversitat Bonn, Auf dem Hugel 71, West Germany
ABSTRACT
On September 3, 1988 at 14.10 UT the payloadINTERZODIAK II was carried on board a SKYLARK 12from Natal, Brazil, to an apogee of 857 km. Atotal of 13 different celestial targets in thevicinity of the sun were observed during the 16minute flight. EUV radiation from interplanetaryspace and the geocorona was measured with severalspectrophotometric sensors at the resonancewavelengths 58.4 nm (He) and 121.6 nm (H).
Keywords: EUV-radiation, Dayglow, Sounding Rocket
1. THEORY
About 20 years ago the theory was formulated byour group describing how interstellar neutralgases penetrating the solar system would beaffected by the solar gravitation, solar wind,radiation pressure and ionizing solar EUVradiation. Accounting for these interactions, awell defined density and velocity distribution ofthe interstellar wind ( OP LISM = LocalInterstellar Medium ) within interplanetary spacecould be established (Réf. 1).
In the Jîiean time, instruments on high flyingrockets, satellites and space probes have measuredthe resonantly scattered solar EUV radiationespecially at Ly-oc 121.6 nm (hydrogen) and 58.4 nm(helium). These measurements not only verified theincreasingly refined theory, but also yieldedvalues for the parameters of the interstellarwind.
About 10 years ago, again in Bonn, anothersource of interplanetary backscattered radiationwas postulated. The reasoning was briefly thefollowing:The interplanetary dust, also called zodiacal
dust, spirals towards the sun on nearly circularorbits due to the Poynting-Robertson-effect.During this motion - with residence times ofseveral ten thousands of years within the orbit ofthe earth - the dust grains are subject to thesolar wind bombardment. Solar protons anda-particles impinge on and penetrate into thesurface of the meteorites where they becomeneutralized. Taking into account theQ well-knownsolar wind particle flux of about 10 cm" s" at1 AU, saturation of the dust particles with
hydrogen and helium occurs within only a fewmonths or years, depending on the size of thegrain. After that time the dust particles cannotabsorb any more solar wind particles: the formersolar wind ions become neutralized and eventuallyleave the dust particle with relatively smallvelocities with respect to their parent grains. Itcan be asbumed that this desorption of neutralsfrom the grain surface occurs as an isotropicemission according to a temperature comparable tothat of the grain surface itself. The net resultis that fairly high energy solar wind Ions areconverted into neutral gases (hydrogen and helium)with temperatures of 200 to 300 K that move aroundthe sun with a velocity distribution functionsimilar to that of the dust grains. The mostlikely distribution function can be deduced, forinstance, from HELIOS zodiacal light measurements(Réf. 21.The t.olar EUV radiation resonantly scattered at
these dust-generated neutral helium and hydrogenatoms should be measurable, thereby yieldinginformation on the properties of the dust surfaceas well as the dust dynamics.
A detailed description of the dust - solar windinteraction can be found in Réf. 3.
2. EXPECTED CONTRIBUTIONS TO THE SIGNAL
For EUV observations from the vicinity of theearth, calculations show that the contribution ofthis "zodiacal" component becomes comparable tothe "interstellar" component' only for aline-of-sight (LOS) with a small small solaroffset angle. In Fig. 1 the expected backscatteredintegrated intensity (in Rayleigh) at a wavelengthof 58.4 nm (He) is plotted versus the solar offsetangle of the LOS in the ecliptic. Two differentobservational positions have been used for theinterstellar component: INTerstellar SUMMERPosition means that the observer is at a positionupstream of the sun in the interstellar wind (case for June ), INTerstellar SPRING Positionmeans the LOS is perpendicular to the interstellarwind vector ( case for March or September ). Theplot shows that, even in the favorable springposition, the interstellar contribution is stillcomparable with the DUST signal even for smallsolar offset angles.The situation gets remarkably better if the
spectral distribution is analyzed instead of the
Proc. Ninth ESAIPAC Symposium on 'European Rocket and Balloon Programmes and Related Research ', Lahnslein, FRG, 3—7 April 1989(ESA SP-291, June 1989)

174 G. LAY, H.J. FAHR & H.U. NASS
Table 1 : EUV - Radiation ( HeI 58.4 nm )
IT SOUfl OFFS AWlU
Figure 1. Theoretical integrated intensities atS8.4 nm for small solar offset angles ofthe LOS in the ecliptic plane.
Source
1) Zodlakal dust
Z) LISM
3) Solar corona
4) Geo-corona
S) Particles
Intensity
5-102 2.
S-IO2 2.
1-102 0.4
6-104 240.
3 • 10 5.
-2 -1 „cm s R
Mear.s, of reduction
Time of yearresonance cell
Light baffle
Launch siteresonance cell
Launch siteEM - baffle
iO ft «ni
Figure 2. Theoretical spectral intensities around58.4 nm (A = O) at a solar offset angle5° of the LOS in the ecliptic plar'.
integrated signal. Fig. 2 shows - again for heliumand the LOS in the ecliptic - the spectralbehavior of the different intensities for a solaroffset angle of the LOS of 5° versus distance isomline center. In addition, the vertical bars closeto A=O (=line center at 58.4 nm) mark the typicalcontribution of thj helium geocorc •• with atemperature of 1200 K. It is obviou that theinterstellar contribution is more concentratedtoward the line center.The dust-generatedcomponent, because of the large Doppler shift atthese small solar distances, extends up to A=20 pm(a solar offset angle of 5° corresponds to aclosest solar distance of the LOS of about 20solar radii where the orbital velocity of thedust-generated helium atoms is about 100 km/s).Therefore, by means of a tunable resonance cell
spectrometer one is able to separate the differentradiation contributions to the signal.
Table 1 lists the typical intensitycontributions to be expected in an experimentcarried out on board a high flying sounding rocketabove Natal, Brazil, with a field of view of 2° ,a detector (i.e. channeltron) efficiency of 1OXand a solar offset angle of 5° at 58.4 nm. Thelast column gives the means by which therespective contribution can be reduced in or evenremoved from the signal. The last row specifies acontribution that - strictly speaking - is not aradiation signal, but a contribution due toelectrons and/or protons. A corresponding signal
seen in the previous sounding rocket missionASTROHEL ( also carried out in Natal, Brazil, in1979 ) was identified as a contribution due toelectrons in the energy range around 10 key withinthe field of view of the detector (Réf. 4).
3. THF EXPERIMENT INTERZODIAK
One of the prinary goals of the rocketexperiment INTERZODIAK was to measure for thefirst time this aforementioned "dust-generated"EUV radiation and hence to prove the underlyingtheory.
The payload consisted of:a) Two helium sensors each consisting of achanneltron as a photon counter, an attached Heresonance cell and -becruise of the small solaroffset angles of the LOS - a light baffle tosuppress stray solar light. In order to screen offthe unwanted particle signal (5) in Table 1,cylindricalIy shaped capacitors, maintained at avoltage of 9 kV, were mounted providently withinthis baffle system. This capacitor system keptelectrons up to an energy of 36 keV away from thedetectors.b) one helium sensor, mounted 40° off-axis withoutan attached resonance cell, desigp.c-U to measurethe geocoronal 58.4 nm radiation.c) one hydrogen cal1 sensor contributed by H.Lauche ( Max-Planck-Institut fur Aeronomie inLindau ), consisting of a channeltron and anattached hydrogen resonance cell designed toobserve the Ly-<x resonance line. During most ofthe flight this sensor was pointed 40° off-axis toobserve the geocorona. Close to the apogee,however, the region close to the sun was observedwith the help of a convertible mirror device.
Figure 3 shows the mission program: During itsway up and down the payload was pointed at 13different targets ( 1 thi-ough 13 ) on the sky andkept there for about 70 seconds each. The upperpanel of the picture shows the position of thesetargets close to the sun and the ecliptic.The first attempt to launch the payload
INTERZODIAK on board a SKYLARK 12 took plr.-,e onMarch 3, 1985 at local noon in Natal, Brazil.Unfortunately, due to a failure in the separationof the third stage, the experiment did notfunction properly and the data was barely usable.INTERZODIAK II was launched on September 3, 1939

INTERZODIAK II 175
13 12 11 10 1 MESSZYKLEN
SONNE 15° ABLASEWINKELDER NL-ACHSE
ERDE
Figure 3. INTEEiZODIAK mission program. For the 13 observational cycles thesolar offset angle of the payload axis is shown in the lower panel.The corresponding LOS positions of the sensors Sl and SZ close tothe ecliptic plane are given in the upper panel. Time increases withcycle number.
__1 3 3 k ""' -
Cl -r — P" — >IJLS!n — r — in1 - 1 38° "'
10 kV
gao <m
9tKp.3-sMtp.5-200 400 600 800 1000
TIME • /s 890219 / 110321
Figure 4. The relevant raw data of INTERZODIAK II versus time of flight. Somegeophysical data are given in the lower left corner.
176 G. LAY, H.J. FAHR & H.U. NASS
again at local noon with a SKYLARK 12 from Natal,Brazil. This time the launch was a perfectperformance. Nevertheless, the experimental datadid show some irregularities.
4. THE DATA AND A FIRST ANALYSIS
Fig. 4 shows a plot of the relevant dataobtained versus time of flight. Since the finalattitude tape is not yet available, only the rawdata can be discussed at the present. Someinteresting features, however are apparent in thedata. The panels in Fig. 4 show from top tobottom: Cl and CZ, the helium channel 1 and 2 dataand the corresponding helium cell pressure Pl inmb; C3, the off-axis looking 58.4 nm channel data;C4, the hydrogen channel data and thecorresponding filament heating steps as anindication for the pressure P4 in the hydrogencell; HV, the high voltage applied to theshielding capacitor in the baffle system in kV,and Z, the altitude of the payload in km. Allintensities are given in counts/s.For reasons not yet presently understood, the
high voltage shows a height dependence and,therefore, was switched off during some parts ofthe mission ( from 300 to 450 sec). During thattime the Ly-a signal C4 shows the expectedstepping down as the hydrogen gas pressure P4 isincreased in the absorption cell.
At about BOO s flight time the on-board computercontrolling the experiment failed, leaving allswitches and valves as they where at that instantof time. This breakdown was very probably causedby a high energy particle event that led to a deadloop in the computer program.Above a height of about 500 kilometers the
signal in the helium channels increasedunexpectedly, showing a distinct dependence onheight. Since the aperture of channel 1 stayedclosed after the computer failure at 600 withoutany influence on the signal Cl, it can be deducedthat this enhanced signal is not of radiativenature. It is obvious to assume this signal beingdue to particle events. Using the same argument asabove and the fact that the signal is notinfluenced by the applied screening high voltage,however, shows that the energy of these particlescannot be in the expected energy range of 10 keV.A rough estimate using the Bethe-Bloch formula forparticle penetration of at least 1 mm aluminumgives a lower energy limit of about 1 MeV. Onlyparticles above this energy are able to penetratethe skin of the payload and the materialsurrounding the channeltrons. For a more detailedinvestigation of the contribution of theseparticle events, and how they are related to themagnetic field of the earth, a more precise
knowledge of the payload trajectory and theattitude is needed.
Even at this preliminary stage of analysis,however, it can be concluded that an Increasinglylarge number of highly energetic particles werepresent during the two launches at heightsstarting at 500 km upwards. We hope that adetailed analysis of our data will yield moreinformation about this interesting feature thatappears to be stable over a time period of 10years.
The next step in analyzing the data will be toremove this particle related signal by carefullyevaluating its dependence on height and attitude.The data remaining after this separation procedureare those that the mission INTER20DIAK wasdesigned to record: the interplanetary andgeocoronal EUV resonance ^adiation of HeI and HI.
Acknowledgement: The project INTERZODIAK wasfunded by the German Ministerium fur Forschung undTechnologie.
REFERENCES
1. Fahr H J 1974, The ExtraterrestrialUV-Background and the Interstellar Medium,Space Science Reviews 15, 483-540.
2. Leinert C, Hanner M & Pitz E 1978, On theSpatial Distribution of Interplanetary Dustnear 1 AU, Astron.Astrophys. 63, 183-187,
3. Fahr H J, Ripken H W & Lay G 1981, Plasma -Dust Interactions in the Solar Vicinity andtheir Observational Consequences, Astron.Astrophys. 102, 359-370.
4. Fahr H J & Lay G 1984, Radiation BeltParticles and Oil Emissions determined asContaminations of geocoronal Helium AirglowObservations, J Geophys 54, 219-229.
SESSION 9MIDDLE ATMOSPHERE
Chairman:E.V. Thrane
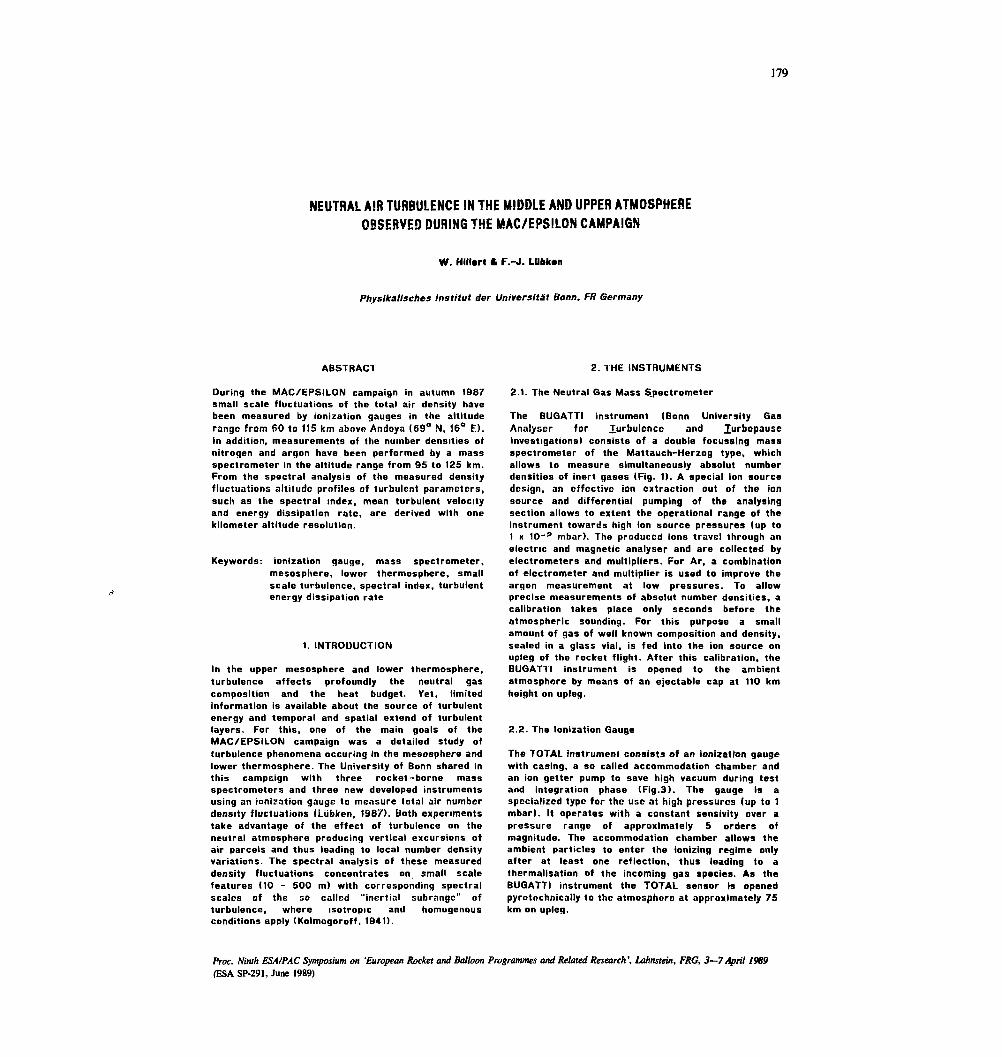
179
NEUTRAL AtR TURBULENCE IN THE MIDDLE AND UPPER ATMOSPHEREOBSERVED DURING THE MAC/EPSILON CAMPAIGN
W. Hillcrt t F.-J. LUbk«n
Physikalisches Institut der Universitat Bonn, FR Germany
ABSTRACT
During the MAC/EPSILON campaign in autumn 1987small scale fluctuations of the total air density havebeen measured by ionization gauges in the altituderange from 60 to 115 km above Andoya (69° N, 16° E).In addition, measurements of the number densities ofnitrogen and argon have been performed by a massspectrometer in the altitude range from 95 to 125 km.From the spectral analysis of the measured densityfluctuations altitude profiles of turbulent parameters,such as the spectral index, mean turbulent velocityand energy dissipation rate, are derived with onekilometer altitude resolution.
Keywords: ionization gauge, mass spectrometer,mésosphère, lower thermosphère, smallscale turbulence, spectral index, turbulentenergy dissipation rate
1. INTRODUCTION
In the upper mésosphère and lower thermosphère,turbulence affects profoundly the neutral gascomposition and the heat budget. Yet, limitedInformation is available about the source of turbulentenergy and temporal and spatial extend of turbulentlayers. For this, one of the main goals of theMAC/EPSILON campaign was a detailed study ofturbulence phenomena occuring in the mésosphère andlower thermosphère. The University of Bonn shared inthis campaign with three rocket-borne massspectrometers and three new developed instrumentsusing an ianization gauge to measure total air numberdensity fluctuations (Liibken, 1987). Both experimentstake advantage of the effect of turbulence on theneutral atmosphere producing vertical excursions ofair parcels and thus leading to local number densityvariations. The spectral analysis of these measureddensity fluctuations concentrates on. small scalefeatures (10 - 500 m) with corresponding spectralscales of the so called "inertial subrange" ofturbulence, where isotropic and homogenousconditions apply (Kolmogoroff, 1941).
2.THE INSTRUMENTS
2.1. The Neutral Gas Mass Spectrometer
The BUGATTI instrument (Bonn University GasAnalyser for Turbulence and TurbopauseInvestigations) consists of a double focussing massspectrometer of the Mattauch-Herzog type, whichallows to measure simultaneously absolut numberdensities of inert gases (Fig. 1). A special ion sourcedesign, an effective ion extraction out of the ionsource and differential pumping of the analysingsection allows to extent the operational range of theinstrument towards high ion source pressures (up to1 x 1O-? mbar). The produced ions travel through anelectric and magnetic analyser and are collected byelectrometers and multipliers. For Ar, a combinationof electrometer and multiplier is used to improve theargon measurement at low pressures. To allowprecise measurements of absolut number densities, acalibration takes place only seconds before theatmospheric sounding. For this purpose a smallamount of gas of well known composition and density,sealed in a glass vial, is fed into the ion source onupleg of the rocket flight. After this calibration, theBUGATTI instrument is opened to the ambientatmosphere by means of an ejectable cap at 110 kmheight on upleg.
2.2. The lonization Gauge
The TOTAL instrument consists of an ionizatfon gaugewith casing, a so called accommodation chamber andan ion getter pump to save high vacuum during testand integration phase (Fig.3). The gauge is aspecialized type for the use at high pressures (up to 1mbar). It operates with a constant sensivity over apressure range of approximately 5 orders ofmagnitude. The accommodation chamber allows theambient particles to enter the ionizing regime onlyafter at least one reflection, thus leading to athermalisation of the incoming gas species. As theBUGATTI instrument the TOTAL sensor is openedpyrotochnically to the atmosphere at approximately 75km on upleg.
Proc. Ninth ESAIPAC Symposium on 'European Rocket and Balloon Programmes and Related Research', Lahnstein, FRG, 3—7 April 1989(ESA SP-291, June 1989)

180 W. HILLERT & F.-J. LUBKEN
magnetic analyser
electrometers '
glas vial fortnflightcalibration
multipliers
entrance slit
accommodation chamber
ejectable ion source cover
Hcjuro i. Cross section of the HUGAfTl-sensor
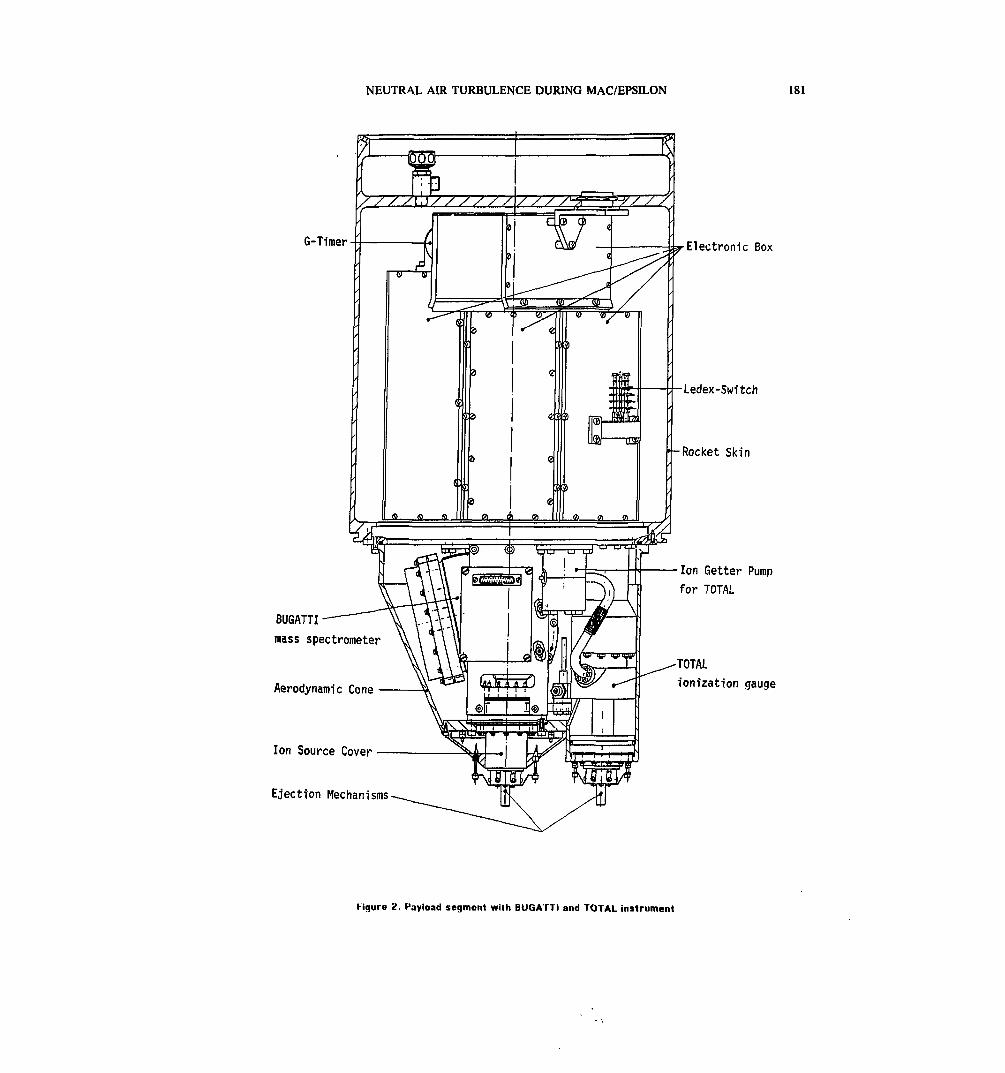
NEUTRAL AIR TURBULENCE DURING MAC/EPSILON 181
G-Timer Electronic Box.
Ledex-Switch
-Rocket Skin
BUGATTImass spectrometer
Aerodynamic Cone
Ion Source Cover
Ejection Mechanisms
Ion Getter Pumpfor TOTAL
TOTALionization gauge
Hgure 2. Payload segment with BUGATTI and TOTAL instrument

182 W. HILLERT & F.-J. LÙBKEN
casing of ionization qautje accommodation chamber with baffle
ejectable cap
/ ionization aauqe
to ion getter pump
figure 3 Cross section of the TOTAL-sensor
2.3. Payload Confiquration
The BUGAIfI mass spectrometer and the IOIALionization gauge are the lowermost instruments in aE-T payload, both mounted on the same platform (Fiq.S). Their inlet openings nrc failing towards the motor,both located at the same level to reach a free field ofview of almost Z n steradian for each of the sensors.The volumes surrounding the sensors and theassociated electronics are kept pressurized with 1 bardry nitrogen in order to avoid arcing ot the varioushigh voltages employed in the instruments. Bothsensors measure on downlug of tlie flight. Tlieinvestigated altitude regime reaches from apogee to95 km for the mass spectrometer and down toapproximately 60 km for the ionization gauges.
3. THE HOCKET FLIGHTS
As part of the international MAC/EPSILON campaign,one BUGATTI and three TOTAL, instruments weresuccessfully launched from Andffya (690N, 16° E),Norway. The first of these bunches (E-TI, "BLfGATT!10" and ' 1 O t A L 10") took place at iO:52:00 Uf onOctober 15. 1987 under geomagnetically quietconditions as part of the Day Salvo, the second (E-T3,"TOTAL 9") ?1:33:?0 UT on October 21, !987 undergeomagnetically weak to moderate disturbedconditions as part of the first Night Salvo A and thethird (E-TS, "TOTAL 11") at 0:21:20 UT on November12, 1987 under strong disturbed geomagneticconditions as part of the second Night Salvo B.
4 . DATA PROCESSING
4.1. Number Densities
The measured electrometer currents or multipliercount rates Ui) of the gas species i are converted toion source densities na(i) by
Mil(t)
where EIi) is the sensivity of the sensor for the gasspecies i. Due to the fact that the incoming gas ispressed into the ion source by the fast motion of thepayload on downleg, the ion source densities areenhanced over the atmospheric densities. The ionsource densities arc converted to atmosphericdensities by a ram correction, which depends on theinfluence of the varying attitude and velocity of therocket (Horowitz et al., 1957)
(2)
with n = atmospheric number densitynn = ion source densitiesT3
r temperature of the accommodationchamber
1 = atmosheric temperatureF = ram factor
This ram correction is derived from a self consistentiterative process: in a first step, ion source densitiesarc corrected with the measured attitude of therocket and a given temperature profile which had beentaken from the USSA 76. The corrected densities areused to compute a temperature profile by integrationof this corrected density profile. In a next step,atmospheric number densities are recalculated usingthe new temperature profile. Repeating these twosteps for 4 or 5 times, a vertical profile ofatmospheric density and temperature is obtainedcovering the height region from 95 to 125 km for themass spectrometer and from 95 to 115 km for theionization gauge (molecular flow region). Fig. 4 andFig. S show the temperature profiles, together withother derived quantities such as temperature gradient(dT/dz), scale heights of nitrogen (HNp ) and total airnumber densities (H,,), pressure scale height (Hp) andbrunt Vàisàla Period (P8), which are used for thequanitative analysis of the turbulent parameters. Theprofiler, ;ire extended towards lower altitudes by usingdensity profiles measured by passive falling spheresduring the MAC/F.PSH ON salvos.
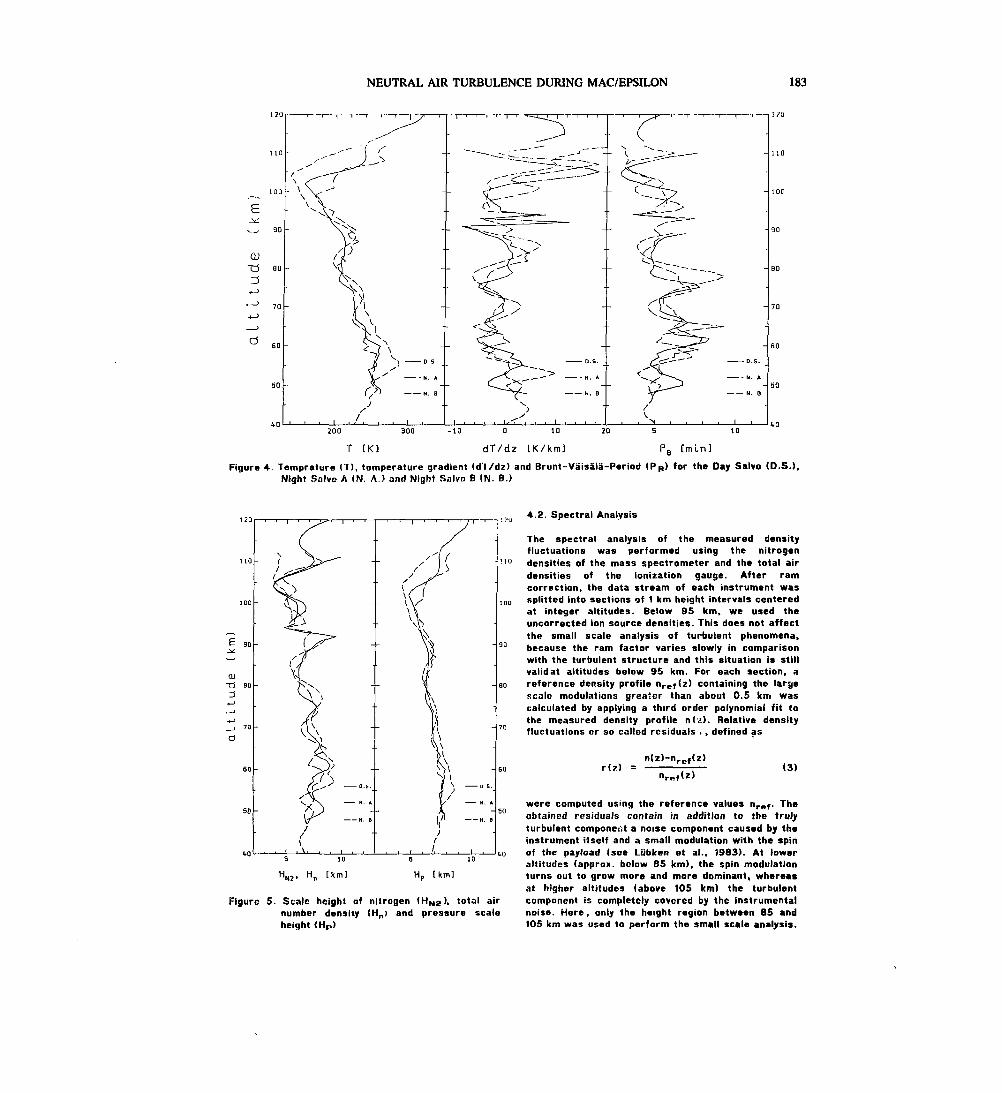
NEUTRAL AIR TURBULENCE DURING MAC/EPSILON 183
- so
Figure 4. Temprature (T), temperature gradient (d'l/dz) and Brunt-Vàïsala-Period (PB) for the Day Salvo (O.S.).Night Salvo A (N. A.) and Nigh» Salvo B (N. B.)
QJT3 BQ
H1, [ k m ] Hp UmI
Figure 5. Scale height of nitrogen (HN2), total airnumber density (Hn) and pressure scaleheight <HP)
4.2. Spectral Analysis
The spectral analysis of the measured densityfluctuations was performed using the nitrogendensities of the mass spectrometer and the total airdensities of the ionization gauge. After ramcorrection, the data stream of each instrument wassplitted into sections of 1 km height intervals centeredat integer altitudes. Below 95 km, we used theuncorrected ion source densities. This does not affectthe small scale analysis of turbulent phenomena,because the ram factor varies slowly in comparisonwith the turbulent structure and this situation is stillvalidât altitudes below 95 km. For each section, areference density profile n re f(z) containing the largescale modulations greater than about 0.5 km wascalculated by applying a third order polynomial fit tothe measured density profile n(.>>. Relative densityfluctuations or so called residuals ., defined as
n(z)-nrcf(z)
nrnf(z)(3)
were computed using the reference values nref. Theobtained residuals contain in addition to the trulyturbulent component a noise component caused by theinstrument itself and a small modulation with the spinof the payload (see Liibken et al., 5983). At loweraltitudes (appro», below 85 km), the spin modulationturns out to grow more and more dominant, whereasat higher altitudes (above 105 km) the turbulentcomponent is completely covered by the instrumentalnoise. Here, only the height region between 85 and105 km was used to perform the small scale analysis.
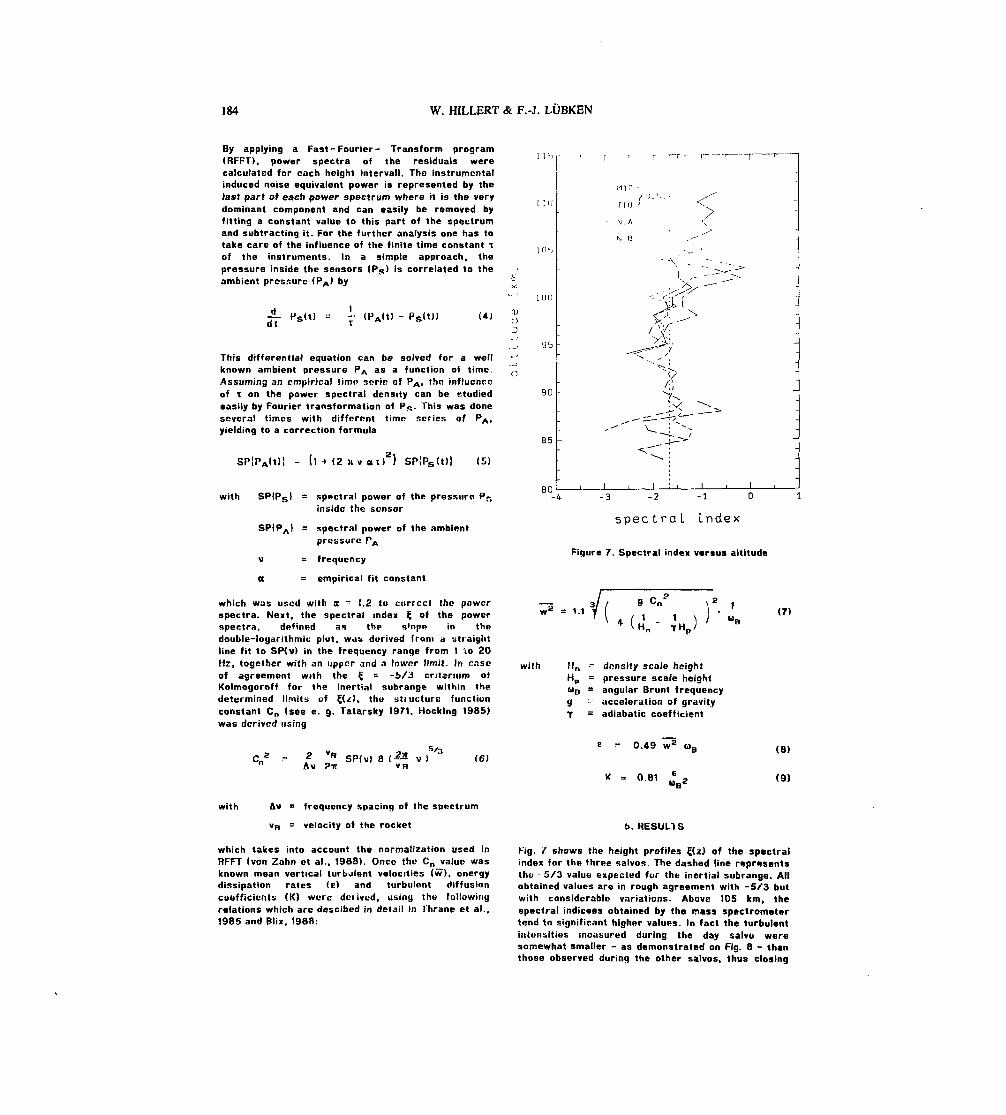
184 W. HILLERT & F.-J. LUBKEN
By applying a Fast - Fourier - Transform program(RFFT), power spectra of the residuals werecalculated for each height interval). The instrumentalinduced noise equivalent power is represented by thelast part of each power spectrum where it is the verydominant component and can easily be removed byfitting a constant value to this part of the spectrumand subtracting it. For the further analysis one has totake care of the influence of the finite time constant tof the instruments. In a simple approach, thepressure inside the sensors (P<;) is correlated to theambient pressure (PA' by
r <HA<t) - Ps(t)) (41
This differential equation can be solved for a wellknown ambient pressure PA as a function of time.Assuming an empirical time scrio of PA, the influenceof T on the power spectral density can be studiedeasily by Fourier transformation of PB. This was doneseveral times with different time scries of PA,yielding to a correction formula
SP|PA(t)! - (l • (2 Ti « <*ï)Z) SP|Ps(t)î (5)
with SPIPj3I = spectral power of the pressure Pn
inside the sensor
SPIPA ( = spectral power of the ambientpressure PA
V = frequency
a = empirical fit constant
which was used with oc ~ 1.2 to correct the powerspectra. Next, the spectral index C of the powerspectra, defined as the s'ope in thedouble-loyarithmic plut, WdS derived from a straightline fit to SP(v) in the frequency range from t 'to 20Hz, together with an upper and a lower limit. In raseof agreement with the $ - -6/3 critérium ofKolmogoroff for the inertia! subrange within thedetermined limits of Ç(z), the structure functionconstant Cn (see e. g. Tatarsky 1971, Hocking 1985)was derived using
, s. _Av Pit
SPIv) 8 (•*- v )VR
(6)
IGU
OJo3
90
85
80
M in
r KJ
N. A
N B
l I . I-4 -3 -2 -1 O
spectral Index
Figure 7. Spectral index versus altitude
-T. 3Jl 9 Cn?
w 1 ' M , ( 1 i S* - -
(7)
-,H0
with Hn •- density scale heightHp = pressure scale heightUQ = angular Brunt frequencyg - acceleration of gravityT = adiabatic coefficient
E ^- 0.49 w5 4iB
K = 0.81 .? ,
(8)
(9)
with Av = frequency spacing of the spectrum
Vp = velocity of the rocket
which takes into account the normalization used inRFFT (von Zahn ct a!., 1988). Once the Cn value wasknown mean vertical turbulent velocities (w), energydissipation rates (E) and turbulent diffusioncoefficients (K) were derived, using the Followingrelations which are descibed in detail in Ihrane et al.,1985 and BHx, 1988:
t>. HESULlS
Kig. ? shows the height profiles C(z) of the spectralindex for the three salvos. The dashed line representsthe 5/3 value expected for the inertia! subrange. Allobtained values are in rough agreement with -5/3 butwith considerable variations. Above 105 km, thespectral indicées obtained by the mass spectrometertend to significant higher values. In fact the turbulentintensities measured during the day salvo weresomewhat smaller - as demonstrated on Fig. 8 - thanthose observed during the other salvos, thus closing

NEUTRAL AIR TURBULENCE DURING MAC/EPSILON 185
£•^r
CU
3
' 90
Ci
pn
-T-J-- -T-, T— |- - -T -y-— I— f 1— T-
\
O O- I 1 0\ O- rii ' i' fy •* ^ - ^ - ' M
/ " /d. Ata o *TO
^- Xv a ~o V
"i ..^^r^''*
Vn a o
\
*-
O
1 i l . I L_J_
TItT| I I T-T-TTTIJ r T I I l I T I ] T I ' ' I T I J
- V'W ^J^ "\J^ / "*• <.
(T Hx. ^» ^
>-,*" ./
\ jQu \>
» *\
D O
n u l i i l | I 1 — i I
I , I 1 I | T | I r T |
< f
\)<
^À-,,_'--
"^ X^''* -
O M l G Xo
O T l O 0^ ^
« T09
û--- T I l \
D O- • - USSA 76
. I '
100
90
80io-5 ID-' io-3 io-! ID- ' 10° io-J 10-' 10°
e [ W / k g ] w [ m / s ]
10-' 10-' 10° lo1 io j io3
K C m 2 X s I
Fiqure 8. Altitude profiles of energy dissipation rate (e), mean vertiacl turbulent velocity (9) and turbulentdiffusion coefficient, derived from BUGATTI 10 (M10), TOTAL 10 (T10). TOTAL 9 (T09) and TOTAL 11(Dl). The dashed line represents the shifted «-Profile of the USSA 76 (see text).
out altogether the inertia! subrange at this altitudes.Energy dissipation rates, mean vertical turbulentvelocities and turbulent diffusion coefficients arepresented on Fig. 8. The dashed line represents theK-Profile of the USSA 76, shifted 10 km downwardsfor comparison reasons. In the height region betweenSO and 100 km, the measured values areapproxemately one order of magnitude lower thanthose predicted by the mean K-Profile of the USSA76, which is in agreement with measurementsperformed during the MAP/WINE campaign (Lubken etal.. 1987).
6. CONCLUSIONS
A new instrument - the TOTAL sensor - has beendeveloped and been operated - together with the massspectrometer - successfully during the MAC/EPSILON!campaign. Vertical profiles of turbulent parametershave been derived for all 3 flights covering an altituderange of 25 km.
7. ACKNOWLEDGEMENTS
The authors thank H. Baumann for the mechanicalpréparation of the instruments. This research wassupported by the Bundesministerium fiir Forschungund Technologie, Bonn, through grant 01-OE-8604 6.
8. REFERENCES
Blix, T., In situ studies of turbulence in the middleatmosphere by means of electrostatic ionprobes, Ph.D. thesis. University of Oslo,Norway, 1988
Hocking, W.K., Measurement of turbulent energydissipation rates in the middle atmosphere byradar technique: A review. Radio Sd., 20,1403-1*22, 1985
Horowitz, R., and LaGow, H.t., Upper air pressureand density measurements from 90 to 220kilometers with the Viking 7 rocket, J. Geophys.Res.. 62, 57-58, 1957
Kolmogoroff, A.N., The local structure of turbulencein incompressible viscous fluid or very largeReynolds number, Dokl. Acad. Nauk SSSR, 30,301, 1941
Lubken, F.J., and von Zahn, U., Small scale densityfluctuations at homopause altitudes, ESAScientific and Technical Publications Branch,c/o ESTEC, Noordwijk, Netherlands, 1983
Lubken, F.J., TOTAL: a new instrument to studyturbulent parameters in the mésosphère andlower thermosphère. ESA Publications Division,ESTEC, Noordwijk, The Netherlands, 1987
186 W. HILLERT & F.-J. LÛBKEN
Lubken. F.J.. von Zahn, U., Thrane, E.V., Blix, T..Kogin, Q.A. and Pachomov, S. V., In situmeasurements of turbulent energy dissipationrates and eddy diffusion coefficients duringMAP/WINE. J. Atmos. Terr. Phys.. 49.763-775, 1987
USSA 1976. U.S. Standard Atmosphere, 1976,NOAA-S/T 76-1562, U.S. Government PrintingOffice, Washington, D.C., 1976
Tatarsky, V.I.. The Effects of the TurbulentAtmosphere on Wave Propagation, IsraelProgram for Scientific Translations Ltd, U.S.Department of Commerce, NTIS, Springfield,VA 22151 (translated from the Russian), 1971
Thrane, E.V., Andreassen, 0., Blix, T., Grandal, B.,Brekke, A.. Philbrick, C.R.. Schmidlin, F.J.,Widdel, H.U., von Zahn. U., and Lubken, F J ,Neutral air turbulence in the upper atmosphereobserved during the bnergy Budget Campaign, J.Atmos. Terr. Phys.. 49. 243-264. 1985
von Zahn, U., Lubken, r.J., and PUtz. Ch., 'BUGATTI'Experiments: mass spectrometric studies ofthe lower thermosphère eddy mixing andturbulence, submitted to J. Geophys. Res., 1988
187
POLAR MESOSPHERE SUMMER ECHOES AND ASSOCIATED ATMOSPHERIC GRAVITY VfAVES
P. J. S.Williams A.P.van Eyken C.Hall .T.RBttger
Coleg Prifysgol CyroruAberystwyth SY23 3BZWales
Southampton UniversitySouthampton S09 5NHEngland
Nordlysobservatoriet9001 TronisoNorway
EISCAT Scientific Association981 28 KirunaSweden
ABSTRACT.
Mesospheric observations at Tromstf were made withthe EISCAT VHP radar, using the OEN-Il correlatorprogramme to determine pulse-to-pulse correlationfunctions for Barker-coded double pulses. On oneoccasion lasting for a total of 5 hours arelatively weak Polar Mésosphère Summer Echo (PMSE)was observed at a height of 85 km with itsintensity increasing to a maximum at intervals ofapproximately 27 minutes. In the region below thePMSE layer, height profiles of vertical velocityshowed an atmospheric gravity wave, also with aperiod of about 27 minutes. In most cases themaximum intensity of the PMSE corresponded to themaximum upward velocity associated with the wave.It is suggested that particle precipitation,adiabatic cooling due to the upward velocity andwave steepening and breaking at the roesopause allappear to play a role in creating the conditionsfor PMSEs to be observed.
Keywords : Polar Mésosphère Summer Echoes (PMSEs),Incoherent-Scatter Radar, Atmospheric GravityWaves, Heavy Ion Clusters, Turbulent EnergyDissipation, Inertial Sub-range.
1. INTRODUCTION
Throughout the summer, EISCAT (the EuropeanIncoherent-Scatter radar) operating at 22li MHz,regularly receives strong echoes from narrow layersin the mésosphère, called Polar Mésosphère SummerEchoes or PMSEs (Réf. 1-3). These echoes are farstronger than the incoherent-scatter echoesnormally received from the middle- andupper-atoosphere, and suggest quasi-coherentscattering. In June, July and August 1988 aninternational campaign was organised to makeextensive observations of PMSEs using twocategories of EISCAT experimental programmes. Inthe first category, programmes based on the GEH-Ilradar modulation (Réf. U) used a series ofBarker-coded double-pulses to observe themésosphère between 70 km and llU km with a heightresolution of 1.05 km and a spectral resolution of3.6 Hz. In the second category, programmes usingcomplementary codes observed the PMSE layers with aheight resolution of 150 or 300 ro but covered amore limited height range between 80 and 90 km. Allprogrammes measured height profiles of the powerreceived, the spectral width and the mean Dopplershift of the scattered signals.
2. EISCAT OBSERVATIONS AND ANALYSIS
EISCAT is situated in Rarofjordmoen in Norway(69.6°N,19.2°E) and consists of two systemsoperating at VHF and UHF (Réf. 5). The observationsreported in this paper were made using the VHFradar in a frequency band centred on 22lt MHz. Thisis a roonosttttic radar and the signals aretransmitted and received through a parabolic troughantenna with a total size of l*6n x 120ro (Réf. 6).The first successful observations of the mésosphèrewith this radar were carried out in February 1987and are described by Hall et al. (Réf. 7).
The EISCAT VHP transmitter is designed to operatewith two klystrons but in the summer of 1988 onlyone klystron was available, operating with a peakpower of about 1.2 MW. This offered the possibilityof transmitting linear polarisation from the wholeantenna to roaximuroize the signal-to-noise ratio, orcircular polarisation from half of the antenna toavoid any possible error due to Faraday rotation.In the PMSE experiment the signal-to-noise ratiofor the echoes was always so strong that the lattermode was used.
The observations reported in the present paper weremade using the GENII radar modulation. Doublepulses were transmitted, each with 13-bitBarker-coding to give a height resolution of 1.05km. Echoes were received fï-ora 1(2 independent rangegates and the digital correlator performedpulse-to-pulse correlation to provide heightprofiles of the autocorrelation functions. GEN-Ilis described in detail elsewhere (Réf. U,7) andonly the main features are suromariser! in Table 1.
The autocorrelation functions of the echo'es from agiven range-gate were first post-integrated for 150seconds. The mean Doppler shift was then determinedto indicate the Hne-of-sight component of plasmavelocity at that range. For all the heightsconsidered in the present paper (70 to 92 Jan) theion-neutral collision frequency was sufficientlyhigh that it could be assumed that the measuredcomponent of plasma velocity represented thevertical velocity of the neutral atmosphere.
The measured correlation functions were thencorrected for Doppler shift and by extrapolatingthe corrected auto-correlation functions to zerolag we obtained the total scattered power and thehalf-power spectral width for each gate. For thosegates where only incoherent scatter occurred the
Proc. Ninth ESAIPAC Symposium on 'European Rocket and Balloon Programmes and Related Research', Lahnstein, FRG, 3—7April 1989(ESA SP-291, June 1989)
188 P.J.S. WILLIAMS ET AL.
total scattered pover was used to determine theactual electron concentration (Réf. 8). This didnot apply to gates where PMSEs were seen, but forconvenience scattered PMSE power was represented asan equivalent electron concentration.
Table 1.
Experimental Parameter Value
Transmitter peak powerAntenna positionNumber of lags in ACFLag spacingFrequency resolutionBarker codeBit lengthHeight resolutionHeight range observed
1.2 MWvertical226.666 œs3.6 Hz13 tit7 us1,05 km70 km - Uh km
3. RESULTS
During observations made between 0100 and 0600 UTon 12 August 1988, echoes were received from theheight range 85-86 to. Thej showed thecharacteristic features of PMSEs, namely strongecho power and narrow spectra (Réf. 2). However,although the PMSEs were much stronger than theechoes received from the background D-region, theywere significantly weaker than the PMSEs observedin June and July. This allowed simultaneousmeasurements to be made of both the PMSEs and thebackground D-region without the backgroundmeasurements suffering unduly from receiversaturation, or from "side-lobes' of the PMSE layerwhich are seen in the power-profile as a result ofthe Barker-coding.
The PMSEs observed on 12 August were intermittent,with sharp peaks in scattered power occurring in aquasi-periodic manner at OlltO, 0210, 0238, 0310,0350, 01(15, OJ(I(O, 0507 and 0535 UT, as shown inFigure Ia. This figure also shows the actualelectron concentration at heights above the PMSElayer. It is clear that PMSEs were only observedwhen particle precipitation was strong enough tocreate a. background electron concentration greater
Figure Ib presents the corresponding measurementsof vertical velocity and these also show evidenceof a quasi-periodic variation. It is apparen', froma quick comparison of Figures Ia and Ib that inroost cases the peaks of scattered power from thePMSE layer correspond to the maximum upwardvelocity in the neutral atmosphere at heights justbelow the layer. To confirm this quantitatively, asimple wave function of the form :-
V(z,t) = A(z).sin(2ir [t/T z/ (1)
was natohed to the set of velocity measurementsbetween 0300 and 0600 OT for all heights between 70and 86 km. A(Z), T and * were varied to obtainthe "least-squares" deviation of the fitted wavefrco the data.
The results confirm the presence of a 27.5-minutewave with downward phase-propagation correspondingto a vertical wavelength of 35 km. The amplitude ofthe wave increased steadily with height up to80to, reached a maximum at about 82 km and thendecreased. These characteristics suggest anatmospheric gravity wave (AGW) with group-velocitydirected upwards.
This wave is illustrated in Figure 2 where the timevariation of the total power scattered fron thePMSE layer is compared with the average verticalvelocity over the height ranges 70-fk km, 7U-78 km,78-82 km and 82-86 km. An AGW with a period of 27.5minutes and a vertical wavelength of 35 km is alsoindicated in the figure, with a continuous line tomark the roaximuro upward velocity and a broken lineto mark the maximum downward velocity. This diagramconfinas the relationship between the maxima inscattered power and the maxima in upward velocity.
The results also indicate that the regular patternof the AGW does not extend above the PMSE layer.Figure Ib shows that the wavelike oscillationschange their period and vertical wavelengthabruptly above 86 km. The same effect has beenobserved in other EISCAT roesospheric experiments(Réf. 7).
Similar variations in the period of oscillationhave been reported in the upper troposphere andlower stratosphere where it was demonstrated thatthe variation of wave oscillation period wasconsistent with the temperature lapse rate deducedfrom radiosonde temperature profiles (Réf. 9)« Itfollows that in this case it was possible to relatea fairly sharp increase in oscillation frequency tothe presence of the tropopause.
Applying the same argument to the observations inFigure Ib we can identify the change frco longer toshorter periods in the vertical velocityoscillations with the roesopause. In this way we canestimate the height of the roesopause to be around87 km, with the PMSEs occurring at, or a littlebelow, this height. It is therefore difficult toexplain the reduction of wave oscillation amplitudewith altitude in terms of supersaturation whichoccurs at the stable mesopause and above, and isassociated with turbulence (as suggested by Frittsand Van Zandt 1989, personal communication).
Instead we would suggest that the presence of thetemperature inversion causes heavy retardation ofthe upward-moving air parcels at or below themesopause, and hence a dramatic foreshortening ofthe gravity wave wavelength in the region ofnegative lapse rate.
Such an effect would supply a mechanism forgenerating turbulence. However, it is not certainat present if turbulence is generated, or needed tocause the PMSEs, since this should manifest itselfin a widened Doppler spectrum (Réf. 2).
A similar relationship between maximum powerscattered frcn> the PMSE layer and maximum upwardvelocity was also seen on several other days,including 13 August; although the results were notso clear cut, once again there was evidence of aquasi-periodic variation in the PMSE correspondingto an AGW at lower heights.
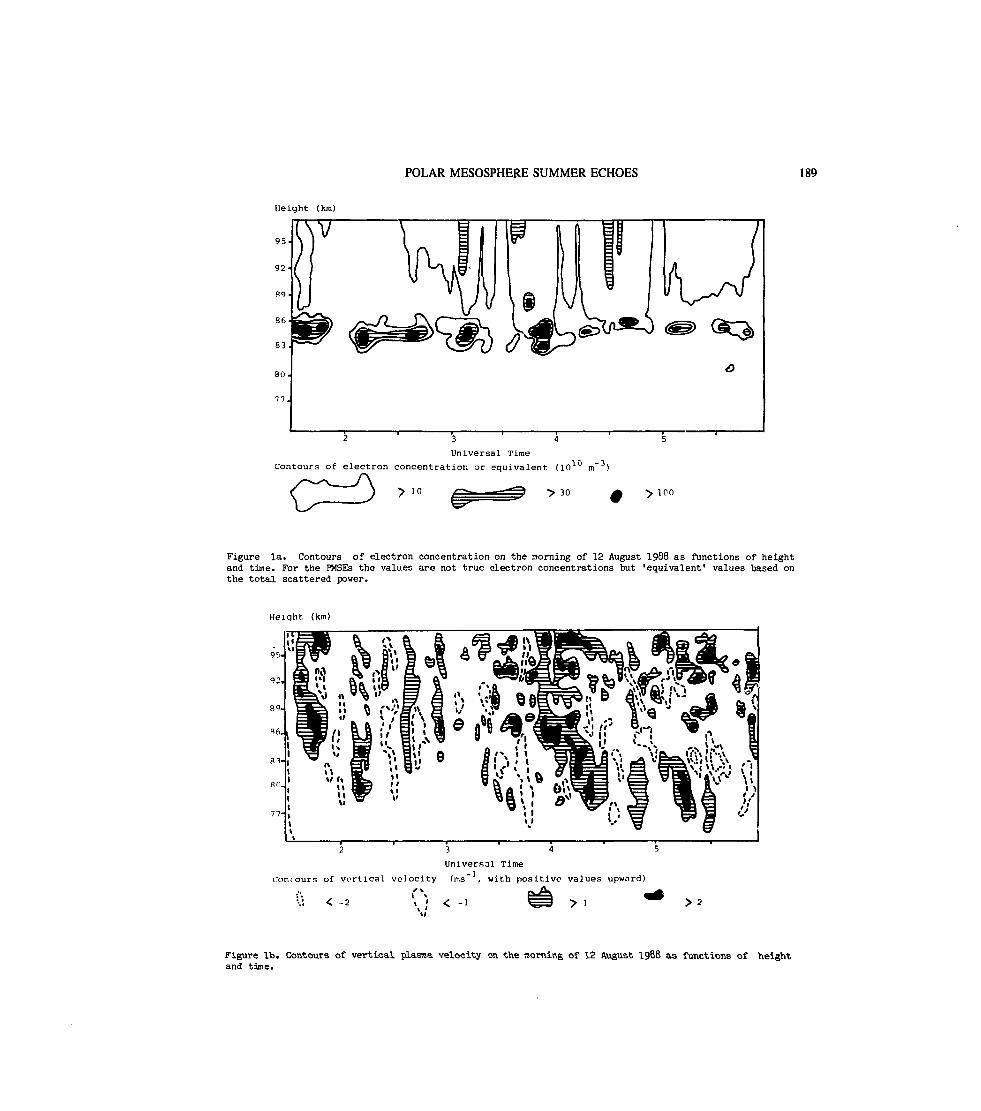
POLAR MESOSPHERE SUMMER ECHOES 189
Height (km)
Universal Time
Contours of electron concentration or equivalent (10 m )
> loo
Figure Ia. Contours of electron concentration on the morning of 12 August 1988 as functions of heightand time. For the PMSEs the values are not true electron concentrations but 'equivalent1 values based onthe total scattered power.
Height (km)
3 4
Universal Time
contours of vortical velocity (ms~ , with positive values upward)
< -2 < -1
Figure Ib. Contours of vertical plasma velocity on the morning of 12 August 1988 as functions of heightand tine.
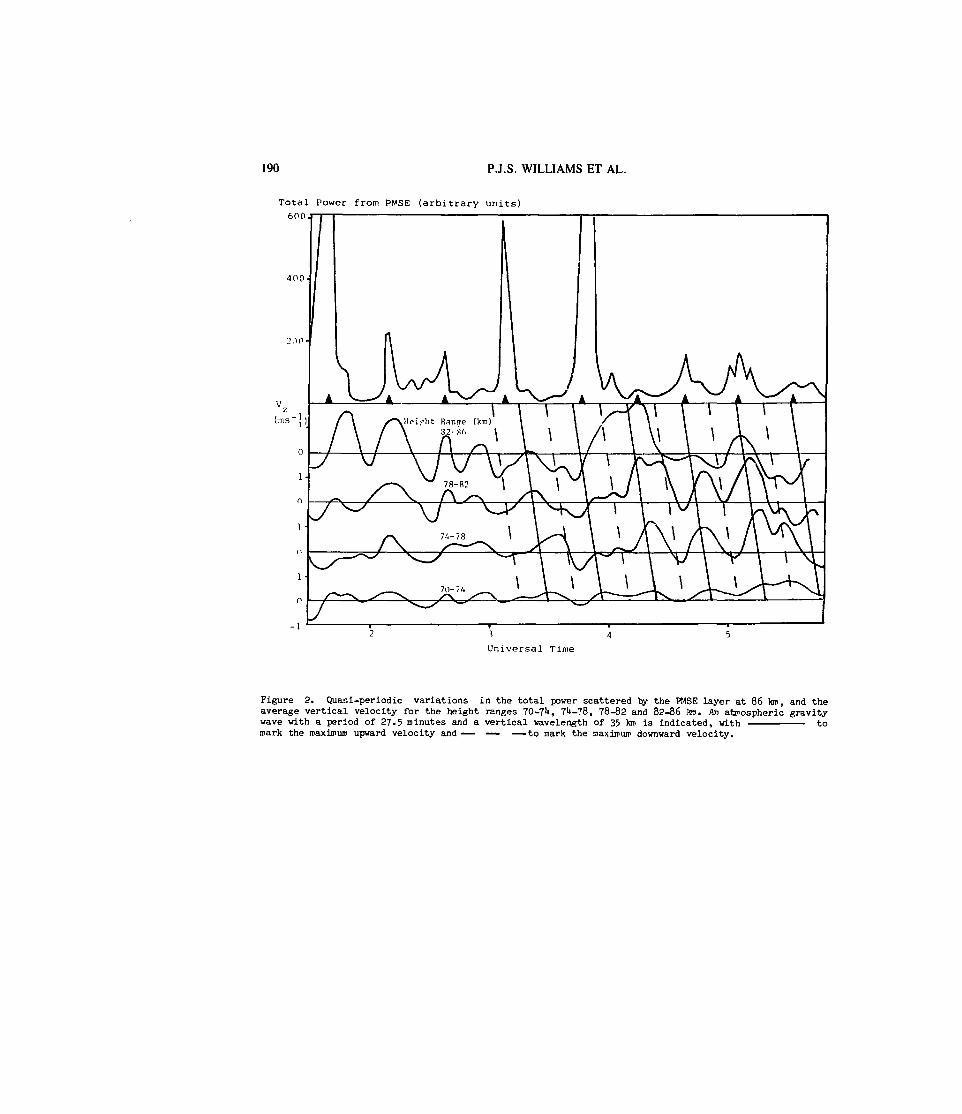
190 P.J.S. WILLIAMS ET AL.
Total Power from PMSE (arbitrary units)600
400
Figure 2. Quaoi-periodic variations in the total power scattered by the PMSE layer at 86 'km, and theaverage vertical velocity for the height ranges 70-71I, 7U-78, 78-82 and 82-86 km. An atmospheric gravitywave with a period of 27.5 minutes and a vertical wavelength of 35 km is indicated, with tomark the maximum upward velocity and — — —to mark the maximum downward velocity.
POLAR MESOSPHERE SUMMER ECHOES 191 /
'U. CONCLUSION
These observations demonstrate a definiteassociation between waves in the neutral atmosphereand a periodic variation in the strength of thePMSE.
Two possible mechanisms for this have beensuggested :-a) adiabatic cooling during the uplift phase of theoscillation, which in August reduces the raesopausetemperature sufficiently to cause nucleation ofheavy ions and ice particles;b) wave steepening and breaking at the mesopause.
Adiabatic cooling would cause a sufficient drop intemperature for the forward reaction in theformation of proton hydrates to outstrip thebackward reaction, so that very large hydrated ionswere produced. Clusters of large ions have beensuggested as the reason for the narrow spectralwidths sometimes observed at these heights (Réf.10).
In the presence of such ions the arobipolardiffusion coefficient may decrease sufficiently forthe inertial subrange of the electron gas to extendto wavenurobers well beyond the limit for theneutral gas. If this subrange extends to largeenough wavenurobers for the Bragg condition to applyto the EISCAT VHF transmissions, the scatteringmechanism suggested by Kelley et al. may befeasible (Réf. 11).
In contrast, rapid warming of the descending airwould bring about the destruction of cluster ionsover tiroeseales considerably less than the gravitywave period.
It is therefore likely that heavy ion clusters areconcentrated in patches as a result of localisedcooling during the upward phase of verticaloscillation, and are destroyed by warming duringthe downward phase. We may therefore expect verylocalised changes in Schmidt number and hence verylocalized changes in the refractive index whichcause Fresnel reflections, provided the verticalscale-length of these changes is less than theradar wavelength. Fresnel reflection could also beexpected because we note from other observations(Réf. 2) and from recent high-resolutioncomplementary code measurements (La Hoz et al.,private communication) that the echoes often sterofrom vertically very thin layers. They also axhibita very strong signal power which could not beexplained by conventional scattering from such thinlayers, which are often quite calm internally andinactive rather than strongly turbulent.It remains questionable, therefore, as to whetherthe turbulence is always present and theconcentration of passive tracers is modulated bythe atmospheric gravity wave or whether the passivetracers for turbulence are always present and theturbulence itself is periodic in association withthe wave. It is also possible that both phenomenaoccur in phase.
5. ACKNOWLEDGEMENTS
We wish to thank the staff of EISCAT for their helpin making the observations. The EISCAT ScientificAssociation is supported by Sucroen Akatemia(Finland), CNRS (France), Max-Planck Gesellschaft(FRG), WAF (Norway), NVF (Sweden) and the SERC(UK) . One of us (APvE) is indebted to the SERC forsupport during the period when this work wascarried out.
6. REFERENCES
1. Hoppe U-P, Hall C, & RSttger J 1988, Firstobservations of summer polar mesospheric back-scatter with a 22*4MHz radar, Geophys.Res.Lett.15, 28-31.
2. Rflttger J, La Hoz C, Kelley M C, Hoppe U-P &Hall C 1988, The structure and dynamics ofpolar mésosphère summer echoes observed withthe EISCAT 22U MHz radar, Geophys.Res.Lett.,15, 1353-1356.
3. Rishbeth H, van Eyken A P, Lanchester B S,Turunen T, ROttger J, Hall C M S Hoppe U-P1988, EISCAT VHF radar observations ofperiodic mesopause echoes, Planet.Sp.Sci.,36, 1(23-1)28.
1*. Turunen T 1986,GEN-SïSTEM - a new experimentalphilosophy for EISCAT radars, J.atroos.terr.Phys., 1»8, 7T7-8T5.
5. Folkestad K, Hagfors T & Westerlund S 1983,EISCAT: an updated description of technicalcharacteristics and operational capabilities,Radio Sci., 18, 867-879.
6. Hagfors T, Kildal P S, Kârcher H J, Liesen-kotter, B 1 SchrBder G 1982, VHP paraboliccylinder antenna for incoherent scatter radarresearch. Radio Sci. 17, 1607-1621.
7- Hall, C M, Hoppe U-P, Williams P J S & JonesG O L 1987, Mesospheric measurements using theEISCAT VHF system: first results and theirinterpretation, Geophys.Res.Lett. lU, 1187-1190.
8. Kofman W, Bertin F, RBttger J, Creroieux A &Williams P J S 198U, The EISCAT mesosphericmeasurements during the CAMP campaign,J.atmos.terr.Phys., 1(6, 565-575.
9. RSttger J I960, 19th Conference on RadarMeteorology, 593-598, American MeteorolgicalSociety, Boston, Mass.
10. Collis P N, Turunen T & Turunen E 1988,Evidence of heavy positive ions at the summerarctic mesopause from EISCAT UHF incoherentscatter radar, Geophys.Res.Lett., 15, 1U8-151.
11. Kelley M C, Farley D T t Rflttger J 1987, Theeffect of cluster ions on anomalous VHF back-scatter fron the summer polar mésosphère,Geophys.Res.Lett. lU, 1031-103U.
SESSION 10RANGE FACILITIES
Chairman:D. Offermann
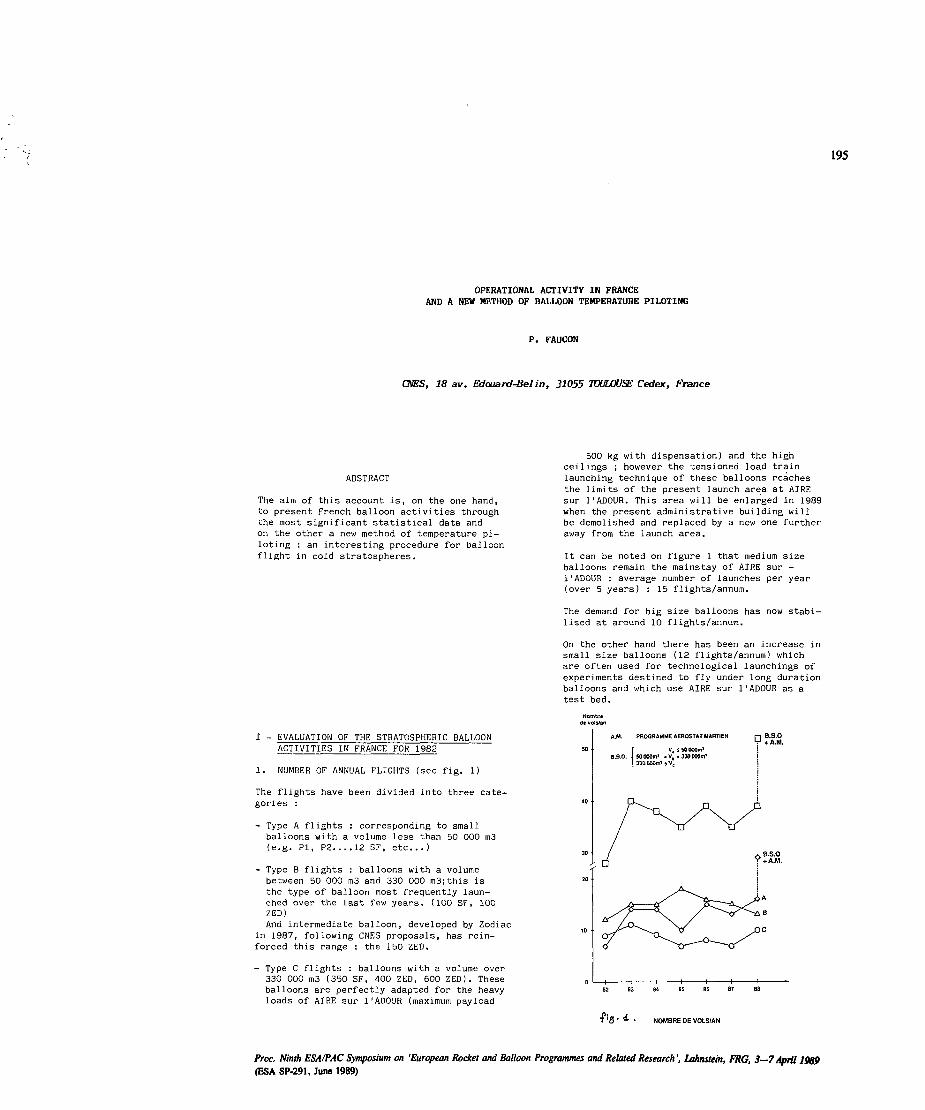
195
OPERATIONAL ACTIVITY IN FRANCEAND A NEW METHOD OF BALLOON TEMPERATURE PILOTING
P. FAUCON
ONES, 18 av. Edouard-Sel in, 31055 TOULOUSE Cedex, France
ABSTRACT
The aim of this account is, on the one hand,to present French balloon activities throughche most significant statistical data andon the other a new method of temperature pi-loting : an interesting procedure for balloonflight in cold stratospheres.
500 kg with dispensation) and the highceilings ; however the tensioned load trainlaunching technique of these balloons reachesthe limits of the present launch area at AlREsur 11ADOUR. This area will be enlarged in 1989when the present administrative building willbe demolished and replaced by a new one furtheraway from the launch area.
It can be noted on figure 1 that medium sizeballoons remain the mainstay of AIRE sur -1'ADOUR : average number of launches per year(over 5 years) : 15 flights/annum.
The demand for big size balloons has now stabi-lised at around 10 flights/annum.
On the other hand there has been an increase insmall size balloons (12 flights/annum) whichare often used for technological launchings ofexperiments destined to fly under long durationballoons and which use AIRE sur 11ADOUR as atest bed.
I - EVALUATION OF THE STRATOSPHERIC BALLOONACTIVITIES IN FRANCE FOR 1982
1. NUMBER OF ANNUAL FLIGHTS (see fig. 1)
The flights have been divided into three cate-gories :
- Type A flights : corresponding to smallballoons with a volume less than 50 000 m3(e.g. Pl, P2 12 SF, etc...)
- Type B flights : balloons with a volumebetween 50 000 m3 and 330 000 m3;this isthe type of balloon most frequently laun-ched over the last few years. (100 SF, 100ZED)And intermediate balloon, developed by Zodiac
in 1987, following CNES proposals, has rein-forced this range : the 150 ZED.
- Type C flights : balloons with a volume over330 000 m3 (350 SF, 400 ZED, 600 ZED). Theseballoons are perfectly adapted for the heavyloads of AIRE sur l'ADOUR (maximum payload
A.M. PROGRAMME AEROSTMMARTlEH
( V, SSOOOOm1
50000m1 < V1 < 330000m1
33000Om1SVj
T '3 • * • NOMBRE OE VOLS/AN
froc. Ninth ESAIfAC Symposium on 'European Rocket and Balloon Programmes and Related Research ', lahnstein, FRG, 3—7April 1989(ESA SP-291, June 1989)
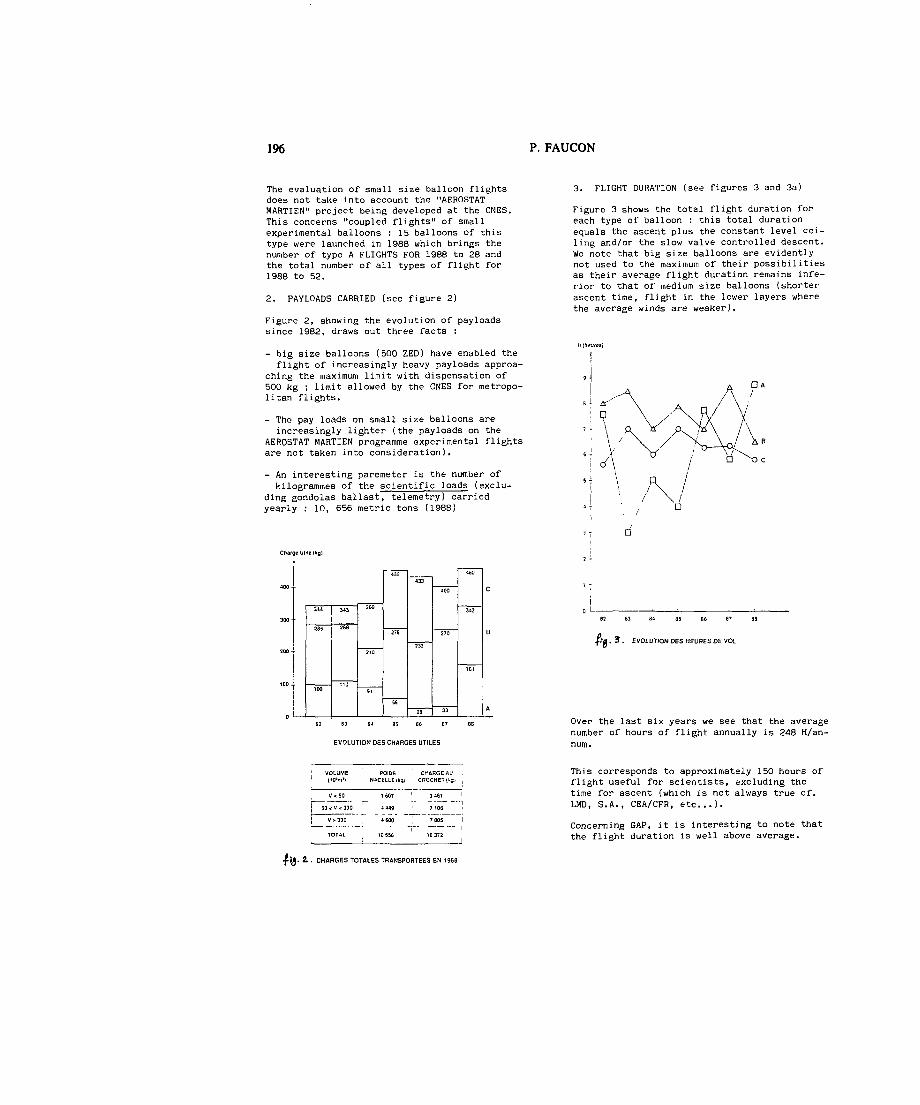
196 P. FAUCON
The evaluation of small size balloon flightsdoes not take into account the "AEROSTATMARTIEN" project being developed at the CNES.This concerns "coupled flights" of smallexperimental balloons : 15 balloons of thistype were launched in 1988 which brings thenumber of type A FLIGHTS FOR 1988 to 28 andthe total number of all types of flight for1988 to 52.
2. PAYLOADS CARRIED (see figure 2)
Figure 2, showing the evolution of payloadssince 1983, draws out three facts :
- big size balloons (500 ZED) have enabled theflight of increasingly heavy payloads approa-
ching the maximum limit with dispensation of500 kg ; limit allowed by the CNES for metropo-litan flights.
- The pay loads on small size balloons areincreasingly lighter (the payloads on the
AEROSTAT MARTIEN programme experimental flightsare not taken into consideration).
- An interesting paremeter is the number ofkilogrammes of the scientific loads (exclu-
ding gondolas ballast, telemetry) carriedyearly : 10, 656 metric tons (1988)
Charge uttle (kg]
I
~28~ 33
3. FLIGHT DURATION (see figures 3 and 3a)
Figure 3 shows the total flight duration foreach type of balloon : this total durationequals the ascent plus the constant level cei-ling and/or the slow valve controlled descent.We note that big size balloons are evidentlynot used to the maximum of their possibilitiesas their average flight duration remains infe-rior to that of medium size balloons (shorterascent time, flight in the lower layers wherethe average winds are weaker).
f;a. 3 . EVOLUTION DES HEURES DE UOL
S2 63 8J 35 66 67
EVOLUTION DES CHARGES UTILES
Over the last six years we see that the averagenumber of hours of flight annually is 248 H/an-num.
1 VOLUME
'I V
I 50«
! v
< 50
V e 330
> 330
TOTAL
POIDS
1 607
4449
4600
ID 655
CHARGE AU
3461
7 106
7805
IB 372
!
I
!i
i
This corresponds to approximately 150 hours offlight useful for scientists, excluding thetime for ascent (which is not always true cf.LMD, S.A., CEA/CFR, etc...).
Concerning GAP, it is interesting to note thatthe flight duration is well above average.
, CHARGES TOTALES TRANSPORTEES EN 1968
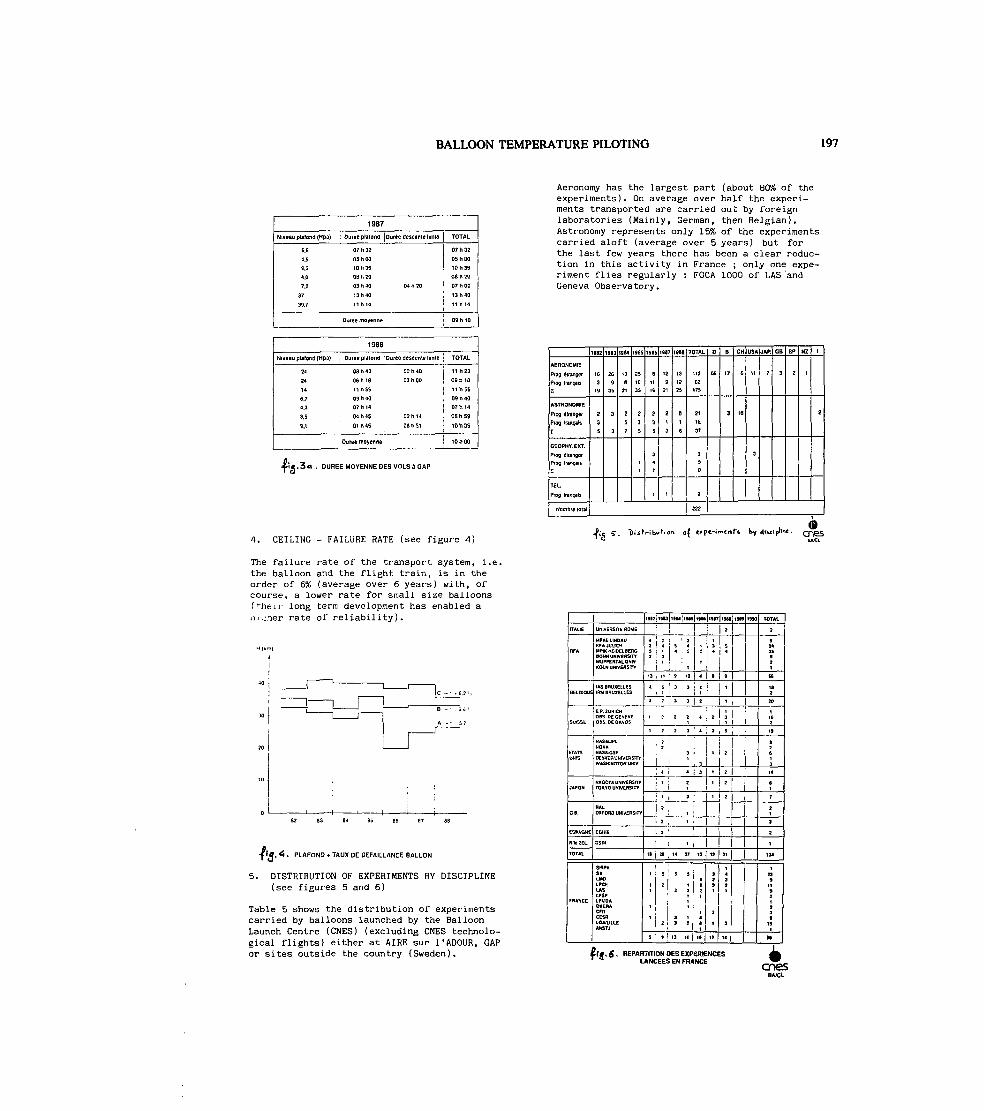
BALLOON TEMPERATURE PILOTING 197
1987
Niveau plafond (Hpa)
6.8
4.5
9.5
! Durée plafond | Durée descinte lente
07 h 32
OShDO
10 h 36
4,8 08 h 20
7.2
37
39.7
03 h 40 04 h 20
13 h 40
11 rt 14
Durée ™yenn.
TOTAL
07 h 32
OShOO
10 h 36
OBhZO
07 h OO
13 h 40
il h 14
09 h 10
1988
24
24
14
6.7
-».3
3,5
9.1
09 h 43 02 h 40
06
11
09
07
04
01
Duiée
18 03 h OO
56
40
14
45 02 h IJ
45 08 U 51
moyenne
11 23
09 18
11 56
09 40
07 14
06 h 59
10 h 36
1OhOO
« .3 a . DUREEMOYENNEDESVOLSaGAP
4. CEILING - FAILURE RATE (see figure 4)
Aeronomy has the largest part (about 80% of theexperiments). On average over half the experi-ments transported are carried out by foreignlaboratories (Mainly, German, then Belgian).Astronomy represents only 15% of the experimentscarried aloft (average over 5 years) but forthe last few years there has been a clear reduc-tion in this activity in France ; only one expe-riment flies regularly : FOCA 1000 of LAS 'andGeneva Observatory.
AERONOMIE
Prog étranger
Prog Irançais
£
ASTRONOMIE
Prog tiranger
PIVJ français
I
GEOPHV. EXT.
Prog fi i ranger
Prog Irakis
£
TEL.
Prog français
Nombre total
1S02
16
3
13
2
3
1913
26
935
3
ISM
13
B
21
2
5
1985
25
ID
35
2
3
1I
19BG
8
11
19
2
3
34
7
1
1907
12
921
2
1
1
1986
13
1225
B
1
TOTAL
113
62175
2<
16
35
B
Z
222
O
GG
B
17
3
CH
6
IG
USA
11
3
h;
JAP.
7
GB
3
i»
SP
2
t
NZ
1
<
I
2
The failure rate of the transport system, i.e.the balloon and the flight train, is in theorder of 6% (average over 6 years) with, ofcourse, a lower rate for small size balloons(*~heir long term development has enabled aHi.;.ner rate of reliability).
T1J' ' PLAF°ND * TAUX DE DEFAILLANCE BALLON
5. DISTRIBUTION OF EXPERIMENTS BY DISCIPLINE(see figures 5 and 6)
Table 5 shows thé distribution of experimentscarried by balloons launched by the BalloonLaunch Centre (CNES) (excluding ONES technolo-gical flights) either at AIRE sur I1ADOUR, GAPor sites outside the country (Sweden).
ITALIE
BELGIQUE
SUISSE
ETATSUNIS
JAPON
G 8.
CSFAGHE
NIIeZEL.
TOTAL
FRANCE
UNIVERSITE ROME
MPAE LINOAURFA JUUCH
BOHM UNIVERSITYWUPPERTAL ONIVKOLK UNIVERSITY
IASDRUKELLESIRM BRUXELLES
E P. ZURICHOBS DE GENEVEODS. OE DAVOS
NASWJPLNOAANASA.GSFDeKVERUHVJtRSITVWASHINGTON UrIIV
NACOTA UNIVERSITYTOKYO UNIVERSITY
RALOIFORD UNIVERSITY
CONIE
DSRI
SIRPA
LMDLPceLASLPSPLPWDAOMtRt,CFRCESRLOMLItLEAhSTJ
i9i2Ji9U ISM[IHS
* Z t 1 Iî 4 S «
13 i II ' 9 IZ
4 E 3 3
1 I
a 7 . 3 3
1 ï ! !
ï '
' 3
i l ', 4 1 •*
I 1 J
I 1[ ) , 3
1 ' :î , t
î '
;
11 j !) M 37
! •! , |
: i, :! i 3 }
I)M
•4
J
2
'
3
3
13
1H7
3
•
2
'
t
'i
»
131
I
1»
I
S
9
'
1
3
I
I
2
2
*32
3
191) IMO TOTAL
1
iS3
K
183
20
16Z
19
22
G
3
14
;7
2
3
a
,
134
1
3
3123
IS1
K
it*. 6 • BEPAHTlTlON DES EXPERENCE51 4 LANCEESENFRANCE ones
BA/GL
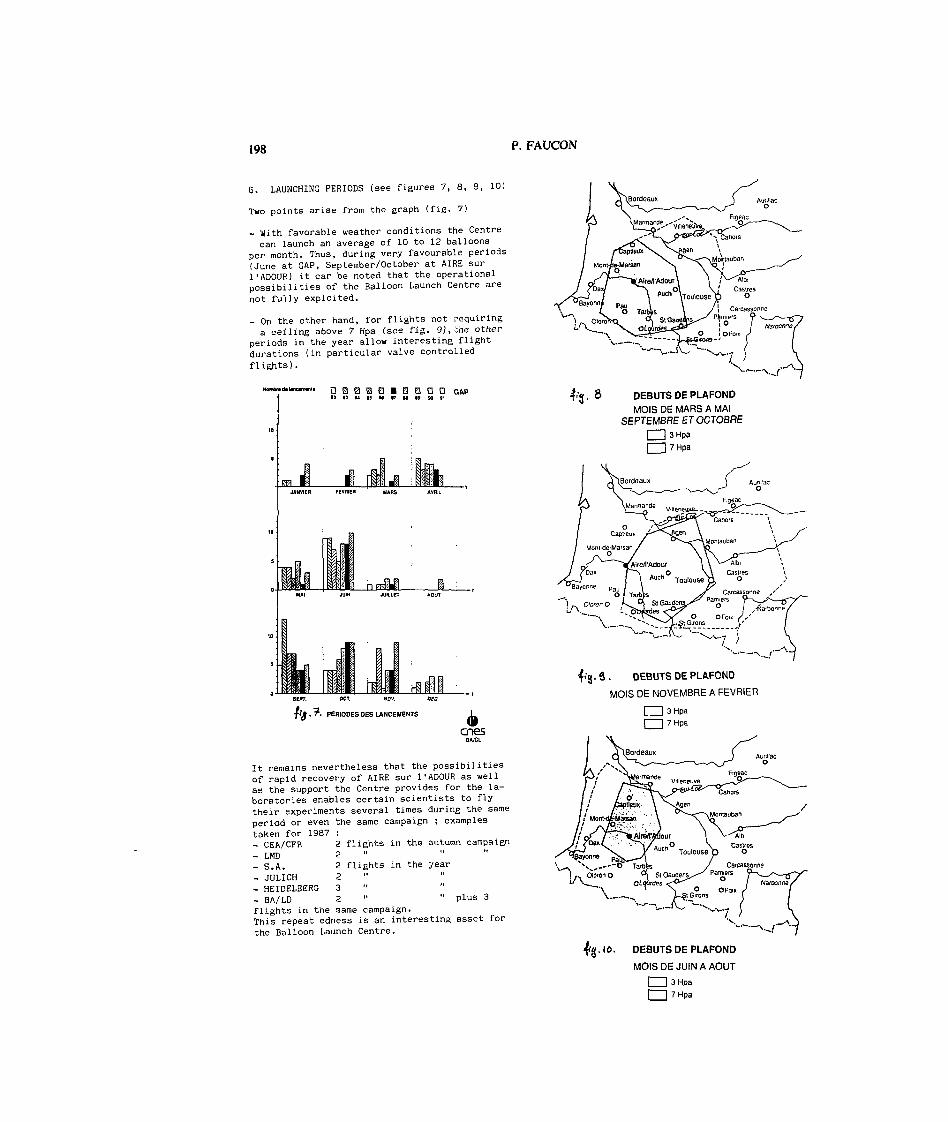
198 P. FAUCON
6. LAUNCHING PERIODS (see figures 7, 8, 9, 10)
Two points arise from the graph (f ig. 7)
- With favorable weather conditions the Centrecan launch an average of 10 to 12 balloons
per month. Thus, during very favourable periods(June at GAP, September/October at AIRE surI 1 A D O U R ) it car be noted that the operationalpossibilities of the Balloon Launch Centre arenot fully exploited.
- On the other hand, for flights not requiringa ceiling above 7 Hpa (see fig. 9), the other
periods in the year allow interesting flightdurations (in particular valve controlledflights).
D Q 0 B 0 B 0 B D D G A P
PERIODESOESLANCEMENTS
cnesBJtCL
It remains nevertheless that the possibilitiesof rapid recovery of AIRE sur 1'ADOUR as wellas the support the Centre provides for the la-boratories enables certain scientists to flytheir experiments several times during the sameperiod or even the same campaign ; examplestaken for 1987 :- CEA/CFR 2 flights in the autumn campaign
- LMD 2 " " "- S.A. 2 flights in the year- JULICH 2 " "- HEIDELBERG 3 "- BA/LD 2 " " plus 3flights in the same campaign.This repeat edness is an interesting asset forthe Balloon Launch Centre.
• f ' . & DEBUTSDEPLAFOND
MOIS DE MARS A MAISEPTEMBRE ETOCTOBRE
I 1 3 Hpa1 7 Hpa
f'g. 3 . DEBUTS DE PLAFOND
MOIS DE NOVEMBRE A FEVRIER
[ I 3 HpaI I 7 Hpa
^. IU. DEBUTSDEPLAFOND
MOIS DE JUIN A AOUT
I I 3 HpaI I 7 Hpa

BALLOON TEMPERATURE PILOTING 199
U - TEMPERATURE PILOTING OF AN OPEN STRATOS-PHERIC BALLOON
89/03 R 100 Z
1. The winter campaigns in Lapland (CHEOPS 1and CHEOPS 2) have shown the difficulty in
carrying out balloon flights in cold stratos-pheres while maintaining rapid ascent rates.This relatively rapid ascent rate is necessaryso that the flight's scientific programme canbe completed before the balloon's separationnear the Finnish/Soviet border.The rapid ascent rate obtained by a free lift10% up to 11%,brings about a signifi-cant adiabatic cooling of the gas .
This cooling of the gas, and, consequentlyof the balloon skin can cause the envelope toburst : this ripping occurs when the vttreoustransition temperature of polyethylene is rea-ched i.e. -95° to -105° (see diagram 11).
Fi8.!TQ - » IMuhlmlil ptKontMhn)
DRT/M/EE
KiIO*OMKng
Loxlllhour)
In order to make cold zone flights more relia-ble a first step has been to decrease theballoon's free lift rate (8%) which must howe-ver remain compatible both with the operatio-nal constraints of the flight path and with thephenomena of temperature inversions which canhalt the balloon's ascent (see diagram 12 and13).
JorHIe i^ss
V^
//p
r/ ter, \_iur*&t-
.13
Following the technological flights carried outin France (GAP campaign 1988) the effects ofvalve openings and ballast release on the ther-modynamic system "GAS + ENVELOPE + ENVIRONMENT"were clearly shown.
Thus the opening of the valve enables a signifi-cant warming up (up to 6°) of the mass of gas ;on the other hand, the release of ballast causesa cooling down (see figure 14 and 15).
89/03 R 100 Z
89/03 R 100 I 89/03 R 100 2 ,„ i.«.mn,.M
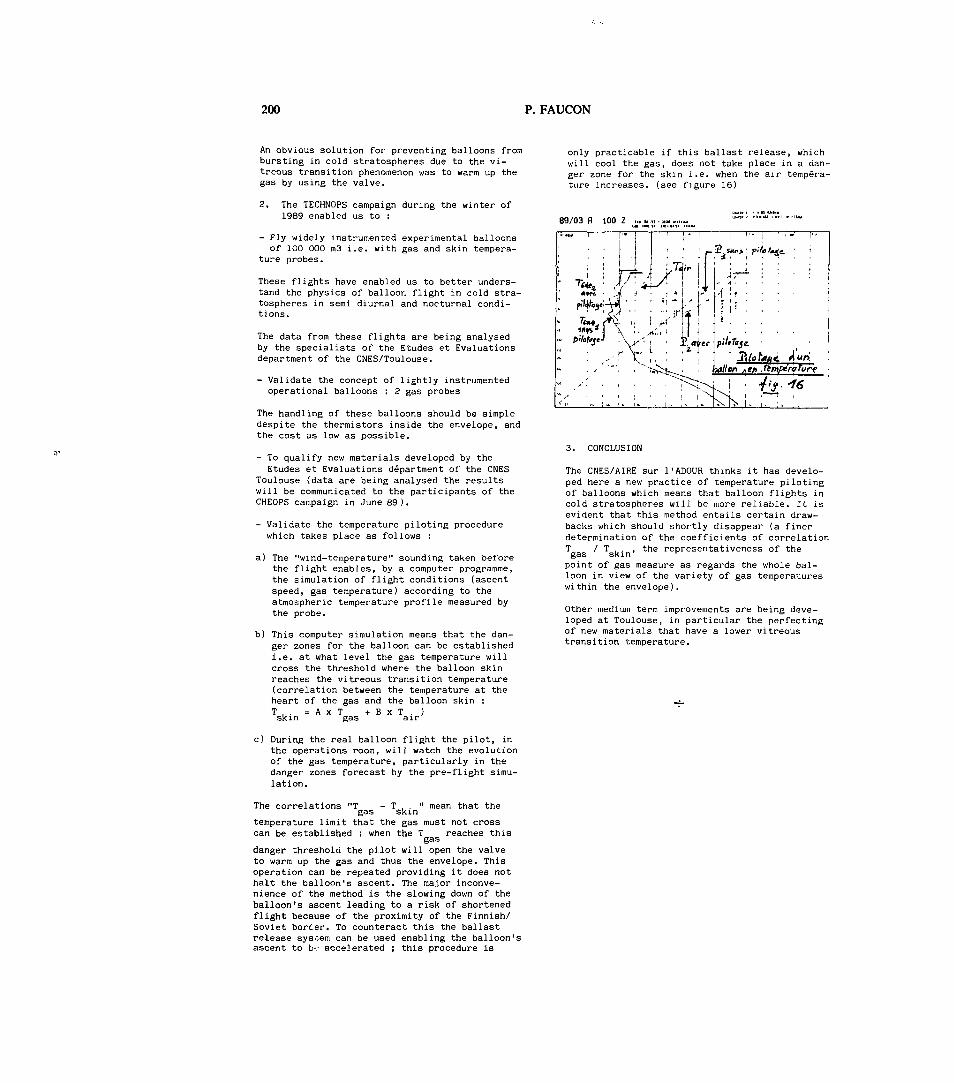
200 P. FAUCON
An obvious solution for preventing balloons frombursting in cold stratospheres due to the vi-treous transition phenomenon was to warm up thegas by using the valve.
2, The TECHNOPS campaign during the winter of1989 enabled us to :
- Fly widely instrumented experimental balloonsof 100 000 m3 i.e. with gas and skin tempera-
ture probes.
These flights have enabled us to better unders-tand the physics of balloor. flight in cold stra-tospheres in semi diurnal and nocturnal condi-tions.
The data from these flights are being analysedby the specialists of the Etudes et Evaluationsdepartment of the CNES/Toulouse.
- Validate the concept of lightly instrumentedoperational balloons : 2 gas probes
The handling of these balloons should be simpledespite the thermistors inside the envelope, andthe cost as low as possible.
- To qualify new materials developed by theEtudes et Evaluations department of the CNES
Toulouse (data are being analysed the resultswill be communicated to the participants of theCHEOPS campaign in June 89 ).
- Validate the temperature piloting procedurewhich takes place as follows :
a) The "wind-temperature" sounding taken beforethe flight enables, by a computer programme,the simulation of flight conditions (ascentspeed, gas temperature) according to theatmospheric temperature profile measured bythe probe.
b) This computer simulation means that the dan-ger zones for the balloon can be establishedi.e. at what level the gas temperature willcross the threshold where the balloon skinreaches the vitreous transition temperature(correlation between the temperature at theheart of the gas and the balloon skin :
skinA x T
gasB x T . )
air
c) During the real balloon flight the pilot, inthe operations room, will watch the evolutionof the gas temperature, particularly in thedanger zones forecast by the pre-flight simu-lation.
only practicable if this ballast release, whichwill cool the gas, does not take place in a dan-ger zone for the skin i.e. when the air tempéra-ture increases, (see figure 16)
89/03 R 100 Z
r
2.suo>
' ( <>J ;r a t- T*t.fa „ ( X it ! '•. «»»»*j \ ;. x.,' I i- Mritytj .X1X-; , , IpV4, .,-/,
, i. . ,i I ! ~. „ , i1 .
L i ÀMafane, «tun,*n /i*/> .r
fV
3. CONCLUSION
The CNES/AIRE sur I1ADOUR thinks it has develo-ped here a new practice of temperature pilotingof balloons which means that balloon flights incold stratospheres will be more reliable. It isevident that this method entails certain draw-backs which should shortly disappear (a finerdetermination of the coefficients of correlationT / T , . , the representativeness of thegas skin ^
point of gas measure as regards the whole bal-loon in view of the variety of gas temperatureswithin the envelope).
Other medium term improvements are being deve-loped at Toulouse, in particular the perfectingof new materials that have a lower vitreoustransition temperature.
The correlations "T - T 1 . " mean that thegas skin
temperature limit that the gas must not crosscan be established : when the T reaches this
danger threshold the pilot will open the valveto warm up the gas and thus the envelope. Thisoperation can be repeated providing it does nothalt the balloon's ascent. The major inconve-nience of the method is the slowing down of theballoon's ascent leading to a risk of shortenedflight because of the proximity of the Finnish/Soviet borcer. To counteract this the ballastrelease sysoem can be used enabling the balloon'sascent to b-:- accelerated ; this procedure is

201
LARGE HEAVY DUTY BALLOONS IN EUROPE
A. Soubrier
CNES, 18 avenue Edouard Belin, 31055 Toulouse Cedex, France
ABSTRACT
Large "Ht>avy Duty" Balloons an- regularly operatedin Furopi' ttu'u thv ODISSI-A organization, managedby I-ranee, Italy and Spain.
The difficulties encountered by the balloons inthe previous years seem to be now overcome, thanksto the development of new materials. The successot the 1>)!<7 transmediterranean flights campaignbrings evidence of this new situation.
The domaine of large balloons activity has beenextended to the Southern Hemisphere, where CNESorganized in 1988 a first campaign in cooperationwith the austral!an government, concluded with afull success.
A constant improvement of balloons and equipmentsincreases the overall efficiency of these flights.
Large "Heavy Duty" Balloons have been operated inEurope since 1977, by the ODISSEA organisation,created and managed by the three national agen-cies : CNES from France, CNR from Italy, andINTA from Spain. Normally conducted during the1987 year, the activity was interrupted in 1988,as CNES was initiating, along with the australiangovernment, a new program of flights in theSouthern Hemisphere.
The 1987 campaign took place in the transmediter-ranean flight facilities of Trapani (Sicily),Palma and El Arenosillo (Spain). The programincluded four flights. All four of them weresuccessfully achieved, evidencing the highquality of the new material developped by CNESand flight tested during the 1986 campaign. Thefrench made balloons had a volume ranging from400 000 m3 to 800 000 m3, and they carried pay-loads from 1000 l<g to 2200 kg. The flight dura-tions were in the range of 19 to 21 hours. Mostof t.ie experiments flown, were devoted to astrono-my observations (X rays, gamma rays and infra-redradiaiions) and few of them to geophysics (magne-tic field measurements).
The successful I achievement of this campaign, res-tored the. confidence, in the large balloons, whichhad been lost in the previous years, following along series of failures all over the world. Thisconfidence was high enough to encourage CNES toinitiate a program of flights in the SouthernHemisphere able to satisfy the stong demand ofthe scientific community. A cooperation was ini-tiated with the australian government in order todevelop new facilities to carry out transaustra-lian flights. The first campaign of this programtook place during the months of octcber-november1988. The launching center was installed on theairport of Charleville, sm; H town of the S. WQuennsland (26° 25'), and a down range stationwas set up in the outback country of the NorthernTerritory. 1300 km West of Charleville. Two flightswere scheduled. The first one with a ZODIAC madeballoon of 400 000 m3, carrying a one ton infra-redexperiment, prepared by four french institutes,and due to observe the galactic center and diffe-rent regions of the Southern sky. The second one,with a ZODIAC made ballon of 800 000 mj carryinga 2.2 ton gamma-ray experiment, prepared in coo-peration by four french and Italian institutesand due to observe the Super-Nova 1987-a and seve-ral other sources. The flights were carried out onOctober 29th and November .15th. Both were entirelysuccessful1, and offered respectively 19h30mn and23h40mn of observation without any trouble ofballoon, equipment, or experiment. Intended to becarried out in a well established regime of easter-ly upper winds, the second flight was actuallyachieved in a typical turn-around situation, parti-cularly unusual in late november. Although theflight was entirely controlled by the prime trac-king station, it was continously followed in thedown-range station thanks to a direct telephonelink, achieved thru the australian Digital DataNetwork. This connection, which allowed the trans-mission of telemetry data at a reduced rate of 10kbps, performed with a remarkable efficiency.
CNES intends to conduct further campaigns in thesenew facilities, during the next coming years.Flights will be carried out, either during theturn-around periods, or in summer with well esta-blished easterly winds. They might even be exten-ded to the west, with the implementation of asecond down-range station in Western Australia.
Proc. Ninth ESAIPAC Symposium on 'European Rocket and Balloon Programmes and Related Research', Lahnstein, FRG, 3—7April 19S9(ESA SP-291, June 1989)
202 A. SOUBRIER
!•'lights of .}s hours or more, could then bo achio- llio u.so ol' (il1"- I inio signal lia-: al low.'(I an CJIMveil. i»-.11 it or ing ol' ( h i - clok-, in (he t racking M a i IDII-,
K Î t i l .in accuracy of I micro second, even in ri'inoi c!'ho overall q u a l i t y of these f l i g h t s h.is boon areas,constant ly improved in ( I w lasi few .V(MPM, andw i l l be so in the next f igure , thanks to I he A ne'.v v c l o m e t r y ! paiisnii ! t er work in;; in the 1 îiVde\'eIopmiMit of nivw balloons and equipmiMit .s . Mil/ ran;>e has been tc - s t ec l and w i l l be -,oon inAmong Chem we may note : operation. I t w i l l a l l o i v a larjfer bandwid th
( 2 Mi l / ) and w i l l avoid the in t orferenco.s <'ncouii-Hie new balloons, made of LP!- m a t e r i a l , wiiich ai-e tercel i n the over-crowded ranj^e of 4^^ Mil/,now able to carry a payload of -.- ton-, at J mb.A ba l loon of 000 000 in.? designed to carr.\ 2 . Î tons A ivw "packet -tel émet py" is undei' de\ e 1 opinent .at t h ( - .same a l t i t u d e , w i l l be f lown i l l . In ly l»so. It w i l l a l l o w a much higher rale of transmission
both in I'elemetpv (1 Ml)|)s ) and Telecommand. TheHie qua l i ty of radio transmission has been -,ubs- Telomolry System is due to be in operation intant K i l l y improved w i t h the use of new aer ia ls HIUl and I'o I ecommand in I^>2.working in c ipcn la r jx^ lap i /a t ion. instead ofver t ica l polapi/at ion. A gain of l> db has beenobtained on the l i n k budget, and -sudden at ienua-t ions have been overcome.
203
AN00YA ROCKET RANGE - NEU INSTALLATIONS. FUTURE PLANS AND INVESTMENTS
K Aiuifsen, P A Nikalsen and I Nyheint
Norwegian Space Centre, findoya Rocket Range, Andenes, Norway
*••
ABSTRACT
This paper describe?- the installations andinvestments made at the Andaya Rocket Range inconnection with the extensive MAC/SINE andMAC/EPSILON campaign in 1987 and futureoperations.
A brief historical reviewpossibilities are also included.
and launch
area of up to more than 1900 km away. This allowsseveral choices of rocket trajectories whichpermit observations in different directions andimpact areas. Together with a net of ground-basedobservations, this provides a great flexibilityin selecting launch condition and types ofph">nomena to be studied.
The facilities at Andoy have been continuouslyimproved to keep up with the new demands ofusers.
2. INSTALLATIONS
Key words: Sounding Rockets, Balloons, GroundInstallations.
2.1 Buildings
1. INTRODUCTION
Andaya Rocket Range, situated in Northern Norway,has been in operation and owned by NTNF, SpaceActivity Division since August 1962. In June 1987NSC, Norwegian Space Centre took over theownership and management.
Since July 1972, the range has been partlysupported by a number of ESA member states. Inreturn for this support, contributing ESA membersmay use the range on a marginal cost basis. Otherusers are charged on a non-profit basis.
Since the first launch of a Nike/Cajun on August18- 1962, a number of 441 sounding rockets havebeen launched.
In addition the range has been involved inlaunching of a total of 418 scientific balloons.
Personal from more Chan 70 institutes anduniversities in Europe, Japan, Canada and USAhave been engaged in scientific programmescarried out at the range.
The range has a large sea impact area permittingfour stage rockets to be launched into an impact
A four stage plan for refurbisment and newconstruction of the office/laboratory and livingfacilities has already started and will becompleted in 1992 :
Phase 1 : New building containing a living quarterwith 32 bedrooms, laboratory and atraining center for space technology.
In addition a separate transformer /emergency power supply building andextension of the LIDAR building by 30
Phase 1 will be completed in May /Junethis year.
Phase 2: Refurbisment of current living quarterto staff and guest offices.
Phase 3: New garage and storage building and anextension of the main assembly hall inthe launch area.
Phase 4: Refurbisment and extension of currentmain building.
2.2 Telemetry and timing system
A 20-foot telemetiy tracking antenna system,delivered by Scientific-Atlanta, has beeninstalled. This system operates with simultaneousreception of both 1650-1750 MH2 and 2200-2300 MHztelemetry signals with antenna gain of 37 dBi and40 dBi, respectively. The antenna is covered with
Proc. Ninth ESAIPAC Symposium on 'European Rocket and Balloon Programmes and Related Research', Lahnstein, FRG, 3—7April 1989(ESA SP-291, June 1989)

204 K. ADOLFSEN, P.A. MIKALSEN & I. NYHEIM
a 30-foot radome with a transmission loss of only0.22 dB at 2.5 GHz.
A new timing and video information system will beinstalled in 1989. All information nreded foroperation will be shown on videoscreens.
2.3 Science Operation Centre
The main goal for all project scientists is tolaunch the rockets when scientific conditions areoptimal. To enable this it is necessary to haveaccess to real-time data from ground-basedsupport instrumentation.
Significant improvements have been made at therange the last two years to increase thepossibilities for the project scientist to studyscientific conditions in real-time.
In the SCIENCE OPERATION CENTRE data from a broadspectra of ground-based instruments is availablein real-time, such as riometers, fluxgate andpulsation magnetometers, photometer, VLF andionosonde.
Data from remote site installations such as PRE,SOUSy, STARE and EISCAT, is also available inreal-time on special request.
2.4 EISCAT
During the NEED-I campaign in November 1988, areal-time display of data from the EISCAT radarsystem was available in SCIENCE OPERATION CENTRE.
Data was displayed on a colour graphics screen,with a colour hardcopy unit connected. Electrontemperature and electron density at variousaltitudes were displayed simultaneously in twoseparate diagrams on the screen, using colourcodes to indicate high and low temperatures anddensities.
The real-time display of EISCAT-data was a veryuseful diagnostic tool during this campaign, andit will also be used during the NEED-II campaignin November 1989.
2.5 STARE
During the ROSE-campaign in November - December1988, the computer was connected to the twoSTARE-computers at Malvik in Norway andHankasalmi in Finland. Data from the two STAREradars was displayed in real-time on a colourgraphics screen with a hardcopy unit connected.
The measured Doppler velocities and backscatterintensities together with other radar parameterswere displayed for each station separately. Inaddition, by combining the data from the tworadars a vector-diagram was plotted, showing theelectric field and electron drift velocities overan area of size 400 x 400 km of the northern partof Scandinavia.
STARE real-time data proved to be a veryimportant tool to the Project Scientist duringthe ROSE campaign.
3. FUTURE PLANS
Andaya will in 1989 install a new computer systemand develope software to collect and present datafrom various ground-based instruments. Theinstruments to be included are:
- Fluxgate magnetometer- Pulsation magnetometer- Riometers- Photometer- lonosonde- VLF <20Hz-20kHz>
In addition it will be possible to display andrecord data from remote installations as e.g.STARE and EISCAT.
The system will be based on an Ethernet-connection between personal computers and aworkstation as file-server. The PC's will readdata from the instruments, and store them on theserver-disk. The PC's will also store datalocally to prevent loss of data.
The server will be a computer running the UNIXoperating system. Applications using X-Windows inUNIX will be developed to display the instrument-data. This will make it possible to display datafrom a selected group of instruments at the sametime, on the same screen.
The server will also be equipped with modems.Instrument-data may then be transmitted to remoteusers, or remote users may run a program on aUNIX-workstation or a MS-DOS PC to display thedata. This program will be developed by the Rangeand distributed to the users. For the instrumentswith low data-rate, it will even be possible forremote users to look at the data in real-time.
The modems may also be used to receive data fromremote ground-based instruments, e.g. Svalbardand ESRANGE.
4. LAUNCH FACILITIES
During the last two years theinvestments have been made:
following major
Modifications of the universal launcher No. 2.A new hydraulic system, including new piston andsome modifications of the structure, now permitsa SWL (Safety Weight Load) of 27 ton m. A newBBX rail is also mounted, thus permitting thelauncher to be used for many rocketconfigurations. A mobile container is used forprotection of the front part of the beam. Thisautumn a remote control system will be installed.
Two new launch pads for HAD-launchers have beenmade. These pads can also be used for otherlaunchers with the same capacity.
Completion of a new blockhouse No. 2 by 35 m2.From this blockhouse the Payload manager orcontroller can operate.
Renewal of power supply for both 220 and 38OV.
AND0YA ROCKET RANGE 205
4.1 Manor planned investments
Building of a new universal launcher, including amobile protective house. This launcher will havethe following dimentions:
Rail length 20.5 mHight underneath the rail 2.5 mTotal capacity 250 ton ra SWL
This permitts the handling of rocketconfiguration with a center of gravity weight uptill 20 tons.
The protective housing may also be used as anassembly hall, and will have the followingdimentions: 45 m x 6 ra, included is a permanenthouse with 80m2.
A new generator able to supply the whole areawith sufficient 22OV emergency power will beinstalled.
5. ACTIVITIES
Since the Sunne meeting, 108 rockets have beenlaunched from Andoya.
5.1 MACXEPSILOM
During the MAC/EPSILON campaign in the autumn1987, 34 rockets were launched. Most of them insalvoes, which consisted of both instrumented andmeteorological rockets. The biggest salvoconsisted of 4 Nike/Orion, 1 single Orion and 8meteorological rockets. The instrumented payloadswere launched in 20 seconds '"'-.ervals.
5.2 MASA'S 35.024 UE
An other interesting campaign is NASA's projectin December 1988. This was a Black Brant XCconfiguration, and was launched in an elevationof 76°.
Launch criteria
At least two of the optical sites (PokerFlat/Alaska, Longyearbyen/Svalbard, SandreStremfjord/Greenland) shou.'d have clear sky withfunctioning cameras and data recording equipment.Meridian scanning photometer functional atLongyearbyen. Auroa in the polar cap at dayside -not interferenced by moon/sun at the heightaround 450 km (detonations of the shapedcharges).
Performance
The payload performance wassubsystems worked. The rocketof approximately 515 km and a1800 km (86°). Rocketcoordinated from Svalbard,scientist was situated during
5.3 Oedipus A
successful, and allreached an altitudehorizontal range ofmeasurements werewhere the projectthe campaign.
Launch criteria
An active auroral arc in solar darkness (sunshadow height 900 km). Clear sky sufficient forobservations at launch site.
Performance
Both payloads performed successfully and allsubsystems worked. The rocket reached an altitudeof 511 km and a horizontal range of approx. 950km. Launch criteria was fullfilled.
The next OEDIPUS campaign will be launched with aBlack Brant XII from Andoya. This is a four stageconfiguration and will be the biggest rocket everlaunched from Europe.
In the past there have been some interest fromthe users to have the payloads recovered. This isa new field for the range, but in close co-operation with the coast guard, this will takeplace in the following campaigns:
in September/October 1989.in February/March 1990.
This was a Canadian campaign with a l='jpch ofa Black Brant X configuration.
TURBO/RECOMMENDTURBO/DYANA
5.5
The Norwegian Space Centre plans to build asatellite launch site on Andaya, based onrequirements of the LittLeo launch vehicle andother launch vehicles.
A suitable site has been located and an area of 5km2 in the middle of the island has beenprovisionally selected as a suitable place forrecovery operations.
A down range and tracking station on Svalbard isplanned to provide tracking, telemetry andcontrol facilities.
The possible Andoya Satellite Launch Site willtherefore offer the user a number of significantbenefits:
- A European location offering easy and rapidaccess.
- An adjacent recovery area.- The ability to interrogate or command aspacecraft on every pass from one station.
- Both polar and sun-synchronous orbits.
6. CONCLUSION
With the above mentioned investments in newbuildings and technical installations at theAndaya Rocket Range, the range should be wellprepared for coming campaigns. The range isinterested in new ideas from the users to makethe life and scientific work at the range moreuseful.
More information can be obtained by contactingthe Andoya Rocket Range.
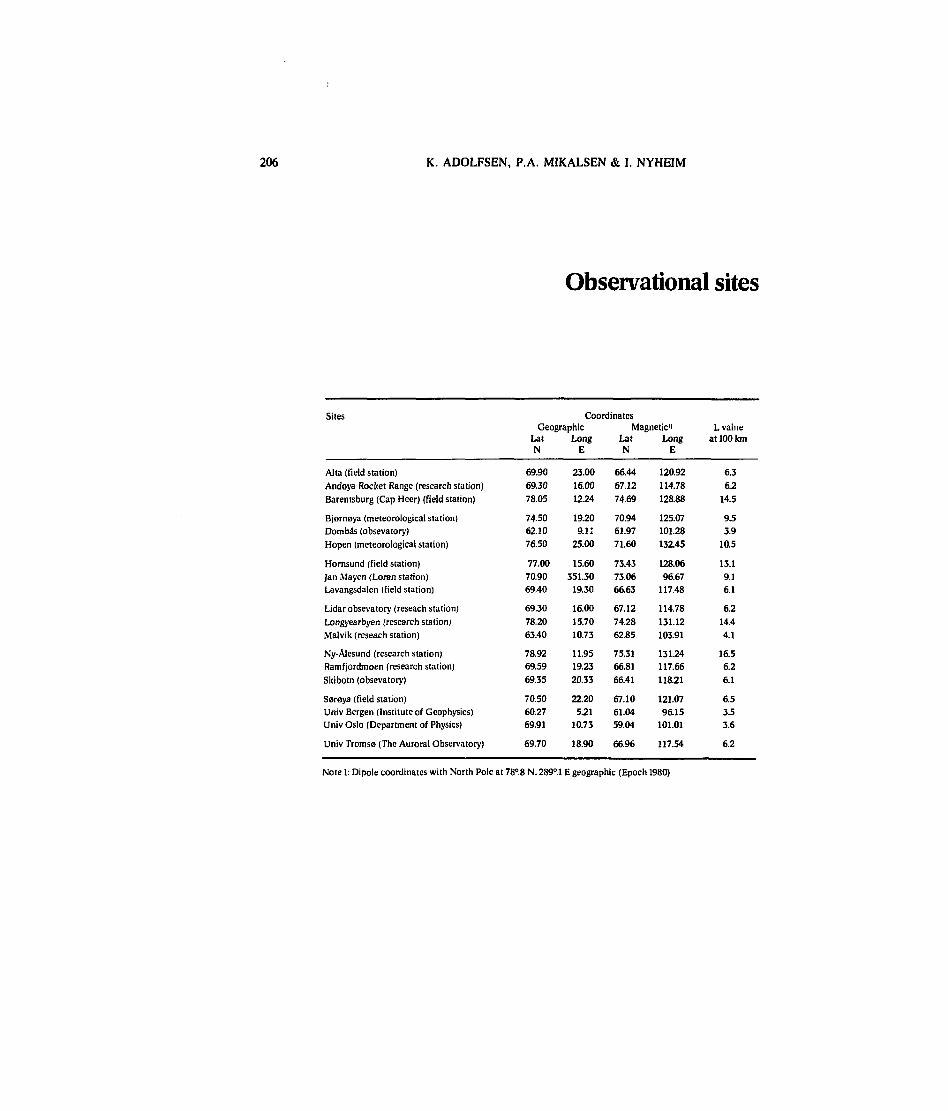
206 K. ADOLFSEN, P.A. MIKALSEN & I. NYHEIM
Observational sites
Sites
Alta (field station)Andoya Rocket Range (research station)Baremsburg (Cap Heer) (field station)
Bjornoya (meteorological station)Dombâs (obsevatory)Hopen (meteorological station)
Hornsund (field station)Jan Mayen (Loran station)Lavangsdalen (field station)
Lidar obsevatory (reseach station)Longyearbyen (research station)Malvik (reseach station)
Ny-Alesund (research station)Ramfjordmoen (research station)Skibotn (obsevatory)
Saraya (field station)Univ Bergen (Institute of Geophysics)Univ Oslo (Department of Physics)
Univ Tromse (The Auroral Observatory)
CoordinatesGeographic Magnetic11
Lat Long Lat LongN E N E
69.9069.3078.05
74.5062.1076.50
77.0070.9069.40
69.3078.2063.40
78.9269.5969.35
70.5060.2769.91
69.70
23.0016.0012.24
19.209.11
25.00
15.60351.30
19.30
16.0015.7010.73
11.9519.2320.33
22.205.21
10.73
18.90
66.4467.1274.69
70.9461.9771.60
73.4373.0666.63
67.1274.2862.85
75.3166.8166.41
67.1061.0459.04
66.96
120.92114.78128.88
125.07101.28132.45
128.0696.67
117.48
114.78131.12103.91
131.24117.66118.21
121.0796.15
101.01
117.54
Lvalueat 100 km
6.36.2
14.5
9.53.9
10.5
13.19.16.1
6.214.44.1
16.56.26.1
6.53.53.6
6.2
Note 1: Dipole coordinates with North Pole at 78°.8 N. 289°.l E geographic (Epoch 1980)
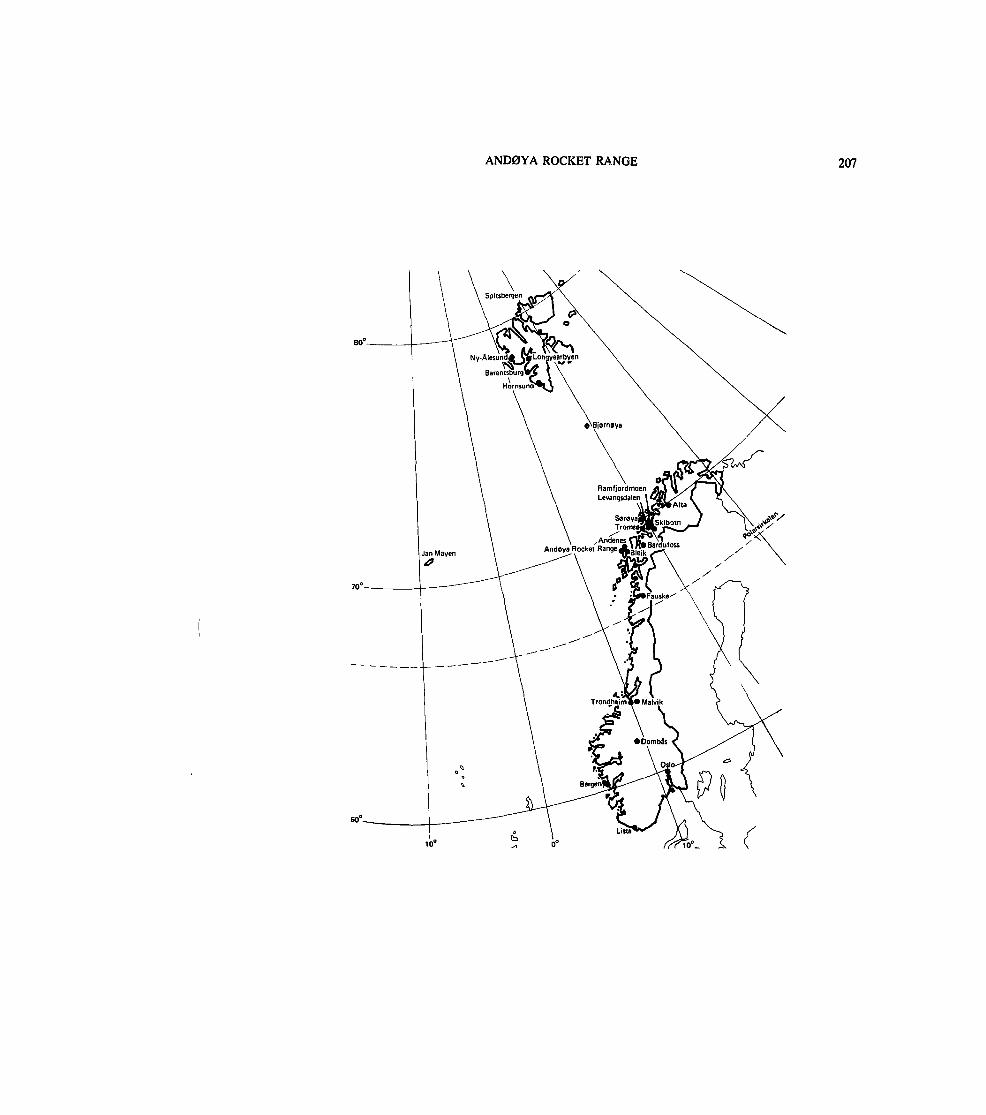
AND0YA ROCKET RANGE 207
10°
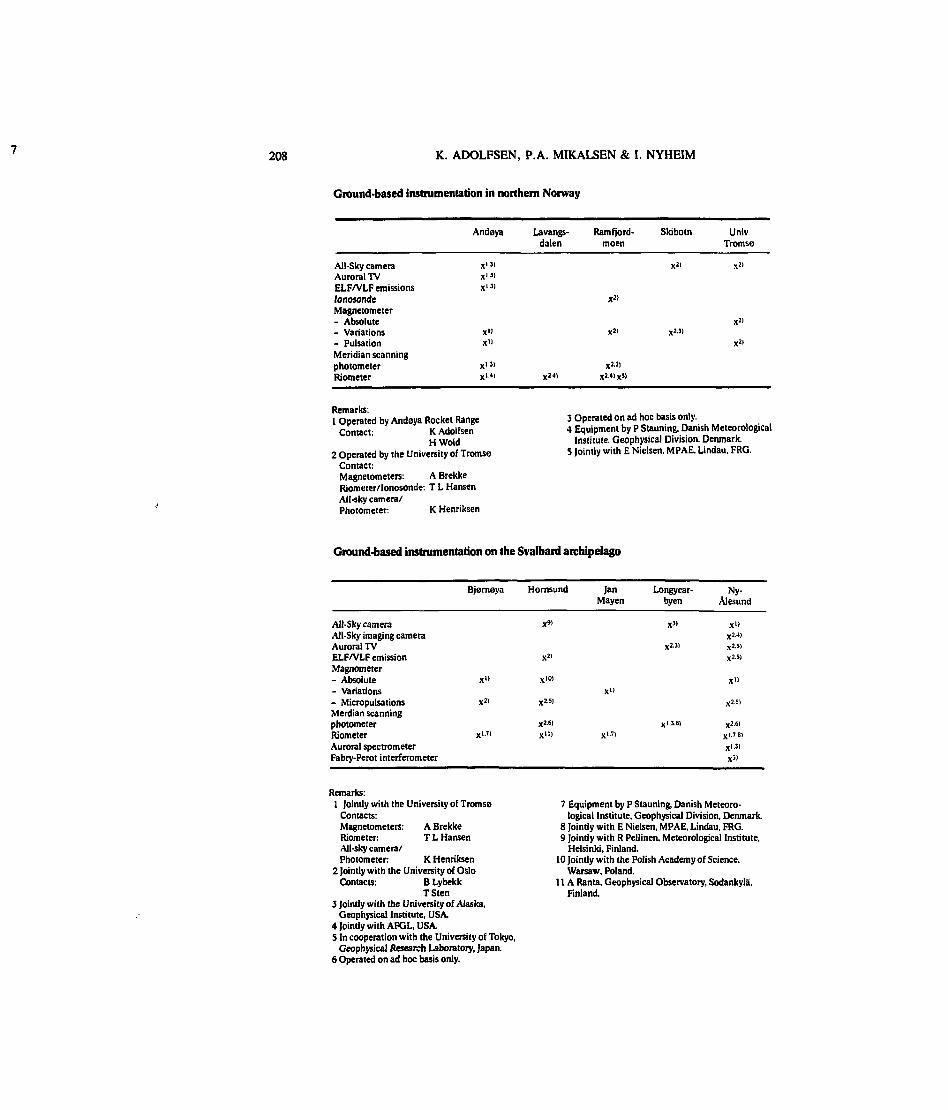
208 K. ADOLFSEN, P.A. MIKALSEN & I. NYHEIM
Ground-based instrumentation in northern Norway
Andeya Lavangs- Ramfjord- Skibotn Univdalen moen Tromse
All-Sky cameraAuroral TVELF '/VLf emissionslonosondeMagnetometer- Absolute- Variations- PulsationMeridian scanningphotometerRiometer
X1 Sl X2I X2I
X I 3 I
X I3 I
X2>
X2>
X" X21 X2-31
X1 ' X21
X1.3) X2.3)
xl.4) X2 4) X2'4' X^l
Remarks:1 Operated by Andeya Rocket Range
Contact: K AdolfsenHWoId
2 Operated by the University of TromseContact:Magnetometers: A BrekkeRiometer/lonosonde: T L HansenAll-sky camera/Photometer: K Henriksen
3 Operated on ad hoc basis only.4 Equipment by P Stauning, Danish Meteorological
Institute. Geophysical Division. Denmark.5 Jointly with E Nielsen. MPAE. Lindau. FRG.
Ground-based instrumentation on the Svalbard archipelago
All-Sky cameraAll-Sky imaging cameraAuroral TVELF/VLF emissionMagnometer- Absolute- Variations- MicropulsationsMerdian scanningphotometerRiometerAuroral spectrometerFabry-Perot interferometer
Bjemeya Hornsund
X"
X2>
X» X"»
X2) X2.5I
X2.6]
Xl.7| Xll|
Jan Longyear- Ny-Mayen byen Alesund
X3) x l )
X2.4)
X2.3) X2.5)
X2.5I
X»
X»
X2.5)
X1.3.6I X2.6I
X1-'' X1-781
X1.3I
X«
Remarks:1 Jointly with the University of Tromse
Contacts:Magnetometers: A BrekkeRiometer: T L HansenAll-sky camera/Photometer: K Henriksen
2 Jointly with the University of OsloContacts: B Lybekk
TSten3 Jointly with the University of Alaska.
Geophysical Institute, USA.4 Jointly with AFGL, USA.5 In cooperation with the University of Tokyo,
Geophysical Research Laboratory, Japan.6 Operated on ad hoc basis only.
7 Equipment by P Stauning, Danish Meteoro-logical Institute. Geophysical Division, Denmark.
8 Jointly with E Nielsen, MPAE, Lindau, FRG.9 Jointly with R Pellinen, Meteorological Institute,
Helsinki, Finland.10 Jointly with the Polish Academy of Science.
Warsaw, Poland.11A Ranta, Geophysical Observatory, Sodankylà.
Finland.
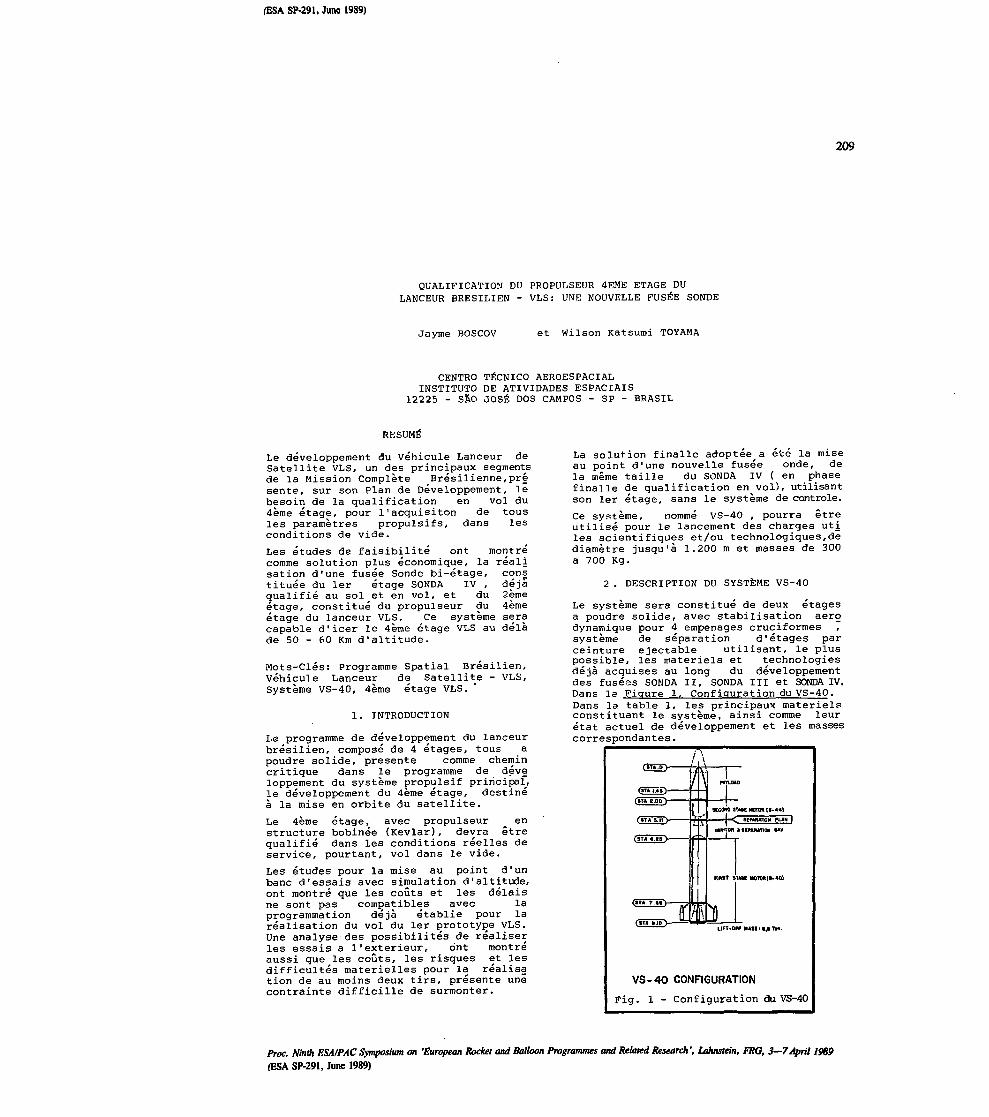
(ESA SP-291, June 1989)
209
QUALIFICATION DU PROPULSEUR 4EME ETAGE DULANCEUR BRESILIEN - VLS: UME NOUVELLE FUSÉE SONDE
Jayme BOSCOV et Wilson Katsumi TOYAMA
CENTRO TÉCNICO AEROESPACIALINSTITUTO DE ATIVIDADES ESPACIAIS
12225 - SAO JOSÉ DOS CAMPOS - SP - BRASIL
RÉSUMÉ
Le développement du Véhicule Lanceur deSatellite VLS, un des principaux segmentsde la Mission Complète Brésilienne,présente, sur son Plan de Développement, lebesoin de la qualification en vol du4ème étage, pour l'acquisiton de tousles paramètres propulsifs, dans lesconditions de vide.
consdéjà2ènie4ème
Les études de faisibilité ont montrécomme solution plus économique, la réalisation d'une fusée Sonde bi-étage,tituée du 1er étage SONDA IV ,qualifié au sol et en vol, et duétage, constitué du propulseur duétage du lanceur VLS. Ce système seracapable d'icer le 4ème étage VLS au delàde 50 - 60 Km d'altitude.
Mots-Clés: Programme Spatial Brésilien,Véhicule Lanceur de Satellite - VLS,Système VS-40, 4ème étage VLS.
1. INTRODUCTION
Le programme de développement du lanceurbrésilien, composé de 4 étages, tous apoudre solide, présente comme chemincritique dans le programme de développement du système propulsif priricipaf,le développement du 4ème étage, destineà la mise en orbite du satellite.
Le 4ème étage, avec propulseur ^ enstructure bobinée (Kevlar), devra êtrequalifié dans les conditions réelles deservice, pourtant, vol dans le vide.
Les études pour la mise au point d'unbanc d'essais avec simulation d'altitude,ont montré que les coûts et les délaisne sont pas compatibles avec laprogrammation déjà établie pour laréalisation du vol du 1er prototype VLS.Une analyse des possibilités de réaliserles essais a l'extérieur, ont montréaussi que les coûts, les risques et lesdifficultés matérielles pour la réalisation de au moins deux tirs, présente unecontrainte difficille de surmonter.
La solution finalle adoptée^a été la miseau point d'une nouvelle fusée onde, dela même taille du SONDA IV ( en phasefinalle de qualification en vol), utilisantson 1er étage, sans le système de contrôle.
Ce système, nommé VS-40 , pourra êtreutilisé pour le lancement des charges utiles scientifiques et/ou technologiques,dediamètre jusqu'à 1.200 m et masses de 300a 700 Kg.
2 . DESCRIPTION DU SYSTÈME VS-40
Le système sera constitué de deux étagesa poudre solide, avec stabilisation aerodynamique pour 4 empenages cruciformes ,système de séparation d'étages parceinture ejectable utilisant, le pluspossible, les matériels et technologiesdéjà acquises au long du développementdes fuséas SONDA II, SONDA III et SONDA IV.Dans le Figure 1, Configuration du VS-40.Dans la table 1, les principaux matérielsconstituant le système, ainsi comme leurétat actuel de développement et les massescorrespondantes.
/
(JiOaD- jp
~\
\
rï»
F
NTLOAD
XCOW STAK MOTOR .t>44|
WNlTM t BIMNATION MV
FlMT STAK HOTON(|.40I
ïLIFT-OM HASI i f,t Tut.
VS-40 CONFIGURATION
Fig. 1 - Configuration du VS-40
froc. Ninth ESAIPAC Symposium on 'European Rocket and Balloon Programmes and Related Research', Lahnstein, FRG, 3—7April 1989(BSA. SP-291, June 1989)

210 J. BOSCOV & W.K. TOYAMA
UO<EHU
ceU
UO<EHU
U§(M
PO
INT
E
MATERIEL
- JUPE ARRIERE
. Système rétro-propulseur
. Empenages
. Structure Jupe
- PROPULSEUR
. Tuyère
. Enveloppe Propulseur
. Propergol
. Gouttières
. Système de Destruction
- JUPE AVANT
. Structure
. Système de Séparation
- PROPULSEUR
. Tuyère
. Jupe Arrière
. Enveloppe Propulseur
. Propergol
. Jupe Avant
- CASE A EQUIPEMENTS
. Structure
. Equipements
- Pour l'écoulement aeroydinaqueet ballastage pour la stabilisation aérodynamique pendantla phase propulsée 1er étage,(valable pour le 1er vol)
ETAT ACTUEL DE DEVELOPPEMENT
Qualifié au Sol et en Vol (3 vols SIV)
Idem
Même conception et techonologies desj jpes interestages et systèmes deséparation du lanceur VLS, en étatavancé de développement.
Conception et technologies nouvelles.Chemin critique du programme de développement du système propulsif principal du VLS.
Même conception et instrumentationutilisées dans les cases à équipementsdes fusées SONDA III et SONDA IV ,qualifié au sol et en vol.
MASSEKG
130
4.997
82
948
110
300à
600
MASSE TOTALE 6.567 à 6.867
Table
3. CARACTERISTIQUES DES PROPULSEURS
4.1 1er Étage
Enveloppe moteur en acier très hauterésistance technologie roulle-soudée ,déjà epprovée dans les programmes dedéveloppement des fusées Sondas SONDA IIIet SONDA IV.
Poudre composite, classique (PBHL/P.A. /AL): polibutadiene + perclorate d'amonion+ aluminium en poudre, impulsion spécifiquestandart de l'ordre de 235 s.
Tuyère classique, carter en acier, divergent bobiné en tissus de silice / résinephenolique. Col en graphite policristaline,haute densité.
Dans la Figure 2. le Propulseur S-40.
Allumeurs classiques,pastillés.
Statistique: 3 tirs au banc d'essai3 en vol avec succès.
et
II I i \ i tsamàI I I ur,£R\ \
/ I \ INlTlMQfI-
Fig. 2 - Propulseur S-40
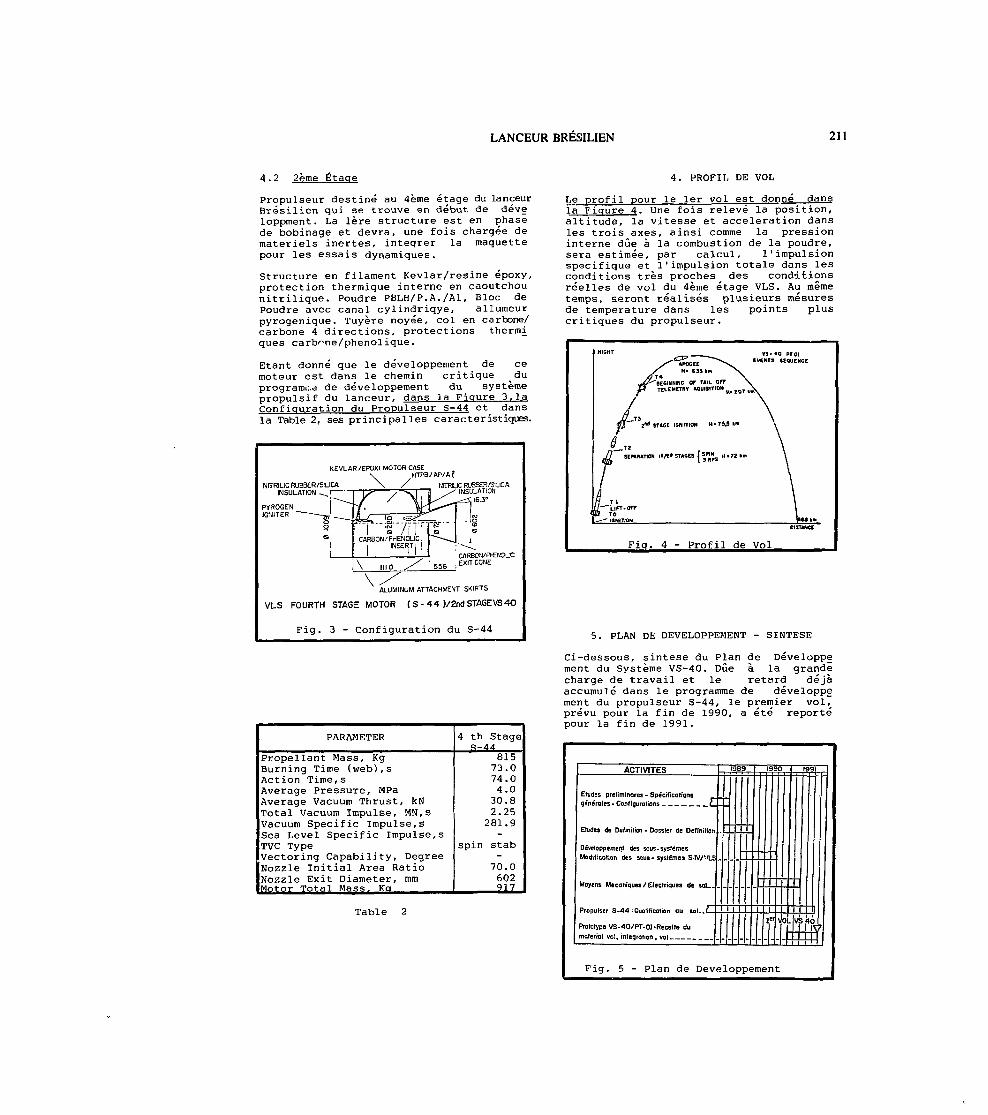
LANCEUR BRESILIEN 211
4.2 2ème Étage
Propulseur destiné au 4ème étage du lanceurBrésilien qui se trouve en début de développment. La 1ère structure est en phasede bobinage et devra, une fois chargée dematériels inertes, intégrer la maquettepour les essais dynamiques.
Structure en filament Kevlar/resine époxy,protection thermique interne en caoutchounitrilique. Poudre PBLH/P.A./Al, Bloc dePoudre avec canal cylindriqye, allumeurpyrogenique. Tuyère noyée, col en carbone/carbone 4 directions, protections thermiques carbr-ne/phenolique.
Etant donné que le développement de cemoteur est dans le chemin critique ^ duprogramed de développement du systèmepropulsif du lanceur, dans la Figure 3.1aConfiguration du Propulseur S-44 et dansla Table 2, ses principalles caractéristiques.
KEVLAR/EPOXI MOTOR CASEHTPB/AP/A?
NITRILIC RUBBER/SILICA \ /INSULATION
HITTiILC RUSSER/STJCA'
ALUMINUM ATTACHMENT SKIRTS
VUS FOURTH STAGE MOTOR ( S - 44 )/2nd STAGEVS4O
Fig. 3 - Configuration du S-44
PARAMETER
Propellant Mass, KgBurning Time (web),sAction Time,sAverage Pressure, MPaAverage Vacuum Thrust, kNTotal Vacuum Impulse, MN, sVacuum Specific Impulse,sSea Level Specific Impulse,sTVC TypeVectoring Capability, DegreeNozzle Initial Area RatioNozzle Exit Diameter, mmMotor Total Mass» Kq
Table 2
4 th Stages-44
81573.074.04.030.82.25281.9
spin stab
70.0602917
4. PROFIL DE VOL
Le profil pour le 1er vol est donné dansla Figure 4. Une fois relevé la position,altitude, la vitesse et acceleration dansles trois axes, ainsi comme la pressioninterne due à la combustion de la poudre,sera estimée, par calcul, l'impulsionspécifique et l'impulsion totale dans lesconditions très proches des conditionsréelles de vol du 4ème étage VLS. Au mêmetemps, seront réalisés plusieurs mesuresde température dans les points pluscritiques du propulseur.
VS-40 PTOIEVENTS SEQUENCE
Fiq. 4 - Profil de Vol_
5. PLAN DE DEVELOPPEMENT - SINTESE
Ci-dessous, sintese du Plan de Développement du Système VS-40. Due à la grandecharge de travail et le retard déjàaccumulé dans le programme de développement du propulseur S-44, le premier vol,prévu pour la fin de 1990, a été reportépour la fin de 1991.
ACTIVITES 's89
Eludes preliminores - Spécifications . _
Etudes de Définition - Dossier de Définition . LJ _ .I
Développement des sous- systèmesModification des sous- systèmes SW-tS L
Propulser S-44 = Quotif icatron au soL.L. . . .
Prototype VS-40/PT-01 'Recette du
19! > 1991
I
IE IL J
1V \Q VS ko
ffm::± I
Fig . 5 - Plan de Développement
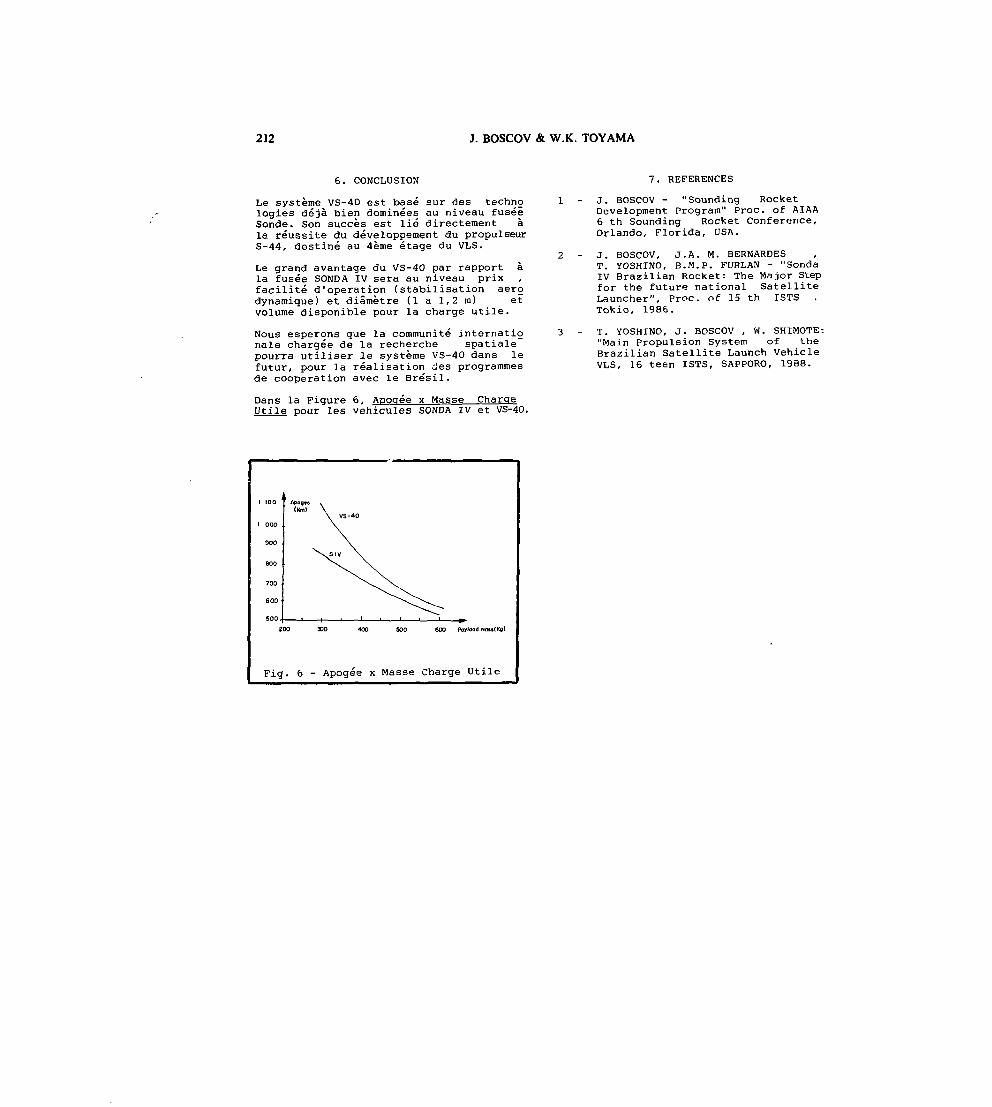
212 J. BOSCOV & W.K. TOYAMA
6. CONCLUSION
Le système VS-40 est basé sur des technologies déjà bien dominées au niveau fuséeSonde. Son succès est lié directement àla réussite du développement du propulseurS-44, destiné au 4ème étage du VLS.
Le grand avantage du VS-40 par rapport àla fusée SONDA IV sera au niveau prix ,facilité d'opération (stabilisation aerodynamique) et diamètre (1 a 1,2 m) etvolume disponible pour la charge utile.
Nous espérons que la communité internatignale chargée de la recherche spatialepourra utiliser le système VS-40 dans lefutur, pour la réalisation des programmesde coopération avec le Brésil.
Dans la Figure 6, Agocrée x Masse ChargeUtile pour les véhicules SONDA IV et VS-40.
7. REFERENCES
1 - J. BOSCOV - "Sounding RocketDevelopment Program" Proc. of AIAA6 th Sounding Rocket Conférence,Orlando, Florida, USA.
2 - J. BOSCOV, J.A. M. BERNARDES ,T. yoSHINO, B.M.P. FURLAN - "SondaIV Brazilian Rocket: The Major Stepfor thé future national SatelliteLauncher", Proc. of 15 th ISTS .Tokio, 1986.
3 - T. YOSHINO, J. BOSCOV , W. SHIMOTE:"Main Propulsion System of theBrazilian Satellite Launch VehicleVLS, 16 teen ISTS, SAPPORO, 1988.
000
900
GOO
700
EOO
500
(Km)
SOO 600 Poyloo<t mossing)
Fig. 6 - Apogée x Masse charge Utile

213
"THE BRAZILIAN SPACE PROGRAM: ACTUAL STATE OF THE ART"
Col. A.C.F. PEDROSA Lt. Col. T.S. RIBEIRO Ing. J. BOSCOV
CENTRO TECNICO AEROESPACIALINSTITUTO DE ATIVIDADES ESPACIAIS
12225 - SAO JOSÉ DOS CAMPOS - SP - BRASIL
ABSTRACT
The Brazilian Space Program, MECB, comprisesthree segments: the Satellite Launcher,wich is the most complex part , theSatellite itself and the Launching Range.
The VLS project is the result of more than20 years of experience in development andoperation of the sounding rockets SONDA I,SONDA II, SONDA III and SONDA IV.
The great difficulty concerning thedevelopment of VLS is the recent policy ofexport restriction of materials and servicesimposed, by the countries of the Cocon.
In this paper we present a description ofthe IAE acitivities with sounding rocketsprograms and in the actual VLS program.
Keywords: Brazilian Space Program, SoundingRockets SONDA I, SONDA II, SONDA III ,SONDA IV, Brazilian Satellite Launcher-VLS,Alcantara Launching Center.
1. INTRODUCTION
The Brazilian Space Program began in the 60'sin a coherent and economic way using theexisting technologies to start a new development.
The program is sponsered by the BrazilianComission for Space Activities (COBAE) withdirect subordination to the BrazilianPresidency. This comission is supportedby three organizations: Institue for SpaceActivities (IAE), Alcantara Launching Center(CLA) and Institute for Space Research (INPE).The IAE and CLA are under the Ministry ofAeronautics and INPE of the Ministry ofScience and Technology.
The IAE objective is to continually assureand enhance the capability to implementresearch and development projects in thefield of space and technology , seekingthereby to créât and improve a family ofsounding vehicles and satellite launch systems.
The CLA has the task of planning, buildingand operating a new rocket launching site.
2. RESUME OF SPACE ACTIVITIES IN BRAZIL.CHRONOLOGY OF THE SOUNDING ROCKET PROGRAM
Brazilian Space Activities can becharacterized by two different phases: inthe first phase the RSD of sounding rocketsused aerodynamics as the basic stabilityfactor; the second phase, now in progress,includes guidance and control in the system.
The first phase under IAE management startedin 1965 with the design and manufacture ofthe SONDA I system. This rocket served asa learning ground in the field of solidpropellants and the development of shortrange rockets.
The SONDA I system (Fig.l) was designed for highatmosphere sounding in altitude range from60 to 75 Km and specifically intented forusing in the International Exametnet Program.
The INPE purpose is to carry outdevelopment of artificial satellites.
the
I
I
£C
1 -.
L "
i —1
DO
0M1
JJO
0izr
g
9-
O
-
SONOA I
CHARACTERISTICS'
TAKE- Of r UASS(Mt S»
PATLOMI UASS (U) *,i
UAXIMUW VELCCIT* ImAt ISW
MAXIMUM ACCCLFRATlDN I m/t*) ISO
APOGEE ALTITUDE (*<•) «3
i* s«ceMOTOR MASS (M) ÎT.S
PKOPELLANT MASS (IfI '2,^
AVCHACE THHUST IN] 2TOOO
V* ST*6EMOTOR UASS 1 It > 27, 3
FROPELIANT MA» ll|M».*
AVERAGE THRUST IN) «z«o
Fig. 1-SONDA I SYSTEM
Proc. Ninth ESAIPAC Symposium on 'European Rocket and Balloon Programmes and Related Research', Lahnstein, FRG, 3—7April 1989fESA SP-291, June 1989)
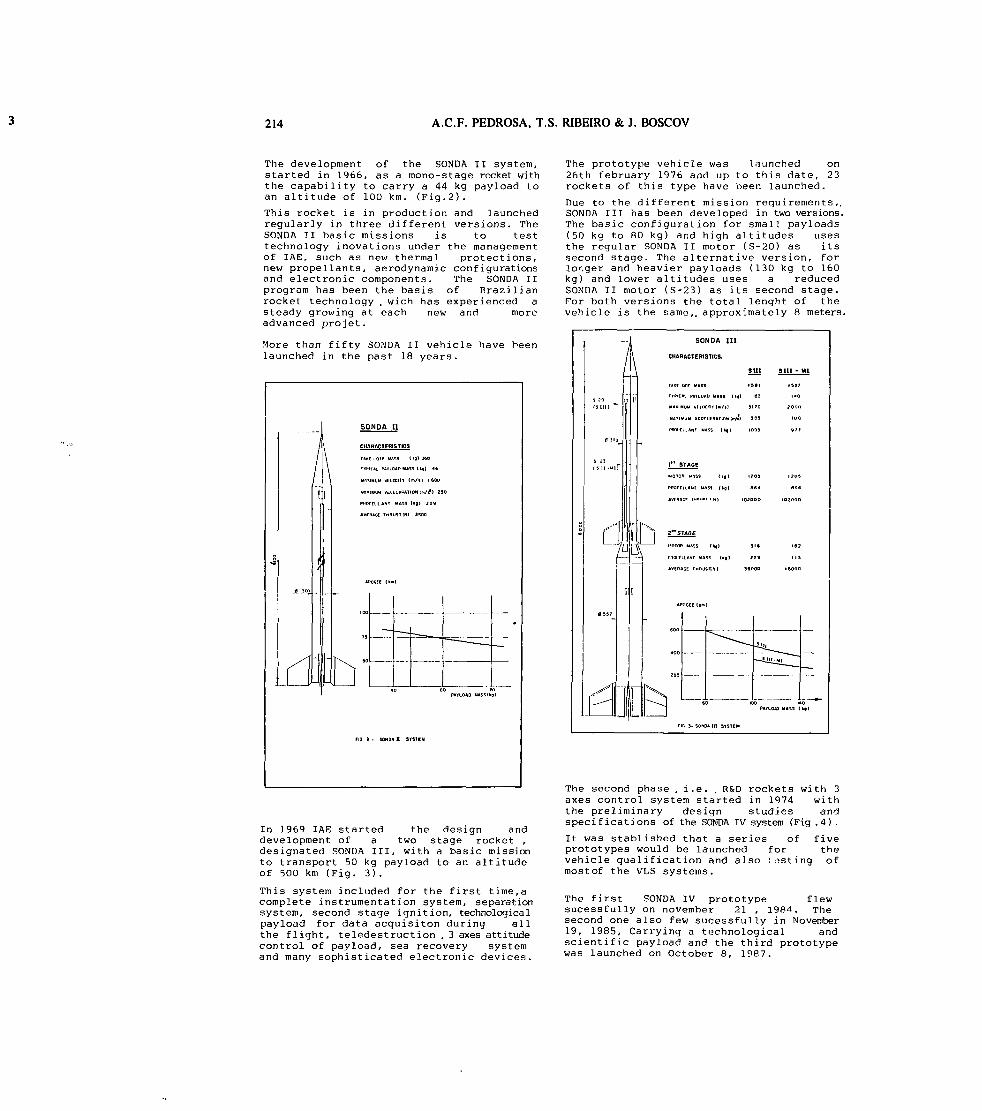
214 A.C.F. PEDROSA, T.S. RIBEIRO & J. BOSCOV
The development of the SONDA II system,started in 1966, as a mono-stage rocket withthe capability to carry a 44 kg payload toan altitude of 100 km. (Fig.2).
This rocket is in production and launchedregularly in three different versions. TheSONDA II basic missions is to testtechnology inovations under the managementof IAE, such as new thermal protections,new propellants, aerodynamic configurationsand electronic components. The SONDA IIprogram has been the basis of Brazilianrocket technology . wich has experienced asteady growing at each new and moreadvanced projet.
More than fifty SONDA II vehicle have beenlaunched in the past 18 years.
d
CHARACTERISTICS
TlIKt . Olr MASS t «9) MO
TTI-ICAL PATLOAD MUSS I kg) 44
MAXIMUM VtLCCIIT ImAl 1600
MAXtUOM A1AtLAHiTION lit./**) 250
PIlOfELLANT MASS llgl 229
AVERAGE THRUST IMI 3GOO
PATLOAD UASSIlg)
FIG t - SONOA H STSTCM
In 1969 IAE started the design anddevelopment of a two stage rocket ,designated SONDA III, with a basic missionto transport 50 kg payload to an altitudeof 500 km (Fig. 3).
This system included for the first time,acomplete instrumentation system, separationsystem, second stage ignition, technologicalpayload for data acquisiton during allthe flight, teledestruction . 3 axes attitudecontrol of payload, sea recovery systemand many sophisticated electronic devices.
The prototype vehicle was launched on26th february 1976 and up to this date, 23rockets of this type have been launched.
Due to the different mission requirements,.SONDA III has been developed in two versions.The basic configuration for small payloads(50 kg to 80 kg) and high altitudes usesthe regular SONDA II motor (S-20) as itssecond stage. The alternative version, forlonger and heavier payloads (130 kg to 160kg) and lower altitudes uses a reducedSONDA II motor (S-23) as its second stage.For both versions the total lenght of thevehicle is the same,, approximately 8 meters.
g
"
//S PO r
IS III) ~~
(MOO-
'"
riLJ,
i
« 5 5 7
r llJPnIJI
SONDA III
^CHARACTERISTICS.
SlII SIII - Ml
TAKC Orr UASS I5BI I S 2 T
MAI MUM VIIOCIlT In/l) J I T O 2000
ITOItIlAMI MASS IK1I IO«J » T T
-
I" STAGE
PRORClLAHT MASS ( Ig I 464 AIÎ4
AVtRAM Tuo-.'ïtlti) I02000 IO2OOO
fh ,,„«
'~\V MOlOf» MrtSS (Ig) SIB IB?
AVERAGE THRUSTlS) 36OOO IBOQO
I
APQGEE t*m)
-
^^ ., ^^M,__
niN|_| 6° ""PATLOA5MASS1,'.0.,
rut S- SOMOAIR SYSTEM
The second phase . i.e. . R&D rockets with 3axes control system started in 1974 withthe preliminary design studies andspecifications of the SONDA IV system (Fig .4) .
It was stablished that a series of fiveprototypes would be launched for thevehicle qualification and also testing ofmostof the VLS systems.
The first SONDA IV prototype flewsucessfully on november 21 , 1984. Thesecond one also few sucessfully in November19, 1985, Carrying a technological andscientific payload and the third prototypewas launched on October 8, 1967.

BRAZILIAN PROGRAMME 215
Most of the technologies required for thesatellite launcher concerning the materialsTVC by secondary injection system, stageand payload separations,, auxiliary propulsionsystem and flightsafety devices are presentin the SONDA IV rocket.
In 1978 the satellite launcher (VLS)program,that also included the development of thesatellite by INPE . obtained the officialapproval. This program named the "CompleteBrazilian Space Mission - MECB" is anintegrated program with IAE responsiblefor the development and qualification onthe launcher vehicle, INPE responsible forthe satellite and CLA is in charge for thelaunching operation.
The objective of this program is to put inorbit two satellites for earth observationand two remote sensing satellites. Forearth observation the orbit will be nearcircular equatorial (maximum inclination252) at 700 km altitude and the remotesensing satellites will have aheliosynchronous orbit with 982 inclination,550 km apogee and 350 km perigee.
The chronologic events for thelaunching are in Fig. 5.
satelli te
SONDA IV
CHARACTERISTICS'
IAME Off MASS (Ig) F J T O
TrPICAL TATLOAD MAIS I IgI SOO
MAXIMUM VELOCITT In/I) S ÏOO
MAXIMUM ACCELflJIAIIO'll m/»l no
pnoF'ELLANT «ASS I IB) SOB*
PATLOAD MASS III)
FIC 4- SO1IDfI IV STSTE
VLS - PROJECT SCHEDULE
SEG
(O
EVENTSSOLID PROPELLANT SYSTEMS FOR IST, 2"1Js"0 AND
4 Th STAGES.
LIQUID PROPELLANT SYSTEM FORATTITUDE CONTROL
STRUTURAL CASES1MODULAR PARTS AND
EJECTABLE NOSE
PYROTECHNIC SYSTEMS AND ELETRO-PNEUMATICS
FOR IGNITIONS, SEPARATIONS, ATTITUDE CONTROL
CONTROL ELETRIC NETWORK AND EQUIPMENTS,
TELEMETRY, SAFETY PROCEDURES AND SERVICES
VLS MOCK-UP FORVIBRATIONTESTS1ELETRIC
AND SIMULATED LAUNCHINaS
GROUNDING SUPPORT PROJECTS: MECHANICS,
ELETRICS AND TESTS.
CIVIL BUILDINGS CONSTRUCTIONS.
FLIGHT VEHICLE PRODUCTION
VEHICLE LAUNCHINGS AT CLA
88 89 901ST STAGE SJtC.
( '
\
SATELLITE EHB MOD
S
L HIM
,
SATELLl
! I
I
I-PTO*^VLSH!-.
W
15 -1S' SIVPT
5"~N.\7
;5'"-2-
91HD3TA6E aHOST
OCM.
J,
UE 4
-Si]r]
I
r EHC u
MlM
Ot^ LAUNCHlW
MAS
bl
92HSTaQE
V SAT
V LAU
V SOl
V VLS
V FLK
I
3
/SAT
(2 / OAT
TELITE
CHINQ FO
NHPINO
FLIGHT
HT AT
—• x.FLIBHT
U COLtC
93
fl CU* H
DOCKETS
AT CLA
LBl
SFOATAi
OXL
ton
-^ ^ VSWOJ^^LS^O, yj vts^> »**'
HG MODE
OMOLODA
FLIGHTS
SFH
DATACti
OLECTOH
7
94
TION
AT CL
H.ECTOR
\ SFM
LS frôs
^7I
Fig. 5 VLS- Project Schedule

216 A.C.F. PEDROSA, T.S. RIBEIRO & J. BOSCOV
3. THE SATELLITE LAUNCHING VEHICLE - VLS
The VLS, shown in Fig.6, ,is a conventionalfour stages satellite launcher utilizingsolid propellant motor in all stages. Itis being designed and developed based onthe available technlogy from 20 years ofexperience by IAE on solid propellantrockets. The choice of solid propellantpropulsion instead of liquid propulsion isdue to the lower initial investmentsrequired for the program. The vehicle willhbva the capability to inser a 100 to 200kg satellites into circular orbits rangingfrom 250 to JOOO km in altitude, and witha large spectrum of inclinations whenlaunched from Alcantara, located (2.3^S ,.44.42W) . as shown in Fig. 7.
The main features of the VLS are listed asfollows :
Number of stages 4Lift-off mass 50.730 kgOveral lenght 18.8 mDiameter 1.0 mDiameter of fairings 1.2 mFirst stage Propellant mass..28.900 kgSecond stage Propellant mass. 7.140 kgThird stage Propellant mass.. 4.370 kgFourth stage Propellant mass. 820 kgNominal payload capability... 150 kg into
750 km circ.equatorial orbit.
The VLS is made up of five major subsystems:
a) First propulsive stage;b) Seccn3 propulsive stage;c) Third propulsive stage with the Roll
Control Module;d) Fourth propulsive stage with Guidance
and Control Module, the Attitude ControlSystem and 4th stage spin-up system ;
e) Payload Heatshield.
The system breakdow with the weight summaryis presented below:
8
™
__
S
(S tAM
-^
SlMESEPAtIAlICfI
E I Allais
(SfAS IfT)
L
-\
Is»
r!
4-
"
/
r_
r-
/'
~
^
\ /k
\
à
r
„
t.3\~
T-
SHROUD
SAlEl-LItE
FUUIUIl STAGE [IECIROMICG
- GUIt)AIiCE AtiD comnm M"TJUI.E-ATTITUt)E COfIT(IDL SlSTCM
- 1IIIHD STAGE MUtCiR (S-Id)
AfA
t
•
. I',
A-!
— FIfIDT StftGE MUlOn'J(4]C!-lM
— SECO(ID STA-IEf-UTOR(Cintra!) (S-43)
LIFT. orr MASS 50 B ton
Ii
VLS COHFIGUIWION
Fig. 6 - VLS Configuration
Subsystems
PayloadHeatshield*
4th stage:At burnoutPropellant + consumableAt ignition
3rd stage:At burnoutPropellant + consumableAt ignition
2nd stage:At burnoutPropellant + consumableAt ignition
1st stage:At burnoutPropellant + consumableAt ignition
MassSubsystem
170820
1.3304.370
1.6807.140
6.20028.900
(kg)Total
120
990
5.700
8.820
35.100
VLS at lift-off Mass (kq) 50.730
60* 50* 40* 30' ZO' 10'
EOUATOR
ALCANTARA AND THE OTHERS SOUTH AMERICA LAUNCHING SITES
Fig. 7 - VLS Launching Site
* Heatshield is separated at beginning of3rd stage flight.
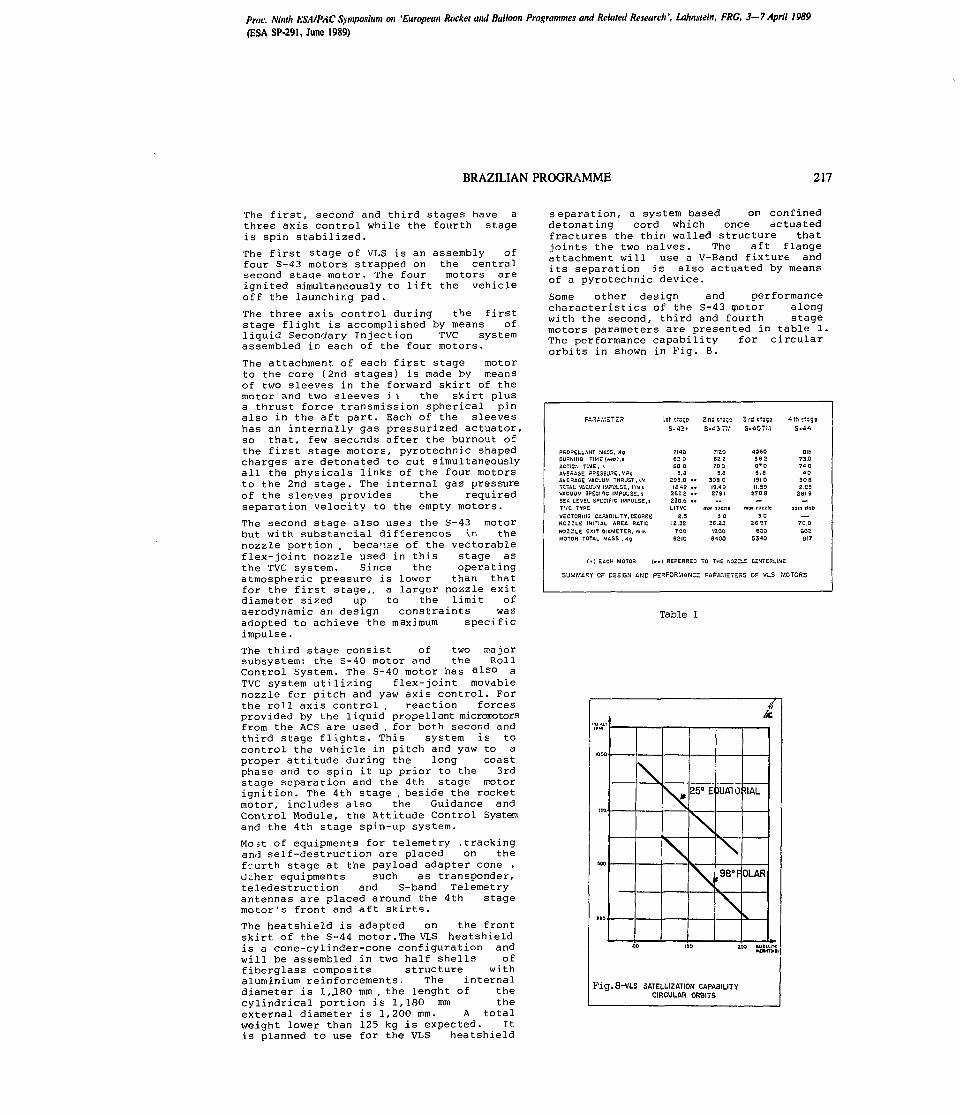
Prof. Ninth ESA/PAC Symposium on 'European Rocket and Balloon Programmes and Related Research ', Lahnstein, FRG, 3—7 April 1989(ESA SP-291, June 1989)
BRAZILIAN PROGRAMME 217
The first, second and third stages have athree axis control while the fourth stageis spin stabilized.
The first stage of VLS is an assembly offour S-43 motors strapped on the centralsecond staqe motor. The four motors areignited simultaneously to lift the vehicleoff the launching pad.
The three axis control during the firststage flight is accomplished by means ofliquid Secondary Injection TVC systemassembled in each of the four motors.
The attachment of each first stage motorto the core (2nd stages) is made by meansof two sleeves in the forward skirt of themotor and two sleeves i i the sXirt plusa thrust force transmission spherical pinalso in the aft part. Each of the sleeveshas an internally gas pressurized actuator,so that, few seconds after the burnout ofthe first stage motors, pyrotechnic shapedcharges are detonated to cut simultaneouslyall the physicals links of the four motorsto the 2nd stage. The internal gas pressureof the sleeves provides the requiredseparation velocity to the empty motors.
The second stage also uses the S-43 motorbut with substancial differences in thenozzle portion . because of the vectorableflex-joint nozzle used in this stage asthe TVC system. Since theatmospheric pressure is lowerfor the first stagediameter sized up
operatingthan that
a larger nozzle exitto the limit of
aerodynamic an design constraints wasadopted to achieve the maximum specificimpulse.
The third stage consist of two majorsubsystem: the S-40 motor and the RollControl System. The S-40 motor has also aTVC system utilizing flex-joint movablenozzle for pitch and yaw axis control. Forthe roll axis control . reaction forcesprovided by the liquid propellant micromotorsfrom the ACS are used . for both second andthird stage flights. This system is tocontrol the vehicle in pitch and yaw to aproper attitude during the long coastphase and to spin it up prior to the 3rdstage separation and the 4th stage motorignition. The 4th stage . beside the rocketmotor, includes also the Guidance andControl Module, the Attitude Control Systemand the 4th stage spin-up system.
Most of equipments for telemetry ,trackingan.'J self-destruction are placed on thef'.-urth stage at the payload adapter cone .Other equipments such as transponder,teledestruction and S-band Telemetryantennas are placed around the 4th stagemotor's front and aft skirt?.
The heatshield is adapted on the frontskirt of the S-44 motor.The VLS heatshieldis a cone-cylinder-cone configuration andwill be assembled in two half shells offiberglass composite structure withaluminium reinforcements. The internaldiameter is 1,.18O mm . the lenght of thecylindrical portion is 1,180 mm theexternal diameter is 1,200 mm. A totalweight lower than 125 kg is expected. Itis planned to use for the VLS heatshield
separation, a system based on confineddetonating cord which once actuatedfractures the thin walled structure thatjoints the two halves. The aft flangeattachment will use a V-Band fixture andits separation is also actuated by meansof a pyrotechnic device.
Some other design and performancecharacteristics of the S-43 motor alongwith the second, third and fourth stagemotors parameters are presented in table 1.The performance capability for circularorbits in shown in Fig. 8.
PAR AM ST S3
PROPELLANT MASS, KgBURNING TIME (w«oj,iACTION TIME, sAVERAGE PP.ESSUHE.MPaAVERAGE VACUUM THRUST, iNTCTnL VACUUM IMPULSE, MN s
VACUUM SPECIFIC IMPULSE, s
SEA LEVEL SPECIFIC IMPULSE,!
TVC TYPE
VECTORIfIG CAPABILITY1CEGREENO....LE INITIAL AREA RATIO
MOTOR TOTAL MASS , Kg
SUMMARY Cr DESIGN AND
1st srccs
s-«.
7140€20
68.05.8
293.0 "1842 ..
2S22 •*230.6 .*LITVC
Z.S
8210
PSSFOHMANCE
2nd 51=52S -4 3 TM
7120
622
700
5.8
306019.492791
trav mime
Î O
8400
PARAMÎ7
^rdr.-B
S- 40 TM
4360
sa 2670
5.8
191 O
11.592709
—m ov nozzle
30
6GO
5340
=?.S OF VLS MO
T th "T--*S-44
81573.0
7« O40
3OB
2.25£BI9
—spin îïob
—_
ai 7
TORS
Table 1
(KHt
1000
TSQ
SOO
290 <
Fig
//X.
\
\
\
250E
\
\
JUAlO
\
(98"F
\
WAL
OLAR
.
150 v" SVÏÏ,
.8-VLS SATELLISATION CAPABILITYCIRCULAR ORBITS
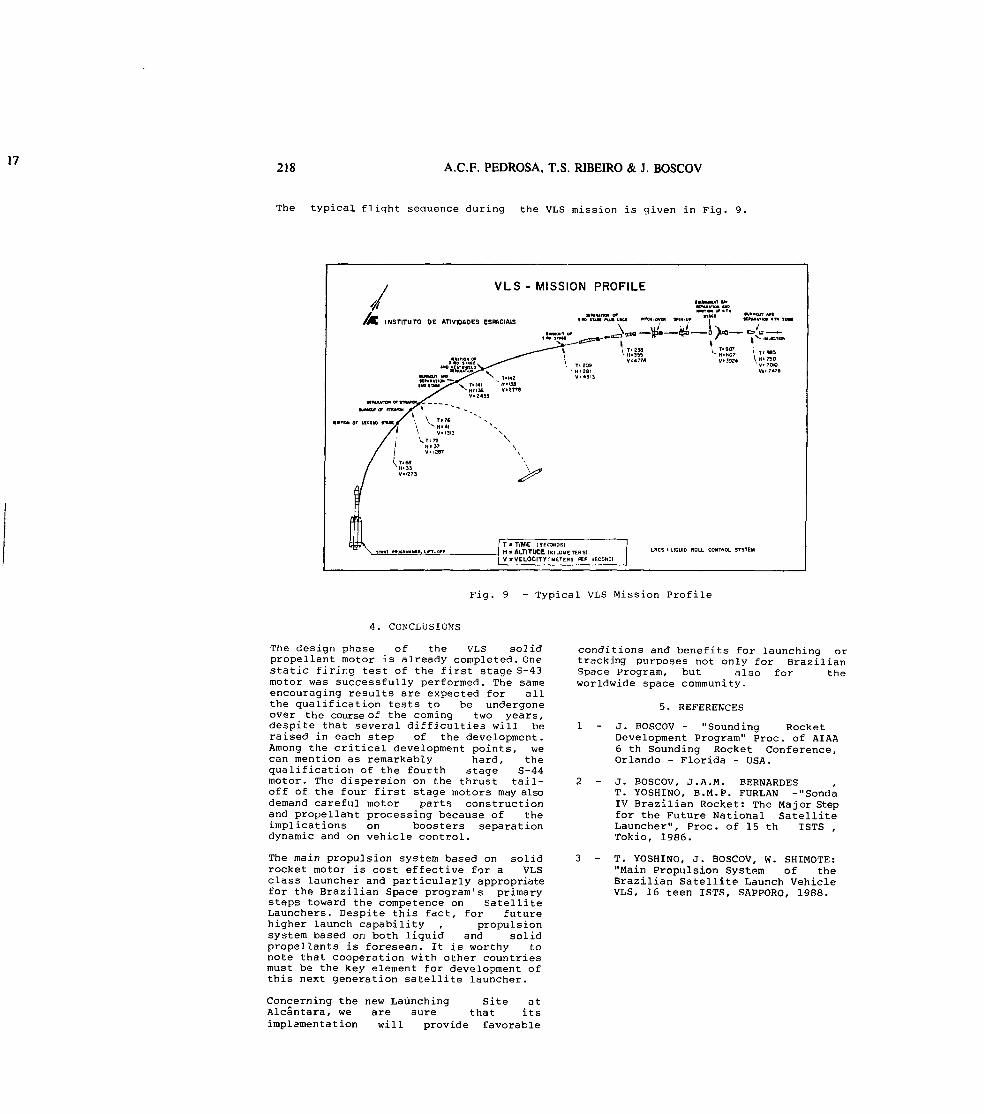
218 A.C.F. PEDROSA, T.S. RIBEIRO & J. BOSCOV
The typical fliqht sequence during the VLS mission is given in Pig. 9.
VLS - MISSION PROFILE
INSTITUTO DE ATIVIOAOES ESKCIAIS *"•»• 1T
\ T'MSESS, u«o
. yraBT maa**tiMtii,T * TIME (SECONDS!
.1 HxALTITUDE (KILOMETERS)I V » VELOCITYlMETERS Ftn SECOND!
LRCS ' LIQUID ROLL CONTROL SYSTEM
Fig. 9 - Typical VLS Mission Profile
4. CONCLUSIONS
The design phase of the VLS solidpropellent motor is already completed. Onestatic firing test of the first stage S-43motor was successfully performed. The sameencouraging results are expected for allthe qualification tests to be undergoneover the course of the coming two years,despite that several difficulties will beraised in each step of the development.Among the critical development points, wecan mention as remarkably hard, thequalification of the fourth stage S-44motor. The dispersion on the thrust tail-off of the four first stage motors may alsodemand careful motor parts constructionand propellant processing because of theimplications on boosters separationdynamic and on vehicle control.
The main propulsion system based on solidrocket motor is cost effective for a VLSclass launcher and particularly appropriatefor the Brazilian Space program's primarysteps toward the competence on SatelliteLaunchers. Despite this fact, for futurehigher launch capability , propulsionsystem based on both liquid and solidpropellants is foreseen. It is worthy tonote that cooperation with other countriesmust be the key element for development ofthis next generation satellite launcher.
Concerning the new Launching Site atAlcantara, we are sure that itsimplementation will provide favorable
conditions and benefits for launching ortracking purposes not only for BrazilianSpace Program, but also for theworldwide space community.
5. REFERENCES
1 - J. BOSCOV - "Sounding RocketDevelopment Program" Proc. of AIAA6 th Sounding Rocket Conference,Orlando - Florida - USA.
2 - J. BOSCOV, 0.A.M. BERNARDEST. YOSHINO, B.M.P. FDRLAN -"SondaIV Brazilian Rocket: The Major Stepfor the Future National SatelliteLauncher", Proc. of 15 th ISTS ,Tokio, 1986.
3 - T. YOSHINO, J. BOSCOV, W. SHIMOTE:"Main Propulsion System of theBrazilian Satellite Launch VehicleVLS, 16 teen ISTS, SAPPORO, 1988.
SESSION 11ASTRONOMY & ASTROPHYSICS
Chairmen:J.M. Lamarre
HJ. Fahr

221
INTERSTELLAR MEDIUM AND INFRARED EMISSION OF THE GALACTIC DISK
Guy SERRA
CESR-CNRS/UFS9, av. colonel RocheBP4346 - 31029 ToulouseFrance
ABSTRACT
The measurements of the galactic discinfrared emission are summarized(particularly those made using balloon-borne instruments). The empirical modelsmade to explain the spatial distributionof the infrared fluxes emitted by thegalactic disc are recalled. Then, a reviewof the dust models is given with specialemphasis on the difficulties to accountfor the observations, using the standarddust models. The proposition of a newcomponent of the interstellar matter : thepolycyclic aromatic molecules (PAH) isdiscussed. Recent results obtained usingthe AROME balloon-borne instrument arereported. These results strengthen theidentification of the galacticinterstellar very small grains to PAHmolecules. The present new vision of theinterstellar medium is described.
Keywords : Interstellar matter. TheGalaxy, Balloon-borne instrumentation,infrared, Polycyclic Aromatic Hydrocar-bons, molecular clouds.
1. INTRODUCTION
Balloons and rockets have been used forastronomical observations in the infraredand submillimeter range, mainly in twofields.
The first one concerns the observation ofthe diffuse extragalactic backgroundradiation. For example, measurements ofthe anisotropies have been made withballoon-borne and rocket-borne instruments: i) cosmic background dipole and ii)fluctuations at intermediate angular scale(a few degrees) (see for example Réf.1-5).
The second field is related to the MilkyWay emission. Bldimensional maps have beenestablished giving informations about thegalactic structure. The flux measurementsat several wavelengths allowed to know thespectral distribution of the powerradiated in the infrared and submillimeter
range by our Galaxy. These results induceda significant increase of our knowledgeabout the interstellar medium in thegalactic plane.
Only the problems related to this secondfield will be discussed in this paper, asan example of what can be done, inAstrophysics, with balloons and rockets.
2. INFRARED CONTINUUM EMISSIONAND GALACTIC MODELS
As is wellknown, the atmospherictransmission is very poor from 5|im up to700|im. Except for a few atmosphericwindows (35, 350, 450|im) the atmosphere istotally opaque in the far infrared range(x > 30|im) even at mountain altitudes. Atthe ceiling altitude for balloons theatmosphere become hightly transparent (>99 %). But the infrared emission is stillvery important and much higher than theintensities of most of the astronomicalsources. This atmospheric emission impliesspecific techniques for the detectionsystems. Chopping or fast scanningprocedures have to be applied in theinfrared range even when the atmosphericemission is reduced because the optics areemiting an intense infrared background.This makes measurements of extendedsources difficult.
In the IR range from a few |im up to 1 mm,some observations have been made '.-romrockets. The diffuse flux emission of thegalactic disc has been measured for thefirst time by an instrument carried abovethe atmosphere by a rocket in 1970 (Réf.6). Another example of observations madeusing rockets is a sky survey at 4, 11 and20|im. Sixty percent of the galactic dischas been surveyed during the AFGL Infraredsky survey (Réf. 51). These maps show atthe three wavelengths an intense galacticridge with bright spots superimposed to anunresolved diffuse emission. But, manyastronomical observations in the infraredrange have been made using balloon-borneinstruments.
Proc. Ninth ESA/PAC Symposium on 'European Rocket and Balloon Programmes and Related Research ', Lahnstein, FRG, 3—7 April 1989(ESA SP-291, June 1989)
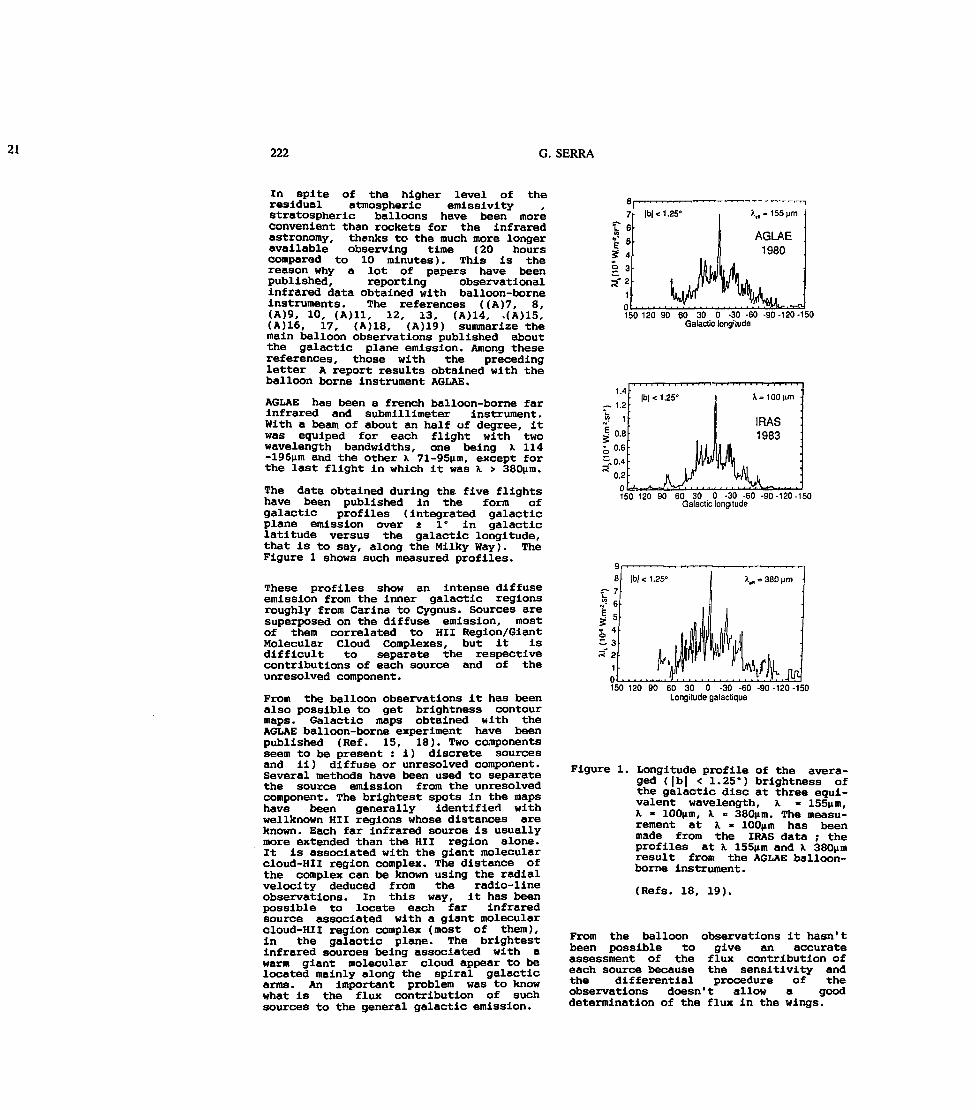
222 G. SERRA
In spite of the higher level of theresidual atmospheric emissivity ,stratospheric balloons have been moreconvenient than rockets for the infraredastronomy, thanks to the much more longeravailable observing time (20 hourscompared to 10 minutes). This is thereason why a lot of papers have beenpublished, reporting observationalinfrared data obtained with balloon-borneinstruments. The references ((A)7, 8,(A)9, 10, (A)Il, 12, 13, (A)14, .(A)15,(A)16, 17, (A)18, (A)19) summarize themain balloon observations published aboutthe galactic plane emission. Among thesereferences, those with the precedingletter A report results obtained with theballoon borne instrument AGLAE.
AGLAE has been a french balloon-borne farinfrared and submillimeter instrument.With a beam of about an half of degree, itwas equiped for each flight with twowavelength bandwidths, one being X 114-196 m and the other K 71-95(im, except forthe last flight in which it was K > 380|im.
The data obtained during the five flightshave been published in the form ofgalactic profiles (integrated galacticplane emission over * 1° in galacticlatitude versus the galactic longitude,that is to say, along the Milky Way). TheFigure 1 shows such measured profiles.
These profiles show an intense diffuseemission from the inner galactic regionsroughly from Carina to Cygnus. Sources aresuperposed on the diffuse emission, mostof them correlated to HII Region/GiantMolecular Cloud Complexes, but it isdifficult to separate the respectivecontributions of each source and of theunresolved component.
From the balloon observations it has beenalso possible to get brightness contourmaps. Galactic maps obtained with theAGLAE balloon-borne experiment have beenpublished (Réf. 15, 18). Two componentsseem to be present : i) discrete sourcesand Ii) diffuse or unresolved component.Several methods have been used to separatethe source emission from the unresolvedcomponent. The brightest spots in the mapshave been generally identified withwellknown HII regions whose distances areknown. Each far infrared source is usuallymore extended than the HII region alone.It is associated with the giant molecularcloud-HIl region complex. The distance ofthe complex can be known using the radialvelocity deduced from the radio-lineobservations. In this way, it has beenpossible to locate each far infraredsource associated with a giant molecularcloud-HII region complex (most of them),in the galactic plane. The brightestinfrared sources being associated with awarm giant molecular cloud appear to belocated mainly along the spiral galacticarms. An important problem was to knowwhat is the flux contribution of suchsources to the general galactic emission.
8
7
fe*
Ï 5
S 4
I 3
15012090 60 30 O -30-60-90-120-150Galactic long'iude
1.4
— 1.2
0.8
•0 0.6
J0.4
0.2
X = 100(im
IRAS1983
150 120 90 60 30 O -30 -60 -90-120-150Galactic longitude
6
=• 35 ' Z
1
O
lb| < 1.25°
150 120 90 60 30 O -30 -60Longitude galactique
-90-120-150
Figure 1. Longitude profile of the avera-ged (|b| < 1.25°) brightness ofthe galactic disc at three equi-valent wavelength, K » I55um,K « 100(im, K » 380|im. The measu-rement at X - 100|im has beenmade from the IRAS data ; theprofiles at A. 155|im and Jt 380(imresult from the AGLAE balloon-borne instrument.
(Refs. 18, 19).
From the balloonbeen possible toassessment of theeach source becausethe differential
observations it hasn'tgive an accurateflux contribution ofthe sensitivity andprocedure of the
observations doesn't allow a gooddetermination of the flux in the wings.

INTERSTELLAR MEDIUM & GALACTIC IR EMISSION 223
Fortunately, in 1983 an "InfraredAstronomical Satellite" named IRAS waslaunched. This instrument was composed ofa 0.60 cm diameter Cassegrain telescopecooled at cryogenic temperature and a fourbands photometer : X 12|im, K 25|im, K 60(imand X 100|im using photovoltalcs andphotoconductive detectors (Refs. 20, 21).
IRAS made a survey in these fourphotometric bands of 95 % of the sky. Thehigh sensitivity allows to measure thefluxes emitted not only by ponctuaisources, but also by extended infraredobjects. After substraction of thezodiacal emission, bidimensional maps ofthe galactic and extragalactic infraredsky have been made.
All the essential characteristics of thegalactic diffuse infrared emissiondiscovered previously with balloon-borneor rocket-borne instruments have beenconfirmed by the IRAS observations (with ahigher sensitivity). The Figure 1 showsthe galactic profile computed at K lOOpimfrom the IRAS data ; it can be compared tothe profiles measured using the ballon-borne instrument AGLAE at K 155|im and X380pim.
There have been several works making out amodélisation in the aim to explain thespatial distribution of the infraredgalactic emission (Refs. 22-26). As anexample, the main conclusions of the modelpublished by Caux et al. (Réf. 26) arereminded. The infrared galactic emissionis believed to be due to the interstellardust emission. In the interstellar mediumthe dust grains are mixed with the gas.The interstellar gas (80 % hydrogen and 19% helium) is mostly made up of twocomponents : the atomic hydrogen HI (inlow density clouds or in the extendeddiffuse medium), and the molecularhydrogen H2 (in dense cores with highdensities or in giant molecular cloudswith total gas masses reaching 10e Mo).
In Caux et al model (Réf. 26), 55 % of thetotal power radiated in the infrared rangeby our Galaxy is attributed to theemission by dust mixed with the HIcomponent, 45 % being attached to the dustembeded in the H2 gas component. This lastcontribution related to the molecularhydrogen gas can be divided in two sub-components : the first one (15 % of thetotal power) is due to cold dust mixedwith quiet molecular clouds and the second(30 % of the total power) being emitted bywarm dust embeded in molecular cloud - HIIcomplexes in which an active starformation is occuring.
This model, like the others, gives a goodrepresentation of the spatial distributionof the galactic emission. The absolutevalues of the infrared fluxes have beenassessed supposing that the dust to gasratio is the same everywhere in the Galaxyand using the gas column-densitiesaccounted from the radio observations (X2.6 mm CO line giving informations about
the H2 column-densities and X 21 cm HIline for the HI column-densities). Themodel is based also on the followinghypothesis : the infrared luminosity (pervolume unit of the Galaxy, for example) isproportional to the local dust density andto the local interstellar radiation fieldprovided by the light emitted by thesurrounding stars. The computed absolutevalues of the infrared fluxes are in aquite good agreement with the IRASobservations. But this model doesn'tproduce information about the dust nature.In fact, this model is based on anempirical spectrum based on theobservations. The question to explain thespectrum shape remains still open. Thespectral distribution of the powerradiated in the infrared range depends onthe grain temperature distributiondepending critically on the model used todescribe the dust grainabsorption/emission properties.
3. DUST MODELS
Numerous dust models have been made inorder to account for the interstellarextinction curve. This curve describes thevariation with the wavelength (in the UV,visible and very near infrared range) ofthe star light extinction (absorption anddiffusion) by the interstellar medium. Theextinction decreases continously from theUV to the IR, with a local enhancement atabout X = 2200 A (the "UV bump").
These models use a set of solid materialsassuming single grain size or a sizedistribution generally contained betweenO.Oliim and 0,25|im for the radius of thegrains supposed to be spherical.
Two main kinds of grain models are takeninto account. In the first one thematerial that make up the grains areassumed to be pure silicate for one familyand pure graphite for the other. The grainsize distribution is supposed to bedescribed by a power law : n(r) = r"3'5, rbeing the radius of a grain assumed to bespherical and n(r) is the number of grainsper volume unit. In such models the grainsare supposed to be produced mostly in theatmospheres of cool stars. Classicalpapers presenting these models, are forexample. Réf. 27 (often noted "MRNmodel"in the littérature) and Réf. 28.
The second kind of grain models take intoaccount a mixture of various materials tomake up each grain. A typical case isbased on a grain structure with a graphitecore surrounded by a mantle of silicatesand ice. A special case has been publishedby Greenberg (Réf. 29) who assumes a grainmantle with organic refractory materialremaining after processing in densemolecular clouds. A review published byTielens and Allamendola discuss thevarious grain models (Réf. 30 ).
224 G.SERRA
In all these models, all grains aresupposed to be in thermal equilibrium.Each grain is heated by absorbing thephotons (mostly in UV and visible range)of the interstellar radiation field (ISRF)and cooled by the infrared emission.
Assuming the thermal equilibrium for eachgrain, the total energy absorbed (mostlyin UV and Visible range) can be written tobe equal to the total energy reradiated(in the infrared). This quantitynormalised per hydrogen (H) atom,U
LIR can be computed directly from the
empirically known two quantities, u (A.),the ISRF density and 0..(A.), the absorptionncross section of the interstellar matternormalised per :
,H _ ,H atom
with
IR : f OHJuv,v H
(X) U (A.) dX
thec the light velocity and A,H
wavelength. The LIR value computed byPuget and Léger (Réf. 31) for the localgalactic disc region is :LHR - 5.7 x 10~
31 W/H atom. The value de-duced directly from the observations inhigh galactic latitude directions byBoulanger and Perault (Réf. 32) isL"R « 6.1 x ICf31 W/H atom . The goodagreement between these two values giveand indication "at posteriori" that theempirical values of u (A.) and o (X) are
U
rather wellknown. From the LIR knowledge
it is possible to assess the temperatureof each grain using one of the variousgrain dust model. The temperature value iscritically model dependent. Using astandard grain model (MRN), Draine and Lee(Réf. 28) found temperatures between 17 Kand 20 K for pure graphite grains and 15 Kand 18 K for pure silicate grains. But,the results found for these computationsgive a spectral distribution of thediffuse galactic emission which cannot bein agreement with the observations. Twomain discrepancies can be noticed betweenthe measured spectrum of the galactic dif-fuse emission and the predictions based onthe standard dust models : i) the near in-frared fluxes are underestimated (see forexample the figure 1 of Réf. 31) and ii)the values of the color ratio between theIRAS photometric bands are significantlydifferent.
Building an empirical model of the graindust temperature distribution in thepurpose to account for the galacticdiffuse emission spectrum, Pajot et al.(Réf. 33 ) found an extended hot componentin the interstellar matter which could notbe explained by dust in the vicinity ofstars. What's the origin and nature ofthis hot component ?
In an other hand, Caux et al. (Réf. 18)noticed that, for large HII regions-molecular clouds complexes, the mid-infrared emission (X ll|im and X 20(im)
correlated very well with the far infraredemission (A, > 100|im) on scales largerthan 100 pc where no hot dust wasexpected. In fact, these difficulties tounderstand the infrared diffuse galacticspectrum are similar to those yet found inparticular objects. Andriesse (Réf. 34)noticed a discrepancy between the spectrumof dust emission and the predictions ofthe standard dust model in the photometricdata for the HII region M17. He proposesthe presence of very small grains toaccount for the observations. Morerecently, Sellgren (Réf. 35) observingreflection nebulae in the near-infrared (X2|im to X 5|im) found an excess emission anda color temperature independent withdistance to the heating star. This wasinterpreted as evidence for emission bygrains heated to a thousand K followingsingle photon absorption. Such emission donot depends on the radiation fieldintensity ; it depends only on thephysical properties of the grains and onthe photon energy. Puget et al. (Réf. 36)derived from this idea, a model for theemission of the Interstellar Matter thatpredicted a strong excess around X 10|im inparticular nearby clouds at high galacticlatitude (named "cirrus") observed later(Réf. 37). In the same time. Draine andAnderson (Réf. 38) deduced from the IRAScolor ratio X 60/X 100|im value, that thedust size distribution should be extendeddown to a few Angstroms.
What could be the constituent and thephysical characteristics of these smallgrains ? It was wellknown for a long time,that particular features in the nearinfrared range are present in the spectrumof various astronomical sources.
In many objects (for example, reflectionnebulae, galaxies...) a same family ofspectral bands was observed in emission :3.3|im, 6.2|im, 7.7|im, 8.6|im and 11. Sum(Réf. 39). Among them the X 3.3pim and11.3|im features have been attributed tovibrational transitions of carbon-hydrogenbond, the carbon atom being included in anaromatic nucleus (Réf. 40).
Léger and Puget (Réf. 41) proposed thatthese bands are emitted by polycyclicaromatic hydrocarbon molecules which areidentified in the same time with the verysmall particles out of thermal equilibriumfound by Sellgren. These molecules couldbe hydrogenated graphite platelets with 20to 100 carbon atoms cluster ; for examplethe coronene C H . If this propositionwas true, such molecules would be presenteverywhere in the diffuse InterstellarMedium and in consequence, the nearinfrared aromatic bands would be presentin the infrared diffuse galactic emission.This point was, in 1986 at the origin ofthe AROME project.

INTERSTELLAR MEDIUM & GALACTIC IR EMISSION 225
4. INFRARED LINES IN THE DIFFUSE GALACTICEMISSION AND THE AROME BALLOON-BORNE
INSTRUMENT
The AROME balloon-borne instrument hasbeen devoted to observe the K 3.3\imfeature in the diffuse galactic emission.
Made by a collaboration between fourFrench CNRS institutes and the CNES, theinstrument consists in two 15 cm diameterCassegrain telescopes with wobblingsecondary mirror (angular amplitude of thebeam in the sky = 1.7° and 18 Hzfrequency) and two photometers, each onehaving two channels (wide and narrowphotometric band locked in the wavelengthX - 3.3 m). All this scientificinstrumentation is oscillating around thevertical axis, producing a slow azimutalscanning (O.B°/s) of the beam on the skywith an angular amplitude of ± 9 °. Thescan direction was roughly perpandicularto the galactic plane.
Two flights have been made with the AROMEballoon-borne instrument. For the firstone, the balloon was launched on August 4,1987 from the launching station ofTrapani-Milo in Sicilia and the gondolalanded in Andalucia (Spain), 24 hourslater. The galactic plane was observedfrom Sagittarius to Cygnus (galacticlongitudes between 1 =8° and 1 » 90°).The Orion region and several brightinfrared stars, for the in-flight calibra-ibrations have also been observed.
The results obtained with this AROMEflight have been published (Refs. 42, 43).The second flight happened in October 29,1988 in Australia with a duration of about20 hours at an altitude of about 3.5millibars. It allows to observe theSouthern part of the galactic plane, forgalactic longitudes between 1 = 295° to 1= 60°. The Orion region was observed asecond time, while the flux provided bybright infrared stars was measured for thein-flight calibrations.
The first flight allows to demonstrate thepresence of the X 3.3|im feature in thediffuse galactic emission. This result hasbeen confirmed by the second flight. Thisdetection was made by comparing thediffuse galactic flux measured in thenarrow band (AX - 0.16um) with the onemeasured in the wide band (AA. - 0.61|im).This emission feature was found to bepresent at all directions along thegalactic plane for the inner regions ofour Galaxy (in other directions the signalto noise ratio is not sufficient). Theaverage power measured, attributed to thefeature in the diffuse galactic planeemission is about 10" W m"2 sr"1. Thisvalue shows that the power radiated in theA. 3.3|xm feature by the galactic discrepresents a few 10"3 of the total powerradiated in the infrared and submillimeterrange from A. * O.Siim to X * 1 nun. Thefigure 2 shows the galactic infraredspectrum.
io' io2Lambda (micron)
10
Figure 2. Plot of the averaged A. . I A.surface brightness in the innerGalaxy (8.5° < 1 < 35°), |b|<l°)in the IR and submillimeterrange. Horizontal bars show theexperimental bandwidths if X. IX< 20, whereas vertical bars areerror bars. The two points at3.3|im are from AROME measure-ments (a wide and a narrow band-width ) . Other data are fromHayakawa et al. 1981 (2.4|im)(Réf. 45), Price 1980 (4.2(im)(Réf. 52), IRAS satellite (12,25, 60 and 100|im) and Caux andSerra 1986 ( 145 and 380|im )( Réf. 19). The insert show adetail of the AROME measure-ments. A typical observed pro-file of the 3.3(im aromatic fea-ture from Muizon et al. 1986(Réf. 53 ) has been scaled tomatch the data.
(Réf. 42).
The results obtained with the AROMEinstrument have been published (Réf. 43)in the form of two Milky Way maps forgalactic longitudes in the range (5°-35°)and galactic latitudes between -6° and+6°. The map obtained in the wide band (AX
0.61|im) related to the continuousemission at X 3.3|im is very similar tothose made at 2.4|im (Refs. 44-46) and itcan be attributed to starlight. The otherone in the narrow band (AX - 0.16|im)presents a very different spatialdistribution with intense spots in thedirection of Giant molecular Cloud/HiIregion complexes where the continuousemission is weak. In the direction of suchcomplexes the column-densities of theinterstellar matter increases. This factshows that the origin of the 3.3(im featureis correlated with the interstellar matterwhile the decrease of the continuousemission can be accounted for the galacticinterstellar extinction enhancement. Theanticorrelation between the respectivefluxes in the feature and in the continuumcan be seen, also, in the galacticprofiles as it is showed in the figure 3.
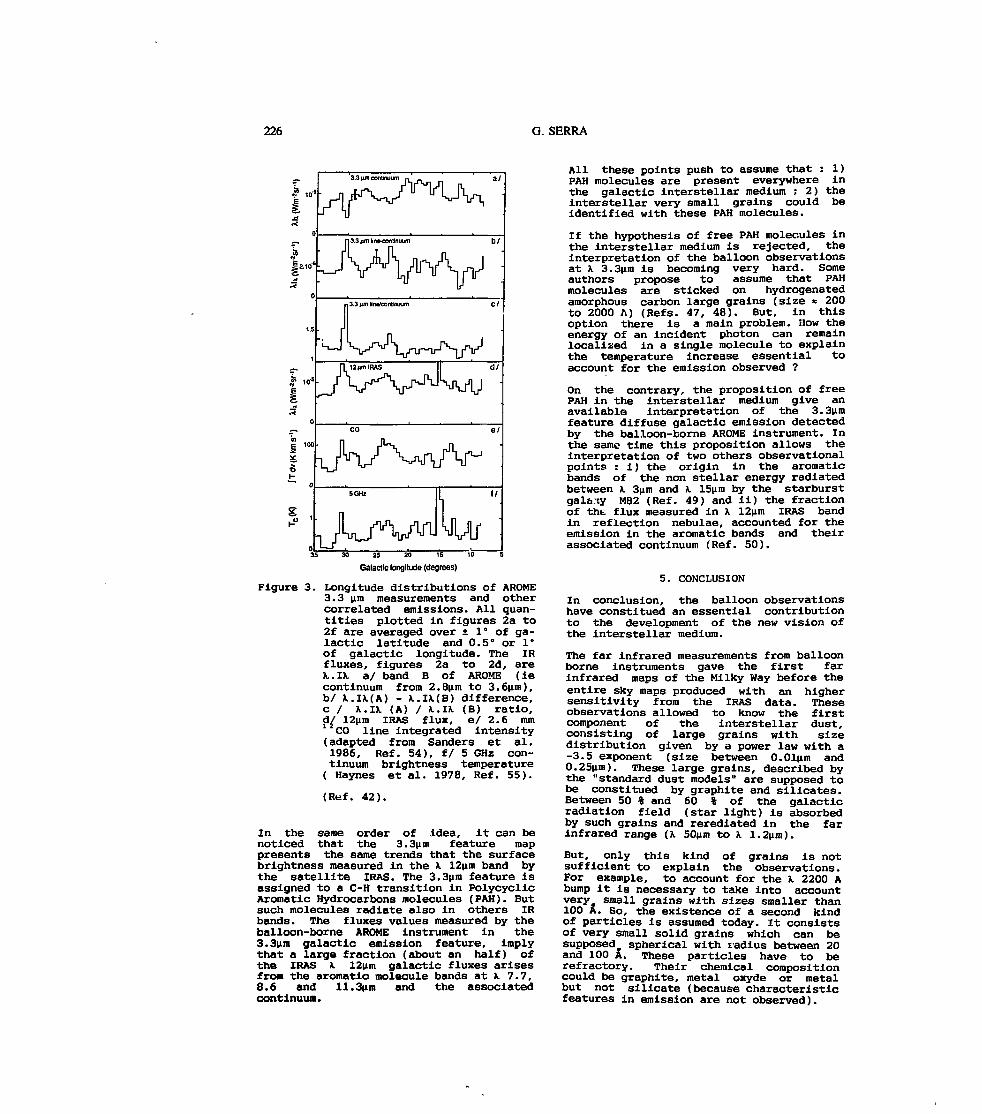
226 G. SERRA
3.3 IUn continuum
n 3.3 (am Int-conlinuum b/
n 3.3 jun intfcontinuum C/
e/
Galactic longitude (degrees)
Figure 3. Longitude distributions of AROME3.3 (ira measurements and othercorrelated emissions. All quan-tities plotted in figures 2a to2f are averaged over ± 1° of ga-lactic latitude and 0.5° or 1°of galactic longitude. The IRfluxes, figures 2a to 2d, areX. IX a/ band B of AROME (iecontinuum from 2.8|im to 3.6|im),b/ X.IK(A) - K.IX(B) difference,c / X.IX (A) / X.IX (B) ratio,d/ 12|im IRAS flux, e/ 2.6 nun1 CO line integrated intensity(adapted from Sanders et al.1986, Réf. 54), f/ 5 GHz con-tinuum brightness temperature( Haynes et al. 1978, Réf. 55).
(Réf. 42).
In the same order of idea, it can benoticed that the 3.3(im feature mappresents the same trends that the surfacebrightness measured in the X 12u.m band bythe satellite IRAS. The 3.3|im feature isassigned to a C-H transition in PolycyclicAromatic Hydrocarbons molecules (PAH). Butsuch molecules radiate also in others IRbands. The fluxes values measured by theballoon-borne AROME instrument in the3.3|im galactic emission feature, implythat a large fraction (about an half) ofthe IRAS X 12|im galactic fluxes arisesfrom the aromatic molecule bands at X 7.7,8.6 and 11.3|im and the associatedcontinuum.
All these points push to assume that : 1)PAH molecules are present everywhere inthe galactic interstellar medium ; 2) theinterstellar very small grains could beidentified with these PAH molecules.
If the hypothesis of free PAH molecules inthe interstellar medium is rejected, theinterpretation of the balloon observationsat X 3.3|im is becoming very hard. Someauthors propose to assume that PAHmolecules are sticked on hydrogenatedamorphous carbon large grains (size ~ 200to 2000 A) (Refs. 47, 48). But, in thisoption there is a main problem. How theenergy of an incident photon can remainlocalized in a single molecule to explainthe temperature increase essential toaccount for the emission observed ?
On the contrary, the proposition of freePAH in the interstellar medium give anavailable interpretation of the 3.3|imfeature diffuse galactic emission detectedby the balloon-borne AROME instrument. Inthe same time this proposition allows theinterpretation of two others observationalpoints : i) the origin in the aromaticbands of the non stellar energy radiatedbetween X 3|im and X 15|im by the starburstgala-ty M82 (Réf. 49) and ii) the fractionof thfc flux measured in X 12nm IRAS bandin reflection nebulae, accounted for theemission in the aromatic bands and theirassociated continuum (Réf. 50).
5. CONCLUSION
In conclusion, the balloon observationshave constituée! an essential contributionto the development of the new vision ofthe interstellar medium.
The far infrared measurements from balloonborne instruments gave the first farinfrared maps of the Milky Way before theentire sky maps produced with an highersensitivity from the IRAS data. Theseobservations allowed to know the firstcomponent of the interstellar dust,consisting of large grains with sizedistribution given by a power law with a-3.5 exponent (size between 0.01|im and0.25|im). These large grains, described bythe "standard dust models" are supposed tobe constitued by graphite and silicates.Between 50 % and 60 % of the galacticradiation field (star light) is absorbedby such grains and rerediated in the farinfrared range (X 50pm to X 1.2(jm).
But, only this kind of grains is notsufficient to explain the observations.For example, to account for the X 2200 Abump it is necessary to take into accountvery small grains with sizes smaller than100 A. So, the existence of a second kindof particles is assumed today. It consistsof very small solid grains which can besupposed spherical with radius between 20and 100 A. These particles have to berefractory. Their chemical compositioncould be graphite, metal oxyde or metalbut not silicate (because characteristicfeatures in emission are not observed).
INTERSTELLAR MEDIUM & GALACTIC IR EMISSION 227
But this two kinds of particles : verysmall grains and large grains, cannotexplain all the observations, particularlythe spectral bands emitted in the nearinfrared by the interstellar matter. Thisis the reason why it seems reasonabletoday to admit the existence of freePolycyclic Aromatic Hydrogeneous moleculeseverywhere in the interstellar medium.This new component could be clusters of 20to 100 Carbon atoms organised in planargraphitic structure with hydrogens atomsbonded with a part of the périphérieCarbon atoms. The size of such particlescould be between 3 and 10 A. The PAHmolecules would play an important role inthe interstellar chemical and physicalprocessus. 20 % of the interstellar Carbonatoms could be present in such PAHmolecules, giving at this component thelargest geometric area what could have anessential incidence on the interstellarchemistry. Aproximately 20 % of the powerradiated by the interstellar matter wouldbe emitted by PAH molecules.
To resume the present situation, it can besaid that a new vision of the Interstellarmedium is emerging today (see the reviewin Réf. 31). It results at least for alarge part from an increase of theinfrared measurements of the galacticemission. An extensive contribution hasbeen given using balloon-borne
instruments. In the years to come, the useof balloon-borne instruments will remainof importance in infrared andsubmillimeter astronomy. In particular theuse of large FIR and Submra telescope inballoons, is expected in the next two orthree years. Several such projects havebeen approved (for example, in France,PRONAOS) or are still in discussion.Another main contribution about theInterstellar Galactic Medium knowledge isalso expected from the next infraredastronomical satellites, particularly fromthe european project ISO.
REFERENCES
1. Bond J, Carr B J and Hogan C J 1966,ApJ 306, 428.
2. Ceccarelli C, Dall'oglio G,Oe Bernardis P, Masi S, Melchiorri B,Melchiorri F, Moreno G, Pietranera L1983, ApJ Lett 275, 39.
3. Matsumoto T, Hayakawa S, Matsuo H,Murahami H, Sato S, Lange A E,Richards P L 1988, ApJ 329, 567
4. De bernardis P, Masi S, Melchiorri F,Moreno G, Vannoni R, Aiello S 1988ApJ 326, 941
5. Masi S, Dall'oglio G, De bernardis P,De Santis E, Epifani M, Gionannozzi E,Guarini G, Melchiorri F, Boscaleria A,Natale V, Guidi I 1989 A & Ap to bepublished.
6. Pipher J 1973, IAU Symp 52, 559 (ed.Greenberg J M, Van de hulst H C)Reidel.
7. Serra G, Puget J L, Ryter C 1977,Symp. Recent Results IR Astro NASAAmes.
8. Low F J, Kurtz R F, Potest W M,Nishimura T 1977, ApJ 214, L115.
9. Serra G, Puget J L, Ryter C,Wijnbergen J J 1978, ApJ 222, L21
10. Maihara T, Oda N, Okuda H 1979, ApJ227, L129.
11. Serra G, Boisse P, Gispert R,Wijnbergen J J, Ryter C, Puget J L1979, A & Ap 76, 259.
12. Owens D K, Muehlner D J, Weiss R 1979,ApJ 231, 702.
13. Nishimura T, Low F J, Kurtz R F 1980,ApJ 239, LlOl.
14. Boisse P, Gispert R, Coron N,Wijnbergen J J, Serra G, Ryter C,Puget J L 1981, A & Ap 94, 265.
15. Gispert R, Puget J L, Serra G 1982,A & Ap 106, 293.
16. Caux E, Serra G, Gispert R, Puget JL,Ryter C, Coron N 1984 A & Ap 137, 1.
17. Houser M G, Silverberg R F, Stier M T,Kelsall T, Gezari D Y, Dwek E,Walser E, Mather J L 1984, ApJ 285,74.
18. Caux E, Puget J L, Serra G, Gispert R,Ryter C 1985, A & Ap 144, 37.
19. Caux E and Serra G 1986, A & Ap 165,L5.
20. The Astrophysical Journal 1984,March 1, Volume 278, NB-I, Part 2.
21. IRAS, Catalogs and Atlases,Explanatory Supplement, edited byBeichman C A, Neugebauer G, Habing H JClegg P E and Chester T J.
22. Perault M, Boulanger F, Puget J L,Falgarone E 1989, A & Ap, to bepublished.
23. Mezger P G, Mathis J S, Panagia N1982, A & Ap 105, 372.
24. Cox P and Mezger P G 1989,Astro £ Astrophys. Review, to bepublished.
25. Caux E, Solomon P, Mooney T 1988,Symp. Ames.
26. Caux E, Solomon P, Mooney T 1989,A & Ap, submitted.
27. Mathis J S, Rumpl W, Nordsiekc K H,1977, ApJ 217, 425.

228 G. SERRA
28. Draine B T and Lee H M 1984, ApJ285, 89.
29. Greenberg J M 1985, Birth andInfancy of Stars, p. 139, éd. Lucaset al., Elsevier Science Pub.
30. Tielens and Allamendola 1987IS Processes, 397, éd. Hollenbach Dand Thromson Reidel Pub.
31. Léger A and Puget J L 1989, to appearin Annual Review of Astronomy andAstrophysics.
32. Boulanger F and Perault M 1987, ApJ330, 964.
33. Pajot F, Boisse P, Gispert R, LamarreJ M, Puget J L and Serra G 1986,A 6 Ap 157, 393.
34. Andriesse C D 1978, A & Ap 66, 169.
35. Sellgren K 1984, ApJ 277, 623.
36. Puget J L, Léger A, Boulanger F 1985,A & Ap 142, L19.
37. Boulanger F, Baud B and Van Albada G D1985, A & Ap 144, L9.
38. Draine B T and Anderson M 1985, ApJ292, 494.
39. Gillett F C, Forrest W J, Merril K M,1977, ApJ 133, 87.
40. Duley W W and Williams D A 1981, MNRAS196, 269.
41. Léger A and Puget J L 1984 A & Ap 137,L5.
42. Giard M, Pajot F, Lamarre J M, Serra GCaux B, Gispert R, Léger A and Rouan D1988 A & Ap 201, Ll.
43. Giard M, Pajot F, Lamarre J M, Serra Gand Caux E 1989, A & Ap, in press.
44. Hayakawa S, Ito K, Matsumoto T andUyama K 1977, A & Ap 58, 325.
45. Hayakawa S, Matsumoto T, Murakani M,Uyama K, Thomas J A and Yamagami T1981, A & Ap 100, 116.
46. Oda N, Maihara T, Sugiyama T, Okuda H1979, A & Ap 72, 309.
47. Duley W W and Williams D A 1988, MNRAS231, 969.
48. Sakata A, Wada S, Tanabe T, Onaka T1984, ApJ 287, L51.
49. Willmer S P, Soifer B T, Russell R W,Joyce R R, Gillett F C 1977, ApJ 217,L121.
50. Ryter C, Puget J L and Perault M 1987,A & Ap 186, 312.
51. Price S D 1981, Astronomical Journal86, 193.
52. Price S D, Marcotte L P 1980, AnInfrared Survey of the diffuseemission within 5" of the galacticplane, AFGL-TR-80-0182.
53. Muizon M, Geballe T R, D'HendecourtL B, BAAS F. 1986, ApJ 306, L105.
54. Sanders DB, Clemens D P, ScovilleN Z, Solomon P M 1986, ApJ Sup 60, 1.
55. Haynes R F, Caswell J L, Simons L W J1978, Aust. J. Phys. sup. 45.
229
OPTICAL OBSERVATIONS OF INTERPLANETARY PICK-UP IONS: THE EXPERIMENT HELLY
H. J. Fahr G. Lay H. U. Nass
Institut fur Astrophysik und Extraterrestrische ForschungUniversitat Bonn, Auf dem Hugel 71, D-5300 BONN 1 (FRG)
ABSTRACT
Recently direct observations of both cometaryand interplanetary pick-up ions in the solar windplasma flow obtained by in-situ plasma analyzermeasurements have been reported by severalauthors. While in these cases very sophisticatedelectrostatic plasma-investigation techniques wereused for the detection of these halo ionpopulations, interesting observational studies ofsuch ions yielding complementary information arefeasible by appropriate EUV optical methods. Onthe basis of this idea we are conceiving a newrocket mission, called HELLY, which will bedevoted to the observation of solar HeII-304 Aphotons resonantly scattered at plasmaspheric andinterplanetary HeII ions. Such observations willbe carried out at the night side of the earth fromwhere a scan out of the sunlit part of theterrestrial plasmasphere into the antisolar coreshadow region can be carried out. The 304 A signalseen there is of extraterrestrial origin and itsstrength is sensitively determined by the shape ofthe velocity distribution function ofinterplanetary Hell-pick-up ions. In the followingwe shall describe in some detail the scientificobjectives of the HELLY mission.
1. INTRODUCTION
As is well known interstellar gas is flowingover the solar system. Its neutral componentmainly consists of H- and He-atoms that canpenetrate deeply into the inner region of theheliosphere before they will become ionized byphotoionization, electron impact ionization orcharge exchange. The originating ions are calledpick-up ions since immediately after theircreation they are picked up by the frozen-inmagnetic fields of the solar wind plasma flow andare convected radially outwards. First directobservations of such HeII pick-up ions convectedfrom regions inside 1 AU to the earth's orbit havebeen carried out by Mbbius et al.(Refs. 1,2,3).What concerns the differential energy flux ofthese ions and their distribution on the orbit ofthe earth these measurements can well beunderstood by the underlying theory (Refs. 4,5)yielding results shown in Figure 1. More difficultto explain, however, is their distribution in
velocity space, because relevant processes likepitch angle scattering, nonlinear energy diffusiondue to plasma-wave interactions, adiabatic coolingin diverging magnetic fields and possibly Coulombrelaxation processes interfere into the businesswith unclear relative importance. .The resultsobtained by Mobius et al. (Refs.1,2,3) for ionscoming from inside 1 AU seem to allow for theinterpretation that mainly energy-conservingpitch-angle scattering and adiabatic coolingprocesses are of importance, however, at largerdistances nonlinear wave-particle interactionsshould systematically increase their relativeimportance (Réf. 6). In addition it is not yetclear how complete the toroidal seed particledistribution is converted into a spherical shelldistribution by pitch angle scattering. On theother hand it is just this phenomenon thatsubstantially counts for the resonant scatteringproperties of HeII ions, because only ions whichare Doppler shifted from the center of the solarHell-Ly-a line by less than 100 km/s are able toeffectively scatter solar line photons. Thus intheir initially toroidal distribution ions, sincemoving relatively slowly with respect to the sun,are in a favorite mode for resonant scattering,whereas the major part of the spherical shelldistribution population, due to the high solarwind bulk velocity of about 400 km/s, is unable toscatter line photons. The degree of "spherization"of the distribution function is thus sensitivelyreflected in the intensity of the interplanetary304 A glow. Looking antisolar from an upwindposition of the earth, one could expect to see aninterplanetary 304 A glow intensity of 0.35Rayleigh, if all interplanetary HeII ions would beat rest with respect to the sun, whereas theresulting intensity would only amount to S.S-10"S
Rayleigh for HeII ions moving antisolar with thesolar wind bulk velocity of about 400 km/s (seee.g. Réf.7). Thus vie are stressing the point herethat a measurement of the absolute intensities ofthe 304 A interplanetary glow would give clearindications for the velocity space behavior of theinterplanetary HeII pick-up ions.
2. MISSION PERFORMANCE
In an earth-bound observation, either by rocketor by satellite, it is hardly avoidable to see an
PTOC. Ninth ESAIPAC Symposium on 'European Rocket and Balloon Programmes and Related Research', Lahnstein, FRG, 3—7April 1989(ESA. SP-291, June 1989)

29 230 H.J. FAHR, G. LAY & H.U. NASS
IAU
30 eo 90 120 150 180
Figure 1. Shown are total interplanetary He pick-up ion fluxes for a varyingposition with respect to the interstellar wind vector at the orbit of theearth. For underlying theory and LlSM parameters see Réf. 5.
PLASMAPAU;;ELOS
Figure 2. Schematic illustration of 304 Aobservations carried out from an earth-boundposition (High altitude rocket or satellitein low circular orbit, e.g. small typeExplorer- class).
He 11-resonance glow. This terrestrial radiationcomponent is due to HeII ions of the ionosphereand of the plasmasphere that are resonantlyexcited by direct s<~ .ar 304 A line emission. Sincethese terrestrial plasma regions are opticallythin in 304 A, the terrestrial signal only appearsin the registrations when the line of sight of theinstrument passes through the sunlit />art of theseregions (see Figure 2). In an experiment carriedout with the Berkeley EUV-telescope from theApollo-Soyuz spacecraft in a 215 km circular
-~ 0.80Ol;§o 0.60
0.000.02 R
! I ' l l
800 I20O 1600 20OO 2400
UT (Seconds)
Figure 3. Shown versus time are 304 A glowintensities observed with the EUV telescopeof the SAG (Berkeley) on board ofApollo-Soyuz (Réf.7) and the correspondingvariations of D and R, the length of the lineof sight within the sunlit plasmasphere andthe distance on the line of sight to theterminator shadow.
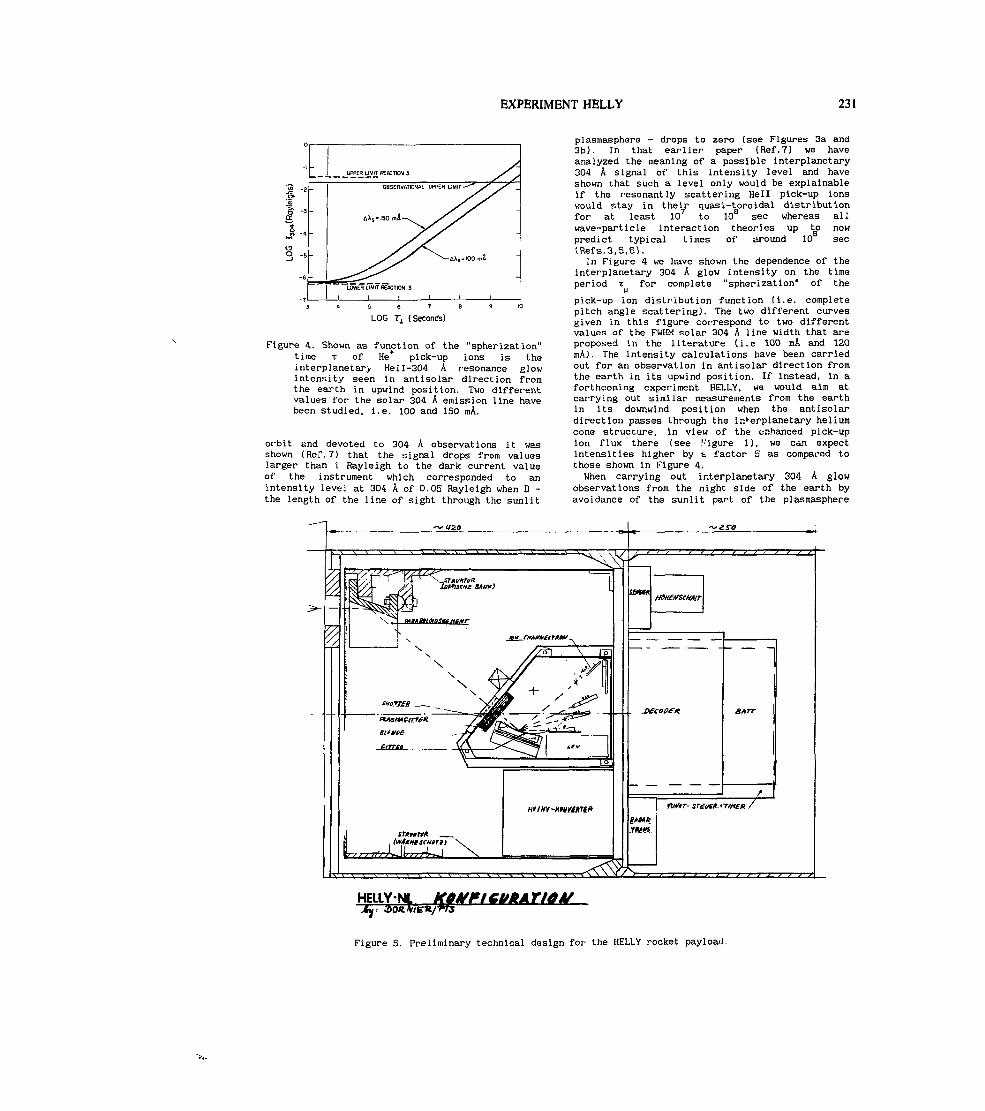
EXPERIMENT HELLY 231
LOG T1 (Seconds)
Figure 4. Shown as function of the "spherization"time T of He+ pick-up ions is theinterplanetary HeII-304 A resonance glowintensity seen in antisolar direction fromthe earth in upwind position. Two differentvalues for the solar 304 A emission line havebeen studied, i.e. 100 and ISO mA.
orbit and devoted to 304 A observations it wasshown (Réf.7) that the signal drops from valueslarger than 1 Rayleigh to the dark current valueof the instrument which corresponded to anintensity level at 304 A of 0.05 Rayleigh when D -the length of the line of sight through the sunlit
plasmasphere - drops to zero (see Figures 3a and3b). In that earlier paper (Réf.7) we haveanalyzed the meaning of a possible interplanetary304 A signal of this intensity level and haveshown that such a level only would be explainableif the resonantly scattering HeII pick-up ionswould stay in their quasi-toroidal distributionfor at least 10 to 10 sec whereas allwave-particle interaction theories up to nowpredict typical times of around 10 sec(Refs.3,6,6).
In Figure 4 we have shown the dependence of theinterplanetary 304 A glow intensity on the timeperiod T for complete "spherization" of the
pick-up ion distribution function (i.e. completepitch angle scattering). The two different curvesgiven in this figure correspond to two differentvalues of the FWHM solar 304 A line width that areproposed in the literature (i.e 100 mA and 120mA). The intensity calculations have been carriedout for an observation in antisolar direction fromthe earth in its upwind position. If instead, in aforthcoming experiment HELLY, we would aim atcarrying out similar measurements from the earthin its downwind position when the antisolardirection passes through the interplanetary heliumcone structure, in view of the enhanced pick-upion flux there (see .r;igure 1), we can expectintensities higher by & factor 5 as compared tothose shown in Figure 4.When carrying out interplanetary 304 A glow
observations from the night side of the earth byavoidance of the sunlit part of the plasmasphere
Figure 5. Preliminary technical design for the HELLY rocket payload.

232 HJ. FAHR, G. LAY & H.U. NASS
within the angle of acceptance of our instrumentwe are left with a cone of a FWHM width of 35°within which we can monitor the interplanetaryradiation field. With an angle of view'of about 5°FWHM we thus would have the chance to nicelyresolve the interplanetary isophotal 304 A glowpattern around the helium cone region reflectingthe pick-up He ion behavior there.
In order to effectively work out from the abovementioned observations a confident number forthese times one had to measure the interplanetary304 A radiation by instruments with an intrinsicdark current rate corresponding to 304 Aintensities of much lower than 0.01 Rayleigh, Withthe instrumentation shown in Figure 5 andconceived for the forthcoming HELLY mission we areaiming at lower intensity limits of 10" to 10~Rayleigh enabling an affirmative determination ofpitch angle scattering periods T of HeII pick-up
C ^ions down to 10 sec.In Figure 5 we are showing the EUV
instrumentation planned for the HELLY rocketexperiment. By a large collecting paraboloidmirror segment the EUV radiation from a 5° fxngleof view is focused through an entrance slit undergrazing incidence conditions onto a concavegrating system from where the differentwavelengths are forwarded to their specificpositions on the associated Rowland circle. At thepositions where the wavelengths HI-1216 A, 011-834A, HeI-584 A, and HeI 1-304 A are focusedchanneltron detectors are placed. In order toenhance selectively the efficiency by which 304 Aphotons are forwarded to their detector thegrating (Jobin Yvon) will be blazed for thewavelength 304 A yielding a specific gain at 304 Aby a factor of 1.5 with respect to the unblazedgrating.
Acknowledgement •We gratefully acknowledge many helpful and
fruitful discussions on the possible technicalHELLY experiment design which we had with thefirms Dornier (Friedrichshafen) and PTS(Freiburg).
REFERENCES
1. Mbbius E D, Hovestadt D1 Klecker B,Scholer M, Glockler G & Ipavich I M 198S,
Direct observations of He pick-up ions ofinterstellar origin in the solar wind, Nature318, 426-4??
2. Mobius E D, Hovestadt D, Klecker B1Schole* M, GlbV/.ler G, Ipavich I M & Luhr H1986, Obser-'dt'on of lithium pick-up ions inthe 5-20 !'pV energy range, J.Ceophys.Res. 91,1325-1332
3. Mobius E D, Klecker B, Hovestadt D &Scholer- M 1988, Interaction of interstellarpick-up ions with the solar wind,Astrophys.Space Science 144, 487-493
4. Rucinski D 8. Fahr H J 1989, The influence ofelectron impact ionizations on thedistribution of interstellar helium in theinner heliosphere, Astron.Astrophys., in press
5. Fahr H J & Rucinski D 1989, Modelling of theinterplanetary pick-up ion fluxes andrelevance for the LISM parameters,Planet.Space Science, in press
6. Fahr H J & Ziemkiewicz J 1988, The behaviorof distant heliospheric pick-up ions and theassociated solar wind heating,Astron.Astrophys. 202, 295-305
7. Paresce F, Fahr H J & Lay G 1983, A searchfor interplanetary HeI1-304 A emissions,J.Geophys.Res. 86, 10038-10048
C C? (Ml 233
INTERPLANETARY DUST CLOSE TO THE SUN (F-CORONA): ITS OBSERVATIONIN THE VISIBLE AND INFRARED BY A ROCKED-BORNE CORONAGRAPH
B.KneijSel I.Mann H. van der Meer
Bereich Extraterrestrische PhysikRuhr - Universitàt Bochum
D - 4630 Bochum
ABSTRACT
The observation of the F - Corona providesa favourable opportunity for studying theannihilation and creation of dust withincircumstellar dust clouds in detail. Thevarious kinds of dust show specific pat-terns of scattering light and thermal ra-diation in the infrared. A dedicatedspace-borne remote sensing experiment re-garding the radiation properties of dustin the visible for scattered sunlight andin the infrared for the thermal emissionof grains permits the analysis of thiscomplex scenario. Thus a rocket-borne twincoronagraph is now under design at theBereich Extraterrestrische Physik inBochum.
Keywords: F - Corona, optical and infraredproperties of dust, dynamics of interpla-netary dust, coronagraphs
1. INTRODUCTION
Within the recently increasing interest inthe solar environment also interplanetarydust surrounding the sun on close orbitseffecting the Fraunhofer-Corona (distanceto Sun smaller than 20 solar radii) hasraised attention. So a rocket-borne coro-nagraph observing the Fraunhofer-Corona inthe visible and infrared spectral range isnow under development at the BereichExtraterrestrische Physik.
2. THE F-CORONA WITHIN THE ECOLOGY OF THEMETEORITIC COMPLEX
The investigation of dust close to the Sunprovides the possibility of studying pro-cesses detailed which are fundamental forthe dynamics of circumstellar dust clouds.Interplanetary dust is created either bycollisions of minor planets in the aste-roid belt or by outgassing of comets du-ring their perihelion passage. Theseparticles then spiral into the inner the
solar system under the decelarating dragof Poynting-Robertson effect (passage timeabout 10.000 years) (Refs. 3,8). Withinthat passage interplanetary dust between10 and 100 micron in size gives the zodia-cal light by scattering of sunlight. Closeto the Sun (less than 0.1 AU solardistance) increasing collisions comminutethe particles (Réf. 2) thus resulting intothree populations: saved big zodiacalparticles and two populations of smallparticles (about less than 1 micron insize), one of transparent (i.e.silicate)and the other one of absorbing(i.e.graphite) nature.
Every population has its own dynamicaccording to the strength of radiationpressure and gravitational force. As smallsilicate particles are transparent theyare dominated by gravitational forces incontrast to the big zodiacal particles andsmall absorbing grains, on which bothforces effect (Réf. 7). Thus silicateparticles stay close to the sun, wherethey completely sublimate. Also bigparticles are sublimated close to the sun.But small absorbing particles are blownoff the solar system because of radiationpressure.
Furthermore the orbits of the particlesare affected by the perturbing forces ofthe interplanetary magnetic field on thecharged dust grains (Réf. 6). In the caseof the big zodical dust grains this wouldlead to an increase of inclinations thusresulting into a more spherical shape ofthe dust cloud close to the sun incomparison to the global zodiacal dustcloud.
3.REMOTE SENSING OF INTERPLANETARY DUSTCLOSE TO THE SUN
Remote sensing of interplanetary dustclose to the sun means observing thebrightness from all radiating componentsspent alony the observer's line of sight:
Proc. Ninth ESA/PAC Symposium on 'European Rocket and Balloon Programmes and Related Research ', Lahnstein, FRC, 3—7 April 1989(ESA SP-291, June 1989)

234 B. KNEISSEL, I. MANN & H. VAN DER MEER
!.atmospheric molecules and aerosols,2.dust in the global zodiacal cloud,3.three components of dust populationsclose to the sun, 4.in case of white lightobservations an additional component fromscattering at electrons (K- Corona).
As contamination of the signal byatmospheric contributions is avoided bythe use of a space-borne coronograph (cf.as here proposed an instrument mounted ona sounding-rocket), the other radiatingcomponents still have to be disentangledfrom each other by their characteristicradiation properties.
The scattering properties of dust aredescribed by their effectiveness ofscattering light in dependence from scat-tering angle (scattering function) andwavelength (colour of scattered light).Typically one can find for the run ofscattering functions in the case of bigparticles an enhancement for back-scattering due to their regolith like sur-face structure. In contrast to the blue-ning of scattered light from small par-ticles known to be the the Rayleigh-effeetmany big particles of extraterrestrialmaterial show a reddening. But very signi-ficant for the specific physical pro-perties of dust is the scattering angledependent run of polarization. Cf. smallabsorbing (magnetite or graphite) grainsreach maxima of about 80 % at scatteringangles around 90 degrees, for small sili-cate grains the polarization pattern runsvery flat, whereas zodiacal particles showa moderate polarization of about 30 % atrectangular scattering.
The thermal radiation of dust is mainlydescribed by their spectral run in the in-frared following a Planck-function deter-mined by the grains temperature. Big zo-diacal particles in general are supposedto radiate as blackbodies, small graphitegrains should have temperatures appre-ciatly higher than blackbodies, and final-ly small silicate grains deviate in theirtemperatures from a blackbody. Furthermorewill show the so-called silicate-featureat 10 microns.
The difficulties of disentanglement be-tween these different components will in-crease considerably if one is referred toobservations in the near infrared between1-5 microns. In this wavelength domain asuperposition from scattered sunlight andthermal emission is indicated. So in thevisible one only has to take scatteredcomponents into account, and in the mid-infrared only thermal emission.
4.EXISTING OBSERVATIONS
In the visible wavelength range there havebeen a lot of observations from eclipsesand space-borne instruments, but they areall faced with the difficulties of sepera-
ting between dust and plasma. So one stillhas to rely on the separation made byBlackwell et al. (Réf. 1) using the depthof Fraunhofer-lines in the white-light ra-diation as a criterion. Concerning the po-larization detected in the whitelight co-rona there are discrepancies for largerobservational elongations (more than 7solar radii) reaching a factor more than 2(Réf. 5).
Observations in the infrared are mainlyrestricted to small observational elon-gations (about 4 solar radii) and to theunfavourable 2 micron wavelength region.Only a few observations, in disagreement,have measured the thermal emission of dustat 10 micron wavelength band (Réf. 5).
5. CONCEPT OF A ROCKET-BORNE TWINCORONOGRAPH
Thus a synoptic observation of the coronain the visible and infrared is needed.Such a goal is aimed by a rocket-bornetwin coronagraph observing the solarcorona in the infrared and in the visiblewhich is under design at the BereichExtraterrestrische Physik. This instrumentwill consist of two externally occultingcoronagraphs, where external occulting isprovided by a set of three disks coveringthe sun in front of tf.3 entrance aperture(Réf. 4). The proposed capabilities of theinstrument are listed in the table 1.
Table 1.
Properties of the twin coronagraph
visible infrared
field ofview:
spectralrange
resolution:
opticalsystem:
3.5 to 15 solar radii
colours:V,R,I
15' '
5-15 microns
30'
refractive reflective
Whereas the design of the visible branchcan be confirmed already, the infraredinstrument is at the beginnig.
6.CONCLUSIONS
As this scenario of annihilation and crea-tion of dust close to the sun is so com-plex in its dynamics itself and hard todisentangle from remote sensing the com-bined observation of as many as possiblequantities is needed. This is most favour-able provided by a synoptic coronagraph,which is dedicated to the solution ofthese specific problems.

(ESA SP-291. June 1989)
INTERPLANETARY DUST CLOSE TO SUN
R/SOLAR KAOII
SUBLIMATION OFABSORBINC; PARTICLES
U-METEORITE
Figure 1. Sublimation zones of threedust populations (shaddedareas) close to the sun.
7.REFERENCES
1. BLACKWELL D E et al 1967, The ZodiacalLight,Adv.Astron.Astrophys. 5, 1-69
2. GRUN E & ZOOK H A 1980, Dynamics ofMicromateoroids, Solid Particles in theSolar System, Dordrecht, Reidel, 293 -298
235 /
3. GRUN E et al 1985, Collisional Balanceof the Meteoritic Complex, ICARUS 62,244 - 272
4. KOOMEN M J et al 1975, White LightCoronograph in OSO - 7, Appl. Opt. 14,743 - 751
5. KOOTCHMY S & LAMY P L 1985, The F-Corona and the Circum - Solar Dust.Evidences and Properties, Propertiesand Interactions of InterplanetaryDust, Dordrecht, Reidel, 63 - 74
6. MORFILL G E & GRUN E 1979, The Motionof Charged Dust Particles in Inter-planetary Space - I. The ZodiacalCloud, Planet. Space Sci. 27, 1269 -1282
7. SCHWEHM G H & ROHDE M 1977, DynamicalEffects on Circumsolar Dust Grains, J.Geophys. 42, 727 - 735
8. WHIPPLE F L 1967, On Maintaining theMeteoritic Complex ,Zodiacal Light andthe Interplanetary Medium, NASA SP -150, 409 - 426
237
DEEP DETECTION OF HOT STAR POPULATIONS AT BALLOON ULTRAVIOLET WAVELENGTHS
B. Milliard^», M. LagetW, J. Donas<l>, D. BnrgareliaW, H. MoulinecW, D. HugueninW
Laboratoire d'Astronomie Spatiale, Les Trois Lues, 13012 Marseille FranceObservatoire de Gen«ve, Sauverny, Suisse
ABSTRACT
As part of an on-going deep-sky imaging programmededicated to hot stellar population studies, a total of KtSO sq. deg. of the sky has been observed with a 40-cmballoon borne telescope. With a limiting visual mag-nitude above 20 for blue objects and an in-flight imageresolution of 13 arcsec the bulk of the observations con-cern SeId galaxies, cluster of galaxies and a few galacticglobular clusters. An automated reduction techniqueallows numeric summation of night sky Imited individ-ual exposures to reach an equivalent observing timewhich may reach one hour. Results concerning thespace distribution of horizontal branch stars up to thecentral part (> 1 arcmin) of the globular cluster M13and the star formation activity of galaxies member ofthe cluster Abell 1367 are presented.
Keywords : UV Astronomy - Galaxies - Globular clus-ters - A1367 - M13 - Star formation - Horizontal Branchstars -
1. INTRODUCTION
In the frame of a continuing long term intermediatecost program, the repetitive flights of a balloon-bornedeep sky imaging ultraviolet 40 cm telescope have pro-duced a significant set of data relevant to hot starpopulations studies, with special emphasis on stars inglobular clusters and on galaxies located in low-redshiftclusters. With a limiting visible magnitude above 20and an in-flight image resolution of 13 arcsec, most ofthe objects investigated are out of reach from existingspectroscopic space instruments in this spectral region(IUE), and only a limited sample of such objects hasbeen observed by rocket flights. Similar observationshowever, in the far ultraviolet, are part of the plannedASTRO mission on the space shuttle.The hot star populations in stellar systems, which cor-respond to critical, short-lived phases in stellar evolu-tion, are of spécial interest for the understanding ofstar formation phenomena in galaxies and of the finalstages of stellar evolution. In star forming galaxies,the ultraviolet fluxes are proportional to the intensity
of the star formation. A sufficiently large sampling isa way to relate physical parameters to the prominantmechanism that possibly triggers large scale star for-mation. In old, evolved objects like globular clustersor elliptical galaxies, the faint hot evolved stars candominate the ultraviolet fluxes; this allows a preciseevaluation of their numbers and individual ultravioletfluxes, which put constraints on models for stellar evo-lution.
2. THE EXPERIMENT, OBSERVATIONSAND DATA REDUCTION
The FOCA experiment is a second generation 40 cmaperture imaging ultraviolet telescope, placed on-boarda 4 arc sec rms stabilized gondola (Huguenin, thisconference). A 1.5 deg field of view is imaged atw 200nm wavelenghth on an ITT 40 mm diametersealed MCP intensifier with a CsTe photocathode fibre-coupled with to a HaO emulsion on film support.The « 6 hours cumulated effective observing time atnominal performance, covering a total of « 50 squaredegrees, have been devoted to 3 open clusters, 2 glob-ular clusters, 7 individual well resolved nearby galax-ies, 5 clusters of galaxies and 2 low extinction regionsnear the galactic pole. An automated software pack-age with secure checkpoints has been developed on aVAX 11/780 computer using the Munich !mage DataAnalysis System (MIDAS) to numerically superimposethe multiple, maximum DQE exposures of the astro-nomical targets required to balance the still limitedsize of the telescope. The software was also primarilydesigned to give linear intensity maps of the observedfields, corrected for classical instrumental effects (flat-flelding, distortion, ion noise correction,...) and a pho-ton noise limited photometry of the resolved and unre-solved objects, even in the presence of variable imagequality across the field; the equatorial coordinates ofthe detected objects are based on those of the severaldizains per field in common with the Guide Star Cat-alog (Space Telescope Science Institute), and specialattention has been put to identify candidates in on lineastronomical catalogues (CDS, STARCAT) or special-ized papers.
Proc. Ninth ESAIPAC Symposium on 'European Rocket and Balloon Programmes and Related Research ', Lahnstein, FRG, 3—7 April 1989(ESA SP-291, June 1989)
237 238 B. MILLIARD ET AL.
The final product of the software for each field is a ta-ble of the detected objects with equatorial coordinates,ultraviolet relative fluxes, candidate identifications incatalogues, aud a set of calibration constants for abso-lute fluxes; the last rest on existing ultraviolet measuresin the field and on visible observations via star modelatmosphere calculations and a synthetic instrumentalbandpass. The internal dispersion is found near 0.16mag r.m.s. on a sample of artificial vacuum tank starscovering a range of 8 magnitudes.
3. RESULTS
3.1 The cluster of galaxie» Abell 1367
This nearby irregular little evolved galaxy cluster hasbeen observed 20 minutes in the spring of 1987. Morethan one hundred galaxies identified in the catalogueof Godwin and Peach (1982) have been detected inthe V magnitude range 13.5 to 20.5. After correctionfor galactic and internal extinction, the observed inte-grated fluxes of the 27 member galaxies with measuredHI mass have been translated in total star formationrates (SFR) using techniques similar to those used fora sample of isolated galaxies observed with a smaller,1st generation instrument (Donas et al., 1987). A goodcorrelation is found between the SFR per surface unitand the neutral gaz surface density of the cluster galax-ies, which extends to lower densities the correlation al-ready observed for the isolated galaxies sample. Themedian gaz time depletion scale, evaluated as the gazmass divided by the total SFR is found lower in thecluster than in the field, suggesting a more efficientstar formation in A1367 than in the field.
3.2 The globular clutter M13
The galactic globular cluster M13 is the second direc-tion for which the data (equivalent integration time of« 800 sec) have been reduced ; this is the first fullimage of a globular cluster at ultraviolet wavelengths.The major findings presently under discussion concernthe detection of the entire sequence of hot stars knownas Horizontal Branch (HB) down to a central radiusof » 1 arcmin ; subdwarf stars are also accessible inthe outer part of the cluster. The surface distributionof HB stars shows a more concentrated profile thanthe red giants stars observed in visible light, providingevidence for a possible radial mass segregation. The(2000-V) vs (B-V) color-color diagram of HB shows afew exotic cases under analysis seen in contrast withthe little dispersion (a few tenths) observed of the ul-traviolet color. A total of « 400 horizontal branch starsare measured.
4. CONCLUSION
The observed performance and reliability of threeyears flights with the experiment FOCA emphasizethe unique opportunity to perform deep-sky ultravi-olet imagery at moderate cost from balloon-borne in-struments, at a sensitivity level not currently achievedby operating space experiments.
5. REFERENCES
1. Godwin 3 G, Peach 3 V 1982, M N R A S 1 200.733.2. Donas 3, Deharveng 3 M, Laget M, Milliard B and
Huguenin D 1987, Astronomy it Astrophysics, 180,12.
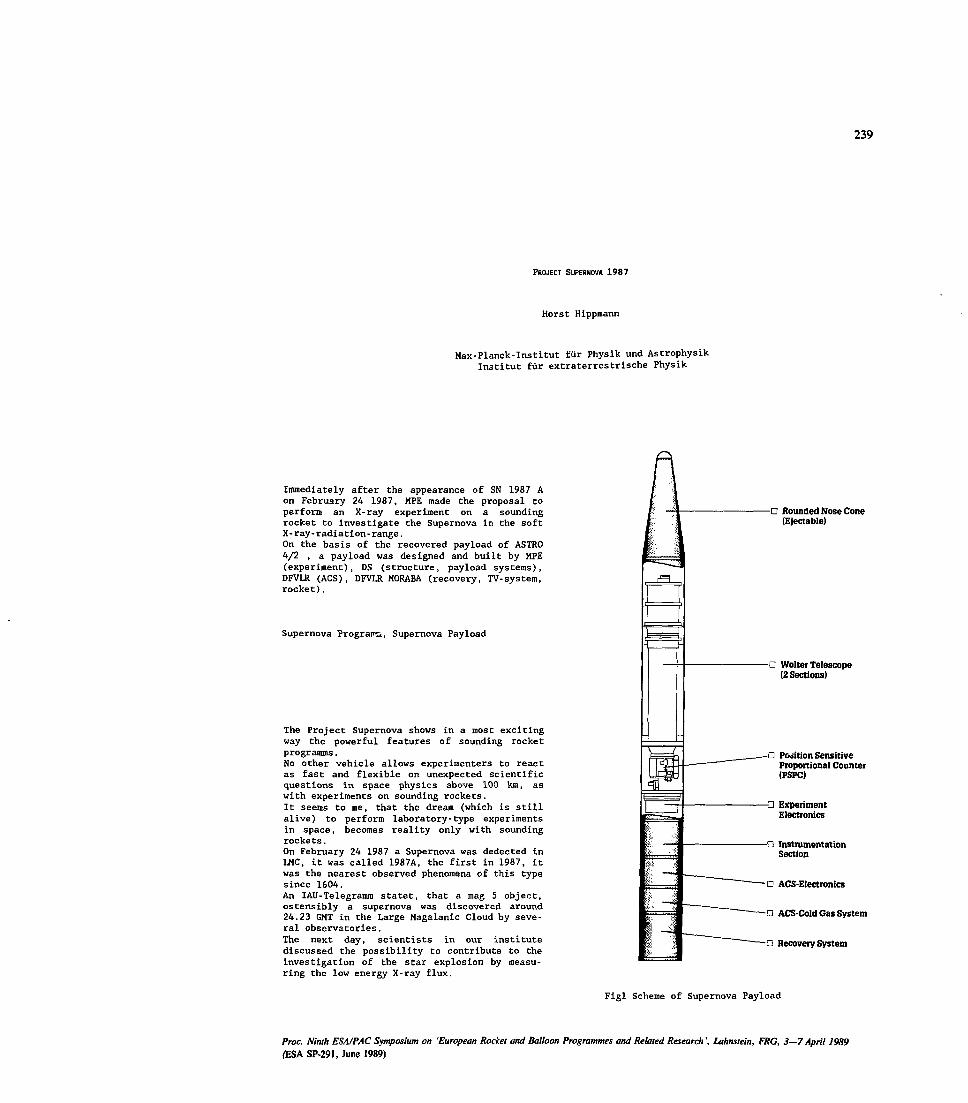
239
PROJECT SUPERNOVA 1987
Horst Hippmann
Max-Planck-Institut fur Physik und AstrophysikInstitut fur extraterrestrische Physik
Immediately after the appearance of SN 1987 Aon February 24 1987, MPE made the proposal toperform an X-ray experiment on a soundingrocket to investigate the Supernova in the softX-ray-radiation-range.On the basis of the recovered payload of ASTRO4/2 , a payload was designed and built by MPE(experiment), DS (structure, payload systems),DFVLR (ACS), DFVLR MORABA (recovery, TV-system,rocket).
Supernova Programs, Supernova Payload
The Project Supernova shows in a most excitingway the powerful features of sounding rocketprogramms.No other vehicle allows experimenters to reactas fast and flexible on unexpected scientificquestions in space physics above 100 km, aswith experiments on sounding rockets.It seems to me, that the dream (which is stillalive) to perform laboratory-type experimentsin space, becomes reality only with soundingrockets.On February 24 1987 a Supernova was dedected inLMC, it was called 1987A, the first in 1987, itwas the nearest observed phenomena of this typesince 1604.An IAU-Telegramm statet, that a mag 5 object,ostensibly a supernova was discovered around24.23 GMT in the Large Magalanic Cloud by seve-ral observatories.The next day, scientists in our institutediscussed the possibility to contribute to theinvestigation of the star explosion by measu-ring the low energy X-ray flux.
D Rounded Nose Cone(Ejectable)
n Woltei Telescope(2 Sections)
a Position SensitiveProportional Counter(PSPC)
O ExperimentElectronics
D InstrumentationSection
D ACS-Eleetronics
—n ACS-CoId Gas System
D Recovery System
Figl Scheme of Supernova Payload
Proc. Ninth ESAIPAC Symposium on 'European Rocket and Balloon Programmes and Related Research ', Lahnstein, FRG, 3—7 April 1989(ESA. SP-291, June 1989)

240 H. HIPPMANN
The payload from project Astro IV-2, success-fully flown and recovered on February 22 1979in Woomera South Australia, seemed suitable fora reflight within the next half year.Management in the institute looked for colabo-ration and money.DFVLR HORABA was asked about launch possibili-ties, telemetry, command control and recovery,DFVLR (angewandte Datentechnik) was contactedfor attitude control, Dornier System was con-tacted to look into the refurbishment of theinstrumentation, DFVLR-PT was asked to financethe project.The first Meetings with all parties envolvedwere helt in late March 1987, the payload waslaunched 5 month later on August 24 from Woo-mera South Australia.
The time in between was filled with many acti-fities:A first technical meeting on march 20 was fol-lowed by a management meeting with DFVLR PT aweek later.All parties started work immediately.DFVLR looked for a rocket and found it in ascheduled programm of Dr. Fahr, who gave uphis launch opportunity in late 1987, we thankhim for that. Negotiations with the Australianauthorities through the German government anddirectly in a meeting end of April, lead to thereopening of the Woomera Range, which was clo-sed in 1979 right after Astro IV. The contractwas signed two days before launch after only 3month of negotiations.The legal difficulties with safety and securityon the range were worked on by MORABA togetherwith the German government and, especially inthe field of skylark safety, the Swedish SpaceCorporation.We sent the formal request to finance the pro-gramm after collecting all the costs on Mai 15to BMFT and got the official OK in time.Some important milestones for the hardwarewere:
-Payload refurbishmentApril 15 to June 3
-ACS devlopment and testApril 15 to June 23
-Instrumentation RefurbishmentApril 15 to Mai 18
-IntegrationJune 24 to July 16
-Sea TransportJune 1
-Air TransportJuly 20
-LaunchpreparationAugust 3 to August 26
-LaunchAugust 24.69 GMT
-Publication of Scientific ResultsLetter August 25Paper November 19 (Nature)
The payload launched, consisted of the mainparts of Astro IV-2.The payload skin was painted, a new noseconewas built. The telescope was refurbished andcalibrated in the X-ray test facility of MPE.The instrumentation was tested, batteries werechanged, the telemetry frequency was alteredfrom P-band to S-band with new transponder andantennas. The Attitude Control System (ACS) wasredesigned using the old (17 years) ITT startracker, two commercial TV cameras and a new S-
band command control system. A new recoverysystem was integrated.The payload measured 5,5 m and weighed 316 kg.The Skylavk 7 rocket (8 m long and 2020 kg),carried the payload to an altitude of 260 kmand allowed a total measuring time above 100 kmof 250 sec on LMC-Xl (10sec) and Supernova 1987A (240 sec). The payload was recovered the dayafter launch.By looking at the recovered Raven motor, wefound out, that the launch was a very luckysuccess, because the motor has been close toburn through inspite the fact, that it was mo-dified before launch triggered by the Texus-15launch failure in early 1987.
Fig 2 Launch of Supernova Payload
Fig 3 Recovered payload
ConclusionAstronomical X-ray experiments request conditi-ons, which sounding rockets are not especiallysuited for:
lo-.g observation timelow particle background.
This programm however, showed, that soundingrockets offer possibilties offerded by STS inthe early days and never came true, the possi-bility to react fast on unexpected phenomena.The result of the Supernova experiment is, af-ter 2 years, still the best measurement in thisenergy band.

241
THE X-RAY MIRROR AND THE PSPC OF THE SUPERNOVA - ROCKET - PROJECT
U. G. Briel, E. Pfeffermann, H. Brauninger, W. BurkertG. Kettenring, and G. Metzner
Max-Planck-lnstitut fur Fhysik and AstrophysikInstitut fur extraterrestrische Physik
8046 Garching, FRG
ABSTRACT
For the German Supernova-rocket-project, the Astro 4/2scientific payload was refurbished and recalibrated inour institute. The payload consists of a 32 cm X-raytelescope with a focal length of 143 cm and an effectivecollecting area of 23 cm2, and a position sensitive pro-portional counter (PSPC) with an aperture of 23 mm,corresponding to a FOV of 50 arc min. The PSPC wasdesigned for an energy range from 0.2 to 2,0 keV andhas an energy resolution of 45% (FWHM) at 1 keV. Itspositional resolution is 300 [im (FWHM), also at 1 keV.The half power width of the telescope - detector combi-nation is approximately 1.4 arc min. With its high quan-tum efficiency and its good background rejection ofabout 95%, the PSPC is especially suited for low surfacebrightness extended X-ray sources, such as the newsupernova SN1987 A.
1. INTRODUCTION
sitive proportional counters (Réf. 8). Our rocket typePSPC had a sensitive circular area of 30 mm diameter(later reduced to 23 mm). Based on this detector wethen developed a PSPC with a window diameter of 80mm for the ROSAT telescope (Refs. 9, 10).We had two successful rocket flights of the 32 cm te-lescope with the PSPC in 1979 and 81, obtaining spec-traly resolved X-ray images of the supernova remnantsPuppis A, Cas A, and the Crab nebula (Refs. 11, 12, 13).
After the outburst of the supernova SN1987 A in Feb.1987, we discussed a refurbishment of the now already 8years old rocket payload in order to search for soft X-rays from SN1987 A. Because of several constraints, weconcluded that this could only be done in a very shorttime scale. It was then planned, prepared, organized,financed, and carried out within 5 months. This waspossible only with the effective cooperation of theGerman BMFT, the Australian DITAC, the DFVLR secti-ons in KoIn and Oberpfaffenhofen, and Dornier System.
The development of imaging X-ray telescopes and de-tectors is an ongoing program at the MPI, culminatingwith the launch of the ROSAT satellit (Réf. 1), which isscheduled for Feb. 1990.The mirror development is being carried out in closecooperation with the Carl Zeiss Company and was ini-tiated in 73 with an extensive study on flat mirror sam-ples, essentially to select materials and find polishingtechniques (Refs. 2, 3). The next step was to built andtest paraboloidal concentrators of 15 cm diameter and 1m length. A cluster of 12 paraboloidals was flown twiceon Aries rockets in 1977/78 (Réf. 4). In 1976 we beganthe development of imaging X-ray telescopes with 32 cmdiameter for rocket experiments (Réf. 5), and in 1978 weinitiated the development of a large, fourfold nestedtelescope with a diameter of 83 cm: the main mirror ofthe Rontgensatellit ROSAT (Refs. 1, 6).In parallel to the mirror development, we began a pro-gram on X-ray detectors. For the paraboloidals we builtnon imaging single wire proportional counters (Réf. 7),and in 1976 we started with the multi wire position sen-
2. THE 32 CM TELESCOPE
The 32 cm telescope has been designed to fit into theenvelope of Skylark or Black Brant rocket bays. There-fore it has a front aperture of 32 cm and a focal lengthof 143 cm. Using the Wolter type 1 geometry; the mir-rors have been optimized with respect to the effectivecollecting area at 1 keV X-ray energy, leading to alength of the paraboloidal and hyperboloidal sections of43 and 38 cm respectively. The basic material of the te-lescope is aluminum with a thickness of 14 mm, platedwith a 70 (Jm thick kanigen layer. The kanigen layer wasground and then polished in several steps, and in bet-ween monitored by X-ray scattering measurements. Af-ter the final polishing step, the kanigen surface wascoated with about 600 A of gold. The final mour.ling ofthe mirror sections was done under microscopical con-trol of the focal image in visible light. (A more detaileddescription of the fabrication of the telescope is given inRéf. 5). Figure 1 shows a photograph of the telescope.
Proc. Ninth ESAIPAC Symposium on 'European Racket and Balloon Programmes and Related Research ', Lahnstein, FRG, 3—7 April 1989(ESA SP-291, June 1989)
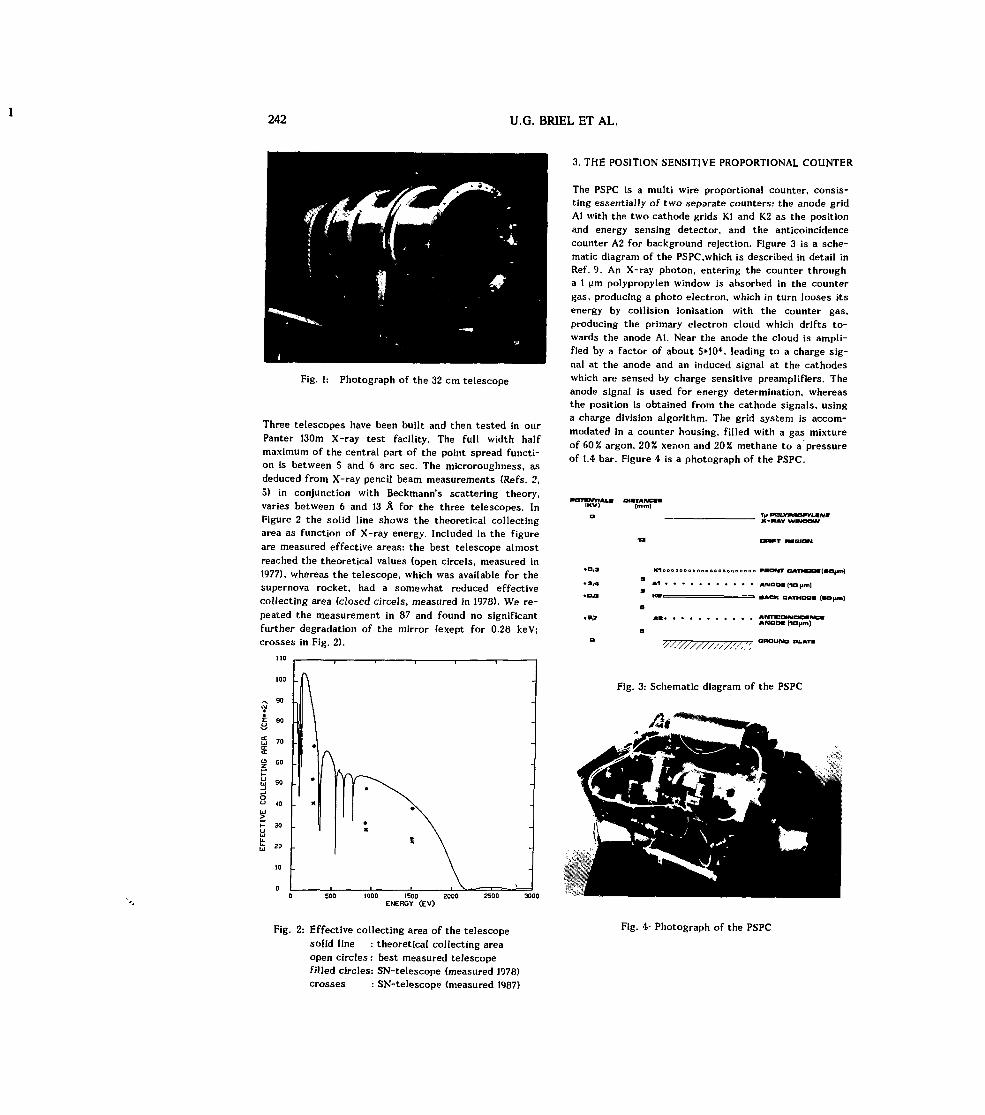
242 U.C. BRIEL ET AL.
Fig. 1; Photograph of the 32 cm telescope
Three telescopes have been built and then tested in ourPanter 13Om X-ray test facility. The ful l width halfmaximum of the central part of the point spread functi-on is between 5 and 6 arc sec. The microroughness, asdeduced from X-ray pencil beam measurements (Refs. 2,5) in conjunction with Beckmann's scattering theory,varies between 6 and 13 A for the three telescopes. InFigure 2 the solid line shows the theoretical collectingarea as function of X-ray energy. Included in the figureare measured effective areas: the best telescope almostreached the theoretical values (open circels, measured in1977), whereas the telescope, which was available for thesupernova rocket, had a somewhat reduced effectivecollecting area (closed circels, measured in 1978). We re-peated the measurement in 87 and found no significantfurther degradation of the mirror (exept for 0.28 keV;crosses in Fig. 2).
100
^ 90y§ 8°S 70
g 60
B 50_jO<-> <0
y£ 30LJU,fc 20
IO
OSOO 1000 ISOO 2000 2500 3000
ENERGY (EV)
Fig. 2: Effective collecting area of the telescopesolid line : theoretical collecting areaopen circles : best measured telescopefilled circles: SN-telescope (measured 1978)crosses : SN-telescope (measured 1987)
3. THE POSITION SENSITIVE PROPORTIONAL COUNTER
The PSPC is a multi wire proportional counter, consis-ting essentially of two separate counters: the anode gridAl with the two cathode grids Kl and K2 as the positionand energy sensing detector, and the anticoincidencecounter A2 for background rejection. Figure 3 is a sche-matic diagram of the PSPC.which is described in detail inRéf. 9. An X-ray photon, entering the counter througha 1 |im polypropylen window is absorbed in the countergas, producing a photo electron, which in turn looses itsenergy by collision ionisation with the counter gas,producing the primary electron cloud which drifts to-wards the anode Al. Near the anode the cloud is ampli-fied by a factor of about S»104, leading to a charge sig-nal at the anode and an induced signal at the cathodeswhich are sensed by charge sensitive preamplifiers. Theanode signal is used for energy determination, whereasthe position is obtained from the cathode signals, usinga charge division algorithm. The grid system is accom-modated in a counter housing, filled with a gas mixtureof 60% argon, 20% xenon and 20% methane to a pressureof 1.4 bar. Figure 4 is a photograph of the PSPC.
"0TBST-
K(BOpm)
l(1DHm]
1 BACK CATHOOB (BOpm)
ANTICDINCIDKNCKANOOC (1OnH
y/ t/ ORDUND PLATH
Fig. 3: Schematic diagram of the PSPC
/If
Fig. 4- Photograph of the PSPC
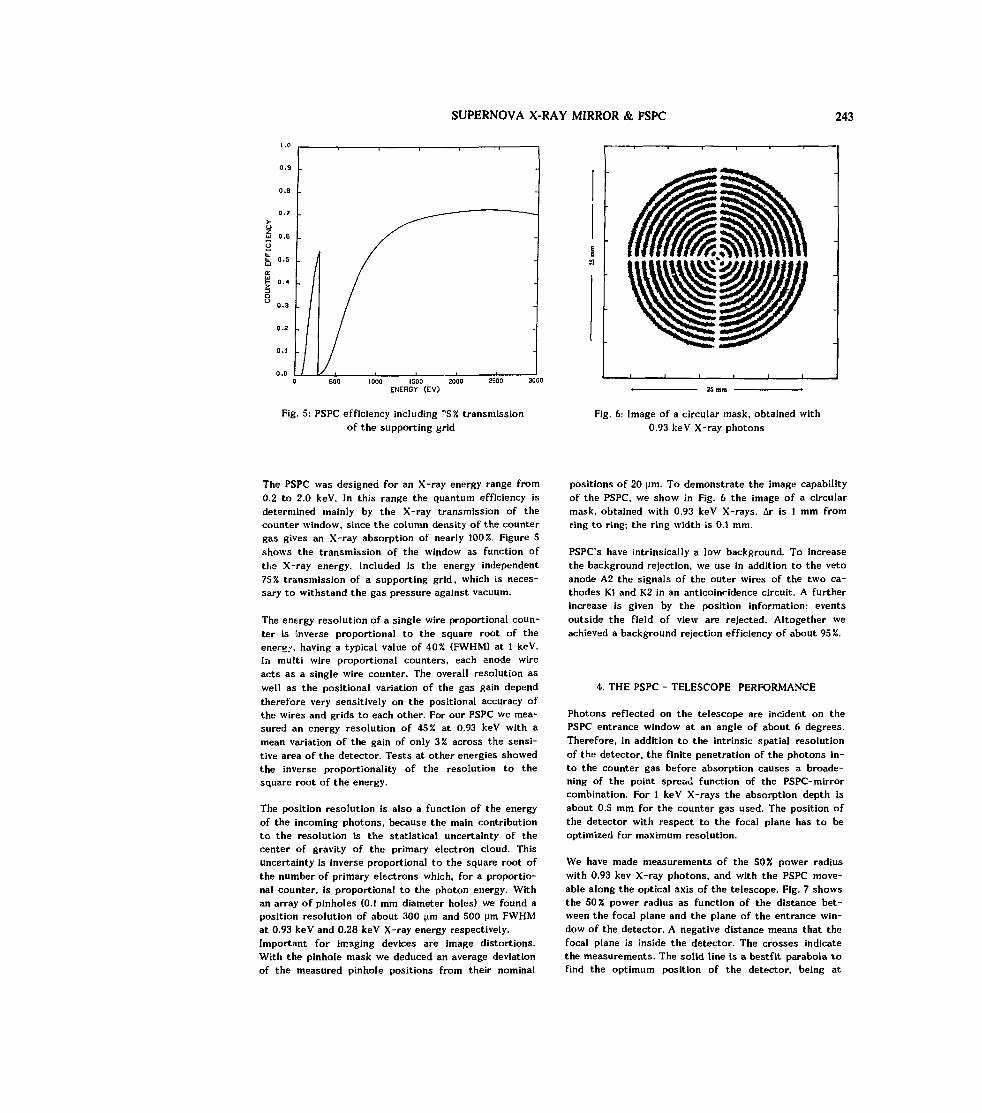
SUPERNOVA X-RAY MIRROR & PSPC 243
1000 1500 2000ENERGY (EV)
Fig. 5: PSPC efficiency including T'5% transmissionof the supporting grid
Fig. 6: Image of a circular mask, obtained with0.93 keV X-ray photons
The PSPC was designed for an X-ray energy range from0.2 to 2.0 keV. In this range the quantum efficiency isdetermined mainly by the X-ray transmission of thecounter window, since the column density of the countergas gives an X-ray absorption of nearly 100%. Figure Sshows the transmission of the window as function ofthe X-ray energy. Included is the energy independent75% transmission of a supporting grid, which is neces-sary to withstand the gas pressure against vacuum.
The energy resolution of a single wire proportional coun-ter is inverse proportional to the square root of theenerg/, having a typical value of 40% (FWHM) at 1 keV.hi multi wire proportional counters, each anode wireacts as a single wire counter. The overall resolution aswell as the positional variation of the gas gain dependtherefore very sensitively on the positional accuracy ofthe wires and grids to each other. For our PSPC we mea-sured an energy resolution of 43% at 0.93 keV with amean variation of the gain of only 3% across the sensi-tive area of the detector. Tests at other energies showedthe inverse proportionality of the resolution to thesquare root of the energy.
The position resolution is also a function of the energyof the incoming photons, because the main contributionto the resolution is the statistical uncertainty of thecenter of gravity of the primary electron cloud. Thisuncertainty is inverse proportional to the square root ofthe number of primary electrons which, for a proportio-nal counter, is proportional to the photon energy. Withan array of pinholes (0.1 mm diameter holes) we found aposition resolution of about 300 (im and 500 [tm FWHMat 0.93 keV and 0.28 keV X-ray energy respectively.Important for imaging devices are image distortions.With the pinhole mask we deduced an average deviationof the measured pinhole positions from their nominal
positions of 20 urn. To demonstrate the image capabilityof the PSPC, we show in Fig. 6 the image of a circularmask, obtained with 0.93 keV X-rays. Ar is 1 mm fromring to ring; the ring width is 0.1 mm.
PSPC's have intrinsically a low background. To increasethe background rejection, we use in addition to the vetoanode A2 the signals of the outer wires of the two ca-thodes Kl and K2 in an anticoincidence circuit. A furtherincrease is given by the position information: eventsoutside the field of view are rejected. Altogether weachieved a background rejection efficiency of about 95%.
4. THE PSPC - TELESCOPE PERFORMANCE
Photons reflected on the telescope are incident on thePSPC entrance window at an angle of about 6 degrees.Therefore, in addition to the intrinsic spatial resolutionof the detector, the finite penetration of the photons in-to the counter gas before absorption causes a broade-ning of the point spread function of the PSPC-mirrorcombination. For 1 keV X-rays the absorption depth isabout 0.5 mm for the counter gas used. The position ofthe detector with respect to the focal plane has to beoptimized for maximum resolution.
We have made measurements of the 50% power radiuswith 0.93 kev X-ray photons, and with the PSPC move-able along the optical axis of the telescope. Fig. 7 showsthe 50% power radius as function of the distance bet-ween the focal plane and the plane of the entrance win-dow of the detector. A negative distance means that thefocal plane is inside the detector. The crosses indicatethe measurements. The solid line is a bestfit parabola tofind the optimum position of the detector, being at
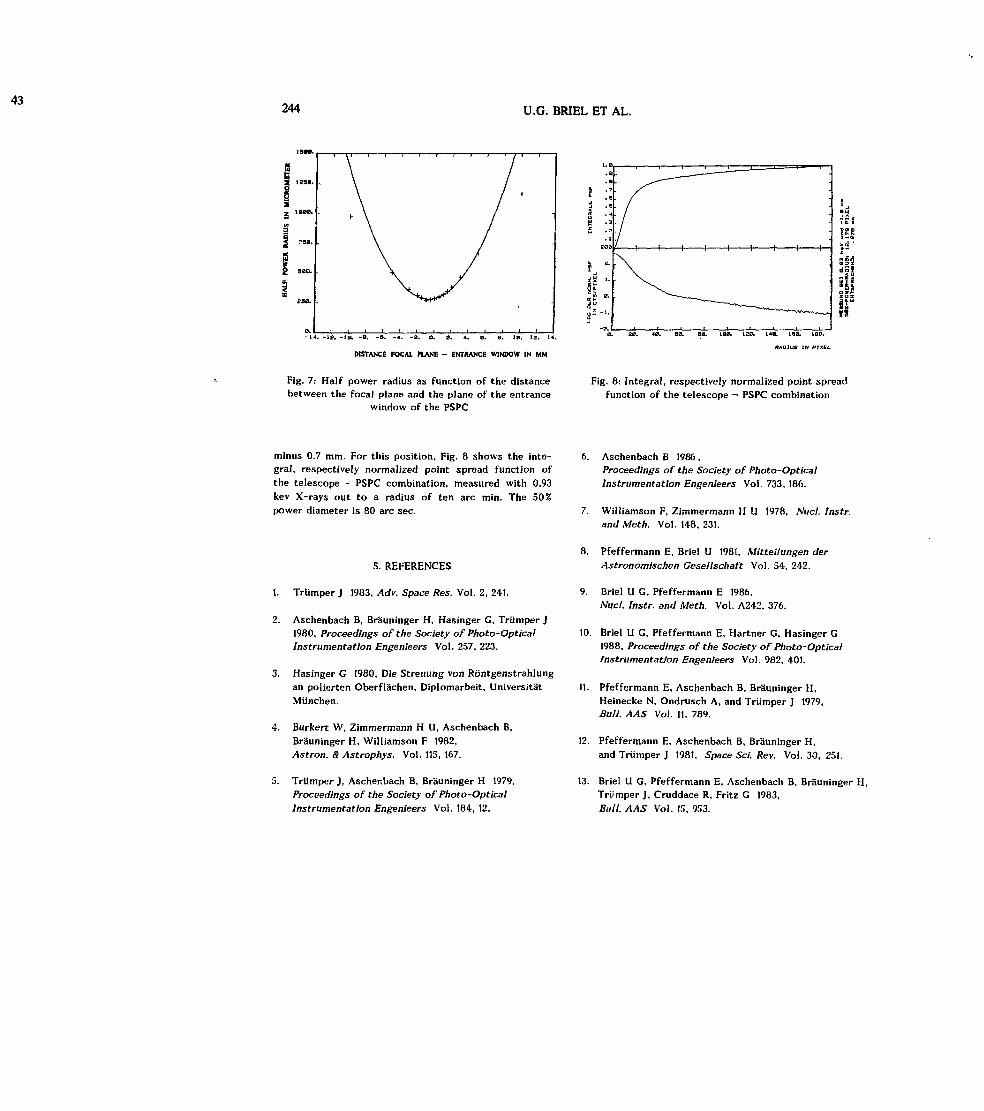
43244 U.C. BRIEL ET AL.
2 =00.
, -B. -a. -4. -2. a. a. 4. a. B. la. iz. M.
DISTANCE FOCAl PLANE - ENTRANCE WINDOW IN MM
Fig. 7: Half power radius as function of the distancebetween the focal plane and the plane of the entrance
window of the PSPC
Fig. 8: Integral, respectively normalized point spreadfunction of the telescope — PSPC combination
minus 0.7 mm. For this position. Fig. 8 shows the inte-gral, respectively normalized point spread function ofthe telescope - PSPC combination, measured with 0.93kev X-rays out to a radius of ten arc min. The 50%power diameter is 80 arc sec.
5. REFERENCES
1. Trumper J 1983, Adv. Space Res. Vol. 2, 241.
2. Aschenbach B, Brauninger H, Hasinger G1 Trumper J1980, Proceedings of the Society of Photo-OpticalInstrumentation Engenieers Vol. 257, 223.
3. Hasinger G 1980, Die Strenting von Rontgenstrahlungan polierten Oberflachen, Diplomarbeit, UniversitatMunchen.
4. Burkert W, Zimmermann H U, Aschenbach B,Brauninger H, Williamson F 1982,Astron. & Astrophys. Vol. 115, 167.
5. Trumper J, Aschenbach B, Brauninger H 1979,Proceedings of the Society of Photo-OpticalInstrumentation Engenieers Vol. 181, 12.
6. Aschenbach B 1986 ,Proceedings of the Society of Photo-OpticalInstrumentation Engenieers Vol. 733, 186.
7. Williamson F, Zimmermann H U 1978, Nucl. Instr.and Meth. Vol. 148, 231.
8. Pfeffermann E, Briel U 1981, Mitteilungen derAstronomischen Gesellschaft Vol. 54, 242.
9. Briel U G, Pfeffermann E 1986,Afuc/. Instr. and Meth. Vol. A242, 376.
10. Briel U G, Pfeffermann E, Hartner G, Hasinger G1988, Proceedings of the Society of Photo-OpticalInstrumentation Engenieers Vol. 982, 401.
11. Pfeffermann E, Aschenbach B, Brauninger H,Heinecke N, Ondrusch A, and Triimper J 1979,Bull. AAS Vol. 11, 789.
12. Pfeffermann E, Aschenbach B, Brauninger H,and Trumper J 1981, Space Sd. Rev. Vol. 30, 251.
13. Briel U G, Pfeffermann E, Aschenbach B, Brauninger H,Trumper J, Cruddace R, Fritz G 1983,Ball. AAS Vol. 15, 953.
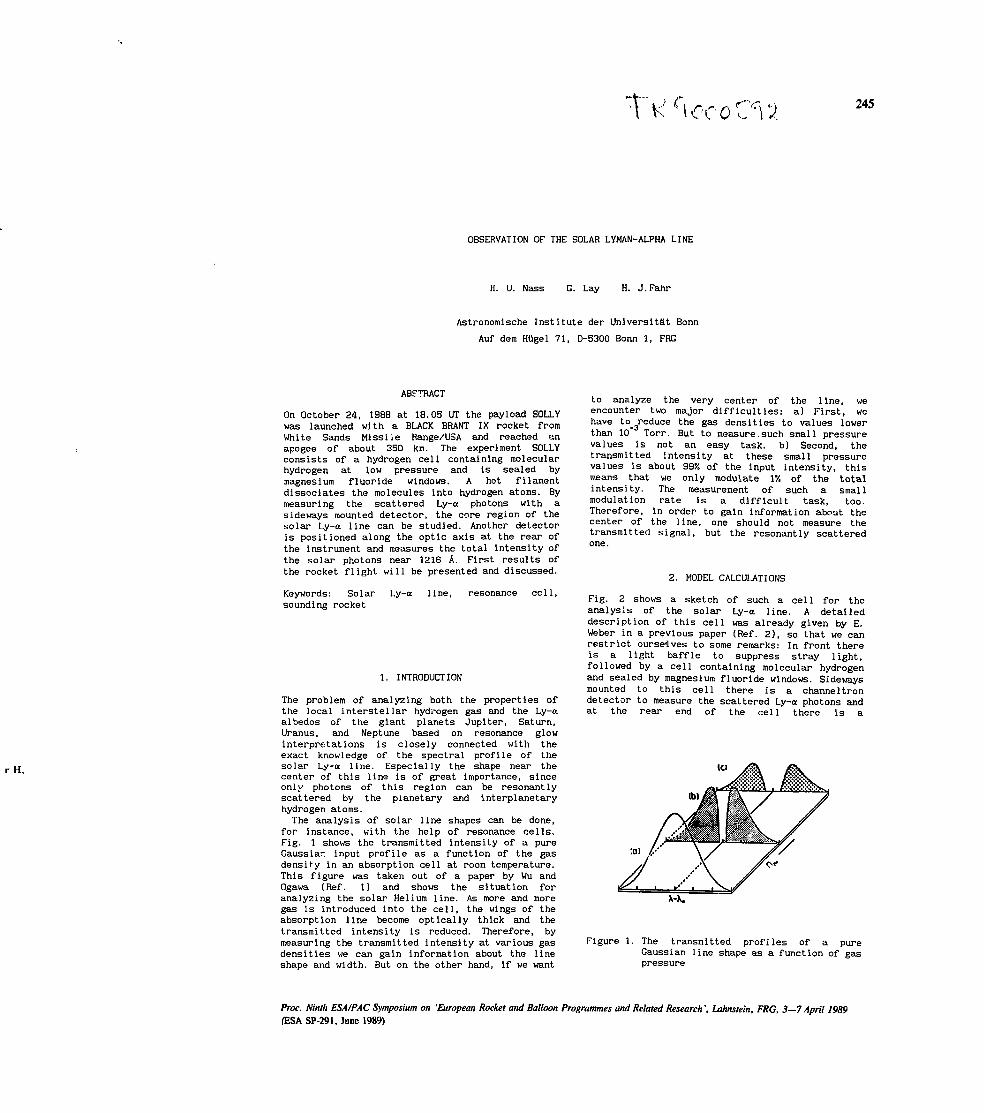
245
OBSERVATION OF THE SOLAR LYMAN-ALPHA LINE
H. U. Nass G. Lay H. J.Fahr
Astronomische Institute der Universitat Bonn
Auf dem Hugel 71, D-5300 Bonn 1, FRC
ABSTRACT
On October 24, 1988 at 18.05 UT the payload SOLLYwas launched with a BLACK BRANT IX rocket fromWhite Sands Missile Range/USA and reached anapogee of about 350 km. The experiment SOLLYconsists of a hydrogen cell containing molecularhydrogen at low pressure and is sealed bymagnesium fluoride windows. A hot filamentdissociates the molecules into hydrogen atoms. Bymeasuring the scattered Ly-a photons with asideways mounted detector, the core region of thesolar Ly-a line can be studied. Another detectoris positioned along the optic axis at the rear ofthe instrument and measures the total intensity ofthe solar photons near 1216 A. First results ofthe rocket flight will be presented and discussed.
Keywords: Solarsounding rocket
Ly-a line, resonance cell,
1. INTRODUCTION
The problem of analyzing both the properties ofthe local interstellar hydrogen gas and the Ly-aalbedos of the giant planets Jupiter, Saturn,Uranus, and Neptune based on resonance glowinterpretations is closely connected with theexact knowledge of the spectral profile of thesolar Ly-a line. Especially the shape near thecenter of this line is of great importance, sinceonly photons of this region can be resonantlyscattered by the planetary and interplanetaryhydrogen atoms.The analysis of solar line shapes can be done,
for instance, with the help of resonance cells.Fig. 1 shows the transmitted intensity of a pureGaussiar. input profile as a function of the gasdensity in an absorption cell at room temperature.This figure was taken out of a paper by Wu andOgawa (Réf. 1) and shows the situation foranalyzing the solar Helium line. As more and moregas is introduced into the cell, the wings of theabsorption line become optically thick and thetransmitted intensity is reduced. Therefore, bymeasuring the transmitted intensity at various gasdensities we can gain information about the lineshape and width. But on the other hand, if we want
to analyze the very center of the line, weencounter two major difficulties: a) First, wehave to_areduce the gas densities to values lowerthan 10 Torr. But to measure.such small pressurevalues is not an easy task, b) Second, thetransmitted intensity at these small pressurevalues is about 99% of the input intensity, thismeans that we only modulate IJ! of the totalintensity. The measurement of such a smallmodulation rate is a difficult task, too.Therefore, in order to gain information about thecenter of the line, one should not measure thetransmitted signal, but the resonantly scatteredone.
2. MODEL CALCULATIONS
Fig. 2 shows a sketch of such a cell for theanalysis of the solar Ly-a line. A detaileddescription of this cell was already given by E.Weber in a previous paper (Réf. 2), so that we canrestrict ourselves to some remarks: In front thereis a light baffle to suppress stray light,followed by a cell containing molecular hydrogenand sealed by magnesium fluoride windows. Sidewaysmounted to this cell there is a channeltrondetector to measure the scattered Ly-a photons andat the rear end of the cell there is a
(Cl
Figure 1. The transmitted profiles of a pureGaussian line shape as a function of gaspressure
Proc. Ninth ESAIPAC Symposium on 'European Rocket and Balloon Programmes and Related Research', Lahnstein, FRG, 3—7 April 1989fESA SP-291, June 1989)
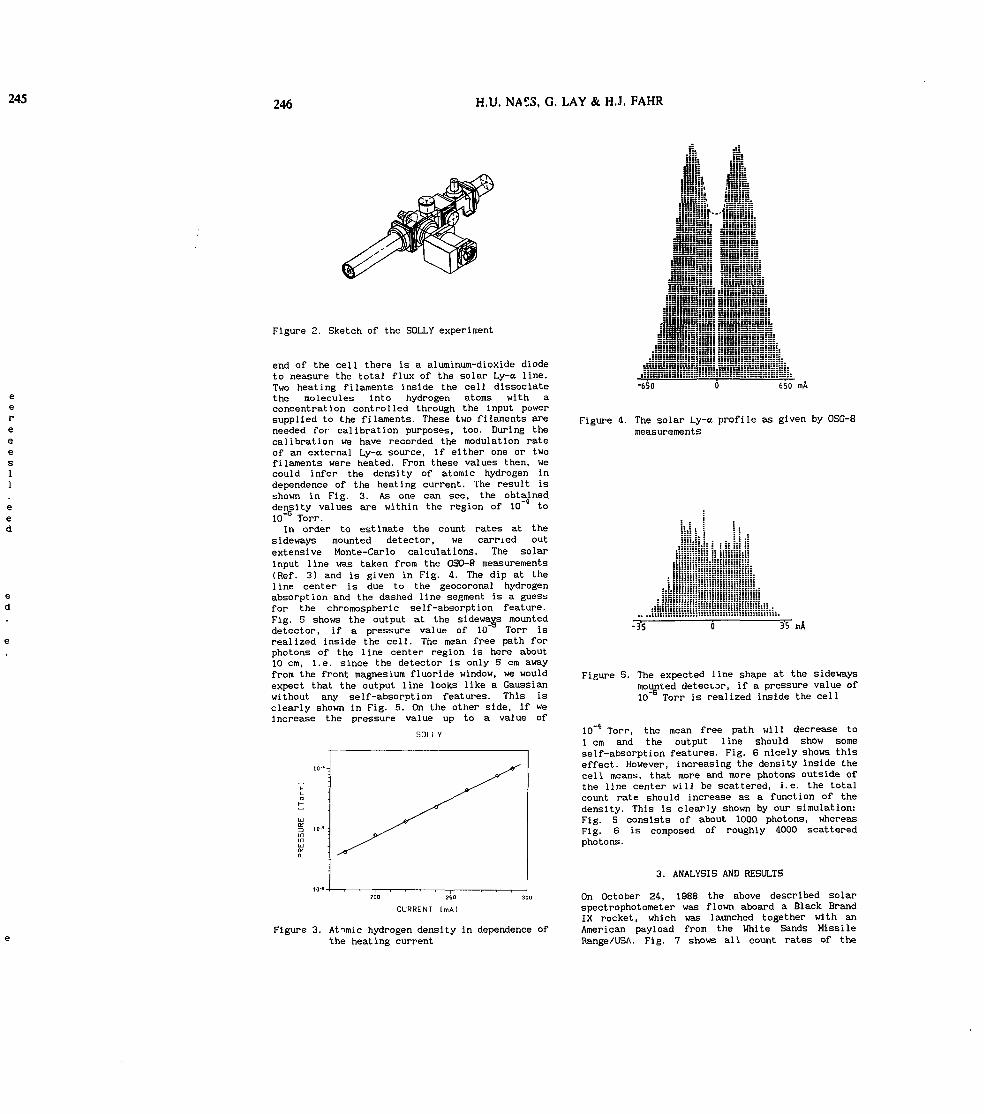
246 H.U. NAS3, G. LAY & HJ. FAHR
Figure 2. Sketch of the SOLLY experiment
end of the cell there is a aluminum-dioxide diodeto measure the total flux of the solar Ly-cc line.Two heating filaments inside the cell dissociatethe molecules into hydrogen atoms with aconcentration controlled through the input powersupplied to the filaments. These two filaments areneeded for calibration purposes, too. During thecalibration we have recorded the modulation pateof an external Ly-a source, if either one or twofilaments were heated. From these values then, wecould infer the density of atomic hydrogen independence of the heating current. The result isshown in Fig. 3. As one can see, the obtaineddensity values are within the region of 10" toICf6 Torr.
In order to estimate the count rates at thesideways mounted detector, we earned outextensive Monte-Carlo calculations. The solarinput line was taken from the OSO-8 measurements(Réf. 3) and is given in Fig. 4. The dip at theline center is due to the geocoronal hydrogenabsorption and the dashed line segment is a guessfor the chromospheric seIf-absorption feature.Fig. 5 shows the output at the sideways mounteddetector, if a pressure value of 10 Torr isrealized inside the cell. The mean free path forphotons of the line center region is here about10 cm, i.e. since the detector is only 5 cm awayfrom the front magnesium fluoride window, we wouldexpect that the output line looks like a Gaussianwithout any self-absorption features. This isclearly shown in Fig. 5. On the other side, if weincrease the pressure value up to a value of
250
CURRENT ImAl
-650 650 mA
Figure 4. The solar Ly-a profile as given by OSO-8measurements
I!!!:!; L : . :. Lj :!• •••••"• ! : :: î ï î i:: =. :.::.::| ::
flliilF111"1
itHiiiiiiii:::::::::::!••;;::::£
::::: ::.. ..!!!!!!i!!! !!!!!!il
!!!!!!.
JHJpLj':::::::::
-35 35 mA
Figure 3. Atimic hydrogen density in dependence ofthe heating current
Figure 5. The expected line shape at the sidewaysmounted detector, if a pressure value of10"s Torr is realized inside the cell
10 Torr, the mean free path will decrease to1 cm and the output line should show someseIf-absorption features. Fig. 6 nicely shows thiseffect. However, increasing the density inside thecell means, that more and more photons outside ofthe line center will be scattered, i.e. the totalcount rate should increase as a function of thedensity. This is clearly shown by our simulation:Fig. 5 consists of about 1000 photons, whereasFig. 6 is composed of roughly 4000 scatteredphotons.
3. ANALYSIS AND RESULTS
On October 24, 1988 the above described solarspectrophotometer was flown aboard a Black BrandIX rocket, which was launched together with anAmerican payload from the White Sands MissileRange/USA. Fig. 7 shows all count rates of the
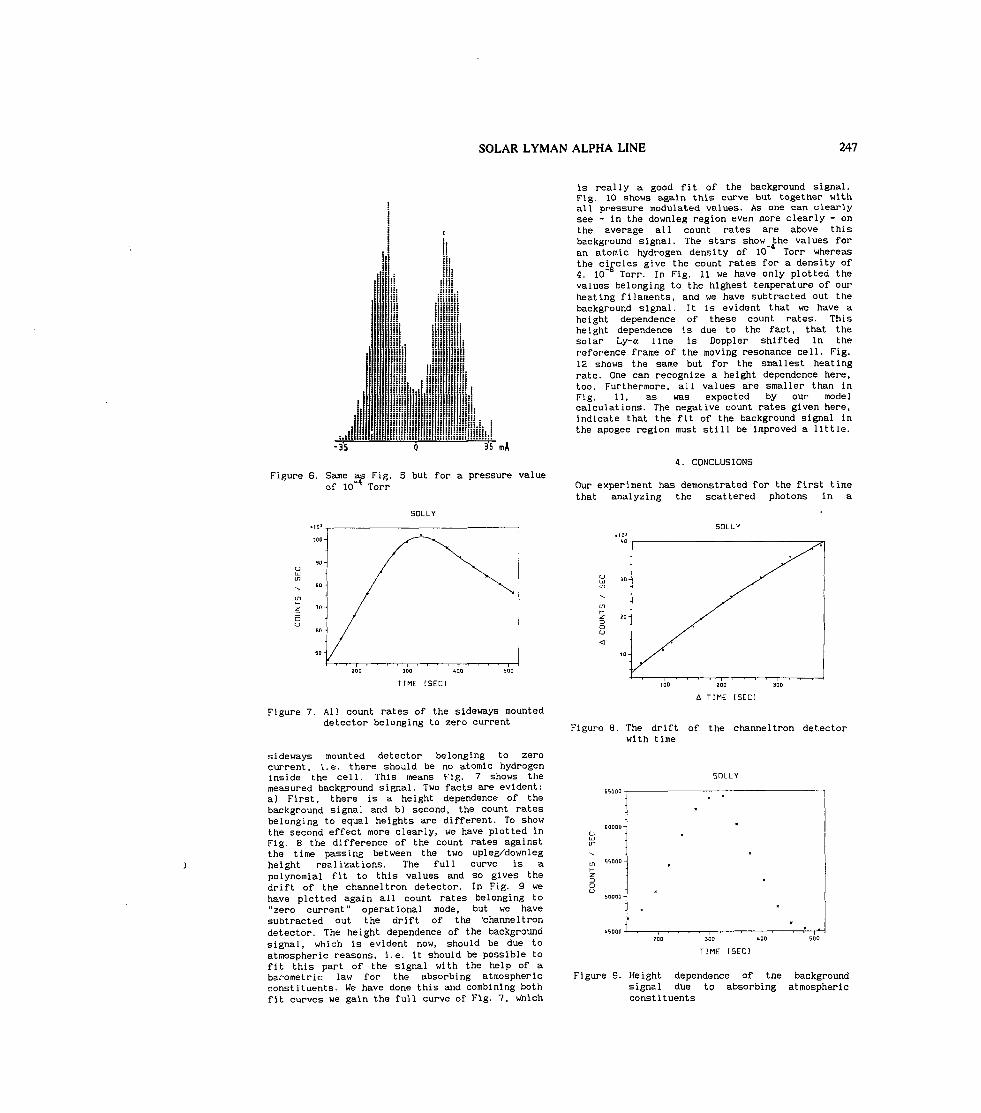
SOLAR LYMAN ALPHA LINE 247
•35
i ;;liiii
Ii!
. ijiiiih:I!35 mA
Figure 6. Same as Fig. 5 but for a pressure valueof IQ"4 Torr
is really a good fit of the background signal.Fig. 10 shows again this curve but together withall pressure modulated values. As one can clearlysee - in the downleg region even more clearly - onthe average all count rates are above thisbackground signal. The stars show the values foran atomic hydrogen density of 10" Torr whereasthe circles give the count rates for a density of4. 10~B Torr. In Fig. 11 we have only plotted thevalues belonging to the highest temperature of ourheating filaments, and we have subtracted out thebackground signal. It is evident that we have aheight dependence of these count rates. Thisheight dependence is due to the fact, that thesolar Ly-a line is Doppler shifted in thereference frame of the moving resonance cell. Fig.12 shows the same but for the smallest heatingrate. One can recognize a height dependence here,too. Furthermore, all values are smaller than inFig. 11, as was expected by our modelcalculations. The negative count rates given here,indicate that the fit of the background signal inthe apogee region must still be improved a little.
4. CONCLUSIONS
Our experiment has demonstrated for the first timethat analyzing the scattered photons in a
TIME (SECl
Figure 7. All count rates of the sideways mounteddetector belonging to zero current
sideways mounted detector belonging to zerocurrent, i.e. there should be no atomic hydrogeninside the cell. This means Fig. 7 shows themeasured background signal. Two facts are evident;a) First, there is a height dependence of thebackground signal and b) second, the count ratesbelonging to equal heights are different. To showthe second effect more clearly, we have plotted inFig. 8 the difference of the count rates againstthe time passing between the two upleg/downlegheight realizations. The full curve is apolynomial fit to this values and so gives thedrift of the channeltron detector. In Fig. 9 wehave plotted again all count rates belonging to"zero current" operational mode, but we havesubtracted out the drift of the 'channeltrondetector. The height dependence of the backgroundsignal, which is evident now, should be due toatmospheric reasons, i.e. it should be possible tofit this part of the signal with the help of abarometric law for the absorbing atmosphericconstituents. We have done this and combining bothfit curves we gain the full curve of Fig. 7, which
200 300
U TIME [SEC l
Figure 8. The drift of the channeltron detectorwith time
300 too
TIME [SEC)
Figure 9. Height dependence of tne backgroundsignal due to absorbing atmosphericconstituents

247248 H.U. NASS, G. LAY & HJ. FAHR
al.1thrlyon
hisforeasof
theourthe
ahisthetheig.inge,inele,ine.
mea
SOLLY
(JLJin
Z)OCJ
50-
200 A-OO 500
TIME [SEC]
Figure 10. All pressure modulated count rates together with the backgroundsignal (full curve)
resonance cell and not the transmitted ones, cangive excellent information on the very center ofthe solar Ly-a line. The data are in goodagreement to our Monte-Carlo calculations, if onesubtracts out a certain background signal. Thebackground signal itself seems to be due to thefollowing effect: Fig. 13 shows the solar spectrumbetween 1000 A and 1300 A as given by Hall et. al.(Réf. 4). As one can see, there is a broad
300
TIME ISEC)
dic
Figure 11. All count rates belonging to thehighest temperature of our heatingfilaments after subtraction of thebackground signal
300
TIME ISEC)
Figure 12. Same as Fig. 11 but for the lowesttemperature value
continuum aside of the Ly-a line of the order of10s photons/cm**2/sec/A. On the other hand lookingat a part of the molecular hydrogen emissionspectrum, which is given in Fig. 14 and wasobtained by Schubert and Hudson (Réf. 5), one seesa lot of emission lines beside the Ly-a line. Thismeans, that the molecular hydrogen, which is ofcourse the dominant part in our hydrogen cell,should be able to resonantly scatter the Justmentioned continuum of the solar spectrum. Inother words, if one wants to enhance the signal tonoise ratio, one should attempt to still narrowdown the spectral input profile. For the possible
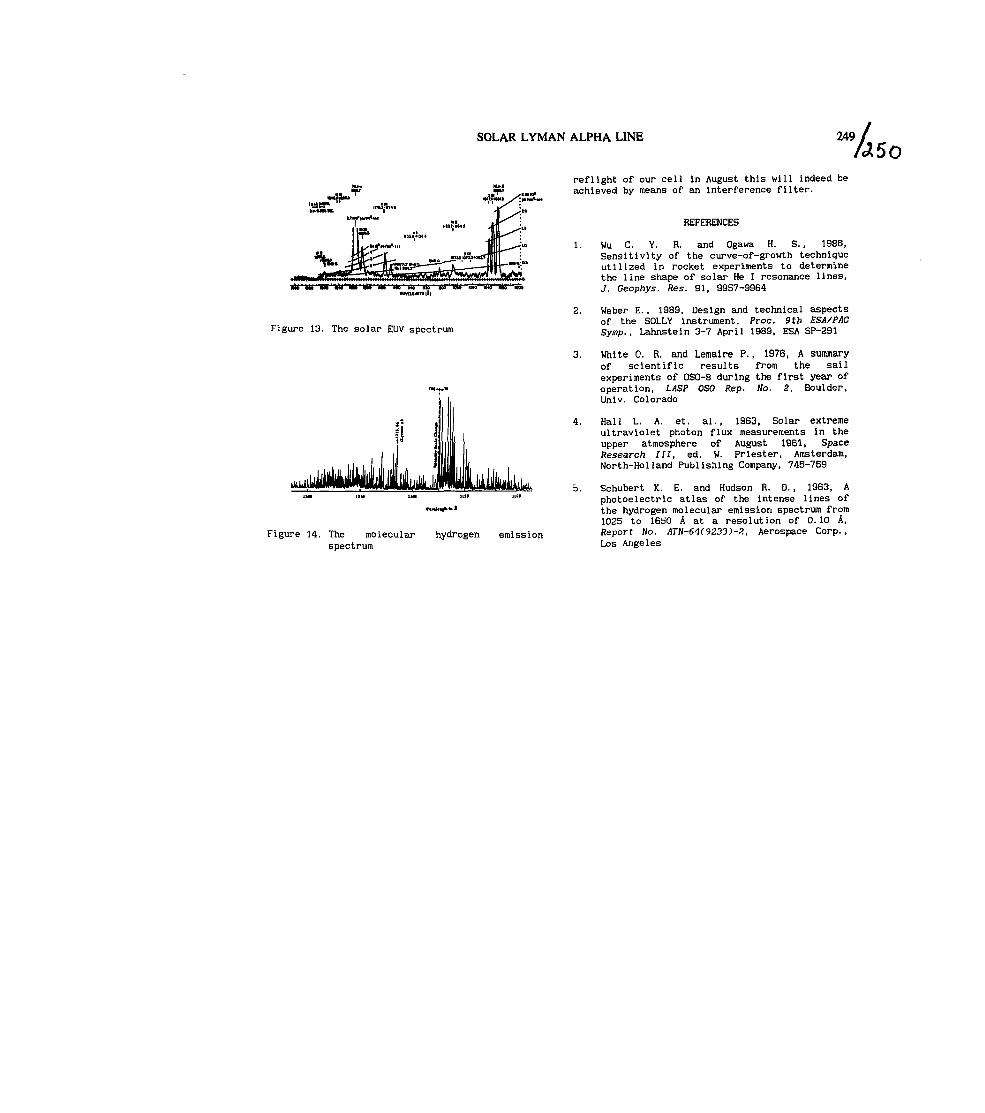
SOLAR LYMAN ALPHA LINE
1SSi
Figure 13. The solar EUV spectrum
Figure 14. The molecular hydrogen emissionspectrum
249/Areflight of our cell in August this will indeed beachieved by means of an interference filter.
REFERENCES
Wu C. Y. R. and Ogawa H. S., 1986,Sensitivity of the curve-of-growth techniqueutilized in rocket experiments to determinethe line shape of solar He I resonance lines,J. Geophys. Res. 91, 9957-9964
2.
4.
Weber E. , 1989, Design and technical aspectsof the SOLLY instrument, Proc. 9th ESA/PACSymp. , Lahnstein 3-7 April 1989, ESA SP-291
White O. R. and Lemaire P., 1976, A summaryof scientific results from the sailexperiments of OSO-8 during the first year ofoperation, LASP OSO Rep. No. 2, Boulder,Univ. Colorado
Hall L. A. et. al., 1963, Solar extremeultraviolet photon flux measurements in theupper atmosphere of August 1961, SpaceResearch III, ed. W. Priester, Amsterdam,North-Holland Publishing Company, 745-759
Schubert K. E. and Hudson R. D. , 1963, Aphotoelectric atlas of the intense lines ofthe hydrogen molecular emission spectrum from1025 to 1650 A at a resolution of 0.10 A,Report No. ATN-64(9233)-2, Aerospace Corp. ,Los Angeles

SESSION 13POLAR TRACE CONSTITUENTS
Chairman:F. Arnold
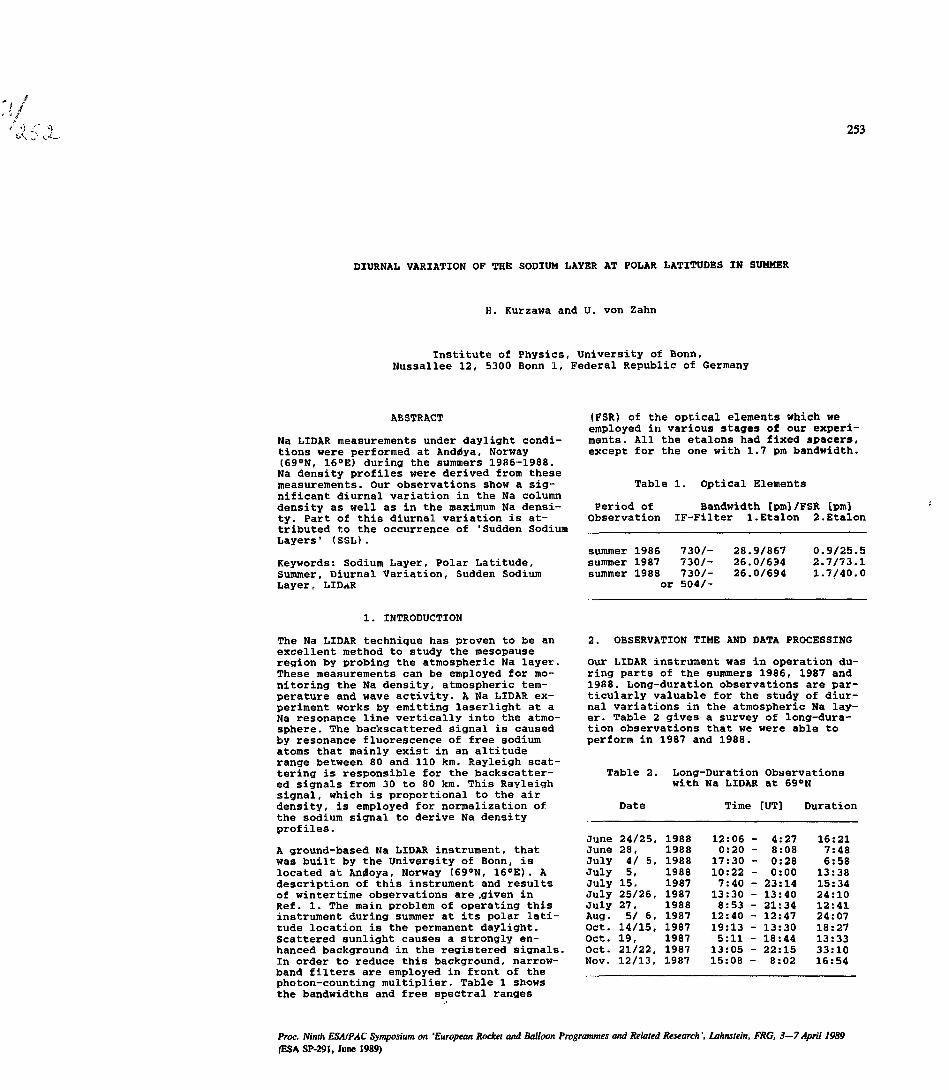
253
DIURNAL VARIATION OF THE SODIUM IiAYER AT POLAR LATITUDES IN SUMMER
H. Kurzawa and U. von Zaim
Institute of Physics, University of Bonn,Nussallee 12, 5300 Bonn 1, Federal Republic of Germany
ABSTRACT
Na LIDAR measurements under daylight condi-tions were performed at Andrfya, Norway(690N, 160E) during the summers 1986-1988.Na density profiles were derived from thesemeasurements. Our observations show a sig-nificant diurnal variation in the Na columndensity as well as in the maximum Na densi-ty. Part of this diurnal variation is at-tributed to the occurrence of 'Sudden SodiumLayers' (SSL).
Keywords: Sodium Layer, Polar Latitude,Summer, Diurnal Variation, Sudden SodiumLayer, LID R
(FSR) of the optical elements which weemployed in various stages of our experi-ments. All the étalons had fixed spacers,except for the one with 1.7 pm bandwidth.
Table 1. Optical Elements
Period of Bandwidth [pml/FSRObservation IF-FiI ter !.Etalon 2
summersummersummer
198619871988
or
730/-730/-730/-504/-
282626
.9/867
.0/694
.0/694
O21
tpm]. Etalon
.9/25
.7/73
.7/40
.5
.1
.0
1. INTRODUCTION
The Na LIDAR technique has proven to be anexcellent method to study the mesopauseregion by probing the atmospheric Na layer.These measurements can be employed for mo-nitoring the Na density, atmospheric tem-perature and wave activity. A Na LIDAR ex-periment works by emitting laserlight at aNa resonance line vertically into the atmo-sphere. The backseattered signal is causedby resonance fluorescence of free sodiumatoms that mainly exist in an altituderange between 80 and 110 km. Rayleigh scat-tering is responsible for the backscatter-ed signals from 30 to 80 km. This Rayleighsignal, which is proportional to the airdensity, is employed for normalization ofthe sodium signal to derive Na densityprofiles.
A ground-based Na LIDAR instrument, thatwas built by the University of Bonn, islocated at Andoya, Norway (690N, 160E). Adescription of this instrument and resultsof wintertime observations are .given inRéf. 1. The main problem of operating thisinstrument during summer at its polar lati-tude location is the permanent daylight.Scattered sunlight causes a strongly en-hanced background in the registered signals.In order to reduce this background, narrow-band filters are employed in front of thephoton-counting multiplier. Table 1 showsthe bandwidths and free spectral ranges
2. OBSERVATION TIME AND DATA PROCESSING
Our LIDAR instrument was in operation du-ring parts of the summers 1986, 1987 and1988. Long-duration observations are par-ticularly valuable for the study of diur-nal variations in the atmospheric Na lay-er. Table 2 gives a survey of long-dura-tion observations that we were able toperform in 1987 and 1988.
Table 2. Long-Duration Observationswith Na LIDAR at 690N
Date Time [UT] Duration
JuneJuneJulyJulyJulyJulyJulyAug.Oct.Oct.Oct.Nov.
24/25,28,4/ 5,5,15,25/26,27,5/ 6,14/15,19,21/22,12/13,
198819881988198819871987198819871987198719871987
12:060:2017:3010:227:4013:308:5312:4019:135:1113:0515:08
- 4:27- 8:08- 0:28- 0:00- 23:14- 13:40- 21:34- 12:47- 13:30- 18:44- 22:15- 8:02
16:217:486:5813:3815:3424:1012:4124:0718:2713:3333:1016:54
Proc. Ninth ESAlPAC Symposium on 'European Rocket and Balloon Programmes and Related Research'. Lahnstein, FRG, 3—7April 1989(ESA SP-291, June 1989)

253 254 H. KURZAWA & U. VON ZAHN
Figures 1 - 3 show the frequencies of ourobservations vs. local tine during summerand autumn 1987 and summer 1988. Unfortuna-tely there are only a few observationsnear noon in summer.
i-s.h.
time [UT]
Fig. 1 Frequency of observations duringsummer 1987
.5
.1
.0
Summer 1988
IO 20
time [UT]
Fig. 2 Frequency of observations duringsummer 1988
10
time [UT]
Fig. 3 Frequency of observations duringautumn 1987
A single raw data profile consists of the
backscattered signal integrated over 1000up to 5000 laser pulses which gives a time-resolution between 1.5 and 6 min. Densityprofiles can be calculated from everysingle raw data profile. In daylight it isnecessary to average over a longer periodof time in order to reduce the error ofthe calculated Na density, which is pre-dominantly caused by the statistical errorof the Na signal and the fluctuation ofthe background signal. Na densities werecalculated by normalization to the Ray-leigh signal from 30 km altitude. The airdensity at 30 km altitude was taken fromRéf. 2. Temperatures were taken from theCIRA 1986 (Réf. 3) to calculate the crosssection for Na resonance fluorescence,which depends on the temperature.
3. VARIATIONS OF THE NA LAYER
3.1 Variablitv of Summer Densities
Measurements during the three summers of1986 - 1988 showed both strong short-termvariations in the sodium densities as wellas unexpected variations from year to year.On an average the maximum Na density measu-red during the summer of 1987 was only inthe range of 1200 atoms/cm" (Réf. 4). Inthe summers of 1986 and 1988, however, Nadensities were factors of 2 to 3 higherthan in the intermediate summer. Hence,derivation of a 'common1 diurnal variationthroughout the entire period of our obser-vations needs some special considerations.
3.2 Diurnal Variations
In order to account for the differentbehaviour of the sodium layer during thethree summers of our observations we havecalculated the diurnal variation in Nacolumn desnity separately for the threecampaigns of summer 1987, summer 1988,and, for comparison purposes, for autumn1987. Figure 4 demonstrates the deriveddiurnal variation of the normalized Nacolumn density during the summers of 1987and of 1988. 'Normalized' means that it isthe ratio of measured Na column densityover the mean Na density measured duringthis particular campaign.
^ULY/AUG. 87
JUNE/DULY 88
0 : O D 6:00 12:00 18:00 Otime CLT]
Fig. 4 Diurnal variation of the norma-lized Na column density in thesummers of 1987 and 1988
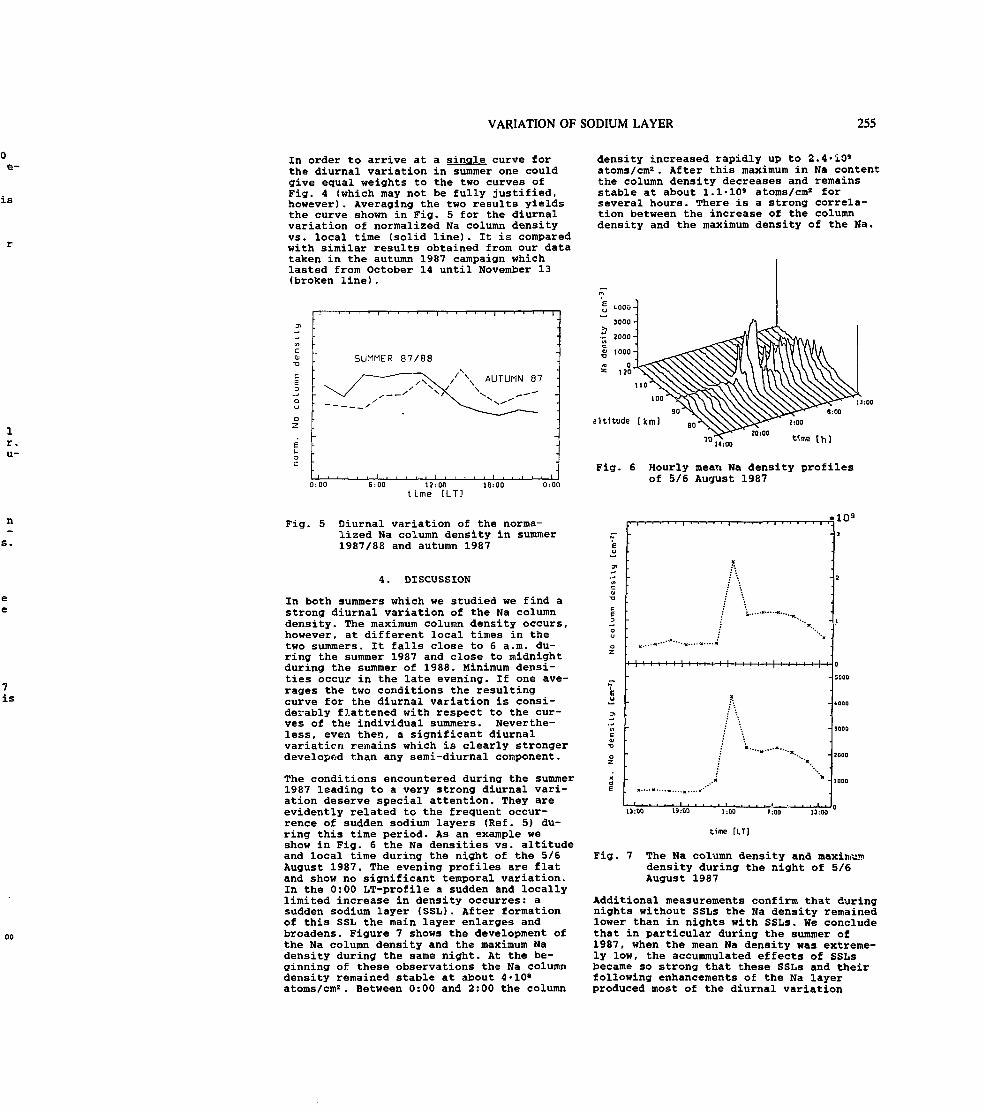
VARIATION OF SODIUM LAYER 255
In order to arrive at a single curve forthe diurnal variation in summer one couldgive equal weights to the two curves ofFig. 4 (which may not be fully justified,however). Averaging the two results yieldsthe curve shown in Fig. 5 for the diurnalvariation of normalized Na column densityvs. local time (solid line). It is comparedwith similar results obtained from our datataken in the autumn 1987 campaign whichlasted from October 14 until November 13(broken line).
SUMMER 87/88
density increased rapidly up to 2.4*10*atoms/cm2. After this maximum in Na contentthe column density decreases and remainsstable at about 1.1-10' atoms/cm* forseveral hours. There is a strong correla-tion between the increase of the columndensity and the maximum density of the Na.
6:00 12:00 16:00t ime [LT]
a l t i t ude ( k m )
Fig. 6 Hourly mean Na density profilesof 5/6 August 1987
Fig. 5 Diurnal variation of the norma-lized Na column density in summer1987/88 and autumn 1987
4. DISCUSSION
In both summers which we studied we find astrong diurnal variation of the Na columndensity. The maximum column density occurs,however, at different local times in thetwo summers. It falls close to 6 a.m. du-ring the summer 1987 and close to midnightduring the summer of 1988. Minimum densi-ties occur in the late evening. If one ave-rages the two conditions the resultingcurve for the diurnal variation is consi-derably flattened with respect to the cur-ves of the individual summers. Neverthe-less, even then., a significant diurnalvariation remains which is clearly strongerdeveloped than any semi-diurnal component.
The conditions encountered during the summer1987 leading to a very strong diurnal vari-ation deserve special attention. They areevidently related to the frequent occur-rence of sudden sodium layers (Réf. 5) du-ring this time period. As an example weshow in Fig. 6 the Na densities vs. altitudeand local time during the night of the 5/6August 1987. The evening profiles are flatand show no significant temporal variation.In the 0:00 LT-profile a sudden and locallylimited increase in density occurres: asudden sodium layer (SSL). After formationof this SSL the main layer enlarges andbroadens. Figure 7 shows the development ofthe Na column density and the maximum Nadensity during the same night. At the be-ginning of these observations the Na columndensity remained stable at about 4-10"atoms/cm2. Between 0:00 and 2:00 the column
109
o5000
Fig. 7
) 15:00 1:00 7:00
time [LT)
The Na column density and maximumdensity during the night of 5/6August 1987
Additional measurements confirm that duringnights without SSLs the Na density remainedlower than in nights with SSLs. He concludethat in particular during the summer of1987, when the mean Na density was extreme-ly low, the accummulated effects of SSLsbecame so strong that these SSLs and theirfollowing enhancements of the Na layerproduced most of the diurnal variation
255 256 H. KURZAWA & U. VON ZAHN
exhibited in the curve of Fig. S. If thisis so then it implies that under these con-ditions a considerable amount of sodium iscycled diurnalIy between the atomic state(which we can observe) and other states(which we can not observe) such as molecul-ar, ionic or being adsorbed to solid par-ticles.
At lower latitudes diurnal variations ofthe sodium layer have been studied at 230Slatitude by Clemesha et al. (Réf. 6) andBatista et al. (Réf. 7), as well as at 410Nby Kwon et al. (Réf. 8). At both sites théamplitude of the semidiurnal variation wasfound to be strongly dominant over thediurnal component, except for altitudes be-low 85 km at 230S. These authors argue thatmost of the observed variations are causedby vertical oscillations of the sodium lay-er induced by the passage of tidal waves.At 690S, however, Nomura et al. (Réf. 9)did not observe any significant semidiurnalvariation of the Na layer in winter. Summermeasurements are not yet available fromsouthern polar latitudes.
We have suggested that the formation ofSSLs may well be related to the passage oftidal waves through the sodium layer (Réf.10), although in a more complex way thanjust pure linear oscillatory air motions.Hence, tidal waves may play a role in thebehaviour of the sodium layer not only atlow and middle latitudes, but also at polarlatitudes. Their interactions with the so-dium layer are, however, of a differentkind at different latitudes. These interac-tions will be studied in more detail oncethe observations of tidal winds are publish-ed which have been collected in 1987 at7O0N by Manson and Meek (Réf. 11).
5. CONCLUSIONS
Observations of the atmospheric Na layerin polar summer show significant 24-hourvariations in the Na column density and themaximum Na density. The diurnal increase inNa density shows a strong correlation withthe development of SSLs. Thus, the behaviourof the Na layer at polar latitudes is dif-ferent from that at middle and low latitu-des where a dominance of the 12-hour varia-tions has been observed. Further investiga-tions at polar latitudes are necessary toobtain more information about the diurnalvariation of the Na layer and the correla-tion between these variations and SSLs.
6. ACKNOWLEDGEMENTS
We thank P. von der Gathen, G. Hansen andM. Alpers for their invaluable help in theacquisition of the data. Helpful assistancewas provided by the staff of the And«SyaRocket Range during all observation cam-paigns. This research nroject was supportedby grant Ho 858/1 of the Deutsche For-schungsgemeinschaft, Bonn, Germany.
7. REFERENCES
1. Tilgner, C., and U. von Zahn, Averageproperties of the sodium densitydistribution as observed at 690Nlatitude in winter, J. Geophvs. Res..93, 8439-8454, 1988.
2. Groves, G. V., A global referenceatmosphere from 18 to 80 km, Rep.AFGL-TR-85-0129, Air Force Surv.Geophvs.. 448, 121 pp., 1985.
3. CIRA 1986, COSPAR InternationalReference Atmosphere 1986, part 2,Pergamon Press, in print, 1989.
4. von Zahn, U., G. Hansen, and H.Kurzawa, Observations of the sodiumlayer at high latitudes in summer,Nature, 331, 594-596, 1988.
5. von Zahn, U., P. von der Gathen, andG. Hansen, Forced release of sodiumfrom upper atmospheric dust par-ticles, Geophvs. Res. Lett.. 14, 76-79, 1987.
6. Clemesha, B. R., D. M. Simonich, P.P. Batista, and V. W. J. H. Kirch-hoff, The diurnal variation of at-mospheric sodium, J. Geophvs. Res..87, 181-186, 1982.
7. Batista, P. P., B. R. Clemesha, D. M.Simonich, and V. W. J. H. Kirchhoff,Tidal oscillations in the atmosphericsodium layer, J. Geophvs. Res.. 90,3881-3888, 1985.
8. Kwon, K. H., C. S. Gardner, D. C.Senft, F. L. Roesler, and J. Har-lander. Daytime lidar measurements oftidal winds in the mesospheric sodiumlayer at Urbana, Illinois, J. Geophvs.Res., 92, 8781-8786, 1987.
9. Nomura, A., T. Kano, Y. Iwasaka, H.Fukunishi, T. Hirasawa, and S. Kawa-guchi, Lidar observations of themesospheric sodium layer at SyowaStation, Antarctica, Geophvs. Res.Lett.. 14, 700-703, 1987.
10. von Zahn, U., and G. Hansen, Reply toComments by B. R. Clemesha and O. M.Simonich on a paper entitled 'Suddenneutral sodium layers: A strong linkto sporadic E layers', J. Atmbs.Terr. Phvs.. 51, 147-150, 1989.
11. Manson, A. H., and C. E. Meek, Dyna-mics of the upper middle atmosphere(80-110 km) at Troms<S, June-December1987, using the Tromsrf/Saskatoon M.F.radar, to be published, 19?;.

SESSION 14FUTURE PROJECTS
Chairman:E. Kopp
259
The DYANA Campaign 1990
D. Offermann
Wuppertal University, FRG
ABSTRACT
DYANA is an international campaign ofcoordinated ground based, balloon androcket borne experiments (GBR) at variousplaces on the globe for case studies ofmiddle atmosphere dynamics up to about100 km. Campaign duration is from Januaryto March 1990. Emphasis is on planetarywaves, gravity waves, and turbulence.Relationship to minor constituentsdistributions will also be studied.The campaign heavily relies on meteoro-logical rockets (plus radiosondes) andground based lidars and radars formeasurements of density, temperatureand wind. Various other ground based orrocket borne experiments will also beinvolved. The measurement sites are setup in a way that they form a network withvarying mesh width, which is adapted tothe horizontal scales of the dynamicalfeatures studied.
1. INTRODUCTION
Extensive dynamical analyses of themiddle atmosphere have been performed inthe past by means of satellite data.These are especially suitable forevaluation of large scale planetary waves(low wave numbers). Satellites are,however, much less helpful if higher wavenumbers are involved. Their basicdrawback is that they have either goodhorizontal or good vertical resolution,depending on their scan mode. Recentrocket measurements indicate that thevertical struture of planetary waves mayat least occasionally differ considerablyfrom Lamb wave modes. Surprisingly stronggradients in the vertical profiles ofwave amplitudes and phases were observed(Offermann et al., 1987). Standing waveswith nodes were suggested by these rocketdata. They require an altitude resolutionof the order of 1 km to detect. This isnot available from present day satelliteinstruments, nor will it be in the nearfuture.
Due to their limited vertical and timeresolution satellite measurements do notcontribute much to the investigation ofgravity waves either. This is especiallytrue for short period gravity waves,which appear to be the more interestingones for momentum and energy transport.Relevance of satellite data for the keyissues of atmospheric turbulence is alsovery limited, at least at higher alti-tudes. As concerns middle atmospheredynamics in general it must be noted thatup to now and for a few years to come(until UARS) there are no wind measure-ments from satellites in the altituderegime in question.
The deficiencies mentioned can beovercome by campaigns of rocket flightsand coordinated ground based measurementsof lidars, radars, spectrometers, etc.Quite a number of such campaigns wereperformed in recent years on the Americancontinent, in Europe and elsewhere (seefor instance Zimmerman et al., 1974;Philbrick et al., 1974; Offermann 1977;Offermann, 1985; v. Zahn, 1987; Thrane,1986). Planetary waves, gravity waves,and turbulence were all studied exten-sively. A few comparative data on minorconstituents are also available, as tracespecies can act as valuable tracers fordynamics (e. g. Grossmann et al., 1987).
These GBR campaigns suffered, however,from their lack of horizontal coverage.Most of them were performed at one placeonly, and hence their results were one-dimensional in space. In those cases whensome horizontal coverage was tried eitherthe altitude regime studied or thehorizontal extension was limited.
To improve this situation, the DYANAcampaign covers a fairly extended part ofthe Northern hemisphere, with somestations on the Southern hemisphere alsoparticipating. Of course, such a campaignis of limited duration, and thus will bea case study only.
Proc. Ninth ESAIPAC Symposium on 'European Rocket and Balloon Programmes and Related Research', Lahnstein, FRG, 3—7April 1989(ESA SP-291, June 1989)

59 260 D. OFFERMANN
2. CAMPAIGN OBJECTIVES
Obviously there is a clear need formiddle atmosphere dynamics measurementswith high resolution in the verticaldirection, in the horizontal direction,and in time. This applies equally well tothe study of planetary waves, gravitywaves, turbulence, and minor constituentsdistributions. The DYANA campaign istherefore designed such that measurementsare taken at various places simultaneous-ly. The measurement and launch sites forma network with a mesh width varying froma few hundered kilometers in its centralpart (Western Europe) to global extent inits outer part. Also the measurementsfrequency (e. g. rocket launch frequency)will be adjusted to the dynamicalfeatures studied. The key questions to bestudied this way are as follows:
1. Planetary waves
1.1. Zonal wavenumbers from low to high(by the network stations and bysatellite data)
1.2. Meridional wavenumbers from low tohigh
1.3. Vertical amplitude and phasestructure with high spatialresolution up to the mesopause (byrockets and lidars); search for Lambwaves.
1.4. Search for "standing planetarywaves", study of vertical modalstructures and of their horizontalextent.
1.5. Damping/saturation in the mésosphèreby gravity waves, turbulence, etc.
1.6. Coupling of the middle atmosphère tothe troposphere and thermosphère(wave excitation and damping)
1.7. Comparison of temperature and windoscillations
2. Gravity waves
2.1. Local characteristics, determined bydifferent techniques in the samearea
2.1.1. Horizontal and verticalstructure
2.1.2. Vertical distribution of energy2.1.3. Sources: orography, jet stream,
geostrophic adjustment, etc.
2.1.4. Dissipation: breaking byconvective or dynamicalinstabilities, relationshipwith turbulent layers
2.1.5. Saturation of spectrum; wave -wave interaction
2.2. Large scale distribution, determinedby simultaneous measurements atdifferent locations (SouthernFrance, Northern Scandinavia, Japan)
2.2.1. Variation of activity withlatitude, orography andstratospheric circulation(polar vortex over NorthernScandinavia, Aleutian high)
2.2.2. Interaction of gravity wavesand planetary waves, tides, andthe mean flow
3. Turbulence
3.1. Characteristics of turbulence3.1.1. Occurrence3.1.2. Intensity3.1.2. Variation with height, time,
and geographic location3.1.4. Minimum of e near 80 km
3.2. Energy dissipation and diffusionrate due to turbulence
3.3. Relation between gravity waves andturbulence
3.3.1. Momentum and energy flux in thewave field and turbulent field
3.3.2. Spectral characteristics ofgravity waves and turbulence
4. Minor Constituents
4.1. Altitude profiles of Oa, H2O, NO,O, H, and various source gases inthe upper stratosphere, in themésosphère, and/or lowerthermosphère.
4.2. Influence of dynamicaldisturbances on minor constituentsvertical profiles; relativeimportance of photochemistry anddynamics; study of uppermésosphère Oi spring maximum.
4.3. Non-LTE excitation mechanisms ofO, NO, 03 and HzO.
5. Intercomparisons
5.1. Rocket and lidar measurements5.2. Suborbital and satellite
measurements
3. EXPERIMENTAL SET-UP
3.1. Spatial structure
The main idea of DYANA is to set up astation network with a mesh width thatis small in its central part andincreases towards its outer parts. Thenetwork consists of a "central", an"inner", and an "outer" part. The"central" part (Fig. 1) is located inWestern Europe and consists of nine lidarstations, two rocket ranges, and severalother ground experiments. Typical meshwidth is 500 - 1000 km. The "inner"network extends northward and eastward,and includes stations in NorthernScandinavia and in the USSR. The meshwidth is 2000 - 4000 km. The "outer" netfinally extends to America and EasternAsia. The mesh width in the zonaldirection is 8000 to 12.000 km. TheEurasian part of the network extendsalmost from the pole to the equator.
3.1.1. Ground based experiments. Most ofthe ground based experiments participa-ting in the campaign are shown in Fig. 1and given in more detail in Tab. 1.
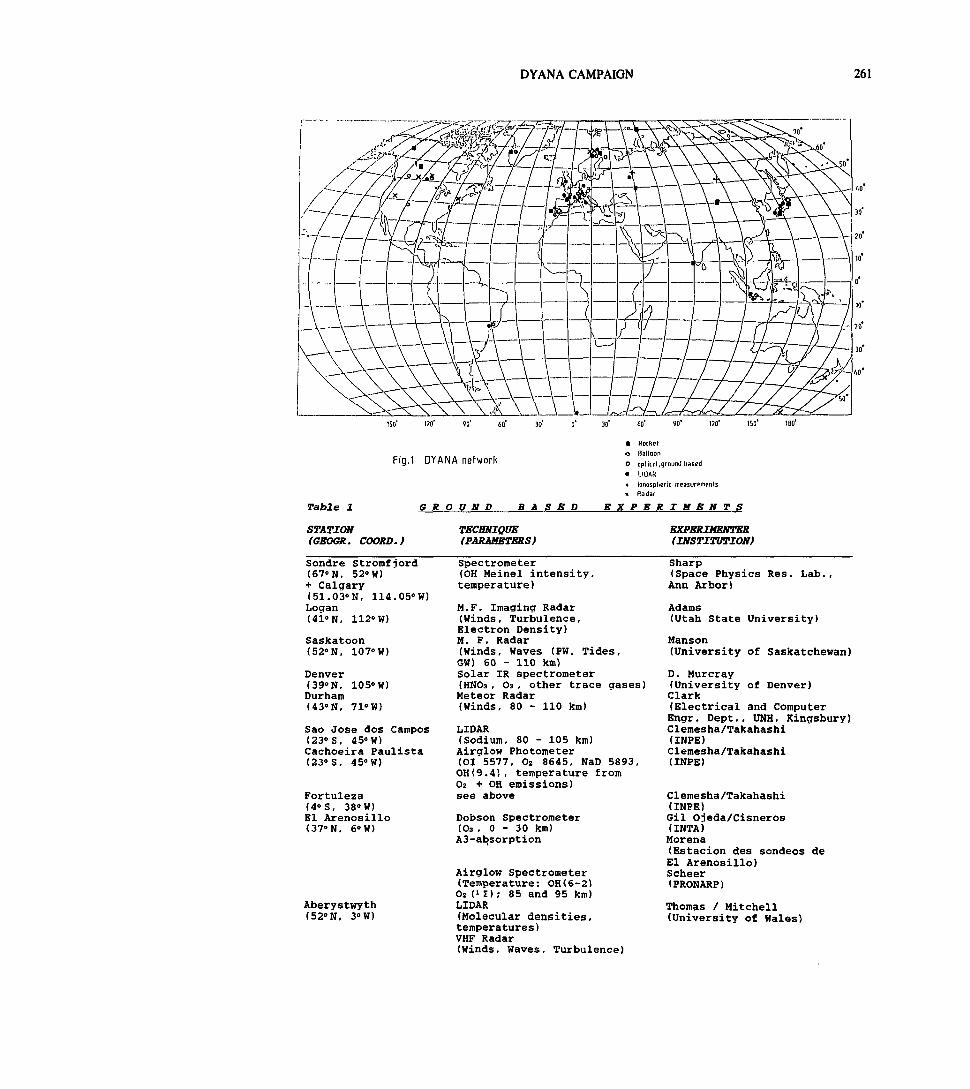
DYANA CAMPAIGN 261
90' 120 150' 180'
Fig.1 DYANA network
Table 1
STATION(GBOGR. COORD.)
GROUND BASED
TECHNIQUE(PARAMETERS)
• Rocket
O Balloon
O oplkiil, ground hased
• LIQAH
• iooospliertc measurementsx Radar
EXPERIMENTS
EXPERIMENTER(INSTITUTION)
Sondre Stromfiord(67 0 N, 52 0 W)+ Calgary(51.03°N, 114.05°W)Logan
Saskatoon(52 0N, 1070W)
Denver(39°N. 105»W)
Durham(43°N, 710W)
Sao Jose dos Campos(23° S. 450W)Cachoeira Paulista(23 0S, 45 0 W)
Fortuleza(4°S, 38»W)El Arenosillo(370N, 6°W)
Aberystwyth(520N, 30W)
Spectrometer(OH Meinel intensity,temperature)
M.F. Imaging Radar(Winds, Turbulence,Electron Density)M. F. Radar(Winds, Waves (FW, Tides,GW) 60 - 110 km)Solar IR spectrometer(HNO3, Oa, other trace gases)Meteor Radar(Winds, 80 - 110 km)
LIOAR(Sodium, 80 - 105 km)Airglow Photometer(OI 5577, 02 8645, NaD 5893,OH<9.4), temperature fromO: + OH emissions)see above
Dobson Spectrometer(Oo , O - 30 km)A3-absorption
Airglow Spectrometer(Temperature: OH(6-2)Oz (' Z) ; 85 and 95 km)LIDAR(Molecular densities,temperatures)VHF Radar(Winds, Waves, Turbulence)
Sharp(Space Physics Res. Lab.,Ann Arbor)
Adams(Utah State University)
Hanson(University of Saskatchewan)
D. Murcray(University of Denver)Clark(Electrical and ComputerEngr. Dept., UNH, Kingsbury)Clemesha/Takahashi(INPE)Clemesha/Takahashi(INPE)
Clemesha/Takahashi(INPE)Gil Ojeda/Cisneros(INTA)Morena(Estacion des sondeos deEl Arenosillo)Scheer(PRONARP)
Thomas / Mitchell(University of Wales)
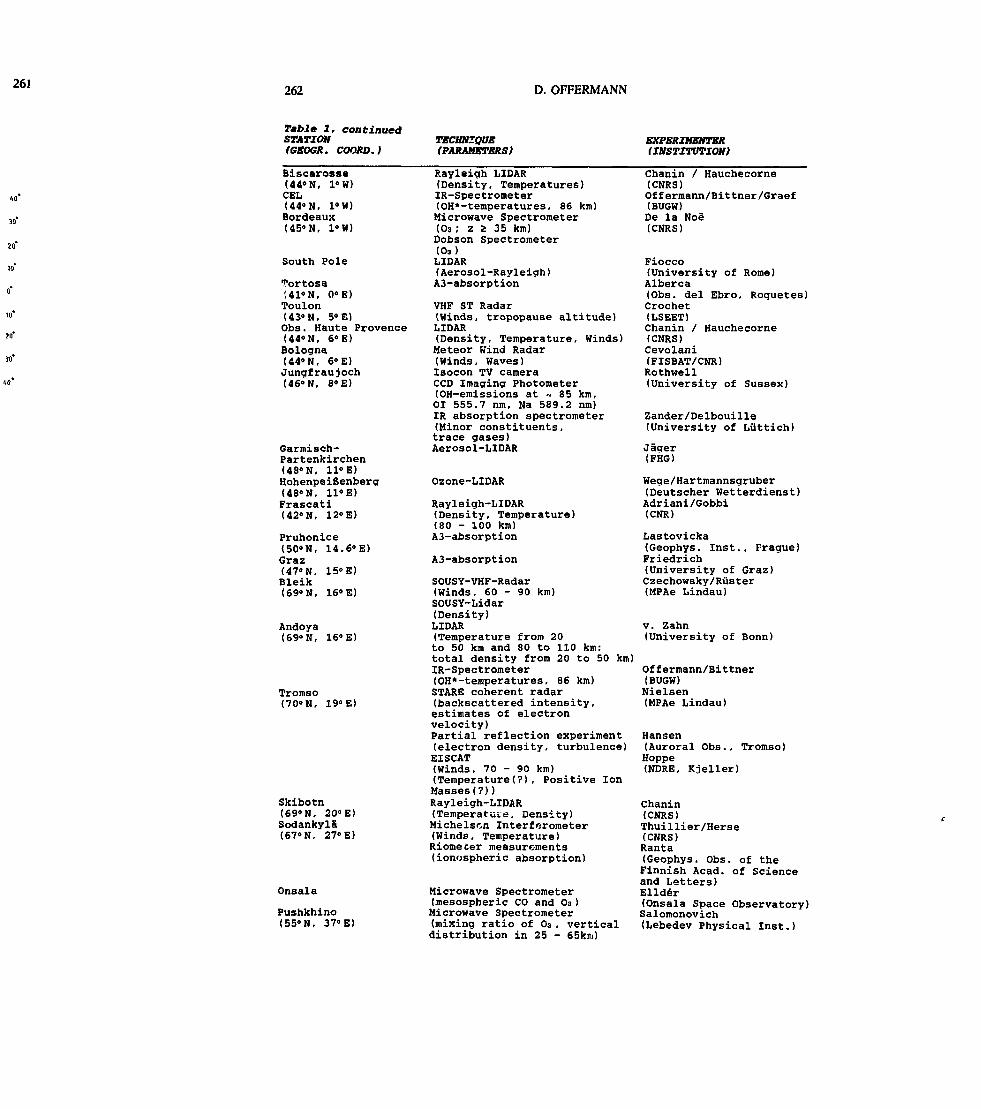
261 262 D. OFFERMANN
Table 1, continuedSTATION(GSOGR. COORD.)
TSCOlKOUE(PARMISTBRS)
BXPERIMSHTSR(INSTITUTION)
Biscarosse(44°N, I0W)CEL<44°N, I0W)Bordeaux(45°N, 1°W)
South Pole
Tortosa!410N, 0«E)Toulon(43°N, 50E)Obs. Haute Provence(44°N, 6° E)BolognaU4°N, 6« E)Jungfraujoch(46°N, 8« E)
Garmisch-Partenkirchen<48°N, 11»E)Hohenpeifienberg(480N, U0E)Frascati(42° N, 12° E)
Pruhonice(50°N, 14.6»E)Graz(4TN, 15«E)Bleik(69°N, 16« E)
Andoya(69°N, 16° E)
Tromso(7O0N, 190E)
Skibotn(69°N, 2O0E)Sodankylâ(67°N, 270E)
Onsala
Pushkhino(550N, 370E)
Rayleigh LIDAR(Density, Temperatures)IR-Speotrometer(OH*-temperatures, 86 km)Microwave Spectrometer(O3 ; z 2 35 km)Dobson Spectrometer(O3)LIDAR( Aerosol -Rayl eigh )A3-absorption
VHF ST Radar(Winds, tropopause altitude)LIDAR(Density, Temperature, Winds)Meteor Wind Radar(Winds, Waves)Isocon TV cameraCCD Imaging Photometer(OH-emissions at - 85 km,OI 555.7 nm, Na 589.2 nm)IR absorption spectrometer(Minor constituents,trace gases)Aerosol-LIDAR
Ozone-LIDAR
Rayleigh-LIDAR(Density, Temperature)(80 - 100 km)A3-absorption
A3-absorption
SOUSY-VHF-Radar(Winds, 60 - 90 km)SOUSY-Lidar(Density)LIDAR(Temperature from 20to 50 km and 80 to 110 km;total density from 20 to 50 km)IR-Spectrometer(OH*-temperatures, 86 km)STARE coherent radar(backscattered intensity,estimates of electronvelocity)Partial reflection experiment(electron density, turbulence)EISCAT(Winds, 70 - 90 km)(Temperature!?), Positive IonMasses(?})Rayleigh-LIDAR(Température, Density)Michelscn Interferometer(Winds, Temperature)Riometer measurements(ionospheric absorption)
Microwave Spectrometer(mesospheric CO and O3)Microwave Spectrometer(mixing ratio of O3, verticaldistribution in 25 - 65km)
Chanin / Hauchecorne(CNRS)Offermann/Bittner/Graef(BUGW)De la Noë(CNRS)
Fiocco(University of Rome)Alberca(Obs. del Ebro, Roquetes)Crochet(LSEET)Chanin / Hauchecorne(CNRS)Cevolani(FISBAT/CNR)Rothwell(University of Sussex)
Zander/Delbouille(University of Luttich)
Jâger(FHG)
Wege/Hartmannsgruber(Deutscher Wetterdienst)Adriani/Gobbi(CNR)
Lastovicka(Geophys. Inst., Prague)Friedrich(University of Graz)Czechowsky/Ruster(MPAe Lindau)
v. Zahn(University of Bonn)
Offermann/Bittner(BUGW)Nielsen(MPAe Lindau)
Hansen(Auroral Obs., Tromso)Hoppe(NDRE, Kjeller)
Chanin(CNRS)Thuillier/Herse(CNRS)Ranta(Geophys. Obs. of theFinnish Acad. of Scienceand Letters)Elldér(Onsala Space Observatory)Salomonovich(Lebedev Physical Inst.)

DYANA CAMPAIGN 263
Table 1, concludedSTATION(GEOGR. COORD.)
TECHNIQUE(PARAMETERS)
EXPBRIMBNTSK(INSTITUTION)
Gorky(56°N. 46« E)
Irkutsk(52°N. 104«E)
Hatukosek(TS. 1120E)
Fukuoka<33»N, 130«E)Nagoya(35«N, 136«E)Shigasaki(35«N, 136"E)
Tsukuba(36«N, 140«E)
Scott Base(78° S, 167« E)
Christchurch(44« S, 173°E)
VLF signal generationCrossmodulation Measurements(Direction of ionophericcurrents, turbulence, periodsof acoustic gravity waves andvertical wavelengths, Ne(h),Yt* (h)profilesIonospheric windsby Dl method, 4f-range
Ionospheric Transceiver
Rayleigh-LIDAR(Density, Temperature)LIDAR(Density, Temperature)MU-Radar(Winds, Waves)
LIDAR(Oa, Density, Aerosols)
Medium frequency partialreflection spaced antennawind radar(horizontal winds)as above
Kotik(Radiophys. Res. Inst., Gorky)
Kazimirovsky(Siberian Institute ofTerr. Magn., Ionosphere andRadio Propagation)Soegijo(Indonesian Inst. ofAeronautics and Space,Bandung)Shibata/Maeda(Kyushu University)Iwasaka(Nagoya University)Kato/Fukao/Yamanaka(Kyoto University)Tamaka(Water Res. Inst., Nagoya)Nakane(National Inst. forEnvironmental Studies)Fraser(Univ. of Canterbury)
Fraser(Univ. of Canterbury)
Numerous lidars will measure atmosphericdensity and temperature, or minor con-stituents as ozone and sodium. VariousMST, ST and other radars will determinehorizontal and vertical winds. Some ofthem will also detect atmospheric tur-bulence. Minor constituents and theirreactions to dynamical disturbances willbe monitored by a variety of spectro-meters and photometers/radiometers foremission as well as absorption measure-ments in the visible, infrared and micro-wave p*rt of the spectrum. A network ofionospheric stations will observe D- andE~region reactions to atmosphericdynamics.
3.1.2. Balloon experiments. Balloonexperiments are mostly dedicated tostratospheric ozone. Variations in the Oafield are good indications for dynamicaldisturbances on various scales (see forinstance De Bakker, 1988). Other balloonflights are planned to determine variousminor constituents in the stratosphere.Details are given in Tab. 2. Coordinationof a CHEOPS campaign with DYANA is apossibility.
3.1.3. Rocket experiments. A largenumber of meteorological rockets will beflown in the stratosphere and mésosphère(Datasondes, M 100, falling spheres).They complement the lidar and radarmeasurements to determine a full set ofdynamical parameters (winds, density,temperature) with high vertical
resolution, good time and altitudecoverage, and independence of localweather. Pairs of rockets with passivefalling spheres and Datasondes cover thelargest possible altitude regime. This isimportant because some planetary wavesexhibit characteristic structures in the60 - 75 km and 30 - 50 km regime. Goodradiosonde data are required as a basisfor the rocket data analysis, and toprovide the link to the troposphere.Hence a number of radiosonde releasesis planned. Falling spheres requireprecision tracking radars, and aretherefore launched only from places wheresuch radars are available (RIR 774 C,MPS 36, FPS 16, etc.).
A number of larger rockets are plannedfor the study of turbulence in the uppermésosphère/lower thermosphère. They willbe launched in Northern and WesternEurope. It is intended to studylatitudinal differences of turbulencethis way.
Several larger rockets will be launchedto determine minor constituents in themiddle atmosphere (Oa, source gases,radicals). Minor constituents are verysensitive to atmospheric dynamics. Thisholds especially for Oa and HzO in themésosphère, but also for many otherspecies in the middle atmosphere. Someionospheric parameters will also bemeasured. Details of the rocketexperiments are given in Tab. 3.

264 D. OFFERMANN
Table 2 BALLOON SXPBRIMSUTS
STATIOH EXPERIMENT(GBOGR. COORD. ) (SOHBSR)
El Arenosillo Oa -Sonde(3TN, 6°E) (20 x ECC)Hohenpeifienbera O» -Sonde(47«N. 11»E) (3 x B/M
per week)Garmisch- Oa -SondePartenkirchen (B/M)(47«N. 11«E)ESRANGE ?
Hyderabad Cryo Sampler,(17»N, 78« E) Radiation payload
Pameunpeuk Oa -Sonde(7«S. 107« E)Southern ScientificHemisphere Balloon Gondola
Table 3 SOCKS
STATION VSSICLS NUMBER(GSOGR . COORD. ) (EXPSRIMSNT)
Cold Lake Super Loki 18(54» N, 110» W) (Datasonde)
El Arenosillo Super Loki 15(37« N, 6° W) (Datasonde)
Super Loki 5(Datasonde)
CEL Viper IIIA-12A 31(44«N. I0W) (Falling Sphere)
(3 test flights)
Viper IIIA-12A 15(Chaff)Viper IIIA-12A 8(Chaff)
Viper IIIA-12A 4(Falling Sphere)
Nike Orion 8(TURBO)
Andoya Viper IIIA-12A 33(69« N, 16« E) (Falling Sphere)
Super Loki 24(Datasonde)
Viper IIIA-12A 15 &(Chaff)Nike Orion 8(TURBO)
FLOATALTITUDE
35 km
35 km
35 km
40 km
T SXPS
APOGEE
73 km
73 km
73 km
113 km
z S 110 km
z S 110 km
113 km
125 km
113 km
73 km
110 km
125 km
OBJECTIVE
Ozone
Ozone
Ozone
Trace ?Constituents ?MinorConstituents
Ozone
TraceConstituents,Temperature ,PotentialTemperature
R IMENTS
OBJECTIVE
Temperature ,Winds(z <; 65km)
Temperature ,Winds(z <. 65 km)as above
Density, Tempe-rature , Winds(z S 100 km)
Winds(60km - 105km)Winds(60km - 105km)
Density, Tempe-rature , Winds(z & 100 km)Turbulence,Density
Density, Tempe-rature, Winds(z <. 100 km)Temperature ,Winds(z <; 65 km)Winds(65km - 105km)Turbulence,Density
EXPERIMENTER(INSTITUTION)
Gil/Cisneros(INTA)Wege/Har tmannsar uber(DWD)Jâger(FMG)
Schmidt ?(KFA Jiilich) ?Borchers /Subbaraya(MPAe / PROSoeoi jo(LAPAN)Aimedieu,(CNRS)
EXPERIMENTER(INSTITUTION)
Offermann/Bittner(BUGW)Soule(CFB Cold Lake)Schmidlin(NASA)Offermann/Bittner(BUGW)
Gil(INTA)Offermann/Bittner(BUGW)Mourié(CEL)Hauchecorne(CNRS)Widdel(MPAe)v.Zahn /Siebenmorgen(Univ. of Bonn)v. Zahn /Siebenmorgen(Univ. of Bonn)v. Zahn/Lûbken(Univ. of Bonn)Thrane/Blix(NDRE)Offermann/Bittner(BUGW)
Offermann/Bittner(BUGW)
Widdel(MPAe)v. Zahn/Lûbken(Univ. of Bonn)Thrane/Blix(NDRE)
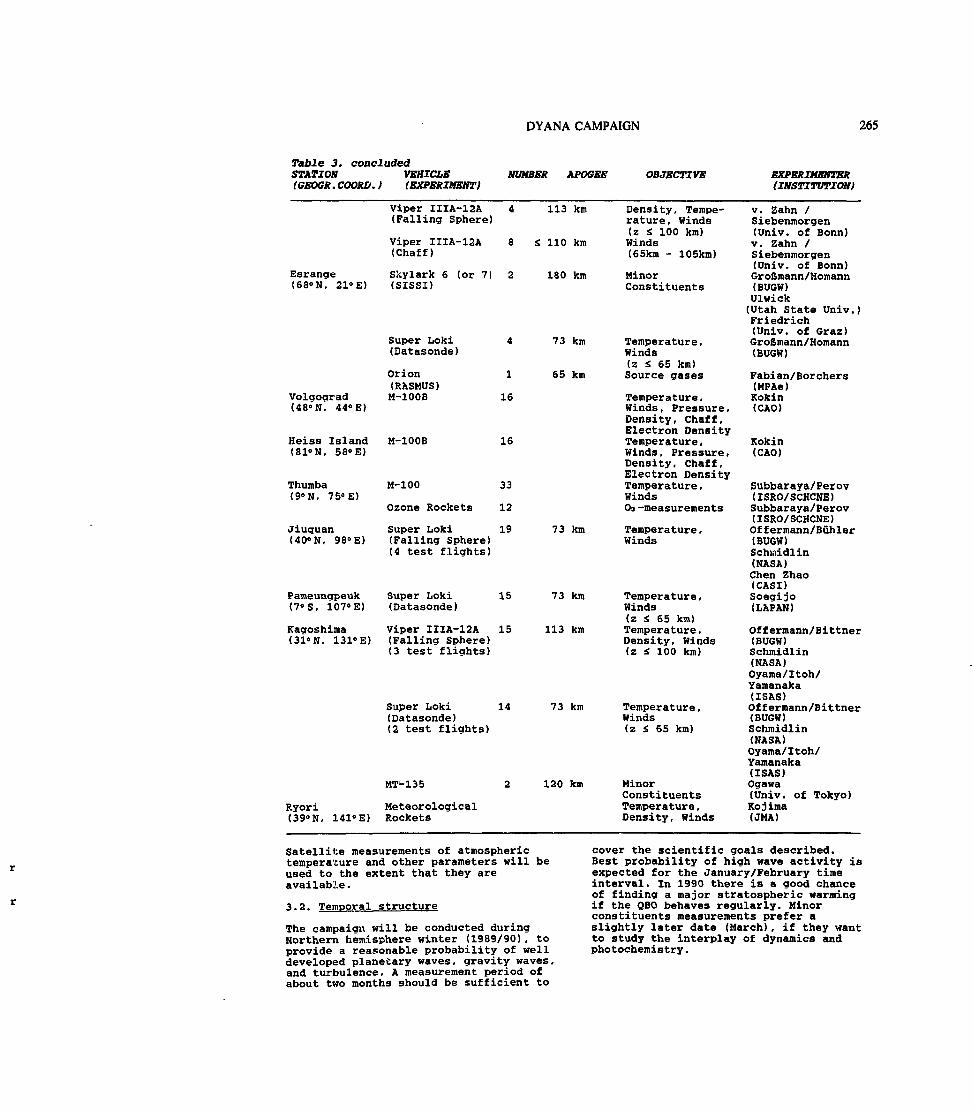
DYANA CAMPAIGN 265
TaJbJe 3. concludedSTATION(GSOGR. COORD.
Esranae(68«N, 210E)
Volgograd(48° N, 44° E)
Heiss Island(81°N, 58«E)
Thumbs(9°N. 75« E)
Jiuquan(40«N. 980E)
Pameunapeuk(7° S, i07«E)
Kaaoshima(31«N, 1310E)
Ryori(390H, 1410E)
VEHICLE NUMBER APOGEE) (EXPERIMENT)
Viper IIIA-12A 4 113 km(Falling Sphere)
Viper IIIA-12A 8 <: 110 km(Chaff)
Skylark 6 (or 7) 2 180 km(SISSI)
Super Loki 4 73 km(Datasonde)
Orion 1 65 km(RASMUS)M-IOOB 16
M-IOOB 16
M-IOO 33
Ozone Rockets 12
Super Loki 19 73 km(Falling Sphere)(4 test flights)
Super Loki 15 73 km(Datasonde)
Viper IIIA-12A 15 113 km(Falling Sphere)(3 test flights)
Super Loki 14 73 km(Datasonde)(2 test flights)
MT-135 2 120 km
MeteorologicalRockets
OBJECTIVE
Density, Tempe-rature , Hinds(z Z 100 km)Winds(65km - 105km)
MinorConstituents
Temperature,Winds(z S 65 km)Source gases
Temperature,Winds , Pressure ,Density, Chaff,Electron DensityTemperature ,Winds , Pressure ,Density, Chaff,Electron DensityTemperature ,Winds03 -measurements
Temperature ,Winds
Temperature ,Winds(z S 65 km)Temperature ,Density, Winds(z <: 100 km)
Temperature ,Winds(z S 65 km)
MinorConstituentsTemperature ,Density, Winds
EXPERIMBHTBR(INSTITUTION)
v. Zahn /Siebenmorgen(Univ. of Bonn)v. Zahn /Siebenmorgen(Univ. of Bonn)Gro&mann/Homann(BUGW)Ulwick(Utah State Univ.)Friedrich(Univ. of Graz)Grofimann/Homann(BUGW)
Fabian/Borchers(MPAe)Kokin(CAO)
Kokin(CAO)
Subbaraya/Perov(ISRO/SCHCNE)Subbaraya/Perov(ISRO/SCHCNE)Offermann/Buhler(BUGW)Schmidlin(NASA)Chen Zhao(CASI)Soegijo(LAPAN)
Offermann/Bittner(BUGW)Schmidlin(NASA)Oyama/Itoh/Yamanaka(ISAS)Offermann/Bittner(BUGW)Schmidlin(NASA)Oyama/Itoh/Yamanaka(ISAS)Ogawa(Univ. of Tokyo)Kojima(JMA)
Satellite measurements of atmospherictemperature and other parameters will beused to the extent that they areavailable.
3.2. Temporal structure
The campaign will be conducted duringNorthern hemisphere winter (1989/90), toprovide a reasonable probability of welldeveloped planetary waves, gravity waves,and turbulence. A measurement period ofabout two months should be sufficient to
cover the scientific goals described.Best probability of high wave activity isexpected for the January/February timeinterval. In 1990 there is a good chanceof finding a major stratospheric warmingif the QBO behaves regularly. Minorconstituents measurements prefer aslightly later date (March), if they wantto study the interplay of dynamics andphotochemistry.
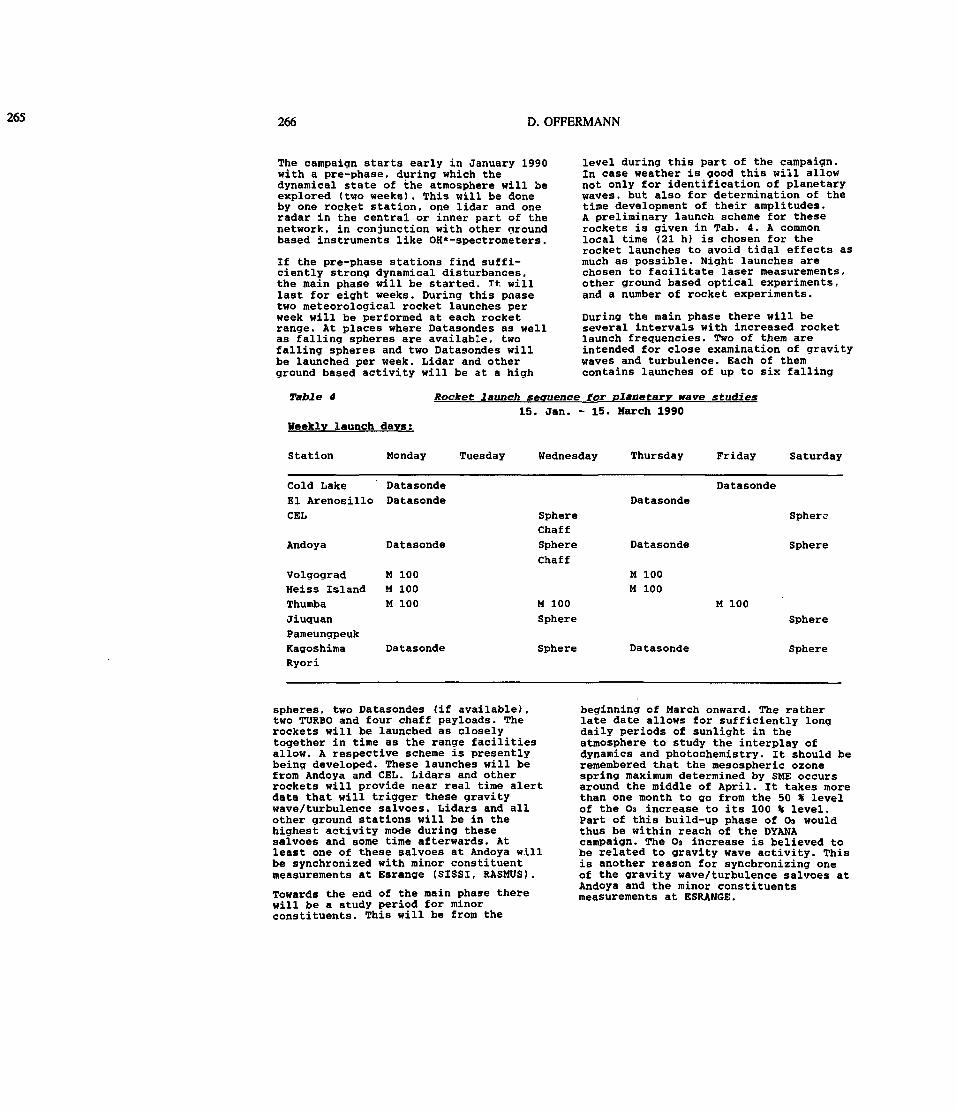
266 D. OFFERMANN
The campaign starts early in January 1990with a pre-phase, during which thedynamical state of the atmosphere will beexplored (two weeks). This will be doneby one rocket station, one lidar and oneradar in the central or inner part of thenetwork, in conjunction with other aroundbased instruments like OH*-spectrometers.
If the pre-phase stations find suffi-ciently strong dynamical disturbances,the main phase will be started. It willlast for eight weeks. During this phasetwo meteorological rocket launches perweek will be performed at each rocketrange. At places where Datasondes as wellas falling spheres are available, twofalling spheres and two Datasondes willbe launched per week. Lidar and otherground based activity will be at a high
level during this part of the campaign.In case weather is good this will allownot only for identification of planetarywaves, but also for determination of thetime development of their amplitudes.A preliminary launch scheme for theserockets is given in Tab. 4. A commonlocal time (21 h) is chosen for therocket launches to avoid tidal effects asmuch as possible. Night launches arechosen to facilitate laser measurements,other ground based optical experiments,and a number of rocket experiments.
During the main phase there will beseveral intervals with increased rocketlaunch frequencies. Two of them areintended for close examination of gravitywaves and turbulence. Each of themcontains launches of up to six falling
Rocket launch sequence for planetary nave studies15. Jan. - 15. March 1990
Weekly launch days;
Station Monday Tuesday Wednesday Thursday Friday Saturday
Cold Lake DatasondeEl Arenosillo DatasondeCEL
Datasonde
Andoya Datasonde
Volgograd M 100Heiss Island M 100
ThumbaJiuquanPameungpeukKagoshimaRyori
M 100
Datasonde
SphereChaffSphereChaff
M 100Sphere
Sphere
Datasonde
Datasonde
M 100M 100
Datasonde
M 100
Sphere
Sphere
Sphere
Sphere
spheres, two Datasondes (if available),two TURBO and four chaff payloads. Therockets will be launched as closelytogether in time as the range facilitiesallow. A respective scheme is presentlybeing developed. These launches will befrom Andoya and CEL. Lidars and otherrockets will provide near real time alertdata that will trigger these gravitywave/turbulence salvoes. Lidars and allother ground stations will be in thehighest activity mode during thesesalvoes and some time afterwards. Atleast one of these salvoes at Andoya willbe synchronized with minor constituentmeasurements at Esrange (SISSI, RASMUS).
Towards the end of the main phase therewill be a study period for minorconstituents. This will be from the
beginning of March onward. The ratherlate date allows for sufficiently lonerdaily periods of sunlight in theatmosphere to study the interplay ofdynamics and photochemistry. It should beremembered that the mesospheric ozonespring maximum determined by SME occursaround the middle of April. It takes morethan one month to go from the 50 * levelof the Oa increase to its 100 % level.Part of this build-up phase of Oa wouldthus be within reach of the DYANAcampaign. The Oa increase is believed tobe related to gravity wave activity. Thisis another reason for synchronizing oneof the gravity wave/turbulence salvoes atAndoya and the minor constituentsmeasurements at ESRANGE.
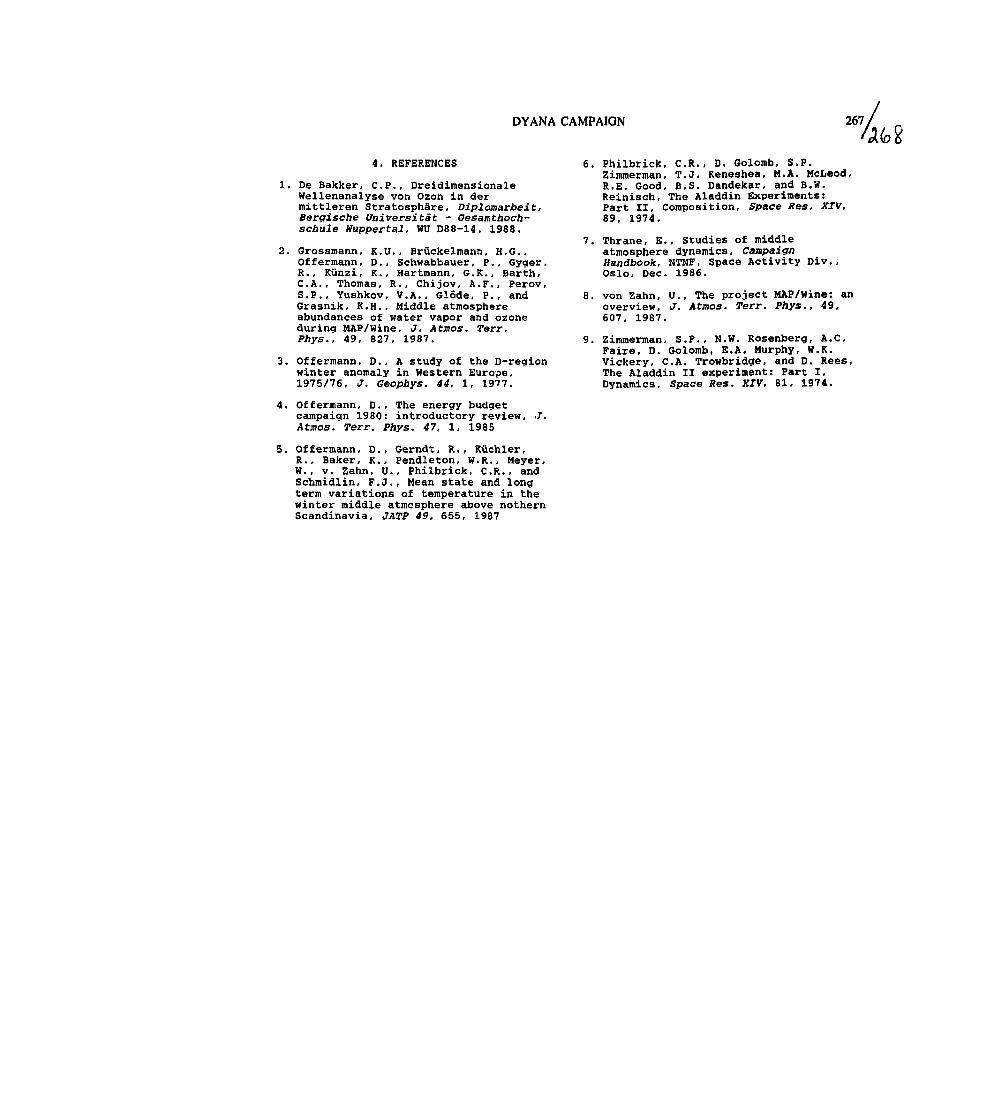
DYANA CAMPAIGN 267//1/ Q' A(Q o
4. REFERENCES
1. De Bakker, C.P., DreidimensionaleWellenanalyse von Ozon in dermittieren Stratosphere, Diplomarbeit,Bergische Universitât - Gesamthoch-schule Huppertal, WU D88-14, 1988.
2. Grossmann, K.I}., Briickelmann, H.G.,Offermann, D., Schwabbauer, P., Gyqer,R., Kunzi, K., Hartmann, G.K., Earth,C.A., Thomas, R., Chijov, A.F., Perov,S.P., Yushkov, V.A., Glôde, P., andGrasnik, K.H., Middle atmosphereabundances of water vapor and ozoneduring MAP/Wine, J. Atmos. Terr.Phys., 49, 827, 1987.
3. Offermann, D., A study of the D-regionwinter anomaly in Western Europe,1975/76, J. Geophys. 44, 1, 1977.
4. Offermann, D., The energy budgetcampaign 1980: introductory review, J.Atmos. Terr. Phys. 47, 1, 1985
5. Offermann, D., Gerndt, R., Kuchler,R., Baker, K., Pendleton, W.R., Meyer,W., v. Zahn, U., Philbrick, C.R., andSchmidlin, F.J., Mean state and longterm variations of temperature in thewinter middle atmosphere above nothernScandinavia, JATP 49, 655, 1987
6. Philbriok. C.R., D. Colomb, S.P.Zimmerman, T.J. Keneshea, M.A. McLeod,R.E. Good, B.S. Dandekar, and B.W.Reinisch, The Aladdin Experiments:Part II, Composition, Space Res. XIV,89, 1974.
7. Thrane, E., Studies of middleatmosphere dynamics. CampaignHandbook, NTNF, Space Activity Div.,Oslo, Dec. 1986.
8. von Zahn, U., The project MAP/Wine: anoverview, J. Atmos. Terr. Phys., 49,607, 1987.
9. Zimmerman, S.P., N.W. Rosenberg, A.C.Faire, D. Colomb, E.A. Murphy, W.K.Vickery, C.A. Trowbridcte, and D. Rees,The Aladdin II experiment: Part I,Dynamics, Space Res. XIV, 81, 1974.
%/î269
THE SKYLARK SOUNDING ROCKET PROGRAMME AND FUTURELAUNCHER DEVELOPMENTS BY BRITISH AEROSPACE
(SPACE SYSTEMS) LTD.
J.A. ELLIS
BRITISH AEROSPACE (SPACE SYSTEMS) LTD.BRISTOLENGLAND
ABSTRACT
The paper relates briefly to the past history ofthe Skylark Sounding Rocket, and provides abackground to the rationalisation of thevariations of Rocket now available. It liststhe last two years launch programme , with asummary of future scheduled progammes, a briefdescription is then given of the futureinterrests of BAe in Rocket Launchers, inparticular LittLEO the Small Launcher forpayloads into Low Earth Orbit.Keywords: Sounding rocket, Skylark,Programme, LittLEO,
1. INTRODUCTION - SKYLARK
Several times in the past 15 years some users otSounding Rockets have considered they wouldbecome obsolescent. However 31 years after thefirst launch of a Skylark, sales of the Rocketare continuing and it is the work horse of theEuropean Sounding Rocket Programme.
To date 410 rockets have been launched notincluding the current TEXUS programme, whichwill bring the number to 412 .
The highly successful Skylark vehicle was firstbuilt by the Royal Aircraft Establishment RAEand launched at Woomera Australia in 1957. In1961 British Aerospace,or as it was then knownthe British Aircraft Corporation BAC, becameresponsible for the preparation of SkylarkPayloads, followed in 1964 by becoming theDesign Authority for the Rocket. BAe alsoassumed the responsibility for the launches ofSkyark Rockets and had some 200 people workingon the project. Launches were carried out inlocations from Australia, Norway, Sweden, Spain,Sardinia, Brazil and Argentina.
During the period up to 1976 the team at Bristolwere involved in programmes for both theBritish National Sounding Rocket Programme andfor ESA. Unfortunately in the late 1970's bothof these programmes were phased out in favour ofSatellite payload missions. In recent years theskylark vehicles have been used by the variousGerman Programmes for both Scientific andMicrograviy payloads. Since 1957 there have beenmany developments of motors and manyconfigurations offered. At the previous ESASymposium in Sweden the Skylark 17 was presentedas an option for the Longer Duration SoundingRocket Programme which gives some idea of thenumber of variations that have been considered.To day British Aerospace (Space Systems ) Ltdoffer three options a one two and three stageRocket known as Skylark 5, 7 and 12. TheseRockets I'm sure are familiar to you all, themost common being Skylark 7 with a typicalperformance of 300kg payload to 300Km, and theSkylark 12 with a typical performance of some125Kg to 850Km.
In 1987 there were two failures of Skylark 7 atKiruna in Sweden. BAe and Royal Ordnanceconducted exhaustive investigations into thesefailures and demonstrated two unrelated causes.Appropriate modifications to the Second StageRaven XI motor were introduced and a test flightin Hay 1988 demonstrated the effectiveness ofthe changes and that Skylark was back on course.
2. SKYLARK LAUNCH PROGRAMME
Since the test flight in May 1983 there havebeen seven successful launches for the variousGerman programmes, these were:-
MISSIONLAUNCH SITE
INTERZODIACNATAL, BRAZIL
ROSEANDOYA, NORWAY
LAUNCH DATEVEHICLE
3 SEPT 88SKYLARK 12
26 NOV 88SKYLARK 75 DEC 88SKYLARK 7
Proc. Ninth ESA/PAC Symposium on 'European Rocket and Balloon Programmes and Related Research ', Lahnstein, FRG, 3—7 April 1989(ESA SP-2'.»1, June 1989)
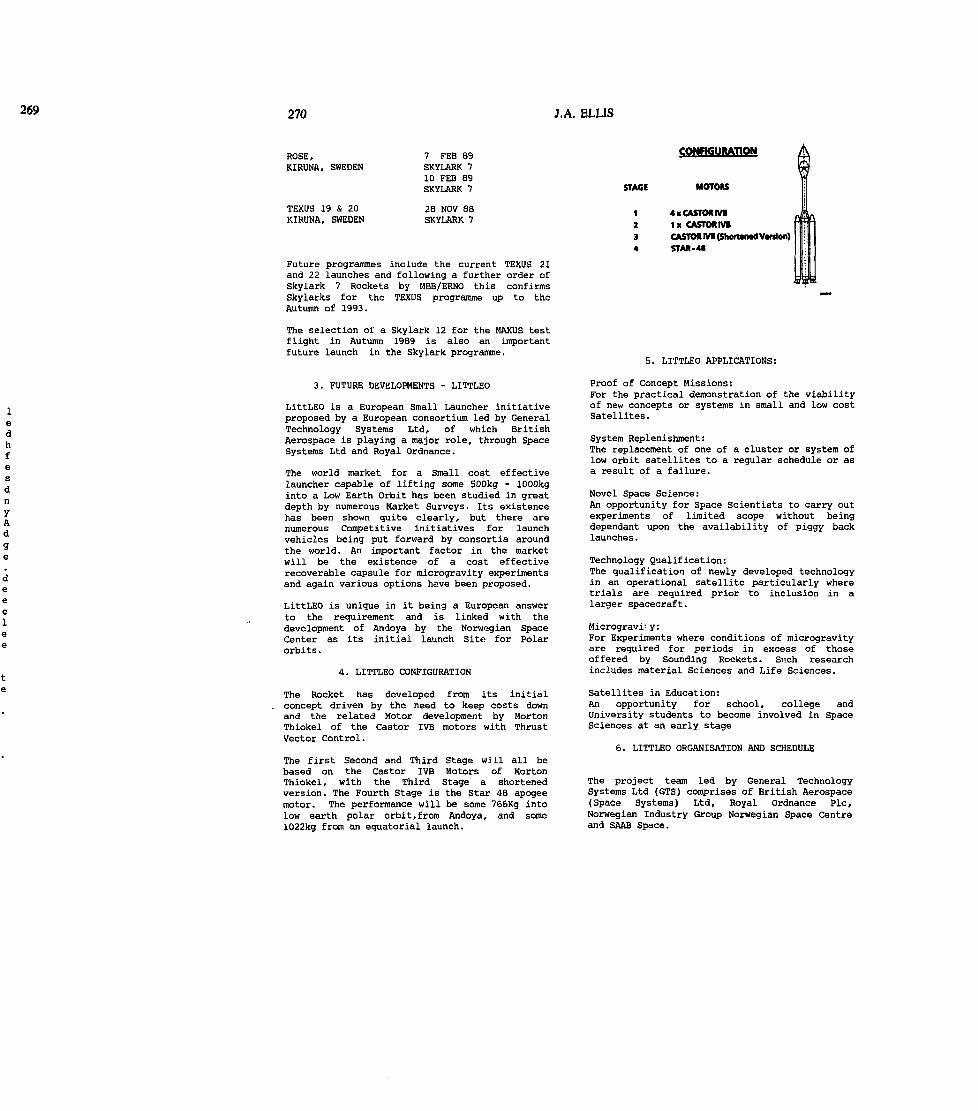
269 270 J.A. ELLIS
ROSE,KIRUNA, SWEDEN
TEXUS 19 S 20KIRUNA, SWEDEN
7 FEB 89SKYLARK 710 FEB 89SKYLARK 7
28 NOV 88SKYLARK 7
Future programmes include the current TEXUS 21and 22 launches and following a further order ofSkylark 7 Rockets by MBB/ERNO this confirmsSkylarks for the TEXUS programme up to theAutumn of 1993.
The selection of a Skylark 12 for the MAXUS testflight in Autumn 1989 is also an importantfuture launch in the Skylark programme.
3. FUTURE DEVELOPMENTS - LITTLEO
LittLEO is a European Small Launcher initiativeproposed by a European consortium led by GeneralTechnology Systems Ltd, of which BritishAerospace is playing a major role, through SpaceSystems Ltd and Royal Ordnance.
The world market for a Small cost effectivelauncher capable of lifting some 500kg - 1000kginto a Low Earth Orbit has been studied in greatdepth by numerous Market Surveys. Its existencehas been shown quite clearly, but there arenumerous Competitive initiatives for launchvehicles being put forward by consortia aroundthe world. An important factor in the marketwill be the existence of a cost effectiverecoverable capsule for microgravity experimentsand again various options have been proposed.
LittLEO is unique in it being a European answerto the requirement and is linked with thedevelopment of Andoya by the Norwegian SpaceCenter as its initial launch Site for Polarorbits.
4. LITTLEO CONFIGURATIOK
The Rocket has developed from its initialconcept driven by the need to keep costs downand the related Motor development by MortonThiokel of the Castor IVB motors with ThrustVector Control.
The first Second and Third Stage will all bebased on the Castor IVB Motors of MortonThiokel, with the Third Stage a shortenedversion. The Fourth Stage is the Star 48 apogeemotor. The performance will be some 766Kg intolow earth polar orbit,from Andoya, and some1022kg from an equatorial launch.
CONHGUKATlON
STAGE MOTORS
1 4 x CASTORIVB2 IxCASTORIVS3 CASTOR WB (Shortened Vtfflon)4 STAR-4»
5. LITTLEO APPLICATIONS:
Proof of Concept Missions:For the practical demonstration of the viabilityof new concepts or systems in small and low costSatellites.
System Replenishment:The replacement of one of a cluster or system oflow orbit satellites to a regular schedule or asa result of a failure.
Novel Space Science:An opportunity for Space Scientists to carry outexperiments of limited scope without beingdependant upon the availability of piggy backlaunches.
Technology Qualification:The qualification of newly developed technologyin an operational satellite particularly wheretrials are required prior to inclusion in alarger spacecraft.
Microgravi' y:For Experiments where conditions of microgravityare required for periods in excess of thoseoffered by Sounding Rockets. Such researchincludes material Sciences and Life Sciences.
Satellites in Education:An opportunity for school, college andUniversity students to become involved in SpaceSciences at an early stage
6. LITTLEO ORGANISATION AND SCHEDULE
The project team led by General TechnologySystems Ltd (GTS) comprises of British Aerospace(Space Systems) Ltd, Royal Ordnance PIc,Norwegian Industry Group Norwegian Space Centreand SAAB Space.
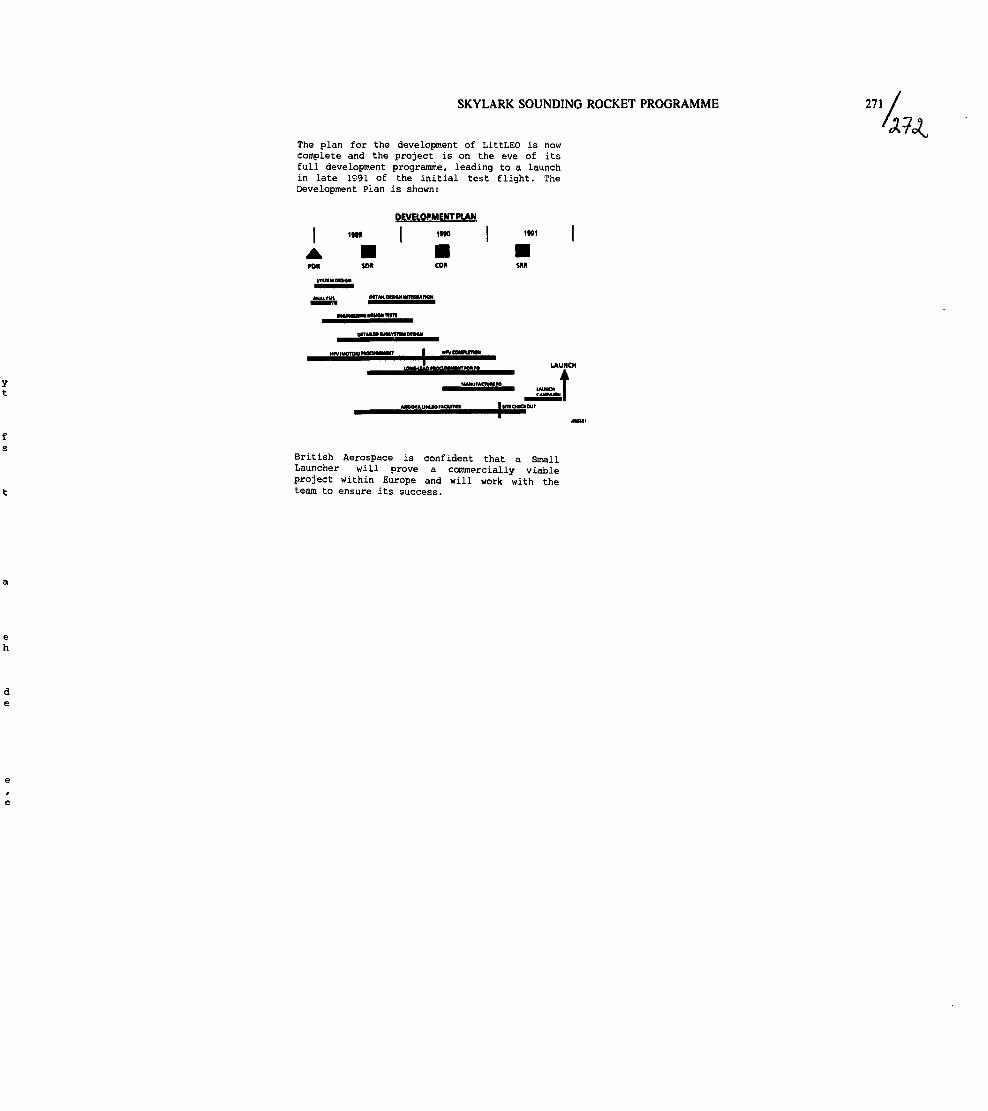
SKYLARK SOUNDING ROCKET PROGRAMME 2711 /
The plan for the development of LittLEO is nowcomplete and the project is on the eve of itsfull development programme, leading to a launchin late 1S91 of the initial test flight. TheDevelopment Plan is shown:
DEVELOFMENTPlAN
I im I 1MO ! IMl
British Aerospace is confident that a SmallLauncher will prove a commercially viableproject within Europe and will work with theteam to ensure its success.

S/
2V/3
POSTER SESSION
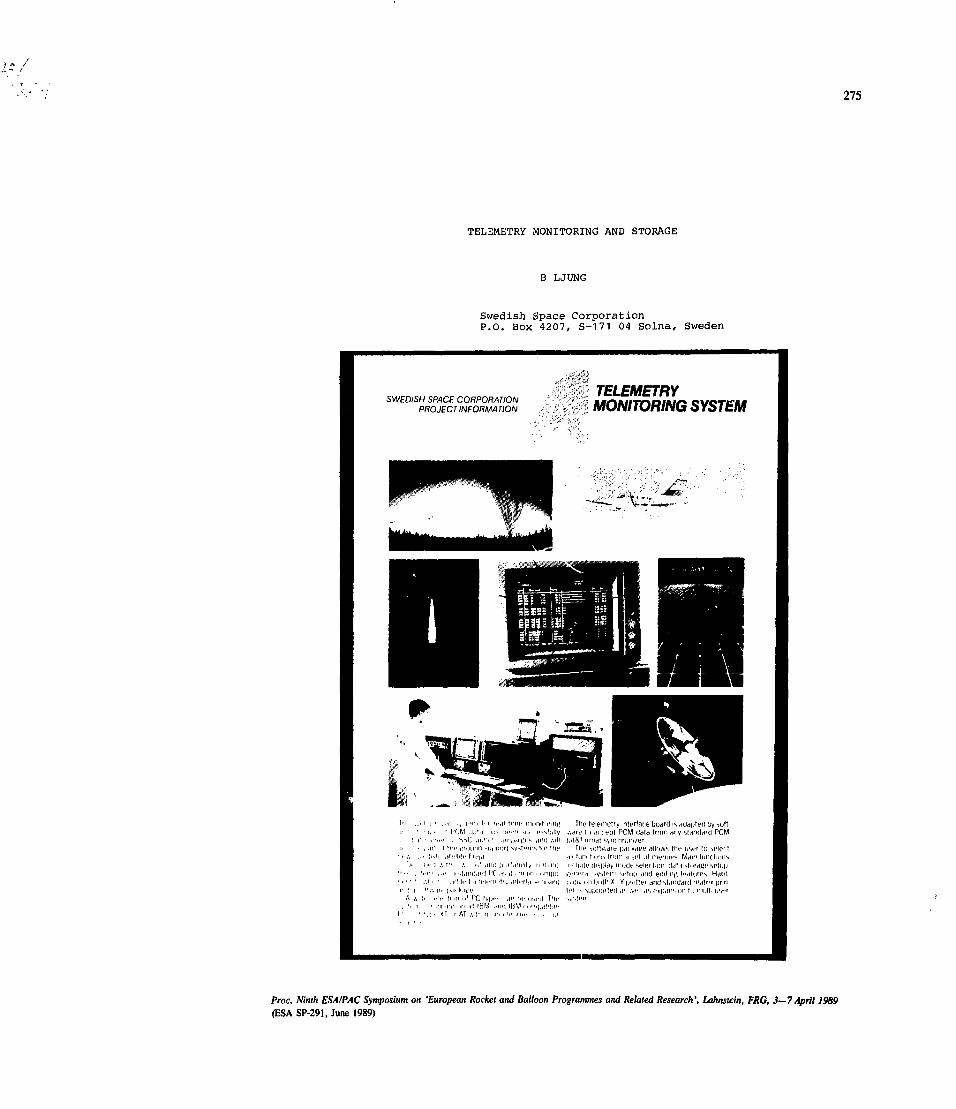
275
TELEMETRY MONITORING AND STORAGE
B LJUNG
Swedish Space CorporationP.O. Box 4207, S-171 04 Solna, Sweden
TELEMETRYMONITORING SYSTEM
SWEDISH SPACE CORPORATIONPROJECTINFORMATION
the telemetry nterlai e board is ,«!at tea l)y sod.•.tiff t j tic (eut PCM (laid lujni any
allows tMe us •' to selei I
Proc. Ninth ESA/PAC Symposium on 'European Rocket and Balloon Programmes and Related Research', Lahnstein, FRG, 3—7 April 1989(ESA SP-291, June 1989)
75 276 B. UUNG
Technical Data
PC Req»jr«nhjnîsIB' / . . - . , Vl •'.'
v-'\> .TM Interface-.
S W

277
PREDICTION OF THE 10 CM SOLAR FLUX INDEX
P. Lantos
Forecasting Center, Paris Observatory, Meudon, France
\
ABSTRACT
The 10.7-cm solar flux index evaluates andforecasts solar radiation in the X and UV range,thereby predicting effects on the terrestrialatmosphere. The origin of the centimeter emissionis reviewed, and the operational, short-termprediction method (a few days in advance) isevaluated. Long term predictions for the nextsolar cycle maximum (in 1990) are given. Thepresent cycle is probably one of the strongestsolar activity cycles.
Keywords: Solar Radiation, Solar ActivityPrediction, Solar-Terrestrial Physics
1. INTRODUCTION
The solar flux at 10.7-cm wavelength is widelyused as an index of solar activity to study theeffect of solar radiations on the Earth'satmosphere because it represents an acceptablesubstitute for more recent and more difficultabsolute X and UV measurements (see review byLean,Réf. 1). The 10.7-cm solar flux has beenmeasured with ground-based radiotélescopes since1946, ensuring a continuous set of data over four11-year solar cycles. The reference observatory islocated in Canada and the measure of the 10.7-cmflux at 17 UT is taken conventionally as the dailyindex. Unlike the sunspot number index (obtainedby sunspot counting), the 10.7-cm flux is ameasured physical index. As the solar X and UVflux is of importance for the equilibrium of theEarth atmosphere, particularly below 200 km, theapplications of the 10.7-cm index measurement andprediction deal with aeronomy and ionosphericphysics (including radio propagation). Satellitedrag predictions based on atmospheric models athigher altitudes also need solar centimetricindices.
2. ORIGIN OF THE 10-cm SOLAR EMISSION
When monthly mean values are considered, the10.7-cm flux is closely related to the number ofsunspots present on the disk, the correlationcoefficient being 0.99. A linear regressionanalysis leads to the simple relation: S = 62.76 +RI * 0.8789 where S is the 10.7-cm flux in solarflux units (10(-22) W/m2/Hz) and RI is the monthly
mean international sunspot index. Figure 1 shows acomparison of 10.7-cm flux and sunspot index forthe last cycle.The two terms of the relation correspond . to twodistinct components of the solar radio emission at10 cm wavelength in the absence of flares. Aslowly varying component is superimposed on aquiet sun background. The background is similar insize to the solar optical disk ond is of thermalorigin. The slowly varing component is also ofthermal origin but localized above active centers.Its emission mechanisms are bremmstraiilung andgyromagnetic effect (i.e. related v electronbreaking respectively by ions and by magneticfields). The excellent correlation with sunspotnumbers, when monthly mean values are considered,must not hidde the fact that the centimeteremission around 10 cm is (as UV and X-ray flux)also dependent on the solar faculae area withinthe active regions.On a daily basis, the relationship between sunspotnumber and radio flux is less strict and thus thesimilarity between both indices is particularlyusefull for long term prediction.
p i i T | - i r i i | T ! i r | n r i | i i i-rf i i i r| n i-rn
4 K J « I Ri , AMV . WVM 3Ot-O-O-JLL-T-JjJ j j.l 1.1._L_ul_i_u_t.J. 4 i i_i_J.i..i i. i>JLÏS:.i_iJ1974 1976 1978 1980 1962 1984 1986 196
Figure 1. Comparison of RI and 10.7-cm indices forthe last cycle (1976-1986).
Proc. Ninth ESAIPAC Symposium on 'European Rocket and Balloon Programmes and Related Research', Lahnstein, FRG, 3—7 April 1989(ESA SP-291, June 1989)
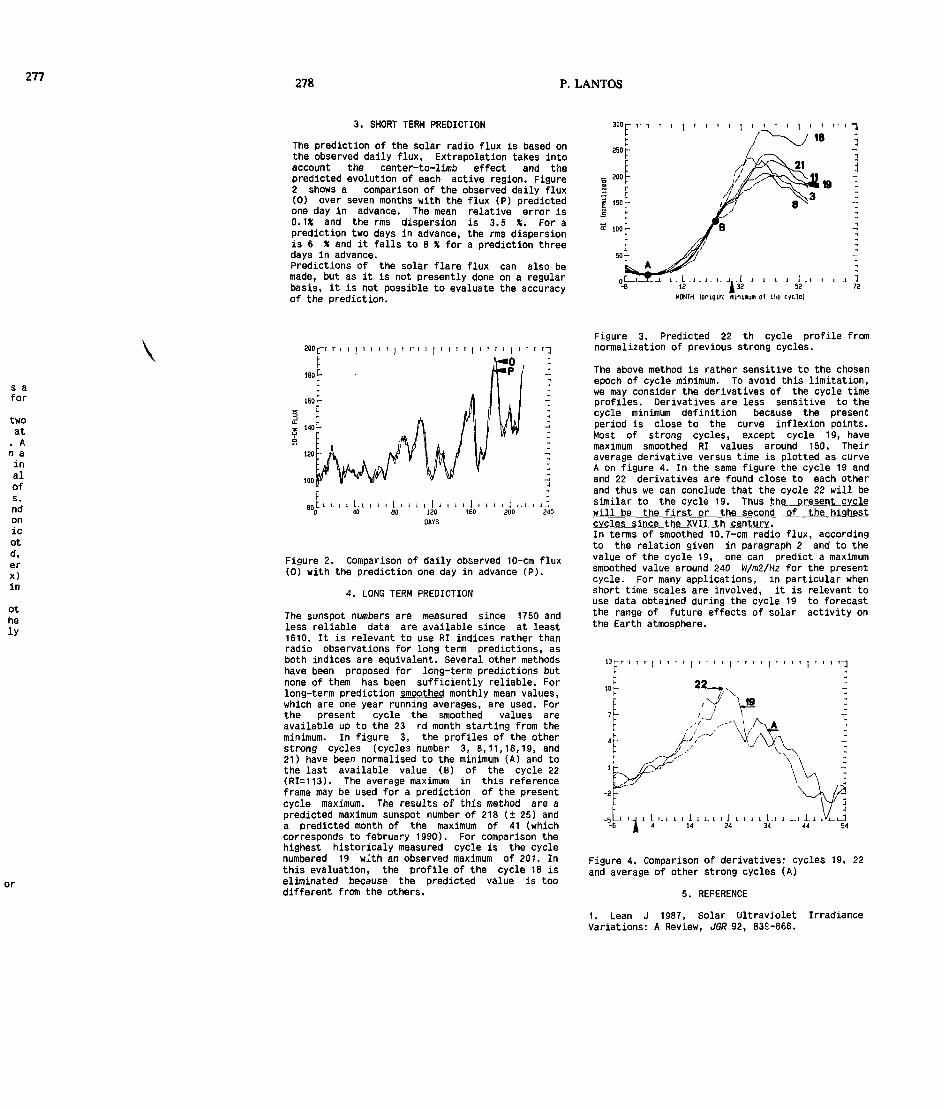
277 278 P. LANTOS
3. SHORT TERM PREDICTION
The prediction of the solar radio flux is based onthe observed daily flux. Extrapolation takes intoaccount the center-to-limb effect and thepredicted evolution of each active region. Figure2 shows a comparison of the observed daily flux(O) over seven months with the flux (P) predictedone day in advance. The mean relative error is0.1* and the rms dispersion is 3.5 X. For aprediction two days in advance, the rms dispersionis 6 X and it falls to 8 X for a prediction threedays in advance.Predictions of the solar flare flux can also bemade, but as it is not presently done on a regularbasis, it is not possible to evaluate the accuracyof the prediction.
3DOp T T i
.52
MONTH (origin: ninifflum of the cycle]
s afor
twoat. An ainalofs.ndonicotd,erx)in
I 1-1 1 L-L-J.I [ L-I L 1 .1. L. J. -L J120 160 200 240
DAYS
Figure 2. Comparison of daily observed 10-cm flux(O) with the prediction one day in advance (P).
4. LONG TERM PREDICTION
The sunspot numbers are measured since 1750 andless reliable data are available since at least1610. It is relevant to use RI indices rather thanradio observations for long term predictions, asboth indices are equivalent. Several other methodshave been proposed for long-term predictions butnone of them has been sufficiently reliable. Forlong-term prediction smoothed monthly mean values,which are one year running averages, are used. Forthe present cycle the smoothed values areavailable up to the 23 rd month starting from theminimum. In figure 3, the profiles of the otherstrong cycles (cycles number 3, 8,11,18,19, and21) have been normalised to the minimum (A) and tothe last available value (B) of the cycle 22(RI=113). The average maximum in this referenceframe may be used for a prediction of the presentcycle maximum. The results of this method are apredicted maximum sunspot number of 218 (± 25) anda predicted month of the maximum of 41 (whichcorresponds to february 1990). For comparison thehighest historicaly measured cycle is the cyclenumbered 19 with an observed maximum of 201. Inthis evaluation, the profile of the cycle 18 iseliminated because the predicted value is toodifferent from the others.
Figure 3. Predicted 22 th cycle profile fromnormalization of previous strong cycles.
The above method is rather sensitive to the chosenepoch of cycle minimum. To avoid this limitation,we may consider the derivatives of the cycle timeprofiles. Derivatives are less sensitive to thecycle minimum definition because the presentperiod is close to the curve inflexion points.Most of strong cycles, except cycle 19, havemaximum smoothed RI values around 150. Theiraverage derivative versus time is plotted as curveA on figure 4. In the same figure the cycle 19 andand 22 derivatives are found close to each otherand thus we can conclude that the cycle 22 will besimilar to the cycle 19. Thus the present cyclewill be the first or the second of the highestcycles since the XVII _th _ç_entu_ry.In terms of smoothed 10.7-cm radio flux, accordingto the relation given in paragraph 2 and to thevalue of the cycle 19, one can predict a maximumsmoothed value around 240 W/m2/Hz for the presentcycle. For many applications, in particular whenshort time scales are involved, it is relevant touse data obtained during the cycle 19 to forecastthe range of future effects of solar activity onthe Earth atmosphere.
io r
I22 .
,:/>/K
\ / "*j L-L I -J 1 1- 1. 1 1 1 I 1 L. I l J I 1 I 1 1 . I 1 L. 1 1. I LV-L-L-J1
j| 4 IA 24 34 44 54
Figure 4. Comparison of derivatives: cycles 19, 22and average of other strong cycles (A)
5. REFERENCE
1. Lean J 1987, Solar Ultraviolet IrradianceVariations: A Review, JGR 92, 836-868.

279
The German Space Science Program
Ferdinand DahlDLR, PT-WRF/WRT, KoIn, Germany
Manfred OtterbeinBMFT, Bonn, Germany
In the following a survey is given of theongoing and planned projects of extrater-restrial research within the German SpaceProgram, making a distinction betweenastronomy and exploration of the solarsystem.
The German Space Research Program distin-guishes between national, bilateral, andEuropean projects. Germany is a strongsupporter of the ESA long-term space plan"Horizon 2000" and executes a substantialcomplementary national program.
In the field of astronomy/astrophysicsthe current program contains participa-tion in the Hubble Space Telescope, inthe data evaluation of the InternationalUltraviolet Explorer IUE, launched in1978, and in ESA's astrometry satelliteproject HIPPARCOS.
To ESA's Infrared Space Observatory ISO,two German teams are contributing focalplane instruments (ISOPHOT; ISO-SWS)which are built in close cooperation withother European scientists.
The German X-ray satellite ROSAT isdesigned for a sky survey and for pointedobservations in the energy range from0.04 to 2 KeV. Manufactured in Germanywith contributions by NASA and SERC,ROSAT will be launched with an expendablelaunch vehicle in 1990.
Germany supplies an imaging Comptontelescope for 1 - 3 0 MeV (COMPTEL) and amajor part of the Energetic Gamma RayExperiment Telescope 20 MeV - 30 GeV(EGRET) to NASA's Gamma Ray Observatory(GRO).
An advanced 1 m EUV telescope ORFEUS isunder development for the free flyersystem ASTRO-SPAS, to be released fromthe Space Shuttle for a short durationmission.
Exploration of the solar system isdivided into three parts
- Magnetospheric research/Plasmaphysics- Aeronomy research and- Planetary system researchIn the area of magnetospheric researchGermany participated with SERC and NASAin the three satellites Active Magneto-spheric Particle Tracer Explorer AMPTE,successfully launched in 1984, withongoing data evaluation.SOHO, the Solar and Heliospheric Obser-vatory, and CLUSTER form the SolarTerrestrial Physics cornerstone of theESA long-term program. Many Germanscientists have been selected for sup-plying instrumental contributions to thisprogram.
In aeronomy research, CRISTA, a cryogenicinfrared spectrometer/ telescope for theatmosphere is specially developed for asecond mission of ASTRO-SPAS, to bereleased from the Space Shuttle.ASTRO-SPAS is a reusable Space Shuttlededicated satellite for space science andapplication missions.
In planetary system research using spaceprobes, the solar probes HELIOS A and Bsuccessfully supplied scientific data forover 11 years which are still evaluatedby international teams.German scientists contributed numerousscientific experiments to the GIOTTOprobe which successfully encounteredHalley's comet in March 1986.The other space probe projects withGerman participation are GALILEO toexplore Jupiter and its moons and ULYSSESwith the former designation InternationalSolar Polar Mission (ISPM), which are nowscheduled for launch on the Shuttle in1989 and 1990.
In the soviet PHOBOS project, whichconsists of two planetary probes to orbitMars' moons, German investigators areinvolved in six instrument developments.Germany plans to contribute a High
Proc. Ninth ESAIPAC Symposium on 'European Rocket and Balloon Programmes and Related Research ', Lahnstein, FRG, 3—7 April 1989(ESA SP-291, June 1989)

279 280 F. DAHL & M. OTTERBEIN
Resolution Space Camera HRSC to theMARS-94 mission of the USSRGermany will also participate in the NASAproject CRAF (Comet Rendezvous andAsteroid Fly-by mission) with scientificinstruments and a propulsion systemmodule.In addition to this, several soundingrocket projects in all disciplines havebeen performed - for instance a campaignin Australia for the SN 1987a, andseveral campaigns for the middle atmo-sphere program - and more are planned forthe future. Germany is a strong supporterof the ESRANGE special project with manycampaigns in Andoya/N and Kiruna/S.Besides future German participation inthe ESA long-term space plan, national/-bilateral projects are in a planning andpreparatory phase:SPEKTROSAT as a ROSAT successor withimproved spectral resolution and a German"Planetenteleskop" with a 1 m-mirror and< 0,1 arcsec pointing and trackingaccuracy. To the NASA project SOFIA -Stratospheric Observatory for InfraredAstronomy - the contribution of thetelescope system is in a definitionphase. A German participation in the USOrbiting Solar Laboratory OSL (formerobservatory HRSO) with a spectrograph forthe visible spectral range as part of itscoordinated instrument package is pre-sently investigated. Also a Germanparticipation in the FREJA project incooperation with Sweden, USSR, GreatBritain is under discussion.
Technological aspects of future projectsare studied in most promising areas andin preparation for these projects ortheir sophisticated scientific instrumen-tation.
The German Program makes use of theopportunities of the ESA science programas well as of the cooperation offeredfrom other organizations (e.g. NASA,IKI ) , Supplemented by national comple-mentary programs it stands as a well-balanced, comprehensive long-term programwith time phase priorities on differentscientific subjects.
Figures
German Space Research Program-Organiza-tionAstronomy ResearchMagnetospheric Research, AeronomyResearchInterplanetary Research
I OTHERS
NASA BMFT
BILATERALNATIONAL
EARTH OBSERVATIONTELECOMMUNICATIONSMICROGRAVITY ETC.
[EXPERT 'j UAKtKl »."COMMITTEES!""^
CONTRACTS
t TAD HOC iI COMMITFEES I
EXTRA-TERRESTRIALRESEARCH
PROJECT EXECUTIVERESPONSIBILITIESPROJECT MANAGEMENTSYSTEM ENGINEERINGOPERATION
GRANTS
OTHERMEMBERSTATES
EUROPEAN
INDUSTRYUNIVERSITIESMP-INSTITUTESETC.
SYSTEM ENGINEERINGPAYLOADSSATELLITES
SCIENCEINSTRUMENTSEVALUATION
DLR PT-WRF/WRT
GERMAN SPACERESEARCH PROGRAM-ORGANIZATION
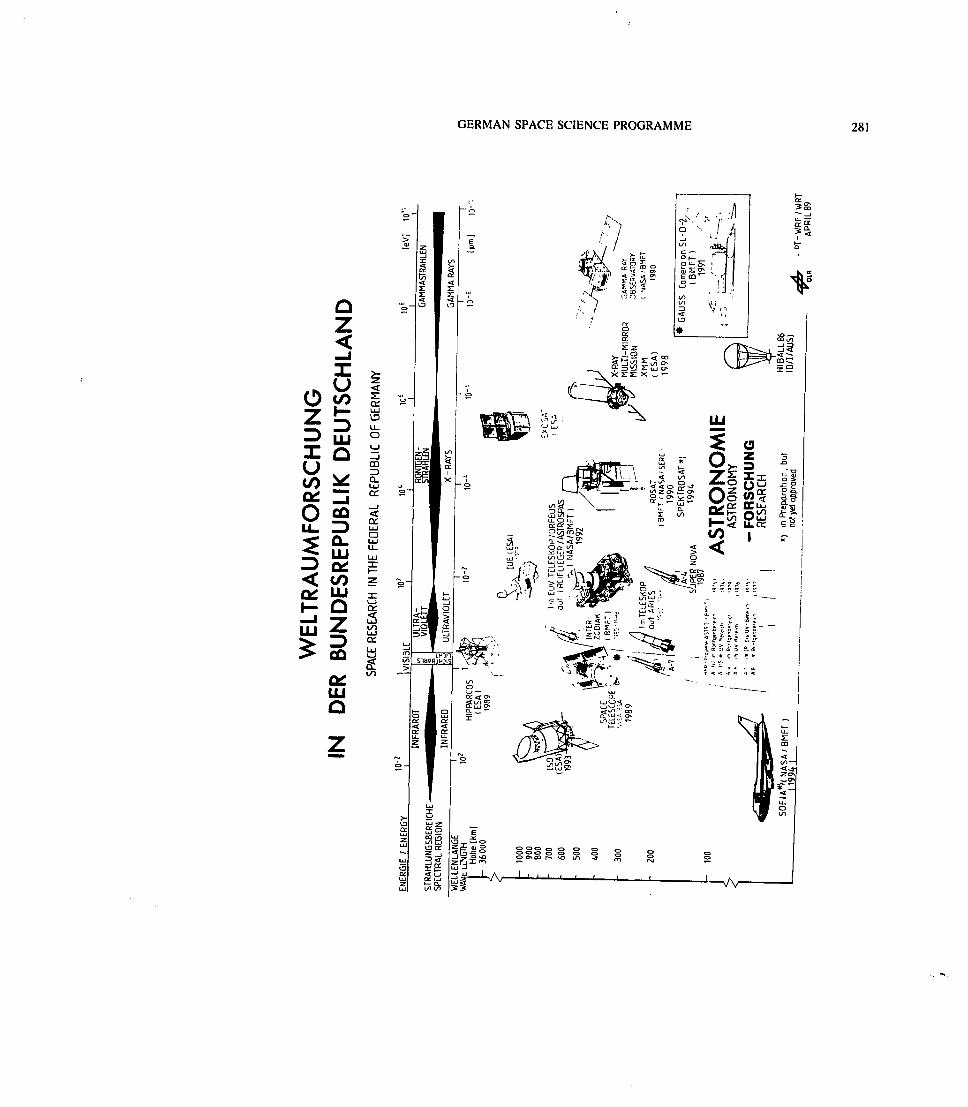
GERMAN SPACE SCIENCE PROGRAMME 281
ûZ
o * iz t
b) ^
LU
-^ °*< coCg LUJ- û
OQ
LUû
CC -UJUJ
g
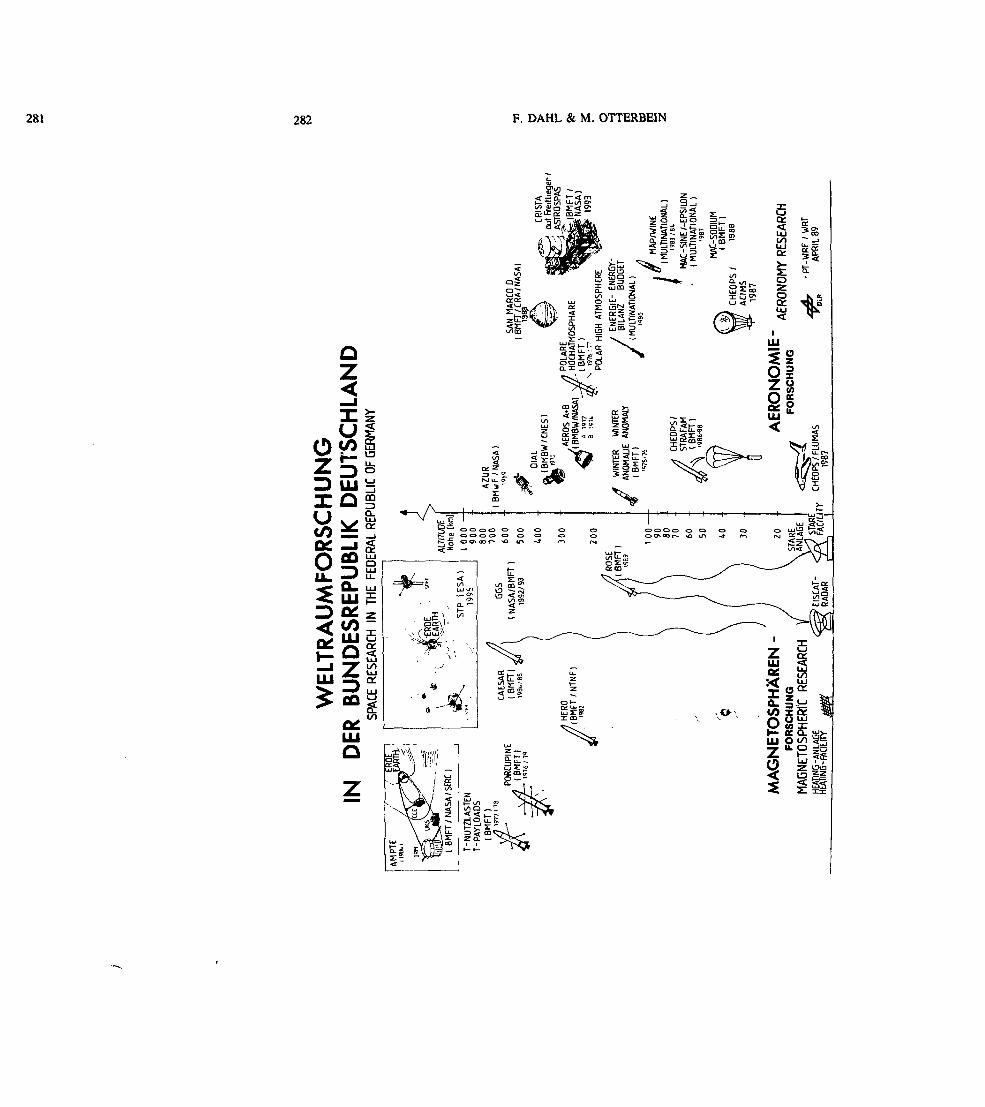
281 282 F. DAHL & M. OTTERBEIN
gIF*
aéUJXQ.l/lOZ
ST*
fnUuj^tj
£§LU CO
ILU
5g
II
5z e5 fe™lisZ 3-
^T
*
|
si
~~««
sOnQ_LU
ÉO
LU •< £ZZçh
c/ïG
hr _
3Z
S
s|s^i-CT)^CD-
g\
1/)
°r£UJ *• OOX GO;u <
f%té-
5CC
2fflCC.
•>-O
\Li I
<
tCC
3S""" _Ju. s;
fc
-(V
5
i§r
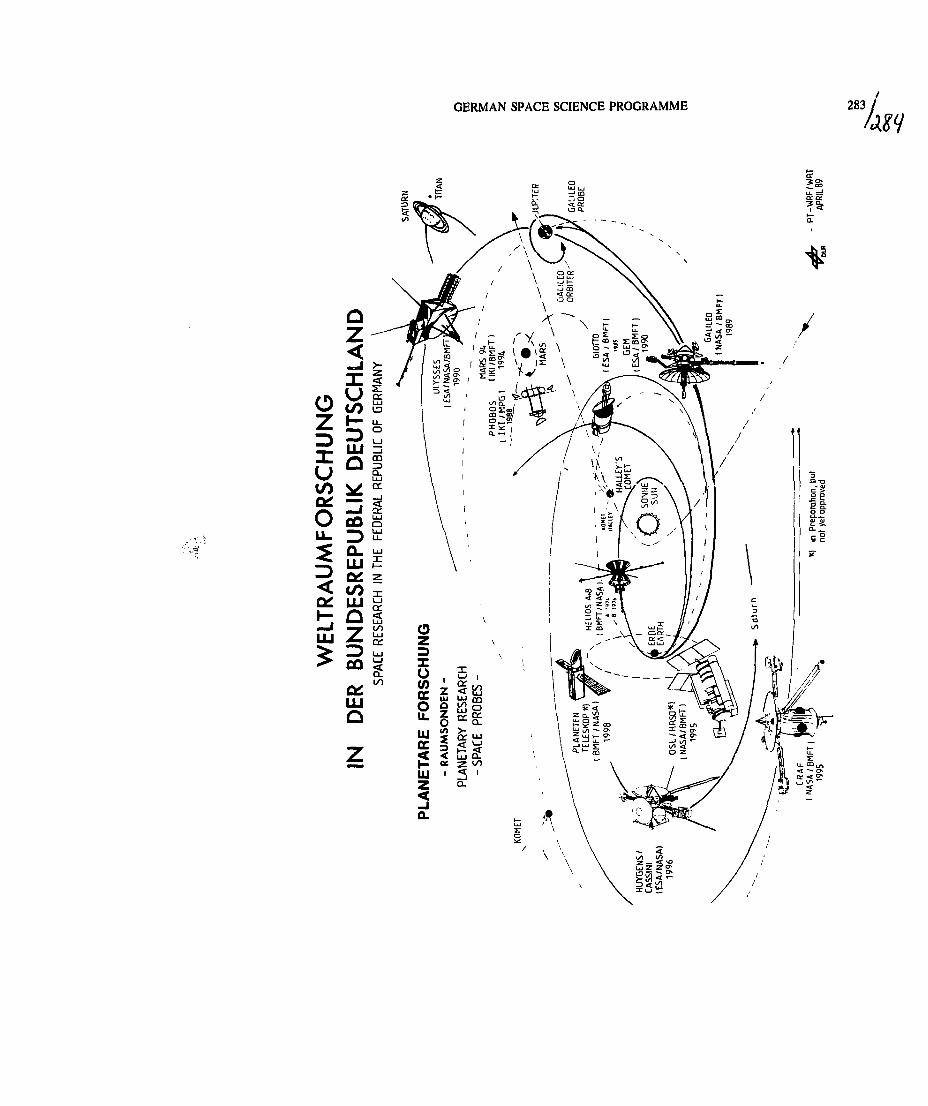
GERMAN SPACE SCIENCE PROGRAMME 283 //a
û<
OZID
=OR
SC
H
UCOH-
û
-JOù
2:CCLUL3LL.O
V-J
:EDER
AL R
EPUB
L
^ û- tu^ UJ £^ ûl s< CO io: LLJ g!T û §—J —y LOLU Z ë
CO

285
LONG DURATION BALLOON FLIGHTS IN THE MIDDLE STRATOSPHERE
Pierre Malaterre
Centre National d'Etudes Spatiales (ONES)Division Ballons18, avenue Edouard Belin31055 Toulouse Cedex, France
ABSTRACT
A scries of long duration flights has been car-ried one in the Soucnern Hemisphere, at levelsof 25 co 32 kras. Ttie scientific experiments con-cerned stratospheric water vapor measurementswith an experiment from L.H.D. (Laboratoire deMétéorologie Dynamique), Paris), and an experi-ment of geophysics with the measurement of magne-tic crus'cal anomalies over the Atlantic andPacific ocean prepared by I.P.G. (Institut dePhysique du Globe, Paris).
The balloon LS playing in important role betweensatellites and ground stations measurements,by providing in-situ datas. This is speciallytrue for the regions of the globe where meteorolo-gical sounding stations are scarce, for monito-ring of constituants such as water vapor, ozone,N02, on long range and period, in the layersof the atmosphere where they are presents.
To meet requirements outline above, C.N.E.S.has developped a balloon platform able to flyseveral weeks in the lower stratosphere witha 40 to 80 kg payload, which correspond to theactual demand of the French scientific teamsinvolved in these kind of measurements. Thisplatform can be used for any kind of experiment,so far : it needs a long time and distance flight,the payload -is not too heavy, and the flightaltitude re.nains in the lower stratosphere. Thatis the way a geophysics experiment on magneticcrustal anomalies and a humidity measurementpackage have been flying during November/December1988, over Atlantic ocean, South America, thenPacific ocean, and that a stratospheric dynamicspackage will be launched for a Transatlanticflight during the next campaign in November HJfjy.
According to the foregoing, the main character! s-tics of such a balloon are its ability to main-tain the payload at flight levels for sufficientlylong periods, and to transmit real time datasto ground stations 'oecause, generally, payloadsare not designed so as to be recovered.
Major objectives can be fulfilled with a superpres-sure balloon, but this way, after being investiga-te, still needs additionnai work and C.N.E.S. teaminvolved in those long duration flights has putits efforts to develop the MIR Project (InfraredMontgolfière). The starting point was an ideaput forward by Service d'Aéronomie from C.N.R.S.(.1 P Pommereau and A Hauchecorne ), in 1976(Réf. 1). The first proof of concept flight tookplace in December 1977. The balloon used forthis flight displaced 5 800 m3 and featured atransparent lower part and aluminised upper part.The principle is that the lower part, and theinner skin of the balloon, absorbs infrared ener-gy radiated by the earth and the background,while the rate of re-emission of the same energyis kept as low as possible by the shape of theenveloppe and a thermal coating of the upperhalf which is covered with aluminium film.
The overall efficiency of the system is suchthat, at night, with a clear sky beneath theballoon, the temperature inside the enveloppeis 25° C above ambient. This implies that theInfrared Montgolfière (IRM) principle only workswell for relatively large balloons made of ultra-light materials. IRM's currently opperated byC.N.E.S. are made of 12 microns polyester (1/2mil) and expands to a volume of 36 500 m3> Aninteresting feature of the IRM1s is that, atsunset, the absorption of the solar flux by theenveloppe greatly increases the temperature ofthe air making the balloon ascend of more then10 km from its night level. This gives an opportu-nity to make an automatic vertical sounding twicea day, and add to the interest of the horizontalsounding. So far, about 30 IRM1s have been laun-ched in six campaigns of 3 to 8 launches each.
Proc. Ninth ESA/PAC Symposium on 'European Rocket and Balloon Programmes and Relatea Research', Lahnstein, FRG, 3—7April J989(ESA SP-291, June 1989)

285 286 P. MALATERRE
The scientifi.es payloads that have been flownare listed below :
Campaign
1981
1982
1983
1985
1987
Experiment / Laboratory
Gravity waves CNRS/LMDmeasurements
Gravity waves CNRS/LMDmeasurements
Water vapor measurementsStratospheric radiative budgetDynamics of the statosphere
CNRS/SA
Water vapor measurements
CNRS/SA
Gravity waves CNRS/LMD
No scientific payload
Reference
Réf. 2
Réf. 3
Réf. 4
The 1988 campaign was set up to measure verylow concentration of water vapor in the stratos-phere, and to measure crustal geomagnetic fieldanomalies . Two French Institutes are concernedby the scientific results : the L.M.D. (Labora-toire de Météorologie Dynamique) for the watervapor measurements, and the I.P.G. (Institutde Physique du Globe) for the magnetics measure-ments.
The water vapor experiment is built around adew-point hygrometer that use Peltier thermo-elements to cool a mirror on which the waterdeposit is controlled. A pump help the air goingthrough the analysis cell. The measurement cycleis microprocessor controlled so as to optimisethe parameters of the regulation that dependgreatly of the flight altitude (in fact of theair ambient temperature and pressure). This expe-riment was previously tested on stratosphericflights of few hours in France where concentra-tion as low as 2 ppm were recorded (Réf. 5)-
The geomagnetic field experiment use a protonmagnetometer. The probe itself is attached alongthe flight train far enough in such a way thatthe magnetic perturbations due to the electronicequipment were negligible. This experiment waspreviously tested on stratospheric flights betweenSicilia and Spain (24 hours flight), (Réf. 6).
On the whole, six flights have been launchedduring the period November/December 1988, threeof them for technological purpose. The mean dura-tion on six flights is of 30 days with a maximumto 53 days with a 40 kg payload and a new designfor the shape and materials of the enveloppe.On figure 1 to 6 are given the trajectories ofthe différents flights.
The next campaign will take place in November1989 with an experiment on the study of Stratos-pheric Dynamics (C.N.R.S./S.A.), followed, in1990/1991, by the first launches for AméthysteProject, set up by C.N.R.S./L.H.D. to study thewater vapor concentration in the equatorial lati-tude. Other experiments are expected, to jointhe Project.
REFEKENCKS
1 Pommereau J P & Hauchecornc A, A new atmosphe-ric vehicle : la Montgolfière Infrarouge,Ad. Space 1Re^. Scientific Bal-Looning., 55, 1979.
2 Talagrand O (CNRS/LMD), Stratospheric hotballoon completes revolution around the globe ,Bu-LLetin of. the /'metican flet.eoio-LoQi.caJL Socie-ty, 64-9, 1983.
3 Pommereau J P, Dalaudier F, Barat J, BertauxJ L, Goutail F and Hauchecorne A (CNRS/SA),First results of a Stratospheric Experimenton board an Infrared Montgolfière balloon,Co-ipa/i proceedings, July 1984-
4 Goutail F and Pommereau J P (CNRS/SA), Stra-tospheric water vapor in-situ measurementsfrom IR Montgolfière, Coupon pioceedintyi, July1984.
5 Ovarlez J (CNRS/LMD), Banc d'étalonnage fai-ble humidité : application au développementhygromètre bas point de rosée, AcJLe-i du confiés"Meiiologie 1987". AFCIQ Cedex 7 Paris Défense.
6 Cohen Y, Menvielle M, Le Mouel J L (Laboratoirede Géomagnétisme IPGP), Mangetic measurementsaboard a stratospheric balloon, Phy.-iJ.c4 of. thef-with and P-Laneta/iy. 3nJ.eAjion.-i, 44> 1987-

LONG DURATION BALLOON FLIGHTS 287,
LM.D.IMnrM nMtgolllm
LMD..,30 (W
Figure 1 Figure 2
InrnrM noMtolMtr»
I.P.6.
LMKhM I9IW IMtEMOfMI)M' 17«
•tnfl of on MITd MUfrln.
InTnrad I1«lt9elf l»f»
P.E.T.Liuncfwit 07dtf IWBEndolfllpl
Figure 3 Figure 4
KfrodltalqellMn
P.S.I.
Figure 5 Figure 6
287 289
SN 1987 A TELEMETRY DECODING SYSTEM
Siegfried Muller
Max-Planck-lnstitut fiirextraterrestrische Physik
GarchingGermany
ABSTRACT
The Supernova telemetry data decodingand display system has been realized byusing Personal Computers with aspecial interface card. The softwaresupports data recording on hard disk,individual colour screen layouts forthe different payload units, serveraldata display types, limit checks andscreen hard copies. After flight, aplayback version is available to reviewdata stored on hard disk at variablespeed or in single steps.
Keywords : Supernova,keeping data
telemetry, house-
1. INTRODUCTION
Because time to realize the telemetrydecoding system was only some monthsand the previously systems andcomputers used for data processing wereno longer available, we decided to usewell known Personal Computers (PC's) toinstall a system which is inexpensive,easy to handle and unproblematic intransportation.
2. TELEMETRY DECODING SYSTEM
The Supernova telemetry data deliveredfrom the telemetry station (Bi-0/M) wasconverted into NRZ data and clock by abit synchronizer (see Figure 1) . Thissignals were decoded by the framesynchronizer into the frame data words(8bit parallel). A time code reader wasconverting the central time code (IRIG-B) into time data (Sbit parallel) . Aanalog tape recorder was available asbackup.
The telemetry data processing systemwas realized using two IBM-ATcompatible personal computers and oneAtari computer, each with a printer.
2.1 Housekeeping Data Processing
One PC was used for data recording onits hard disk and for displayinghousekeeping data using serveral screenwindows. After flight, disk data hasbeen reviewed with a playback versionof this program, in order to get directaccess to different data frames atvariable speed or single step.
In figure 2 you can see the screenlayout created for the Supernovapayload housekeeping data. The firstline shows the logging status with timeof day information. The big windowdisplays the selected housekeepingscreen with frame receive time. On acolor screen the names will bedisplayed white and the values green,if they are within the limits or redblinking, if they are out of limits.The lower left window shows onlycritical housekeeping data independentfrom the selected screen, if they areout of limit. The lower right window isthe command window, where the operatorcan control the program, receiveprogram messages and telemetry statusinformation. Optionally this commandwindow can be logged onto hard disk,too. The bottom line shows thecorresponding function keys for allavailable housekeeping screen layouts.
The individual colour screen layoutsfor the differe.it rocket units (e.g.experiment, ACS) are hold in tablefiles. These screens can be selected bythe operator via function keys. Thetelemetry data can be displayed inhexadecimal frame format, as convertedvalues, bit decoded schematic diagramor as analogue bar. This display typetogether with a data name, conversionparameters, limits and a unit for eachframe data word is controlled by ahousekeeping table.
Proc. Ninth ESA/PAC Symposium on 'European Rocket and Balloon Programmes and Related Research', Lahnstein, FRG, 3—7April 1989(ESA SP-291, June 1989)
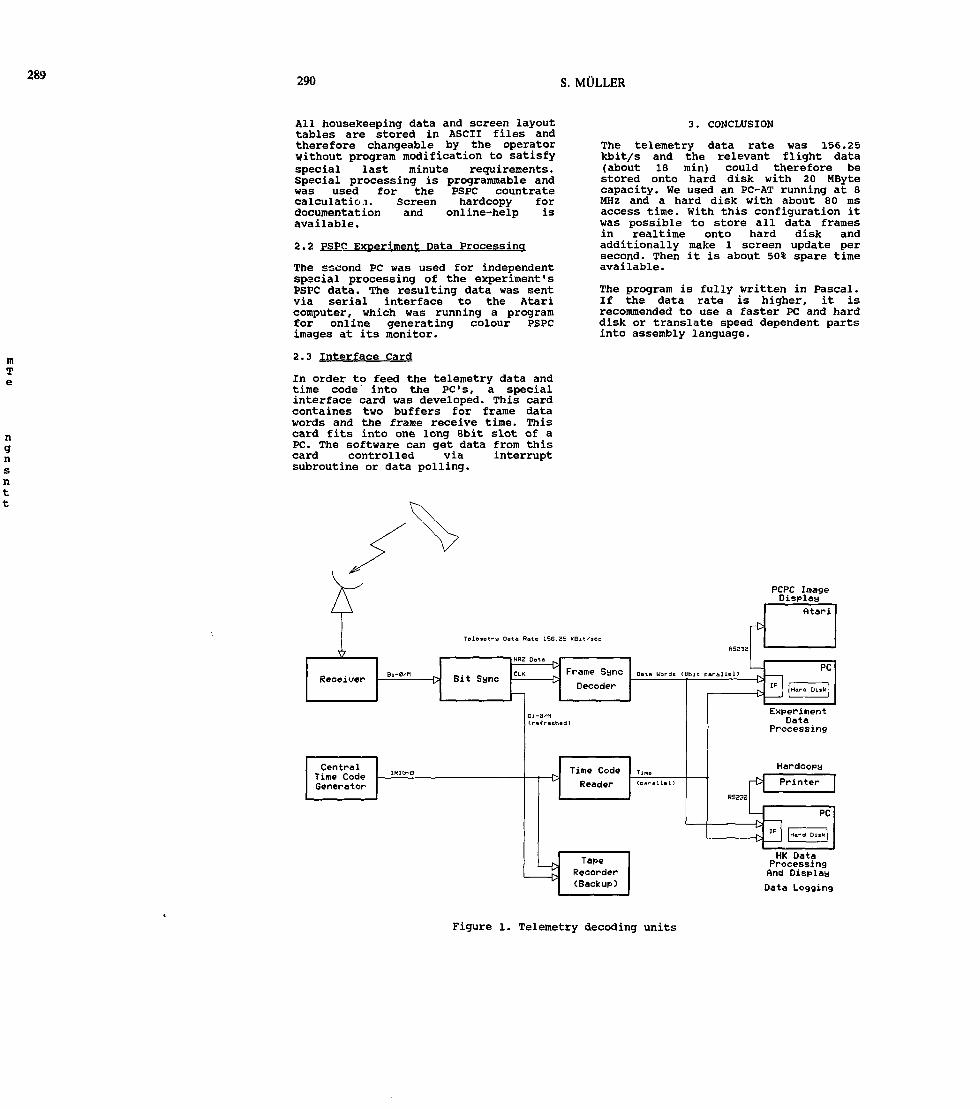
289 290 S. MÙLLER
All housekeeping data and screen layouttables are stored in ASCII files andtherefore changeable by the operatorwithout program modification to satisfyspecial last minute requirements.Special processing is programmable andwas used for the PSPC countratecalculation. Screen hardcopy fordocumentation and online-help isavailable.
2.2 PSPC Experiment Data Processing
The second PC was used for independentspecial processing of the experiment'sPSPC data. The resulting data was sentvia serial interface to the Ataricomputer, which was running a programfor online generating colour PSPCimages at its monitor.
2.3 Interface Card
In order to feed the telemetry data andtime code' into the PC's, a specialinterface card was developed. This cardcentaines two buffers for frame datawords and the frame receive time. Thiscard fits into one long 8bit slot of aPC. The software can get data from thiscard controlled via interruptsubroutine or data polling.
3. COMCLOSION
The telemetry data rate was 156.25kbit/s and the relevant flight data(about 18 min) could therefore bestored onto hard disk with 20 MBytecapacity. We used an PC-AT running at 8MHz and a hard disk with about 80 msaccess time. With this configuration itwas possible to store all data framesin realtime onto hard disk andadditionally make 1 screen update persecond. Then it is about 50% spare timeavailable.
The program is fully written in Pascal.If the data rate is higher, it isrecommended to use a faster PC and harddisk or translate speed dependent partsinto assembly language.
PCPC ImageDisplay
Receiver Bi-a/n
HK DataProcessingAnd DisplayData Logging
Figure 1. Telemetry decoding units
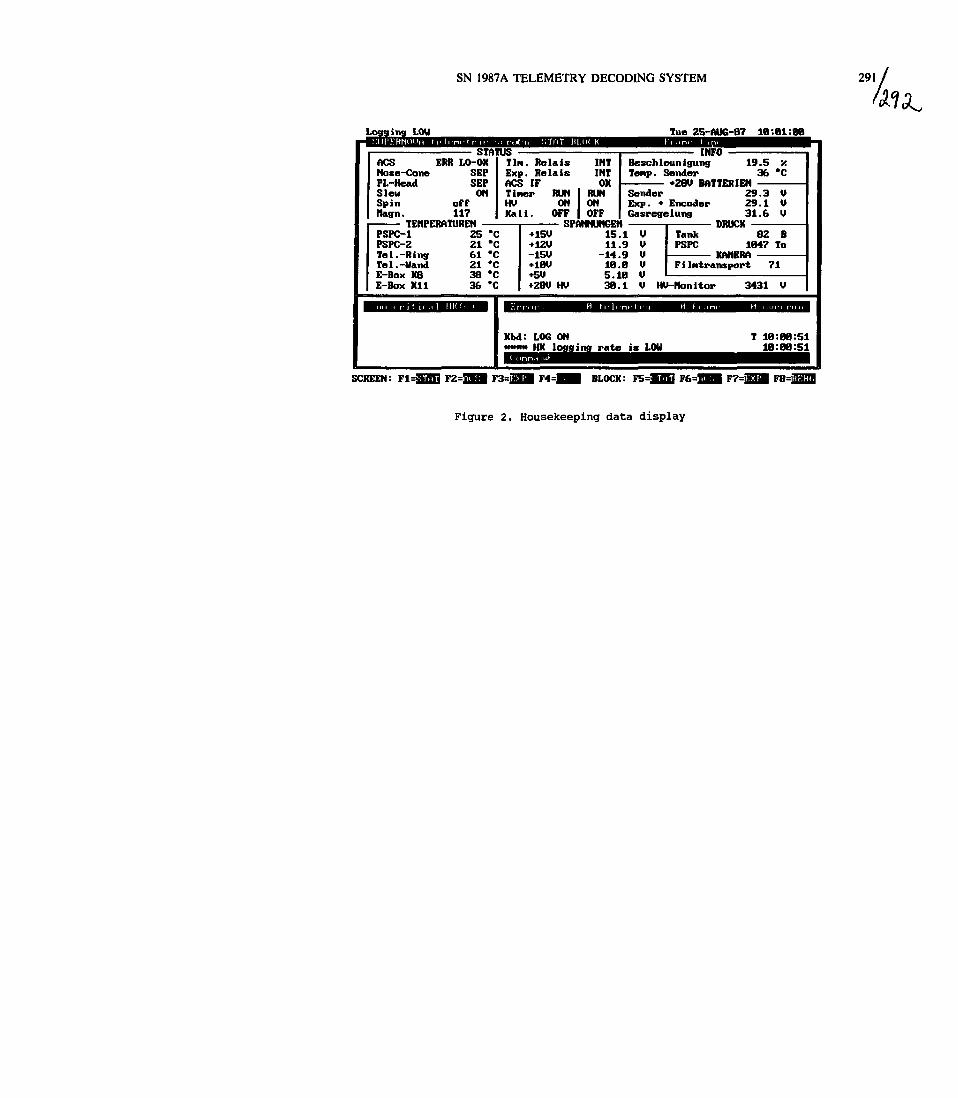
SN 1987A TELEMETRY DECODING SYSTEM 291 /
/aLogging Tue 25-AUG-B7 16181:88
I SMACS ERR LO-OKNose-Cone SEPPL-Head SEPS leu ONSpin offNagn. 117
_ TFHPFQATImFN
PSPC-I 25 *(PSPC-2 21 *(TM 1 Ri new A1 *f
Tel.-Uand 21 *CE-Box KB 38 *CE-Box KIl 36 *C
rusTin. RelaisExp. RelaisACS IFTimer RUNHV ONKali . OFF
oiw
,,i
+15V+12V_4cn+18U+5M+28V HV
INTINT
OKRUNONOFF
WNUNGEt1511
185.138.
• INFO !Beschleunigung 19.5 •/.Tewp. Sender 36 *C
Sender 29.3 VExp. * Encoder 29.1 VGasregelung 31.6 V
•tnii/w
1 V9 V9 V8 V
LB V1 V Hl
KM: LOG ON«««* HK logging rate is LOU
Tank 82 BPSPC 1847 To
VAHPlMF !In-transport 71
'-Monitor 3431 V
T 18:88:5118:88:51
SCREEN: F2= BLOCK: FS=! F6=| F7=| FB=J
Figure 2. Housekeeping data display
% 293
ESRANGE
J Englund, t. Helper, A Wikstrôm, L Marcus
Swedish Spac>5 Corporation, Esrange, Sweden
ABSTRACT
Esrange offers a complete range of services forsounding rocket and balloon launchings to usersfrom all over the world.
Experiments carried out include microgravity,geophysics, space physics, astronomy and thechemistry of the upper atmosphere. Data from theextensive network of ground based scientificinstruments in northern Scandinavia can bedisplayed at Esrange.
Most types of sounding rockets including highperformance vehicles such as Terrier Black Brantand Skylark 12 can be launched. The latest develop-ment, MAXUS (MBB-ERNO/SSC), is offering 15 rain,of microgravity and 1000 km altitude. Balloonpayloads up to 500 kg are regularly flown fromEsrange. The land recovery operations are veryreliable concerning both rockets and balloons.
1. GENERAL
Esrange is an international space operationscenter for sounding rockets, balloons and satel-lites. It is situated close to the modern townof Kiruna in northern Sweden (68 N, 21 E).
The base is owned and managed by the Swedish SpaceCorporation (SSC).
The operations are co-ordinated by the EuropeanSpace A£.e-"v (ESA) within the framwork of theEsrange 817?ial Project (ESP) and financiallysupported by France, Germany, Switzerland andSweden in co-operation with Norway.
Scientists from all over the world are'invitedto use the Esrange facility. The range usercommunity includes scientists from e.g. Japan,USSR, Western Europe, USA and Canada.
Esranee offers a complete range of services forsouiding rocket and balloon launchings. Theexperiments can be co-ordinated with the receptionof oata from scientific satellites.
Hew installations and investments are continouslymade in order to meet new requirements from thescientists.
The following general support facilities areavailable: mechanical workshop, spare parts store,offices, conference rooms, secretarial assistance,10 hotelrooms at the range and a good restaurant.
The recreational facilities include satellite-TV,sauna, billiard, gym, fishing and hunting.
There are daily flight connections betvieenKiruna and Stockholm.
2. SOUNDING ROCKETS
322 sounding rockets have been launched fromEsrange since 1966. The most common experimentsare in the field of: Auroral research, Aeronomie,Astronomy, Ozone research and Microgravity.
Esrange offers a unique possibility to makesimultaneous measurements of Auroral activities,Ozone hole etc. by means of sounding rockets,balloons, satellites, aeroplanes and ground basedmeasurements.
An extensive network of scientific instrumentationsuch as EISCAT, STARE, CUPRI-radar has beenestablished in northern Scandinavia and data canbe linked directly to Esrange. Facilities arcavailable for installation of the users oim equip-ment e.g. ozone-lidars and spectrographs.
Six permanent universal launchers are available,enabling simultaneous launchings as well aslaunchings of salvos. A big variety of rocketshave been launched e.g. Aries, Skylark, BlackBrant, Mike Orion, Taurus Orion, Terrier BlackBrant and Super Loki.
Saab Space is at present developing an attitudecontrol system (SPIMRAC) for vehicles withexoatmospheric burning on a contract fromSwedish Space Corporation (SSC). SPINRAC willenable launchings up to altitudes between 500 and1000 km with three stage vehicles such as Sky-lark 12 and Black Brant 10. The first launchingwith SPINRAC will take place in December 1989.
Proc. Ninth ESAIPAC Symposium on 'European Rocket and Balloon Programmes and Related Research ', Lahnstein, FRG, 3—7April 1989
(ESA SP-29I, June 1989)

293
e,e,
294
J. ENGLUND ET AL.
is a joint MBB-ERNO/SSCProject enabling launchings to
1000 Kn altitude.

ESRANGE 295
There are also plans to develop a three canardversion of >.he 319 guidance system. The 30 meterSkylark launcher can then be used for all types ofguided 19 inch diameter vehicles.
The biggest future program at Esrange will beMAXUS. MAXUS is a joint venture between MBB-ERNO,West Germany and SSC, Sweden. MAXUS is a develop-ment of the German program TEXUS and the Swedishprogram MASER. MAXUS will primarily be used formicrogravity experiments but will also be avail-able for other applications. Launch vehicle willbe a CASTOR IB with flexed nozzle and a capabilityto carry 350 kilos of experiments to 1000 km alti-tude. The first launching is planned from Esrangein November 1990. A new launch complex includingextension of the blockhouse and a rocket storagehall will be built for the CASTOR UB.
All payloads launched from Esrange can be equippedwith a recovery system and easily recovered in theland impact area by helicopter. Recovery operationshave so far been very successful and the payloadis normally back at the range within one hour.This is of greatest importance concerning biologi-cal experiments in microgravity.
3. BALLOONS
Balloon activities started at Esrange 1971. Sincethen 127 stratospheric balloons have been releasedfrom the range. The balloons are mostly utilizedby scientists in the field of ozone research,astronomy, auroral research and microgravity.
All balloons are released by auxiliary balloontechniques. The launching pad enables launchingsof balloons up to the size of 500 000 m . An ex-tension of the pad is planned.
A preparation hall for balloon payloads is situatedclose to the pad. This hall will be built out ar.dwill also accommodate a control center for balloonoperations.
Experiments, release of ballast and cut down canbe commanded from Esrange.
Long duration flights with experiment timesbetween 10 and 20 hours can be carried out duringthe turn around periods in April-May and August-September when the high altitude wind is very low.Recovery of the payload can then be carried outclose to Esrange. During the winter time westerlywinds are predominant at high altitudes. This windsituation is typical during ozone research cam-paigns in January-February. Recovery is thencarried out over the eastern part of Finland.Normal flight times are 3-1 hours. Recovered ex-periments have many times been re-flown just a fewdays after the first flight.
A stratospheric balloon launch during the ozone campaign CHEOPS 2, January 1988.Photo Torbjorn Lôvgren

295 296 J. ENGLUND ET AL.
4. SCIENTIFIC AND TECHNICAL SUPPORT FACILITIES
In order to support new areas of research and'•.eohnical requirements from scientists, Esrange isoontinously developing instrumentation, equipmentand technical functions. Besides classical groundbased scientific instruments, data from moresophisticated instruments like STARE (The Scandi-navian Twin Auroral Radar Experiment), EISCAT(European Incoherent Scattering Scientific Associ-ation) and CUPRI (Cornell University PortableRadar Interferometer) are linked to Esrange.
These instruments are located far away from thethe range but data is transferred via the publictelecommunication network and is displayed in realtime.
IRF (Swedish Institute of Space Physics) andEISCAT are situated close to Esrange. This givesunique possibilities to co-ordinate research inthe atmosphere.
Telescience is a new field of operations whichwill be tested in the near future. Data will betransferred from the scientist's instrumentdirectly to the own laboratory which may belocated thousands of kilometers from Esrange. Bymeans of teleoommands it will be possible to mani-pulate the instrument and observe the results inreal time. Broadband video signals will be trans-ferred via satellite communication.
New systems are being built to enable data recep-tion and telecommanding of payloads flown as highas 1000 kilometers.
4.1 Scientific support facilities
There are different possibilicies to display andrecord data from Esrange ground based scientificinstruments. All instruments can operate asseparate systems but it is possible to connectthem to a new powerful Data Acquisition system.Data from tha acquisition system is available toscientists upon request.
MagnetometersA new instrument was installed during 1988. Flux-gate sensors for measuring three components of theearth's magnetic field are located 300 metresnorth-west of the main building, in an area whichis free from magnetic interference.
The analog signals are presented in real time on acolour CRT display and on a multi channel paperrecorder.
Data is recorded in the instrument and also in theData Acquisition system.
Auroral TV-systemAn extremely sensitive camera system for night skyobservations is available.
The field of view is either 180° all sky or 50°.The camera is mounted outdoors on a remotelycontrolled pedestal.
The TV picture is displayed in Scientific Centre,including universal time and count-down time. Thecomposite signal is recorded on a time lapse videorecorder which allows up to 24 hours of unattendedimage recording.
PhotometersA four-channel photometer measures specificspectral lines in auroral emission. Data from theinstruments is displayed in Scientific Centre.Different portions of the sky can be examined asdetermined by a remotely controlled pointingmechanism. Data collection can be done in the dataacquisition system.
RiometersTwo riometers are in use, at 27.6 MHz and 35.1 HHz.The location and configuration of instruments hasbeen chosen to minimize effects of earth rotationand radio frequency interference. The output fromthe riometers are today complemented withadditional antenna systems. It is possible tochoose narrow or wide beam antennas when measuringwith the instruments. It is also possible to usethe data acquisition system to record data fromthe riometers,
Ionospheric soundersA vertical-incidence ionospheric sounder isinstalled at Esrange down range station.
The sounder transmits RF pulses which are reflectedby different layers in the ionosphere. The RFfrequency is swept from 0.25 MHz to 20 MHz.
The result of the measurement is recorded on 35 mmphotographic film as virtual height vs. frequency.The height range is up to 1000 km.
A new digital ionospheric sounder will be installedat IRF, located about 30 kilometres west ofEsrange. It will be possible to receive real timedata via modem links and display and record dataat Esrange Scientific Centre.
Faraday transmittersFour Faraday transmitters are installed near thelaunch area. These transmitters can be used toemit linearly polarized RF energy into the ionos-phere. The RF frequencies are normally fixed butcan be moved to meet special requirements.
All-sky cameraA camera system with a field of view covering thefull hemisphere is used to record the aurora. Thepictures are in colour or black/white 35 mm filmincluding timing information.
STAREThe Scandinavian Twin Auroral Radar Experimentsis a system that provides ionospheric electricfield estimates in real time. Two coherent radarstations, one in southern Finland and one insouthern Norway, cover a 200 000 km field of viewof the E-region over northern Scandinavia,including Esrange. Real time data is received viamodem links and plasma drift data can be presentedin beam range or vector mode by a computer systemon a graphic colour terminal. The instrumentbelongs to MPI and can be operated upon request.
CUPRIThe CUPRI-radar is placed in Lycksele in the northof Sweden. This radar is owned by CornellUniversity and is used by scientists visitingEsrange. The frequency is 50 MHz and it is usedfor auroral studies.

ESRANGE 297
4.2 Technical support facilities
TelemetryThe telemetry station is very flexible and canquickly be configured for different missions.Several telemetry links can be maintained simul-taneously. RF downlinks in P-, S- or L-band areused. Equipment for demodulation and recording atPCM, FM and TV signals is included in the station.Signal decommutation and conditioning for quicklook is also performed. Flight data is presentedin real time or post flight, using several diffe-rent media and format.
Computer compatible tapes can be generated bothfor PCM and FM data.
Esrange telemetry station has been modernizedduring last year. The station will in future besupervised, logged and reconfigured by computers.A new ranging system will give complete informationabout the flight trajectory from take-off to impact.New equipment for distribution of TV-signals isinstalled.
To receive data from rockets at very high altitudesthe Esrange satellite antennas will be used. Datawill be linked from the antennas to the Esrangeand DLR telemetry stations.
C-band radarThe main system to obtain information about theflight trajectory is a C-band tracking radar,located about 3 kilometres from the launcher. Inskin-tracking mode it gives a high accuracytrajectory up to 130 kilometres altitude for mostrockets. If the payload is equipped with a radartransponder, the complete trajectory from take-offto impact is obtained with an accuracy in altitudeof +/- 120 metres.
A new acquisition aid system has been purchasedand will be installed on the slaved platform tothe radar. Pointing data from this system willalso be sent to satellite antennas and to theparabolic telecommand antenna.
Telecommand systemA ground to space transmitter system is available.This system is used for commanding and manoeuvringof experiments flown on rockets or balloons.
The system is also used for flight safety purposesto terminate balloon or rocket flights.
Two carrier frequencies are used, one for experi-ment commanding and the other for flight safetycommands. The system will be equipped with twolow gain helix antennas for short range operationsand one high gain parabolic antenna for longranges.
Steering information to the parabolic antenna isreceived from other systems.
Upper air observationsA radiosonde system is used to measure the atmos-pheric conditions. Temperature, pressure andrelative humidity as well as the ozoneprofile canbe measured and transmitted to a ground station.An aerogram for all these parameters is producedin real time.
Facilities for installation of user instrumentsare available at the range.
Recovery systemThe recovery system relies on a homing beacon inthe payload. Helicopters with special receiversand associated antenna equipment localize andrecover valuable equipment within hours.
Laboratory facilitiesOne general purpose laboratory and one clean roomare available since a few years. They have beenequipped with general laboratory equipment, suchas workbenches, cupboards, chairs, chemistrybenches and laminar flovi benches. Apart from this,other equipment such as high-temperature oven,vacuum pumps, microscopes, refrigerators andfreezers are available.
As a result of the increased number of biologicalexperiments a decision has been taken to buildfour completely new laboratories during 1989. Theyare intended to be used in biological science indifferent microgravity projects. Similar equipmentwhich exists in the present laboratories will alsobe installed in these new ones. The four new bio-labs will be finished and ready for use as fromautumn 1989.
Besides the above mentioned facilities there is amobile clean room which can be used for differenttypes of payloads. With fairly simple measures itcan be extended to preferred dimensions.
Scientific CentreThe Scientific Centre will be completely rebuiltto match the demands of complex scientific andtechnical operations. The aim is to provide anefficient and pleasant work environment for eachmission.
5. SATELLITES
Esrange is an important centre for the support ofmany national and international satellite projects.
The facilities for reception, processing anddisplay of data from scientific satellites may beof particular interest to the users of soundingrocket and balloon experiments.
Data from scientific satellites, sounding rocketsand balloons can be received simultaneously atEsrange. This gives unique opportunities to makecorrelation and verification studies of data takenat different points in the polar region. Datareceived from scientific satellites could also beused as a basis for deciding the launch instantfor sounding rockets and balloons.
The other satellite support function that maybe of interest to Esrange users is the Tracking,Telemetry and Command (TTC) support to anysatellite in a high inclination orbit.
6. CONCLUSION
Esrange is an international space operationscentre that offers a complete range of servicesfor sounding rockets, balloons, satellites andground based measurements.
New installations and investments are continouslymade in order to meet new requirements from thescientists.

298 J. ENGLUND ET AL.
The latest extensions and developments at Esrangeare:
MAXUS for 15 minutes of microgravity and1000 km capability for other experimentsIntroduction of Skylark 12 and other exoatmos-pheric burning vehicles with capability of upto 1000 km altitudeImprovements of the balloon operation facili-tiesImprovements of the scientific and technicalinstrumentation and data reception fromexternal scientific ground installationsExtended space for payload preparation andlaboratoriesImprovements of in flight command and datareception
In summary, the main advantages to the user ofEsrange are:
Land recovery of rocket and balloon payloadsThe northern locationThe wide range of services availableThe high standard of the technical andscientific installationsThe competent staffThe possibility of co-ordinated rocket,balloon, satellite and ground based measure-ments
WELOTtE TO ESRANGE!
299
ALIS - AN AURORAL LARGE IMAGING SYSTEM IN NORTHERN SCANDINAVIA
A. Steen
Swedish Institute of Space Physics, Kiruna, Sweden
ABSTRACT
Recent advancements in solid state imagers, random accessmass storage and computer/data communication technologiesmake it possible to plan for a new generation of ground-based auroral imaging systems. In this report we discuss acomplementary (to satellite imaging) ground-based imagingsystem, ALIS (Auroral Large Imaging System). The propos-ed system consists of a two-dimensional array of 28 mono-chromatic imagers and a Control Centre (CC). Each stationimages with a medium field of view (90 deg.), and transfersthe image data in real-time to CC, where a grand image isconstructed with 300*600 km coverage in latitude andlongitude and 2000*4000 pixels resolution. Parametersderived from the grand image will be available at CC fortelescience applications.
Keywords: Auroral Imaging, 3-D Distribution of AuroralEmissions, 2-D Maps of Energy of Precipitating Particles.
1. INTRODUCTION
The aurora is one of the end results of processes in theionosphere and magnetosphere, starting with the interactionbetween the solar wind and the outer boundaries of theEarth's magnetosphere. From the point of view of measure-ment techniques the aurora is a three-dimensional time-dependent signal with additional information content in thespectral regime. Ground-based auroral imaging started asearly as the beginning of this century (Réf. 1), and con-centrated efforts during the IGY 1957/58 produced importantscientific results, such as the concept of the auroral oval(Réf. 2). Auroral imaging from space opened up the pos-sibility to observe the whole auroral oval, which at presentcan be made with a time resolution of a few tens of seconds(Réf. 3). For some time, satellite imaging experimentsseemed to make ground-based imaging techniques obsolete.However, the ground-based auroral imaging methods possessa number of unique qualities, which make them complemen-tary to satellite imaging techniques rather than inferior.
In a certain local time sector, the auroral oval can bemonitored only periodically from a satellite, due to the
orbital motion. In following the evolution of an auroralstructure, a degradation in resolution is caused by the speedof the satellite. The studied auroral structure and the satellitewill be on the same field line only for a short time interval.The finer details in the aurora are difficult to measure fromspace also because of the unprecisely known value of theeffective albedo. An additional advantage of the satelliteimaging techniques in the global imaging perspective, is thecapability to use UV-emissions for the measurement ofsunlit dayside aurora.
The major disadvantage of ground-based auroral imagingtechniques is the weather dependence. However, given aclear sky during the dark hour period, the ground-basedmethod can produce continuous measurements in a certainlocal time sector. If the number of observing stations islarge, the aurora will always be measured reasonably closeto the local magnetic zenith.
Another argument in favour of the ground-based auroralimaging method is related to the experience from more thanhalf a century of ground-based optical measurements. Thisdata set has provided the reference frame for the scientificcommunity in the classification and modelling of variousauroral forms. The satellite imaging experiments contributewith a new type of measurements, but there remains theneed to know how the aurora appears from below.
Northern Scandinavia has become an area with excellentfacilities for auroral research. In this area two rocket ranges,And0ya and Esrange, have the capability to launch soundingrockets, to receive data from polar orbiting satellites, andeventually in the future to launch polar orbiting satellites.An incoherent scatter radar system, EISCAT, has beenconstructed, with the main objectives to measure plasmaparameters in the auroral ionosphere. The coherent radarsystem, STARE, will continue to provide valuable ionos-pheric electric field data in an upgraded version (E. Nielsen,priv. comm.). In addition to these major installations forauroral research, several observatories exist in the threeScandinavian countries. At Svalbard observatory measure-ments have expanded during the last years. In the discussionof where to place a new sophisticated ground-based auroralimaging system, the northern part of Scandinavia is a verystrong candidate.
Proc. Ninth ESA/PAC Symposium on 'European Rocket and Balloon Programmes and Related Research ', Lahnstem, FRG, 3—7 April 1989
(ESA SP-291, June 1989)
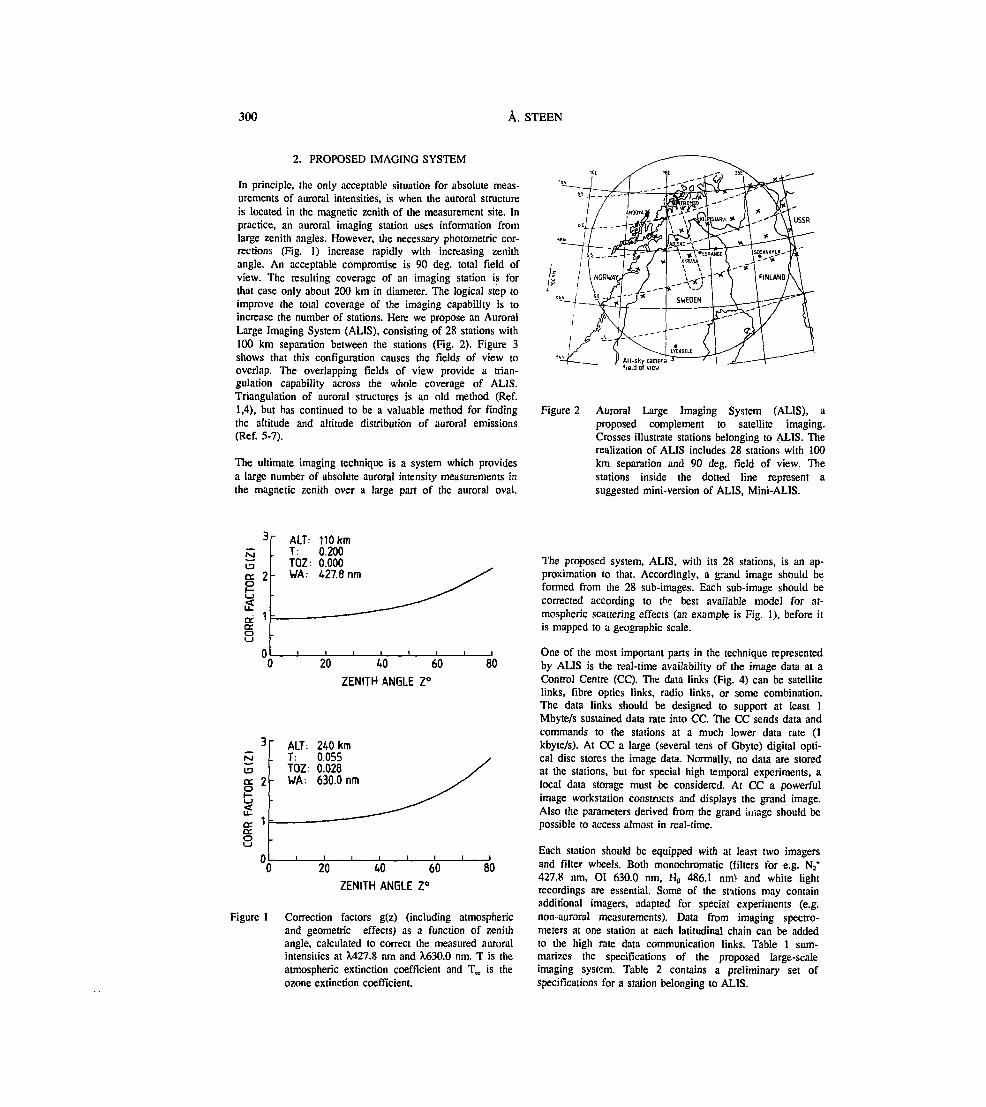
300 À.STEEN
2. PROPOSED IMAGING SYSTEM
In principle, the only acceptable situation for absolute meas-urements of auroral intensities, is when the auroral structureis located in the magnetic zenith of the measurement site. Inpractice, an auroral imaging station uses information fromlarge zenith angles. However, the necessary photometric cor-rections (Fig. 1) increase rapidly with increasing zenithangle. An acceptable compromise is 90 deg. total field ofview. The resulting coverage of an imaging station is forthat case only about 200 km in diameter. The logical step toimprove the total coverage of the imaging capability is toincrease the number of stations. Here we propose an AuroralLarge Imaging System (ALIS), consisting of 28 stations with100 km separation between the stations (Fig. 2). Figure 3shows that this configuration causes the fields of view tooverlap. The overlapping fields of view provide a trian-gulation capability across the whole coverage of ALIS.Triangulation of auroral structures is an old method (Réf.1,4), but has continued to be a valuable method for findingthe altitude and altitude distribution of auroral emissions(Réf. 5-7).
The ultimate imaging technique is a system which providesa large number of absolute auroral intensity measurements inthe magnetic zenith over a large part of the auroral oval.
Figure 2 Auroral Large Imaging System (ALIS), aproposed complement to satellite imaging.Crosses illustrate stations belonging to ALIS. Therealization of ALIS includes 28 stations with 100km separation and 90 deg. field of view. Thestations inside the dotted line represent asuggested mini-version of ALIS, Mini-ALIS.
UJ
I'c_lifa: 1cc.OL-I
CC.CC.O
Figure 1
ALT.- 110kmT: 0.200TOZ: 0.000WA: 427.8 nm
20 40 60
ZENITH ANGLE Z°
80
ALT: 240kmT: 0.055TOZ: 0.028WA; 630.0 nm
20 40 60
ZENITH ANGLE Z°
80
Correction factors g(z) (including atmosphericand geometric effects) as a function of zenithangle, calculated to correct the measured auroralintensities at X427.8 nm and X630.0 nm. T is theatmospheric extinction coefficient and Tra is theozone extinction coefficient.
The proposed system, ALIS, with its 28 stations, is an ap-proximation to that. Accordingly, a grand image should beformed from the 28 sub-images. Each sub-image should becorrected according to the best available model for at-mospheric scattering effects (an example is Fig. 1), before itis mapped to a geographic scale.
One of the most important parts in the technique representedby ALIS is the real-time availability of the image data at aControl Centre (CC). The data links (Fig. 4) can be satellitelinks, fibre optics links, radio links, or some combination.The data links should be designed to support at least 1Mbyte/s sustained data rate into CC. The CC sends data andcommands to the stations at a much lower data rate (1kbyte/s). At CC a large (several tens of Gbyte) digital opti-cal disc stores the image data. Normally, no data are storedat the stations, but for special high temporal experiments, alocal data storage must be considered. At CC a powerfulimage workstation constructs and displays the grand image.Also the parameters derived from the grand image should bepossible to access almost in real-time.
Each station should be equipped with at least two imagersand filter wheels. Both monochromatic (filters for e.g. N2*427.8 nm, OI 630.0 nm, H1, 486.1 nml and white lightrecordings are essential. Some of the stations may containadditional imagers, adapted for special experiments (e.g.non-auroral measurements). Data from imaging spectro-meters at one station at each latitudinal chain can be addedto the high rate data communication links. Table 1 sum-marizes the specifications of the proposed large-scaleimaging system. Table 2 contains a preliminary set ofspecifications for a station belonging to ALlS.
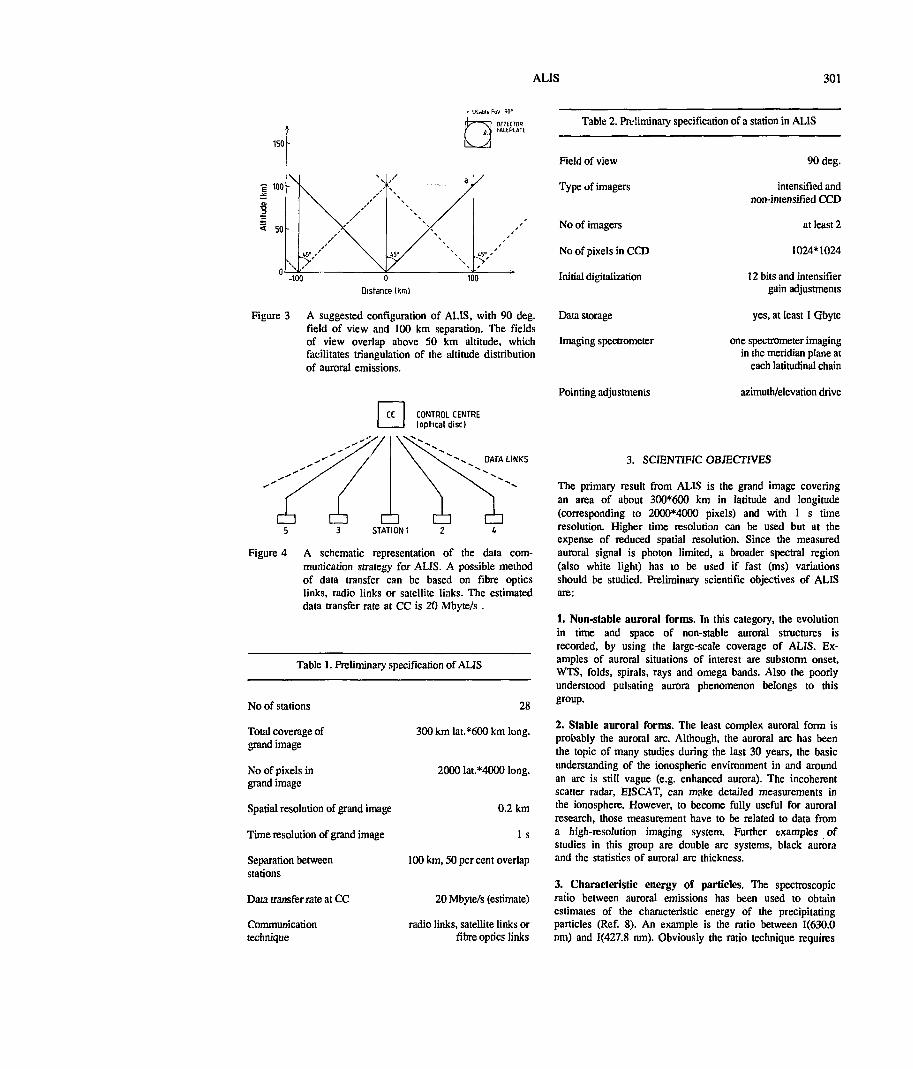
ALIS 301
Table 2. Preliminary specification of a station in ALlS
-100Distance (Km)
Figure 3 A suggested configuration of ALIS, with 90 deg.field of view and 100 km separation. The fieldsof view overlap above 50 km altitude, whichfacilitates triangulation of the altitude distributionof auroral emissions.
CONTROL CENTRE!optical disc)
DATA LINKS
STATION 1
Figure 4 A schematic representation of the data com-munication strategy for ALIS. A possible methodof data transfer can be based on fibre opticslinks, radio links or satellite links. The estimateddata transfer rate at CC is 20 Mbyte/s .
Table 1. Preliminary specification of ALIS
No of stations
Total coverage ofgrand image
No of pixels ingrand image
Spatial resolution of grand image
Time resolution of grand image
Separation betweenstations
Data transfer rate at CC
Communicationtechnique
28
300 km lat.*600 km long.
2000 lat.*4000 long.
0.2km
I s
100 km, 50 per cent overlap
20 Mbyte/s (estimate)
radio links, satellite links orfibre optics links
Field of view
Type of imagers
No of imagers
No of pixels in CCD
Initial digitalization
Data storage
Imaging spectrometer
Pointing adjustments
90 deg.
intensified andnon-intensified CCD
at least 2
1024*1024
12 bits and intensifiergain adjustments
yes, at least 1 Gbyte
one spectrometer imagingin the meridian plane at
each latitudinal chain
azimuth/elevation drive
3. SCIENTIFIC OBJECTIVES
The primary result from ALIS is the grand image coveringan area of about 300*600 km in latitude and longitude(corresponding to 2000*4000 pixels) and with 1 s timeresolution. Higher time resolution can be used but at theexpense of reduced spatial resolution. Since the measuredauroral signal is photon limited, a broader spectral region(also white light) has to be used if fast (ms) variationsshould be studied. Preliminary scientific objectives of ALISare:
1. Non-stable auroral forms. In this category, the evolutionin time and space of non-stable auroral structures isrecorded, by using the large-scale coverage of ALIS. Ex-amples of auroral situations of interest are substorm onset,WTS, folds, spirals, rays and omega bands. Also the poorlyunderstood pulsating aurora phenomenon belongs to thisgroup.
2. Stable auroral forms. The least complex auroral form isprobably the auroral arc. Although, the auroral arc has beenthe topic of many studies during the last 30 years, the basicunderstanding of the ionospheric environment in and aroundan arc is still vague (e.g. enhanced aurora). The incoherentscatter radar, EISCAT, can make detailed measurements inthe ionosphere. However, to become fully useful for auroralresearch, those measurement have to be related to data froma high-resolution imaging system. Further examples ofstudies in this group are double arc systems, black auroraand the statistics of auroral arc thickness.
3. Characteristic energy of particles. The spectroscopicratio between auroral emissions has been used to obtainestimates of the characteristic energy of the precipitatingparticles (Réf. 8). An example is the ratio between 1(630.0nm) and 1(427.8 nm). Obviously the ratio technique requires
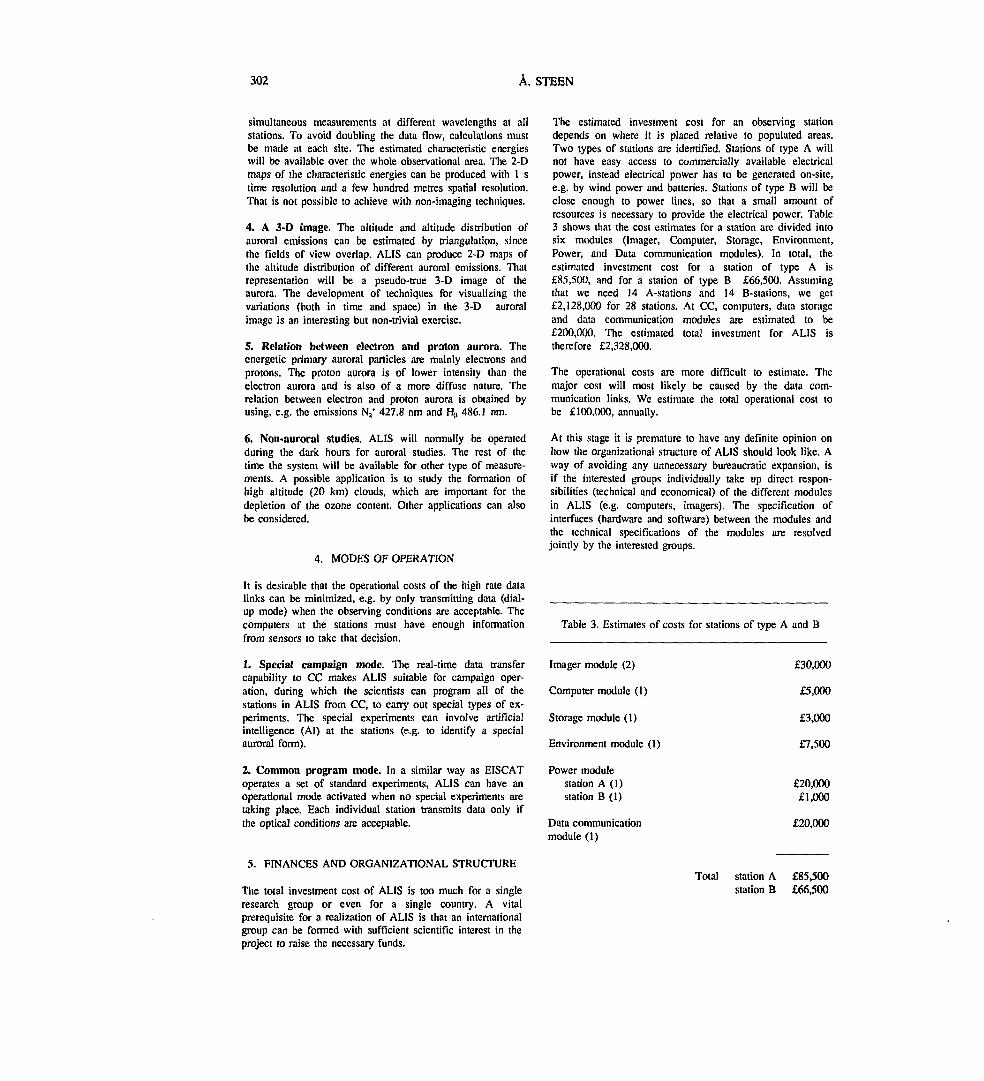
302 A.STEEN
simultaneous measurements at different wavelengths at allstations. To avoid doubling the data flow, calculations mustbe made at each site. The estimated characteristic energieswill be available over the whole observational area. The 2-Dmaps of the characteristic energies can be produced with 1 stime resolution and a few hundred metres spatial resolution.That is not possible to achieve with non-imaging techniques.
4. A 3-D image. The altitude and altitude distribution ofauroral emissions can be estimated by triangulation, sincethe fields of view overlap. ALIS can produce 2-D maps ofthe altitude distribution of different auroral emissions. Thatrepresentation will be a pseudo-true 3-D image of theaurora. The development of techniques for visualizing thevariations (both in time and space) in the 3-D auroralimage is an interesting but non-trivial exercise.
5. Relation between electron and proton aurora. Theenergetic primary auroral particles are mainly electrons andprotons. The proton aurora is of lower intensity than theelectron aurora and is also of a more diffuse nature. Therelation between electron and proton aurora is obtained byusing, e.g. the emissions N2* 427.8 nm and Hp 486.1 nm.
6. Non-auroral studies. ALIS will normally be operatedduring the dark hours for auroral studies. The rest of thetime the system will be available for other type of measure-ments. A possible application is to study the formation ofhigh altitude (20 km) clouds, which are important for thedepletion of the ozone content. Other applications can alsobe considered.
4. MODES OF OPERATION
It is desirable that the operational costs of the high rate datalinks can be minimized, e.g. by only transmitting data (dial-up mode) when the observing conditions are acceptable. Thecomputers at the stations must have enough informationfrom sensors to take that decision.
1. Special campaign mode. The real-time data transfercapability to CC makes ALIS suitable for campaign oper-ation, during which the scientists can program all of thestations in ALIS from CC, to carry out special types of ex-periments. The special experiments can involve artificialintelligence (AI) at the stations (e.g. to identify a specialauroral form).
2. Common program mode. In a similar way as EISCAToperates a set of standard experiments, ALIS can have anoperational mode activated when no special experiments aretaking place. Each individual station transmits data only ifthe optical conditions are acceptable.
5. FINANCES AND ORGANIZATIONAL STRUCTURE
The total investment cost of ALIS is too much for a singleresearch group or even for a single country. A vitalprerequisite for a realization of ALIS is that an internationalgroup can be formed with sufficient scientific interest in theproject to raise the necessary funds.
The estimated investment cost for an observing stationdepends on where it is placed relative to populated areas.Two types of stations are identified. Stations of type A willnot have easy access to commercially available electricalpower, instead electrical power has to be generated on-site,e.g. by wind power and batteries. Stations of type B will beclose enough to power lines, so that a small amount ofresources is necessary to provide the electrical power. Table3 shows that the cost estimates for a station are divided intosix modules (Imager, Computer, Storage, Environment,Power, and Data communication modules). In total, theestimated investment cost for a station of type A is£85,500, and for a station of type B £66,500. Assumingthat we need 14 A-stations and 14 B-stations, we get£2,128,000 for 28 stations. At CC, computers, data storageand data communication modules are estimated to be£200,000. The estimated total investment for ALIS istherefore £2,328,000.
The operational costs are more difficult to estimate. Themajor cost will most likely be caused by the data com-munication links. We estimate the total operational cost tobe £100,000, annually.
At this stage it is premature to have any definite opinion onhow the organizational structure of ALIS should look like. Away of avoiding any unnecessary bureaucratic expansion, isif the interested groups individually take up direct respon-sibilities (technical and economical) of the different modulesin ALIS (e.g. computers, imagers). The specification ofinterfaces (hardware and software) between the modules andthe technical specifications of the modules are resolvedjointly by the interested groups.
Table 3. Estimates of costs for stations of type A and B
Imager module (2)
Computer module (1)
Storage module (1)
Environment module (1)
Power modulestation A (1)station B (1)
Data communicationmodule (1)
£30,000
£5,000
£3,000
£7,500
£20,000£1,000
£20,000
Total station A £85,500station B £66,500
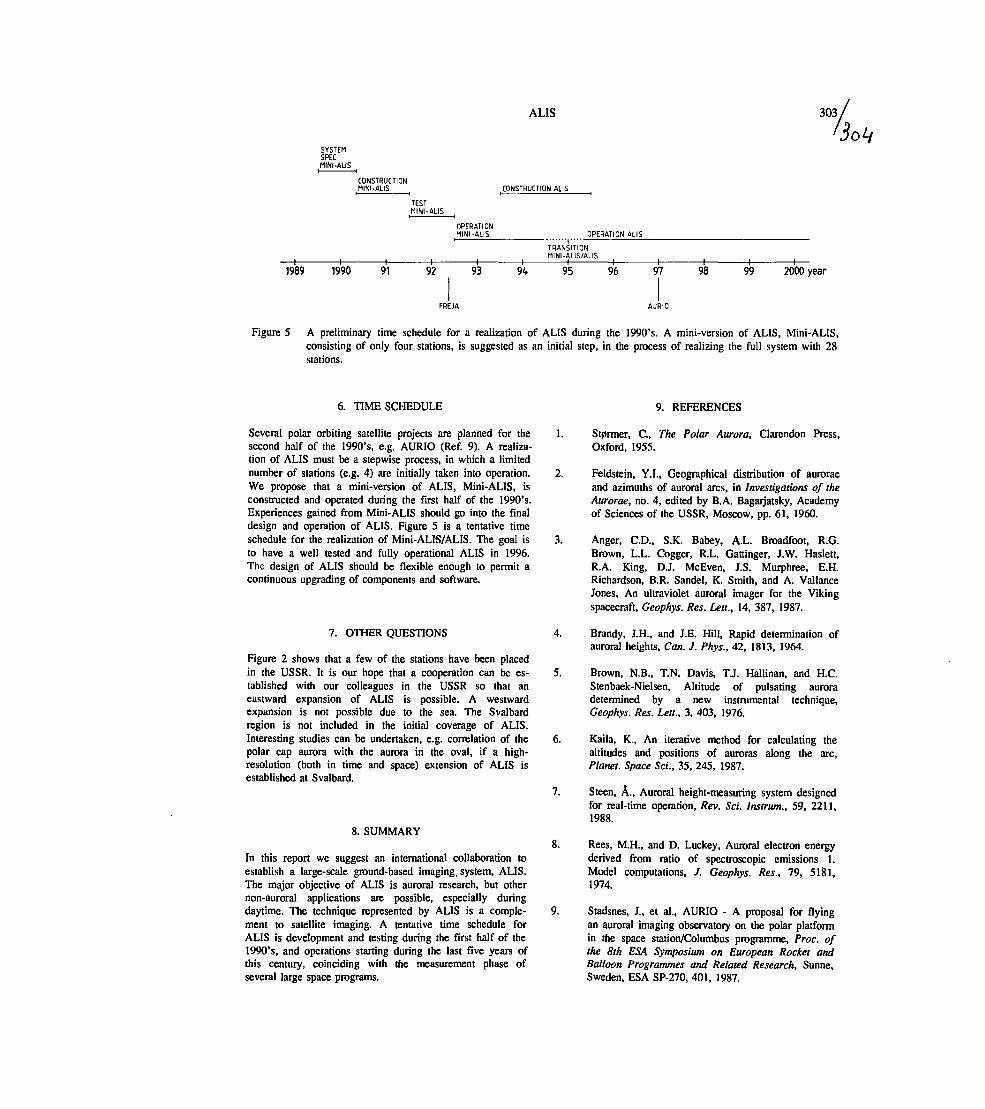
ALIS 303;
CONSTRUCTIONMINI-ALIS CONSTRUCTION ALIS
1989 1990 91 92
OPERATIONMINI-ALIS OPERATION ALIS
TRANSITIONMINI-ALIS/ALIS
93 94 95 96 97 98 99 2000 year
FREJA AURIO
Figure 5 A preliminary time schedule for a realization of ALIS during the 1990's. A mini-version of ALIS, Mini-ALIS,consisting of only four stations, is suggested as an initial step, in the process of realizing the full system with 28stations.
6. TIMESCHEDULE
Several polar orbiting satellite projects are planned for thesecond half of the 1990's, e.g. AURIO (Réf. 9). A realiza-tion of ALIS must be a stepwise process, in which a limitednumber of stations (e.g. 4) are initially taken into operation.We propose that a mini-version of ALIS, Mini-ALIS, isconstructed and operated during the first half of the 1990's.Experiences gained from Mini-ALIS should go into the finaldesign and operation of ALIS. Figure 5 is a tentative timeschedule for the realization of Mini-ALB/ALIS. The goal isto have a well tested and fully operational ALIS in 1996.The design of ALIS should be flexible enough to permit acontinuous upgrading of components and software.
7. OTHERQUESTIONS
Figure 2 shows that a few of the stations have been placedin the USSR. It is our hope that a cooperation can be es-tablished with our colleagues in the USSR so that aneastward expansion of ALIS is possible. A westwardexpansion is not possible due to the sea. The Svalbardregion is not included in the initial coverage of ALIS.Interesting studies can be undertaken, e.g. correlation of thepolar cap aurora with the aurora in the oval, if a high-resolution (both in time and space) extension of ALIS isestablished at Svalbard.
8. SUMMARY
In this report we suggest an international collaboration toestablish a large-scale ground-based imaging, system, ALIS.The major objective of ALIS is auroral research, but othernon-auroral applications are possible, especially duringdaytime. The technique represented by ALIS is a comple-ment to satellite imaging. A tentative time schedule forALIS is development and testing during the first half of the1990's, and operations starting during the last five years ofthis century, coinciding with the measurement phase ofseveral large space programs.
6.
7.
8.
9.
9. REFERENCES
St0rmer, C., The Polar Aurora, Clarendon Press,Oxford, 1955.
Feldstein, Y.I., Geographical distribution of auroraeand azimuths of auroral arcs, in Investigations of theAurorae, no. 4, edited by B.A. Bagarjatsky, Academyof Sciences of the USSR, Moscow, pp. 61, 1960.
Anger, C.D., S.K. Babey, A.L. Broadfoot, R.G.Brown, L.L. Cogger, R.L. Gattinger, J.W. Haslett,R.A. King, DJ. McEven, J.S. Murphree, E.H.Richardson, B.R. Sandel, K. Smith, and A. VallanceJones, An ultraviolet auroral imager for the Vikingspacecraft, Geophys. Res. Lett., 14, 387, 1987.
Brandy, J.H., and J.E. Hill, Rapid determination ofauroral heights, Can. J. Phys., 42, 1813, 1964.
Brown, N.B., T.N. Davis, TJ. Hallinan, and H.C.Stenbaek-Nielsen, Altitude of pulsating auroradetermined by a new instrumental technique,Geophys. Res. Lett., 3, 403, 1976.
Kaila, K., An iterative method for calculating thealtitudes and positions of auroras along the arc,Planet. Space Sd., 35, 245, 1987.
Steen, A., Auroral height-measuring system designedfor real-time operation, Rev. Sd. Instrum., 59, 2211,1988.
Rees, M.H., and D. Luckey, Auroral electron energyderived from ratio of spectroscopic emissions 1.Model computations, J. Geophys. Res., 79, 5181,1974.
Stadsnes, J., et al., AURIO - A proposal for flyingan auroral imaging observatory on the polar platformin the space station/Columbus programme, Proc. ofthe 8th ESA Symposium on European Rocket andBalloon Programmes and Related Research, Sunne,Sweden, ESA SP-270, 401, 1987.

CONCLUSION

307
CONCLUDING REMARKS
U. von Zahn
Physikalisches Institut der Universitât BonnNussillee 12, 5300 Bonn 1, Fed. Rep. of Germany
It has been 25 years ago that ESRO launchedits first sounding rocket payload. It hasbeen 16 years ago that the first of theESRO/ESA symposia on sounding rocket re-search took place at Spfltind, Norway. Itwill be in only a few minutes that our Sym-posium, the '9th ESA Symposium on EuropeanRocket and Balloon Programmes and RelatedResearch1, will draw to a close. Therefore,it might be appropriate to reflect brieflyon the questions: where do we stand withrespect to (1) the Symposium series and (2)the general environment in which we performour scientific research or technical ser-vices ?
(1) The aim of the Symposium series is,above all, the presentation of the resultsof scientific research as well as a friend-ly exchange of ideas. In this it is not dif-ferent from any other major scientific con-ference. Yet, our Symposia have developeda few special features which, although notbased on written rules, seem to reflect acommon understanding among those organizingthis series:
We have always kept the door open for par-ticipation of technical services and indus-try. This provides for an intense exchangeof information between scientists and thosewho in fact make the dreams of scientistscome true: those who build the payloads,balloons, rockets, and launch and recoverthem. How much this opportunity of contactis really appreciated was demonstrated yes-terday afternoon when - during the sessionon 'Range Facilities'- this room was ascrowded as I have ever seen it during thisSymposium.
In this drive for maximum information ex-change we have allowed presentations onfuture projects more than is common at mostscientific conferences. This appears justi-fied because of the rather short time scalefor planning and execution of the researchprojects discussed at these Symposia. Manyof the cooperative ground-based measure-ments, balloon projects, and rocket cam-paigns are planned and executed in lessthan two years, some in less than one year.Hence, rapid release and receipt of infor-
mation about research opportunities is adefinite help for the interested scien-tists and is fostered by this Symposiumseries. ESTEC has developed means t'o pub-lish the Symposium Proceedings in a veryspeedy way as ESA Special Publications.This quick response makes it really at-tractive for many of us to put papersinto these Proceedings.
Last, but not least, the former ProgramCommittees as well as the current one haveusually selected hotels located at more orless isolated places as meeting places forthese Symposia. This assures the partici-pants lots of time for discussions beyond•the official session periods and in an in-formal and relaxed atmosphere. It alsohelps to convert colleagues to friends.
(2) In the two years which have passedsince the last Symposium we have witnessedat least three scientific highlights whichalready have or will in the future impacton the work of many of us:
The 'Ozone Hole'.Let me remind you about the fact that du-ring a major international ozone confe-rence only 5 years ago, the ozone hole wasstill an unknown. Since then the rapidgrowth of the ozone hole has suddenly andtremendously increased the interest of thepublic in the results of atmospheric re-search. Formation of the ozone hole final-ly convinced a number of politicians thatmiddle atmosphere research is not only forthe fun of a few playful scientists, ra-ther it is an absolute necessity for thewell-being of mankind. The discovery ofthe ozone hole was made through ground-based observations at one of the most re-mote places on Earth. It was neither dis-covered by one of the multi-hundred-milliondollar satellites or the much heraldedspace shuttle, nor was the ozone holepredicted by any computer simulation ofthe middle atmosphere. Its discovery sti-mulated on the one hand an intense rushinto ground-based, airborne and balloon-borne experiments, on the other hand itfocussed our attention on the importanceof heterogeneous processes in the middle
Proc. Ninth ESAIPAC Symposium on 'European Rocket and Balloon Programmes and Related Research', Lahnstein, FRG, 3—7April 1989(ESA SP-29I, June 1989)
308 U. VON ZAHN
atmosphere. These trends will without doubtcontinue to influence our work.
The Labitzke-van Loon Effect.Labiztke and van Loon discovered that thethermal structure of our entire atmosphereresponds with significant, yet complex pat-terns to changes in the level of solar ac-tivity. The cause of the effect remainslargely unexplained. However, due to itspotentially massive importance for long-term climate predictions it is easy toforecast that considerable effort will bespent in the coming years to gain an under-standing of the atmospheric processes andinteractions which cause this most unexpec-ted and again unpredicted response of theatmosphere to what amounts to a very, verysmall change of the solar constant.
Supernova 1987A.'ihe occurrence of the supernova 1987A trig-gered another rush into sounding rocketand balloon experiments. In fact, its oc-currence has thoroughly mixed up the sche-dule of previously planned rocket campaignsat least in Germany and the U.S.A. Manyscientists regarded sounding rockets andballoons as the best means for achievingrapidly observations of the supernova fromoutside the atmosphere. Admirably, thefirst sounding rocket aimed at studying thesupernova with complex instrumention waslaunched only 6 months (!) after the super-nova 1987A was discovered. Yet, the scien-tific interest in supernova 1987A is farfrom being over. It will continue to impactour work for many years to come by makingdemands on the limited resources of teamsand facilities required for launching rocketand balloons.
Turning to the general level of activitiesduring the past two years I argue that itremained on a high level, perhaps evenslightly increasing. The Scandinavianrocket ranges saw the execution of majorinternational rocket campaigns like SINE,Epsilon, CHEOPS, TEXUS, MASER, ROSE, toname a few. The AndeSya Rocket Range launched108 rockets during this time frame. In 1988the French balloon activities reached a newrecord of 52 launches/year. New capabilitiesfor scientific measurements were added orbecame operational: e.g. the EISCAT facilitystarted up its VHF system, ground-basedLIDAR instruments provided operationaltemperature soundings from 30 to 110 kmaltitude; high-altitude balloons carriedpayloads up to 2.2 tons, IR-Mongolfieresreached an operational status for long-endurance flights (> 3 weeks), balloon androcket launch activities in the southernhemisphere and at polar latitudes increasedconsiderably; meteorological rockets provi-ded for 50-m-resolution wind measurementsup to an altitude of 100 km. All these arebut examples of the ever increasing spectrumof new capabilities for studying the middleand upper atmosphere and regions beyond.
But not only new techniques are asked for.The improved or more efficient use of pro-ven techniques provide for advances inscientific return from individual missions
too. Here I would like to emphasize thegreat value of the sophisticated equipmentwhich has been recently introduced at someof the launch sites for real-time moni-toring of data obtained from ground-basedand remote sensing instruments like magne-tometers, riometers, various types ofradars, lidars etc. This equipment enablesthe project scientist to obtain a detainedpicture of the atmosphere and ionosphereabove him and to launch his precious hard-ware under much better defined geophysicalconditions than we were used to earlier.The near perfect match of geophysical con-ditions sought for and finally achievedby the four ROSE sounding rockets are animpressive example for the value of thisinvestment in ground-based equipment.Another example of improved use of avail-able resources is the introduction of1telescience' into sounding rocket pay-loads which is designed to enable thescientist to supervise and to operate hisinstrument in real-time during the rocketflight.
Is everything bright and shiny ? Well,shortcomings needing improvements willalways exist. Here I want to mention butone which, however, concerns me quite abit. It is the lack of a high precisiontracking radar owned by either one of theScandinavian launching ranges. With thelevel of rocket (and balloon) launchesachieved in recent years the lack of range-owned precision radars seems unexcusableto me. It causes considerable limitationsor additional cost for the major scientificprojects carried out at these ranges. Forexample, upper atmosphere soundings bymeans of inflatable falling spheres or byfoil clouds can only be carried out emp-loying high precision radars. Multiplesimultaneous rocket launches, which havebeen performed during the projects MAP/WINEand MAC/Epsilon and which are planned formost future rocket campaigns, require nowdeployment of up to 3 mobile radars. Ifeel uncomfortable in a situation whereessential parts of our scientific workdepend totally on a national asset likethe German MPS-36 radar, the availabilityand operation of which is entirely outsidethe control of the rocket ranges. If ourScandinavian ranges would really like tostay competitive and attractive at leastone of them, if not both, should acquire amodern radar like the multiple-object-tracking radar AN/MPS-39.
I want to conlude these remarks with thanksfrom all of us to the persons and institu-tions involved in preparing and performingthis Symposium: the members of the ESA/PACSecretariat in Paris and the organizingcommittee at the DLR, my colleagues of theProgram Committee, the chairpersons andthe speakers during the Symposium, and theeditor of the Symposium Proceedings, whonow must make good on my promises of aspeedy publication of the Proceedings.Last, but not least, I'd like to thank themembers of the 'Doktor Jazz Ambulanz' Bandfor entertaining us with dixies and hotjazz during a most enjoyable night.

KEY-WORD INDEX
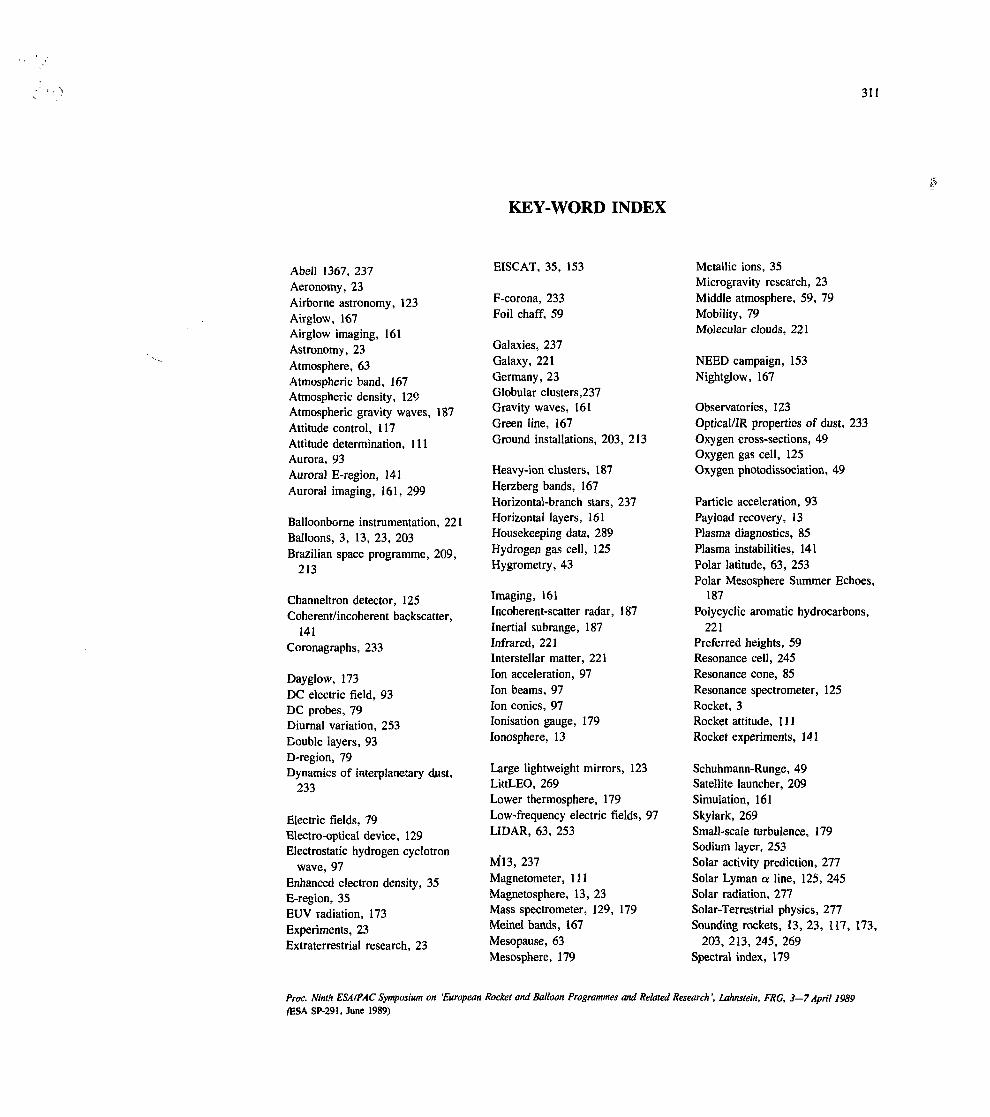
KEY-WORD INDEX
311
Abell 1367, 237Aeronomy, 23Airborne astronomy, 123Airglow, 167Airglow imaging, 161Astronomy, 23Atmosphere, 63Atmospheric band, 167Atmospheric density, 129Atmospheric gravity waves, 187Attitude control, 117Attitude determination, 111Aurora, 93Auroral E-region, 141Auroral imaging, 161, 299
Balloonborne instrumentation, 221Balloons, 3, 13, 23, 203Brazilian space programme, 209,
213
Channeltron detector, 125Coherent/incoherent backscatter,
141Coronagraphs, 233
Dayglow, 173DC electric field, 93DC probes, 79Diurnal variation, 253Double layers, 93D-region, 79Dynamics of interplanetary dwst,
233
Electric fields, 79Electro-optical device, 129Electrostatic hydrogen cyclotron
wave, 97Enhanced electron density, 35E-region, 35EUV radiation, 173Experiments, 23Extraterrestrial research, 23
EISCAT, 35, 153
F-corona, 233Foil chaff, 59
Galaxies, 237Galaxy, 221Germany, 23Globular clusters,237Gravity waves, 161Green line, 167Ground installations, 203, 213
Heavy-ion clusters, 187Herzberg bands, 167Horizontal-branch stars, 237Horizontal layers, 161Housekeeping data, 289Hydrogen gas cell, 125Hygrometry, 43
Imaging, 161Incoherent-scatter radar, 187Inertial subrange, 187Infrared, 221Interstellar matter, 221Ion acceleration, 97Ion beams, 97Ion conies, 97Ionisation gauge, 179Ionosphere, 13
Large lightweight mirrors, 123LittLEO, 269Lower thermosphère, 179Low-frequency electric fields, 97LIDAR, 63, 253
MÏ3, 237Magnetometer, 111Magnetosphere, 13, 23Mass spectrometer, 129, 179Meinel bands, 167Mesopause, 63Mésosphère, 179
Metallic ions, 35Microgravity research, 23Middle atmosphere, 59, 79Mobility, 79Molecular clouds, 221
NEED campaign, 153Nightglow, 167
Observatories, 123Optical/IR properties of dust, 233Oxygen cross-sections, 49Oxygen gas cell, 125Oxygen photodissociation, 49
Particle acceleration, 93Payload recovery, 13Plasma diagnostics, 85Plasma instabilities, 141Polar latitude, 63, 253Polar Mésosphère Summer Echoes,
187Polycyclic aromatic hydrocarbons,
221Preferred heights, 59Resonance cell, 245Resonance cone, 85Resonance spectrometer, 125Rocket, 3Rocket attitude, 111Rocket experiments, 141
Schuhmann-Runge, 49Satellite launcher, 209Simulation, 161Skylark, 269Small-scale turbulence, 179Sodium layer, 253Solar activity prediction, 277Solar Lyman a line, 125, 245Solar radiation, 277Solar-Terrestrial physics, 277Sounding rockets, 13, 23, 117, 173,
203, 213, 245, 269Spectral index, 179
Proc. Ninth ESA/PAC Symposium on 'European Rocket and Balloon Programmes and Related Research ', Lahnstein, FRG, 3—7 April 1989(ESA SP-291, June 1989)
312 KEY-WORD INDEX
Sporadic E, 35Star formation, 237Star sensor, 111Stellar television, 117Stratosphere, 43, 129Substorm growth phase, 35Submm/FIR/IR techniques, 123Sudden sodium layer, 253Summer, 59, 63, 253Supernova 1987 A, 117Supernova payload, 239
Supernova Programme, 239, 289Switzerland, 3
Telecommand, 117Telemetry, 289Temperature anomaly, 85Temperatures, 63, 79Three-D distribution of auroral
emissions, 299
Turbulence, 59Turbulent energy dissipation rate,
179, 187Two-D maps of precipitating
particle energy, 299
UV astronomy, 237
Waves, 93Troposphere/stratosphere exchange, Wind corner, 59
43 Winter, 59