education resource pack - COUNTRY UNDER THREAT - ESA ...
26
education resource pack COUNTRY UNDER THREAT The prospects for life on small islands teacher guide and student worksheets Primary 8–11
-
Upload
khangminh22 -
Category
Documents
-
view
0 -
download
0
Transcript of education resource pack - COUNTRY UNDER THREAT - ESA ...

education resource pack
COUNTRY UNDER THREAT
The prospects for life on small islands
teacher guide and student worksheets
Primary
8–11

COUNTRY UNDER THREAT 2 European Space Agency climate change initiative
climate change initiative education resource pack – COUNTRY UNDER THREAT
https://climate.esa.int/en/educate/
Activity concepts developed by University of Twente (NL) and
National Centre for Earth Observation (UK)
The ESA Climate Office welcomes feedback and comments
https://climate.esa.int/helpdesk/
Produced by the ESA Climate office
Copyright © European Space Agency 2020
Overview page 3
Summary of activities page 4
Climate from Space page 6
Climate and sea level: background information page 7
Activity 1: COUNTRY UNDER THREAT page 8
Activity 2: MELTING ICE page 10
Activity 2: WARMING WATER page 13
Activity 4: WARM AND COLD SEAS page 16
Student worksheet 1 page 18
Student worksheet 2 page 20
Student worksheet 3 page 21
Student worksheet 4 page 22
Information sheet 1 page 24
Links page 26
COUNTRY UNDER THREAT 3 European Space Agency climate change initiative
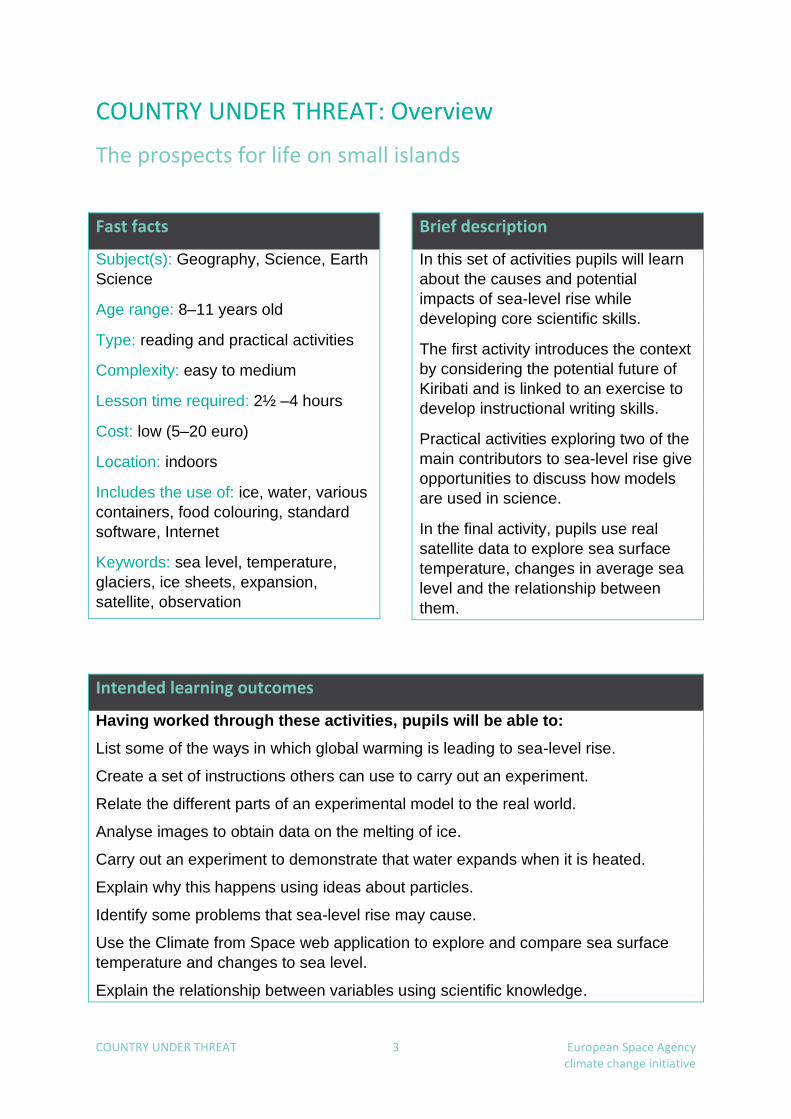
COUNTRY UNDER THREAT: Overview
The prospects for life on small islands
Fast facts
Subject(s): Geography, Science, Earth
Science
Age range: 8–11 years old
Type: reading and practical activities
Complexity: easy to medium
Lesson time required: 2½ –4 hours
Cost: low (5–20 euro)
Location: indoors
Includes the use of: ice, water, various
containers, food colouring, standard
software, Internet
Keywords: sea level, temperature,
glaciers, ice sheets, expansion,
satellite, observation
Brief description
In this set of activities pupils will learn
about the causes and potential
impacts of sea-level rise while
developing core scientific skills.
The first activity introduces the context
by considering the potential future of
Kiribati and is linked to an exercise to
develop instructional writing skills.
Practical activities exploring two of the
main contributors to sea-level rise give
opportunities to discuss how models
are used in science.
In the final activity, pupils use real
satellite data to explore sea surface
temperature, changes in average sea
level and the relationship between
them.
Intended learning outcomes
Having worked through these activities, pupils will be able to:
List some of the ways in which global warming is leading to sea-level rise.
Create a set of instructions others can use to carry out an experiment.
Relate the different parts of an experimental model to the real world.
Analyse images to obtain data on the melting of ice.
Carry out an experiment to demonstrate that water expands when it is heated.
Explain why this happens using ideas about particles.
Identify some problems that sea-level rise may cause.
Use the Climate from Space web application to explore and compare sea surface
temperature and changes to sea level.
Explain the relationship between variables using scientific knowledge.

COUNTRY UNDER THREAT 4 European Space Agency climate change initiative
Summary of activities
Title Description Outcome Prior learning Time
1 Country under threat
Story on the effect of sea-level rise on low-lying island nations as a basis for a comprehension exercise and a literacy activity. Optional discussion on local impacts of rising sea levels.
List some of the ways in which global warming is leading to sea-level rise. Create a set of instructions others can use to carry out an experiment.
None 45–60 minutes
2 Melting ice Monitoring and mapping the melting of ice.
Relate the different parts of an experimental model to the things they represent in the real world. Analyse images to obtain data on the melting of ice.
None
30 minutes (simple version) 1–1½ hours (with analysis)
3 Warming water
Practical activities demonstrating and explaining the thermal expansion of water.
Carry out an experiment to demonstrate that water expands when it is heated. Explain why this happens using ideas about particles. Identify problems that sea-level rise may cause.
None 30–45 minutes
4 Warm and cold seas
Research activity using Climate from Space web application. Optional additional research on El Niño.
Use the Climate from Space web application to explore and compare sea surface temperature and changes to sea level. Explain the relationship between variables using scientific knowledge.
Understanding of thermal expansion, e.g. through Activity 3
30 minutes
Times given are for the main exercises, assuming full IT access or/and distribution of repetitive calculations and plots around the
class. They include time for sharing results, but not presentation of outcomes as this will vary depending on the size of the class
and groups. Alternative approaches may take longer.
COUNTRY UNDER THREAT 5 European Space Agency climate change initiative
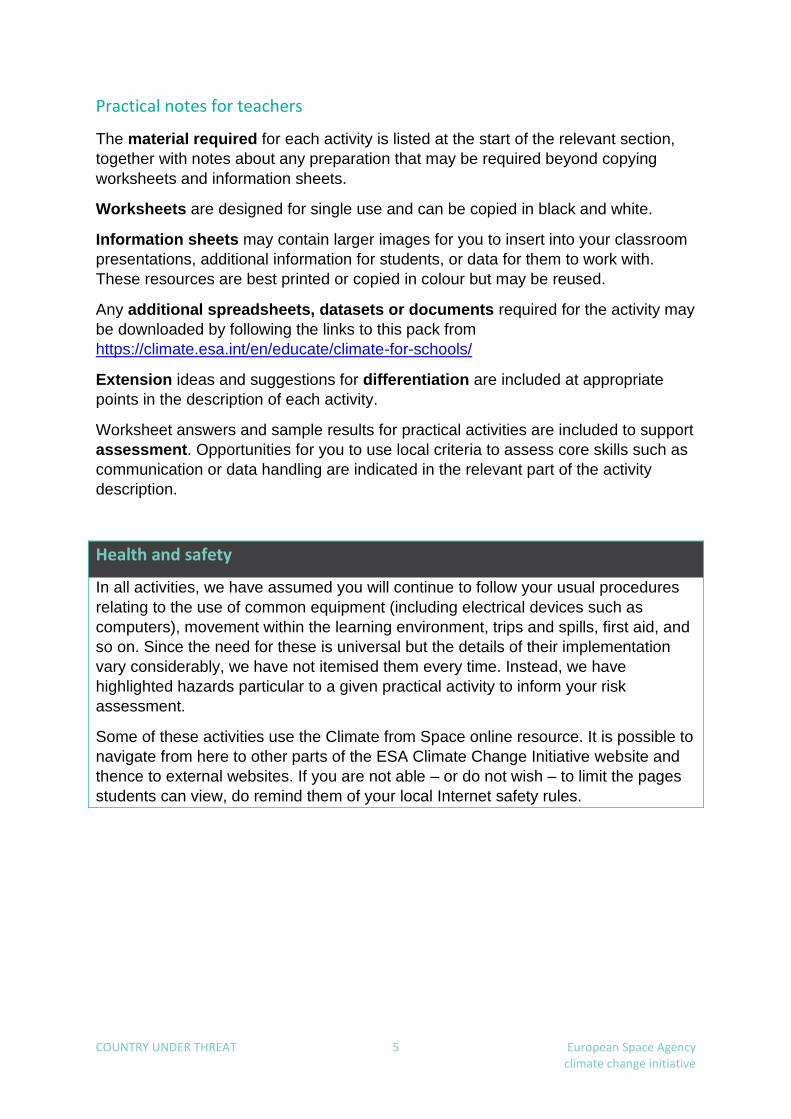
Practical notes for teachers
The material required for each activity is listed at the start of the relevant section,
together with notes about any preparation that may be required beyond copying
worksheets and information sheets.
Worksheets are designed for single use and can be copied in black and white.
Information sheets may contain larger images for you to insert into your classroom
presentations, additional information for students, or data for them to work with.
These resources are best printed or copied in colour but may be reused.
Any additional spreadsheets, datasets or documents required for the activity may
be downloaded by following the links to this pack from
https://climate.esa.int/en/educate/climate-for-schools/
Extension ideas and suggestions for differentiation are included at appropriate
points in the description of each activity.
Worksheet answers and sample results for practical activities are included to support
assessment. Opportunities for you to use local criteria to assess core skills such as
communication or data handling are indicated in the relevant part of the activity
description.
Health and safety
In all activities, we have assumed you will continue to follow your usual procedures
relating to the use of common equipment (including electrical devices such as
computers), movement within the learning environment, trips and spills, first aid, and
so on. Since the need for these is universal but the details of their implementation
vary considerably, we have not itemised them every time. Instead, we have
highlighted hazards particular to a given practical activity to inform your risk
assessment.
Some of these activities use the Climate from Space online resource. It is possible to
navigate from here to other parts of the ESA Climate Change Initiative website and
thence to external websites. If you are not able – or do not wish – to limit the pages
students can view, do remind them of your local Internet safety rules.

COUNTRY UNDER THREAT 6 European Space Agency climate change initiative
Climate from Space
ESA satellites play an important role in monitoring climate change. Climate from
Space (cfs.climate.esa.int) is an online resource that uses illustrated stories to
summarise some of the ways in which our planet is changing and highlight the work
of ESA scientists.
ESA’s Climate Change Initiative programme produces reliable global records of
some key aspects of the climate known as essential climate variables (ECVs). The
Climate from Space web application allows you to find out more about the impacts of
climate change by exploring this data for yourself.
Figure 1: Stories in Climate from Space (Source: ESA CCI)
Figure 2: Comparing sea level and sea surface temperature in the Climate from Space web application (Source: ESA CCI)

COUNTRY UNDER THREAT 7 European Space Agency climate change initiative
Climate and sea level: background information
Global warming and our oceans
Global warming has a number of effects on the enormous amount of water in the
oceans – and the ocean has a huge impact on the climate of the Earth because of
the vast amounts of energy it stores and the proportion of the planet it covers.
Sea levels are rising because of thermal expansion (warmer water takes up more
space), faster melting of ice on land (mountain glaciers in many parts of the world
and the massive ice sheets of Antarctica and Greenland) and changes to how we
use water which means more water from lakes and underground is making its way to
the oceans.
The impact of sea-level rise
The potential consequences of rising seas for coral island nations such as Kiribati
are dramatic and the people of these countries are working to protect their homes.
But governments in other places are also spending on projects to defend their own
coastline or adapt it to the changes they expect to see. Across the world, 680 million
people live in coastal zones and many of them are already feeling the effects of
increased flooding or higher storm surges. More and more people are moving to
cities, many of which are low-lying: every centimetre of sea-level rise means 3 million
more people live in a place where they may experience floods every year.
Monitoring changing seas
We can now use satellite sensors,
such as those carried by the satellite
shown in Figure 3, to measure sea
level, along with many of the factors
that are causing it to rise, including the
thickness and extent of ice sheets, and
the temperature of the ocean surface.
Satellites can take frequent
measurements across the whole world
rather than periodic measurements in
a few selected places. However,
instruments on buoys, research ships
and planes are still needed – scientists
use readings from them to calibrate
the satellite sensors and check that
the data from them is reliable. Figure 3: Sentinel-6 – a satellite that monitors sea level (Source: ESA/ATG Medialab)

COUNTRY UNDER THREAT 8 European Space Agency climate change initiative
Activity 1: COUNTRY UNDER THREAT
This activity uses the story of two children in Kiribati to introduce the reasons why global sea
levels are rising globally. Confident readers may be able to read the story themselves,
perhaps in preparation for the lesson. In the classroom, you can use material from the
related Climate from Space story to supplement the text.
The story describes experiments carried out by the characters. Rewriting the descriptions as
instructions provides an opportunity to develop literacy skills related to science and
reinforce some aspects of the scientific method.
Equipment
• Information sheet 1 (2 pages)
• Student worksheet 1 (2 pages)
• Climate from Space online resource: Coasts under threat story (optional)
Exercise
1. Read the story on Information sheet 1 to or with the class, pausing to check
understanding at appropriate places.
You could illustrate the text with material from the Climate from Space story
Coasts under threat as follows:
• There are more pictures of Kiribati in the gallery displayed on slide 2, along
with the image of New York used on the information sheet.
• The first part of the video on slide 3 (up to 1:33 minutes) gives more details
about the various contributions to sea-level rise (including figures which
students could note and use to create a graph or/and a pie chart).
• Another area already heavily affected by rising seas, the Mississippi delta, is
shown in the gallery on slide 5 which also contains the other two images used
on the information sheet.
2. Ask students to complete question 1 on the worksheet to summarise the causes
of sea-level rise.
If your country has a coastline, you could follow this with a discussion of possible
local effects of rising sea levels or/and things that are being done to reduce the
impact of, or adapt to, potential changes.
3. Explain that scientists repeat experiments that other scientists have done in
order to check the results are reliable. (The oldest national scientific institution in
the world, The Royal Society (UK), founded in 1660, has as its motto Nullius in
verba which is usually translated as ‘Take nobody’s word for it’.)
This is easier to do if we have a list of the equipment needed, step-by-step
instructions and, perhaps, a diagram of how to set the equipment up.
4. Ask students to change the descriptions of the experiments in the story to
instructions, working individually or in pairs and using the outline on the
worksheet.
Some students may need support to make sure there is a single action in each
step or/and to appreciate that the description in the story also includes the
results (what happened).

COUNTRY UNDER THREAT 9 European Space Agency climate change initiative
More able students may want to include additional detail – for example, the story
does not explain how to tell if the water level has changed.
5. Students could peer assess their instructions by considering exactly what they
would do if they only had the instructions created by another pair to follow.
Note: If students were to do the experiment following their instructions or those of
another pair you would need a lot of buckets and quite a lot of ice, so we are not
suggesting this, although you might want to follow Miss Bauro’s lead and do it as a
demonstration. There are instructions for a version of the activity using cups of water
and only two ice cubes per group in the ESA Climate Detectives pack The ice is
melting (see Links).
Worksheet answers
1. The four factors mentioned in the story are melting glaciers, melting ice sheets,
groundwater ending up in the ocean, water expanding as temperature rises.
2. Items in brackets are not specifically mentioned in the story.
Experiment 1 What you need: bucket, water, ice.
What to do:
Step 1: Put water in the bucket (and mark or note the water level).
Step 2: Add ice to the bucket.
Step 3: Leave the bucket in a warm place.
Step 4: Look at the water level after a few hours/when the ice has
melted (and mark or note the new level).
Experiment 2 What you need: bucket, water, ice, sand.
What to do
Step 1: Use the sand to make an ‘island’ in the bucket.
Step 2: Put water in the bucket, leaving some of the island
sticking out (and mark or note the water level).
Step 3: Put ice on the island.
Step 4: Leave the bucket in a warm place.
Step 5: Look at the water level after a few hours/when the ice has
melted (and mark or note the new level).

COUNTRY UNDER THREAT 10 European Space Agency climate change initiative
Activity 2: MELTING ICE
In this activity, students monitor the melting of ice. It provides an opportunity for them to
make close observations which may include scale drawing or/and using squared paper to
measure irregular areas. They may use a smartphone to model a satellite taking
observations from orbit, or you may set this up as a parallel demonstration.
Equipment
● A plate with a rim or edge, or a small tray or bowl for each group
● Three or four buttons or counters of different colours for each group
● Play dough to fix the markers in place
● An ice cube or lump of ice for each group
● Classroom clock
● A copy of Student worksheet 2 for each student with spares in case of spills
● Smartphone or tablet (optional)
● A stack of books or block of wood to support the phone if it is being used
● Squared or/and graph paper (optional)
● Acetate sheets printed with a grid (optional if using camera)
● Access to presentation, image- or/and word-processing software with which
students are familiar (optional, if using camera)
● Towels for wet hands and to deal with any spills
Note: The worksheet suggests various ways of recording the results: choose the one
appropriate to the age and ability of your students, the equipment available and the
skills you wish to develop. The first option is to describe close observations, but you
may wish younger children to simply draw what they see. If students are to measure
the area of the ice, analysing photographs is easier than making drawings that are
roughly to scale. A compromise may be to have students work in groups, writing
descriptions of what they see, in parallel with the phone version of the experiment
being run as a demonstration. The images from this activity can then be shared and
analysed by the whole class.
Preparation
You may want to try this out beforehand to find out the best height and position for a
phone (if relevant) or/and how long it takes ice cubes of the size you plan to use melt
to a noticeable extent in the environment of your classroom.
Health and safety
Make sure that the plates (and books/blocks if you are using them) are in stable
positions and not overhanging the edge of tables. They will need to stay in position
for some time and there is a risk of spills if they are dislodged.
Instruct students not to put anything – including their fingers! – in their mouths.
Ensure there is material available to deal with spills.
COUNTRY UNDER THREAT 11 European Space Agency climate change initiative
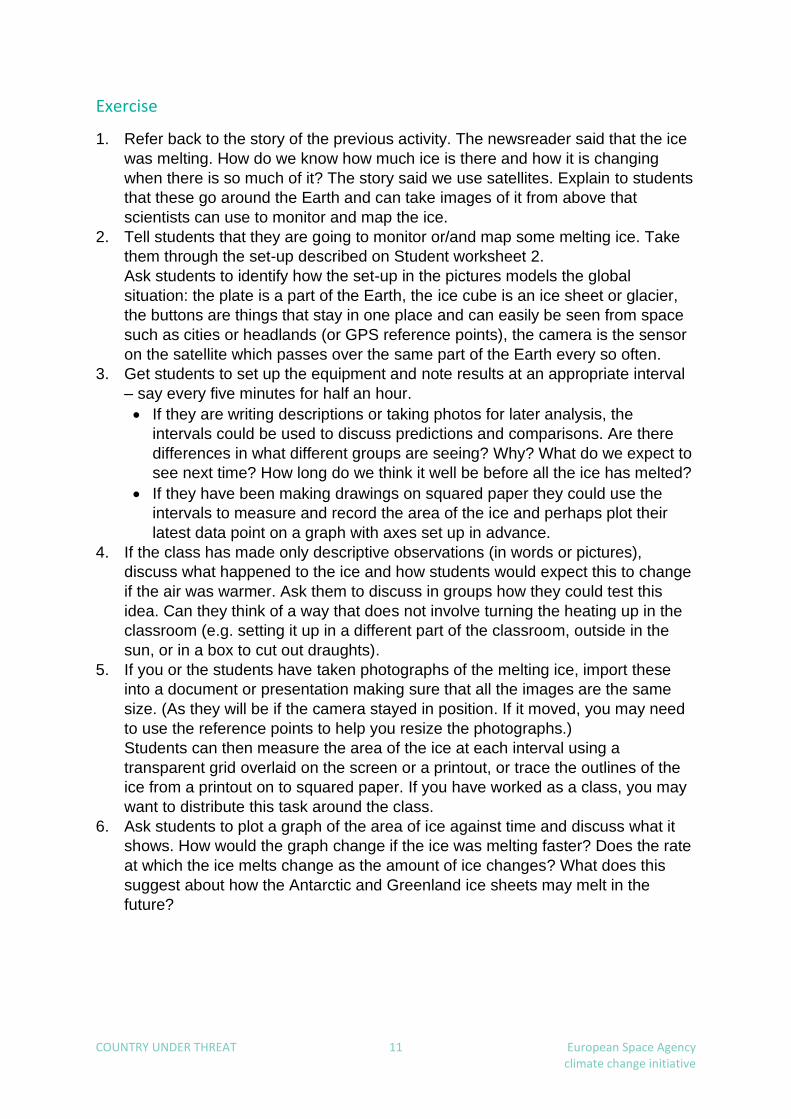
Exercise
1. Refer back to the story of the previous activity. The newsreader said that the ice
was melting. How do we know how much ice is there and how it is changing
when there is so much of it? The story said we use satellites. Explain to students
that these go around the Earth and can take images of it from above that
scientists can use to monitor and map the ice.
2. Tell students that they are going to monitor or/and map some melting ice. Take
them through the set-up described on Student worksheet 2.
Ask students to identify how the set-up in the pictures models the global
situation: the plate is a part of the Earth, the ice cube is an ice sheet or glacier,
the buttons are things that stay in one place and can easily be seen from space
such as cities or headlands (or GPS reference points), the camera is the sensor
on the satellite which passes over the same part of the Earth every so often.
3. Get students to set up the equipment and note results at an appropriate interval
– say every five minutes for half an hour.
• If they are writing descriptions or taking photos for later analysis, the
intervals could be used to discuss predictions and comparisons. Are there
differences in what different groups are seeing? Why? What do we expect to
see next time? How long do we think it well be before all the ice has melted?
• If they have been making drawings on squared paper they could use the
intervals to measure and record the area of the ice and perhaps plot their
latest data point on a graph with axes set up in advance.
4. If the class has made only descriptive observations (in words or pictures),
discuss what happened to the ice and how students would expect this to change
if the air was warmer. Ask them to discuss in groups how they could test this
idea. Can they think of a way that does not involve turning the heating up in the
classroom (e.g. setting it up in a different part of the classroom, outside in the
sun, or in a box to cut out draughts).
5. If you or the students have taken photographs of the melting ice, import these
into a document or presentation making sure that all the images are the same
size. (As they will be if the camera stayed in position. If it moved, you may need
to use the reference points to help you resize the photographs.)
Students can then measure the area of the ice at each interval using a
transparent grid overlaid on the screen or a printout, or trace the outlines of the
ice from a printout on to squared paper. If you have worked as a class, you may
want to distribute this task around the class.
6. Ask students to plot a graph of the area of ice against time and discuss what it
shows. How would the graph change if the ice was melting faster? Does the rate
at which the ice melts change as the amount of ice changes? What does this
suggest about how the Antarctic and Greenland ice sheets may melt in the
future?

COUNTRY UNDER THREAT 12 European Space Agency climate change initiative
Sample results
The results shown in Figure 4 and
the table were collected working
outdoors on a warm sunny day in
August.
Figure 5 shows a sequence of
images from a second run that
have been cropped and resized so
a grid can be used to compare the
area of the ice in each case.
Time Time since start
(minutes) Observations
13:30 0 A large block of ice.
13:35 5 The edges of the block have melted.
It has moved to a different place.
13:40 10 The ice block has moved, maybe it has slid on the water below it or someone has nudged the table.
13:45 15 The ice block is smaller.
13:50 20 The ice block has almost completely melted.
Figure 4: Melting ice observations at 13:30 and 13:50 (Source: ESA CCI)
Figure 5: Melting ice images resized and cropped so areas can be measured using an overlay (Source: ESA CCI)
COUNTRY UNDER THREAT 13 European Space Agency climate change initiative
Activity 3: WARMING WATER
An experiment illustrating the thermal expansion of water. This being a major cause of rising
seas is mentioned in the story in Activity 1 and explored further in Activity 3.
Equipment
• 2 identical bottles with plastic lids for each group – small bottles will give
faster results; 500 ml PET water bottles work well
• 2 transparent straws for each group – narrower ones are better
• Food colouring or ink
• A jug or large beaker for each group
• Play dough or similar material – each group will need a piece about the size of
a walnut
• Heat source – this could be, for example, a sunny windowsill, a reading lamp
with a filament bulb, a bowl of hot water to use as a water bath, a heat pad of
the sort used for home winemaking, a hairdryer or a fan heater
• Cloths to deal with spills
• A tray for each group to work in (optional)
• Marker pen and ruler (optional)
• Student worksheet 3 – one copy per student with spares in case of spills
• Chalk or tape to mark a box on the ground
Preparation
• Make a hole for the straw in the lid of each bottle using a bradawl or pointed
scissors. If the bottles have nipple tops, remove the lid and cut away any plastic
inside the nipple so the straw can go in.
• You may want to prepare jugs of coloured water rather than allowing children to
colour the water themselves.
• If laboratory equipment is available, you can use boiling tubes, capilliary tubing
and a holed bung. The tubing needs to fit tightly into the hole in the bung so it is
advised to insert it in advance to reduce the risk of injury from broken glass.
• The time taken to obtain measurable results varys widely depending on the
equipment and heat source used. It is, therefore, important to try this out in
advance and structure the session accordingly.
Health and safety
Instruct students not to put anything – including their fingers! – in their mouths.
If mains electrical equipment is to be used, make sure it has been safety tested, that
students do not to touch it with wet hands and that leads do not pose a trip hazard.
Warn students if the heat source is likely to become hot to the touch (although the
use of such devices is not recommended).
Ensure there is material available to deal with spills.

COUNTRY UNDER THREAT 14 European Space Agency climate change initiative
Exercise
1. Refer back to the story in Activity 1. Miss Bauro tells Joena and Afa that warm
water takes up more space than cold water but she does not show them this is
so. Explain this is called expansion, and discuss whether or not we see water
expanding at home. If we take a bottle of water from the fridge, does it get fuller?
(You may need to point out that something different is going on when a pot boils
over!) Is Miss Bauro wrong? Maybe not.
2. Discuss the idea that the change of volume of a liquid is much more visible if we
put it in a narrow container. (You could perhaps use a straw as a pipette to pick
up some coloured water and transfer it to a beaker – the water shows up in the
straw but barely covers the bottom of the larger container.) So if the only place
water has to go when it expands is into a narrow place, we’ll be able to see the
change.
3. Get students to set up the equipment as described on Student worksheet 3. You
will need to tell them where to leave each bottle and how long for.
With younger students, transferring the water with all the equipment on a tray
(such as a shallow storage tray) may help to contain spills.
If the sensitivity of the set-up you are using allows, you may want older or more
able students to produce a graph showing how the level changes over time.
They may find it easier to make a mark on the straw where it meets the bottle
and then mark the water level at intervals, they can make the measurements
when the equipment has been disassembled.
4. This next step can be done while students wait for the water to warm or after
they have noted the results, as appropriate.
Remind or explain to students that everything is made up of particles and the
hotter something is, the faster the particles in it move. Get a group of students
(anything from four to a whole class) to stand close together and mark a box
around them on the floor using chalk or tape. Ask the students to start wiggling
and then moving faster – they will soon find it difficult to stay in the box. When
particles move faster, they take up more space.
5. Ask students to use these ideas to explain what they saw happening in their
experiment, noting their ideas on the worksheet.
6. The seas are huge, not narrow like the straw, so it may seem they will not rise
that much. Discuss this with students bringing out the following points:
• Water is very good at storing heat (think about how long a bath of water stays
warm compared to how quickly the air in a room cools).
• The oceans cover 70% of our planet and are very deep – that’s a lot of water.
• Many of the world’s major cities – and therefore lots of the world’s population,
are coastal so will be affected by relatively small rises. (Students could use
maps and population data to explore this further.)
• Flooding and land disappearing are not the only problem. Think about the
effects of seawater seeping into ground it does not normally reach – parts of
many cities are underground, wetter ground may not support buildings so
well, we pull fresh water from the ground and plants depend on it too.

COUNTRY UNDER THREAT 15 European Space Agency climate change initiative
• Scientists, therefore, keep a close eye on sea temperatures and sea levels
and we will look at some of their data in the next activity.
Sample results
As noted above, results depend on the equipment used and the
environment, but water should move into the straw of the bottle
left in a warm place. The bottle shown in Figure 6 had been
sitting in the bowl of hot tap water for about five minutes.
There may be a slight change in level for the bottle left in a cool
place if the water used was cooler than the surroundings.
Worksheet answer
The heat makes the water particles move around more.
When they are moving more, they take take up more space.
So the water expanded into the straw because there was no
more room in the bottle.
Figure 6: Warming water activity result (Source: ESA CCI)

COUNTRY UNDER THREAT 16 European Space Agency climate change initiative
Activity 4: WARM AND COLD SEAS
In this activity, students use the Climate from Space web application to explore sea surface
temperatures and sea level changes across the globe. Looking at both datasets together
gives the students an opportunity to relate satellite data to experimental work on thermal
expansion.
Equipment
• Internet access
• Climate from Space web application
• Student worksheet 4 (2 pages)
• Coloured pencils
Exercise
1. Ask students to open the Climate from Space web application and navigate to
the sea surface temperature data layer.
Ensure students understand the colour scale (blue is cool, red is hot).
It would be worth discussing why the lowest temperature is just below freezing
(sea water freezes at a lower temperature than fresh water) and what the hottest
temperature on the scale would feel like (swimming pools are often heated to
28–29°C, a hot bath will be 40–45°C).
2. Give students time to explore the data before asking them to answer the first two
questions on Student worksheet 4.1.
You may want to encourage students to draw a number line to help them answer
the second question if they are not familiar with operations involving negative
numbers.
3. Demonstrate how to switch to the sea level dataset and again discuss the colour
scale. This step may not be necessary for older students who may be able to
continue by following the instructions on the worksheet.
4. Ask students to answer questions 3 and 4 from the worksheet. They will
probably need to refer to an online map or atlas to find the locations.
Students working more quickly could spend some time investigating how sea
levels at a single location vary. Is there a regular pattern over a year? Is there a
longer-term trend?
5. Show students how to bring up two globes side by side, if necessary, before
asking them to continue with the questions on Student worksheet 4.2.
Students might want to look for interesting patterns in other years, explore how
the location and path of currents of cooler water vary from year to year, or carry
out some independent research on El Niño.
Worksheet answers
Sea temperatures
1. The South Pole.
2. About 40°C: 37°C – (–3°C) = 40°C

COUNTRY UNDER THREAT 17 European Space Agency climate change initiative
Sea levels
3.
4.
Comparing sea levels and temperatures
5. Students’ pictures should be simplified versions of the data shown in
Figure 7.
Note: There was a strong La Niña in 1998–1999. The opposite pattern – El
Niño – shows clearly in the sea level data (see, for example, October to
December 2015) but less so in the temperature data as this looks at absolute
values rather than differences.
6. a. Lower than usual.
b. Cooler water takes up less space than warmer water (over this temperature
range).
Place Date Sea level
Red Sea August 1994 much lower than usual
Baltic Sea January 2000 much higher than usual
Mediterranean Sea April 2004 a little lower than usual
North Sea February 2009 about the same as usual/ a little lower than usual
Gulf of Guinea May 2015 a little higher than usual
Figure 7: Sea level and sea surface temperature for October 1998 in the Climate from Space web application (Source: ESA CCI)

COUNTRY UNDER THREAT 18 European Space Agency climate change initiative
Worksheet 1: COUNTRY UNDER THREAT
1. Why are sea levels rising?
(There are four reasons mentioned in the story – can you find them all?)
___________________________________________________________________
___________________________________________________________________
___________________________________________________________________
___________________________________________________________________
2. Miss Bauro, Joena and Afa do two experiments.
Write step-by-step instructions to help someone repeat these experiments.
List the equipment they will need and draw diagrams to show how to set up the
equipment. (You might not need to use every line.)
Experiment 1
What you need
____________________________ ____________________________
____________________________ ____________________________
Diagram
What to do
Step 1 _____________________________________________________________
___________________________________________________________________
Step 2 _____________________________________________________________
___________________________________________________________________
Step 3 _____________________________________________________________
___________________________________________________________________
Step 4 _____________________________________________________________
___________________________________________________________________
Step 5 _____________________________________________________________
___________________________________________________________________
STU
DEN
T W
OR
KSH
EET
1.1

COUNTRY UNDER THREAT 19 European Space Agency climate change initiative
Experiment 2
What you need
____________________________ ____________________________
____________________________ ____________________________
Diagram
What to do
Step 1 _____________________________________________________________
___________________________________________________________________
Step 2 _____________________________________________________________
___________________________________________________________________
Step 3 _____________________________________________________________
___________________________________________________________________
Step 4 _____________________________________________________________
___________________________________________________________________
Step 5 _____________________________________________________________
___________________________________________________________________
STU
DEN
T W
OR
KSH
EET
1.2
COUNTRY UNDER THREAT 20 European Space Agency climate change initiative
Worksheet 2: MELTING ICE
What you need ● Plate
● Three or four buttons (different colours)
● Some play dough
● A large ice cube
● A clock
You might also want ● A pile of books
● A smartphone
● Squared paper or graph paper
What to do
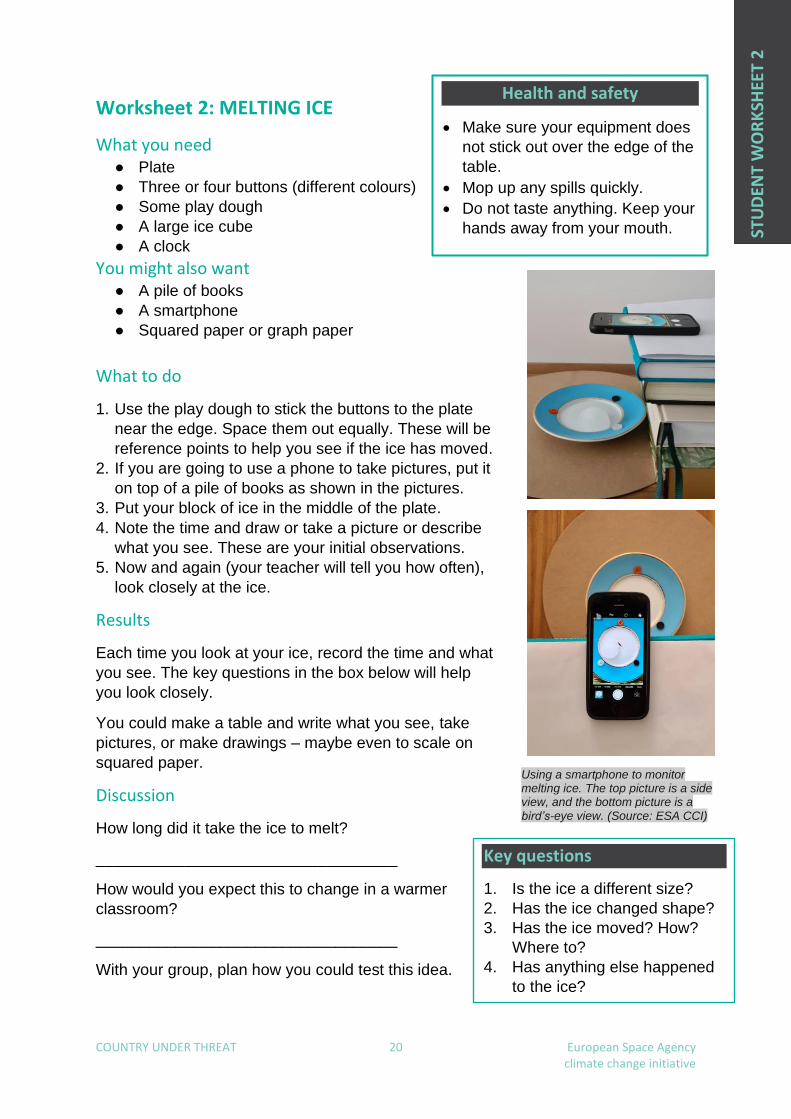
1. Use the play dough to stick the buttons to the plate
near the edge. Space them out equally. These will be
reference points to help you see if the ice has moved.
2. If you are going to use a phone to take pictures, put it
on top of a pile of books as shown in the pictures.
3. Put your block of ice in the middle of the plate.
4. Note the time and draw or take a picture or describe
what you see. These are your initial observations.
5. Now and again (your teacher will tell you how often),
look closely at the ice.
Results
Each time you look at your ice, record the time and what
you see. The key questions in the box below will help
you look closely.
You could make a table and write what you see, take
pictures, or make drawings – maybe even to scale on
squared paper.
Discussion
How long did it take the ice to melt?
__________________________________
How would you expect this to change in a warmer
classroom?
__________________________________
With your group, plan how you could test this idea.
Health and safety
• Make sure your equipment does
not stick out over the edge of the
table.
• Mop up any spills quickly.
• Do not taste anything. Keep your
hands away from your mouth.
Key questions
1. Is the ice a different size?
2. Has the ice changed shape?
3. Has the ice moved? How?
Where to?
4. Has anything else happened
to the ice?
Using a smartphone to monitor melting ice. The top picture is a side view, and the bottom picture is a bird’s-eye view. (Source: ESA CCI)
STU
DEN
T W
OR
KSH
EET
2

COUNTRY UNDER THREAT 21 European Space Agency climate change initiative
Worksheet 3: WARMING WATER
What you need • 2 plastic bottles with holes in the lids
• Coloured water
• 2 straws
• Play dough
What to do 1. Set up your bottles as in the picture:
a. Pour coloured water into the bottle right up
to the top, then put the lid on the bottle.
b. Put a straw through the hole in the lid.
Leave about three quarters of the straw
sticking out of the the bottle.
c. Wrap play dough around the straw to keep it
in place and make sure no air can get into
the bottle through the lid.
2. Put one of your bottles in a cool place.
3. Put the other bottle in a warm place.
4. Leave both bottles alone for a while.
What happened Write or draw what happened in these boxes.
Bottle in a cool place Bottle in a warm place
Explanation Use ideas about particles to explain what happened.
___________________________________________________________________
___________________________________________________________________
___________________________________________________________________
STU
DEN
T W
OR
KSH
EET
3
Health and safety
• Pour coloured water carefully so you
don’t stain your skin or anything else.
• Mop up any spills quickly.
• Do not taste anything. Keep your
hands away from your mouth.
• Make sure your hands are dry before
you touch any electrical equipment.
• Be careful near hot objects.
• .
(So
urc
e: E
SA
CC
I)

COUNTRY UNDER THREAT 22 European Space Agency climate change initiative
Worksheet 4: WARM AND COLD SEAS
Sea temperatures
Open the Climate from Space web application (cfs.climate.esa.int).
Click on the Data Layers symbol (top right) and pick Sea Surface Temperature.
Check you understand the colours and how the controls on the screen help you to
look more closely at particular places or times.
1. Move the globe so you can see the Arctic, and then the Antarctic.
Which pole has colder water surrounding it?
_______________________________________________________________
2. Work out the temperature difference between the ocean near the equator and
the ocean near the poles.
_______________________________________________________________
Sea levels
Open the Data Layers list.
Pick Sea Level.
This map shows the average sea level compared to the usual value for the time of
year. Shades of blue mean the sea is lower than usual, shades of red mean the sea
is higher than usual. The darker the colour, the bigger the difference.
3. Move the globe and the timeline dot so you see the Red Sea in August 1994.
Was the level of the sea much higher than usual, a little higher than usual, the
same as usual, a little lower than usual or a lot lower than usual?
Write your answer in the third column of the table below.
4. Now do the same for the other times and places in the table.
Place Date Sea level
Red Sea August 1994
Baltic Sea January
2000
Mediterranean Sea
April 2004
North Sea February
2009
Gulf of Guinea May 2015
STU
DEN
T W
OR
KSH
EET
4.1

COUNTRY UNDER THREAT 23 European Space Agency climate change initiative
Comparing sea levels and temperatures
Open the Data Layers list again.
Click COMPARE next to Sea Surface Temperature.
You should now see two globes side by side on your screen.
5. Rotate the globes so you see the Pacific Ocean with some of America showing at
the top and New Zealand just visible at the bottom (as in the diagrams below).
Move the timeline bar to October 1998.
Colour in the pictures to show the main patterns you see on each globe.
Add a key to your diagrams.
Sea Level Sea Surface Temperature
lower than usual arrowshigher than usual cold space for arrow a white text gap hot
6. Look on the temperature globe for a band of cooler water near the equator.
Now look at the same place on the sea level globe.
a. What is the sea level like in the places where the temperature is lower?
_________________________________________________________________
b. Why? _________________________________________________________
_________________________________________________________________
STU
DEN
T W
OR
KSH
EET
4.2

COUNTRY UNDER THREAT 24 European Space Agency climate change initiative
Information sheet 1: COUNTRY UNDER THREAT
Kiribati (you say it ‘ki-ri-bas’) is a group
of small tropical islands in the Pacific
Ocean. Joena lives on one of these
islands with her mum, dad and little
brother in a beautiful house close to the
beach. Many, many generations of her
ancestors lived on the same island. Her
father is a fisherman, her mum is a
nurse. Afa is Joena’s best friend.
Together they play on the beach, swim
in the lagoon and try to climb the palm
trees. Life in Kiribati is good.
After a day outdoors, Joena loves to sit on the sofa with a cup of chocolate.
Sometimes she watches the news with her mum. Usually this helps Joena to fall
asleep, but today she heard something that shocked her. The newsreader was
talking about global warming, saying the temperature of the Earth is increasing.
Because it is warmer, all the seas and oceans around the world are rising. The
newsreader said scientists expect the islands of Kiribati will be completely drowned
by the year 2100.
Joena can’t sleep because she is afraid that her family will have to move one day.
She would like to know why the level of the ocean is rising. Even though it is now the
middle of the night, she calls Afa. He doesn’t know either, so they decide to talk to
their teacher in the morning.
Joena and Afa are first into class the next day. They ask their teacher, Miss Bauro, if
she has a minute. When they tell her what it said on the news, she is shocked, too.
‘But why is it happening?’ Joena asks. ‘Is it because the ice where the polar bears
live is melting?’
Miss Bauro stands up. ‘Wait a minute’, she says and walks away.
Five minutes later, she comes back with a bucket of water and a bag of ice cubes.
They throw the ice cubes into the bucket and put it on a sunny windowsill. When they
look in the bucket an hour later, they see that the floating ice cubes have all gone but
nothing has happened to the water level. Now they are even more puzzled. If the ice
floating in the sea doesn’t make the water rise, what does?
The next day, Miss Bauro, Joena and Afa do another experiment with the bucket of
water and a new bag of ice cubes. Miss Bauro has made an island of sand in the
middle of the bucket and this time they put the ice cubes on the island. ‘We’ll come
back in a few hours and see what has happened,’ the teacher says. When they
come back, they see that all the ice cubes have disappeared and that the island is
covered by water.
INFO
RM
ATI
ON
SH
EET
1.1
(So
urc
e: D
iede
rik V
ee
rma
n,
Mu
se
on
Th
e H
ag
ue
)
COUNTRY UNDER THREAT 25 European Space Agency climate change initiative
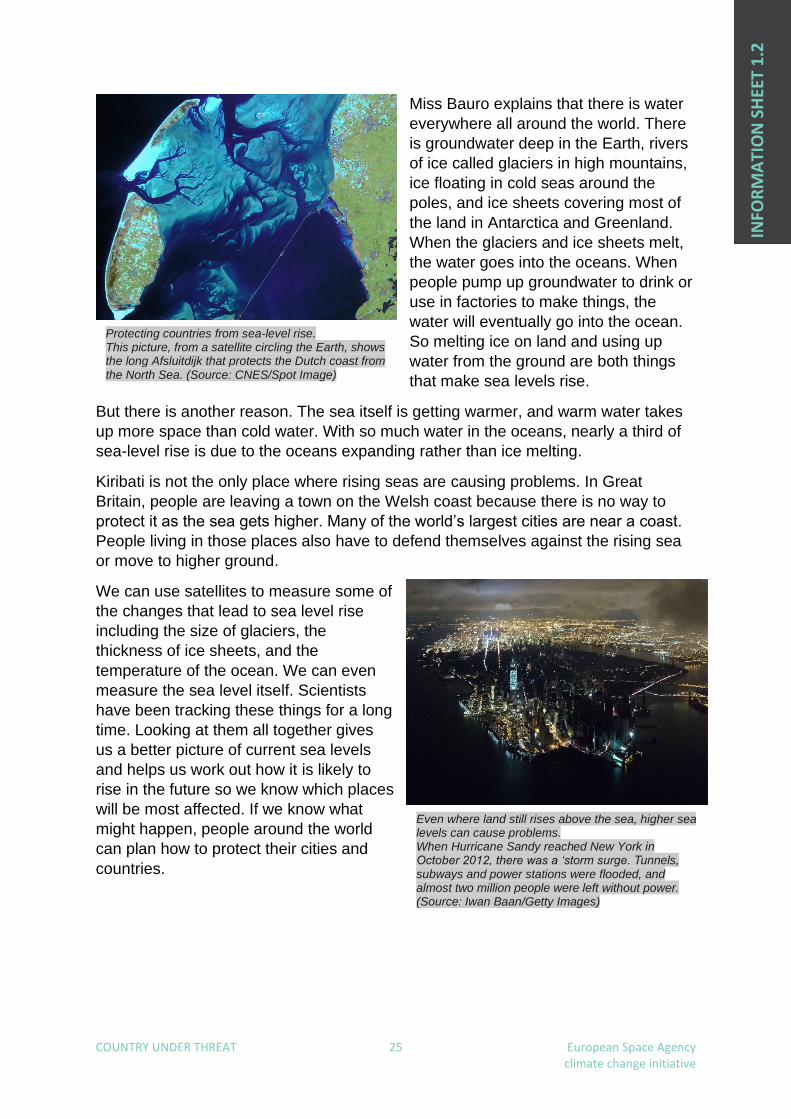
Miss Bauro explains that there is water
everywhere all around the world. There
is groundwater deep in the Earth, rivers
of ice called glaciers in high mountains,
ice floating in cold seas around the
poles, and ice sheets covering most of
the land in Antarctica and Greenland.
When the glaciers and ice sheets melt,
the water goes into the oceans. When
people pump up groundwater to drink or
use in factories to make things, the
water will eventually go into the ocean.
So melting ice on land and using up
water from the ground are both things
that make sea levels rise.
But there is another reason. The sea itself is getting warmer, and warm water takes
up more space than cold water. With so much water in the oceans, nearly a third of
sea-level rise is due to the oceans expanding rather than ice melting.
Kiribati is not the only place where rising seas are causing problems. In Great
Britain, people are leaving a town on the Welsh coast because there is no way to
protect it as the sea gets higher. Many of the world’s largest cities are near a coast.
People living in those places also have to defend themselves against the rising sea
or move to higher ground.
We can use satellites to measure some of
the changes that lead to sea level rise
including the size of glaciers, the
thickness of ice sheets, and the
temperature of the ocean. We can even
measure the sea level itself. Scientists
have been tracking these things for a long
time. Looking at them all together gives
us a better picture of current sea levels
and helps us work out how it is likely to
rise in the future so we know which places
will be most affected. If we know what
might happen, people around the world
can plan how to protect their cities and
countries.
Protecting countries from sea-level rise. This picture, from a satellite circling the Earth, shows the long Afsluitdijk that protects the Dutch coast from the North Sea. (Source: CNES/Spot Image)
Even where land still rises above the sea, higher sea levels can cause problems. When Hurricane Sandy reached New York in October 2012, there was a ‘storm surge. Tunnels, subways and power stations were flooded, and almost two million people were left without power. (Source: Iwan Baan/Getty Images)
INFO
RM
ATI
ON
SH
EET
1.2

COUNTRY UNDER THREAT 26 European Space Agency climate change initiative
Links
ESA resources
Climate from Space online resource
https://cfs.climate.esa.int
Climate for schools
https://climate.esa.int/en/educate/climate-for-schools/
Teach with space
http://www.esa.int/Education/Teachers_Corner/Teach_with_space3
Climate Detectives: The ice is melting
https://www.esa.int/Education/Teachers_Corner/The_ice_is_melting_How_can
_we_investigate_the_effects_of_melting_ice_Teach_with_space_PR13
ESA space projects
ESA Climate Office
https://climate.esa.int/en/
Space for our climate
http://www.esa.int/Applications/Observing_the_Earth/Space_for_our_climate
ESA’s Earth Observation missions
www.esa.int/Our_Activities/Observing_the_Earth/ESA_for_Earth
Earth Explorers
http://www.esa.int/Applications/Observing_the_Earth/The_Living_Planet_
Programme/Earth_Explorers
Copernicus Sentinels
https://www.esa.int/Applications/Observing_the_Earth/Copernicus/Overview4
Copernicus Sentinel-6
https://www.esa.int/Applications/Observing_the_Earth/Copernicus/Sentinel-
6_overview
Extra information
Tarawa, Kiribati
https://www.esa.int/ESA_Multimedia/Videos/2020/09/Earth_from_Space_Tarawa
_Kiribati
Earth from Space videos
http://www.esa.int/ESA_Multimedia/Sets/Earth_from_Space_programme
ESA Kids
https://www.esa.int/kids/en/learn/Earth/Climate_change/Climate_change