
CDF Study Report - ESA Science & Technology
431
Ice Giants CDF Study Report: CDF-187(C) January 2019 page 1 of 431 ESA UNCLASSIFIED – Releasable to the Public CDF Study Report Ice Giants A Mission to the Ice Giants – Neptune and Uranus
-
Upload
khangminh22 -
Category
Documents
-
view
0 -
download
0
Transcript of CDF Study Report - ESA Science & Technology

Ice Giants CDF Study Report: CDF-187(C)
January 2019 page 1 of 431
ESA UNCLASSIFIED – Releasable to the Public
CDF Study Report
Ice Giants A Mission to the Ice Giants – Neptune and Uranus

Ice Giants CDF Study Report: CDF-187(C)
January 2019 page 2 of 431
ESA UNCLASSIFIED – Releasable to the Public
This study is based on the ESA CDF Open Concurrent Design Tool (OCDT), which is a community software tool released under ESA licence. All rights reserved.
Further information and/or additional copies of the report can be requested from:
S. Bayon
ESA/ESTEC/ SCI-FMP
Postbus 299
2200 AG Noordwijk
The Netherlands
Tel: +31-(0)71-5655502
Fax: +31-(0)71-5655985
For further information on the Concurrent Design Facility please contact:
M. Bandecchi
ESA/ESTEC/TEC-SYE
Postbus 299
2200 AG Noordwijk
The Netherlands
Tel: +31-(0)71-5653701
Fax: +31-(0)71-5656024
FRONT COVER
Study Logo showing the two ice giants Neptune and Uranus

Ice Giants CDF Study Report: CDF-187(C)
January 2019 page 3 of 431
ESA UNCLASSIFIED – Releasable to the Public
STUDY TEAM
This study was performed in the ESTEC Concurrent Design Facility (CDF) by the following interdisciplinary team:
TEAM LEADER
AOCS/GNC POWER
COMMUNICATIONS PROGRAMMATICS/ AIV
CONFIGURATION CHEMICAL PROPULSION
COST RISK
AEROTHERMO DYNAMICS
SIMULATION
DATA HANDLING MISSION ANALYSIS
GS&OPS STRUCTURES
RADIATION/ ATMOSPHERIC MODEL
SYSTEMS
MECHANISMS THERMAL
Under the responsibility of:
S. Bayon, SCI-FMP, Study Manager
SCI-FMA, Study Manager Support
SCI-FIS, Payload Study Manager
P.Falkner, SCI-FM, Program Responsible
With the scientific assistance of:
SCI-S, Study Scientist
With the technical support of:
TEC-SYE, Systems Support
SCI-PUS, Systems Support
TEC-MPA, EDS Parachute
TEC-MXC, Programmatics/AIV

Ice Giants CDF Study Report: CDF-187(C)
January 2019 page 4 of 431
ESA UNCLASSIFIED – Releasable to the Public
The editing and compilation of this report has been provided by:
A. Pickering, TEC-SYE, Technical Author

Ice Giants CDF Study Report: CDF-187(C)
January 2019 page 5 of 431
ESA UNCLASSIFIED – Releasable to the Public
TABLE OF CONTENTS
1 INTRODUCTION .................................................................................. 15
1.1 Background ........................................................................................................... 15
1.2 Objective ................................................................................................................ 15
1.3 Scope .................................................................................................................... 16
1.4 Document Structure ............................................................................................. 16
2 EXECUTIVE SUMMARY ...................................................................... 17
2.1 Study Flow ............................................................................................................. 17
2.2 Neptune ................................................................................................................. 17
2.2.1 Requirements and Design Drivers .................................................................. 17 2.2.2 Mission ........................................................................................................... 20
2.3 Uranus .................................................................................................................. 23
2.4 Technical Conclusions and Options..................................................................... 24
2.4.1 Probe .............................................................................................................. 24 2.4.2 Orbiter ............................................................................................................ 25 2.4.3 Lander ............................................................................................................ 25
3 SCIENCE OBJECTIVES ........................................................................ 27
3.1 Background .......................................................................................................... 27
3.2 Mission Justification ............................................................................................ 27
3.3 Science Objectives ................................................................................................ 27
3.3.1 Atmospheric Probes ....................................................................................... 27 3.3.2 Orbiters .......................................................................................................... 28 3.3.3 Triton Lander ................................................................................................. 28
3.4 Mission Requirements ......................................................................................... 28
4 NEPTUNE MISSION ANALYSIS .......................................................... 33
4.1 Atmospheric Probe ............................................................................................... 34
4.1.1 Requirements and Design Drivers ................................................................. 34 4.1.2 Assumptions and Trade-Offs ......................................................................... 34 4.1.3 Baseline Design .............................................................................................. 34 4.1.4 Budgets ........................................................................................................... 35
4.2 Orbiter .................................................................................................................. 38
4.2.1 Assumptions and Trade-Offs ......................................................................... 38 4.2.2 Baseline Design .............................................................................................. 38 4.2.3 Budgets ........................................................................................................... 38
5 NEPTUNE SYSTEMS ............................................................................ 41
5.1 Atmospheric Probe ............................................................................................... 41
5.1.1 Mission & System Requirements and Design Drivers .................................. 41 5.1.2 System Assumptions and Trade-Offs ............................................................ 41 5.1.3 Mission System Architecture ......................................................................... 42 5.1.4 System Baseline Design ................................................................................. 43

Ice Giants CDF Study Report: CDF-187(C)
January 2019 page 6 of 431
ESA UNCLASSIFIED – Releasable to the Public
5.1.5 System Budgets .............................................................................................. 46 5.1.6 Comparison with Galileo probe and PEP ...................................................... 50
5.2 Orbiter .................................................................................................................. 52
5.2.1 Mission and System Requirements ............................................................... 52 5.2.2 Design Drivers ................................................................................................ 53 5.2.3 System Assumptions and Trade-Offs ............................................................ 53 5.2.4 Mission System Architecture ......................................................................... 57 5.2.5 System Baseline Design ................................................................................. 59 5.2.6 System Budgets .............................................................................................. 60 5.2.7 System Options ............................................................................................... 71 5.2.8 Future Work ................................................................................................... 80 5.2.9 Technology Needs .......................................................................................... 81
6 NEPTUNE PAYLOAD .......................................................................... 83
6.1 Atmospheric Probe ............................................................................................... 83
6.1.1 Requirements and Design Drivers ................................................................. 83 6.1.2 Assumptions and Trade-Offs ......................................................................... 83 6.1.3 Baseline Design .............................................................................................. 84 6.1.4 List of Equipment ........................................................................................... 85 6.1.5 Options ........................................................................................................... 85 6.1.6 Technology Needs .......................................................................................... 87
6.2 Orbiter .................................................................................................................. 87
6.2.1 Requirements and Design Drivers ................................................................. 87 6.2.2 Assumptions and Trade-Offs ......................................................................... 87 6.2.3 Baseline Design .............................................................................................. 87 6.2.4 List of Equipment ........................................................................................... 89 6.2.5 Options ........................................................................................................... 89 6.2.6 Technology Needs .......................................................................................... 89
7 NEPTUNE CONFIGURATION .............................................................. 91
7.1 Atmospheric Probe ............................................................................................... 91
7.1.1 Requirements and Design Drivers ................................................................. 91 7.1.2 Assumptions and Trade-Offs ......................................................................... 91 7.1.3 Baseline Design .............................................................................................. 91 7.1.4 Overall Dimensions ........................................................................................ 92
7.2 Orbiter .................................................................................................................. 96
7.2.1 Requirements and Design Drivers ................................................................. 96 7.2.2 Assumptions and Trade-Offs ......................................................................... 96 7.2.3 Baseline Design .............................................................................................. 96 7.2.4 Overall Dimensions ........................................................................................ 99
8 NEPTUNE STRUCTURES ................................................................... 101
8.1 Atmospheric Probe .............................................................................................. 101
8.1.1 Requirements and Design Drivers ................................................................ 101 8.1.2 Assumptions and Trade-Offs ....................................................................... 102 8.1.3 Baseline Design ............................................................................................ 102 8.1.4 List of Equipment ......................................................................................... 103

Ice Giants CDF Study Report: CDF-187(C)
January 2019 page 7 of 431
ESA UNCLASSIFIED – Releasable to the Public
8.1.5 Options ......................................................................................................... 104 8.1.6 Technology Needs ........................................................................................ 104
8.2 Orbiter ................................................................................................................ 104
8.2.1 Requirements and Design Drivers ............................................................... 104 8.2.2 Assumptions and Trade-Offs ....................................................................... 105 8.2.3 Baseline Design ............................................................................................ 107 8.2.4 List of Equipment ........................................................................................ 108 8.2.5 Options ......................................................................................................... 108 8.2.6 Technology Needs ........................................................................................ 108
9 NEPTUNE MECHANISMS .................................................................. 109
9.1 Atmospheric Probe ............................................................................................. 109
9.1.1 Requirements and Design Drivers ............................................................... 109 9.1.2 Assumptions and Trade-Offs ....................................................................... 109 9.1.3 Baseline Design ............................................................................................. 110 9.1.4 List of Equipment ......................................................................................... 112
9.2 Orbiter ................................................................................................................. 113
9.2.1 Requirements and Design Drivers ................................................................ 113 9.2.2 Assumptions and Trade-Offs ........................................................................ 113 9.2.3 Baseline Design ............................................................................................. 114 9.2.4 List of Equipment ......................................................................................... 115
10 NEPTUNE PROPULSION ................................................................... 117
10.1 Orbiter ................................................................................................................. 117
10.1.1 Requirements and Design Drivers ................................................................ 117 10.1.2 Assumptions and Trade-Offs ........................................................................ 117 10.1.3 Baseline Design ............................................................................................. 119 10.1.4 List of Equipment ........................................................................................ 123 10.1.5 Options ......................................................................................................... 124 10.1.6 Technology Requirements ........................................................................... 126
11 NEPTUNE AOCS ................................................................................ 127
11.1 Orbiter ................................................................................................................. 127
11.1.1 Requirements and Design Drivers ................................................................ 127 11.1.2 Assumptions and Trade-Offs ....................................................................... 128 11.1.3 Baseline Design ............................................................................................ 129 11.1.4 List of Equipment ........................................................................................ 148 11.1.5 Options ......................................................................................................... 148 11.1.6 Technology Needs ........................................................................................ 150
12 NEPTUNE GNC .................................................................................. 151
12.1 Atmospheric Probe .............................................................................................. 151
12.1.1 Requirements and Design Drivers ................................................................ 151 12.1.2 Assumptions and Trade-Offs ........................................................................ 151 12.1.3 Baseline Design .............................................................................................152 12.1.4 List of Equipment .........................................................................................154 12.1.5 Options .......................................................................................................... 155 12.1.6 Technology Needs .........................................................................................156

Ice Giants CDF Study Report: CDF-187(C)
January 2019 page 8 of 431
ESA UNCLASSIFIED – Releasable to the Public
13 NEPTUNE POWER ............................................................................ 157
13.1 Atmospheric Probe .............................................................................................. 157
13.1.1 Requirements and Design Drivers ................................................................ 157 13.1.2 Assumptions and Trade-Offs ....................................................................... 159 13.1.3 Baseline Design ............................................................................................ 160 13.1.4 List of Equipment .......................................................................................... 161 13.1.5 Options .......................................................................................................... 161 13.1.6 Technology Needs ......................................................................................... 161
13.2 Orbiter ................................................................................................................ 162
13.2.1 Requirements and Design Drivers ............................................................... 162 13.2.2 Assumptions and Trade-Offs ....................................................................... 164 13.2.3 Baseline Design ............................................................................................ 168 13.2.4 List of Equipment ......................................................................................... 170 13.2.5 Options ......................................................................................................... 170 13.2.6 Technology Needs ........................................................................................ 170
14 NEPTUNE TELECOMMUNICATIONS ................................................. 171
14.1 Atmospheric Probe .............................................................................................. 171
14.1.1 Requirements and Design Drivers ................................................................ 171 14.1.2 Assumptions and Trade-Offs ........................................................................ 171 14.1.3 Baseline Design ............................................................................................. 173 14.1.4 List of Equipment ......................................................................................... 176 14.1.5 Options ......................................................................................................... 178 14.1.6 Technology Needs ........................................................................................ 178
14.2 Orbiter ................................................................................................................ 178
14.2.1 Requirements and Design Drivers ............................................................... 178 14.2.2 Assumptions and Trade-Offs ....................................................................... 179 14.2.3 Baseline Design ............................................................................................ 180 14.2.4 List of Equipment ......................................................................................... 183 14.2.5 Options ......................................................................................................... 184 14.2.6 Technology Needs ........................................................................................ 185
15 NEPTUNE DATA HANDLING ............................................................. 187
15.1 Atmospheric Probe ............................................................................................. 187
15.1.1 Requirements and Design Drivers ............................................................... 187 15.1.2 Assumptions and Trade-Offs ....................................................................... 187 15.1.3 Baseline Design ............................................................................................ 190 15.1.4 Probe DHS List of Equipment ...................................................................... 191 15.1.5 Technology Needs ........................................................................................ 192
15.2 Orbiter DHS ....................................................................................................... 192
15.2.1 Orbiter DHS Requirements and Design Drivers ......................................... 192 15.2.2 Assumptions ................................................................................................. 194 15.2.3 Trade-Offs .................................................................................................... 195 15.2.4 Baseline Design ............................................................................................ 196 15.2.5 Orbiter DHS List of Equipment ................................................................... 197 15.2.6 Orbiter DHS Options ................................................................................... 197 15.2.7 Orbiter DHS Technology Needs................................................................... 198

Ice Giants CDF Study Report: CDF-187(C)
January 2019 page 9 of 431
ESA UNCLASSIFIED – Releasable to the Public
16 NEPTUNE THERMAL ........................................................................ 199
16.1 Atmospheric Probe ............................................................................................. 199
16.1.1 Requirements and Design Drivers ............................................................... 199 16.1.2 Assumptions and Trade-Offs ....................................................................... 199 16.1.3 Baseline TPS Design .................................................................................... 205 16.1.4 Baseline TCS Design .................................................................................... 207 16.1.5 List of Equipment ........................................................................................ 208 16.1.6 Options ......................................................................................................... 209 16.1.7 Technology Needs ........................................................................................ 210 16.1.8 Test Facility Needs ....................................................................................... 210
16.2 Orbiter ................................................................................................................. 211
16.2.1 Requirements and Design Drivers ................................................................ 211 16.2.2 Assumptions and Trade-Offs ........................................................................ 211 16.2.3 Baseline Design ............................................................................................. 211 16.2.4 List of Equipment ........................................................................................ 213 16.2.5 Options ......................................................................................................... 213 16.2.6 Technology Needs ........................................................................................ 214
17 NEPTUNE AEROTHERMODYNAMICS ............................................... 215
17.1 Aerodynamics Shape ...........................................................................................215
17.2 Aerodynamic Drag Profile.................................................................................. 216
17.3 Atmospheric Model ............................................................................................ 216
17.4 Heat Flux ............................................................................................................. 217
17.4.1 Heat Flux Correlations .................................................................................. 217 17.4.2 Heat Flux Margin Policy ............................................................................... 217
17.5 Entry Interface Conditions and Trajectory Analysis ......................................... 218
17.6 Potential Material Plasma Testing With H/He in Europe ................................ 221
18 NEPTUNE EDS PARACHUTE ............................................................. 231
18.1 Requirements and Design Drivers ..................................................................... 231
18.2 Assumptions and Trade-Offs ............................................................................. 232
18.3 Baseline Design .................................................................................................. 234
18.3.1 Pilot Chute Design ....................................................................................... 235 18.3.2 Main Parachute Design ................................................................................ 237 18.3.3 A Preliminary Timeline ................................................................................ 238
18.4 List of Equipment ............................................................................................... 239
18.5 Technology Needs .............................................................................................. 239
19 URANUS MISSION ANALYSIS .......................................................... 243
19.1 Atmospheric Probe ............................................................................................. 244
19.1.1 Requirements and Design Drivers ............................................................... 244 19.1.2 Assumptions and Trade-Offs ....................................................................... 244 19.1.3 Baseline Design ............................................................................................ 244 19.1.4 Budgets ......................................................................................................... 245
19.2 Orbiter ................................................................................................................ 248
19.2.1 Requirements and Design Drivers ............................................................... 248

Ice Giants CDF Study Report: CDF-187(C)
January 2019 page 10 of 431
ESA UNCLASSIFIED – Releasable to the Public
19.2.2 Assumptions and Trade-Offs ....................................................................... 248 19.2.3 Baseline Design ............................................................................................ 248 19.2.4 Budgets ......................................................................................................... 248
20 URANUS SYSTEMS............................................................................ 249
20.1 Atmospheric Probe ............................................................................................. 249
20.1.1 Mission & System Requirements and Design Drivers ................................. 249 20.1.2 Mission System Architecture ....................................................................... 249 20.1.3 System Baseline Design ............................................................................... 249
20.2 Orbiter ................................................................................................................ 250
20.2.1 System Requirements and Design Drivers .................................................. 250 20.2.2 Design Drivers .............................................................................................. 251 20.2.3 System Assumptions and Trade-Offs .......................................................... 251 20.2.4 Mission System Architecture ....................................................................... 254 20.2.5 System Baseline Design ............................................................................... 258 20.2.6 System Budgets ............................................................................................ 259 20.2.7 System Options ............................................................................................ 263 20.2.8 Future Work ..................................................................................................271
21 URANUS PAYLOAD ........................................................................... 273
21.1 Atmospheric Probe ............................................................................................. 273
21.1.1 Requirements and Design Drivers ............................................................... 273 21.1.2 Assumptions and Trade-Offs ....................................................................... 273 21.1.3 List of Equipment ......................................................................................... 273 21.1.4 Options ......................................................................................................... 273 21.1.5 Technology Needs ........................................................................................ 273
21.2 Orbiter ................................................................................................................ 273
21.2.1 Requirements and Design Drivers ............................................................... 273 21.2.2 List of Equipment ......................................................................................... 274 21.2.3 Options ......................................................................................................... 274 21.2.4 Technology Needs ........................................................................................ 274
22 URANUS CONFIGURATION .............................................................. 275
22.1 Atmospheric Probe ............................................................................................. 275
22.2 Orbiter ................................................................................................................ 275
23 URANUS STRUCTURE ....................................................................... 276
23.1 Atmospheric Probe ............................................................................................. 276
23.2 Orbiter ................................................................................................................ 276
24 URANUS MECHANISMS.................................................................... 277
24.1 Atmospheric Probe ............................................................................................. 277
24.1.1 Requirements and Design Drivers ............................................................... 277 24.1.2 Baseline Design ............................................................................................ 277
24.2 Orbiter ................................................................................................................ 277
24.2.1 Requirements and Design Drivers ............................................................... 277 24.2.2 Baseline Design ............................................................................................ 277
25 URANUS PROPULSION ..................................................................... 278

Ice Giants CDF Study Report: CDF-187(C)
January 2019 page 11 of 431
ESA UNCLASSIFIED – Releasable to the Public
25.1 Orbiter ................................................................................................................ 278
25.1.1 Requirements and Design Drivers ............................................................... 278 25.1.2 Assumptions and Trade-Offs ....................................................................... 278 25.1.3 Baseline Design ............................................................................................ 279 25.1.4 List of Equipment ........................................................................................ 280 25.1.5 Options ......................................................................................................... 281 25.1.6 Technology Requirements ........................................................................... 282
26 URANUS AOCS ................................................................................. 283
26.1 Orbiter ................................................................................................................ 283
26.1.1 Requirements and Design Drivers ............................................................... 283 26.1.2 Assumptions and Trade-Offs ....................................................................... 283 26.1.3 Baseline Design ............................................................................................ 283 26.1.4 List of Equipment ........................................................................................ 287 26.1.5 Options ......................................................................................................... 287 26.1.6 Technology Needs ........................................................................................ 288
27 URANUS GNC ................................................................................... 289
27.1 Atmospheric Probe ............................................................................................. 289
28 URANUS POWER .............................................................................. 290
28.1 Atmospheric Probe ............................................................................................. 290
28.2 Orbiter ................................................................................................................ 290
29 URANUS TELECOMMUNICATIONS ................................................... 291
29.1 Atmospheric Probe ............................................................................................. 291
29.2 Orbiter ................................................................................................................ 291
30 URANUS DATA HANDLING .............................................................. 292
30.1 Atmospheric Probe ............................................................................................. 292
30.2 Orbiter ................................................................................................................ 292
31 URANUS THERMAL ......................................................................... 293
31.1 Atmospheric Probe ............................................................................................. 293
31.2 Orbiter ................................................................................................................ 293
32 URANUS AEROTHERMODYNAMICS ................................................ 294
33 URANUS EDS PARACHUTE .............................................................. 295
34 TRITON LANDER ............................................................................... 297
34.1 Triton Facts & Figures ........................................................................................ 297
34.2 Requirements and Design Drivers ..................................................................... 297
34.3 Assumptions ....................................................................................................... 298
34.4 Trade-Offs .......................................................................................................... 298
34.4.1 Release during Triton Flyby......................................................................... 299 34.4.2 Release from orbit around Triton (50x50km) ............................................. 301
34.5 Baseline Design .................................................................................................. 302
34.5.1 Mission to Triton .......................................................................................... 302

Ice Giants CDF Study Report: CDF-187(C)
January 2019 page 12 of 431
ESA UNCLASSIFIED – Releasable to the Public
34.5.2 GNC .............................................................................................................. 307 34.5.3 Mechanisms ................................................................................................. 314 34.5.4 Power ............................................................................................................ 315 34.5.5 Thermal ......................................................................................................... 317 34.5.6 Propulsion .................................................................................................... 318 34.5.7 Structures & Configuration .......................................................................... 321 34.5.8 Communication ............................................................................................ 321 34.5.9 Operations .................................................................................................... 323 34.5.10 Risks ............................................................................................................. 323
34.6 Technology Needs .............................................................................................. 323
34.7 Europa Lander Mission ...................................................................................... 324
35 RADIATION ....................................................................................... 329
35.1 Requirements and Design Drivers ..................................................................... 329
35.1.1 Design Drivers: Radiation Effects and Main Sources of Radiation Environment ............................................................................................................. 329
35.2 Assumptions and Trade-Offs ............................................................................. 330
35.2.1 Solar Particle Events (SPEs) ........................................................................ 330 35.2.2 Radioisotope Thermoelectric Generators (eMMRTGs) .............................. 330 35.2.3 Jovian Trapped Energetic Particle Environment ........................................ 331 35.2.4 Local Planetary Trapped Radiation ............................................................. 334
35.3 Baseline Design .................................................................................................. 336
35.4 List of Equipment ............................................................................................... 338
35.5 Technology Needs .............................................................................................. 338
36 GROUND SEGMENT AND OPERATIONS ........................................... 339
36.1 Requirements and Design Drivers ..................................................................... 339
36.2 Assumptions and Trade-Offs ............................................................................. 340
36.2.1 Assumptions ................................................................................................. 340 36.2.2 Ground Segment and Operational Characteristics...................................... 341
36.3 Rosetta Lessons Learned applicable to Ice Giants operations .......................... 345
36.3.1 Ground Segment Incremental Development Approach .............................. 345 36.3.2 Team Evolution ............................................................................................ 346 36.3.3 Operations Planning for Long Cruise Phases .............................................. 346 36.3.4 Planning of Complex Mission Phases .......................................................... 346 36.3.5 In-Flight Characterisation ........................................................................... 347 36.3.6 Availability of Engineering Model (EM) ...................................................... 347
36.4 Baseline Design .................................................................................................. 347
36.4.1 Ground Segment Overview .......................................................................... 347 36.4.2 Ground Segment Development Approach ................................................... 347 36.4.3 Mission Operations ...................................................................................... 348
36.5 Ground Stations ................................................................................................. 349
36.5.1 Seasonal Solar Conjunctions ........................................................................ 350 36.5.2 Use of UHF Telescopes ................................................................................ 350 36.5.3 Enhanced Ground Station: Arrayed Antennas ............................................ 350
37 RISK ASSESSMENT ........................................................................... 353

Ice Giants CDF Study Report: CDF-187(C)
January 2019 page 13 of 431
ESA UNCLASSIFIED – Releasable to the Public
37.1 Reliability and Fault Management Requirements ............................................ 353
37.2 Risk Management Process and Scope of Risk Assessment ............................... 354
37.2.1 Approach for Risk Identification and Risk Reduction (steps 2 and 3) ....... 355 37.3 Risk Management Policy .................................................................................... 357
37.3.1 Hazard Targets ............................................................................................. 357 37.3.2 Success Criteria ............................................................................................ 358 37.3.3 Severity Categorisations .............................................................................. 359 37.3.4 Risk Acceptance Policy ................................................................................ 361
37.4 Risk Drivers ........................................................................................................ 361
37.5 Top Risk Log (preliminary) ................................................................................ 361
37.5.1 Risk Log General Conclusions ..................................................................... 380 37.6 Risk Log Specific Conclusions and Recommendations ..................................... 380
38 PROGRAMMATICS/AIV .................................................................... 383
38.1 Requirements and Design Drivers ..................................................................... 383
38.2 Assumptions and Trade-Offs ............................................................................. 383
38.3 Technology Requirements ................................................................................. 384
38.4 Model Philosophy ............................................................................................... 389
38.4.1 Orbiter .......................................................................................................... 390 38.4.2 Planetary Probe ............................................................................................ 391 38.4.3 Instruments .................................................................................................. 391
38.5 Development Approach ..................................................................................... 391
38.5.1 Orbiter Development ................................................................................... 392 38.5.2 Planetary Probe Development ..................................................................... 393 38.5.3 Test Matrix ................................................................................................... 394
38.6 Schedule ............................................................................................................. 395
38.6.1 Orbiter Schedule .......................................................................................... 396 38.6.2 Planetary Probe Schedule ............................................................................ 397 38.6.3 Back-up Data: ExoMars 2016 Schiaparelli Probe ....................................... 398
38.7 Summary and Recommendations...................................................................... 399
39 COST .................................................................................................. 401
40 CONCLUSIONS ................................................................................. 403
40.1 Satisfaction of Study Objectives ......................................................................... 403
M* Ice Giants Objectives have been successfully achieved. .................................... 403 40.2 Probe .................................................................................................................. 403
40.2.1 Major Findings ............................................................................................. 403 40.2.2 Open Points .................................................................................................. 404 40.2.3 Areas for Further Investigation ................................................................... 405
40.3 Orbiter ................................................................................................................ 406
40.3.1 Major Findings ............................................................................................. 406 40.3.2 Open Points .................................................................................................. 407 40.3.3 Areas for Further Investigation ................................................................... 408
40.4 Lander ................................................................................................................ 409
40.4.1 Requirements and Assumptions .................................................................. 409

Ice Giants CDF Study Report: CDF-187(C)
January 2019 page 14 of 431
ESA UNCLASSIFIED – Releasable to the Public
40.4.2 Major Findings ............................................................................................. 409 40.4.3 Open Points and Areas for Further Investigation ....................................... 410
40.5 Additional Observations .................................................................................... 410
41 REFERENCES .................................................................................... 413
42 ACRONYMS ....................................................................................... 419
A TRACEABILITY MATRICES ............................................................... 425

Ice Giants CDF Study Report: CDF-187(C)
January 2019 page 15 of 431
ESA UNCLASSIFIED – Releasable to the Public
1 INTRODUCTION
1.1 Background
A mission to the Ice Giants (Neptune and Uranus) will be among the ones examined by the next Planetary Sciences Decadal, which also fits with the potential launch opportunity, with a Jupiter swing-by, that would allow to reach both planets by launching in the early 2030s.
ESA is exploring potential contributions to a NASA-led mission to the ice giants aimed at understanding the interior structure and bulk composition of the planet(s) (including isotopes and noble gases).
ESA and NASA agreed to study a palette of possible configurations of varying cost to ESA and complexity, keeping in mind the need for clear interfaces.
It is important to keep this background in mind and remember that this study is not analysing a specific science proposal but trying to understand potential contributions following a top–down approach.
Requested by SCI-FM and funded by GSP, the M* (Ice Giants) study was set to analyse the feasibility of “stand-alone” elements provided by ESA to be part of the NASA-led mission to Uranus, Neptune and their moons (M-class mission budget but not proposed following a Cosmic Vision Programme Call, hence M*).
The study was carried out by an interdisciplinary team of experts from across ESA sites with the active participation of experts from NASA/JPL and the European science community (represented by the four members of the Science Study Team). The study consisted of 9 sessions, starting with a kick-off on the 7th November 2018 and ending with an Internal Final Presentation on the 12th December 2018.
The Mission
The potential mission contributions to be studied were:
An individual spacecraft (orbiter), complementary to a NASA one. In this scenario the ESA orbiter would target one of the ice giants while the NASA spacecraft would fly to the other one.
An atmospheric probe to either of the two planets, transported and released by a NASA orbiter.
A lander to Triton (Neptune’s largest Moon), transported and released by NASA orbiter.
The reference payload suites to be considered for the purpose of this study for the various elements were put together by the M* Ice Giants PL Team in liaison with representatives of the Scientific Community.
1.2 Objective
The goal of the CDF study was to: Establish conceptual designs for the key European element(s) identified above in order to assess the mission feasibility

Ice Giants CDF Study Report: CDF-187(C)
January 2019 page 16 of 431
ESA UNCLASSIFIED – Releasable to the Public
identifying the required resources and defining the interfaces with the international partner
Highlight the technological areas for which mission enabling developments would be required
Define the programmatic approach and the schedule constraints for the studied option(s)
Assess the mission cost for the studied option(s), taking into account that the ESA contribution shall fit within an M-class mission budget, i.e. 550 MEuro (excluding Member state contributions like Payload).
1.3 Scope
As previously stated, the scope of the study was not to analyse a specific science proposal but trying to understand potential contributions following a top–down approach. The defined study planning for the allocation of the associated sessions was based on the following assumptions:
Orbiter
o Design Target: Neptune
o Design sensitivity analysis to Uranus
o Payload: as specified by M* Ice Giants PL Team
o Orbiter does not carry a probe
Probe
o Design Target: Neptune and Uranus
o Reference: PEP CDF Study + Deltas Assessment (Designs very similar for Neptune and Uranus (small differences identified) – assumption based on PEP CDF Study)
o Payload: as specified by M* Ice Giants PL Team/PEP PL complement; Design Assumption: PEP PL operating between 1 and 10 bars in 90 minutes (in PEP: free fall from 10 to 100 bars)
o Released by NASA Orbiter
Lander
o Design Target: Triton
o Payload: as specified by M* Ice Giants PL Team
o Released by NASA Orbiter
1.4 Document Structure
The layout of this report of the study results can be seen in the Table of Contents. The Executive Summary chapter provides an overview of the study; details of each domain addressed in the study are contained in specific chapters.
Due to the different distribution requirements, cost information is removed from this version of the report.

Ice Giants CDF Study Report: CDF-187(C)
January 2019 page 17 of 431
ESA UNCLASSIFIED – Releasable to the Public
2 EXECUTIVE SUMMARY
2.1 Study Flow
Requested by SCI-FM and funded by GSP, the M* (Ice Giants) study was setup to analyse the feasibility of “stand-alone” elements provided by ESA to be part of a NASA-led mission to Uranus, Neptune and their moons (mission of opportunity, M-class mission budget but not proposed following a Cosmic Vision Programme Call, hence M*).
The study was carried out by an interdisciplinary team of experts from across ESA sites with the active participation of experts from NASA/JPL and the European science community (represented by the four members of the Science Study Team). The study consisted of 9 sessions.
The study investigated:
An individual spacecraft (orbiter) to either of the two planets;
An atmospheric probe to either of the two planets, transported and released by a NASA orbiter;
A preliminary sizing of a lander to Triton (Neptune’s largest moon), transported and released by a NASA orbiter.
2.2 Neptune
2.2.1 Requirements and Design Drivers
The following science objectives and mission requirements were the starting point of the probe, orbiter and lander design.
2.2.1.1 Probe
Objectives:
To determine the planet’s bulk composition, including abundances and isotopes of heavy elements;
To determine the compositional, thermal and dynamical structure of the atmosphere.
An atmospheric entry probe targeting the 10-bar level would yield insight into two broad themes: i) the formation history of the ice giants and, in a broader extent, that of the Solar System, and ii) the processes at play in planetary atmospheres.
The mission and system requirements of the probe are listed in the table below.
Mission Requirements
Req. ID Statement Parent ID
MIS-010 The cost of the mission shall fit within a M-class mission
MIS-020 The launch of the probe will be in the period of 2029-2034
Table 2-1: Probe mission requirements

Ice Giants CDF Study Report: CDF-187(C)
January 2019 page 18 of 431
ESA UNCLASSIFIED – Releasable to the Public
System Requirements
Req. ID Statement Parent ID
SYS-010 The probe shall be carried by the NASA orbiter to Neptune
SYS-020 The science observations of the probe shall occur during the descent from 1 bar to 10 bar and shall be 90 minutes
SYS-030 The data generated on-board of the probe shall be transmitted to the orbiter in real time
SYS-040 The orbiter shall serve as a relay for the probe during probe operations
SYS-050 The probe shall perform a direct entry.
SYS-060
The probe shall have Earth visibility during entry.
Note: to allow for UHF carrier monitoring of the probe from Earth during entry (see 36.5.2)
Table 2-2: Probe system requirements
2.2.1.2 Orbiter
The highest priority is the study of the interior structure of the planet. Secondary and equal priorities are listed below:
Planetary dynamo
Atmospheric temperature and dynamics
Ring science
Moons science (with a potential focus on Triton)
Solar wind magnetosphere-ionosphere interactions.
The mission and system requirements of the orbiter are listed in the table below:
Mission Requirements
Req. ID Statement Parent ID
MIS-010 The mission shall be launched within a timeframe of 2029 to 2034.
MIS-020 The mission shall be compatible with launch via a SLS Block 1B.
MIS-030 The total mission cost shall be within an M-class ESA science mission budget.
MIS-040 The mission shall be capable of performing in-situ and observational measurements at Neptune with a payload suite defined by the Study Science Team.
MIS-050 The mission shall be capable of performing in-situ and observational measurements at Triton during flybys, with a payload suite defined by the Study Science Team.
MIS-060 The mission shall include at least do 2 years (TBC) of science operations at Neptune.
Table 2-3: Orbiter mission requirements

Ice Giants CDF Study Report: CDF-187(C)
January 2019 page 19 of 431
ESA UNCLASSIFIED – Releasable to the Public
System Requirements
Req. ID Statement Parent ID
SYS-010 The orbiter shall be compatible with a dual launch with a NASA orbiter on an SLS Block 1B in a TBD configuration.
SYS-020 The orbiter shall be delivered to NASA for final integration onto the launcher.
SYS-030 The orbiter delivery date to NASA shall be compatible with the selected launch date and any pre-launch activities agreed between ESA and NASA.
SYS-040 The orbiter shall be compatible with a storage of TBD months before integration onto the launcher.
SYS-050 The orbiter design shall allow late access for integration of the RTGs under the launcher fairing.
SYS-060 The orbiter shall include a payload suite of 116 kg (TBC).
SYS-070 The operational lifetime of the orbiter shall be at least 15.5 years after launch.
SYS-080 [DELETED]
SYS-090 The orbiter shall rely solely on its own power source(s) during cruise with the NASA orbiter.
SYS-100 The orbiter shall provide a SpaceWire interface to the NASA orbiter.
SYS-110 The orbiter shall be asleep during cruise with the NASA orbiter, apart from periodic checkouts.
SYS-120 The orbiter shall not require any active thermal control from the NASA orbiter.
SYS-130 The orbiter shall separate from the NASA orbiter before the Jupiter swing-by.
SYS-140 The orbiter shall be able to perform an independent interplanetary transfer from separation until Neptune.
SYS-150 The orbiter shall be able to insert into orbit around Neptune.
SYS-160 The orbiter shall be able to download all gathered science data within the nominal mission duration (TBC).
SYS-170 The orbiter shall be compatible with all environments from integration until EOM.
SYS-180 The orbiter shall include redundancy for all mission-critical functionalities (TBC).
Table 2-4: Orbiter system requirements
2.2.1.3 Lander
Objectives:
Map surface geology at the landing site
In situ surface and subsurface characterisation
Determine surface composition, including organics; search for variations evidence for mass exchange/volatile transportation

Ice Giants CDF Study Report: CDF-187(C)
January 2019 page 20 of 431
ESA UNCLASSIFIED – Releasable to the Public
Determine the composition of Triton's atmosphere
Investigate moon-magnetosphere interactions
The main design drivers for the Triton lander include:
Release strategy: from orbit around Triton or during flyby only. This has a strong impact on the delta V
Low atmospheric density, implying that a propulsion-only descent and landing is assumed
Need for throttled / pulsed propulsion capabilities in a closed-loop GNC system for the final descent manoeuvre (technology gap)
Possible need of reconnaissance imaginary created by another mission to enable high level selection of safety areas
Instruments/science (during descent and surface operations): Mass / power / data / temperature/ Operations timeline
Available communications window(s) duration.
The high-level mission requirements of the Triton lander are listed in the table below:
Main Requirements
Req. ID Statement Parent ID
MI-010 The Triton Lander shall land a payload of 11.18 kg
MI-020 The Triton Lander shall be released from Triton fly-by
MI-030 The Triton Lander shall perform a soft landing manoeuvre of 4637 m/s
MI-040 The Triton Lander shall operate during one week of lifetime
Table 2-5: Triton Lander mission requirements
2.2.2 Mission
2.2.2.1 Probe baseline design
Probe
Mass (Incl 20% system margin)
Mass w/o TPS&TC: 191 kg
TPS&TC: 151 kg
Mass with TPS: 342 kg
Ballistic coefficient
Projected area: 1.43 m2 (diameter 1.35 m)
Front shield area: 1.99 m2
Cd: 1.07
BC: 228 kg/m2

Ice Giants CDF Study Report: CDF-187(C)
January 2019 page 21 of 431
ESA UNCLASSIFIED – Releasable to the Public
Probe
Payload Atmospheric Structure Instrument
Camera-Radiometer
Mass Spectrometer
Photometer
USO-Doppler
EDS 2 subsonic parachutes: pilot (M=0.8) and main
TPS Front shield: 51.9 mm thickness, 129 kg
Back shield: 31.4 mm, 19.9 kg
GNC 2 redundant IMUs
2 parachute deployment switches
Mechanisms Back and Front Shell Separation Mechanisms
Parachute Swivel Mechanism
Mortar parachute pyro cutter
Spin Eject Mechanism [Probe side]
Communications UHF redundant chain
Patch antenna on the backshell
Helix antenna during descent
Power 4 x 3 kg batteries
PCDU
Data Handling CDMU including timer
Structures 61.3 kg of structures (of which 28.5kg are in the descent module)
Thermal 31 RHUs, MLIs, Front shield radiator, pressure vessel insulation
2.2.2.2 Orbiter baseline design
Orbiter
Mass (Incl 20% system margin)
Dry mass: 1605 kg
Propellant mass (excl. margin): 1991 kg
Wet mass: 3969 kg
Payload Camera
Imaging Spectrometer
Ion and Neutral Mass Spectrometer
Magnetometer

Ice Giants CDF Study Report: CDF-187(C)
January 2019 page 22 of 431
ESA UNCLASSIFIED – Releasable to the Public
Orbiter
Macrowave radiometer
Ultra Stable Oscillator (USO)
Ka-band transponder
Propulsion 2x main bipropellant thrusters (1000 N)
16x RCS thrusters (10 N)
3x pressurant tanks (2x 120 L and 1x 66 L tanks)
4x propellant tanks (550 L)
AOGNC 1x coarse rate sensor
2x navigation cameras
2x IMUs
2x star trackers
4x reaction wheels
(+ RCS thrusters)
Communications X-band uplink/downlink
Ka-band downlink (42 kbps)
Science volume downlinked: 0.48 Gb/day
Communication window duration: 3.2 h/day
Data volume generated by EOM: 350 Gb
Power 3x eMMRTGs (EOM Power = 90W)
4x 48kg batteries
Data Handling Redundant OBC + 1Tbit of storage
Structures 303 kg
Thermal Heaters + use of the eMMRTG thermal dissipation
On the orbiter, trade-offs were performed, including to investigate the dual launch configuration on the SLS and the number of RTG’s used on the orbiter.
2.2.2.3 Triton lander baseline design
The lander design was based on a draft payload definition which was reduced in mass and power consumption to be able to be accommodated on a small lander. Based on the initial projected payload mass of 11.18 kg, a lander of >2000kg was estimated for landing from Triton flyby.
An alternative top-down assessment was then performed. Using a lander wet mass of 350 kg, an estimated 1.5 kg was predicted as available from Triton flyby. This is still significantly less than the reduced model payload of 2.24 kg.
It was noted that an option to release the lander from Triton orbit (rather than flyby) would significantly reduce the delta-v required for a soft landing, and thus increase the payload mass / lander wet mass ratio.
Ice Giants CDF Study Report: CDF-187(C)
January 2019 page 23 of 431
ESA UNCLASSIFIED – Releasable to the Public
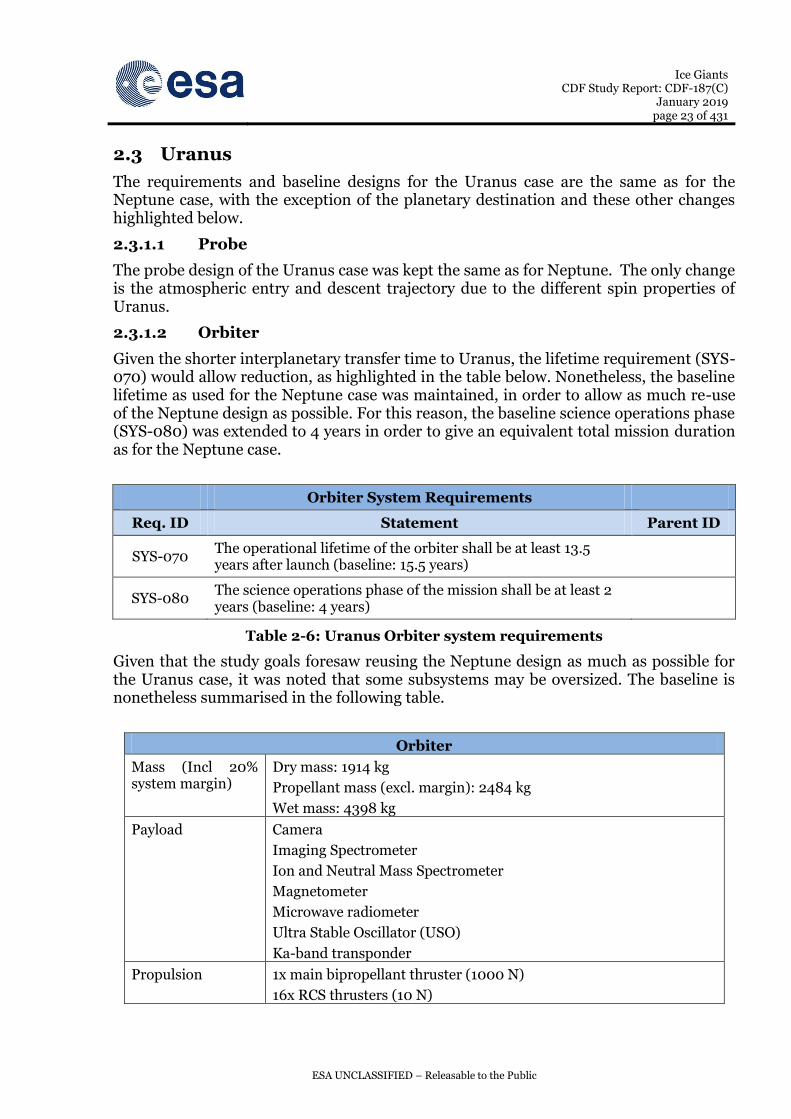
2.3 Uranus
The requirements and baseline designs for the Uranus case are the same as for the Neptune case, with the exception of the planetary destination and these other changes highlighted below.
2.3.1.1 Probe
The probe design of the Uranus case was kept the same as for Neptune. The only change is the atmospheric entry and descent trajectory due to the different spin properties of Uranus.
2.3.1.2 Orbiter
Given the shorter interplanetary transfer time to Uranus, the lifetime requirement (SYS-070) would allow reduction, as highlighted in the table below. Nonetheless, the baseline lifetime as used for the Neptune case was maintained, in order to allow as much re-use of the Neptune design as possible. For this reason, the baseline science operations phase (SYS-080) was extended to 4 years in order to give an equivalent total mission duration as for the Neptune case.
Orbiter System Requirements
Req. ID Statement Parent ID
SYS-070 The operational lifetime of the orbiter shall be at least 13.5 years after launch (baseline: 15.5 years)
SYS-080 The science operations phase of the mission shall be at least 2 years (baseline: 4 years)
Table 2-6: Uranus Orbiter system requirements
Given that the study goals foresaw reusing the Neptune design as much as possible for the Uranus case, it was noted that some subsystems may be oversized. The baseline is nonetheless summarised in the following table.
Orbiter
Mass (Incl 20% system margin)
Dry mass: 1914 kg
Propellant mass (excl. margin): 2484 kg
Wet mass: 4398 kg
Payload Camera
Imaging Spectrometer
Ion and Neutral Mass Spectrometer
Magnetometer
Microwave radiometer
Ultra Stable Oscillator (USO)
Ka-band transponder
Propulsion 1x main bipropellant thruster (1000 N)
16x RCS thrusters (10 N)

Ice Giants CDF Study Report: CDF-187(C)
January 2019 page 24 of 431
ESA UNCLASSIFIED – Releasable to the Public
3x pressurant tanks (120 L)
4x propellant tanks (550 L)
AOGNC 1x coarse rate sensor
2x navigation cameras
2x IMUs
2x star trackers
4x reaction wheels
(+ RCS thrusters)
Communications X-band uplink/downlink
Ka-band downlink (94 kbps)
Science volume downlinked: 1.09 Gb/day
Communication window duration: 3.2 h/day
Data volume generated by EOM: 1.6 Tb
Power 3x eMMRTGs (EOM Power = 90W for 4 year science phase)
4x 48kg batteries
Data Handling Redundant OBC + 1Tbit of storage
Structures 303 kg
Thermal Heaters + use of the eMMRTG thermal dissipation
Table 2-7: Orbiter system baseline (Uranus)
2.4 Technical Conclusions and Options
The M* Ice Giants study objectives were successfully achieved.
The major study findings for the probe, orbiter, and Triton lander are described below.
2.4.1 Probe
The PEP CDF Study was taken as the initial reference for the probe assessment, with only deltas with regards to PEP being assessed in the M* Ice Giants CDF Study. The most significant changes were:
TPS mass: due to revised characterisation of the TPS material properties and an increase in size, the total mass of the TPS increased by 50% (despite a marginally lower entry velocity).
Pressure range: scientific observations were changed to spend more time at lower pressures (1-10 bar), and as such the pressure vessel could be reduced. However the increased observation time at these pressures resulted in a larger main parachute.
A mass reduction on the DHS was achieved via the latest technology developments.
31 RHUs were installed to survive the 20-day coast phase.

Ice Giants CDF Study Report: CDF-187(C)
January 2019 page 25 of 431
ESA UNCLASSIFIED – Releasable to the Public
2.4.2 Orbiter
For the Neptune design case, it was demonstrated that downlink of the generated science data versus the available energy would be a significant challenge. However this could be revisited with an revised operations concept and further iterations on the orbital timeline at Neptune (including moon tours). The inclusion of a larger high gain antenna would also improve the available downlink (dependent on launch configuration and fairing size).
For the Uranus case, the data volume constraints seemed more relaxed than with regards to Neptune.
The availability and inclusion of 3 eMMRTGs was shown as essential to enable any type of useful science at the destination planet, even for the Uranus case.
The EOM power of the RTGs must still to confirmed, and would have a large impact on the available energy for downlink and on the payload duty cycle.
In a dual-orbiter scenario the availability of a combined 6+ eMMRTGs for both missions, and the implications of this on AIV, storage and launcher fairing access, would pose challenges.
The trajectory used to target Uranus (and in particular, the flyby at Jupiter) might impose stringent requirements for radiation tolerance of up to 155 krad for all units.
Technology developments shall be compatible with the programmatic requirement of TRL 6 by end of 2022 (corresponding milestone: mission adoption) for a launch on 13 February 2031.
2.4.3 Lander
A rough scaling exercise from an existing lander study was performed, in order to derive a quick relationship to estimate available payload masses. It was noted that the relationship is optimistic for higher wet masses, and that landing from Triton orbit would significantly reduce the propellant mass required.

Ice Giants CDF Study Report: CDF-187(C)
January 2019 page 26 of 431
ESA UNCLASSIFIED – Releasable to the Public
This Page Intentionally Blank

Ice Giants CDF Study Report: CDF-187(C)
January 2019 page 27 of 431
ESA UNCLASSIFIED – Releasable to the Public
3 SCIENCE OBJECTIVES
3.1 Background
The ice giants, Uranus and Neptune, have been visited by the Voyager 2 spacecraft in 1986 and 1989, respectively. These two fantastic flybys raised some questions that still need to be answered by dedicated missions. The ice giant system is a distinct class of planets, fundamentally different from the better explored gas giants, Jupiter and Saturn. Their study is critical and absolutely necessary to advance our understanding of the solar system origin and evolution RD[1] to RD[6]. As ice giant type planets represent around ¼ of exoplanet population, they are the only laboratory in which one can perform in-situ experiments to understand exoplanet formation, dynamos, systems and magnetospheres RD[2]. The moon system of Uranus and Neptune is also extremely interesting to explore. In particular, the Triton moon is very likely a captured Kuiper Belt object RD[3], and is predicted to harbour a subsurface ocean. The choice between which system to explore is not straightforward. Uranus and Neptune are equally important, but are different from each other.
3.2 Mission Justification
A mission to the icy giants will be among the ones examined by the next Planetary Sciences Decadal Survey RD[1]. Given the broad science goals, the two planets to explore, and the different mission elements under consideration, there is a clear opportunity to collaborate with NASA, similarly to the international Cassini-Huygens mission.
There is a large scientific community behind such planetary missions [RD[2], RD[3], RD[4], RD[5], RD[6]].
A launch opportunity has been identified in 2031, which would allow reaching both planets with one single launch.
It’s time to explore Uranus and Neptune again!
3.3 Science Objectives
The science objectives are largely taken from RD[1]. Since three mission elements have been analysed in this CDF study, it was decided to define one science traceability matrix per element, which can be found in annex A. The following subsections list the science objectives per element (by alphabetical order). The model payload to address these objectives are discussed in the instrument section.
3.3.1 Atmospheric Probes
Regarding the probes, the highest priority is to determine the planet’s bulk composition, including abundances and isotopes of heavy elements, while a second priority is the determination of the compositional, thermal and dynamical structure of the atmosphere. An atmospheric entry probe targeting the 10-bar level would yield insight into two broad themes: i) the formation history of the ice giants and, in a broader extent, that of the Solar System, and ii) the processes at play in planetary atmospheres.

Ice Giants CDF Study Report: CDF-187(C)
January 2019 page 28 of 431
ESA UNCLASSIFIED – Releasable to the Public
3.3.2 Orbiters
The highest priority is the study of the interior structure of the planet. Secondary and equal priorities are listed below:
Planetary dynamo
Atmospheric temperature and dynamics
Ring science
Moons science
Triton (in the case of the Neptune orbiter)
Solar wind magnetosphere-ionosphere interactions.
3.3.3 Triton Lander
The science objectives were discussed in the context of an orbiter (with the scientific objectives relevant to Triton).
There are three groups of decreasing priorities:
Priority #1 (highest):
Map surface geology at the landing site
In situ surface and subsurface characterisation.
Priority #2:
Determine surface composition, including organics; search for variations evidence for mass exchange/volatile transportation
Determine the composition of Triton's atmosphere.
Priority #3:
Investigate moon-magnetosphere interactions.
3.4 Mission Requirements
The main requirements are:
Atmospheric probes:
o Payload model recommended by the SST and same payload for both planets
o Measurements to be performed in the 1-10 bars range, and for a duration of 90 minutes. It is expected that measurements of atmospheric structure will start in fact above 1 bar level (during entry). As in the case of the Galileo probe, a lower altitude could be reached, even with a design for 10 bars.
o Visibility from Earth of the Entry and Descent phases is desired to track the probe’s carrier signal (as done for Huygens and ExoMars2016-Schiaparelli)
o Direct entry
o Data transmitted in real time to the NASA Orbiter, which serves as relay to Earth
Orbiters:
o Payload model recommended by the SST and same payload for both planets

Ice Giants CDF Study Report: CDF-187(C)
January 2019 page 29 of 431
ESA UNCLASSIFIED – Releasable to the Public
o Similar trajectories than in [RD1] around the ice giants.
o Launched in stacked configuration with the NASA orbiter (SLS launch assumed)
o Science operations duration: at least 2 years.
Triton Lander:
o Payload model recommended by the SST.
o No specific requirements for the landing site.

Ice Giants CDF Study Report: CDF-187(C)
January 2019 page 30 of 431
ESA UNCLASSIFIED – Releasable to the Public
This Page Intentionally Blank

Ice Giants CDF Study Report: CDF-187(C)
January 2019 page 31 of 431
ESA UNCLASSIFIED – Releasable to the Public
NEPTUNE

Ice Giants CDF Study Report: CDF-187(C)
January 2019 page 32 of 431
ESA UNCLASSIFIED – Releasable to the Public
This Page Intentionally Blank

Ice Giants CDF Study Report: CDF-187(C)
January 2019 page 33 of 431
ESA UNCLASSIFIED – Releasable to the Public
4 NEPTUNE MISSION ANALYSIS
The Mission Analysis work is based on the Dual Spacecraft, Single Launch scenario from Appendix A6 in RD[1], assuming launch in February 2031 on a SLS-IB heavy lift launch vehicle. Launch sends a composite (stack) of the Uranus and the Neptune orbiters directly to Jupiter together with a SEP stage. The Neptune orbiter separates on the transfer to Jupiter.
The Uranus and Neptune orbiters perform independent Jupiter swingbys in December 2032. The Uranus orbiter performs a very close swingby at a perijove altitude of 10,000 km, while the Neptune spacecraft a much higher one at around 857,000 km (see Figure 4-2), after which the two satellites travel in completely different directions, reaching their targets in April 2042 and September 2044, respectively.
Figure 4-1: Dual Spacecraft, Single Launch Transfer Overview
The obtained arrival conditions at Uranus and Neptune (considered here) are the main input for all further analysis. The transfer scenario, timeline and arrival conditions would be significantly different for different assumptions on the overall mission.

Ice Giants CDF Study Report: CDF-187(C)
January 2019 page 34 of 431
ESA UNCLASSIFIED – Releasable to the Public
Figure 4-2: December 2032 Jupiter Swingby of the Neptune Mission
4.1 Atmospheric Probe 4.1.1 Requirements and Design Drivers
SubSystem Requirements
Req. ID Statement Parent ID
MA-010
Consistency with the entry conditions assumed in the earlier PEP study RD[7], specifically, a FPA relative to the rotating frame of -35 deg at an EIP altitude of 600 km above the 1 bar radius
MA-020 The atmospheric part of the probe mission shall take place during local daylight and with visibility from the Earth.
MA-030 The atmospheric phase of the probe mission shall last up to 90 minutes
4.1.2 Assumptions and Trade-Offs
Assumptions
1
If ESA provides a probe this is assumed to be carried by a NASA-provided orbiter.
Note: Any mention of the orbiter in this chapter is discussing the NASA orbiter. The design of the ESA orbiter has a dedicated chapter.
2
The probe is assumed to be deployed such that it enters the Neptune atmosphere at a location close to the equator and with a prograde velocity orientation. This is not consistent with a Neptune tour that is optimised for observation of the main moon Triton, which is on a retrograde, circular orbit, inclined by 157 deg wrt Neptune’s equator plane.
4.1.3 Baseline Design
The Neptune entry diagram for the given scenario is displayed in Figure 4-3. Neptune’s equator is inclined by 28.32 deg with respect to its orbit. In the given case, the Sun and Earth direction and the direction towards the incoming probe are all close to the equator

Ice Giants CDF Study Report: CDF-187(C)
January 2019 page 35 of 431
ESA UNCLASSIFIED – Releasable to the Public
and close to the noon meridian. The Sun and Earth visibility terminators are shown. All entry points above the Earth visibility terminator have Earth visibility at entry. The steeper the entry, the better are the Earth visibility conditions at entry, and consequently, the longer the time after entry before Earth loses visibility of the entry probe.
Entry locations and directions of flight are shown for inertial flight path angles of -25, -35 and -45 deg. For -25 deg, all entry points are either beyond the Sun and Earth visibility terminator or close to it, so a daylight mission with Earth visibility would be impossible. Prograde entry at 0 deg of latitude minimises the relative entry velocity to 23.2 km/s, compared to over 27 km/s for retrograde, equatorial entry.
An inertial entry flight path angle of -35 deg appears to allow missions that are consistent with the Sun and Earth visibility requirement, but only if entry is prograde. In the present study a relative entry flight path angle of -35 deg is required, which translates into some offset in the inertial FPA. However, Figure 4-3 is still qualitatively applicable.
Figure 4-3: Entry Plot and EIP Velocities for 2044/9/1 Arrival at Neptune
4.1.4 Budgets
Table 4-1 lists the entry conditions for prograde, equatorial entry with a relative FPA of -35 deg at an EIP altitude of 600 km above the 1 bar radius. All data are given in the planet-centered rotating frame.
Altitude [km] 600.133
Velocity [km/s] 23.082
FPA [deg] -35.039
Longitude [deg E] -8.821
Latitude [deg N] -0.749
Azimuth [deg] 84.468
Table 4-1: Entry Conditions for Prograde, Equatorial Entry at -35 deg Relative FPA
Note that the longitude value given here applies only to entry at the stated epoch. The entry longitude can be modified at negligible delta-v cost just by changing the arrival time by +/- 8 hours, which will not affect any of the other parameters. Conversely, the

Ice Giants CDF Study Report: CDF-187(C)
January 2019 page 36 of 431
ESA UNCLASSIFIED – Releasable to the Public
entry latitude can be changed only by applying a steeper or shallower entry FPA or by a significant change in the arrival date, all of which would have a significant effect throughout the mission design.
Even if there is Earth visibility, an array of terrestrial radio telescopes will at best only be able to capture the carrier signal. Data transmission will have to take place via the orbiter, which will be performing NOI while the probe is performing atmospheric entry. The determining parameter for the coverage quality is the periapsis altitude of the orbiter.
Figure 4-4: Altitudes and Slant Range, Target Periposeidon Alt. 2000 km
For a targeted periposeidon altitude of 2000 km above the 1 bar radius the altitude of probe and orbiter and the probe-orbiter slant range are shown in Figure 4-4, while Figure 4-5 gives the evolution of Earth aspect angle (EAA) and Orbiter aspect angle (OAA), i.e., the angle between the symmetry axis of the entry probe and the directions to Earth or orbiter. The probe symmetry axis is assumed to be aligned in the opposite direction of the current relative velocity wrt. the rotating Neptune atmosphere.
Figure 4-5: EAA and OAA, Target Periposeidon Altitude 2000 km
Following entry, the probe will slow down through aerodynamic drag and its relative flight path angle will quickly deepen from -35 deg to near-vertical. As a consequence, the EAA undergoes a strong initial increase, followed by a slow drift caused by the probe being carried along by the rotating planet.

Ice Giants CDF Study Report: CDF-187(C)
January 2019 page 37 of 431
ESA UNCLASSIFIED – Releasable to the Public
Conversely, the OAA initially approaches zero as the orbiter, which was trailing the probe on a higher and slower orbit, catches up and passes the probe directly above. Around 10 minutes after entry, the OAA increases fast as the orbiter races ahead while the probe is moving only slowly with respect to the atmosphere and its lateral motion is due only to the rotation of the latent. The OAA goes above 90 deg around 19 minutes after entry. Depending on the opening angle of the probe antenna pattern the orbiter will lose contact at the latest at that point, or likely some time earlier. A target orbiter periposeidon altitude of 2000 km is inconsistent with a probe mission duration of 90 minutes. (Note that for a retrograde entry, the descending probe would be carried in the opposite direction of the orbiter flight by the rotation of the planet, so the OAA would rise faster and an even higher target periposeidon altitude would be required to ensure relay coverage for a 90 minute probe mission.)
Figure 4-6: Altitudes and Slant Range, Target Periposeidon Alt. 25000 km
The same set of diagrams has been produced assuming a target periposeidon altitude of 25000 km. In this case, the orbiter arrival is delayed significantly and the probe-orbiter geometry is much different, leading to a much larger slant range with a minimum of 26500 km but also a time of 90 minutes from entry to the point where the OAA reaches 77 deg. This indicates that a target periposeidon altitude of around 25000 km is required to support a 90 minute probe mission.
Figure 4-7: EAA and OAA, Target Periposeidon Altitude 25000 km

Ice Giants CDF Study Report: CDF-187(C)
January 2019 page 38 of 431
ESA UNCLASSIFIED – Releasable to the Public
Note that the switch to a high periposeidon altitude has implications not only on the ODM and NOI size but that it may also lead to intersection of the rings. This must be studied in detail.
4.2 Orbiter
4.2.1 Assumptions and Trade-Offs
Assumptions
1 In the present study, a target periposeidon altitude of 2000 km above the 1 bar radius has been assumed.
2 For the ESA-provided orbiter, the communications with the entry probe, which will then not be provided by ESA, is not assumed to be object of the study
3 The tour design is assumed not to be object of the study. The information related to the tour contained in the NASA document RD[1] is considered to be applicable.
4.2.2 Baseline Design
For the orbiter study, no considerations related to deploying a Neptune entry probe have been taken into account. Therefore, the ODM is not budgeted. The NOI manoeuvre has been modelled for different T/M ratios, assuming different values of the target apoposeidon radius.
4.2.3 Budgets
Table 4-2 shows the NOI size and duration obtained via numerical propagation of the trajectory, assuming that the thrust acceleration is anti-tangential to the current poseidocentric velocity. The results are given for various values of the thrust/to mass ratio at the start of the manoeuvre, and for different target apoposeidon radii. The results are applicable independently of the inclination of the obtained orbit.
This flyby altitude would be achieved if no manoeuvre took place; it would also be the periposeidon altitude of the capture orbit if the manoeuvre were near-impulsive. The longer the manoeuvre duration, the more the osculating periposeidon is lowered during the burn. This, together with the significant gravity losses, should be taken into account when designing the propulsion system.
In the studied range of apoposeidon radius values, the impact on the NOI size is minimal. Only for much lower apoposeidon values will there be a marked increase in the NOI. This imposes constraints on the accuracy of the execution of the insertion manoeuvre, as any mis-performance would lead to a significant deviation of the obtained from the planned orbit.
All further details on the tour timeline and manoeuvre sequence are beyond the scope of the CDF study and should be taken from RD[1].

Ice Giants CDF Study Report: CDF-187(C)
January 2019 page 39 of 431
ESA UNCLASSIFIED – Releasable to the Public
Description: Target periposeidon altitude 2000 km, apoposeidon radius 275 RN
Thrust/Mass ratio [N/kg]
NOI [m/s] Duration [s]
0.25 2249 6429
0.5 2061 3025
0.75 2005 1977
1.0 1981 1470
Description: Target periposeidon altitude 2000 km, T/M Ratio 0.5 N/kg
Apoposeidon radius [RN]
NOI [m/s] Duration [s]
275 2061 3025
250 2065 3030
225 2072 3036
200 2079 3044
Target periposeidon altitude 25000 km, T/M Ratio 0.5 N/kg
275 2615 3553
Table 4-2: NOI Size as Function of Various Parameters

Ice Giants CDF Study Report: CDF-187(C)
January 2019 page 40 of 431
ESA UNCLASSIFIED – Releasable to the Public
This Page Intentionally Blank

Ice Giants CDF Study Report: CDF-187(C)
January 2019 page 41 of 431
ESA UNCLASSIFIED – Releasable to the Public
5 NEPTUNE SYSTEMS
5.1 Atmospheric Probe
5.1.1 Mission & System Requirements and Design Drivers
Mission Requirements
Req. ID Statement Parent ID
MIS-010 The cost of the mission shall fit within a M-class mission
MIS-020 The launch of the probe will be in the period of 2029-2034
Table 5-1: Mission requirements
System Requirements
Req. ID Statement Parent ID
SYS-010 The probe shall be carried by the NASA orbiter to Neptune
SYS-020 The science observations of the probe shall occur during the descent from 1 bar to 10 bar and shall be 90 minutes
SYS-030 The data generated on-board of the probe shall be transmitted to the orbiter in real time
SYS-040 The orbiter shall serve as a relay for the probe during probe operations
SYS-050 The probe shall perform a direct entry.
SYS-060
The probe shall have Earth visibility during entry.
Note: to allow for UHF carrier monitoring of the probe from Earth during entry (see 36.5.2)
Table 5-2: System requirements
5.1.2 System Assumptions and Trade-Offs
Assumptions
1 The PEP design is the reference for the Ice Giants probe (RD[7]).
2 The science payload of the probe is the same as for the PEP study (RD[7]).
3 The launch date will be 13/02/2031.
4 The RHUs will be provided by NASA.
5 The probe batteries can be charged and topped off before probe release.
6 The NASA orbiter can provide up to two hours of data relay.
Note: This implies an orbiter with a higher periapsis altitude (>25000 km) than assessed in the NASA Ice Giants study (RD[1]) as shown in the mission analysis chapter(4.2) .
7 The TPS of the probe also shields the equipment inside from the radiation during Jupiter fly-by.

Ice Giants CDF Study Report: CDF-187(C)
January 2019 page 42 of 431
ESA UNCLASSIFIED – Releasable to the Public
5.1.3 Mission System Architecture
5.1.3.1 Mission options
5.1.3.1.1 Coasting duration
The coasting duration for the PEP probe was assumed to be 20 days. An option to increase this to 60 days for Ice Giants was investigated, based on similar assumptions in RD[1]. During the coast phase of PEP it was also assumed that the probe would send sporadic telemetry (namely housekeeping and GNC data) to the orbiter. This required frequent activation of the probe units, and amounted to a total energy consumption of 297 Wh. These assumptions were also traded against a coastal phase design where only a timer (Mission Timer Unit, MTU) was operational, with all other units in hibernation. An updated MTU power assumption was used, requiring only 180 mW compared to the 272 mW timer of PEP.
Table 5-3 provides a summary of the trade-offs. The criteria considered are:
Probe battery size (compared to the PEP battery of 11 kg)
Orbit Deflection Manoeuvre (ODM) required by orbiter after probe release
Thermal impact (preliminary assessment only).
PEP-like operations + MTU “Only-MTU-on” case, smaller MTUs
System impacts 20 days 60 days 20 days 60 days
Total energy for coast phase (Wh)
297 891 86.4 259
Increase of PEP battery size (%)
- +64.8% -23.0% -4.15%
ODM (m/s) 6.9 2.3 6.9 2.3
Estimated temperatures at arrival (without RHUs) (°C)
-28 -136 Unknown (worse than PEP)
Unknown (worse than PEP)
Table 5-3: Trade-off between the 20 day and 60 day cruise mode including or excluding the PEP like operations
This trade-off used the following assumptions:
The ODM delta-v analysis assumed a target periposeidon altitude of 2000 km from the NASA report (note that a 20,000 km design case was shown to not affect the delta-v markedly).
The lower temperature limit for all internal units in PEP was assumed to be -40ºC.

Ice Giants CDF Study Report: CDF-187(C)
January 2019 page 43 of 431
ESA UNCLASSIFIED – Releasable to the Public
For the 60 days thermal case the unit temperatures are extrapolated linearly after the 20 days that were analysed in PEP.
Based on the table above it has been decided to go for the 20 days coast duration with only the MTU turned “ON”. The impact on the delta-v budget of the orbiter is negligible and the benefits on the battery sizing and arrival temperature made this the obvious choice.
5.1.3.1.2 Entry flight path angle
The entry flight path angle (FPA) at an interface point of 600 km altitude needed to be selected such that:
The entry will be prograde, in order to reduce the entry velocity
In daylight (Copy from PEP but not really required)
Visible from earth during the entry.
These entry condition requirements will drive the FPA of the probe. See Figure 5-1.
Figure 5-1: Different entry conditions depending on the flight path angle
From Figure 5-1 it is clear that the FPA of the probe should be ca. -35 deg or lower. While a -45 deg FPA can reach different latitudes of Neptune and still have Earth/ Sun visibility. However changing the -35 deg to -45 deg the FPA increases the aerodynamic flux and therefor increases the TPS. In order to reuse the PEP study heritage, the baseline for the Ice Giants probe design was selected as -35 deg FPA.
5.1.4 System Baseline Design
5.1.4.1 Mission phases
The mission phases of the probe are the following:
Transfer phase: When the probe is attached to the orbiter. This phase lasts 13.5 years and ends when the probe is released from the orbiter.
No earth visibility
No earth visibility

Ice Giants CDF Study Report: CDF-187(C)
January 2019 page 44 of 431
ESA UNCLASSIFIED – Releasable to the Public
Coast phase:
o After the probe is released from the orbiter the probe will coast for 20 days to Neptune. Immediately after the release of the probe the system is turned “ON” for 10 minutes to checkout all of the equipment with the exception of the instruments.
o After this 10 minute checkout, all of the equipment are turned “OFF” with the exception of a small MTU timer which will wake up the system approx. ~30 minutes before entry.
o Approx. 30 minutes before entry, the probe equipment and instruments will be turned “ON” for a final pre-entry checkout and to calibrate the GNC system. Note that this duration could be significantly reduced, pending a consolidated checkout timeline (thus saving a significant amount of battery energy).
Entry phase: The probe entry phase will last ~6 min during which the parachutes are deployed and the front and back shield are released from the descent module.
Descent phase: During the 1.5 h descent phase the probe will take scientific measurements and transmit them back to the orbiter for relay to Earth.
In the future, the coast phase can be optimised with respect to readout of the equipment. Currently it is assumed that the HK and instrument HK will be transmitted to the orbiter at the end of the coast phase. This does not leave any time to transmit the data back to ground and perform any error correction that might be needed. As such this data will only be used for calibration on ground.
5.1.4.2 System Modes
The system modes of the probe that were taken into account during the CDF study to model the probe are the following.
•Probe carried by the Orbiter. Power interface to the orbiter for battery charging and check-ups.
•Note: Not modelled in OCDT Cruise mode
•From probe release from orbiter until the atmospheric entry. The probe uses its own power system and timer switches to activate automatic sequences. All other units off. Note: NO telecommand capability assumed
Coast mode
•The mode in which the probe relays housekeeping data during coast phase. Used for checkout and possible calibration. This mode occurs 10 minutes immediately after release from the orbiter, and from 30 minutes before atmospheric entry up until the release of the front shield after entry (app. 6 mins).
Intermediate mode
•After the front shield release the Descent Module is ready to: - Perform scientific measurements - Relay data
Descent mode

Ice Giants CDF Study Report: CDF-187(C)
January 2019 page 45 of 431
ESA UNCLASSIFIED – Releasable to the Public
5.1.4.3 Probe baseline design
Probe
Mass (Incl 20% system margin)
Mass w/o TPS&TC: 191 kg
TPS&TC: 151 kg
Mass with TPS: 342 kg
Ballistic coefficient
Projected area: 1.43 m2 (diameter 1.35 m)
Front shield area: 1.99 m2
Cd: 1.07
BC: 228 kg/m2
Payload Atmospheric Structure Instrument
Camera-Radiometer
Mass Spectrometer
Photometer
USO-Doppler
EDS 2 subsonic parachutes: pilot (M=0.8) and main
TPS Front shield: 51.9 mm thickness, 129 kg
Back shield: 31.4 mm, 19.9 kg
GNC 2 redundant IMUs
2 parachute deployment switches
Mechanisms Back and Front Shell Separation Mechanisms
Parachute Swivel Mechanism
Mortar parachute pyro cutter
Spin Eject Mechanism [Probe side]
Communications UHF redundant chain
Patch antenna on the backshell
Helix antenna during descent
Power 4 x 3 kg batteries
PCDU
Data Handling CDMU including timer
Structures 61.3 kg of structures (of which 28.5kg are in the descent module)
Thermal 31 RHUs, MLIs, Front shield radiator, pressure vessel insulation

Ice Giants CDF Study Report: CDF-187(C)
January 2019 page 46 of 431
ESA UNCLASSIFIED – Releasable to the Public
5.1.5 System Budgets
5.1.5.1 Mass budget
The baseline mass budget for the probe is presented in Table 5-4. It should be noted that the EDL, TPS and Structures subsystems were designed assuming a dry mass incl. TPS of 345 kg. The mass budget for the descent module only is presented in Table 5-5.
Probe Mass Budget Mass [kg]
Guidance Navigation and Control 1.68
Communications 12.31
Data-Handling 1.00
Instruments 11.10
Mechanisms 9.71
Power 21.76
Structures 61.24
Entry, Descent and Landing 18.43
Thermal Control 14.19
Harness 5% 7.87
Dry Mass w/o System Margin 159.28
System Margin 20% 31.86
Dry Mass incl. System Margin 191.13
Thermal Protection 151.25
Dry Mass incl. TPSS 342.38
Table 5-4: Probe mass budget
Below is the descent module mass budget. This is the part of the probe that will continue the descent after the TPS has been released.
DM Mass Budget
Mass [kg]
Guidance Navigation and Control 1.68
Communications 8.13
Data-Handling 1.00
Instruments 11.10
Mechanisms 3.08
Power 21.76
Structures 28.52
Thermal Control 10.77
Harness 5% 4.47
Dry Mass w/o System Margin 90.52
System Margin 20% 18.10
Dry Mass incl. System Margin 108.62
Table 5-5: Descent Module mass budget
The corresponding equipment list is presented in Table 5-6.

Ice Giants CDF Study Report: CDF-187(C)
January 2019 page 47 of 431
ESA UNCLASSIFIED – Releasable to the Public
# Mass (kg)
Total Mass (kg)
Mass margin (%)
Total mass incl. margin (kg)
Probe (Probe)
COM 11.00 11.86 12.31
DM (Descent Module)
7.20 12.85 8.13
RFDN_UHF (UHF Radio Frequency Distribution Network) 1 0.50 0.50 10 0.55
UHF_LGA_Helix (UHF Low Gain Antenna) 1 1.50 1.50 5 1.58
UHF_SSPA (UHF Solid State Power Amplifier) 2 0.80 1.60 5 1.68
UHF_TX (UHF Transmitter) 2 1.80 3.60 20 4.32
Outside Descent Module
UHF_LGA (UHF Patch LGA) 1 3.80 3.80 10 4.18
DH 0.83 20 1.00
DM (Descent Module)
0.83 20 1.00
CDM_2 (Computer and Data Management Probe #2) 1 0.83 0.83 20 1.00
INS 9.25 20 11.10
DM (Descent Module)
9.25 20 11.10
ASI (Atmospheric Structure Instrument) 1 1.25 1.25 20 1.50
Cam_Rad (Camera-Radiometer) 1 1.20 1.20 20 1.44
Mass_Spec (Mass Spectrometer) 1 5.00 5.00 20 6.00
Phot (Photometer) 1 0.30 0.30 20 0.36
USO_Doppler (USO-Doppler) 1 1.50 1.50 20 1.80
MEC 8.80 10.34 9.71
DM (Descent Module)
2.80 10 3.08
BSSM_DM (Back Shell Separation Mechanism [DM side]) 1 1.40 1.40 10 1.54
FSSM_DM (Front shield sep Mec [DM side]) 1 1.40 1.40 10 1.54
Outside Descent Module
BSSM_P (Back Shell Separation Mechanism [probe side]) 1 0.90 0.90 10 0.99
FSSM_P (Front shield sep Mec [probe side]) 1 2.40 2.40 10 2.64
SEM_probe (Spin Eject Mec [Probe side]) 1 2.40 2.40 10 2.64
Pyro_1 (Pyro #1) 3 0.00 0.00 0 0.00
cutter (Mortar parachute pyro cutter) 1 0.30 0.30 20 0.36
PWR 20.31 7.14 21.76
DM (Descent Module)
20.31 7.14 21.76
Bat_Pr (Battery_Probe) 4 2.90 11.60 5 12.18
PCDU_Pr (Power Conditioning & Distribution Unit_Probe) 1 8.71 8.71 10 9.58
STR 51.03 20 61.24

Ice Giants CDF Study Report: CDF-187(C)
January 2019 page 48 of 431
ESA UNCLASSIFIED – Releasable to the Public
# Mass (kg)
Total Mass (kg)
Mass margin (%)
Total mass incl. margin (kg)
DM (Descent Module)
23.77 20 28.52
DM_MP_1 (DM Mounting Platform #1) 1 1.03 1.03 20 1.24
DM_R (DM Mid Section Ring) 1 5.70 5.70 20 6.84
DM_Sh (DM Shell) 1 12.0
0 12.00 20 14.40
Parach_IF_1 (DM Main Parachute Supporting Structure #1) 3 1.68 5.04 20 6.05
Outside Descent Module
BS_Cold (BS Cold Structure) 1 4.05 4.05 20 4.86
FS_Cold (Front Shield Cold Structure) 1 7.50 7.50 20 9.00
BS_DM_IF_Brkt_1 (BS To DM IF Bracket #1) 3 1.32 3.96 20 4.75
BS_Ribs_1 (BS Stiffening Ribs #1) 3 1.00 3.00 20 3.60
FS_IF_Brkt_1 (FS IF Bracket #1) 3 1.32 3.96 20 4.75
FSSR (Front Shield Separation Ring) 1 4.79 4.79 20 5.75
TC 12.44 14.02 14.19
DM (Descent Module)
9.34 15.35 10.77
NP_PV_Ins (NP_PressureVessel_Insulation) 1 5.00 5.00 20 6.00
P_RHU_01 (P_RHU) 31 0.04 1.24 10 1.36
P_RHU_support_01 (P_RHU_support) 31 0.10 3.10 10 3.41
Outside Descent Module
NP_BC_MLI (NP_Backcover_MLI) 1 1.54 1.54 10 1.69
NP_FS_MLI (NP_Frontshield_MLI) 1 1.42 1.42 10 1.56
NP_FS_Rad (NP_Frontshield_Rad) 1 0.15 0.15 10 0.17
TP 126.04 20 151.25
Outside Descent Module
NP_BC_Abl (NP_Backcover_Ablator) 1 4.33 4.33 20 5.20
NP_BC_HotStr (NP_Backcover_HotStr) 1 7.43 7.43 20 8.92
NP_BC_Ins (NP_Backcover_Insulation) 1 4.82 4.82 20 5.78
NP_FS_Abl (NP_Frontshield_Ablator) 1 97.0
5 97.05 20 116.46
NP_FS_HotStr (NP_Frontshield_HotStr) 1 7.86 7.86 20 9.43
NP_FS_Ins (NP_Frontshield_Insulation) 1 2.55 2.55 20 3.06
NP_HS_Instr (NP_Heatshield_Instruments) 1 2.00 2.00 20 2.40
EDL 15.36 20 18.43
Outside Descent Module
MP (Main parachute) 1 14.3
8 14.38 20 17.25
PC (Pilot chute) 1 0.98 0.98 20 1.18
GNC 1.60 5 1.68

Ice Giants CDF Study Report: CDF-187(C)
January 2019 page 49 of 431
ESA UNCLASSIFIED – Releasable to the Public
# Mass (kg)
Total Mass (kg)
Mass margin (%)
Total mass incl. margin (kg)
DM (Descent Module)
1.60 5 1.68
LN200S_1 (LN200S #1) 2 0.75 1.50 5 1.58
PAS_switch_1 (PAS Switch #1) 2 0.05 0.10 5 0.11
Table 5-6: Probe equipment list
The low mass of the DH subsystem has increased after the IFP. The mass and other changes of the DH subsystem have not been flown down into the system budgets or other subsystems.
5.1.5.2 Power budget
The duty cycles assumed during the study for the probe equipment are presented in Table 5-7. The main assumptions made were:
All instruments are on for 5 minutes during the intermediate mode, off during coasting and on during the entire descent mode
During coasting, the on-board computer (CDM) is in stand-by and the MTU timer is only consuming 5 mW of power. All other equipment are turned off.
Note that this the MTU power of 5 mW is significantly less than the initial 180 mW assumed for the trade-off in Section 5.1.3.1, and was based on the latest available data sheets.
Both the IMU and the communications subsystem were assumed to be on during the entire intermediate mode, however their duty cycles could be reduced once the mode is further characterised. However, it should also be noted that the communication subsystem was sized for a maximum range of 40000 km during the descent mode. The orbiter-probe ranges of the intermediate mode were not analysed, but are expected to be higher (see MA chapter 0). Nonetheless, the data generated would be low in this mode (only housekeeping), and so this would not be expected to be a driver.
The pyro actuators for back and front shell release were assumed to only operate for 100 ms during the intermediate mode (see Mechanisms chapter 9).
The probe’s power budget taking into account these duty cycles is presented in the Power chapter.
EQUIPMENT P_ ON
P_STBY
REDUNDANCY SCHEME
REDUNDANCY TYPE
REDUNDANCY.K*
REDUNDANCY.N*
P_DUTY_CYC PDM
P_DUTY_CYC PCM
P_DUTY_CYC PIM
ASI 6 0 - - - - 1 -1 0.14
CAM_RAD 9.6 0 - - - - 1 -1 0.14
CDM 5 0.005
- - - - 0.7 0 1
LN200S 16 0 Active (or Hot)
External 1 2 1 -1 1
MASS_SPEC
9.6 0 - - - - 1 -1 0.14

Ice Giants CDF Study Report: CDF-187(C)
January 2019 page 50 of 431
ESA UNCLASSIFIED – Releasable to the Public
EQUIPMENT P_ ON
P_STBY
REDUNDANCY SCHEME
REDUNDANCY TYPE
REDUNDANCY.K*
REDUNDANCY.N*
P_DUTY_CYC PDM
P_DUTY_CYC PCM
P_DUTY_CYC PIM
PCDU_PR 16.5 16.5
Active (or Hot)
Internal - - 1 -1 1
PHOT 1.2 0 - - - - 1 -1 0.14
PYRO 15 0 Passive (or Cold or
Standby)
Internal 1 2 -1 -1 4.6E-6
RFDN_UHF 0 0 - - - - 1 -1 1
UHF_LGA_HELIX
0 0 - - - - 1 -1 1
UHF_SSPA 266.67
0 Passive (or Cold or
Standby)
External 1 2 1 -1 1
UHF_TX 5 0 Passive (or Cold or
Standby)
External 1 2 1 -1 1
USO_DOPPLER
12 0 - - - - 1 -1 0.14
*Redundancy k out of n: #k equipment are required to perform the mission out the #n equipment baselined
Table 5-7: Probe equipment duty cycles
5.1.5.3 Data budget
The probe instruments data budget is presented in Table 5-8.
Probe Data rates per mode
Instruments Data Rate (kbps) Descent Mode Intermediate Mode
ASI 0.16 0.16 0.16
Cam_Rad 1.75 1.75 1.75
Mass_Spec 0.13 0.13 0.13
Phot 0.00026 0.00026 0.00026
USO_Doppler 0.00 0.00 0.00
Total data rate required (kbps) 2.04 2.04
Duration (min) 90 5
Total data downloaded (Mb) 11.00 0.61
Table 5-8: Probe’s instruments data budget
5.1.6 Comparison with Galileo probe and PEP
Based on a request during the study, a comparison was made between the design of the Ice Giants Neptune probe and the designs of the Galileo probe and the PEP study. The investigation sought to understand why the Galileo probe could include approximately three times as much payload mass as Ice Giants, for an equivalent total probe mass.

Ice Giants CDF Study Report: CDF-187(C)
January 2019 page 51 of 431
ESA UNCLASSIFIED – Releasable to the Public
The main findings are summarised in Table 5-9.
Table 5-9: Comparison of Ice Giants design against PEP and Galileo
For the difference with the Galileo probe, the most significant contributing factors for the difference in payload mass available is seen to be in the power subsystem and parachute design.
The Galileo probe descent timeline foresaw a descent duration of 60 mins, during which it fell from 0.4 bars to ca. 24 bars. As such, it experienced a much more rapid descent than Ice Giants, and so Galileo could use a smaller parachute.
In addition, the longer operations time of 90 mins for Ice Giants (factor 1.5), coupled with a much higher data rate (factor 2), necessitates a much larger battery than for Galileo. Notably, Ice Giants transmits about three times as much total data during the descent period (11 Mb compared to 3.6 Mb for Galileo).
For this comparison with the Galileo probe it is also worth noting the different maturity of the mass budgets being compared. While the Galileo probe figures correspond to the flown capsule, the Ice Giants mass figures for the probe are the result of a first estimate a phase 0 level. As such, the inherently carry high margins which would then be diminished as the project evolves in maturity. Therefore, a comparison between the mass figures of a flown probe and those of the very preliminary design presented in this report can serve as a guideline but nothing more than that.
The comparison with PEP notes that the PEP study used very optimistic data for the TPS performance. As such, the TPS mass for PEP is considerably smaller. The rest of the mass differences with comparison to Ice Giants are primarily driven by the change in the probe descent profile.

Ice Giants CDF Study Report: CDF-187(C)
January 2019 page 52 of 431
ESA UNCLASSIFIED – Releasable to the Public
5.2 Orbiter
5.2.1 Mission and System Requirements Mission Requirements
Req. ID Statement Parent ID
MIS-010 The mission shall be launched within a timeframe of 2029 to 2034.
MIS-020 The mission shall be compatible with launch via a SLS Block 1B.
MIS-030 The total mission cost shall be within an M-class ESA science mission budget.
MIS-040 The mission shall be capable of performing in-situ and observational measurements at Neptune with a payload suite defined by the Study Science Team.
MIS-050 The mission shall be capable of performing in-situ and observational measurements at Triton during flybys, with a payload suite defined by the Study Science Team.
MIS-060 The mission shall include at least do 2 years (TBC) of science operations at Neptune.
System Requirements
Req. ID Statement Parent ID
SYS-010 The orbiter shall be compatible with a dual launch with a NASA orbiter on an SLS Block 1B in a TBD configuration.
SYS-020 The orbiter shall be delivered to NASA for final integration onto the launcher.
SYS-030 The orbiter delivery date to NASA shall be compatible with the selected launch date and any pre-launch activities agreed between ESA and NASA.
SYS-040 The orbiter shall be compatible with a storage of TBD months before integration onto the launcher.
SYS-050 The orbiter design shall allow late access for integration of the RTGs under the launcher fairing.
SYS-060 The orbiter shall include a payload suite of 116 kg (TBC).
SYS-070 The operational lifetime of the orbiter shall be at least 15.5 years after launch.
SYS-080 [DELETED]
SYS-090 The orbiter shall rely solely on its own power source(s) during cruise with the NASA orbiter.
SYS-100 The orbiter shall provide a SpaceWire interface to the NASA orbiter.
SYS-110 The orbiter shall be asleep during cruise with the NASA orbiter, apart from periodic checkouts.
SYS-120 The orbiter shall not require any active thermal control from the NASA orbiter.

Ice Giants CDF Study Report: CDF-187(C)
January 2019 page 53 of 431
ESA UNCLASSIFIED – Releasable to the Public
System Requirements
Req. ID Statement Parent ID
SYS-130 The orbiter shall separate from the NASA orbiter before the Jupiter swing-by.
SYS-140 The orbiter shall be able to perform an independent interplanetary transfer from separation until Neptune.
SYS-150 The orbiter shall be able to insert into orbit around Neptune.
SYS-160 The orbiter shall be able to download all gathered science data within the nominal mission duration (TBC).
SYS-170 The orbiter shall be compatible with all environments from integration until EOM.
SYS-180 The orbiter shall include redundancy for all mission-critical functionalities (TBC).
Table 5-10: System requirements
5.2.2 Design Drivers
The orbiter design was mostly driven by the far astronomical distance to Earth during the science operations phase. This necessitated the use of radioisotope power sources, and put large constraints on the available data rates for science data downlink.
In addition, the long mission lifetime and close swing-by to Jupiter (in particular for the mission to Uranus) requires High Reliability parts with significant Radiation Hardness.
5.2.3 System Assumptions and Trade-Offs
Assumptions
1 The ESA orbiter shall be launched together with a NASA orbiter in a stacked configuration. The ESA orbiter shall be topmost on the stack.
2 The launch shall take place on an SLS Block 1B.
3
The two orbiters shall remain together (and also attached to the SEP stage) until shortly before a Jupiter swing-by in December 2032. Note that this study focuses on the timeframe after the separation of the two orbiters. The preceding mission phases are not considered in detail.
4 There is no power interface to any NASA elements during cruise.
5 There shall be a SpaceWire (data) interface to the NASA orbiter for periodic checkouts during cruise.
6 The ESA orbiter shall be asleep during cruise, apart from periodic checkouts and for the preparation of the separation.
7 All communications to Earth from the orbiter during cruise shall be transmitted via the NASA orbiter / SEP stage.
8 For communications during the pre-separation activities, telecommunications to Earth from the ESA orbiter would be either via the NASA orbiter / SEP stage, or via the ESA orbiter during dedicated reorientations of the stack.
9 Up to 3 eMMRTGs would be available from NASA for the ESA orbiter.
10 The spacecraft structure and the equipment casing can provide up to 4 mm of radiation shielding

Ice Giants CDF Study Report: CDF-187(C)
January 2019 page 54 of 431
ESA UNCLASSIFIED – Releasable to the Public
5.2.3.1 Dual launch configuration trade-off
Two options for the dual launch configuration were preliminarily assessed for feasibility. In the first option, the ESA orbiter was considered to sit above the NASA orbiter/SEP stage stack (see Figure 5-2). In the second option, the two orbiters would be launched side-by-side atop the SEP stage (see Figure 5-3). Note that for both cases, the short Payload Fairing concept for the SLS Block-1B was used (as defined in RD[8]).
Figure 5-2: Dual launch – stacked configuration (includes images adapted from RD[8] and RD[1] for illustrative purposes)
Figure 5-3: Dual launch – side-by-side configuration (includes image adapted from RD[1] for illustrative purposes)

Ice Giants CDF Study Report: CDF-187(C)
January 2019 page 55 of 431
ESA UNCLASSIFIED – Releasable to the Public
The initial sizing of both options suggested that, from a configuration point-of-view, both alternatives would be feasible. Various benefits and risks were identified for both configurations, however a more detailed analysis (in combination with NASA) would be required to decide upon the final flight configuration. Several issues, such as the coupled mechanical loads, access under the launcher fairing for the RTGs installation, attitude control during cruise and the risk of non-separation (or from misalignments during separation) would need to be studied at much greater depth. The stacked configuration was selected as baseline for the remainder of the study.
5.2.3.2 Radiation shielding
The radiation levels observed by the spacecraft equipment behind 2.5, 4 or 10 mm of shielding structure are presented in Table 5-11. To protect the orbiter’s equipment from these radiation levels, 3 options were considered:
1. Shield sensitive units individually 2. Perform delta-design and re-qualification of sensitive units to increase radiation
tolerance 3. Shield the entire inner spacecraft (creating a shielded “vault”)
TIDL (krad)
2.5 mm (~100mil)
4 mm 10mm
Neptune 133 66 21
Table 5-11: Radiation levels for Neptune Orbiter
It was assumed for the analysis that the spacecraft structure and the individual equipment casing can provide 4 mm of radiation shielding to each unit. Table 5-12 presents an overview of the amount of extra shielding required (Option 1), or, alternatively, which units would require delta-design/re-qualification (Option 2). For Option 3, using a spacecraft diameter of 3.5m and height of 2.1m, the aluminium mass required for a full body shielding was estimated to be 374 kg (including 20% margin). As such, Option 3 was discarded.
From Table 5-12, and given the known TIDS, only 3 equipment for the Neptune orbiter were estimated to require extra shielding or modification/re-qualifications. However, the TIDS of the communication subsystem equipment and payload were not possible to identify during the course of the study. In a worst case scenario, they might require 150 kg of radiation shielding or modification/re-qualification. Thus, the TIDS of these units should be addressed in future work.

Ice Giants CDF Study Report: CDF-187(C)
January 2019 page 56 of 431
ESA UNCLASSIFIED – Releasable to the Public
Unit TIDS (krad)
Neptune Option 1 Neptune Option 2
Thickness required
Thickness applied
(assuming 4 mm provided by structure
and unit)
Aluminium Radiation
shielding mass (kg)
Delta-design/
re-qualification required
to 66 krad
Gyro 20 >10 mm 6 mm 1.3 Yes
IMU 100 None None 0 No
NavCam 2000 None None 0 No
RW 20 >10 mm 6 mm 4x2.9 Yes
STR 2000 None None 0 No
CDMU 100 None None 0 No
RIUC 100 None None 0 No
PCDU 50 >10 mm 6 mm 6.7 Yes
Batteries 4000 None None 0 No
Radiation monitor
100 None None 0 No
Comms* TBD >10 mm 6 mm 20 TBD
Payload TBD >10 mm 6 mm 130 TBD
Total 174
Total w/ 20% margin
207
*includes shielding of Ka and X-band EPC, TWT and X-band Transponder
Table 5-12: Neptune orbiter radiation trade-off
Note that for the design baseline and mass budget, it was assumed that all units would be able to reach a TIDS of minimum 60 krad. This would correspond to the 4 mm Al case, excluding RHA margin. As such, a delta-design/re-qualification of at least the Gyros, Reaction Wheels and PCDU would be required. Note that this delta-design/re-qualification should actually target at least 66 krad, if the RHA margin is to be applied.

Ice Giants CDF Study Report: CDF-187(C)
January 2019 page 57 of 431
ESA UNCLASSIFIED – Releasable to the Public
5.2.4 Mission System Architecture
5.2.4.1 Mission timeline
The mission timeline is presented in Figure 5-4. Note that the proposed mission foresees two orbiters, one provided by ESA (which journeys to Neptune) and one provided by NASA (which journeys to Uranus).
Figure 5-4: Mission timeline (Neptune)
The two orbiters are to be launched in a dual launch configuration on an SLS Block-1B in February 2031. The NASA orbiter is assumed to be attached to a Solar Electric Propulsion (SEP) stage, which provides power (to the NASA orbiter) and propulsion (to the stack) up until just before the Jupiter swing-by in December 2032, when the ESA orbiter detaches from the NASA orbiter. It thereafter travels alone to Neptune.
The ESA orbiter should arrive at Neptune in September 2044. The science operations phase at Neptune is envisaged to include planetary science of Neptune, coupled with multiple fly-bys of its moon Triton. The science phase at Neptune should last 2 years.
5.2.4.2 Mission phases
The mission phases are presented in Table 5-13. Note that the majority of the duration of the “independent swing-by phase [of Jupiter]” corresponds to the time before the Jupiter swing-by when the ESA orbiter is separated from the NASA orbiter. This phase was, however, not analysed in detail during the study.
Mission Phase Duration
(LEOP and) transfer phase [to Jupiter] 1.5 - 2 years
Independent swing-by phase [of Jupiter] ~6 months (TBC)
Cruise phase 11.5 years
Insertion phase 1-2 weeks (TBC)
Science phase 2 years
Disposal TBD
TOTAL: ~15.5 years
Table 5-13: Mission phases (Neptune)

Ice Giants CDF Study Report: CDF-187(C)
January 2019 page 58 of 431
ESA UNCLASSIFIED – Releasable to the Public
The duration of the insertion phase (for operational constraints) and disposal are also to be clarified in later work.
5.2.4.3 Science operations timeline
The science operations to be performed in Neptune orbit include a mixture between planetary observations and measurements of Neptune’s largest moon, Triton. The Triton measurements are performed during close fly-bys, while the majority of the Neptune science is also performed at Neptune periapsis. A reference science timeline was defined in order to size the system, as represented in Figure 5-5. Note however that this does not correspond precisely to any single orbit case identified by mission analysis.
Figure 5-5: Science operations timeline (Neptune)
The reference orbit includes 100 hours of Neptune periapsis science, during the “Neptune Closest Approach” phase. This is broken only intermittently by 3.2 hour communications windows, budgeted for one window per 24 hours.
During the Triton fly-bys, there are two science phases: the “Closest Approach Triton 1” (11 hours before and after the closest point to Triton), and the “Closest Approach Triton 2” (the 2 hours closest to Triton during the fly-by). This covers a total period of 24 hours of Triton science. During this phase, there are no communications back to Earth.
For the remainder of the orbit, the orbiter performs “Nominal science”. This uses a reduced payload complement, in order to use the surplus power from the RTG’s to charge the spacecraft batteries for the higher-consumption phases. During this part of the orbit, the spacecraft also performs 3.2 hours communications of science data per day.
Note that the reference timeline considers a reduction in the orbital period over the 2 years of science performed at Neptune. This reduces from an orbital period of 180 Earth days at the initial orbit, to 50 Earth days by the end of the mission. This was sized on a preliminary understanding of the Triton tour envisaged by NASA in RD[1]. Later analysis revealed that this assumption was incorrect, and that an orbital period reduction of initially 35 Earth days down to 5 Earth days by end-of-mission was more

Ice Giants CDF Study Report: CDF-187(C)
January 2019 page 59 of 431
ESA UNCLASSIFIED – Releasable to the Public
likely. This however could not be addressed in the current work. Such sizings are highly dependent on the Triton fly-by tour selected, and as such this should be further iterated in future work.
5.2.4.4 System modes
The orbiter system modes are defined in Figure 5-6.
Figure 5-6: System modes (Neptune)
5.2.5 System Baseline Design
The baseline orbiter design is summarised in Table 5-14.
Orbiter
Mass (Incl 20% system margin)
Dry mass: 1605 kg
Propellant mass (excl. margin): 1991 kg
Wet mass: 3969 kg
Payload Camera
Imaging Spectrometer
Ion and Neutral Mass Spectrometer
Magnetometer
Macrowave radiometer
Ultra Stable Oscillator (USO)
Ka-band transponder
Propulsion 2x main bipropellant thrusters (1000 N)
16x RCS thrusters (10 N)
3x pressurant tanks (2x 120 L and 1x 66 L tanks)
4x propellant tanks (550 L)
AOGNC 1x coarse rate sensor
2x navigation cameras

Ice Giants CDF Study Report: CDF-187(C)
January 2019 page 60 of 431
ESA UNCLASSIFIED – Releasable to the Public
Orbiter
2x IMUs
2x star trackers
4x reaction wheels
(+ RCS thrusters)
Communications X-band uplink/downlink
Ka-band downlink (42 kbps)
Science volume downlinked: 0.48 Gb/day
Communication window duration: 3.2 h/day
Data volume generated by EOM: 350 Gb
Power 3x eMMRTGs (EOM Power = 90W)
4x 48kg batteries
Data Handling Redundant OBC + 1Tbit of storage
Structures 303 kg
Thermal Heaters + use of the eMMRTG thermal dissipation
Table 5-14: Orbiter system baseline (Neptune)
5.2.5.1 Margin policy
The margin policy used in this study is the CDF margin policy for science missions. The following points note either exceptions or deviations from the standard policy.
5.2.6 System Budgets
5.2.6.1 Mass budget
The mass budget for the Neptune orbiter is presented in Table 5-15. The propellant mass is based on a total delta-v of 2712 m/s. The mass margin for the propellant residuals is already included (see Chemical Propulsion Chapter).
SC Mass Budget Mass [kg]
Attitude, Orbit, Guidance, Navigation Control 60.40
Communications 71.64
Chemical Propulsion 224.95
Data-Handling 38.48
Instruments 118.41
Mechanisms 39.00
Power 350.04
Structures 303.26
Radiation Shielding 0.00
Thermal Control 65.89
Radiation Instrumentation 1.49
Harness 5% 63.60
Dry Mass w/o System Margin 1337.17
System Margin 20% 267.43

Ice Giants CDF Study Report: CDF-187(C)
January 2019 page 61 of 431
ESA UNCLASSIFIED – Releasable to the Public
Dry Mass incl. System Margin 1604.60
CPROP Fuel Mass 887.53
CPROP Fuel Margin 0% 0.00
CPROP Oxidizer Mass 1464.42
CPROP Oxidizer Margin 0% 0.00
CPROP Pressurant Mass 12.03
CPROP Pressurant Margin 0% 0.00
Total Wet Mass 3968.59
Table 5-15: Neptune orbiter mass budget
The corresponding equipment list is presented in Table 5-16.
Equipment #
Mass (kg)
Total Mass (kg)
Mass margin (%)
Total mass incl. margin (kg)
SC (Spacecraft)
AOGNC
56 7.86 60.4
IMU_Astrix_1090A_1 (IMU Airbus Astrix 1090A #1)
2 5.00 10.00 5 10.5
NavCam_1 (NavCam #1) 2 11.00 22.00 5 23.1
RW_HR04_1 (RW Honeywell HR04 #1) 4 2.60 10.40 20 12.5
STR_HydraEU_Juice_1 (STR Sodern Hydra JUICE Electronics Unit #1)
2 3.60 7.20 5 7.6
STR_HydraOH_Juice_1 (STR Sodern Hydra JUICE Optical Head #1)
2 2.80 5.60 5 5.9
GYRO_Sireus (GYRO Selex Galileo Sireus) 1 0.80 0.80 10 0.9
COM
64.20 11.59 71.6
HGA (High Gain Antenna) 1 33.00 33.00 10 36.3
KaEPC (Ka-Band Electronic Power Conditioning)
2 1.30 2.60 20 3.1
KaTWT (Ka-Band Traveling Wave Tube) 2 0.80 1.60 20 1.9
LGA_LHCP (Low Gain Antenna - LHCP) 1 0.90 0.90 5 0.9
LGA_RHCP (Low Gain Antenna - RHCP) 1 0.90 0.90 5 0.9
RFDN (Radio Frequency Distribution Network)
1 13.00 13.00 20 15.6
XEPC (X-Band Electronic Power Conditioning)
2 1.30 2.60 5 2.7
XKaXPND (X/X/Ka-Band Transponder) 2 4.00 8.00 5 8.4
XTWT (X-Band Traveling Wave Tube) 2 0.80 1.60 5 1.7
DH
32.07 20 38.5
RIUC (Remote Inteface Unit Centralised) 1 8.33 8.33 20 10.0
RIUD (Remote Interface Unit Decentralised)
1 7.08 7.08 20 8.5
CDMU_1 (Computer and Data Management Unit #1)
2 8.33 16.66 20 20.0
INS
98.94 19.68 118.4

Ice Giants CDF Study Report: CDF-187(C)
January 2019 page 62 of 431
ESA UNCLASSIFIED – Releasable to the Public
Equipment #
Mass (kg)
Total Mass (kg)
Mass margin (%)
Total mass incl. margin (kg)
Cam (Camera) 1 16.00 16.00 20 19.2
Im_spec (Imaging Spectrometer) 1 15.50 15.50 20 18.6
INMS (Ion and Neutral Mass Spectreometer)
3 12.00 36.00 20 43.2
Mag (Magnetometer) 1 4.56 4.56 20 5.5
Micro_rad (Microwave radiometer) 1 19.34 19.34 20 23.2
USO (Ultra Stable Oscillator) 1 2.00 2.00 20 2.4
Ins_KaEPC (Instrument Ka-Band Electronic Power Conditioning)*
1 1.30 1.30 5 1.4
InsKaTWT (Instrument Ka Band Traveling Wave Tube)*
1 0.80 0.80 5 0.8
Ka_Transp (Ka-band Trransponder) 1 3.44 3.44 20 4.1
MEC
35.00 11.43 39.0
magBOOM (Deployable magnetometer boom)
1 30.00 30.00 10 33.0
SEP_separation (SEP stage separation [SC side])
1 5.00 5.00 20 6.0
PWR
324.90 7.74 350.0
Bat_Orb (Battery_Orbiter) 4 43.90 175.60 5 184.4
EMMRTG (Enhanced_Multi_Mission_RTG) 3 45.00 135.00 10 148.5
PCDU_Orb (Power Conditioning & Distribution Unit_Orbiter)
1 10.30 10.30 20 12.4
Ext_Pwr_Shnt (External power shunt) 1 1.00 1.00 20 1.2
Res_Pwr_Shnt (Resisitive power shunt) 3 1.00 3.00 20 3.6
STR
252.72 20 303.3
APs (Assembly Panels) 1 54.82 54.82 20 65.8
BP (Bottom Panel) 1 18.16 18.16 20 21.8
CPROP_TD (CPROP_Tank Deck) 1 21.88 21.88 20 26.3
MC (Module Collars) 1 22.00 22.00 20 26.4
SPs (Shear_Panels) 1 28.64 28.64 20 34.4
TP (Top Panel) 1 18.16 18.16 20 21.8
TR (Tube Rings) 1 12.74 12.74 20 15.3
TSS (Tank Supporting Struts) 1 66.00 66.00 20 79.2
TST (Tank Supporting Tube) 1 10.32 10.32 20 12.4
TC
59.72 10.34 65.9
TCS (Thermal Control Subsystem) 1
0.00 0 0.0
NO_BP (NO_Black_Paint) 1 10.00 10.00 10 11.0
NO_Louvre (NO_Louvres) 1 2.05 2.05 20 2.5
NO_MLI_ex (NO_MLI_external_22-layer) 1 32.00 32.00 10 35.2
NO_MLI_HGA (NO_MLI_HGA_10-layer) 1 1.60 1.60 10 1.8
NO_MLI_int (NO_MLI_internal_10-layer) 1 3.20 3.20 10 3.5
NO_Rad (NO_Radiator_SSM-tape) 1 0.20 0.20 10 0.2

Ice Giants CDF Study Report: CDF-187(C)
January 2019 page 63 of 431
ESA UNCLASSIFIED – Releasable to the Public
Equipment #
Mass (kg)
Total Mass (kg)
Mass margin (%)
Total mass incl. margin (kg)
NO_WP (NO_White_Paint) 1 0.80 0.80 10 0.9
NO_MLI_RTG_rad (NO_MLI_RTG_radiative_shield)
1 0.80 0.80 10 0.9
NO_MLI_RTG_ShuntRad (NO_RTG_ShuntRadiator)
1 1.88 1.88 10 2.1
NO_Therm_01 (NO_Thermistor) 40 0.06 2.40 10 2.6
O_Heater_01 (O_Heater) 80 0.06 4.80 10 5.3
CPROP
213.05 5.59 224.9
Biprop_FDV_1 (Biprop_FillDrain_Valve) 9 0.07 0.63 5 0.7
Biprop_Filter_1 (Biprop_Filter) 4 0.08 0.31 5 0.3
Biprop_LP_Trans_1 (LP_Transducer) 4 0.22 0.86 5 0.9
Biprop_LV_1 (Biprop_Latch_Valve) 4 0.75 3.00 5 3.2
Biprop_NRV_1 (Non_Return_Valve) 4 0.59 2.34 5 2.5
Biprop_Pipes (Biprop_Pipes) 1 8.00 8.00 20 9.6
Biprop_Thruster_Main_1 (Biprop_Thruster_Main #1)
2 7.80 15.60 5 16.4
Biprop_PR_1 (Biprop_PressureRegulator) 2 1.00 2.00 5 2.1
Biprop_Pres_Tank_1 (Biprop_Pressurant_Tank)
2 23.50 47.00 5 49.4
Biprop_Prop_Tank_1 (Biprop_Prop_Tank) 4 27.08 108.31 5 113.7
Biprop_SMA_Valve_1 (Biprop_SMA_Valve) 2 0.16 0.32 20 0.4
Biprop_Thruster_RCS_1_01 (Biprop_Thruster_RCS #1)
16 0.65 10.40 5 10.9
Biprop_HP_LV (Biprop_HP_Latch_Valve) 1 0.80 0.80 5 0.8
Biprop_HP_Trans (Biprop_HP_Transducer) 1 0.22 0.22 5 0.2
Biprop_Pres_Tank_small (Biprop_Pressurant_Tank_small)
1 12.00 12.00 5 12.6
Biprop_PV_1 (Biprop_Pyro_Valve) 4 0.32 1.26 5 1.3
RAD 1.35 10 1.5
rad_mon_ngrm (Radiation Monitor NGRM) 1 1.35 1.35 10 1.5
*These equipment are here modelled as part of the instruments (payload) as they are only required to perform radio science, but are actually integrated into the architecture of the communication subsystem
Note: The data handling subsystem has gone through some changes after the IFP. These changes have not been flown down into the system budgets or other subsystems.
Table 5-16: Neptune orbiter equipment list

Ice Giants CDF Study Report: CDF-187(C)
January 2019 page 64 of 431
ESA UNCLASSIFIED – Releasable to the Public
5.2.6.2 Power budget
The orbiter unit operations scheme per system mode is diagrammatically presented in Table 5-17.
System modes
LEOP Transfer
mode Cruise mode
Maneuver mode
Observation mode
Comms mode
Nominal Science mode
Transmitter
Receiver
OBC
AOCS thrusters
Main thruster
PCDU
Star trackers
Reaction wheels
Navigation camera
Green – High duty cycle; Orange – Low duty cycle or in stand-by; Red - OFF
Table 5-17: Platform equipment operations per system mode
In addition to this, additional science sub-modes were defined to complement the orbiter system modes (see Table 5-18).

Ice Giants CDF Study Report: CDF-187(C)
January 2019 page 65 of 431
ESA UNCLASSIFIED – Releasable to the Public
OBSERVATION MODE COMMS MODE
NOMINAL MODE
Science sub-modes /
Instruments
Neptune Closest
Approach [IPCA]
(100h*)
Closest Approach
Triton 1
[IMCA1]
(22h)
Closest Approach
Triton 2
[IMCA2]
(2h)
Science during comms
[ISCOM]
(3.2h)
Nominal science
[IN]
(remainder of orbit)
Cam X O / X O / X O O
Im_spce X O / X O / X O O
INMS O O O / X O O
KA_transp O O / X O / X X O
Mag X X X X X
Micro_rad X X X
USO X X X X X
Green (X) – ON; Orange (O/X) – Low to high duty cycle; Red (O) - OFF
Table 5-18: Payload operations per science sub-mode
The duty cycles modelled in OCDT for the orbiter instruments and platform equipment are presented in Table 5-19 and Table 5-21, respectively. The redundancy scheme adopted for platform equipment is presented in Table 5-20.
The main assumptions were:
The KA transponder, used for Doppler science during the Triton closest approach sub-modes, only operates for 1/3 of the Triton flyby, while the camera and imaging spectrometer operate for the remaining 2/3 of the fly-by.
The instrument INMS consists of 3 units which consume in total 63.72 W. For modelling purposes only, each unit was assumed to consume 1/3 of that value.
The propulsion latch valves were assumed to have a 2% to 5% duty cycle in several system modes, but actually only require activation once. If this is taken into account in future studies, there could be a reduction of 2.4W of power in the most driving modes.
The RCS thrusters are assumed to have a 1% duty cycle in observation mode, communication mode and nominal science mode. According to the amount of AOCS propellant required during science operations, the RCS thrusters should only have to operate a total of 22 min in 2 years (see AOCS chapter), so a 1% duty cycle can be considered conservative if the science pointing requirements remain the same.

Ice Giants CDF Study Report: CDF-187(C)
January 2019 page 66 of 431
ESA UNCLASSIFIED – Releasable to the Public
During the Communication mode, Doppler science is performed with Earth, using the payload KA transponder and the communication subsystem in X and Ka band. All three links are required to perform Earth Doppler science, however not simultaneously. The X band is only required for a fraction of time (2% duty cycle), when occultations occur.
During cruise mode, only periodic checks of the orbiter are done which require Earth pointing for data transfer. For that purpose a 10% duty cycle was assumed in that mode for the IMU, RWs and STRs.
The heaters duty cycles assumed correspond to the required total consumption stated in the Thermal Chapter, for an amount of 80 heaters.
The radiation monitor should be on during the transfer and science operations, but could be turned off if power is required for other activities.
The orbiter’s transmitters should be off during the LEOP mode to not blind any communications with the NASA orbiter and SEP stage, and to respect ITU requirements (this was not injected into the OCDT model, but does not affect the design).
The orbiter’s power budget taking into account these duty cycles is presented in the Power chapter. It should be noted that the RCS thrusters and the second main thruster were added to the model later and thus the power budget used for designing the power subsystem does not include these thrusters (approximately 300W, including 20% system margin, are missing in the manoeuvre mode). This should however not affect the power subsystem design, which is driven by the science operations.
INSTRUMENT P_ON P_STBY P_DUTY_CYC IPCA
P_DUTY_CYC IMCA1
P_DUTY_CYC IMCA2
P_DUTY_CYC ISCOM
P_DUTY_CYC IN
CAM 34.8 0 1 0.66 0.66 -1 -1
IM_SPEC 25.2 18.9 1 0.66 0.66 -1 -1
INMS 21.24 10 -1 -1 0.66 -1 -1
INMS_2 21.24 10 -1 -1 0.66 -1 -1
INMS_3 21.24 10 -1 -1 0.66 -1 -1
INS_KAEPC 3 0 -1 0.33 0.33 1 -1
INSKATWT 60 0 -1 0.33 0.33 1 -1
KA_TRANSP 39.84 0 -1 0.33 0.33 1 -1
MAG 12 2.74 1 1 1 1 1
MICRO_RAD 67.14 14.04 1 1 1 -1 -1
USO 6 0 1 1 1 1 1
Table 5-19: Orbiter instruments duty cycles
EQUIPMENT P_ON P_STBY REDUNDANCY. SCHEME
REDUNDANCY.TYPE
REDUNDANCY.K*
REDUNDANCY.N*
BIPROP_HP_TRANS 0.3 0.3 None - - -

Ice Giants CDF Study Report: CDF-187(C)
January 2019 page 67 of 431
ESA UNCLASSIFIED – Releasable to the Public
EQUIPMENT P_ON P_STBY REDUNDANCY. SCHEME
REDUNDANCY.TYPE
REDUNDANCY.K*
REDUNDANCY.N*
BIPROP_LP_TRANS 0.8 0 Active (or Hot) Internal 1 2
BIPROP_LV 30 0 Passive (or Cold or Standby)
Internal 2 4
BIPROP_THRUSTER_MAIN
180 0 Passive (or Cold or Standby)
External 1 1
BIPROP_THRUSTER_RCS
16.8 0 Passive (or Cold or Standby)
External 8 16
CDMU 35 0 Passive (or Cold or Standby)
External 1 2
EPC 9.07 0 Passive (or Cold or Standby)
External 1 2
IMU_ASTRIX_1090A
21 0 Passive (or Cold or Standby)
External 1 2
KATWT 172.41 0 Passive (or Cold or Standby)
External 1 2
NAVCAM 5.25 0 Passive (or Cold or Standby)
External 1 2
O_HEATER 0.6 0 - - - -
PCDU_ORB 24 24 Active (or Hot) Internal - -
PYRO_BOOM 15 0 Passive (or Cold or Standby)
Internal 1 2
RAD_MON_NGRM 2.65 0 None - - -
RIUC 16 0 - - - -
RIUD 12 0 - - - -
RW_HR04 9.6 0 Passive (or Cold or Standby)
External 3 4
STR_HYDRAEU_JUICE
11.55 0 Passive (or Cold or Standby)
External 1 2
STR_HYDRAOH_JUICE
7.88 0 Passive (or Cold or Standby)
External 1 2
XEPC 5.99 0 as above External 1 2
XPND_RX 15 0 as above External 1 2
XPND_TX 20 0 as above) External 1 2
XTWT 112.07 0 as above External 1 2
*Redundancy k out of n: #k equipment are required to perform the mission out the #n equipment baselined
Table 5-20: Orbiter equipment redundancy scheme

Ice Giants CDF Study Report: CDF-187(C)
January 2019 page 68 of 431
ESA UNCLASSIFIED – Releasable to the Public
EQUIPMENT P_DUTY_CYC LEOP
P_DUTY_CYC TM
P_DUTY_CYC CM
P_DUTY_CYC MM
P_DUTY_CYC OBM
P_DUTY_CYC COMM
P_DUTY_CYC NSM
BIPROP_HP_TRANS 1 1 1 1 1 1 1
BIPROP_LP_TRANS 1 1 1 1 1 1 1
BIPROP_LV -1 -1 0.02 0.05 0.02 0.02 0.02
BIPROP_THRUSTER_MAIN
-1 -1 -1 1 -1 -1 -1
BIPROP_THRUSTER_RCS
-1 -1 0.01 0.5 0.01 0.01 0.01
CDMU 1 1 0.6 1 1 1 0.4
EPC -1 -1 -1 -1 -1 0.98 -1
IMU_ASTRIX_1090A 1 -1 0.1 1 1 -1 0.1
KATWT -1 -1 -1 -1 -1 0.98 -1
NAVCAM 0.1 -1 -1 -1 0.1 -1 -1
O_HEATER -1 0.792 0.938 -1 -1 -1 0.417
PCDU_ORB 1 1 1 1 1 1 1
PYRO_BOOM -1 -1 -1 -1 -1 -1 -1
RAD_MON_NGRM 0.1 1 1 -1 1 1 1
RFDN 1 -1 0.1 0 -1 1 0.1
RIUC 1 1 0.6 1 1 1 0.4
RIUD 1 1 0.6 1 1 1 0.4
RW_HR04 -1 -1 0.1 1 1 1 -1
STR_HYDRAEU_JUICE 1 -1 0.1 1 1 1 1
STR_HYDRAOH_JUICE 1 -1 0.1 1 1 1 1
XEPC 1 -1 0.1 0 0 0.02 0.1
XPND_RX 1 1 1 1 1 1 1
XPND_TX 1 -1 0.1 0 -1 0.02 0.1
XTWT 1 -1 0.1 0 -1 0.02 0.1
Table 5-21: Orbiter equipment duty cycles
5.2.6.3 Data budget
The obiter’s payload data budget is presented in Table 5-22. The data rates and compression rates presented on the left are the rates initially provided by the payload experts. However, the total data generated in each mode assuming these values could not be downloaded to ground, given the platform power constraints (see 5.2.7.1). As such, it has been agreed with the science team that, for the course of the study, it would be assumed that the payload would only need to download:

Ice Giants CDF Study Report: CDF-187(C)
January 2019 page 69 of 431
ESA UNCLASSIFIED – Releasable to the Public
13 Gb of data from each Neptune closest approach (IPCA mode). The assumed rate was computed as follows: 10Gb/66.7h=0.15 Gb/h
4 Gb of data from each Triton closest approach sub-mode (IMCA1&2 modes).
Table 5-22: Orbiter’s payload data budget
5.2.6.4 Dissipation budget
The dissipation budget for the Neptune orbiter is presented in Table 5-23, where the platform and power consumptions already include a 20% margin. The RF outputs assumed were as follows:
Payload KaT: 35 W
Communication subsystem KA-band: 100W
Communication subsystem X-band: 65W.
It should be noted that the actual Safe mode (SM) consumed power and heater power were not modelled in OCDT and the value indicated in red is only an estimation based on the spacecraft Nominal Science mode (NSM).
There is also a discrepancy between the numbers here provided and those used to size the thermal subsystem (see Thermal chapter), due to the late addition of the RCS thrusters and a second main engine into the OCDT model, which increased the power consumed and dissipation. This increase is mostly in the manoeuvre mode (by approximately 300W, including 20% margin). However, this should mostly likely not impact the design of the thermal subsystem significantly, apart from the thermal aspects of the two main engines close to each other. Most heat during this mode is radiated to the outside of the spacecraft. Still, a reassessment of the radiator size should be made in future phases.

Ice Giants CDF Study Report: CDF-187(C)
January 2019 page 70 of 431
ESA UNCLASSIFIED – Releasable to the Public
System Mode CM ObM ObM NSM ObM Com
M LEOP MM SM TM
Science Sub-Mode IMCA
1 IMCA
2 IN IPCA ISCo
m Platform power consumption 183 218 218 155 218 409 342 730 183 175 Payload power consumption 0 199 262 22 174 145 0 0 0 0 Total consumption (W) 183 417 480 177 392 554 342 730 183 175
Instrument KaT duty cycle 0.33 0.33 -1 -1 1 Instrument RF output -11.7 -11.7 -35
Comms X duty cycle 0.1 -1 -1 -1 -1 0.02 1 0 0.1 -1
Comms Ka duty cycle -1 -1 -1 -1 -1 0.98 -1 -1 -1 -1
Comms RF output -6.5 0 0 0 0 -99.3 -65 0 -6.5 0
Heater Power -45 0 0 -20 0 0 0 0 -48 -38
Total output (W) -51.5 -11.7 -11.7 -20 0 -134 -65 0 -54.5 -38
Dissipation (W) 131 405 468 157 392 420 277 730 129 137
Table 5-23: Neptune orbiter dissipation budget
5.2.6.5 Delta-v budget
The Neptune orbiter delta-v budget is presented in Table 5-24.
Delta-v Budget Manoeuvre type
Orbiter to Neptune
Unit Comment
Jupiter fly-by Targeting stochastic 15 m/s
Orbital Insertion deterministic 2058.7 m/s From propulsion, considering baseline T/M ratio
Triton/Uranus Moon Targeting
deterministic 226 m/s
Planet Tour Deterministic deterministic 65 m/s
Planet Tour Stochastic stochastic 20 m/s
Planet Tour Future Design deterministic 30 m/s
Margin on stochastic delta-v 0 % 3-sigma values, no margin applied
Margin on deterministic delta-v
5 %
Total det. and stoch. Manoeuvres
2533.65 m/s
Disposal manoeuvre 10 m/s

Ice Giants CDF Study Report: CDF-187(C)
January 2019 page 71 of 431
ESA UNCLASSIFIED – Releasable to the Public
Delta-v Budget Manoeuvre type
Orbiter to Neptune
Unit Comment
Margin on disposal manoeuvre
0 %
Total disposal manoeuvre 10 m/s
AOCS delta-v 168.18 m/s Margin on total propellant estimated by propulsion
Margin on AOCS delta-v 0 %
Total AOCS delta-v 168.18 m/s
Total delta-v w/o margin 2592.8 m/s
Total delta-v with margin 2711.8 m/s
Table 5-24: Neptune orbiter delta-v budget
5.2.7 System Options
5.2.7.1 Payload timeline
The communication window duration drives both the total data that can be downlinked and the total energy budget per orbit. However, the total data that can be downlinked is also a driver for the instrument design and the duration of the science modes, which in turn sizes the communication window duration. To estimate the total data that can be generated and downlinked an analysis has been made at system level using the following assumptions:
3 RTGs with an EoL power of 90 W each
The duration of all science modes with the exception of the Nominal Science mode are fixed for each orbit
A system margin of 20% is added to the total power consumed
An efficiency of 90% is assumed for the losses inside the spacecraft, including the battery charging and discharging losses, PCU losses, harness losses, etc. Note: This efficiency, for ease of calculations, was assumed at the power generation side. This is a worst case that includes several factors that might not happen at the same time.
The power of each mode is shown in Table 5-25
The total duration of the each of the science modes is:
o Neptune closest approach: 100 h including 4 communication windows where the science mode will switch to the science comms mode. (See Figure 5-5)
o Triton closest approach 1: 22 hours
o Triton closest approach 2: 2 hours
o Nominal science mode: the remainder of the orbit with 1 comms mode/day
The total science data generated in each science mode is:
o Neptune closest approach: 10Gb/66hours (0.15 Gb/hour) has been requested by the project scientists. Since the duration of this mode is dependent on the

Ice Giants CDF Study Report: CDF-187(C)
January 2019 page 72 of 431
ESA UNCLASSIFIED – Releasable to the Public
communication window duration, this number will be increased or decreased depending on the actual duration of the mode.
o Triton closest approach 1: The triton closest approach 1 and 2 combined generate 4 Gb of data. (For ease of analysis this is assumed to be all generated during the Triton closest approach 2 mode.
o Science comms mode: 1.265 kbps
o Nominal science mode: 1.265 kbps
The HK data during the orbit is 200 Mb/day
The downlink datarate is 42kbps.
Power Closest
approach Neptune
Closest approach Triton1
Closest approach Triton2
Comms duration/day
Nominal Science
Power instrument 145 166 218 121 18 W
Power platform 177 177 177 336 125 W
Total Power 322 342 395 457 143 W
Note: The following results change significantly with only minor changes in the power budget.
Table 5-25: Power consumed in each science mode for the instruments and the platform
5.2.7.1.1 Results
The results for the communication window duration have been sized for the 50 day orbit, to ensure that the total generated energy equals the total consumed energy per orbit.
The total communication window duration in this case is 3.2 hours. Table 5-26 shows that the worst case is the 50 day orbit and that there is energy available in case of a different orbit duration. Table 5-27 shows a negative data margin for both the 50 and 75 day orbit.
Figure 5-7 shows different data points taken for the data margin and energy margin. This shows that the data downlinked can be increased to be more than the data generated in the 75 day orbit by reducing the energy margin and by increasing the communication window.
Since it is not possible to increase the communication window in the 50 day orbit, the remaining data (7.2 Gb) will have to be downlinked after the 50 day orbit.
All the remaining data can be downlinked in 15 days, assuming the 3.2 hours/day communication window, after the 50 day orbit if no extra data is generated (HK or science)
If downlink HK data is generated, all the remaining science data can be downlinked in 24 days assuming the 3.2 hours/day communication window
If both HK and science data is generated at the same duty cycle as the nominal case:
o 3.2 hours of communication
o 20.8 hours of nominal science

Ice Giants CDF Study Report: CDF-187(C)
January 2019 page 73 of 431
ESA UNCLASSIFIED – Releasable to the Public
o 50 days of downlink are needed.
Energy
Days Generated Consumed Margin
50 291600 291600 0 Wh
75 437400 425107 12293 Wh
100 583200 558614 24586 Wh
Table 5-26: The total power generated, consumed and the power margin for a 50, 75 and 100 day orbit
Data
Days Generated downlinked Margin
50 32 25 -7 Gb
75 40 37 -3 Gb
100 48 50 2 Gb
Table 5-27: The total data generate, downlink availability and margin for a 50, 75 and 100 day orbit
Figure 5-7: The energy margin available plotted against the data margin available. The circled points are the data points from Table 5-26 and Table 5-27
The next figures show the total power and data generated in the 50, 75 and 100 day orbit for each mode. These figures show that the driving case for the energy consumption is the nominal science mode and the communication mode. The numbers in these pictures are preliminary numbers that will change significantly with minor changes in the power budget.
For the data generated the driving case is the Neptune closest approach mode.

Ice Giants CDF Study Report: CDF-187(C)
January 2019 page 74 of 431
ESA UNCLASSIFIED – Releasable to the Public
Figure 5-8: The consumed energy per mode and per orbit in kW and percentage over the total orbit for the 50 day orbit
Day
s50
Inst
rum
en
ts53
153
22%
Pla
tfo
rm18
9847
78%
Tota
l24
3000
100%
Inst
rum
en
ts12
611
5%
Pla
tfo
rm15
357
6%
Tota
l27
968
12%
Inst
rum
en
ts19
806
8%
Pla
tfo
rm55
044
23%
Tota
l74
850
31%
Inst
rum
en
ts16
654
7%In
stru
me
nts
436
0%In
stru
me
nts
3646
2%
Pla
tfo
rm11
5204
47%
Pla
tfo
rm35
30%
Pla
tfo
rm38
882%
Tota
l13
1858
54%
Tota
l79
00%
Tota
l75
343%
Clo
sest
ap
pro
ach
Co
mm
s d
ura
tio
n/d
ay
No
min
al S
cie
nce
Clo
sest
ap
pro
ach
C
lose
st a
pp
roac
h
Tota
l

Ice Giants CDF Study Report: CDF-187(C)
January 2019 page 75 of 431
ESA UNCLASSIFIED – Releasable to the Public
Figure 5-9: The consumed energy per mode and per orbit in kW and percentage over the total orbit for the 75 day orbit
Day
s75
Inst
rum
en
ts72
381
20%
Pla
tfo
rm28
1875
80%
Tota
l35
4256
100%
Inst
rum
en
ts12
611
4%
Pla
tfo
rm15
357
4%
Tota
l27
968
8%
Inst
rum
en
ts29
709
8%
Pla
tfo
rm82
566
23%
Tota
l11
2275
32%
Inst
rum
en
ts25
979
7%In
stru
me
nts
436
0%In
stru
me
nts
3646
1%
Pla
tfo
rm17
9710
51%
Pla
tfo
rm35
30%
Pla
tfo
rm38
881%
Tota
l20
5689
58%
Tota
l79
00%
Tota
l75
342%
Clo
sest
ap
pro
ach
Co
mm
s d
ura
tio
n/d
ay
No
min
al S
cie
nce
Clo
sest
ap
pro
ach
C
lose
st a
pp
roac
h
Tota
l

Ice Giants CDF Study Report: CDF-187(C)
January 2019 page 76 of 431
ESA UNCLASSIFIED – Releasable to the Public
Figure 5-10: The consumed energy per mode and per orbit in kW and percentage over the total orbit for the 100 day orbit
Day
s10
0
Inst
rum
en
ts88
891
19%
Pla
tfo
rm36
8086
81%
Tota
l45
6977
100%
Inst
rum
en
ts12
772
3%
Pla
tfo
rm15
554
3%
Tota
l28
326
6%
Inst
rum
en
ts36
252
8%
Pla
tfo
rm10
0751
22%
Tota
l13
7003
30%
Inst
rum
en
ts35
784
8%In
stru
me
nts
436
0%In
stru
me
nts
3646
1%
Pla
tfo
rm24
7539
54%
Pla
tfo
rm35
30%
Pla
tfo
rm38
881%
Tota
l28
3323
62%
Tota
l79
00%
Tota
l75
342%
Co
mm
s d
ura
tio
n/d
ay
No
min
al S
cie
nce
Clo
sest
ap
pro
ach
C
lose
st a
pp
roac
h
Tota
l
Clo
sest
ap
pro
ach

Ice Giants CDF Study Report: CDF-187(C)
January 2019 page 77 of 431
ESA UNCLASSIFIED – Releasable to the Public
Figure 5-11: The generated data per mode in Gb and percentage over the total orbit for the 50 day orbit
Day
s50
Inst
rum
en
ts22
69%
Pla
tfo
rm10
31%
Tota
l32
100%
Inst
rum
en
ts13
.03
41%
Pla
tfo
rm0.
722%
Tota
l13
.75
43%
Inst
rum
en
ts1
2%
Pla
tfo
rm1
4%
Tota
l2
7%
Inst
rum
en
ts4
13%
Inst
rum
en
ts4
13%
Inst
rum
en
ts0
0%
Pla
tfo
rm8
24%
Pla
tfo
rm0
0%P
latf
orm
01%
Tota
l12
37%
Tota
l4
13%
Tota
l0
1%
No
min
al S
cie
nce
Tota
l
Clo
sest
ap
pro
ach
Clo
sest
ap
pro
ach
C
lose
st a
pp
roac
h
Co
mm
s d
ura
tio
n/d
ay

Ice Giants CDF Study Report: CDF-187(C)
January 2019 page 78 of 431
ESA UNCLASSIFIED – Releasable to the Public
Figure 5-12: The generated data per mode in Gb and percentage over the total orbit for the 75 day orbit
Day
s75
Inst
rum
en
ts25
62%
Pla
tfo
rm15
38%
Tota
l40
100%
Inst
rum
en
ts13
.03
33%
Pla
tfo
rm0.
722%
Tota
l13
.75
35%
Inst
rum
en
ts1
3%
Pla
tfo
rm2
4%
Tota
l3
8%
Inst
rum
en
ts7
17%
Inst
rum
en
ts4
10%
Inst
rum
en
ts0
0%
Pla
tfo
rm12
30%
Pla
tfo
rm0
0%P
latf
orm
00%
Tota
l19
47%
Tota
l4
10%
Tota
l0
0%
No
min
al S
cie
nce
Tota
l
Clo
sest
ap
pro
ach
Clo
sest
ap
pro
ach
C
lose
st a
pp
roac
h
Co
mm
s d
ura
tio
n/d
ay

Ice Giants CDF Study Report: CDF-187(C)
January 2019 page 79 of 431
ESA UNCLASSIFIED – Releasable to the Public
Figure 5-13: The generated data per mode in Gb and percentage over the total orbit for the 100 day orbit
Day
s10
0
Inst
rum
en
ts27
58%
Pla
tfo
rm20
42%
Tota
l47
100%
Inst
rum
en
ts13
.03
27%
Pla
tfo
rm0.
722%
Tota
l13
.75
29%
Inst
rum
en
ts1
3%
Pla
tfo
rm3
5%
Tota
l4
9%
Inst
rum
en
ts9
19%
Inst
rum
en
ts4
8%In
stru
me
nts
00%
Pla
tfo
rm16
34%
Pla
tfo
rm0
0%P
latf
orm
00%
Tota
l25
53%
Tota
l4
8%To
tal
00%
No
min
al S
cie
nce
Tota
l
Clo
sest
ap
pro
ach
Clo
sest
ap
pro
ach
C
lose
st a
pp
roac
h
Co
mm
s d
ura
tio
n/d
ay

Ice Giants CDF Study Report: CDF-187(C)
January 2019 page 80 of 431
ESA UNCLASSIFIED – Releasable to the Public
5.2.7.2 Number of RTGs
In the previous analysis, the use of 3 RTGs is assumed. Since these are LLIs with considerable availability and usage challenges, the use of 2 RTGs was investigated.
Due to the already very low / negative margins on the data downlink budget it is clear that a 2 RTG solution would not be feasible for the current payload and science operations baseline.
5.2.8 Future Work
There are a number of open issues/options to be addressed in future work at system level. These trade-offs would seek to optimise the design or to mitigate identified risks and uncertainties. These include:
Optimisation of science timeline:
The Neptune mission is highly constrained by the trade-off between data downlink and power/energy. The reference case science timeline was considered to be at the margins of feasibility. As such, a detailed analysis of the desired science operations would help to reintroduce margin into the design. For instance, it could be considered to perform the majority of Neptune periapsis science during the initial Neptune orbits, which have more time to recharge the battery. The shorter Neptune orbits could then be used to focus on Triton science. Such shorter orbits were already identified in RD[1] as being of more value for Triton science.
In addition, a simple extension of the mission duration, or intermittent breaks in high-volume science, would allow time and energy to download all acquired payload data.
Increasing the number or size of considered ground stations:
The current design considers an ESA-only array of two visible ground stations. The extension to a third ESA station in the array would offer considerable data downlink advantages, however the availability of this feature by 2044 could not be guaranteed. In addition, potential access to the 70-metre antennae of the NASA Deep Space Network could vastly increase the data throughput to Earth.
Consolidated analyses for launch and initial interplanetary trajectories:
As presented in the assumptions, the study focused on the orbiter design from the point of release from the NASA orbiter (pre Jupiter swing-by). As such, further iteration and interaction would be required with NASA to consolidate interface requirements during launch and the pre-separation cruise.
In addition, there remain significant uncertainties for the later system work:
Availability of Enhanced Multi-Mission Radioisotope Thermoelectric Generators (eMMRTGs):
The availability of 3 eMMRTGs for the ESA orbiter is critical for the mission. As discussed elsewhere in the report, the availability of these devices is combined

Ice Giants CDF Study Report: CDF-187(C)
January 2019 page 81 of 431
ESA UNCLASSIFIED – Releasable to the Public
with significant programmatic/schedule risk. There are also issues regarding access during testing and under the launcher fairing, as well as nuclear safety regulations dictating the maximum mass of radioactive material that can be stored at the launch site and launched in a single rocket (the total of 6 eMMRTGs required for this mission (3 for the ESA orbiter and 3 for the NASA one) seems to be above the allowed limit, but the indication for the purpose of this study was to not go into those details at this stage) . None of these issues were addressed in detail in this study. However, any one of them could potentially be a showstopper for the realisation of the mission. The end-of-mission output power to be expected from the eMMRTGs remains an additional point that could potentially restrain the mission science operations further.
5.2.9 Technology Needs
All technology needs are considered at subsystem level. Note however that the baseline launcher (SLS Block 1B) will not be available until after 2021 (RD[8]).

Ice Giants CDF Study Report: CDF-187(C)
January 2019 page 82 of 431
ESA UNCLASSIFIED – Releasable to the Public
This Page Intentionally Blank

Ice Giants CDF Study Report: CDF-187(C)
January 2019 page 83 of 431
ESA UNCLASSIFIED – Releasable to the Public
6 NEPTUNE PAYLOAD
6.1 Atmospheric Probe
The Model Payload for the Neptune Atmospheric Probe was put together in order to size the capsule resources and to address the payload accommodation. These instruments are a representation of a possible future payload, but are not meant to be understood as a pre-selection of instruments for a potential future mission.
This Model Payload was taken over from an earlier CDF study, the Planetary Entry Probe to Venus (“PEP (V)”; RD[7]). This approach was chosen due to the limited study time available of five weeks for three potential mission elements (Atmospheric Probe, Orbiter, and Triton Lander) and the need to devote more time to study the mission enabling elements of the Atmospheric Probe: the critical technologies of the Entry Descent System (EDS), in particular the heat-shield and the parachute(s).
6.1.1 Requirements and Design Drivers
The main design drivers for the Model Payload of the Atmospheric Probe were the following:
The instruments shall survive a ~13-year transfer to Neptune. Throughout the transfer the temperature of the instruments shall be sufficient (value TBC) to keep them functioning optimally for operations at the target planet.
The instruments shall have sufficient power for science operations during the 90-minute descent of the Atmospheric Probe down to 10 bar (minimum) in Neptune’s atmosphere (see Power section 13.1.3
The instruments shall be able to uplink the science data in real time to the communications system of the relay satellite.
Instruments that will start operations before the start of real-time uplink shall be able to store the acquired data in a data storage unit and this data shall be transmitted by the communications system at the appropriate time.
SubSystem Requirements
Req. ID Statement Parent ID
PAY-010 The Atmospheric Probe instruments shall be able to operate between 0.1 bar and 10 bar (minimum).
TBD
PAY-202 The Atmospheric Probe instruments shall be able to operate between 60 and 90 minutes in Neptune’s atmosphere.
TBD
Table 6-1: SubSystem requirements for the Neptune Probe Model Payload
6.1.2 Assumptions and Trade-Offs
For the Atmospheric Probe Model Payload no trade-offs were performed, as the same instruments were used in RD[7].
The assumptions that were taken are listed in Table 6-2:

Ice Giants CDF Study Report: CDF-187(C)
January 2019 page 84 of 431
ESA UNCLASSIFIED – Releasable to the Public
Assumptions
1 No radiation shielding is assumed as the calculated TID (Total Ionising Dose) for the Neptune mission is ~66 krad with 4 mm Al shielding see Chapter 35 Radiation.
2 Heating for the instruments shall be provided by RHUs [35.2.2].
Table 6-2: Assumptions for the Neptune Atmospheric Probe Model Payload
6.1.3 Baseline Design
The Model Payload for the Atmospheric Probe addresses science goals as described in the Science Traceability Matrix (STM). The main science objectives at Neptune are to:
Determine the compositional, thermal and dynamical structure of the atmosphere
Determine the planet’s bulk composition, including abundances and isotopes of heavy elements.
The main instruments to address the planet’s bulk composition are the Mass Spectrometer (measuring the atmospheric composition) and the Atmospheric Structure Instrument, providing supporting information on altitude profile (e.g. by pressure) and on the thermal condition, allowing for derive mixing ratio profile and detect possible condensation.
The structure of the atmosphere will be addressed by the Atmospheric Structure Instrument, Camera/Radiometer, Photometer, and the USO/Doppler wind experiment.
Table 6-3 lists those instruments, together with their mass (incl. 20% equipment margin), average power consumption, data rate, physical size and their heritage from previous instruments and missions.
Instrument Mass
[kg] Power
[W] Data rate
[kb/s]
Volume envelope
[mm]
Notes/Heritage
Atmospheric Structure Instrument (ASI)
1.50 6.00 0.16 TEM, PPI: 205×30 Ø ACC: 79×58×68
Three core sensor packages: - three-axial accelerometer (ASI-ACC) - pressure profile instrument (ASI-PPI) - temperature sensors (ASI-TEM)
Mass Spectrometer 6.00 9.60 0.13 200×200×100 Ion Trap Mass Spectrometer, Rosetta/Ptolemy heritage
Ultra Stable Oscillator (USO)/Doppler wind experiment
1.80 12.00 n/a 150×150×118 USO for Doppler Wind Experiment; Huygens heritage
Camera/radiometer channels
1.44 9.60 1.747 100×100×200 For atmospheric cloud features; 17.5º FoV, 4 filters; VenusExpress heritage
Photometer 0.36 1.20 0.00026 30×30×80 Selected as placeholder for potential other instruments (see Section 6.1.3.1).
Table 6-3: Baseline Model Payload for the Neptune Atmospheric Probe
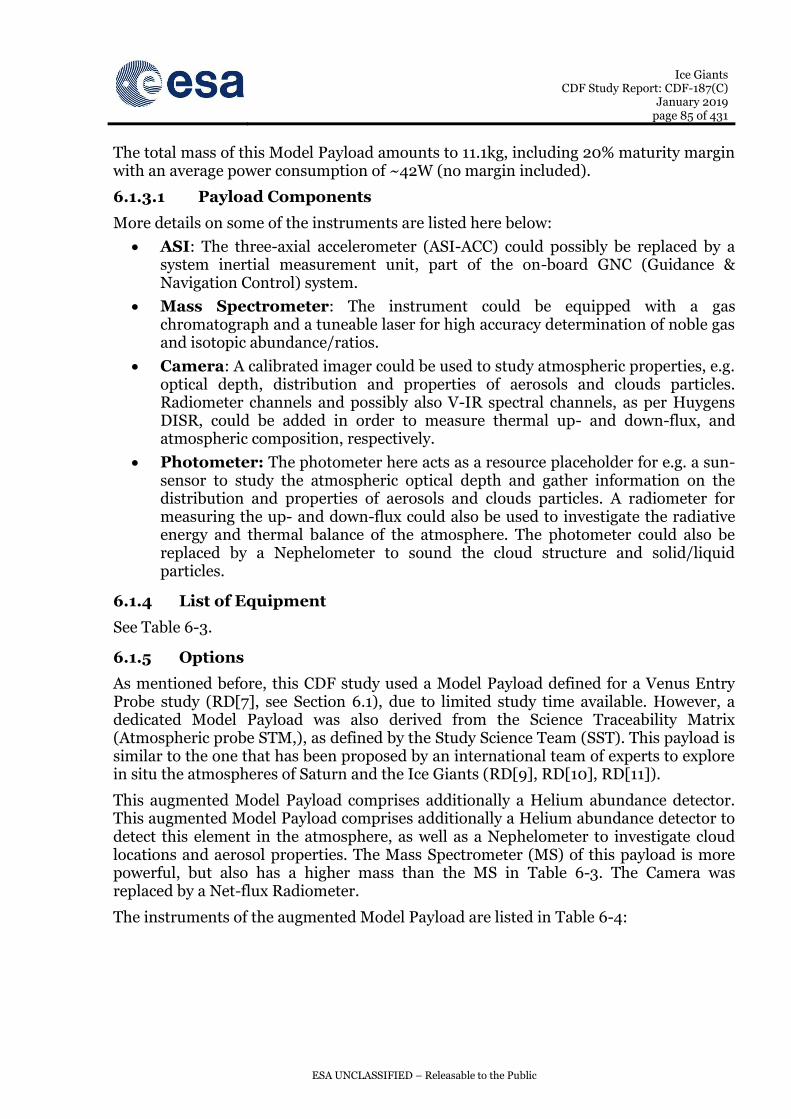
Ice Giants CDF Study Report: CDF-187(C)
January 2019 page 85 of 431
ESA UNCLASSIFIED – Releasable to the Public
The total mass of this Model Payload amounts to 11.1kg, including 20% maturity margin with an average power consumption of ~42W (no margin included).
6.1.3.1 Payload Components
More details on some of the instruments are listed here below:
ASI: The three-axial accelerometer (ASI-ACC) could possibly be replaced by a system inertial measurement unit, part of the on-board GNC (Guidance & Navigation Control) system.
Mass Spectrometer: The instrument could be equipped with a gas chromatograph and a tuneable laser for high accuracy determination of noble gas and isotopic abundance/ratios.
Camera: A calibrated imager could be used to study atmospheric properties, e.g. optical depth, distribution and properties of aerosols and clouds particles. Radiometer channels and possibly also V-IR spectral channels, as per Huygens DISR, could be added in order to measure thermal up- and down-flux, and atmospheric composition, respectively.
Photometer: The photometer here acts as a resource placeholder for e.g. a sun-sensor to study the atmospheric optical depth and gather information on the distribution and properties of aerosols and clouds particles. A radiometer for measuring the up- and down-flux could also be used to investigate the radiative energy and thermal balance of the atmosphere. The photometer could also be replaced by a Nephelometer to sound the cloud structure and solid/liquid particles.
6.1.4 List of Equipment
See Table 6-3.
6.1.5 Options
As mentioned before, this CDF study used a Model Payload defined for a Venus Entry Probe study (RD[7], see Section 6.1), due to limited study time available. However, a dedicated Model Payload was also derived from the Science Traceability Matrix (Atmospheric probe STM,), as defined by the Study Science Team (SST). This payload is similar to the one that has been proposed by an international team of experts to explore in situ the atmospheres of Saturn and the Ice Giants (RD[9], RD[10], RD[11]).
This augmented Model Payload comprises additionally a Helium abundance detector. This augmented Model Payload comprises additionally a Helium abundance detector to detect this element in the atmosphere, as well as a Nephelometer to investigate cloud locations and aerosol properties. The Mass Spectrometer (MS) of this payload is more powerful, but also has a higher mass than the MS in Table 6-3. The Camera was replaced by a Net-flux Radiometer.
The instruments of the augmented Model Payload are listed in Table 6-4:

Ice Giants CDF Study Report: CDF-187(C)
January 2019 page 86 of 431
ESA UNCLASSIFIED – Releasable to the Public
Instrument Mass [kg]
Power [W]
Data rate [kb/s]
Volume envelope
[mm]
Notes/Heritage
Mass spectrometer
18.96 81.60 2.00 245×145×229 Time-of-flight mass spectrometer with varying measurement cadence, tuneable laser spectrometer, gas separation system.
Atmospheric Structure Instrument
3.00 12.00 (2b/s) 200×200×200 In situ measurements of atmospheric density, pressure, temperature profile.
Huygens/HASI heritage
Helium abundance detector
1.20 1.20 (4b/s) 1
sample/64 sec
TBD Measurement of He abundance in Neptune’s atmosphere; flown on Galileo Probe.
Radio Science Experiment (USO)
1.80 3.60 0.055 40 Ø × 140 Ultra-Stable Oscillator to generate a stable signal for the Probe radio link.
Nephelometer 2.76 3.60 0.15 TBD For cloud locations and aerosol properties
Net-flux radiometer (NFR)
2.88 7.56 0.06 110×140×280 Measure the net radiation flux and upward radiation flux within the atmosphere. Heritage: Venus Probe/LIR and Galileo Probe/NFR.
Table 6-4: Augmented Atmospheric Probe Model Payload
The total mass of this Model Payload amounts to 30.6kg, including 20% maturity margin and an average power consumption of ~109W (no margin included).
With further payload iterations, the SST is confident to be able to reduce the P/L mass to ca. 20kg (incl. maturity margin) without compromising science.
6.1.5.1 Payload Components of the augmented Atmospheric Probe Model Payload
More details on some of the instruments are listed here below:
Mass Spectrometer: The time-of-flight MS consists of four units: the MS itself, a tuneable laser spectrometer, a gas separation and enrichment system, and the reference gas system.
Nephelometer: The instrument would passively sample cloud and haze particles, illuminate them, and measure the flux and degree of polarization of the scattered light. The TRL for light-weight designs (1kg, <3W) is TBD. The instrument contains two modules: LOAC (Light Optical Aerosol Counter) to measure the size distribution of particles, and PAVO (Polarimetric Aerosol Versatile Observatory) to measure particle shape and composition. It was flown on balloons in Europe (LOAC-S instrument). If LOAC only is considered, the mass can be reduced to <1 kg.

Ice Giants CDF Study Report: CDF-187(C)
January 2019 page 87 of 431
ESA UNCLASSIFIED – Releasable to the Public
6.1.6 Technology Needs
No new technologies were identified for the baseline Model Payload (Table 6-3).
6.2 Orbiter
6.2.1 Requirements and Design Drivers
The Neptune Orbiter Model Payload is based on the science objectives and measurements described in the Science Traceability Matrix (STM) for Neptune, as defined by the Study Science Team (SST).
The Model Payload was put together to size the spacecraft resources and to allow for accommodation checks. These instruments are a representation of a possible future payload, but are not meant to be understood as a pre-selection of instruments for a potential future mission.
Currently only the data volume produced by the science instruments was identified to impact the Mission/System requirements. The SST has established preliminary observation time-lines [see Table 5-18] for different parts of the science observations that support the determination of the communications system.
Several instruments are nadir pointing (similar pointing accuracy requirements as for the JUICE mission were provided) and no EMC requirements have been established at the time of the study. The payload accommodation and access of the instruments to their measurement environment needed to be considered for the baseline design.
6.2.2 Assumptions and Trade-Offs
Assumptions
1 Power for science operation shall be provided by (e)MMRTGs (see 0).
6.2.3 Baseline Design
The list of Model Payload instruments is given in Table 6-5. It shows the instruments’ mass, power and data rate as well as the volume envelope. Note that the mass values already include 20% equipment margin. The Notes/Heritage column contains information on precursor instruments.
Instrument Mass
[kg] Power
[W] Data rate
[kb/s]
Volume envelope
[mm]
Notes/Heritage
Camera 19.20 34.80 550.00 660×490×300 Simplified JUICE/JANUS design; Narrow-angle framing camera, 13 filters (TBC), spectral range 350-1050 nm
Imaging Spectrometer
18.60 25.20 2870.00 500×550×250 Simplified, single-channel JUICE/MAJIS design; spectral range 0.4-2.5 microns
Ion and Neutral Mass Spectrometer
43.20 21.24 1.30 260×260×170
630×630×260
Rosetta/ROSINA design; two mass spectrometers (DFMS, RTOF), one pressure sensor

Ice Giants CDF Study Report: CDF-187(C)
January 2019 page 88 of 431
ESA UNCLASSIFIED – Releasable to the Public
Instrument Mass [kg]
Power [W]
Data rate
[kb/s]
Volume envelope
[mm]
Notes/Heritage
(3 parts: COPS, DFMS, RTOF)
380×1140×240 (COPS).
Similar to Cassini/INMS
Magnetometer 5.47 12.00 1.20 10000 (boom length)
e-box: 300×200×200 fluxgate sensor:
110×110×120 (each)
Fluxgates sensors mounted on boom; JUICE/J-MAG design
Microwave radiometer
23.21 67.14 5.23 550×392×451 Based on JUICE/SWI; Wavelength range: 1.37-50cm (=600 MHz-22 GHz); for deep atmosphere
Radio Science: - USO (Ultra-Stable Oscillator)
- X/Ka-band Transponder
2.40
4.13
6.00
39.84
0.00 172×154×118
236×208×150
Radio science package: X/Ka-band transponder + Ultra-stable oscillator for the gravity science and radio occultations, both at the Ice Giant and the satellites.
BepiColombo/MORE and JUICE/3GM heritage.
Table 6-5: Model Payload for the Neptune Orbiter
The total mass of this Model Payload amounts to 116.2kg, including 20% maturity margin. The average power consumption of this payload is ~248W (no margin included).
In Section 6.2.3.1 more details on the assumed masses and the derived data rates of the Model payload instruments are given. In addition, modifications proposed with respect to the existing/heritage instruments used to derive the Model Payload for this study are listed.
6.2.3.1 Payload Components
Camera: A single, uncompressed acquisition is 46 Mbit and the conservative compression factor is 3-3.5. A realistic compression factor could be of 7 (BepiColombo-SIMBIO-SYS currently adopted compression factor for HRIC) but values up to 28 are possible with higher image degradation.
Imaging Spectrometer: A single, uncompressed acquisition is 8.6 Mbit and the expected compression factor is 3. The JUICE-MAJIS data rate was halved for this instrument, as only a single channel is use for this light version. This amounts to 2870kb/s. The power for this simplified design is the JUICE-MAJIS power need, but scaled down by 25%.
Ion and Neutral Mass Spectrometer: The mass of 36 kg and power of 42W comprises all three instrument elements together. The data rate of 1.3 kb/s is based on "nucleus mapping" of the Rosetta-ROSINA instrument and 25 b/s is allocated for house-keeping.

Ice Giants CDF Study Report: CDF-187(C)
January 2019 page 89 of 431
ESA UNCLASSIFIED – Releasable to the Public
Magnetometer: The mass for the magnetometer is based on JUICE-J-MAG, but lowered by 7% to compensate for the radiation shielding that was added to J-MAG. The boom length is also based on JUICE-J-MAG. The EMC requirements discussion is pending, as this depends on the S/C EMC environment. The data rate is taken from the J-MAG normal mode of 2.41kb/s and it is already compressed. Also, 16 vectors/s could be used for the Ice Giants mission instead of 32, which halves the data rate to 1.2 kb/s. The electronics box is mounted on the service module of the S/C, two fluxgate sensors are mounted on a boom (one of the sensors at the end of the boom), each is sensor connected to the box by a harness. The electronics box volume is 300×200×200 mm, and each fluxgate sensor has a volume of 110×110×120 mm. The boom length is 10000 mm.
Microwave radiometer: Note that the warm-up power for this instrument is 24.46W for 60 min. The dimensions are in detail 550×392×451 mm for the Telescope and Receiver Unit and 489×489×40 mm for the Radiator.
Radio Science: This instrument package contains a X/Ka-band transponder and Ultra-Stable Oscillator for the gravity science and radio occultations, both at the giant planet and the satellites. Note that this X/Ka-band transponder is in addition to the platform communications Ka-band transponder. The produced data rates are limited and the radio science measurements plus housekeeping telemetry is estimated to be in total ~10% of the data volume of the other instruments. The transponder needs warm-up power of 35.7W for 5 min.
6.2.4 List of Equipment
See Table 6-5.
6.2.5 Options
No Options were studied.
6.2.6 Technology Needs
No new technologies were identified for the baseline Model Payload (Table 6-5).

Ice Giants CDF Study Report: CDF-187(C)
January 2019 page 90 of 431
ESA UNCLASSIFIED – Releasable to the Public
This Page Intentionally Blank

Ice Giants CDF Study Report: CDF-187(C)
January 2019 page 91 of 431
ESA UNCLASSIFIED – Releasable to the Public
7 NEPTUNE CONFIGURATION
7.1 Atmospheric Probe
7.1.1 Requirements and Design Drivers
SubSystem Requirements
Req. ID Statement Parent ID
CONF-010 Keep same baseline design as PEP-V (SUN) probe
CONF -020 Assign new mass and volume for varied equipment
CONF -030 Scale the descent module with 10 [cm] in diameter
CONF -040 Keep pressure vessel dimensions intact
7.1.2 Assumptions and Trade-Offs
For the probe configuration, the same baseline design was kept as depicted in previous CDF studies, the PEP-V probe, mission to Venus, and the PEP-SUN probe, mission to Saturn, Uranus and Neptune, both conducted in the CDF during the summer of 2010 RD[7]. Thus, the configuration was adapted for this new mission, the M* Ice Giants Study, mission to Uranus and Neptune.
The probe design consists of a descent module, which is a spherical pressurised vessel accommodating the payload and equipment, and a deceleration module made out of two parts, a front and a back shield. These shields have the same objective, to protect the pressure vessel from the extreme heat loads during its decent.
As mentioned above, one of the major requirement of the probe configuration was to keep the same baseline design of the PEP-V probe, driven by aerodynamic constraints, but to enlarge the deceleration module diameter from the base diameter of PEP-V design of 1250 [mm] to a new diameter of 1350 [mm]. The descent module should remain unchanged, dimension wise, accommodating all the subsystem units.
By scaling the front and back shield of the probe, the TPS design was consequently altered. The EDS subsystem was modified as well, and a new, bigger volume was needed to be allocated below the back shield.
7.1.3 Baseline Design
Based on PEP-V design, the internal accommodation in the decent module pressure vessel was retained, except the following:
Batteries size and redistribution
New solid state power amplifiers (SSPA) and new patch antenna design
Data handling components changed
Reshuffling of the components inside the descent module.
The location of the helix antenna, that supports the data link with the orbiter, was lowered as much as the available volume permitted, to make space for the new EDS design. The new available envelope dedicated for the EDS subsystem is of 0.05 [m3].

Ice Giants CDF Study Report: CDF-187(C)
January 2019 page 92 of 431
ESA UNCLASSIFIED – Releasable to the Public
As needed, the deceleration module was lengthened with 10 [cm] and the new TPS thickness were applied calculated by the thermal subsystem experts (Figure 7-8; BS employs the same design outline). Under these circumstances, with a FS-BS thicker, the location of the pressure vessel needed to be raised as well.
7.1.4 Overall Dimensions
The final design’s overall dimensions of the M* Ice Giants Study probe are shown in the figures below (Figure 7-3 & Figure 7-7 ), and the internal accommodation of the units for the aft and forward compartments are shown in Figure 7-4 and Figure 7-5 respectively.
The CoG of the entry probe given by CATIA is listed below (Table 7-1) and calculated from the nose area.
COG
Gx 2.208 [mm]
Gy -1.018 [mm] Gz 500.698 [mm]
Table 7-1: CATIA output for M* Ice Giants Study for probe
For more detailed information about the probe configuration, please refer to the document describing the PEP-V probe configuration RD[7].
Figure 7-1: M* Giants Study probe configuration

Ice Giants CDF Study Report: CDF-187(C)
January 2019 page 93 of 431
ESA UNCLASSIFIED – Releasable to the Public
Figure 7-2: M* Giants Study probe config –view descent module
Figure 7-3: M* Giants Study probe config –overall dim.

Ice Giants CDF Study Report: CDF-187(C)
January 2019 page 94 of 431
ESA UNCLASSIFIED – Releasable to the Public
Figure 7-4: Descent module – accommodation top platform
Figure 7-5: Descent module – accommodation bottom platform

Ice Giants CDF Study Report: CDF-187(C)
January 2019 page 95 of 431
ESA UNCLASSIFIED – Releasable to the Public
Figure 7-6: Descent module
Figure 7-7: Descent module –overall dimensions

Ice Giants CDF Study Report: CDF-187(C)
January 2019 page 96 of 431
ESA UNCLASSIFIED – Releasable to the Public
Figure 7-8: Front Shield –TPS design
7.2 Orbiter
7.2.1 Requirements and Design Drivers
The spacecraft shall provide accommodation for all the sub-systems and ensure the required pointing, if any mentioned.
7.2.2 Assumptions and Trade-Offs
Assumptions
1 Mass implemented in CATIA with a 20% system margin on top of the 20% at product level
2 If no physical representation of the component/part is available, mass gets redistributed accordingly, to its own sub-system, or uniformly to the overall mass of the spacecraft
7.2.3 Baseline Design
The configuration was driven largely by the propulsion subsystem, which provides the necessary thrust and manoeuvres for such a long duration mission. Four bi-propellant tanks main engine were selected from the E3000 tank family along with three helium, pressurizing tanks. These were positioned as much as possible around the centre tube of the orbiter configuration.
In addition to the centre tube used for reinforcement, shear panels were added for accommodating the instruments, bottom and top panels, and of course, panels that enclose the overall configuration.

Ice Giants CDF Study Report: CDF-187(C)
January 2019 page 97 of 431
ESA UNCLASSIFIED – Releasable to the Public
In order to isolate the instrumentation, a dedicated panel was reserved on which an optical bench will be mounted with standoff on the outside panel of the spacecraft.
Thus, the optical bench will be isolated from the orbiter and located near the upper end of the spacecraft. Along with the orbiter’s payload, the two NavCams were also positioned on this optical bench,, as they are required to point in the same direction as the camera. The standard radiator was placed under the optical bench to facilitate the heat exchanged in the hot case from the payload instruments, and a louvered radiator in close proximity for the same reason.
Other major equipment were the three enhanced Multi-Mission Radioisotope Generators (eMMRGT), which were placed near the bottom end, on the outside of the spacecraft, and in their close proximity, the excess power radiator.
Furthermore, the four space large-format Li-Ion batteries of 44 kg each were placed as well internally at the bottom of the spacecraft. The comms high gain antenna, of 3[m] in diameter was fixed on the top deck of the spacecraft (configuration during launch) and the 10 [m] unfolded boom, with the magnetometer at the far end, was positioned on one side of the spacecraft.
For the AOCS subsystem, the four reaction wheels were placed as close as possible to the centre tube and the star trackers were positioned 180 degrees opposite to the optical bench, as required. S10-18 thrusters will provide the attitude control of the orbiter and desaturation of the reaction wheels as depicted by the propulsion subsystem. These do not have a physical representation in the current configuration.
All other subsystems, from power, data handling, communication components, sensors and gyros of the GNC subsystem, were as much as possible grouped together on the shear panels, in order to facilitate the need of having an extra structure protecting them from the radiation environment.
The orbiter configuration can be seen in Figure 7-9 and the (internal) configuration of the subsystems and units labelling is shown in Figure 7-10 and Figure 7-11.
Figure 7-9: Orbiter configuration

Ice Giants CDF Study Report: CDF-187(C)
January 2019 page 98 of 431
ESA UNCLASSIFIED – Releasable to the Public
Figure 7-10: Orbiter equipment labelled
Figure 7-11: Orbiter internal equipment labelled

Ice Giants CDF Study Report: CDF-187(C)
January 2019 page 99 of 431
ESA UNCLASSIFIED – Releasable to the Public
7.2.4 Overall Dimensions
Overall dimensions of the M* Giants Study orbiter to Neptune can be visualised in Figure 7-12.
The total dry mass of the Neptune orbiter is 1603.4 kg and the position of the centre of gravity, as output by CATIA, is shown in Table 7-2.
COG
Gx -5.796 [mm]
Gy 9.606 [mm] Gz 1074.793 [mm]
Table 7-2: CATIA output for M* Ice Giants Study for orbiter
Figure 7-12: Orbiter –overall dimensions

Ice Giants CDF Study Report: CDF-187(C)
January 2019 page 100 of 431
ESA UNCLASSIFIED – Releasable to the Public
This Page Intentionally Blank

Ice Giants CDF Study Report: CDF-187(C)
January 2019 page 101 of 431
ESA UNCLASSIFIED – Releasable to the Public
8 NEPTUNE STRUCTURES
8.1 Atmospheric Probe
8.1.1 Requirements and Design Drivers
The heritage of the Probe mechanical design is sourced in the design concept of the Planetary Entry Probe for Venus, (PEP-V), assumed to be a baseline for outer Solar Entry Planetary Probes for Saturn, Uranus and Neptune missions, RD[7]. The reason for this assumption is in the fact that PEP-V represented the worst case environmental conditions (atmospheric pressure) hence enveloping all above mentioned mission environmental requirements. Whilst there were some configuration changes, such as; a variation in the TPS thickness applied, number of parachutes used (Venus required a drogue and main chute, whereas Saturn, PEP-Neptune and Uranus required only a drogue chute); the structural requirements and loads were assumed to remain unchanged. For the Ice Giants study, the approach was to take the PEP structural design as reference and adapt it in accordance to the current pressure requirements (10 bar).
SubSystem Requirements
Req. ID Statement Parent ID
STR-20
The Neptune probe shall accommodate and operate the scientific P/L, avionics and power subsystems in a descent module compatible with atmospheric conditions to an altitude corresponding to at least 10bar
STR-25
In design of the Neptune probe the following mass margins shall be used:
Conventional maturity margins for all subsystems, between 5 and 20%, depending on the maturity level agreed with Agency
A system margin of 20% on top of all equipment, except for the TPS material (back and front). The heat shield mass will be computed using aerothermodynamics data, including their margins and based on the NEP mass including margins (and heat shield mass) as defined above
A 50% maturity margin shall be added to the mass of the heat shield material computed as specified above if the current TRL is lower than 5
STR-30 Max. deceleration shall not exceed 50 g’s
STR-35 Max. front shield, (FS) pressure shall not exceed 10.2 bar, resulting in the load of 140 kN
From the list of requirements, the following requirements are identified as design drivers and will be followed by the detailed design assessment presented in this report.
Descent Pressure – driving descent module, (DM) wall thickness and hence mass. It will be investigated how the atmospheric pressure affects the design of the DM shell thickness. The assessment presented here follows analytical approach to

Ice Giants CDF Study Report: CDF-187(C)
January 2019 page 102 of 431
ESA UNCLASSIFIED – Releasable to the Public
determine DM minimal shell thickness able to sustain external pressure, as explained in RD[12]
Entry Decceleration – driving front shield pressure and hence loading on Front shield and loads at front shield/Descent Module (DM) interface.
8.1.2 Assumptions and Trade-Offs
Assumptions
1 For simplicity. A perfect spherical shape of the descent module (DM) shell is assumed, without any cutouts and/or reinforcements. DM pressure shell material is Titanium, with diameter of 650mm.
2 Design of the FS cold structure is based on the Al honeycomb core, with CFRP skin. The core shall support inserts that will transmit more than 10kN in shear.
3 The alternative is to have a monolithic structure, either metallic, CFRP or potentially modification of the C/SiC of the TPS, able to sustain greater loads.
4 No FEA has been conducted in this Study, however it is essential for future work in order to assess structural strength around interfacing structures/ports/inlets and hence better mass estimation.
8.1.3 Baseline Design
The Neptune probe structural design is based on the Venus PEP design. Internal accommodation of the DM spherical pressure vessel was assumed the same as the one used for the Venus case. The primary structure of the Probe contains two elements: Front and Rear Shields, which are forming aerodynamic element to ensure initial entry and descent, and DM shell, which accommodates instruments and payloads and essentially is defined as a pressure vessel. In addition to these, there are also secondary structural elements such as:
Payload mounting platform that is situated equatorially in the Descent module and has a diameter of 630mm. Payload mounting platform is a standard CFRP/Aluminium core sandwich panel, 20mm thick with 0.6mm CFRP skin. All equipment and payload are mounted on both sides of this panel, which in turn is mounted to the DM connection ring.
Front shield interface brackets, which interface the Front shield with the separation system connected to the DM connection ring
Back Shield to DM interface bracket, connecting the back shield separation system to the DM
Back Shield ribs, these act as supports for the mortar on the back shield
DM main parachute support structure provides support to the mortar and parachute for the Descent Module
Miscellaneous structural items are inserted to cover items not detailed in the current design.
The assumptions given in section 8.1.2 and corresponding configuration assessment of the instruments and payload mounted on the DM platform as done in the course of Study foresees following parameters for the DM shell:

Ice Giants CDF Study Report: CDF-187(C)
January 2019 page 103 of 431
ESA UNCLASSIFIED – Releasable to the Public
Material to be used: Titanium
Diameter of the DM pressure shell: 650mm
Max. external pressure: 10bar.
Based on the input data above, the shell thickness has been determined, based on the inversion of the following expression defined in RD[12]:
22
2'
13
2
r
tEq Equation 1
Where
22
2'
13
2
r
tEq Equation 1 can be simplified as follows:
r
tEq
2
2' 365.0 Equation 2
The r
tEq
2
2' 365.0 Equation 2 uses knock down factor for material anomalies in
the range between 0.365 and 0.840 in ideal case. In the course of PEP-V study, it was agreed to consider value of 0.5 as a realistic one and to allow some mass savings. The
same value has been assumed for the Ice Giants study. Re-writing r
tEq
2
2' 365.0
Equation 2 to obtain thickness as a function of pressure q’, geometry (radii r) and material moduli of elasticity, E, yields to:
E
qrt
5.0
'2
Equation 3
Applying simultaneously qualification factor of 2 and buckling factor of 1.25 on the pressure load, considering radii of DM shell to be 325mm and E=114000 N/mm2 for Titanium: finally, shell thickness of: 2.2mm is obtained. Considering DM shell surface area and calculated thickness for the Titanium material, the mass of the shell is calculated to be 12.0kg.
8.1.4 List of Equipment
Based on the current configuration of the Probe and considering similar technological advances and material characteristics of the main structural parts identified in Sec.8.1.3, the following mass budget as presented in Table 8-1 is obtained.

Ice Giants CDF Study Report: CDF-187(C)
January 2019 page 104 of 431
ESA UNCLASSIFIED – Releasable to the Public
Table 8-1: Probe list of equipment and mass budget breakdown
8.1.5 Options
Currently no further design options for the Probe have been investigated in the course of this study. However, in the course of further development of the Probe mechanical design it is important to emphasise the importance of detailed structural analyses of the front shield interfacing structure in order to optimise mass by reducing density of the front shield core by introducing larger number of inserts. For this purpose detailed FEM of the front shield and interfacing structures would be necessary in the next stage of this study.
8.1.6 Technology Needs
No new technologies are identified at this stage of the study.
8.2 Orbiter
The structures subsystem mechanical concept is conceived throughout configuration assessment in order to provide efficient support and accommodation to the major load contributors, e.g. propulsion subsystem, based on the bi-propellant concept of four E3000 tank family, together with three pressurant tanks (He), as well as providing support and accommodation for other spacecraft subsystems: payload, power, communications, thermal, AOCS, etc. The launch concept follows NASA dual stack configuration above SEP, as discussed in the RD[1] and further assessed in the course of ESA CDF study.
8.2.1 Requirements and Design Drivers
The assessment of the mechanical design drivers follows the logic of the mission launch scenario based on the SLS as selected launch vehicle and launcher’s environment predictions given in RD[13], which shall be used in payload structural design. These predictions assume dynamic excitations, occurring predominantly during lift-off and

Ice Giants CDF Study Report: CDF-187(C)
January 2019 page 105 of 431
ESA UNCLASSIFIED – Releasable to the Public
transonic periods of SLS flight and are superimposed to the steady-state accelerations to produce combined accelerations (expressed in g’s) in the Table 8-2.
Table 8-2: Quasi-static Loads for SLS Flight Conditions
Furthermore, in the course of Study the following structural requirements have been used as design drivers (mass and stiffness driven design) for the mechanical concept of the Orbiter:
SubSystem Requirements
Req. ID Statement Parent ID
STR-010 The overall mass budget for the s/c structures subsystem shall not be higher than 300kg (TBC), including design maturity margin of 20%
STR-020
Cantilevered payload fundamental mode frequencies are assumed to be min. of 8Hz lateral and 15Hz axial to ensure applicability of the design load factors for the QSL as mentioned in Table 8-2
8.2.2 Assumptions and Trade-Offs
The launch scenario foresees usage of SLS 8.4m long P/L fairing, under which two spacecraft in stacked configuration shall be mounted on the NASA SEP module. The assumptions and trade-offs conducted in the course of study are summarised in the following table:

Ice Giants CDF Study Report: CDF-187(C)
January 2019 page 106 of 431
ESA UNCLASSIFIED – Releasable to the Public
Table 8-3 Launch Configuration Trade-offs
The outcome of the above conducted trade-offs resulted in two orbiter spacecraft stacked in the LV axis direction above SEP module as a most suitable configuration, based on the previous missions designing experience, (e.g. Bepicolombo). Such configuration ensures potential for the orbiters structures mass reduction as a design driver, however at the same time puts some challenges in design of the SEP supporting structures and stack I/F points. The accommodation of the stack configuration under 8.4m long payload fairing is shown in Figure 8-1.
Figure 8-1: Stacked Orbiters accommodation under 8.4m PLF

Ice Giants CDF Study Report: CDF-187(C)
January 2019 page 107 of 431
ESA UNCLASSIFIED – Releasable to the Public
Based on the transfer-to-Neptune mission scenario and corresponding limitations to the bi-propellant based propulsion of Orbiters with assumed capacity of the E3000 tanks volume, the following design assumptions have been taken:
Assumptions
1 Assumption 1: overall structures subsystem mass for both orbiters shall not exceed 600kg (TBC), including mass of stack I/Fs and supporting structures for the high gain antenna and 10m long magnetometer boom
2 The general shape of stack is based on the cylindrical bus, with shear and side assembly panels, top and bottom floors for accommodation of the s/c subsystems, payload and equipment.
8.2.3 Baseline Design
Based on the above-defined assumptions, design drivers, and Neptune Orbiter configuration assessment, the following s/c structure is shown in Figure 8-2 below:
Figure 8-2: Neptune Orbiter structures subsystem
Transparent view of the side assembly panels in the figure above shows four core structures of shear panels around tubular support, (CFRP filament-based cylinder). All panels are sandwich panels of 20mm Al-honeycomb, with 0.6mm CFRP skin. The tubular element accommodates pressurant tank and provides propellant tank supporting trusses interfaced together with shear panels thus ensuring transfer of the major mass inertia loads via stack interfaces to SEP module mounted on the LV adapter.

Ice Giants CDF Study Report: CDF-187(C)
January 2019 page 108 of 431
ESA UNCLASSIFIED – Releasable to the Public
8.2.4 List of Equipment
The list of structural subsystem parts/equipment is extracted from OCDT and shown in Table 8-4:
Table 8-4: Orbiter structures subsystem mass breakdown
The mass breakdown for the primary and secondary structural elements includes system maturity margin adopted in this study of 20% and shows slightly increased total mass above requirement STR-010 but still within acceptable tolerance, with regards to required propellant mass and delta V characteristics.
8.2.5 Options
It has been clearly stated in the course of the study that stiffness verification of such complex stack configuration of three modules (two orbiters and SEP module) would require detailed FEM analysis, which overcomes scope of work in this study and accessibility to the necessary information about SEP at this project phase. However, such analysis is required to assess stiffness characteristic of the proposed configuration against the requirement STR-020 in order to justify design limit load factors adopted for SLS. Demonstration of the stiffness compliance in this case is also necessary in order to ensure proper dimensioning of the primary structural elements, as well as interfacing structures to the major system masses in the next project phase.
8.2.6 Technology Needs
No new technologies are identified at this stage of the study.

Ice Giants CDF Study Report: CDF-187(C)
January 2019 page 109 of 431
ESA UNCLASSIFIED – Releasable to the Public
9 NEPTUNE MECHANISMS
9.1 Atmospheric Probe
9.1.1 Requirements and Design Drivers
The following tasks have to be covered by mechanisms in the probe.
Separation from the spacecraft and stabilisation via spin. This task is covered by a spin and eject mechanism. A separation speed of 0.4m/s and a lateral speed lower than 2.5cm/s are required. A spin of 2-3rpm is considered for now, similar to previous missions (i.e. ExoMars). Connection to the spacecraft is done at 3 points, thus synchronised actuation of the three release mechanisms is required.
Front shield separation. The front shield is separated from the rest of the probe when no longer needed. The shield is connected to the rest of the probe in three points, which have to be actuated simultaneously.
Back cover separation. The back cover is separated when needed by three simultaneous release separation mechanisms. The back cover is attached to the descent module in three points to be released simultaneously.
Cut cable line connecting to mortar-released pilot parachute. A cable cutter has to be included in the design to cut the connection to the mortar-deployed pilot parachute.
9.1.2 Assumptions and Trade-Offs
The previous CDF Study PEP (Planetary Entry Probe), as well as the design of the Huygens probe, are taken as reference.
The mechanisms related to parachute deployment and parachute swivel are covered by the parachute discipline.
9.1.2.1 Trade-off for release actuators
The mechanisms hold the separating parts together until the time of separation. This separation is initiated by release actuators. Several possible technologies have been considered for release actuators: pyrotechnic actuators, non-explosive actuators (NEA), shape memory alloy based actuators.
NEAs and shape memory alloy actuators provide a lower shock at release; however, their actuation time (time since the release command is given until release is effective) is longer and less predictable, whereas for pyrotechnic actuators the release is virtually immediate. Synchronised release is required for this mission, as all the connection points between mating parts have to be separated at the same time. Consequently, the pyrotechnic actuators have to be used for this mission.

Ice Giants CDF Study Report: CDF-187(C)
January 2019 page 110 of 431
ESA UNCLASSIFIED – Releasable to the Public
9.1.3 Baseline Design
9.1.3.1 Spin and eject mechanism (SEM)
This mechanism is responsible for separation between the probe and the spacecraft. Connection between the probe and spacecraft is done at three nodes, spaced 120 degrees.
Figure 9-1: Location of mechanism nodes (red) on the probe (right) and corresponding apertures in the back shell, for the spacecraft-probe connecting
rods (left)
The design of the mechanisms is based on the Huygens probe, of very similar configuration and mass properties.
Figure 9-2: Spin and Eject Mechanism (1 out of the 3)

Ice Giants CDF Study Report: CDF-187(C)
January 2019 page 111 of 431
ESA UNCLASSIFIED – Releasable to the Public
The part of the mechanisms attached to the probe is pushed by springs, and it follows the trajectory given by a helix-shaped guide. This provides the desired ratio between translation and rotation speed. Bearings are used to provide a smooth separation and to reduce risk of cold welding during transit.
Pyrotechnic release actuators initiate the separation of the probe in a synchronised manner. Separable connectors are considered as the baseline for the electrical connection with the spacecraft.
9.1.3.2 Front Shield separation mechanism (FSSM)
The Front Shield separation mechanism is also taken from the Huygens and PEP designs. Front shield and probe are connected at three equally spaced points. The location of these nodes is coincident with the Spin and Eject mechanism and the back cover separation mechanism. Pyrotechnic actuators are used to achieve a synchronised deployment and springs push the separating parts.
9.1.3.3 Back Shell separation mechanism (BSSM)
The Back Cover separation mechanism is also based on the Huygens and PEP designs. Back cover and probe are connected at the same nodes where the other mechanisms are located. Figure 9-3 shows the Front Shield and Back Cover separation mechanisms. Pyrotechnic actuators are used to achieve a synchronised deployment and springs push the separating parts away.
Figure 9-3: FSSM and BSSM (1 out of the 3 nodes) (RD[14])
9.1.3.4 Cable cutter for mortar-deployed pilot parachute
A cable cutter is also included, to cut the cable connection with the mortar-deployed pilot parachute.

Ice Giants CDF Study Report: CDF-187(C)
January 2019 page 112 of 431
ESA UNCLASSIFIED – Releasable to the Public
9.1.3.5 Pyrotechnic actuators
Three pyrotechnic actuators are used per separation mechanism, one on each node. Two redundant European Standard Initiators are included in each pyro. This constitutes an internal cold redundancy concept (k=1 out of 2) at pyro actuator level.
Figure 9-4: Example of pyrotechnic actuators with 2 initiators
9.1.4 List of Equipment
In the computer model supporting this study, each mechanism is modelled as two different elements, corresponding to each of the separating parts for each mechanism.
9.1.4.1 Mass budget
Table 9-1 shows the mass budget coming from the mechanisms.
Mass budget
Mechanism Mass [kg] Mass margin [%]
Mass with margin
SEM_SC 11.8 10 13
SEM_probe 2.4 10 2.6
FSSM_P 2.4 10 2.6
FSSM_DM 1.4 10 1.5
BSSM_P 0.9 10 1
BSSM_DM 1.4 10 1.5
Cable cutter 0.3 20 0.4
Table 9-1: Neptune Probe mechanisms mass budget
SEM_SC refers to the part of the mechanism that remains on the spacecraft, SEM_probe to the one on the probe. The suffix _P refers on mechanisms on the probe that do not stay on the final descent module. The suffix _D refers to the part of the mechanism staying on the descent module.
9.1.4.2 Power budget
The only power consuming elements are the pyrotechnic actuators.
Each pyro has a redundant firing circuit (cold internal redundancy k=1, n=2), power consumption of each one is:

Ice Giants CDF Study Report: CDF-187(C)
January 2019 page 113 of 431
ESA UNCLASSIFIED – Releasable to the Public
E=0.15J
t=10ms max peak duration
P=E/t=15W average power
I=5A current
(Firing of 3 pyros should be included in the NASA spacecraft power budget for probe separation).
There are three pyros on each separation mechanism, plus one for the cable cutter for the parachute, totalling 10 pyros to be fired.
9.2 Orbiter
9.2.1 Requirements and Design Drivers
Deploy the magnetometer to a distance of 10m away from the spacecraft to achieve enough magnetic cleanliness at the magnetometer location, while providing enough stiffness. Distance to be deployed as well as stiffness required are to be detailed in later stages.
9.2.2 Assumptions and Trade-Offs
A deployable boom is required to separate the magnetometer from the spacecraft. This is the only mechanism identified for the orbiter itself, in addition to separation from the Solar Electric Propulsion (SEP) stage.
9.2.2.1 Trade off for the deployable boom
Several different concepts are available and proven for deployable booms, each with its advantages and disadvantages.
Coilable: Long length achievable, but lower stiffness and position accuracy. Besides, there is little European heritage and expertise regarding this type of boom.
Figure 9-5: coilable boom
(https://ttt.astro.su.se/groups/head/cost14/talks/Kallman.pdf)
Rigid articulated: high stiffness, heritage existing for the required length (10m), but higher mass and accommodation space required.

Ice Giants CDF Study Report: CDF-187(C)
January 2019 page 114 of 431
ESA UNCLASSIFIED – Releasable to the Public
Figure 9-6: articulated boom
(www.aerospace.sener)
Collapsible: Low mass, but lower stiffness and risk of buckling for such a long boom.
Figure 9-7: Collapsible boom (RD[16])
The choice for one technology is driven by the following criteria:
Risk is to be minimised, prioritising solutions with well-proven heritage and reliable design.
Mass is to be low enough not to become a driver of the mission, but will not be given priority above reliability.
Coupling with other disciplines is also considered. The solution has to be chosen in such a way that it minimises the risk of causing huge impacts in other disciplines in case the boom design has to be changed.
9.2.3 Baseline Design
The baseline design selected is an articulated rigid boom, based on the JUICE magnetometer boom. This boom is made of three CFRP tubes connected by rotary joints. The deployment is spring actuated. Three hold down and release mechanisms hold the boom in stowed configuration until deployment.

Ice Giants CDF Study Report: CDF-187(C)
January 2019 page 115 of 431
ESA UNCLASSIFIED – Releasable to the Public
Figure 9-8: JUICE mag-boom
www.aerospace.sener
Due to the proposed orbiter being smaller than JUICE, the boom has to be folded in 4 segments instead of 3. Nonetheless, the JUICE technology can be adapted to this design with no major changes.
Figure 9-9: Boom accommodation in spacecraft
In later stages, once the requirements for the magnetometer are mature (distance to be deployed and positioning accuracy required), it is recommended to review the selection of boom technology, as other alternatives may prove more convenient. Coilable booms have been successfully used in several missions, and provide a much lighter solution in case a lower stiffness is acceptable.
9.2.4 List of Equipment
Mechanisms for the orbiter only include the magnetometer boom and the separation mechanisms from the SEP stage (only the portion of the mechanisms that remains on the spacecraft after separation). The following table shows the mass budget for the mechanisms.

Ice Giants CDF Study Report: CDF-187(C)
January 2019 page 116 of 431
ESA UNCLASSIFIED – Releasable to the Public
Mass budget
Mechanism Mass [kg] Mass margin [%] Mass with margin
Magnetometer boom 30 10 33
SEP separation mechanisms
5 20 6
Table 9-2: Neptune Orbiter mechanisms mass budget

Ice Giants CDF Study Report: CDF-187(C)
January 2019 page 117 of 431
ESA UNCLASSIFIED – Releasable to the Public
10 NEPTUNE PROPULSION
10.1 Orbiter
10.1.1 Requirements and Design Drivers
The requirements for the propulsion system are derived from the main requirements for the delta v and the mission and the ground operations.
SubSystem Requirements
Req. ID Statement Parent ID
PROP-010 Propulsion system provides necessary thrust and delta v for the mission manoeuvres
PROP -020 Propulsion system provides torques to compensate the main thruster misalignments and for all other AOCS manoeuvres
PROP -030 Propulsion system has at least three barriers for safety reasons on ground
PROP -040 Propulsion system includes the measurement of the pressures within the subsystem at mandatory locations
PROP -050 Propulsion system provides means to isolate potential mechanical pressure regulator leakage through the mission
PROP -060 Propulsion system provides means to isolate the main engine in case of major leakage
PROP -070 Propulsion system incorporates per branch a serial redundant pressure regulator
PROP -080 Propulsion system includes Fill and drain valves for filling and testing of the propulsion system on ground
10.1.2 Assumptions and Trade-Offs
The following table includes the assumptions used during the mission scenario.
Assumptions
1 Gravity losses are linearly interpolated for the Apoposeidon radius [RN] of 275km, assumed to be representative for all mission cases. Additionally, a margin of 5% was taken for the delta v demands of the gravity losses.
2 The AOCS mass was modelled by using 5% of the total propellant mass used during the mission for the delta v manoeuvres. This propellant mass is split into 3% after the main Neptune Orbit insertion manoeuvre and 2 % after the mission.
3 For the bipropellant system, a mixture ratio of 1.65 was assumed. The dual mode systems used a mixture ratio of 1.43
4 No redundancy need for the main engine was assumed. It was furthermore assumed that the main engine can be accommodated in such a way to minimise the propellant need for any misalignment or centre of mass shift.
5 The thrust and the specific impulse of the engine was modelled by using the parametric model provided by the supplier.
6 The pressure set point in the tanks and the orifice of the main engine corresponds
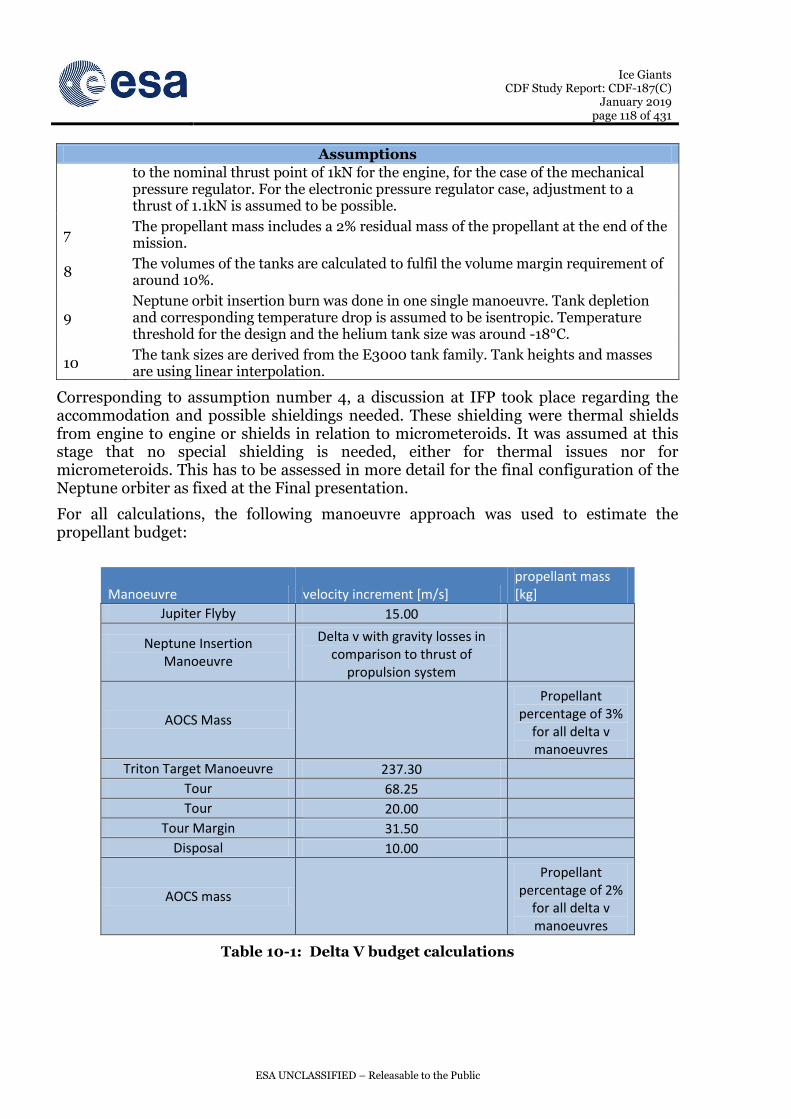
Ice Giants CDF Study Report: CDF-187(C)
January 2019 page 118 of 431
ESA UNCLASSIFIED – Releasable to the Public
Assumptions
to the nominal thrust point of 1kN for the engine, for the case of the mechanical pressure regulator. For the electronic pressure regulator case, adjustment to a thrust of 1.1kN is assumed to be possible.
7 The propellant mass includes a 2% residual mass of the propellant at the end of the mission.
8 The volumes of the tanks are calculated to fulfil the volume margin requirement of around 10%.
9 Neptune orbit insertion burn was done in one single manoeuvre. Tank depletion and corresponding temperature drop is assumed to be isentropic. Temperature threshold for the design and the helium tank size was around -18°C.
10 The tank sizes are derived from the E3000 tank family. Tank heights and masses are using linear interpolation.
Corresponding to assumption number 4, a discussion at IFP took place regarding the accommodation and possible shieldings needed. These shielding were thermal shields from engine to engine or shields in relation to micrometeroids. It was assumed at this stage that no special shielding is needed, either for thermal issues nor for micrometeroids. This has to be assessed in more detail for the final configuration of the Neptune orbiter as fixed at the Final presentation.
For all calculations, the following manoeuvre approach was used to estimate the propellant budget:
Manoeuvre velocity increment [m/s] propellant mass [kg]
Jupiter Flyby 15.00
Neptune Insertion Manoeuvre
Delta v with gravity losses in comparison to thrust of
propulsion system
AOCS Mass
Propellant percentage of 3%
for all delta v manoeuvres
Triton Target Manoeuvre 237.30 Tour 68.25 Tour 20.00 Tour Margin 31.50 Disposal 10.00
AOCS mass
Propellant percentage of 2%
for all delta v manoeuvres
Table 10-1: Delta V budget calculations

Ice Giants CDF Study Report: CDF-187(C)
January 2019 page 119 of 431
ESA UNCLASSIFIED – Releasable to the Public
10.1.3 Baseline Design
The baseline design of the propulsion system consists of a pressurising section using helium and the propellant section using the propellant combination MON/MMH. It features two complete separated branches for the pressurisation of the propellant tanks, using serial redundant pressure regulator from VACCO (V1E10776-01). Both branches are isolated on ground using a nominal closed pyrovalve.
Downstream of the pressure regulators, one high pressure latch valve common for both branches and two check valves in each branch are accommodated to prevent propellant mixtures upstream the tanks and to provide the third barrier on ground. This has to be assessed in detail in a later stage of the mission including the assessment of possible liquid flowing towards the check valves during the entire mission scenario. Additionally, the benefits of having two latch valves including a possible entire isolation of a leaking branch by means of a dedicated latch valve should be traded against the disadvantages (mass, reliability) in a later stage of the mission analysis.
Downstream of the check valves, the four tanks are accommodated, two tanks for MMH and two tanks for MON. Due to the usage of the isovolumetric mixture ratio of 1.65 both tanks are similar in size and the depletion of the tanks will lead to a centre of mass shift only along one axis of the spacecraft.
The propellant section consists of two branches each has in common a latch valve and then separate equipment for the AOCS thrusters branches and the main engine branch. Since the baseline AOCS thruster includes a dual seat valve, only one latch valve to the main AOCS branch is sufficient. The main engine branches consist of one additional latch valve and Normally Open Pyrovalves to enable a potential isolation of the main engine. Since the failure of a huge leakage and the subsequent isolation of the main engine would lead maybe to a potential loss of mission, the need of this extra equipment should be traded as well in a later stage of the mission design.
Figure 10-1 shows the propulsion system in its designed stage. It only includes one line per propellant branch to the thruster to facilitate the reading of the schematic. In fact, every thruster has one connection to MMH and one to MON.

Ice Giants CDF Study Report: CDF-187(C)
January 2019 page 120 of 431
ESA UNCLASSIFIED – Releasable to the Public
He
MMH MON
Tank
Check Valve
NO/NC Pyrovalve
Pressure regulator (1st)
Pressure regulator (2st)
Latch Valve
FFilter
Dual Seat Thruster
Single Seat Thruster
Fill & Drain Valve
F F
PT
PT
F
PT PT
F
MMH MON
PTPT
Figure 10-1: Propulsion system baseline schematic
The baseline design consists of two main engines RD[17] which has in its current stage planned to be trimmed to about 1kN of thrust. Due to the impact of the thrust ratio in relation to the mass as provided by the mission analysis, the system consisted of either only one engine or two engines of this kind.

Ice Giants CDF Study Report: CDF-187(C)
January 2019 page 121 of 431
ESA UNCLASSIFIED – Releasable to the Public
Figure 10-2: LEROS 4 (HTAE – High Thrust Apogee Engine) and its subassemblies
One of the main aspects highlighted for the configuration is the impact of thrust differences between the two main engines if the distance is quite high or the thermal radiation impact from one engine to the other if they are too close. Currently, the baseline was chosen to have two main engines but it has to be assessed in detail in a later study whether this accommodation and the drawbacks due to the thrust differences and the centre of mass shift is still the best possible solution. This should then also include a detailed assessment of the reliability of the system and the AOCS thruster as well as a detailed assessment of the thermal impacts from one engine to the other.
Furthermore, the system includes also AOCS thrusters, using the S10-18 thrusters manufactured by ArianeGroup RD[18].
Figure 10-3: S10-18 thruster from Arianegroup including the Plan for the thruster with main geometrical parameters
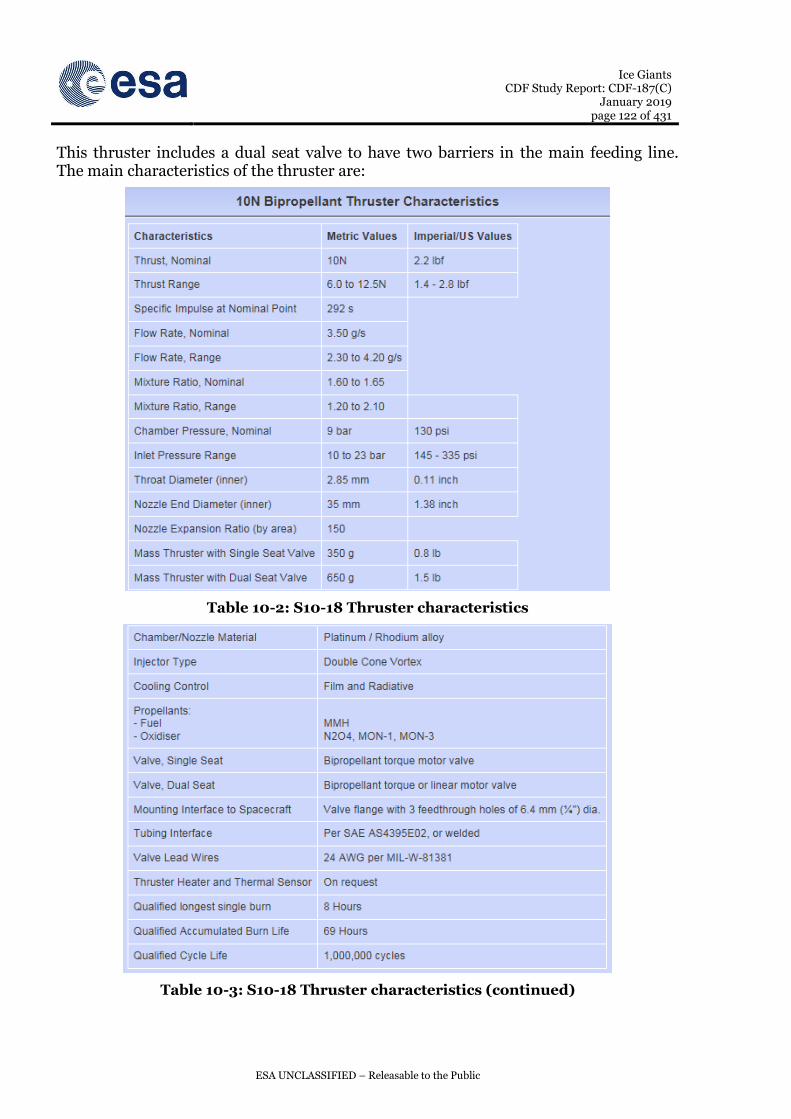
Ice Giants CDF Study Report: CDF-187(C)
January 2019 page 122 of 431
ESA UNCLASSIFIED – Releasable to the Public
This thruster includes a dual seat valve to have two barriers in the main feeding line. The main characteristics of the thruster are:
Table 10-2: S10-18 Thruster characteristics
Table 10-3: S10-18 Thruster characteristics (continued)

Ice Giants CDF Study Report: CDF-187(C)
January 2019 page 123 of 431
ESA UNCLASSIFIED – Releasable to the Public
Using the LEROS 4 engine, the delta v demand for the Neptune Orbit insertion is around 3100s. Based on this, the temperature drop of the helium, assuming a starting temperature inside the tanks at the upper temperature level, the inlet temperature to the helium pressure regulator was estimated to be around -18.3°C which was assumed to be okay at this state. But this value has to be investigated in detail in a later stage.
The results of the system are the following:
Manoeuvre mass begin [kg] mass end [kg] velocity increment
[m/s]
propellant mass
[kg]
Jupiter Flyby 3968.59 3949.74 15.00 18.85 Neptune Insertion Manoeuvre 3949.74 1987.95 2162.55 1961.79
AOCS Mass 1987.95 1922.07 94.84 65.88
NOI clean-up 1922.07 1922.07 0.00 0.00 Triton Target Manoeuvre 1922.07 1782.59 237.30 139.48
PTTM clean up 1782.59 1782.59 0.00 0.00
Tour 1782.59 1744.38 68.25 38.21
Tour 1744.38 1732.03 20.00 12.35
Tour Margin 1732.03 1712.75 31.50 19.28
Disposal 1712.75 1706.68 10.00 6.07
AOCS mass 1706.68 1662.76 73.38 43.92 Final/Total (Including Residuals) 1604.60
2712.83 2351.96
Table 10-4: Baseline delta v and propellant mass results
Using the baseline design with only one engine (maybe an issue with the thermal radiation or the propellant mass needed for AOCS as mentioned above) would lead to an increase of the wet mass up to 4509.9kg. This is mainly due to the increase of the gravity losses for the Neptune orbit insertion manoeuvre. A detailed assessment of this manoeuvre and the misalignments/impacts of using two engines has to be done in the future. (A similar assessment was done, for example, for the ExoMars mission)
10.1.4 List of Equipment
The current baseline consists of the following equipment:
Description Type Amoun
t Mass per
unit Margin Mass incl.
margin
Pipes Pipes 1 8 0.2 9.6
AOCS Engines S10-18 16 0.65 0.05 10.92
Main Engine LEROS-4 2 7.8 0.05 16.38
Fuel Tank E3000 2 27.08 0.05 56.86
Oxid Tank E3000 2 27.08 0.05 56.86
Fill / Drain Valves 9 0.07 0.05 0.6615

Ice Giants CDF Study Report: CDF-187(C)
January 2019 page 124 of 431
ESA UNCLASSIFIED – Releasable to the Public
Description Type Amoun
t Mass per
unit Margin Mass incl.
margin LP Pressure Transducer SAPT 4 0.216 0.05 0.9072 HP Pressure Transducer SAPT 1 0.216 0.05 0.2268
Latch Valve 4 0.75 0.05 3.15
Propellant Filter RA04822A 4 0.077 0.05 0.3234
Check valve VN005-001 4 0.585 0.05 2.457
Helium Tank PVG-120 2 23.5 0.05 49.35
Helium Tank PVG-65 1 12 0.05 12.6
Pressure regulator VACCO 2 1 0.05 2.1
Pyrovalve Cobham 4 0.315 0.05 1.323
SMA valve Arianegroup 2 0.16 0.2 0.384 High pressure latch valve
Vacco V1E10560-01 1 0.8 0.05 0.84
Total
224.95
Table 10-5: Propulsion system (Neptune) Equipment list
Currently, two normally closed SMA valves as currently in qualification for MON/MMH systems are considered for the system RD[19]. In its current stage, those valves are only available in normally closed configuration but the supplier has indicated potential configurations as well for normally open designs. This could potentially be used as a replacement for the normally open pyro valves if there is any issue with radiation or lifetime limitation. However, this would come at the cost of qualification of such an equipment.
10.1.5 Options
Several options for the entire propulsion system were investigated. Corresponding list includes the investigations:
1. Dual Mode system using hydrazine/Mon and two engines. 2. Baseline design using an electronic pressure regulator with set point adjustments
to have higher thrust level during the firing and using two engines.
Additionally, every concept was calculated by using only one engine.
The first one consists of using a dual mode system including two times the engine R-42DM from Aerojet RD[20] with a nominal thrust of 890N and the hydrazine thruster CHT-20 from ArianeGroup RD[21]. For the estimate, the propulsion system components except the tanks were kept constant, the tanks were estimated in the same family to be used with hydrazine as well. This system mass reduction was then used for the calculation with the impact of the higher gravity losses in comparison to the lower thrust level.

Ice Giants CDF Study Report: CDF-187(C)
January 2019 page 125 of 431
ESA UNCLASSIFIED – Releasable to the Public
Manoeuvre mass begin [kg] mass end [kg] velocity
increment [m/s] propellant mass [kg]
Jupiter Flyby 3973.2 3954.7 15.0 19.03 Neptune Insertion
Manoeuvre 3954.7 1989.3 2203.4 1969.84
AOCS Mass 1989.3 1923.0 69.8 66.19
NOI clean-up 1923.0 1923.0 0.0 0.00 Triton Target Manoeuvre 1923.0 1785.8 237.3 140.96
PTTM clean up 1785.8 1785.8 0.0 0.00
Tour 1785.8 1748.2 68.3 38.61
Tour 1748.2 1731.3 20.0 12.43
Tour Margin 1731.3 1705.0 31.5 19.40
Disposal 1705.0 1696.8 10 6.11
AOCS Mass 1696.8 1652.6 54.36049117 44.13 Final/Total (Including
Residuals) 1594.1
2709.7 2363.03
Table 10-6: Dual Mode propulsion system results
The usage of only one engine would increase the delta v demand to 2579.36m/s. This would, using the percentage value for AOCS propellant mass as indicated above, lead to a wet mass increase up to 4562.2kg.
The second option was using the baseline design above but using an electronic pressure regulator to pressurise the tanks. This would enable the set point adjustment of the engines to reach a higher thrust. On the other hand, the system mass increase by having two electronic pressure regulators including the electronics are counterweighting the thrust benefit. Additionally, the thrust increase is leading to a slightly lower specific impulse which also affects the benefits of using the electronic pressure regulator.
Manoeuvre mass begin [kg] mass end [kg] velocity
increment [m/s] propellant mass [kg]
Jupiter Flyby 3990.5 3971.4 15.0 19.03 Neptune Insertion
Manoeuvre 3971.4 2001.6 2150.2 1969.84
AOCS Mass 2001.6 1935.4 94.6 66.19
NOI clean-up 1935.4 1935.4 0.0 0.00 Triton Target Manoeuvre 1935.4 1794.5 237.3 140.96
PTTM clean up 1794.5 1794.5 0.0 0.00
Tour 1794.5 1755.9 68.3 38.61
Tour 1755.9 1743.4 20.0 12.43
Tour Margin 1743.4 1724.0 31.5 19.40
Disposal 1724.0 1717.9 10 6.11
AOCS mass 1717.9 1673.8 73.24 44.13 Final/Total (Including
Residuals) 1615.42
2700.1 2363.03
Table 10-7: Baseline with Electronic Pressure regulator

Ice Giants CDF Study Report: CDF-187(C)
January 2019 page 126 of 431
ESA UNCLASSIFIED – Releasable to the Public
Using this design but only one engine would increase the wet mass of the system to 4306.6kg. This wet mass, compared to the wet mass of the baseline with only one engine, is less because the delta v demands of the Neptune Orbit insertion manoeuvre is decreased. This is because the engine was assumed adjustable to about 1.1kN instead of only 1kN as currently planned for the nominal point. This benefit should be assessed in detail in the future.
10.1.6 Technology Requirements
The following technologies are required or would be beneficial to this domain:
|~T Technology Needs
* Equipment
Name & Text Reference
Technology Supplier (Country)
TRL Funded
by Additional
Information
Electronic Pressure regulator
Pressure regulator using the high
proportional valve for MON/MMH
Nammo (UK)
5
High
Proportional Valve
This valve can be used for throttling purposes
in MON/MMH/Hydrazine
Nammo (UK)
5
Normally Open Shape Memory
Alloy valve
This valve could be used as a replacement
for normally open pyrovalves without the
lifetime limitation
ArianeGroup (Germany)
1-3

Ice Giants CDF Study Report: CDF-187(C)
January 2019 page 127 of 431
ESA UNCLASSIFIED – Releasable to the Public
11 NEPTUNE AOCS
11.1 Orbiter
11.1.1 Requirements and Design Drivers
Subsystem Requirements
ID Type Statement Parent
ID Comment
AOGNC-010
F The AOCS shall point the high-gain antenna to Earth for 3.2 hrs per (Earth) day and during safe mode or system checkout events
AOGNC-020
M
The AOCS shall point the relevant instrument boresight to Neptune (anywhere from nadir to limb) during close approach period (100 hours per orbit with the exception of the 3.2 hours every 24 hours in which the spacecraft shall do the earth pointing for communication.)
AOGNC-030
M
The AOCS shall point the relevant instrument boresight to Triton (anywhere from nadir to limb) during close approach period (22 hrs per orbit)
AOGNC-040
M
The Absolute Performance Error (APE) of the instrument boresights shall be better than 300 arcsec half-cone angle at 95% confidence with temporal statistical interpretation
Based on JUICE / JANUS
AOGNC-050
M
The Relative Performance Error (RPE) of the instrument boresights shall be better than 1.5 arcsec half-cone angle over 100 msec at 95% confidence with temporal statistical interpretation
Based on JUICE / JANUS but assuming 10 times longer integration time due to low light
AOGNC-060
M
The Absolute Performance Error (APE) about the instrument boresights shall be better than 1 deg at 95% confidence with temporal statistical interpretation
Based on JUICE / JANUS
AOGNC-070
M
The Relative Performance Error (RPE) about the instrument boresights shall be better than 20 arcsec over 100 msec at 95% confidence with temporal statistical interpretation
Based on JUICE / JANUS but assuming 10 times longer integration time due to low light (10 times solar flux)

Ice Giants CDF Study Report: CDF-187(C)
January 2019 page 128 of 431
ESA UNCLASSIFIED – Releasable to the Public
Subsystem Requirements
ID Type Statement Parent
ID Comment
AOGNC-080
D
The Absolute Performance Error (APE) of the high-gain antenna boresight shall be better than 1 deg half-cone angle at 95% confidence with temporal statistical interpretation
Derived from assumed antenna beam half-width of 1 deg
AOGNC-090
F The AOCS should use different equipment for safe mode than is used in the normal mode
ESA best practice
AOGNC-100
M
The AOCS shall point the relevant instrument boresight to Jupiter (anywhere from nadir to limb) or Jovian moons during the Jupiter fly-by
Typical expectation for science mission passing a planet
11.1.2 Assumptions and Trade-Offs
Assumptions
1 Systems checkout of the orbiter need only be performed at infrequent intervals (e.g. once per year) during cruise. Communications with orbiter is only mandatory during system checkouts.
2 Science camera cannot be used for navigation purposes (field of view and functional needs are not compatible)
3 Achieving adequate Neptune orbit injection burn accuracy requires IMU (accelerometer & gyro) for delta-v loop closure during burn
4 Laser communications is not considered as an option; note that it would drive pointing requirements if adopted
5
Mass moments of inertia are computed assuming the mass is isotropically distributed over a cylinder 2.5 m high with 2 m radius; relatively low height is necessary to reduce impact of main engine misalignments and the large radius improves the moment arm of RCS thrusters
6 If the orbiter must first insert into a low-periapsis (~2000 km altitude, needed for probe ejection) orbit, no science is required to be performed in this orbit. The periapsis is assumed to be raised (to ~20000 km) after ~10 days
11.1.2.1 AOCS reference frame
The frame assumed for AOCS design is illustrated below with the origin located at the geometric centre of the main body cylinder:

Ice Giants CDF Study Report: CDF-187(C)
January 2019 page 129 of 431
ESA UNCLASSIFIED – Releasable to the Public
Figure 11-1: AOCS frame assumption; X – aligned with star tracker boresight, Z – aligned with high-gain antenna boresight. Orange cylinder represents payload
camera and main engine thrust direction is +Z
11.1.2.2 Mass properties
Two mass states were studied:
BOL – spacecraft with full wet mass – assumed during cruise phase
EOL – end of fuel expenditure, dry mass only – assumed during science phase.
Using assumption 6 above, the diagonal mass moments of inertia are computed as:
BOL: [5600, 5600, 7400] kg.m2
EOL: [2500, 2500, 3300] kg.m2.
and the center of gravity in AOCS frame is assumed fixed at:
[0.05, 0.05, -0.25] m (lateral offsets ~1% of s/c width).
Note that the minimisation of height in the design has the purpose of reducing the distance of the main engine to the c.g. (assumed to be 1 m), which drives misalignment torques. A large radius enables enhanced lever arm for RCS thrusters.
11.1.2.3 Orbit and fly-by trajectories
Several orbits and fly-by trajectories were considered for the Neptune orbiter mission:
1. Cruise: Heliocentric orbit with periapsis at Jupiter and apoapsis at Neptune 2. Post-probe-injection (if necessary): Low-periapsis Neptune orbit (2000 km
altitude periapsis, 200 x Rneptune apoapsis) 3. Science: High-periapsis Neptune orbit (20000 km altitude periapsis, 200 x
Rneptune apoapsis) 4. Science: Triton fly-by (during high-periapsis Neptune orbit) at 100 km altitude
and relative speed of 3.9 km/s.
11.1.3 Baseline Design
The functional AOCS needs for the orbiter led to the selection of the following AOCS modes:
1. Acquisition & safe mode
X
Z

Ice Giants CDF Study Report: CDF-187(C)
January 2019 page 130 of 431
ESA UNCLASSIFIED – Releasable to the Public
2. Communications mode 3. Cruise mode 4. Science mode 5. Orbit control mode
Figure 11-2: AOCS mode logic
In the above concept Communications mode is used as a bridging mode. The architectural design of each mode is described in section 11.1.3.1.
Note that a key lesson learned from Rosetta was that the number of modes and sub-modes should be limited to reduce testing burden. The different functional needs have been captured in this report thus a phase A should focus on consolidating mode design considering this desire for test efficiency.
The mapping from system modes to AOCS modes is as follows:
System Mode AOCS Mode
LEOP None/idle
Transfer mode None/idle
Cruise mode Acquisition & safe mode or Cruise mode
Manouevre mode Orbit control mode
Observation mode Science mode
Communication mode Communications mode
Safe mode Acquisition & safe mode
11.1.3.1 Mode designs
11.1.3.1.1 Acquisition & safe mode
This mode removes any residual spin rates from the spacecraft and acquires Earth-pointing for the high-gain antenna. There is no strong thermal constraints because the orbiter is not detached from the US carrier spacecraft until just before Jupiter fly-by, thus the solar heat energy is already low at this distance from the Sun. There are also no Sun-pointing constraints because the orbiter does not carry solar panels.
Acquisition & safe mode
Communications mode
Cruise mode
Science mode
Orbit control mode

Ice Giants CDF Study Report: CDF-187(C)
January 2019 page 131 of 431
ESA UNCLASSIFIED – Releasable to the Public
Previous outer-solar-system missions induced a search slew in safe mode to ensure that intermittently the antenna would sweep past the Earth. The known direction of the Sun, via a Sun sensor, could be used to decrease the search space to a cone using the known Sun-to-Earth offset angle from ephemerides. However, Earth-pointing can be more rapidly achieved by combining an Earth heliocentric position estimate, spacecraft position estimate and mapping between the inertial and body-reference frame via a star tracker. The subject of a star tracker based safe mode was studied in RD[22]. The star tracker would be loaded with a safe-mode set of parameters that are tuned for robustness rather than performance. This allows the star tracker to acquire at higher rates, for example. The required pointing accuracy for Earth-pointing is 1 deg (AOGNC-080), which is well within the capabilities of a low-performance (tuned for robustness) star tracker. The Earth and spacecraft ephemerides, propagated in the on-board software, would need to be loaded from ground and updated during the mission. Any reasonable-magnitude error in the spacecraft position estimate has negligible impact on the pointing accuracy given the > 500e6 km minimum distance from the spacecraft to Earth during autonomous operations.
The recovery from any spin motion can assume relatively low initial angular rates – a function of the ejection accuracy of the NASA carrier spacecraft. Subsequent entries to safe mode will also begin at low rates, depending on the FDIR threshold tuning for detection of RCS anomalies. An initial value of 2 deg/s has been assumed for propellant budgeting.
For cost and power reasons the recommendation is to embark a single star tracker in addition to a parallel-aligned cold redundant backup. A star tracker could be sufficient as sole sensor for this mode, but it may get blinded by the Sun or a nearby planet/moon.
One possible blinding-mitigation solution is to embark two additional optical heads and spread all the heads sufficiently far apart to ensure at least one non-blinded head at all times even in event of a single head failure.
Another blinding-mitigation solution is to execute an open loop thrust action to induce rotation orthogonal to the star tracker line of sight if it is blinded for a sufficiently long duration. However, this solution lacks robustness.
For robustness and cost reasons, the baseline solution is to add a coarse rate sensor (or an extra IMU/gyro of the same type used in orbit control mode), which also enhances the capabilities to handle higher than expected rates. This allows for closed-loop attitude control to stabilise rates and rotate the star tracker boresight (as needed) until it is no longer blinded. Note that since the star tracker is orthogonal to the high gain antenna there is no danger of Sun blinding after the Earth has been acquired. Planet or moon induced blindings are still possible, but on-board ephemerides of nearby planets or moons could be used to derive the attitude guidance quaternion such that the star tracker will always see cold sky (using degree of freedom of rotation about the high gain antenna boresight) or the coarse rate sensor could again be used to induce slow rotation (until blinding is removed) in a reactive manner.
The blinding-mitigation trade-off is presented in the table below:

Ice Giants CDF Study Report: CDF-187(C)
January 2019 page 132 of 431
ESA UNCLASSIFIED – Releasable to the Public
Coarse rate sensor
Extra IMU/gyro (same type as used
in orbit manoeuvres)
Extra 2 star tracker optical heads
Total mass (including TRL margins)
0.9 kg 4.5 kg 5.9 kg
Total power (including TRL margins)
5.5 W 13.5 W (assuming gyro only; no accelerometer)
23.7 W (but only necessary to have all 4 heads on in safe mode)
Cost Low Medium Medium
Table 11-1: Safe mode star tracker blinding mitigation trade-off
The safe mode attitude actuator should be different from that used in nominal modes – as per AOGNC-090. If nominal modes use wheels and RCS thrusters for momentum dumping then the safe mode should use a redundant RCS branch. If nominal mode uses thrusters at all times, then possibly a different type of thruster would be advised for use in the safe mode, or perhaps just the redundant RCS branch. Since wheels are the nominal modes baseline actuator, the safe mode will use a redundant RCS branch for actuation.
Figure 11-3: Safe mode logic
11.1.3.1.2 Communications mode
Earth-pointing for communications can be conducted in the same manner as for the safe mode, but with different equipment and more advanced handling of star tracker blindings.
Actuation can be performed with wheels for fine pointing and primary branch thrusters for momentum dumping and slews. This provides finer pointing and saves a small amount of fuel compared to using the thrusters alone (0.06 kg vs 0.02 kg), but thruster-only control is certainly an option if wheels are considered too power-hungry. 4 x reaction wheels will be embarked, but only 3 will be used at any one time in order to save power. Note that fuel estimates provided here are so low because the calculated limit cycle period is 12000 sec assuming 0.01 Ns MIB (minimum impulse bit) for a 10N RCS thruster and EoL inertias. Thruster pulsing is therefore very infrequent even when used as the primary actuator. However, fuel estimates are slightly optimistic because they assume steady state specific impulse.
If blinded
Rate damp
Earth acquisition Earth
point
Cold sky search
If blinded

Ice Giants CDF Study Report: CDF-187(C)
January 2019 page 133 of 431
ESA UNCLASSIFIED – Releasable to the Public
Momentum dumping fuel is also very low because the environmental torque disturbances are relatively small in the nominal science orbit (orbit 3. Note that all disturbances are considered as secular because momentum dumps will be performed approximately daily to avoid oversizing wheels given the power constraints.
Attitude sensing can be done with the primary star tracker and attitude guidance can be planned (via on-board ephemerides) to avoid star tracker blinding from nearby planets or moons. If blinding is geometrically unavoidable, which is unlikely, one could consider temporarily operating the primary gyro (also necessary for closed-loop burns - see assumption 3) for propagating through anticipated outage periods. However, to minimise power consumption, which is especially important since the wheels draw a lot of power, it is preferred to leave the primary gyro off if not required. Pointing accuracy is sufficient with star-tracker-only given the communications APE requirement (AOGNC-080). If there are initial angular rates (e.g. from spin stabilisation during cruise) a sub-mode could be included to perform initial rate damping using the star tracker.
Although star trackers may be designed to handle solar flares, it may be difficult to entirely rule out unexpected outage events that affect both the nominal and the redundant tracker. This may be a problem as the gyros are not intended to be on all the time due to power restrictions. One could switch on the gyro temporarily in case of unsuccessful tracking on both optical heads. The gyro would then enable propagation from the last known attitude solution to rough accuracy - given that the bias would not have been estimated a priori by the on-board attitude estimator. Alternatively the attitude could just be left to drift during outages of both nominal and redundant star trackers since there is no strict requirements on thermal/power safe attitude range. If the power budget does allow for powering the gyro permanently in some spacecraft modes of operation it should be done. This was an important lesson learned on Rosetta, but Rosetta did not have the same power constraints as the Neptune mission.
Figure 11-4: Communications mode logic
11.1.3.1.3 Science
Science requires pointing of instruments, such as a camera (JANUS) and visible/near-infrared spectrometeter (MAJIS) to planetary targets (Jupiter and Neptune) or moons (e.g. Triton). The specific target may be the limb, nadir or anywhere in between (AOGNC-020 & 030). ESOC requests that a navigation camera (and redundant backup) be included in the sensor suite to improve the estimates of spacecraft and moon ephemeris for targeting correction burns. The navigation camera would need to be pointed to planet or moon limbs during specific periods, possibly at the expense of science pointing depending on the relative layout of units on the orbiter.
Rate damp
Earth acquisition
Earth point
Momentum dump

Ice Giants CDF Study Report: CDF-187(C)
January 2019 page 134 of 431
ESA UNCLASSIFIED – Releasable to the Public
It is intended to use a similar AOCS functional strategy to the Communications mode to achieve Science and navigation pointing objectives, albeit with different attitude guidance.
For periods in between science and communications, there are no constraints on attitude. During these periods the navigation camera could be pointed to the Neptune limb by default in order to maintain accurate spacecraft ephemeris. However, this decision is an open trade.
It is assumed that no rate damp sub-mode is required, providing one only transits to science mode from either Communications or Orbit control mode.
Figure 11-5: Science mode logic
11.1.3.1.4 Cruise
Several options have been considered for the AOCS strategy during the cruise:
1. Spin-stabilised s/c with continuous Earth-pointing of high gain antenna; requires < 1 deg nutation/coning and regular spin axis corrections to account for translational motion of spacecraft relative to Earth
2. Spin-stabilised to maintain at least an approximate known attitude, with temporary de-spin and transit to communications mode once per year for system checkout operations
3. 3-axis stabilised Earth pointing with wheels and momentum dumping with thrusters
4. 3-axis stabilised Earth pointing with thrusters.
Spin stabilisation with no more than 1 deg pointing error, assuming (for example) weekly spin-axis pointing corrections, requires a spin rate of ~0.02 deg/s given a maximum solar pressure disturbance of 6.6E-8 Nm. Since this is very slow spin and may be difficult to achieve accurately with thrusters, it is assumed instead an arbitrary nominal spin rate of 1 deg/s. The fuel required to generate the spin is 0.08 kg and fuel required to regularly re-orient the spin axis is 0.13 kg assuming a total slew angle of 180 deg over the 12 year cruise from Jupiter to Neptune.
Inertial spin-stabilisation with periods of interruption for communications requires 1.9 kg fuel for spin & de-spin (with 1 deg/s spin) and 0.01 kg fuel for slew and 3-axis pointing – assuming checkouts done one day per year. Spin-stabilisation options have the advantage that spacecraft equipment can be turned off during the majority of cruise to reduce the total operation hours of electronics or mechanisms (e.g. wheels). This could also be done without spin-stabilisation but then the attitude will be left to drift freely.
Momentum dump
Target acquisition
Target point

Ice Giants CDF Study Report: CDF-187(C)
January 2019 page 135 of 431
ESA UNCLASSIFIED – Releasable to the Public
3-axis stabilised pointing with wheels requires that the wheels operate for a total of 14 years of the 16 year mission. This requires high reliability wheels, and this may not necessarily be possible given the necessity to select small-sat wheels to satisfy the power constraints (see section 11.1.3.4). The momentum dumping fuel consumption associated with this solution is negligible due to the weak solar pressure being the sole disturbance.
3-axis stabilised pointing with thrusters requires 0.35 kg fuel. Note that the fuel consumption is so small because the limit cycle period is computed to be 26000 secs during cruise phase. However, it still represents a large number of pulses over the lifetime, which could be an issue for qualification limits.
To avoid the need to run the wheels all the time during the cruise, and for a more robust Earth-pointing strategy for communications, the baseline design is to inertially spin-stabilise the satellite and turn the satellite equipment off during the cruise except for periods of system checkout – in which case the Communications mode is used. The annual running of the wheels will also help redistribute lubricant in the bearings to avoid the wheels getting stuck after a long period of non-use. Spin rate control should be done with the IMU as it is more accurate than the coarse rate sensor.
Figure 11-6: Cruise mode logic
11.1.3.1.5 Orbit Control
On basis of propulsion subsystem design trades, delta-V manoeuvres are executed using:
Large delta-Vs: Single 1000 N engine with RCS in on-pulse mode for attitude control
Small delta-Vs: RCS thrusters in off-pulse mode for attitude control.
To avoid switching off and on the wheels (which can affect lifetime) it is recommended to keep the wheels running at fixed speed during orbit control mode.
Attitude sensing can be performed by star tracker and gyro-based propagation in case of star tracker outage. The IMU will be running continuously during burns to keep track of the delta-V imparted and update the manoeuvre completion time.
Figure 11-7: Orbit control mode logic
The option of spin-stabilisation during operation of the 1000 N engine should also be considered as it would allow the spacecraft shape to be narrower if desired and allow the star tracker to be switched off during large burns.
Spin rate control
Idle
Attitude acquisition
Delta-V

Ice Giants CDF Study Report: CDF-187(C)
January 2019 page 136 of 431
ESA UNCLASSIFIED – Releasable to the Public
11.1.3.2 Equipment usage per mode
Table 11-2: AOCS equipment usage per mode and sub-mode
Note in the above table that (X) means the unit is used in a secondary manner. For wheels (X) implies fixed-speed control of reaction wheels to avoid having to turn them off and on. For the navigation camera (X) means that it is only used during periods where ground wishes to improve knowledge of planetary or moon ephemerides.
11.1.3.3 Sensor selection
11.1.3.3.1 Star tracker
Since the TID for the Neptune mission is estimated at ~66 krad, several high performance European star trackers would make suitable candidates. However, since there is also a requirement to perform accurate science pointing around Jupiter (AOGNC-100) on the way to Neptune, it is logical to embark the JUICE-version of the Sodern Hydra. This unit has been designed and shielded specifically for being able to acquire and track stars in the high radiation environment around Jupiter.
The baseline design includes the following hardware in cold redundancy:
2 x Sodern JUICE-Hydra optical heads (see RD[23])
2 x cross-strapped Sodern JUICE-Hydra electronic units.
As mentioned previously, since the choice is to operate just a single star tracker (to save power) it should be mounted parallel but opposite to the payload boresight since the tracker has the best accuracy orthogonal to its boresight – which is also the most important axes for the payload.
If there has already been a star tracker failure previously and thus the spacecraft is already operating on the redundant optical head or electronic unit, then the baseline design is simply to continue using the redundant unit if a safe mode transition is initiated. Failure of both nominal and redundant unit could be considered a double failure thus out of scope. However, if project policy is not to rely on the exact same hardware in normal mode and safe mode then an extra electronics unit and optical head could be embarked for exclusive use in the star-tracker based safe mode.
11.1.3.3.2 Navigation camera
NASA typically uses the payload camera for improving knowledge of spacecraft or moon locations with respect to a nearby planet. However, ESA prefers functional separation of
Ice Giants CDF Study Report: CDF-187(C)
January 2019 page 137 of 431
ESA UNCLASSIFIED – Releasable to the Public
the navigation task from the science task. Furthermore the baseline science camera has a very narrow field of view thus is less suited to the task of limb fitting. For these reasons the baseline design includes the following hardware in cold redundancy:
2 x Sodern JUICE navigation camera with electronics (see RD[24]).
The navigation camera should be approximately aligned with the science payload to reduce the need for separate pointing sessions for navigation updates. The camera need only be operated at intermittent intervals as required by ground for targeting of delta-V burns. In nominal operations the camera is capable of producing a relative planet/moon position estimate every 15 minutes. The images can also be relayed to the ground during communications mode for solution cross-comparison by the mission operations centre.
11.1.3.3.3 IMU
Several options are available for long lifetime / high reliability IMUs. The European Astrix 1090A includes a medium performance fibre optic gyro and a Honeywell QA3000 accelerometer. It has been embarked on ExoMars and is considered suitable for a mission to Neptune, with a radiation hardness of 100 krad. Note that the gyro is only used for spin-rate control during cruise and for decoupling translation and rotation motion during the delta-V burns, thus high performance is not needed; the star tracker is used as primary attitude sensor during burns.
For a ~1.5 hour burn to execute the 2161 m/s Neptune injection delta-V, the 1090A expected delta-V estimation error is expected to be < 10 m/s.
The baseline design includes the following hardware in cold redundancy:
2 x Airbus Defence & Space Astrix 1090A IMUs.
11.1.3.3.4 Coarse rate sensor
The safe mode design description identifies a need for a coarse rate sensor to aid a cold sky search in the event of star tracker blinding. The performance requirements for such a sensor are very loose. Several low cost options are available, but the best option is considered to be the SiREUS NG10 since they use radiation hardened parts and do not have obsolescence issues.
The baseline design includes the following hardware for use in safe mode only (without redundancy):
1 x TAS SiREUS NG10.
The specific radiation susceptibility level information was not available for this study, but it is possible that some additional shielding may be required.
11.1.3.4 Actuator selection
11.1.3.4.1 Environmental torque disturbances
Simulations were conducted using ESA’s GAST tool, setup for orbit about Neptune. Relevant assumptions were:
Residual magnetic moment: 1.6 Am2, based on mass-based formula from NASA SP8018 standard
Offset of Z-axis from nadir during Earth communications: 45°

Ice Giants CDF Study Report: CDF-187(C)
January 2019 page 138 of 431
ESA UNCLASSIFIED – Releasable to the Public
s/c solar pressure reflectance factor: 0.5
Solar pressure cross-sectional area: 12.5 m2.
Neptune magnetic field dipole as per RD[25].
Simulations of length 1 Neptune day were conducted near periapsis and apoapsis and these were used to check the static analytical torque estimates from the AOGNC Excel workbook tool. The simulation results agreed with the workbook to within an order of magnitude. The workbook was then used to find the mean torque disturbances over the orbit which is useful for propellant budgeting. The mean value is found numerically by computing torques at each 10 deg increment of mean anomaly and then averaging these values.
The simulation results below are given for the temporary low-periapsis orbit (orbit 2) used just after injection, which is required in the case that the orbiter carries an atmospheric probe. Figure 11-8 shows that the orbiter is only close to Neptune (within 1 Rneptune altitude) for around 10000 secs, where it sweeps through a ~180 deg change in true anomaly.
Figure 11-8: Low-periapsis orbit, periapsis pass, inertial pointing. Position in Neptune-centred inertial frame (left) and altitude (right)
0 1 2 3 4 5 6 7
x 104
-2.5
-2
-1.5
-1
-0.5
0
0.5
1
1.5
2x 10
5
Ri [
km]
Time [s]
Neptune-centered inertial position
x
y
z
0 1 2 3 4 5 6 7
x 104
0
0.5
1
1.5
2
2.5
3x 10
5Altitude above Neptune 1-bar level
Time (s)
Altit
ude
(km
)

Ice Giants CDF Study Report: CDF-187(C)
January 2019 page 139 of 431
ESA UNCLASSIFIED – Releasable to the Public
Figure 11-9: Low-periapsis orbit, periapsis pass, inertial pointing. Disturbance torques (left) and wheel momenta (right)
Figure 11-10: Low-periapsis orbit, periapsis pass, inertial pointing. Disturbance torque contributors
Figure 11-9 and Figure 11-10 show that the gravity gradient disturbance torque is dominating, due to off-pointing from nadir and the strong gravity of Neptune. However, the gravity gradient torque profile after periapsis pass is equal and opposite (sign) to that prior to periapsis pass thus the momentum accumulation is temporary. The secular accumulation is just 0.3 Nms per axis. It is assumed in the simulation that 3 wheels are mounted in orthogonal configuration for simplicity. In the above plots the angle of body +Z w.r.t. nadir is 45 deg (gravity gradient worst case) at t=0 and then changes rapidly to ~150 deg at periapsis pass. The worst case would be a nadir offset of 45 or 135 deg at periapsis pass, however a repeated simulation with this constraint showed that torque and momentum accumulation is still roughly the same as that shown above.
0 1 2 3 4 5 6 7
x 104
-3
-2
-1
0
1
2
3
4
5x 10
-4
Gd
ist [
Nm
]
Time [s]
Disturbance Torque
x
y
z
0 1 2 3 4 5 6 7
x 104
-0.4
-0.3
-0.2
-0.1
0
0.1
0.2
0.3
0.4
hw
[N
ms]
Time [s]
Wheel momentum
x
y
z
0 2 4 6 8
x 104
0
1
2
3
4x 10
-4Gravity Gradient
Torq
ue (
Nm
)
Time (s)
0 2 4 6 8
x 104
0
1
2
3
4x 10
-8Solar Pressure
Torq
ue (
Nm
)
Time (s)
0 2 4 6 8
x 104
0
1
2
3x 10
-5Magnetic Residual
Torq
ue (
Nm
)
Time (s)
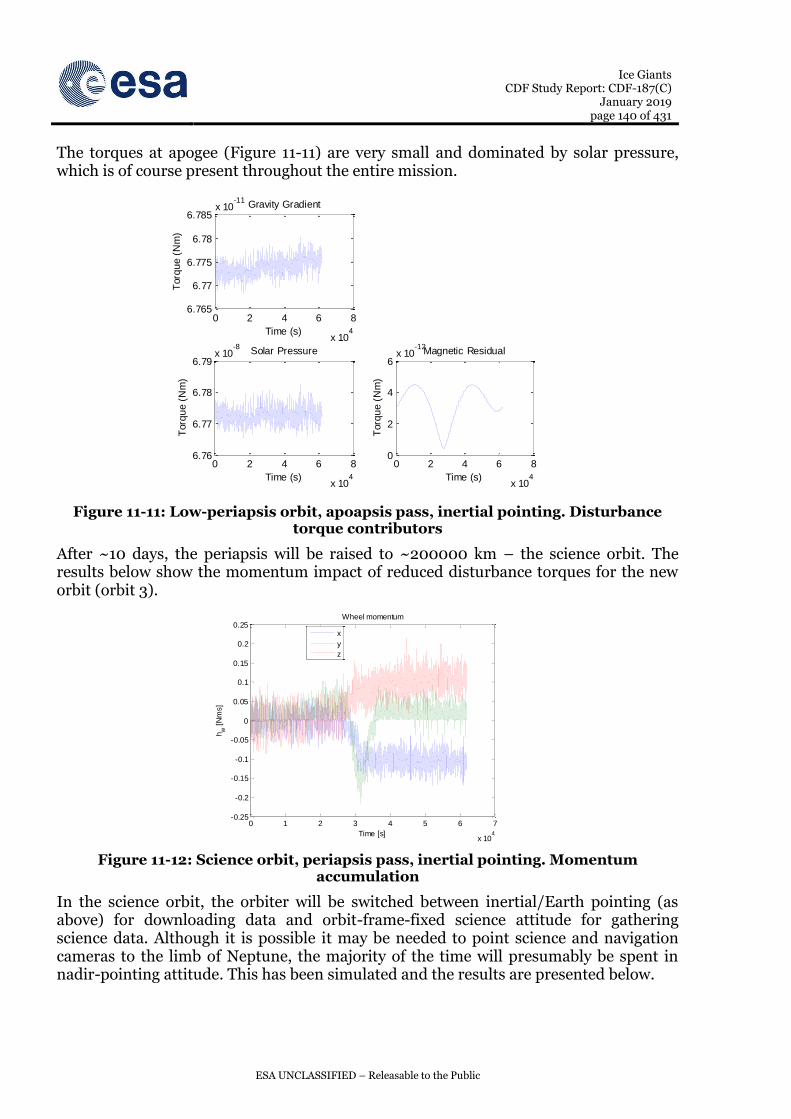
Ice Giants CDF Study Report: CDF-187(C)
January 2019 page 140 of 431
ESA UNCLASSIFIED – Releasable to the Public
The torques at apogee (Figure 11-11) are very small and dominated by solar pressure, which is of course present throughout the entire mission.
Figure 11-11: Low-periapsis orbit, apoapsis pass, inertial pointing. Disturbance torque contributors
After ~10 days, the periapsis will be raised to ~200000 km – the science orbit. The results below show the momentum impact of reduced disturbance torques for the new orbit (orbit 3).
Figure 11-12: Science orbit, periapsis pass, inertial pointing. Momentum accumulation
In the science orbit, the orbiter will be switched between inertial/Earth pointing (as above) for downloading data and orbit-frame-fixed science attitude for gathering science data. Although it is possible it may be needed to point science and navigation cameras to the limb of Neptune, the majority of the time will presumably be spent in nadir-pointing attitude. This has been simulated and the results are presented below.
0 2 4 6 8
x 104
6.765
6.77
6.775
6.78
6.785x 10
-11Gravity Gradient
Torq
ue (
Nm
)
Time (s)
0 2 4 6 8
x 104
6.76
6.77
6.78
6.79x 10
-8Solar Pressure
Torq
ue (
Nm
)
Time (s)
0 2 4 6 8
x 104
0
2
4
6x 10
-12Magnetic Residual
Torq
ue (
Nm
)
Time (s)
0 1 2 3 4 5 6 7
x 104
-0.25
-0.2
-0.15
-0.1
-0.05
0
0.05
0.1
0.15
0.2
0.25
hw
[N
ms]
Time [s]
Wheel momentum
x
y
z

Ice Giants CDF Study Report: CDF-187(C)
January 2019 page 141 of 431
ESA UNCLASSIFIED – Releasable to the Public
Figure 11-13: Science orbit, periapsis pass, nadir pointing. Body-frame angular rates (left) and wheel momenta (right)
Figure 11-14: Science orbit, periapsis pass, nadir pointing. Disturbance torque contributors
The momentum accumulation in nadir pointing attitude is similar in magnitude but most pronounced on the Y axis instead of the X and Z axes as was the case with inertial pointing. There is also a large momentum transient due to the fast rate of change of the orbital frame around periapsis (see Figure 11-13). This is a consequence of the highly eccentric orbit geometry.
The disturbances are summarised in the table below:
0 1 2 3 4 5 6 7
x 104
-0.025
-0.02
-0.015
-0.01
-0.005
0
0.005
[
de
g/s
]
Time [s]
True Body Rates
x
y
z
0 1 2 3 4 5 6 7
x 104
-0.4
-0.2
0
0.2
0.4
0.6
0.8
1
hw
[N
ms]
Time [s]
Wheel momentum
x
y
z
0 2 4 6 8
x 104
0
1
2
3
4x 10
-5Gravity Gradient
Torq
ue (
Nm
)
Time (s)
0 2 4 6 8
x 104
0
0.5
1x 10
-7Solar Pressure
Torq
ue (
Nm
)
Time (s)
0 2 4 6 8
x 104
0
2
4
6x 10
-6Magnetic Residual
Torq
ue (
Nm
)
Time (s)

Ice Giants CDF Study Report: CDF-187(C)
January 2019 page 142 of 431
ESA UNCLASSIFIED – Releasable to the Public
Table 11-3: Environmental torque disturbances summary
The orbital mean torque for gravity gradient seems to be over estimated because the workbook assumes a constant offset from nadir, rather than time varying, and because it does not account for the fact that the high gravity gradient during the half-day prior to periapsis pass is mostly balanced by the gravity gradient the half-day after periapsis pass; this period of time dominates the orbital mean. Therefore, for sizing momentum devices the simulation values for pericenter pass will be used rather than the orbital mean values quoted from the AOGNC workbook.
11.1.3.4.2 Fine pointing actuator
Fine pointing could either be done with:
Reaction wheels, and regular momentum dumping with RCS thrusters
Cold gas thrusters
RCS thrusters.
A trade-off is provided below:

Ice Giants CDF Study Report: CDF-187(C)
January 2019 page 143 of 431
ESA UNCLASSIFIED – Releasable to the Public
Reaction wheels Cold gas RCS
Total mass (including TRL margins)
12.4 kg, assuming Honeywell HR04 wheels (see sizing in next section)
18 kg, assuming 8 thrusters and scaled-down Euclid system
10 N thrusters: no extra dry mass since equipment already embarked for other reasons
1 N thrusters: dry mass 3 kg (assuming 8 thrusters) + piping
Extra fuel: 2.2 kg including 100% margin (but this fits in ample margins taken for fuel budget)
Total power (including TRL margins)
29 W (assuming mean operation at 30% of momentum capacity and including a 20% TRL margin)
23 W base + 16 W if all thrusters on, but duty cycle will be low and base power could be reduced if throttling controller removed
17 W if all thrusters on but duty cycle will be very low, with exception of periapsis pass
Cost Medium High Low
Pointing accuracy High Very high Medium; not certain if RPE requirements can be met
Other comments -May require some redesign to include radiation hardened parts or other modifications to guarantee sufficient lifetime.
-Complex architecture given simultaneous use of Bi-propellant propulsion system
-Production line may be discontinued
-Could embark additional mono-propellant 1N thrusters to further reduce MIB
Table 11-4: Fine pointing actuator trade-off (green indicates baseline)
A cold gas system was quickly eliminated from the trade due to its complexity and questions over the production line.
Given the relatively stringent RPE requirements, it is not certain whether RCS-based control would be sufficiently smooth especially around periapsis pass where torque adjustments will be frequent. In the majority of the orbit the disturbances and required angular rates are very low and RCS-based control will most likely suffice. However, if orbit-frame-fixed pointing needs to be maintained during periapsis pass the microvibrations from frequent RCS firings may violate the RPE requirements and result in blurry imagery.
Since reaction wheels offer better pointing performance than RCS control and because the power budget can accommodate them (albeit without margin to grow), wheels are

Ice Giants CDF Study Report: CDF-187(C)
January 2019 page 144 of 431
ESA UNCLASSIFIED – Releasable to the Public
included in the baseline. However, this is a crucial first point of iteration should this mission design move forward to a Phase A. NASA’s New Horizons probe did all fine pointing with 1 N RCS thrusters thus it is expected that a no-reaction-wheel design is possible.
11.1.3.4.3 Reaction wheel sizing
From Table 11-3, the worst case science mode needs for the reaction wheels (taking the simulation results in favour of the AOGNC workbook estimates) is the 0.9 Nms transient momentum peak required to maintain orbit-frame-fixed pointing during periapsis pass.
For slews between science attitude and Earth communications attitude, a 180 deg 1 hour (reasonable from availability standpoint) slew would require 8 Nms wheels. Wheels of this size consume ~20 W in steady state per wheel, i.e. 60 W total.
For the closest-approach Triton fly-by (see section 11.1.2.3) nadir-pointing would require 6 Nms wheels.
Given the extreme power constraints on this mission, a 1 Nms wheel is selected as baseline. It is assumed that slews can be performed completely with thrusters and that fly-bys will either have to tolerate increased absolute pointing error due to limited slew rate from 1 Nms wheels or the fly-by can be thruster-assisted. No special allowance is made for this in the AOCS mode structure yet but it is something that should be considered in a phase A design.
Since ESA interplanetary missions always demand use of high reliability parts, the typical suppliers of 1 Nms wheels (for the smallsat/microsat market) cannot be considered. Honeywell supply the HR04 1 Nms wheel, which is a possible candidate – consuming ~8 W steady state per wheel. However, this is advertised as just 5 year minimum mission life thus would possibly require some parts replacement to qualify it for Ice Giants (16 years, including 2+ years of wheel operations).
The baseline design includes the following hardware with 3 active wheels and 1 in cold redundancy:
4 x Honeywell HR04 reaction wheels, in pyramid configuration.
Rockwell Collins Deutschland is a candidate European supplier that could be considered. There is evidence that they do supply wheels in this class but do not seem to actively advertise them. Astrofein or MSCI also supply wheels of this size but their use of COTS parts would need to be thoroughly revised to meet reliability/radiation/lifetime requirements for Ice Giants.
11.1.3.4.4 Thruster sizing
RCS thruster size is driven by the need to provide torques to counteract the misalignment torques induced by the main engine.
Assuming 1 deg misalignment of the 1000 N engine, placed 1 m from the c.g., with RCS thrusters at a moment arm of 2 m, the RCS thrusters must be at least 6.5 N with a 4-thruster box configuration and 15 deg tilt to enable Z-axis control. 10 N thrusters are available in bi-prop configuration therefore these are selected for Ice Giants.

Ice Giants CDF Study Report: CDF-187(C)
January 2019 page 145 of 431
ESA UNCLASSIFIED – Releasable to the Public
These results are obtained assuming a 20kg mass, assuming different configurations and a 5% error margin, the mass can becomes 110 kg and the requirement in Newton for the thrusters stay the same.
Assuming a thruster with a Minimum Impulse Bit of 0.01Ns and a moment arm of 2 meter, the speed induced on the Z axis with dry mass is 0.02deg/min which is considered small.
If two main engines are embarked and will be fired simultaneously then larger RCS thrusters should be embarked or spin-stabilisation during main engine firings should be employed.
The number of thrusters required depends on the level of fuel-use, efficiency desired and any need for torque control to have no impact on the orbit. Since neither of these have been expressed as strong needs for Ice Giants a simple 4 thruster configuration should suffice. However, the propulsion design baselines 2 strings of 8 thrusters per string in case force-free torques become a requirement. These could be laid out as two opposing box configurations with tilted thrusters or optimisation could be performed.
11.1.3.5 Attitude control propellant budget
The attitude control propellant uses the following input data:
Phase duration
o Science phase: 66% of 2 years
o Communications phase: 33% of 2 years
Environmental disturbances
o Mean total torques over orbit as per Table 11-3
RCS properties
o 4 x 10 N thrusters, with 15 deg tilt to achieve Z-axis control
o MIB 0.01 Ns
o Specific impulse 290 sec
Delta-V firings
o 2618 m/s total main engine usage
o Engine misalignment and RCS-layout assumptions as per previous sub-section
o Control overshoot margin: 10%
Cruise phase
o Spin up/down during cruise: from ejection with initial rate 2 deg/s and then 24 repeats for rate change of 1 deg/s spin stabilisation between system checkouts
o Slews cruise phase: 180 x 1 deg, 1 hour slews (for system check out & comms)
o Fly-by pointing (i.e. Jupiter and Jovian moons) during cruise phase: 12 fly-bys of 1000 km closest approach at 5 km/s relative speed
Science phase
o Slews between communications and science attitude: 180 deg, twice per day over two years

Ice Giants CDF Study Report: CDF-187(C)
January 2019 page 146 of 431
ESA UNCLASSIFIED – Releasable to the Public
o Fly-by pointing (i.e. Triton, etc.) during science phase: once per month over two years with 1500 km closest approach (to moon centre) at 3.9 km/s relative speed
Safe mode
o 3 de-spins (from 2 deg/s), 3 x 180 deg, 1 hour slews and 10 days Earth-pointing with 1 deg deadband.
Table 11-5: Attitude control propellant budget
Note that the propulsion subsystem has allocated much more than this (roughly double) for attitude control propellant to remain conservative and to help offset the optimistic assumption of steady state specific impulse used to compute the above budget. Also note that stand alone fuel values reported earlier in this chapter do not contain any margin unless explicitly stated.
As mentioned in the tradeoff for the fine pointing actuator, if the reaction wheels were removed and all fine pointing was done with thrusters an additional ~2.2 kg of propellant would be required including 100% margin.
11.1.3.6 Pointing budgets
The primary contributors to the camera payload pointing APE and RPE budgets are given in the tables below.
Payload pointing error About payload LoS Transverse to payload LoS
Post-calibration payload alignment knowledge error (estimate after discussion with ESA JUICE GNC lead)
160 16
Attitude guidance error bias (along-track nav. error of 3 km assumed)
negligible 46 (Neptune) or 920 (Triton)

Ice Giants CDF Study Report: CDF-187(C)
January 2019 page 147 of 431
ESA UNCLASSIFIED – Releasable to the Public
Payload pointing error About payload LoS Transverse to payload LoS
Star tracker bias (Hydra) 12 8
Star tracker noise equivalent angle (Hydra with transfer function)
4.4 0.6
Rate estimation error (Hydra with transfer function)
6.1 0.8
Controller delay (1 x 8 Hz cycle)
1.6 negligible
Magnetetomer boom flexible oscillations (neglecting flex filtering in controller design)
6.6 0.4
TOTAL
(RSS summation within error categories and linear summation of categories)
174 65 (Neptune) or 940 (Triton)
Table 11-6: Science cameras’ pointing APE; all values are arcsec and are given at 2-sigma confidence
Payload pointing error About payload LoS Transverse to payload LoS
Star tracker noise equivalent angle (Hydra with transfer function)
4.4 0.6
Rate estimation error (Hydra with transfer function)
6.1 0.8
Controller delay (1 x 8 Hz cycle)
1.6 negligible
Magnetetomer boom flexible oscillations (neglecting flex filtering in controller design)
6.6 0.4
TOTAL
(RSS summation within error categories and linear summation of categories)
13 1.2
Table 11-7: Science cameras’ pointing RPE; all values are arcsec and are given at 2-sigma confidence
The above estimated performances satisfy all the APE and RPE requirements (AOGNC-040 to -070) with the exception of APE during Triton pointing – dominated by navigation error due to the small moon size and close approach. It is likely that the error can be better than the 3 km value estimated here.

Ice Giants CDF Study Report: CDF-187(C)
January 2019 page 148 of 431
ESA UNCLASSIFIED – Releasable to the Public
The APE budget for communications mode is not presented, though it will be dominated by post-calibration antenna residual misalignment bias error. It is expected to be compliant.
11.1.4 List of Equipment
Table 11-8: AOCS mass and power budgets – extracted from OCDT
11.1.5 Options
There have been several trades made in this chapter whose outcomes have scope for re-evaluation if Ice Giants moves to phase A. These are summarised in the list below:
1. Safe mode strategy a. Baseline: star tracker based Earth-acquisition b. Alternative: Sun sensor + slew search to re-establish communications (as
per NASA outer solar system s/c heritage) 2. Safe mode star tracker blinding mitigation strategy
Ice Giants CDF Study Report: CDF-187(C)
January 2019 page 149 of 431
ESA UNCLASSIFIED – Releasable to the Public
a. Baseline: low cost coarse rate sensor to initiate slew until star tracker un-blinded
b. Alternative 1: a third IMU (just for safe mode) of same type as used in nominal mode to initiate slew until star tracker un-blinded
c. Alternative 2: embarking a total of 4 optical heads evenly spaced in ring orthogonal to comms antenna, to guarantee that at least 1 head will see cold sky even in event of a single head failure
3. Attitude between science and communications period a. Baseline: Neptune or moon limb pointing of navigation camera b. Alternative: communications attitude for improved safety
4. Cruise mode attitude profile a. Baseline: spin-stabilised with all equipment off, with exception of 3-axis
pointing to Earth for ~annual system checkout events. b. Alternative 1: spin-stabilised with all equipment off but slewing spin-axis
regularly to maintain alignment of high-gain antenna with Earth c. Alternative 2: 3-axis stabilised pointing of high-gain antenna to Earth at
all times, using reaction wheels d. Alternative 3: 3-axis stabilised pointing of high-gain antenna to Earth at
all times, using thrusters only 5. Attitude stabilisation during main engine operations
a. Baseline: 3-axis stabilised b. Alternative: spin-stabilised
6. Star tracker hardware use in safe mode a. Baseline: use redundant optical head and electronics unit in safe mode b. Alternative: embark a dedicated extra optical head and electronics unit for
use in safe mode only 7. Fine pointing actuator
a. Baseline: smallsat reaction wheels (1 Nms) b. Alternative 1: RCS default thrusters (10 N) c. Alternative 2: RCS monoprop thrusters (1 N) d. Alternative 3: cold gas thrusters
8. Number of RCS thrusters a. Baseline: 2 x 8 thruster strings b. Alternative 1: 2 x 4 thruster strings c. Alternative 2: 2 x 12 thruster strings
There are also several options for suppliers of the AOCS units. Some examples have been provided in sections 11.1.3.3 and 11.1.3.4 but the listed options are not exhaustive.

Ice Giants CDF Study Report: CDF-187(C)
January 2019 page 150 of 431
ESA UNCLASSIFIED – Releasable to the Public
11.1.6 Technology Needs
|~T Technology Needs
* Equipment
Name & Text Reference
Technology Supplier (Country)
TRL Funded
by Additional
Information
X RW_HR04 Reaction wheels (1
Nms) Honeywell
(US) or 7
May require parts upgrade to improve
lifetime (5 years) and radiation hardness (20 krad is listed)
RW Reaction wheels (1
Nms)
Rockwell Collins
Deutschland (Germany)
7/8?
Limited information on mass/power,
lifetime, radiation, etc. for their 1 Nms wheels. Not clear if product line active
and whether wheels can meet lifetime or
radiation requirements of Ice
Giants. Possible tech development to meet
Ice Giant needs.
Table 11-9: possible AOCS technology development needs for Ice Giants

Ice Giants CDF Study Report: CDF-187(C)
January 2019 page 151 of 431
ESA UNCLASSIFIED – Releasable to the Public
12 NEPTUNE GNC
12.1 Atmospheric Probe
12.1.1 Requirements and Design Drivers
SubSystem Requirements
Req. ID Statement Parent ID
AOCS-010 The GNC system shall trigger safely the various events of the Entry and Descent (E&D) sequence
AOCS-020
The GNC system shall be able to record accelerations and angular rates for trajectory reconstruction.
Note: the reconstruction is performed in post-processing not on-board
AOCS-030 The GNC system shall be able to perform calibration of the acceleros and gyros before the entry phase.
12.1.2 Assumptions and Trade-Offs
Assumptions
1
The GNC will be passive during the ballistic flight after separation and before power up for the entry phase.
Note: this means that there is no active control of the trajectory and entry conditions.
2 There are no specific performances of the IMU outputs required by the science community to be able to reconstruct the trajectory with a certain level of accuracy with respect to the centre of mass of the planet.
3 The separation strategy is similar to the Huygens’ one, including the separation mechanism (RD[26] and RD[27]).
A trade-off considering having on-board navigation capability or no navigation has been performed.
On board navigation: will reduce the amount of data to be transmitted for trajectory reconstruction and will provide more precise on-board knowledge of trajectory and attitude state. The drawback is the increased complexity in the on-board software (the GNC application software will include a full navigation function).
No autonomous navigation: very simple GNC SW but the amount of data to be transmitted is higher (in order to be able to reconstruct the trajectory completely the raw accelerations and angular rates along with ancillary data needs to be transmitted).
For this mission it has been decided at system and customer level to keep a simple GNC SW and not perform any on-board navigation (including the calibration).

Ice Giants CDF Study Report: CDF-187(C)
January 2019 page 152 of 431
ESA UNCLASSIFIED – Releasable to the Public
12.1.3 Baseline Design
12.1.3.1 Entry corridor analysis
In order to define separation requirements that ensure fulfilment of entry corridor conditions some analysis is performed. In this analysis it is important to note that there is a long flight time after separation (20 days at least was considered since the beginning of the study) and that there are no actuators on the probe (after separation the probe is in ballistic flight)
The review of the Huygens mission reveals that the total B-plane error is about 75 km
(1) and the main contributions (which defines the Flight Path Angle corridor of ±1 deg 1-sigma) are:
Orbit Determination error (~3 cm/s)
Separation mechanism (~3 cm/s)
Total pointing accuracy (~2 deg).
The assumed conditions for the entry corridor analysis are in the Neptune case:
V infinity = 11.3 km/s
Radius EIP = 25.690 km
V separation mechanism = 0.4 m/s.
For an inertial FPA of -20 deg, an entry angle corridor of 1 deg (1-sigma) transforms into a B-plane error of 350 km (1-sigma). Assuming half of it (in the RSS sense) goes to orbit determination error and that the rest is shared equally between the pointing accuracy (APE) and the separation mechanism dispersion, there is plenty of margin to achieve the entry corridor even for further separation time (see pictures below).
Note that the arrival velocity has been assumed very high. In case this velocity is reduced the situation in terms of entry angle corridor improves (larger errors are allowed to achieve the same entry angle error).
For a FPA of -35 deg, the situation again is better (larger errors at separation can be tolerated to achieve the entry corridor).
Reducing the entry angle corridor to 0.1 deg, essentially decreases the tolerated errors by 10 times. Note that it might still be possible to achieve such demanding entry corridor with proper apportionment of the error sources. However, at this stage is considered not necessary to reach such accurate entry angle dispersion.

Ice Giants CDF Study Report: CDF-187(C)
January 2019 page 153 of 431
ESA UNCLASSIFIED – Releasable to the Public
Figure 12-1: Orbit Determination velocity error (FPA -20 deg)
Figure 12-2: Pointing accuracy at separation (FPA -20 deg)
Figure 12-3: Separation mechanism transversal velocity error (FPA -20 deg)
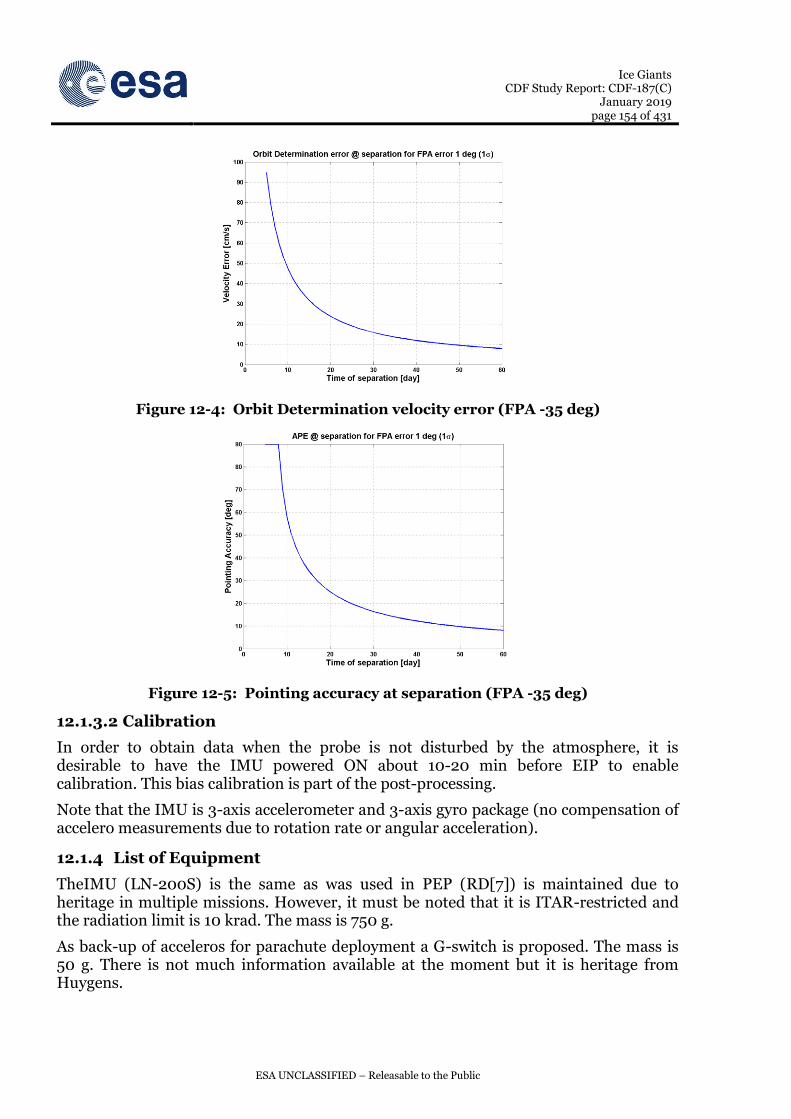
Ice Giants CDF Study Report: CDF-187(C)
January 2019 page 154 of 431
ESA UNCLASSIFIED – Releasable to the Public
Figure 12-4: Orbit Determination velocity error (FPA -35 deg)
Figure 12-5: Pointing accuracy at separation (FPA -35 deg)
12.1.3.2 Calibration
In order to obtain data when the probe is not disturbed by the atmosphere, it is desirable to have the IMU powered ON about 10-20 min before EIP to enable calibration. This bias calibration is part of the post-processing.
Note that the IMU is 3-axis accelerometer and 3-axis gyro package (no compensation of accelero measurements due to rotation rate or angular acceleration).
12.1.4 List of Equipment
TheIMU (LN-200S) is the same as was used in PEP (RD[7]) is maintained due to heritage in multiple missions. However, it must be noted that it is ITAR-restricted and the radiation limit is 10 krad. The mass is 750 g.
As back-up of acceleros for parachute deployment a G-switch is proposed. The mass is 50 g. There is not much information available at the moment but it is heritage from Huygens.

Ice Giants CDF Study Report: CDF-187(C)
January 2019 page 155 of 431
ESA UNCLASSIFIED – Releasable to the Public
Table 12-1: The mass of the selected GNC equipment
Table 12-2: The power of the selected GNC equipment
12.1.5 Options
There are some European ‘IMU’ alternatives under development:
MEMS gyro + MEMS acceleros (low performance, low mass) from TAS-UK
Mini-FOG + quartz pendulum acceleros (high perform, higher mass) from Innalabs in Ireland.
mass (kg) mass margin (%) mass incl. margin (kg)
Probe (Probe) 1.60 5.00 1.68
DM (Descent Module) 1.60 5.00 1.68
LN200S_1 (LN200S #1) 0.75 5.00 0.79
LN200S_2 (LN200S #2) 0.75 5.00 0.79
PAS_switch_1 (PAS Switch #1) 0.05 5.00 0.05
PAS_switch_2 (PAS Switch #2) 0.05 5.00 0.05
Grand Total 1.60 5.00 1.68
Power (W)
P_on P_stby
Probe (Probe) 32.00 0.00
DM (Descent Module) 32.00 0.00
LN200S_1 (LN200S #1) 16.00 0.00
LN200S_2 (LN200S #2) 16.00 0.00
PAS_switch_1 (PAS Switch #1) 0.00 0.00
PAS_switch_2 (PAS Switch #2) 0.00 0.00
Grand Total 32.00 0.00

Ice Giants CDF Study Report: CDF-187(C)
January 2019 page 156 of 431
ESA UNCLASSIFIED – Releasable to the Public
12.1.6 Technology Needs
|~T Technology Needs
* Equipment
Name & Text Reference
Technology Supplier (Country)
TRL Funded
by Additional
Information
IMU Rad-hard, low-
power, low-mass acceleros and gyros
TAS-UK, Innalabs (Ireland)
5 GSTP
Current technology for EDL IMU
(Astrix 1090A) is 5 times more massive and power hungry but more accurate.
Radiation hardening, bias stability during
extended temperature and
dynamics conditions
* Tick if technology is baselined

Ice Giants CDF Study Report: CDF-187(C)
January 2019 page 157 of 431
ESA UNCLASSIFIED – Releasable to the Public
13 NEPTUNE POWER
13.1 Atmospheric Probe
13.1.1 Requirements and Design Drivers
The requirements that effectively drive the EPS subsystem design are best described by considering the Probe mission timeline:
The EPS shall survive 13 years transfer attached to NASA orbiter. During this period, the probe will be in a normally dormant state, but some periodic activity for e.g. systems check-outs is foreseen.
The EPS shall support, immediately after separation from the orbiter, 10 minutes of intermediate (PIM) mode (for systems check out and calibration etc.).
The EPS shall then support 20 days of independent cruise in a dormant cruise (PCM) mode with all systems off except a timer (MTU).
EPS shall then support, immediately before atmospheric entry, 36 minutes of intermediate (PIM) mode (for systems check out and calibration etc.).
EPS shall then support 90 minutes of active descent (PDM) mode (in which the science mission is performed).
The power/energy requirements in each of the aforementioned systems modes are detailed below in Table 13-1 and Table 13-2. The energy requirements in Table 13-2 are derived according to the assumption that the probe will be exclusively battery powered following its release from a carrier spacecraft.
The final energy requirements in Table 13-2 include a system margin of 20%, an energy reserve of 20% (i.e. a battery depth-of discharge of 80%), and a 10% allowance for battery string redundancy.

Ice Giants CDF Study Report: CDF-187(C)
January 2019 page 158 of 431
ESA UNCLASSIFIED – Releasable to the Public
13.1.1.1 Power/energy requirement budget
Table 13-1: Probe power requirement budget at equipment-level. Values are time-averaged power in watts, and include an equipment maturity margin
Table 13-2: Summarised power and energy requirement budget (probe)
P_mean
Row Labels PDM PCM PIM
Probe (Probe) 362.1 0.0 330.5
COM 271.7 0.0 271.7
UHF_SSPA (UHF Solid State Power Amplifier) 133.3 0.0 133.3
UHF_SSPA_2 (UHF Solid State Power Amplifier #2) 133.3 0.0 133.3
UHF_TX (UHF Transmitter) 2.5 0.0 2.5
UHF_TX_2 (UHF Transmitter #2) 2.5 0.0 2.5
DH 3.5 0.005 5.0
CDM (Computer and Data Management Probe) 3.5 0.005 5.0
INS 38.4 0.0 5.4
ASI (Atmospheric Structure Instrument) 6.0 0.0 0.8
Cam_Rad (Camera-Radiometer) 9.6 0.0 1.3
Mass_Spec (Mass Spectrometer) 9.6 0.0 1.3
Phot (Photometer) 1.2 0.0 0.2
USO_Doppler (USO-Doppler) 12.0 0.0 1.7
MEC 0.0 0.0 0.0
BSSM_DM (Back Shell Separation Mechanism [DM side]) 0.0 0.0 0.0
FSSM_DM (Front shield sep Mec [DM side]) 0.0 0.0 0.0
Pyro_1 (Pyro #1) 0.0 0.0 0.0
Pyro_2 (Pyro #2) 0.0 0.0 0.0
Pyro_3 (Pyro #3) 0.0 0.0 0.0
PWR 16.5 0.0 16.5
PCDU_Pr (Power Conditioning & Distribution Unit_Probe) 16.5 0.0 16.5
GNC 32.0 0.0 32.0
LN200S_1 (LN200S #1) 16.0 0.0 16.0
LN200S_2 (LN200S #2) 16.0 0.0 16.0
Grand Total 362.1 0.005 330.5
Element properties Level 3
Element Definition short name: Probe
Element Definition long name: Probe
PDM PCM PIM
Total pwr incl. maturity margin (W) 362.1 0.005 330.5
Harness Losses (W) 2% 7.2 0.000 6.6
System Margin (W) 20% 72.4 0.001 66.1
Total average power inc. Margin 441.7 0.006 403.3
Mode duration (minutes) 90 28800 46
Energy requirement (Wh) 662.6 2.9 309.2 SUM TOTAL
incl.20% energy reserve 1231 Wh
incl. 10% battery string redundancy 1354 Wh
325.4 1026Energy req. incl 5% power
conditioning loss (Wh)697.5 3.1

Ice Giants CDF Study Report: CDF-187(C)
January 2019 page 159 of 431
ESA UNCLASSIFIED – Releasable to the Public
13.1.2 Assumptions and Trade-Offs
Assumptions
1 The probe can receive (a small amount of) power from the carrier orbiter during transfer. This introduces an associated requirement upon the EPS: the EPS shall provide a power interface to the carrier orbiter.
2 Use of USA-provided radioisotope heater units (RHUs) will maintain EPS components at “normal” temperatures (approx. 10°C assumed) during transfer and cruise, without requiring use of electrical heating.
Table 13-3: Probe EPS assumptions
The major trade-off decision is between a primary (e.g. LiSO2) battery, and a secondary rechargeable battery (Li-Ion). The trade-off is summarised in Table 13-4.
Trade consideration
Li primary Li-ion secondary
Specific energy (cells @ BOL)
235 Wh/kg for LiSO2 with MER Heritage (@ 20°C).
BUT much lower at lower temperatures (~26% less at 0°C).
TRL9: 140-170 Wh/kg @ 20°C but advancing quickly.
Less affected by low temperature: 12% less capacity at 0°C w.r.t. 20°C.
Degradation during transfer?
Self discharge ~3% per year means < 160 Wh/kg after 13 years.
Calendar ageing. Very low for certain cell types (NCA). E.g. ~ 3% total capacity loss after 15 years @ 20°C.
Management during transfer?
Keep electrically isolated (but temp-controlled).
Keep at low SoC to minimise degradation. Temp must be controlled (capacity loss is much higher above 20°C).
Management during science mission?
Depassivation is needed before probe separation: this capability is needed in the PCDU (successful Huygens heritage).
Charge battery to 100% immediately before probe separation. Power from host spacecraft will be required. BCR needed within PCDU.
Table 13-4: Probe battery trade-off
In terms of battery mass, the trade is close. In the previous PEP CDF study (RD[7]), the selection was Li primary, specifically LiSO2. This avoids the battery charge requirement with power from the host spacecraft. However, considering that a power and data interface to the probe would be needed in any case to allow for periodic check-out in transfer, this advantage is negligible.
Low temperatures (< 20°C) during the science mission will tend to push the trade towards Li-ion secondary due to the comparatively smaller reduction in secondary cell performance.
For the Ice Giants study (probe), the decision is to baseline a rechargeable Li-ion battery, because the EoL specific energy is slightly better, and temperature

Ice Giants CDF Study Report: CDF-187(C)
January 2019 page 160 of 431
ESA UNCLASSIFIED – Releasable to the Public
requirements are more flexible, especially the greater tolerance of lower temperatures during discharge.
13.1.3 Baseline Design
13.1.3.1 Battery
The battery mass and volume is sized assuming next-generation (but already high TRL) small-format space Li-ion cells with “NCA” (nickel-cobalt-aluminium) positive electrode chemistry for very low calendar ageing. A BoL nameplate specific energy of 169 Wh/kg is assumed.
For configuration reasons only, the battery is implemented as four separate battery units. The mass and size calculation, based on an EoL energy requirement of 1354 Wh (see Table 13-2) is shown in Table 13-5.
Table 13-5: Probe battery mass and size calculation (based on assumption of small-format Li-ion NCA cells with nameplate specific energy of 169 Wh/kg)
13.1.3.2 PCDU
The PCDU should be quite simple, having to interface only with one energy source (battery). The maximum power delivery capability is modest (approx. 360 watts). Therefore, a reasonably small and light unit is foreseen. The mass and size estimates are based approximately on Medium Modular Power System by Terma A/S, with a selection of functionality appropriate to this case, as detailed in Table 13-6.
BOL at cell level @ 20 deg C 169 Wh/kg
Temperature reduction factor 0.94 at 10 deg C
BOL at cell level @ mission temp 159 Wh/kg
Packaging factor cells-to-battery 1.26
BOL at battery level 126 Wh/kg
Calendar plus cycling degredation 0.995 per year
Mission duration 15 years
EOL at cell level 147 Wh/kg
EOL at battery level 117 Wh/kg
Battery density 0.92 g/cc
Battery mass 11.6 kg
Battery volume 12.6 litres
Number of batteries 4
Battery mass 2.9 kg
Battery volume 3.2 litres
Battery Height 165 mm
Battery width 196 mm
Battery length 97 mm
TOTAL all
batteries

Ice Giants CDF Study Report: CDF-187(C)
January 2019 page 161 of 431
ESA UNCLASSIFIED – Releasable to the Public
Table 13-6: Probe PCDU mass and size estimates (based very approximately on Medium Modular Power System by Terma A/S)
13.1.4 List of Equipment
Table 13-7: EPS Equipment list (Neptune Probe)
13.1.5 Options
A credible option would be to use a primary battery rather than a secondary rechargeable one. This is discussed in Section 13.1.2 above.
13.1.6 Technology Needs
No new technologies are required.
Mass, kg # of Total
per module modules mass, kg
Equipment power distribution module 0.570 2 1.1
Pyro firing module 0.476 2 1.0
BCDR module 0.550 3 1.7
"Power interface module" (mass of BDR module assumed) 0.575 2 1.2
MIL1553 Interface module 0.458 2 0.9
Mass of all modules 5.8 kg
Total mass of PCDU incl backplane and structure 8.8 kg
Width 0.235 metres
Height 0.156 metres
Length 0.279 metres
volume 10.2 litres
density 0.86 g/cc
mass (kg) mass margin (%) mass incl. margin (kg)
Bat_Pr (Battery_Probe) 2.90 5.00 3.05
Bat_Pr_2 (Battery_Probe #2) 2.90 5.00 3.05
Bat_Pr_3 (Battery_Probe #3) 2.90 5.00 3.05
Bat_Pr_4 (Battery_Probe #4) 2.90 5.00 3.05
PCDU_Pr (Power Conditioning & Distribution Unit_Probe) 8.71 10.00 9.58
Grand Total 20.31 7.14 21.76
Other parameters
TIDS len height wid P_on P_stby TRL
Bat_Pr (Battery_Probe) 4000 97 165 196 6
Bat_Pr_2 (Battery_Probe #2) 4000 97 165 196 6
Bat_Pr_3 (Battery_Probe #3) 4000 97 165 196 6
Bat_Pr_4 (Battery_Probe #4) 4000 97 165 196 6
PCDU_Pr (Power Conditioning & Distribution Unit_Probe) 50 279 156 235 16.5 16.5 5

Ice Giants CDF Study Report: CDF-187(C)
January 2019 page 162 of 431
ESA UNCLASSIFIED – Releasable to the Public
13.2 Orbiter
13.2.1 Requirements and Design Drivers
Requirements on the EPS, at this level of design, are dominated firstly by:
Provision of power at 30 AU from the sun (or 19 for Uranus). This rules out solar power
Total (autonomous phase) mission energy requirements of several MWh. This rules out any energy storage technology as the primary source.
Having therefore established that nuclear power is mission enabling, the EPS is not classically designed and sized according to imposed requirements, but rather the spacecraft system, mission and EPS subsystem are iterated in parallel, informed mainly by the high level assumptions regarding the details of the nuclear power source provision (see below).

Ice Giants CDF Study Report: CDF-187(C)
January 2019 page 163 of 431
ESA UNCLASSIFIED – Releasable to the Public
13.2.1.1 Orbiter power requirement budget

Ice Giants CDF Study Report: CDF-187(C)
January 2019 page 164 of 431
ESA UNCLASSIFIED – Releasable to the Public
Table 13-8: Orbiter power requirement budget at equipment-level, according to system mode (platform and instruments). Values are time-averaged power in
watts, and include an equipment maturity margin
Table 13-9: Summarised orbiter average power requirement budget according to “mission mode” (hybrid of platform and instrument system modes)
13.2.2 Assumptions and Trade-Offs
Assumptions
1 Availability & provision of 3 eMMRTGs
2 EOM power output of one eMMRTG = 90 W
Table 13-10: Orbiter EPS assumptions
13.2.2.1 Assumption 1: availability & provision of 3 eMMRTGs
There are risks to this assumption as follows:
Pu-238 availability
"Mission mode" --->Closest
approach
Neptune
Closest
approach
Triton (1)
Closest
approach
Triton (2)
Comms
(duration per
24hr period)
Nominal
Science
Instruments sys. mode IPCA IMCA1 IMCA2 ISCom IN
Platform sys. mode ObM ObM ObM ComM SaM
Mission mode duration 81.3 22.0 2.0 4.5 Remainder hrs
Instruments av. power 145 166 218 121 18 W
Instruments incl maturity margin 145 166 218 121 18 W
Platform av. power 194 194 194 353 142 W
Platform incl maturity margin 194 194 194 353 142 W
Total av. power incl maturity margin 339 359 412 474 160 W

Ice Giants CDF Study Report: CDF-187(C)
January 2019 page 165 of 431
ESA UNCLASSIFIED – Releasable to the Public
U.S. stocks of Pu-238 radioisotope fuel have been reducing since cessation of manufacture in the 1980s. A new programme to restart production is now underway, but Pu-238 remains a scarce resource that is, in effect, competed for by different mission proposals.
The NASA Ice Giants report, (RD[1] section D.5.1) states: “as of 2016 DOE can fuel 4 generators including the one for the Mars 2020” [implying availability of 3 generators for an Ice Giants mission]. In order to provide fuel for an additional 2 RTGs for a total 5 RTGs [for Ice Giants], it would require approx. 6 additional years for fuel processing”
Furthermore, RD[28] states “DOE officials said they now expect to reach full [1.5 kg/yr] production no earlier than 2025 with a late completion date remaining in 2026”.
It can be concluded that a mission concept including 3 or more RTGs for a NASA element plus 3 RTGs for a European element is dependent on both good performance of the DOE fuel programme, and prioritisation of the mission within the NASA strategy.
Ground facilities and integration
The NASA Ice Giants report [JPL D-100520] states: “no more than 4 RPS into a spacecraft are recommended”. This is based on maximum storage capacity (both at INL and KSC) and availability of doors in launcher fairing. In addition, side-by-side configuration for the two complementary orbiters would not allow a late integration of RTGs. This point is one reason to favour a vertical stack rather than a side-by-side concept for a two-orbiter configuration.
13.2.2.2 Assumption 2: EOM power output of one eMMRTG = 90 W
The enhanced MMRTG (eMMRTG) is a new version of the device powering the MSL Curiosity rover – it uses a new type of thermoelectric couple, partly motivated by a requirement to decrease the power degradation rate. However, despite the foreseen improvement, the power output reduction from the eMMRTG will be very significant over a mission of ~15 years. Furthermore, because the eMMRTG is a new development, the long term performance characteristics have significant uncertainty.
Recent references give EODL end-of-design-life (nominally 3 years storage +14 year mission) power estimates in the range of 80 to 100W.
For this Ice Giants study, 90W EOM end-of-mission (15 years after launch) is assumed.
Most recently, in an abstract submitted to the 2019 IEEE Aerospace Conference, 77 W at EODL is mentioned as the requirement.
In conclusion, the 90 W at EOM assumption is subject to later refinement and/or confirmation. An uncertainty level of ~15% seems appropriate at the time of writing.
13.2.2.3 Major EPS trade-off
The most fundamental EPS design option is:
To embark little or no secondary energy storage (rechargeable batteries), and therefore constrain the spacecraft system and mission power requirements to be always below the RTG power output.

Ice Giants CDF Study Report: CDF-187(C)
January 2019 page 166 of 431
ESA UNCLASSIFIED – Releasable to the Public
This is the classical approach of USA deep space probes e.g. Voyager, Cassini, New Horizons. In some cases a large high-voltage capacitor bank provides for very-short-term power spikes (e.g. turn-on in-rush), but there is no battery.
Or,
To run the mission functionality in a periodic way, from secondary batteries, at power levels exceeding the RTGs output. Interspersed with semi-dormant recharge periods.
This is the approach of MSL Curiosity rover.
The power requirements of the science instruments and the communication subsystem, together with the constraints on number of RTGs available, lead to selection of the second option (battery supported).
13.2.2.4 EPS model
The power subsystem is modelled using ESA TEC-EP simulation platform PEPS. This allows dynamic modelling of full power system with a load profile of unlimited complexity, which is well suited to modelling the situation of the Neptune orbit with the complex periodical concept of operations.
The schematic representation of the power system model is shown in Figure 13-1. The model was used to find the required battery energy, and also the maximum duration of the communication mode that could be supported in a periodic way, once in every 24 hours.
Figure 13-1: Schematic representation of the PEPS power system model for Ice Giants Orbiter
Figure 13-2 shows an example of the simulation results output. It begins with the Neptune close approach, in which the electrical load profile flip-flops between science

Ice Giants CDF Study Report: CDF-187(C)
January 2019 page 167 of 431
ESA UNCLASSIFIED – Releasable to the Public
and communications modes, relying on provision of stored energy and discharging the battery to 20% SOC. At 120 hours the load switches to flip-flop between Communications and Nominal Science profiles, which provides a slow battery recharge in a sawtooth pattern.
Figure 13-3 shows the EPS model results for one full 50-day orbit (Triton approach at ~650 hours): Battery is fully charged just before orbit completion, showing that the energy demand is maximised w.r.t. the energy available.
These results were obtained with a battery size of 19.8 kWh without redundancy (21.8 kWh including 10% string redundancy). The duration of the communications mode is 3.2 hours in every 24 hour period.
Figure 13-2: PEPS model results showing the Neptune approach (between 20 and 120 hours)
Figure 13-3: PEPS model results for 1 full 50-day orbit (Triton approach at ~650 hours)

Ice Giants CDF Study Report: CDF-187(C)
January 2019 page 168 of 431
ESA UNCLASSIFIED – Releasable to the Public
13.2.3 Baseline Design
13.2.3.1 Battery
The battery is sized assuming new-generation (but already qualified) space large-format Li-ion cells with “NCA” (nickel-cobalt-aluminium) positive electrode chemistry for low calendar ageing. It is large, so is split into four modules.
Table 13-11: Probe battery mass and size calculation (based on assumption of large-format Li-ion space-qualified cells)
13.2.3.2 PCDU
Mass and size estimation is based very approximately on the Medium Modular Power System from TERMA A/S, with functionality tailored to this case.
Table 13-12: Orbiter PCDU mass and size estimates (based very approximately on Medium Modular Power System by Terma A/S)
BOL cell energy 182 Wh
Cell mass 1.079 kg
BOL at cell level 169 Wh/kg
packaging factor cells-to-battery 1.26
BOL at battery level 134 Wh/kg
Calendar plus cycling deg 0.995 per year
Mission duration 15 years
EOL at cell level 156 Wh/kg
EOL at battery level 124 Wh/kg
Battery density 0.92 g/cc
Battery mass 176 kg
Battery volume 190.884444 litres
Number of batteries 4
Battery mass 43.9 kg
Battery volume 48 litres
Battery Height 265 mm
Battery width 235 mm
Battery length 766 mm
TOTAL all
batteries
Mass, kg # of Total
per module modules mass, kg
Equipment power distribution module 0.570 2 1.1
Pyro firing module 0.476 1 0.5
"RTG power control module" (mass of an APR MPPT module assumed) 0.500 4 2.0
BCDR module 0.550 2 1.1
"Power interface module" (mass of BDR module assumed) 0.575 2 1.2
MIL1553 Interface module 0.458 2 0.9
Mass of all modules 6.78 kg
Total mass of PCDU incl backplane and structure 10.29 kg
Width 0.235 metres
Height 0.156 metres
Length 0.329 metres
volume 12.1 litres
density 0.85 g/cc

Ice Giants CDF Study Report: CDF-187(C)
January 2019 page 169 of 431
ESA UNCLASSIFIED – Releasable to the Public
13.2.3.3 Resistive power shunts
RTGs must be subject to a reasonably constant load (close to the maximum power point) in order to maintain internal temperatures within specification. Therefore, the power conditioning system must include resistive shunts for the dissipation of excess power whenever is it not used by the spacecraft electrical equipment. It is assumed that both internal and external resistive shunts are included, for spacecraft thermal management reasons.
13.2.3.4 RTGs
Three USA eMMRTGs are baselined. See Figure 13-4 and Table 13-13.
Figure 13-4: eMMRTG – courtesy of NASA
Table 13-13: eMMRTG characteristics
Property Value
Diameter (fin tip to tip) 0.65 m
Length 0.69 m
Mass 45 kg
BOM power 145 Wel
Estimated EODL power3-year storage + 14-year mission
> 90 Wel
BOL specific power ~3.5 Wel/kg
Power degradation rate 2.5% /year
Allowable flight voltage envelope 22-34 V
Heat rejection in vacuum BOM 1854 Wth
Heat rejection in vacuum EODL 1649 Wth
Fin root temperature in deep space 420 K
Max allowable fin root temperature 473 K

Ice Giants CDF Study Report: CDF-187(C)
January 2019 page 170 of 431
ESA UNCLASSIFIED – Releasable to the Public
13.2.4 List of Equipment
Table 13-14: EPS Equipment list (Neptune Orbiter)
13.2.5 Options
13.2.5.1 Number of RTGs
An analysis was performed to determine if the mission was feasible with only 2 eMMRTGs.
The energy budget could not be balanced, even with severe restriction of mission functionality (e.g. communication link time). Therefore this option is rejected.
13.2.6 Technology Needs
A PCDU to interface with eMMRTGs will need to be designed, manufactured and qualified, but this involves no unknown factors and is not a new technology development in the sense intended here.
As mentioned above, the eMMRTGs are still in development (with high current TRL), but this aspect is taken care of on the NASA side.
mass (kg) mass margin (%) mass incl. margin (kg)
Bat_Orb (Battery_Orbiter) 43.9 5.0 46.1
Bat_Orb_2 (Battery_Orbiter #2) 43.9 5.0 46.1
Bat_Orb_3 (Battery_Orbiter #3) 43.9 5.0 46.1
Bat_Orb_4 (Battery_Orbiter #4) 43.9 5.0 46.1
EMMRTG (Enhanced_Multi_Mission_RTG) 45.0 10.0 49.5
EMMRTG_2 (Enhanced_Multi_Mission_RTG #2) 45.0 10.0 49.5
EMMRTG_3 (Enhanced_Multi_Mission_RTG #3) 45.0 10.0 49.5
Ext_Pwr_Shnt (External power shunt) 1.0 20.0 1.2
PCDU_Orb (Power Conditioning & Distribution Unit_Orbiter) 10.3 20.0 12.4
Res_Pwr_Shnt (Resisitive power shunt) 1.0 20.0 1.2
Res_Pwr_Shnt_2 (Resisitive power shunt #2) 1.0 20.0 1.2
Res_Pwr_Shnt_3 (Resisitive power shunt #3) 1.0 20.0 1.2
Grand Total 324.9 7.7 350.0
Other parameters
TIDS len diam height wid P_on P_stby TRL
Bat_Orb (Battery_Orbiter) 4000 766 0 265 235 7
Bat_Orb_2 (Battery_Orbiter #2) 4000 766 0 265 235 7
Bat_Orb_3 (Battery_Orbiter #3) 4000 766 0 265 235 7
Bat_Orb_4 (Battery_Orbiter #4) 4000 766 0 265 235 7
EMMRTG (Enhanced_Multi_Mission_RTG) 690 650 0 0 4
EMMRTG_2 (Enhanced_Multi_Mission_RTG #2) 690 650 0 0 4
EMMRTG_3 (Enhanced_Multi_Mission_RTG #3) 690 650 0 0 4
Ext_Pwr_Shnt (External power shunt) 0 200 0 10 40 0 0 5
PCDU_Orb (Power Conditioning & Distribution Unit_Orbiter) 50 329 0 156 235 24 24 4
Res_Pwr_Shnt (Resisitive power shunt) 0 200 0 10 40 0 0 5
Res_Pwr_Shnt_2 (Resisitive power shunt #2) 0 200 0 10 40 0 0 5
Res_Pwr_Shnt_3 (Resisitive power shunt #3) 0 200 0 10 40 0 0 5

Ice Giants CDF Study Report: CDF-187(C)
January 2019 page 171 of 431
ESA UNCLASSIFIED – Releasable to the Public
14 NEPTUNE TELECOMMUNICATIONS
14.1 Atmospheric Probe
14.1.1 Requirements and Design Drivers
The requirements for the telecommunication subsystem are shown below:
SubSystem Requirements
Req. ID Statement Parent ID
COM-010 The telecommunication subsystem shall be able to receive a telemetry (TM) data stream from the data handling system and to transmit this data to the Orbiter.
COM-020
The Probe-to-Orbiter link shall adopt a residual carrier signal.
Rationale: a residual carrier signal has simpler acquisition and tracking with respect to suppressed carrier signals, and it allows to perform signal detection by Earth Radiotelescopes for Probe aliveness.
COM-030 The Probe shall be able to transmit all generated data from instruments (payload telemetry) and the system (housekeeping telemetry) to the Orbiter.
COM-040 The transmitter function shall be hot redundant.
The main design drivers for the communication subsystem can be identified in the followings:
The required bitrate: COM-030 requires to size the bitrate to a minimum value so that all generated data can be transmitted to the Orbiter. This will drive the minimum radiofrequency (RF) power for transmission, and thus the sizing of the power subsystem.
Orbiter antenna and pointing capabilities: for meeting the minimum bitrate (COM-030), the Orbiter antenna and pointing capabilities will drive the antenna sizing of the probe, and the minimum RF power for transmission (and thus also the sizing of the power subsystem).
14.1.2 Assumptions and Trade-Offs Assumptions
1 The Orbiter antenna has an antenna aperture > [m] that is pointed in the Probe direction.
2 The worst case noise temperature seen by the orbiter receiver, caused by Neptune, is 1000 K.
3 The worst case atmospheric losses experienced by the Probe-to-Orbiter link is 10.6 dB.
4 The required bitrate for transmitting all generated data (COM-030) is 2 kbps
5 The change of transmitter (due to possible failure) is recognized by the FDIR.

Ice Giants CDF Study Report: CDF-187(C)
January 2019 page 172 of 431
ESA UNCLASSIFIED – Releasable to the Public
Concerning Assumption 1, As the NASA Orbiter communication subsystem design (for the Probe-to-Orbiter link) is out of the scope of the CDF study, it has been assumed that the minimum antenna aperture (that drives the Orbiter antenna dimension) is (greater than or) equal to m that corresponds (for instance) to the following antenna gains:
~14.5 dB at UHF, 435-450 MHz,
~29 dB at S-Band, 2290 MHz,
~40 dB at X-Band, 8450 MHz.
Concerning Assumption 2 and 3, they have been derived by the CDF study PEP (RD[7]), for which a preliminary estimation of noise temperature and atmospheric losses on Neptune was done. No re-assessment of such values has been done during the CDF IceGiants, and the consolidation of such values should be done in next study phases.
Assumption 4 comes from the computation done at system level of the data volume against transmission time. In particular, based on the input provided by Mission analysis, a minimum bitrate of 2 kbps was derived.
Finally, concerning Assumption 5, it has been assumed that the FDIR can recognize possible failures of the transmitter, and hence it is able to switch to the redundant one without the need of having a receiving link (Orbiter-to-Probe).
14.1.2.1 Frequency allocation trade-offs
During the CDF study, a trade-off on the following frequency bands was considered:
UHF, 435-450 MHz,
S-Band, 2200-2300 MHz,
X-Band, 8025-8500 MHz.
While the S- and X-Band could limit antenna dimensions, the UHF has the following advantages:
Solid state power amplifier (SSPA) with RF output power up to 80 W already qualified (BioMass heritage)
Better omni-directional coverage of the antenna (or array of antennas) on the Probe side
Huygens and ExoMars heritage concerning UHF transmitters
Typically lower mass of units and components w.r.t. S- and X-Band ones
Compatibility with UHF Radiotelescope arrays for Probe aliveness signal detection.
With reference to the first advantage, Table 14-1 shows a link budget comparison between UHF and X-Band, considering the best amplifier option for both cases. In particular, the link budget assumes:
80 W for UHF, 12 W for X-Band
The worst case distance (Probe-to-Orbiter)
An LGA on the probe side
An (equivalent) antenna aperture of 1.5 m on the Orbiter side.

Ice Giants CDF Study Report: CDF-187(C)
January 2019 page 173 of 431
ESA UNCLASSIFIED – Releasable to the Public
From the link budget, it can be seen that UHF, thanks to the SSPA heritage, allows to achieve the required 2 kbps with a low gain antenna (LGA) on the Probe (that maximises antenna coverage). Hence, UHF has been selected for the baseline design.
Table 14-1: UHF versus X-Band trade-off for the probe, in terms of achievable bitrate
14.1.3 Baseline Design
The baseline design of the Probe UHF communication subsystem foresees an architecture as shown in Figure 14-1 and includes:
Two UHF transmitters
Two SSPAs
One array of LGA UHF antennas (on the Probe backshell) patch-like providing a low gain coverage
One UHF LGAs
The RFDN that interconnects all the aforementioned devices.
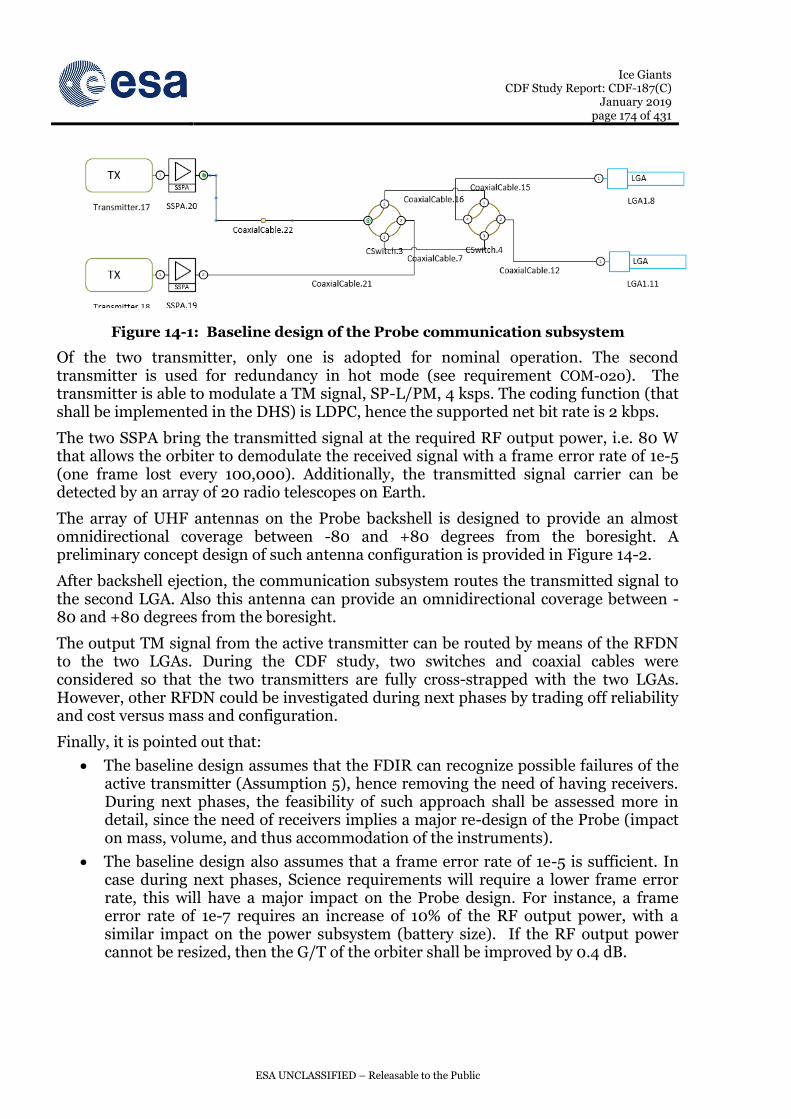
Ice Giants CDF Study Report: CDF-187(C)
January 2019 page 174 of 431
ESA UNCLASSIFIED – Releasable to the Public
Figure 14-1: Baseline design of the Probe communication subsystem
Of the two transmitter, only one is adopted for nominal operation. The second transmitter is used for redundancy in hot mode (see requirement COM-020). The transmitter is able to modulate a TM signal, SP-L/PM, 4 ksps. The coding function (that shall be implemented in the DHS) is LDPC, hence the supported net bit rate is 2 kbps.
The two SSPA bring the transmitted signal at the required RF output power, i.e. 80 W that allows the orbiter to demodulate the received signal with a frame error rate of 1e-5 (one frame lost every 100,000). Additionally, the transmitted signal carrier can be detected by an array of 20 radio telescopes on Earth.
The array of UHF antennas on the Probe backshell is designed to provide an almost omnidirectional coverage between -80 and +80 degrees from the boresight. A preliminary concept design of such antenna configuration is provided in Figure 14-2.
After backshell ejection, the communication subsystem routes the transmitted signal to the second LGA. Also this antenna can provide an omnidirectional coverage between -80 and +80 degrees from the boresight.
The output TM signal from the active transmitter can be routed by means of the RFDN to the two LGAs. During the CDF study, two switches and coaxial cables were considered so that the two transmitters are fully cross-strapped with the two LGAs. However, other RFDN could be investigated during next phases by trading off reliability and cost versus mass and configuration.
Finally, it is pointed out that:
The baseline design assumes that the FDIR can recognize possible failures of the active transmitter (Assumption 5), hence removing the need of having receivers. During next phases, the feasibility of such approach shall be assessed more in detail, since the need of receivers implies a major re-design of the Probe (impact on mass, volume, and thus accommodation of the instruments).
The baseline design also assumes that a frame error rate of 1e-5 is sufficient. In case during next phases, Science requirements will require a lower frame error rate, this will have a major impact on the Probe design. For instance, a frame error rate of 1e-7 requires an increase of 10% of the RF output power, with a similar impact on the power subsystem (battery size). If the RF output power cannot be resized, then the G/T of the orbiter shall be improved by 0.4 dB.

Ice Giants CDF Study Report: CDF-187(C)
January 2019 page 175 of 431
ESA UNCLASSIFIED – Releasable to the Public
Any improvement of the Orbiter G/T could lead to major reduction of the peak power consumption. For instance, if the Orbiter G/T is increased by 1, 2, or 3 dB, the RF output power can be decreased by -20%, -37%, or -50% respectively.
Similarly, any reduction of the bitrate (that is sized according to Assumption 4) leads to an equal percentage reduction of the RF output power. For instance, 0.5 kbps leads to -75% RF output power.
Figure 14-2: A first guess for the sizing of UHF conformal array (backshell seen from the the top)
14.1.3.1 Technical budgets
In this section a summary of the main technical budgets for the Probe communication subsystem is reported.
Table 14-2 reports the mass budget, and it can be seen that the mass of the communication subsystem has been estimated to 12.55 kg (including margins).
Table 14-2: Probe communication subsystem mass budget
Table 14-3 shows the power budget. For the communication subsystem, the worst case peak power consumption is when one of the two transmitters is turned ON, i.e., 267 W. However, it is pointed out that this estimation was done considering a low efficiency of the SSPA, and such value should be reviewed during next phases based on BioMass heritage.
mass (kg) mass margin (%) mass incl. margin (kg)
Probe (Probe) 11.00 14.05 12.55
DM (Descent Module) 7.20 16.18 8.37
RFDN_UHF (UHF Radio Frequency Distribution Network) 0.50 10.00 0.55
UHF_LGA_Helix (UHF Low Gain Antenna) 1.50 5.00 1.58
UHF_SSPA (UHF Solid State Power Amplifier) 0.80 20.00 0.96
UHF_SSPA_2 (UHF Solid State Power Amplifier #2) 0.80 20.00 0.96
UHF_TX (UHF Transmitter) 1.80 20.00 2.16
UHF_TX_2 (UHF Transmitter #2) 1.80 20.00 2.16
UHF_LGA (UHF Patch LGA) 3.80 10.00 4.18

Ice Giants CDF Study Report: CDF-187(C)
January 2019 page 176 of 431
ESA UNCLASSIFIED – Releasable to the Public
Table 14-3: Probe communication subsystem power budget
The preliminary link budget for Probe-to-Orbiter communications is shown in Table 14-1 for the UHF transmitter.
Finally, Table 14-4 shows the link budget for having carrier detection on ground by means of an array of Radio telescopes on Earth. The considered array, as reference, is the giant metrowave radio telescopes (GMRT) located in Pune (Narayangaon), India. It can be seen that, for 80 W of RF output power, an array of 20 antennas is sufficient to provide 4.6 dB of carrier-to-noise power spectral density ratio (C/N0) for carrier detection.
Table 14-4: Link budget computation for GMRT
14.1.4 List of Equipment
The transmitter considered for the baseline design is a modified version of the ExoMars UHF transceiver, limited to the transmitter module, and without the Proximity-1 data link implementation (open-loop transmission). As the technology is well consolidated, and requiring just a dedicated unit implementation, the TRL is estimated as 4, and for IceGiants an EQM approach is expected.
Power (W)
P_on P_stby
Probe (Probe) 543.33 0.00
DM (Descent Module) 543.33 0.00
RFDN_UHF (UHF Radio Frequency Distribution Network) 0.00 0.00
UHF_LGA_Helix (UHF Low Gain Antenna) 0.00 0.00
UHF_SSPA (UHF Solid State Power Amplifier) 266.67 0.00
UHF_SSPA_2 (UHF Solid State Power Amplifier #2) 266.67 0.00
UHF_TX (UHF Transmitter) 5.00 0.00
UHF_TX_2 (UHF Transmitter #2) 5.00 0.00
UHF_LGA (UHF Patch LGA) 0.00 0.00
PARAMETER Value Notes
RANGE [AU] 31.4 Worst case AU
RANGE [km] 4697373149.4
FREQUENCY [MHz] 450
TX POWER [W] 80
TX ANTENNA GAIN [dB] -0.63 LGA
TX LOSSES [dB] 1 Preliminary estimation
TX EIRP [dBW] 17.40 Calculated
PATH LOSSES [dB] 278.94 Calculated
ATMOSPHERE LOSS [dB] 10.65 Best estimation
GROUND ARRAY 10.00 20 antennas, Taking into account 50% efficiency
RX G/T [dBK] 55.30
DEMOD. LOSS [dB] 1.00 Estimation
MOD. LOSS [dB] 6.06 Suppressed carrier modulation
C/N0 [dBK] 4.64

Ice Giants CDF Study Report: CDF-187(C)
January 2019 page 177 of 431
ESA UNCLASSIFIED – Releasable to the Public
Figure 14-3: ExoMars UHF transceiver
The SSPA considered for the baseline design comes from BioMass heritage, and it is an SSPA using the high power semiconductor gallium nitride (GaN). It was implemented during the GREAT2 initiative. Such amplifier comes in two packaging solution, 15 W and 80 W (here considered). The corresponding TRL is 8. The environmental conditions of Uranus and Neptune needs to be assessed for possible delta-qualifications needed.
The backshell antenna is a conformal array technology, made of patches. The technology is well proven, TRL 5, but a delta-design shall be done specifically for IceGiant. Thus an EQM approach is expected.
Instead, for the second LGA a quadrifilar helix antenna (based on ExoMars 2016 heritage) has been considered. Such antenna can provide >0 dB between -80 and 80 degrees (as shown in Figure 14-4) from boresight, and has TRL 9 for Mars. The environmental conditions of Uranus and Neptune needs to be assessed for possible delta-qualifications needed.
Figure 14-4: Quadrifilar helix antenna gain considered
Finally the RFDN, composed by switches and coaxial cables, still rely on ExoMars heritage, and it has TRL 9 for Mars. The environmental conditions of Uranus and Neptune needs to be assessed for possible delta-qualifications needed.

Ice Giants CDF Study Report: CDF-187(C)
January 2019 page 178 of 431
ESA UNCLASSIFIED – Releasable to the Public
14.1.5 Options
The main option is an UHF communication subsystem with a resized RF output power. In particular, during the CDF study a bitrate of 2 kbps was assumed, that has driven the RF output power and, in turn, the size of the power subsystem.
In this respect, during Phase A it is strongly recommended to review the instrument data generation, and trade-off the number of instruments against required bitrate. Notice however, that the RF output power should not be decreased below 56W, otherwise the carrier detection by means of an array of telescopes could not be feasible (see GMRT link budget in Section 14.1.3.1).
14.1.6 Technology Needs
The following table shows the technology needs.
|~T Technology Needs
* Equipment
Name & Text Reference
Technology Supplier (Country)
TRL Funded
by Additional
Information
* Baseline UHF transmitter QinetiQ 4 ExoMars heritage
* Baseline UHF antenna array on Probe backshell
TAS-I 5
Studied in the framework of
ECOMTEC for EDL, ESA contract
4000113507/NL/FE
14.2 Orbiter
14.2.1 Requirements and Design Drivers
SubSystem Requirements
Req. ID Statement Parent ID
COM-010
The telecommunication subsystem shall be able to perform the following functions regardless of the spacecraft’s attitude, throughout all the mission phases:
Receive and demodulate the uplink signal from the ground segment and transmit the telecommands (TC) to the data handling system as defined in RD[29] and RD[30].
Receive a telemetry (TM) data stream from the data handling system and transmit this data to the ground segment as defined in RD[29] and RD[31],
Receive, transponder, and re-transmit a ranging signal as defined in RD[32],
Provide two-way Doppler.

Ice Giants CDF Study Report: CDF-187(C)
January 2019 page 179 of 431
ESA UNCLASSIFIED – Releasable to the Public
SubSystem Requirements
Req. ID Statement Parent ID
COM-020 Active (hot) redundancy shall be provided for telecommand (uplink) and passive (cold) redundancy for telemetry (downlink).
COM-030
The link budget margins shall be as defined in RD[29]:
Nominal > 3 dB
Mean 3*sigma > 0 dB
RSS worst case > 0 dB
ECSS-E-ST-50-o5C Req. 8.3.2-i
COM-040 The frequency assignment shall be done in coordination with the Space Frequency Coordination Group (SFCG) and in compliance to its recommendations and resolutions RD[33].
The main design drivers for the communication subsystem was the Data volume return: the amount of data directly drives the minimum RF output power that, in turn, drives the peak power consumption.
14.2.2 Assumptions and Trade-Offs
Assumptions
1 Cryo-cooling is adopted in the ground segment for improving G/T
2 A G/S antenna array of 2 elements (as minimum) is adopted for receiving the TM signal
3 A TM bitrate of 40 kbps is sufficient for achieving the Science requirements
4 The antenna diameters shall be less than 3 m
Concerning Assumption 1, ESA is planning an improvement for the ESTRACK network. The key item is the replacement of the feed and low noise amplifier subsystem with a single integrated subsystem including a portion of the feed and the low noise amplification, both cooled down at cryo temperature, hence called “cryo feed” or “cry cooling”. The upgrade will reduce the system noise temperature, especially acting on the lossy portion of the feed which today, due to its ambient temperature, is a major noise contributor. Quantitatively speaking, the following G/T had been assumed during the CDF study:
G/T>52.5 dBK for a 35 m G/S in X-Band (8400-8450 MHz),
G/T>61.3 dBK for a 35 m G/S in Ka-Band (31 800-32 300 MHz).
Concerning Assumption 2, the baseline RF link budget assumed multiple co-located ground stations in an array configuration. This situation can take place in case there are multiple 35 meters ground stations co-located in the same premises (e.g. Cebreros site or Malargue site). Then the technique relies in receiving the same signal from the multiple sites and combining it appropriately. The theoretical gain is then equal to the number of stations used for combining the signal. Two G/S lead therefore to a theoretical improvement of 3 dB in the G/T, although lower values are actually expected because of the implementation losses. In this respect, during the CDF study it has been considered that an array of 2 elements is able to provide the following G/T values:

Ice Giants CDF Study Report: CDF-187(C)
January 2019 page 180 of 431
ESA UNCLASSIFIED – Releasable to the Public
G/T>54 dBK in X-Band,
G/T>63.8 dBK in Ka-Band.
Assumption 3 comes from the computation done at system level of the data volume against transmission time and ground station visibility and availability. In particular, based on the input provided by Mission Analysis, a minimum bitrate of 40 kbps had been derived for achieving the Science requirements.
Finally, assumption 4 comes from Deep Space mission heritage. Although an antenna with diameter larger than 3 m could provide better gains, thus increasing the bitrate, on the other hand it complicates the S/C accommodation, configuration, and pointing requirements. For instance:
An antenna of 3.5 meters could provide +35% higher bitrate, but the pointing requirement would be <0.04 deg, and mass higher by +35%,
An antenna of 4.0 meters could provide +77% higher bitrate, but the pointing requirement would be <0.03 deg, and mass higher by +77%.
Hence, during the CDF study an antenna diameter of maximum 3 meters was considered. However it is pointed out that in case during Phase A the required RF output power or bitrates could become critical, the trade-off on the antenna diameter can be re-opened.
14.2.2.1 Frequency allocation trade-off
During the CDF study a frequency allocation trade-off was done. In particular the following two options were considered:
X/X option: uplink in 7145-7190 MHz, and downlink in 8400-8450 MHz,
X/X/Ka option: uplink in 7145-7190 MHz, TM downlink in 8400-8450 MHz, and payload TM downlink in 31 800-32 300 MHz.
These options were considered for different RF output powers in terms of maximum bitrate, TRL, ground operations, mass, power, and cost. The trade-off is summarised in Table 14-5. It can be seen that currently the trade-off is driven by Assumption 4, i.e., the minimum TM bitrate. Hence, the only feasible option is X/X/Ka with a travelling wave tube amplifier able to provide 100 W of RF output power, although such TWTAs have TRL 2 (in the ESA member states).
Table 14-5: Frequency allocation trade-off summary
14.2.3 Baseline Design
The baseline design of the X-Band communication subsystem foresees architecture as shown in Figure 14-5 and includes:
ID Allocation Max TM bitrate TRL G/S Mass Power [W]Cost
1 X/X, 35W 5.6 kbps 9 Cryo+Array 52-57 110-115
2 X/X, 65W 10.5 kbps 9 Cryo+Array 52-57 165-170
3 X/X, 80W 12.9 kbps 9 Cryo+Array 52-57 195-200
4 X/X/Ka, 35W 14.1 kbps 9 Cryo+Array 60-65 110-115
5 X/X/Ka, 100W 42.6 kbps 2 (TWTA) Cryo+Array 60-65 200-220
6 Ka/Ka, 35W 14.1 kbps 2 (XPND) No uplink 52-57 110-115
Best
Good
Poor
Not feasible

Ice Giants CDF Study Report: CDF-187(C)
January 2019 page 181 of 431
ESA UNCLASSIFIED – Releasable to the Public
Two X/X/Ka transponders
Two LGAs
One HGA
Two Ka-Band TWTAs, and two X-Band TWTAs
The RFDN that interconnects all the aforementioned devices.
Of the two transponders, only one is adopted for nominal operation. The second transponder is used for redundancy: its transmitter is operating in cold mode and its receiver in hot mode (see requirement COM-020).
Figure 14-5: Baseline design for the Orbiter communication subsystem
The output TM signal from the active transmitter is amplified by means of TWTAs, either in X-Band for standard TT&C, or in Ka-Band for payload telemetry. The TWTA RF output power is 65 W for X-Band, and 100 W for Ka-Band.
The uplink and downlink telemetry signals are routed between the transponders and the LGAs (for low bit rate TM) or the HGA (for high bit rate TM) by means of the RFDN. The two LGAs are on opposite directions and polarizations for obtaining an almost omnidirectional coverage.
The RFDN consist of hybrids, switches, and waveguides that interconnect all the aforementioned equipment. A possible selection of the RFDN is provided in Figure 14-5, but it is pointed out that a more detailed RFDN design shall be performed during next phases by trading off reliability, dimension, mass, and power losses and its optimisation is out of the scope of the CDF study.

Ice Giants CDF Study Report: CDF-187(C)
January 2019 page 182 of 431
ESA UNCLASSIFIED – Releasable to the Public
Finally, it is highlighted that the communication subsystem is also interfaced (by means of the RFDN) to the KaT, for supporting Radio Science with Ka-Band uplink and downlink. In particular, the KaT with diplexer shall be connected to the upper-left hybrid port shown in the upper-right corner of Figure 14-5. With this approach, the communication subsystem can support three radio science links (X/X, X/Ka, and Ka/Ka) simultaneously.
14.2.3.1 Main functions and operations
The communication subsystem is able to provide 500 bps in uplink and 1 kbps in downlink in X-Band at the farthest distance from Earth by means of the HGA. Additionally, the Ka-Band link can provide 42.5 kbps.
During safe mode it was considered that spacecraft can perform Sun-acquisition and Earth pointing of the HGA, hence still allowing 500 bps and 1 kbps in uplink and downlink respectively. In case of star-tracker failures, or other limitations, the HGA pointing to Earth can also rely on S/C strobing.
Finally it is pointed out that, differently from other missions, power flux density constraints shall not drive the RFDN design. The S/C telemetry RF link will be only activated in proximity of Neptune, while all status checks and communications before then will be by means of the umbilical link.
14.2.3.2 Technical budgets
Table 14-6 shows the mass budget for the communication subsystem. It can be seen that mass is estimated 72 kg, including margin.
Table 14-6: Mass budget for the communication subsystem
Table 14-7 shows the power budget for the communication subsystem. The worst case peak power consumption is when performing radio science, i.e., when both the X-Band and Ka-Band link are active. In such case the consumption is about ~350 W.
mass (kg) mass margin (%) mass incl. margin (kg)
SC (Spacecraft) 64.20 11.59 71.64
HGA (High Gain Antenna) 33.00 10.00 36.30
KaEPC (Ka-Band Electronic Power Conditioning) 1.30 20.00 1.56
KaEPC_RED (Ka-Band Electronic Power Conditioning - Redundant) 1.30 20.00 1.56
KaTWT (Ka-Band Traveling Wave Tube) 0.80 20.00 0.96
KaTWT_RED (Ka-Band Traveling Wave Tube - Redundant) 0.80 20.00 0.96
LGA_LHCP (Low Gain Antenna - LHCP) 0.90 5.00 0.95
LGA_RHCP (Low Gain Antenna - RHCP) 0.90 5.00 0.95
RFDN (Radio Frequency Distribution Network) 13.00 20.00 15.60
XEPC (X-Band Electronic Power Conditioning) 1.30 5.00 1.37
XEPC_RED (X-Band Electronic Power Conditioning - Redundant) 1.30 5.00 1.37
XKa_XPND_RED (X/X/Ka-Band Transponder - Redundant) 4.00 5.00 4.20
XKaXPND (X/X/Ka-Band Transponder) 4.00 5.00 4.20
XTWT (X-Band Traveling Wave Tube) 0.80 5.00 0.84
XTWT_RED (X-Band Traveling Wave Tube - Redundant) 0.80 5.00 0.84
Grand Total 64.20 11.59 71.64

Ice Giants CDF Study Report: CDF-187(C)
January 2019 page 183 of 431
ESA UNCLASSIFIED – Releasable to the Public
Table 14-7: Power budget for the communication subsystem
14.2.4 List of Equipment
The transponder considered for the baseline design is the X/X/Ka-Band transponder of BepiColombo developed by Thales-Italy. The transponder, shown in Figure 14-6, has TRL 9 and meets all performance and functional requirements foreseen for IceGiant.
Figure 14-6: X-Band Transponder
Similarly, a possible solution for the X-Band LGAs is manufactured by TRYO and is shown in Figure 14-7. Their mass is 0.4 kg, diameter 90 mm, and height 240 mm, and they have TRL 9. Instead, the HGA of 3 meters can be a resized version of the one adopted in BepiColombo.
Power (W)
P_on P_stby
SC (Spacecraft) 668.91 0.00
HGA (High Gain Antenna) 0.00 0.00
KaEPC (Ka-Band Electronic Power Conditioning) 9.07 0.00
KaEPC_RED (Ka-Band Electronic Power Conditioning - Redundant) 9.07 0.00
KaTWT (Ka-Band Traveling Wave Tube) 172.41 0.00
KaTWT_RED (Ka-Band Traveling Wave Tube - Redundant) 172.41 0.00
LGA_LHCP (Low Gain Antenna - LHCP) 0.00 0.00
LGA_RHCP (Low Gain Antenna - RHCP) 0.00 0.00
RFDN (Radio Frequency Distribution Network) 0.00 0.00
XEPC (X-Band Electronic Power Conditioning) 5.90 0.00
XEPC_RED (X-Band Electronic Power Conditioning - Redundant) 5.90 0.00
XKa_XPND_RED (X/X/Ka-Band Transponder - Redundant) 35.00 0.00
XPND_TX (Transponder Transmitter) 20.00 0.00
XPND_RX (Transponder Receiver) 15.00 0.00
XTWT (X-Band Traveling Wave Tube) 112.07 0.00
XTWT_RED (X-Band Traveling Wave Tube - Redundant) 112.07 0.00

Ice Giants CDF Study Report: CDF-187(C)
January 2019 page 184 of 431
ESA UNCLASSIFIED – Releasable to the Public
Figure 14-7: X-Band LGA
Concerning TWTAs for Ka-Band 32 GHz, a European technology development has been considered in the baseline design. In particular, a delta-design based on the TH4606 (shown in Figure 14-8) has been assumed, with a Breadboard+EQM+PFM+FMs approach. Hence, the TRL has been considered equal to 2.
Another possible solution for the TWTA in X-Band is the TH4704C, developed by Thales that relies on Venus and Mars Express heritage and it has TRL 9.
Figure 14-8: TWTA for Ka-Band 32 GHz
Finally, the RFDN elements are developed by different manufacturers, but typically a common procurement at RF harness or communication assembly level can be done. An example is TRYO procurement for hybrids, coaxial cables, and waveguides. All elements have TRL 9.
14.2.5 Options
14.2.5.1 TWTA procurement in non-ESA member states
Currently space qualified TWTAs in Ka-Band, in the ESA member states, have a maximum RF output power of 35 W. Hence, the 100 W TWTA of the baseline design implies a technology development, with a risk due to its low TRL.
As alternative option, a procurement in non-ESA member states can be done. An example, it is the TWTA manufactured by L3 in US, the 999H. According to the information public available, the TWTA could need a delta-qualification and TRL 5 is estimated.
14.2.5.2 IDST transponder
A valid option for the communication subsystem is the use of the integrated Deep-Space transponder (IDST). Recently, the IDST developed the first breadboard, reaching TRL 4, and now a technology development for an EM and mass reduction is being kicked-off.
The IDST provides several improvements with respect the BepiColombo heritage. A preliminary (but not complete) list is:

Ice Giants CDF Study Report: CDF-187(C)
January 2019 page 185 of 431
ESA UNCLASSIFIED – Releasable to the Public
Mass (<3.5 kg) and power reduction, by simplifying the transmitter and receiving chains
Flexible turn-around ratio
Implementation of LDPC in uplink, allowing 1 kbps or higher
On-board radio science (OBRAS)
Radio science in X/X, X/Ka, Ka/X, and Ka/Ka
Wide-band delta-DOR
Regenerative PN-ranging up to 25 Mcps
Acquisition and tracking with larger Doppler values
Autonomous receiver capabilities.
14.2.6 Technology Needs
|~T Technology Needs
* Equipment
Name & Text Reference
Technology Supplier (Country)
TRL Funded
by Additional
Information
* Baseline Ka-Band TWTA
100 W Thales 2
Option Integrated Deep
Space Transponder 4

Ice Giants CDF Study Report: CDF-187(C)
January 2019 page 186 of 431
ESA UNCLASSIFIED – Releasable to the Public
This Page Intentionally Blank

Ice Giants CDF Study Report: CDF-187(C)
January 2019 page 187 of 431
ESA UNCLASSIFIED – Releasable to the Public
15 NEPTUNE DATA HANDLING
IMPORTANT NOTE: Post IFP the design of the DHS for the probe was changed. This has affected the budgets and the DH modes. The latest design is reflected in the following chapter but not flown down to the other domains or the systems chapter.
15.1 Atmospheric Probe
15.1.1 Requirements and Design Drivers
The probe DHS shall be compliant to the following requirements.
Probe DHS Requirements
Req. ID Statement
P-DHS-010 The probe DHS design shall support the Neptune & the Uranus atmosphere probing
P-DHS -020
The probe DHS shall be off during the Orbiter launch phase
DHS -030 The probe DHS, except its timer function, shall be off during the Orbiter cruise phase, except during checkout mode
DHS -050
The probe DHS shall interface and manage the probe instruments that are:
Imaging System Instrument
In Situ Science Package Instrument
Gaz Analyser / Mass Spectrometer Instrument
Magnetometer and Plasma Monitor Instrument
P-DHS -060
The probe DHS design shall not be redundant (TBC)
P-DHS -070 The probe DHS design budget in terms of mass and dimension shall be optimised and reduced to the needs
P-DHS -080
The probe DHS design shall be independent to any mission configuration and it shall support 90 minutes sciences operations with a 64Mbits data volume
P-DHS -090
The probe DHS design shall use technology with a TRL not lower than 6 by 2022
P-DHS -0100
The probe DHS design shall support the following phases:
Cruise (including Check out mode) phase
Coasting phase
Entry & Descent phase
P-DHS -0110
The probe DHS power consumption over all phases shall be minimised.
15.1.2 Assumptions and Trade-Offs
For the launch and cruise to Neptune or Uranus, the probe will be attached to the Orbiter. The power will be transferred from the Orbiter to the probe to keep the probe battery at full charge until separation. A hard-line TM/TC interface allows data

Ice Giants CDF Study Report: CDF-187(C)
January 2019 page 188 of 431
ESA UNCLASSIFIED – Releasable to the Public
exchange between the probe, through the orbiter, and the ground and vice versa for telecommands.
It is assumed that during the Orbiter Launch and cruise phases the probe DHS is not powered permanently, thus it will be in hibernation mode. This mode will limit the power drown from the battery.
It is also assumed that during the Orbiter launch and cruise phases that a probe checkout mode will be possible. This check out mode will allow the monitoring of the probe DHS, the instruments and other sub-systems including the TCS.
Considering requirement P-DHS -0110, the launch and cruise phase is assumed including sub-modes optimising the power consumption. Threeo sub-modes can be identified with a low power option:
Hibernation mode: In this mode, the probe DHS processor and its peripheral components are powered on and initialised. The probe SW is loaded. No science operations are performed.
Check-out mode: In this mode, the probe DHS is receiving TC from the Orbiter, acquiring the probe HK TMs and transmitting it back to the Orbiter.
During the Entry & Descent mode, the probe DHS is on. It is performing the data management of the probe sub-systems and instruments. In this mode, the probe DHS consumethe maximum power budget allocated to it.
It is assumed that no GNC activity is expected from the DHS probe. Moreover, considering the short descent time 90 minutes, it is assumed that not redundant design is envisaged for the probe DHS as the switching time between nominal and redundant design does not fit with the descent time.
Thus, the probe DHS shall implement the following functions:
The computing function supporting the probe SW and related storage environment
The communication function with the 5 probe instruments
The mission Timer function needed to wake up the DHS at the entry time
The probe HK acquisition function of the DHS and the probe instruments
The probe instrument actuator commanding, if needed
The probe IMU TM/TC handling.
For mass and power optimisation, the trade-0ffs are addressed through 2 criteria related respectively to the transmission function and to the mission timer function. These two criteria are:
Criteria A, which is related to the probe timer: Independent Timer vs. a Timer dependant on the CPU oscillator
Criteria B, which is related to the technology used to transfer the science data from probe instrument to the probe storage function: SpW links vs. CAN bus.
The criteria options and related pros & cons are indicated in Table 15-1.

Ice Giants CDF Study Report: CDF-187(C)
January 2019 page 189 of 431
ESA UNCLASSIFIED – Releasable to the Public
Option 1:
Use independent
Probe Timer
Option 2:
Use a timer linked
to the probe CPU oscillator
Option 3:
Use SpW communication technology
Option 4: Use Can bus communication technology
Pros Cons Pros Cons Pros Cons Pros Cons
Criterion A:
Probe Mission Timer
Independent and flexible design
Limited power during descent
Small mass increase due to the extra timer supply
Extra power consumption
Mass limited to the Timer implementation only, Timer supply to be provided by - extra DC/DC during the coast and descent modes of the probe
Criterion B:
Probe DHS bus communication with the instrument
Limited power consumption
Highly reliable communication protocol
Very flexible AIT/AIV exercice as they can be tested and integrated individually
No miniaturised version of connectors
Difficulty to accommodate the 10 SpW cables of the instruments inside the probe
CAN technology is flying with similar functionaity and performances.
High power consumption per node
Table 15-1: Criteria options for DHS
For the first criteria, an activity has been performed by TERMA [RD-7]. It is allowing the provision of a Mission Timer requesting only 5mW. This option is very appealing, considering its flexibility w.r.t to the probe DHS and its very low power need. This option is the preferred one and it is the one proposed and assessed for the probe DHS.
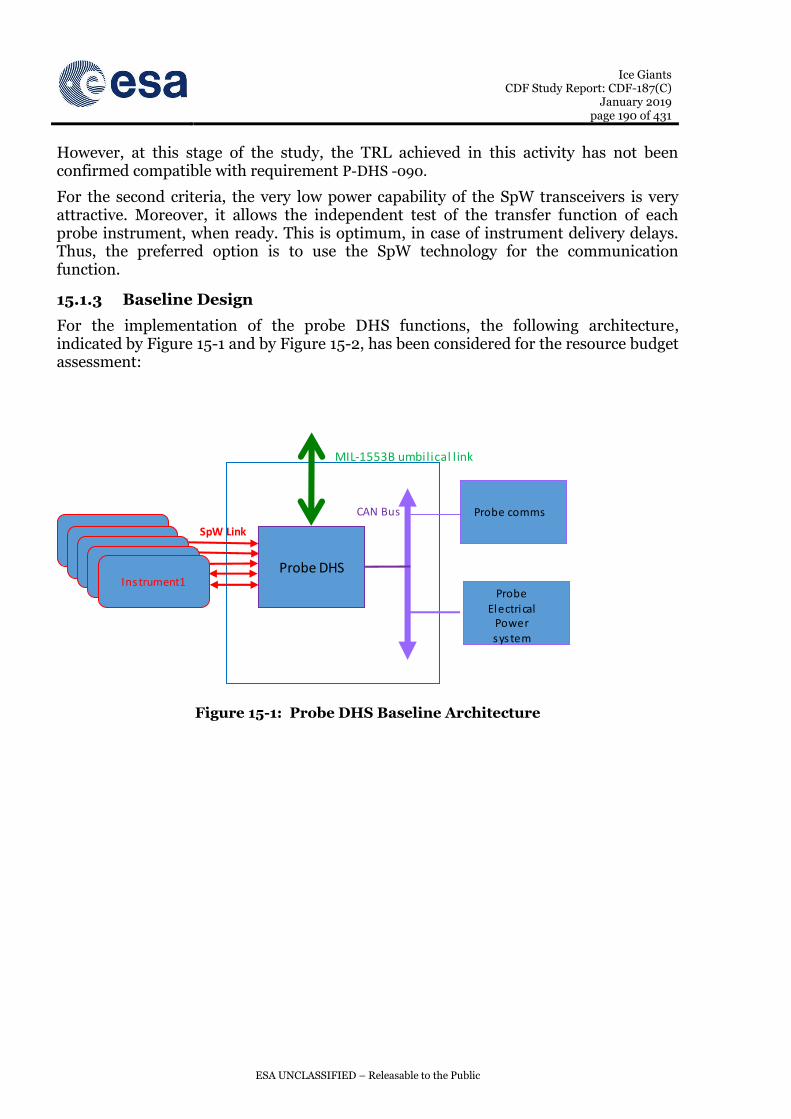
Ice Giants CDF Study Report: CDF-187(C)
January 2019 page 190 of 431
ESA UNCLASSIFIED – Releasable to the Public
However, at this stage of the study, the TRL achieved in this activity has not been confirmed compatible with requirement P-DHS -090.
For the second criteria, the very low power capability of the SpW transceivers is very attractive. Moreover, it allows the independent test of the transfer function of each probe instrument, when ready. This is optimum, in case of instrument delivery delays. Thus, the preferred option is to use the SpW technology for the communication function.
15.1.3 Baseline Design
For the implementation of the probe DHS functions, the following architecture, indicated by Figure 15-1 and by Figure 15-2, has been considered for the resource budget assessment:
Figure 15-1: Probe DHS Baseline Architecture
Instrument1
Probe DPHS
Probe comms
Probe DHS
Probe Electrical
Power system
CAN Bus
Instrument1Instrument1
Instrument1Instrument1
SpW Link
MIL-1553B umbilical l ink

Ice Giants CDF Study Report: CDF-187(C)
January 2019 page 191 of 431
ESA UNCLASSIFIED – Releasable to the Public
Figure 15-2: Probe DHS Detailed Architecture
This probe DHS architecture, depicted by Figure 15-2, is to be implemented on a single board. The architecture board block functions are listed here below:
A Core Processor based on a LEON2-FT or LEON3FT processor and related resources:
o PROM for the SW Boot
o I/O Drivers services
o Non-volatile and Volatile Memories
On-board time generation and synchronisation services
4 SpW links I/F dedicated to the instrument operations and science data acquisition
CAN bus dedicated to the command and control of the probe communication and power sub-system units
RS422 for Telecommand and Telemetries interfaces with the UHF transceiver
MIL 1553 for the Interface with the Orbiter for the monitoring during cruise phase
Mission Micro-Timers
DC/DC
Note: the UHF receiver is considered to be part of the probe communication sub-system.
15.1.4 Probe DHS List of Equipment
The probe DHS list of equipment is actually based on the CDMP box, based on mainly on the 3 non redundant following modules:
DC/DC
Micro-Mission_Timer
Probe Electrical
Power Sub-system
P-DM Instrument1
Instrument1Instrument1
Instrument1
SpW Link
Instrument1
MIL-1553B Umbilical Link with the Orbiter
PCSR Switch
P-RIM
Probe comms
Probe Power
system
Primary Power Bus
I/Os & LPCs
Probe Internal
CAN Bus
Power secondary l ines
Probe IMU
Power Bus from Orbiter

Ice Giants CDF Study Report: CDF-187(C)
January 2019 page 192 of 431
ESA UNCLASSIFIED – Releasable to the Public
Probe-DHS Module (P-DM)
Probe Mission Micro-Timer Module (P-MµTM) based on triple Micro-Timers
Probe Remote Interface Module (P-RIM)
These 3 modules are part of the same and single equipment;
Name Mass (kg) Mass Margin (%) Mass including
margin (kg) P-DM 1 20 1.2
P-MµTM 0.02 x 3 0.024 x 3
P-RIM 0.416 20 0.5 DC/DC 0.8 20 1 Total Mass of CDMP
2.227 2.68
Table 15-2: Probe-DHS Mass Budget
Equipment Name
Power (W) Power Margin (%)
Power Including Margin (W)
P-DM 4 20 4.8
P-MµTM
P-RIM 0.005 x 3 20 0.006 x 3 DC/DC 5 20 6 Total Power of CDMPl
9.015 10.818
Table 15-3: Probe-DHS Power Budget
15.1.5 Technology Needs
The probe timer TRL need to be raised to TRL 6
15.2 Orbiter DHS
15.2.1 Orbiter DHS Requirements and Design Drivers
The present DHS architecture is described in the light of the Space Avionics Open Interface ARchitecture (SAVOIR) set of standards and related terminology. Thus, the main functions of the Orbiter Data Handling Subsystem (DHS) are:
Provide the On-Board Computing capability and associated memory (OBC) for the on-board S/W to enable the Spacecraft Orbiter to function autonomously (including failure management), to respond to TC and to generate TM
Interface with science Payload equipment to collect time-stamped and format science data for downlinking them to ground Earth stations
Provide long-term storage, in particular to store science data during long period outage
Interface with the Orbiter platform equipment, distributing commands and collecting telemetry, formatting low-level data (e.g. AOCS equipment and thermistor acquisitions)

Ice Giants CDF Study Report: CDF-187(C)
January 2019 page 193 of 431
ESA UNCLASSIFIED – Releasable to the Public
Interface with the Communications subsystem to communicate with ground Earth stations.
Data Handling Sub-System Requirements
Req. ID Statement
DHS-010 The Orbiter DHS shall accommodate the mission to Neptune and to Uranus
DHS-020
The Orbiter DHS shall accommodate operations during the following operational phases:
Pre-launch Phase
LEOP Phase
Transfer Phase
Commissioning Phase
Nominal Science Operations Phase
DHS -030
For configuration & data handling aspects, the DHS shall be able to support at least the following modes:
Pre-Launch Modes for the ground test configuration and operations
Operational Mode ensuring the generation of mission products
Safe Mode ensuring safety of all spacecraft subsystems and payloads.
DHS -030
The DHS sub-system shall be compliant to the Avionics System Reference Architecture (ASRA) SAVOIR specifications related to on-board OBC, MM and RTU units as specified respectively in SAVOIR-GS-001, SAVOIR-GS-002, SAVOIR-GS-003 and SAVOIR-GS-004
DHS -040 The DHS sub-system shall ensure the spacecraft safety and be compatible with the ground outage durations
DHS -050 The Orbiter Data Storage function has to be tolerant to one ground station failure
DHS -060 The DHS sub-system shall support On-board Data Storage function which copes with a data volume up to 30 Gbits, covering 50 days of outage
DHS -070 The DHS sub-system shall support CFDP file management
DHS -080 The on-board m The DHS sub-system memory at EoL shall be sufficient to store all on-board
HK and science data. The science phase duration shall be of 2 years at least.
DHS -090 All DHS digital electronics and Mass Memory shall be immune from destructive Single Event Effect (e.g. Single Event Latch-up (SEL)) and protected against Single Event Effects (e.g. SEU and LET) by parts selection and circuit design.
DHS-0100 The orbiter DHS shall cope with the worst case radiations conditions related to Uranus (due to Jupiter fly-by TID) for which sensitive units shall be provided even with 10mm of Al shielding (TBC by selected Jupiter fly-by dates)
DHS -0110 The protection of on-board memory shall ensure that no mission outage occurs throughout S/C lifetime caused by SEU or SET.
DHS -0120 The orbiter DHS hardware shall be redundant
DHS -0130 The orbiter DHS shall accommodate 7 instruments, that are:
Ice Giants CDF Study Report: CDF-187(C)
January 2019 page 194 of 431
ESA UNCLASSIFIED – Releasable to the Public
Camera High resolution
Magnetometer
Imaging Spectrometer*
Ion and Neutral Mass Spectrometer
Microwave radiometer
Radio Science: USO (Ultra-Stable Oscillator)
Radio Science: Ka-band Transponder
DHS-0150 The orbiter DHS shall cope with dual launch configuration that are:
stacked spacecraft configuration
- side by side spacecraft configuration
DHS -0160 The Orbiter DHS shall use technology with a TRL not lower than 6 by 2022
DHS -0170 The Orbiter DHS shall be compatible with a launch as early as 2031
15.2.2 Assumptions
The DHS assumptions made in this study are, as follow:
1. Assumptions for the CPU of the Orbiter DHS
The Computing Micro-Processor has to fulfil performances as defined by the Central SW (CSW) applications and have their characteristics driven by the technology used to manufacture them. It drives the design and the development of other electronics parts of the computer (memories, internal/external interfaces, etc). Indeed, it influences the SW development process and hence has a significant impact on the mission development. The main assumption for the CPU of the Orbiter DHS is that it is solely dedicated to CSW. Thus, the instrument data processing is performed individually by each instrument, where needed.
2. Assumptions for the Science Data Volume of the Orbiter
Following the instruments studied and presented during the CDF sessions, it becomes clear that the maximum science data volume to be stored, between consecutive ground stations, will be in the range of 30 Gbits during 30 days of science operations.
As the trend, these days, is leaning towards the usage of external memory with faster serial interfaces. Flash memory is the baseline for the implementation of the On-Board Mass Memory. There are two main types of flash memory where code and data is stored, and they are NAND flash memory and NOR flash memory. NAND has much more capacity and a higher density than NOR. Moreover, NAND Flash memory devices are commonly available in larger capacities at generally above 1 Gbits; while NOR flash memory’s top capacity is around 1 Gbits.
The Flash storage space shall be organised, at partition level, to cope with redundancy aspects and to ensure the 30 Gbits End of life capacity.
Considering, present implementation scheme, a storage space up 128 Gbits should cope with the Orbiter need in terms of code and data storage.
3. Assumptions for the DHS Orbiter Mass Memory Unit

Ice Giants CDF Study Report: CDF-187(C)
January 2019 page 195 of 431
ESA UNCLASSIFIED – Releasable to the Public
Considering the limited storage space needed by this mission, it is assumed to have a unique equipment to handle the OBC and the MMU functionalities and performances of the Orbiter DHS. This equipment is called CDMU. Actually, this design and manufacturing option will not be a premiere as it has already been used in Euclid mission.
4. Assumptions for the DHS Orbiter communication technology The important factors of avionics buses include:
Deterministic behaviour
Fault tolerance
Redundancy.
Moreover, most avionics buses are serial and multi-drop. Very often MIL-STD-1553 (rev B) is widely used in ESA satellites. Because of its success in automotive industry, CAN bus technology attracted the attention of the space industry as well. Thus today, the DHS communication bus trend seems to be moving to CAN bus. DHS will still have to accommodate few RS-422 interfaces where platform equipment require it.
This study was taking legacy from instrument designs already flying in other missions. In all the cases, SpW technology was used to interface these instruments. Thus, it is assumed that SpW technology will be used to interface the Orbiter instruments.
5. For the side-to-side configuration of ESA & NASA spacecraft, MIL-1553B communication is considered instead of the SpW solution proposed by NASA. The rational resides in two facts that are:
The SpW technology suffers lack of galvanic isolation capability
The SpW technology has a very limited common mode i.e. 1.125V with ± 1 V difference between the grounds of the 2 side-by-side satellites.
An umbilical link, Mil-1553B based, has already been successfully used in Bepi Colombo mission. Its design, with TRL 9, is assumed to be re-used for the Orbiter communication between the 2 side-by-side satellites.
15.2.3 Trade-Offs
The OBC is very central in the orbiter platform, and therefore has the potential to integrate more functions as the science data storage. As the volume of science data, to be stored on board is not huge, it is expected that the related board can be housed in the Orbiter OBC. This assumption has already been stated. The resulting CDMU will bring saving not only at mass, power and external interfaces but at manufacturing level as well. The CDMU design will not be further traded-off. The CDMU unit will have to be complemented by the usage of CFDP for the related file system management. Today, it is becoming a baseline function to collect science data and to downlink them to ground station.
The remaining Orbiter DHS functionalities resides with the Orbiter HK data collection and actuator commanding that is classically performed by a centralised RIU unit. If requested by the overall system budget, further saving in terms of mass, power, external interfaces, test effort, manufacturing time and costs, it will be interesting to consider a de-centralised architecture to implement the RIU functionalities.

Ice Giants CDF Study Report: CDF-187(C)
January 2019 page 196 of 431
ESA UNCLASSIFIED – Releasable to the Public
15.2.4 Baseline Design
Classically, the DHS is subdivided into 3 equipment interlinked, that are:
On-board Computer (OBC) to host S/W and associated memory, to interface the communication subsystem, to handle reconfiguration, to host on-board time function.
Mass Memory Unit (MMU) to store science and HK data; interfaces to the Payload equipment to allow efficient storage of science data without interrupting S/W processing.
Remote Interface Unit (RIU) to collect HK from low-level interfaces (including analogue interfaces e.g. thermistors) of many platform equipment, to command actuators.
Considering the previous assumptions and trade-offs, the baseline design of the Orbiter DHS is based on 2 units that are the CDMU and the RIU. Both of these units shall be doubled to ensure the reliability figures needed by ESA science mission. The baseline design will rely on cold redundant configuration of these units. Thus, any combination of the nominal or the redundant CDMU with the nominal or the redundant shall be possible. These two units shall be intrinsically single point failure free. They shall provide high reliability and availability during all phases of the mission. Their design shall be based on rad-hard components and possibly will need extra shielding. The extra shielding is mainly to be considered for the Neptune Orbiter DHS, considering the specific Neptune harsh radiation environment.
Note that the DHS provides the computing platform for the Central SW (CSW) but does not include the CSW itself. Thus, the CDMU should provide the adequate computing capability which is evaluated around 80 MIPS. Thus, the CDMU baseline design is based on a one core CPU device; as for example the Leon2FT (~80 MIPS @ 100Mhz).
Figure 15-3: DHS Orbiter Baseline Design
Orbiter DHS
Transponder
RIU
CDMU
PCDU
AOCS Units
DHS Bus MIL-
1553B
Instrument1 Instrument1
Instrument1 Instrument1
SpW Links
MIL-1553B
Umbilical Link

Ice Giants CDF Study Report: CDF-187(C)
January 2019 page 197 of 431
ESA UNCLASSIFIED – Releasable to the Public
15.2.5 Orbiter DHS List of Equipment
The Orbiter DHS list of equipment is based on two cold redundant units that are:
Command & Data management Unit (CDMU)
Remote Interface Unit (RTUC).
Equipment Name
Mass (kg) Mass Margin (%) Mass Including Margin (kg)
CDMU x 2 6.66 x2 20 8 x2 RTUC 13.33 x2 20 16 x2
Table 15-4: DHS Mass Budget
Equipment Name
Power (W) Power Margin (%)
Power Including Margin
CDMU 29.15 20 35 RTUC 13.33 20 16
Table 15-5: DHS Power Budget
Equipment Name
Height (mm)
Length (mm)
Width (mm)
CDMU 200 250 300 RTUC 200 250 300
Table 15-6: DHS Volume Budget
15.2.6 Orbiter DHS Options
There are mainly 2 design options for the Orbiter DHS that are related to the RIU implementation
Option1 : DHS based on a centralised RIU (RIUC)
In this case the DHS will be based on 2 equipments that are: CDMU + RIU.
The CDMU will be based on classical OBC manufacturing with an extra board for the Mass Memory. Specific power on of the memory banks/partitions will ensure redundancy and end of life performances.
The RIU will be based on legacy design of RIU flying on ESA science mission but tailored to the need of the Orbiter in terms of monitoring and command and control of the Orbiter sensor & actuators.
Option 2: DHS based on a de-centralised RIU (RIUD)
In this case the DHS will be based on one main equipment that is: CDMS
The CDMS will be based on classical OBC manufacturing with an extra board for the Mass Memory as in option1..
The option2, via the RIUD, offers the possibility to decrease the mass by ~1 kg and the power by ~4W but this option is not yet flying. Moreover, there is no guarantee that it will be compliant to DHS -0170l.

Ice Giants CDF Study Report: CDF-187(C)
January 2019 page 198 of 431
ESA UNCLASSIFIED – Releasable to the Public
Therefore, the RIU will be based on legacy design of RIUC flying on ESA science mission but tailored to the need of the Orbiter in terms of monitoring and command and control of the Orbiter sensor & actuators
15.2.7 Orbiter DHS Technology Needs
Similar CDMU and RIU have been either already manufactured (e.g. Euclid CDMU) or already been flown (e.g. Bepi Colombo RIU). Possibly extra shielding or minor adaption to fit to all the DHS performances might be needed but no specific technology need to be developed for both Orbiter.
Ice Giants CDF Study Report: CDF-187(C)
January 2019 page 199 of 431
ESA UNCLASSIFIED – Releasable to the Public
16 NEPTUNE THERMAL
16.1 Atmospheric Probe
16.1.1 Requirements and Design Drivers
SubSystem Requirements
Req. ID Statement Parent ID
THE-010 The heatshield shall protect the inner capsule from the harsh entry environment.
THE-020 The P/L compartment shall be maintained within [0/30°C] (TBC) during all mission phases.
THE-030 The probe shall be able to survive a coasting phase of 20 days (TBC).
16.1.2 Assumptions and Trade-Offs
16.1.2.1 Assumptions
Assumptions
1 No heater power available for boost heating before probe release
2 Steep entry (FPA=-35 deg) to allow observation from Earth (resulting from SYS-060)
3 Test facilities limited to maximum 70 MW/m2 (combined convection and radiation) within budget of M-class mission. No facility is readily available today. (see chapter 16.1.8)
16.1.2.2 Frontshield TPS Material
Dense Carbon-Phenolic
Based on the extremely harsh aerothermodynamic entry environment, in terms of atmospheric composition, peak heat fluxes and pressure loads, the only material type with relevant heritage is fully-dense carbon-phenolic. Heritage stems from the Galileo probe which entered into Jupiter’s atmosphere back in 1985 and which used an American fully-dense carbon-phenolic ablator (rho = 1450 kg/m3) developed in the 1970’s. While the composition of Jupiter’s atmosphere is similar to Uranus and Neptune, entry loads were more severe reaching peak heat fluxes in the order of 350 MW/m2 (combined convective and radiative) RD[41]. Further heritage comes from the Pioneer-Venus entry probes which also used fully-dense carbon-phenolic. However, the material used for Jupiter-Galileo and Pioneer-Venus seems not to be available any more.
In Europe different types of dense carbon-phenolic materials are available. Dense carbon-phenolic materials available at ArianeGroup can be classified in two types, 2D-CP and 3D-CP. Both materials are produced at high yearly production rates.
2D dense carbon-phenolic:

Ice Giants CDF Study Report: CDF-187(C)
January 2019 page 200 of 431
ESA UNCLASSIFIED – Releasable to the Public
Produced through a tape wrapping and chop molding manufacturing process;
Used as insulating layers inside nozzles of Ariane-5 & -6 solid rocket motors;
Manufacturing well mastered for large cones up to 3m diameter allowing to produce a heatshield in one piece;
3D dense carbon-phenolic:
3D fiber architecture produced through a needling process;
Improved mechanical resistance with comparable thermal performance;
Used for insulating layers inside nozzles of Vega P80 solid rocket motors;
Manufacturing done for large cones up to 2.1 m diameter;
For both types of the material, the performance under Uranus/Neptune entry conditions would have to be verified. However, due to similarity to the material used on Jupiter Galileo & Pioneer Venus there is confidence that the material is suited for Uranus/Neptune entry conditions. Further, the capability to produce a monolithic shield with spherical nose would have to be verified but is not expected to be a potential show-stopper.
It is highlighted that the dense carbon-phenolic materials from ArianeGroup are being considered by JPL as candidate material for the Mars Sample Return Earth Entry Vehicle (MSR-EEV).
Ceramic Materials
Alternatively also carbon-carbon (C-C) or possibly Carbon-SiC (C/SiC) materials could represent a suitable choice for the frontshield TPS. They typically demonstrate a better ablation behavior with lower recession rates than classical ablators. Mechanical properties of C-C are similar to those of Aluminum while it can be operated up to temperatures of several thousand degrees. Ceramic materials might therefore combine the functions of the TPS with those of a hot primary structure.
Manufacturing capabilities for C-C and C/SiC materials are available in Europe. Intensive development, characterization and testing was done for both, launcher and Earth entry applications. However, the performance under Uranus/Neptune entry conditions would have to be investigated.
Advanced Materials
The TPS mass fraction of an entry probe is strongly correlated to the integrated heat load until shield separation. This is demonstrated in Figure 16-1. From this, the TPS mass fraction for an Ice Giant entry probe when using classical ablators can be expected to be in the order of 30-40%.

Ice Giants CDF Study Report: CDF-187(C)
January 2019 page 201 of 431
ESA UNCLASSIFIED – Releasable to the Public
Figure 16-1: Probe TPS mass fraction over total heat load RD[41]
A considerable reduction of the TPS mass fraction requires the development of advanced TPS materials. Such development is currently performed by NASA in the frame of the ‘Heatshield for Extreme Entry Environment Technology’ (HEEET) program RD[41] & RD[42]. The development is based on a 3D-woven material tailored in such a way that the external (dense) part provides high resistance against recession while the internal (less dense) part provides improved thermal insulation. According to RD[42], TRL-6 is expected to be reached within 2019. Further development might be required for a specific application on an Ice Giant probe.
Frontshield Material Selection
Within this study, European fully-dense 3-D carbon phenolic has been assumed as baseline frontshield TPS material, based on the extensive existing European manufacturing capabilities with regular production of large complex shapes and the expected adequate performance based on similarity to the material used on the Galileo probe.
16.1.2.3 Backcover TPS Material
The backcover TPS is assumed to be based on the European ASTERM material developed by ArianeGroup, which is a lightweight carbon-phenolic material. ASTERM is produced with standard European raw materials based on a robust manufacturing process by impregnating a rigid graphite substrate with phenolic resin. Within the study the nominal density of 280 kg/m3 was assumed, while adaptation is possible within a significant range to adapt to the mission needs. ASTERM has been pre-qualified (TRL-6) for an application as frontshield material of the Earth Return Capsule (ERC) of sample return missions with typical peak heat fluxes of about 14 MW/m2, integrated heat loads of around 240 MJ/m2, and peak stagnation pressure loads of around 1 bar.
While the material performance in an H2/He-atmosphere would have to be verified, the expected backcover peak heat fluxes (<2 MW/m2) and integrated heat loads (~20 MJ/m2) are well within the qualified range of the material.
16.1.2.4 TPS Margin Approach
As described in chapter 17, for the sizing of the TPS ablator a margin of 100% has been applied on top of the calculated convective and radiative stagnation point heat fluxes.
Ice Giants

Ice Giants CDF Study Report: CDF-187(C)
January 2019 page 202 of 431
ESA UNCLASSIFIED – Releasable to the Public
Heat flux blocking effects due to injection of pyrolysis gas into the boundary layer have been considered with a reduction of 20% applied on both, convective and radiative stagnation point heat fluxes. Stagnation point heat fluxes have been assumed applicable over the entire frontshield.
Again as described in chapter 17, for the backcover ablator sizing 2.5% of the margined convective stagnation point flux plus 1.0% of the margined radiative stagnation point flux have been considered.
On top of the derived minimum required ablator thickness a margin of 50% has been applied, in order to reflect the unknown material behaviour under Uranus or Neptune entry conditions with extreme heat flux and pressure conditions. Finally, an additional 20% maturity margin has been applied on the derived ablator mass.
16.1.2.5 Aerothermal Heat Fluxes
The following case had been defined as baseline for the TPS sizing at entry interface:
Relative entry velocity: 23.1 km/s
Relative entry flight path angle: -35 deg
Probe mass at entry: 341 kg
Probe diameter: 1.35 m
Unfortunately, as described in chapter 17, some parameters in the ATD tool were initially set such that the considered entry velocity was assumed as inertial velocity rather than relative velocity. Therefore the initially provided ATD data was based on an inertial velocity of 23.1 km/s which corresponds to a relative velocity of only 20.6 km/s.
Since this error was only found after the design freeze, the ablator sizing was done for both cases. Figure 16-2 below provides the heatflux timelines based on an inertial velocity of 23.1 km/s as used for the baseline TPS sizing. Figure 16-3 provides the corrected heat flux timelines for a relative entry velocity of 23.1 km/s. All heat fluxes consider the margin approach as described in chapter 16.1.2.4.

Ice Giants CDF Study Report: CDF-187(C)
January 2019 page 203 of 431
ESA UNCLASSIFIED – Releasable to the Public
Figure 16-2: Heat flux timelines for baseline TPS sizing (20.6 km/s relative)
Figure 16-3: Heat flux timelines for corrected TPS sizing (23.1 km/s relative)

Ice Giants CDF Study Report: CDF-187(C)
January 2019 page 204 of 431
ESA UNCLASSIFIED – Releasable to the Public
As can be seen, after the correction from inertial to relative (delta-v = 2.7 km/s), the peak heat flux increased from 71 MW/m2 to 94 MW/m2, while the integrated heat loads increased from 674 MJ/m2 to 904 MJ/m2.
While TPS sizing for both cases is provided in chapter 16.1.3.1, it has to be highlighted that the peak heat flux of the corrected case is beyond the test facility capabilities which are considered achievable within the budget of an M-class mission (see also 16.1.8). Further, even though no clear limitation for the fully-dense carbon-phenolic material can be stated, the high heat fluxes may also represent an increased risk for the material performance.
In conclusion: a steep entry trajectory (FPA = -35 deg combined with a relative entry velocity of 23.1 km/s) may therefore likely not be feasible. More shallow approaches should therefore be addressed in future studies.
Figure 16-4 shows the heat flux timelines used for the backcover ablator sizing, based on the assumptions described in chapter 16.1.2.4.
Figure 16-4: Backcover heat flux timelines
16.1.2.6 Release Sequence
The following release / timing sequence has been assumed for the heatshield sizing.
Drogue parachute opens at Ma=0.8
Backcover release at Ma=0.8 plus 2 seconds
Frontshield release at Ma=0.8 plus 10 seconds
Note that the baseline frontshield release timeline assumed in the EDS sizing was Ma=0.8 plus 15 seconds (see Section 18.3.3). The effects of this should however be limited, and should be addressed in future work.

Ice Giants CDF Study Report: CDF-187(C)
January 2019 page 205 of 431
ESA UNCLASSIFIED – Releasable to the Public
16.1.3 Baseline TPS Design
16.1.3.1 Frontshield Design
A hybrid hot structure concept has been assumed as baseline for the frontshield, i.e. a fully-dense carbon-phenolic ablator is mounted onto a ceramic CMC structure. This way the temperature limit at the bonding interface of the ablator is significantly increased, which in consequence leads to a relevant reduction of the required ablator thickness. A lightweight efficient insulation is then used to insulate the descent compartment against the hot structure. A further advantage is increased robustness e.g. against micrometeoroid impacts. High temperature structural stand-offs are required for the load-carrying mechanical connection between the hot structure and the descent compartment. The stand-offs are covered under the structure (8.1.3). Such design is also referred to as so-called SEPCORE® concept RD[44].
Within the current study the temperature limit at the ablator bonding interface has been assumed at 800°C, whereas for a ‘classical’ substructure in CFRP and/or Aluminum a limit of about 180°C would apply. The limit value was chosen based on work performed within the FP7 HYDRA activity performed under funding of the European Commission on adhesive based joining technologies RD[45]. It shall be noted that RD[45] also provides study results for advanced bonding techniques which indicate limits of about 1200°C and above. However, verification would be required for the material combination of interest here (fully-dense carbon-phenolic onto CMC).
The ablator sizing analysis within this study has been based on material properties from the FM5055 material for which a good agreement has been found with characterization performed on the 2D-CP from ArianeGroup. Based on indications from ArianeGroup, the performance of the 3D-CP is preliminarily assumed to be comparable.
The initial heatshield temperature at entry point has been conservatively assumed as 20°C.
Figure 16-5 shows the ablator sizing for a relative entry velocity of 20.6 km/s. To maintain the backface temperature limit of 800°C, an ablator thickness of 26.3 mm is required. Applying the 50% sizing margin, this results in a design thickness of 39.5 mm.
Figure 16-6 shows the ablator sizing for a relative entry velocity of 23.1 km/s. To maintain the backface temperature limit of 800°C, an ablator thickness of 28 mm is required. Applying the 50% sizing margin, this results in a design thickness of 42 mm.
(Note that for a frontshield release at Ma=0.8 plus 15 seconds, as assumed in the EDS sizing case, an additional ~1.5 mm thickness would be required, including margin)

Ice Giants CDF Study Report: CDF-187(C)
January 2019 page 206 of 431
ESA UNCLASSIFIED – Releasable to the Public
Figure 16-5: Frontshield Ablator Sizing for 20.6 km/s relative entry velocity (erroneous baseline at design freeze)
Figure 16-6: Frontshield Ablator Sizing for 23.1 km/s relative entry velocity (correction after design freeze)
16.1.3.2 Backcover Design
Due to time constraints during the study, the backcover heatshield design had initially been considered identical to the one foreseen during the PEP study in 2010, which was based on the ASTERM ablator (9mm thickness) mounted onto a hot structure. Note that in the PEP study the backcover was assumed to remain attached during the atmospheric descent for a duration of about 60 minutes.
Since the backcover is now assumed to be released together with the drogue parachute just seconds after peak heating, the thickness of the ASTERM ablator can be reduced. As shown Figure 16-7, only 4mm ablator thickness are needed to maintain the backface

Ice Giants CDF Study Report: CDF-187(C)
January 2019 page 207 of 431
ESA UNCLASSIFIED – Releasable to the Public
temperature limit of 800°C. Applying the 50% sizing margin, this results in a design thickness of 6 mm.
Figure 16-7: Backcover ablator sizing (update after design freeze)
16.1.4 Baseline TCS Design
The thermal control design of the probe assumes the frontshield and backcover to be externally covered by a high-performance 22-layer MLI (based on JUICE MLI with HELPAC spacer and incorporating micro-meteoroid shield capability).
31 Radioisotope Heater Units (RHU’s) are used for heater power during the 20 day coasting phase. A white-painted radiator window (0.15 m2) is implemented on the frontshield to reduce the sensitivity of the internal temperature towards uncertainties in the knowledge of the MLI performance and to accounts for heater power variations due to RHU decay. This design is similar to the one applied on the Huygens probe, see Figure 16-8.
Figure 16-8: Radiative window on Huygens probe
A simplified thermal mathematical model was used to derive the number of required RHU units and to derive the required area of the radiative window, see Figure 16-9.

Ice Giants CDF Study Report: CDF-187(C)
January 2019 page 208 of 431
ESA UNCLASSIFIED – Releasable to the Public
Figure 16-9: P/L temperature as function of RHU dissipation and MLI performance
Aerogel or foam insulation is used inside the pressure vessel to insulate the payload compartment during the atmospheric entry under parachute.
16.1.5 List of Equipment
16.1.5.1 Heatshield Equipment
As explained in chapter 16.1.2.5, a correction to the aerothermodynamic heat fluxes has been received after study design freeze. Further to this, after study design freeze it was also found that the surface area assumed for the frontshield was incorrect.
Therefore two versions of the heatshield equipment summary table are provided. Table 16-1 provides the heatshield equipment summary at the time of study design freeze. Table 16-2 provides the update after study design freeze reflecting 1/ the increase in frontshield ablator thickness due to the higher relative velocity, 2/ the corrected frontshield surface area, and 3/ the revised backcover design eliminating the hot structure.
Table 16-1: Heatshield equipment and mass (at study design freeze)
density
[kg/m3]
area
[m2]
thickness
[mm]
Mass excl. margin
[kg]Margin
Mass incl. margin
[kg]
Frontshield ablator (3D carbon-phenolic) 1350 1.82 39.5 97.05 20 % 116.46
Frontshield hot structure (C/SiC) 1800 1.82 2.4 7.86 20 % 9.43
Frontshield internal insulation 140 1.82 10.0 2.55 20 % 3.06
Backcover ablator (ASTERM) 280 1.72 9.0 4.33 20 % 5.20
Backcover hot structure 1800 1.72 2.4 7.43 20 % 8.92
Backcover internal insulation 140 1.72 20.0 4.82 20 % 5.78
Heatshield instrumentation 2.00 20 % 2.40
Subsystem total 126.04 151.25

Ice Giants CDF Study Report: CDF-187(C)
January 2019 page 209 of 431
ESA UNCLASSIFIED – Releasable to the Public
Table 16-2: Heatshield equipment and mass (correction after study design freeze)
16.1.5.2 TCS Equipment
The summary and masses of the thermal control equipment is provided in Table 16-3.
Table 16-3: TCS equipment and mass
16.1.6 Options
The following options are identified which would have to be addressed in further detail in a separate study.
1. Shallower entry flight path angle: As discussed in chapter 16.1.2.5, the steep entry flight path angle (FPA=-35deg) assumed within this study leads to very high heat fluxes which cannot be reproduced with available facilities and for which facility adaptation is likely not achievable within a Type-M mission budget. A potential delta-study should therefore assess mission concepts with a shallower entry to reduce the peak heat fluxes. Due to the increased integrated heat loads this will however require increased ablator thickness.
2. Frontshield without hot structure: Due to the very short heat flux peak and the short duration until frontshield separation (in case of the assumed steep entry), the benefit of the hybrid hot structure concept is rather limited (about 5 kg with the current design). A trade-off would therefore be needed to trade the mass benefit versus the increased design complexity. It is however noted that in the case of a shallower entry the benefit of a hot structure approach will be more significant.
3. Alternative frontshield TPS material: Use of advanced ablator material currently developed by NASA in the frame of the ‘Heatshield for Extreme Entry Environment Technology’ (HEEET) program.
4. Backcover without hot structure: Since the backcover now is assumed to be released shortly after peak heating, the mass advantage of a hot structure concept on the

Ice Giants CDF Study Report: CDF-187(C)
January 2019 page 210 of 431
ESA UNCLASSIFIED – Releasable to the Public
backcover is minimal. For a standard cold substructure the required ASTERM thickness has been analysed as 33mm (including 50% margin). The mass advantage of a hot structure concept would therefore only be about 1 kg, while it would still significantly increase the complexity and cost of the probe.
5. Alternative backcover TPS materials: Cork-based ablators might be a potential choice for the backcover with a better thermal performance than ASTERM. E.g. the Norcoat Liege ablator from ArianeGroup has been qualified for Exomars for heat fluxes up to about 2 MW/m2. However, the suitability and performance under a H2/He-atmosphere would have to be verified.
6. Increase bondline temperature limit: In case a hot structure concept is maintained, available study results indicate that the bondline temperature limit could be increased to the order 1200°C. Dedicated verification for the ablator/substructure material combination would be required.
16.1.7 Technology Needs
* Equipment
Name & Text Reference
Technology Supplier (Country)
TRL Funded by Additional
Information
* Heatshield
(front)
Fully-dense carbon-phenolic
ablator
ArianeGroup (F)
4 3rd party
Sustainable material with large flight heritage but
different environment
* Heatshield High-temperature
bonding (>1000°C)
TECNALIA (E)
4 EU
Delta-development required for dense
CP onto C-C at high temperature
* Heatshield
(back)
Low density carbon-phenolic
ablator (ASTERM)
ArianeGroup (F)
4 ESA
TRL6 reached for sample return
missions (Earth return)
* RHU’s RHU’s Adaptation as
needed
The aspects to be addressed on the fully-dense carbon phenolic material include in particular: 1/ verification of the capability to produce a monolithic heatshield including the spherical nose, 2/ verify sufficient micro-meteroid impact resistance, 3/ verify the material performance in plasma test under representative loads, 4/ complete the material characterisation.
16.1.8 Test Facility Needs
The response and performance of the heatshield materials will have to be verified under relevant plasma conditions, representing as closely as possible the atmospheric composition and dissociation status, the expected convective and radiative heat flux levels, as well as pressure and possibly shear loads. To the knowledge of the study team

Ice Giants CDF Study Report: CDF-187(C)
January 2019 page 211 of 431
ESA UNCLASSIFIED – Releasable to the Public
there are no plasma test facilities available capable to reproduce the relevant environment.
However, attention is drawn to the JP200 facility at ArianeGroup in Bordeaux, which is an open 20 MW Huels arc-heater facility capable to achieve in stagnation point configuration up to about 80 MW/m2 at 5-50 bars (TBC). Operation would presumably be limited to air. Dedicated assessment would be required to further assess the capability and suitability of the facility. Possibly lasers could be used to additionally reproduce the radiative component of the heat flux environment.
Additional attention is drawn to the plasma facilities operated at IRS (University of Stuttgart) which are based on a magneto-plasma-dynamic generator (MPD). These facilities can be operated in both air and H2/He. Limits in terms of heat flux conditions would have to be assessed, but might be above 10 MW/m2. This may therefore allow to correlate the material performance in air versus the one in H2/He.
16.2 Orbiter
16.2.1 Requirements and Design Drivers
SubSystem Requirements
Req. ID Statement Parent ID
THE-010 Temperature range for units and payloads: 0 - 30 °C
16.2.2 Assumptions and Trade-Offs
Assumptions
1 No sunshield is required for the RTGs (as Sun distance of S/C is always >1AU)
2 MLI effective conductivity at low T: 0.02 W/m2K
3 MLI emissivity outer layer: 0.5
4 Orbiter’s outer surface (MLI area): 36 m2
5 Internal S/C temperature limits: 0 ≤ TS/C ≤ 30 °C
6 ∆T between payload compartment and radiator: 10 K
7 Radiator emissivity: 0.8
8 Louver efficiency: 0.7 (considered conservative)
9 “Excess power radiator” max temperature: 60 °C
16.2.3 Baseline Design
The orbiter is covered in a high-performance MLI which incorporates micro-meteoroid shielding capabilities and uses a HELPAC spacer. This MLI was developed for JUICE and has currently a TRL of 6 (for JUICE). Heat leakage through the MLI is estimated to be in the order of 120 W (0°C inside) to 140 W (30°C inside).
Three types of radiators are used to radiate excess heat. Classical (SSM-taped) radiators are sized such that in the hot case (internal heat dissipation of 465 W) the P/L compartment is maintained within a maximum temperature of 30°C.

Ice Giants CDF Study Report: CDF-187(C)
January 2019 page 212 of 431
ESA UNCLASSIFIED – Releasable to the Public
In order to limit the demand of heater power in the cold case, the baseline design foresees to pass waste heat from the RTG’s into the spacecraft. The amount of utilised RTG waste heat has been set to 159 W. Additionally electrical heaters are used to be able to control the temperature.
Additional louvered radiators are foreseen to reject the used RTG waste heat in hot conditions. The louver blades close in the cold conditions and open above a defined threshold temperature. Heritage for louvers exists from the Rosetta mission.
The third radiator, the “excess power radiator”, is needed in cases where not all of the generated electrical power from the RTGs is consumed. The excess power radiator will be mounted on standoffs with its rear side covered by MLI in order to conductively and radiatively insulate it from the spacecraft. Any RTG excess electrical power will be ‘burnt’ in heaters mounted on the rear side of the excess radiator.
An overview of the various radiators is shown in Figure 16-10.
Figure 16-10: Radiators on the orbiter
The RTGs need to be thermally insulated from the S/C platform. Conductive decoupling of the RTG is achieved by designing it interface structure in Titanium (low conductivity) with long conductive paths, and by implementing a radiative shield covered by MLI.
The required electrical heater power for the cold cases depends on the internal heat dissipation. The estimated required electrical heater power for every mode can be found in Table 16-4. The electrical heater power was derived by assuming the S/C operates at 0°C in the cold case. The maximum electrical heater power needed is 48 W. At this early stage a maximum heater duty cycle of 50% is assumed. The installed heater power is therefore around 100 W.
Mode Dissipation [W]
Heater Power [W]
CM 129 45
IMCA1 402 0
IMCA2 465 0
IN 154 20
Standard radiator Louvered radiator
Excess power radiator
Radiative shield

Ice Giants CDF Study Report: CDF-187(C)
January 2019 page 213 of 431
ESA UNCLASSIFIED – Releasable to the Public
Mode Dissipation [W]
Heater Power [W]
IPCA 389 0
ISCom 417 0
LEOP 274 0
MM 436 0
NSM 126 48
TM 136 38
Table 16-4: Heat dissipation and electrical heater power
16.2.4 List of Equipment
The equipment needed with the respective amount and mass can be found in Table 16-5.
Density Amount Mass [kg] Margin Mass with margin [kg]
TRL
External MLI (22-layer) 0.8 kg/m2 40 m2 32 10 % 35.2 6
Internal MLI (10-layer) 0.4 kg/m2 8 m2 3.2 10 % 3.52 HGA MLI (10-layer) 0.4 kg/m2 4 m2 1.6 10 % 1.76 6
Normal radiator area (SSM-tape) 0.2 kg/m2 0.97 m2 0.19 10 % 0.21
Louvres 3 kg/m2 0.68 m2 2.0 20 % 2.46 Heaters 0.06 kg/unit 80 units 4.8 10 % 5.28 Thermistors (triplet) 0.06 kg/unit 40 units 2.4 10 % 2.64 White paint (HGA) 0.2 kg/m2 4 m2 0.8 10 % 0.88 Black paint 0.2 kg/m2 50 m2 10 10 % 11 RTG radiative shield
MLI 0.4 kg/unit 2 units 0.8 10 % 0.88 6
RTG excess power radiator 4 kg/m2 0.47 m2 1.88 10 % 2.07
Total
59.72
65.90
Table 16-5: Equipment and mass
16.2.5 Options
There are no other options defined.

Ice Giants CDF Study Report: CDF-187(C)
January 2019 page 214 of 431
ESA UNCLASSIFIED – Releasable to the Public
16.2.6 Technology Needs
|~T Technology Needs
* Equipment
Name & Text Reference
Technology Supplier (Country)
TRL Funded
by Additional
Information
* MLI RUAG Austria
6 JUICE MLI
* Louvers Heritage from
Rosetta
* RTG Use of RTG waste
heat inside the S/C
Controlled approach to be
developed
* RTG RTG conductive
and radiative decoupling
To be reflected in
development of I/F structure

Ice Giants CDF Study Report: CDF-187(C)
January 2019 page 215 of 431
ESA UNCLASSIFIED – Releasable to the Public
17 NEPTUNE AEROTHERMODYNAMICS
17.1 Aerodynamics Shape
In the Ice Giants CDF study, the outer mould line of the entry vehicle is maintained from previous, CDF studies JEP 2005 RD[47] and PEP 2010 RD[7]. The outer mould line is similar to the Galileo probe:
The JEP/PEP shape has a nose-to-base diameter ratio of 0.41 (0.512/1.25) whereas the Galileo probe’s ratio is 0.28 ( 44.4/126.4) . A drawback with deviating from the Galileo ratio is that this has an impact on the heritage in wind tunnel testing and flight entry. It might have a small impact on the aerodynamic drag, but larger impact on the radiative and convective heating . A more detailed trade-off on the shape of the probe shall be performed in the future.
The base diameter (1.35) in the JEP/PEP and cone angle (45degree), which are maintained in this study is similar to Galileo
The NASA Ice giant study in 2017 RD[1] maintained the Galileo nose/base ratio, and takes a somewhat smaller base diameter of 1.20m.
Figure 17-1: Galileo shape dimension

Ice Giants CDF Study Report: CDF-187(C)
January 2019 page 216 of 431
ESA UNCLASSIFIED – Releasable to the Public
17.2 Aerodynamic Drag Profile
Figure 17-2: Drag coefficients of the Galileo Probe
The hypersonic drag coefficients used in this study are based on the Galileo wind tunnel experiments in the hypersonic and transonic regime. The hypersonic drag coefficient is 1.045 on which the ballistic coefficient is based. A 45 degree capsule can be made statically stable throughout the hypersonic, transonic and subsonic regime. The static and dynamic stability decreases when the sonic line of the front shield move towards the shoulder. From EVD studies RD[49], the capsule is static and dynamically stable if the centre of gravity is placed less than 26% from the nose based on the diameter. In a later stage the stability has to be studied in detail. Both the base shape and the rounding of shoulder tip are expected to influence the stability of the probe.
17.3 Atmospheric Model
The atmospheric model developed by Jean–Paul Huot RD[48] has been utilised in previous PEP and JEP CDF studies. It has no uncertainties included. In Figure 17-3 the model is compared with the more recent Neptune Gram 7 model, taken from RD[46]. The Gram model has a minimum, mean and maximum density profile indicated with resp. Fminmax=-1,0,1 . However the Gram model itself was not available at the current CDF study and in future it is needed to include this model with its uncertainties in the trajectory analysis. As it can be noticed, the range of aero-capture altitudes are below 300km where the density becomes appreciable. Lastly also note that the zero altitude is defined where the atmospheric pressure equals 1 bar.

Ice Giants CDF Study Report: CDF-187(C)
January 2019 page 217 of 431
ESA UNCLASSIFIED – Releasable to the Public
Figure 17-3: Neptune Atmospheric Model based on 85%H2/15%He ( right), comparison density with the Gram Neptune 7 model (left)
17.4 Heat Flux
17.4.1 Heat Flux Correlations
The following heat flux correlations used in this study based on simulation of Simmonds and Moss. RD[50]
√
(
)
(
)
The back cover heat flux is considered to be 2.5% of margined convective and 1% margined radiative flux component of the stagnation point of the front shield, a percentage commonly used in pre-phase A studies for capsules, also in the PEP study in 2010 and JEP in 2005. This assumption needs to be assessed by CFD in future.
17.4.2 Heat Flux Margin Policy
The same margin policy used in PEP or JEP study has been maintained. The margin is around 1.6 times the nominal value. The number is comprised of:
Uncertainty margin: 100%. This assumption is maintained from PEP/JEP study
20% reduction on both convective and radiative heating due to blockage based on Galileo studies depicted in Figure 17-4. Looking at the graph, and taking into account that the heat flux is around 100 MW/m2, a radiation blockage factor of 0.4 (40 % reduction) could have been taken. However, it has been decided to keep the 20% reduction as used in PEP/JEP study
0 – 6% reduction on radiative component to correct the effects for the non-adiabatic shock layer compensation. Depending on the local flight conditions.

Ice Giants CDF Study Report: CDF-187(C)
January 2019 page 218 of 431
ESA UNCLASSIFIED – Releasable to the Public
Figure 17-4: Radiation blockage factors
17.5 Entry Interface Conditions and Trajectory Analysis
The base line entry interface conditions are maintained from the PEP and JEP study. Entry state in rotating, Neptune-centered, Neptune-fixed equatorial frame. Sun and Earth directions were provided. Note that the baseline probe diameter is however enlarged with respect to the PEP case.
Altitude [km]: 600.133
Relative Velocity [km/s]: 23.082
Relative FPA [deg]: -35.039
Longitude [deg]: -8.821
Latitude [deg]: -0.749
Azimuth [deg]: 84.468
Base line diameter 1.35m
Parachute opening is assumed in the following analysis at Mach =0.8 assuming a drogue and main parachute of 2 and 7m2 area. These values are scaled up from the PEP study to meet roughly the adapted requirements. A 113 kg removal of front heat shield mass is assumed at the opening.
In Figure 17-5 the baseline trajectory is plotted, computed with the traj3d code RD[50]. It can be seen that lowering the flight path angle from 35 to 18 the maximum heat flux is reduced by half, and the radiative fraction of the total heat flux is reduced significantly at the cost of an longer flight time and 40% increased heat load.
In Table 17-1 the main characteristic of the trajectories are shown. It becomes clear that for a baseline diameter of 1.25m the maximum stagnation heat flux is 111MJ/m2 at a pressure of 9.7 bar. No facility exists today to qualify material at these conditions since:
Current capabilities for air can reach around heat fluxes of 50MW/m2,
The above facilities can not be used with H/He gas, and
The use of H/He is expected to behave different to the commonly used gases (N2/O2/Co2).

Ice Giants CDF Study Report: CDF-187(C)
January 2019 page 219 of 431
ESA UNCLASSIFIED – Releasable to the Public
Therefore the large uncertainty margin of 100% cannot be reduced. Even more it can be questioned whether it is sufficient, other than relying on the Galileo heritage.
A possible remedy to reduce the heat flux is to lower the flight path angle to 18 degrees. It further reduces the deceleration forces and surface pressures, which will result in a lighter structure.
On the other hand, the heat load is larger, and as a result the TPS thickness. This is not a priori major problem. The extra TPS thickness will be beneficial since it will move forward the CoG position of the capsule. This way ballast can be avoided to compensate the aft placement of the parachute assembly and payloads in the capsule.
The main drawback for lowering the flight path angle is that it makes the entry not visible from Earth.
Increasing the base diameter from 1.25 of PEP to 1.35m, and assuming the same mass, does increase the ballistic coefficient and therefore both heat flux and heat load will be slightly reduced. As a result the thickness of the TPS can also be reduced. However due the enlarged surface area increased the resulting total TPS mass might be larger in this case. Therefore reducing the base diameter to 1.2 meter is expected to reverse the effect in a beneficial way. The ballistic coefficient is based on 341 kg which is based on the TPS mass before the design freeze. Any changes to the TPS mass, increase of 18 kg, has not been flown down to the reiteration of the aerodynamic fluxes.
Figure 17-5: Base line trajectory plots with variation of flight path angles. On the right figure the convective and radiative ratio are plotted

Ice Giants CDF Study Report: CDF-187(C)
January 2019 page 220 of 431
ESA UNCLASSIFIED – Releasable to the Public
base diameter [m] 1.2 1.25 1.35 1.2 1.25 1.35
ballistic
coefficient [kg/m2] 288.57 265.95 228.01 288.57 265.95 228.01
FPA_rel deg -35.039 -35.039 -35.039 -18 -18 -18
Mass [m2] 341 341 341 341 341 341
Ve [km/s] 23.082 23.082 23.082 23.082 23.082 23.082
qmax_total [W/m2] 121262265.3 110908183.8 94293856.26 57479105.45 53735076.51 47667001.16
qmax_c [W/m2] 65774247.08 63032373.81 57615111.83 42935213.53 41168307.43 38013655.28
qmax_r [W/m2] 55488018.23 47875810.02 36678744.44 14543891.92 12566769.08 9653345.874
heatload_mar_t [J/m2] 1035987966 987103727 904392247 1448141328 1391874100 1293967362
heatload_mar_c [J/m2] 768978466 748561517 711552037 1247027653 1212191347 1148641803
heatload_mar_r [J/m2] 267009500 238542210 192840211 201113675 179682753 145325560
qmax_pstag [bars] 11.157 9.716 8.030 3.758 3.279 2.611
fpa_rel_m08 [deg] -47.39 -47.52 -47.52 -48.39 -48.39 -48.47
qmax_alt [km] 81.85 84.40 87.45 102.66 106.15 112.14
qmax_fpa_rel [deg] -33.69 -33.69 -33.70 -15.19 -15.21 -15.25
qmax_time [s] 40.2 40 39.8 76.6 76 75
qmax_vel [km/s] 18.11 18.26 18.16 18.46 18.61 18.77
qmax_dp [bars] 6.063 5.280 4.364 2.042 1.782 1.419
qmax_pinf [bars] 8.18E-03 7.32E-03 6.48E-03 3.74E-03 3.33E-03 2.76E-03
qmax_mach 32.55 32.11 31.02 27.94 27.66 27.10
decmax 324.52 318.05 305.96 126.27 123.49 118.10
decmax_alt [km] 64.65 65.50 68.53 78.09 79.75 82.38
decmax_time [s] 42.2 42.2 42 82.6 82.4 82.2
decmax_vel [m/s] 12.54 12.29 12.44 12.30 12.30 12.07
decmax_dp [bar] 9.067 8.189 6.754 3.528 3.179 2.607
decmax_pstag [bar] 16.687 15.072 12.431 6.493 5.852 4.799
decmax_pinf [bar] 2.15E-02 2.04E-02 1.68E-02 9.76E-03 8.97E-03 7.99E-03
fpa_rel_m2 -36.04 -36.08 -36.04 -20.79 -20.91 -20.90
alt_m2 [km] 39.66 40.89 43.30 50.38 51.55 53.91
mach_m18 1.76 1.79 1.80 1.79 1.79 1.79
pdyn_m18 [bars] 0.24 0.23 0.20 0.13 0.12 0.10
pinf_m18 [bars] 0.113 0.104 0.090 0.058 0.054 0.046
pstag_m18 [bars] 0.506 0.478 0.418 0.269 0.249 0.213
rho_m18 [kg/m^3] 6.51E-02 6.02E-02 5.22E-02 3.40E-02 3.13E-02 2.66E-02
sos_m18 [m/s] 496.39 494.61 493.17 493.30 494.19 496.12
vel_m18 [m/s] 872.79 882.99 887.36 881.79 885.54 886.20
fpa_rel_m14 -37.93887215 -37.99761712 -37.95288369 -25.18408025 -25.33593791 -25.27397284
alt_m14 [km] 38.07862751 39.31802103 41.72955301 48.35257727 49.52097267 51.86380715
mach_m08 0.797375224 0.795676546 0.796492145 0.799903612 0.799282563 0.798355833
pdyn_m08 [bars] 0.067 0.062 0.053 0.043 0.039 0.034
pinf_m08 [bars] 0.152 0.140 0.119 0.095 0.088 0.077
pstag_m08 [bars] 0.23 0.21 0.18 0.14 0.13 0.12
rho_m08 [kg/m2] 8.46E-02 7.87E-02 6.84E-02 5.53E-02 5.14E-02 4.49E-02
sos_m08 [m/s] 504.21 501.77 497.79 493.75 493.02 491.97
vel_m08 [m/s] 402.04 399.25 396.48 394.95 394.06 392.76
time_m08 [s] 67.4 67.4 67.2 137 137 137.2
Table 17-1: Specific values (maximum heat flux, heat load, decelration , and potential free stream conditions at Mach 0.8 or M1.8) for the base line concept
with varying base diameter at 23km/s and total weight of 341kg.
To further understand the impact of deviating from the baseline conditions, the following parameters have been varied in the trajectory analysis:
Total probe mass including margins [kg]= 160.0, 180.0, 200.0, 220., 240.0, 250., 260., 278.15 288.0, 300.0, 313.34, 320.0,295.78, 330.0, 341.0, 345.0, 350.0, 360.0, 365.0, 370.0, 380.0, 390.0, 400.0
Relative flight path angle at entry interface: -50, -40, -35, -30, -20, -18 , -16
Ice Giants CDF Study Report: CDF-187(C)
January 2019 page 221 of 431
ESA UNCLASSIFIED – Releasable to the Public
Base diameter [m]=1.25, 1.35. The ratio of the base-/nose- diameter is kept to 0.28 for both diameters
Relative Entry velocity at 600km altitude, Ve [km/s]=21,0, 23.082, 25,7
The resulting trajectory values are plotted in Figure 17-6 to Figure 17-13 as contour lines as function of the total mass with and relative flight path angle:
Stagnation point heat flux , including margin
Stagnation point heat load, including margin
Maximum deceleration druing the trajectory
Altitude at which the maximum deceleration occurs
At Mach=0.8, assuming the parchute will open
o Stagnation pressure
o Relative fligh path angle.
Figure 17-6 to Figure 17-13 have been ordered with 3 rows each increasing the entry velocities: 21 km/s, 23 and 25,7 km/s; the columns are associated to the 2 base diameters 1.25 and 1.35. In each plot 6 value markers have been placed corresponding for flight path angles ( -25 and –18) and mass ( 341, 288 and 140 kg).
From these figures it can be concluded that
Substantially lowering the mass below or entry velocity from the baseline, with a 35 degree flight path angle yields appreciable lowered heat load and fluxes. For example at 23 km/s, with diameter of 1.25, yield low heat fluxes (47MW/m2) and loads (624MJ/m2) if the mass is reduced to 140 kg. Increasing the mass to 288 kg yields 92MW/m2 and 897MJ/m2.
Flight path angles of 18 degrees yield in all cases substantially lowered fluxes, at the cost of increased heat loads compared to 25 degrees. Although not visible in the plots, it has to be highlighted that this flight path angle does not allow Earth visibility during entry.
The conditions are also given at parachute opening. Although the flight path angle at Mach 0.8 is similar, the stagnation pressure does vary up to a factor of 2 for 140 of 341 kg mass.
17.6 Potential Material Plasma Testing With H/He in Europe
It is essential to study and qualify the TPS in facilities with a hydrogen/Helium environment. The only certified facility in Europe, to the author’s knowledge, able to qualify material samples for high enthalpy hydrogen-Helium mixture in Europe is the magnetoplasmadynamic PWK1 arcjet at IRS. It has been developed in the 1980s based on the know-how on electric propulsion devices. This facility was designed and certified for light weight gases, including hydrogen and could potentially test samples in the range of when using lightweight gases hydrogen for effective enthalpies in the order of 85MJ/kg with peak values 450MJ/kg. It is expected that PWK1 can reach effective enthalpies larger than 400MJ/kg, at total pressures in the hPa-range and heat fluxes 0.5MW/m2. Further investigations to adjust performance of the facility is needed.
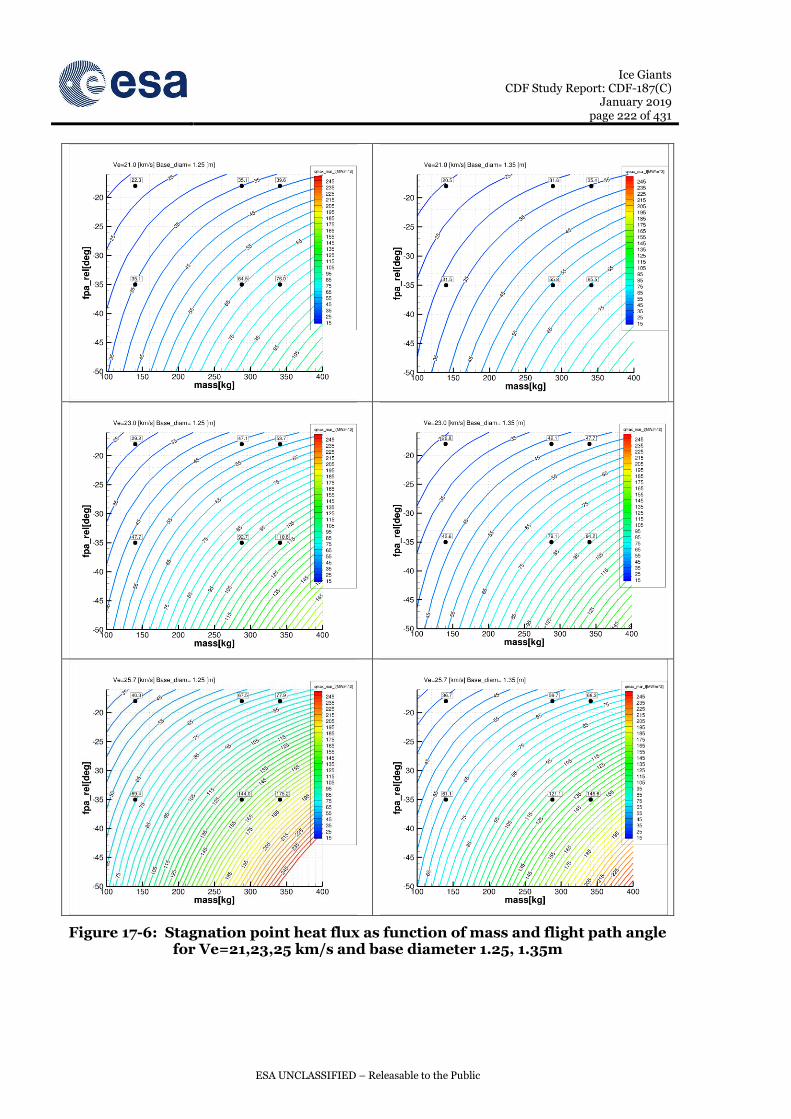
Ice Giants CDF Study Report: CDF-187(C)
January 2019 page 222 of 431
ESA UNCLASSIFIED – Releasable to the Public
Figure 17-6: Stagnation point heat flux as function of mass and flight path angle for Ve=21,23,25 km/s and base diameter 1.25, 1.35m

Ice Giants CDF Study Report: CDF-187(C)
January 2019 page 223 of 431
ESA UNCLASSIFIED – Releasable to the Public
Figure 17-7: Stagnation point heat load as function of mass and flight path angle for Ve=21,23,25 km/s and base diameter 1.25, 1.35m

Ice Giants CDF Study Report: CDF-187(C)
January 2019 page 224 of 431
ESA UNCLASSIFIED – Releasable to the Public
Figure 17-8 Stagnation pressure at maximum total heat flux as function of mass and flight path angle for Ve=21,23,25 km/s and base diameter 1.25 , 1.35m

Ice Giants CDF Study Report: CDF-187(C)
January 2019 page 225 of 431
ESA UNCLASSIFIED – Releasable to the Public
Figure 17-9: Maximum deceleration as function of mass and flight path angle for Ve=21,23,25km/s and base diameter 1.25 , 1.35m

Ice Giants CDF Study Report: CDF-187(C)
January 2019 page 226 of 431
ESA UNCLASSIFIED – Releasable to the Public
Figure 17-10: Altitude at maximum deceleration as function of mass and flight path angle for Ve=21,23,25km/s and base diameter 1.25 , 1.35m

Ice Giants CDF Study Report: CDF-187(C)
January 2019 page 227 of 431
ESA UNCLASSIFIED – Releasable to the Public
Figure 17-11: stagnation pressure at maximum deceleration as function of mass and flight path angle for Ve=21,23,25km/s and base diameter 1.25 , 1.35m
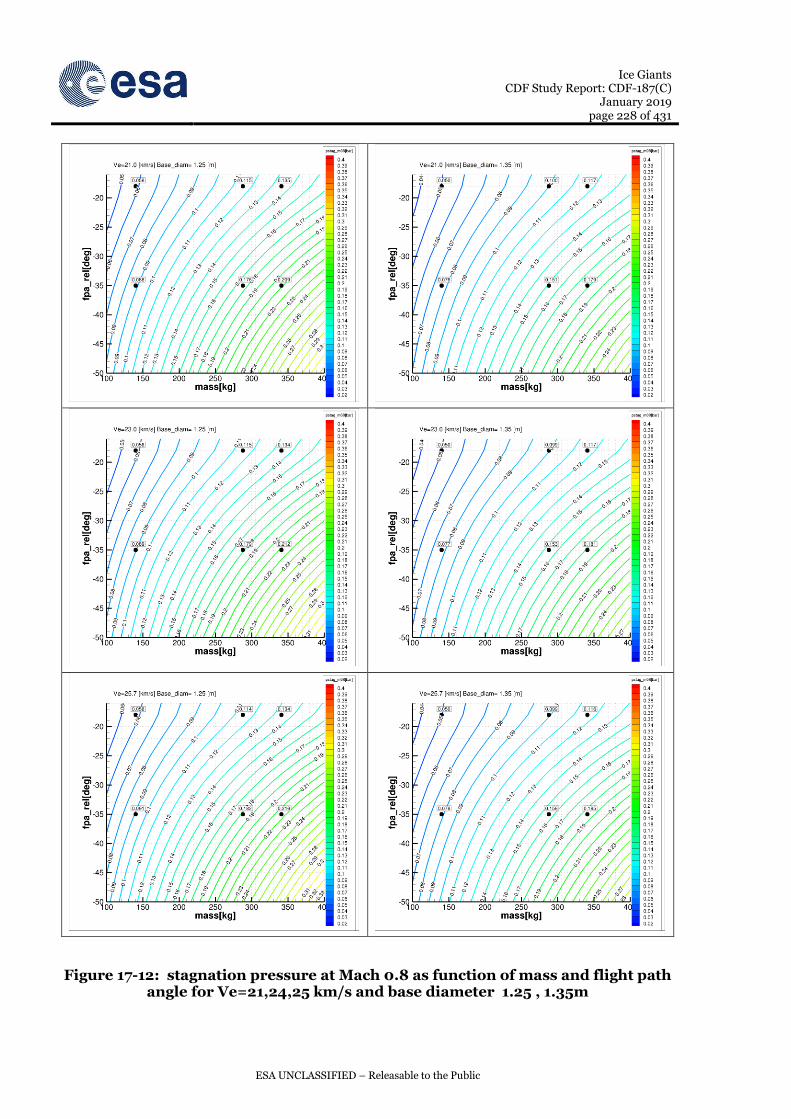
Ice Giants CDF Study Report: CDF-187(C)
January 2019 page 228 of 431
ESA UNCLASSIFIED – Releasable to the Public
Figure 17-12: stagnation pressure at Mach 0.8 as function of mass and flight path angle for Ve=21,24,25 km/s and base diameter 1.25 , 1.35m

Ice Giants CDF Study Report: CDF-187(C)
January 2019 page 229 of 431
ESA UNCLASSIFIED – Releasable to the Public
Figure 17-13 Relative flight path angle at Mach 0.8 as function of mass and flight path angle for Ve=21, 24,25 km/s and base diameter 1.25 , 1.35m

Ice Giants CDF Study Report: CDF-187(C)
January 2019 page 230 of 431
ESA UNCLASSIFIED – Releasable to the Public
This Page Intentionally Blank

Ice Giants CDF Study Report: CDF-187(C)
January 2019 page 231 of 431
ESA UNCLASSIFIED – Releasable to the Public
18 NEPTUNE EDS PARACHUTE
The Entry and Descent System (EDS) described below focuses only on the Parachute Assembly System (PAS) leaving the (hypersonic/supersonic) Entry phase under the responsibility of the Aerothermodynamics (see Chapter 17).
The PAS, see Chapter 18.3, consists of a two-stage system with a mortar-ejected subsonic pilot chute that is used to deploy the main subsonic parachute.
Each parachute consists of a canopy (ribbon, suspension lines, radial tapes, vent tapes, hem tapes), a riser, 3 bridles and a confluent fitting – see Figure 18-1.
The mass (and volume) allocation for these components are therefore included in the PAS budget together with the mortar (to eject the pilot chute) and the canister (to contain the main parachute together with the mortar of the pilot).
Additional elements required for the proper functioning of the parachute system like the separation mechanisms and the cable cutter (see Chapter 18.3) are not considered part of the PAS and can be found in the Mechanisms chapter (9)
Figure 18-1: Typical parachute components (left) and a typical conical ribbon gore layout with ribbons and radial/hem/vent tapes
18.1 Requirements and Design Drivers
The main PAS requirements and design drivers are summarised below.
It is worth noting that while the release of the Thermal Protection System (TPS), especially the front shield (FS), is required to expose the scientific instruments to the atmosphere, the actual sequence and timing are free parameters that can be tuned to

Ice Giants CDF Study Report: CDF-187(C)
January 2019 page 232 of 431
ESA UNCLASSIFIED – Releasable to the Public
minimise the PAS and TPS masses and simultaneously reduce the complexity of the system.
PAS Requirements
Req. ID Statement Parent ID
EDL-010 The PAS shall decelerate the entry probe after hypersonic/ supersonic phases
EDL-020 The PAS shall allow a safe separation of the descent module and the thermal protection system consisting of the front shield (FS) and back cover (BC)
EDL-020 The PAS shall stabilise the descent module during scientific measurement phase (1-10 bar)
EDL-030 The PAS shall be designed to guarantee a descent from 1 to 10 bar in 90 min
SYS-020
EDL-040 The PAS shall keep the g-load to an acceptable level (<50 g)
18.2 Assumptions and Trade-Offs
For the design of the PAS, the mass break-down reported in Table 18-1 has been assumed.
It is highlighted that the total mass of the probe at pilot chute ejection/inflation is 345 kg. After the removal of the back shell (BS) and associated structural mass, the mass left at main parachute opening is reduced to 294 kg.
Table 18-1: Assumed mass break-down for PAS design
Moreover, assuming a stable attitude of the capsule during transonic regime, in order to limit the dynamic pressure within the values experienced in previous missions, a subsonic (Mach = 0.8) initiation has been selected.
The full list of conditions considered at pilot chute opening (see Aerothermodynamics Chapter 17) are reported in Table 18-2:

Ice Giants CDF Study Report: CDF-187(C)
January 2019 page 233 of 431
ESA UNCLASSIFIED – Releasable to the Public
Mach 0.8
Altitude 37103 m
Atmospheric pressure 0.13 bar
FPA -50 deg
Velocity 398 m/s
Atmospheric density 0.0731 kg/m3
Dynamic Pressure 5792 Pa
Table 18-2: Condition at pilot chute deployment
Note that, although a supersonic deployment has been avoided during the study to limit the complexity of the PAS and overall system to the minimum, present European capabilities (mostly developed within the ExoMars programme) would be available to support the introduction of a supersonic parachute.
Based on a quick comparison with a few relevant missions reported in Table 18-3, due to the high dynamic pressure at parachute opening, a conical ribbon parachute type has been selected for both (pilot and main) parachutes: the slightly lower drag of this type of parachute compared to other (e.g. disc-gap-band) is largely compensated by its performance at high dynamic pressure.
Table 18-3: Previous mission and adopted parachute system (Courtesy of VOR)
The assumptions described above are summarised in Table 18-4:

Ice Giants CDF Study Report: CDF-187(C)
January 2019 page 234 of 431
ESA UNCLASSIFIED – Releasable to the Public
Assumptions
1 The PEP design of the probe and specifically of the parachute is kept as reference
2 The total entry mass of the probe (at pilot activation) is 345 kg
3 Considering a total mass of TPS of 151 kg, the total mass at main parachute opening is 294 kg (see detailed mass break-down in Table 18-2 )
4 The parachute sequence shall be activated at Mach = 0.8 at a dynamic pressure of 5792 Pa
Table 18-4: Assumption and Trade-off
For all the design and the analysis of the two parachutes, the Parachute Engineering Tool (PET) RD[53] has been extensively used. All major outputs are reported in the following sections, while additional (minor) information is available if necessary.
18.3 Baseline Design
The PAS sequence is depicted in Figure 18-2:
After the initial hypersonic/supersonic entry phase, the Mach = 0.8 condition is detected and the PAS sequence initiated
At Mach = 0.8 the pilot parachute is mortar-ejected.
With a fraction of a second delay, the back cover separation mechanisms are commanded
The pilot chute inflates and removes the back cover that extracts the main parachute (that is attached to it)
The main parachute is deployed and inflated
After a short period of time required for the probe to be stabilised, the front shield separation mechanisms are commanded and the FS is detached
The descent module under the main parachute is ready for scientific measurement acquisition.

Ice Giants CDF Study Report: CDF-187(C)
January 2019 page 235 of 431
ESA UNCLASSIFIED – Releasable to the Public
Figure 18-2: PAS sequence
18.3.1 Pilot Chute Design
The pilot chute is triggered at Mach = 0.8 (see above the detailed description of the conditions in Table 18-2) and it is needed to remove the BC and extract the main parachute.
To guaranteed sufficient drag to extract the BC, a nominal diameter D0 = 1m has been selected.
With the above condition, the simulation of the parachute opening has been performed and a maximum force, experienced at parachute inflation, has been estimated to be 3620.95 N – see Figure 18-3 (left) with a maximum deceleration of 3.5 g. The velocity decreases from the initial 398 m/s to 343.5 m/s.
Figure 18-3: pilot chute force (left) and velocity at deployment/inflation
Additional output (for brevity not fully reported here) have also been obtained. For clarity and further reference only the states of a few parameters at the completion of the pilot chute inflation (necessary to initiate the analysis of the main parachute) are briefly reported here below:

Ice Giants CDF Study Report: CDF-187(C)
January 2019 page 236 of 431
ESA UNCLASSIFIED – Releasable to the Public
Altitude 36530 m
Mach 0.685
Velocity 343.5 m/s
Density 0.0756 kg/m3
Dynamic Pressure 4448 Pa
Atmospheric Pressure 0.13 Bar
Table 18-5: Condition at pilot chute end of inflation
The maximum inflation load has then been used to size and select the material of the different elements of the parachute which are reported in Table 18-6.
As standard practice, the riser of 13 m (more than 10 capsule diameter) and three 1 m bridles have also been selected.
Component Material Name Unit Mass (kg/unit) Quantity
Mass (kg)
Mass
Margin (-)
Mass With Margin (kg)
Safety margin (-)
Ribbon PIA-T-87130A
Type XI Class 3 0.003751 12.47 0.0468 0.20 0.0561 9.42 Suspension Line
PIA-C-87129C Type XIII 0.000827 16.00 0.0132 0.20 0.0159 1.63
Radial Tape PIA-C-87129C Type XIII 0.000827 8.00 0.0066 0.20 0.0079 1.63
Riser PIA-T-87130A Type XI Class 15 0.013641 13.00 0.1773 0.20 0.2128 1.09
Bridle PIA-T-87130A
Type XI Class 15 0.013641 3.00 0.0409 0.20 0.0491 1.09
Vent Tape PIA-T-87130A Type I Class 3 0.00372 0.18 0.0007 0.20 0.0008 1.09
Hem Tape PIA-T-87130A Type II Class 1 0.00248 2.99 0.0074 0.20 0.0089 1.36
Tot
0.2929
0.3515 Table 18-6: Pilot chute mass break-down (excluding CF, bag and mortar)
The total mass of the pilot parachute is 0.2929 kg without margin and 0.3515 kg including 20% maturity margin on all the components. Finally assuming a pack density of 600 kg/m3 it requires a vol = 0.0005m3
In addition, the following items are necessary to complete the pilot chute assembly:
Confluent fitting (CF): 0.050 kg without margin, and 0.060 kg (including 20% margin)
Bag: 0.044 kg without margin, and 0.053 kg (including 20% margin) (see Figure 18-4)
Mortar or Parachute Deployment Device (PDD): 0.642 kg without margin, and 0.770 kg (including 20% margin) (see Figure 18-4).
Note that the mortar has been designed for a total ejected mass of 0.4 kg at of 40 m/s.

Ice Giants CDF Study Report: CDF-187(C)
January 2019 page 237 of 431
ESA UNCLASSIFIED – Releasable to the Public
Figure 18-4: Mortar (left – ExoMars), and typical parachute bag (right)
18.3.2 Main Parachute Design
The main parachute is extracted at the time of the pilot chute inflation with the conditions reported in Table 18-5: .
To guaranteed the correct drag allowing a descent from 1 to 10 bar in 1.5 h, a nominal diameter D0 = 7.7m has been selected.
With the above conditions, the simulation of the main parachute opening has been performed and a maximum force, experienced at parachute inflation, has been estimated to be 141,464 N.
Figure 18-5: Main parachute force (left) and velocity at deployment/inflation
Note that at inflation completion, the descent module is descending at roughly 100 m/s at approximately 36000 m, guaranteeing (rough estimate) at least 6 min before reaching the target altitude for scientific data acquisition (1 bar corresponding to the target altitude, set at 0 m).
As for the pilot chute, the maximum inflation load (of 141,464 N) has been used as input to size and select the material of the different elements of the main parachute which are reported in Table 18-7.
Component Material Name Unit Mass (kg/unit) Quantity Mass (kg)
Mass Margin (-)
Mass With Margin (kg)
Safety Margin (-)
Ribbon PIA-T-87130A Type XI Class 3 0.003751 732.61 2.7482 0.2 3.2978 2.10
Suspension Line
PIA-C-87129C Type XIV 0.014882 215.60 3.2085 0.2 3.8502 1.13
Radial Tape PIA-T-87130A Type VI Class 6 0.011161 107.80 1.2031 0.2 1.4437 1.03

Ice Giants CDF Study Report: CDF-187(C)
January 2019 page 238 of 431
ESA UNCLASSIFIED – Releasable to the Public
Component Material Name Unit Mass (kg/unit) Quantity Mass (kg)
Mass Margin (-)
Mass With Margin (kg)
Safety Margin (-)
Riser 6xPIA-T-87130A Type X Class 13 0.46968 7.00 3.2878 0.2 3.9453 1.26
Bridle 6xPIA-T-87130A Type X Class 13 0.46968 3.00 1.4090 0.2 1.6908 1.26
Vent Tape 6xPIA-T-87130A Type VI Class 6 0.067634 1.37 0.0926 0.2 0.1112 1.03
Hem Tape 2xPIA-T-
87130A Type VI Class 8 0.034443 22.83 0.7862 0.2 0.9435 1.10
Tot
12.7355
15.2826 Table 18-7: Main parachute mass beak-down (excluding CF, bag and canister) –
The total mass of the main parachute is 12.7355 kg without margin and 15.2826 kg including 20% maturity margin on all the components. Finally assuming a pack density of 600 kg/m3 it requires a volume = 0.0212 m3.
In addition, the following items are necessary to complete the main parachute assembly:
Confluent fitting: 1.98 kg without margin and 2.377 kg - including 20% margin
Bag: 0.632 kg without margin and 0.758 kg - including 20% margin
Canister: 1.146 kg without margin and 1.375 kg – including 20% margin.
18.3.3 A Preliminary Timeline
With the information collected on the previous analysis, a preliminary timeline has been defined and summarised in Table 18-8 – note the close similarity with the Galileo sequence presented in Figure 18-6.
Event Time
PC mortar deployment
T=T0=0
PC inflation T1=T0+2s
MP inflation T2=T1+2.5s = T0+4.5s
FS release T3=T2+10.5s = T0+15 s
Table 18-8: PAS timeline
Figure 18-6: Galileo sequence

Ice Giants CDF Study Report: CDF-187(C)
January 2019 page 239 of 431
ESA UNCLASSIFIED – Releasable to the Public
18.4 List of Equipment
The following table summarises the parachute equipment:
Pilot chute Main parachute
Item Mass w/o margin (kg)
Mass with margin (kg)
Item Mass w/o margin (kg)
Mass with margin (kg)
Parachute 0.293 0.351 Parachute 12.736 15.283
Bag 0.044 0.053 Bag 0.632 0.758
CF 0.050 0.060 CF 1.98 2.377
Mortar 0.642 0.770 Canister 1.146 1.375
Tot 1.029 1.234 Tot 16.494 19.739
Table 18-9: PAS equipment list and associated masses
The parachute system total mass is then 17.5 kg (w/o mass margins) and 21.0 kg (including 20% maturity margin for all components). Note however that, due to minor corrections noted after the design freeze of the baseline, these numbers are slightly higher than those in the baseline. As such, these numbers are higher than those in the systems chapter and were not modelled in OCDT or flown down to other subsystem’s design (see Table 5-6 for the pilot chute and main parachute mass values assumed for the baseline).
The parachute system total volume has then been estimated to be 0.024 m3 including extra 10% of needed volume due to the rather complex configuration with the mortar to be accommodated inside the toroidal bag of the main parachute (as in ExoMars mission).
18.5 Technology Needs
All the technologies identified in this study (which would be beneficial/enabler for the feasibility of this and/or other future ESA missions) adopted for the current mission are listed in Table 18-10.

Ice Giants CDF Study Report: CDF-187(C)
January 2019 page 240 of 431
ESA UNCLASSIFIED – Releasable to the Public
|~T Technology Needs
* Equipment
Name & Text Reference
Technology Supplier (Country)
TRL Funded
by Additional
Information
* Pilot Chute PAS IRVIN
(IT/US), Pioneer (US)
9 ARD/IXV
This type of parachute was
procured by IRVIN (IT/US) for ARD and Pioneer (US) for IXV. Similar capability have
been developed in Arescosmos (IT) under ExoMars
* PC Bag PAS
IRVIN (IT/US)
9 ARD/IXV See Pilot Chute
* PC confluent fitting
PAS Aeroscosmo (IT)
8 ExoMars Modifications will
be required
* PC Mortar
PAS APP (NL) 8 ExoMars
Modifications will be required
* Main Parachute
PAS IRVIN (IT/US)
9 ARD/IXV See Pilot Chute
* MP Bag
PAS IRVIN (IT/US)
9 ARD/IXV See Pilot Chute
* MP confluent fitting
PAS Aeroscosmo (IT)
8 ExoMars Modifications will
be required
* MP Canister
PAS Frentech (CZ)
8 ExoMars Modifications will
be required
Table 18-10: PAS Technology readiness

Ice Giants CDF Study Report: CDF-187(C)
January 2019 page 241 of 431
ESA UNCLASSIFIED – Releasable to the Public
URANUS

Ice Giants CDF Study Report: CDF-187(C)
January 2019 page 242 of 431
ESA UNCLASSIFIED – Releasable to the Public
This Page Intentionally Blank
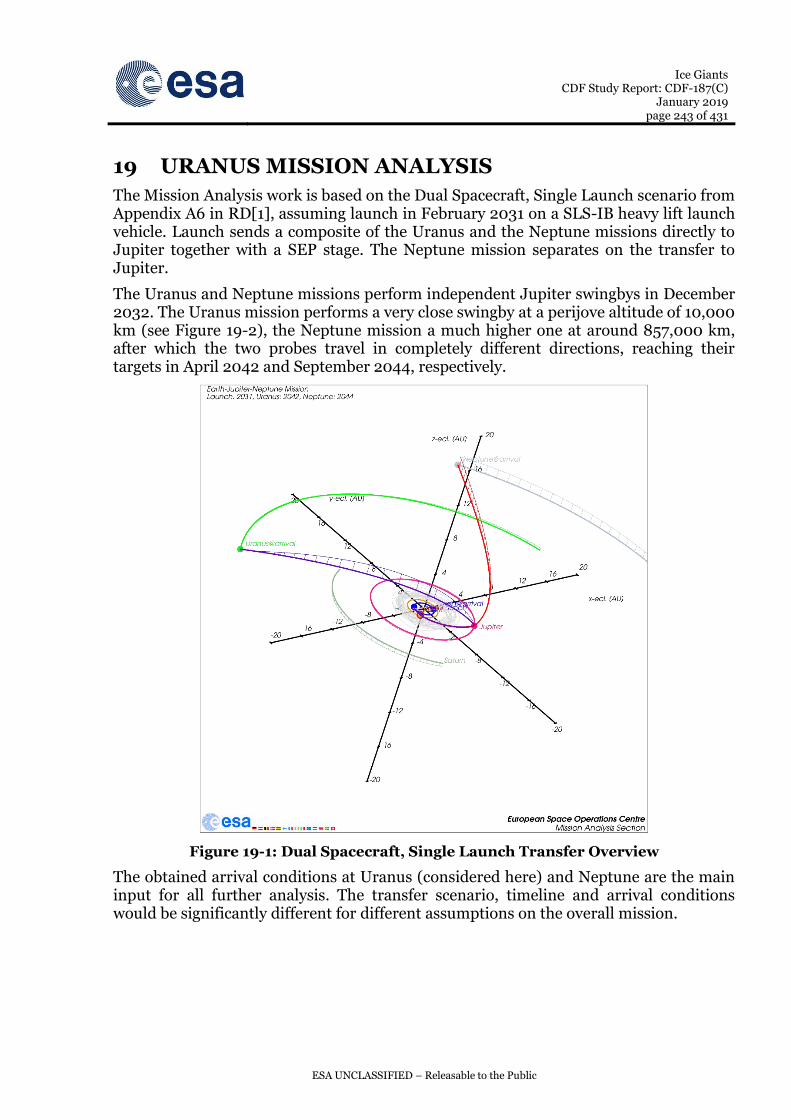
Ice Giants CDF Study Report: CDF-187(C)
January 2019 page 243 of 431
ESA UNCLASSIFIED – Releasable to the Public
19 URANUS MISSION ANALYSIS
The Mission Analysis work is based on the Dual Spacecraft, Single Launch scenario from Appendix A6 in RD[1], assuming launch in February 2031 on a SLS-IB heavy lift launch vehicle. Launch sends a composite of the Uranus and the Neptune missions directly to Jupiter together with a SEP stage. The Neptune mission separates on the transfer to Jupiter.
The Uranus and Neptune missions perform independent Jupiter swingbys in December 2032. The Uranus mission performs a very close swingby at a perijove altitude of 10,000 km (see Figure 19-2), the Neptune mission a much higher one at around 857,000 km, after which the two probes travel in completely different directions, reaching their targets in April 2042 and September 2044, respectively.
Figure 19-1: Dual Spacecraft, Single Launch Transfer Overview
The obtained arrival conditions at Uranus (considered here) and Neptune are the main input for all further analysis. The transfer scenario, timeline and arrival conditions would be significantly different for different assumptions on the overall mission.

Ice Giants CDF Study Report: CDF-187(C)
January 2019 page 244 of 431
ESA UNCLASSIFIED – Releasable to the Public
Figure 19-2: December 2032 Jupiter Swingby of the Uranus Mission
19.1 Atmospheric Probe
19.1.1 Requirements and Design Drivers
SubSystem Requirements
Req. ID Statement Parent ID
MA-010
Consistency with the entry conditions assumed in the earlier PEP study RD[7], specifically, a FPA relative to the rotating frame of -35 deg at an EIP altitude of 600 km above the 1 bar radius
MA-020 The atmospheric part of the probe mission shall take place during local daylight and with visibility from the Earth.
MA-030 The atmospheric phase of the probe mission shall last up to 90 minutes
19.1.2 Assumptions and Trade-Offs
Assumptions
1 If ESA provides a probe this is assumed to be carried by a NASA-provided orbiter which will target an inclination of either 73 or 107 deg with respect to the Uranus equator plane.
2 The inclination requirement of the orbiter together with the given entry FPA limits the number of possible entry locations. One possibility shall be chosen for further analysis.
19.1.3 Baseline Design
The Uranus entry diagram for the given scenario is displayed in Figure 19-3. Due to the unusual orientation of the planet’s rotation axis, the Sun and Earth direction and the direction towards the incoming probe are all above the Northern hemisphere. The Sun and Earth visibility terminators are shown. All entry points above the Earth visibility terminator have Earth visibility at entry. The further an entry location is from the Earth
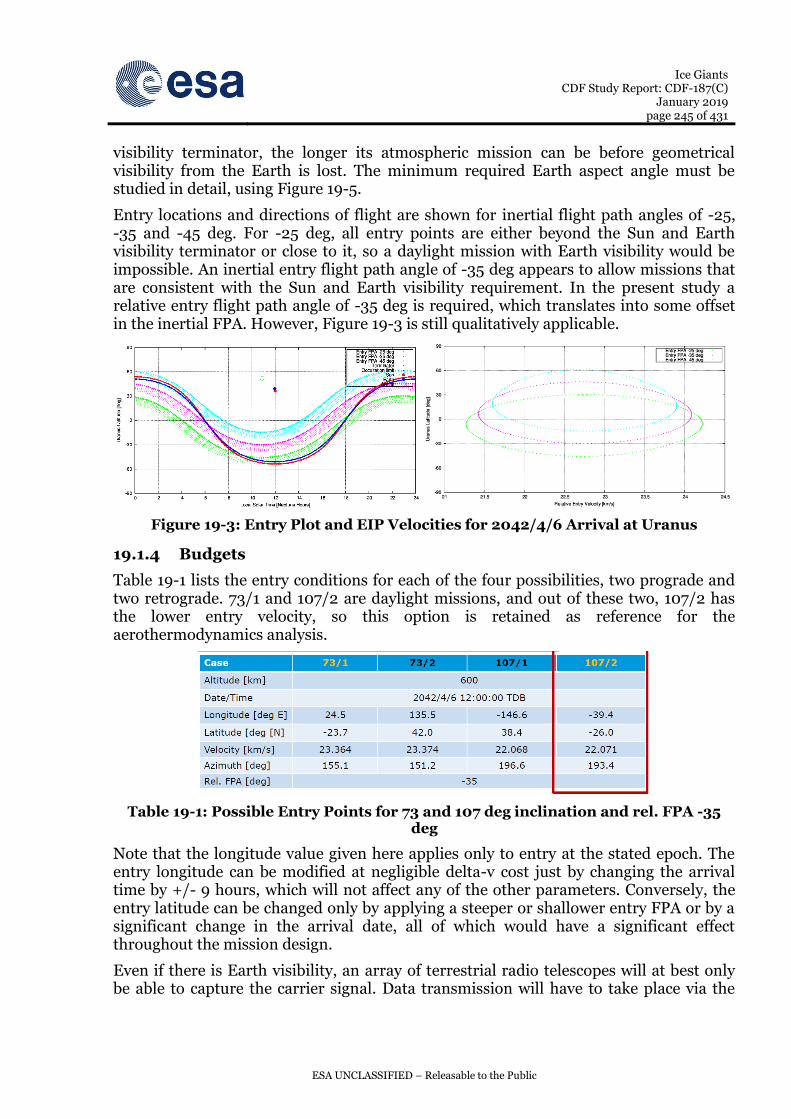
Ice Giants CDF Study Report: CDF-187(C)
January 2019 page 245 of 431
ESA UNCLASSIFIED – Releasable to the Public
visibility terminator, the longer its atmospheric mission can be before geometrical visibility from the Earth is lost. The minimum required Earth aspect angle must be studied in detail, using Figure 19-5.
Entry locations and directions of flight are shown for inertial flight path angles of -25, -35 and -45 deg. For -25 deg, all entry points are either beyond the Sun and Earth visibility terminator or close to it, so a daylight mission with Earth visibility would be impossible. An inertial entry flight path angle of -35 deg appears to allow missions that are consistent with the Sun and Earth visibility requirement. In the present study a relative entry flight path angle of -35 deg is required, which translates into some offset in the inertial FPA. However, Figure 19-3 is still qualitatively applicable.
Figure 19-3: Entry Plot and EIP Velocities for 2042/4/6 Arrival at Uranus
19.1.4 Budgets
Table 19-1 lists the entry conditions for each of the four possibilities, two prograde and two retrograde. 73/1 and 107/2 are daylight missions, and out of these two, 107/2 has the lower entry velocity, so this option is retained as reference for the aerothermodynamics analysis.
Table 19-1: Possible Entry Points for 73 and 107 deg inclination and rel. FPA -35 deg
Note that the longitude value given here applies only to entry at the stated epoch. The entry longitude can be modified at negligible delta-v cost just by changing the arrival time by +/- 9 hours, which will not affect any of the other parameters. Conversely, the entry latitude can be changed only by applying a steeper or shallower entry FPA or by a significant change in the arrival date, all of which would have a significant effect throughout the mission design.
Even if there is Earth visibility, an array of terrestrial radio telescopes will at best only be able to capture the carrier signal. Data transmission will have to take place via the

Ice Giants CDF Study Report: CDF-187(C)
January 2019 page 246 of 431
ESA UNCLASSIFIED – Releasable to the Public
orbiter, which will be performing UOI while the probe is performing atmospheric entry. The determining parameter for the coverage quality is the periapsis altitude of the orbiter.
Figure 19-4: Altitudes and Slant Range, Target Periuranion Alt. 2000 km
For a targeted periuranion altitude of 2000 km above the 1 bar radius the altitude of probe and orbiter and the probe-orbiter slant range are shown in Figure 19-4, while Figure 19-5 gives the evolution of Earth aspect angle (EAA) and Earth aspect angle (OAA), i.e., the angle between the symmetry axis of the entry probe and the directions to Earth or orbiter. The probe symmetry axis is assumed to be aligned in the opposite direction of the current relative velocity wrt. the rotating Uranus atmosphere.
Figure 19-5: EAA and OAA, Target Periuranion Altitude 2000 km
Following entry, the probe will slow down through aerodynamic drag and its relative flight path angle will quickly deepen from -35 deg to near-vertical. As a consequence, the EAA undergoes a strong initial increase, followed by a slow drift caused by the probe being carried along by the rotating planet.
Conversely, the OAA initially approaches zero as the orbiter, which was trailing the probe on a higher and slower orbit, catches up and passes the probe directly above. Around 10 minutes after entry, the OAA increases fast as the orbiter races ahead while the probe is moving only slowly with respect to the atmosphere and its lateral motion is due only to the rotation of the latent. The OAA goes above 90 deg around 22 minutes

Ice Giants CDF Study Report: CDF-187(C)
January 2019 page 247 of 431
ESA UNCLASSIFIED – Releasable to the Public
after entry. Depending on the opening angle of the probe antenna pattern the orbiter will lose contact at the latest at that point, or likely some time earlier. A target orbiter periuranion altitude of 2000 km is inconsistent with a probe mission duration of 90 minutes
Figure 19-6: Altitudes and Slant Range, Target Periuranion Alt. 25000 km
The same set of diagrams has been produced assuming a target periuranion altitude of 25000 km. In this case, the orbiter arrival is delayed significantly and the probe-orbiter geometry is much different, leading to a much larger slant range with a minimum of 30000 km but also a time of 90 minutes from entry to the point where the OAA reaches 90 deg. This indicates that the target periuranion altitude must be at least 25000 km to support a 90 minute probe mission, possibly higher.
Figure 19-7: EAA and OAA, Target Periuranion Altitude 25000 km
Note that the switch to a high periuranion altitude has implications not only on the ODM and UOI size but that it may also lead to intersection of the rings. This must be studied in detail.

Ice Giants CDF Study Report: CDF-187(C)
January 2019 page 248 of 431
ESA UNCLASSIFIED – Releasable to the Public
19.2 Orbiter
19.2.1 Requirements and Design Drivers
19.2.2 Assumptions and Trade-Offs
Assumptions
1
In the present study, a target periuranion altitude of 2000 km above the 1 bar radius and an apouranion radius of 225 RU has been assumed. This would lead to an orbital period of 148 days, which exceeds he requirement of 140 days, though the difference in delta-v is small.
2 For the ESA-provided orbiter, the communications with the entry probe, which will then not be provided by ESA, is not assumed to be object of the study
3 The tour design is assumed not to be object of the study. The information related to the tour contained in the NASA document RD[1] is considered to be applicable.
19.2.3 Baseline Design
For the orbiter study, no considerations related to deploying a Uranus entry probe have been taken into account. Therefore, the ODM is not budgeted. The UOI manoeuvre has been modelled for different T/M ratios, assuming a target apouranion radius of 225 RU.
19.2.4 Budgets
Table 4-2 shows the UOI size and duration obtained via numerical propagation of the trajectory as function of the thrust/mass ratio at start of the manoeuvre, assuming that the thrust acceleration is anti-tangential to the current uranocentric velocity. The target periuranion altitude is assumed as 2000 km.
This flyby altitude would be achieved if no manoeuvre took place; it would also be the periuranion altitude of the capture orbit if the manoeuvre were near-impulsive. The longer the manoeuvre duration, the more the osculating periuranion is lowered during the burn. This, together with the significant gravity losses, should be taken into account when designing the propulsion system.
As discussed, the assumed target aopuranion radius is 225 RU. The change in the UOI when targeting to a slightly higher or lower apouranion is negligible. All further details on the tour timeline and manoeuvre sequence are beyond the scope of the CDF study and should be taken from RD[1].
Description: Target periuranion altitude 2000 km, apouranion radius
225 RU
Thrust/Mass ratio [N/kg]
UOI [m/s] Duration [s]
0.25 1878 5658
0.5 1744 2678
1.0 1699 1373
1.5 1690 872
Table 19-2: UOI Size as Function of T/M Ratio

Ice Giants CDF Study Report: CDF-187(C)
January 2019 page 249 of 431
ESA UNCLASSIFIED – Releasable to the Public
20 URANUS SYSTEMS
20.1 Atmospheric Probe
20.1.1 Mission & System Requirements and Design Drivers
The requirements and design drivers for the Uranus probe design case are the same as for the Neptune case, apart from the replacement of SYS-010 in Table 4-2 by the requirement in Table 20-1.
System Requirements
Req. ID Statement Parent ID
SYS-010 The probe shall be carried by the NASA orbiter to Uranus
Table 20-1: System requirements
20.1.2 Mission System Architecture
The system architecture and design of the probe is the same as for the Neptune option.
Note that, given the spin properties of Uranus, the entry and descent profiles look very different to those reported for Neptune (see Mission Analysis chapter). Nonetheless, as shown in Figure 20-1, the selected FPA of -35deg still satisfies the requirements for almost all cases.
Figure 20-1: Entry conditions for Uranus probe for different FPA
20.1.3 System Baseline Design
Mass, power and data budgets for the Uranus probe are the same as for the Neptune probe.

Ice Giants CDF Study Report: CDF-187(C)
January 2019 page 250 of 431
ESA UNCLASSIFIED – Releasable to the Public
20.2 Orbiter
20.2.1 System Requirements and Design Drivers
Mission Requirements
Req. ID Statement Parent ID
MIS-010 The mission shall be launched within a timeframe of 2029 to 2034.
MIS-020 The mission shall be compatible with launch via a SLS Block 1B.
MIS-030 The total mission cost shall be within an M-class ESA science mission budget.
MIS-040 The mission shall be capable of performing in-situ and observational measurements at Uranus with a payload suite defined by the Study Science Team.
MIS-050 The mission shall be capable of performing in-situ and observational measurements at the Uranian moons with a payload suite defined by the Study Science Team.
MIS-060 The mission shall include at least 2 years (TBC) of science operations at Uranus.
System Requirements
Req. ID Statement Parent ID
SYS-010 The orbiter shall be compatible with a dual launch with a NASA orbiter on an SLS Block 1B in a TBD configuration.
SYS-020 The orbiter shall be delivered to NASA for final integration onto the launcher.
SYS-030 The orbiter delivery date to NASA shall be compatible with the selected launch date and any pre-launch activities agreed between ESA and NASA.
SYS-040 The orbiter shall be compatible with a storage of TBD months before integration onto the launcher.
SYS-050 The orbiter design shall allow late access for integration of the RTGs under the launcher fairing.
SYS-060 The orbiter shall include a payload suite of 116 kg (TBC).
SYS-070 The operational lifetime of the orbiter shall be at least 13.5 years after launch (baseline: 15.5 years)
SYS-080 The science operations phase of the mission shall be at least 2 years (baseline: 4 years)
SYS-090 The orbiter shall rely solely on its own power source(s) during cruise with the NASA orbiter.
SYS-100 The orbiter shall provide a SpaceWire interface to the NASA

Ice Giants CDF Study Report: CDF-187(C)
January 2019 page 251 of 431
ESA UNCLASSIFIED – Releasable to the Public
System Requirements
Req. ID Statement Parent ID
orbiter.
SYS-110 The orbiter shall be asleep during cruise with the NASA orbiter, apart from periodic checkouts.
SYS-120 The orbiter shall not require any active thermal control from the NASA orbiter.
SYS-130 The orbiter shall separate from the NASA orbiter before the Jupiter swing-by.
SYS-140 The orbiter shall be able to perform an independent interplanetary transfer from separation until Uranus.
SYS-150 The orbiter shall be able to insert into orbit around Uranus.
SYS-160 The orbiter shall be able to download all gathered science data within the nominal mission duration (TBC).
SYS-170 The orbiter shall be compatible with all environments from integration until EOM.
SYS-180 The orbiter shall include redundancy for all mission-critical functionalities. (TBC)
Table 20-2: System requirements
20.2.2 Design Drivers
As for the Neptune design case.
20.2.3 System Assumptions and Trade-Offs
Assumptions as for the Neptune case, plus the additional assumption in Table 20-3.
Assumptions
1 The Uranus case shall envisage maximum reuse of the Neptune orbiter design. As such, some systems (e.g. communications) may be oversized.
Table 20-3: Additional assumption for Uranus design case
20.2.3.1 Dual launch configuration trade-off
As for the Neptune design case.
20.2.3.2 Radiation shielding trade-off
The radiation levels observed by the spacecraft equipment behind 2.5, 4 or 10 mm of shielding structure is presented in Table 20-4. The values in the first row (“Original analysis”) represent the sizing values which were used in the analysis. The values in the second row (“Revised analysis”) came during the IFP and were not able to be injected into the baseline design. As can be seen, the revised analysis predicts a significantly milder radiation environment beyond 4 mm. This is driven by the corrected trajectories

Ice Giants CDF Study Report: CDF-187(C)
January 2019 page 252 of 431
ESA UNCLASSIFIED – Releasable to the Public
(inclined flyby, versus a near-equatorial earlier assumption) for the flyby around Jupiter.
Note that the high predicted radiation doses for the Uranus case are driven by the Jupiter flyby, during which a significant dose is imparted. For the “original analysis” environment, it was also predicted that beyond 10mm Al, the TIDL is driven by the electron environment, which cannot be compensated further by increasing aluminium thickness.
Taking into account the “original analysis” values (predicting 164 krad behind 10 mm Al), 2 options were considered for radiation shielding:
1. Shield sensitive units individually to 10 mm Al (4 mm from the spacecraft structure + 6 mm additional shielding). Any units which still cannot survive the residual TIDL of 164 krad would require delta-design and re-qualification to this level.
2. Shield the entire inner spacecraft (with a radiation “vault”) to 10 mm Al. Again, any units which still cannot survive the residual TIDL of 137 krad would require delta-design and re-qualification to this level.
Uranus TIDL (krad)
2.5 mm (~100mil) 4 mm 10mm
Original analysis 1350 509 164
Revised analysis 1130 155 40
Table 20-4: Radiation levels for Uranus Orbiter
As stated above, it was assumed that each unit sees an equivalent of 4 mm of Al shielding from the spacecraft structure and surrounding equipment. Table 20-5 presents the additional shielding required by each unit for Option 1, up to a maximum of 6 mm Al (giving 10 mm Al total).
From Table 20-5, and given the TIDS of each unit, at least 7 equipment from the Uranus orbiter would require extra shielding and delta-design / re-qualification. As for the Neptune case, the TIDS of the communication subsystem equipment and payload were identified during the course of the study. In a worst case scenario, they might require up to 150 kg of radiation shielding and delta-design / re-qualification. Thus, these subsystems should be further studied.

Ice Giants CDF Study Report: CDF-187(C)
January 2019 page 253 of 431
ESA UNCLASSIFIED – Releasable to the Public
Unit TIDS (krad)
Uranus Option 1
Thickness required
Thickness applied
(assuming 4 mm provided by
structure and unit)
Aluminium Radiation
shielding mass (kg)
Delta-design /
re-qualification required
164 krad
Gyro 20 >10 mm 6 mm 1.3 Yes
IMU 100 >10 mm 6 mm 2x4.3 Yes
NavCam 2000 None None 0 No
RW 20 >10 mm 6 mm 4x2.9 Yes
STR 2000 None None 0 No
CDMU 100 >10 mm 6 mm 2x6.5 Yes
RIUC 100 >10 mm 6 mm 1.9 Yes
PCDU 50 >10 mm 6 mm 6.7 Yes
Batteries 4000 None None 0 No
Radiation monitor
100 >10 mm 6 mm 1.7 Yes
Comms* TBD >10 mm 6 mm 20 TBD
Payload TBD >10 mm 6 mm 130 TBD
Total 197
Total w/ 20% margin
237
*includes shielding of Ka and X-band EPC, TWT and X-band Transponder
Table 20-5: Uranus orbiter radiation trade-off
As such, for Option 1, approximately 237 kg (including 20% margin) would be required for the known cases. This is mostly driven by the unknown requirements of the payload, which is assumed to require 130 kg shielding.
For Option 2, assuming a spacecraft diameter of 3.5m and height of 2.1m, a total shielding mass of 374 kg (including 20% margin) was estimated. As such, the Option 1 shielding concept was selected for the mission baseline.
Revised analysis
Using the values of the “revised analysis”, the required shielding mass projections would not change. Note however, that this is based on the simplified analysis performed. In

Ice Giants CDF Study Report: CDF-187(C)
January 2019 page 254 of 431
ESA UNCLASSIFIED – Releasable to the Public
this analysis, a simple step-change at 2.5 mm, 4 mm and 10 mm Al was considered. No interpolation was considered between these points. As such, any unit which cannot survive the 4 mm level was automatically given the full 10 mm shielding.
For the “original analysis”, this was less significant as the variation was from 509 krad at 4 mm to 164 krad at 10 mm. No units were identified which had a TIDS within these two data points.
However for the “revised analysis”, the IMU, CDMU, RIUC, PCDU and radiation monitor all had TIDS within the two data points (155 krad at 4 mm, 40 krad at 10 mm). As such, their required shielding would not be the full 10 mm. Such a reduction in the estimate would be the result of an additional analysis.
Note that in the “revised analysis” case, the IMU, CDMU, RIUC, PCDU and radiation monitor would also not require delta-design / re-qualification, if given the correct shielding.
Should the same approach be followed for the Uranus design case as for Neptune, whereby it was assumed that all units would be able to reach a TIDS of minimum 60 krad (excluding RHA margin), then the shielding values via extrapolation would be lower still.
Radiation shielding conclusions
Given the late provision of the “revised analysis” predictions, the system baseline maintains the values from the “original analysis”. Future work should include a reiteration of the design based on the “revised analysis”, including extrapolation for radiation shieldings of varying thickness.
In addition, future work must also address exposed surfaces which may not see significant shielding from the spacecraft structure, such as external surfaces and optical elements. Such elements may still see TIDLs an order of magnitude higher than for the Neptune case. Furthermore, the coupling of the interplanetary transfer properties, e.g. launch date, and the radiation exposure seen during the Jupiter flyby should be investigated further.
20.2.4 Mission System Architecture
20.2.4.1 Mission timeline
The mission timeline is presented in Figure 20-2. Note that the proposed mission foresees two orbiters, one provided by ESA (which journeys to Uranus) and one provided by NASA (which journeys to Neptune).

Ice Giants CDF Study Report: CDF-187(C)
January 2019 page 255 of 431
ESA UNCLASSIFIED – Releasable to the Public
Figure 20-2: Mission timeline (Uranus)
As for the Neptune design case, the two orbiters are to be launched in a dual launch configuration on an SLS Block-1B in February 2031. The NASA orbiter is still assumed to be attached to the Solar Electric Propulsion (SEP) unit, which provides power (to the NASA orbiter) and propulsion (to the stack) up until just after a Jupiter swing-by in December 2032. Shortly before the Jupiter swing-by, the ESA orbiter detaches from the NASA orbiter. It thereafter travels alone to Uranus.
The ESA orbiter should arrive at Uranus in April 2042. Note that this is over two years earlier than in the Neptune design case. The science operations phase at Uranus is envisaged to include planetary science of Uranus, coupled with multiple fly-bys of some of its moons. This tour was not analysed in detail, however a 4 year science operations duration was assumed, based on the initial tour design of RD[1].
20.2.4.2 Mission phases
The mission phases are presented in Table 20-6. The durations until the “independent swing-by phase [of Jupiter]” are the same as for the Neptune design case. As above, the baseline science operations phase duration was set at 4 years. This covered the worst sizing case for the power subsystem (i.e. eMMRTGs) and unit radiation tolerance and reliabilities.

Ice Giants CDF Study Report: CDF-187(C)
January 2019 page 256 of 431
ESA UNCLASSIFIED – Releasable to the Public
Mission Phase Duration
(LEOP and) transfer phase [to Jupiter] 1.5 - 2 years
Independent swing-by phase [of Jupiter] ~6 months (TBC)
Cruise phase 9.5 years
Insertion phase 1-2 weeks (TBC)
Science phase 4 years
Disposal TBD
TOTAL: ~15.5 years
Table 20-6: Mission phases (Uranus)
The duration of the insertion phase (for operational constraints) and disposal are also to be clarified in later work.
20.2.4.3 Science operations timeline
The science operations to be performed in Uranus orbit include a mixture between planetary observations and measurements of some Uranian moons (e.g. Titania, Oberon, Umbriel, Miranda and Ariel). As for the Neptune design case, the Uranian moon measurements are performed during close fly-bys, while the majority of the Uranus science is performed at Uranus periapsis. A reference science timeline was defined in order to size the system, as represented in Figure 20-3. Note however that this does not correspond precisely to any single orbit case identified by mission analysis.
Figure 20-3: Science operations timeline (Uranus)
The reference orbit includes 100 hours of Uranus periapsis science, during the “Uranus Closest Approach” phase. This is broken only intermittently by 3.2 hour communications windows, budgeted for one window per 24 hours.
During the Uranian moon fly-bys, there are two science phases: the “Closest Approach Moon 1” (11 hours before and after the closest point to the moon), and the “Closest Approach Moon 2” (the 2 hours closest to the moon during the fly-by). This covers a

Ice Giants CDF Study Report: CDF-187(C)
January 2019 page 257 of 431
ESA UNCLASSIFIED – Releasable to the Public
total period of 24 hours of moon science. During this phase, there are no communications back to Earth.
For the remainder of the orbit, the orbiter performs “Nominal science”. This uses a reduced payload selection, in order to use the surplus power from the RTG’s to charge the spacecraft batteries for the higher-consumption phases. During this part of the orbit, the spacecraft also performs 3.2 hours communications of science data per day.
Note that the reference timeline considers a reduction in the orbital period over the 4 years of science performed at Uranus. This reduces from an orbital period of 150 Earth days at the initial orbit, to 50 Earth days by the end of the mission. This was sized on a preliminary understanding of the Triton tour envisaged by NASA in RD[1]. Later analysis revealed that this assumption was incorrect, and that an orbital period reduction of initially 107 Earth days down to 38 Earth days by end-of-mission was more likely. This however could not be re-addressed in the current work. Note that such sizings are highly dependent on the Uranus moon fly-by tour selected, and as such this should be further iterated in future work.
20.2.4.4 System modes
The orbiter system modes are defined in Figure 20-4.
Figure 20-4: System modes (Uranus)
20.2.4.5 Science sub-modes
The science sub-modes are analogous to those for the Neptune orbiter.
20.2.4.6 Mission options
RD[1] also includes a science operations phase of 2 years at Uranus. As discussed above, the duration of the science phase is highly dependent on the moon tour selected, and it’s compatibility with the science goals of the mission. Reducing the science phase to 2 years would improve the eMMRTG output power at EOM (due to short mission duration), while also reducing the requirements on unit radiation tolerance and

Ice Giants CDF Study Report: CDF-187(C)
January 2019 page 258 of 431
ESA UNCLASSIFIED – Releasable to the Public
reliabilities, delta-V on-orbit, and mission cost. As such, it would provide an attractive alternative, as long as the science requirements can be fulfilled.
20.2.5 System Baseline Design
The baseline orbiter design is summarised in Table 20-7.
Orbiter
Mass (Incl 20% system margin)
Dry mass: 1914 kg
Propellant mass (excl. margin): 2484 kg
Wet mass: 4398 kg
Payload Camera
Imaging Spectrometer
Ion and Neutral Mass Spectrometer
Magnetometer
Microwave radiometer
Ultra Stable Oscillator (USO)
Ka-band transponder
Propulsion 1x main bipropellant thruster (1000 N)
16x RCS thrusters (10 N)
3x pressurant tanks (120 L)
4x propellant tanks (550 L)
AOGNC 1x coarse rate sensor
2x navigation cameras
2x IMUs
2x star trackers
4x reaction wheels
(+ RCS thrusters)
Communications X-band uplink/downlink
Ka-band downlink (94 kbps)
Science volume downlinked: 1.09 Gb/day
Communication window duration: 3.2 h/day
Data volume generated by EOM: 1.6 Tb
Power 3x eMMRTGs (EOM Power = 90W for 4 year science phase)
4x 48kg batteries
Data Handling Redundant OBC + 1Tbit of storage
Structures 303 kg
Thermal Heaters + use of the eMMRTG thermal dissipation
Table 20-7: Orbiter system baseline (Uranus)

Ice Giants CDF Study Report: CDF-187(C)
January 2019 page 259 of 431
ESA UNCLASSIFIED – Releasable to the Public
20.2.6 System Budgets
20.2.6.1 Mass budget
The mass budget for the Uranus orbiter is presented in Table 20-8. Residuals’ propellant mass margins are already included in the values provided by chemical propulsion (see Chemical Propulsion Chapter).
SC Mass Budget Mass [kg]
Attitude, Orbit, Guidance, Navigation Control 60.40
Communications 71.64
Chemical Propulsion 233.94
Data-Handling 38.48
Instruments 118.41
Mechanisms 39.00
Power 350.04
Structures 303.26
Radiation Shielding 237.02
Thermal Control 65.89
Radiation Instrumentation 1.49
Harness 5% 75.90
Dry Mass w/o System Margin 1595.48
System Margin 20% 319.10
Dry Mass incl. System Margin 1914.58
CPROP Fuel Mass 931.72
CPROP Fuel Margin 0% 0.00
CPROP Oxidizer Mass 1537.34
CPROP Oxidizer Margin 0% 0.00
CPROP Pressurant Mass 14.70
CPROP Pressurant Margin 0% 0.00
Total Wet Mass 4398.33
Table 20-8: Uranus orbiter mass budget
The corresponding equipment list is presented in Table 20-9.
Equipment #
Mass (kg)
Total Mass (kg)
Mass margin (%)
Total mass incl. margin (kg)
SC (Spacecraft)
AOGNC
56 7.86 60.4
IMU_Astrix_1090A_1 (IMU Airbus Astrix 1090A #1)
2 5.00 10.00 5 10.5
NavCam_1 (NavCam #1) 2 11.00 22.00 5 23.1
RW_HR04_1 (RW Honeywell HR04 #1) 4 2.60 10.40 20 12.5
STR_HydraEU_Juice_1 (STR Sodern Hydra JUICE Electronics Unit #1)
2 3.60 7.20 5 7.6
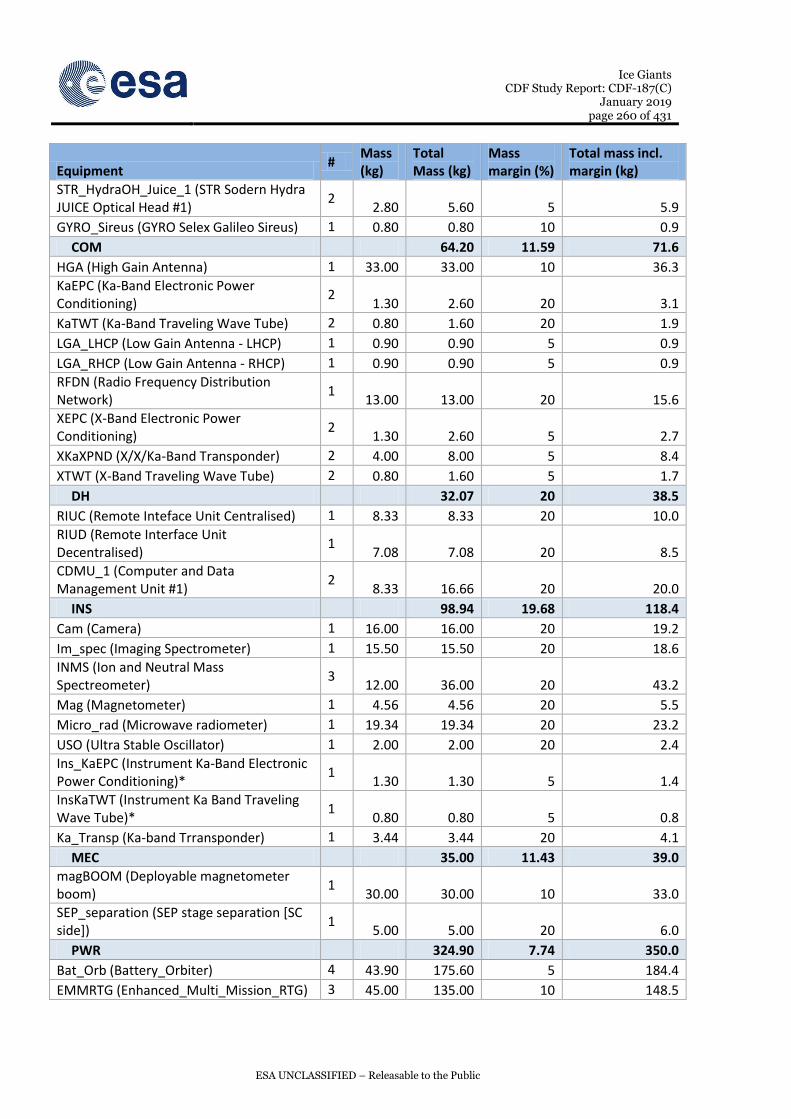
Ice Giants CDF Study Report: CDF-187(C)
January 2019 page 260 of 431
ESA UNCLASSIFIED – Releasable to the Public
Equipment #
Mass (kg)
Total Mass (kg)
Mass margin (%)
Total mass incl. margin (kg)
STR_HydraOH_Juice_1 (STR Sodern Hydra JUICE Optical Head #1)
2 2.80 5.60 5 5.9
GYRO_Sireus (GYRO Selex Galileo Sireus) 1 0.80 0.80 10 0.9
COM
64.20 11.59 71.6
HGA (High Gain Antenna) 1 33.00 33.00 10 36.3
KaEPC (Ka-Band Electronic Power Conditioning)
2 1.30 2.60 20 3.1
KaTWT (Ka-Band Traveling Wave Tube) 2 0.80 1.60 20 1.9
LGA_LHCP (Low Gain Antenna - LHCP) 1 0.90 0.90 5 0.9
LGA_RHCP (Low Gain Antenna - RHCP) 1 0.90 0.90 5 0.9
RFDN (Radio Frequency Distribution Network)
1 13.00 13.00 20 15.6
XEPC (X-Band Electronic Power Conditioning)
2 1.30 2.60 5 2.7
XKaXPND (X/X/Ka-Band Transponder) 2 4.00 8.00 5 8.4
XTWT (X-Band Traveling Wave Tube) 2 0.80 1.60 5 1.7
DH
32.07 20 38.5
RIUC (Remote Inteface Unit Centralised) 1 8.33 8.33 20 10.0
RIUD (Remote Interface Unit Decentralised)
1 7.08 7.08 20 8.5
CDMU_1 (Computer and Data Management Unit #1)
2 8.33 16.66 20 20.0
INS
98.94 19.68 118.4
Cam (Camera) 1 16.00 16.00 20 19.2
Im_spec (Imaging Spectrometer) 1 15.50 15.50 20 18.6
INMS (Ion and Neutral Mass Spectreometer)
3 12.00 36.00 20 43.2
Mag (Magnetometer) 1 4.56 4.56 20 5.5
Micro_rad (Microwave radiometer) 1 19.34 19.34 20 23.2
USO (Ultra Stable Oscillator) 1 2.00 2.00 20 2.4
Ins_KaEPC (Instrument Ka-Band Electronic Power Conditioning)*
1 1.30 1.30 5 1.4
InsKaTWT (Instrument Ka Band Traveling Wave Tube)*
1 0.80 0.80 5 0.8
Ka_Transp (Ka-band Trransponder) 1 3.44 3.44 20 4.1
MEC
35.00 11.43 39.0
magBOOM (Deployable magnetometer boom)
1 30.00 30.00 10 33.0
SEP_separation (SEP stage separation [SC side])
1 5.00 5.00 20 6.0
PWR
324.90 7.74 350.0
Bat_Orb (Battery_Orbiter) 4 43.90 175.60 5 184.4
EMMRTG (Enhanced_Multi_Mission_RTG) 3 45.00 135.00 10 148.5

Ice Giants CDF Study Report: CDF-187(C)
January 2019 page 261 of 431
ESA UNCLASSIFIED – Releasable to the Public
Equipment #
Mass (kg)
Total Mass (kg)
Mass margin (%)
Total mass incl. margin (kg)
PCDU_Orb (Power Conditioning & Distribution Unit_Orbiter)
1 10.30 10.30 20 12.4
Ext_Pwr_Shnt (External power shunt) 1 1.00 1.00 20 1.2
Res_Pwr_Shnt (Resisitive power shunt) 3 1.00 3.00 20 3.6
STR
252.72 20 303.3
APs (Assembly Panels) 1 54.82 54.82 20 65.8
BP (Bottom Panel) 1 18.16 18.16 20 21.8
CPROP_TD (CPROP_Tank Deck) 1 21.88 21.88 20 26.3
MC (Module Collars) 1 22.00 22.00 20 26.4
SPs (Shear_Panels) 1 28.64 28.64 20 34.4
TP (Top Panel) 1 18.16 18.16 20 21.8
TR (Tube Rings) 1 12.74 12.74 20 15.3
TSS (Tank Supporting Struts) 1 66.00 66.00 20 79.2
TST (Tank Supporting Tube) 1 10.32 10.32 20 12.4
TC
59.72 10.34 65.9
TCS (Thermal Control Subsystem) 1
0.00 0 0.0
NO_BP (NO_Black_Paint) 1 10.00 10.00 10 11.0
NO_Louvre (NO_Louvres) 1 2.05 2.05 20 2.5
NO_MLI_ex (NO_MLI_external_22-layer) 1 32.00 32.00 10 35.2
NO_MLI_HGA (NO_MLI_HGA_10-layer) 1 1.60 1.60 10 1.8
NO_MLI_int (NO_MLI_internal_10-layer) 1 3.20 3.20 10 3.5
NO_Rad (NO_Radiator_SSM-tape) 1 0.20 0.20 10 0.2
NO_WP (NO_White_Paint) 1 0.80 0.80 10 0.9
NO_MLI_RTG_rad (NO_MLI_RTG_radiative_shield)
1 0.80 0.80 10 0.9
NO_MLI_RTG_ShuntRad (NO_RTG_ShuntRadiator)
1 1.88 1.88 10 2.1
NO_Therm_01 (NO_Thermistor) 40 0.06 2.40 10 2.6
O_Heater_01 (O_Heater) 80 0.06 4.80 10 5.3
CPROP
221.6 5.56 233.9
Biprop_FDV_1 (Biprop_FillDrain_Valve) 9 0.07 0.63 5 0.7
Biprop_Filter_1 (Biprop_Filter) 4 0.08 0.31 5 0.3
Biprop_LP_Trans_1 (Biprop_LP_Transducer)
4 0.22 0.86 5 0.9
Biprop_LV_1 (Biprop_Latch_Valve) 4 0.75 3.00 5 3.2
Biprop_NRV_1 (Biprop_Non_Return_Valve)
4 0.59 2.34 5 2.5
Biprop_Pipes (Biprop_Pipes) 1 8.00 8.00 20 9.6
Biprop_Thruster_Main_1 (Biprop_Thruster_Main #1)
1 7.80 7.80 5 8.19
Biprop_PR_1 (Biprop_PressureRegulator) 2 1.00 2.00 5 2.1
Biprop_Pres_Tank_1 3 23.50 70.5 5 7.40

Ice Giants CDF Study Report: CDF-187(C)
January 2019 page 262 of 431
ESA UNCLASSIFIED – Releasable to the Public
Equipment #
Mass (kg)
Total Mass (kg)
Mass margin (%)
Total mass incl. margin (kg)
(Biprop_Pressurant_Tank)
Biprop_Prop_Tank_1 (Biprop_Prop_Tank) 4 28.29 113.18 5 118.84
Biprop_SMA_Valve_1 (Biprop_SMA_Valve) 2 0.16 0.32 20 0.4
Biprop_Thruster_RCS_1_01 (Biprop_Thruster_RCS #1)
16 0.65 10.40 5 10.9
Biprop_HP_LV (Biprop_HP_Latch_Valve) 1 0.80 0.80 5 0.8
Biprop_HP_Trans (Biprop_HP_Transducer) 1 0.22 0.22 5 0.2
Biprop_PV_1 (Biprop_Pyro_Valve) 4 0.32 1.26 5 1.3
RAD 1.35 10 1.5
rad_mon_ngrm (Radiation Monitor NGRM) 1 1.35 1.35 10 1.5
*These equipment are here modelled as part of the instruments (payload) as they are only required to perform radio science, but are actually integrated into the architecture of the communication subsystem
Table 20-9: Uranus orbiter equipment list
20.2.6.2 Power budget
The Uranus orbiter power budget was assumed the same as the Neptune orbiter power budget. Although the later has an additional main thruster, which is activated during the manoeuvre mode, both systems were designed considering only one thruster in terms of power consumption. This should however not affect the power subsystem design which is driven by the science operations.
20.2.6.3 Data budget
The Uranus orbiter data budget is the same as the Neptune orbiter data budget.
20.2.6.4 Dissipation budget
The Uranus orbiter dissipation budget was assumed the same as the Neptune orbiter dissipation budget.
20.2.6.5 Delta V budget
The Uranus orbiter Delta V budget is presented in Table 20-10.
Delta-v Budget Manoeuvre
type Orbiter to
Uranus Unit Comment
Jupiter fly-by Targeting stochastic 15 m/s Orbital Insertion deterministic 1878 m/s From propulsion, consedering
baseline T/M ratio Triton/Uranus Moon Targeting
deterministic 201 m/s
Planet Tour Deterministic deterministic 85 m/s Planet Tour Stochastic stochastic 30 m/s Planet Tour Future Design deterministic 20 m/s Margin on stochastic delta- 0 % 3sigma values, no margin

Ice Giants CDF Study Report: CDF-187(C)
January 2019 page 263 of 431
ESA UNCLASSIFIED – Releasable to the Public
Delta-v Budget Manoeuvre type
Orbiter to Uranus
Unit Comment
v applied Margin on deterministic delta-v
5 %
Total det. and stoch. Manoeuvres
2338.2 m/s
Disposal manoeuvre 10 m/s Margin on disposal manoeuvre
0 %
Total disposal manoeuvre 10 m/s
AOCS delta-v 149.3 m/s Margin on total propellant estimated by propulsion
Margin on AOCS delta-v 0 % Total AOCS delta-v 149.3 m/s
Total delta-v without margin 2388.3 m/s Total delta-v including margin 2497.5 m/s
Table 20-10: Uranus orbiter Delta V budget
20.2.7 System Options
20.2.7.1 Payload timeline (JV)
The assumptions for the payload timeline and the communication window duration are the same as for the Neptune case. With the exception of the downlink data rate which is 94 kbps in the Uranus case.
20.2.7.1.1 Results
The results for the communication window duration have been sized for the 50 day orbit, to ensure that the total generated energy equals the total consumed energy per orbit.
The total communication window duration in this case is 3.2 hours. Table 20-11 shows that the worst case is the 50 day orbit and that there is energy available in case of a different orbit duration. Table 20-12 shows that, in contrast to the Neptune case, there is a positive data margin for all of the orbits.
Energy
Days Generated Consumed Margin
50 291600 291600 0 Wh
75 437400 425107 12293 Wh
100 583200 558614 24586 Wh
Table 20-11: Power consumed in each science mode for the instruments and the platform

Ice Giants CDF Study Report: CDF-187(C)
January 2019 page 264 of 431
ESA UNCLASSIFIED – Releasable to the Public
Energy
Days Generated downlinked Margin
50 32 55 24 Gb
75 40 83 44 Gb
100 47 111 64 Gb
Table 20-12: The total data generate, downlink availability and margin for a 50, 75 and 100 day orbit
Figure 20-5: The energy margin available plotted against the data margin available. The circled points are the data points from Table 20-11 and Table 20-12
The numbers in the following pictures are preliminary numbers that will change significantly with minor changes in the power budget.

Ice Giants CDF Study Report: CDF-187(C)
January 2019 page 265 of 431
ESA UNCLASSIFIED – Releasable to the Public
Figure 20-6: The consumed energy per mode and per orbit in kW and percentage over the total orbit for the 50 day orbit
Day
s50
Inst
rum
en
ts51
865
22%
Pla
tfo
rm18
6968
78%
Tota
l23
8832
100%
Inst
rum
en
ts12
772
5%
Pla
tfo
rm15
554
7%
Tota
l28
326
12%
Inst
rum
en
ts18
126
8%
Pla
tfo
rm50
376
21%
Tota
l68
502
29%
Inst
rum
en
ts16
884
7%In
stru
me
nts
436
0%In
stru
me
nts
3646
2%
Pla
tfo
rm11
6797
49%
Pla
tfo
rm35
30%
Pla
tfo
rm38
882%
Tota
l13
3681
56%
Tota
l79
00%
Tota
l75
343%
Co
mm
s d
ura
tio
n/d
ay
No
min
al S
cie
nce
Clo
sest
ap
pro
ach
C
lose
st a
pp
roac
h
Tota
l
Clo
sest
ap
pro
ach
Ura
nu
s
Mo
on

Ice Giants CDF Study Report: CDF-187(C)
January 2019 page 266 of 431
ESA UNCLASSIFIED – Releasable to the Public
Figure 20-7: The consumed energy per mode and per orbit in kW and percentage over the total orbit for the 75 day orbit
Day
s75
Inst
rum
en
ts70
378
20%
Pla
tfo
rm27
7527
80%
Tota
l34
7904
100%
Inst
rum
en
ts12
772
4%
Pla
tfo
rm15
554
4%
Tota
l28
326
8%
Inst
rum
en
ts27
189
8%
Pla
tfo
rm75
564
22%
Tota
l10
2753
30%
Inst
rum
en
ts26
334
8%In
stru
me
nts
436
0%In
stru
me
nts
3646
1%
Pla
tfo
rm18
2168
52%
Pla
tfo
rm35
30%
Pla
tfo
rm38
881%
Tota
l20
8502
60%
Tota
l79
00%
Tota
l75
342%
Co
mm
s d
ura
tio
n/d
ay
No
min
al S
cie
nce
Clo
sest
ap
pro
ach
C
lose
st a
pp
roac
h
Tota
l
Clo
sest
ap
pro
ach
Ura
nu
s
Mo
on

Ice Giants CDF Study Report: CDF-187(C)
January 2019 page 267 of 431
ESA UNCLASSIFIED – Releasable to the Public
Figure 20-8: The consumed energy per mode and per orbit in kW and percentage over the total orbit for the 100 day orbit
Day
s10
0
Inst
rum
en
ts88
891
19%
Pla
tfo
rm36
8086
81%
Tota
l45
6977
100%
Inst
rum
en
ts12
772
3%
Pla
tfo
rm15
554
3%
Tota
l28
326
6%
Inst
rum
en
ts36
252
8%
Pla
tfo
rm10
0751
22%
Tota
l13
7003
30%
Inst
rum
en
ts35
784
8%In
stru
me
nts
436
0%In
stru
me
nts
3646
1%
Pla
tfo
rm24
7539
54%
Pla
tfo
rm35
30%
Pla
tfo
rm38
881%
Tota
l28
3323
62%
Tota
l79
00%
Tota
l75
342%
Co
mm
s d
ura
tio
n/d
ay
No
min
al S
cie
nce
Clo
sest
ap
pro
ach
C
lose
st a
pp
roac
h
Tota
l
Clo
sest
ap
pro
ach
Ura
nu
s
Mo
on

Ice Giants CDF Study Report: CDF-187(C)
January 2019 page 268 of 431
ESA UNCLASSIFIED – Releasable to the Public
Figure 20-9: The generated data per mode in Gb and percentage over the total orbit for the 50 day orbit
Day
s50
Inst
rum
en
ts22
69%
Pla
tfo
rm10
31%
Tota
l32
100%
Inst
rum
en
ts13
.19
41%
Pla
tfo
rm0.
732%
Tota
l13
.93
43%
Inst
rum
en
ts1
2%
Pla
tfo
rm1
4%
Tota
l2
6%
Inst
rum
en
ts4
13%
Inst
rum
en
ts4
12%
Inst
rum
en
ts0
0%
Pla
tfo
rm8
24%
Pla
tfo
rm0
0%P
latf
orm
01%
Tota
l12
38%
Tota
l4
12%
Tota
l0
1%
No
min
al S
cie
nce
Tota
l
Clo
sest
ap
pro
ach
Clo
sest
ap
pro
ach
C
lose
st a
pp
roac
h
Co
mm
s d
ura
tio
n/d
ay
Ura
nu
s
Mo
on

Ice Giants CDF Study Report: CDF-187(C)
January 2019 page 269 of 431
ESA UNCLASSIFIED – Releasable to the Public
Figure 20-10: The generated data per mode in Gb and percentage over the total orbit for the 75 day orbit
Day
s75
Inst
rum
en
ts25
62%
Pla
tfo
rm15
38%
Tota
l40
100%
Inst
rum
en
ts13
.19
33%
Pla
tfo
rm0.
732%
Tota
l13
.93
35%
Inst
rum
en
ts1
3%
Pla
tfo
rm2
4%
Tota
l3
7%
Inst
rum
en
ts7
17%
Inst
rum
en
ts4
10%
Inst
rum
en
ts0
0%
Pla
tfo
rm12
31%
Pla
tfo
rm0
0%P
latf
orm
00%
Tota
l19
47%
Tota
l4
10%
Tota
l0
0%
No
min
al S
cie
nce
Tota
l
Clo
sest
ap
pro
ach
Clo
sest
ap
pro
ach
C
lose
st a
pp
roac
h
Co
mm
s d
ura
tio
n/d
ay
Ura
nu
s
Mo
on
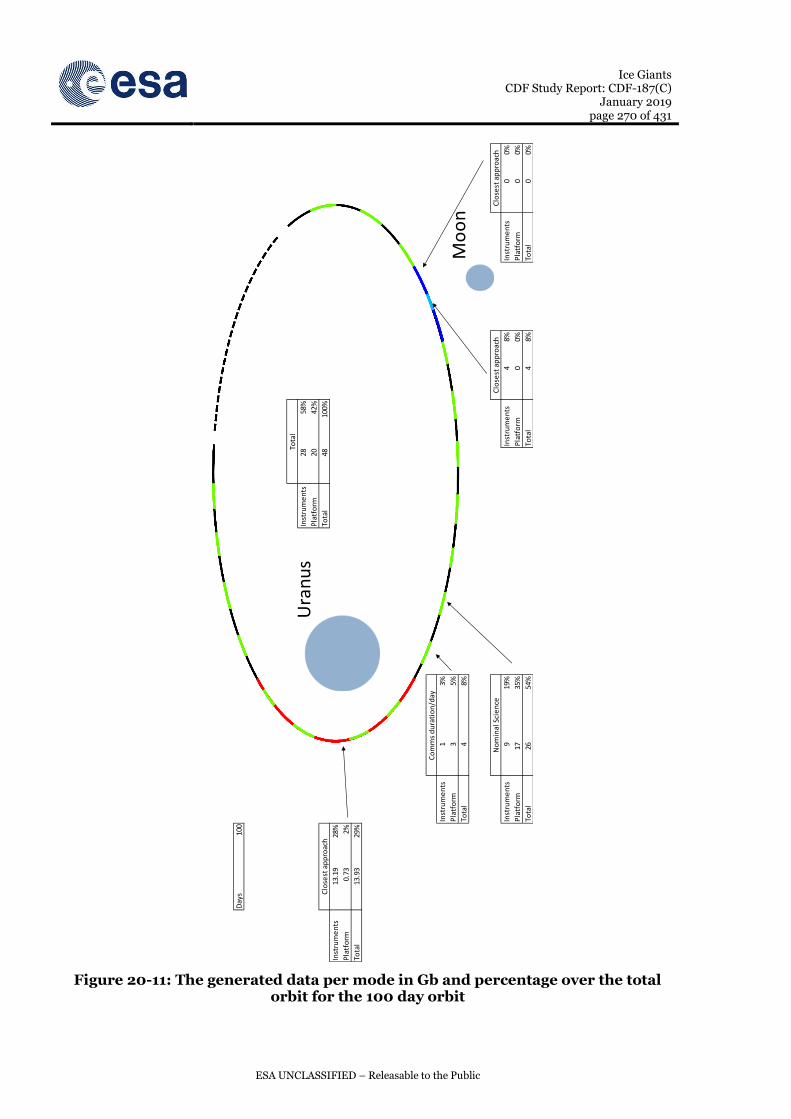
Ice Giants CDF Study Report: CDF-187(C)
January 2019 page 270 of 431
ESA UNCLASSIFIED – Releasable to the Public
Figure 20-11: The generated data per mode in Gb and percentage over the total orbit for the 100 day orbit
Day
s10
0
Inst
rum
en
ts28
58%
Pla
tfo
rm20
42%
Tota
l48
100%
Inst
rum
en
ts13
.19
28%
Pla
tfo
rm0.
732%
Tota
l13
.93
29%
Inst
rum
en
ts1
3%
Pla
tfo
rm3
5%
Tota
l4
8%
Inst
rum
en
ts9
19%
Inst
rum
en
ts4
8%In
stru
me
nts
00%
Pla
tfo
rm17
35%
Pla
tfo
rm0
0%P
latf
orm
00%
Tota
l26
54%
Tota
l4
8%To
tal
00%
No
min
al S
cie
nce
Tota
l
Clo
sest
ap
pro
ach
Clo
sest
ap
pro
ach
C
lose
st a
pp
roac
h
Co
mm
s d
ura
tio
n/d
ay
Ura
nu
s
Mo
on

Ice Giants CDF Study Report: CDF-187(C)
January 2019 page 271 of 431
ESA UNCLASSIFIED – Releasable to the Public
20.2.7.2 Number of RTGs
An analysis has been performed to see if it is feasible to downlink all of the generated data using only 2 RTGs.
However, looking at the total power in the spacecraft lowest power mode, 125 W is required for the platform and 18 W for the payload. Adding the 20% system margin, this gives a total power consumption of 172 W (excluding the 90% charging efficiency, which would lead to 191 W at input). Since the 2 RTGs only generate 180W combined, a 2 RTG system would not be feasible even for low power mode of the spacecraft.
20.2.8 Future Work
As for the Neptune case, with the addition of:
Further optimisation of orbiter design for Uranus: As discussed in Section 20.2.2, the study objectives foresaw maximum reuse of the design between the Neptune and Uranus design cases. As such, some subsystems (in particular the communications subsystem) may be oversized for the design case. Future work should address a detailed and optimised design for the Uranus case.

Ice Giants CDF Study Report: CDF-187(C)
January 2019 page 272 of 431
ESA UNCLASSIFIED – Releasable to the Public
This Page Intentionally Blank

Ice Giants CDF Study Report: CDF-187(C)
January 2019 page 273 of 431
ESA UNCLASSIFIED – Releasable to the Public
21 URANUS PAYLOAD
21.1 Atmospheric Probe
For the Uranus mission the same Model Payload was assumed as for the Neptune mission (see Section 6.1.3 and RD[7]).
These instruments are a representation of a possible future payload but are not meant to be understood as a pre-selection of instruments for a potential future mission.
21.1.1 Requirements and Design Drivers
The main design drivers for the Uranus Atmospheric Probe were the same as for the Neptune Atmospheric Probe. The transfer to Uranus is ca. 2 years shorter than to Neptune but the same requirements for instruments temperature and power were assumed for this CDF study.
21.1.2 Assumptions and Trade-Offs
For the Atmospheric Probe Model Payload no trade-offs were performed, as the same instruments were used as identified in the PEP (V) CDF study (RD[7]).
The assumptions that were taken are listed in Table 21-1:
Assumptions
1 No radiation shielding is assumed.
Heating for the instruments shall be provided by RHUs [[add system ref.]].
Table 21-1: Assumptions for the Uranus Atmospheric Probe Model Payload.
For this CDF study no radiation shielding was assumed, but with a calculated TID (Total Ionising Dose) for the Uranus case of ~155 krad with 4 mm Al shielding [[add ref to radiation section]] a suitable radiation shielding approach should be adopted in potential future studies.
21.1.3 List of Equipment
Not applicable.
21.1.4 Options
No Options were studied.
21.1.5 Technology Needs
No new technologies were identified for the Model Payload (see Section 6.1.3, Table 6-3).
21.2 Orbiter
21.2.1 Requirements and Design Drivers
For the Uranus mission the same Model Payload was assumed as for the Neptune mission (see Section 6.2.3.1).

Ice Giants CDF Study Report: CDF-187(C)
January 2019 page 274 of 431
ESA UNCLASSIFIED – Releasable to the Public
These instruments are a representation of a possible future payload but are not meant to be understood as a pre-selection of instruments for a potential future mission.
The same assumptions were taken for the Orbiter element as for the Neptune case and an adequate shielding strategy shall be devised in a potential future study.
21.2.2 List of Equipment
Not applicable.
21.2.3 Options
No Options were studied.
21.2.4 Technology Needs
No new technologies were identified for the Model Payload.

Ice Giants CDF Study Report: CDF-187(C)
January 2019 page 275 of 431
ESA UNCLASSIFIED – Releasable to the Public
22 URANUS CONFIGURATION
22.1 Atmospheric Probe
The probe configuration for Uranus remains unchanged; nothing has been added nor changed.
22.2 Orbiter
*/In principle, the orbiter configuration for Uranus remains unchanged from the Neptune design. The propulsion subsystem changed only in terms of number of thruster used, from two main engines to one, and it also uses three helium tanks of the same type, from the family PFVG-120 (see Chapter 25.1.3).
Since the radiation environment is higher than the equipment can tolerate, a shielding structure needs to be employed in order to protect them.
Ice Giants CDF Study Report: CDF-187(C)
January 2019 page 276 of 431
ESA UNCLASSIFIED – Releasable to the Public
23 URANUS STRUCTURE
23.1 Atmospheric Probe
The structure of the Uranus Probe is assumed to be identical to the probe design for Neptune.
23.2 Orbiter
The structure of the Uranus Orbiter is assumed to be identical to the Orbiter design for Neptune.

Ice Giants CDF Study Report: CDF-187(C)
January 2019 page 277 of 431
ESA UNCLASSIFIED – Releasable to the Public
24 URANUS MECHANISMS
24.1 Atmospheric Probe
24.1.1 Requirements and Design Drivers
Mechanism requirements and design drivers are equal to the ones for the Neptune mission.
24.1.2 Baseline Design
The design of the probe mechanisms is the same as for the Neptune mission.
24.2 Orbiter
24.2.1 Requirements and Design Drivers
Mechanism requirements and design drivers are equal to the ones for the Neptune mission.
24.2.2 Baseline Design
The design of the orbiter mechanisms is the same as for the Neptune mission.

Ice Giants CDF Study Report: CDF-187(C)
January 2019 page 278 of 431
ESA UNCLASSIFIED – Releasable to the Public
25 URANUS PROPULSION
25.1 Orbiter
25.1.1 Requirements and Design Drivers
The requirements for the propulsion system are derived from the main requirements for the delta v and the mission and the ground operations.
SubSystem Requirements
Req. ID Statement Parent ID
PROP-010 Propulsion system provides necessary thrust and delta v for the mission manoeuvres
PROP -020 Propulsion system provides torques to compensate the main thruster misalignments and for all other AOCS manoeuvres
PROP -030 Propulsion system has at least three barriers for safety reasons on ground
PROP -040 Propulsion system includes the measurement of the pressures within the subsystem at mandatory locations
PROP -050 Propulsion system provides means to isolate potential mechanical pressure regulator leakage through the mission
PROP -060 Propulsion system provides means to isolate the main engine in case of major leakage
PROP -070 Propulsion system incorporates per branch a serial redundant pressure regulator
PROP -080 Propulsion system includes Fill and drain valves for filling and testing of the propulsion system on ground
25.1.2 Assumptions and Trade-Offs
The following table includes the assumptions used during the mission scenario.
Assumptions
1 Gravity losses are linearly interpolated from the data provided by Mission Analysis. Additionally, a margin of 5% was taken for the delta v demands of the gravity losses.
2 The AOCS mass was modelled by using 5% of the total propellant mass used during the mission for the delta v manoeuvres. This propellant mass is split into 3% after the main Uranus Orbit insertion manoeuvre and 2 % after the mission.
3 For the bipropellant system, a mixture ratio of 1.65 was assumed. The dual mode systems used a mixture ratio of 1.43
4 No redundancy need for the main engine was assumed. It was furthermore assumed that the main engine can be accommodated in such a way to minimise the propellant need for any misalignment or centre of mass shift.
5 The thrust and the specific impulse of the engine was modelled by using the parametric model provided by the supplier.

Ice Giants CDF Study Report: CDF-187(C)
January 2019 page 279 of 431
ESA UNCLASSIFIED – Releasable to the Public
Assumptions
6
The pressure set point in the tanks and the orifice of the main engine corresponds to the nominal thrust point of 1kN for the engine, for the case of the mechanical pressure regulator. For the electronic pressure regulator case, adjustment to a thrust of 1.1kN is assumed to be possible.
7 The propellant mass includes a 2% residual mass of the propellant at the end of the mission.
8 The volumes of the tanks are calculated to fulfil the volume margin requirement of around 10%.
9 Uranus orbit insertion burn was done in one single manoeuvre. Tank depletion and corresponding temperature drop is assumed to be isentropic. Temperature threshold for the design and the helium tank size was around -18°C.
10 The tank sizes are derived from the E3000 tank family. Tank heights and masses are using linear interpolation.
For all calculations, the following manoeuvre approach was used to estimate the propellant budget:
Manoeuvre velocity increment [m/s] propellant mass
[kg]
Orbiter Deflection Manoeuvre 11.2
UOI
Delta v with gravity losses in comparison to thrust of
propulsion system
AOCS Mass
Propellant percentage of 3%
for all delta v manoeuvres
Target Manoeuvre 211.1 Tour 85.0 Tour 30.0 Tour Margin 31.5 Disposal 10
AOCS mass
Propellant percentage of 2%
for all delta v manoeuvres
Table 25-1: Delta v and propellant mass assumption for the Uranus Orbiter case
25.1.3 Baseline Design
The baseline design of the Uranus Orbiter case is in principle the same as the one for the Neptune Orbiter. The differences are in the underlying requirements in terms of delta v and gravity loss dependence on thrust, which in this case led to a system using one engine only.

Ice Giants CDF Study Report: CDF-187(C)
January 2019 page 280 of 431
ESA UNCLASSIFIED – Releasable to the Public
One particular point to mention is the radiation impact on the equipment. Since the level of radiation was indicated to be around 155 krad, some of the equipment currently in development (like the LEROS-4 engine) needs detailed assessment. For some of the equipment, special radiation shields can be ordered as well (one example being the SAPT). This extra equipment was currently not baselined and further analysis would need to be done to investigate this in more detail.
25.1.4 List of Equipment
The following list includes the equipment and masses for the baseline concept:
Description Type Amount
Mass per unit
Margin
Mass incl. margin
Pipes Pipes 1 8 0.2 9.6
AOCS Engines S10-18 16 0.65 0.05 10.92
Main Engine LEROS-4B 1 7.8 0.05 8.19
Fuel Tank E3000 2 28.29 0.05 59.42
Oxid Tank E3000 2 28.29 0.05 59.42 Fill / Drain
Valves
9 0.07 0.05 0.6615 LP Pressure Transducer SAPT 4 0.216 0.05 0.9072 HP Pressure Transducer SAPT 1 0.216 0.05 0.2268
Latch Valve
4 0.75 0.05 3.15
Propellant Filter RA04822A 4 0.077 0.05 0.3234
Check valve VN005-001 4 0.585 0.05 2.457
Helium Tank PVG-120 3 23.5 0.05 74.025
Helium Tank PVG-65 0 12 0.05 0 Pressure regulator VACCO 2 1 0.05 2.1
Pyrovalve Cobham 4 0.315 0.05 1.323
SMA valve Arianegroup 2 0.16 0.2 0.384 High pressure
latch valve Vacco V1E10560-01 1 0.8 0.05 0.84
Total
233.94
Table 25-2: Propulsion system mass budget
Table 25-2 includes one main engine and the adapted tank size for the updated propellant budget. Table 25-3 lists the propellant masses for each manoeuvre:

Ice Giants CDF Study Report: CDF-187(C)
January 2019 page 281 of 431
ESA UNCLASSIFIED – Releasable to the Public
Manoeuvre mass begin [kg] mass end [kg] velocity
increment [m/s]
propellant mass
[kg] Orbiter Deflection Manoeuvre 4400.3 4379.4 15.0 20.90
UOI 4379.4 2341.7 1971.9 2037.67
AOCS Mass 2341.7 2272.5 84.4 69.22
NOI clean-up 2272.5 2272.5 0.0 0.00
Tour Targeting 2272.5 2125.3 211.1 147.28
Tour 2125.3 2065.9 89.3 59.37
Tour 2065.9 2046.3 30.0 19.58
Tour Margin 2046.3 2031.1 21.0 15.21
Disposal 2031.1 2023.9 10 7.20
AOCS mass 2023.9 1977.7 64.91 46.14 Final/Total (Including Residuals) 1914.58
2497.5 2469.06
Table 25-3: Manoeuvre propellant budget
25.1.5 Options
The options investigated included the baseline with an electronic pressure regulator as well. The results are listed in Table 25-4, showing the nearly negligible impact of the thrust on the gravity losses. The dry mass increase of around 15kg is therefore leading to a total amount of extra propellant needed in the order of 38kg.
Manoeuvre mass begin [kg] mass end [kg] velocity increment [m/s]
propellant mass [kg]
Orbiter Deflection Manoeuvre 4451.8 4436.0 11.2 15.86
UOI 4436.0 2366.5 1971.8 2069.45
AOCS Mass 2366.5 2296.3 84.7 70.25
NOI clean-up 2296.3 2296.3 0.0 0.00 Triton Target Manoeuvre 2296.3 2147.5 211.1 148.82
Tour 2147.5 2090.1 85.0 57.39
Tour 2090.1 2070.2 30.0 19.89
Tour Margin 2070.2 2047.2 31.5 23.04
Disposal 2047.2 2039.9 10 7.26
AOCS mass 2039.9 1993.1 65.37051861 46.83 Final/Total (Including Residuals) 1929.16 2500.6 2507.97
Table 25-4: Propulsion system with electronic pressure regulator
Additionally, the Uranus case was also investigated without the shielding mass of 237.02kg. This leads to a decrease of the dry mass to 1578.87kg. The propulsion system was changed to the usage of 400l tanks for MMH and MON. The Helium tank sizes also

Ice Giants CDF Study Report: CDF-187(C)
January 2019 page 282 of 431
ESA UNCLASSIFIED – Releasable to the Public
changed back to the original Neptune case of having 2 times 120l tanks and 1 time 65l tank. Using the dry mass as mentioned above leads to the following results in terms of velocity increment and propellant mass consumption:
Manoeuvre mass begin [kg] mass end [kg] velocity increment
[m/s]
propellant mass
[kg] Orbiter Deflection Manoeuvre 3618.9 3606.0 11.2 12.84
UOI 3606.0 1937.6 1956.5 1668.40
AOCS Mass 1937.6 1881.1 83.3 56.73
NOI clean-up 1881.1 1881.1 0.0 0.00 Triton Target Manoeuvre 1881.1 1759.2 211.1 121.91
Tour 1759.2 1712.4 85.0 46.84
Tour 1712.4 1696.1 30.0 16.23
Tour Margin 1696.1 1677.2 31.5 18.88
Disposal 1677.2 1671.3 10 5.95
AOCS mass 1671.3 1633.5 64.42 37.82 Final/Total (Including Residuals) 1578.87 2483.0 2025.32
Table 25-5: Manoeuvre propellant budget without shielding mass
25.1.6 Technology Requirements
The technology requirements for the Uranus case kept the same as the ones already mentioned for the Uranus case, no additional needs are identified.
Ice Giants CDF Study Report: CDF-187(C)
January 2019 page 283 of 431
ESA UNCLASSIFIED – Releasable to the Public
26 URANUS AOCS
26.1 Orbiter
26.1.1 Requirements and Design Drivers
See Neptune orbiter attitude control system chapter. Requirements are assumed unchanged for Uranus, with the exception that Triton is potentially substituted for a Uranus moon or moons.
26.1.2 Assumptions and Trade-Offs
See Neptune orbiter attitude control system chapter.
Uranus has a shorter cruise duration, roughly 2 years less than Neptune.
26.1.2.1 Orbit and fly-by trajectories
Several orbits and fly-by trajectories were considered for the Uranus orbiter mission:
5. Cruise: Heliocentric orbit with periapsis at Jupiter and apoapsis at Uranus 6. Post-probe-injection (if necessary): Low-periapsis Uranus orbit (2000 km
altitude periapsis, 225 x Ruranus apoapsis) 7. Science: High-periapsis Uranus orbit (20000 km altitude periapsis, 225 x Ruranus
apoapsis) 8. Science: Uranus moon fly-by (during high-periapsis Uranus orbit) at 100 km
altitude and relative speed of 3.9 km/s.
26.1.3 Baseline Design
See Neptune orbiter attitude control system chapter for main architectural design, etc.
26.1.3.1 Sensor selection
There are two sensors that may require parts upgrade and/or local/global shielding to handle the higher dosage of the Uranus mission, due to the closer approach to Jupiter during gravity assist. These are described as follows:
26.1.3.1.1 Coarse Rate Sensor
TAS SiRUES radiation susceptibility information not available, but assumed to be < 100 krad. If parts upgrade or shielding are not feasible options or deemed to costly or massive, a third Astrix 1090 gyro (IMU without accelerometer) could be embarked in its place. This backup gyro would only be used in safe mode. The disadvantage would be that the safe mode sensor hardware type would then be identical to that used in nominal operations and may be more costly.
26.1.3.1.2 IMU
Airbus Astrix 1090A radiation tolerance is 100 krad. Some additional shielding may be required.
26.1.3.2 Actuator selection
26.1.3.2.1 Environmental torque disturbances

Ice Giants CDF Study Report: CDF-187(C)
January 2019 page 284 of 431
ESA UNCLASSIFIED – Releasable to the Public
The GAST model referred to in the Neptune orbiter attitude control system chapter was updated to the relevant modelling parameters of Uranus.
Disturbances were similar to those around Neptune. The magnetic disturbances were slightly higher due to the closer distance to the dipole centre at periapsis passes and the stronger dipole of Uranus.
Example of disturbances torques during periapsis passes is provided in the plots below:
Figure 26-1: Low-periapsis orbit, periapsis pass, inertial pointing. Disturbance torque contributors
Figure 26-2: Low-periapsis orbit, periapsis pass, inertial pointing. Wheel momenta

Ice Giants CDF Study Report: CDF-187(C)
January 2019 page 285 of 431
ESA UNCLASSIFIED – Releasable to the Public
Figure 26-3: Science orbit, periapsis pass, Uranus pointing. Disturbance torque contributors
Figure 26-4: Science orbit, periapsis pass, Uranus pointing. Wheel momenta
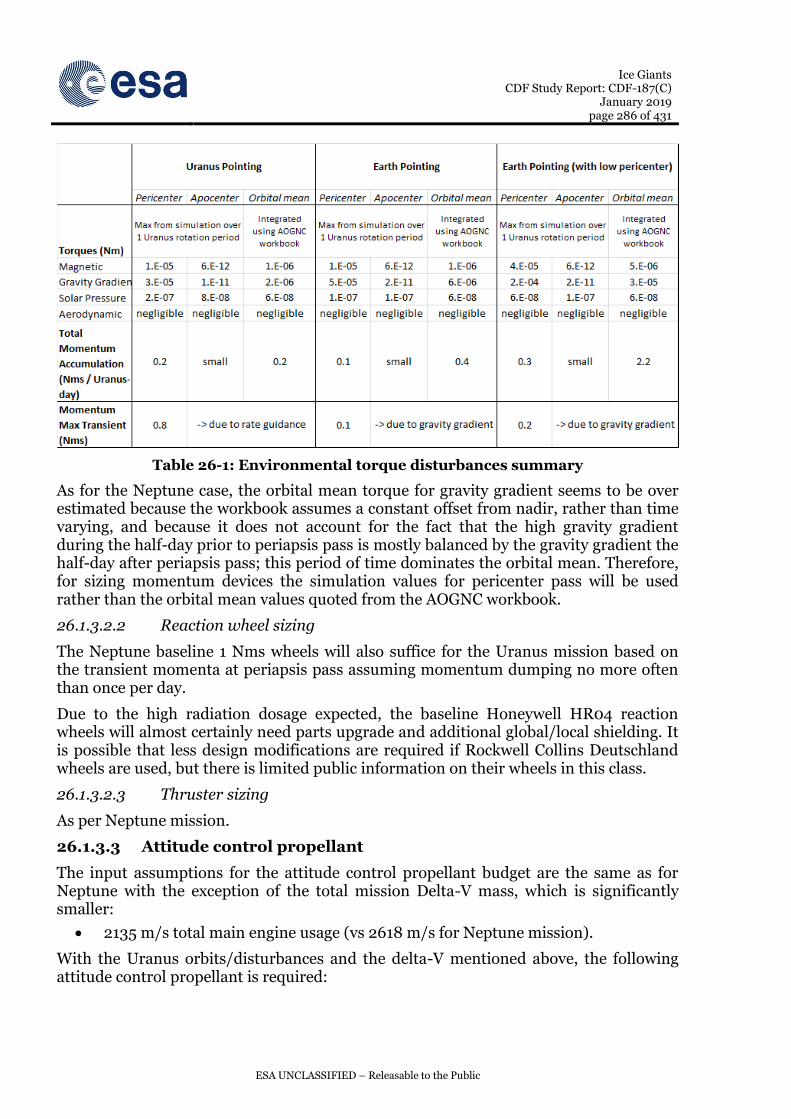
Ice Giants CDF Study Report: CDF-187(C)
January 2019 page 286 of 431
ESA UNCLASSIFIED – Releasable to the Public
Table 26-1: Environmental torque disturbances summary
As for the Neptune case, the orbital mean torque for gravity gradient seems to be over estimated because the workbook assumes a constant offset from nadir, rather than time varying, and because it does not account for the fact that the high gravity gradient during the half-day prior to periapsis pass is mostly balanced by the gravity gradient the half-day after periapsis pass; this period of time dominates the orbital mean. Therefore, for sizing momentum devices the simulation values for pericenter pass will be used rather than the orbital mean values quoted from the AOGNC workbook.
26.1.3.2.2 Reaction wheel sizing
The Neptune baseline 1 Nms wheels will also suffice for the Uranus mission based on the transient momenta at periapsis pass assuming momentum dumping no more often than once per day.
Due to the high radiation dosage expected, the baseline Honeywell HR04 reaction wheels will almost certainly need parts upgrade and additional global/local shielding. It is possible that less design modifications are required if Rockwell Collins Deutschland wheels are used, but there is limited public information on their wheels in this class.
26.1.3.2.3 Thruster sizing
As per Neptune mission.
26.1.3.3 Attitude control propellant
The input assumptions for the attitude control propellant budget are the same as for Neptune with the exception of the total mission Delta-V mass, which is significantly smaller:
2135 m/s total main engine usage (vs 2618 m/s for Neptune mission).
With the Uranus orbits/disturbances and the delta-V mentioned above, the following attitude control propellant is required:

Ice Giants CDF Study Report: CDF-187(C)
January 2019 page 287 of 431
ESA UNCLASSIFIED – Releasable to the Public
Table 26-2: Attitude control propellant budget
Note that the propulsion subsystem has allocated much more than this (roughly double) for attitude control propellant to remain conservative and to help offset the optimistic assumption of steady state specific impulse used to compute the above budget.
26.1.4 List of Equipment
Unchanged from Neptune design.
26.1.5 Options
See Neptune design.
Additional option for Uranus mission:
Replacement of coarse rate sensor with an extra Airbus Astrix 1090 for safe mode only.

Ice Giants CDF Study Report: CDF-187(C)
January 2019 page 288 of 431
ESA UNCLASSIFIED – Releasable to the Public
26.1.6 Technology Needs
|~T Technology Needs
* Equipment
Name & Text Reference
Technology Supplier (Country)
TRL Funded
by Additional
Information
X RW_HR04 Reaction wheels (1
Nms) Honeywell
(US) or 7
Will require parts upgrade to improve
lifetime (5 years) and radiation hardness (20 krad is listed)
RW Reaction wheels (1
Nms)
Rockwell Collins
Deutschland (Germany)
7
Limited information on mass/power,
lifetime, radiation, etc. for their 1 Nms wheels. Not clear if product line active
and whether wheels can meet lifetime or
radiation requirements of Ice
Giants. Possible tech development to meet
Ice Giant needs.
X GYRO_Sireus Safe mode Coarse
rate sensor TAS (UK) 7
Possible parts upgrade required
and/or local shielding increase to
meet radiation requirements.

Ice Giants CDF Study Report: CDF-187(C)
January 2019 page 289 of 431
ESA UNCLASSIFIED – Releasable to the Public
27 URANUS GNC
27.1 Atmospheric Probe
The Probe is identical for the Neptune and Uranus missions. Please refer to the Neptune GNC Chapter.

Ice Giants CDF Study Report: CDF-187(C)
January 2019 page 290 of 431
ESA UNCLASSIFIED – Releasable to the Public
28 URANUS POWER
28.1 Atmospheric Probe
All aspects are unchanged from the Neptune case.
28.2 Orbiter
All aspects are unchanged from the Neptune case with the following points to be noted:
Shorter transfer time
The approx. 2 years shorter transfer time to Uranus vs. Neptune will result in a slightly greater power output from the RTGs at the time of arrival at the target planet. According to the predicted power degradation characteristics of the eMMRTG, this additional power will be approximately 6 W per RTG, 18 W in total.
However, because
the science mission would likely be extended in this case, making the total mission duration the same in both cases (15 years) and
6 W is less than the current uncertainty on the EODL power of the eMMRTG,
it is decided to leave the power budget and sizing results unchanged w.r.t. the Neptune case.
Greater radiation dose (TID)
Increase TID for the Uranus mission may lead to the requirement for extra shielding and/or specific qualification for the PCDU and the cell balancing electronics of the batteries.

Ice Giants CDF Study Report: CDF-187(C)
January 2019 page 291 of 431
ESA UNCLASSIFIED – Releasable to the Public
29 URANUS TELECOMMUNICATIONS
29.1 Atmospheric Probe
For the probe, requirements and design drivers, assumptions, trade-offs, and baseline design are the same as for the Neptune Probe.
The main difference is the maximum slant range for sizing the Probe-to-Orbiter link. In this respect, the bitrate as function of the distance has been computed as shown in Figure 29-1. According to mission analysis, the worst case distance is about 25,000 km, hence a bit rate of 4.65 kbps is achievable.
Figure 29-1: achievable bitrate as function of the distance
29.2 Orbiter
For the Orbiter, the requirements and design drivers, assumptions, trade-offs, and baseline design are the same as for the Neptune Orbiter. In particular, it has been considered that a common procurement of the two orbiters’ communication subsystem could be done, and thus the Neptune design can be adapted to Uranus by using the same RF output power, and thus increasing the link budget margin.

Ice Giants CDF Study Report: CDF-187(C)
January 2019 page 292 of 431
ESA UNCLASSIFIED – Releasable to the Public
30 URANUS DATA HANDLING
30.1 Atmospheric Probe
The Probe for Uranus is identical to the probe for Neptune
30.2 Orbiter
The requirements for the Orbiter are the same as for the Neptune Orbiter with the exception of the potential for radiation shielding.
Data Handling Sub-System Requirements
Req. ID Statement
DHS-0100 The orbiter DHS shall cope with the worst case radiations conditions related to Uranus for which sensitive units shall be provided with 10mm of Al shielding
In all other respects the design of the Orbiter for the Uranus mission is the same as for the Neptune mission.

Ice Giants CDF Study Report: CDF-187(C)
January 2019 page 293 of 431
ESA UNCLASSIFIED – Releasable to the Public
31 URANUS THERMAL
31.1 Atmospheric Probe
A dedicated thermal analysis of the Uranus probe has not been addressed within this study. Based on the outcome of the PEP study in 2010, entry conditions may be fairly similar to the conditions assumed for Neptune. Due to the comparable atmosphere and potentially comparable entry velocities, the Neptune design might eventually be re-used to some extent. However, a dedicated study will be required to confirm that. Certainly the restrictions in terms of material and facility limitations will be same.
31.2 Orbiter
For the Uranus orbiter the same requirements and assumptions as for Neptune are considered applicable. In particular, no changes in the power dissipation and no changes of the outer surface area of the orbiter are assumed. The Uranus orbiter design is therefore considered to be the same than for Neptune.

Ice Giants CDF Study Report: CDF-187(C)
January 2019 page 294 of 431
ESA UNCLASSIFIED – Releasable to the Public
32 URANUS AEROTHERMODYNAMICS
The Aerothermodynamics for the Uranus Probe are considered to be identical to the Neptune Probe for the purposes of this study.

Ice Giants CDF Study Report: CDF-187(C)
January 2019 page 295 of 431
ESA UNCLASSIFIED – Releasable to the Public
33 URANUS EDS PARACHUTE
The Uranus EDS Parachute is designed identical to the Neptune EDS Parachute. Please refer to the Neptune chapter for details.

Ice Giants CDF Study Report: CDF-187(C)
January 2019 page 296 of 431
ESA UNCLASSIFIED – Releasable to the Public
This Page Intentionally Blank

Ice Giants CDF Study Report: CDF-187(C)
January 2019 page 297 of 431
ESA UNCLASSIFIED – Releasable to the Public
34 TRITON LANDER
34.1 Triton Facts & Figures
Triton is orbiting Neptune on an orbit that is circular at a semi-major axis of 355,000 km (somewhat less than our Moon). It has a period of 5.88 days (our Moon: 27.3 days), which is equal to the body rotation period (bound rotation, as is the case for our Moon).
The same face always faces Neptune and day and night each last almost 3 days. The orbit is retrograde with an inclination of ~120 deg with respect to the Ecliptic and ~157 deg with respect to Neptune equator (the orbit of our Moon is prograde).
If the orbit of a Neptune orbiter is optimised for Triton observations, it will also have to be retrograde.
Triton is the seventh largest planetary satellite in the solar system, after the four Galilean moons around Jupiter, Saturn’s Titan and our Moon.
Its diameter is 2706.8 km, its radius 1353.4 km (our Moon: 1738 km)
Its density is ~2 g/cm3, indicating that a significant portion of the body is water ice
Its mass is 29% of that of our moon, so the specific gravitational parameter is ~1429 km2/s2
Velocity on a low, circular orbit is around ~1 km/s (our Moon ~1.65 km/s), so landing is non-trivial
This puts a hard lower limit on the delta-v required for soft landing
Escape velocity on surface: 1.455 km/s.
34.2 Requirements and Design Drivers
The following main design drivers have to be considered for a Lander mission at Triton:
Release strategy: from orbit around Triton or during flyby only. This has a strong impact on the delta V
Low atmospheric density, implying that a propulsion-only descent and landing is assumed
Need for throttled / pulsed propulsion capabilities in a closed-loop GNC system for the final descent manoeuvre (technology gap)
Possible need of reconnaissance imaginary created by another mission to enable high level selection of safety areas1
Instruments/science (during descent and surface operations): Mass / power / data / temperature/ Operations timeline
Available communications window(s) duration.
1 Europa Lander is assuming that they will get images from Clipper beforehand so after the main braking burn it is possible to know where they are with respect to the planet surface.

Ice Giants CDF Study Report: CDF-187(C)
January 2019 page 298 of 431
ESA UNCLASSIFIED – Releasable to the Public
Main Requirements
Req. ID Statement Parent ID
MI-010 The Triton Lander shall land a payload of 11.18 kg
MI-020 The Triton Lander shall be released from Triton fly-by
MI-030 The Triton Lander shall perform a soft landing manoeuvre of 4637 m/s
MI-040 The Triton Lander shall operate during one week of lifetime
34.3 Assumptions
During the Triton Lander Assessment, the following assumptions were made:
Assumptions
1 Release from Triton Flyby is considered as baseline strategy, as this imposes less constraints on the orbiter side
2 There is no atmospheric contribution to braking (or heating)
3 It is assumed that the engine and the corresponding propulsion system including the GNC control, throttled or pulsed, required for the final part of the landing is available (technology development)
4 Instrument mass is the bigger of the 2 envelopes defined by the Study Science Team (11.18 kg)
5 Science measurements are taken during 1 week of operational lifetime on the surface of Triton
6
It is assumed that the communication window is such that the communication design for the probe case is valid. A reverse analysis is performed in order to identify the constraints that this implies (in terms of link geometry)
The dry mass of the system used for the calculation of the propellant mass is 473 kg.
34.4 Trade-Offs
Two Mission analysis scenarios have been considered, addressing two lander release options:
Release during Triton flyby
Release from orbit around Triton (50x50km)

Ice Giants CDF Study Report: CDF-187(C)
January 2019 page 299 of 431
ESA UNCLASSIFIED – Releasable to the Public
34.4.1 Release during Triton Flyby
Figure 34-1: Lander release during Triton flyby
Lander has very significant delta-v capability
Landing sequence with several burns using the lander propulsion system:
o Manoeuvre 1: Capture into eccentric Triton orbit. 50x5000 km obit proposed. Orbit is low enough to ensure insertion despite manoeuvre execution errors
o Manoeuvre 2: Circularisation to 50x50 km orbit to ensure precise targeting to envisaged landing site
o Manoeuvre 3: Deorbit manoeuvre, lowers periapsis in preparation for landing
o Manoeuvre 4: Soft landing on surface allowing closed-loop guidance, hazard avoidance etc.
The chosen strategy will:
o Allow staging, if required
o Permit landing at any location on the surface, independently of the hyperbolic arrival conditions
o Eliminate manoeuvre execution errors and maximise probability of success
o Simplify GNC by ensuring that most of the delta-v is NOT part of the critical landing burn
The chosen strategy will not:
o Reduce the large amount delta-v required.
Manoeuvre 1 is the only manoeuvre in the sequence that depends on the design of the Neptune orbiter tour:
For v-inf of 3.6 km/s: Man. 1 size: 2582 m/s
For v-inf of 4.6 km/s: Man. 1 size: 3526 m/s
For v-inf of 2.6 km/s: Man. 1 size: 1675 m/s

Ice Giants CDF Study Report: CDF-187(C)
January 2019 page 300 of 431
ESA UNCLASSIFIED – Releasable to the Public
Depending on the thrust/mass ratio, gravity losses of 10-20% are to be expected.
Table 34-1: Triton baseline flyby tour, shadowed rows show night time flybys
Manoeuvre 2:
Circularization to 50x50 km orbit
Nominal delta-v: 282 m/s
Gravity losses are low, as manoeuvre can be split into parts
Manoeuvre 3:
Deorbit to ~10x50 km orbit
Nominal delta-v: 7 m/s
Manoeuvre 4:
Soft landing
Delta-v around 1150-1250 m/s depending on thrust/mass ratio, GNC & hazard avoidance strategy.
Total budget (Example for v-inf 3.6 km/s)
Low: 2582*1.1 + 282 + 7 + 1150 m/s = 4279 m/s
High: 2582*1.2 + 282 + 7 + 1250 m/s = 4637 m/s
The delta-v requirements on EDL is a Key driver for the mission.

Ice Giants CDF Study Report: CDF-187(C)
January 2019 page 301 of 431
ESA UNCLASSIFIED – Releasable to the Public
34.4.2 Release from orbit around Triton (50x50km)
Figure 34-2: Lander release from Triton orbit
Assuming that an orbiter has placed the lander in low Triton orbit, and not considering the impact on the orbiter manoeuvre into Triton orbit, the delta-v for landing is reduced to manoeuvres 3+4:
Manoeuvre 3:
Deorbit to ~10x50 km orbit
Nominal delta-v: 7 m/s
Manoeuvre 4:
Soft landing
Delta-v around 1150-1250 m/s depending on thrust/mass ratio, GNC & hazard avoidance strategy.
Manoeuvre 4 is different from all others in the sequence as the main engine must be controlled in closed loop by a GNC system that:
Measures the imparted and computes the remaining delta-v
Computes the required thrust direction as function of time into manoeuvre and controls the attitude accordingly
Regulates the thrust level in the final part close to the surface* * This requires an engine that can be either throttled or pulsed. The requirement for throttled or pulsed operations is specific to landing and does not apply to any of the other phases. Initial ~90% of manoeuvre is executed at full thrust.
Measures vertical and lateral velocity and achieves ~0 velocity in all components at ~0 altitude (size of “~” TBD)
Performs hazard detection and commands avoidance manoeuvres (if applicable)
Can allow limited pre-touch-down hovering (optional).

Ice Giants CDF Study Report: CDF-187(C)
January 2019 page 302 of 431
ESA UNCLASSIFIED – Releasable to the Public
Note: Triton gravity at surface: 0.78 m/s2 = 1/12.6 g. (our Moon: 1.623 m/s2=1/6 g) and the required MINIMUM thrust level per 100 kg of landed mass is 78 N.
34.5 Baseline Design
The Model Payload for the Triton Lander was put together in order to size the lander resources and to address the payload accommodation. These instruments are a representation of a possible future payload but are not meant to be understood as a pre-selection of instruments for a potential future mission.
Two options for a scientific Model Payload for a Triton Lander were established: the baseline Model Payload (see Table 34-2), and a lighter Model Payload (see Table 34-3).
Table 34-2 lists the baseline instruments, together with their mass (incl. 20% maturity margin), average power consumption, data rate, physical size and their heritage from previous instruments and missions.
Instrument Mass
[kg] Power [W]
Data rate
Volume envelope [mm]
Notes/Heritage
Imaging system
3.40 12.1 1.2-24 Mbits/s
70x56x36 (single)
112×19×90 (stereo)
70x50x94 80x50x120
Panoramic, microscopic imaging and analysis of the sample composition; three units comprising the system. Based on CIVA/Philae (ROSETTA)
In situ science package
2.35 2.2 180kb/h TBD Mechanical, electrical and thermal properties of surface, soil and subsoil. Based on SSP/Huygens MUPUS, SESAME/Philae
Gas Analyser / Mass spectrometer
4.50 14.0 2kb/s TBD TOF measurement for Triton’s atmosphere; based on JUICE/NIM (part of PEP on JUICE), COSAC, PTOLEMY/Philae
Magnetometer and plasma monitor
0.93 0.9 0.03-4.4kb/s
TBD Heritage from ROMAP/Philae incl. ions & electrons detectors
Table 34-2: Triton Lander draft Model Payload Definition – 1
The total mass of the baseline Model Payload amounts to 11.18kg, including 20% maturity margin with an average power consumption of ~29.20W (no margin included). This mass presents a maximum value for these instruments, as miniaturization of these instruments has been taking place in recent years. Also, the technological progress since the conception of the e.g. Rosetta instruments would allow for lighter instrument for the
34.5.1 Mission to Triton
More details on some of the instruments are listed here below:
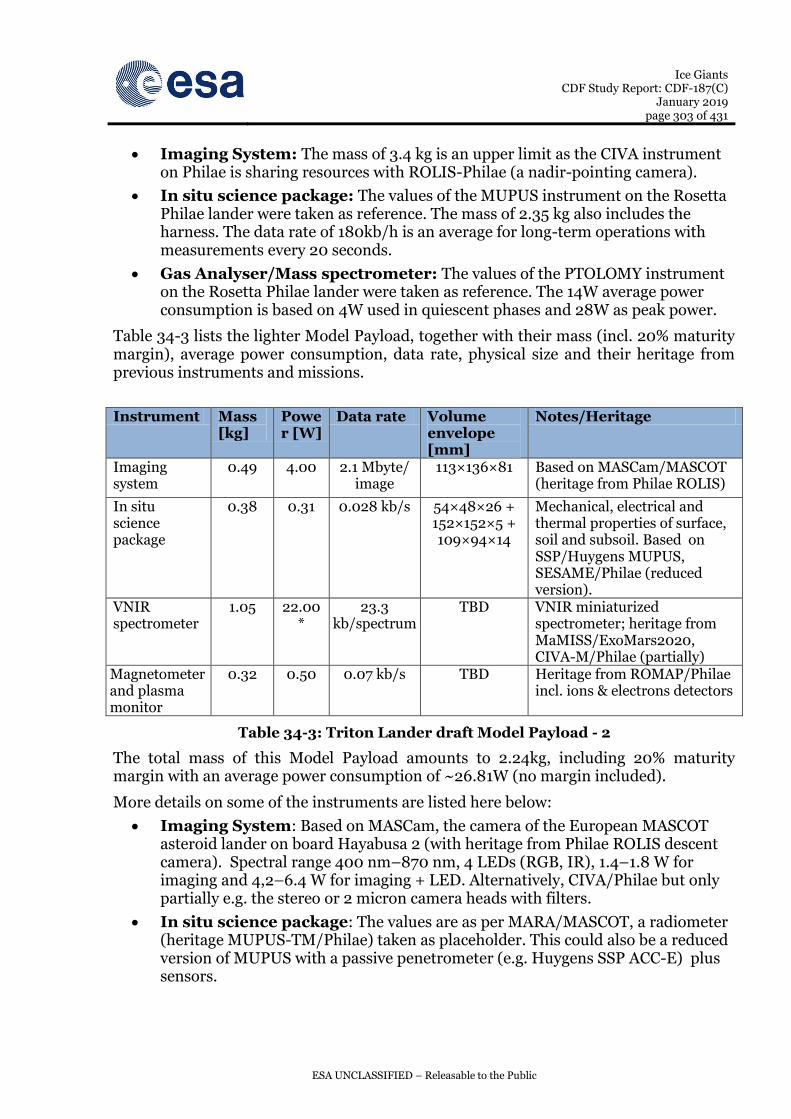
Ice Giants CDF Study Report: CDF-187(C)
January 2019 page 303 of 431
ESA UNCLASSIFIED – Releasable to the Public
Imaging System: The mass of 3.4 kg is an upper limit as the CIVA instrument on Philae is sharing resources with ROLIS-Philae (a nadir-pointing camera).
In situ science package: The values of the MUPUS instrument on the Rosetta Philae lander were taken as reference. The mass of 2.35 kg also includes the harness. The data rate of 180kb/h is an average for long-term operations with measurements every 20 seconds.
Gas Analyser/Mass spectrometer: The values of the PTOLOMY instrument on the Rosetta Philae lander were taken as reference. The 14W average power consumption is based on 4W used in quiescent phases and 28W as peak power.
Table 34-3 lists the lighter Model Payload, together with their mass (incl. 20% maturity margin), average power consumption, data rate, physical size and their heritage from previous instruments and missions.
Instrument Mass
[kg] Power [W]
Data rate Volume envelope [mm]
Notes/Heritage
Imaging system
0.49 4.00 2.1 Mbyte/ image
113×136×81 Based on MASCam/MASCOT (heritage from Philae ROLIS)
In situ science package
0.38 0.31 0.028 kb/s 54×48×26 + 152×152×5 + 109×94×14
Mechanical, electrical and thermal properties of surface, soil and subsoil. Based on SSP/Huygens MUPUS, SESAME/Philae (reduced version).
VNIR spectrometer
1.05 22.00*
23.3 kb/spectrum
TBD VNIR miniaturized spectrometer; heritage from MaMISS/ExoMars2020, CIVA-M/Philae (partially)
Magnetometer and plasma monitor
0.32 0.50 0.07 kb/s TBD Heritage from ROMAP/Philae incl. ions & electrons detectors
Table 34-3: Triton Lander draft Model Payload - 2
The total mass of this Model Payload amounts to 2.24kg, including 20% maturity margin with an average power consumption of ~26.81W (no margin included).
More details on some of the instruments are listed here below:
Imaging System: Based on MASCam, the camera of the European MASCOT asteroid lander on board Hayabusa 2 (with heritage from Philae ROLIS descent camera). Spectral range 400 nm–870 nm, 4 LEDs (RGB, IR), 1.4–1.8 W for imaging and 4,2–6.4 W for imaging + LED. Alternatively, CIVA/Philae but only partially e.g. the stereo or 2 micron camera heads with filters.
In situ science package: The values are as per MARA/MASCOT, a radiometer (heritage MUPUS-TM/Philae) taken as placeholder. This could also be a reduced version of MUPUS with a passive penetrometer (e.g. Huygens SSP ACC-E) plus sensors.

Ice Giants CDF Study Report: CDF-187(C)
January 2019 page 304 of 431
ESA UNCLASSIFIED – Releasable to the Public
VNIR spectrometer: Derived from MaMISS on the ExoMars2020 Rover. MaMISS is located inside the drill for borehole science; spectral range 0.4–2.2 µm; 22W is peak for science mode; average power is TBD.
The Lander design has been initiated with a top-down assessment, exploring potential reference missions in order to derive rough scaling factors in order to get a feeling for the mass range of the system.
Ice Giants // Triton Huygens // Titan
Surface gravity (m/s2) 0.779 1.352
Surface pressure (mbar) 0.014 1500
Approach velocity (km/s) 3.6 6
Total probe mass (kg) 350 318.3
Payload mass (kg) 11.18 47.6
Table 34-4: Rough scaling factor with Huygens Titan lander
Assuming a total lander system wet mass of 350 kg (same ball-park number of the probe design in the frame of the CDF Study), a top down estimate of the payload landed mass was derived, taking a reference case of a known lander mission.
Using the same scaling ratios, the required Lander wet mass to land the instrument package defined by the science team was computed.
The scaling exercise, performed for Lander release from Triton flyby, indicated the following figures:
Table 34-5: Scaling exercise for Lander release from Triton flyby

Ice Giants CDF Study Report: CDF-187(C)
January 2019 page 305 of 431
ESA UNCLASSIFIED – Releasable to the Public
The scaling exercise, performed for Lander release from 50x50 km Triton orbit, indicated the following figures:
Table 34-6: Scaling exercise for Lander release from 50x50 Triton orbit
A very rough scaling function was derived, for both mission analysis scenarios, and it is shown hereafter:
Figure 34-3: Rough scaling function for both mission analysis scenarios
The scaling factor is based on a single point of reference, and does not consider the scaling function rules for the propulsion subsystem hardware with the propellant mass. Also, it is assumed that airbags scale linearly which is far from being real, therefore there is no intention of correctness with providing these figure, but rather to give quick ROM rules of thumb.

Ice Giants CDF Study Report: CDF-187(C)
January 2019 page 306 of 431
ESA UNCLASSIFIED – Releasable to the Public
A bottom up mass budget has been built, based on a preliminary estimate at subsystem level for GNC, Propulsion, Mechanisms (landing gear) and Power. For the structures, a 20% of the System Dry Mass is assumed. For Communications and Data Handling the same design of the Neptune probe is retained.
Subsystem Switch Probe Mass Budget Mass [kg]
GNC Product Guidance Navigation and Control 27.00 no redundancy
COM Product Communications 12.31 from probe CPROP Not used Chemical Propulsion 127.00 wet mass of 350kg assumed DH Product Data-Handling 1.00 from probe EPROP Not used Electric Propulsion 0.00 INS Product Instruments 11.18
MEC Product Mechanisms 20.00
3% of lander mass, assumed landing systems that also needed to ascent
PWR Product Power 55.00 2 weeks mission assumed – RTG Option
STR Product Structures 90.00 40kgl anding legs + 30 kg structure + margin
EDL Product Entry, Descent and Landing 24.60 airbags
TC Product Thermal Control 14.19 from probe
Harness 5% 19.88 Dry Mass w/o System Margin 402.15 System Margin 20% 80.43 Dry Mass incl. System Margin 482.58 CPROP Fuel Mass 654.13 fly-by option, 4322 km/s Delta V CPROP Fuel Margin 0% 0.00 CPROP Oxidizer Mass 855.07
CPROP Oxidizer Margin 0% 0.00
CPROP Pressurant Mass 4.72
CPROP Pressurant Margin 0% 0.00 2% margins already included
EPROP Propellant Mass
EPROP Propellant Margin 2% 0.00
Total Wet Mass 1996.50
Table 34-7: Mass budget

Ice Giants CDF Study Report: CDF-187(C)
January 2019 page 307 of 431
ESA UNCLASSIFIED – Releasable to the Public
34.5.2 GNC
34.5.2.1 GNC design drivers
34.5.2.1.1 Soft landing requirements
The main objective of the GNC is to achieve certain performances of velocity and attitude orientation in the instant of touchdown in order to ensure structural compatibility with the landing system (landing legs, crushable structure or airbags) and avoid roll-over. For this specific mission there is another stringent requirement for low contamination
of the landing area with the engine’s plumes. In the case of the Europa Lander mission,
NASA’s way of dealing with this requirement is the use of a large sky-crane landing
system (cable of 15 meters) and thrusters canted 30 degrees during sky-crane
manoeuvres (RD[55]).
An alternative solution could be to switch-off the engines at 15 meters and design a
crushable structure or landing legs capable of sustaining the loads derived from this
free-fall. The following table shows a comparison of impact velocities for different drop
altitudes and different planets.
Table 34-8: Radius, atmospheric pressure and gravitational parameter of different moons and planets
Table 34-9: Impact velocities in different planets depending on initial drop altitude
For the case of Schiaparelli Mars landing, the crushable structure was designed to withstand a vertical velocity of 4.8 m/s, equivalent to a free fall from 3 meters altitude. In the case of Triton, a similar vertical velocity is encountered if the free fall starts from 15 meters. But in contrast with Mars, the free fall from 15 m in Triton lasts 6.2 seconds which
imposes a constraint on the initial orientation and residual angular rate at the moment
of engines switch off. The attitude with respect to the local vertical at touchdown
together with the lateral velocity determines whether or not the roll over will occur.
Triton Europa Moon Mars Earth
Radius [km] 1353.4 1561 1737 3390 6378
Surface gravity [m/s2] 0.779 1.314 1.62 3.711 9.806
Surface pressure [Pa] 1.4-1.9 1.0E-12 0 800 101325
mu [ km3/s2] 1427 3202 4888 42647 398914
Drop Altitude
[m] Triton Europa Moon Mars Earth Triton Europa Moon Mars Earth
1 1.2 1.6 1.8 2.7 7.3 1.6 1.2 1.1 0.7 0.5
2 1.8 2.3 2.5 3.9 8.7 2.3 1.7 1.6 1.0 0.6
3 2.2 2.8 3.1 4.7 9.6 2.8 2.1 1.9 1.3 0.8
10 3.9 5.1 5.7 8.6 13.0 5.1 3.9 3.5 2.3 1.4
15 4.8 6.3 7.0 10.6 14.4 6.2 4.8 4.3 2.8 1.7
Impact Velocities [m/s] Time to touchdown [s]

Ice Giants CDF Study Report: CDF-187(C)
January 2019 page 308 of 431
ESA UNCLASSIFIED – Releasable to the Public
A further assumption on the geometry of the lander is needed to complete the analysis.
The following picture shows a schematic of two possible lander designs: with a
crushable structure or with landing legs.
Figure 34-4: Possible lander configurations (left, centre) and Europa Lander NASA design (right)
Table 34-10: Assumptions for MCI and lander configurations
A simplified assessment of the dynamic landing stability can be performed based on angular momentum considerations and additional simplifications detailed hereafter. These analyses feature very simple assumptions (no rebounce, no model of the leg dampers, etc.), so conclusions must be considered with care, and more detailed analyses will be needed in future phases. The first assumption is a two-dimensional movement, as presented in Figure 34-5.
Additionally it is assumed that at the moment of impact, the leg or crushable structure
will encounter some kind of obstacle which would prevent it from sliding and the whole
vehicle will start a rotational movement around the impact point (point A in Figure
34-5).
The initial angular rate after touch down will be computed applying the conservation
of angular momentum between the two instants prior and after the impact:
√
( )
(
)
where is the angular rate prior to impact, which is assumed to be the same as the
angular rate at the switch-off of the thrusters (SOT), m is the mass of the lander
h
L
a
L
h
b
a
b
Crushable Landing Legs
a [m] 0.3 0.3
b [m] 0.3 0.3
h [m] 0.2 0.8
L [m] 0.6 0.8
mass [kg] 80 80
Ixx [kg*m2] 10 10
Geometric/MCI assumptions

Ice Giants CDF Study Report: CDF-187(C)
January 2019 page 309 of 431
ESA UNCLASSIFIED – Releasable to the Public
composite, the horizontal velocity prior to impact. The denominator represents the
moment of inertia around the impact point A (see Figure 34-5)
Figure 34-5: Parameter definitions for the preliminary landing stability assessment
During this rotational movement the gravitational acceleration of Triton creates an angular deceleration which tends to counteract the initial angular velocity. This angular acceleration depends on and it is computed using the following formula:
√
( )
(
)
The above equations have been integrated over time for different initial angular offset
with respect to the surface at the moment of touchdown (αTD). Note that the αTD is
related to the initial angular offset at SOT (α_SOT) with the following formula:
αTD = α_SOT + (time_free_fall) x ( )
Note that in all the analyses it is assumed that the surface is a geodetic surface, meaning
that it is perpendicular to the gravitational acceleration. The roll-over condition occurs
when the angle exceeds 90 degrees.
Figure 34-6 shows the evolution of the angle versus time for the crushable structure
configuration, assuming an initial angular rate of 1 deg/s and two different lateral
velocities: 1.5 and 2 m/s. Figure 34-7 shows similar simulations for the landing legs
configuration.
Table 34-11 shows in a parametric analysis which is the allowable attitude error at SOT
for given lateral velocities and attitude rates at SOT.
Based on previous Moon and Mars studies involving vision based navigation system, the expected performance in terms of lateral velocity knowledge can be in the order of 0.25-0.5 m/s and the final lateral velocity achieved can be controlled down to 1.5 to 2 m/s. It is also assumed that at SOT an attitude error of 1 or 2 degrees and angular rate error residual of 1 deg/s is achievable. This attitude error performance imposes a stringent
α0
vh
g
A
Θ
αgeometric

Ice Giants CDF Study Report: CDF-187(C)
January 2019 page 310 of 431
ESA UNCLASSIFIED – Releasable to the Public
constraint on the thruster actuation accuracy and its feasibility should be better assessed in future studies. With such assumptions, the crushable structure configuration as defined in Table 34-10 seems to be a feasible option in terms of GNC for a drop altitude of 15 meters above the surface.
On the contrary, if a landing system with legs is deemed necessary for whatever reason, and the required altitude of the CoG with respect to the ground is 0.8 m, this would impose a big challenge on the navigation and control performance, which should be able to reduce the lateral velocity to 0.5 m/s and angular rate of 1 deg/s at SOT.
This analysis will need to be refined once a proper design of the lander is identified, but it can already be used as an indication of the challenges that might be encountered.
Figure 34-6: Crushable structure configuration. Angular evolution after impact
for initial = 1 deg/s and = 1.5 m/s (left) and = 2.0 m/s (right)
Figure 34-7: Landing leg configuration. Angular evolution after impact for initial
= 1 deg/s and = 0.5 m/s (left) and = 0.75 m/s (right)

Ice Giants CDF Study Report: CDF-187(C)
January 2019 page 311 of 431
ESA UNCLASSIFIED – Releasable to the Public
Table 34-11: Max. allowable attitude error at SOT (αSOT) for a given and
34.5.2.2 Thrust level requirements for soft-landing manoeuvre
In both of the mission analysis scenarios considered (delivery from fly-by or from orbit) the last manoeuvre (M4 or M2 respectively) is called “soft landing manoeuvre” and requires a total delta-v in the order of 1150-1250 m/s to slow down the vehicle from the periapsis velocity of a 10x50 km orbit to touchdown conditions. The manoeuvre is planned to be performed in two phases: a first phase where the biggest part of the dv is performed (using a higher thrust level) and a second phase where the last 200 m/s are provided with a lower thrust level, aiming to have a thrust to weight ratio of 1 prior to the switch-off thrusters (SOT) event.
This strategy is similar to the one proposed by Europa Lander (see section 34.7). In the case of the Europa Lander, the arrival to Europa is done via a fly-by approach which can be assumed to be equivalent to an arrival from a 6 x 6500 km high elliptical orbit. For such an orbit, the passage through the periapsis occurs very rapidly and therefore not only the gravity losses will increase dramatically if the T/W is small, but also the whole strategy might become unfeasible if the periapsis braking manoeuvre is stretched over time. As a result, for the Europa Lander the thrust level proposed is 70 kN (i.e non-dimensional T/W = 16.7), the burn lasts approximately 60 seconds and delivers a delta-v of 1750 m/s. Assuming that the manoeuvre is started at periapsis, Table 34-12 shows the condition at the end of the burn in terms of true anomaly, altitude and flight path angle (FPA), being the latter the main contributor for the gravity losses.
Just for comparison, Table 34-12 shows also the initial orbit for the Triton lander and what would be the conditions 60 seconds after the periapsis passage. As it can be seen, the FPA is almost two order of magnitudes smaller, showing that the delta-V losses for the Triton case would be negligible in the manoeuvre was to last only 60 seconds.
vh h_CoG L Mass Ixx@CoG Maximum α0 Maximum α0_SW
[m/s] [m] [m] [kg] [kg*m2] [deg/s] [deg] [deg]
2 0.2 0.6 80 10 1 6 0
2 0.2 0.6 80 30 1 10 4
2 0.2 0.8 100 30 1 9 3
2 0.2 0.8 80 10 1 12 6
2 0.2 0.8 80 10 1.5 12 3
1.5 0.2 0.6 80 10 1 12 6
1.5 0.2 0.6 80 30 1 16 10
1.5 0.2 0.8 100 30 1 15 9
1.5 0.2 0.8 80 10 1 18 12
1.5 0.2 0.8 80 10 2 18 6
0.5 0.8 0.6 80 10 1 8 2
0.75 0.8 0.8 80 30 1 8 2

Ice Giants CDF Study Report: CDF-187(C)
January 2019 page 312 of 431
ESA UNCLASSIFIED – Releasable to the Public
Table 34-12: Comparison of initial orbits to start soft landing manoeuvre: Europa Lander vs Triton Lander
Assuming an Isp=300 s, the wet mass of the Triton lander is 111 kg at periapsis, since it
has already consumed a considerable amount of propellant to perform the previous
manoeuvres. As explained above, the soft-landing 1250 m/s manoeuvre is split in two:
1050 m/s with high T/W thrust (33 kg) and 200 m/s at lower T/W (5 kg). The final
mass prior to touchdown is therefore 73 kg. As a result, the minimum required thrust
level at touchdown shall be 57 N, to allow a non-dimensional T/W ratio equal to 1.
Table 34-13: Triton lander thrust level, throttable requirements and T/W ratios during mission
Table 34-18 shows different possible thrust levels for the Triton lander. For example, if
the thrust level selected is 57 N, the non-dimensional T/W at touchdown would be 1, but
the same thrust level should be used to perform the manoeuvre at periapsis (1050 m/s),
which would last 1699 seconds, equivalent to 75 degrees of true anomaly. The most
critical issue is that the non-dimensional T/W during the first manoeuvre would be 0.2,
which most likely will provoke gravity losses higher than the 20% currently assumed.
On the contrary, if a single thruster of 453 N would be used, the non-dimensional T/W
during the first manoeuvre would be 1.7, which most likely is covered by the 20% gravity
losses currently assumed in the delta-v budget (confirmation of this assumption should
be done in future steps of the study). The burn duration at periapsis would only last 214
seconds with a final FPA of 0.13 deg, ensuring negligible gravity losses in this
manoeuvre. But in order to ensure safe touch down, the engine should be throttleable by
a factor of 8.
Another possibility is to use a cluster of engines used in pulse-width-modulation
(PWM). This was the solution chosen for Schiaparelli (RD[63]). For a landed mass of
approximately 270 kg, Schiaparelli used 3 clusters of 3 CHT-400 hydrazine engines,
canted 20 deg. The maximum effective thrust using all the engines in continued mode
was 3420 N, while for the final part of the flight, the PWM managed to reduce the total
thrust to 1000 N. This is equivalent to a throttleable capability of a factor of 3.4.
For the Triton lander, a Schiaparelli-like strategy would imply a total thrust level of 204
N to be distributed in 3 clusters of either 3 thrusters 22N each. Another option would be
to use the Phoenix/Insight configuration which used also 3 clusters but with only 4
Planet Perig Alt Apog Alt Perig Vel True Anomaly (ν) FPA @ ν Alt @ ν T from perigee to ν
[km] [km] [m/s] [deg] [deg] [km] [s]
Europa 6 6500 1850 2.5 1.01 6.60 60
Triton 10 50 1030 2.5 0.04 10.02 60
Mass T/W T/W Mass T/W Mass T/W T (T_Max/T_Min) Burn time True anomaly FPA Altitude
[kg] [-] [N/kg] [kg] [-] [kg] [-] [N] Ratio Request [s] [deg] [deg] [km]
350 2.5 1.9 111 7.9 73 12.0 680 12.0 142 6.1 0.09 10.11
350 1.7 1.3 111 5.2 73 8.0 453 8.0 214 9.2 0.13 10.25
350 1.0 0.8 111 3.3 73 5.0 284 5.0 339 14.5 0.20 10.62
350 0.8 0.6 111 2.4 73 3.6 205 3.6 463 19.9 0.28 11.16
350 0.4 0.3 111 1.3 73 2.0 114 2.0 827 35.6 0.48 13.64
350 0.2 0.2 111 0.7 73 1.0 57 1.0 1699 75.0 0.80 24.55
@Periapsis @TouchDown Conditions@end_burn with maneouver starting@periapsis@First Maneouvre

Ice Giants CDF Study Report: CDF-187(C)
January 2019 page 313 of 431
ESA UNCLASSIFIED – Releasable to the Public
engines per cluster, which would result in a total of 12 thrusters 17N. Another option
would be 3 clusters with 2 thrusters 35N each.
This option would yield to a 463 s periapsis burn duration (negligible gravity losses) and
a non-dimensional T/W of 0.8 at the beginning of the flight. It needs to be further
assessed whether this T/W would be covered by the 20% gravity losses margin already
included in the budget. If this is the case, this option should be further analysed in
future studies to estimate the mass of the propulsion system.
34.5.2.3 Baseline GNC design
The overall operation of the GNC functions is very similar to the one proposed by NASA for the Europa Lander (see Figure 34-14). This is also similar to the PILOT (Precise and Intelligent Landing Using Onboard Technologies) navigation system, which is to be flown on the robotic Luna-Resource (2023) lander mission as part of the ESA cooperation with Roscosmos on exploration. PILOT provides relative & absolute vision based navigation and hazard-detection-and-avoidance (HDA) capabilities by means of:
Camera Optical Unit (70deg FoV full cone, with a baffle with an exclusion angle of 110deg full cone). Estimated mass @ PDR (maturity + 10% system) ~ 0.8 kg
LIDAR: scanning LIDAR developed by Neptec, maximum range of 1500m, 40 deg FoV max and scan time of 5 s. Estimated mass @ PDR (maturity + 10% system) ~ 7.0 kg
Landing Processing Unit (LPU): includes a processor board, and FPGA board, mass memory unit and power distribution unit to power the camera, not the LIDAR. Estimated mass @ PDR (maturity + 10% system margin) ~ 9.0 kg
The navigation camera is used to create hazard maps in terms of texture and illumination, while the LIDAR identifies hazards related to slopes.
The navigation camera will also be used to provide estimation of the relative velocity with respect to the ground by identifying and tracking features of the terrain.
A priori images of Triton might be needed to increase the absolute navigation knowledge with respect to the surface.
In addition an altimeter is needed to provide relative altitude with respect to the ground, since the position estimation purely based on inertial measurement units would not yield the sufficient precision.
The mass and power estimation of such an altimeter has been done using the results obtained from an ESA TRP - Planetary Altimeter breadboard (ABPA) - aiming to analyse, design and bread-board two versions (radar and laser) of a compact, low-power planetary altimeter for use in ESA exploration programmes (Sep-2018).
RADAR altimeter: Estimated mass (including antennas) ~ 1.7 kg. Power consumption 5.6 W. Operational envelope: 10 m – 2.2 km.
LIDAR altimeter: Estimated mass (unit box only) ~ 0.6 kg. Power consumption 8.6 W. Operational envelope (max distance limited by test campaign): 18 – 810 m
As a result, the estimated mass budget for the GNC equipment is provided in Figure 34-12. It should be highlighted that no redundancy is included in this equipment list,

Ice Giants CDF Study Report: CDF-187(C)
January 2019 page 314 of 431
ESA UNCLASSIFIED – Releasable to the Public
while the NASA Europa Lander assumes full redundancy of the GNC equipment. In addition, the propulsion system (either main engine with reaction control thrusters or cluster of engines) is not included this equipment list.
Figure 34-8: PILOT inside Lunar Resource (left) and Triton Lander GNC equipment summary (right)
Possible improvements to the above equipment summary are:
RADAR altimeter: Estimated mass (including antennas) ~ 1.7 kg. Power
Planetary Altimeter breadboard (ABPA) – [TRP Activity] aiming to analyse, design and bread-board two versions (radar and laser) of a compact, low-power, planetary altimeter for usage in ESA exploration (completed in Sep-2018)
34.5.2.4 GNC technology developments
The Planetary Altimeter (continuation of ABPA activity) shall complete its development.
A possible upgrade aiming to reduce the overall mass, is to develop a dual-use LIDAR which could be used both as an altimeter and a hazard-detection-avoidance sensor.
Finally, it should be highlighted that the landing processor unit currently baselined includes a power distribution unit for the camera. It is also estimated that further optimisation of the processor unit could reduce the final weight by more than 50%.
With these modifications, the overall GNC equipment mass (with no redundancy) could be reduced down to 20 kg.
34.5.3 Mechanisms
34.5.3.1 Mechanisms Design Challenges
The main challenge for the Triton Lander Mechanisms subsystem design is the landing gear, in charge of ensuring the following functions:
Prevent tip over
Absorb kinetic energy
Avoid bouncing back
Ensure ground clearance
Minimise acceleration (to protect payload).
Qua
ntity
Mass per
unit, excl
margin [kg]
Maturity Level /
mission
Margin
[%]
Total Mass
Inc margin
[kg]
Star Tracker 1 2.7 COTS (Sodern Hydra) 5% 2.8
Radar Altimeter 1 1.7 Planetary Altimeter TRP 20% 2.0
European IMU 1 5 ExoMars 2020 5% 5.3
LIDAR 1 5.8 PILOT 20% 7.0
Camera 1 0.7 PILOT 20% 0.8
Landing Processor Unit 1 7.5 PILOT 20% 9.0
27Total Mass with margin [kg]

Ice Giants CDF Study Report: CDF-187(C)
January 2019 page 315 of 431
ESA UNCLASSIFIED – Releasable to the Public
Other mechanisms would have to be designed (deploying instruments, pointing antenna(s), …), but this was out of scope of the preliminary assessment of the Lander Concept.
34.5.3.2 Mechanisms Design Drivers
Major design drivers for the Landing gear are:
Max allowable acceleration (how ‘soft’ must the landing be)
Landing speed (this is the energy the landing gear has to absorb)
Vertical and lateral velocity
Lander size, CoG
Clearance needed below lander (payload and terrain would define this)
Terrain slope.
*Taking conservative assumptions for all the points would lead to oversized solutions or just to infeasibility.
Reasonable assumptions and careful evaluation of reference missions would have to be used in the design.
34.5.3.3 Baseline mechanisms design
The following reference missions have been considered:
Figure 34-9: Mechanism design reference missions
As a preliminary assumption, landing gears are typically around 3-5% of lander mass. For the Triton case a rough estimate of 20kg (excluding margins) is used as the starting point.
34.5.3.4 Mechanisms technology developments
No peculiar developments in the mechanisms domain are envisaged at this stage.
34.5.4 Power
34.5.4.1 Power trade-offs
A lander power subsystem could be based on:
Battery
Heritage solution: Lithium primary cell. assuming SAFT LO26SHX LiSO2:
o 235 Wh/kg BOL nameplate @ cell @ 20°C.

Ice Giants CDF Study Report: CDF-187(C)
January 2019 page 316 of 431
ESA UNCLASSIFIED – Releasable to the Public
o x1.3 cells-to-batt mass factor, 13 years x 3% self discharge, 80% DoD, 10% string redundancy.
o 73 Wh/kg EOL total effective usable @ battery level. = 0.33 kg per watt per day.
o Minimum conceivable power budget: Assuming:
10W PCDU, 20W DHS, 20W AOGNC, 20W COMMS
TOTAL POWER: 70W
o Flight time: one week (assumption based on considerations over the drift arcs for the orbit before landing. Such drift arcs are driven by several factors:
The need for orbit determination in preparation for or following one of the manoeuvres in the sequence (M1 to M4, as explained in the Mission Analysis section)
Operational requirements (driven by the orbiter or by orbital dynamics) Surface science in preparation of landing (will observations from the Neptune
orbiter gathered during its flybys at Triton be sufficient to characterise the landing site: slope, roughness, other hazards? Does the lander have to do that prior to initiating the final landing sequence?)
It can be assumed that as a minimum ~ 1 week is needed and most of these activities require a lander that is very much alive and non-hibernating. At least this is valid for orbit determination and Triton surface observation.
– Battery mass = 7 days x 70 W x 0.27 kg per watt per day = 162 kg (excluding SURFACE MISSION, thus is a ‘’zero science situation”)
– Battery mass (assuming 1 week of Surface mission) = 162 + (=7*(70+50***)*0.27) = 162 + 226.8 kg = 388.8 kg*
*** 50 W would be the additional required power to transmit data
Best case technology solution: Next-generation Li-ion secondary.
o Assuming:
Very low calendar ageing 0.5 %/yr. Top-up charge before release 220 Wh/kg BOL nameplate @ cell @ 20°C Temperature ensured by RHUs x1.3 cells-to-battery mass factor, 80% DoD, 10% string redundancy 114 Wh/kg EOL total effective usable @ battery level. = 0.21 kg per watt
per day.
o Minimum conceivable power budget? Assuming:
10W PCDU, 20W DHS, 20W AOGNC, 20W COMMS

Ice Giants CDF Study Report: CDF-187(C)
January 2019 page 317 of 431
ESA UNCLASSIFIED – Releasable to the Public
TOTAL POWER: 70W
o Flight time: one week
o Battery mass = 7 days x 70 W x 0.27 kg per watt per day = 103 kg (excluding SURFACE MISSION)
o Battery mass (assuming 1 week of Surface mission) = 103 x 2 = 206 kg
RTG
eMMRTG
o Assuming: 90W EOL.
o Minimum flight power budget? Assuming:
10W PCDU, 20W DHS, 20W AOGNC, 20W COMMS
TOTAL POWER: 70W
o Flight time? As long as needed
o 45 kg, including surface mission.
However this solution still needs a small battery in support in case there are any moments exceeding 90W power demand (Propulsion power needs are not considered in the minimum power budget, therefore a battery could be required, unless the timeline is planned in such a way not to exceed the power demand).
PCDU
Heritage solution: Huygens probe
o 16 kg, plus 5 kg pyro unit = 21 kg
o 600 W max power capability
Best case technology solution: Modern high function-density modular PCDU e.g. Terma Modular Medium Power Unit.
o Approximatively 10 kg total with all functionalities including pyro actuation
34.5.4.2 Power technology developments
Further mass savings could be expected with a combined avionics/power unit approach, as a “Minavio” concept.
34.5.5 Thermal
34.5.5.1 Thermal design drivers
A Triton Lander will not only require very good radiative decoupling but also an effective conductive decoupling from any contact point on the moon’s surface (considering the duration of the operations on ground). Note: Voyager 2 during fly-by found surface temperatures of -235 degC.
34.5.5.2 Thermal baseline design
A preliminary sizing is based on:

Ice Giants CDF Study Report: CDF-187(C)
January 2019 page 318 of 431
ESA UNCLASSIFIED – Releasable to the Public
22-layer MLI using HELPAC spacers from Juice (mass can be estimated based on external surface area)
Conductive de-coupling somewhat configuration dependent, but likely based on foam or aerogels
RHU’s required already for cruise and coasting (number would be determined by the duration of these phases)
Radiator windows might be required to reduce sensitivity during coasting
PCM’s might locally be used to protect instruments and units.
34.5.5.3 Thermal technology developments
Possibly no technology developments are required, however a well elaborated system testing is required.
34.5.6 Propulsion
The propulsion system is designed to handle the high delta v demands as indicated above as well as the soft landing of the spacecraft. Due to the gravity constant of 0.78m/s² the thrust can be compared to the actual acceleration of the spacecraft on ground. Due to the requirement of the soft landing, a system based on conventional hydrazine thrusters is used. This is due to the fact that those thrusters are due to the blowdown of current systems designed for throttling purposes. The only missing adaptation is a usage of a valve with throttling capabilities. This valve is based on the high pressure proportional valve from Nammo (https://indico.esa.int/event/181/contributions/1375/attachments/1331/1556/Nammo_Electronic_Pressure_Regulator_-_Clean_Space_26-10-17.pdf). This valve could be adapted to be in the direct flow path in hydrazine (technology development needed) and could then throttle the mass flow by having a blowdown system. This enables a regulation of the thrust to compensate the acceleration on the surface.
Due to the large delta v demands, a dual mode system consisting of a main engine and several 220N thrusters using purely hydrazine is baselined. This system consists of one main engine (HIPAT™ DM - http://www.rocket.com/propulsion-systems/bipropellant-rockets) with a nominal thrust of 445N and a specific impulse of 329s for the configuration with an expansion ratio of 375 (http://www.rocket.com/files/aerojet/documents/Capabilities/PDFs/Bipropellant%20Data%20Sheets.pdf). The other thrusters are the MR-107V thrusters from Aerojet as well, characteristics mentioned in the figure below.

Ice Giants CDF Study Report: CDF-187(C)
January 2019 page 319 of 431
ESA UNCLASSIFIED – Releasable to the Public
Figure 34-10: MR-107V 220N Rocket engine assembly
34.5.6.1 Propulsion system
The propulsion system consists of the engines for landing as well as the main engine for the large delta v manoeuvres.
Description Type Amount Mass per unit Margin
Mass incl. margin
Pipes Pipes 1 6 0.2 7.2
AOCS Engines MR-107V 8 1.01 0.05 8.484
Main Engine HIPAT-DM 1 5.44 0.05 5.712
Fuel Tank OST-22X 1 36 0.05 37.8
Oxid Tank E3000 1 36 0.05 37.8
Fill / Drain Valves 7 0.07 0.05 0.5145
LP Pressure Transducer SAPT 2 0.216 0.05 0.4536
HP Pressure Transducer SAPT 1 0.216 0.05 0.2268
Latch Valve 2 0.75 0.05 1.575
Propellant Filter RA04822A 2 0.077 0.05 0.1617
Check valve VN005-001 2 0.585 0.05 1.2285
Helium Tank PVG-120 1 23.5 0.05 24.675
Helium Tank ATK-80446 0 7.7 0.05 0
Pressure regulator Vacco 1 1 0.2 1.2

Ice Giants CDF Study Report: CDF-187(C)
January 2019 page 320 of 431
ESA UNCLASSIFIED – Releasable to the Public
Description Type Amount Mass per unit Margin
Mass incl. margin
Pyrovalve Cobham 0 0.315 0.05 0
SMA valve Arianegroup 2 0.16 0.2 0.384
High pressure latch valve Vacco V1E10560-01 0 0.8 0.05 0
Proportional valve Nammo 1 0.5 0.2 0.6
Total 127.0311
Table 34-14: Propulsion system equipment and mass
It was discussed during the session dedicated to the design of the lander whether a possible jettison of a part of the propulsion system could be beneficial. This option was investigated shortly but also has not shown a compliance to the maximum mass requirement.
34.5.6.2 Propulsion manoeuvre baseline
The following scenario for the manoeuvres and the delta v investigations was used:
Manoeuvre mass begin [kg] mass end [kg] velocity increment [m/s]
Manoeuvre 1 2457.6 1261.3 2152.0
Manoeuvre 1 gravity losses 1261.3 1104.0 430.0
AOCS manoeuvre 1 1104.0 1036.3 138.4
Manoeuvre 2 1036.3 949.6 282.0
Manoeuvre 2 gravity losses 949.6 949.6 0.0
AOCS manoeuvre 2 949.6 945.2 10.0
Manoeuvre 3 945.2 943.2 7.0
Manoeuvre 3 gravity losses 943.2 943.2 0.0
AOCS manoeuvre 3 943.2 943.1 0.2
Manoeuvre 4 943.1 532.5 1250
Manoeuvre 4 gravity losses 532.5 532.5 0
AOCS manoeuvre 4 532.5 512.0 85.98146515
Final/Total (Including Residuals) 473.04 4355.6
Table 34-15: Propulsion system manoeuvres
The AOCS manoeuvres are always modelled as a percentage of 5% of the propellant used for the manoeuvre. As an example, the AOCS manoeuvre 1 is 5% of the propellant mass of the manoeuvre 1 and manoeuvre 1 gravity losses. Following table includes the details about the manoeuvres and the propellant mass consumption:
Manoeuvre Thruster Mixture ratio propellant mass [kg]
Manoeuvre 1 HIPAT-DM 1.43 1196.24
Manoeuvre 1 gravity losses HIPAT-DM 1.43 157.39
AOCS manoeuvre 1 MR-107V 0.00 67.68
Manoeuvre 2 HIPAT-DM 1.43 86.73
Manoeuvre 2 gravity losses HIPAT-DM 1.43 0.00

Ice Giants CDF Study Report: CDF-187(C)
January 2019 page 321 of 431
ESA UNCLASSIFIED – Releasable to the Public
Manoeuvre Thruster Mixture ratio propellant mass [kg]
AOCS manoeuvre 2 MR-107V 0.00 4.34
Manoeuvre 3 HIPAT-DM 1.43 2.05
Manoeuvre 3 gravity losses HIPAT-DM 1.43 0.00
AOCS manoeuvre 3 MR-107V 0.00 0.10
Manoeuvre 4 MR-107V 0.00 410.58
Manoeuvre 4 gravity losses MR-107V 0.00 0.00
AOCS manoeuvre 4 MR-107V 0.00 20.53 Final/Total (Including Residuals) 1984.55
Table 34-16: Propellant mass consumption by manoeuvre
In total, around 1984.6kg of propellant is needed to land with the MR-107V engine the final mass of 473.04kg on the surface. The relation between thrust and surface acceleration at the end is calculated to be 0.596. Therefore, two engines simultaneous, maybe with an angle in relation to the axis of the spacecraft, are needed to throttle down at the end of the landing. It was as well assumed that a part of the deceleration of the spacecraft can be still done with the HIPAT engine, leading to a maximum thrust of around 800N to land the spacecraft.
34.5.7 Structures & Configuration
34.5.7.1 Structures & configuration design drivers
Major design drivers for the Structures/Configuration design are:
CoG (in case there is a big battery mass, accommodation shall be carefully addressed)
Stiffness requirements and loads experienced during landing have to be assessed; however landing on a low-gravity moon makes the structural design less critical. Heritage can be used and Crushable structure should be sufficient, as the lander does not have to take off again after landing
Need to cant thrusters and reduce plume impingement contamination.
34.5.7.2 Structures baseline design
Structural mass can be assumed to be 20% of the lander dry mass.
The possibility to stop the engine high enough from the surface and then land with a crushable structure (TRL 4 as of today) shall be considered. This could mitigate the contamination effects of the plumes and allow not adopting the sky-crane, as done by NASA (and for which ESA does not have the technology ready).
34.5.7.3 Structures technology developments
No peculiar developments in the Structural domain are envisaged at this stage.
34.5.8 Communication
34.5.8.1 Communication design drivers
Major design driver for the Comms subsystem is the visibility of the orbiter in order to be able to relay scientific data.

Ice Giants CDF Study Report: CDF-187(C)
January 2019 page 322 of 431
ESA UNCLASSIFIED – Releasable to the Public
34.5.8.2 Communication baseline design
Due to the maturity level of the payload timeline definition and the required data volumes, it is assumed to adopt the Neptune Probe comms baseline design, with an RF power of 20W, derived from a 70 peak power consumption for comms.
Under the assumption that visibility of the orbiter is ensured, then the bitrate shall be selected as a function of the maximum distance from the probe as follows:
Figure 34-11: Bitrate versus distance to orbiter
Source Parameters of the link budget computation are as follows:
Table 34-17: Link budget

Ice Giants CDF Study Report: CDF-187(C)
January 2019 page 323 of 431
ESA UNCLASSIFIED – Releasable to the Public
34.5.8.3 Communications technology developments
No peculiar developments in the Communication domain are envisaged at this stage.
34.5.9 Operations
34.5.9.1 Operations design drivers
Major design drivers for the Operations are:
AOCS complexity (level of autonomy)
Availability of the communication link to ground or to orbiter
Visibility from Earth.
34.5.9.2 Operations Baseline Design
An array of two 35 meters antennas is the baseline, as for the Neptune probe and orbiter.
34.5.9.3 Operations technology developments
There is the idea to develop an array of up to 4 ground stations, with 2 receiver-only antennas, and 2 Transmitting + Receiving (less costly)
34.5.10 Risks
The major criticalities identified at this stage, and to be properly addressed, mitigated and controlled, are the landing hazards:
Stability
Landing in “fluffy” ice with consequent loss of communication
Plume contamination
34.6 Technology Needs
Included in this table are:
Technologies to be (further) developed
Technologies identified as coming from outside ESA member states
Technologies available within European non-space sector(s)
|~T Technology Needs
* Equipment Name & Text Reference
Technology Supplier (Country)
TRL Funded by
Additional Information
PROPULSION
Throttled / pulsed propulsion capabilities in a closed-loop GNC system for the final descent manoeuvre

Ice Giants CDF Study Report: CDF-187(C)
January 2019 page 324 of 431
ESA UNCLASSIFIED – Releasable to the Public
GNC
Dual-use LIDAR, hazard-detection-avoidance and altimeter.
POWER
Combined avionics/power unit approach, as a “Minavio” concept.
OPS
Array of up to 4 ground stations, with 2 receiver-only antennas, and 2 Transmitting + receiving
34.7 Europa Lander Mission
This section provides a summary of the current status of the NASA mission Europa Lander, as understood from several sources available on the internet. It must be stressed that the mission is still going through multiple iterations and it is not easy to ensure that all the inputs found in the mentioned references are fully coherent among themselves. Nevertheless the following summary is believed to be sufficiently representative of the mission design and provides a good sample case to compare to the Triton Lander scenario.
The Europa Lander mission will use Space Launch System (SLS) as launch vehicle in Dec-2025 and arrive to Jupiter in Jul-2030 by means of a propulsive Earth gravity assist. Another gravity assist manoeuvre, this time at Ganymede, is planned prior to the Jupiter Orbit Insertion (JOI) and a series of gravity assists manoeuvres at Ganymede and Calisto will result in a Jupiter tour of 18 months from JOI to Europa encounter. After the lander release, the carrier will execute several transfer orbits to reach a final relay orbit, allowing more than 10 hours communication coverage with the lander (RD[55]).
Figure 34-12: 2025 launch with a 4.8 year transfer (left) and Carrier/Lander trajectories around Europa (right)

Ice Giants CDF Study Report: CDF-187(C)
January 2019 page 325 of 431
ESA UNCLASSIFIED – Releasable to the Public
This trajectory is designed to reduce the spacecraft velocity relative to Europa. After the Mission Concept Review in June 2017, NASA explored several concepts to reduce cost (RD[56], RD[59]): abandon the orbiter in a stable orbit after separation and ensuring direct Earth communication of the lander or extending Europa Clipper mission by 3 years (to be launched in 2022) and use it as satellite relay.
All these options impact on the lander velocity relative to Europa, which is the main driver for the lander design. For the option using the carrier as orbiter relay, the lander velocity relative to Europa at 6 km periapsis altitude is equal to 1850 m/s (RD[57]), while for the case of Europa Clipper as satellite relay the entry velocity can increase up to 2300 – 2900 m/s (see page 136 of RD[56]).
The resulting spacecraft design is shown in Figure 34-13, taken from RD[56], page 129.
Figure 34-13: Europa Lander Flight System (2/3 of the total mass is devoted to propulsion needs). Note how the lander stack is covered by a bio-shield at lift-off
The solution proposed by NASA uses a two-stage propulsion system followed by a sky-crane landing. The main delta-v manoeuvre is performed by a fixed-nozzle solid rocket motor (SRM) Star 48 class. The attitude control during the thrust of the SRM is done by 4 hydrazine engines MR-104 G (800 N each). The burn lasts approximately 60 seconds, and afterward the SRM is jettisoned. The descent stage is now on charge of reducing the remaining 100 m/s velocity down to 0 at touch-down.
Based on all the available information, Table 34-18 shows an estimation of the overall mass budget of the Europa Lander Flight System, together with the thrust level and delta-v of each propulsion module assuming a Europa arrival velocity of 1750 m/s.

Ice Giants CDF Study Report: CDF-187(C)
January 2019 page 326 of 431
ESA UNCLASSIFIED – Releasable to the Public
Table 34-18: Europa Lander Flight System estimated mass budget
No information was found about the Descent Stage dry mass, so it has been assumed to be 500 kg. RD[57] states that the DS is responsible for braking the last 100 m/s of velocity. A 100% margin has been added to take into account hovering during sky-crane operations and re-targeting during the hazard avoidance manoeuvre. Those 200 m/s delta-v result in 72 kg of DS propellant. RD[57] also states that the deorbit stage (DOS) delivers a delta-v of 1750 m/s burning 1500 kg in approximately 60 seconds. With that information, the dry mass of the DOS has been computed as 591. The propellant mass of the Carrier and Relay stage has been derived imposing that the total propellant mass of the mission is 2/3 of the total mass (as stated in RD[56] )
Due to the uncertainties of the SRM burn duration, the position error is approximately +/- 4 km. To reduce this error, the Europa Lander mission will perform absolute visual navigation, comparing the images taking by an on-board camera with the reconnaissance maps provided by Clipper. The lander will then select a safe landing area using hazard detection & avoidance algorithms based on LIDAR and camera images. The guidance manoeuvre towards the safe landing site is performed with another 4 mono propellant MR-104 G engines, canted 5 deg. At an altitude of approximately 24 m altitude, the lander and the Descent Stage will separate and the sky-crane will deploy a 13 m cable, enabling a safe landing. During the sky-crane operation, a different set of 4 MR-104 G engines is used. These are canted 30 deg (to prevent landing site contamination) and are throttled down to 30% to allow a thrust to weight ratio close to 1.

Ice Giants CDF Study Report: CDF-187(C)
January 2019 page 327 of 431
ESA UNCLASSIFIED – Releasable to the Public
Figure 34-14: De-orbit, Descent and Landing sequence of Europa Lander RD[55]
Figure 34-15: De-orbit (left), Power Descent (center) and Sky-crane configurations for the Europa Lander mission RD[55]RD[61]

Ice Giants CDF Study Report: CDF-187(C)
January 2019 page 328 of 431
ESA UNCLASSIFIED – Releasable to the Public
Based on the above literature survey, there are several key aspects from the Europa Lander mission which can be relevant for a Triton lander mission:
Two thirds of the total mass of the system is devoted to propulsion needs
Bringing a lander in the vicinity of Europa at a reasonable small velocity (1750 -2900 m/s) requires a dedicated mission of 14 metric tons for a lander mass of roughly 500 kg
A dedicated carrier delivers the lander stack near Europa such that the lander stack performs only one major delta-v manoeuvre prior to land. The carrier is either discarded after that or used shortly as relay satellite for the lander, but it is not expected to do additional science
The GNC assumes reconnaissance imaginary created by a previous mission (Clipper) to help of the selection of a safe landing area. The final hazard detection and avoidance algorithms do not need prior knowledge of the terrain and are based on LIDAR and camera images
One of the key challenges is the compliance to the requirements of a planetary mission classification Category IV, which implies that the whole lander stack shall be covered with a bio shield (less than 1 × 10⁻⁴ probability of contaminating the European ocean by a viable Earth micro-organism). (RD[55])
In order to avoid landing site contamination during landing, the lander uses a large sky-crane (> 13 m cable) with highly canted braking engines (30 deg)
The landing system uses long legs at touch down (> 1.5 m length), most likely to be able to cope with very irregular terrain. Once the vehicle is stabilised, the legs can be folded during surface operations.

Ice Giants CDF Study Report: CDF-187(C)
January 2019 page 329 of 431
ESA UNCLASSIFIED – Releasable to the Public
35 RADIATION
35.1 Requirements and Design Drivers
The requirements that drive the radiation design are derived from the expected effects potentially experienced by the mission from the radiation environment sources.
In the ESA PEP CDF study (RD[7]), requirements from potential radiation effects were not considered. The NASA Ice Giants Report (RD[64]) includes a generic reference to a radiation total dose level of 30 krad (behind a 100 mil thick aluminium shielding (~2.5 mm), with an RDM of 2 added), probably only including the effect of Solar energetic particles (SEPs) in Appendix B (A-Team Study Report from the Ice Giants Workshop).
Use of RTGs, Jupiter flybys and extended duration of the orbiter mission segments at the destination planets require increased attention to the constraints imposed by radiation.
35.1.1 Design Drivers: Radiation Effects and Main Sources of Radiation Environment
Radiation effects can in general be categorised as:
Cumulative degradation effects from total ionising dose (TID) or total non-ionising dose (TNID)
Single event effects (SEEs) from single particles.
The main radiation sources to be included in a complete radiation analysis for the mission, along the mission timeline, are summarised in Table 35-1. In this study, SEEs and TNID are not considered, and TID is included as main design driver.
Radiation sources
Source Particles Time/Location Impact
Solar Particle Events (SPEs)
Solar energetic particles (SEPs)
During the entire mission (13 year transfer and 2 years at the destination planet)
Short term high fluxes, contribution to SEEs and cumulative doses
Galactic Cosmic Rays (GCR)
Protons and heavier ions
During the entire mission (13 year transfer and 2 years at the destination planet)
Continuous low intensity flux, contribution to SEEs, only limited cumulative dose
Radioisotope thermoelectric generators (RTGs)
Neutrons and gammas
Local artificial environment, during the entire mission (13 year transfer and 2 years at the destination planet)
Continuous low intensity flux, contribution to TNID/TID, potentially SEEs
Jovian trapped energetic particle environment
Energetic electrons and protons
In the vicinity of Jupiter
Short term high intensity fluxes, contribution to total mission cumulative doses and SEEs
Local planetary trapped radiation
Electrons and protons
2 years at the destination planet
Potential short term fluxes. contribution SEEs and total cumulative doses
Table 35-1: Main sources of radiation considered in the study

Ice Giants CDF Study Report: CDF-187(C)
January 2019 page 330 of 431
ESA UNCLASSIFIED – Releasable to the Public
35.2 Assumptions and Trade-Offs
This Section includes the assumptions made for the sources of radiation included in the analysis for the CDF study. For each source, the method used to compute the source intensity and the related TID level is outlined, together with potential uncertainties and related proposed margins.
35.2.1 Solar Particle Events (SPEs)
Solar energetic particles (SEPs) are emitted from the Sun during Solar Particle Events (SPEs), often categorised into Solar flares or Coronal Mass Ejections (CMEs), both linked to reconfiguration of solar magnetic field. The CMEs, responsible for the greater disturbances, are event driven phenomena, with occasional high fluxes over short periods. Solar particle species include protons, some ions, electrons, neutrons, gamma rays, X-rays, but the dominant contribution to TID and TNID comes from the protons.
The total mission fluences computed for the mission (worst case transfer to Neptune: 13 year transfer and 2 years at the destination planet) are based on the probabilistic ESP model (RD[7]),prescribed by ECSS standards (RD[67]), with 11 years of Solar maximum and 90% Confidence Level (CL).
Flux scaling could be applied in principle to the SPE fluences to take account of the varying Helio-radial distance along the mission trajectory. However, given the statistical nature of the SPE occurrence and the significant uncertainties in the flux variation, the conservative approach is adopted of computing the total particle fluence at 1 AU.
The TID calculations are based on SHIELDOSE-2 (RD[76]) (solid-sphere geometry case).
Margin: The fluence estimates from ESP are based on a Confidence Level-based risk approach; therefore, no extra margin is required to cover the stochastic nature of the Solar event phenomena. Potential systematic uncertainties in the ESP model are being analysed in ongoing ESA-led projects and are addressed in new related model developments (e.g. SAPPHIRE, RD[66]) but are not taken into account in this study.
35.2.2 Radioisotope Thermoelectric Generators (eMMRTGs)
The eMMRTGs create an additional local artificial radiation environment, during the entire mission (13 year transfer and 2 years at the destination planet). The radioactive decay chain in the RTGs pellets induces emission of neutrons and high energy gamma rays, which can easily traverse the structures of the RTG and of the rest of the spacecraft, and reach sensitive devices of platform and payload.
The resulting continuous, low intensity flux of neutrons and gammas contribute respectively to TNID and TID, and potentially SEEs. Estimates in this study for TID and TNID (expressed in equivalent 1 MeV neutron fluence) are based on dose maps from NASA Ice Giants report RD[64], reported in Figure 35-1.
Based on example spacecraft configurations in the NASA report, such as the one reported in Figure 35-2, it is here conservatively assumed that sensitive electronic devices are at 1m distance from the 1st RTG, at 1.5m distance from the 2nd RTG, and that other RTGs are more distant and can therefore be neglected. RTG particle emission decrease during the mission duration is neglected, and no reduction in TID or TNID

Ice Giants CDF Study Report: CDF-187(C)
January 2019 page 331 of 431
ESA UNCLASSIFIED – Releasable to the Public
levels is assumed from the spacecraft structures due to shielding. The resulting dose levels for the total 15 year duration of the mission are reported in Table 35-2. It is assumed that the eMMRTGs are well characterised and no additional margin factor is included in this study for the dose levels.
Figure 35-1: TID and TNID (expressed in equivalent 1 MeV neutron fluence) dose maps from NASA Ice Giants report ([])
Figure 35-2: Example configuration from the NASA Ice Giants report
(RD[64])
Distance gamma neutron
TID (TNID) eq fluence
[m] [krad] [1MeVn/cm2]
0.5 12.0 9E+11
1.0 3.8 2E+11
1.5 1.4 1E+11
2.0 0.8 5E+10
Table 35-2: TID and TNID dose levels induced by the RTGs for the entire
mission duration
35.2.3 Jovian Trapped Energetic Particle Environment
The Jupiter magnetic field traps electrons, protons, and heavier ions in Van Allen belts around the planet. The intensity of the field and size of the magnetosphere allow for trapped electrons with energies probably in excess of 100 MeV, significantly higher than

Ice Giants CDF Study Report: CDF-187(C)
January 2019 page 332 of 431
ESA UNCLASSIFIED – Releasable to the Public
those observed in the Earth trapped environment, where typical electron energies are lower than 10 MeV. Jupiter rotational period of 9 h 56 min makes plasma torus and radiation belts wobble due to a 7° tilt between Jupiter rotational and magnetic axes.
Several models have been developed at JPL in the past decades to describe the Jovian trapped particle environment, starting with the Divine&Garrett model (1983, RD[68]), and continuing with its updates: GIRE (2003, RD[69] RD[70]), and GIRE2 (2012, RD[71]).
The predictions in this study are based on the JOSE model RD[72], developed in the context of the ESA-led JORE²M² project, in preparation for the ESA JUICE mission, and used for the mission design. Close to Jupiter, for a magnetic shell parameter L<9.5, JOSE internally makes use of the ONERA Salammbo model (RD[73]). For distances from Jupiter beyond the extension of JOSE, the Interplanetary Electron Model (IEM, RD[74]) is used. All calculations are performed with the models as available in the SPENVIS system.
The calculations for both the Neptune and the Uranus case are based on the detailed trajectories produced by the ESA/ESOC Mission Analysis team.
The Neptune Jupiter segment follows a hyperbolic trajectory with 875,000 km minimum altitude. The trajectory is near-equatorial (see Figure 35-3 left), and therefore encounters the more intense regions of the radiation environment, although at relatively big distance from the planet. Although the full trajectory segment lasts 120 days, the spacecraft is expected to traverse the most intense radiation regions in just a few days.
The Uranus case is rather different from the Neptune one: the flyby has a closest approach altitude of just 10,000 km. In a near-equatorial case, this would bring the spacecraft through the extreme intensities of the core of the Jupiter trapped electron belt. Instead, the trajectory has a very high inclination (see Figure 35-3 right), allowing for a significant reduction in dose levels.
Figure 35-3: Graphical representation of the Jupiter flyby mission segment for the Neptune case (left) and the Uranus case (right)
The TID calculations are based on the SHIELDOSE-2Q RD[75] code (an extension of SHIELDOSE-2 RD[76]) for the solid-sphere geometry case.
There are significant uncertainties in the estimates of Jupiter trapped energetic electrons flux levels. These uncertainties have two aspects:
Systematics may affect the models due to both the limited dataset upon which the prediction models are based, and to errors in the measurements themselves (for

Ice Giants CDF Study Report: CDF-187(C)
January 2019 page 333 of 431
ESA UNCLASSIFIED – Releasable to the Public
example signal saturation, as visible in the EPD data in the left plot of Figure 35-4, as analysed by Evans in RD[77]).
Significant variations in the particle flux time series have been observed in the available dataset for the same region in the Jovian system. See for example the wide variations in the scattered data in the EPD data plots in Figure 35-4 for both the lower energies (left) and the higher ones (right). Predictions of averages over long periods are less affected by the short-term variations, than those over short duration trajectories such as in the case of a single flyby.
Figure 35-4: Galileo EPD DC2(>2MeV) and DC3 (>11 MeV) data as analysed by Evans (RD[77])
In order to take account of these aspects, the environment margin strategy adopted for the ESA JUICE mission includes:
A factor x2 to be applied to long term average electron fluences (for TID, TNID)
A factor x4 to be applied to the worst case fluxes (e.g. for instrument background or short term SEE analyses).
The approach for the Ice Giants study flybys needs reconsideration of the margin policy to take account of important differences with respect to the JUICE mission.
For the Neptune case:
The flybys have a much shorter time-scale than the total JUICE trajectory segment in the Jovian system. Therefore, the full range of flux oscillation needs to be considered
Available Galileo data suggest bigger electron flux variations in time at distance from Jupiter larger than Europa or Ganymede orbits.
As a result, the margin that has been applied to the TID predictions for the Jupiter flyby for the Neptune case is a factor 5x.
For the Uranus case:
Available data seem to indicate that flux variations closer to Jupiter (e.g. at Europa distance, or at 10k km altitude) are probably smaller than at the Jovian distances typical of the JUICE mission (e.g. Ganymede ~15 RJ). The trapped population appears more stable at low altitudes.

Ice Giants CDF Study Report: CDF-187(C)
January 2019 page 334 of 431
ESA UNCLASSIFIED – Releasable to the Public
At lower Jupiter altitudes, the Galileo EPD dataset, which is the main source of data for all models, show a suspected data saturation (see e.g. the DC2 channel for E>2MeV)
For the trajectory segments inside the Europa orbit, modelling heavily depends on the original Salammbo Jupiter physical model, whose validation is very challenging, giving the limited dataset, implying potential significant model systematics. The 2018 update of this model (RD[77]) could not be used for the study.
As a result, the margin that has been applied to the TID predictions for the Jupiter flyby for the Uranus case is a factor 3x.
35.2.4 Local Planetary Trapped Radiation
Both Neptune and Uranus have a global magnetic field that keep particles trapped in Van Allen belts. There is no standard model for trapped radiation at the two planets, and the development of European models would enable raising the confidence in the dose and flux level predictions. Extremely limited measurement datasets for model construction and validation should also be augmented with new in-situ data by flying radiation monitors on board orbiters at both planets.
35.2.4.1 Neptune
Mechanisms for trapping, acceleration, losses for electrons and protons in the Neptune belt are not very well known. The highly tilted magnetic field with respect to the planet rotation axis is believed to induce a complex interaction with heliosphere.
Significant uncertainties are associated to Neptune trapped energetic electrons and proton flux levels due to the lack of a comprehensive model for trapped radiation. A recent effort by JPL led to the creation of the Neptune Radiation Model (NMOD, RD[79]), covering electrons and protons between 0.025 MeV and 5 MeV based on the California Institute of Technology’s Cosmic Ray Subsystem and the Applied Physics Laboratory’s Low Energy Charged Particle Detector from the Voyager 2 Neptune flyby of 1986.
The JPL NMOD model is not available for use at ESA, although there has been some exchange of information with JPL and the model development report is available. Earlier publications and the NMOD report allow us to predict in general lower energies, lower fluxes for Neptune orbiter than in typical Earth orbits.
The estimates of radiation exposure at the planet are based on the conservative assumptions of:
a 2y long Neptune phase consisting of 10d duration orbits, with 1 day of exposure per orbit, leading to a 0.2 year exposure
a fixed dose rate of 2E-04 rad/s behind 100 mil (~2.5mm) of aluminium shielding (maximum from Section 10 of the NMOD report).
The proposed uncertainty margin to be applied to the TID levels is a factor x5, justified by the limited validation and the limited energy coverage of the model, only including the lower energy range.

Ice Giants CDF Study Report: CDF-187(C)
January 2019 page 335 of 431
ESA UNCLASSIFIED – Releasable to the Public
Related proposals from this study, aimed at overcoming these limitations, include:
Initiation of R&D for development of European models for radiation/ plasma/ dust at Neptune
Embarkation on the Neptune orbiter of a low mass, low power radiation monitor extending to species and energies relevant for dose and SEE predictions.
35.2.4.2 Uranus
As for the Neptune case, also the Uranus trapped environment is heavily affected by its interaction with the heliosphere, due to the large tilt (of about 58 degrees) between its magnetic and rotation axes.
Significant uncertainties affect our knowledge of the trapped electrons and proton flux levels. The Voyager 2 flyby data is currently the only in-situ measurement dataset for model development and validation. A first radiation model had been developed for electrons in the range 0.7 – 2.5 MeV by Selesnick and Stone (1991, RD[80]) based on Voyager 2 data from the Cosmic Ray Subsystem TET electron telescope. The JPL Uranian Radiation Model (UMOD, RD[81]) extends the electron range down to 0.022 MeV, and additionally includes protons in the range 0.028 - 3.5 MeV, by using data taken during the Voyager 2 flyby by the APL Low Energy Charged Particle detector (LECP). These models are not available at ESA for calculations for this study, and no ESA model has been developed yet in preparation for missions to Uranus.
In terms of spectra the Uranus trapped environment is assumed to be qualitatively similar to the Earth one, although maybe lower in intensity. The particle higher energy ranges, of relevance for radiation analyses, i.e. allowing for sufficient penetration through the spacecraft structures, are not included in the aforementioned JPL model, in particular for protons. However, there is indication that TID levels for orbits in the Uranus Van Allen belts cannot be neglected. An analysis by Mauk et al. (2010, RD[82]) comparing the trapped planetary environments, suggests that electrons at Uranus may have an energy spectrum similar to the Earth trapped one. A plot from RD[82] is reported in Figure 35-5, including high intensity spectra for Jupiter, Neptune, Uranus and Earth.
Figure 35-5: Planetary trapped radiation levels at most intense location, from Mauk’s 2010 paper (RD[82])
The estimates of radiation exposure at the planet are based on the assumptions of:
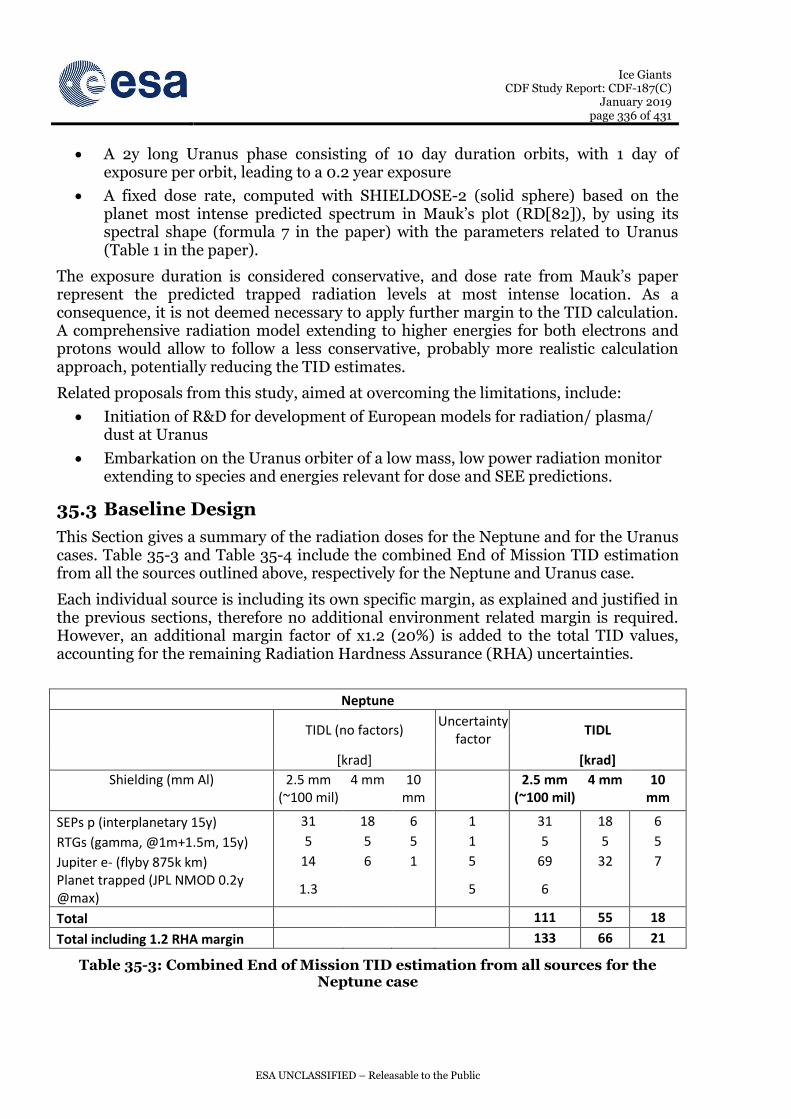
Ice Giants CDF Study Report: CDF-187(C)
January 2019 page 336 of 431
ESA UNCLASSIFIED – Releasable to the Public
A 2y long Uranus phase consisting of 10 day duration orbits, with 1 day of exposure per orbit, leading to a 0.2 year exposure
A fixed dose rate, computed with SHIELDOSE-2 (solid sphere) based on the planet most intense predicted spectrum in Mauk’s plot (RD[82]), by using its spectral shape (formula 7 in the paper) with the parameters related to Uranus (Table 1 in the paper).
The exposure duration is considered conservative, and dose rate from Mauk’s paper represent the predicted trapped radiation levels at most intense location. As a consequence, it is not deemed necessary to apply further margin to the TID calculation. A comprehensive radiation model extending to higher energies for both electrons and protons would allow to follow a less conservative, probably more realistic calculation approach, potentially reducing the TID estimates.
Related proposals from this study, aimed at overcoming the limitations, include:
Initiation of R&D for development of European models for radiation/ plasma/ dust at Uranus
Embarkation on the Uranus orbiter of a low mass, low power radiation monitor extending to species and energies relevant for dose and SEE predictions.
35.3 Baseline Design
This Section gives a summary of the radiation doses for the Neptune and for the Uranus cases. Table 35-3 and Table 35-4 include the combined End of Mission TID estimation from all the sources outlined above, respectively for the Neptune and Uranus case.
Each individual source is including its own specific margin, as explained and justified in the previous sections, therefore no additional environment related margin is required. However, an additional margin factor of x1.2 (20%) is added to the total TID values, accounting for the remaining Radiation Hardness Assurance (RHA) uncertainties.
Neptune
TIDL (no factors)
Uncertainty factor
TIDL
[krad]
[krad]
Shielding (mm Al) 2.5 mm (~100 mil)
4 mm 10 mm
2.5 mm (~100 mil)
4 mm 10 mm
SEPs p (interplanetary 15y) 31 18 6 1 31 18 6
RTGs (gamma, @1m+1.5m, 15y) 5 5 5 1 5 5 5
Jupiter e- (flyby 875k km) 14 6 1 5 69 32 7
Planet trapped (JPL NMOD 0.2y @max)
1.3
5 6
Total 111 55 18
Total including 1.2 RHA margin 133 66 21
Table 35-3: Combined End of Mission TID estimation from all sources for the Neptune case

Ice Giants CDF Study Report: CDF-187(C)
January 2019 page 337 of 431
ESA UNCLASSIFIED – Releasable to the Public
Uranus
TIDL (no factors)
Uncertainty factor
TIDL
[krad] [krad]
Shielding (mm Al) 2.5 mm (~100 mil)
4 mm 10 mm 2.5 mm (~100 mil)
4 mm 10 mm
Interplanetary transit 31 18 6 1 31 18 6
RTGs (gamma, @1m+2m, 15y) 5 5 5 1 5 5 5
Jupiter flyby detailed trajectory 17 12 7 3 51 36 21
Planet trapped (Mauk WC spectra 0.2y) 855 70 2 1 855 70 2
Total
942 129 33
Total including 1.2 RHA margin
1130 155 40
Table 35-4: Combined End of Mission TID estimation from all sources for the Uranus case
A 4 mm Al shielding thickness is a reasonable, easily achievable level of protection (including S/C, Unit, board elements) without excessive additional shielding structures. As a consequence, the reference TID levels resulting from these analyses are 66 krad for the Neptune case, and 155 krad for the Uranus case (including margins).
As a side note, had Jupiter flyby at 10k km minimum distance been near-equatorial (as for the Neptune case), the TID predicted by the JOSE model for the Jupiter flyby alone would be 366 krad(Si) behind 4 mm Al (incl. x3 margin).
At the beginning of the CDF Study the radiation analysis run on preliminary trajectories (referred to as “Original Analysis” in the Uranus System Chapter) produced worse results. A sensitivity analysis highlighting the shielding mass penalty, and delta qualification required by sensitive electronic equipment, implied by the most severe radiation environment is reported in the System chapter.
Uranus
TIDL (no factors) Uncertainty
factor TIDL [krad] [krad]
Shielding (Al) 2.5 mm
(~100mil) 4 mm 10 mm
2.5 mm
(~100mil) 4
mm 10mm
Interplanetary transit 31 18 6 1 31 18 6 RTGs (gamma, @1m+2m,
15y) 5 5 5 1 5 5 5 Jupiter flyby 10k km 221 122 42 3 662 366 125 Planet trapped (JPL UMOD) Planet trapped (Mauk WC
spectra 0.2y/20)* 42.8 3.5 0.1 10 428 35 1 Planet trapped (Earth 2y/5) 7 2 0 10 71 19 1
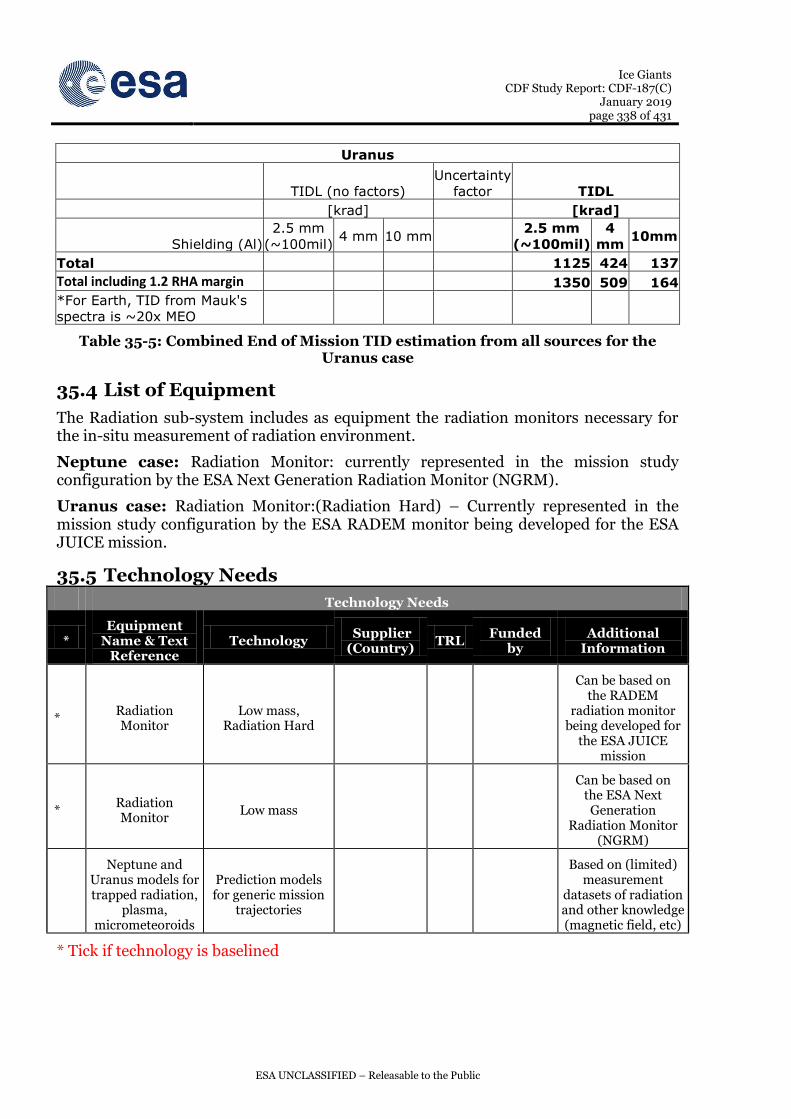
Ice Giants CDF Study Report: CDF-187(C)
January 2019 page 338 of 431
ESA UNCLASSIFIED – Releasable to the Public
Uranus
TIDL (no factors) Uncertainty
factor TIDL [krad] [krad]
Shielding (Al) 2.5 mm
(~100mil) 4 mm 10 mm
2.5 mm
(~100mil) 4
mm 10mm
Total 1125 424 137 Total including 1.2 RHA margin 1350 509 164
*For Earth, TID from Mauk's
spectra is ~20x MEO
Table 35-5: Combined End of Mission TID estimation from all sources for the Uranus case
35.4 List of Equipment
The Radiation sub-system includes as equipment the radiation monitors necessary for the in-situ measurement of radiation environment.
Neptune case: Radiation Monitor: currently represented in the mission study configuration by the ESA Next Generation Radiation Monitor (NGRM).
Uranus case: Radiation Monitor:(Radiation Hard) – Currently represented in the mission study configuration by the ESA RADEM monitor being developed for the ESA JUICE mission.
35.5 Technology Needs
|~T Technology Needs
* Equipment
Name & Text Reference
Technology Supplier (Country)
TRL Funded
by Additional
Information
* Radiation Monitor
Low mass, Radiation Hard
Can be based on the RADEM
radiation monitor being developed for
the ESA JUICE mission
* Radiation Monitor
Low mass
Can be based on the ESA Next Generation
Radiation Monitor (NGRM)
Neptune and Uranus models for trapped radiation,
plasma, micrometeoroids
Prediction models for generic mission
trajectories
Based on (limited) measurement
datasets of radiation and other knowledge (magnetic field, etc)
* Tick if technology is baselined

Ice Giants CDF Study Report: CDF-187(C)
January 2019 page 339 of 431
ESA UNCLASSIFIED – Releasable to the Public
36 GROUND SEGMENT AND OPERATIONS
36.1 Requirements and Design Drivers
The following lessons learned from the Rosetta mission are recommended to be included as mission requirements for the Ice Giants mission:
SubSystem Requirements
Req. ID Statement Parent ID
GS-010 Margins for propellant budget allocated for stochastic navigation shall be retained for in flight use.
RD[91] ID-01
GS-020 Landers shall not be treated as payloads/scientific instruments. ESA to be involved in the design and in the operations of the lander type missions.
RD[91] ID-02
GS-030 The dependency on scientific instruments and products for operational purposes shall be minimised.
RD[91] ID-03
GS-040
The spacecraft design (spacecraft and operations) shall be such that it is possible to recover all TM stored during cruise phases. There shall be the capability to recover additional TM ad hoc, e.g. when an anomaly occurs.
RD[91] ID-06
GS-050 For missions having to use optical navigation and dynamic trajectory planning, the processes of navigation, trajectory and attitude planning shall be done by the same entity.
RD[91] ID-07
GS-060 OBCPs shall be available to the mission. ESA shall be involved in early phases of the OBCP specification, development and testing.
RD[91] ID-10
The main design drivers for ground segment and operations identified during the CDF study are:
NASA <– >ESA Project. NASA leading with ESA partnering. Mission is developed by NASA with ESA proposing and implementing their contribution upon agreements. Possible contributions are either a Neptune Orbiter or Uranus Orbiter launched on a dual launch together with a NASA orbiter. Or a Probe carried by a NASA orbiter to either Neptune or Uranus.
Orbiter and Probe designs depend on use of RHUs and RTGs
Orbiter concepts address multiple options driving definition of different transfer and target arrival operational baselines.
The probe lifetime is for a direct entry descent in Earth visibility of 90 minutes, with HK and science TM data transferred to the NASA carrier which serves as the relay to Earth.

Ice Giants CDF Study Report: CDF-187(C)
January 2019 page 340 of 431
ESA UNCLASSIFIED – Releasable to the Public
36.2 Assumptions and Trade-Offs
36.2.1 Assumptions Assumptions
1 The Ice Giants part of the mission is conducted by ESA, reliant on ESA ESOC/ESAC infrastructure.
2
The ground segment and operations infrastructure for the Mission Operations Centre (MOC), of the Ice Giants mission (Orbiter or Probe) will be set up by ESA ESOC, and will be based on an extension of the ESOC ground segment infrastructure customised to meet the mission specific requirements.
3 The Ice Giants mission (Orbiter or Probe) will be operated from the MOC at ESA ESOC, by the Flight Control Team that forms part of the Solar System & Exploration Missions Division under OPS-OP.
4
MOC is responsible for:
Mission operations planning
Spacecraft operations, monitoring and control
Instrument operations execution
Mission data distribution and HKTM archiving.
5
For an obiter scenario, the science data will be received, processed and stored in the Science Operations Centre (SOC). There is no processing of science Telemetry required at ESOC.
For a probe scenario the SOC will be co-located with MOC to optimise operations execution.
6
It is assumed that the SOC as part of the overall science ground segment is responsible for:
Coordinating the Science planning
Instrument command requests compilation
Providing guidelines to the instrument teams with respect to Science data processing
Archiving and long term storage of instrument data and spacecraft auxiliary data.
7
The Ground Station baseline assumes ESTRACK Ground Station network is used for the communications with the satellite.
In the scenario where DSN Ground Station support is provided, operational interfaces to NASA DSN network for Ice Giants will be established.
8 X/X Ka frequencies. Communications with ground shall use X-band for TT&C at 7.2 GHz uplink, 8.4 GHz downlink and Ka Band for Science data downlink at 32GHz.
9 X Band Ranging and Doppler used for Orbit Determination. Ka doppler used during routine operational phase. Delta DOR capability used for planetary arrival. Use of navigation cameras for optical navigation.
10 All data required for the assessment of the correct functioning and performance of the spacecraft and payload are included in housekeeping data available to ESOC.
11 During interplanetary transfer, pre-separation from the Stack, all operations/ checkouts are executed via the NASA provided communications link routed through the NASA orbiter.

Ice Giants CDF Study Report: CDF-187(C)
January 2019 page 341 of 431
ESA UNCLASSIFIED – Releasable to the Public
Assumptions
Options for direct communications to the ESA orbiter in the stacked configuration using the Ice Giants comms is considered.
12
After separation from the stack, ESTRACK 35m ground station passes will be routinely scheduled for communications to support nominal spacecraft monitoring control and science data dumps with the Orbiter during the commissioning, interplanetary check outs and operational phases.
During critical interplanetary phases multiple ground stations will be scheduled to ensure back-up availability.
13 Routine operations are strictly preplanned using automated on-board timelines.
14 The Ice Giants spacecraft TT&C services are compliant with the applicable and, appropriately tailored standards: ECSS (PUS-C and Operability Standard), CCSDS Standards RD[83] to RD[87]
15 The OBC Mass Memory shall be compliant to PUS-C and support file based operations, storing data in separate files as specified in RD[83].
16 The exchange of files between space and ground shall follow the CCSDS File Delivery Protocol (CFDP) as specified in RD[84].
36.2.2 Ground Segment and Operational Characteristics
With respect to the ground segment and operations the Ice Giants mission has the following major characteristics impacting ground segment and operations:
Figure 36-1: Mission Scenario

Ice Giants CDF Study Report: CDF-187(C)
January 2019 page 342 of 431
ESA UNCLASSIFIED – Releasable to the Public
36.2.2.1 NASA Operational activity
The ESA contribution, Orbiter or Probe, will be launched under NASA responsibility with the Orbiter in a dual launch stack configuration or the Probe attached as a passenger to the NASA Orbiter.
Shortly after launch, the mission begins its checkout processes and deployment of all flight systems. During the first four weeks of cruise, continuous DSN coverage is provided for thorough characterisation of all flight systems and for accommodating the variable commanding schedules typical of early checkout operations. Once checkout is complete, the post-launch phase configures the spacecraft to low thrust SEP navigation and the DSN coverage is reduced to only 1 pass per week.
ESA Orbiter
The dual stack configuration is maintained up to Jupiter approach where the ESA Orbiter continues to be supported and under trajectory control by NASA. Prior to reaching Jupiter the ESA Orbiter prepares for operations and separation from the stack. This critical phase of the mission will be supported by both daily DSN and ESA ESTRACK coverage for commanding and tracking for 2 weeks approaching the event. Continuous ground station and FCT coverage is required during the days surrounding the separation and subsequent Ice Giants orbiter Jupiter gravity assist and manoeuvring. Independent operations then commence with ESA controlling their Ice Giants orbiter.
ESA Probe contribution
The ESA probe is operated as a passenger on the NASA stack with minimal periodic check out operations.
Starting from 9 months until Probe Entry, DSN coverage increases to daily tracks in preparation for the Probe release. During the approach phase and probe entry the HGA is continuously Earth-pointed to provide flexibility in DSN scheduling to ensure maximum science data return during this period.
36.2.2.2 Orbiter Operational considerations
Mission Timeline: Neptune Orbiter
Activity Duration
Dual Launch SLS Depart Earth 13/2/2031
Interplanetary transfer ~ 1 year 10 months
Fly by phase (after separation from stack)
Fly by Jupiter 24/12/2032 @ 857000km
Cruise phase ~11.5 years
Orbit insertion NOI Arrive Neptune 1/9/2044
Science Phase
2 years.
Orbital period ~180 days.
Target orbit period of 50days.
Disposal Phase To be defined

Ice Giants CDF Study Report: CDF-187(C)
January 2019 page 343 of 431
ESA UNCLASSIFIED – Releasable to the Public
Figure 36-2: Neptune Orbiter Mission Profile
Mission Timeline: Uranus Orbiter
Activity Duration
Dual Launch SLS Depart Earth 13/2/2031
Interplanetary transfer ~ 1 year 10 months
Fly by phase (after separation from stack)
Fly by Jupiter 24/12/2032 @ 10000km
Cruise phase ~9 years 4 months
Orbit insertion UOI Arrive Uranus 6/4/2042
Science Phase
2 years
Orbit period of 104.5 Earth days. Target orbit period of 37.8 days.
4 years
Orbit period of 150 Earth days. Target orbit period of 50 days.
Disposal Phase To be defined
During the stacked cruise phase there is no power interface to the NASA orbiter. The Ice Giants orbiter provides all its own power. A SpaceWire interface to the NASA orbiter allows for the TM/TC data interface to Earth. This interface supports all TM/TC traffic covering post launch checkout requirements and the periodic health checks while in the stacked configuration. Outside of these check out periods the ESA orbiter is in a low power, sleep mode.
Post stack separation, X-Band is used for TT&C and Ka band used for the Science downlink. Data rates achievable are 42kbps at Neptune for the 0.48 Gb/day of science and 94 kbps at Uranus for the 1.09 Gb/day of science. Usage is made of 3m HGA for X and Ka band and two LGAs for X-Band.

Ice Giants CDF Study Report: CDF-187(C)
January 2019 page 344 of 431
ESA UNCLASSIFIED – Releasable to the Public
Figure 36-3: Uranus Orbiter Mission Profile
Figure 36-4: Neptune Science orbit timeline
36.2.2.3 Probe
Mission Timeline: Neptune/Uranus Probe
Activity Duration
Launch Depart Earth 13/2/2031
Transfer 11.5 years for Uranus
13.5 years for Neptune
Release Deploy and checkout
Transfer to Entry interface point EIP 20 days
Entry Initial altitude 600km

Ice Giants CDF Study Report: CDF-187(C)
January 2019 page 345 of 431
ESA UNCLASSIFIED – Releasable to the Public
Mission Timeline: Neptune/Uranus Probe Activity Duration
Science Phase 90 minutes
Disposal Phase Final pressure: 10 bar.
Figure 36-5: Probe Orbit insertion
Upon Probe release the Probe uses its own power system and timer switches to activate the pre-planned automatic sequences. No telecommanding capability is assumed after release. UHF is assumed for communications with minimum TM rate of 2kbps. The maximum distance of probe to relay orbiter is 40000km.
36.3 Rosetta Lessons Learned applicable to Ice Giants operations
Below are extracts from the Rosetta mission lessons learned which are considered applicable to the Ground segment and operations approach for an Ice Giants type mission. For the full set of Rosetta lessons learned see RD[91].
36.3.1 Ground Segment Incremental Development Approach
Incremental development of operations concepts and ground segment over the long cruise phases.
For missions with long cruise phases, as is the case for the Ice Giants mission, the following points should be applied to the development approach of the Ice Giant ground segment.
Plan for an incremental development of operations concepts and ground segment; opportunity to develop operational concepts and ground systems once knowledge of the “mission system” is accrued in flight. MOC readiness for launch. Deferred SOC development.

Ice Giants CDF Study Report: CDF-187(C)
January 2019 page 346 of 431
ESA UNCLASSIFIED – Releasable to the Public
Plan for proficiency training of new teams on already developed elements and allow this to become opportunities to improve the system.
Manage obsolescence of systems with care; thorough trade-offs, only if really beneficial and unavoidable.
Actively maintain knowledge and awareness of major mission limitations, risks, and unknowns such that expectations are properly managed.
36.3.2 Team Evolution
Adopt an active strategy for planning of team evolution and knowledge preservation to cover long cruise phase.
Missions with extremely long duration from launch to the main operations phase pose a significant challenge in terms of knowledge and team evolution planning. Both aspects can be tackled with a pro-active approach involving recruitment of team members with long availability, who are then prepared for additional roles applicable to later mission phases. This addresses the preservation of knowledge and build-up of the expertise required for such a long term mission.
A similar approach should be adopted for the Ice Giants mission applying this active strategy for team evolution planning in the recruitment process and career evolution planning.
36.3.3 Operations Planning for Long Cruise Phases
Operations planning for long cruise phases to consider adopting Active and Passive cruise phases and associated related activity levels.
Non-contact periods for “passive” cruise should be in the order of 7-14 days; anything above/below is likely to cause major impacts on the spacecraft or the ground segment design.
Active cruise phases shall allow for unplanned activities, i.e. passive cruise phase should remain unaffected.
During periods of low frequency contacts, passes are best placed in the middle of a working week.
Adequate and dedicated planning tools and processes shall be put in place from the start of the mission. (e.g. planning concept, rules, commanding interfaces, operations grouping/sub scheduling, etc.)
36.3.4 Planning of Complex Mission Phases
Mission planning concepts, timelines, and tools shall be designed as simple as possible and reduced to their essential elements; simplicity is the key to guarantee the flexibility ensuring the possibility to add more elaborated features as needed.
As far as possible, flight and ground segment recurring events (e.g. manoeuvre, planning) should be synchronised with calendar cycles; this ensures an efficient utilisation of the mission control team.

Ice Giants CDF Study Report: CDF-187(C)
January 2019 page 347 of 431
ESA UNCLASSIFIED – Releasable to the Public
36.3.5 In-Flight Characterisation
Plan for in-flight power, thermal and disturbance torques characterisation phases with appropriate expert support/tools.
In flight problems can occur with inaccurate prediction of disturbance torques, power and thermal behaviour. Planning for in flight characterisation campaigns with an adequate support of expertise and correlation of tools allows for optimisation of the inflight, power, thermal and AOCS systems,
36.3.6 Availability of Engineering Model (EM)
Availability of the Orbiter or Probe Engineering Model (EM) hardware to Flight operations teams post LEOP with adequate documentation and training mitigates the need for long Phase E2 industrial support contracts.
36.4 Baseline Design
36.4.1 Ground Segment Overview
The ground segment will be set up according to baselines established for the Solar System & Exploration Missions as performed by ESA. The Ice Giants mission will be operated by the ESA Mission Operations Centre (MOC) located at ESOC in Darmstadt, Germany. The spacecraft operations, scientific instrument operations, flight dynamics and ground station activities will be performed from the Mission Operations Centre (MOC).
The planning of science operations and co-ordination of the scientific input will be the responsibility of PI teams via a Science Operations Centre (SOC) forming part of the Science Ground Segment (SGS). For the Probe, the SOC would be co-located with the MOC, for the Orbiter mission the SOC would be located at ESAC, near Madrid, Spain.
36.4.2 Ground Segment Development Approach
36.4.2.1 Orbiter
Reviewing lessons learned from Rosetta, as well as the approach taken for the JUICE mission ground segment development and operations, a staggered development approach would be established for the Ice Giants ground segment.
The MOC and SOC ground segment requirements would be established pre-launch. The MOC Ground Segment is required to support Mission Operations from Launch while the SOC Ground Segment has a deferred development due to the long interplanetary transfer periods.
MOC development would be split into a “Launch system”, linked to launch date, and would be based on Launch, LEOP and transfer operational requirements. This would cover all activities up until shortly before arrival at the target planet. The “Planetary System” MOC development would be linked to planetary orbit insertion date and based on the operational requirements to support planetary phase of mission, orbit insertion, maintenance and science operations execution.
The MOC “Planetary System” would be considered as an iteration of the ‘Launch System’ MOC ground segment. At the planetary arrival stage of the mission the

Ice Giants CDF Study Report: CDF-187(C)
January 2019 page 348 of 431
ESA UNCLASSIFIED – Releasable to the Public
operations concepts would have matured with in-flight experience and the subsequent development of the “Planetary System” benefits from the improved mission system knowledge.
The SOC system is developed to support science data processing, science mission planning and operations in the target planet orbit. The development schedule for the SOC is linked to planetary orbit insertion dates.
Example “Launch System” Ground Segment Development
Review name Relative to Launch System participants
Ground Segment Requirements Review L-4.5years MOC and SGS
Ground Segment Design Review L-3.5y MOC
Ground Segment Implementation Review L-1.5y MOC
Ground Segment Readiness Review feeding into Flight Readiness Review
L-4months MOC
Operations Readiness Meeting L-1m MOC
Example “Planetary System” Ground Segment Development
Review name Relative to Orbit Insertion System participants
Planet Operations Design Review OI-3years MOC and SGS
Planet Operations Implementation Review OI -20months MOC and SGS
Planet Operations Readiness Review OI -8m MOC and SGS
Planet Orbit Insertion Readiness Review OI -1m MOC
Moon Orbit Insertion Readiness Review Moon OI -1m MOC
Table 36-1: Example of Ground segment development timelines.
36.4.2.2 Probe
For the ground segment development of a Probe type mission the approach is simplified. For the MOC, a small MOC is developed to be ready at Launch to allow for pre-launch Probe checkout and testing. There would be minimal activity during the planetary transfer phase with occasional check out and testing of the Probe.
For the SOC, a small SOC co-located with MOC would be developed to allow for joint mission execution and science timelining. A delayed start of development of the SOC linked to planetary insertion would be adopted due to the long cruise phase.
36.4.3 Mission Operations
36.4.3.1 Orbiter
The MOC is heavily involved pre-launch for the development and support to Orbiter system validation testing, integration testing, readiness and preparation of MOC systems and Flight control teams to support launch. These MOC activities start ‘~Launch – 5.5 years’.

Ice Giants CDF Study Report: CDF-187(C)
January 2019 page 349 of 431
ESA UNCLASSIFIED – Releasable to the Public
During the Launch and LEOP the MOC executes pre-launch final checks on the orbiter and executes check out of subsystems performance post launch. The full launch systems Full Flight Control Team (FCT) is in place for these activities.
For the periods of interplanetary transfer as the passenger in the combined stack (~1 year 10 months), orbiter separation before reaching Jupiter and Jupiter flyby, there are periods of intense flight operations activities i.e. orbiter commissioning, stack separation, Jupiter flyby, interspersed with quieter transfer periods where only periodic health checks are executed. To support these activities varying levels of FCT support are scheduled over these periods.
Post Jupiter flyby during the ~11 year cruise phase to Neptune (9.3 years to Uranus), where only periodic health checks are carried out, minimal FCT support is planned for.
Planetary arrival operations preparation activities start at approximately ‘Orbit insertion-4 years’. The FCT is ramped up over this period as the MOC is developed for planetary phase of the mission and the science operations system are developed and finalised. The operational experience and orbiter familiarisation gathered during cruise phase is used to optimise the operations concepts used in the planetary phase.
36.4.3.2 Probe
Pre-launch activities in the MOC take place to support Probe system validation testing, integration testing, readiness and preparation for launch.
Probe mission operations during the cruise phase are minimal. Approximately six months prior to Probe release a period of intense preparation and validation activities is executed by both MOC and SOC collocated at the MOC. Final detailed mission preparation and system validation, takes place during Probe cruise period (20 days) post release from the orbiter.
Full operational support is provided from both MOC and SOC teams during Probe entry and descent period noting that the one way light time delay of 2.7 hrs for Uranus, and 4.3 hrs for Neptune is such that the Probe mission is completed by the time the TM data reaches Earth.
36.5 Ground Stations
The three ESTRACK 35m ground station sites Malargüe, New Norcia (NNO-1), and Cebreros are baselined to support the operational needs of the Ice Giants mission in X / X Ka. The upgraded cryogenic capability has been assumed to be available in all ground stations supporting Ice Giants in both X and Ka band feeds. This cryogenic capability improves the G/T assumed to be available at the different ground stations and has been used in the TT&C link budget calculations.
The Ka-band uplink frequency will be allocated to the Radio Science Ka-Band transponder with an uplink frequency in the 34200 – 34700 MHz frequency band. For the Radio Science experiments both X and Ka band uplinks would be available in parallel during nominal operations in orbit.
Varying ESA 35m ground station support requirements are evident during the early stages of the mission dependent on the planned activities. During stacked transfer

Ice Giants CDF Study Report: CDF-187(C)
January 2019 page 350 of 431
ESA UNCLASSIFIED – Releasable to the Public
phase all comms is via NASA orbiter capability. A possible ESA ground station contribution to Launch and LEOP could be considered during this stacked phase.
During routine science phases (~2 years) daily ground station passes are expected of ~ 3 to 4 hours per day. The data downlink duration is constrained by on board power availability rather than ground station visibility. The 35m ground station visibility snapshot (Neptune, Uranus from Earth) is shown in Figure 36-6. It can be seen from this plot that the ~ 3 to 4 hours coverage from a single ground station is easily met. NASA DSN contributions to ground station time can also be considered.
Figure 36-6: 35m Ground station visibility to Neptune(l) and Uranus (r)
36.5.1 Seasonal Solar Conjunctions
Solar conjunctions occur at both Neptune (every May for ~7 to 8 days) and Uranus (period of ~8 days in August shifting yearly) resulting in RF interruption. During these solar conjunction periods, i.e. within <3 deg of the Solar conjunction, no flight operations shall take place and the spacecraft shall be put into a safe configuration.
An additional operational constraint is that NO critical operations e.g. flyby, deep space manoeuvres, orbit insertion etc. occur within 5 deg of the Solar conjunctions. Activities need to be planned such that these conjunction periods are avoided.
36.5.2 Use of UHF Telescopes
It is proposed for support to the Probe mission that a large array (20) of geographically distributed Radio Telescopes is deployed on ground during the probe descent mission to deduce additional flight dynamics information. This would be done by locking onto the Probe carrier signal. The UHF Radio telescope arrays provide Probe ‘alive’ signal detection.
36.5.3 Enhanced Ground Station: Arrayed Antennas
Studies have been carried out to investigate the feasibility of improving the 35m ground station performance by the arraying of 35m antennas. Two studies have been carried out through OPS-GS. (RD[88], RD[89], RD[90])
The results of the studies show that the use of two antennas would give ~3dB improvement on data rate and use of further antennas would further increase the data rate performance.

Ice Giants CDF Study Report: CDF-187(C)
January 2019 page 351 of 431
ESA UNCLASSIFIED – Releasable to the Public
With Ka-Band there are constraints on the proximity between the terminals used to array, however these constraints could be respected in Malargüe where ESA has full control of the site.
Two possible implementations could be supported;
1. At MLG: Implement one additional 35m terminal in Malargüe, MLG-2, Rx only in X-Band and Ka-Band (with optional X-Band uplink), with the same performance as MLG-1. MLG-1 and MLG-2 can then be arrayed to support the Ka-Band and X-Band downlink.
2. At CEB: 1) Implement one additional 35m terminal in Cebreros, CEB-2, Rx only in X-
Band and Ka-Band (with optional X-Band uplink), with the same performance as CEB-1.
2) Establish a cooperation with NASA/JPL in Robledo, to array CEB-1 with one of the NASA 34m BWG antennas, which have similar performance as the cryo-feed enhanced CEB-1. Such arraying of ESA/NASA antennas would utilise the proposed NASA DSN contribution. If there is an issue linked to distance between NASA Robledo and CEB terminals, NASA/JPL could be requested to support from Robledo with a full NASA/JPL array configuration.
It is recommend to further analyse the application of arraying of large antennas (ESA and/or NASA DSN) for use by the Ice Giants mission.
Figure 36-7: Arrayed Malargüe two antenna example

Ice Giants CDF Study Report: CDF-187(C)
January 2019 page 352 of 431
ESA UNCLASSIFIED – Releasable to the Public
This Page Intentionally Blank
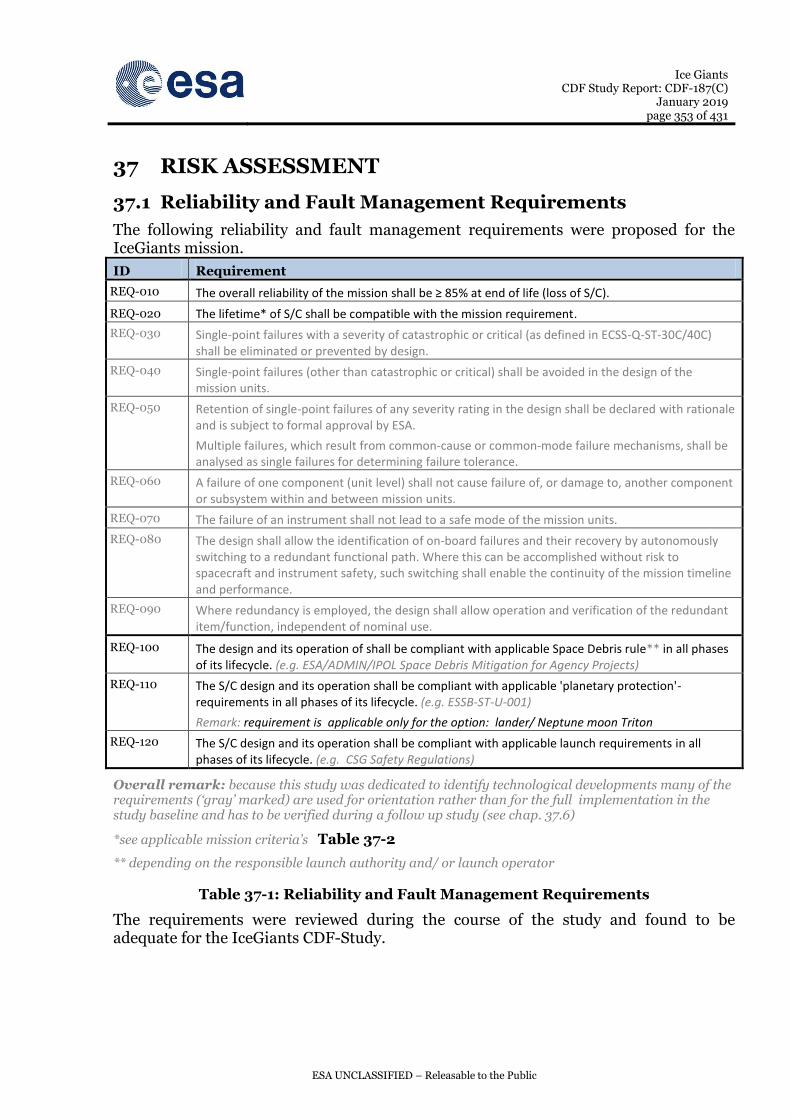
Ice Giants CDF Study Report: CDF-187(C)
January 2019 page 353 of 431
ESA UNCLASSIFIED – Releasable to the Public
37 RISK ASSESSMENT
37.1 Reliability and Fault Management Requirements
The following reliability and fault management requirements were proposed for the IceGiants mission.
ID Requirement
REQ-010 The overall reliability of the mission shall be ≥ 85% at end of life (loss of S/C).
REQ-020 The lifetime* of S/C shall be compatible with the mission requirement.
REQ-030 Single-point failures with a severity of catastrophic or critical (as defined in ECSS-Q-ST-30C/40C) shall be eliminated or prevented by design.
REQ-040 Single-point failures (other than catastrophic or critical) shall be avoided in the design of the mission units.
REQ-050 Retention of single-point failures of any severity rating in the design shall be declared with rationale and is subject to formal approval by ESA.
Multiple failures, which result from common‐cause or common‐mode failure mechanisms, shall be analysed as single failures for determining failure tolerance.
REQ-060 A failure of one component (unit level) shall not cause failure of, or damage to, another component or subsystem within and between mission units.
REQ-070 The failure of an instrument shall not lead to a safe mode of the mission units.
REQ-080 The design shall allow the identification of on-board failures and their recovery by autonomously switching to a redundant functional path. Where this can be accomplished without risk to spacecraft and instrument safety, such switching shall enable the continuity of the mission timeline and performance.
REQ-090 Where redundancy is employed, the design shall allow operation and verification of the redundant item/function, independent of nominal use.
REQ-100 The design and its operation of shall be compliant with applicable Space Debris rule** in all phases of its lifecycle. (e.g. ESA/ADMIN/IPOL Space Debris Mitigation for Agency Projects)
REQ-110 The S/C design and its operation shall be compliant with applicable 'planetary protection'-requirements in all phases of its lifecycle. (e.g. ESSB-ST-U-001)
Remark: requirement is applicable only for the option: lander/ Neptune moon Triton
REQ-120 The S/C design and its operation shall be compliant with applicable launch requirements in all phases of its lifecycle. (e.g. CSG Safety Regulations)
Overall remark: because this study was dedicated to identify technological developments many of the requirements (‘gray’ marked) are used for orientation rather than for the full implementation in the study baseline and has to be verified during a follow up study (see chap. 37.6)
*see applicable mission criteria’s Table 37-2
** depending on the responsible launch authority and/ or launch operator
Table 37-1: Reliability and Fault Management Requirements
The requirements were reviewed during the course of the study and found to be adequate for the IceGiants CDF-Study.

Ice Giants CDF Study Report: CDF-187(C)
January 2019 page 354 of 431
ESA UNCLASSIFIED – Releasable to the Public
37.2 Risk Management Process and Scope of Risk Assessment
Risk management is an organised, systematic decision making process that efficiently identifies, analyses, plans, tracks, controls, communicates, and documents risk in order to increase the likelihood of achieving the project/ study goals. The procedure comprises four fundamental steps:
Step 1: Definition of the risk management policy which includes the project success criteria, the severity & likelihood categorisations, and the actions to be taken on risks
Step 2: Identification and assessment of risks in terms of likelihood and severity
Step 3: Decision and action (risk acceptance or implementation of mitigating actions for the risk reduction)
Step 4: Monitoring, Communication and documentation and risk acceptance.
The Ice Giants CDF-Study is a pre-phase A feasibility assessment. It focused on the identification of technological developments necessary to make this mission feasible. Therefore the focus of the Risk assessment was on the first two steps whereby solely the severity of unwanted consequences were judged in step 2. The further steps are mentioned in this chapter for the completeness in terms of the overall Risk management process.
Figure 37-1: ECSS-M-ST-80C, 2008 Risk Management Process
The results of the 2 dedicated steps have to be seen as preliminary. The full documentation of the Risk assessment is pre-mature.
The basis for the preliminary risk assessment is the kick-off documentation/ presentation of the study. Changes in the kick-off baseline which are caused by identified risks were already seen as mitigation measures.
The scope of the preliminary risk assessment was clearly defined at the beginning and during the study. The risk assessment comprises all mission phases and mission elements whereby the focus was on the Neptune/ Uranus-probe followed by the
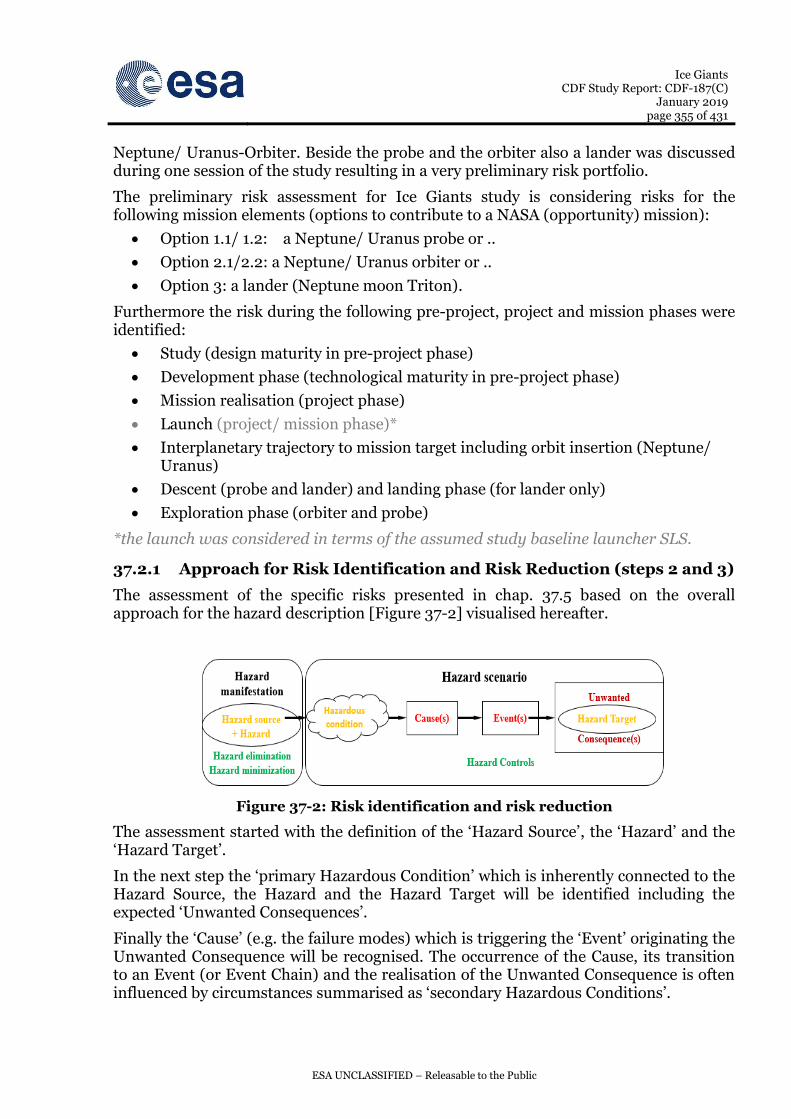
Ice Giants CDF Study Report: CDF-187(C)
January 2019 page 355 of 431
ESA UNCLASSIFIED – Releasable to the Public
Neptune/ Uranus-Orbiter. Beside the probe and the orbiter also a lander was discussed during one session of the study resulting in a very preliminary risk portfolio.
The preliminary risk assessment for Ice Giants study is considering risks for the following mission elements (options to contribute to a NASA (opportunity) mission):
Option 1.1/ 1.2: a Neptune/ Uranus probe or ..
Option 2.1/2.2: a Neptune/ Uranus orbiter or ..
Option 3: a lander (Neptune moon Triton).
Furthermore the risk during the following pre-project, project and mission phases were identified:
Study (design maturity in pre-project phase)
Development phase (technological maturity in pre-project phase)
Mission realisation (project phase)
Launch (project/ mission phase)*
Interplanetary trajectory to mission target including orbit insertion (Neptune/ Uranus)
Descent (probe and lander) and landing phase (for lander only)
Exploration phase (orbiter and probe)
*the launch was considered in terms of the assumed study baseline launcher SLS.
37.2.1 Approach for Risk Identification and Risk Reduction (steps 2 and 3)
The assessment of the specific risks presented in chap. 37.5 based on the overall approach for the hazard description [Figure 37-2] visualised hereafter.
Figure 37-2: Risk identification and risk reduction
The assessment started with the definition of the ‘Hazard Source’, the ‘Hazard’ and the ‘Hazard Target’.
In the next step the ‘primary Hazardous Condition’ which is inherently connected to the Hazard Source, the Hazard and the Hazard Target will be identified including the expected ‘Unwanted Consequences’.
Finally the ‘Cause’ (e.g. the failure modes) which is triggering the ‘Event’ originating the Unwanted Consequence will be recognised. The occurrence of the Cause, its transition to an Event (or Event Chain) and the realisation of the Unwanted Consequence is often influenced by circumstances summarised as ‘secondary Hazardous Conditions’.

Ice Giants CDF Study Report: CDF-187(C)
January 2019 page 356 of 431
ESA UNCLASSIFIED – Releasable to the Public
Based on this information the likelihood of the occurrence of the Unwanted Consequences can be judged as point estimate which applies in general to the ‘worst case’ Severity category.
In case the risk is not acceptable in terms of the used Risk Index (see chap. 37.3.3) Risk Reductions via Mitigation Measures has to be defined to bring the risk in an acceptable area of the Risk ranking. Such Mitigation measures like Hazard Elimination, Hazard Minimization and Hazard Controls are beyond the baseline. They have to be considered in a delta study or in the project/ mission phase.
An Initial Risk for one Hazard Target can be connected or lead to a new(^)/ additional(+) risks for another Hazard Targets as a consequence of its reduction e.g. the mitigation of Dependability risks (e.g. increase of the redundancy) can lead to an impact on other Hazard Targets like programmatic (e.g. possible overrun of the mass budget) and/or cost and/ or schedule. Such risk propagation is visualised in Figure 37-3 hereafter.
Figure 37-3: Risk propagation
The terms used in connection with the risk identification are defined as:
Hazard1 [H] Existing or potential property/ state2 of a Hazard Source that can result in a mishap for the Hazard Target
Hazard Source [HS]3 An item/ entity of the CDF study and/ or space mission
Hazard Target [HT] An item/ entity/ person which could get affected by the mishap like performance (science, services, ..)/safety (harm, damage)/ cost/ schedule (see chap. 37.3.1)
Hazardous Condition2
[HC] Hazardous conditions are levels/ borders capacities or situation/ circumstances which can initiate a 'Hazard scenario' and can be associated . * . with physical, chemical or biological capacity of a 'Hazard source' (primary condition [HCp]) – intrinsic property but also with the technology, design, manufacturing, organisation (secondary conditions [HCs]) – functional/ physical state
Hazard Manifestation The Hazard Source with its potential Hazards and Hazardous

Ice Giants CDF Study Report: CDF-187(C)
January 2019 page 357 of 431
ESA UNCLASSIFIED – Releasable to the Public
Conditions becomes part of the study baseline/ future mission
Hazard Scenario The combination of ‘Cause(s)’ and ‘Event(s)’, which results into a specific Unwanted Consequence
Cause [C] Root Cause which is the origin of a Hazard Scenario
(final) Event [E] Final physically event or status which is directly leading to the Unwanted Consequence under the given Hazardous Conditions
Event Chain Between the Cause and the Event several intermediate events might occur
Unwanted Condition [UC]
Is a/are potential result(s) of a Hazard Scenario which specified the negative effect for the Hazard TARGET[HT] in the frame of the CDF study the Unwanted Conditions has to be specified based on the Study/ Mission Success Criteria’s (see chap. 37.3.2)
Hazard Elimination4 The Hazard will be fully eliminated mostly by elimination of the Hazard Source
Hazard Minimisation4 The Unwanted Consequences (Severity category) will be downgraded mostly via changes in the primary Hazardous Condition
Hazard Control4, 5 Engineering or administrate measurements
Remarks:
1/3 Hazards are NOT events (neither accidents nor incidents) but potential threats to the Hazard Target;
2 Property or state which can be associated with the design, manufacturing, operation, organisation, application or environment, an intrinsic property of an item/ entity, e.g. instable isotopes/ radiation, Hardware/ sharp edges, - a functional/physical state of an item/ entity e.g. Medium/ high pressure in a vessel; Hardware/ high temperature of a surface, …
3 Prerequisite(s) for the occurrence of 'Hazard scenarios' with their negative effects ('Unwanted Consequences') on 'Hazard Target(s)
4 Basic strategies/ Mitigation Measures for the Risk Reduction
5 e.g. - Design selection (failure tolerance, ..) - Design to minimum risk (Safety margins/factors) - Automatic safety device, design to contain, - Warning device, crew escape/ safe haven, - Dedicated procedures, regulations, standard's, programmes, ...
However, because of the development-oriented focus of the study, risk mitigation measures were mostly discussed in terms of the identification of equipment/ material development.
37.3 Risk Management Policy
37.3.1 Hazard Targets
The CDF risk management policy for Ice Giants study aims at handling risks which may cause serious programmatic/ cost/ schedule***/ technological, performance (science return [or] services) **/ technical and protection* impact on the future project.
Because of the development-focused objectives of the study, safety aspects as defined hereafter were not assessed.

Ice Giants CDF Study Report: CDF-187(C)
January 2019 page 358 of 431
ESA UNCLASSIFIED – Releasable to the Public
* ‘Safety’ related to the human life and health has a higher priority and importance than ‘Safety’ related to property and environment. To have a clear split between both safety aspects in the report the term
‘safety’ is used exclusively for risks related to human life and health on ground and in space
‘protection’ is used exclusively for risks related to equipment (e.g. the S/C, the launcher), property (e.g. launch facility) and planetary environments (terrestrial, space and specific solar objects)
** ‘Performance’ is standing for e.g. ‘science’ incl. ‘technological tests’ or ‘services’ (e.g. telecommunication, navigation , cargo)
*** The Hazard Target ‘Schedule’ has two aspects:
cost related .. each delay might lead to a project extension, shift of launch preparation and the (c+sh) launch; what is usually linked to a cost increase; but this does not mean that the mission can not be performed at a later date/ launch opportunity from launch/launcher-viewpoint
mission related .. schedule-constraints like launch window or Earth-orbit escape window has to be (m+sh) considered depending from several mission conditions, like mission destination, Earth-orbit before escaping to e.g. the interplanetary trajectory and the trajectory itself.
37.3.2 Success Criteria
The success criteria with respect to the program, science, technical, safety/ protection safety, schedule, and cost objectives are presented in Table 37-2:
Risk Domain
(Hazard Targets)
Success Criteria
Programmatic STU1: preliminary feasibility study for several mission options dedicated to the Ice Giants Neptune and Uranus
MIS1: Contribution* to a NASA opportunity mission dedicated to observe one of the Ice Giants (Neptune+Triton/ Uranus)**
Remark:
*either an orbiter or a probe (Neptune/ Uranus) or an lander (Neptune moon Triton)
** either Neptune and its moon Triton or Uranus
Programmatic
(Cost)
PR-C1.a/b: Orbiter .. CaC for ESA < 550M€ (2016 EC) ->M Class Mission ..
PR-C1.b : Probe .. CaC for ESA < 550M€ (2016 EC) ->M Class Mission ..
PR-C1.1b : Lander .. CaC for ESA < 550M€ (2016 EC) ->M Class Mission ..
PR-C2: The mission design shall follow a “design-to-cost” for all its elements under ESA responsibility
PR-C3: The mission and system design should make use as far as practicable of technologies from suppliers from ESA Member or Cooperating States.
Remark: Use of equipment subject to US export control regulations shall be agreed on a case-by case basis with the Agency.
Programmatic
(Schedule)
PR-S1: All architecture elements are available and their FRR successful for the launch
(NLT 2029 ..34)
PR-S2: The contributions from international partners are available at the relevant
milestones of the development schedule
PR-S3: TRL >6 for all components at the time of mission adoption (est. 2022)
PR-S4: Low development risk during Phase B2/C/D * ISO scale 2016
PR-S5: Delivery to NASA app. 16 month before launch (mid Oct. 2029 with Launch in
February 2031)

Ice Giants CDF Study Report: CDF-187(C)
January 2019 page 359 of 431
ESA UNCLASSIFIED – Releasable to the Public
Risk Domain
(Hazard Targets)
Success Criteria
Performance (Science/ Services)
Technical
PER1.1a: Orbiter .. to transport a probe to Neptune or lander to Triton and orbiting/ monitor of Neptune PER1.2a: Orbiter .. to transport a probe to Uranus and orbiting of/ monitor Uranus PER1.b : Probe .. to enter and monitor Neptune or Uranus atmosphere PER1.1b: Lander .. to land on Neptune moon Triton
TEC1: The SC operates successfully over the designated mission lifetime of 4years**
TEC2: A reliability of >85% at the end of mission/ program [CDF Study requirement]
Design DES1: Baseline launcher SLS
Safety / Protection
SAF1: Catastrophic hazard (2 Failure/Error Tolerance), critical hazard
(1 Failure/Error Tolerance) incl. undesired incl. human performance (human related error/failure) [ECSS-Q-ST-40C]
SAF2: No SPF can lead to catastrophic hazards; No performance degradation owing to SPF, and no failure propagation. [ECSS-Q-ST-40C]
SAF3: Mission shall be compliant with applicable ‘Launch Requirements’ (e.g. CSG Safety Regulations) [ECSS-Q-ST-40C]
PRO: Mission shall be compliant with applicable ‘Planetary Protection Policies’ (e.g. ESSB-ST-U-001) [ESSB-ST-U-001]
PRT3: Mission shall be compliant with ESA policy for space debris mitigation ESA/ADMIN/IPOL(2014)2 [ECSS-U-AS-10C]
PRT3 criteria not discussed during study sessions -
Reference: Ice Giants NASA study 2017(JPL D-100520)/ / overall CDF study requirements/ ECSS-Q-ST-40C
Table 37-2: Success Criteria
37.3.3 Severity Categorisations
For the Ice Giants CDF-study a preliminary risks identification for all Hazard Targets like programmatic(pr) in terms of e.g. cost(c), schedule(sh), technological readiness (tr), performance(dp)*/ technical(dt) and safety(s)/ protection(p) was performed as described in chap. 37.2.
* ‘Performance’ is standing for e.g. ‘science’ incl. ‘technological tests’ or ‘services’ (e.g. telecommunication, navigation , cargo)
The severity of the risk scenarios are classified (based on the study baseline) according to their Hazard Target of impact. The consequential severity category of the risks scenarios is defined according to the worst case potential effect with respect to programmatic and science / performance objectives, technical and safety/ protection objectives, schedule objectives and/or cost objectives (see Table 37-3).
In addition, identified risks that may jeopardise and/or compromise the Ice Giants mission will be ranked in terms of severity of unwanted consequence (shortened as ‘severity of consequence’) for the study baseline.

Ice Giants CDF Study Report: CDF-187(C)
January 2019 page 360 of 431
ESA UNCLASSIFIED – Releasable to the Public
The scoring scheme with respect to the severity of consequence on a scale of 1 to 5 is established in Table 37-4, based on recommendations given for the risk assessment in ECSS-M-ST-80C.
Severity
Score
Dependability
Performance(Science return - dp) & Technical (Dependability – dt)
Safety & Protection (s/p)
Schedule (pr/ sh) incl. technological
readiness (pr/ tr)
Cost (pr/ c)
Catastro-phic
5
Performance: * Failure leading to the impossibility of fulfilling the mission's performance Technical: failure propagation: * from lower system level to highest system level * from mission to constellation/ campaign level * leading to loss of safety-related barriers
Safety: * Loss of life, life- threatening or permanently disabling injury or occupational illness; * Loss of an interfacing manned flight system Protection: * Loss of the system (e.g. S/C) * Severe detrimental environmental effects * Loss of launch site facilities.
Delay results in project cancellation
.... For the project the 'Schedule’ is also mission related because of the defined launch window ( ..??..
weeks) and escape windows (..??.. week)
defined by the mission destiny
Cost increase result in project cancellation
Critical
4
Performance: * Failure resulting in a major reduction (70- 90%) in overall performance according mission objective Technical: * Major damage to flight systems
Safety: * Temporarily disabling but not life- threatening injury, or temporary occupational illness; Protection: * Major detrimental environmental effects. * Major damage to or ground facilities. * Major damage to public or private property
Critical launch delay
(24-48 months)
Critical increase in estimated cost
(20 -50%)
Major
3
Performance: * Failure resulting in a major reduction (30- 70%) in overall performance Technical: * Major degradation of the flight system
Safety: * Minor injury, minor disability, minor occupational illness. Protection: * Minor system or environmental damage
Major launch delay
(6-24 months)
Major increase in estimated cost
(10 -20%)
Significant
2
Performance: * Failure resulting in a substantial reduction (10-30%) in overall performance Technical: * Minor degradation of system (e.g.: system is still able to control the consequences)
Safety: * Impact less than consequences defined for severity level '3- Major'
Significant launch delay
(3-6 months)
Significant increase in estimated cost
(5 – 10%)
Minimum
1
Performance: * No/minimal consequences (0 - 10%) in overall performance Technical: * No/ minimal consequences
Safety: * No/ minimal consequences * Space Debris Mitigation: casualty risk <10E-4
No/ minimal consequences
(1-3 month delay)
No/ minimal consequences
(<5%)
No
0
Initial risk fully eliminated Initial risk fully eliminated Initial risk fully
eliminated Initial risk fully
eliminated
* ‘mission’ stands for a ‘.. set of tasks, duties ..’ ECSS-S-ST-00-01C; para. 2.3.139 ** ‘system’ stands for a ‘..set of interrelated or interacting functions constituted to achieve a specified (mission) objective..’ ECSS-S-ST-00-01C; para. 2.3.212
Table 37-3: Severity Categorisation

Ice Giants CDF Study Report: CDF-187(C)
January 2019 page 361 of 431
ESA UNCLASSIFIED – Releasable to the Public
37.3.4 Risk Acceptance Policy
The risk index is usually the combination of the likelihood of occurrence of the consequences and the severity of consequences of a given risk item.
However, in the frame of the Ice Giants study the use/ categorisation of the ‘likelihood’ would be only relevant in terms of ‘safety’ and ‘protection’. Nevertheless, only the Hazard Targets ‘protection’ in terms of the loss of the S/C was seen as relevant for the defined study objectives (see REQ-010 in Table 37-1 ). Its rough quantitative consideration based on expert judgement.
The Risk rating of low risk (green), medium risk (yellow), high risk (red), and very high risk (dark red) were assigned based on the criteria ‘Severity’ (see Table 37-4).
37.4 Risk Drivers
The following risk drivers have been considered in the identification of specific risk items:
New technologies (TRL)
Design challenges (configuration, mass, volume, power, lifetime, mission/ performance operation, communication, …)
Major mission events (launch/ orbit insertion)
Functional and dependability issues (performance + technical, reliability in terms of loss of S/C (e.g. single point failures – SPFs)
Safety, and Environmental & Property factors (protection)
Programmatic factors (cost budget, project delays).
The study approach has to answer in the first row the question whether or not the technical basis for the expected mission objectives might be available at the foreseen project start. This means: is it feasible a space system that ‘WORKs’ – will it satisfy the expected performance in terms of science results or space born services (quality and amount)?.
In an iterative way the design had to be checked e.g. in a follow-up study whether (or not) the space system ‘WORKs GOOD’. This means, will it satisfy the expected programmatic constraints (e.g. cost, schedule) and performance in terms of safety (reasonable low numbers of safety events) and reliability (loss of S/C and, number and circumstances of anomalies ).
Both, the performance and its safety/ reliability/ availability are from viewpoint of the study and mission objective inherently linked to each other and can not be fully separated from each other in terms of its Risk Assessment. Therefore a follow-up study is anyway needed.
37.5 Top Risk Log (preliminary)
Top risk items have been preliminary identified at the mission (ESA) levels. Please refer to Table 37-4 for a complete list of preliminary identified top risks and their corresponding suggested mitigating actions.

Ice Giants CDF Study Report: CDF-187(C)
January 2019 page 362 of 431
ESA UNCLASSIFIED – Releasable to the Public
The Risk Index results reflecting the initial risk assessment* are summarised in Table 37-4. Table 37-4 summarises the final assessment considering mitigation measures as described in the Table 37-5 to Table 37-7.
The risks are sorted and marked* according the study/ mission timeline**:
Study
Mission Design + realisation
Launch (preparation) + LEOP & IOT (S/C deployment)
Cruise + Mission deployment
Mission performance
Other risks (e.g. interfacing risk with the mission partners like other Space agencies)
Overall Cost (OC) + Overall Schedule (OS).
* the underlined abbreviations are used in the risk tables as the beginning initials of the Risk no.
** appearance of ‘(root) cause’ and ‘events’ (chap. 37.2.1) in the study/ mission timeline
The risk numbering (1st column of risk tables) is associated to the study internal risk allocation and does not give a ranking according their importance or any other numerical order.
IMPORTANT:
Safety/ protection and reliability related risks were not in the focus of this study. However, this does not mean that these risks are from subordinate importance. It is because safety, reliability is often effected by and interacting with several other risks scenarios via randomised & systematically failure/ errors (lifetime, launch/space / operation environment, TRL, design fluffs, ... ) or contribution to overall mass, power budget, cost and schedule risks (e.g. via redundancies, safety factors and margins, S/C modes, implementation and verification of related mitigation measures...).
The risk assessment in terms of the safety and reliability has to be part of the follow-up studies.

Ice Giants CDF Study Report: CDF-187(C)
January 2019 page 363 of 431
ESA UNCLASSIFIED – Releasable to the Public
Figure 37-4: Risk Log summary

Ice Giants CDF Study Report: CDF-187(C)
January 2019 page 364 of 431
ESA UNCLASSIFIED – Releasable to the Public
The risk Log is split in three parts according the study elements:
overall risk (preliminary) applicable for all study elements (Table 37-4)
preliminary risks especially applicable for the ‘Probe’ (Table 37-5)
preliminary risks especially applicable for the ‘Orbiter’ (Table 37-6)
preliminary risks especially applicable for the ‘Lander’(Table 37-7)
The study options related to the mission target (Neptune or Uranus) is discussed separately within this 3 ‘study element‘-tables if needed. If there is no specific planet mentioned then the risk identification is applicable for both mission targets.
Risk Risk Context/ Scenario Risk Reduction
no. -
Title
Risk Classi-
fication ----------
-- Risk
Hazard Source [HS],
Hazard [H],
.. could endanger .. Hazard Target [HT]
.. resulting finally in ..
possible Mitigation Measure
(if applicable)
further remarks
ranking Hazardous Condition
[HC] Unwanted
consequences[UC]
Study
SI - Assumptions
program-matic ------------
HS .. study information H .. incompleteness of study information HC1: Many assumptions* for several options (Probe/ Orbiter/ Lander) had to be made to define a closed study baseline options leading to study uncertainties HC2: limited number of sessions for a comprehensive study program (e.g. 2 ½ session dedicated to the orbiter; 1 session dedicated to lander .. could endanger .. HT .. study results in general and completeness of Risk log .. resulting finally in .. UC .. immaturity of the final study baseline an incomplete Risk log Remark: * e.g. lifetime, mass budget, no full mission cruise design, simplified structure, aerodynamic ‘s, maximum design pressure for probe changed in comparison to former study (PEP) from 100kg to 10bar, .…
- follow-up studies - arrangement of working groups with NASA
related risk: not all risks are identified
related risk: OM1
SII - Open points
program-matic ------------
HS .. study scope H .. incompleteness of study scope HC1: Impact of micro meteoroids not discussed HC2: Impact of the collision with ring particles of Jupiter/ Neptune/ Uranus) not discussed HC3: Long-lead items not identified HC4: planetary protection for combined mission elements (Orbiter+Lander) not discussed HC5: TRL readiness * HC6: safety aspects not discussed during study .. could endanger ..
- consideration of open points in follow-up studies

Ice Giants CDF Study Report: CDF-187(C)
January 2019 page 365 of 431
ESA UNCLASSIFIED – Releasable to the Public
Risk Risk Context/ Scenario Risk Reduction
no. -
Title
Risk Classi-
fication ----------
-- Risk
Hazard Source [HS],
Hazard [H],
.. could endanger .. Hazard Target [HT]
.. resulting finally in ..
possible Mitigation Measure
(if applicable)
further remarks
ranking Hazardous Condition
[HC] Unwanted
consequences[UC]
HT .. study results in general and completeness of Risk log .. resulting finally in .. UC .. immaturity of the final study baseline and incomplete Risk log Remark: * Technology developments shall be compatible with the programmatic requirement of TRL 6 by end of 2022 (mission adoption) for launch on 13 February 2031
related risk: HC1/2 -> DIXb HC3 -> OM1 HC4 -> SII-L HC5 -> DI-P, DI-O
related risk:
Overall Mgn./PA/Eng. OMI - Inter-face management
program-matic (schedule+costs) ------------- *
HS .. organisational, design and realisation interfaces between space agencies H .. interface management HC1: differences in program management, project / engineering processes and applicable standards HC2: cultural differences .. could endanger .. HT .. schedule + costs .. resulting finally in .. UC .. delay in schedule and cost increase * Remark: * worst case: project cancellation in pre-project phase or during project
- use of experiences from former projects shared by agencies - specific interface and access requirements
related risk:
related risk:
Design & mission realisation
DIa - Radiation related developments
depen-dability ------------
HS .. see DIXa/b / MIX H .. unexpected development needs in pre-project phase HC: see DIXa/b / MIX .. could endanger .. HT .. project schedule + costs .. resulting finally in .. UC .. schedule delay and cost increase Remark: * applicable especially for the Uranus option because of the closer Jupiter Flyby
- early identification of development needs in terms of radiation resistance -
related risk: DIXa
related risk:

Ice Giants CDF Study Report: CDF-187(C)
January 2019 page 366 of 431
ESA UNCLASSIFIED – Releasable to the Public
Risk Risk Context/ Scenario Risk Reduction
no. -
Title
Risk Classi-
fication ----------
-- Risk
Hazard Source [HS],
Hazard [H],
.. could endanger .. Hazard Target [HT]
.. resulting finally in ..
possible Mitigation Measure
(if applicable)
further remarks
ranking Hazardous Condition
[HC] Unwanted
consequences[UC]
DVIIb - Ground communication
protection ------------
HS .. deep space trajectory H .. travel time of signals/ information HC1: Ground communication 2*3.2h data travel time/ 30 AU from the Sun HC2: Mission operation in critical trajectory phases ** (e.g. Jupiter flyby ) .. could endanger .. HT .. all mission elements .. resulting finally in .. UC .. loss of all mission elements Remark: * relatively close Jupiter independent flyby (gravitational assistance); deviations might lead to unrecoverable trajectory deviations ** -> Neptune/ Uranus orbiter: Jupiter flyby (esp. N.) & orbit insertion & (high S/C autonomy) -> Neptune/ Uranus probe: entry (high S/C autonomy)
- high S/C autonomy - pre-definition of contingency procedures in case of trajectory deviations
related risk: DVIII, DIXb, DIXa-u, MIX
related risk:
DVIII - Long Life-time
protection ------------
HS .. deep space mission targets H .. degradation/ derating processes HC1: long cruise to mission targets HC2: harsh space environment in terms of (temperature, radiation, ...) .. could endanger .. HT .. all mission elements .. resulting finally in .. UC .. loss of mission elements
- design margin - adequate material and component selection and qualification
related risk: DVIIb, MIX
related risk:
DIXa/b - Radiation related loss of mission
protection/ perfor-mance ------------ /
HS .. radiation background* on cruise (especially Jupiter flyby**) H .. interaction with on-board components HC1: various energy levels/ particles of radiation background leading to short-term effects (SEE) and long-term effect (derating) HC2: shielding is contributing to mass budget .. could endanger .. HT .. all mission elements/ science return(instruments) .. resulting finally in .. UC .. loss of mission/ science return
- radiation resistant component design of components and equipment - adequate FDIR concept with prepared contingency measurements
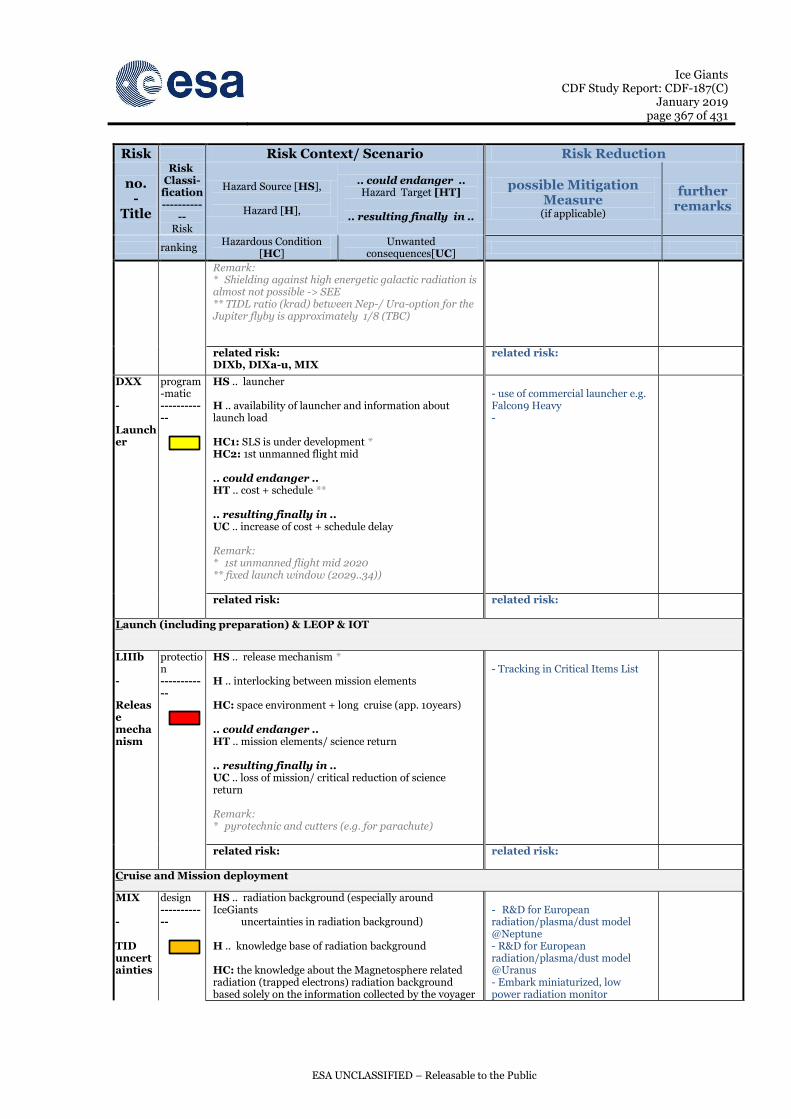
Ice Giants CDF Study Report: CDF-187(C)
January 2019 page 367 of 431
ESA UNCLASSIFIED – Releasable to the Public
Risk Risk Context/ Scenario Risk Reduction
no. -
Title
Risk Classi-
fication ----------
-- Risk
Hazard Source [HS],
Hazard [H],
.. could endanger .. Hazard Target [HT]
.. resulting finally in ..
possible Mitigation Measure
(if applicable)
further remarks
ranking Hazardous Condition
[HC] Unwanted
consequences[UC]
Remark: * Shielding against high energetic galactic radiation is almost not possible -> SEE ** TIDL ratio (krad) between Nep-/ Ura-option for the Jupiter flyby is approximately 1/8 (TBC)
related risk: DIXb, DIXa-u, MIX
related risk:
DXX - Launcher
program-matic ------------
HS .. launcher H .. availability of launcher and information about launch load HC1: SLS is under development * HC2: 1st unmanned flight mid .. could endanger .. HT .. cost + schedule ** .. resulting finally in .. UC .. increase of cost + schedule delay Remark: * 1st unmanned flight mid 2020 ** fixed launch window (2029..34))
- use of commercial launcher e.g. Falcon9 Heavy -
related risk:
related risk:
Launch (including preparation) & LEOP & IOT
LIIIb - Release mechanism
protection ------------
HS .. release mechanism * H .. interlocking between mission elements HC: space environment + long cruise (app. 10years) .. could endanger .. HT .. mission elements/ science return .. resulting finally in .. UC .. loss of mission/ critical reduction of science return Remark: * pyrotechnic and cutters (e.g. for parachute)
- Tracking in Critical Items List
related risk:
related risk:
Cruise and Mission deployment
MIX - TID uncertainties
design ------------
HS .. radiation background (especially around IceGiants uncertainties in radiation background) H .. knowledge base of radiation background HC: the knowledge about the Magnetosphere related radiation (trapped electrons) radiation background based solely on the information collected by the voyager
- R&D for European radiation/plasma/dust model @Neptune - R&D for European radiation/plasma/dust model @Uranus - Embark miniaturized, low power radiation monitor

Ice Giants CDF Study Report: CDF-187(C)
January 2019 page 368 of 431
ESA UNCLASSIFIED – Releasable to the Public
Risk Risk Context/ Scenario Risk Reduction
no. -
Title
Risk Classi-
fication ----------
-- Risk
Hazard Source [HS],
Hazard [H],
.. could endanger .. Hazard Target [HT]
.. resulting finally in ..
possible Mitigation Measure
(if applicable)
further remarks
ranking Hazardous Condition
[HC] Unwanted
consequences[UC]
missions .. could endanger .. HT .. element design/ schedule + cost .. resulting finally in .. UC .. increase of cost + schedule delay Remark: * Potential systematic uncertainties cannot be excluded; # Work on-going in new ESA-led model development (SAPPHIRE, TEC-EPS Piers Jiggens et al.) but ESP can be used for now, and is current ECSS prescription # Uncertainties in Jupiter trapped energetic electrons flux levels - Limited dataset for model building - Significant variations observed in dataset - Longer term predictions less affected by short term variations
related risk: DIXa/b ** Remark:** long terms effect of high radiation might lead to unexpected derating and number of anomalies
related risk: OC/ OS
Other risks
O/P-NASA Identified by NASA ( Ice Giants NASA study 2017, chap.:4.5.4.2)a: Risks and Concerns for orbiter & probe e.g. - Orbit Insertion ΔV is sensitive to the orbiter periapsis altitude - Higher orbiter periapsis provides better relay line-of-sight and longer persistence (lower angular rate relative to probe), but higher NOI ΔV. Shallow FPA reduces probe g-load, but presents challenging telecomm geometry and more TPS mass on the probe due to higher accumulated heat loads. - Relay antenna must point zenith since the probe rotational phase during EDL cannot be easily predicted. One potential solution that was not explored is to baseline an omnidirectional antenna, or have multiple antennae on the probe. - Another factor to consider is the time between Probe Entry and NOI. Currently, there are two hours allocated between probe entry and NOI, a critical event. It may be operationally challenging to sequence both the probe relay and NOI on the orbiter within this time window. Increasing the separation will make the geometry more challenging for telecomm. - Probe-orbiter geometry also needs to deal with issues like uncertainties regarding the Neptune atmosphere and potential signal attenuation. A potential solution would be to perform the NOI burn post periapsis at the cost of increased orbit insertion ΔV.

Ice Giants CDF Study Report: CDF-187(C)
January 2019 page 369 of 431
ESA UNCLASSIFIED – Releasable to the Public
Risk Risk Context/ Scenario Risk Reduction
no. -
Title
Risk Classi-
fication ----------
-- Risk
Hazard Source [HS],
Hazard [H],
.. could endanger .. Hazard Target [HT]
.. resulting finally in ..
possible Mitigation Measure
(if applicable)
further remarks
ranking Hazardous Condition
[HC] Unwanted
consequences[UC]
P-NASA2 NASA report TEAMX-JPL/ Executive Summary/ Risk - OPTION 3: Uranus Orbiter concept w/Probe - 50 kg payload allocation/ - 1 atmospheric probe (previously designed) - Only 2 hours between Probe entry and UOI, a critical event * May be operationally challenging to sequence both the Probe relay and UOI for the Orbiter within this time window. * Longer than 2 hours makes the geometry more challenging for telecom.
- May be issues for the relay link margin due to Probe-Orbiter geometry and uncertainties regarding Uranus atmosphere/ potential signal attenuation. - High g load on the Probe carries some risk. - Last Probe targeting occurs more than 60 days prior to encounter. * Probe carries no propulsion, so it cannot correct trajectory dispersions. * Need dispersions small enough to ensure safe entry conditions at Uranus.
- Orbit knowledge requirements for science reconstruction need to be determined. * Will drive how the Probe is tracked pre-entry and what telemetry (e.g. IMU) needs to be transmitted with the science data to the Orbiter. * The latter will impact the data budget.
- Mission duration will push systems to their operating lifetimes. - Science planning risk * Relative velocities between Orbiter and Uranus’ satellites will be high. # Flybys occur near periapse
- Collision avoidance with Uranus’ rings needs to be considered. - Uranus stays close to the range of solar conjunction (~4-5 deg) * Doppler measurements may have increased noise levels.
- Running the Orbiter power bus to the SEP stage makes for a more complex electronics design and adds cabling. * Higher risk than adding a battery on the SEP stage. * Chose this to minimize SEP stage mass.
- eMMRTG still needs some development. * May cause a schedule slip. * Performance may degrade at a higher rate than currently predicted. * RTG production rate (~8 years required for 3 eMMRTG) may be too low with respect to requirements
- ROSA solar array qualification carries some risk. - RTG waste heat recovery design robustness * Approach is highly configuration-dependent and may have high hidden development costs. * Less expensive on paper, but the actual implementation could be more expensive than an active system.
- Component development for both propulsion subsystems * NEXT development for SEP *Large bi-prop engines for chemical
Table 37-4: Risk Log applicable for more than one or all study elements

Ice Giants CDF Study Report: CDF-187(C)
January 2019 page 370 of 431
ESA UNCLASSIFIED – Releasable to the Public
Risk Risk Context/ Scenario Risk Reduction
no. -
Title
Risk Classi-
fication ----------
-- Risk
Hazard Source [HS],
Hazard [H], Hazardous
.. could endanger .. Hazard Target [HT]
.. resulting finally in ..
possible Mitigation Measure
(if applicable)
further remarks
ranking Condition [HC] Unwanted
consequences[UC]
Study SII-P - Open points
program-matic ------------
HS .. study scope H .. incompleteness of study scope HC: open study points * .. could endanger .. HT .. study results in general and completeness of Risk log .. resulting finally in .. UC .. immaturity of the final study baseline and incomplete Risk log Remark: * - Consolidation of Heat Fluxes and Loads - TPS shall be sized to withstand the aerothermodynamics loads and a complete design iteration shall be performed - TPS Material Trade-Offs shall be performed (see also OMII.2-P) - Dynamic pressure impact on structural mass shall be: duly assessed - Probe stability shall be ensured - Payload mass could be revisited - a FPA = -18 deg could be considered
- consideration of open points in follow-up studies ** Remark: ** A dedicated Probe study is highly recommended ( the probe is not just a delta with respect PEP): - Operational timeline of the payload and scientific requirements shall be clearly identified as both pressure level and scientific measurements duration have an impact on the design - Black-out during entry and descent (0 deg elevation for 10 minutes) shall be addressed - 50 g effects on the instruments shall be checked - Radiation effects on the payload shall be assessed - DHS mass ok 1 kg shall be revisited as it might be optimistic - DM Structural mass shall be carefully computed - Pressure Load on FS shall be looked at Hot Structure need for the FS (no significant benefit for the FS at -35 deg FPA)
related risk: HC1/2 -> DIXb
related risk:
Overall Mgn./PA/Eng. OMII.1-P - RHU integration
program-matic ------------
HS .. RHU H .. integration in probe HC: integration at non-European location .. could endanger .. HT .. schedule + cost .. resulting finally in .. UC .. schedule delay/ increase of cost Remark: * 31 RHUs are considered necessary to survive 20 day coast phase
- consideration of adequate accessibility requirements which allow European stuff to follow the probe integration in US - consideration of additional time slot
related risk: OMI
related risk:

Ice Giants CDF Study Report: CDF-187(C)
January 2019 page 371 of 431
ESA UNCLASSIFIED – Releasable to the Public
Risk Risk Context/ Scenario Risk Reduction
no. -
Title
Risk Classi-
fication ----------
-- Risk
Hazard Source [HS],
Hazard [H], Hazardous
.. could endanger .. Hazard Target [HT]
.. resulting finally in ..
possible Mitigation Measure
(if applicable)
further remarks
ranking Condition [HC] Unwanted
consequences[UC]
OMII.2-P - TPS testing
program-matic ------------
HS .. TPS shields H .. material availability in Europe HC1: new development is needed for TPS * HC2: no test facility is existing worldwide; testing will only be possible at sample level ** .. could endanger .. HT .. schedule + costs .. resulting finally in .. UC .. increase of cost + delay in schedule Remark: * mass increases against PEP study by 50% ** However the risks will be at least partly absorbed by the big margins in design
- consideration in ESA development programs
related risk: DI-P
related risk:
Design & mission realisation
Basis for the probe design was the former CDF study PEP with the following general limitations: 1.) the results of the PEP CDF study had to be screened/ updated because of the requested time of science operation of 1.5h (PEP 1h); this was leading to redesign of the probe and parachute dimension: - probe diameter increased by 10cm to 138cm see SI-p (design uncertainties) and mass increase with the possibility to contribute to DII-p (mass/ volume budget); - parachute design changed complexly from one-stage-parachute system to a two-stage-parachute system and a changed sequence of the release of the back and front heat shield (see DIa-p)
2.) In comparison to the PEP study the operational design pressure could be reduced to 10bar (PEP 100bar) with two effects: - the probe structure/ pressure vessel could be designed with for a lower pressure -> mass reduction; however a redesign in a very short study period (study uncertainty .. see SI1+2) - the operation in higher atmosphere (up to 10 bar) leads to lower heat flux** during entry at a given FPA, however the TPS mass increase with respect to PEP related to a current better knowledge of the materials produced an increase in mass, which – in turn – translated into heat flux increase 3.) heat flux might get the leading design risk (OMII.2-p) - the higher the FPA the bigger the heat flux and the lower heat load - the lower the flight path angle (low change of attitude) the lower the heat flux -35deg.->64 | -18deg.->33MW/m2 , but the higher the heat loads -> TPS shield mass at -35deg. FPA -> Ablator 25mm 81kg | (low HL is good!) -18deg. -> 35mm +32kg | - the material of the TPS shield has to be optimised the balance based on head load & heat flux - a higher mass will increase load on parachute -> bigger parachute
4.) the Probe is mass ~345kg (study baseline) still compliance with the informative mass budget (350kg) but might become critical with further specification of the mission/ Probe design; PEP design 315kg

Ice Giants CDF Study Report: CDF-187(C)
January 2019 page 372 of 431
ESA UNCLASSIFIED – Releasable to the Public
Risk Risk Context/ Scenario Risk Reduction
no. -
Title
Risk Classi-
fication ----------
-- Risk
Hazard Source [HS],
Hazard [H], Hazardous
.. could endanger .. Hazard Target [HT]
.. resulting finally in ..
possible Mitigation Measure
(if applicable)
further remarks
ranking Condition [HC] Unwanted
consequences[UC]
DI-P - TRL status
program-matic ------------
HS .. S/C components/ subsystems H .. TRL (Technological Readiness) HC: TRL > 6 for all components* at the time of mission adoption end Phase A/B1 .. could endanger .. HT .. schedule + costs .. resulting finally in .. UC .. increase of cost + delay in schedule Remark: * No TRL info’s for instruments/ Data Handling (DCM/ CMOS)/ PWR(PCDU)/ structure Low TRL COM (UHF_TX/TPS(Back &Front shield)**/parachutes*** ** actually no test facility is existing worldwide; testing will only be possible at sample level; However the risks will be at least partly absorbed by the big margins in design; Furthermore a mass increases against PEP study by 50% has to be considered, related to a more mature knowledge on the material
- early consideration in ESA development programs - procurement on non-European market
*** overall discussion notes about parachute design/deployment - changed pressure/ attitude to open parachute (to PEP) will lead to change of parachute (2 needed) -> mass/ volume increase) incl. cost impact - CSG -> open parachute as early as possible -> supersonic parachute? * Is there the available volume for a much bigger parachute system? * A bigger parachute suffers (and generate) much bigger loads requiring stronger and (much) heavier material * Need to check when the parachute needs to be deployed to be ready to acquire data at 1 bar - study baseline ended up with a 2 times bigger 2stage parachute (surface/ mass )in comparison PEP (1 stage parachute) Further design uncertainties: * What after reaching 10 bar? Keep descending under parachute? Free fall? * Thermal boost before entry to warm up pyros?
related risk:
related risk:
DII-P - Para-chute supplier
program-matic ------------
HS .. procurement of parachute H .. availability of former parachute supplier * HC: the European parachute supplier is economical not stable .. could endanger .. HT .. schedule + costs .. resulting finally in .. UC .. increase of cost + delay in schedule Remark: * PAS procurement (EXM had problems with supplier bankruptcy)
- procurement as early as possible - qualification of new European supplier - procurement on non-European market
related risk: LIIIb-P, DI-P
related risk:

Ice Giants CDF Study Report: CDF-187(C)
January 2019 page 373 of 431
ESA UNCLASSIFIED – Releasable to the Public
Risk Risk Context/ Scenario Risk Reduction
no. -
Title
Risk Classi-
fication ----------
-- Risk
Hazard Source [HS],
Hazard [H], Hazardous
.. could endanger .. Hazard Target [HT]
.. resulting finally in ..
possible Mitigation Measure
(if applicable)
further remarks
ranking Condition [HC] Unwanted
consequences[UC]
Launch (including preparation) & LEOP & IOT
LIIIb-P - Para-chute deploy-ment
protection ------------
HS .. parachute system H .. deployment of parachute system HC1: space environment + long cruise HC2: adoption of military used design which is not space used so far .. could endanger .. HT .. probe/ science return .. resulting finally in .. UC .. loss of probe/ science return
- -
related risk: DII-P
related risk:
Cruise and Mission deployment
CIb-P - Instrument deployment/Data collection/ transmission
per-formance ------------
HS .. entry conditions H .. limited time frame HC1: short instrument deployment period after separation from orbiter 2h HC2: very short deployment period after release of back/ front shields (5min) HC2: fixed science period during entry (90min) incl. data return to orbiter .. could endanger .. HT .. science return .. resulting finally in .. UC .. loss of science return Remark: * Data is generated in 90 mins at 2 kbps (significantly larger data volume than Galileo of ~factor 3)
- advanced FDIR concept for fast reaction in case of anomalies incl. comprehensive plausibility checks of incoming GNC system - full redundancy for data handling system
related risk: LIIIb-P, DI-P
related risk:
Other risks
P-NASA1 Identified by NASA ( Ice Giants NASA study 2017 4.7.4.3/ A5.5): Due to the fact that -18° shallow trajectory has certain drawbacks, such as higher heat load leading to higher TPS mass, a potential compromise in communications (link visibility), as well as a greater risk of skip out, however it would enable the usage of European test facilities, in the future it will be worthwhile to investigate trajectories at -18° FPA and attain a more optimum design ... If the specifications and performance parameters of the instruments and thermal protection system (TPS) materials used in this study are valid when the mission is implemented, the prograde probe entry adopted for this study appears feasible. But the modified entry trajectory adopted here requires a steeper-than-usual entry flight path angle (FPA). This produces higher peak heating rates and significantly higher inertial loads than a shallower FPA. It is possible that as this mission concept

Ice Giants CDF Study Report: CDF-187(C)
January 2019 page 374 of 431
ESA UNCLASSIFIED – Releasable to the Public
Risk Risk Context/ Scenario Risk Reduction
no. -
Title
Risk Classi-
fication ----------
-- Risk
Hazard Source [HS],
Hazard [H], Hazardous
.. could endanger .. Hazard Target [HT]
.. resulting finally in ..
possible Mitigation Measure
(if applicable)
further remarks
ranking Condition [HC] Unwanted
consequences[UC]
evolves, changes in approach circumstances, less-than-anticipated performance by various components, or other unforeseen drivers could force the prograde approach to an entry that is riskier than the project is willing to accept.
NASA reportTEAMX-JPL/ Executive Summary/ Risk - OPTION 4: Option 2: Uranus Orbiter Variant Concept - 150 kg payload allocation/ - No atmospheric probe/ - No crosslink telecom hardware - Mission duration will push systems to their operating lifetimes. - Science planning risk * Relative velocities between Orbiter and Uranus’ satellites will be high. # Flybys occur near periapse
- Collision avoidance with Uranus’ rings needs to be considered. - Uranus stays close to the range of solar conjunction (~4-5 deg) * Doppler measurements may have increased noise levels.
- Running the Orbiter power bus to the SEP stage makes for a more complex electronics design and adds cabling. * Higher risk than adding a battery on the SEP stage. * Chose this to minimize SEP stage mass.
- eMMRTG still needs some development. * May cause a schedule slip. * Performance may degrade at a higher rate than currently predicted.
- ROSA solar array qualification carries some risk. - RTG waste heat recovery design robustness * Approach is highly configuration-dependent and may have high hidden development costs. * Less expensive on paper, but the actual implementation could be more expensive than an active system.
- Component development for both propulsion subsystems * NEXT development for SEP * Large bi-prop engines for chemical
- Sun sensor performance may degrade past Saturn. * May impact safe mode used during star tracker outage.
Table 37-5: Risk Log specifically applicable for the ‘Probe’

Ice Giants CDF Study Report: CDF-187(C)
January 2019 page 375 of 431
ESA UNCLASSIFIED – Releasable to the Public
Risk Risk Context/ Scenario Risk Reduction
no. -
Title
Risk Classi-
fication -----------
- Risk
Hazard Source [HS], Hazard [H],
.. could endanger .. Hazard Target [HT]
.. resulting finally in
..
possible Mitigation Measure
(if applicable)
further remarks
ranking Hazardous Condition [HC]
Unwanted consequences[UC]
Study
SII-O - Open points
program-matic ------------
HS .. study scope H .. incompleteness of study scope HC: Open points * .. could endanger .. HT .. study results in general and completeness of Risk log .. resulting finally in .. UC .. immaturity of the final study baseline and incomplete Risk log Remark: * - RTGs characteristics shall be better understood: Power degradation characteristics (esp. EOL power output) Number of RTGs that could actually be made available to an ESA mission element - HGA diameter and pointing capability shall be revisited - Structural mass is on the low side (~7% of the dry mass) and shall be revisited
- consideration of open points in follow-up studies ** Remark: * - Scientific Requirement of downloading 32 Gb data volume at the end of the mission is currently (50 days orbit) looking challenging for the Neptune case - For the Uranus case the data volume downloadable with the Neptune design is 53 Gb - Payload timeline shall be consolidated, tailoring it such to meet boundary conditions e.g. doing less periapsis science in the shorter orbits (which occur near the end of the mission, when the planetary periapsis should already be well characterized) - Dual orbiter accommodation inside the LV trade-off - Minimal distance between 2 engines in Neptune (as per current configuration) shall be checked for thermal issues (also attitude control shall be investigated), as they are operated simultaneously for ~ 30 mins - Alternative Jupiter flybys for targeting Uranus in different launch dates should be carefully investigated, sensitivity to be understood, and a detailed assessment of the radiation environment should be provided - Alternative radiation shielding materials could be traded off to target mass savings - Energy excess available during cruise could be considered for science usage - Dedicated design for a specific planet could bring optimisation to some of the subsystems
related risk: CIb,
related risk:
Overall Mgn./PA/Eng.
OMII.1-O - RHU integration
program-matic ------------
HS .. RTG H .. integration in orbiter * HC: integration at non-European location .. could endanger .. HT .. schedule + cost .. resulting finally in .. UC .. schedule delay/ increase of cost Remark: * - launch and launch site safety requirements - Ground facilities for integration - integration through fairing doors
- consideration of adequate accessibility requirements which allow European stuff to follow the probe integration in US - consideration of additional time slot
related risk: OMI
related risk:

Ice Giants CDF Study Report: CDF-187(C)
January 2019 page 376 of 431
ESA UNCLASSIFIED – Releasable to the Public
Risk Risk Context/ Scenario Risk Reduction
no. -
Title
Risk Classi-
fication -----------
- Risk
Hazard Source [HS], Hazard [H],
.. could endanger .. Hazard Target [HT]
.. resulting finally in
..
possible Mitigation Measure
(if applicable)
further remarks
ranking Hazardous Condition [HC]
Unwanted consequences[UC]
Design & mission realisation
DI-O - TRL status
program-matic -------------
HS .. S/C components/ subsystems H .. TRL (Technological Readiness0 HC: TRL > 6 for all components* at the time of mission adoption end Phase A/B1 .. could endanger .. HT .. schedule + costs .. resulting finally in .. UC .. increase of cost + delay in schedule Remark: * No TRL info’s for instruments **/ AOCS(STR)/ PWR(PCDU)/ structure Low TRL COM(HGA+ Ka-equipment) ** deployable boom for magnetometer (Neptune) .. European instrument with high TRL - very heavy
- early consideration in ESA development programs - procurement on non-European market
related risk:
related risk:
DII-O - RTU Procur-ment avail-ability
program-matic -------------
HS .. RTG H .. RTG production capacities HC1: relatively high amount of Uranium needed * HC2: limited RTG production capacities .. could endanger .. HT .. project .. resulting finally in .. UC .. project cancellation/ delay Remark: * 3 RTUs a 4kg Uranium -> 8 years of actual production rate; 3 RTGs are essential to enable any type of science * a dual orbiter scenario this would imply high number of RTGs (6), with following issues to be considered:
- early start of procurement
related risk:
related risk:
DIII-Ou - Mass budget
program-matic ------------
HS .. mass contribution of subsystems/ components/ media H .. mass limit HC: high radiation requires adequate shielding additionally to the shielding given by ‘usual’ structures .. could endanger .. HT .. schedule + costs .. resulting finally in .. UC .. increase of cost + delay in schedule
- optimisation of Jupiter flyby in terms of radiation reduction ( (understanding dependency with launch date and increase distance from the planet) - mass reduction in other subsystem domains

Ice Giants CDF Study Report: CDF-187(C)
January 2019 page 377 of 431
ESA UNCLASSIFIED – Releasable to the Public
Risk Risk Context/ Scenario Risk Reduction
no. -
Title
Risk Classi-
fication -----------
- Risk
Hazard Source [HS], Hazard [H],
.. could endanger .. Hazard Target [HT]
.. resulting finally in
..
possible Mitigation Measure
(if applicable)
further remarks
ranking Hazardous Condition [HC]
Unwanted consequences[UC]
related risk:
DXX, DIXa/b related risk:
DIV-O - Power, Thermal
perfor-mance -------------
HS .. RTU H .. performance of RTU HC1: long cruise period HC2: uncertainties about end-of-life performance (+ 15%) .. could endanger .. HT .. science return .. resulting finally in .. UC .. critical reduction of science return
- -
related risk:
related risk:
Cruise and Mission deployment
CIa-O - cruise accuracy
protection -------------
HS .. deep space trajectory H .. deviations from trajectory HC1: several critical manoeuvre has to be performed to reach mission target (Jupiter flyby *, Orbit deflection/ insertion) HC2: high manoeuvre accuracy needed to reach mission target HC3: limited time windows to perform manoeuvres .. could endanger .. HT .. mission element/science return .. resulting finally in .. UC .. loss of mission element/science return Remark: * relatively close Jupiter independent flyby (gravitational assistance); deviations might lead to unrecoverable trajectory deviations
- high on-board autonomy - advanced FDIR concept - intermediate health checks
related risk:
related risk:
Other risks
Identified during the Internal Final Presentation: Minimal distance between 2 engines in Neptune (as per current configuration) shall be checked for thermal issues (also attitude control shall be investigated), as they are operated simultaneously for ~ 30 mins [single thruster to be considered? It is recommended to inject the ExoMars lessons learned] Identified by NASA ( Ice Giants NASA study 2017, chap.:4.5.4.2)a: Risks and Concerns for orbiter e.g. - Orbit Insertion ΔV is sensitive to the orbiter periapsis altitude - Higher orbiter periapsis provides better relay line-of-sight and longer persistence (lower angular rate relative to probe), but higher NOI ΔV. Shallow EFPA reduces probe g-load, but presents challenging telecomm geometry and more TPS mass on the probe due to higher accumulated heat loads.

Ice Giants CDF Study Report: CDF-187(C)
January 2019 page 378 of 431
ESA UNCLASSIFIED – Releasable to the Public
Risk Risk Context/ Scenario Risk Reduction
no. -
Title
Risk Classi-
fication -----------
- Risk
Hazard Source [HS], Hazard [H],
.. could endanger .. Hazard Target [HT]
.. resulting finally in
..
possible Mitigation Measure
(if applicable)
further remarks
ranking Hazardous Condition [HC]
Unwanted consequences[UC]
- Relay antenna must point zenith since the probe rotational phase during EDL cannot be easily predicted. One potential solution that was not explored is to baseline an omnidirectional antenna, or have multiple antennae on the probe. - Another factor to consider is the time between Probe Entry and NOI. Currently, there are two hours allocated between probe entry and NOI, a critical event. It may be operationally challenging to sequence both the probe relay and NOI on the orbiter within this time window. Increasing the separation will make the geometry more challenging for telecomm. - Probe-orbiter geometry also needs to deal with issues like uncertainties regarding the Neptune atmosphere and potential signal attenuation. A potential solution would be to perform the NOI burn post periapsis at the cost of increased orbit insertion ΔV.
Table 37-6: Risk Log specifically applicable for the ‘Orbiter’
Risk Risk Context/ Scenario Risk Reduction
no. -
Title
Risk Classi-
fication -----------
- Risk
Hazard Source [HS],
Hazard [H],
.. could endanger .. Hazard Target [HT]
.. resulting finally in ..
possible Mitigation Measure
(if applicable)
further remarks
ranking Hazardous Condition
[HC] Unwanted
consequences[UC]
Study
SII-L - Open points
program-matic -------------
HS .. study scope H .. incompleteness of study scope HC1: planetary protection not discussed* HC2: other open points and findings. ** .. could endanger .. HT .. study results in general and completeness of Risk log .. resulting finally in .. UC .. immaturity of the final study baseline and incomplete Risk log Remark: * for the Neptune moon Triton the same conditions in terms of the origin of life like for the moons Enceladus or Europe applies; therefore to search there for signs of life the lander should be decontaminated from terrestrial forms of life ** In order to land ~ 10 kg payload during Triton fly-by, Lander wet mass is 2.0-2.5 tons
- consideration of open points in follow-up studies *** - further technical developments **** Remarks: *** Dedicated study shall address the major issues of: - Plume impingement contamination during descent - Landing gear sizing coping with unknown surface characteristics - Lander release strategy and impact on lander and carrier - Visibility (rage, elevation) of the carrier for communication relay **** Propulsion .. throttled / pulsed propulsion capabilities in a closed-loop GNC system for the final descent manoeuvre GNC .. Dual-use LIDAR, hazard-detection-avoidance and altimeter Power .. Combined avionics/power unit approach, as a “Minavio” concept Operation .. Array of up to 4 ground stations, with 2 receiver-only antennas, and 2 Transmitting + receiving

Ice Giants CDF Study Report: CDF-187(C)
January 2019 page 379 of 431
ESA UNCLASSIFIED – Releasable to the Public
Risk Risk Context/ Scenario Risk Reduction
no. -
Title
Risk Classi-
fication -----------
- Risk
Hazard Source [HS],
Hazard [H],
.. could endanger .. Hazard Target [HT]
.. resulting finally in ..
possible Mitigation Measure
(if applicable)
further remarks
ranking Hazardous Condition
[HC] Unwanted
consequences[UC]
related risk: HC1/2 -> SII (HC4)
related risk:
Cruise and Mission deployment
CIc.1-L - Landing site
per-fomance -------------
HS .. landing site H .. selection of landing site HC1: landing site should be close to ice plume areas HC2: limited possibilities to monitor moon surface from orbiter .. could endanger .. HT .. science return .. resulting finally in .. UC .. major reduction in science return (landing site away from ice plume fallout areas)
- release of lander in later phase after several moon flybys of the orbiter
related risk:
related risk: DIXb, MIX
CIc.2-L - Instrument deployment/Data collection/ trans-mission
protection -------------
HS .. lander descent H .. limited time frame HC1: the descent manoeuvre has to be performed fully automatically incl. handling of non-rational data (plausibility checks) and anomalies) HC2: descent sequence is extreme short without very limited correction possibilities also for the on-board FDIR .. could endanger .. HT .. lander/ science return .. resulting finally in .. UC .. loss of lander/ science return
- advanced FDIR concept for fast reaction in case of anomalies incl. comprehensive plausibility checks of incoming AOCS system - full redundancy for data handling system
related risk:
related risk:
CId-L - landing conditions
perfor-mance -------------
HS .. landing surface H .. landing condition of site HC1: stability of landing ground is highly unknown* HC2: admixtures in the ice (plumes might come from underground oceans with active geology) .. could endanger .. HT .. science return .. resulting finally in .. UC .. loss of science return Remark: * the preferred landing site is next to the ice plumes to search for signs of life in the assumed underground ocean; however, under low gravity and extreme low
- -

Ice Giants CDF Study Report: CDF-187(C)
January 2019 page 380 of 431
ESA UNCLASSIFIED – Releasable to the Public
Risk Risk Context/ Scenario Risk Reduction
no. -
Title
Risk Classi-
fication -----------
- Risk
Hazard Source [HS],
Hazard [H],
.. could endanger .. Hazard Target [HT]
.. resulting finally in ..
possible Mitigation Measure
(if applicable)
further remarks
ranking Hazardous Condition
[HC] Unwanted
consequences[UC]
temperature it is possible that the ice surface/ structure might not carry the lander; in case the lander would drown in the ice the RF contact might be lost due to minerals in the ice coming as well from the underground ocean
related risk:
related risk:
Table 37-7: Risk Log specifically applicable for the ‘Lander’
37.5.1 Risk Log General Conclusions
Very high risks and high risks are typical of a phase A project. Areas with lack of definition or little previous experience pose a priori more risk to the mission and therefore are the ones with more risk reduction potential
Experience shows that all risk items with a critical risk index (red, orange area) must be analysed and proposals for risk treatment actions elaborated
In the end, ideally all risk items should achieve a level of justifiable acceptance
The risk management process should be further developed during the project definition phase in order to refine the risk identification/analysis and provide evidence that all the risks have been effectively controlled.
37.6 Risk Log Specific Conclusions and Recommendations
The study has to be seen as a preliminary feasibility study for several mission element-options (Orbiter or Probe or Lander) dedicated to the Ice Giants Neptune and Uranus in the frame of a NASA opportunity mission.
Therefore a ‘Risk identification’ was seen as more suitable than an extended Risk assessment.
The scientific objectives of the Ice Giants mission:
To contribute to the observation one of the Ice Giants and its moons (Neptune+Triton/ Uranus)**
One of the main focus of this study was the identification of early development needs which are also subject of the Risk Log’- Table 37-4 to Table 37-7.
The Ice Giants study covers a very complex mission with many mission elements (probe or orbiter or lander), mission phases (interplanetary trajectory with a Jupiter flyby, orbit insertion and landing) and options (mission target: Neptune or Uranus) where only limited practical ESA-internal experiences are available related to platform components (e.g. the use/ integration of RTG, RHU and the use of high-radiation resistant Star

Ice Giants CDF Study Report: CDF-187(C)
January 2019 page 381 of 431
ESA UNCLASSIFIED – Releasable to the Public
tracker) and payload instruments resistant against high radiation. Naturally many risks were identified (see Table 37-4 to Table 37-7). However, such comprehensive risk portfolio is in general not unusual for a deep space mission and especially not in case of several mission elements and options.
The uncertainty about the identified risks is relatively high caused by:
The limited time-frame of the study , the amount of assumptions which had to be made related to the incomplete knowledge of the NASA mission requirements/ assessment (e.g. trajectory conditions for cruise/ orbit insertion, availability of nuclear components) .. SI
The weak data base related to the mission targets Neptune/ Uranus (e.g. Magnetosphere / radiation environment); Furthermore results from a former probe study (PEP) were 'only' partially applicable (e.g. change of entry trajectory) leading to re-designed (e.g. parachute system) .. e.g. MIX contributing also to DIXa/b,
Several open points which has still to be analysed in follow up studies (SII, SII-P/-O/-L) or working groups
Special early development needs were identified in the area of:
The Probe parachute system .. DII-P, LIIIb-P
The Thermal Protection System of the Probe .. OMII.2-P
and applicable for all study elements:
The Data transmission Ka-Band equipment .. DI-P/-O
The instruments .. DI-P/-O
Further development needs are addressed in (SII, SII-P/-O/-L).
Nevertheless the study did not identify 'show stoppers' for ESA contribution. However, the design of the Uranus-orbiter (DIII-Ou) might increase in mass limit of due to high radiation during Jupiter flyby. Nevertheless the mass budget is given for orientation only and has still to be verified.
Further delta studies are needed for all study/ mission elements to consolidated the Risk identification and to perform a Risk assessment.

Ice Giants CDF Study Report: CDF-187(C)
January 2019 page 382 of 431
ESA UNCLASSIFIED – Releasable to the Public
This Page Intentionally Blank

Ice Giants CDF Study Report: CDF-187(C)
January 2019 page 383 of 431
ESA UNCLASSIFIED – Releasable to the Public
38 PROGRAMMATICS/AIV
38.1 Requirements and Design Drivers
The main requirements and design drivers for the Ice Giants project from a programmatic point of view are:
SubSystem Requirements
Req. ID Statement Parent ID
PROG-010
The Program Milestones on ESA and NASA side shall be consistent with a logic where the System Level (NASA) PDR is first performed, with Element level (ESA) PDR following, then all Subcontractors PDR’s . CDR logic shall be with Subcontractors CDR’s first, followed by Element level (ESA) CDR, concluding then with the System (NASA) CDR.
PROG -020 Any deviation from the above milestones logic (PROG-010) shall be agreed at the level of Joint NASA/ESA Program Board
PROG -030
The ESA delivery date for its FM Elements shall be compatible with a mission launch date fixed on February 2031. The ESA Elements delivery due date is currently fixed on mid October 2029, including an ESA schedule contingency of 6 months.
PROG -040
In case the Heat Shield TPS of a Planetary Probe is procured by ESA, the verification method for the Heat Shield Thermal Protection System, against the planetary entry heat flux, shall be analysis, supported by appropriate sample level testing by the available European test facilities.
PROG -050
In case the Parachute System of a Planetary Probe is procured by ESA, a Subcontractor Survey shall be launched at PRR in order to select the Parachute System supplier well in advance of mission adoption. This is a condition to the success of the Program.
PROG -060
Element interfaces with the NASA system, namely data and power, shall be verified by test with a NASA provided System Interface Simulator, reproducing the required interface characteristics for realistic testing.
PROG -070 Power compatibility of NASA System with ESA Orbiter shall be verified by test.
38.2 Assumptions and Trade-Offs Assumptions
1 It is assumed that the System Composite AIT activities at NASA, after ESA FM Elements delivery, will last 13 months, including 3 months of NASA contingency.
2 It is assumed that the launch campaign, under the responsibility of NASA, will last 3 months.
3 It is assumed that for the Ice Giants ESA Orbiter, an aggressive model philosophy

Ice Giants CDF Study Report: CDF-187(C)
January 2019 page 384 of 431
ESA UNCLASSIFIED – Releasable to the Public
Assumptions
with AVM (Avionics Verification Model) and PFM Element level models can be applied; due to the good heritage European Industry have with this class of spacecraft.
4
An Element level STM (structural and thermal model) is not currently requested, but it could be accommodated within the margins of the presented schedule, if requested by NASA as deliverable model to System AIT, and as technical risk reduction method.
5 An Element level EM may be required in place of the AVM, depending on NASA System test level requirements and program technical risk reduction requirements. This is to be subject of a further investigation with NASA.
38.3 Technology Requirements
The Technology Readiness Levels (TRL) present a systematic measure, supporting the assessments of the maturity of a technology of interest and enabling a consistent comparison in terms of development status between different technologies.
The product tree for Ice Giants, as established in the CDF workbooks, is shown in Table 38-2 (probe) and Table 38-2 (orbiter). It identifies for each subsystem the associated equipment, their quantity and their TRL as far as available.
Category Owner Name n_item
s shape TRL
Elements SYE Probe
Subsystems COM Communications Subsystem
Equipment COM UHF Radio Frequency Distribution Network
9
Equipment COM UHF Low Gain Antenna 9
Equipment COM UHF Solid State Power Amplifier 8
Equipment COM UHF Solid State Power Amplifier #2 8
Equipment COM UHF Transmitter 4
Equipment COM UHF Transmitter #2 4
Equipment COM UHF Patch LGA 5
Subsystems DH Data-Handling Subsystem
Equipment DH Computer and Data Management Probe #2
TBD
Subsystems EDL Entry, Descent and Landing Subsystem
Equipment EDL Main parachute 3
Equipment EDL Pilot chute 3
Subsystems GNC Guidance, Navigation and Control Subsystem
Equipment GNC LN200S #1 9
Equipment GNC LN200S #2 9
Equipment GNC PAS Switch #1 TBD
Equipment GNC PAS Switch #2 TBD

Ice Giants CDF Study Report: CDF-187(C)
January 2019 page 385 of 431
ESA UNCLASSIFIED – Releasable to the Public
Subsystems INS Instruments Subsystem
Equipment INS Atmospheric Structure Instrument TBD
Equipment INS Camera-Radiometer TBD
Equipment INS Mass Spectrometer TBD
Equipment INS Photometer TBD
Equipment INS USO-Doppler TBD
Subsystems MEC Mechanisms Subsystem
Equipment MEC Back Shell Separation Mechanism [probe side]
9
Equipment MEC Back Shell Separation Mechanism [DM side]
9
Equipment MEC Front Shield Seperation Mechanism [DM side]
9
Equipment MEC Front Shield Seperation Mechanism Mec [probe side]
9
Equipment MEC Spin Ejection Mechanism [probe side] 9
Equipment MEC Mortar Parachute Pyro Cutter 9
Subsystems PWR Power Subsystem
Equipment PWR Batteries 4 6
Equipment PWR Power Conditioning & Distribution (PCDU)
5
Subsystems STR Structures Subsystem
Equipment STR Back Shield Cold Structure TBD
Equipment STR Back Shield To DM I/F Brackets 3 TBD
Equipment STR Back Shield Stiffening Ribs 3 TBD
Equipment STR DM Mounting Platform #1 TBD
Equipment STR DM Mid-Section Ring TBD
Equipment STR DM Shell TBD
Equipment STR DM Main Parachute Supporting Structure #1)
3 TBD
Equipment STR Front Shield Cold Structure TBD
Equipment STR Front Shield I/F Brackets 3 TBD
Equipment STR Front Shield Separation Ring TBD
Subsystems TC Thermal Control Subsystem
Equipment TC Backcover MLI 6
Equipment TC Frontshield MLI 6
Equipment TC RHUs 31 TBD
Equipment TC RHUs support 31 TBD
Equipment TC Pressure vessel insulation TBD
Subsystems TP Thermal Protection Subsystem
Equipment TP Backcover Ablator 5
Equipment TP Frontcover Ablator 4
Equipment TP Backcover Hot structure

Ice Giants CDF Study Report: CDF-187(C)
January 2019 page 386 of 431
ESA UNCLASSIFIED – Releasable to the Public
Equipment TP Frontcover Hot structure TBD
Equipment TP Backcover insulation TBD
Equipment TP Frontshield insulation TBD
Equipment TP Heatshield instruments TBD
Table 38-1: Ice Giants product tree – probe at IFP
Category Owner Name n_items shape TRL
Elements SYE Spacecraft
Equipment AOGNC Attitude, Orbit, Guidance, Navigation Control Subsystem
Equipment AOGNC IMU Airbus Astrix 1090A #1 9
Equipment AOGNC IMU Airbus Astrix 1090A #2 9
Equipment AOGNC NavCam #1 9
Equipment AOGNC NavCam #2 9
Equipment AOGNC RW Honeywell HR04 #1 7
Equipment AOGNC RW Honeywell HR04 #2 7
Equipment AOGNC RW Honeywell HR04 #3 7
Equipment AOGNC RW Honeywell HR04 #4 7
Equipment AOGNC STR Sodern Hydra JUICE Electronics Unit #1 9
Equipment AOGNC STR Sodern Hydra JUICE Electronics Unit #2 9
Equipment AOGNC STR Sodern Hydra JUICE Optical Head #1 9
Equipment AOGNC STR Sodern Hydra JUICE Optical Head #2 9
Equipment AOGNC GYRO Selex Galileo Sireus 7
Subsystems COM Communications Subsystem
Equipment COM High Gain Antenna (HGA) 9
Equipment COM Ka-Band Electronic Power Conditioning 2
Equipment COM Ka-Band Electronic Power Conditioning – Redundant
2
Equipment COM Ka-Band Traveling Wave Tube 2
Equipment COM Ka-Band Traveling Wave Tube - Redundant 2
Equipment COM Low Gain Antenna – LHCP 9
Equipment COM Low Gain Antenna – RHCP 9
Equipment COM Radio Frequency Distribution Network 9
Equipment COM X-Band Electronic Power Conditioning 9
Equipment COM X-Band Electronic Power Conditioning – Redundant
9
Equipment COM X/X/Ka-Band Transponder – Redundant 9
Equipment COM X/X/Ka-Band Transponder 9
Equipment COM X-Band Traveling Wave Tube 9
Equipment COM X-Band Traveling Wave Tube - Redundant 9
Subsystems CPROP Chemical Propulsion Subsystem
Equipment CPROP Biprop FillDrain Valves 9 9

Ice Giants CDF Study Report: CDF-187(C)
January 2019 page 387 of 431
ESA UNCLASSIFIED – Releasable to the Public
Equipment CPROP Biprop Filters 4 9
Equipment CPROP Biprop LP Transducer 4 9
Equipment CPROP Biprop Latch Valves 4 9
Equipment CPROP Biprop Non-Return Valves 4 9
Equipment CPROP Biprop Pipes 9
Equipment CPROP Biprop Thruster Main 2 (/1) 7
Equipment CPROP Biprop Pressure Regulator 2 9
Equipment CPROP Biprop Pressurant Tank 2 9
Equipment CPROP Biprop Propellant Tank 4 9
Equipment CPROP Biprop SMA Valves 2 9
Equipment CPROP Biprop RCS Thrusters 16 9
Equipment CPROP Biprop HP Latch Valve 9
Equipment CPROP Biprop HP Transducer 9
Equipment CPROP Biprop Pressurant Tank (small) (only for Neptune)
TBD
Equipment CPROP Biprop Pyro Valves 4 9
Subsystems DH Data-Handling Subsystem
Equipment DH Remote Interface Unit Centralised 5
Equipment DH Remote Interface Unit Decentralised 5
Equipment DH Computer and Data Management Unit #1 6
Equipment DH Computer and Data Management Unit #2 6
Subsystems INS Instruments Subsystem
Equipment INS Camera TBD
Equipment INS Imaging Spectrometer TBD
Equipment INS Ion and Neutral Mass Spectrometer #1 TBD
Equipment INS Ion and Neutral Mass Spectrometer #2 TBD
Equipment INS Ion and Neutral Mass Spectrometer #3 TBD
Equipment INS Instrument Ka-Band Electronic Power Conditioning
TBD
Equipment INS Instrument Ka Band Traveling Wave Tube TBD
Equipment INS Ka-band Trransponder TBD
Equipment INS Magnetometer TBD
Equipment INS Microwave radiometer TBD
Equipment INS Ultra Stable Oscillator (USO) TBD
Subsystems MEC Mechanisms Subsystem
Equipment MEC Deployable magnetometer boom - Pyros
3
9
Equipment MEC SEP stage separation [SC side] TBD
Subsystems PWR Power Subsystem
Equipment PWR Batteries 4 7
Equipment PWR Enhanced Multi-Mission RTG (EMMRTG) 3 4
Equipment PWR External Power Shunt 1 5
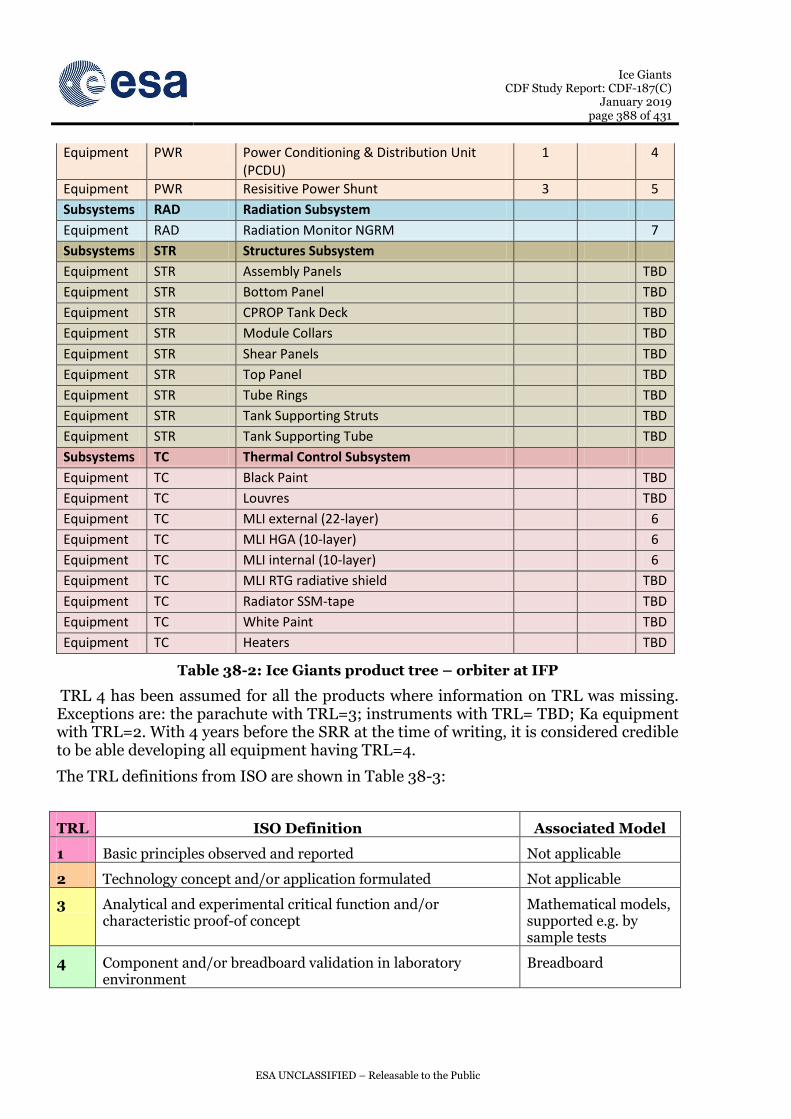
Ice Giants CDF Study Report: CDF-187(C)
January 2019 page 388 of 431
ESA UNCLASSIFIED – Releasable to the Public
Equipment PWR Power Conditioning & Distribution Unit (PCDU)
1 4
Equipment PWR Resisitive Power Shunt 3 5
Subsystems RAD Radiation Subsystem
Equipment RAD Radiation Monitor NGRM 7
Subsystems STR Structures Subsystem
Equipment STR Assembly Panels TBD
Equipment STR Bottom Panel TBD
Equipment STR CPROP Tank Deck TBD
Equipment STR Module Collars TBD
Equipment STR Shear Panels TBD
Equipment STR Top Panel TBD
Equipment STR Tube Rings TBD
Equipment STR Tank Supporting Struts TBD
Equipment STR Tank Supporting Tube TBD
Subsystems TC Thermal Control Subsystem
Equipment TC Black Paint TBD
Equipment TC Louvres TBD
Equipment TC MLI external (22-layer) 6
Equipment TC MLI HGA (10-layer) 6
Equipment TC MLI internal (10-layer) 6
Equipment TC MLI RTG radiative shield TBD
Equipment TC Radiator SSM-tape TBD
Equipment TC White Paint TBD
Equipment TC Heaters TBD
Table 38-2: Ice Giants product tree – orbiter at IFP
TRL 4 has been assumed for all the products where information on TRL was missing. Exceptions are: the parachute with TRL=3; instruments with TRL= TBD; Ka equipment with TRL=2. With 4 years before the SRR at the time of writing, it is considered credible to be able developing all equipment having TRL=4.
The TRL definitions from ISO are shown in Table 38-3:
TRL ISO Definition Associated Model
1 Basic principles observed and reported Not applicable
2 Technology concept and/or application formulated Not applicable
3 Analytical and experimental critical function and/or characteristic proof-of concept
Mathematical models, supported e.g. by sample tests
4 Component and/or breadboard validation in laboratory environment
Breadboard

Ice Giants CDF Study Report: CDF-187(C)
January 2019 page 389 of 431
ESA UNCLASSIFIED – Releasable to the Public
TRL ISO Definition Associated Model
5 Component and/or breadboard critical function verification in a relevant environment
Scaled EM for the critical functions
6 Model demonstrating the critical functions of the element in a relevant environment
Full scale EM, representative for critical functions
7 Model demonstrating the element performance for the operational environment
QM
8 Actual system completed and “flight qualified” through test and demonstration
FM acceptance tested, integrated in the final system
9 Actual system completed and accepted for flight (“flight qualified”)
FM, flight proven
Table 38-3: TRL scale
Although a general statement is made, that only technology sufficiently advanced (TRL) to start the Implementation Phase will be proposed, there are TRL as low as 2, 3, 4 and 5 identified.
Table 38-4 shows an indication of the development time depending on the current TRL. According to the European Space Technology Master Plan, to prepare the contractual basis for multi-annual programs it takes about 18 months to reach political agreement on financial ceiling. This has also been included in the table.
TRL Duration
5-6 4 years + 1.5 year
4-5 6 years + 1.5 year
3-4 8 years + 1.5 year
2-3 10 years + 1.5 year
1-2 12 years + 1.5 year
Table 38-4: TRL – development duration
Assuming, that the development of technology at TRL lower than 6 is already approved and on-going, it can be expected that another 2 years is needed before the implementation phase can start for technologies at TRL 4 and another 4 years for technologies at TRL 3 unless very special effort is made to speed up the development.
38.4 Model Philosophy
The Ice Giants model philosophy is driven by the System Level (NASA), and ESA Elements level will have to agree with NASA the most suitable approach in terms of technical quality, verification effectiveness, schedule constraints and cost affordability. On the basis of these constraints, a model philosophy for the ESA Elements verification by test is proposed.

Ice Giants CDF Study Report: CDF-187(C)
January 2019 page 390 of 431
ESA UNCLASSIFIED – Releasable to the Public
38.4.1 Orbiter
A model philosophy including an Avionics Verification Model (AVM) and the Protoflight Model (PFM) is proposed. As an option, a Structural and Thermal Model (STM) may be added, but it is currently not considered. See the option paragraphs for additional possibilities, not included today.
38.4.1.1 Orbiter AVM
On the Orbiter AVM the functional verification of the on-board electrical system including SW will be accomplished with a number of Element level tests, which procedures, after successful debug and flawless execution, will be then applied to the PFM Orbiter. The newly delivered versions of the on-board SW will be tested on this model before loading them onto the PFM. The AVM will implement EM quality avionic units (see 38.4.1.2) or elegant breadboard quality, if deemed sufficient. The AVM implementation quality shall allow for conducted EMC test, as pre-qualification under EMC CE-CS environment of the Orbiter Element.
This model allows for System level verification with NASA, with the possibility to interface with a NASA System I/F simulator for data traffic verification and power compatibility verification by test. Note that power quality and compatibility with NASA System will have to be verified by test also on the Orbiter PFM.
38.4.1.2 Option: Orbiter EM
As an option to the Orbiter AVM, and depending on the agreements with NASA, an EM quality Orbiter Model may need to be made available. This model would be completely representative of the flight Orbiter in terms of form, electrical interfaces, on-board functions, with the exception of redundancies (hot redundancy if any may need to be implemented); EM quality would be commercial components from the same manufacturer of the flight hi-rel components.
In case NASA request such a model as deliverable to them, this EM would become an additional model as ESA would still need a ground test model (currently the AVM) in support of the PFM AIT and of the flight mission.
38.4.1.3 Orbiter PFM
The flight Orbiter S/C, on which all acceptance tests will be performed, but environmental test will have to be executed at qualification levels (keeping the acceptance durations), i.e. sine vibration test, acoustic vibration test, thermal vacuum and thermal balance, EMC RE-RS (radiated emission and susceptibility).
In the case of a mission where ESA develops the Orbiter and a Probe would be part of the system, the Planetary Probe shall be already integrated at the beginning of the PFM Orbiter environmental test campaign.
38.4.1.4 Option: Orbiter STM
An Element level STM (structural and thermal model) is not currently requested, but it could be accommodated within the margins of the presented schedule, if requested by NASA as deliverable model to System AIT, and as technical risk reduction method.

Ice Giants CDF Study Report: CDF-187(C)
January 2019 page 391 of 431
ESA UNCLASSIFIED – Releasable to the Public
38.4.2 Planetary Probe
Due to the specific characteristic of this product, a risk reduction model philosophy is specified, including a STM, an AVM and the PFM.
38.4.2.1 Planetary Probe STM
The Planetary Probe STM shall be fully representative of the flight structure and thermal control of the flight probe, including external and internal interfaces. It will be subjected to a full qualification test campaign including sine, acoustic vibration and shock, thermal balance and all supplementary tests as required like e.g. alignment and leakage if required. It could be used on the Orbiter STM, in case the latter is built up.
38.4.2.2 Planetary Probe AVM
As per Orbiter (38.4.1.1), in addition it will be integrated to the (NASA) Orbiter AVM for Integrated Orbiter functional tests. Interfaces, power compatibility and data exchange with the Orbiter will be verified there.
38.4.2.3 Planetary Probe FM
The flight probe will be acceptance tested (including environmental acceptance), then delivered to the Orbiter AIT site for integration and joint environmental testing.
38.4.3 Instruments
The instruments of both Orbiter and Probe shall comply with the model philosophy of their carriers. In specific case, and upon Instrument Consortium decision, it may be necessary to procure unit level Qualification Models (QM) or Engineering Qualification Models (EQM) to achieve full performance and environmental qualification by test on selected units (in general all newly designed units, or with substantial design modification from off-the-shelf units). QM units are identical in all parts to their corresponding flight units, while EQM units are the same as QM and FM, but with lower quality EEE components, see 38.4.1.2).
38.5 Development Approach
The proposed development approach makes reference to the following assumptions: TRL = 6 for all products and components by the SRR, and a Mission Adoption by early 2023, with about 6 months time to place the contracts to the product suppliers. Particular attention shall be placed in the contract assignation phase, as the critical products (schedule and TRL critical) should get priority. A special mention to the parachute procurement, as the past heritage is not in favour of smooth procurement; the selection of the Subcontractor for this product should be anticipated if possible.
The ESA Program logic needs to be properly phased with the NASA system development logic. In theory, the Program Milestones on ESA and NASA side shall be consistent with a logic where the System Level (NASA) PDR is first performed, with Element level (ESA) PDR following, then all Subcontractors PDR’s . CDR logic shall be with Subcontractors CDR’s first, followed by Element level (ESA) CDR, concluding then with the System (NASA) CDR. This sequence of events can be jeopardised by the different way ESA and NASA confirm their projects are financed. This difference may be substantial, impacting ESA funding efficiency and, as a consequence, schedule organisation with milestones

Ice Giants CDF Study Report: CDF-187(C)
January 2019 page 392 of 431
ESA UNCLASSIFIED – Releasable to the Public
logic as well. The timely release of a given budget to Industry is of outmost importance for the proper progress of the project development. Besides, adapting to the pace of a project with another International Organisation (i.e. NASA in this case) leading the master schedule and the system interfaces, may be challenging. As a minimum, a larger management reserve should be considered for this specific kind of projects. Greater schedule margins should also be taken, but that is more complicated, being possible only by using consolidated design and trying to anticipate the procurement of time or design critical products. This practice would anyway increase the technical risk, where the schedule risk is more unpredictable, as the external interface definition is in the hands of NASA, leaving ESA more exposed than usual to the risks deriving from late changes of the (NASA) system design.
Some development guidelines can be proposed though, in order to minimise the programmatic risks (details in the risk chapter) that are associated to a joint NASA/ESA Project.
38.5.1 Orbiter Development
An aggressive approach is proposed, with Avionics Verification Model (AVM) and Protoflight Model. This approach is made possible by the adequate heritage and experience the European Industry have acquired w.r.t. the planetary orbiter S/C, i.e. Mars Express, Venus Express, Trace Gas Orbiter (Mars orbiter), JUICE (Jupiter Orbiter and planetary probe, under development).
The Orbiter PFM can be independently tested from the rest of the NASA System, until its completion of environmental test campaign. After that, it will have to be delivered to NASA for their completion of the system Level AIT in US.
There are some exceptions to the above, as follows:
38.5.1.1 Additional STM
The need for the procurement and testing of an Orbiter STM is subject to agreements with NASA. It is currently assumed that NASA does not require such a model for their integrated composite testing in US. However, the currently proposed schedule shows a proper margin of time to accommodate the procurement and AIT of such a model. That may become an ESA project’s choice in order to reduce the technical risk associated to the definition of the mechanical and thermal design of the Orbiter.
38.5.1.2 Electrical Interface Testing
The external interfaces between NASA S/C System and the Orbiter will be verified by test. The electrical interfaces will be verified in EU by the provision by NASA of an Electrical Interface Simulator (NEIS). NASA will have to verify their side of the interface with the Orbiter, therefore ESA shall provide an Orbiter EIS (OEIS) representing Orbiter power and data characteristics. A proper way to verify the mechanical interfaces shall be investigated in the next phase.
38.5.1.3 Interface Functional Test
A reduced configuration of the AVM may be delivered to NASA for a limited time, in order to test the Orbiter to system S/C integrated functions and electrical performances.

Ice Giants CDF Study Report: CDF-187(C)
January 2019 page 393 of 431
ESA UNCLASSIFIED – Releasable to the Public
The way to do this and how to accommodate this activity into the schedule is not described in this study.
38.5.1.4 RTG and RHU
The nuclear equipment planned to be part of the Ice Giants project design, is currently also included into the design of the ESA elements. The assumption here taken is that no activity with active nuclear devices will be performed in Europe. The RTG’s and RHU’s will be replaced by simulators (i.e. mechanical and thermal simulators) able to represent the relevant properties during environmental testing, excluding the nuclear radiation.
It is recommended that the simulators of these devices are NASA furnished equipment. As an alternative, NASA my need to provide the ICD’s of them, for European Industry procurement.
The integration of flight RTG’s and RHU’s in US will be performed by specialised NASA personnel.
38.5.2 Planetary Probe Development
There is some heritage in Europe for the development of planetary probes, the most successful being Huygens (Titan Lander) in the frame of the joint ESA/NASA Cassini-Huygens mission to the moons of Saturn. The last lander was Schiaparelli, ExoMars 2016 Mission, that despite ill-fated was able to procure a massive amount of positive data, useful in the context of the design of this new program.
To begin with, also the development of the Probe can be decoupled from that of the Orbiter. In this case, decoupling is possible until the beginning of the Orbiter level environmental test campaign. In case of later availability of the Probe, it could be replaced by its STM until the beginning of the last orbiter Integrated System Test. In this case though, the technical risk would increase, due to lack of integrated mechanical, thermal and EMC test.
It is necessary to introduce now the Probe Model Philosophy. It is described in para. 38.4.2 and sub-paragraphs. It is inherited from the ExoMars 2016 model philosophy, with some adaptation to the current context.
It is important here to highlight the criticalities of the development, mostly lying on the parachute System, the Thermal Protection Subsystem, TPS (and the Heat Shield) and the radiation environment.
Depending on the project choices, and due to Jupiter flyby, the radiation environment is critical and affects the design of the ESA elements. This aspect is described in the relevant design chapters of this report, and definitely affect the procurement, the lead time of the components, and therefore the procurement schedule. This subject is not explicitly shown in the schedule as it is assumed that at the time of Mission Adoption a procurement strategy has been defined, based on the project mission and design choices.
The Parachute System is a critical development that may lead to a need for late integration, jeopardising the completeness of the environmental test campaign of the Planetary Probe. The schedule and programmatic risk here is deemed high, as well as the technical risk if the Probe cannot be tested in a complete configuration. The design

Ice Giants CDF Study Report: CDF-187(C)
January 2019 page 394 of 431
ESA UNCLASSIFIED – Releasable to the Public
of the Parachute system would be custom for this mission, it needs specific wind tunnel tests (possibly for 1:1 scale testing, with few facilities in the world able to accommodate such tests) and airborne drop test of complex preparation; it is recommended to anticipate the procurement of this product. This implies an early effort into the design, with a risk related to the low maturity of the system level design.
The Heat Shield and its TPS can be designed, manufactured and tested in Europe. It is recommended to avoid building expensive high power thermal flux test facility allowing 1:1 scale testing, as the development and cost effort is not deemed worth the anyway questionable results that can be obtained. It is assumed in the context of this study that the verification of the TPS against the entry heat flux can be achieved by analysis, supported by sample level testing on the TPS material samples, tests that can be performed in Europe, with a number of suitable test facilities being available. Note that in the proposed schedule in the following chapters, the TPS and heat shield procurement are not highlighted.
38.5.3 Test Matrix
To provide a first insight on the test activities that are required to qualify and accept the orbiter and optionally the Planetary Probe, the following test matrices are proposed. Testing shall anyway be planned according to the requirements of ECSS-E-10-03C European Test Standard, that would probably need tailoring to the Ice Giants project.
38.5.3.1 Orbiter Test matrix
Table 38-5: Orbiter test matrix

Ice Giants CDF Study Report: CDF-187(C)
January 2019 page 395 of 431
ESA UNCLASSIFIED – Releasable to the Public
38.5.3.2 Planetary Probe Test Matrix
Table 38-6: Planetary probe test matrix
38.5.3.3 Special Case: Parachute System and Aeroshell Test Matrix
Note: the detail of equipment level test is not provided. Ref.: ExoMars 2016
PDD: Parachute Deployment Device
Table 38-7: Special case and parachute system and aeroshell test matrix
38.6 Schedule
For ease of reading, the schedule is split into two parts, the first showing the ESA Orbiter and NASA System AIT, the second showing the Planetary Probe.

Ice Giants CDF Study Report: CDF-187(C)
January 2019 page 396 of 431
ESA UNCLASSIFIED – Releasable to the Public
38.6.1 Orbiter Schedule
Figure 38-1: Orbiter Schedule

Ice Giants CDF Study Report: CDF-187(C)
January 2019 page 397 of 431
ESA UNCLASSIFIED – Releasable to the Public
38.6.2 Planetary Probe Schedule
Figure 38-2: Planetary Probe Schedule

Ice Giants CDF Study Report: CDF-187(C)
January 2019 page 398 of 431
ESA UNCLASSIFIED – Releasable to the Public
38.6.3 Back-up Data: ExoMars 2016 Schiaparelli Probe
Figure 38-3: Back-up Data Schedule

Ice Giants CDF Study Report: CDF-187(C)
January 2019 page 399 of 431
ESA UNCLASSIFIED – Releasable to the Public
38.7 Summary and Recommendations
In summary, the proposed approach is compliant with the programmatic requirements.
It is recommended that NASA provides a definition of System Model Philosophy in order for ESA to begin with a negotiation based on their current proposal for the orbiter.
It is important to assess the real scope of the Program on ESA side, in order to cope with the main challenges, that are mostly on the management of the programmatic differences between ESA and NASA on the funding and milestones logic, and on the different ways to activate their Industry.
On ESA side, technical criticalities are on the radiation environment for their elements, and on the Parachute procurement for a Planetary Probe. The TPS is a special procurement to be taken under special observation.

Ice Giants CDF Study Report: CDF-187(C)
January 2019 page 400 of 431
ESA UNCLASSIFIED – Releasable to the Public
This Page Intentionally Blank

Ice Giants CDF Study Report: CDF-187(C)
January 2019 page 401 of 431
ESA UNCLASSIFIED – Releasable to the Public
39 COST
This chapter intentionally removed from this version of the report.

Ice Giants CDF Study Report: CDF-187(C)
January 2019 page 402 of 431
ESA UNCLASSIFIED – Releasable to the Public
This Page Intentionally Blank

Ice Giants CDF Study Report: CDF-187(C)
January 2019 page 403 of 431
ESA UNCLASSIFIED – Releasable to the Public
40 CONCLUSIONS
40.1 Satisfaction of Study Objectives
M* Ice Giants Objectives have been successfully achieved.
Study Objective Achievement
(Y/N)
Remarks
1. Assess the possible European contribution to a NASA-led mission to the Ice Giants with launch in 2029-2034.
Y Study Options identification and down-selection explored diverse architectures for cooperation, in line with the specified timeline and scientific objectives
2. Establish conceptual design for the key European element(s) in order to identify the required resources and define the interfaces with the international partner.
Y Addressed by requirements formulation / design / sensitivity analysis / trade-offs
3. Highlight the technological areas for which mission-enabling developments would be required.
Y Addressed by requirements formulation / design / sensitivity analysis / trade-offs / gaps identification / technology readiness assessment
4. Define the programmatic approach and the schedule constraints for the studied option(s).
Y M* Ice Giants Team included Programmatics expert and specialists with extensive experience in providing required inputs (heritage /TRLs)
5. Assess the mission cost for the studied option(s), taking into account that the ESA contribution shall fit within an M-class mission budget, i.e. 550 MEuro (excluding Member State contributions such as payloads).
Y M* Ice Giants Team included Cost expert and specialists with extensive experience in providing required inputs (heritage /TRLs)
40.2 Probe
40.2.1 Major Findings
The PEP CDF Study was taken as a reference for the probe assessment: only deltas with respect to PEP have been assessed in the M* Ice Giants CDF Study (Note: M* is ~ 345 kg and PEP was ~ 315 kg).
Relevant findings are hereafter summarised.

Ice Giants CDF Study Report: CDF-187(C)
January 2019 page 404 of 431
ESA UNCLASSIFIED – Releasable to the Public
40.2.1.1 Mass
Despite the lower entry velocity (inertial entry velocity was estimated to be ~23 km/s at the beginning of the study, while in PEP it was 24.7 km/s, although this was later revised for M* Ice Giants to 25 km/s) with respect to PEP, the expected mass savings for the TPS did not materialise, as current available knowledge about TPS materials invalidated the optimistic estimates assumed in PEP (2010 timeframe).
In particular, the front shield thickness and mass increased by ~50% compared to the PEP baseline (PEP Front Shield Mass: 73 kg – M* Ice Giants FS Mass: 107 kg)
In addition, the atmospheric pressure range for operations identified as of scientific interest for M* Ice Giants (between 1 and 10 bars) was significantly less than the 100 bars upper limit for PEP, resulting in:
A lighter pressure vessel structure (~30 kg less than PEP)
A bigger parachute (as the M* Ice Giants descent timeline foresees 90 mins from 1 to 10 bars, while in PEP the PAS would only sustain the probe descent from 1 to 10 bar in 30 mins, followed by a free fall from 10 to 100 bars in 60 mins – hence requiring significantly less deceleration). As such the M* Ice Giants baseline includes 2 subsonic PAS with ~ 10 kg increase in mass compared to PEP.
The mass increase of the TPS and PAS implied a higher ballistic coefficient, leading to higher heat fluxes and loads, and thus a further increase in the TPS thickness.
In order to limit the ballistic coefficient increase (avoiding further heat flux and load increases), and to accommodate the 2 parachutes, a 10 cm probe diameter increase was baselined. This decision then had a second order mass increase on the probe structure and TPS, which increased along with the increased geometry.
A mass reduction of ~10 kg with respect to PEP for the DHS was achieved via the latest technology developments in the DHS field.
40.2.1.2 RHUs
Given a change to the operations concept such that only timers are switched ON during the coast phase, and no thermal boost before separation from the orbiter, 31 RHUs are considered necessary to survive the 20-day coast phase. These were not considered during the PEP design.
40.2.2 Open Points
The following open points have been identified at the end of the M* Ice Giants study:
A further consolidation of heat fluxes and loads should be performed, injecting also understanding of the margin policy adopted by NASA partners, for alignment between parties.
As a result of the heat fluxes/loads updates, further iterations on the TPS should be performed (including the subsequent impacts on PAS/accommodation/structures and ballistic coefficient), until an optimal convergence is obtained.
A material trade-off for the TPS should also be performed between:

Ice Giants CDF Study Report: CDF-187(C)
January 2019 page 405 of 431
ESA UNCLASSIFIED – Releasable to the Public
o Classical fully dense carbon-phenolic ablators (similar to NASA FM5055 used for the Galileo probe, at higher loads compared to the ones computed in M*). These are available in Europe with large annual production rates as they are supplied for nozzles on various launchers and missiles.
o C-C ceramic materials – characterised by high maturity and flight heritage, however they have never been tested to the heat loads expected for Neptune and Uranus entry.
Independently from the TPS material considered, no facility is currently available worldwide, which could provide representative test conditions close to those predicted for the mission. For the Jupiter Galileo probe a very large plasma wind tunnel facility was specifically built; since then, there was no other use for the facility, and it was dismantled. Absence of adequate test facilities implies that only testing at sample level could be performed, requiring high margins to be taken in the design.
The dynamic pressure impact on the structural mass should be duly assessed, as during the M* Ice Giants Study time constraints did not allow for a further iteration of the structures subsystem in relation to this aspect.
The probe aerodynamic stability must be ensured by design, and it was noted that the final baselined M* Ice Giants probe design would not achieve this. This was due to final changes to the configuration and mass parameters during the IFP with no time to make the necessary further analysis and amendments. In any case, with the other above-listed optimisations and open points still to be addressed, it is considered wise to leave this issue as future work.
40.2.3 Areas for Further Investigation
A dedicated further Probe study is highly recommended, as the CDF Study highlighted that the requirements and constraints for M* Ice Giants are such that the probe cannot just be considered a delta-design with respect to PEP, as it was originally assumed during the Study preparation phase.
In particular, a dedicated study should focus on the following issues:
Payload operational timeline and scientific requirements shall be clearly identified, as both the required atmospheric pressure level and scientific measurements duration have an impact on the design.
The impacts of the 50 g deceleration on the instruments shall be checked.
Radiation effects on the payload shall be assessed.
The impact of the communications black-out during entry and descent (0 deg elevation for 10 minutes) shall be addressed.
The estimated DHS mass of 1 kg shall be revisited (considered too optimistic)
The pressure vessel (DM) structural mass shall be computed via a more detailed analysis.
The pressure load on the FS shall be analysed.
The need of a hot structure for the FS shall be reassessed (no significant benefit is recognised at -35 deg FPA).

Ice Giants CDF Study Report: CDF-187(C)
January 2019 page 406 of 431
ESA UNCLASSIFIED – Releasable to the Public
The payload mass could be revisited, in order to target an increase (baseline design includes a 11.10 kg payload, however the scientific community has identified a ~20 kg class payload suite which represents a more scientifically meaningful case):
o By reducing the data rate (e.g. by 50%) the power demand decreases linearly together with the mass of the batteries (as 73% of the energy of the probe is dedicated to communications). This mass saving from the batteries could be re-allocated to the payload;
Note: With 38,000 km orbiter-probe range and at 80 W RF Power TWTA = 10.8 Mb data is generated in 90 mins at 2 kbps (a significantly larger data volume than for the Galileo Probe by a factor ~3, which considered 1 kbps for ca. 60 mins -> total 3.6 Mb)
o By reducing the distance between the orbiter and probe (at the cost of some delta-V) the communications power (and thus battery mass) would also decrease and this mass could be allocated to the payload;
o By reducing the duration of the descent operations (e.g. from 90 mins to 60 mins), both parachute and battery mass could be saved in favour of the payload.
A FPA = -18 deg could be considered:
o Note that -35 deg was retained for the M* Ice Giants baseline because of the requirement for Direct-To-Earth (DTE) link visibility during entry. This also allowed for greater reuse of the PEP analysis and design (same FPA), which had been recommended at the beginning of the Study;
o -18 deg would allow usage of European test facilities for the TPS (for sample level testing)
o The overall TPS mass impact must still be traded-off (lower heat flux, higher heat loads)
For the Uranus case, the M* Ice Giants study has assumed identical entry conditions and atmosphere as for Neptune case: a dedicated study shall take into account peculiarities and address ad-hoc design solutions.
The datahandling subsystem design needs to be revisited and flown down to all the other subsystems due to a design change after IFP.
40.3 Orbiter
40.3.1 Major Findings
Relevant findings concerning the Orbiter design are hereafter summarised:
The scientific requirement of downloading 32 Gb data volume at the end of the mission (assumed 50 days orbit) is challenging for the Neptune case:
o In order to meet the requirements, an extended mission duration, on top of the nominal 2 years mission lifetime would be required (see Systems Chapter for details). However:
RTGs EOL power still to be confirmed

Ice Giants CDF Study Report: CDF-187(C)
January 2019 page 407 of 431
ESA UNCLASSIFIED – Releasable to the Public
Energy excess in longer considered orbits (e.g. 100 days and 75 days) could be used to modify the timeline and perform more science when more energy is available;
The orbits were modelled such that there were 50 /75 /100 days periods, however in reality there will be a gradual reduction across the periods, allowing for more data to be downloaded;
The actual orbits used for science operations may also look very different to the 50 / 75 / 100 days profiles considered. This would require further iterations between mission analysis, the system and the payload teams.
An upgrade on the ground segment could compensate for the limited resources available on board (current baseline is an array of 2 G/S’s, however this could be increased further);
The possibility might exist for using the NASA Deep Space Network to augment the ESA ground station network.
For the Uranus case the data volume downloadable is 53 Gb (with the same communications design as for Neptune).
3 RTGs are essential to enable any type of useful science, even for the Uranus case.
In a dual orbiter scenario the need for 3 RTGs would imply a high number of RTGs (6+), with the following issues to be considered:
o RTG production rate (~8 years required for 3 eMMRTGs)
o Launch and launch site safety requirements
o Ground facilities availability for integration
o Feasibility of integration through fairing doors
Trajectory to target Uranus and – in particular – flyby at Jupiter might impose stringent requirements for radiation tolerance of up to 155 krad for sensitive equipment (with shielding of 4 mm Al). There is also much uncertainty in the estimation of the radiation environment which requires further work.
Technology developments shall be compatible with the programmatic requirement of TRL 6 by end of 2022 (corresponding milestone: mission adoption) for launch on 13 February 2031.
40.3.2 Open Points
The following open points have been identified at the end of the M* Ice Giants study:
The payload timeline should be consolidated, tailoring it to balance the science objectives with the limits of available resources (particularly power/data). An example could be performing less science at planetary periapsis during the shorter orbits. Such orbits were expected to occur at the end of the mission, by which point the planetary science should already be well characterised. This allows focussing the shorter orbits (which are severely energy constrained) on the Moon flyby science.
The instruments duty cycles could be reconsidered (e.g. whether the USO must be ON at all times). Due to the energy constraints, any device always ON (even at low power) constrains the operation of other instruments or communications.

Ice Giants CDF Study Report: CDF-187(C)
January 2019 page 408 of 431
ESA UNCLASSIFIED – Releasable to the Public
The RTG characteristics should be better understood:
o Power degradation characteristics (especially EOL power output)
o Number of RTGs that could actually be made available to an ESA mission element
Dual orbiter accommodation inside the launcher vehicle trade-off shall be performed.
Minimal distance between the 2 main engines of the Neptune Orbiter (as per the current baseline) should be checked for thermal and attitude control (e.g. misalignment) implications. The alternative of embarking a single main engine could be a solution (as for the Uranus design case), although this would add additional propellant mass due to gravity losses. Note that a similar issue was faced for ExoMars, and the lessons learned from this could be incorporated.
The HGA diameter (assumed in the current baseline as 3m) could be reassessed, as the assumed dual launch on an SLS launcher (stacked configuration) would seem to allow enlarging this. In addition, an antenna pointing capability (not baselined in the current design) could also be assessed.
The structural mass of the design (~7% of the wet mass) is considered optimistic and should be revisited.
40.3.3 Areas for Further Investigation
Alternative Jupiter flybys for targeting Uranus via different launch dates should be carefully investigated, should the radiation tolerance of equipment prove insufficient. The sensitivity of the radiation environment to launch date should also be better understood. A detailed assessment of the radiation environment must be performed as large uncertainties currently exist, in order to determine requirements for shielding mass and any required technology developments / qualification.
Alternative radiation shielding materials could be traded off to target mass savings.
Alternative science tours should be investigated, along with the implications on the mission timeline and scientific data return.
Energy excess available during cruise (in particular at Jupiter) could be considered for science usage.
Dedicated design for a specific planet could bring optimization to some of the subsystems (e.g. smaller propellant tanks, structures, reduced communications powers, etc).
o Note: due to limited amount of time in the frame of the CDF Study, the orbiter design has been kept identical for both planets. This approach offers an advantage in case one party develops the two orbiters (recurrent).
The implications of the launch profile and configuration should be assessed, including requirements for late access under the fairing (e.g. RTGs, RTUs), coupled loads, available volume for antennae and other large structures. In addition, the profile of the cruise (up until separation of the ESA orbiter from the NASA orbiter) should be discussed with NASA to harmonise assumptions.

Ice Giants CDF Study Report: CDF-187(C)
January 2019 page 409 of 431
ESA UNCLASSIFIED – Releasable to the Public
The datahandling subsystem design needs to be revisited and flown down to all the other subsystems due to a design change after IFP.
40.4 Lander
40.4.1 Requirements and Assumptions
One design session of the CDF M* Ice Giants Study was dedicated to perform a high-level feasibility assessment for a Lander at Triton, Neptune’s largest Moon. This was envisioned to deliver a payload of 11.18 kg to the surface.
The main requirements considered were as follows:
The Triton Lander shall be released from Triton flyby.
The Triton Lander shall perform a soft landing manoeuvre.
The Triton Lander shall operate during one week of lifetime.
Figure 40-1: Lander release from Triton flyby
It was assumed that there is no atmospheric contribution to braking (or heating), and the worst-case delta-v for performing a soft landing would be 4,637 m/s (see Figure 40-1).
40.4.2 Major Findings
A rough scaling exercise from an existing lander study was performed, in order to derive a quick relationship as displayed in the graph below. Note that this does not include the impacts of propellant tank and surrounding structure sizing as a function of wet mass, and as such is considered optimistic at higher wet masses.

Ice Giants CDF Study Report: CDF-187(C)
January 2019 page 410 of 431
ESA UNCLASSIFIED – Releasable to the Public
Figure 40-2: Variation of Lander wet mass with payload mass
As can be seen, in order to land ~10 kg payload from Triton flyby, it was calculated that a Lander of wet mass of approximately 2.0-2.5 tons would be required.
40.4.3 Open Points and Areas for Further Investigation
The following open points and areas for further investigation have been identified at the end of the M* Ice Giants session dedicated to the Lander:
Plume impingement contamination during descent
Landing gear sizing coping with unknown surface characteristics
Lander release strategy (from flyby or from orbit) and impact on lander and carrier (orbiter)
Visibility (range, elevation) of the carrier (orbiter) for communication relay.
A list of main technology developments has been identified:
Subsystem Technology
PROPULSION Throttled / pulsed propulsion capabilities in a closed-loop GNC system for the final descent manoeuvre
GNC Dual-use LIDAR, hazard-detection-avoidance and altimeter
POWER Combined avionics/power unit approach, as “Minavio” concept
OPERATIONS Array of up to 4 ground stations, with 2 receiver-only antennas, and 2 Transmitting + receiving
40.5 Additional Observations
During the Internal Final Presentation, further discussions with NASA were identified as highly beneficial to harmonise assumptions, exchange design-relevant expertise (e.g. radiation analysis, atmospheric entry) and to discuss potential areas of shared interest
0.0
1000.0
2000.0
3000.0
4000.0
5000.0
0.0 5.0 10.0 15.0 20.0Lan
der
wet
mas
s (k
g)
Payload mass (kg)
Variation of lander wet mass with payload mass
Triton flyby Triton orbit

Ice Giants CDF Study Report: CDF-187(C)
January 2019 page 411 of 431
ESA UNCLASSIFIED – Releasable to the Public
such as on ground station usage and RTGs. Further to this, a few additional observations were recorded and are hereafter reported for completeness:
Scientific Objectives
A mission including an Orbiter and a Probe to the same planet would cover most of the scientific objectives, however both planets have unique aspects that are of high interest for the scientific community. A trade-off between addressing only one planet (covering all science objectives) or two planets (addressing less scientific objectives) must be performed as part of future work.
Critical Technical Issues
The following main technical issues were highlighted for the probe:
PAS procurement should be performed with an approach to minimise risks (based on negative experience from ExoMars, with supplier bankruptcy)
TPS full testing should be avoided in order to save on cost and schedule. Sample testing and sufficient design margin should rather be adopted.

Ice Giants CDF Study Report: CDF-187(C)
January 2019 page 412 of 431
ESA UNCLASSIFIED – Releasable to the Public
This Page Intentionally Blank

Ice Giants CDF Study Report: CDF-187(C)
January 2019 page 413 of 431
ESA UNCLASSIFIED – Releasable to the Public
41 REFERENCES
41.1.1.1 Chapter 3 Science Objectives References
RD[1] Ice Giants Pre-Decadal Study Final Report, JPL D-100520, June 2017
RD[2] Solar System Ice Giants: Exoplanets in our Backyard, Exoplanet Science Strategy White Paper, submitted to the US National Academies of Sciences, Engineering and Medicine, Space Studies Board, 9 March 2018 [https://arxiv.org/abs/1804.03573]
RD[3] Neptune and Triton: Essential pieces of the Solar System puzzle, A. Masters et al., Planetary and Space Science, 104 (2014), 108–121
RD[4] Outer Solar System Exploration: A Compelling and Unified Dual Mission Decadal Strategy for Exploring Uranus, Neptune, Triton, Dwarf Planets, and Small KBOs and Centaurs, Amy A. Simon et al. white paper submitted, 2018 [https://arxiv.org/abs/1807.08769]
RD[5] Scientific rationale for Uranus and Neptune in situ explorations, Mousis et al., Planetary and Space Science 155 (2018) 12–40
RD[6] The Comparative Exploration of the Ice Giant Planets with Twin Spacecraft: Unveiling the History of our Solar System. Turrini D., et al., Planetary & Space Science 104 (2014), 93-107.
41.1.1.2 Chapter 4 Neptune Mission Analysis References
RD[7] CDF Study Report PEP CDF-106 European Space Agency, July 2010. PEP (V), Planetary Entry Probe to Venus, CDF-106(A), PEP (SUN), Planetary Entry Probe to Saturn, Uranus and Neptune, CDF-106(B)
41.1.1.3 Chapter 5 Neptune Systems References
RD[8] Space Launch System (SLS), Mission Planner’s Guide, ESD 30000, NASA, Initial Baseline, 12 April 2017
41.1.1.4 Chapter 6 Neptune Payload References
RD[9] Scientific rationale for Uranus and Neptune in situ explorations, Mousis, O., et al., Planetary and Space Science, Volume 155, p. 12-40, 2018
RD[10] The Hera Saturn entry probe mission, Mousis, O., et al., Planetary and Space Science 130, p. 80-103, 2016
RD[11] Scientific rationale for Saturn's in situ exploration. Mousis, O. et al., Planetary and Space Science 104, p. 29-47, 2014
41.1.1.5 Chapter 8 Neptune Structures References
RD[12] Reference Roark’s formulas for Stress and Strain, 7th Edition, page 737, Table 15.2, number 22.
RD[13] 2017-04-SLS-MissionPlanersGuide-0005323

Ice Giants CDF Study Report: CDF-187(C)
January 2019 page 414 of 431
ESA UNCLASSIFIED – Releasable to the Public
41.1.1.6 Chapter 9 Neptune Mechanisms References
RD[14] Huygens separation mechanisms. Dr. Udo R. Herlach, P. Tatalias, B. Schmid, D. Musset.
RD[15] Development of a deployable arm to hold mirrors for space interferometric instrument. Mansoor, Zain.
RD[16] Dynamics and robust adaptive control of a deployable boom for a space probe. ZhongYi Chu, YiAn Lei, Dan Li
41.1.1.7 Chapter 10 Neptune Propulsion References
RD[17] (LEROS 4B - http://www.lolannaicker.com/documents/SP2014_2969298.pdf)
RD[18] (http://www.space-propulsion.com/spacecraft-propulsion/bipropellant-thrusters/10-bipropellant-thrusters.html)
RD[19] (http://epic-src.eu/wp-content/uploads/21_EPICWorkshop2017_ARIANEGROUP_2017-10-25-SMA-Presentation_EPIC.pdf)
RD[20] (https://www.rocket.com/files/aerojet/documents/Capabilities/PDFs/Bipropellant%20Data%20Sheets.pdf)
RD[21] (http://www.space-propulsion.com/spacecraft-propulsion/hydrazine-thrusters/20n-hydrazine-thruster.html)
41.1.1.8 Chapter 11 Neptune AOCS References
RD[22] Star sensing Based Safe Mode, TRP Final Report – ESA contract 4000112606/14/NL/MH, Airbus Defence & Space, 2017
RD[23] Hydra Star Tracker for JUICE Mission, AAS guidance and control conference, Breckenridge, B. Gelin, G. Montay, Y. Henriquel, J-F. Bouvry, P. Regnier and D. Gherardi, 2018
RD[24] Design of a vision-based navigation camera for JUICE, ESA guidance, navigation and control conference, L. Nicollet, C. Chalté, L. Majewski, M. Beaumel, M. Chapuy, K. Kanani, D. Gherardi, 2017
RD[25] Magnetic Fields of the Outer Planets, Space Science, C. Russell, M. Dougherty, 2010
41.1.1.9 Chapter 12 Neptune GNC References
RD[26] Cassini/Huygens Interface Requirements Documents, section 2.4.2 (probe delivery) and section 2.4.3 (release), December 30, 1994
RD[27] Huygens Mission Operations Plan, section 3.3.4 (probe separation), 16 December 2004
41.1.1.10 Chapter 13 Neptune Power References
RD[28] United States Government Accountability Office: Report to Congressional Requestors. GAO-17-673. September 2017.

Ice Giants CDF Study Report: CDF-187(C)
January 2019 page 415 of 431
ESA UNCLASSIFIED – Releasable to the Public
41.1.1.11 Chapter 14 Neptune Telecommunications References
RD[29] ECSS-E-ST-50C Rev. 2, Radio Frequency and Modulation, 4 October 2011, complemented with CCSDS 131.2-B.1, Flexible advanced coding and modulation scheme for high rate telemetry applications, March 2012.
RD[30] ECSS-E-50-04C, Telecommand protocols synchronization and channel coding, 31 July 2008 complemented with CCSDS 231.B-3, TC synchronization and channel coding, September 2017.
RD[31] ECSS-E-50-01C, Telemetry synchronization and channel coding, 31 July 2008.
RD[32] ECSS-E-50-02C, Ranging and Doppler Tracking, 31 July 2007, complemented with CCSDS 4.1.4-B-2, Pseudo-Noise (PN) Ranging Systems.
RD[33] Space frequency coordination group (SFCG), resolutions and recommendations available at www.sfcgonline.org.
41.1.1.12 Chapter 15 Neptune Data Handling References
RD[34] SAVOIR Generic OBC Specification, SAVOIR-GS-001 Is. 1, rev1 10-Feb. 2015
RD[35] SAVOIR Functional Reference Architecture, SAVOIR-TN-001 Is. 1, rev4. 4-Dec.-2015
RD[36] ECSS-E-ST-50-12C
RD[37] ECSS-E-ST-50-13C
RD[38] ECSS-E-ST-50-14C
RD[39] ECSS-E-ST-50-15C
RD[40] Extremely Low Power Timer Board EM for Landers - Summary Report - ELPT.TNËOOI2-RSA, 28 Nov 2013
41.1.1.13 Chapter 16 Neptune Thermal References
RD[41] Thermal Protection System Technology and Facility Needs for Demanding Future Planetary Missions; B. Laub and E. Venkatapathy, NASA Ames Research Center; IPPW-2003
RD[42] Overview of Heatshield for Extreme Entry Environment Technology (HEEET) Project; D. Ellerby et al; IPPW-2018
RD[43] Heatshield for Extreme Entry Environment Technology (HEEET) Development Status; D. Ellerby et al; IPPW-2016
RD[44] Investigation and Testing of High Performance to Mass Value Heatshields for Planetary Entry Systems; R. Roumeas (ESA-ESTEC), T. Pichon and A. Lacombe (both SEP division, SNECMA); ESA Bulletin 94, May 1998
RD[45] Advanced Joining Technologies For Hot Structures, J. Barcena et al., Tecnalia; 8th European TPS&HS workshop, 2016
41.1.1.14 Chapter 17 Neptune Aerothermodynamics References
RD[46] Neptune Aerocapture Systems Analysis, Mary Kae Lockwood, NASA Langley Research Center, Hampton, Virginia

Ice Giants CDF Study Report: CDF-187(C)
January 2019 page 416 of 431
ESA UNCLASSIFIED – Releasable to the Public
RD[47] CDF Study Report CDF-043(A), JEP Planetary Entry Probes to Jupiter , ESAT-ESTEC, Dec 2005
RD[48] J.P. Huot, ESA-ESTEC 2010, internal ESTEC communication
RD[49] Aurora Program Earth reentry demonstrator EVD, 2005
RD[50] Program TRAJ3D Three degree of freedom planetary entry and descent trajectory simulation user manual. Fluid Gravity Engineering LTD
RD[51] Hannah Boehrk , “Zur induktiven Nachheizung einer Überschallwasserstoffströmung ” , PhD thesis , 2009
RD[52] S. Loehle, IRS private communication 2019
41.1.1.15 Chapter 18 Neptune EDS Parachute References
RD[53] Software User Manual, Aerodynamic Design Tool for Parachutes and Enhancing Test Facilities for Parachutes. VOR-UM-1301. Contract Number 4000105673/NL/CP.
RD[54] Galileo Parachute System Performance, H. McMenamin, 14th Aerodynamic Decelerator Systems Technology Conference AIAA-97-1510.
41.1.1.16 Chapter 34 Triton Lander References
RD[55] Europa Lander Study. 2016 Report. Europa Lander Mission Pre-Phase A. JPL D-97667. https://europa.nasa.gov/resources/58/europa-lander-study-2016-report/
RD[56] Europa Lander SDT Report & Mission Concept OPAG. Feb 22, 2017, Atlanta, GA.https://www.lpi.usra.edu/opag/meetings/feb2017/presentations/Hand.pdf
RD[57] Landing on Europa: Key Challenges and an Architecture Concept. 15th International Planetary Probe Workshop, Boulder Colorado, June 2018.
RD[58] https://www.colorado.edu/event/ippw2018/sites/default/files/attached-files/outersys_3_zimmer_presid512_presslides_docid1205.pdf
RD[59] Europa Lander Mission Overview and Update. 15th International Planetary Probe Workshop, Boulder Colorado, June 2018
RD[60] https://www.colorado.edu/event/ippw2018/sites/default/files/attached-files/outersys_1_sell_presid716_presslides_docid1199.pdf
RD[61] Proposed Europa Lander Descent Stage Overview. 15th International Planetary Probe Workshop, Boulder Colorado, June 2018
RD[62] https://www.colorado.edu/event/ippw2018/sites/default/files/attached-files/outersys_2_kulkarni_presid642_presslides_docid1204.pdf
RD[63] GNC Design and Performance of the ExoMars EDL Demonstrator. P. Martella et al. 8th International ESA Conference on Guidance, Navigation & Control Systems. 5-10 June 2011.
41.1.1.17 Chapter 35 Radiation References
RD[64] NASA Ice Giants Pre-Decadal Study Final Report, JPL D-100520, June 2017

Ice Giants CDF Study Report: CDF-187(C)
January 2019 page 417 of 431
ESA UNCLASSIFIED – Releasable to the Public
RD[65] Xapsos, M. A., G. P. Summers, J. L. Barth, E. G. Stassinopoulos, and E. A. Burke, Probabillity Model for Cumulative Solar Proton Event Fluences, IEEE Trans. Nucl. Sci., 47, 486-490, 2000
RD[66] Jiggens, P., Varotsou, A., Truscott, P., Heynderickx, D., Lei, F., Evans, H. & Daly, E., The Solar Accumulated and Peak Proton and Heavy Ion Radiation Environment (SAPPHIRE) Model, IEEE Transactions on Nuclear Science, Volume 65, Issue 2, 2018
RD[67] ECSS-E-ST-10-04C Space Environment
RD[68] Divine N. and Garrett H. B., Charged particle distribution in Jupiter's magnetosphere, J. Geophys. Res., 88, 6889-6903, 1983
RD[69] Garrett H. B. et al, Galileo Interim Radiation Electron Model, Jet Propulsion Laboratory, California Inst. of Technol., JPL 03-006, Pasadena, CA, 2003
RD[70] Jun I., Henry B. Garrett and Robin W. Evans, "High-Energy trapped Particle Environments at Jupiter: an update", IEEE Transactions on Nuclear Science, vol. 52, No. 6, 2005
RD[71] H. B. Garrett, M. Kokorowski, and I. Jun, Galileo Interim Radiation Electron Model Update—2012, JPL Publication 12-9
RD[72] Sicard A. and Bourdarie S., Physical electron belts model from Jupiter's surface to the orbit of Europa, J. Geophys. Res., 109, 2004
RD[73] Bourdarie S. and Sicard A., Jupiter environmental modelling, ONERA technical note 120 issue 1.2, ESA contract 19735/NL/HB, FR 1/11189 DESP, October 2006
RD[74] E. Maddox, B. Taylor, G. Vacanti, Interplanetary Electron Model Tools Software Documentation, Report of ESA contract 22915/09/NL/AF, CSC-IEM-DOC003, 2011
RD[75] P. Truscott, "JORE2M2 Project: SHIELDOSE-2Q Requirements, Interface Control, Design, Implementation and Justification Document," QINETIQ/TS/AS/SDD0900017, 2010
RD[76] S. M. Seltzer, "Updated calculations for routine space-shielding radiation dose estimates: SHIELDOSE2," National Institute of Standards and Technology report NISTIR 5477, December 1994.
RD[77] Hugh D. R. Evans et al., Jovian Radiation Belt Models, Uncertainties and Margins, IEEE Trans Nucl Sci Vol. 60, No. 4, August 2013
RD[78] Q. Nénon, A. Sicard, P. Kollmann, H. B. Garrett, S. P. A. Sauer, C. Paranicas, A Physical Model of the Proton Radiation Belts of Jupiter inside Europa's Orbit, JGR Space Physics, 2018
RD[79] Henry Garrett and Robin Evans, The JPL Neptune Radiation Model (NMOD), JPL Publication 17-2, July 1, 2017
RD[80] Selesnick, R.S., and Stone, E.C., “Energetic electrons at Uranus: Bimodal diffusion in a satellite limited radiation belt,” J. Geophys. Res., vol. 96, no. A4, pp. 5651–5665, 1 April 1991

Ice Giants CDF Study Report: CDF-187(C)
January 2019 page 418 of 431
ESA UNCLASSIFIED – Releasable to the Public
RD[81] Henry Garrett and Robin Evans, The JPL Uranian Radiation Model (UMOD), JPL Publication 15-7, September 2015
RD[82] B. H. Mauk and N. J. Fox, Electron radiation belts of the solar system, JGR Vol. 115, A12220, doi:10.1029/2010JA015660, 2010
41.1.1.18 Chapter 36 GS&OPS References
RD[83] ECSS-E-70-41C Telemetry and Telecommand Packet Utilization,15 April 2016
RD[84] CCSDS 727.0-B-4, CCSDS File Delivery Protocol, Blue book, January 2007
RD[85] ECSS-E-ST-50C, Communications, 31 July 2008
RD[86] CCSDS 133.0-B-1, Space Packet Protocol, Cor 2. Sep 2012
RD[87] ECSS-E-70-11C, Space Segment Operability, 31 July 2008
RD[88] Future Architecture of ESA Deep Space Stations for Enhanced Mission Support, REP/1139/2579, issue 1.0, 4 March 2011
RD[89] Future Architecture of ESA Deep Space Stations for Enhanced Mission Support, FAST-INSA-5000-FR-01 16 May 2011.
RD[90] Cost Optimisation for Deep Space Receive-Only Antennas, final report, TN-1016048-01200. Release 1.5, 2018-09-14
RD[91] Rosetta end of Mission Lessons Learned public presentation. RO-ESC-MN-0111
41.1.1.19 Chapter 37 Risk References
RD[92] Space Project Management, Risk Management, ECSS-M-ST-80C, 31 July 2008.
41.1.1.20 Chapter 38 Programmatics References
RD[93] TEC-SYC Cost Risk Procedure, TEC-SYC/5/2010/PRO/HJ, February 2010
RD[94] ESA Cost Engineering Charter of Services, Issue 4, TEC-SYC/12/2009/GRE/HJ
RD[95] ECSS-E-AS-11C Adoption Notice of ISO 16290, Space Systems – Definition of the Technology Readiness Levels (TRLs) and their Criteria of Assessment, dated 1 October 2014. To be supersede by EN16603-11.

Ice Giants CDF Study Report: CDF-187(C)
January 2019 page 419 of 431
ESA UNCLASSIFIED – Releasable to the Public
42 ACRONYMS
Acronym Definition
AIT/V Assembly, Integration and Test/Verification
AIV Acceptance, Integration and Validation
AOCS Attitude and Orbit Control System
AOGNC Attitude and Orbit Guidance, Navigation and Control
AOS Acquisition of Signal
APE Absolute Performance Error
ARES Analysis and Reporting System
ASI Atmospheric Structure Instrument
AVM Avionics Verification Model
BC Back Cover
BCR Battery Charge Regulator
BDR Battery Discharge Regulator
BoL Beginning of Life
BSSM Back Shell Separation Mechanism
C/SiC Ceramics/Silicium-Carbon
CaC Cost at Completion
CDF Concurrent Design Facility
CDMS Computer & Data Management System
CDMU Computer & Data Management Unit
CDR Critical Design Review
CF Confluence Fitting
CFDP CCSDS File Delivery Protocol
CFRP Carbon Fibre Reinforced Plastics
CMA Cost Model Accuracy
CoG Centre of Gravity
COPS COmetary Pressure Sensor
CTP Science Core Technology Programme
DDOR Delta-Differential One-Way Ranging
DDS Data distribution system

Ice Giants CDF Study Report: CDF-187(C)
January 2019 page 420 of 431
ESA UNCLASSIFIED – Releasable to the Public
Acronym Definition
DFMS Double Focusing Mass Spectrometer
DHS Data Handling System
DM Descent Module
DMM Design Maturity Margin
DOA Degree of Adequacy of the cost model
DOD Depth Of Discharge (Battery)
DOE (US) Department Of Energy
DOR Differential One-Way Ranging
DSN NASA Deep Space Network
EAA Earth Aspect Angle
ECSS European Cooperation for Space Standardisation (Standards)
EDL Entry, Descent and Landing
EDS Entry Descent System
EGOS-CC ESA Ground Operations System – Common Core
EIP Entry Interface Point
EM Engineering Model
EMC Electro-Magnetic Compatability
eMMRTG Enhanced Multi-Mission Radioisotope Thermoelectric Generators
EODL End Of Design Life
EOL End of Life
EOM End Of Mission
EPE External Project Events
EPS Electrical Power Subsystem
EQM Engineering and Qualification Model
ESI European Standard Initiator
ESOC European Space Operations Centre
ESP Emission of Solar Protons
FCT Flight Control Team
FDIR Failure Detection Isolation and Recovery
FEA Finite Element Analysis
FEM Finite Element Model
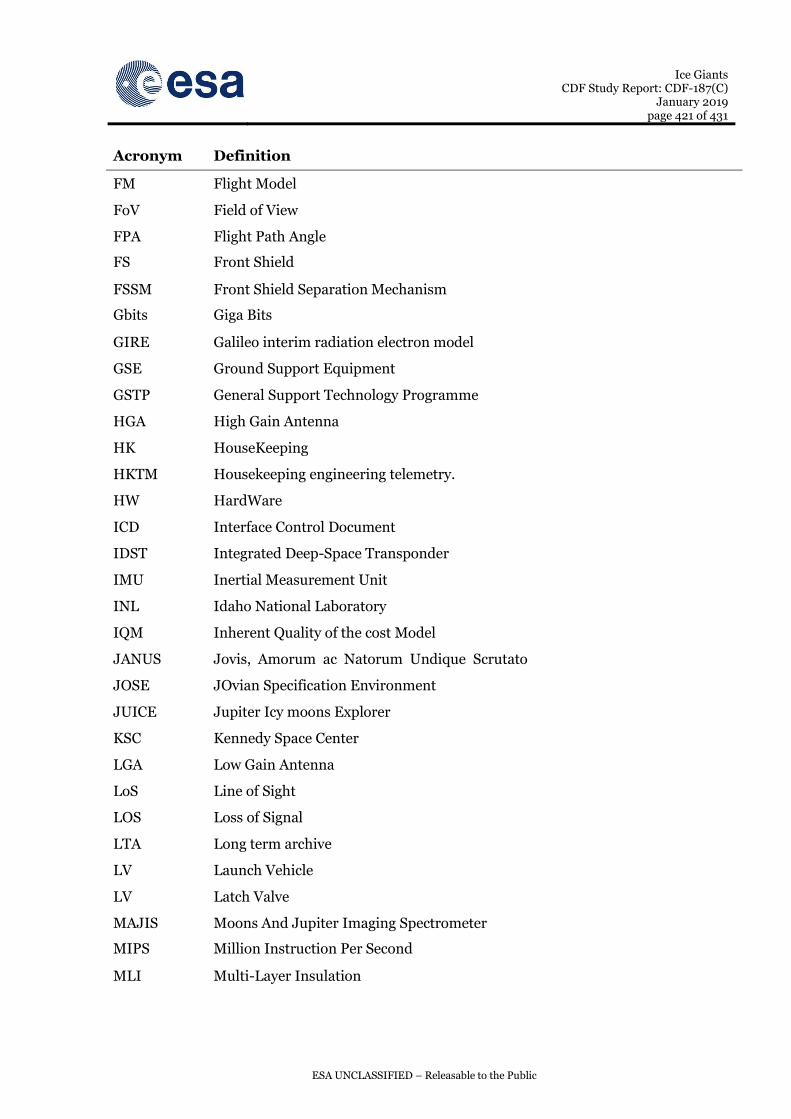
Ice Giants CDF Study Report: CDF-187(C)
January 2019 page 421 of 431
ESA UNCLASSIFIED – Releasable to the Public
Acronym Definition
FM Flight Model
FoV Field of View
FPA Flight Path Angle
FS Front Shield
FSSM Front Shield Separation Mechanism
Gbits Giga Bits
GIRE Galileo interim radiation electron model
GSE Ground Support Equipment
GSTP General Support Technology Programme
HGA High Gain Antenna
HK HouseKeeping
HKTM Housekeeping engineering telemetry.
HW HardWare
ICD Interface Control Document
IDST Integrated Deep-Space Transponder
IMU Inertial Measurement Unit
INL Idaho National Laboratory
IQM Inherent Quality of the cost Model
JANUS Jovis, Amorum ac Natorum Undique Scrutato
JOSE JOvian Specification Environment
JUICE Jupiter Icy moons Explorer
KSC Kennedy Space Center
LGA Low Gain Antenna
LoS Line of Sight
LOS Loss of Signal
LTA Long term archive
LV Launch Vehicle
LV Latch Valve
MAJIS Moons And Jupiter Imaging Spectrometer
MIPS Million Instruction Per Second
MLI Multi-Layer Insulation
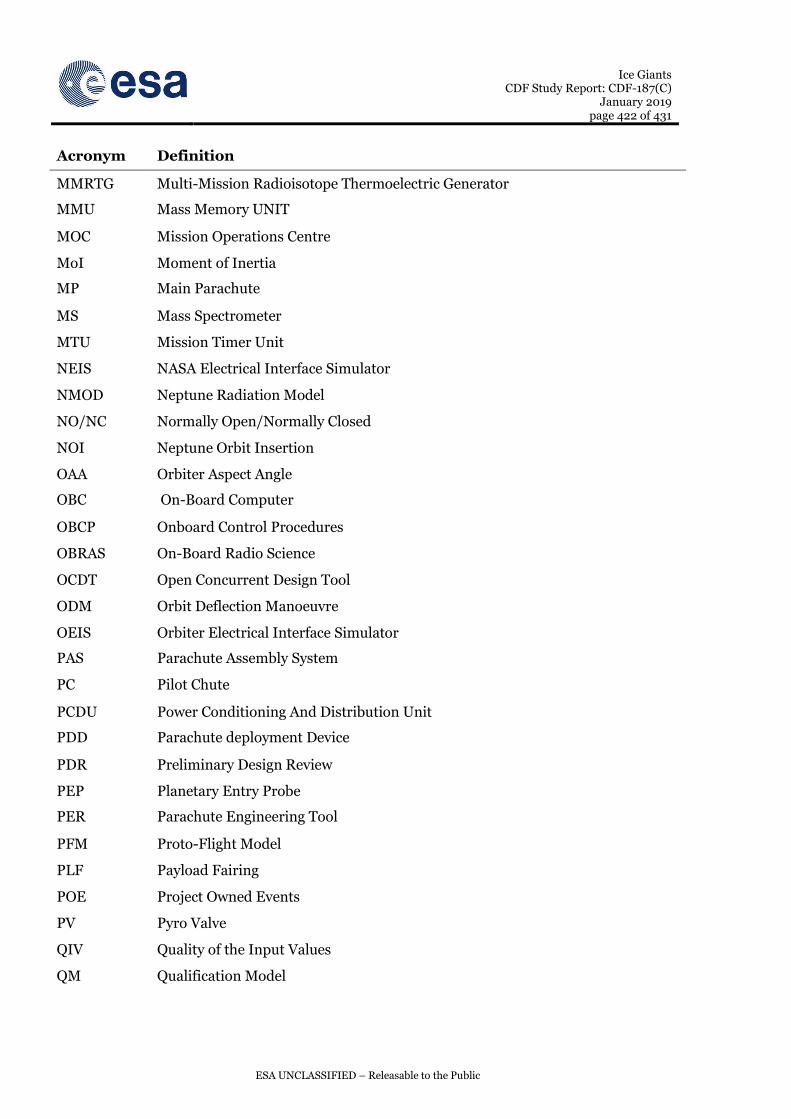
Ice Giants CDF Study Report: CDF-187(C)
January 2019 page 422 of 431
ESA UNCLASSIFIED – Releasable to the Public
Acronym Definition
MMRTG Multi-Mission Radioisotope Thermoelectric Generator
MMU Mass Memory UNIT
MOC Mission Operations Centre
MoI Moment of Inertia
MP Main Parachute
MS Mass Spectrometer
MTU Mission Timer Unit
NEIS NASA Electrical Interface Simulator
NMOD Neptune Radiation Model
NO/NC Normally Open/Normally Closed
NOI Neptune Orbit Insertion
OAA Orbiter Aspect Angle
OBC On-Board Computer
OBCP Onboard Control Procedures
OBRAS On-Board Radio Science
OCDT Open Concurrent Design Tool
ODM Orbit Deflection Manoeuvre
OEIS Orbiter Electrical Interface Simulator
PAS Parachute Assembly System
PC Pilot Chute
PCDU Power Conditioning And Distribution Unit
PDD Parachute deployment Device
PDR Preliminary Design Review
PEP Planetary Entry Probe
PER Parachute Engineering Tool
PFM Proto-Flight Model
PLF Payload Fairing
POE Project Owned Events
PV Pyro Valve
QIV Quality of the Input Values
QM Qualification Model

Ice Giants CDF Study Report: CDF-187(C)
January 2019 page 423 of 431
ESA UNCLASSIFIED – Releasable to the Public
Acronym Definition
QSL Quasi-Static Load
RCS Reaction Control System
RD Reference Document
REQ Requirement
RF Radio Frequency
RFDN Radio Frequency Distribution Network
RFM Recurrent Flight Model
RHA Radiation Hardness Assurance
RHU Radio-isotope Heater Unit
RIU Remote Interface Unit
RN Neptune Radius
RPE Relative Performance Error
RPS Radioisotope Power System
RTG Radioisotope Thermoelectric Generators
RTOF Reflectron type Time-Of-Flight
RU Uranus Radius
S/C Spacecraft
SAVOIR Space Avionics Open Interface ARchitecture
SEE Single Event Effect
SEM Spin and Eject Mechanism
SEP Solar Electric Propulsion
SEP Solar Energetic Particle
SHIELDOSE Computer code for space-shielding radiation dose calculations
SLS Space Launch System
SOC State Of Charge (Battery)
SOC Science Operations Centre
SPE Solar Particle Event
SPF Single Point Failure
SRR Systems Requirements Review
SSMM Solid State Mass Memory
SSPA Solid State Power Amplifier

Ice Giants CDF Study Report: CDF-187(C)
January 2019 page 424 of 431
ESA UNCLASSIFIED – Releasable to the Public
Acronym Definition
SST Study Science Team
STM Science Traceability Matrix
SW SoftWare
T/M Thrust-to-Mass
TBC To Be Confirmed
TBD To Be Decided
TC Telecommand
TID Total Ionizing Dose
TIDL Total Ionising Dose Level
TIDS Total Ionising Dose Sensitivity
TM Telemetry
TMTC Telemetry & Telecommand
TNID Total Non Ionising Dose
TPS Thermal Protection System
TRL Technology Readiness Level
TT&C Tracking Telemetry And Command
TWTA Travelling Wave Tube Amplifier
UMOD Uranian Radiation Model
UOI Uranus Orbit Insertion
USO Ultra-Stable Oscillator
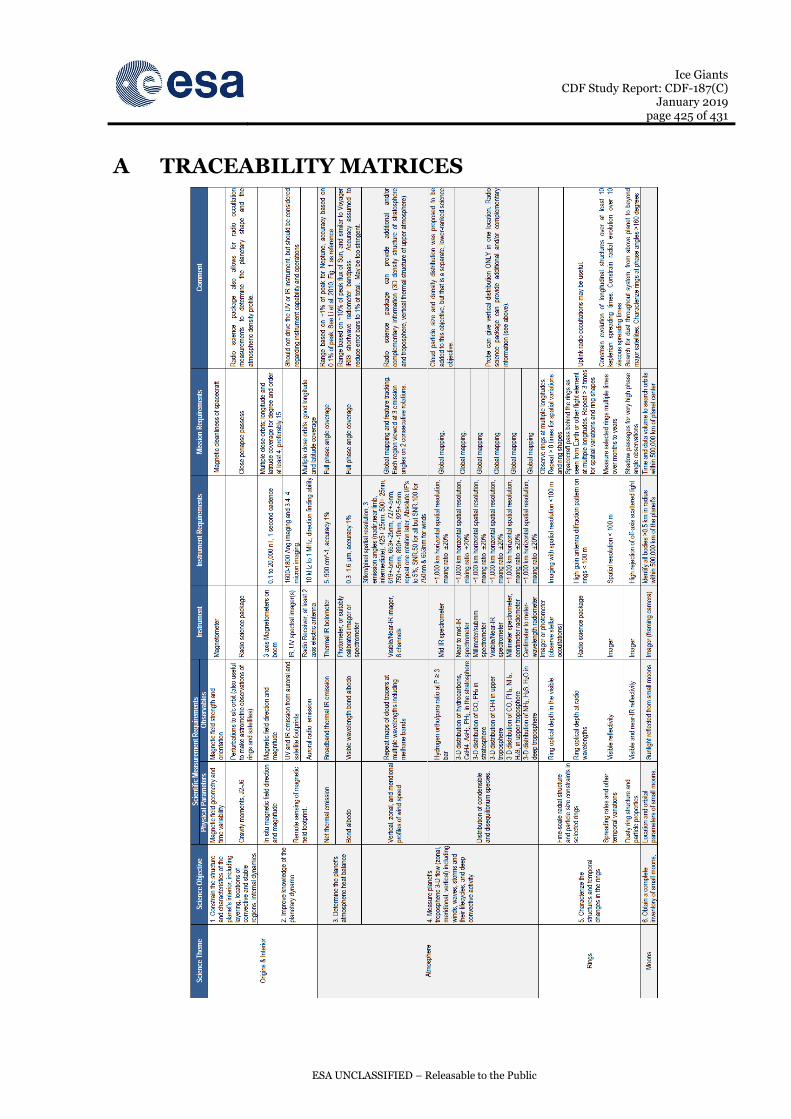
Ice Giants CDF Study Report: CDF-187(C)
January 2019 page 425 of 431
ESA UNCLASSIFIED – Releasable to the Public
A TRACEABILITY MATRICES

Ice Giants CDF Study Report: CDF-187(C)
January 2019 page 426 of 431
ESA UNCLASSIFIED – Releasable to the Public

Ice Giants CDF Study Report: CDF-187(C)
January 2019 page 427 of 431
ESA UNCLASSIFIED – Releasable to the Public
Table A- 1: Orbiter Science Traceability Matrix

Ice Giants CDF Study Report: CDF-187(C)
January 2019 page 428 of 431
ESA UNCLASSIFIED – Releasable to the Public

Ice Giants CDF Study Report: CDF-187(C)
January 2019 page 429 of 431
ESA UNCLASSIFIED – Releasable to the Public
Table A- 2: Nominal Descent Duration 90 Minutes

Ice Giants CDF Study Report: CDF-187(C)
January 2019 page 430 of 431
ESA UNCLASSIFIED – Releasable to the Public

Ice Giants CDF Study Report: CDF-187(C)
January 2019 page 431 of 431
ESA UNCLASSIFIED – Releasable to the Public
Table A- 3: Triton Lander Traceability Matrix