SP-562 EPOENHO - ESA Earth Online
8
MIPAS-B OBSERVATIONS FOR THE VALIDATION OF TARGET PARAMETERS OF ENVISAT CHEMISTRY INSTRUMENTS H. Oelhaf, G. Wetzel, G. Zhang, F. Friedl-Vallon, A. Kleinert, A. Lengel, G. Maucher, H. Nordmeyer and H. Fischer Institut für Meteorologie und Klimaforschung, Forschungszentrum Karlsruhe, Postfach 3640, D-76021 Karlsruhe, Germany, Email: [email protected] ABSTRACT Embedded in the Envisat validation programme of the chemistry instruments GOMOS, MIPAS, and SCIAMACHY three balloon flights were carried out with MIPAS-B, the balloon borne version of MIPAS. The first one at mid-latitudes during the night of 24/25 September 2002 from Aire sur l’Adour, France, adjusted to the night-time overpass of orbit 2975. The second one in the late winter arctic vortex on 20/21 March 2003 from Kiruna, Sweden, matching evening and morning overpasses of Envisat (orbits 5508 and 5515) and the third one in the midnight sun from the same location on 2/3 July 2003 (Envisat orbits 6996 and 7004). This paper outlines the instrumental characteristics of MIPAS-B, the observation and validation strategy, the data processing and compares MIPAS-B results to Envisat results that have been available so far. 1. INTRODUCTION The absolute necessity of validating satellite instrument products is obvious from experience with prior space instruments (as e.g. in [1] and [2]). Increasing complexity of space instruments and enhanced diversity of products expected from instruments like GOMOS, MIPAS, and SCIAMACHY on Envisat demands for even increased efforts in validation. Apart from satellite measurements, balloon-borne observa- tions are the only tool to obtain distributions of a large number of molecules with sufficiently high vertical resolution over most of the stratospheric altitude region. They provide high precision and accuracy due to the quasi-Lagrangian measurement situation which, e.g., allows longer integration times. Furthermore, systematic errors can be kept small since a complete calibration and characterisation of the instruments can be performed and checked close to the time of the measurement. Therefore, balloon observations are to be regarded as a key component in any satellite validation exercise in spite of the limited number of profiles that can be obtained. Since the number of balloon launches is restricted due to logistical and financial constraints and thus any statistics is very limited, the quality of coincidence in time and space between the balloon measurement and the satellite measurement is crucial. Otherwise, modelling techniques such as backward trajectory mapping of observed air masses need to be applied which may reduce the significance of the validation. The balloon flights of MIPAS-B, as discussed here, were embedded in the balloon validation campaigns as part of the ESABC activities that are summarized in [3]. 2. MIPAS-B INSTRUMENT MIPAS-B is an advanced cryogenic Fourier Transform Infra-Red (FTIR) spectrometer specially tailored to the operation on a stratospheric balloon gondola [4-5]. Figures 1 and 2 show the sensor integrated into the gondola, and the optical and mechanical set-up of the spectrometer, respectively. Equipped with suitable subsystems, MIPAS-B allows precise limb emission sounding of chemical constituents related to the stratospheric ozone problem and to the greenhouse effect. This method is appropriate to obtain vertical profiles of ozone and a considerable number of key radicals (e.g. NO, NO 2 ), reservoir species (HNO 3 , N 2 O 5 , ClONO 2 , and HO 2 NO 2 ) as well as source gases (e.g. CH 4 , N 2 O, H 2 O, CFC-11, CFC-12, CFC-22, CCl 4 , CF 4 , C 2 H 6 , and SF 6 ) simultaneously, with an altitude resolution of 2 to 3 km. Hence, MIPAS-B is able to measure the budget and partitioning of the complete NO y family (i.e. NO + NO 2 + HNO 3 + ClONO 2 + 2*N 2 O 5 + HO 2 NO 2 ) together with its source gas N 2 O and to assess denitrification, dehydration, budgets and tracer correlations (e.g. [6-9]). As an emission sounder, MIPAS-B is independent of any extraterrestrial light source, which allows a high flexibility in terms of launching time of the day and observation geometry. Both azimuth and elevation angles can be commanded from ground. This flexibility allows long integration times and offers to adjust the line of sight (LOS) to geophysical constraints in an optimal way (e.g. in the case of strong gradients in the constituents’ fields, during sunrise/sunset, or for validation purposes). An innovative pointing system ensures high precision and stability of acquired observation angles. The capability of MIPAS-B to measure day and night and to choose the observation angles independent of sun and moon is _______________________________________________________ Proceedings of the Second Workshop on the Atmospheric Chemistry Validation of ENVISAT (ACVE-2) ESA-ESRIN, Frascati, Italy, 3-7 May 2004 (ESA SP-562, August 2004) EPOENHO
-
Upload
khangminh22 -
Category
Documents
-
view
0 -
download
0
Transcript of SP-562 EPOENHO - ESA Earth Online
MIPAS-B OBSERVATIONS FOR THE VALIDATION OF TARGET PARAMETERS OF ENVISAT CHEMISTRY INSTRUMENTS
H. Oelhaf, G. Wetzel, G. Zhang, F. Friedl-Vallon, A. Kleinert, A. Lengel,
G. Maucher, H. Nordmeyer and H. Fischer
Institut für Meteorologie und Klimaforschung, Forschungszentrum Karlsruhe, Postfach 3640, D-76021 Karlsruhe, Germany, Email: [email protected]
ABSTRACT Embedded in the Envisat validation programme of the chemistry instruments GOMOS, MIPAS, and SCIAMACHY three balloon flights were carried out with MIPAS-B, the balloon borne version of MIPAS. The first one at mid-latitudes during the night of 24/25 September 2002 from Aire sur l’Adour, France, adjusted to the night-time overpass of orbit 2975. The second one in the late winter arctic vortex on 20/21 March 2003 from Kiruna, Sweden, matching evening and morning overpasses of Envisat (orbits 5508 and 5515) and the third one in the midnight sun from the same location on 2/3 July 2003 (Envisat orbits 6996 and 7004). This paper outlines the instrumental characteristics of MIPAS-B, the observation and validation strategy, the data processing and compares MIPAS-B results to Envisat results that have been available so far.
1. INTRODUCTION The absolute necessity of validating satellite instrument products is obvious from experience with prior space instruments (as e.g. in [1] and [2]). Increasing complexity of space instruments and enhanced diversity of products expected from instruments like GOMOS, MIPAS, and SCIAMACHY on Envisat demands for even increased efforts in validation. Apart from satellite measurements, balloon-borne observa-tions are the only tool to obtain distributions of a large number of molecules with sufficiently high vertical resolution over most of the stratospheric altitude region. They provide high precision and accuracy due to the quasi-Lagrangian measurement situation which, e.g., allows longer integration times. Furthermore, systematic errors can be kept small since a complete calibration and characterisation of the instruments can be performed and checked close to the time of the measurement. Therefore, balloon observations are to be regarded as a key component in any satellite validation exercise in spite of the limited number of profiles that can be obtained. Since the number of balloon launches is restricted due to logistical and financial constraints and thus any statistics is very limited, the quality of coincidence in time and space between the balloon
measurement and the satellite measurement is crucial. Otherwise, modelling techniques such as backward trajectory mapping of observed air masses need to be applied which may reduce the significance of the validation. The balloon flights of MIPAS-B, as discussed here, were embedded in the balloon validation campaigns as part of the ESABC activities that are summarized in [3].
2. MIPAS-B INSTRUMENT MIPAS-B is an advanced cryogenic Fourier Transform Infra-Red (FTIR) spectrometer specially tailored to the operation on a stratospheric balloon gondola [4-5]. Figures 1 and 2 show the sensor integrated into the gondola, and the optical and mechanical set-up of the spectrometer, respectively. Equipped with suitable subsystems, MIPAS-B allows precise limb emission sounding of chemical constituents related to the stratospheric ozone problem and to the greenhouse effect. This method is appropriate to obtain vertical profiles of ozone and a considerable number of key radicals (e.g. NO, NO2), reservoir species (HNO3, N2O5, ClONO2, and HO2NO2) as well as source gases (e.g. CH4, N2O, H2O, CFC-11, CFC-12, CFC-22, CCl4, CF4, C2H6, and SF6) simultaneously, with an altitude resolution of 2 to 3 km. Hence, MIPAS-B is able to measure the budget and partitioning of the complete NOy family (i.e. NO + NO2 + HNO3 + ClONO2 + 2*N2O5 + HO2NO2) together with its source gas N2O and to assess denitrification, dehydration, budgets and tracer correlations (e.g. [6-9]). As an emission sounder, MIPAS-B is independent of any extraterrestrial light source, which allows a high flexibility in terms of launching time of the day and observation geometry. Both azimuth and elevation angles can be commanded from ground. This flexibility allows long integration times and offers to adjust the line of sight (LOS) to geophysical constraints in an optimal way (e.g. in the case of strong gradients in the constituents’ fields, during sunrise/sunset, or for validation purposes). An innovative pointing system ensures high precision and stability of acquired observation angles. The capability of MIPAS-B to measure day and night and to choose the observation angles independent of sun and moon is
_______________________________________________________Proceedings of the Second Workshop on the Atmospheric Chemistry Validation of ENVISAT (ACVE-2)ESA-ESRIN, Frascati, Italy, 3-7 May 2004 (ESA SP-562, August 2004) EPOENHO

very useful for the validation of satellite instruments as has been already demonstrated in the framework of the ILAS validation [10-14].
Fig. 1. The new downsized MIPAS-B2 gondola during integration in Aire sur l’Adour.
Fig. 2. Mechanical and optical set-up of the MIPAS-B2 spectrometer.
MIPAS-B NESR(high resolution single calibrated spectrum, apodized)
1,0E-09
1,0E-08
1,0E-07
500 1000 1500 2000 2500wavenumber (cm-1)
NESR
(W c
m-2
sr-1
cm
)
channel 1channel 2channel 3channel 4
Fig. 3. NESR of MIPAS-B2. MIPAS-B can be regarded as precursor of MIPAS on Envisat. Therefore, a number of specifications are quite similar, such as spectral resolution and spectral
coverage. For some critical parameters, however, the MIPAS-B performance is superior, e.g. in the case of the NESR (Noise Equivalent Spectral Radiance) (Fig. 3), and in the case of the pointing accuracy and precision which is in the order of 90 m (3 σ). Further improvement of the NESR can be achieved by averaging spectra taken at the same pointing angle which is justified in the balloon case. Careful instrument characterisation is performed for each MIPAS-B flight in terms of NESR, instrumental line shape (ILS), field-of-view (FOV), LOS and radiometric calibration. Precision of retrieved profiles is typically 3-7 %, accuracy 7-15 %.
3. MEASUREMENT STRATEGY AND MATCH QUALITY
An overview on all MIPAS-B Envisat validation flights is given in Table 1. Tab. 1. Time and geolocations of the observations. MIPAS-B Flight #11 Flight #13 Flight #14 Location Aire sur l’Adour Kiruna Kiruna Date 24/25 Sep. 2002 20/21 Mar. 2003 2/3 Jul. 2003 Sequence name Seq. S / N3 Seq. N3a / D15c Seq. 2 / 3 Mean time 21:50/22:21 UT 20:56/08:48 UT 00:28/01:13 UT Mean latitude 39.9°N / 47.0°N 65.8°N / 65.6°N 70.3°N / 69.3°N Mean longitude 1.1°E / 0.7°E 14.6°E / 17.5°E 27.6°E / 11.0°E Lowest altitude 11.3 / 5.9 km 11.1 / 9.1 km 7.7 / 7.9 km Highest altitude 38.8 / 38.4 km 31.1 / 31.2 km 38.6 / 39.1 km MIPAS-E Orbit 2975 Orb. 5508/5515 Orb. 6996/7004 Version number 4.55 & 4.61 no data yet / 4.57 no data yet Mean time 22:06/22:07 UT 21:10/09:08 UT 20:02/09:38 UT Mean latitude 41.7°N / 46.4°N 65.7°N / 65.6°N 70.6°N / 70.5°N Mean longitude 1.6°E / 0.6°E 14.1°N / 17.1°E 31.4°E / 10.9°E The first MIPAS-B flight within the Envisat validation activities took place from Aire sur l'Adour during the night of 24/25 September 2002. Launch was at 18:43 UT. The float was reached at a ceiling altitude of about 39 km at 21:47 UT i.e. 20 min before the Envisat overpass. The cut was at 23:50 UT. During the nominal measurement program (during ascent within the stratosphere and at ceiling) all systems worked nominal. The performance of the Fourier transform spectrometer and the LOS pointing system was excellent. During the roughly two hours of ceiling (or slow descent) a couple of complete limb sequences was collected. Thanks to the modified pointing software, which stabilises with respect to the tangent altitude instead of only to the observation angle (and as such taking into account both the rocking of the gondola and altitude excursions), the change of ceiling altitude has not affected our measurement program. Only the uppermost tangent altitude (38.2 km) had to be skipped after the first complete limb sequence.
GOMOS
MIPAS
GOMOS
MIPAS
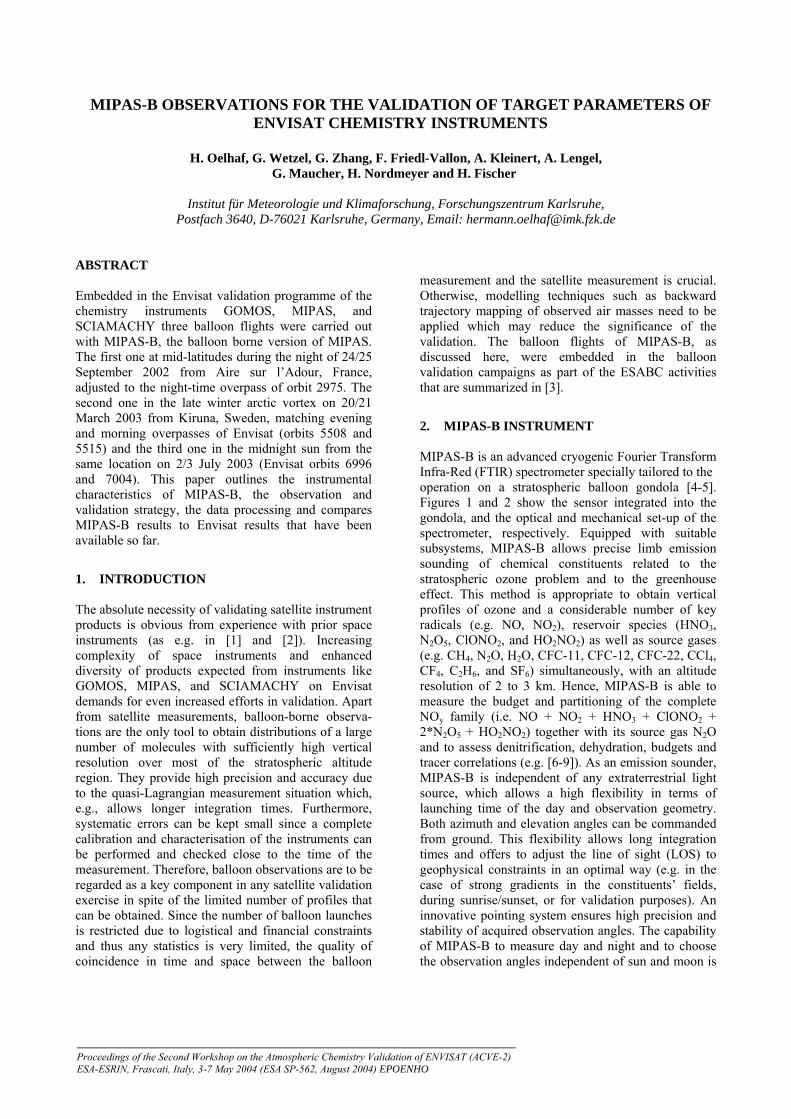
Fig. 4. Colour-coded PV-field over France and Spain at the 675 K level (~ 26.5 km altitude), MIPAS-B balloon trajectory with lines-of-sight (black) plotted from the observer to the tangent points, MIPAS-Envisat limb sequences (red) and nearest GOMOS occultation (blue). The gradient in PV indicates that different air masses were sounded during north and south scans. The selected flight date and time as well as the chosen observation angle scenario allowed a perfect match to the MIPAS-Envisat (MIPAS-E) tangent locations as illustrated in Fig. 4. It shows colour coded potential vorticity at 675 K (about 26.5 km altitude, as an example) indicating the edge of the developing polar vortex at about 45° latitude. MIPAS-Envisat limb sequences are displayed in red bars, MIPAS-B limb sequences are shown in black lines. As can be seen in the Figure, the MIPAS-Envisat limb sequence north of Aire sur l'Adour has been matched almost 1:1 (actually the MIPAS-Envisat limb sequence is masked by the northbound MIPAS-B limb sequence), the southern was off by only about 70 km but perfectly aligned with the southbound MIPAS-B limb sequence. Two other sequences towards east and west were performed by MIPAS-B to look for any atmospheric inhomo-geneities. Furthermore, the nearest GOMOS star occultation of the same orbit was very close (less than 100 km). The validation measurements were performed around the overpass time of Envisat. For SCIAMACHY, which does not measure at night-time, we are looking for potential trajectory matches with the help of the Free University of Berlin. A second Envisat validation flight was performed from Esrange, Kiruna (Sweden, 68°N, 21°E) on 20/21 March 2003. After a flight duration of more than 15 hours from 18:22 UT (March 20) to 9:38 UT (March 21) touch down of the gondola was only about 50 km away from the launch site. The long duration of this
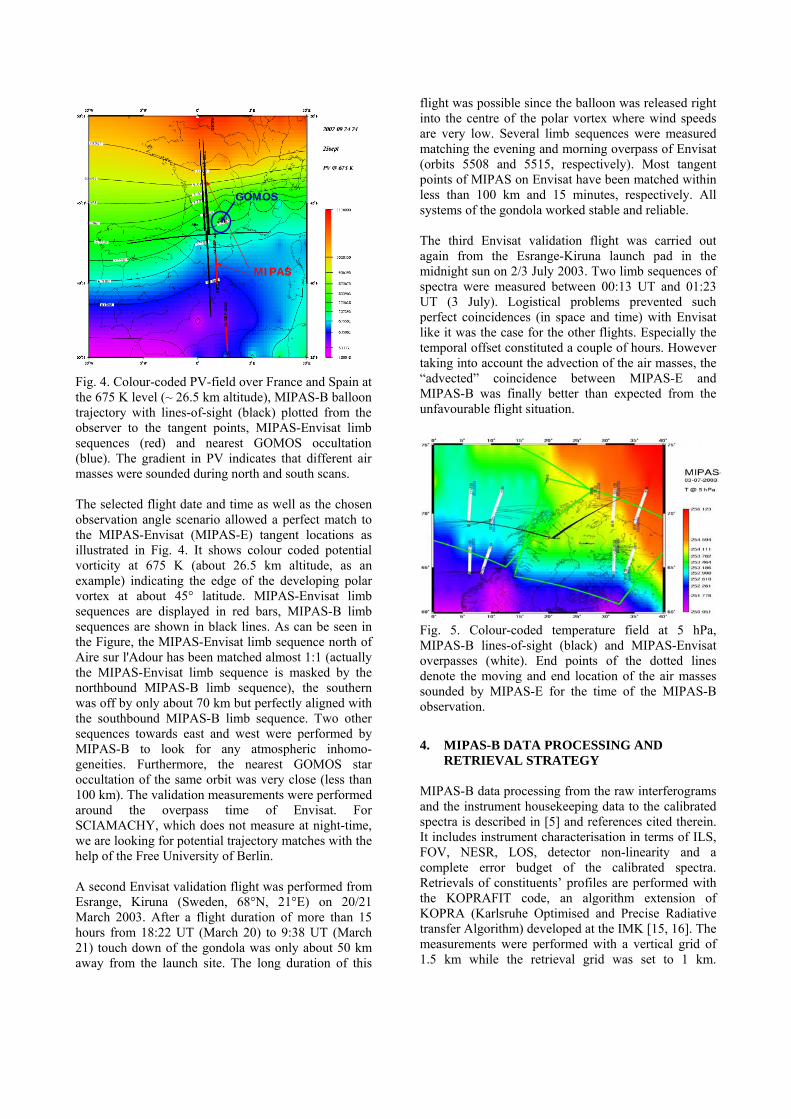
flight was possible since the balloon was released right into the centre of the polar vortex where wind speeds are very low. Several limb sequences were measured matching the evening and morning overpass of Envisat (orbits 5508 and 5515, respectively). Most tangent points of MIPAS on Envisat have been matched within less than 100 km and 15 minutes, respectively. All systems of the gondola worked stable and reliable. The third Envisat validation flight was carried out again from the Esrange-Kiruna launch pad in the midnight sun on 2/3 July 2003. Two limb sequences of spectra were measured between 00:13 UT and 01:23 UT (3 July). Logistical problems prevented such perfect coincidences (in space and time) with Envisat like it was the case for the other flights. Especially the temporal offset constituted a couple of hours. However taking into account the advection of the air masses, the “advected” coincidence between MIPAS-E and MIPAS-B was finally better than expected from the unfavourable flight situation.
Fig. 5. Colour-coded temperature field at 5 hPa, MIPAS-B lines-of-sight (black) and MIPAS-Envisat overpasses (white). End points of the dotted lines denote the moving and end location of the air masses sounded by MIPAS-E for the time of the MIPAS-B observation.
4. MIPAS-B DATA PROCESSING AND RETRIEVAL STRATEGY
MIPAS-B data processing from the raw interferograms and the instrument housekeeping data to the calibrated spectra is described in [5] and references cited therein. It includes instrument characterisation in terms of ILS, FOV, NESR, LOS, detector non-linearity and a complete error budget of the calibrated spectra. Retrievals of constituents’ profiles are performed with the KOPRAFIT code, an algorithm extension of KOPRA (Karlsruhe Optimised and Precise Radiative transfer Algorithm) developed at the IMK [15, 16]. The measurements were performed with a vertical grid of 1.5 km while the retrieval grid was set to 1 km.

Regularisation was based on the Tikhonov-Philipps approach [17-18]. Depending on the trace species retrieved, the number of degrees of freedom of the retrieval (calculated from the averaging kernel matrix, see, e.g., [19]) was between 7 and 13. Spectra were fitted in MIPAS-B proven microwindows (see [7, 9]). Temperature, volume mixing ratios of trace species, frequency and radiance offset were subject to fitting. The error estimation includes random noise as well as the mutual influence of the fitted parameters, temperature errors, LOS inaccuracies, and spectroscopic data errors. Fig. 6 illustrates the quality of the spectra and the fit in a microwindow used for the retrieval of NO2. The residual is close to the noise level.
0.0
20.0
40.0
60.0
80.0
400 420 440 460 480 500 520-7.5-5.0-2.50.02.55.0
MIPAS-B2, Sep. 24, 2002, N3-V.1, Zmin = 20.4 km
Measured Calculated
Rad
ianc
e (W
/(cm
2 s
r cm
-1))
x10-9
Res
idua
l x10
-9
Grid Points
Fig. 6. Example of a best fit for the 20.4-km altitude of one of the NO2 microwindows (1585.0 to 1589.5 cm-1) together with the residual.
5. COMPARISONS OF MIPAS-B PROFILES TO GOMOS AND MIPAS-ENVISAT RESULTS
This section discusses comparisons of the MIPAS-B retrieved profiles with GOMOS and MIPAS-E profiles that have been available so far. Error bars for MIPAS-B indicate the overall 1-σ uncertainty whereas in the case of MIPAS-Envisat only the spectral noise mapped to the retrieved volume mixing ratio is given. Figure 7 shows an ozone inter-comparison between GOMOS (version 6.0a data) and MIPAS-B for the flight carried out from Aire sur l’Adour on 24 September 2002. The northbound MIPAS-B profile was measured within a temporal difference to GOMOS of less than 0.5 hours and a spatial difference of less than 400 km. The measured GOMOS profile reveals some oscillations, especially at higher altitudes, while the MIPAS-B profile is quite smooth. Smoothing out the GOMOS oscillations the two ozone profiles agree
quite well to each other. Below about 8 hPa, the difference of both sensors is within the combined error bars. Above this altitude region the main deviations seem to be caused by instabilities in the GOMOS retrieval. A detailed discussion of an inter-comparison between GOMOS and MIPAS for the species NO2 is shown in [20]. The agreement between these sensors has significantly been improved for the new GOMOS data set after the removal of strong oscillations.
1
10
100
-2 -1 0 1 2 3 4 5 6 7 8 9 10 111
10
100
-2 -1 0 1 2 3 4 5 6 7 8 9 10 11
Absolute difference (ppmv) O3 VMR (ppmv)
Pres
sure
(hPa
)
Aire: 24 September 2002 GOMOS (G): 24-SEP-2002, 22:07:11, V6.0a MIPAS-B (B): 24-SEP-2002, 22:21:42, Seq. N3 Absolute Diff. (B-G) Combined errors
Fig. 7. Ozone profiles as measured by MIPAS-B (northbound sequence) and GOMOS together with absolute differences and combined errors (1σ).
0.1
1
10
100
-50 0 50 100 150 200 250 300 350 400 4500.1
1
10
100
-50 0 50 100 150 200 250 300 350 400 450
Absolute difference (ppbv) N2O VMR (ppbv)
Rec. 15 - South
Pres
sure
(hPa
)
Aire: 24 September 2002 Seq. S MIPAS-E (E): 24-Sep-2002 22:06:29 V4.61 MIPAS-E : 24-Sep-2002 22:06:29 V4.55 MIPAS-B (B): 24-Sep-2002 21:50:26 Absolute Diff. (B-E) Combined errors
Fig. 8. N2O: MIPAS-E version 4.55 and 4.61 data in comparison to MIPAS-B measurements (sequence S) together with absolute differences and combined errors (1σ). A comparison of N2O as measured by MIPAS-B (flight no. 11) at mid-latitudes on 24 September 2002 (sequence south) to the corresponding tracer profile observed by MIPAS-Envisat is given in Figure 8. Both, the previous version 4.55 and the new version 4.61 operational MIPAS-E data are shown together. The comparison to MIPAS-B reveals that, apart from some retrieval instabilities at lower altitudes in the MIPAS-E profiles, the agreement of the new v4.61 data with

MIPAS-B is quite fine and differences are mostly within the combined error bars. This holds also for the comparison with MIPAS-B sequence N3 during the same flight (see Figure 9).
0.1
1
10
100
-50 0 50 100 150 200 250 300 350 400 4500.1
1
10
100
-50 0 50 100 150 200 250 300 350 400 450
Absolute difference (ppbv) N2O VMR (ppbv)
Rec.16 - North
Pres
sure
(hPa
)
Aire: 24 September 2002 Seq. N3 MIPAS-E (E): 24-Sep-2002 22:07:50 V4.61 MIPAS-E : 24-Sep-2002 22:07:50 V4.55 MIPAS-B (B): 24-Sep-2002 22:21:42 Absolute Diff. (B-E) Combined errors
Fig. 9. N2O: MIPAS-E version 4.55 and 4.61 data in comparison to MIPAS-B measurements (sequence N3).
0.1
1
10
100
-0.4 -0.2 0.0 0.2 0.4 0.6 0.8 1.0 1.2 1.4 1.6 1.8 2.0 2.2 2.40.1
1
10
100
-0.4 -0.2 0.0 0.2 0.4 0.6 0.8 1.0 1.2 1.4 1.6 1.8 2.0 2.2 2.4Absolute difference (ppmv) CH4 VMR (ppmv)
Rec. 15 - South
Pres
sure
(hPa
)
Aire: 24 September 2002 Seq. S MIPAS-E (E): 24-Sep-2002 22:06:29 V4.61 MIPAS-E : 24-Sep-2002 22:06:29 V4.55 MIPAS-B (B): 24-Sep-2002 21:50:26 Absolute Diff. (B-E) Combined errors
Fig. 10. CH4: MIPAS-E version 4.55 and 4.61 data in comparison to MIPAS-B measurements (sequence S).
0.1
1
10
100
-0.4 -0.2 0.0 0.2 0.4 0.6 0.8 1.0 1.2 1.4 1.6 1.8 2.0 2.2 2.40.1
1
10
100
-0.4 -0.2 0.0 0.2 0.4 0.6 0.8 1.0 1.2 1.4 1.6 1.8 2.0 2.2 2.4Absolute difference (ppmv) CH4 VMR (ppmv)
Rec.16 - North
Pres
sure
(hPa
)
Aire: 24 September 2002 Seq. N3 MIPAS-E (E): 24-Sep-2002 22:07:50 V4.61 MIPAS-E : 24-Sep-2002 22:07:50 V4.55 MIPAS-B (B): 24-Sep-2002 22:21:42 Absolute Diff. (B-E) Combined errors
Fig. 11. CH4: MIPAS-E version 4.55 and 4.61 data in comparison to MIPAS-B measurements (sequence N3).
An inter-comparison of measured CH4 profiles from this mid-latitude validation scenario is given in Figures 10 and 11. Features and the quality of agreement are very similar compared to those seen in the N2O comparison. N2O and CH4 results from the MIPAS-B flight no. 13 carried out in the night from 20/21 March 2003 are shown in Figures 12 and 13 respectively. For this comparison only MIPAS-E data version 4.57 has been available at the time of the ACVE-2 meeting. The MIPAS-E profiles show some oscillations which are expected to be smaller in the new 4.61 data version. The unreasonable low MIPAS-E N2O and CH4 values below about 100 hPa could be caused by emissions of clouds which are not included in the retrieval process.
10
100
-32 -24 -16 -8 0 8 16 24
-32 -24 -16 -8 0 8 16 24
Absolute Diff. combined errors
Absolute difference (ppbv)
Pres
sure
(hPa
)
0 50 100 150 200 250 300 350
10
100
0 50 100 150 200 250 300 350
Kiruna,21 March 2003 MIPAS-E, orbit 5515, Rec.4, 09:08:14, V4.57 MIPAS-B, Seq.D15c, 08:47:35
N2O VMR (ppbv)
Fig. 12. N2O profile as measured by MIPAS-B in the Arctic on 21 March 2003 compared to version 4.57 MIPAS-E data.
10
100
-0.4 -0.2 0.0 0.2 0.4 0.6
-0.4 -0.2 0.0 0.2 0.4 0.6
Absolute Diff. Combined errors
Pres
sure
(hPa
)
0.0 0.4 0.8 1.2 1.6 2.0 2.4
10
100
0.0 0.4 0.8 1.2 1.6 2.0 2.4
Kiruna,21 March 2003 MIPAS-E, orbit 5515, Rec.4, 09:08:14, V4.57 MIPAS-B, Seq.D15c, 08:47:35
Absolute difference (ppmv) CH4 VMR (ppmv)
Fig. 13. CH4 profile as measured by MIPAS-B in the Arctic on 21 March 2003 compared to version 4.57 MIPAS-E data. N2O-CH4 tracer correlations are illustrated in Figure 14 for measurements performed during flight no. 11 and 13 in comparison to in-situ data and corresponding MIPAS-E observations. The tracer correlations of

MIPAS-B and the in-situ data appear to be compact. The MIPAS-E correlations based on the new re-processed 4.61 data (September 2002) look also quite compact. However the MIPAS-E correlation from March 2003 based on the old v4.57 data reveals some outliers.
0 50 100 150 200 250 300 350 4000.0
0.2
0.4
0.6
0.8
1.0
1.2
1.4
1.6
1.8
2.0
2.20 50 100 150 200 250 300 350 400
0.0
0.2
0.4
0.6
0.8
1.0
1.2
1.4
1.6
1.8
2.0
2.2
Mean 1988-1992, 44°N-68°N (Engel et al., 1996), adjusted to 2002 Mid-latitudes 1993/94 (Michelsen et al., 1998), adjusted to 2002 MIPAS-E: 24-SEP-2002 22:06:29, V4.61 MIPAS-E: 24-SEP-2002 22:07:50, V4.61 MIPAS-E: 21-MAR-2003 09:08:14, V4.57 MIPAS-B: 24-SEP-2002 21:50:26 MIPAS-B: 24-SEP-2002 22:21:42 MIPAS-B: 21-MAR-2003 08:47:35 BONBON: 24-SEP-2002, 44°N
CH
4 Vol
ume
Mix
ing
Rat
io (p
pmv)
N2O Volume Mixing Ratio (ppbv) Fig. 14. N2O-CH4 relationship measured by MIPAS-B and MIPAS-E. For comparison, trend-corrected standard correlations [21, 22] and in-situ observations (BONBON, A. Engel, private communication, 2002) are plotted, too. Figure 15 shows a comparison for H2O measured during the MIPAS-B March 2003 flight. The H2O profile (data version 4.57) measured by MIPAS-E shows large oscillations and a low bias in the lower stratosphere. Further examples of an inter-comparison for the species H2O are given in [23].
10
100
-4.0 -3.0 -2.0 -1.0 0.0 1.0 2.0 3.0 4.0
-4.0 -3.0 -2.0 -1.0 0.0 1.0 2.0 3.0 4.0
Absolute Diff. Combined errors
Pres
sure
(hPa
)
0 2 4 6 8 10
10
100
0 2 4 6 8 10
Kiruna,21 March 2003 MIPAS-E, orbit 5515, Rec.4, 09:08:14, V4.57 MIPAS-B, Seq.D15c, 08:47:35
Absolute difference (ppmv) H2O VMR (ppmv) Fig. 15. H2O profile as measured by MIPAS-B in the Arctic on 21 March 2003 compared to version 4.57 MIPAS-E data. An example of a comparison to O3 is displayed in Figure 16. A good agreement between both sensors is obvious below about 13 hPa pressure height. Above this altitude region, the MIPAS-E data reveal a small high bias.
10
100
-1.2 -0.8 -0.4 0.0 0.4
-1.2 -0.8 -0.4 0.0 0.4
Absolute Diff. combined errors
O3 VMR (ppmv)Absolute difference (ppmv)
Pres
sure
(hPa
)
0 2 4 6
10
100
0 2 4 6
Kiruna,21 March 2003 MIPAS-E, orbit 5515, Rec.4, 09:08:14, V4.57 MIPAS-B, Seq.D15c, 08:47:35
Fig. 16. O3 profile as measured by MIPAS-B in the Arctic on 21 March 2003 compared to version 4.57 MIPAS-E data. Results of further inter-comparisons, like the important nitrogen species HNO3 and NO2 are discussed in other papers [24, 25].
6. CONCLUSIONS AND OUTLOOK We have shown that a perfect match of the GOMOS and MIPAS air masses measured on orbit 2975 could be achieved with the MIPAS-B2 balloon flight performed in the night of 24/25 September 2002 from Aire sur l’Adour in France as part of the Envisat validation activities. Horizontal gradients not only in temperature but also in the volume mixing ratios of the measured species have demonstrated the great benefit of carefully planned and analysed balloon measurements for satellite validation. The MIPAS-B instrument has been characterised, and the data were processed and uploaded to the NILU data centre. Comparisons to SCIAMACHY, which collected data 12 hours prior and after MIPAS-B at nearby locations, will presume trajectory mapping before sound comparisons can be made. Comparisons to GOMOS operational (v6.0a) data have shown that GOMOS profiles show smaller oscillations compared to older data versions. In the case of MIPAS-Envisat operational (v4.61) data the comparisons have revealed that, for the data set studied, temperature profiles compare very well to each other, and ozone and H2O agree within their combined error bars, although there is a small positive bias visible in the Envisat data above about 20 hPa altitude. N2O and CH4 profiles of MIPAS-Envisat show still some oscillations at lower altitudes but the agreement with MIPAS-B measurements has significantly been improved compared to the old v4.5x data. Some small oscillations are also visible in the NO2 profile while the HNO3 data turns out to be in good agreement with MIPAS-B.

Unfortunately, no version 4.61 data has been available so far for the year 2003. Only limited 4.5x data could therefore be compared to MIPAS-B measurements carried out on 20/21 March 2003 from Kiruna inside the polar vortex. These comparisons reveal generally a much poorer agreement. Whether this is connected to the more complex geophysical situation of the polar vortex area or reflects the poorer data quality of v4.5x data versions can only be evaluated when data will be available that are reprocessed with v4.61. For the summer high-latitude flight, performed in July 2003, there was also no new MIPAS-E data available. Therefore, a final assessment on the quality of agreement of both sensors is not yet possible. Recently, the reprocessing of the 2003 data with the v4.61 processor has been completed so that inter-comparison results should be available within the near future.
7. ACKNOWLEDGMENTS Financial support by the DLR (Projects FKZ 50EE0203 and 59EE0020) and ESA is gratefully acknowledged. We thank P. Wursteisen as ESA campaign coordinator for trouble-shooting, the CNES balloon launching team and the SSC Esrange people for excellent balloon operations, and the Free University of Berlin (K. Grunow and B. Naujokat) for meteorological support and trajectory calculations.
8. REFERENCES 1. Gille, J.C., S.T. Massie, and W.G. Mankin, Evaluation of the UARS data, Preface to the special issue of J. Geophys. Res., 101, 9539-9540, 1996. 2. Sasano, Y., M. Suzuki, T. Yokota, and H. Kanzawa, Improved Limb Atmospheric Spectrometer (ILAS) for stratospheric ozone layer measurements by solar occultation technique, Geophys. Res. Lett., 26, 197-200, 1999. 3. Wursteisen, P., The validation of the Envisat chemistry instruments by use of stratospheric balloons and aircraft, Proc. 16th ESA Symposium on European Rocket and Balloon Programmes and Related Research, 2-5 June 2003, St. Gallen, Switzerland, 407-413, 2003. 4. Fischer, H., and H. Oelhaf, Remote sensing of vertical profiles of atmospheric trace constituents with MIPAS limb emission spectrometers, Appl. Opt., 35, 2787-2796, 1996. 5. Friedl-Vallon, F., G. Maucher, A. Kleinert, A. Lengel, C. Keim, H. Oelhaf, H. Fischer, M. Seefeldner, and O. Trieschmann, Design and characterization of
the balloon-borne Michelson Interferometer for Passive Atmospheric Sounding, Appl. Opt., 43, 3335-3355, 2004. 6. Oelhaf, H., et al., Denitrification and Mixing in the 1994/1995 Arctic Vortex Derived from MIPAS-B Measurements and Modelling, in Stratospheric ozone 1999, Proc. 5th European Symposium 27th September to 1st October 1999, St. Jean de Luz, France, 292-295, 2000. 7. Stowasser, M., H. Oelhaf, G. Wetzel, F. Friedl-Vallon, G. Maucher, M. Seefeldner, O. Trieschmann, T. v. Clarmann, and H. Fischer, Simultaneous measurements of HDO, H2O and CH4 with MIPAS-B: Hydrogen budget and indication of dehydration inside the polar vortex, J. Geophys. Res., 104, 19213-19226, 1999. 8. Waibel, A. E., Th. Peter, K. S. Carslaw, H. Oelhaf, G. Wetzel, P. J. Crutzen, U. Pöschl, A. Tsias, E. Reimer, H. Fischer, Arctic ozone loss due to denitrification, Science, 283, 2064-2068, 1999. 9. Wetzel, G., et al., NOy partitioning and budget and its correlation with N2O in the Arctic vortex and in summer mid-latitudes in 1997, J. Geophys. Res., 107(D16), 4280, doi: 10.1029/2001JD000916, 2002. 10. Oelhaf, H., H. Fischer, G. Wetzel, M. Stowasser, F. Friedl-Vallon, G. Maucher, O. Trieschmann, R. Ruhnke, and Y. Sasano, Intercomparison of ILAS/ADEOS with MIPAS-B measurements in late March 1997, Proc. SPIE, 3501, 92-100, 1998. 11. Irie, H., et al., Validation of NO2 and HNO3 measurements from the Improved Limb Atmospheric Spectrometer (ILAS) with the version 5.20 retrieval algorithm, J. Geophys. Res., 107(D24), 8206, doi: 10.1029/2001JD001304, 2002. 12. Kanzawa, H., et al., Validation and data characteristics of water vapor profiles observed by the Improved Limb Atmospheric Spectrometer (ILAS) and processed with the version 5.20 algorithm, J. Geophys. Res., 107(D24), 8217, doi: 10.1029/2001JD000881, 2002 (Errata, J. Geophys. Res., 108(D4), 8218, doi: 10.1029/2003JD001601, 2003). 13. Kanzawa, H., et al., Validation and data characteristics of nitrous oxide and methane profiles observed by the Improved Limb Atmospheric Spectrometer (ILAS) and processed with the Version 5.20 algorithm, J. Geophys. Res., 108(D16), 8003, doi: 10.1029/2002JD002458, 2003.
14. Khosrawi, F., et al., Validation of CFC-12 measurements from the Improved Limb Atmospheric Spectrometer (ILAS) with the Version 6.0 retrieval algorithm, J. Geophys. Res., 109, D06311, doi:10.1029/2003JD004325, 2004. 15. Stiller, G.P., T. v. Clarmann, B. Funke, N. Glatthor, F. Hase, M. Höpfner, and A. Linden, Sensitivity of trace gas abundances retrievals from infrared limb emission spectra to simplifying approximations in radiative transfer modeling, J. Quant. Radiat. Transfer, 72(3), 249-280, 2002. 16. Höpfner, M., et al., Evidence of scattering of tropospheric radiation by PSCs in mid-IR limb emission spectra: MIPAS-B observations and KOPRA simulations, Geophys. Res. Lett., 29(8), 1278, doi: 10.1029/2001GL014443, 2002. 17. Phillips, D., A technique for the numerical solution of certain integral equations of the first kind, J. Ass. Comput. Math., 9, 84-97, 1962. 18. Tikhonov, A., On the solution of incorrectly stated problems and a method of regularization, Dokl. Acad. Nauk SSSR, 151, p. 501, 1963. 19. Steck, T., Methods for determining regularization for atmospheric retrieval problems, Appl. Opt., 41, 1788-1797, 2002. 20. Renard, J.-B., V. Catoire, G. Moreau, M. Pirre, G. Berthet, N. Huret, H. Oelhaf, G. Wetzel, F. Goutail, A. Bazureau, J.-P. Pommereau, A. Bracher, GOMOS NO2 validation, this issue, 2004. 21. Engel, A., C. Schiller, U. Schmidt, R. Borchers, H. Ovarlez, and J. Ovarlez, The total hydrogen budget in the Arctic winter stratosphere during the European Arctic Stratospheric Ozone Experiment, J. Geophys. Res., 101, 14495-14503, 1996. 22. Michelsen, H. A., G. L. Manney, M. R. Gunson, and R. Zander, Correlations of stratospheric abundances of NOy, O3, N2O, and CH4 derived from ATMOS measurements, J. Geophys. Res., 103, 28347-28359, 1998. 23. Oelhaf, H., et al., Validation of MIPAS-ENVISAT 4.61 operational data by airborne measurements: H2O, this issue, 2004. 24. Oelhaf, H., et al., Validation of MIPAS-ENVISAT version 4.61 HNO3 operational data by stratospheric balloon, aircraft and ground-based measurements, this issue, 2004.
25. Wetzel, G., et al., Validation of MIPAS-ENVISAT 4.61 operational data: NO2, this issue, 2004.