Eradication of Liver-Implanted Tumors by Semliki Forest Virus Expressing IL-12 Requires Efficient...
17
of March 4, 2013. This information is current as Responses Requires Efficient Long-Term Immune Semliki Forest Virus Expressing IL-12 Eradication of Liver-Implanted Tumors by Hervas-Stubbs and Cristian Smerdou Medina-Echeverz, Jesus Prieto, Pedro Berraondo, Sandra Bezunartea, Marta Ruiz-Guillen, Erkuden Casales, Jose Jose I. Quetglas, Juan R. Rodriguez-Madoz, Jaione http://www.jimmunol.org/content/190/6/2994 doi: 10.4049/jimmunol.1201791 February 2013; 2013; 190:2994-3004; Prepublished online 11 J Immunol Material Supplementary 1.DC1.html http://www.jimmunol.org/content/suppl/2013/02/11/jimmunol.120179 References http://www.jimmunol.org/content/190/6/2994.full#ref-list-1 , 14 of which you can access for free at: cites 42 articles This article Subscriptions http://jimmunol.org/subscriptions is online at: The Journal of Immunology Information about subscribing to Permissions http://www.aai.org/ji/copyright.html Submit copyright permission requests at: Email Alerts http://jimmunol.org/cgi/alerts/etoc Receive free email-alerts when new articles cite this article. Sign up at: Print ISSN: 0022-1767 Online ISSN: 1550-6606. Immunologists, Inc. All rights reserved. Copyright © 2013 by The American Association of 9650 Rockville Pike, Bethesda, MD 20814-3994. The American Association of Immunologists, Inc., is published twice each month by The Journal of Immunology at Universidad de Navarra on March 4, 2013 http://jimmunol.org/ Downloaded from
Transcript of Eradication of Liver-Implanted Tumors by Semliki Forest Virus Expressing IL-12 Requires Efficient...
of March 4, 2013.This information is current as
ResponsesRequires Efficient Long-Term ImmuneSemliki Forest Virus Expressing IL-12 Eradication of Liver-Implanted Tumors by
Hervas-Stubbs and Cristian SmerdouMedina-Echeverz, Jesus Prieto, Pedro Berraondo, SandraBezunartea, Marta Ruiz-Guillen, Erkuden Casales, Jose Jose I. Quetglas, Juan R. Rodriguez-Madoz, Jaione
http://www.jimmunol.org/content/190/6/2994doi: 10.4049/jimmunol.1201791February 2013;
2013; 190:2994-3004; Prepublished online 11J Immunol
MaterialSupplementary
1.DC1.htmlhttp://www.jimmunol.org/content/suppl/2013/02/11/jimmunol.120179
Referenceshttp://www.jimmunol.org/content/190/6/2994.full#ref-list-1
, 14 of which you can access for free at: cites 42 articlesThis article
Subscriptionshttp://jimmunol.org/subscriptions
is online at: The Journal of ImmunologyInformation about subscribing to
Permissionshttp://www.aai.org/ji/copyright.htmlSubmit copyright permission requests at:
Email Alertshttp://jimmunol.org/cgi/alerts/etocReceive free email-alerts when new articles cite this article. Sign up at:
Print ISSN: 0022-1767 Online ISSN: 1550-6606. Immunologists, Inc. All rights reserved.Copyright © 2013 by The American Association of9650 Rockville Pike, Bethesda, MD 20814-3994.The American Association of Immunologists, Inc.,
is published twice each month byThe Journal of Immunology
at Universidad de N
avarra on March 4, 2013
http://jimm
unol.org/D
ownloaded from
The Journal of Immunology
Eradication of Liver-Implanted Tumors by Semliki ForestVirus Expressing IL-12 Requires Efficient Long-TermImmune Responses
Jose I. Quetglas, Juan R. Rodriguez-Madoz, Jaione Bezunartea, Marta Ruiz-Guillen,
Erkuden Casales, Jose Medina-Echeverz, Jesus Prieto, Pedro Berraondo,
Sandra Hervas-Stubbs, and Cristian Smerdou
Semliki Forest virus vectors expressing IL-12 (SFV–IL-12) were shown to induce potent antitumor responses against s.c. MC38
colon adenocarcinomas in immunocompetent mice. However, when MC38 tumors were implanted in liver, where colon tumors
usually metastasize, SFV–IL-12 efficacy was significantly reduced. We reasoned that characterization of immune responses against
intrahepatic tumors in responder and nonresponder animals could provide useful information for designing more potent antitu-
mor strategies. Remarkably, SFV–IL-12 induced a high percentage of circulating tumor-specific CD8 T cells in all treated animals.
Depletion studies showed that these cells were essential for SFV–IL-12 antitumor activity. However, in comparison with non-
responders, tumor-specific cells from responder mice acquired an effector-like phenotype significantly earlier, were recruited
more efficiently to the liver, and, importantly, persisted for a longer period of time. All treated mice had high levels of functional
specific CD8 T cells at 8 d posttreatment reflected by both in vivo killing and IFN-g–production assays, but responder animals
showed a more avid and persistent IFN-g response. Interestingly, differences in immune responses between responders and
nonresponders seemed to correlate with the immune status of the animals before treatment and were not due to the treatment
itself. Mice that rejected tumors were protected against tumor rechallenge, indicating that sustained memory responses are
required for an efficacious therapy. Interestingly, tumor-specific CD8 T cells of responder animals showed upregulation of IL-
15Ra expression compared with nonresponders. These results suggest that SFV–IL-12 therapy could benefit from the use of
strategies that could either upregulate IL-15Ra expression or activate this receptor. The Journal of Immunology, 2013, 190:
2994–3004.
Metastatic liver cancer takes placewhen cancer originatesin other organs, such as colon, stomach, pancreas, orbreast, and spreads to the liver. This type of liver cancer
is more common than primary liver cancer and is especially fre-quent in patients having colorectal carcinoma, where it develops in35–55% of cases (1). In recent years, significant advances in de-tection, locoregional therapeutic options, and new chemothera-peutic agents have improved the management of colorectal livermetastasis (CLM) (2). Although there are still many incurablecases of CLM, the course of progression can be greatly slowed bya multimodality treatment encompassing surgery, chemotherapy,and interventional locoregional therapy (2, 3).
This type of multimodality treatment could also benefit fromimmunotherapeutic approaches, because many tumors have thepotential to be recognized by the immune system, and induction ofan immune response against the tumor could, in theory, reach allcancer cells. This might be of particular interest in CLM whereseveral tumor nodules could be present in the same patient.One of the most potent immunostimulatory cytokines is IL-12,
a heterodimeric protein usually produced by dendritic cells andmacrophages that has demonstrated strong antitumor activity inseveral preclinical cancer models (4). This activity is mediated byIFN-g and results in activation of both innate and adaptive im-mune responses, as well as in inhibition of angiogenesis (5, 6). IL-12 can be delivered either as recombinant protein or expressed froma viral or nonviral vector. The “vector” option has shown a higherdegree of safety because it allows expression of the cytokine lo-cally, reducing the systemic toxic effects produced by IFN-g (7).Viral vectors based on adenoviruses, poxviruses, or alphavirusesexpressing IL-12 have been used successfully to eradicate tumors inanimals (8–10). However, despite promising preclinical results,a first-generation adenovirus expressing human IL-12 showeda very modest effect in patients with advanced digestive tumors,which also included cases of colon and liver cancer (11).The discrepancy observed between preclinical models and
clinical trials can be due to a number of factors, such as the presenceof a higher tumor burden, genetic heterogeneity, or lower tumortransduction in human patients (12). In addition, preclinicalmodels often rely on transplanted tumors developed in tissues ororgans where they are not usually present and where immuneresponses can be qualitatively and quantitatively different (13, 14).
Division of Hepatology and Gene Therapy, Center for Applied Medical Research,University of Navarra, Pamplona 31008, Navarra, Spain
Received for publication June 28, 2012. Accepted for publication January 14, 2013.
This work was supported by the Spanish Health Ministry (PI11/02190), Departa-mento de Educacion del Gobierno de Navarra (GNE-VECTORES ALFAVIRUS), andthe Center for Applied Medical Research-UTE Project. J.I.Q. was the recipient ofa Torres Quevedo contract.
Address correspondence and reprint requests to Dr. Cristian Smerdou and Dr. SandraHervas-Stubbs, Division of Hepatology and Gene Therapy, Center for Applied Med-ical Research, University of Navarra, Pamplona 31008, Navarra, Spain. E-mail ad-dresses: [email protected] (C.S.) and [email protected] (S.H.-S.)
The online version of this article contains supplemental material.
Abbreviations used in this article: CLM, colorectal liver metastasis; KSP,KSPWFTTL; MDSC, myeloid-derived suppressor cell; SFV, Semliki Forest virus;SFV–IL-12, Semliki Forest virus vector expressing IL-12; Treg, regulatory T cell; vp,viral particle.
Copyright� 2013 by TheAmericanAssociation of Immunologists, Inc. 0022-1767/13/$16.00
www.jimmunol.org/cgi/doi/10.4049/jimmunol.1201791
at Universidad de N
avarra on March 4, 2013
http://jimm
unol.org/D
ownloaded from
Semliki Forest virus (SFV) is an alphavirus containing a singlepositive-strand RNA genome that replicates in the cytoplasm ofinfected cells (15). An expression vector based on SFV was de-veloped in which the region coding for the viral structural proteinsis replaced by the heterologous gene of interest (16). Our groupshowed previously that SFV vectors expressing IL-12 (SFV–IL-12) were able to induce strong antitumor responses against colonadenocarcinomas implanted s.c. in immunocompetent mice (17).These responses were mainly mediated by the induction of cyto-lytic CD8 T cells and were favored by the fact that SFV repli-cation induces apoptosis in infected cells, resulting in release oftumor Ags that can be taken up and presented by APCs (18).Despite the good antitumor activity shown by SFV–IL-12 againsts.c. colon tumors, we observed that when the same type of tumorwas implanted in the liver there was a dramatic decrease in effi-cacy, suggesting that the local tumor environment plays a majorrole in the outcome of treatment. To design more potent antitumorstrategies against liver tumors, we used this surrogate model ofsecondary liver cancer to analyze in detail the antitumor immuneresponses elicited by SFV–IL-12. By comparing responding andnonresponding animals, we observed that the induction of moresustained immune responses in the first group was required for theelimination of tumors. A possible clue for this effect was providedby the observation that IL-15Ra was upregulated in tumor-specificCD8 T cells in responder animals.
Materials and MethodsAnimals and cell lines
Female 4-wk-old C57BL/6 mice were purchased from Harlan (Barcelona,Spain) and maintained under standard pathogen-free conditions accordingto the institution’s ethical guidelines. Mouse adenocarcinoma cell lineMC38-luc, derived from MC38 cell line expressing luciferase (19), andhamster BHK-21 cells (ATCC-CCL10) were cultured as described previ-ously (17). All culture media were supplemented with 2 mM glutamineand antibiotics.
Plasmids and vector production
Plasmids pSFV–enhIL-12 and pSFV-enhLacZ, containing genes coding formouse IL-12 and b-galactosidase, respectively, were described previously(17, 20). Vector RNA synthesis and transfection into BHK-21 cells byelectroporation was performed as described previously (16). Packaging ofRNA into SFV viral particles (vp) was performed as described (21).Briefly, BHK-21 cells were coelectroporated with SFV vector RNA (SFV-enhIL-12 or SFV-enhLacZ) and both SFV-helper-S2 and SFV-helper-C-S219A RNAs, which provide in trans the capsid and spikes proteins,respectively. Electroporated cells were incubated at 33˚ for 48 h, super-natants were collected, and SFV vp were purified by ultracentrifugation, asdescribed previously (22). Indirect immunofluorescence of infected BHK-21 cells was performed to determine the titer of SFV–enhIL-12 and SFV-enhLacZ (designated in this article as SFV–IL-12 and SFV-LacZ, re-spectively) recombinant virus stocks (23). A rabbit polyclonal antiserumspecific for the nsp2 subunit of SFV replicase was used as primary Ab.
Induction and treatment of tumor nodules in SFV experiments
To generate intrahepatic tumor nodules, MC38-luc cells were collected,washed twice with HBSS, and resuspended in the same buffer. C57BL/6mice were inoculated with 5 3 105 cells (50 ml) into the main liverlobe; after 8 d, a single tumor nodule of ∼4–6 mm in diameter was ob-served. Tumors were treated by intratumoral injection with the indicateddoses of SFV vp in a total volume of 25 ml saline buffer. Evaluation oftreatment was carried out 24 d after virus inoculation by laparatomy. Tu-mor size was monitored by measuring two perpendicular diameters andconsidering the average diameter as an indicator of tumor size. Survival ofanimals was checked daily.
Luciferase determination
Mice bearing MC38-luc tumors in the liver were anesthetized and injectedi.p. with 100 ml D-luciferin (30.3 mg/ml; Promega, Madison, WI), and lu-ciferase activity was measured in each animal with an IVIS charge-coupled
device camera system and analyzed with the Living Image 2.20 softwarepackage (Xenogen, Hopkinton, MA).
Determination of IL-12 and IFN-g in serum
Serum concentrations of murine IL-12 and IFN-g were determined byOptEIA mouse IL-12 (p70) and mouse IFN-g ELISA kits (BD BiosciencesPharmingen, San Diego, CA).
Depletion of immune cells
Depletions of CD4+, CD8+, and NK1.1+ cells were performed by i.p. in-jection of 100 mg specific Abs against CD4, CD8b, and NK1.1 cellreceptors. Anti-CD4 (clone GK15) and anti-CD8b (clone H35-17.2) Abswere injected at days 22, 2, 7, and 15 after tumor treatment. Anti-NK1.1Ab (clone PK-136) was injected at days 22, 0, 2, 4, 7, and 15 after tumortreatment. Depletions of Ly6G+ and Ly6C+ cells were performed by i.p.injection of 200 mg specific Abs anti-Gr1 (clone RB6-8C5, which recog-nizes an epitope in both Ly6G and Ly6C receptors) and anti-Ly6G (clone1A8; Bio X Cell, West Lebanon, NH). Anti-Gr1 and anti-Ly6G Abs wereadministered at days 1, 6, and 11 after tumor treatment. Depletions weremonitored by FACS analysis of PBMCs stained with fluorochrome-taggedanti-CD4 (clone RMA-5), anti-CD8a (clone 53-6.7), anti-CD49b (cloneDX5), anti-Ly6C (clone AL-21), and anti-Ly6G (clone 1A8). Only micewith a depletion efficacy. 99% for each specific cell type were used in thestudy.
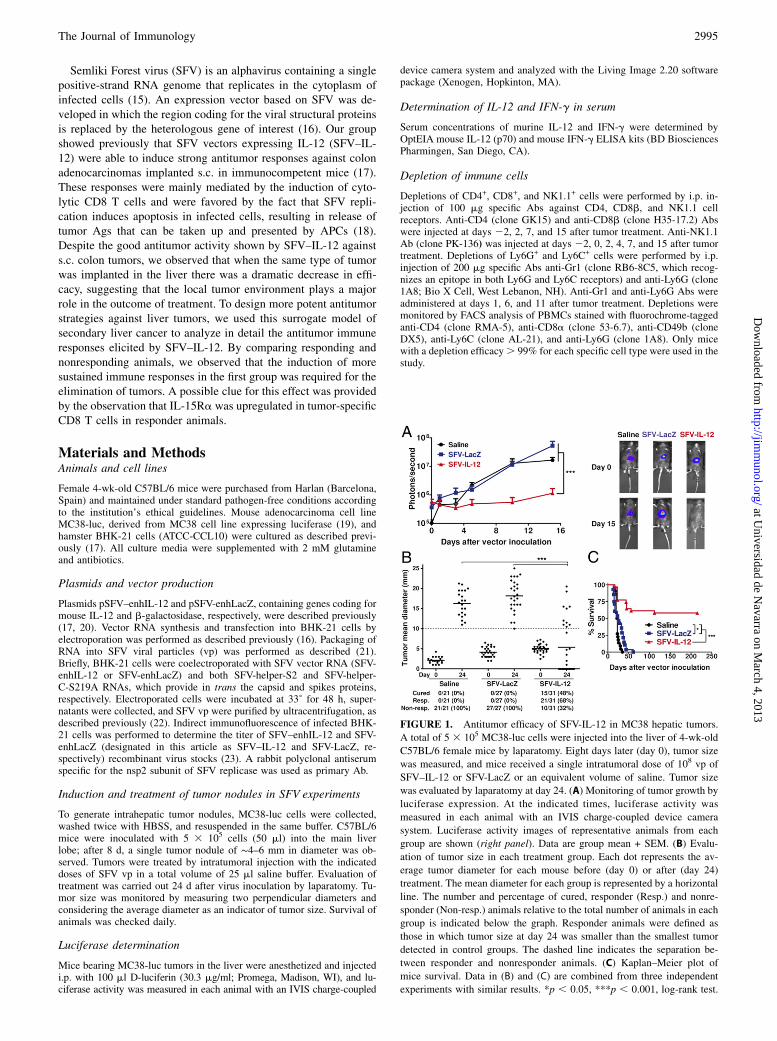
FIGURE 1. Antitumor efficacy of SFV-IL-12 in MC38 hepatic tumors.
A total of 5 3 105 MC38-luc cells were injected into the liver of 4-wk-old
C57BL/6 female mice by laparatomy. Eight days later (day 0), tumor size
was measured, and mice received a single intratumoral dose of 108 vp of
SFV–IL-12 or SFV-LacZ or an equivalent volume of saline. Tumor size
was evaluated by laparatomy at day 24. (A) Monitoring of tumor growth by
luciferase expression. At the indicated times, luciferase activity was
measured in each animal with an IVIS charge-coupled device camera
system. Luciferase activity images of representative animals from each
group are shown (right panel). Data are group mean + SEM. (B) Evalu-
ation of tumor size in each treatment group. Each dot represents the av-
erage tumor diameter for each mouse before (day 0) or after (day 24)
treatment. The mean diameter for each group is represented by a horizontal
line. The number and percentage of cured, responder (Resp.) and nonre-
sponder (Non-resp.) animals relative to the total number of animals in each
group is indicated below the graph. Responder animals were defined as
those in which tumor size at day 24 was smaller than the smallest tumor
detected in control groups. The dashed line indicates the separation be-
tween responder and nonresponder animals. (C) Kaplan–Meier plot of
mice survival. Data in (B) and (C) are combined from three independent
experiments with similar results. *p , 0.05, ***p , 0.001, log-rank test.
The Journal of Immunology 2995
at Universidad de N
avarra on March 4, 2013
http://jimm
unol.org/D
ownloaded from
IFN-g ELISPOT and in vivo killing assays
Immune responses were measured in vitro using a murine IFN-g ELISPOTassay (BD Biosciences), as described (24). Briefly, splenocytes (4 3 105
cells/well) were cultured in triplicate in Ab-coated plates in the absence orpresence of the MC38 tumor–associated KSPWFTTL (KSP) peptide (25)(10 mg/ml; NeoMPS, Strasbourg, France). The next day, plates were in-cubated with biotinylated anti–IFN-g Ab and developed following themanufacturer’s instructions. Spots were counted using an automatedELISPOT reader (CTL, Aalen, Germany).
In vivo evaluation of immune responses was performed by in vivo killingassays. Splenocytes from naive C57BL/6 mice were divided into twosamples. One sample was pulsed with KSP peptide at 10 mg/ml for 30 minat 37˚C, washed extensively, and labeled with 2.5 mM CFSE (Sigma-Aldrich, Dorset, U.K.). The nonpulsed control sample was labeled with0.25 mM CFSE. Then, both CFSEhigh and CFSElow labeled cells weremixed at a 1:1 ratio (53 106 cells of each population) and injected i.v. intotumor-bearing mice. Twenty hours after transfer, spleens were harvested,and specific cytotoxicity was analyzed by flow cytometry. Specific cyto-toxicity was calculated as follows: 100 2 [100 3 (% CFSEhigh tumor-bearing mice/% CFSElow tumor-bearing mice)/(% CFSEhigh naive mice/%CFSElow naive mice)].
Immunohistochemistry
Tumor samples were embedded in Tissue-Tek OCT (Sakura, Zoeterwoude,The Netherlands) for CD8 staining. Samples were air-dried and fixed in coldacetone for 10 min. Endogenous peroxidase was quenched with PeroxidaseBlocking Reagent (Dako, Carpinteria, CA). Tissue sections were incubatedovernight at 4˚ with anti-mouse CD8a (Becton Dickinson, Franklin Lakes,NJ) diluted in TBS and then with a polyclonal rabbit anti-rat biotinylatedAb (Dako). Peroxidase activity was revealed using anti-rabbit EnVisionSystem and DAB+ Substrate Chromogen System (both from Dako).
Flow cytometry
Spleens, livers, and tumors were harvested and treated with 400 U/mlcollagenase D and 50 mg/ml DNase I (Roche Diagnostics, Indianapolis,
IN). After mechanical tissue dissociation, cells were passed through a 70-mm nylon mesh filter (BD Falcon, BD Bioscience, San Jose, CA) andwashed. To enrich liver cell suspension in leukocytes, hepatocytes wereremoved with Percoll gradients. Remaining cells were treated with ACKlysing buffer and washed before further use. The single-cell suspensionobtained was pretreated with anti-CD16/32 (clone 2.4G2; BD BiosciencesPharmingen) to reduce nonspecific binding to FcRs. After this, cells werestained with the following fluorochrome-conjugated Abs: CD3 (clone 145-2C11), CD8 (clone 53-6.7), CD4 (clone RM4-5), CD25 (clone PC61),CD11b (clone M1/70), Ly6C (clone AL-21), Ly6G (clone 1A8), CD62L(clone MEL-14), CD69 (clone HI.2F3), or NK1.1 (clone PK-136) (all fromBD Pharmingen or BioLegend, Aachen, Germany). To detect IL-15Ra, weused a biotinylated goat polyclonal IgG (R&D Systems) plus fluorochrome-conjugated streptavidin (BD Pharmingen). To identify specific tumor CD8T lymphocytes, cells were stained with the iTAg MHC Class I tetramerloaded with the KSP synthetic peptide (25) and conjugated with PE(Beckman Coulter, Madrid, Spain). Blood samples were obtained by retro-orbital venous sinus bleeding of mice, cells were surface stained and thenfixed, and erythrocytes were cleared with FACS Lysing Solution (BDBiosciences). Intracellular staining for Foxp3 or granzyme B was per-formed using a mouse regulatory T cell staining kit or a Fix/Perm kit (bothfrom BD Biosciences) plus anti-human granzyme B fluorochrome-conjugated Ab (clone GB11; BioLegend), respectively, according to themanufacturers’ instructions. FACSCanto II and FACSCalibur (BD Bio-sciences) were used for cell acquisition, and data analysis was carried outusing FlowJo software (TreeStar, Ashland, OR).
Intracellular cytokine staining
Lymphocytes from spleens were resuspended in complete RPMI 1640, setup in 96-well plates at a concentration of 53 105 cells/well, and incubatedfor 4 h with brefeldin A at 10 mg/ml, monensin at 5 mg/ml, KSP peptide at10 mg/ml, or an equivalent volume of medium. After that, cells wereprocessed with the Fix & Perm kit (BD Biosciences) and stained forintracellular IFN-g using anti-mouse IFN-g Ab (clone XMG1.2; BDPharmingen).
Statistical analysis
All error terms are expressed as the SEM. Prism software (GraphPadSoftware, San Diego, CA) was used for statistical analysis. Survival oftumor-bearing animals was represented by Kaplan–Meier plots and ana-lyzed by a log-rank test. To compare four experimental groups, theKruskal–Wallis test, followed by the Dunn multiple-comparison test, wasused for nonparametric data, and one-way ANOVA, followed by theBonferroni multiple-comparison test, was used for parametric data. The pvalues ,0.05 were considered statistically significant. For time-seriesanalysis, data were fitted to a mathematical model, and treatments werecompared using the extra sum-of-squares F test in the Prism softwarepackage. Data in Fig. 1Awere log transformed and fitted to a second-orderpolynomial equation. Data in Fig. 4A were fitted to a centered third-orderpolynomial equation; a dose-response model was used for the data in Fig.4B. In Fig. 4B, the comparison between responders and nonresponders atday 4 was done using the Mann–Whitney U test.
FIGURE 2. IL-12 and IFN-g levels in serum. Sera samples from mice
described in Fig. 1 were taken 24 h after vector inoculation and analyzed
by specific ELISA to determine IL-12 and IFN-g levels. Data are mean +
SEM. ***p , 0.001. n.s., Not significant.
FIGURE 3. CD8 T cells are required for SFV-IL-12
antitumor efficacy. (A) Mice bearing MC38 intrahepatic
tumors were treated with SFV–IL-12, as described in
Fig. 1 (No depletion), or combined with i.p. injection of
specific Abs to deplete CD4+, CD8b+, or NK1.1+ cells
as described in Materials and Methods. Twenty-four
days after vector inoculation, tumor size was evaluated
by laparatomy. Each dot represents the average tumor
diameter for each mouse. The mean of each group is
represented by a horizontal line. The data in bold type
shown below each treatment group indicate the number
of tumor-free mice at day 24/total number of animals
(upper) and the percentage of complete tumor regres-
sions (lower). (B) MC38 tumors were isolated from mice
at day 4 after treatment and processed for immunohis-
tochemistry using a CD8-specific Ab (images from two
representative tumors in each treatment group are
shown). Tumor samples were embedded in Tissue-Tek
OCT (Sakura, Zoeterwoude, The Netherlands) for CD8
staining. Original magnification 3100. ***p , 0.001.
a, Anti; n.s., not significant.
2996 SFV–IL-12 THERAPY OF LIVER SECONDARY TUMORS
at Universidad de N
avarra on March 4, 2013
http://jimm
unol.org/D
ownloaded from
ResultsEvaluation of SFV–IL-12 antitumor efficacy in colon tumorsestablished in the liver
Previous studies showed that an SFV vector expressing IL-12 athigh levels was able to induce a potent antitumor effect in a s.c.model of MC38 murine colon adenocarcinoma. In this model,intratumoral inoculation of 108 vp of SFV–IL-12 was able to in-duce .90% complete tumor remissions (17). Because colontumors implanted s.c. do not resemble a real clinical situation, wedecided to test the SFV–IL-12 vector in MC38 tumors developedin the liver of syngeneic mice. We used this model because colontumors usually metastasize to the liver. MC38 cells engineered toexpress luciferase (MC38-luc) (19) were inoculated into the liverof C57BL/6 mice by laparotomy; when tumors reached 4–6 mm indiameter (day 0), they were injected with 108 vp of SFV–IL-12 orSFV-LacZ or saline. Tumor growth was monitored by measuringluciferase expression in live animals (Fig. 1A). We observed thatluciferase expression increased with time in saline- or SFV-LacZ–treated tumors, indicating that tumors in these animals grew ina similar way (p = 0.19). However, in SFV–IL-12–treated animals,luciferase expression decreased until it was undetectable by day15, or it increased to a lesser extent compared with control animals(p , 0.0001). To determine the effect of treatment on tumorgrowth more precisely, tumors were measured by laparatomy atday 24. In agreement with data from luciferase monitoring, alltumors in mice inoculated with saline or SFV-LacZ had grown toa great extent, reaching a similar size (Fig. 1B). In contrast,treatment with SFV–IL-12 induced complete regression in 48% oftumors. In this group, an additional 20% of animals showed an-titumor responses that resulted in partial regression or delayedtumor growth compared with tumors in control groups. SFV–IL-12 treatment also significantly increased survival of treated micein comparison with control groups (Fig. 1C). Importantly, com-plete responders remained tumor-free until the end of the exper-iment (day 215). In addition, half of the animals that had showna partial response at day 24 had eradicated the tumors by day 215.SFV–IL-12 treatment showed a good safety profile in terms of
liver function. Although SFV–IL-12 inoculation increased alanineaminotransferase levels at day 1, they decreased quickly to basallevels by day 3 (Supplemental Fig. 1). Interestingly, at later times,serum transaminase levels in animals that had shown total orpartial antitumor responses remained at basal levels, in contrastwith animals from control groups or SFV–IL-12 nonresponderanimals, which showed a dramatic increase in transaminases atday 10 after treatment, likely reflecting tumor growth in the liver.These results showed that SFV–IL-12 has a reasonably good
efficacy and safety profile in the treatment of MC38 tumors de-veloped in the liver. However, its efficacy was significantly lowerthan that obtained against the same tumors implanted s.c. (Sup-plemental Fig. 2A), suggesting that different antitumor mecha-nisms could be taking place locally in the liver.To improve the antitumor therapies against liver tumors, we
performed in-depth assessments of the antitumor immune responsesgenerated after SFV–IL-12 treatment. For that purpose, we dividedanimals treated with SFV–IL-12 into two groups: “respondermice,” including those that either eliminated tumors completely orshowed a partial effect, and “nonresponder mice,” in which tumorsgrew at a pace similar to control mice.
IL-12 and IFN-g levels are similar in sera of responderand nonresponder mice
The different outcome of SFV–IL-12 treatment in responder andnonresponder mice could be due to a more efficient transduction
of tumors in the former group, leading to higher IL-12 expressionand induction of IFN-g in those animals. To assess that, we ana-lyzed sera from treated mice at 24 h after vector inoculation, andIL-12 and IFN-g values were determined by specific ELISA. Asexpected, very low levels of IL-12 or IFN-g were detected in seraof SFV-LacZ– or saline-treated animals. All SFV–IL-12–treatedmice exhibited higher levels of both cytokines compared withcontrol animals, but no significant differences were observed be-tween responder and nonresponder mice (Fig. 2). In addition, nosignificant correlation was observed between IL-12 levels detectedat day 1 and tumor size at day 24 in mice treated with SFV–IL-12(p . 0.05; Spearman correlation coefficient = 20.27). This resultindicates that the better antitumor response in the responder groupwas not due to differences in vector delivery.
FIGURE 4. Analysis of tumor-specific CD8 T cells in blood. Mice
bearing MC38 liver tumors received a single intratumoral dose of 108 vp or
an equivalent volume of saline. (A) The percentage of tumor-specific CD8
T cells in blood was determined by flow cytometry at the indicated
times. A total of 31 mice was treated with SFV–IL-12, of which 24 were
responders, and 7 were nonresponders. Mice treated intratumorally with
saline (Saline; n = 24) or animals without tumors (Naive; n = 9) were used
as controls. (B) Percentage of tumor-specific CD8 T cells that were also
CD62L2. Graphs show combined data from three independent experi-
ments with similar results. (C) Representative MC38-tetramer and CD62L
dot plots gated on CD8 T cells showing the percentage of events in each
quadrant. *p , 0.05, **p , 0.01.
The Journal of Immunology 2997
at Universidad de N
avarra on March 4, 2013
http://jimm
unol.org/D
ownloaded from
CD8 T cells are required for complete tumor elimination afterSFV–IL-12 treatment
To determine which immune cells were involved in the antitumorefficacy of SFV–IL-12 against hepatic transplantable MC38tumors, we depleted NK1.1+ cells and CD8b+ and CD4+ T cells inanimals bearing liver MC38 tumors prior to treatment. Depletionof CD8b+ cells completely abrogated the antitumor effect ofSFV–IL-12 (p, 0.001), indicating an essential role for these cellsin this type of therapy (Fig. 3A). Elimination of CD4+ or NK1.1+
cells resulted in a reduction of average tumor size that, in bothcases, was similar to that observed in the nondepleted group.These results indicate that CD4 T cells and NK/NKT cells do notseem to be necessary for the antitumor responses mediated bySFV–IL-12 in this tumor model. The role of CD8 T cells wasconfirmed by immunohistochemistry, which showed a strong in-filtration of these cells in most tumors 4 d after SFV–IL-12treatment (Fig. 3B).
SFV–IL-12 treatment increases tumor-specific effector CD8T cell numbers
Because CD8 T cells played a fundamental role in SFV–IL-12–mediated eradication of MC38 liver tumors, we monitored tumor-specific CD8 T cell responses in both responder and nonresponderanimals. For that purpose, mice bearing MC38 tumors in the liverwere treated either with SFV–IL-12 or saline. Blood was extractedfrom these mice on different days posttreatment, and PBMCs wereanalyzed by multicolor flow cytometry analysis using MHC class Itetramers specific for a MC38 dominant peptide (KSP) and an Abagainst CD62L surface marker, whose downregulation was asso-
ciated with the acquisition of an effector-like phenotype (26). Asdepicted in Fig. 4A and 4C, treatment with SFV–IL-12 remarkablyexpanded the population of MC38-specific CD8 T cells in PBLs,reaching the highest level at day 7. MC38-specific CD8 T cellswere detected at very low levels in the blood of either saline-treatedor naive mice. The initial expansion was followed by a declinephase, with the attrition rate greater in nonresponder animals thanin responder animals (p = 0.0095). Interestingly, after day 22, thepercentage of MC38-specific CD8 T cells was maintained stablyonly in responder mice (Fig. 4A). The loss of CD62L marker at day7 in the majority of tumor-specific CD8 T cells from both re-sponder and nonresponder animals indicated the development ofeffector immune responses in both groups (Fig. 4B, 4C). However,responder animals acquired this phenotype significantly earlier (seeday 4 in Fig. 4B, 4C). The readiness to acquire an effector-likephenotype and a more sustained CD8 T cell response may be theclues to the greater survival of the responder group.We also analyzed the presence of tumor-specific CD8 T cells in
the liver, spleen, and tumors of mice treated with SFV–IL-12 orsaline. In this experiment, a slightly lower dose of SFV–IL-12(5 3 107 vp) was used to increase the number of animals thatshowed a partial response. Half of the animals were sacrificed atday 4 posttreatment, and the other half was sacrificed at day 13,a time point that allowed us to classify mice as responders ornonresponders to the therapy (see Supplemental Fig. 2B forclassification of animals). Interestingly, at day 13 we observeda significant increase in tumor-specific CD8 T cells in livers andspleens of SFV–IL-12 responder animals (Fig. 5, top and middlepanels). Although this effect was not as evident in tumors, the
FIGURE 5. Analysis of tumor-specific CD8 T cells in liver, spleen, and tumor. Mice bearing MC38 liver tumors received a single intratumoral dose of
53 107 vp of SFV–IL-12 or an equivalent volume of saline. Total number of MC38-specific CD8 T cells (liver and spleen) or number of MC38-specific CD8
T cells/mm3 of tissue (tumor) was determined by flow cytometry at the indicated times (graphs in right panels). The median for each group is represented
by a horizontal line, considering responder (:) and nonresponder animals (gray circles) at day 13 as different groups (animals in all other groups, d). The
median for responder and nonresponder mice is indicated by a black and gray line, respectively. The number of liver CD8 T cells in responder animals at
day 13 was compared with all other groups. Tumor volume was determined using the formula: volume = (D 3 d2)/2, where D is the longest diameter, and
d is the shortest diameter. Representative dot plots show the percentage of tumor-specific CD8 T cells (left panels). *p , 0.05, ***p , 0.001. Sal., Saline.
2998 SFV–IL-12 THERAPY OF LIVER SECONDARY TUMORS
at Universidad de N
avarra on March 4, 2013
http://jimm
unol.org/D
ownloaded from
relative number of tumor-specific CD8 T cells increased at day 4in ∼50% of SFV–IL-12–treated animals. The fact that 40% oftumors had been eliminated by day 13 complicated the tumoranalysis at that time point. Nevertheless, the percentage of MC38-specific CD8 T cells in tumors at day 13 tended to be higher inresponder animals (Fig. 5, bottom panels). Taking into accountthat nonresponder mice showed higher numbers of peripheraltumor-specific CD8 T cells than did responder animals (Fig. 4A,4C), the low levels of these cells in liver and tumors of the firstgroup would likely indicate a decreased recruiting capacity tothose tissues. Our results also suggest that the presence of highnumbers of tumor-specific CD8 T cells in the liver correlates witha good antitumor response against tumors implanted in this organ.To address the possible role of other immune cell subsets on the
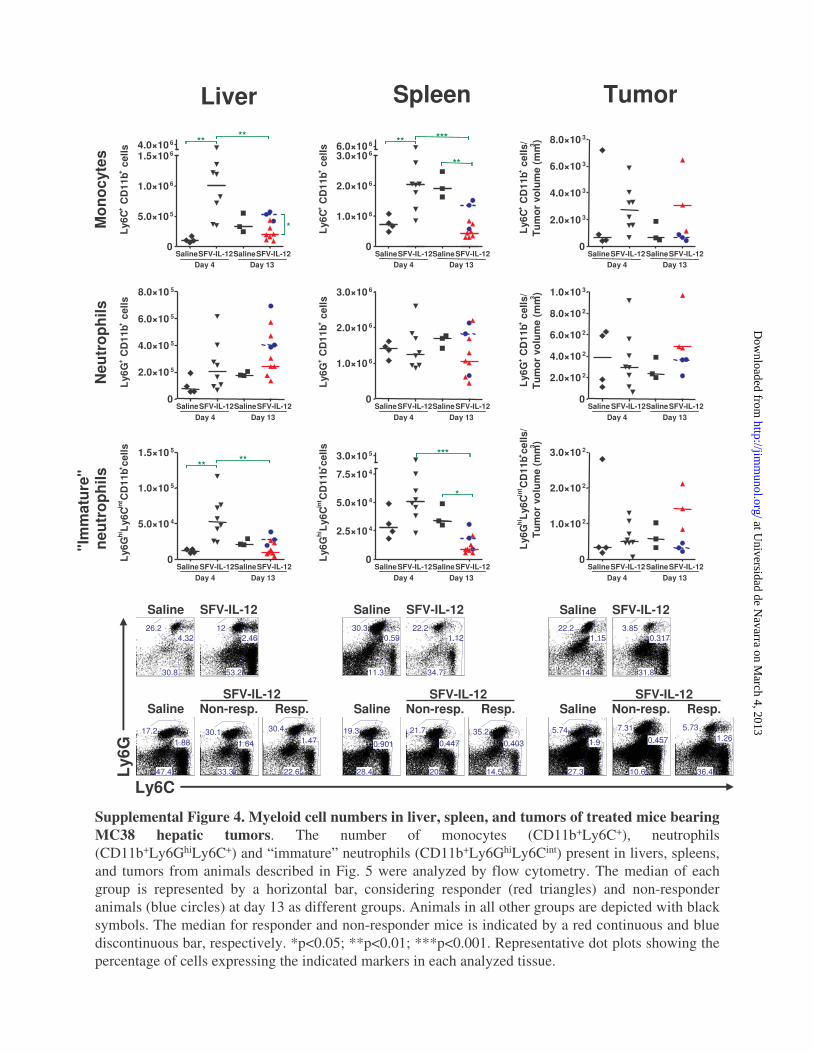
outcome of the treatment, we also analyzed changes in total pop-ulations of CD4, CD8, T regulatory cells (Tregs), NK, and NKT cellsin the aforementioned tissues (Supplemental Fig. 3). No significantchanges were observed in the numbers of total CD4 cells, CD8cells, and Tregs present in any of the analyzed tissues, althoughthe number of Tregs seemed to increase at day 13, especially insidetumors of SFV–IL-12 responder animals. This could be due to thepresence of an antitumor immune response that begins to be sup-pressed. With regard to NK and NKT cells, their numbers increasedin liver and decreased in spleen at day 4 after SFV–IL-12 treatment(comparing SFV–IL-12 versus saline), suggesting trafficking ofthese cells from spleen to the liver. Although these changes weremaintained at day 13 in spleen, NK cell numbers in liver hadreturned to control levels at this time point.Recently, myeloid-derived suppressor cells were shown to be
crucial in controlling tumor microenvironment by suppressing hostimmune responses (27, 28). To study the possible role that theyplayed in our treatment model, we analyzed their presence in liver,spleen, and tumor infiltrates. We observed a significant increase inmonocytes (defined as CD11b+Ly6C+ cells) and of a population of“immature” neutrophils (defined as CD11b+Ly6GhiLy6Cint cells)both in liver and spleens of vector-treated mice at day 4. However,these populations had decreased by day 13, especially in re-sponder mice (Supplemental Fig. 4). An increase in monocyteswas also observed at day 4 in most tumors treated with SFV–IL-12. To address the possible contribution of these populations toSFV–IL-12 treatment success, we depleted mice of monocytes andneutrophils or only neutrophils by delivering anti-Gr1 or anti-Ly6G Abs, respectively, and we examined treatment efficacy. Inboth cases, no significant effect on treatment outcome was ob-served after the depletions, suggesting that these cells do not playa major role in the antitumor responses (data not shown).
SFV–IL-12 responding and nonresponding mice show differentimmunological profiles before treatment
The differences observed in the immunological profile betweenresponder and nonresponder mice could be the result of the an-titumor response developed in each mouse after SFV–IL-12treatment. Alternatively, animals could have different immuno-logical profiles that determine the outcome of treatment. To clarifythis point, we analyzed several immune parameters in micebearing liver MC38-luc tumors before treating them with anintratumoral dose of 5 3 107 vp of SFV–IL-12. PBMCs wereobtained at day 21, and the number of Tregs, myeloid-derivedsuppressor cells (MDSCs), tumor-specific CD8 T cells, and totaland tumor-specific CD8 T cells expressing PD1 or IL-12R(CD212) was analyzed. Animals were sacrificed at day 13 anddivided into responder and nonresponders according to tumor size(Supplemental Fig. 2C). Responder animals had a significantlyhigher number of tumor-specific CD8 T cells before treatment
(Fig. 6A). In addition, nonresponder mice showed a higher per-centage of monocytic MDSCs (Ly6C+ CD11b+) compared withresponder mice (Fig. 6B). Both differences suggest that responderanimals could have a predisposition to respond to SFV–IL-12. Nosignificant differences were observed for any of the other analyzedmarkers between responders and nonresponders (data not shown).Differences in tumor-specific CD8 cells or MDSCs observed be-tween responders and nonresponders were not due to a differencein tumor size at the time of treatment, as shown by the lack ofsignificance obtained with a correlation analysis used to comparetumor size and number of tumor-specific CD8 T cells at day 21
FIGURE 6. Responder mice show a distinctive immunological profile
before treatment. Mice bearing MC38 liver tumors were bled 1 d before
being treated with a single intratumoral dose of 5 3 107 vp of SFV–IL-12
or an equivalent volume of saline. The percentage of tumor-specific CD8
T cells (A) and monocytic myeloid-derived suppressor cells (Ly6C+
CD11b+) (B) in the indicated groups was determined by flow cytometry.
Tumor size was measured in all animals at day 13, which allowed their
classification as responders and nonresponders (see Supplemental Fig. 2C).
Representative dot plots are shown above the graphs; percentages of tu-
mor-specific CD8 T cells (A) or Ly6C+ cells gated on CD11b cells (B).
*p , 0.05. n.s., Not significant.
The Journal of Immunology 2999
at Universidad de N
avarra on March 4, 2013
http://jimm
unol.org/D
ownloaded from
(p = 0.59; Spearman correlation coefficient = 20.14) or to comparetumor size and percentage of monocytic MDSCs at the same timepoint (p = 0.34; Spearman correlation coefficient = +0.25).
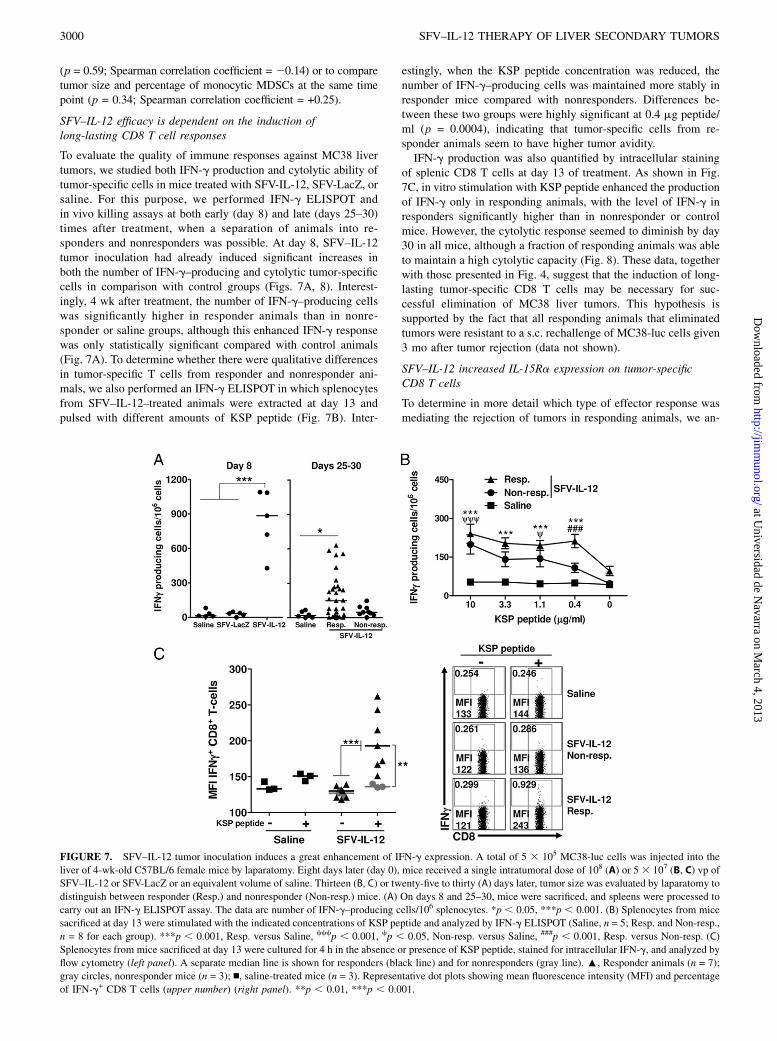
SFV–IL-12 efficacy is dependent on the induction oflong-lasting CD8 T cell responses
To evaluate the quality of immune responses against MC38 livertumors, we studied both IFN-g production and cytolytic ability oftumor-specific cells in mice treated with SFV-IL-12, SFV-LacZ, orsaline. For this purpose, we performed IFN-g ELISPOT andin vivo killing assays at both early (day 8) and late (days 25–30)times after treatment, when a separation of animals into re-sponders and nonresponders was possible. At day 8, SFV–IL-12tumor inoculation had already induced significant increases inboth the number of IFN-g–producing and cytolytic tumor-specificcells in comparison with control groups (Figs. 7A, 8). Interest-ingly, 4 wk after treatment, the number of IFN-g–producing cellswas significantly higher in responder animals than in nonre-sponder or saline groups, although this enhanced IFN-g responsewas only statistically significant compared with control animals(Fig. 7A). To determine whether there were qualitative differencesin tumor-specific T cells from responder and nonresponder ani-mals, we also performed an IFN-g ELISPOT in which splenocytesfrom SFV–IL-12–treated animals were extracted at day 13 andpulsed with different amounts of KSP peptide (Fig. 7B). Inter-
estingly, when the KSP peptide concentration was reduced, thenumber of IFN-g–producing cells was maintained more stably inresponder mice compared with nonresponders. Differences be-tween these two groups were highly significant at 0.4 mg peptide/ml (p = 0.0004), indicating that tumor-specific cells from re-sponder animals seem to have higher tumor avidity.IFN-g production was also quantified by intracellular staining
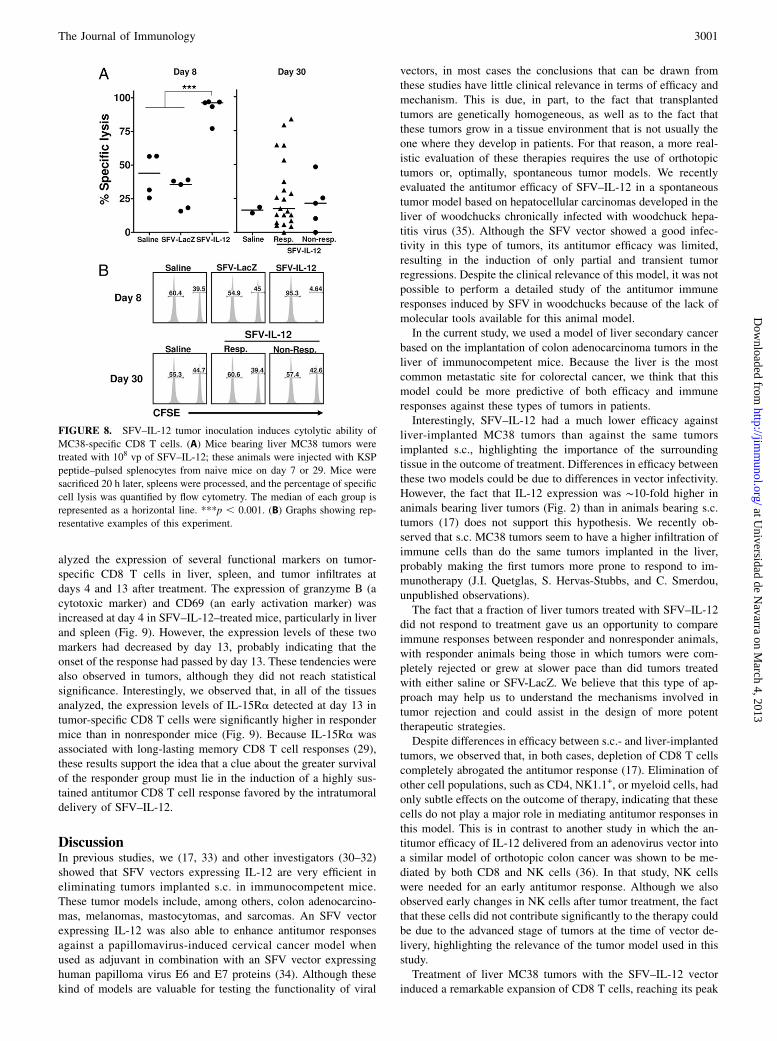
of splenic CD8 T cells at day 13 of treatment. As shown in Fig.7C, in vitro stimulation with KSP peptide enhanced the productionof IFN-g only in responding animals, with the level of IFN-g inresponders significantly higher than in nonresponder or controlmice. However, the cytolytic response seemed to diminish by day30 in all mice, although a fraction of responding animals was ableto maintain a high cytolytic capacity (Fig. 8). These data, togetherwith those presented in Fig. 4, suggest that the induction of long-lasting tumor-specific CD8 T cells may be necessary for suc-cessful elimination of MC38 liver tumors. This hypothesis issupported by the fact that all responding animals that eliminatedtumors were resistant to a s.c. rechallenge of MC38-luc cells given3 mo after tumor rejection (data not shown).
SFV–IL-12 increased IL-15Ra expression on tumor-specificCD8 T cells
To determine in more detail which type of effector response wasmediating the rejection of tumors in responding animals, we an-
FIGURE 7. SFV–IL-12 tumor inoculation induces a great enhancement of IFN-g expression. A total of 5 3 105 MC38-luc cells was injected into the
liver of 4-wk-old C57BL/6 female mice by laparatomy. Eight days later (day 0), mice received a single intratumoral dose of 108 (A) or 5 3 107 (B, C) vp of
SFV–IL-12 or SFV-LacZ or an equivalent volume of saline. Thirteen (B, C) or twenty-five to thirty (A) days later, tumor size was evaluated by laparatomy to
distinguish between responder (Resp.) and nonresponder (Non-resp.) mice. (A) On days 8 and 25–30, mice were sacrificed, and spleens were processed to
carry out an IFN-g ELISPOT assay. The data are number of IFN-g–producing cells/106 splenocytes. *p , 0.05, ***p , 0.001. (B) Splenocytes from mice
sacrificed at day 13 were stimulated with the indicated concentrations of KSP peptide and analyzed by IFN-g ELISPOT (Saline, n = 5; Resp. and Non-resp.,
n = 8 for each group). ***p , 0.001, Resp. versus Saline, cccp , 0.001, cp , 0.05, Non-resp. versus Saline, ###p , 0.001, Resp. versus Non-resp. (C)
Splenocytes from mice sacrificed at day 13 were cultured for 4 h in the absence or presence of KSP peptide, stained for intracellular IFN-g, and analyzed by
flow cytometry (left panel). A separate median line is shown for responders (black line) and for nonresponders (gray line). :, Responder animals (n = 7);
gray circles, nonresponder mice (n = 3); n, saline-treated mice (n = 3). Representative dot plots showing mean fluorescence intensity (MFI) and percentage
of IFN-g+ CD8 T cells (upper number) (right panel). **p , 0.01, ***p , 0.001.
3000 SFV–IL-12 THERAPY OF LIVER SECONDARY TUMORS
at Universidad de N
avarra on March 4, 2013
http://jimm
unol.org/D
ownloaded from
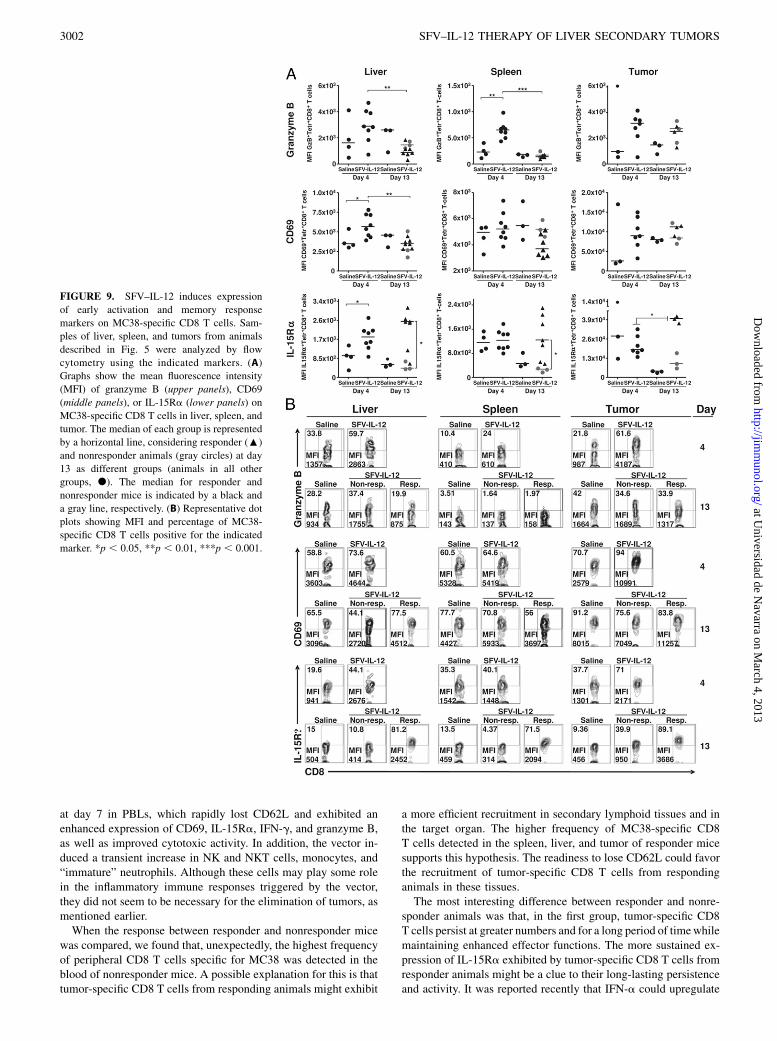
alyzed the expression of several functional markers on tumor-specific CD8 T cells in liver, spleen, and tumor infiltrates atdays 4 and 13 after treatment. The expression of granzyme B (acytotoxic marker) and CD69 (an early activation marker) wasincreased at day 4 in SFV–IL-12–treated mice, particularly in liverand spleen (Fig. 9). However, the expression levels of these twomarkers had decreased by day 13, probably indicating that theonset of the response had passed by day 13. These tendencies werealso observed in tumors, although they did not reach statisticalsignificance. Interestingly, we observed that, in all of the tissuesanalyzed, the expression levels of IL-15Ra detected at day 13 intumor-specific CD8 T cells were significantly higher in respondermice than in nonresponder mice (Fig. 9). Because IL-15Ra wasassociated with long-lasting memory CD8 T cell responses (29),these results support the idea that a clue about the greater survivalof the responder group must lie in the induction of a highly sus-tained antitumor CD8 T cell response favored by the intratumoraldelivery of SFV–IL-12.
DiscussionIn previous studies, we (17, 33) and other investigators (30–32)showed that SFV vectors expressing IL-12 are very efficient ineliminating tumors implanted s.c. in immunocompetent mice.These tumor models include, among others, colon adenocarcino-mas, melanomas, mastocytomas, and sarcomas. An SFV vectorexpressing IL-12 was also able to enhance antitumor responsesagainst a papillomavirus-induced cervical cancer model whenused as adjuvant in combination with an SFV vector expressinghuman papilloma virus E6 and E7 proteins (34). Although thesekind of models are valuable for testing the functionality of viral
vectors, in most cases the conclusions that can be drawn fromthese studies have little clinical relevance in terms of efficacy andmechanism. This is due, in part, to the fact that transplantedtumors are genetically homogeneous, as well as to the fact thatthese tumors grow in a tissue environment that is not usually theone where they develop in patients. For that reason, a more real-istic evaluation of these therapies requires the use of orthotopictumors or, optimally, spontaneous tumor models. We recentlyevaluated the antitumor efficacy of SFV–IL-12 in a spontaneoustumor model based on hepatocellular carcinomas developed in theliver of woodchucks chronically infected with woodchuck hepa-titis virus (35). Although the SFV vector showed a good infec-tivity in this type of tumors, its antitumor efficacy was limited,resulting in the induction of only partial and transient tumorregressions. Despite the clinical relevance of this model, it was notpossible to perform a detailed study of the antitumor immuneresponses induced by SFV in woodchucks because of the lack ofmolecular tools available for this animal model.In the current study, we used a model of liver secondary cancer
based on the implantation of colon adenocarcinoma tumors in theliver of immunocompetent mice. Because the liver is the mostcommon metastatic site for colorectal cancer, we think that thismodel could be more predictive of both efficacy and immuneresponses against these types of tumors in patients.Interestingly, SFV–IL-12 had a much lower efficacy against
liver-implanted MC38 tumors than against the same tumorsimplanted s.c., highlighting the importance of the surroundingtissue in the outcome of treatment. Differences in efficacy betweenthese two models could be due to differences in vector infectivity.However, the fact that IL-12 expression was ∼10-fold higher inanimals bearing liver tumors (Fig. 2) than in animals bearing s.c.tumors (17) does not support this hypothesis. We recently ob-served that s.c. MC38 tumors seem to have a higher infiltration ofimmune cells than do the same tumors implanted in the liver,probably making the first tumors more prone to respond to im-munotherapy (J.I. Quetglas, S. Hervas-Stubbs, and C. Smerdou,unpublished observations).The fact that a fraction of liver tumors treated with SFV–IL-12
did not respond to treatment gave us an opportunity to compareimmune responses between responder and nonresponder animals,with responder animals being those in which tumors were com-pletely rejected or grew at slower pace than did tumors treatedwith either saline or SFV-LacZ. We believe that this type of ap-proach may help us to understand the mechanisms involved intumor rejection and could assist in the design of more potenttherapeutic strategies.Despite differences in efficacy between s.c.- and liver-implanted
tumors, we observed that, in both cases, depletion of CD8 T cellscompletely abrogated the antitumor response (17). Elimination ofother cell populations, such as CD4, NK1.1+, or myeloid cells, hadonly subtle effects on the outcome of therapy, indicating that thesecells do not play a major role in mediating antitumor responses inthis model. This is in contrast to another study in which the an-titumor efficacy of IL-12 delivered from an adenovirus vector intoa similar model of orthotopic colon cancer was shown to be me-diated by both CD8 and NK cells (36). In that study, NK cellswere needed for an early antitumor response. Although we alsoobserved early changes in NK cells after tumor treatment, the factthat these cells did not contribute significantly to the therapy couldbe due to the advanced stage of tumors at the time of vector de-livery, highlighting the relevance of the tumor model used in thisstudy.Treatment of liver MC38 tumors with the SFV–IL-12 vector
induced a remarkable expansion of CD8 T cells, reaching its peak
FIGURE 8. SFV–IL-12 tumor inoculation induces cytolytic ability of
MC38-specific CD8 T cells. (A) Mice bearing liver MC38 tumors were
treated with 108 vp of SFV–IL-12; these animals were injected with KSP
peptide–pulsed splenocytes from naive mice on day 7 or 29. Mice were
sacrificed 20 h later, spleens were processed, and the percentage of specific
cell lysis was quantified by flow cytometry. The median of each group is
represented as a horizontal line. ***p , 0.001. (B) Graphs showing rep-
resentative examples of this experiment.
The Journal of Immunology 3001
at Universidad de N
avarra on March 4, 2013
http://jimm
unol.org/D
ownloaded from
at day 7 in PBLs, which rapidly lost CD62L and exhibited anenhanced expression of CD69, IL-15Ra, IFN-g, and granzyme B,as well as improved cytotoxic activity. In addition, the vector in-duced a transient increase in NK and NKT cells, monocytes, and“immature” neutrophils. Although these cells may play some rolein the inflammatory immune responses triggered by the vector,they did not seem to be necessary for the elimination of tumors, asmentioned earlier.When the response between responder and nonresponder mice
was compared, we found that, unexpectedly, the highest frequencyof peripheral CD8 T cells specific for MC38 was detected in theblood of nonresponder mice. A possible explanation for this is thattumor-specific CD8 T cells from responding animals might exhibit
a more efficient recruitment in secondary lymphoid tissues and inthe target organ. The higher frequency of MC38-specific CD8T cells detected in the spleen, liver, and tumor of responder micesupports this hypothesis. The readiness to lose CD62L could favorthe recruitment of tumor-specific CD8 T cells from respondinganimals in these tissues.The most interesting difference between responder and nonre-
sponder animals was that, in the first group, tumor-specific CD8T cells persist at greater numbers and for a long period of timewhilemaintaining enhanced effector functions. The more sustained ex-pression of IL-15Ra exhibited by tumor-specific CD8 T cells fromresponder animals might be a clue to their long-lasting persistenceand activity. It was reported recently that IFN-a could upregulate
FIGURE 9. SFV–IL-12 induces expression
of early activation and memory response
markers on MC38-specific CD8 T cells. Sam-
ples of liver, spleen, and tumors from animals
described in Fig. 5 were analyzed by flow
cytometry using the indicated markers. (A)
Graphs show the mean fluorescence intensity
(MFI) of granzyme B (upper panels), CD69
(middle panels), or IL-15Ra (lower panels) on
MC38-specific CD8 T cells in liver, spleen, and
tumor. The median of each group is represented
by a horizontal line, considering responder (:)
and nonresponder animals (gray circles) at day
13 as different groups (animals in all other
groups, d). The median for responder and
nonresponder mice is indicated by a black and
a gray line, respectively. (B) Representative dot
plots showing MFI and percentage of MC38-
specific CD8 T cells positive for the indicated
marker. *p , 0.05, **p , 0.01, ***p , 0.001.
3002 SFV–IL-12 THERAPY OF LIVER SECONDARY TUMORS
at Universidad de N
avarra on March 4, 2013
http://jimm
unol.org/D
ownloaded from
the expression of IL-15Ra in T cells (37). Because SFV replica-tion can induce type I IFN responses (38), production of IFN-a byinfected cells could be mediating this effect. In agreement withthis, we observed a similar increase in IL-15Ra in T cells frommice treated intratumorally with SFV-LacZ (data not shown). Inaddition, IL-15Ra can be induced on CD8 T cells by the TLR3agonist polyinosinic-polycytidylic acid, which is an effective ad-juvant in enhancing primary CD8 T cell responses (29, 39). It ispossible that dsRNA produced during SFV replication could act ina similar way.A key question in this study was whether differences in immune
responses between responders and nonresponders were due to theoutcome of treatment or, conversely, whether immunological dif-ferences between animals could determine the outcome of treatment.Our data suggest that mice bearing tumors have different immu-nological profiles that seem to correlatewith the efficacy of SFV–IL-12 therapy, indicating that some individuals could have a predis-position to eliminate tumors if immunotherapy is provided.In general, our study showed that the development of sustained
memory immune responses is needed for a high antitumor efficacy.These responses could be potentiated by combining SFV–IL-12with cytokines able to promote memory immune responses, suchas IL-15 (40), or by enhancing the expression of IL-15Ra(i.e., coadministration of type I IFN inducers).Efficient therapies against cancer will most likely benefit from
the combination of different agents that can potentiate immuneresponses. As an example, we recently showed that a combinationof SFV–IL-12 and a CD137 agonistic Ab can enhance antitumorimmune responses against s.c. colon tumors in mice (33). Incontrast, oncolytic viruses able to kill tumor cells in an immu-nogenic way showed very promising results in recent clinical trials(41, 42). Based on both approaches, we believe that the combi-nation of an SFV vector able to induce tumor cell death witha potent immunostimulatory cytokine, such as IL-12, and addi-tional cytokines/factors able to enhance effector or memory im-mune responses or to inhibit suppressor responses could havea significant impact on cancer therapy.
AcknowledgmentsWe thank Puri Fortes and other members of our laboratory for scientific
discussions. We also give special thanks to Nerea Razquin for generosity
and technical assistance and to Ruben Hernandez-Alcoceba for generous
support.
DisclosuresThe authors have no financial conflicts of interest.
References1. Pawlik, T. M., and M. A. Choti. 2007. Surgical therapy for colorectal metastases
to the liver. J. Gastrointest. Surg. 11: 1057–1077.2. Wang, C. C., and J. Li. 2012. An update on chemotherapy of colorectal liver
metastases. World J. Gastroenterol. 18: 25–33.3. Nordlinger, B., E. Van Cutsem, T. Gruenberger, B. Glimelius, G. Poston,
P. Rougier, A. Sobrero, and M. Ychou; European Colorectal Metastases Treat-ment Group; Sixth International Colorectal Liver Metastases Workshop. 2009.Combination of surgery and chemotherapy and the role of targeted agents in thetreatment of patients with colorectal liver metastases: recommendations from anexpert panel. Ann. Oncol. 20: 985–992.
4. Weiss, J. M., J. J. Subleski, J. M. Wigginton, and R. H. Wiltrout. 2007. Im-munotherapy of cancer by IL-12-based cytokine combinations. Expert Opin.Biol. Ther. 7: 1705–1721.
5. Trinchieri, G. 2003. Interleukin-12 and the regulation of innate resistance andadaptive immunity. Nat. Rev. Immunol. 3: 133–146.
6. Voest, E. E., B. M. Kenyon, M. S. O’Reilly, G. Truitt, R. J. D’Amato, andJ. Folkman. 1995. Inhibition of angiogenesis in vivo by interleukin 12. J. Natl.Cancer Inst. 87: 581–586.
7. Berraondo, P., J. Prieto, and G. Gonzalez-Aseguinolaza. 2009. Advances ininterleukin-12 gene therapy for acquired liver diseases. Curr. Gene Ther. 9: 62–71.
8. Barajas, M., G. Mazzolini, G. Genove, R. Bilbao, I. Narvaiza, V. Schmitz,B. Sangro, I. Melero, C. Qian, and J. Prieto. 2001. Gene therapy of orthotopichepatocellular carcinoma in rats using adenovirus coding for interleukin 12.Hepatology 33: 52–61.
9. Quetglas, J. I., M. Ruiz-Guillen, A. Aranda, E. Casales, J. Bezunartea, andC. Smerdou. 2010. Alphavirus vectors for cancer therapy. Virus Res. 153: 179–196.
10. Tahara, H., L. Zitvogel, W. J. Storkus, H. J. Zeh, III, T. G. McKinney,R. D. Schreiber, U. Gubler, P. D. Robbins, and M. T. Lotze. 1995. Effectiveeradication of established murine tumors with IL-12 gene therapy using a poly-cistronic retroviral vector. J. Immunol. 154: 6466–6474.
11. Sangro, B., G. Mazzolini, J. Ruiz, M. Herraiz, J. Quiroga, I. Herrero, A. Benito,J. Larrache, J. Pueyo, J. C. Subtil, et al. 2004. Phase I trial of intratumoral in-jection of an adenovirus encoding interleukin-12 for advanced digestive tumors.J. Clin. Oncol. 22: 1389–1397.
12. Penuelas, I., G. Mazzolini, J. F. Boan, B. Sangro, J. Martı-Climent, M. Ruiz,J. Ruiz, N. Satyamurthy, C. Qian, J. R. Barrio, et al. 2005. Positron emissiontomography imaging of adenoviral-mediated transgene expression in liver cancerpatients. Gastroenterology 128: 1787–1795.
13. Kung, A. L. 2007. Practices and pitfalls of mouse cancer models in drug dis-covery. Adv. Cancer Res. 96: 191–212.
14. Talmadge, J. E., R. K. Singh, I. J. Fidler, and A. Raz. 2007. Murine models toevaluate novel and conventional therapeutic strategies for cancer. Am. J. Pathol.170: 793–804.
15. Strauss, J. H., and E. G. Strauss. 1994. The alphaviruses: gene expression,replication, and evolution. Microbiol. Rev. 58: 491–562.
16. Liljestrom, P., and H. Garoff. 1991. A new generation of animal cell expressionvectors based on the Semliki Forest virus replicon. Biotechnology (N. Y.) 9:1356–1361.
17. Rodriguez-Madoz, J. R., J. Prieto, and C. Smerdou. 2005. Semliki forest virusvectors engineered to express higher IL-12 levels induce efficient elimination ofmurine colon adenocarcinomas. Mol. Ther. 12: 153–163.
18. Ying, H., T. Z. Zaks, R. F. Wang, K. R. Irvine, U. S. Kammula, F. M. Marincola,W. W. Leitner, and N. P. Restifo. 1999. Cancer therapy using a self-replicatingRNA vaccine. Nat. Med. 5: 823–827.
19. Zabala, M., P. Alzuguren, C. Benavides, J. Crettaz, G. Gonzalez-Aseguinolaza,C. Ortiz de Solorzano, M. Gonzalez-Aparicio, M. G. Kramer, J. Prieto, andR. Hernandez-Alcoceba. 2009. Evaluation of bioluminescent imaging for non-invasive monitoring of colorectal cancer progression in the liver and its responseto immunogene therapy. Mol. Cancer 8: 2.
20. Quetglas, J. I., J. Fioravanti, N. Ardaiz, J. Medina-Echeverz, I. Baraibar,J. Prieto, C. Smerdou, and P. Berraondo. 2012. A Semliki forest virus vectorengineered to express IFNa induces efficient elimination of established tumors.Gene Ther. 19: 271–278.
21. Smerdou, C., and P. Liljestrom. 1999. Two-helper RNA system for production ofrecombinant Semliki forest virus particles. J. Virol. 73: 1092–1098.
22. Fleeton, M. N., B. J. Sheahan, E. A. Gould, G. J. Atkins, and P. Liljestrom. 1999.Recombinant Semliki Forest virus particles encoding the prME or NS1 proteins oflouping ill virus protect mice from lethal challenge. J. Gen. Virol. 80: 1189–1198.
23. Salminen, A., J. M. Wahlberg, M. Lobigs, P. Liljestrom, and H. Garoff. 1992.Membrane fusion process of Semliki Forest virus. II: Cleavage-dependent re-organization of the spike protein complex controls virus entry. J. Cell Biol. 116:349–357.
24. Garzon, M. R., P. Berraondo, J. Crettaz, L. Ochoa, M. Vera, J. J. Lasarte,A. Vales, N. Van Rooijen, J. Ruiz, J. Prieto, et al. 2005. Induction of gp120-specific protective immune responses by genetic vaccination with linearpolyethylenimine-plasmid complex. Vaccine 23: 1384–1392.
25. Chiodoni, C., P. Paglia, A. Stoppacciaro, M. Rodolfo, M. Parenza, andM. P. Colombo. 1999. Dendritic cells infiltrating tumors cotransduced withgranulocyte/macrophage colony-stimulating factor (GM-CSF) and CD40 ligandgenes take up and present endogenous tumor-associated antigens, and primenaive mice for a cytotoxic T lymphocyte response. J. Exp. Med. 190: 125–133.
26. Obar, J. J., and L. Lefrancois. 2010. Memory CD8+ T cell differentiation. Ann.N. Y. Acad. Sci. 1183: 251–266.
27. Gabrilovich, D. I., S. Ostrand-Rosenberg, and V. Bronte. 2012. Coordinatedregulation of myeloid cells by tumours. Nat. Rev. Immunol. 12: 253–268.
28. Medina-Echeverz, J., J. Fioravanti, M. Zabala, N. Ardaiz, J. Prieto, andP. Berraondo. 2011. Successful colon cancer eradication after chemo-immunotherapy is associated with profound phenotypic change of intratumoralmyeloid cells. J. Immunol. 186: 807–815.
29. Lodolce, J. P., P. R. Burkett, D. L. Boone, M. Chien, and A. Ma. 2001. T cell-independent interleukin 15Ralpha signals are required for bystander prolifera-tion. J. Exp. Med. 194: 1187–1194.
30. Asselin-Paturel, C., N. Lassau, J. M. Guinebretiere, J. Zhang, F. Gay, F. Bex,S. Hallez, J. Leclere, P. Peronneau, F. Mami-Chouaib, and S. Chouaib. 1999.Transfer of the murine interleukin-12 gene in vivo by a Semliki Forest virusvector induces B16 tumor regression through inhibition of tumor blood vesselformation monitored by Doppler ultrasonography. Gene Ther. 6: 606–615.
31. Chikkanna-Gowda, C. P., B. J. Sheahan, M. N. Fleeton, and G. J. Atkins. 2005.Regression of mouse tumours and inhibition of metastases following adminis-tration of a Semliki Forest virus vector with enhanced expression of IL-12. GeneTher. 12: 1253–1263.
32. Colmenero, P., M. Chen, E. Castanos-Velez, P. Liljestrom, and M. Jondal. 2002.Immunotherapy with recombinant SFV-replicons expressing the P815A tumorantigen or IL-12 induces tumor regression. Int. J. Cancer 98: 554–560.
33. Quetglas, J. I., J. Dubrot, J. Bezunartea, M. F. Sanmamed, S. Hervas-Stubbs,C. Smerdou, and I. Melero. 2012. Immunotherapeutic synergy between anti-
The Journal of Immunology 3003
at Universidad de N
avarra on March 4, 2013
http://jimm
unol.org/D
ownloaded from
CD137 mAb and intratumoral administration of a cytopathic Semliki Forestvirus encoding IL-12. Mol. Ther. 20: 1664–1675.
34. Riezebos-Brilman, A., J. Regts, M. Chen, J. Wilschut, and T. Daemen. 2009.Augmentation of alphavirus vector-induced human papilloma virus-specificimmune and anti-tumour responses by co-expression of interleukin-12. Vac-cine 27: 701–707.
35. Rodriguez-Madoz, J. R., K. H. Liu, J. I. Quetglas, M. Ruiz-Guillen, I. Otano,J. Crettaz, S. D. Butler, C. A. Bellezza, N. L. Dykes, B. C. Tennant, et al. 2009.Semliki forest virus expressing interleukin-12 induces antiviral and antitumoralresponses in woodchucks with chronic viral hepatitis and hepatocellular carci-noma. J. Virol. 83: 12266–12278.
36. Pham-Nguyen, K. B., W. Yang, R. Saxena, S. N. Thung, S. L. Woo, andS. H. Chen. 1999. Role of NK and T cells in IL-12-induced anti-tumor responseagainst hepatic colon carcinoma. Int. J. Cancer 81: 813–819.
37. Hansen, M. L., A. Woetmann, T. Krejsgaard, K. L. Kopp, R. Søkilde, T. Litman,P. T. Straten, C. Geisler, M. A. Wasik, N. Odum, and K. W. Eriksen. 2011. IFN-aprimes T- and NK-cells for IL-15-mediated signaling and cytotoxicity. Mol.Immunol. 48: 2087–2093.
38. Hidmark, A. S., E. K. Nordstrom, P. Dosenovic, M. N. Forsell, P. Liljestrom, andG. B. Karlsson Hedestam. 2006. Humoral responses against coimmunized pro-tein antigen but not against alphavirus-encoded antigens require alpha/beta in-
terferon signaling. J. Virol. 80: 7100–7110.39. Burkett, P. R., R. Koka, M. Chien, S. Chai, F. Chan, A. Ma, and D. L. Boone.
2003. IL-15R alpha expression on CD8+ T cells is dispensable for T cellmemory. Proc. Natl. Acad. Sci. USA 100: 4724–4729.
40. Schluns, K. S., and L. Lefrancois. 2003. Cytokine control of memory T-celldevelopment and survival. Nat. Rev. Immunol. 3: 269–279.
41. Breitbach, C. J., J. Burke, D. Jonker, J. Stephenson, A. R. Haas, L. Q. Chow,
J. Nieva, T. H. Hwang, A. Moon, R. Patt, et al. 2011. Intravenous delivery ofa multi-mechanistic cancer-targeted oncolytic poxvirus in humans. Nature 477:99–102.
42. Hwang, T. H., A. Moon, J. Burke, A. Ribas, J. Stephenson, C. J. Breitbach,M. Daneshmand, N. De Silva, K. Parato, J. S. Diallo, et al. 2011. A mechanistic
proof-of-concept clinical trial with JX-594, a targeted multi-mechanistic onco-lytic poxvirus, in patients with metastatic melanoma. Mol. Ther. 19: 1913–1922.
3004 SFV–IL-12 THERAPY OF LIVER SECONDARY TUMORS
at Universidad de N
avarra on March 4, 2013
http://jimm
unol.org/D
ownloaded from
AST
Saline SFV-LacZ Resp. Non-resp.0
200
400
600
800
SFV-IL-12
Un
its/
L
ALT
Saline SFV-LacZ Resp. Non-resp.0
50
100
150
200Day 0Day 1
SFV-IL-12
Day 3Day 5Day 10
Un
its/
L
Supplemental Figure 1. Evaluation of liver toxicity associated to SFV-IL-12 treatment. Serum samples from animals treated as described in Fig. 1 were collected at days 0, 1, 3, 5, and 10 after treatment and aspartate aminotransferase (AST, left graph) and alanine transaminase (ALT, right graph) levels were determined with a Hitachi autoanalyzer (Roche, Switzerland). The results arerepresented as mean + SEM.
at U
nive
rsid
ad d
e N
avar
ra o
n M
arch
4, 2
013
http
://jim
mun
ol.o
rg/
Dow
nloa
ded
from
Supplemental Figure 2. (A) Comparison of SFV-IL-12 antitumor effect on subcutaneous and intrahepatic MC38 nodules. 108 vp of SFV-IL-12 were injected intratumorally on MC38 nodules implanted subcutaneously (n=12) or intrahepatically (n=31). Each dot represents the average tumor diameter for each mouse before (day 0) or after (day 24) treatment. The mean diameter of each group is represented by a horizontal bar. The number and percentage of complete tumor rejections relative to the total number of animals in each group is indicated under the graph. *p<0.05. (B and C) Treatment efficacy of SFV-IL-12 in mice sacrificed at day 13 for analysis of immune responses in different organs (B) or for analysis of immune status before treatment (C). 5×10⁵ MC38-luc cells were injected into the liver of 4-week old C57BL/6 female mice by laparatomy. Eight days later (day 0), mice received a single intratumoral dose of 5×10⁷ vp of SFV-IL-12, or an equivalent volume of saline. At day 13 after treatment, tumor size was evaluated by laparatomy in order to distinguish between responder (Resp.) and non-responder (Non-resp.) mice. Each dot represents the mean tumor diameter for each individual mouse before (day 0) or after (day 13) treatment. The mean of each group is represented as a horizontal bar. The discontinuous line indicates the separation between resp. and non-resp. animals. The number and percentage of cured, resp. and non-resp. animals relative to the total number of animals in each group is indicated under the graph.
A
B C
at Universidad de N
avarra on March 4, 2013
http://jimm
unol.org/D
ownloaded from
0
2.0×10⁵
4.0×10⁵
6.0×10⁵
8.0×10⁵
Day 4 Day 13Saline SFV-IL-12 Saline SFV-IL-12
CD
3+ C
D4
+T
cel
ls
0
5.0×10⁶
1.0×10⁷
1.5×10⁷
Saline SFV-IL-12 Saline SFV-IL-12
Day 4 Day 13
CD
3+ C
D4
+T
cel
ls
0
1.0×10³
2.0×10³
3.0×10³
4.0×1037.8×103
Saline SFV-IL-12 Saline SFV-IL-12
Day 4 Day 13
CD
3+ C
D4
+T
cel
ls/
Tu
mo
r vo
lum
e (m
m3 )
0
2.0×10⁵
4.0×10⁵
6.0×10⁵
Saline SFV-IL-12 Saline SFV-IL-12
Day 4 Day 13
CD
3+ CD
8+T
cel
ls
0
2.0×10⁶
4.0×10⁶
6.0×10⁶
8.0×10⁶
Saline SFV-IL-12 Saline SFV-IL-12
Day 4 Day 13
CD
3+ C
D8
+T
cel
ls
0
1.0×10³
2.0×10³
3.0×10³
Saline SFV-IL-12 Saline SFV-IL-12
Day 4 Day 13
CD
3+ C
D8
+T
cel
ls/
Tu
mo
r vo
lum
e (m
m3 )
0
2.0×10⁵
4.0×10⁵
6.0×10⁵
Saline SFV-IL-12 Saline SFV-IL-12
***
Day 4 Day 13
CD
3- N
K1.
1+ce
lls
0
5.0×10⁵
1.0×10⁶
1.5×10⁶
2.0×10⁶
Saline SFV-IL-12 Saline SFV-IL-12
**
Day 4 Day 13
CD
3- N
K1.
1+ce
lls
0
1.0×10³
2.0×10³
3.0×10³
Saline SFV-IL-12 Saline SFV-IL-12
Day 4 Day 13
CD
3- N
K1.
1+
cells
/T
um
or
volu
me
(mm
3 )
Liver Spleen Tumor
CD
4C
D8
NK
0
5.0×10⁴
1.0×10⁵
1.5×10⁵
2.0×10⁵
2.5×10⁵
Saline SFV-IL-12 SalineSFV-IL-12
*
Day 4 Day 13
CD
3+ NK
1.1+
cells
0
5.0×10⁵
1.0×10⁶
1.5×10⁶
2.0×10⁶
Saline SFV-IL-12 Saline SFV-IL-12
**
Day 4 Day 13
CD
3+ NK
1.1+
cells
0
1.0×10⁴
2.0×10⁴
3.0×10⁴
4.0×10⁴
Saline SFV-IL-12 SalineSFV-IL-12
*
Day 4 Day 13
CD
3+ NK
1.1+
cells
/T
um
or
volu
me
(mm
3 )
0
1.0×10⁴
2.0×10⁴
3.0×10⁴
4.0×10⁴
5.0×10⁴
Saline SFV-IL-12 Saline SFV-IL-12
Day 4 Day 13
CD
4+C
D25
+ Fo
xP3
+T
cel
ls
0
5.0×10⁵
1.0×10⁶
1.5×10⁶
Saline SFV-IL-12 Saline SFV-IL-12
Day 4 Day 13
CD
4+C
D25
+ Fo
xP3
+T
cel
ls
0
5.0×101
1.0×10²
1.5×10²
2.0×1023.6×102
Saline SFV-IL-12 Saline SFV-IL-12
Day 4 Day 13
CD
4+C
D25
+ Fo
xP3
+T
cel
ls/
Tu
mo
r vo
lum
e (m
m3 )
NK
TT
reg
s
A
at Universidad de N
avarra on March 4, 2013
http://jimm
unol.org/D
ownloaded from
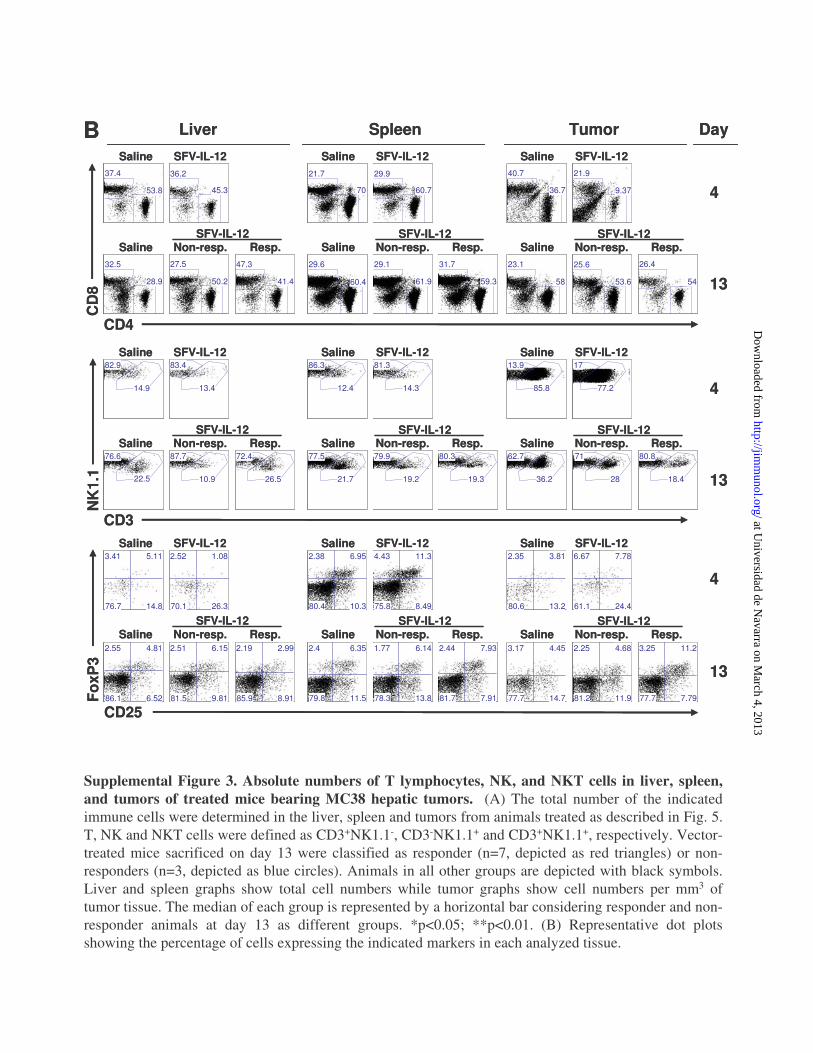
Supplemental Figure 3. Absolute numbers of T lymphocytes, NK, and NKT cells in liver, spleen, and tumors of treated mice bearing MC38 hepatic tumors. (A) The total number of the indicated immune cells were determined in the liver, spleen and tumors from animals treated as described in Fig. 5. T, NK and NKT cells were defined as CD3+NK1.1-, CD3-NK1.1+ and CD3+NK1.1+, respectively. Vector-treated mice sacrificed on day 13 were classified as responder (n=7, depicted as red triangles) or non-responders (n=3, depicted as blue circles). Animals in all other groups are depicted with black symbols. Liver and spleen graphs show total cell numbers while tumor graphs show cell numbers per mm3 of tumor tissue. The median of each group is represented by a horizontal bar considering responder and non-responder animals at day 13 as different groups. *p<0.05; **p<0.01. (B) Representative dot plots showing the percentage of cells expressing the indicated markers in each analyzed tissue.
Liver Spleen Tumor Day
4
13
4
13
4
13
BSaline SFV-IL-12
Saline Non-resp. Resp.SFV-IL-12
Saline SFV-IL-12
Saline Non-resp. Resp.SFV-IL-12
Saline SFV-IL-12
Saline Non-resp. Resp.SFV-IL-12
CD4
Saline SFV-IL-12
Saline Non-resp. Resp.SFV-IL-12
Saline SFV-IL-12
Saline Non-resp. Resp.SFV-IL-12
Saline SFV-IL-12
Saline Non-resp. Resp.SFV-IL-12
NK
1.1
CD3
Fo
xP3
CD25
Saline SFV-IL-12
Saline Non-resp. Resp.SFV-IL-12
Saline SFV-IL-12
Saline Non-resp. Resp.SFV-IL-12
Saline SFV-IL-12
Saline Non-resp. Resp.SFV-IL-12
CD
8
53.8
37.4
45.3
36.2
28.9
32.5
50.2
27.5
41.4
47.3
70
21.7
60.7
29.9
60.4
29.6
61.9
29.1
59.3
31.7
36.7
40.7
9.37
21.9
58
23.1
53.6
25.6
54
26.4
82.9
14.9
83.4
13.4
76.6
22.5
87.7
10.9
72.4
26.5
86.3
12.4
81.3
14.3
77.5
21.7
79.9
19.2
80.3
19.3
13.9
85.8
17
77.2
62.7
36.2
71
28
80.8
18.4
3.41 5.11
14.876.7
2.52 1.08
26.370.1
2.55 4.81
6.5286.1
2.51 6.15
9.8181.5
2.19 2.99
8.9185.9
2.38 6.95
10.380.4
4.43 11.3
8.4975.8
2.4 6.35
11.579.8
1.77 6.14
13.878.3
2.44 7.93
7.9181.7
2.35 3.81
13.280.6
6.67 7.78
24.461.1
3.17 4.45
14.777.7
2.25 4.68
11.981.2
3.25 11.2
7.7977.7
at Universidad de N
avarra on March 4, 2013
http://jimm
unol.org/D
ownloaded from
0
5.0×10 5
1.0×10 6
1.5×10 64.0×10 6
SalineSFV-IL-12SalineSFV-IL-12
*
** **
Day 4 Day 13
Ly6
C+
CD
11b+
cells
0
1.0×10 6
2.0×10 6
3.0×10 66.0×10 6
SalineSFV-IL-12SalineSFV-IL-12
**
**
***
Day 4 Day 13
Ly6
C+
CD
11b+
cells
0
2.0×10 3
4.0×10 3
6.0×10 3
8.0×10 3
SalineSFV-IL-12SalineSFV-IL-12Day 4 Day 13
Ly6
C+
CD
11b+
cells
/T
um
or
volu
me
(mm3
)
0
2.0×10 5
4.0×10 5
6.0×10 5
8.0×10 5
SalineSFV-IL-12SalineSFV-IL-12Day 4 Day 13
Ly6
G+
CD
11b+
cells
0
1.0×10 6
2.0×10 6
3.0×10 6
SalineSFV-IL-12SalineSFV-IL-12Day 4 Day 13
Ly6
G+
CD
11b+
cells
0
2.0×10 2
4.0×10 2
6.0×10 2
8.0×10 2
1.0×10 3
Saline SFV-IL-12SalineSFV-IL-12Day 4 Day 13
Ly6
G+
CD
11b+
cells
/T
um
or
volu
me
(mm3
)
0
5.0×10 4
1.0×10 5
1.5×10 5
SalineSFV-IL-12SalineSFV-IL-12
** **
Day 4 Day 13
Ly6
Gh
i Ly6
Cint C
D11
b+ce
lls
0
2.5×10 4
5.0×10 4
7.5×10 4
3.0×10 5
SalineSFV-IL-12SalineSFV-IL-12
*
***
Day 4 Day 13
Ly6
Gh
i Ly6
Cin
t CD
11b+
cells
0
1.0×10 2
2.0×10 2
3.0×10 2
Day 4 Day 13SalineSFV-IL-12SalineSFV-IL-12
Ly6
Gh
i Ly6
Cin
t CD
11b+
cells
/T
um
or
volu
me
(mm3 )
Mo
no
cyte
sN
eutr
op
hils
"Im
mat
ure
"n
eutr
op
hils
Liver Spleen Tumor
Supplemental Figure 4. Myeloid cell numbers in liver, spleen, and tumors of treated mice bearing MC38 hepatic tumors. The number of monocytes (CD11b+Ly6C+), neutrophils (CD11b+Ly6GhiLy6C+) and “immature” neutrophils (CD11b+Ly6GhiLy6Cint) present in livers, spleens, and tumors from animals described in Fig. 5 were analyzed by flow cytometry. The median of each group is represented by a horizontal bar, considering responder (red triangles) and non-responder animals (blue circles) at day 13 as different groups. Animals in all other groups are depicted with black symbols. The median for responder and non-responder mice is indicated by a red continuous and blue discontinuous bar, respectively. *p<0.05; **p<0.01; ***p<0.001. Representative dot plots showing the percentage of cells expressing the indicated markers in each analyzed tissue.
Ly6
G
Ly6C
30.4
1.47
22.6
122.46
53.2
26.24.32
30.8
17.21.88
47.4
30.11.64
33.3
Saline SFV-IL-12
Saline Non-resp. Resp.SFV-IL-12
30.30.59
11.3
22.21.12
34.7
19.3
0.901
28.4
21.7
0.447
20
35.20.403
14.5
Saline SFV-IL-12
Saline Non-resp. Resp.SFV-IL-12
22.21.15
14
3.850.317
31.8
5.74
1.9
27.3
7.31
0.457
10.6
5.731.26
36.4
Saline SFV-IL-12
Saline Non-resp. Resp.SFV-IL-12
at Universidad de N
avarra on March 4, 2013
http://jimm
unol.org/D
ownloaded from