Equilibrium in fiscal choices: Evidence from a budget game
14
Public Choice 78: 205-218, 1994. © 1994 Kluwer Academic Publishers. Printed in the Netherlands. Equilibrium in fiscal choices: Evidence from a budget game* PIERVINCENZO BONDONIO CARLA MARCHESE Department of Economics, University of Turin, via S. Ottavio 20, 1-10124 Turin Accepted 22 april 1992 Abstract. This is an applied study about the stability of collectivedecision-making in fiscal matters and the features of individual preferenceswhichare sufficientto reach a socialordering. It is based on data about citizens' preferences collectedthrough a budget game played by a sample of voters in Turin, a large Italian city. By simulating a series of indMdual choices, a social ordering of the municipal budget items is arrived at. The rote playedby restricted (i.e., single-peaked, single-caved etc.) preferences to avoid cyclesin choice simulations is then assessed. 1. Introduction Building on the pathbreaking contributions of Black (1948) and Arrow (1963), investigation of the voting paradox and the stability of collective decision- making continues in the current literature: a good overview is provided by Sen (1970). Within this stream of thought, this paper focuses on the features of individu- al preferences that suffice to achieve a social ordering (Sen and Pattanaik, 1969). The paper makes use of data resulting from a survey of fiscal preferences made on a sample of voters in a large Italian city, Turin, to test whether the paradox of voting may actually occur. It checks also whether restrictions upon individual preferences, sufficient to achieve a social ordering, are present or not. To this end, the most significant of these restrictions are reviewed: single- peakedness, separability, single-cavedness, limited agreement and ext~cemal restriction (See Kramer, 1973; and Sen, 1986). 1 Collective choices are made in democracy through some sort of voting process, usually majority voting. This, however, does not guarantee that all the Arrow conditions can be met simultaneously (see Sen, 1986: 1077-1084). Literature has tried to find an exit-path from Arrow's dilemma - which can be described summarily as implying "either irrationality of collective choices of dictatorship" - working along many streams. Two of these research streams seem to be more interesting than others. One contrasts the "ideal
Transcript of Equilibrium in fiscal choices: Evidence from a budget game

Public Choice 78: 205-218, 1994. © 1994 Kluwer Academic Publishers. Printed in the Netherlands.
Equilibrium in fiscal choices: Evidence from a budget game*
PIERVINCENZO BONDONIO
CARLA MARCHESE
Department o f Economics, University o f Turin, via S. Ottavio 20, 1-10124 Turin
Accepted 22 april 1992
Abstract. This is an applied study about the stability of collective decision-making in fiscal matters and the features of individual preferences which are sufficient to reach a social ordering. It is based on data about citizens' preferences collected through a budget game played by a sample of voters in Turin, a large Italian city. By simulating a series of indMdual choices, a social ordering of the municipal budget items is arrived at. The rote played by restricted (i.e., single-peaked, single-caved etc.) preferences to avoid cycles in choice simulations is then assessed.
1. Introduct ion
Building on the pathbreaking contributions of Black (1948) and Arrow (1963),
investigation of the voting paradox and the stability of collective decision- making continues in the current literature: a good overview is provided by Sen (1970).
Within this stream of thought, this paper focuses on the features of individu- al preferences that suffice to achieve a social ordering (Sen and Pattanaik,
1969).
The paper makes use of data resulting from a survey of fiscal preferences made on a sample of voters in a large Italian city, Turin, to test whether the
paradox of voting may actually occur. It checks also whether restrictions upon individual preferences, sufficient to achieve a social ordering, are present or
not. To this end, the most significant of these restrictions are reviewed: single- peakedness, separability, single-cavedness, limited agreement and ext~cemal restriction (See Kramer, 1973; and Sen, 1986). 1
Collective choices are made in democracy through some sort of voting
process, usually majority voting. This, however, does not guarantee that all the Arrow conditions can be met simultaneously (see Sen, 1986: 1077-1084). Literature has tried to find an exit-path from Arrow's dilemma - which can be described summarily as implying "either irrationality of collective choices of dictatorship" - working along many streams. Two of these research streams seem to be more interesting than others. One contrasts the "ideal
206
world" ~ la Arrow with a " r ea l " world in which collective choices are made under conditions that allow for stability, i.e., institutional arrangements (see, among others, Shepsle, 1979), agenda manipulations (Baron and Ferejohn, 1987), strategic vote behaviour (Shepsle and Weingast, 1981; Tullock, 1981), and probabilistic voting (Enelow and Hinich, 1989) and, for a survey, Lafay, (1991). The other research stream (which might be termed optimistic, in the sense that it tries to preserve the ethical meaning of Arrow's approach) tries to escape "impossibil i ty" by loosening, but not eliminating, one of the postu- lates in Arrow's set of five (Sen, 1970; Brown, 1975).
In this paper we shall present some empirical evidence which corroborates the latter approach.
Five sections follow. Section 2 reviews the relevant literature about stable so- cial choice and individual preference restrictions. Section 3 gives some details about a budget game, performed in Turin, from which relevant data were gathered. A test on the absence of cycles in determining a social choice from data resulting from the game is performed in Section 4 while, in Section 5, we present the frequency distribution of preference restrictions and calculate two political indices. The paper ends with a set of concluding remarks.
2. Stable social choice and individual preference restrictions
Let us consider the research stream focusing on how to loosen the postulate of unrestricted domain. Over time social choice research has succeeded in finding progressively less binding restrictions on the individual preferences which suffice to obtain a social ordering.
Following Sen (1966), restrictions need not be checked against the whole set of issues at stake, but on each triplet in that set, and different restrictions may be imposed upon different triplets: some of them can be single-peaked, other single-caved, and so on.
For the sake of simplicity, let us consider only individual orderings with strong preferences (i.e., indifference is not allowed for) and elections in which there is an odd number of voters. An alternative a in a triplet with a, b, c can be classified as " b e s t ' i f a > b and a > c ; as "wo r s t " if b > a and c > a ; and as "me d ium " if a > b but c > a , or a > c but b > a .
The first proposed restriction (Black, 1948) on individual preferences is single-peakedness (SP): this occurs when an alternative is never the worst. 2
A second restriction is single-cavedness (SC), which occurs when an alterna- tive is never the best for any voter. Despite the consistency of this restriction with the existence of a double peak, it may be possible to derive a social order- ing therefrom. This restriction is the opposite of single-peakedness (Inada, 1964).

207
A third restriction is separability (SEP). This occurs when the triplet includes an alternative which is never the "med ium" choice for any voter. Each voter "separates" the alternatives into two groups, and prefers each of the alter- natives in one group to each of the alternatives in the other.
A fourth restriction is extremal restriction (ER). If for a Voter a > b > c, and c > a for another voter, the preferences of the latter must also include c > b and b > a .
A fifth and final restriction is limited agreement (LA). This occurs when the triplet includes two alternatives a, b such that a > b for each voter.
The autonomous relevance of the last two restrictions is limited to a situation in which weak preferences are permitted; with strong preferences ER and LA, both imply that one of the other previous three restrictions is satisfied (for proof, see Sen and Pattanaik, 1969).
I f one could show that preferences, in practice, are likely to be somehow res- tricted, the problems raised by the Arrow impossibility would hold much less practical relevance.
Computer simulations based on the hypotheses of impartial culture (i.e. all the possible orderings of the alternatives are equally likely to be chosen by each voter) lead however to quite pessimistic conclusions.
As the number of voters increases, the likelihood of obtaining a single- peaked ordering decreases: with three issues, for instance, the probability that 75°70 or more of preferences fit a common dimension with a number of voters of 15 is .94; with 48 voters it is .41; and with 96 voters it is .15 (Niemi and Wright, 1987).
3. The Turin budget game: features and outcomes.
The data we shall use come from a budget game carried out in Turin in 1986. 3 The objective of the game 4 was to collect individual preferences about how
local (municipal) government allocates resources. Data were gathered from a sample of 667 citizen-voters drawn, after pre-
testing, from Turin's population and family register. A dossier was mailed to each participant. It included instructions on how to play the fiscal game and a questionnaire. Later, professional interviewers visited each participant's home to collect the dossier (checking the conformity of the answers given to the rules of the game) and to elicit answers to questions about the personal fea- tures of the participants and their families, their consumption of selected local public services, and their attitudes toward more general economic policy issues.
The dossier included a representation (through a vertical bar graph) of the distribution of municipal expenses among ten functional categories and of receipts (with the same total as the expenses) among four different sources. All

208
values were obtained by merging the budgets of the City of Turin with those of the independent municipal corporations, and were expressed in lire per capita.
The ten expenditure classes included: urban roads and ligthing; waste collec- tion and garbage disposal; primary, secondary and high school education; day nursery and nursery schools; population register; municipal police; transport; sports, gardens and cultural activities; welfare; and housing.
The four receipt classes were: value added and other indirect taxes; income and other direct taxes; local borrowing; user charges and other minor local tax- es (such as dog licenses). 5
Participants were asked to alter, if they wished, the allocation and weights accorded to the different classes of expenditures and receipts to make them consistent with their own preferences. Changes were made in three steps, each of which served to elicit the fiscal preferences of the interviewee with increasing accuracy.
In the first step, each person was asked to show his/her preferences in a pure- ly qualitative way, signalling which category of expenditures and receipts he/she wanted to increase or decrease, without a quantitative tie.
The second step probed the core of the game. A bundle of vouchers, differ- ing in unitary value, 6 was made available to each participant. With these he/she could change, at will, the sum allocated to each kind of per capita ex- penditure and receipt. The respondent was asked, simply, to place vouchers, in the desired amount, at appropriate places in the graph of expenditures and receipts, under only one constraint: budget balance. 7 If a person, for instance, wished to increase a class of expenditure by a given amount of life (50,000, say), he/she had to decrease some other class(es) of expenditure and/or in- crease some receipt by the same total amount (50,000 lire). At that time, that was the unique characteristic of the Turin budget game, making it different from other similar games. Strauss and Hughes (1976) were pioneers in using questionnaire responses indicating increases or decreases in expenditures or receipts. Hockley and Harbour (1983), to whose experiment the Turin game makes explicit reference, also made use of money vouchers. But they dealt with total public sector expenses and receipts, whereas the Turin game focused on the local budget. Nor dit they impose a budget constraint. (To make their ex- periment plausible, they used, instead, the deus ex machina of extra receipts from North Sea oil.)
In the third and last step of the Turin budget game, participants were allowed to specify their choices in greater detail, showing which specific expenditure programmes (or receipts) they wanted to modify, within each of the ten (or four) classes mentioned.
Moving on to some of the outcomes of the game, it should be mentioned that interviewees were allowed to choose among six possible options (a bigger set
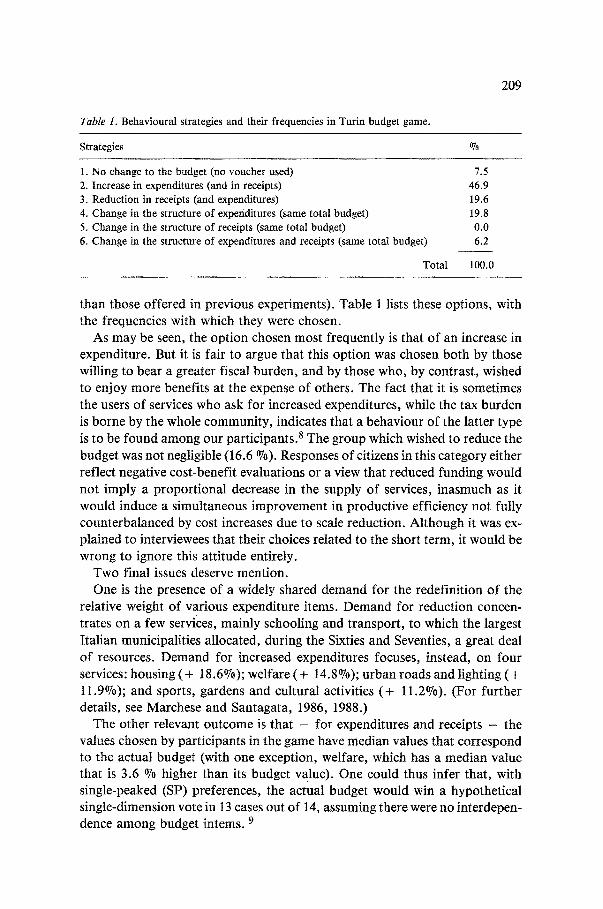
Table 1. Bebavioural strategies and their frequencies in Turin budget game.
Strategies %
209
1. No change to the budget (no voucher used) 7.5 2. Increase in expenditures (and in receipts) 46.9 3. Reduction in receipts (and expenditures) 19.6 4. Change in the structure of expenditures (same total budget) 19.8 5. Change in the structure of receipts (same total budget) 0.0 6. Change in the structure of expenditures and receipts (same total budget) 6.2
Total 100.0
than those offered in previous experiments). Table 1 lists these options, with the frequencies with which they were chosen.
As may be seen, the option chosen most frequently is that of an increase in expenditure. But it is fair to argue that this option was chosen both by those willing to bear a greater fiscal burden, and by those who, by contrast, wished to enjoy more benefits at the expense of others. The fact that it is sometimes the users of services who ask for increased expenditures, while the tax burden is borne by the whole community, indicates that a behaviour of the latter type is to be found among our participants. 8 The group which wished to reduce the budget was not negligible (16.6 %0). Responses of citizens in this category either reflect negative cost-benefit evaluations or a view that reduced funding would not imply a proportional decrease in the supply of services, inasmuch as it would induce a simultaneous improvement in productive efficiency not fully counterbalanced by cost increases due to scale reduction. Although it was ex- plained to interviewees that their choices related to the short term, it would be wrong to ignore this attitude entirely.
Two final issues deserve mention. One is the presence of a widely shared demand for the redefinition of the
relative weight of various expenditure items. Demand for reduction concen- trates on a few services, mainly schooling and transport, to which the largest Italian municipalities allocated, during the Sixties and Seventies, a great deal of resources. Demand for increased expenditures focuses, instead, on four services: housing (+ t8.6%); welfare (+ 14.8%); urban roads and lighting ( + 11.9°/0); and sports, gardens and cultural activities (+ 11.2%). (For further details, see Marchese and Santagata, 1986, 1988.)
The other relevant outcome is that - for expenditures and receipts - the values chosen by participants in the game have median values that correspond to the actual budget (with one exception, welfare, which has a median value that is 3.6 %o higher than its budget value ) . One could thus infer that, with single-peaked (SP) preferences, the actual budget would win a hypothetical single-dimension vote in 13 cases out of 14, assuming there were no interdepen- dence among budget interns. 9
210
4. A test on the absence o f cycles.
Let us now look at the fiscal preferences displayed in the game in order to test whether or not cycles in social ordering may appear, and to observe the fre- quencies of various preference restrictions.
In the budget game, by choosing his/her preferred levels of all expenditure and receipt items, each participant showed his/her preferred hierarchy. That is, he/she implicitly answered - we assume - a series of questions that entail pairwise comparisons such as the following:
"Should the municipality spend more for housing than welfare? Or the other way round?"
"Should the municipality collect more through direct than through indirect taxes? Or the other way round?"
And so on, for every couple of budget items, separately for the expenditure and revenue sides.
The municipality of Turin - to judge by its actual budget - would answer questions of this type through the following ordering, according to size of ex- penditure: a) on the expenditure side: 1st transport; 2nd primary, secondary and high school education; 3rd welfare; 4th day nursery and nursery schools; 5th waste collection and garbage disposal; 6th sports, gardens and cultural ac- tivities; 7th housing; 8th urban roads and lighting; 9th municipal police; 10th population register; b) on the receipts side: 1st income and other direct taxes; 2nd value added and other indirect taxes; 3rd user charges and minor local tax- es; 4th local borrowing.
The participants were provided with enough vouchers to allow them to re- structure the hierarchies implied by the municipal budget. However, a first analysis of the data (Marchese and Santagata, 1988) showed that most pre- ferred just marginal changes. We decided therefore to limit our analysis of the expenditure side to the most unstable part of the ordering, which could be easi- ly changed with the available vouchers. We therefore excluded the outtiers, and kept six items, whose levels in the municipal budget are quite close (welfare; day nursery and nursery schools; waste collection and garbage disposal; sports, gardens and cultural activities; housing; urban roads and lighting). This exclu- sion lowered the variation coefficient from 25% (for the ten items) to 20°70 (for the six considered). The variation coefficient of the receipts items was also 25%, but no reductions was possible, as the revenue side of the budget con- tained just four items.
We assumed that the choice of hierarchy made by each participant did not depend on the level of the budget, at least for the budget totalling between 1,981,000 (the top level chosen: the municipal budget + 50%) and 401,000 lire (the bottom level: the municipal budget - 70%). This interval includes both the budgets that each participant takes into account to form his/her ordering

211
and those which the municipality might reasonably choose. ~° In short, we as- sumed that - within the interval - the participant would not change the hier- archy he/she chose in the budget game. This assumption enabled us to examine solely the composition of the budget, without considering its level. Our hypothesis would materialise, for example, by optimizing consumers with homothetic utility functions - which dictate a constant mix of goods at dif- ferent budget levels - at given tax-prices.
We observed 177 types of orderings for the expenditure items (out of the 720 which might be formed with six items) and 8 for the revenue items (out of 24). 123 (out of 667) people ordered the six expenditure items in exactly the same way as in the municipal budget, while 533 specified the same ordering for revenues as in the municipal budget.
As far as receipts are concerned, it is clear that a social ordering does exist, because the majority of our participant-voters chose the same hierarchy and ordered the items in the same way as the municipal budget. For the expendi- tures, on the contrary, a specific test had to be carried out.
Following Sen (1966), we considered the 20 triplets which can be formed with the alternatives. Transitive results for a triplet of alternatives are guaranteed whenever preferences are restricted (see Section 2) or an ordering has the majority of net preferences - that is of preferences less the mirror ones (mirror preferences, like a > b > c and c > b > a, are opposite ones and neutralize each other: see Feld and Grofman, 1986).
For each of the 20 triplets we calculated the frequencies of the six possible strong orderings (weak orderings were just 0.02°70, so we left them out in order to simplify the computing procedure: moreover, no chooser was "uncon- cerned", i.e., indifferent, among three alternatives). It turned out that there was no triplet for which all the preferences were restricted. However, there was always an ordering which had the majority of the net preferences. It turned out that this was identical to that chosen by the municipality.
The absence of any cycle suggests that, whenever there are no shocks, 11 fis- cal preferences are homogeneous enough to produce a social ordering, before, and independently of the stabilizing intervention of log-rolling or of procedural rules in public institutions, at least at local level.
In addition, our participants chose the same ranking as the municipality. This suggests that local Italian institutions work ~ la Downs, choosing the poli- cies preferred by the majority. The fact that there is an almost exact correspon- dence between the municipal budget and the median budget chosen in the game points in the same direction. On the other hand, the hypothesis that the voter with the median income is decisive in choosing the level of the budget is belied by our data. Piperno and Santagata (1987), using the same data base, showed that the expenditure levels preferred by the participants depend on many eco- nomic, social and political variables and do not increase monotonically with income.

212
Table 2. Frequency distribution of preference orderings which satisfy a common dimension for
three types of restrictions
a) E x p e n d i t u r e s
Type of restrictions Frequency classes of the triplets a
1 2 3 4 5 6 7 Total
Single-peakedness - -
Separability 1 2
Single-cavedness - -
1 1 7 11 - 2 0
1 11 5 - - 20
3 1 11 5 - 20
Statistics
SP SEP SC
- Mean of orderings of a common scale 94.0 86.2 91.9
- Standard deviation 4.2 5.2 4.7
- Minimal value 83.1 73.6 81.6
- Maximal value 98.8 92.5 97.5
b ) R e c e i p t s
Type of restrictions Frequency classes of the triplets a
1 2 3 4 5 6 7 Total
Single-peakedness . . . . . 5 15 20
Separability . . . . . 20 - 20
Single-cavedness . . . . . 10 10 20
Statistics
SP SEP SC
- Mean of orderings of a common scale 99.9 98.9 99.7
- Standard deviation O. 1 0.6 0.3
- Minimal value 99.7 98.1 99.4
- Maximal value 100.0 99.6 100.0
aThe classes considered are: 1, from 0.699 to 0.749; 2, from 0.749 to 0.799; 3, from 0.799 to
0.849; 4, from 0.849 to 0.899; 5, from 0.899 to 0.949; 6, from 0.949 to 0.999; 7, from 0.999 to 1.
Note. With six expenditure items one can form 20 triplets which differ for at least one of the items
considered. Each one of the triplets can be ordered in six different ways. Some of the orderings,
however, imply a common dimension. Consider, for example, the triplet abc" the orderings
a > c > b , c > b > a , and b > c > a are all single-peaked with reference to the dimension (i.e., the x
axis in a diagram). For the triplet abc there are three possible dimensions, namely abc, bca, and
cab. For every triplet we considered the triplet most often chosen by the partecipants in the budget
game, and we classified the triplet according to the percentage of choosers sharing this common
dimension. One must recall that every ordering may satisfy more than one type of restriction.
213
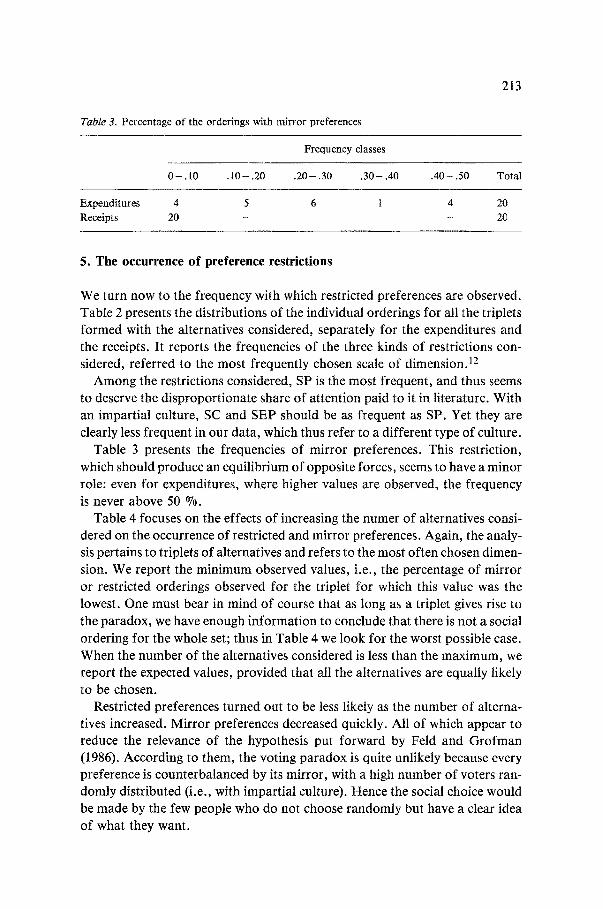
Table 3. Percentage of the orderings with mirror preferences
Frequency classes
0 - .10 .10- .20 .20- .30 .30- .40 .40 - .50 Total
Expenditures 4 5 6 1 4 20 Receipts 20 . . . . 20
5. The occurrence of preference restrictions
We turn now to the frequency with which restricted preferences are observed. Table 2 presents the distributions of the individual orderings for all the triplets formed with the alternatives considered, separately for the expenditures and the receipts. It reports the frequencies of the three kinds of restrictions con- sidered, referred to the most frequently chosen scale of dimension. 12
Among the restrictions considered, SP is the most frequent, and thus seems to deserve the disproport ionate share of attention paid to it in literature. With an impartial culture, SC and SEP should be as frequent as SP. Yet they are clearly less frequent in our data, which thus refer to a different type of culture.
Table 3 presents the frequencies of mirror preferences. This restriction, which should produce an equilibrium of opposite forces, seems to have a minor role: even for expenditures, where higher values are observed, the frequency is never above 50 %.
Table 4 focuses on the effects of increasing the numer of alternatives consi- dered on the occurrence of restricted and mirror preferences. Again, the analy- sis pertains to triplets of alternatives and refers to the most often chosen dimen- sion. We report the minimum observed values, i.e., the percentage of mirror or restricted orderings observed for the triplet for which this value was the lowest. One must bear in mind of course that as long as a triplet gives rise to the paradox, we have enough information to conclude that there is not a social ordering for the whole set; thus in Table 4 we look for the worst possible case. When the number of the alternatives considered is less than the maximum, we report the expected values, provided that all the alternatives are equally likely to be chosen.
Restricted preferences turned out to be less likely as the number of alterna- tives increased. Mirror preferences decreased quickly. All of which appear to reduce the relevance of the hypothesis put forward by Feld and Gro fman (1986). According to them, the voting paradox is quite unlikely because every preference is counterbalanced by its mirror, with a high number of voters ran- domly distributed (i.e., with impartial culture). Hence the social choice would be made by the few people who do not choose randomly but have a clear idea of what they want.

214
Table 4. Percentage of mirror or restricted orderings in relation to the number of the alternatives
a) Expenditures
Number of
alternatives Percentages of preferences
mirror SP SEP SC
r of Rae s of Berg
3 23.1 94.1 86.2 91.9 0.552 3.06 4 15.9 89.5 81.1 62.4 0.667 1,49
5 10.9 86.1 76.4 82.8 0.723 0.92
6 7.5 83.1 73.6 81.6 0.739 0.77
b) Receipts
Number of Percentages of preferences r of Rae s of Berg
alternatives mirror SP SEP SC
3 1.8 99.9 98.9 99.7 0.191 20.23
4 0.0 99.7 98.1 99.4 0.305 10.40
In table 4 information is summarized in terms of two indices: the Rae frac- tionalization index and the Berg contagion index.
X. n The former is r = 1 - E (20/(2), where the numerator of the fraction indi- cates the pairs of people who share the same ordering of alternatives, and the denominator the number of couples they can form. The index value is 0, when all share the same opinion, and 1 when they all disagree. 13 In table 4 the values of the Rae index show that there is a high homogeneity in preferences for receipts and a little less for expenditures. For the latter the fractionalization in- dex increases quickly as the number of alternatives grows.
Berg's index s (see Berg, 1985) refers to the possibility of a "con tag ion" among voters: the larger its value, the greater the likelihood that a preference expressed by one chooser will be repeated by the others who follow. 14
As to the meaning of the parameter s: s = 0 corresponds to an impartial culture and all orderings (6 with three al-
ternatives) are equally likely; small values of s correspond to weak contagion or interdependence among
choosers. In particular, s = 1 corresponds to the so-called impartial anony- mous culture (Gehrlein, 1990);
s > 1 corresponds to increasing levels of interdependence; choosers are more
likely to choose the same. In Table 4 the Berg contagion index was calculated under the assumption
that all orderings were a priori equally likely to be contagious. The index has high values; these, however, decrease quickly as the number of alternatives
215
cons ide red goes up . Pa r t i cu l a r ly for expendi tures with six i tems, the Berg index
indica tes an in t e rmed ia te resul t , be tween a n o n y m o u s preferences and impar t i a l
cul ture . The a priori p r o b a b i l i t y o f observ ing the vo t ing p a r a d o x is in this case
a b o u t 30 %.
6. Conclusions
Our results mus t be cons idered with some cau t ion for a t least three reasons .
Fi rs t o f all, the preferences we cons idered are themselves the f rui t o f an eco-
nomic game, on ly pa r t i a l ly con t ro l l ed (as usual ly happens in the social
sciences), and do no t refer to real choices. Secondly , the budge t game was no t
d i rect ly b o u n d to this analysis ; one cou ld do be t te r by designing a specif ic test .
Th i rd , ou r one -d imens iona l a p p r o a c h simplif ies the choice process , which
could be p o r t r a y e d more comple t e ly b y cons ider ing the p re fe r r ed budgets as
po in ts in a mu l t i d imens iona l choice space (as in P lo t t , 1967).
Bear ing these reserva t ions in mind , however , the results seem qui te signifi-
cant . Cycles - a t least wi th in a given local ju r i sd ic t ion where h o m o g e n e i t y is
l ikely to be h igher than t h r o u g h o u t a na t ion - are re la t ively un l ike ly to occur
on the basis o f ci t izen preferences a lone , even i r respect ive o f the s tabi l iz ing ef-
fects o f represen ta t ive ins t i tu t ions . As a consequence , one o f the m a i n hin-
d rances to the func t ion ing o f d i rec t d e m o c r a c y (or o f the m o d e l o f r epresen ta -
tive d e m o c r a c y ~ la Downs) seems to be far less re levant t han is usua l ly
though t , at least at the local level.
Notes
The authors wish to acknowledge the financial support of the Italian Ministero dell' Universit~ e della Ricerca Scientifica (60 % funds) and the useful comments kindly supplied by V. Grisoli, H. Hochman, J. Schimmelpfennig, M. Salles and two anonymous referees. The usual disclaimers apply.
1. In contrast, other applied works employed computer simulations of distributions calculated from known probability functions. An interesting exception is Niemi and Wright (1987), pub- lished while our research was in course, a paper very similar to ours in its general formuIation. The authors investigate alternatives among candidates, rather than budget items, and find preferences expressed in a survey to be single-peaked. Niemi and Wright try also to connect single-peakedness to personal characteristics of interviewees, something which we have not tried to do so far. In general, however, the use of microdata and experimental techniques to investigate majority voting, in particular, has become increasingly common (e.g., Collier, Or- deshook and Williams, 1989).
2. For more technical definitions, see Sen (1986:1138-1140). 3. The survey was conducted during 1986, in the context of a research study sponsored by IRES
(the Piedmontese Institute for Socio-Economic Research) labelled "Were I the Lord Mayor

2 1 6
. . ." . We are grateful to the Institute for kindly allowing us to make use o f the data. Other mem-
bers o f the research team were G. Brosio, M. Maggi, G. Martinotti , S. Piperno, and W. San-
tagata. 4. Main outcomes of the research project are described in Marchese and Santagata (1986, 1988);
Piperno and Santagata (1987); Piperno (1988); Santagata (1988). 5. In Italy, direct and indirect taxes are a concern of the central government . Nonetheless, we
treated them as sources of municipal receipts - with values proportional to their respective incidence in the national aggregate for the difference between the total budget and au tonomous
sources of revenue - in order to make the actual financing of local expenditures more trans-
parent. 6. Vouchers totalled 920,000 tire, both for increases and decreases in budget items, out o f a total
per capita value o f 1,321,000 lire (for both expenditure and balancing receipts).
7. The budget constraint was imposed to increase the " rea l i sm" of the experiment and, above
all, to reduce the incentive to conceal true preferences (i.e., to act as a free-rider). Internal con-
trols (for instance, reduced willingness to increase expenditures f rom qualitative answers -
without ties - to quantitative answers - with budget constraints) enabled us to verify a signifi- cant propensity to reveal true preferences on the part of the participants.
8. A positive correlation between use of a service and demand for a larger expenditure was also
found in the Turin experiment (Marchese and Santagata, 1986, Table 10). It seems, however,
less strong than that found elsewhere (e.g., Kristensen, 1982). 9. The Turin research project, however, indicates a significant level o f disagreement as to the al-
ternatives preferred by voters (interviewees) and elected representatives. In fact, the average
"d is tance" between proposed and actual budgets was 17 %. We can refer to this distance as a quantitative measure of the "cos t of democracy" . This outcome, compared with that o f a
1979 survey o f 2,000 citizens o f Michigan (Gramlich and Rubinfeld, 1982), suggests that the
average budget change preferred by Turin citizens was equal to the highest level desired by
American citizens (Marchese and Santagata, 1988). 10. This simplification seems compatible with our data. It turns out that the choice of a particular
ranking (described through a d u m m y variable) is related to the preferred budget level. Yet this
relation is weak; correlation coefficients are at most 0.23 for expenditures and 0.28 for
revenues, and for most of the rankings they are under 0.10. 11. The date of the experiment (which lasted for four months in 1986) was chosen to minimize ex-
pectations o f major social changes, as might be anticipated just prior to general or local elec-
tions etc. 12. With three alternatives (a, b, c) and strong preferences it is possible to define three distinct
dimensions (abc, bca, cab), every one of which may be satisfied by four single-peaked orderings
(while their mirrors, i.e. cba, acb, bac, generate the same set of single-peaked preference order-
ings). The possible dimensions are again three for SEP and SC.
13. However, the max imum value is less than 1 if there are more voters than alternatives, so that
some opinion sharing must occur. In our case the max imum value - with impartial culture
- is 0.97. 14. The Berg index refers to the following hypthetical distribution of preferences:
Pr (X = x) = (n! /x 1 ! . . . x6 ! ) A 1 (s,x I) . . . A 6 (s,x 6)/A(s,n) where E x i = n (that is, to the
numbers o f voters) and A 1 • * .A 6 are arbitrary positive numbers , with A = A 1 + A 2 + . . . + A 6. A(S'n) is supposed to be an ascending factorial o f this type: A(s,n) = A(A + s)
. . . ( A + ( n - 1)s).
217
References
Arrow, K. (1963). Social choice and individual values. 2nd edn. New York: Wiley. Baron, D.P. and Ferejohn, J.A. (1987). Bargaining and agenda formation in legislatures. Ameri-
can Economic Review 77: 303-309. Berg, S. (1985). Paradox of voting under an urn model: The effect of homogeneity. Public Choice
47: 377-387. Black, D. (1948). On the rationale of group decision-making. Journal of Political Economy 56:
23 -34. Brown, D.J. (1975). Aggregation of preferences. Quarterly Journal of Economics 89: 456-469. Collier, K.E., Ordeshook, P.C. and Williams, K.C. (1989). The rationally uniformed electorate:
Some experimental evidence. Public Choice 60: 3-29. Enelow, J.M. and Hinich, M.J. (1989). A general probabilistic spatial theory of elections. Public
Choice 61: 101-113. Feld, S.L. and Grofman, B. (1986). Partial single-peakedness: An extension and clarification.
Public Choice 51: 71-80. Gehrlein, W.V. (1990). Probability calculations for transitivity of simple majority rule with anony-
mous voters. Public Choice 66: 253-259. Gramlich, E.M. and Rubinfeld, D.L. (1982). Micro estimates of public spending demand func-
tions and tests of the Tiebout and median-voter hypotheses. Journal o f Political Economy 90: 536-560.
Hockley, G. and Harbour, G. (1983). Revealed preferences between public expenditure and taxa- tion cuts: Public sector choice. Journal of Political Economy 22: 387-399.
Inada, K. (1964). A note on the simple majority decision rule. Econometrica 32: 525-531. Kramer, G.H. (1973). On a class of equilibrium conditions for majority rule. Econometrica 41:
285 -297. Kristensen, O.P. (1982). Voter attitudes and public spending: Is there a relationship? European
Journal of Political Research 10: 35-52. Lafay, J.D. (1991). The silent revolution of probabilistic voting. Unpublished manuscript. Marchese, C. and Santagata, W. (1986). "'Se io fossi il Sindaco. . . "'. Le preferenze fiscali prese
sul serio. Rapporto di ricerca sulle preferenze fiscali a Torino. Working paper 74, Torino: Ires. Marchese, C. and Santagata, W. (1988). Bilancio comunale e preferenze dei cittadini: un es-
perimento per uua grande citt~t. Economia pubblica 18: 209-224. Niemi, R.G. and Wright, J.R. (1987). Voting cycles and the structure of individual preferences.
Social Choice and Welfare 4: 177-183. Piperno, S. (1988). Domanda di servizi pubblici locali e politiche redistributive: il caso del Comune
di Torino. Unpublished manuscript. Piperno, S. and Santagata, W. (1987). A political and socio-economic choice model for local pub-
tic goods. Working paper 81, Torino: Ires. Plott, C.R. (1967). A notion of equilibrium and its possibility under majority rule. American Eco-
nomic Review 57: 787-806. Santagata, W. (1988). Le preferenze fiscali prese sul serio: un modello di domanda di beni pubblici
locali. Rivista di Diritto Finanziario e Scienza delle Finanze 42: 33-63. Sen, A.K. (1966). A possibility theorem on majority decisions. Econometrica 34: 491-499. Sen, A.K. (1970). Collective choice and social welfare. San Francisco: Holden-Day. Sen, A.K. (t986). Social choice theory. In K.J. Arrow and M.D. Intriligator (Eds.), Handbook
of mathematical economics, Vol. 3, 1073-1181. Amsterdam: North Holland. Sen, A.K. and Pattanaik, P.K. (1969). Necessary and sufficient conditions for rational choice un-
der majority decision. Journal of Economic Theory 1: 178-202.
218
Shepsle, K.A. (1979). Institutional arrangements and equilibrium in multidimensional voting models. American Journal o f Political Science 23: 27-59.
Shepsle, K.A. and Weingast, B. (1981). Structure-induced equilibrium and legislative choice. Pub-
lic Choice 37: 189-202. Strauss, R. and Hughes, H. (1976). A new approach to the demand for public goods. Journal o f
Public" Economics 6: 191-204. Tullock, G. (1981). Why so much stability? Public Choice 37: 189-202.