EPRI Title Slide - DER-VET
11
© 2021 Electric Power Research Institute, Inc. All rights reserved. www.epri.com Degradation Reference Case Miles Evans | EPRI
-
Upload
khangminh22 -
Category
Documents
-
view
4 -
download
0
Transcript of EPRI Title Slide - DER-VET

© 2021 Electric Power Research Institute, Inc. All rights reserved.w w w . e p r i . c o m
Degradation Reference
Case
Miles Evans | EPRI

© 2021 Electric Power Research Institute, Inc. All rights reserved.w w w . e p r i . c o m2
Degradation Reference Case
▪ Based on CAISO Market case
– No ancillary services –just energy shifting
▪ Degradation is turned on
▪ Calendar degradationrate = 2%/yr

© 2021 Electric Power Research Institute, Inc. All rights reserved.w w w . e p r i . c o m3
Degradation Reference Case
▪ Enter an expected lifetime then compare the expected lifetime to the dynamic degradation results.
▪ Re-run the case with the dynamic degradation results as the expected lifetime. Repeat as necessary.
© 2021 Electric Power Research Institute, Inc. All rights reserved.w w w . e p r i . c o m4
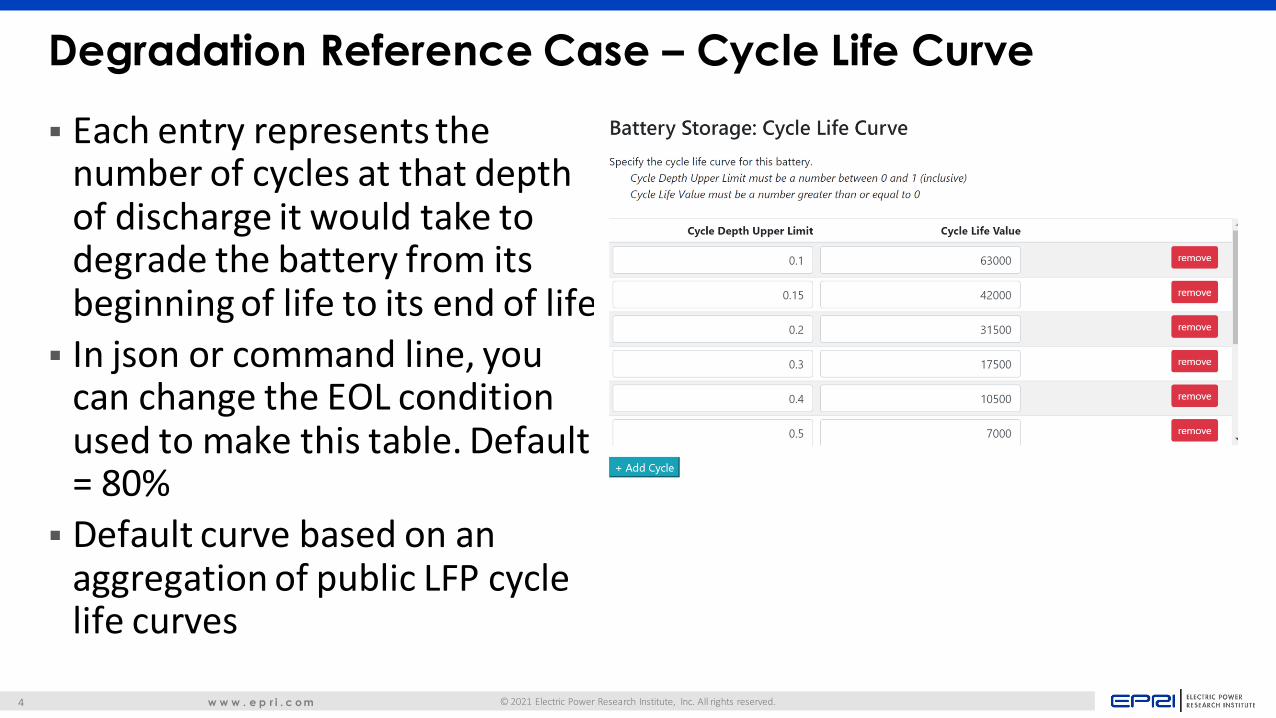
Degradation Reference Case – Cycle Life Curve
▪ Each entry represents the number of cycles at that depth of discharge it would take to degrade the battery from its beginning of life to its end of life
▪ In json or command line, youcan change the EOL condition used to make this table. Default = 80%
▪ Default curve based on an aggregation of public LFP cycle life curves

© 2021 Electric Power Research Institute, Inc. All rights reserved.w w w . e p r i . c o m5
Degradation Reference Case – Cycle Life Curve
▪ This case contains a shorter-life cycle life curve than the default.
▪ Based on an older NMC cell

© 2021 Electric Power Research Institute, Inc. All rights reserved.w w w . e p r i . c o m6
Degradation Reference Case - Results
▪ …degradation_data.csv
▪ Labeling issue in columns B and C – look at column D
3750
3800
3850
3900
3950
4000
4050
0 50 100 150 200 250 300 350 400
Effe
ctiv
e En
ergy
Ca
pac
ity
(kW
h)
Day of the Year
Year-Ending SOH:95.1%
Implied lifetime:4.1 years
© 2021 Electric Power Research Institute, Inc. All rights reserved.w w w . e p r i . c o m7
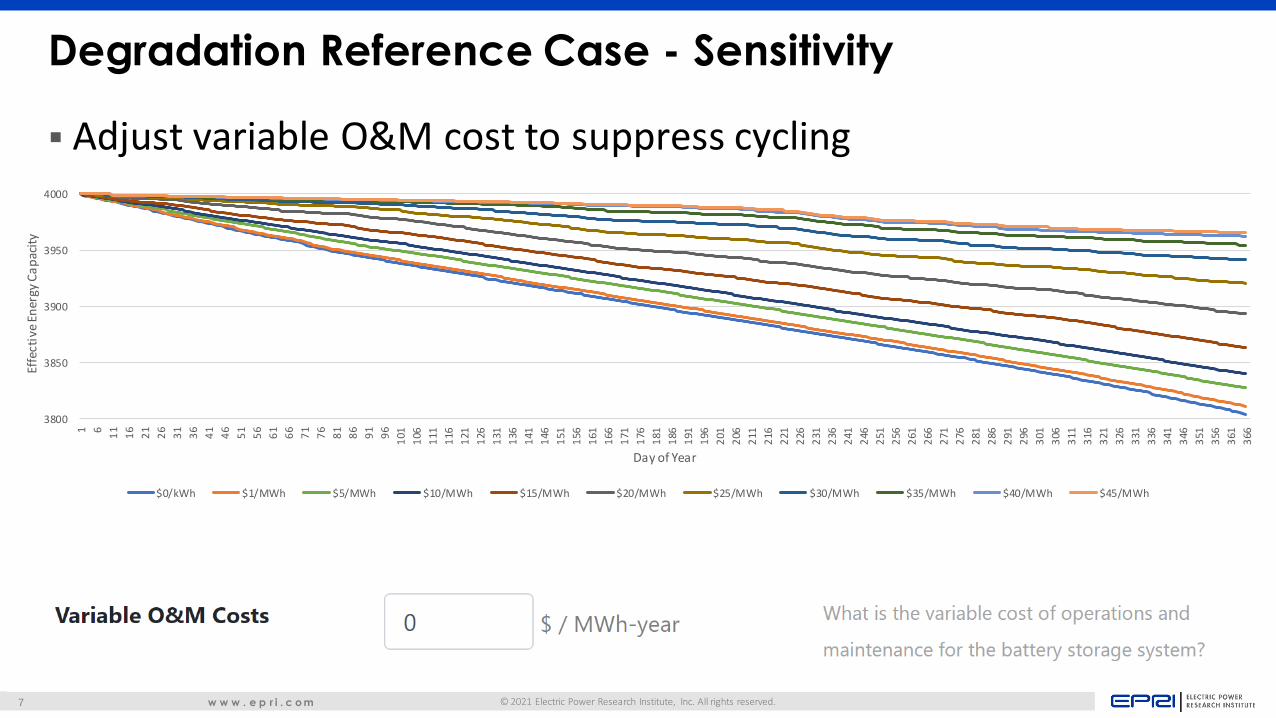
Degradation Reference Case - Sensitivity
▪ Adjust variable O&M cost to suppress cycling
3800
3850
3900
3950
4000
1 6
11
16
21
26
31
36
41
46
51
56
61
66
71
76
81
86
91
96
101
106
111
116
121
126
131
136
141
146
151
156
161
166
171
176
181
186
191
196
201
206
211
216
221
226
231
236
241
246
251
256
261
266
271
276
281
286
291
296
301
306
311
316
321
326
331
336
341
346
351
356
361
366
Effe
ctiv
e En
ergy
Ca
pac
ity
Day of Year
$0/kWh $1/MWh $5/MWh $10/MWh $15/MWh $20/MWh $25/MWh $30/MWh $35/MWh $40/MWh $45/MWh

© 2021 Electric Power Research Institute, Inc. All rights reserved.w w w . e p r i . c o m8
Degradation Reference Case - Sensitivity
0
5
10
15
20
25
0 5 10 15 20 25 30 35 40 45 50
Life
(ye
ars)
Penalty ($/MWh)
40000
45000
50000
55000
60000
65000
70000
75000
80000
0 5 10 15 20 25 30 35 40 45 50
Year
ly V
alu
e ($
, yea
r 1
)
Penalty ($/MWh)

© 2021 Electric Power Research Institute, Inc. All rights reserved.w w w . e p r i . c o m9
Degradation Reference Case - Sensitivity
$0.00
$100,000.00
$200,000.00
$300,000.00
$400,000.00
$500,000.00
$600,000.00
0 5 10 15 20 25 30 35 40 45 50
Life
tim
e P
rese
nt
Val
ue
of
Ener
gy
Shif
tin
g ($
)
Penalty (M/kWh)
Lifetime Value Discount Rate = 7%

© 2021 Electric Power Research Institute, Inc. All rights reserved.w w w . e p r i . c o m10
Degradation Reference Case - Results
0
100
200
300
400
500
600
0 5 10 15 20 25 30 35 40 45 50
Equ
ival
ent
Cyc
les/
Year
Penalty ($/MWh)

© 2021 Electric Power Research Institute, Inc. All rights reserved.w w w . e p r i . c o m11
Together…Shaping the Future of Electricity