Epoetin alfa increases frataxin production in Friedreich's ataxia without affecting hematocrit
43
Direct Visualization of Parkinson’s Disease by In Vivo Human Brain Imaging Using 7.0T Magnetic Resonance Imaging Zang-Hee Cho, PhD, 1 * Se-Hong Oh, MS, 1 Jong-Min Kim, MD, PhD, 2 Sung-Yeon Park, MS, 1 Dae-Hyuk Kwon, MS, 1 Hye-Jin Jeong, BS, 1 Young-Bo Kim, MD, PhD, 1 Je-Geun Chi, MD, PhD, 1,3 Chan-Woong Park, MD, 1 John Huston III, MD, 4 Kendall H. Lee, MD, PhD, 5 and Beom S. Jeon, MD, PhD 2 1 Neuroscience Research Institute, Gachon University of Medicine and Science, Incheon, South Korea; 2 Department of Neurology, College of Medicine, Seoul National University, Seoul, South Korea; 3 Department of Pathology, College of Medicine, Seoul National University, Seoul, South Korea; 4 Department of Radiology, Mayo Clinic, Rochester, Minnesota, USA; 5 Department of Neurosurgery and Department of Physiology and Biomedical Engineering, Mayo Clinic, Rochester, Minnesota, USA ABSTRACT Parkinson’s disease (PD) is a neurodegenerative disor- der resulting from progressive loss of dopaminergic neurons in the substantia nigra (SN) pars compacta. Therefore, imaging of the SN has been regarded to hold greatest potential for use in the diagnosis of PD. At the 7.0T magnetic resonance imaging (MRI), it is now possi- ble to delineate clearly the shapes and boundaries of the SN. We scanned eight early and two advanced PD patients, along with nine age-matched control subjects, using a 7.0T MRI in an attempt to directly visualize the SN and quantify the differences in shape and bounda- ries of SN between PD subjects in comparison with the normal control subjects. In the normal controls, the boundaries between the SN and crus cerebri appear smooth, and clean ‘‘arch’’ shapes that stretch ventrally from posterior to anterior. In contrast, these smooth and clean arch-like boundaries were lost in PD subjects. The measured correlation analyses show that, in PD patients, there is age-dependent correlation and sub- stantially stronger UPDRS motor score-dependent cor- relation. These results suggest that, by using 7.0T MRI, it appears possible to use these visible and distinctive changes in morphology as a diagnostic marker of PD. V C 2011 Movement Disorder Society Key Words: Parkinson’s disease; substantia nigra; 7.0T MRI; neurodegenerative disorder; brain imaging In the majority of cases, the Parkinson’s disease (PD) is idiopathic, and the diagnosis is dependent on con- stellation of symptoms. Thus, the definitive diagnosis is not available until postmortem histologic analysis, where degeneration of the substantia nigra para com- pacta (SNc) dopaminergic system is seen as depigmen- tation of SN. The neurodegeneration SNc result in the release of neuromelanin into the adjacent tissue, where it is phagocytosed and carried away by macrophages. 1 It is believed that >60% of dopaminergic neurons are lost before a patient begins to show clinical symptoms of PD, such as bradykinesia, cogwheel rigidity, and tremor. 2,3 Thus, in vivo direct observation of the SNc in the human brain has been one of the most sought- after goals in PD research, as it has the potential to lead to noninvasive premortem diagnosis of PD. 4–6 In vivo observation of the region related to the SNc in the PD brain has been attempted using various imaging tools, including magnetic resonance imaging (MRI), positron emission tomography, single photon emission computed tomography (SPECT), and com- puted tomography. 7 Many studies have examined the MRI features of PD by using various MR techniques. For example, there has been use of an inversion recov- ery pulse sequence, 8–11 measuring the intensity or T 2 relaxation time, 12 diffusion-weighted images, 13 and phase-contrast images 14 or T 2 -weighted imaging. 15 De- spite this, none have been able to clearly show the shape and boundaries of the SN. Recently, high-resolution phase-contrast MR images obtained with an ultra-high field system, such as 7.0T ------------------------------------------------------------ Additional Supporting Information may be found in the online version of this article. *Correspondence to: Dr. Zang-Hee Cho, Neuroscience Research Institute, Gachon University of Medicine and Science, 1198 Kuwol-dong, Namdong-gu, Incheon 405-760, Korea; [email protected] Relevant conflicts of interest/financial disclosures: The author Zang- Hee Cho had full access to all of the data in the study, and takes responsibility for the integrity of the data and the accuracy of the data analysis. This work was supported by the Korea Science and Engineering Foundation (KOSEF) grant funded by the Korea government (MOST; 20090065597). Full financial disclosures and author roles may be found in the online version of this article. Received: 15 March 2010; Revised: 23 July 2010; Accepted: 9 September 2010 Published online 21 January 2011 in Wiley Online Library (wileyonlinelibrary.com). DOI: 10.1002/mds.23465 BRIEF REPORTS Movement Disorders, Vol. 26, No. 4, 2011 713
Transcript of Epoetin alfa increases frataxin production in Friedreich's ataxia without affecting hematocrit

Direct Visualization of Parkinson’sDisease by In Vivo Human BrainImaging Using 7.0T Magnetic
Resonance Imaging
Zang-Hee Cho, PhD,1* Se-Hong Oh, MS,1 Jong-Min Kim,MD, PhD,2 Sung-Yeon Park, MS,1 Dae-Hyuk Kwon, MS,1
Hye-Jin Jeong, BS,1 Young-Bo Kim, MD, PhD,1 Je-GeunChi, MD, PhD,1,3 Chan-Woong Park, MD,1 John Huston III,MD,4 Kendall H. Lee, MD, PhD,5 and Beom S. Jeon, MD,PhD2
1Neuroscience Research Institute, Gachon University of Medicine and
Science, Incheon, South Korea; 2Department of Neurology, College
of Medicine, Seoul National University, Seoul, South Korea;3Department of Pathology, College of Medicine, Seoul National
University, Seoul, South Korea; 4Department of Radiology, Mayo
Clinic, Rochester, Minnesota, USA; 5Department of Neurosurgery and
Department of Physiology and Biomedical Engineering, Mayo Clinic,
Rochester, Minnesota, USA
ABSTRACTParkinson’s disease (PD) is a neurodegenerative disor-der resulting from progressive loss of dopaminergicneurons in the substantia nigra (SN) pars compacta.Therefore, imaging of the SN has been regarded to holdgreatest potential for use in the diagnosis of PD. At the7.0T magnetic resonance imaging (MRI), it is now possi-ble to delineate clearly the shapes and boundaries ofthe SN. We scanned eight early and two advanced PDpatients, along with nine age-matched control subjects,
using a 7.0T MRI in an attempt to directly visualize theSN and quantify the differences in shape and bounda-ries of SN between PD subjects in comparison with thenormal control subjects. In the normal controls, theboundaries between the SN and crus cerebri appearsmooth, and clean ‘‘arch’’ shapes that stretch ventrallyfrom posterior to anterior. In contrast, these smooth andclean arch-like boundaries were lost in PD subjects.The measured correlation analyses show that, in PDpatients, there is age-dependent correlation and sub-stantially stronger UPDRS motor score-dependent cor-relation. These results suggest that, by using 7.0T MRI,it appears possible to use these visible and distinctivechanges in morphology as a diagnostic marker of PD.VC 2011 Movement Disorder Society
Key Words: Parkinson’s disease; substantia nigra;7.0T MRI; neurodegenerative disorder; brain imaging
In the majority of cases, the Parkinson’s disease (PD)
is idiopathic, and the diagnosis is dependent on con-
stellation of symptoms. Thus, the definitive diagnosis is
not available until postmortem histologic analysis,
where degeneration of the substantia nigra para com-
pacta (SNc) dopaminergic system is seen as depigmen-
tation of SN. The neurodegeneration SNc result in the
release of neuromelanin into the adjacent tissue, where
it is phagocytosed and carried away by macrophages.1
It is believed that >60% of dopaminergic neurons are
lost before a patient begins to show clinical symptoms
of PD, such as bradykinesia, cogwheel rigidity, and
tremor.2,3 Thus, in vivo direct observation of the SNc
in the human brain has been one of the most sought-
after goals in PD research, as it has the potential to
lead to noninvasive premortem diagnosis of PD.4–6
In vivo observation of the region related to the SNcin the PD brain has been attempted using variousimaging tools, including magnetic resonance imaging(MRI), positron emission tomography, single photonemission computed tomography (SPECT), and com-puted tomography.7 Many studies have examined theMRI features of PD by using various MR techniques.For example, there has been use of an inversion recov-ery pulse sequence,8–11 measuring the intensity or T2
relaxation time,12 diffusion-weighted images,13 andphase-contrast images14 or T2-weighted imaging.15 De-spite this, none have been able to clearly show theshape and boundaries of the SN.Recently, high-resolution phase-contrast MR images
obtained with an ultra-high field system, such as 7.0T
------------------------------------------------------------Additional Supporting Information may be found in the online version ofthis article.
*Correspondence to: Dr. Zang-Hee Cho, Neuroscience ResearchInstitute, Gachon University of Medicine and Science, 1198 Kuwol-dong,Namdong-gu, Incheon 405-760, Korea; [email protected]
Relevant conflicts of interest/financial disclosures: The author Zang-Hee Cho had full access to all of the data in the study, and takesresponsibility for the integrity of the data and the accuracy of the dataanalysis.This work was supported by the Korea Science and EngineeringFoundation (KOSEF) grant funded by the Korea government (MOST;20090065597).Full financial disclosures and author roles may be found in the onlineversion of this article.
Received: 15 March 2010; Revised: 23 July 2010; Accepted: 9September 2010Published online 21 January 2011 in Wiley Online Library(wileyonlinelibrary.com). DOI: 10.1002/mds.23465
B R I E F R E P O R T S
Movement Disorders, Vol. 26, No. 4, 2011 713

MRI, are beginning to demonstrate brain anatomy withexquisite detail, such as even the cortical layers, and pro-vided us the tools for imaging of the midbrain areas.16–20
Images obtained using 7.0T MRI also began to showdeep brain areas, such as the hippocampus and thedetails of the structures within the hippocampus.18,19
These findings suggest that 7.0T MRI could be used toobserve the degeneration of the SN in PD patients.18,19,21
Here, we demonstrate that there are visible and distinc-tive differences in morphology of SNc in PD patientswhen compared with normal controls and suggest that7.0 TMRI may be a useful tool in diagnosis of PD.
Methods
Subjects
7.0T T2*-weighted MR images of the SN wereobtained from patients with PD and age-matched con-trol subjects (detailed information on the subjects isshown in Table 1). All subjects were informed of thepurpose of the MR examinations and consented toenrollment in this study. The study protocol wasapproved by the Korean Food and Drug Administrationand by the Institutional Medical Ethics Committees andReview Boards at Gachon University of Medicine andScience and Seoul National University Hospital.The control group included nine subjects (one male
and eight female) aged between 44 and 67 years (mean
age, 57.7 6 7.4 years) without known neurologic deficitsor abnormal findings on conventional 1.5T MR images.The PD group included eight patients in the early stagesof PD [one male and seven female, Hoehn and Yahr(H&Y) Stage 1] who were between the ages of 45 and70 years (mean age, 58.3 6 8.5 years; mean duration,3.4 6 2.6 years) and 2 patients in the advanced stages ofPD (1 male and 1 female, H&Y Stage 3) who werebetween the ages of 51 and 67 years (mean age, 59 611.3 years; mean duration, 8.5 6 4.9 years).
MRI Examinations
The MRI used was a 7.0T research prototype MRIscanner (Magnetom 7T, Siemens). Axial images wereall obtained from the control subjects and patientsacquired using a 2D T2*-weighted gradient echosequence aligned with AC-PC line. The specific MRimaging parameters used were as follows: repetitiontime ¼ 750 ms; echo time ¼ 17.8 ms; flip angle ¼ 45�;total acquisition time ¼ 12.50 min; bandwidth ¼ 30;and matrix size ¼ 1024 � 896. The in-plane resolutionwas 0.25 mm, and the slice thickness was 2 mm. Allimages were obtained without sedation. We developeda 7.0T optimized 8-channel SENSE coil designed spe-cifically for use in this study. Axial images of the mid-brain, which were aligned with the AC-PC line,including the SN and RN, were all obtained from thecontrol subjects and patients.
Table 1. The information of patients in the early stages of PD (H&Y 1), patients in the advanced stages of PD (H&Y3), and age-matched control subjects
Symptoms ID H&Y stage Period Age (yr) Sex
UPDRS (right side
at off medication)
UPDRS (left side
at off medication)
Normal C001 0 – 61 F – –C002 0 – 44 F – –C003 0 – 66 F – –C004 0 – 57 F – –C005 0 – 53 F – –C006 0 – 56 F – –C007 0 – 63 M – –C008 0 – 67 F – –C009 0 – 52 F – –
Early PD P101 1 4 56 F 2 6.5P102 1 2 45 F 6 7P103 1 7 53 F 9.5 4P104 1 1 61 F 12.5 4P105 1 2 57 F 9 1P106 1 5 70 M 7 1P107 1 2 54 F 6 2P108 1 4 70 F 9 15.5
Advanced PD P301 3 12 51 F 5 8P302 3 5 67 M 8.5 12.5
This table presents the information of selected age-matched normal controls, patients in the early stages of PD (H&Y 1), and patients in the advanced stagesof PD (H&Y 3), respectively. This study includes nine age-matched normal controls and 10 patients in the early PD and advanced stages of PD. PDs wereclinically diagnosed with H&Y stages 1–3. In the early stage of PD, the mean period of illness was 3.38 yr, whereas the mean period of illness in the advancedstage of PD was 8.5 yr. The mean age and sex of the subjects were closely matched in normal controls and PDs. The subject’s condition, i.e., normal healthycontrol, Parkinson’s H&Y stages 1 and 3 are indicated as C001–009, P101–108, and P301–302. The UPDRS motor scores are measured in the off medicationstate. Individual’s other information such as their duration of illness, age, and sex are also shown in the table.
C H O E T A L .
714 Movement Disorders, Vol. 26, No. 4, 2011

Data Analysis of the Lateral Boundaries of SN
For the quantitative analysis, we have segmented SNand then the center of mass was obtained to locate acenter point. From this center point, we have definedthe midline of SN along the direction of anterior-poste-rior (see white solid lines in Fig. 3A, D), which dividesthe lateral and the ventral aspects of SN. We select thelateral boundary of each subject and then these bounda-ries are normalized based on the length of midline ofSN, which defined previously. After the normalizationprocess, all dates have same length of midline; therefore,we could compare distance profile from the midline tothe lateral boundary of SN.To make the reference lateral boundary line between
SN and CC, we have calculated mean boundary line ofcontrol group and used as a reference line. We thenmeasured distance profiles by measuring the perpendic-ular distances from the midline to the lateral boundaryof SN and calculated sum of absolute differences(SAD) for PD and normal control, i.e., SAD betweenindividual data along the midline and reference. TheSAD works by taking the absolute value of the differ-ence between reference and individual line along themidline (see Fig. 3C, F). And then these differences aresummed. We referred this SAD value as ‘‘undulationvalue.’’ In Figure S1 (Supporting Information), theoverall schematic diagram is shown.
Results
Ultra-High Field MRI of the SN
Figure 1A shows a photo of the midbrain areaobtained from a cadaver. Figure 1B shows a typicalMR image of the midbrain area obtained from a nor-mal healthy subject using 7.0T MRI. The effects ofmagnetic susceptibility increase linearly with thestrength of the main static magnetic field, especially
when iron is deposited heavily in the SN. This strongT2*- or susceptibility weighted images are difficult toachieve with low field MRI.15 Our results demon-strate that 7.0T MRI significantly increases the SNRand contrast, thus enabling substantially higher reso-lution and higher contrast images with increased sen-sitivity, which in turn enable us to detect themorphological changes of PD. As shown, with 7.0T,we are not only able to see the clear boundaries ofbetween the SN and the CC and their surroundingsbut also allow us to quantitate directly the amount ofundulation from the images obtained both from thenormal and the patient.
Comparison of PD Patients and HealthyNormal Controls
Other representative samples of 7.0T images ofthe normal control and PD groups, namely two nor-mal controls and PD patients with H&Y1 and theother with H&Y3 are selected and compared. First,two typical axial images of age-matched normalhealthy controls obtained using 7.0T T2*-weightedimaging are shown in the left column of Figure 2.These two images clearly show the typical smoothboundaries between the SN and CC. However, inthe right column of Figure 2, the boundaries of thetwo PD cases with H&Y1 and a H&Y2, respec-tively, are severely serrated in both PDs and clearlydistinguishes the two groups, i.e., normal controlsand PD patients. More specifically, the boundariesof PD patients are no longer ‘‘smooth-arch’’ shapedbut rather appear serrated and distorted, suggestingprobably due to the degradation of cells in the SN.These clear distinctions appear an important makerfor the diagnosis of PD in vivo hither to unable todo with any other devices.
FIG. 1. Images of the SN. A cadaver image of a normal healthy subject showing the substantia nigra (SN), cerebral peduncle (CP) or crus cerebri(CC), red nucleus (RN), and other structures. Note that the smooth ‘‘arch’’ shape boundary between the SN and CP or CC. (B) MR images of themidbrain areas in a young normal healthy subject obtained using 7.0T MRI.
D I R E C T V I S U A L I Z A T I O N O F P D U S I N G 7 . 0 T M R I
Movement Disorders, Vol. 26, No. 4, 2011 715

Data Analysis of the Lateral Boundary of SN
Figure3A–C and D–F are the results of analysis intypical PD patient and normal control, respectively.Representative images of a PD and a normal controlobtained from 7.0T T2*-weighted SN images areshown in Figure 3A, D. In these images, white solidlines represent midline, which divides the lateral andthe ventral aspects of SN, and white dotted lines repre-sent distance from the midline to the lateral border ofSN. Distance profiles of individual PD [p(x)] for thelateral borderline and reference line [m(x)] are shownin (B), and same process is applied for normal control[c(x)] and the results is shown in (E). When we takethe absolute differences between the reference and indi-vidual data, one obtains a typical data as shown in (C)and (F) for PD and normal control, respectively. Asshown, the difference of PD patient [|p(x) � m(x)|] ismuch larger than normal control [|c(x) � m(x)|] (thisexample is the case of P102 patient and C002 normalcontrol). Figure 3G shows a group difference, which iscalculated by SAD (Sc and Sp, referred this as undula-tion value for control and PD, respectively) of the indi-viduals divided by the number of control subjects and
patients who participated in the experiment. In case ofthe normal control, we averaged both (left and right)side, whereas in the case of the PD patient, we meas-ured only the most affected side value. As it is seen,the values were significantly different between the twogroups (P ¼ 0.0002) and show much higher value inthe PD patient than the normal control. Within eachPD and control groups, correlation analysis show thatthere is substantial age-dependent correlation as well,especially for the patients (see Fig. 3H). As seen, theundulation value of PD group (Sp) is larger than nor-mal control (Sc). When comparing the two correlationlines, the slope of the PD (0.314) is larger than that ofnormal control (0.117; see Fig. 3H).In addition to age-dependent correlation, we have
also measured UPDRS motor score dependent correla-tion, and the result is shown in Fig. 3I. In this case, wemeasured both side of the undulation value of SN (Sp)and UPDRS motor scores in PD patients. The UPDRSmotor scores are measured in the off medication stateand detailed scores are shown in Table 1. As the UPDRSmotor score increase, the undulation value also increased,and the slope of correlation line was 0.457. This
FIG. 2. The images of midbrain area from two typical normal controls and Parkinson’s patients. These two Parkinson’s cases (H&Y 1 and H&Y 3)show substantially serrated SN and their lateral boundaries compared with normal controls, suggesting that the SN of the PD patients mainly sufferdegeneration of the SN.
C H O E T A L .
716 Movement Disorders, Vol. 26, No. 4, 2011
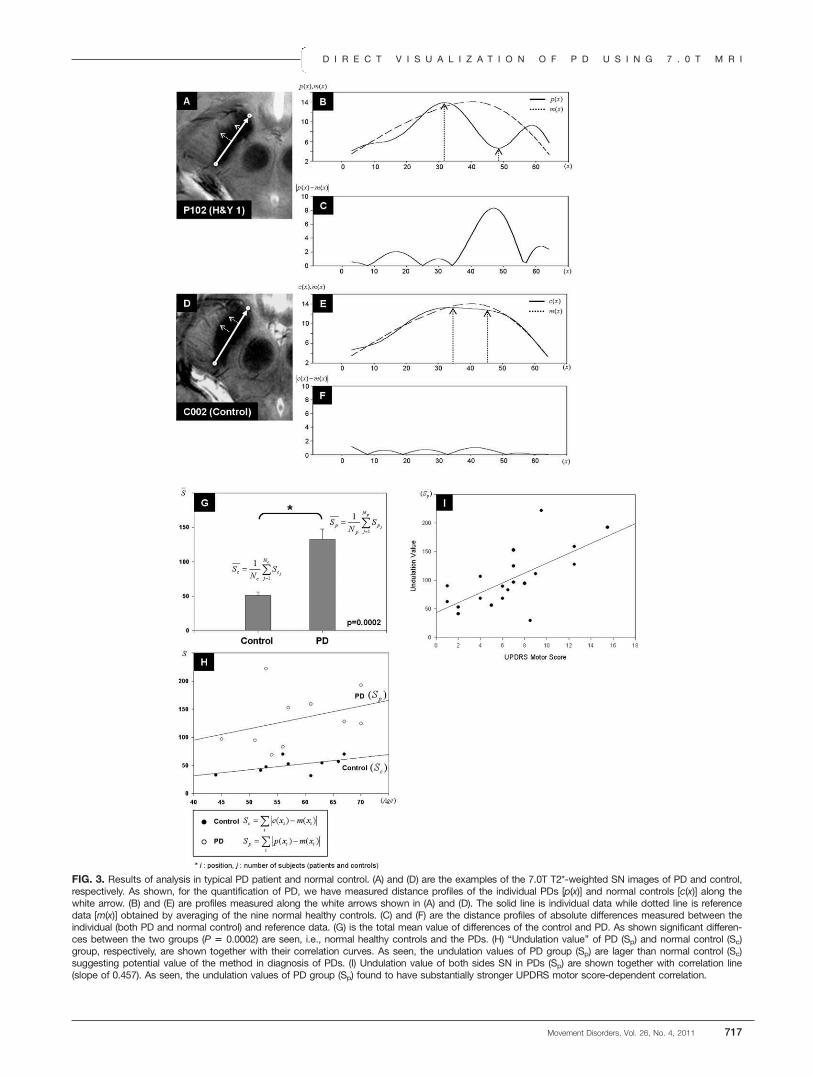
FIG. 3. Results of analysis in typical PD patient and normal control. (A) and (D) are the examples of the 7.0T T2*-weighted SN images of PD and control,respectively. As shown, for the quantification of PD, we have measured distance profiles of the individual PDs [p(x)] and normal controls [c(x)] along thewhite arrow. (B) and (E) are profiles measured along the white arrows shown in (A) and (D). The solid line is individual data while dotted line is referencedata [m(x)] obtained by averaging of the nine normal healthy controls. (C) and (F) are the distance profiles of absolute differences measured between theindividual (both PD and normal control) and reference data. (G) is the total mean value of differences of the control and PD. As shown significant differen-ces between the two groups (P 5 0.0002) are seen, i.e., normal healthy controls and the PDs. (H) ‘‘Undulation value’’ of PD (Sp) and normal control (Sc)group, respectively, are shown together with their correlation curves. As seen, the undulation values of PD group (Sp) are lager than normal control (Sc)suggesting potential value of the method in diagnosis of PDs. (I) Undulation value of both sides SN in PDs (Sp) are shown together with correlation line(slope of 0.457). As seen, the undulation values of PD group (Sp) found to have substantially stronger UPDRS motor score-dependent correlation.
D I R E C T V I S U A L I Z A T I O N O F P D U S I N G 7 . 0 T M R I
Movement Disorders, Vol. 26, No. 4, 2011 717
correlation analysis shows that there is substantialUPDRS motor score-dependent correlation. These statisti-cal results would obviously be useful in setting the crite-ria for diagnosis of PD patients in quantitative manner.
DiscussionThe most interesting and important finding of these
7.0T MR imaging study appears to be the clear visual-ization and eventual quantitation of PDs and normalcontrols based on the difference in the gross anatomi-cal shape and the quantitative undulation valuesbetween the controls and PDs. From the quantitativeobservation and quantitative analysis such as the undu-lation value, in vivo 7.0T T2*-weighted MR imagingcould provide direct visualization of morphological de-formation and quantitative estimation of the PDs fromthat of the normal controls in vivo. In this study, wehave a relatively small number of PD patients and onlytwo patients with more advanced PD. Therefore, thecorrelation analysis may be biased, particularly inundulation value of advanced PD. However, quantita-tive analysis with more patients may further improvethe results of correlation analysis and is subject offuture studies.One of the major difficulties in the past for the in
vivo diagnosis of PD has been the lack of clear imageof SNc and surroundings such as CC; therefore, thedifficulties in setting the quantitative diagnostic criteria.Most of the currently available diagnostic tools, suchthe lower field MRI, were simply insufficient for the di-agnosis of PD. Some investigators have attempted todiagnose PD patients using conventional MRI, but theresults were insufficient for practical use due to thelimited resolution and contrast of the images.11,13,22 Inconclusion, this study has demonstrated that by using7.0T MRI, one can visualize the pathologic features ofPD within the SN.
References1. Bjorklund A, Dunnett SB. Dopamine neuron systems in the brain:
an update. Trends Neurosci 2007;30:194–202.
2. Hornykiewicz O, Kish SJ. Biochemical pathophysiology of Parkin-son’s disease. Adv Neurol 1987;45:19–34.
3. Riederer P, Wuketich S. Time course of nigrostriatal degenera-tion in Parkinson’s disease. A detailed study of influential fac-tors in human brain amine analysis. J Neural Transm 1976;38:277–301.
4. Lang AE, Lozano AM. Parkinson’s disease. First of two parts.N Engl J Med 1998;339:1044–1053.
5. Hughes AJ, Daniel SE, Kilford L, Lees AJ. Accuracy of clinical di-agnosis of idiopathic Parkinson’s disease: a clinico-pathologicalstudy of 100 cases. J Neurol Neurosurg Psychiatry 1992;55:181–184.
6. Meara J, Bhowmick BK, Hobson P. Accuracy of diagnosis inpatients with presumed Parkinson’s disease. Age Ageing 1999;28:99–102.
7. DeKosky ST, Marek K. Looking backward to move forward: earlydetection of neurodegenerative disorders. Science 2003;302:830–834.
8. Rojas GM, Raff U, Quintana JC, Huete I, Hutchinson M. Imagefusion in neuroradiology: three clinical examples including MRIof Parkinson disease. Comput Med Imaging Graph 2007;31:17–27.
9. Hutchinson M, Raff U. Parkinson’s disease: a novel MRI methodfor determining structural changes in the substantia nigra. J Neu-rol Neurosurg Psychiatry 1999;67:815–818.
10. Hutchinson M, Raff U. Structural changes of the substantia nigrain Parkinson’s disease as revealed by MR imaging. AJNR Am JNeuroradiol 2000;21:697–701.
11. Minati L, Grisoli M, Carella F, De Simone T, Bruzzone MG,Savoiardo M. Imaging degeneration of the substantia nigra in Par-kinson disease with inversion-recovery MR imaging. AJNR Am JNeuroradiol 2007;28:309–313.
12. Graham JM, Paley MN, Grunewald RA, Hoggard N, Griffiths PD.Brain iron deposition in Parkinson’s disease imaged using thePRIME magnetic resonance sequence. Brain 2000;123(Pt 12):2423–2431.
13. Adachi M, Hosoya T, Haku T, Yamaguchi K, Kawanami T. Eval-uation of the substantia nigra in patients with Parkinsonian syn-drome accomplished using multishot diffusion-weighted MRimaging. AJNR Am J Neuroradiol. 1999;20:1500–1506.
14. Haacke EM, Ayaz M, Khan A, et al. Establishing a baseline phasebehavior in magnetic resonance imaging to determine normal vs.abnormal iron content in the brain. J Magn Reson Imaging. 2007;26:256–264.
15. Abduljalil AM, Schmalbrock P, Novak V, Chakeres DW.Enhanced gray and white matter contrast of phase susceptibility-weighted images in ultra-high-field magnetic resonance imaging. JMagn Reson Imaging 2003;18:284–290.
16. Duyn JH, van Gelderen P, Li TQ, de Zwart JA, Koretsky AP,Fukunaga M. High-field MRI of brain cortical substructure basedon signal phase. Proc Natl Acad Sci U S A 2007;104:11796–11801.
17. Fischl B, Wald LL. Phase maps reveal cortical architecture. ProcNatl Acad Sci U S A 2007;104:11513–11514.
18. Cho ZH, Kim YB, Han JY, et al. New brain atlas-mapping thehuman brain in-vivo with 7.0T MRI and comparison with post-mortem histology. Int J Imaging Systems Technol 2008;18:2–8.
19. Cho ZH, Han JY, Hwang SI, et al. Quantitative analysis of thehippocampus using images obtained from 7.0T MRI. Neuroimage2010;49:2134–2140.
20. Cho ZH, Min HK, Oh SH, et al. Direct visualization of deepbrain stimulation targets in Parkinson disease with the use of 7-tesla magnetic resonance imaging. J Neurosurg 2010;113:639–647.
21. Chen Z, Johnston LA, Kwon DH, Oh SH, Cho ZH, Egan GF. Anoptimised framework for reconstructing and processing MR phaseimages. Neuroimage 2010;49:1289–1300.
22. Oikawa H, Sasaki M, Tamakawa Y, Ehara S, Tohyama K.The substantia nigra in Parkinson disease: proton density-weighted spin-echo and fast short inversion time inversion-re-covery MR findings. AJNR Am J Neuroradiol 2002;23:1747–1756.
C H O E T A L .
718 Movement Disorders, Vol. 26, No. 4, 2011
Phenotype of the 202 AdenineDeletion in the parkin Gene: 40
Years of Follow-Up
Sharon Hassin-Baer, MD,1,2 Nobutaka Hattori, MD, PhD,3
Oren S. Cohen, MD,1,2 Magdalena Massarwa, MD,1 SimonD. Israeli-Korn, MA, MRCP (UK),1 and Rivka Inzelberg, MD1,2*
1The Sagol Neuroscience Center, Department of Neurology, Sheba
Medical Center, Tel Hashomer, Israel; 2Sackler Faculty of Medicine,
Tel Aviv University, Tel Aviv, Israel; 3Department of Neurology,
Juntendo University Medical School, Tokyo, Japan
ABSTRACTBackground: We describe the four decades follow-upof 14 parkin patients belonging to two large eight-gener-ation-long in-bred Muslim-Arab kindreds.
Results: All patients had a single base-pair of adeninedeletion at nucleotide 202 of exon 2 (202A) of the parkingene (all homozygous, one heterozygous). Parkinson’sdisease onset age was 17–68 years. Special featureswere intractable axial symptoms (low back pain, scoliosis,camptocormia, antecollis), postural tremor, and preservedcognition.
Conclusions: The 202A deletion of the parkin genecauses early-onset Parkinson’s disease with markedlevodopa/STN-DBS–resistant axial features. Posturaltremor and preserved cognition, even after 40 years ofdisease, were also evident. VC 2011 Movement DisorderSociety
Key Words: Parkinson’s disease; genetics; Parkin;PARK2; follow-up
IntroductionMutations in the parkin gene (6q25.2-6q27, MIM
602544) are the most common cause of monogenic
------------------------------------------------------------*Correspondence to: Dr. Rivka Inzelberg, The Sagol NeuroscienceCenter, Department of Neurology, Sheba Medical Center, Tel Hashomer,52621, Israel; [email protected].
Relevant conflicts of interest/financial disclosures: Nothing to report.Full financial disclosures and author roles may be found in the onlineversion of this article.
Received: 11 July 2010; Revised: 31 August 2010; Accepted: 3September 2010Published online 21 January 2011 in Wiley Online Library(wileyonlinelibrary.com). DOI: 10.1002/mds.23456
autosomal recessive Parkinson’s disease (PD).1,2 Thephenotype includes early onset of classic PD symptoms,but may vary with respect to additional atypical fea-tures.3–5 Exonic deletions or multiplications and trun-cating or missense mutations have been described.1–6
No reports point to ethnic clusters of specific parkinmutations. We describe four-decades follow-up of 14parkin patients belonging to two large in-bred Muslim-Arab kindreds.
MethodsPD patients of Arabic-origin with age of disease onset
< 50 years were recruited from the Sheba Medical Cen-ter Movement Disorders Clinic. The InstitutionalReview Board approved the use of human subjects forthis study. All patients and family members signedinformed consent for participating in the study.
Participants were examined by a movement disordersspecialist at 2–12 months intervals. Asymptomatic fam-ily members were examined once at the time of DNAcollection. DNA was extracted from blood leukocytes.All exons of the parkin gene were screened for dele-tions, insertions, or point mutations by direct sequenc-ing of the PCR products, sequenced on both strands aspreviously described.4
ResultsThirteen of 14 PD patients and 15 family members
consented to genetic testing. Patient characteristics aresummarized in Table 1 (10 men, 4 women; mean age52 6 10 years; range 35–73 years).
In all 13 patients, the same parkin mutation was found:a single base-pair deletion of adenine at nucleotide 202 ofexon 2 (202A), causing an out-frame mutation with anearly-stop codon (12 homozygous, 1 heterozygous) andone patient was not genotyped. The mutant parkin lacks apart of the Ubl domain and the entire region of the RINGbox, suggesting loss of activity of E3.
Phenotype and Clinical Course
All patients belong to two large Muslim-Arab in-bred hamulas (kindreds). Each hamula can trace theirancestry to a few founders about eight generations ago.Family A traced back five generations and divided intothree branches shown as Aa, Ab, and Ac Family Btraced back eight generations.
Mean age 6 SD at PD onset was 31 6 15 years(range 17–68) and disease duration 21 6 13 (median19, range 1–41 years) (Table 1). The first patient(B-VII-22) was seen in our clinic in 1963, aged 27years. She complained of ‘‘bent trunk’’ and slowingsince the age of 23. Her first cousin (B-VII-25) wasexamined in 1989, aged 19 years due to scolisois and
P H E N O T Y P E O F T H E 2 0 2 A D E L E T I O N I N T H E p a r k i n G E N E
Movement Disorders, Vol. 26, No. 4, 2011 719

bradykinesia. The diagnosis of juvenile-onset PD wasmade in both.The presenting symptom was hand tremor (n ¼ 6),
leg tremor (n ¼ 4), foot dystonia (n ¼ 1), camptocor-mia (n ¼ 1), and gait disturbances (n ¼ 1). Bradykine-sia and rigidity were present in all patients and resttremor in all but one. Eleven had postural handtremor, three limb dystonia (two at PD onset) andthree reported sleep benefit (Table 1).Atypical motor features included prominent levo-
dopa-resistant axial symptoms (n ¼ 10): recurrent fallsat onset (n ¼ 1), gait disturbances at onset (n ¼ 1),scoliosis (n ¼ 1), camptocormia (progressive to fixed90� trunk flexion, n ¼ 2), antecollis (n ¼ 1), lowerback pain (LBP) (n ¼ 8) (Table 2). Camptocormia and
antecollis 5 years after onset were observed in a hetero-zygous carrier with an intermediate PD phenotype(onset 49 years) and very slow disease progression.Pain was a predominant symptom (painful dystonia
¼ 2, LBP ¼ 8). Two patients manifested autonomicdysfuntion with complaints of constipation (Table 1).None of the patients developed significant cognitive
impairment or dementia during follow-up of up to 40years (median 19 years). Seven patients had depressivesymptoms but none develeoped hallucinosis or psychosis.
Response to Treatment and Progression
Levodopa response was excellent for appendicularsigns but only minor for axial signs. All patients devel-
Table 1. Demographic characteristics and motor features of Parkinson’s disease (PD) patients with the parkin 202Adeletion
Patient No.
Parkin 202A
deletion Gender Age
Age of
onset
PD
duration
H&Y
stage
Presenting
sign
Rest
tremor Rig. Asym Brad.
Post.
Inst.
Gait
dist.
Post.
tremor
Aa-II-3 HOM M 58 17 41 3 Hand tremor þ þ þ þ þ þ þAa-II-8 HOM M 50 15 35 4 Leg dystonia þ þ þ þ þ þ þAa-II-10 HOM F 48 47 1 2 Leg tremor þ þ þ þAa-II-11 HOM M 47 30 17 3 Leg tremor þ þ þ þ þ þ þAb-IV-14 NG M 73 68 5 3 Slow gait þ þ þ þ þ þAb-V-7 HOM F 47 18 29 3 Hand tremor þ þ þ þ þ þAc-IV-5 HOM F 35 17 18 4 Hand tremor þ þ þ þ þ þ þB-VII-8 HOM M 62 35 27 4 Leg tremor þ þ þ þ þB-VII-10 HOM M 59 28 31 4 Hand tremor þ þ þ þ þ þ þB-VII-13 HOM M 49 37 12 3 Leg tremor þ þ þ þ þB-VII-17 HOM M 44 30 14 3 Hand tremor þ þ þ þ þB-VII-22 HOM F 63 23 40 3 Camptocormia þ þ þ þ þ þ þB-VII-25 HOM M 39 19 20 3 Hand tremor þ þ þ þ þ þAa-II-6 HET M 55 49 6 2 Hand tremor þ þ þMean6SD 52610 31615 21613
HET, heterozygous; HOM, homozygous; NG, not genotyped; Rig, rigidity; Asym, asymmetry; Brad, bradykinesia; Post Inst, postural instability; Dist,disturbance; Post, postural.
Table 2. Nonmotor/atypical features and therapy-related features of Parkinson’s disease (PD) patients with the parkin202A deletion
Patient No. Psych.
Cognitive
decline
Sleep
benefit
Autonomic
features
Additional
axial features
Response to
levodopa
Wearing
off
Levodopa induced
dyskinesia
UPDRS III
(on/off)
DBS (Yr after
PD onset)
Aa-II-3 – þ þ þ 52Aa-II-8 DEP – þ þ þ þ 20/27 þ (30)Aa-II-10 – þ constip LBP NA NA NA 17/NAAa-II-11 – þ 46Ab-IV-14 – constip þ þ 38/41Ab-V-7 DEP – þ LBP þ þ þ 14Ac-IV-5 DEP – þ þ þ 48/61 þ (14)B-VII-8 DEP – LBP þ þ þ 16/22B-VII-10 DEP – LBP þ þ þ 37/64 þ (26)B-VII-13 DEP – LBP þ þ 4/20B-VII-17 – LBP þ þ 20/30B-VII-22 DEP – Camptocormia, LBP þ þ þ 37/48B-VII-25 – Scoliosis, LBP þ þ þ 16/28Aa-II-6 – Antecollis, Camptocormia NA NA NA NA
DEP, depression; constip, constipation; LBP, Lower back pain; NA, not applicable.
H A S S I N - B A E R E T A L .
720 Movement Disorders, Vol. 26, No. 4, 2011

oped motor fluctuations. Despite consistently very slowdisease progression, three patients developed severemotor fluctuations and underwent deep brain stimula-tion (STN-DBS) 14, 26, and 30 years after PD onset.Response to STN-DBS was modest with improvementin appendicular symptoms but no change in axial fea-tures, particularly postural instability, gait disorders,and LBP.
Genotype and Phenotype of NonparkinsonianFamily Members
Fifteen family members were genotyped. Five had nomutations and 10 were heterozygous, of whom ninewere asymptomatic (age range 28–40 years). One fam-ily member, (70 year-old female) with postural tremoronly (onset 60 years, B-VI-5), showed A-G hetero-zygosity for the 202A parkin deletion. Tremorremained her sole symptom during 10 years of follow-up and was levodopa unresponsive.
DiscussionThe marked axial nature is the most striking feature
of the parkin 202A deletion phenotype. This includescamptocormia, antecollis, scolisosis, and low back pain.Dystonia in PD manifests mainly in the limbs as equino-varus foot, striatal toe, ulnar deviation or hemidystoniaand in the mid-line as blepharospasm or oromandibulardystonia.7 Scoliosis, if considered a form of dystonia, isalso seen. Camptocormia is a rare feature of PD and isattributed to dystonia or imbalance in muscle activ-ity.3,6–8 We postulate that LBP is part of the dystonicphenotype. In our patients, axial symptoms were painfuland levodopa/STN-DBS unresponsive.A second main characterisitic of the 202A parkin de-
letion phenotype was the preserved cognition after sev-eral decades since PD onset. Lack of dementiacharacterizes parkin disease.9 To our knowledge longterm follow-up up to 40 years has not yet beendescribed. It has been suggested that the lack of de-mentia in parkin disease may be related to the absenceof Lewy body pathology.9 Hayashi et al. reported neu-ropathologic findings in a Japanese patient with a muta-tion in the parkin gene.10 Loss of pigmented neuronsand gliosis were most pronounced in the medial and ven-trolateral regions of the SN pars compacta and in thelocus ceruleus. There was no clinical evidence of demen-tia and no Lewy bodies were identified. Some neurofi-brillary tangles and senile plaques were observed in thecerebral cortex. Another study also found diffuse tau pa-thology but no Lewy bodies.11 Neuropsychiatric distur-bances are reportedly common in carriers for parkin orPINK1 mutations.12,13 The 202A phenotype commonlyincluded depression.There is controversy whether heterozygous carriers
of parkin mutations are symptomatic and whether par-kin is a susceptibility gene.14,15 One of our heterozy-
gous patients (onset 49 years) developed a mildphenotype but with antecollis and camptocormia.Another heterozygous family member presented solelywith postural tremor (onset 60 years) with no otherparkinsonian features during 10 years of follow-up.While homozygous mutations in the parkin gene resultin early-onset PD, heterozygous mutations in the par-kin gene are identified in patients with later-onset dis-ease, raising the possibility that heterozygousmutations may have a role beyond that of loss of func-tion and confer an increased susceptibility to thedisease.15
The risk of developing PD in individuals with muta-tions in the parkin gene is age-dependent and pene-trance remains unclear. Our asymptomatic carrierswere aged 28–40 years and need to be further fol-lowed. A recent study identified mutations in the par-kin gene in 10% of probands with disease onset beforeage 50.16 They estimated the cumulative incidence ofPD to age 65 years in relatives of mutation carriers tobe 7%, compared to 1.7% in noncarrier relatives, and1.1% in relatives of controls.Periquet and coworkers analyzed parkin gene inheri-
tance to discriminate between single founder effectsand independent recurrent events by the use of intra-genic and tightly flanking markers of the parkin generegion.17 By studying a variety of parkin mutations in48 European families they showed that the majority ofexon rearrangements result from distinct mutationalevents, whereas point mutations may have arisen froma limited number of founders suggesting differentmechanisms underlying these two groups of mutations.According to this hypothesis, the frequency of exonrearrangements would be expected, in the absence ofselection, to increase with the passage of time becauseof new mutational events, whereas the frequency ofpoint mutations as in our patients would be expectedto remain stable, because new mutations would berare. In this context, the 202A deletion, being a pointmutation, could be related to a founder effect whichpersisted because of high rates of consanguinity in thispopulation.The fact that all patients in our two kindreds carry
the same mutation suggests that it might be commonamong young-onset PD patients of Arabic descent.Indeed, the 202A deletion has also been observed amongJordanian patients.17 However, the exact phenotype inthis population has not been specified. While PD preva-lence above the age of 65 years in Arab villages in Israelis similar to that of Western populations,18 neither theprevalence of parkin mutations nor its impact on PDprevalence in young adults is known. In our studied pop-ulation of Muslim Arab villages with large in-bred kin-dreds, carrier frequencies may be high.Our phenotypic observations might be useful for
raising the suspicion and recognition of carriers of the
P H E N O T Y P E O F T H E 2 0 2 A D E L E T I O N I N T H E p a r k i n G E N E
Movement Disorders, Vol. 26, No. 4, 2011 721
parkin 202A deletion mutation among young-onsetPD patients with Arabic ancestry. Postural tremor,prominent and/or painful axial features, slowness ofprogression of motor symptoms and preservation cog-nitive function are strong clues to parkin disease.
References1. Lucking CB, Durr A, Bonifati V, et al. Association between early-
onset Parkinson’s disease and mutations in the parkin gene.N Engl J Med 2000;342:1560–1567.
2. Kann M, Jacobs H, Mohrmann K, et al. Role of parkin mutationsin 111 community-based patients with early-onset parkinsonism.Ann Neurol 2002;51:621–625.
3. Inzelberg R, Hattori N, Nisipeanu P, et al. Camptocormia, axialdystonia, and parkinsonism: phenotypic heterogeneity of a parkinmutation. Neurology 2003;60:1393–1394.
4. Nisipeanu P, Inzelberg R, Abo Mouch S, et al. Parkin gene causingbenign autosomal recessive juvenile parkinsonism. Neurology2001;56:1573–1575.
5. Nisipeanu P, Inzelberg R, Blumen SC, et al. Autosomal-recessivejuvenile parkinsonism in a Jewish Yemenite kindred: mutation ofParkin gene. Neurology 1999;53:1602–1604.
6. Kitada T, Asakawa S, Hattori N, et al. Mutations in the parkingene cause autosomal recessive juvenile parkinsonism. Nature1998;392:605–608.
7. De Yebenes JC PR, Taberno C. Symptomatic dystonias. In: WattsRL,Koller KW, editors. Movement disorders neurologic principlesand practice. New York:McGrawHill;1997. p 455–475.
8. Djaldetti R, Mosberg-Galili R, Sroka H, Merims D, Melamed E.Camptocormia (bent spine) in patients with Parkinson’s disease—characterization and possible pathogenesis of an unusual phenom-enon. Mov Disord 1999;14:443–447.
9. Inzelberg R, Polyniki A. Are genetic and sporadic Parkinson’s dis-ease patients equally susceptible to develop dementia? J Neurol Sci2010;289:23–26.
10. Hayashi S, Wakabayashi K, Ishikawa A, et al. An autopsy case ofautosomal-recessive juvenile parkinsonism with a homozygousexon 4 deletion in the parkin gene. Mov Disord 2000;15:884–888.
11. van de Warrenburg BP, Lammens M, Lucking CB, et al. Clinicaland pathologic abnormalities in a family with parkinsonism andparkin gene mutations. Neurology 2001;56:555–557.
12. Ephraty L, Porat O, Israeli-Korn SD, et al. Neuropsychiatric andcognitive features in autosomal-recessive early parkinsonism dueto PINK1 mutations. Mov Disord 2007;22:566–569.
13. Kubo S, Hattori N, Mizuno Y. Recessive Parkinson’s disease. MovDisord 2006;21:885–893.
14. Inzelberg R, Hattori N, Mizuno Y. Dopaminergic dysfunction inunrelated, asymptomatic carriers of a single parkin mutation. Neu-rology 2005;65:1843.
15. Klein C, Lohmann-Hedrich K, Rogaeva E, Schlossmacher MG,Lang AE. Deciphering the role of heterozygous mutations in genesassociated with parkinsonism. Lancet Neurol 2007;6:652–662.
16. Wang Y, Clark LN, Louis ED, et al. Risk of Parkinson disease incarriers of parkin mutations: estimation using the kin-cohortmethod. Arch Neurol 2008;65:467–474.
17. Myhre R, Steinkjer S, Stormyr A, et al. Significance of the parkinand PINK1 gene in Jordanian families with incidences of young-onset and juvenile parkinsonism. BMC Neurol 2008;8:47.
18. Glik A, Masarwa M, Abuful A, et al. Essential tremor might beless frequent than Parkinson’s disease in North Israel Arab vil-lages. Mov Disord 2009;24:119–122.
LINGO1 Gene Analysis inParkinson’s Disease Phenotypes
Oswaldo Lorenzo-Betancor, MD,1,2 Lluıs Samaranch, PhD,1
Elena Garcıa-Martın, MD, PhD,3,4 Sebastian Cervantes, MD,1,2
Jose A.G. Agundez, MD, PhD,4,5 Felix J. Jimenez-Jimenez,MD, PhD,6,7 Hortensia Alonso-Navarro, MD, PhD,8
Antonio Luengo, MD,9 Francisco Coria, MD, PhD,10
Elena Lorenzo, BSc,1 Jaione Irigoyen, RN,2,11
Pau Pastor, MD, PhD1,2,11* The Iberian Parkinson’s DiseaseGenetics Study Group Researchers
1Division of Neurosciences, Neurogenetics Laboratory, Center forApplied Medical Research, University of Navarra, Pamplona, Spain;2Department of Neurology, Clınica Universidad de Navarra, University
of Navarra School of Medicine, Pamplona, Spain; 3Biochemistry and
Molecular Biology, School of Biological Sciences, University of
Extremadura, Badajoz, Spain; 4RIRAAF/RETICS, Redes Tematicas de
Investigacion Cooperativa en Salud, Instituto de Salud Carlos III,
Spain; 5Department of Pharmacology, Medical School, University of
Extremadura, Badajoz, Spain; 6Department of Medicine-Neurology,
Hospital Prıncipe de Asturias, Universidad de Alcala, Madrid, Spain;7Department of Neurology, Hospital del Sureste, Arganda del Rey,
Madrid, Spain; 8Department of Neurology, Hospital La Mancha-
Centro de Alcazar de San Juan, Ciudad Real, Spain; 9Service of
Neurology, Hospital Universitario La Princesa, Madrid, Spain; 10Clinic
for Nervous System Disorders and Service of Neurology, Hospital
Universitario Son Dureta, Palma de Mallorca, Spain; 11CIBERNED,
Centro de Investigacion Biomedica en Red de Enfermedades
Neurodegenerativas, Instituto de Salud Carlos III, Spain
ABSTRACTBackground: Parkinson’s disease (PD) and essentialtremor (ET) may share some etiopathogenic factors. Agenome-wide association study has shown that LINGO1gene variants are associated with increased risk of ET.We hypothesized that LINGO1 variants could increasesusceptibility to PD. Methods: A large series of PD sub-jects and healthy controls were genotyped for rs9652490and rs11856808 LINGO1 single nucleotide polymor-phisms (SNPs). Results: We found an increased fre-quency of the rs11856808T/T genotype in PD comparedwith controls (odds ratio 5 1.46; corrected P value 50.02). A recessive genetic model was the best fit forrs11856808 influence on PD (recessive gene action test:corrected P value 5 0.01). Stratification analysis showedthat rs11856808T/T genotype frequency was higher in thetremor-dominant PD and the classical PD (C-PD) sub-groups (recessive gene action test for the C-PD sub-group: corrected P value 5 0.004). Discussion: Ourresults indicate that LINGO1 variants could increase riskof PD, specifically those presenting the non-rigid-akineticphenotypes, which suggests that LINGO1 may have arole in the etiology of tremor in PD at least in the Spanishpopulation. VC 2011Movement Disorder Society
Key Words: Parkinson’s disease; LINGO1; essentialtremor; genetics; association study
P A S T O R E T A L .
722 Movement Disorders, Vol. 26, No. 4, 2011
Parkinson’s disease (PD) is one of the most fre-quent neurodegenerative diseases with a prevalence of1–2% among individuals over the age of 60 years.1
PD is due to the loss of dopaminergic neurons andpresence of Lewy bodies in several brain areas, mainlyin the substantia nigra pars compacta. The identifica-tion of genes associated with Mendelian inheritedforms of PD supports the hypothesis that othergenetic risk factors can also be associated with spo-radic PD.2
Although essential tremor (ET) and PD are differentneurological disorders, some evidence suggests thatthey may share common etiologic factors. In fact, rela-tives of subjects with tremoric PD have a fourfoldincrease in the prevalence of postural tremor comparedwith healthy controls.3–5 Additionally, brainstem Lewybodies have been described in some ET brains.6,7
Recently, a genome-wide association study (GWAS)showed that two intronic single nucleotide polymor-phisms (SNPs), rs9652490 and rs11856808, ofLINGO1 gene (Leucine-rich repeat and Ig domaincontaining Nogo receptor-interacting protein 1; OMIMref no. 609791) were associated with ET.8 LINGO-1 isa transmembrane protein that contains 12 leucine-richrepeat domains, an immunoglobulin domain and ashort cytoplasmic tail encoded by a gene located onchromosome 15q24.9 LINGO-1 expression is elevatedin the substantia nigra of PD subjects compared withcontrols.10 In addition, dopaminergic neurons ofLINGO1 knockout mice are protected against degen-eration.10 Thus, LINGO1 seems to be a candidategene for modifying PD risk. We genotyped twoLINGO1 gene variants that have been previously asso-ciated with ET, to investigate whether LINGO1 var-iants could increase the risk of PD and its differentsubphenotypes in the Spanish population.
Subjects and MethodsSubjects were recruited from seven centers in Spain
and included 721 PD individuals and 1,117 healthy con-trols. Recruitment data are reflected in the SupportingInformation file 1. Selection criteria for PD included bra-dykinesia and at least one of the following: rigidity, rest-ing tremor, postural instability, positive response to
dopaminergic therapy, and absence of atypical featuresor other causes of parkinsonism.11 When informationwas available, PD subjects were divided into three differ-ent groups: tremor-dominant PD (TD-PD), classical PDphenotype (C-PD), and akinetic-rigid PD (AR-PD; Table1).12 The sample included 171 individuals with early-onset PD [EOPD; age at onset (AAO) < 50 years], and550 subjects with late-onset PD (LOPD; AAO � 51years; Supporting Information Table 1). Given that thesamples came from different regions of Spain to avoidinfluence of subpopulation differences on the results, weperformed a reanalysis based on the geographical locationof the individuals recruited, stratifying the sample intonorthern and southern Spain (Tables 2 and Supporting In-formation Table 5 and Fig. 1).Two intronic polymorphisms of LINGO1 gene,
rs9652490 and rs11856808, which had previouslybeen associated with ET, were selected for genotyping.8
Genotype success rate was over 96.7%. Genotypingmethods are reflected in the Supporting Informationfile 1.Pair-wise linkage disequilibrium (LD) D0 and r2
measurements between rs9652490 and rs11856808were calculated using Haploview software (http://www.broad institute.org/haploview/haploview).13
Hardy–Weinberg equilibrium (HWE) analysis and‘‘goodness-of-fit’’ test are described in the SupportingInformation (Supporting Information file 1). Allelicand genotype frequency analysis and alternate/fullmodel association tests were performed with PLINKv.1.07 software (Shaun Purcell; http://pngu.mgh.har-vard.edu/purcell/plink/).14 Multiple test correction wasperformed with Westfall and Young’s step-downmax(T) permutation procedure implemented in PLINKv.1.07 by running 100,000 permutations within eachgroup.14 Level of statistical significance was consideredat corrected P values � 0.05. Haplotype analysis andinfluence of LINGO1 variants on the AAO aredetailed in the Supporting Information file 1.To replicate the association found by our group in
additional populations, we performed a meta-analysisbased on genotype data of the two LINGO1 SNPsfrom two GWAS in PD and controls15,16 using theMeta-Disc v. 1.1.1 program (http://www.hrc.es/investi-gacion/metadisc.html; Biostatistics Unit, HospitalRamon y Cajal, Madrid, Spain).
ResultsNo deviation from HWE was found for rs9652490 in
PD or control group. However, a significant departurefrom HWE was observed among PD individuals forrs11856808 (n ¼ 721; P value ¼ 0.03, Pearson), but notin control group. Goodness-of-fit test, considering a dis-ease prevalence of 0.01, showed the highest nonsignifi-cant v2 for rs11856808 under a recessive genetic model(v2 ¼ 2.48; P value ¼ 0.29 with 2 df) suggesting that the
------------------------------------------------------------Additional Supporting Information may be found in the online version ofthis article.
*Correspondence to: Dr. Pau Pastor, Neurogenetics Laboratory, Divisionof Neurosciences, Center for Applied Medical Research (CIMA), Universityof Navarra, Pıo XII 55, Pamplona 31008, Spain; [email protected].
Relevant conflicts of interest/financial disclosures: Nothing to report.Full financial disclosures and author roles may be found in the onlineversion of this article.
Received: 6 May 2010; Revised: 4 August 2010; Accepted: 7September 2010Published online 4 January 2011 in Wiley Online Library(wileyonlinelibrary.com). DOI: 10.1002/mds.23452
L I N G O 1 V A R I A N T S I N P D S U B P H E N O T Y P E S
Movement Disorders, Vol. 26, No. 4, 2011 723

rs11856808 HWE departure in PD subjects was a conse-quence of a real genotype association.17 Analysis of ge-notype frequency distribution showed thatrs11856808T/T frequency was higher in PD subjects thanin controls [odds ratio (OR) ¼ 1.46; 95% confidenceinterval (CI) ¼ 1.06–2.02; corrected P value ¼ 0.02; Ta-ble 2)] Alternate/full model association tests confirmedthat the rs11856808 association with PD was explainedby a recessive genetic model (corrected P value ¼ 0.01;Supporting Information Table 3).Stratification analysis of PD sample according to sub-
phenotypes showed that rs11856808T/T genotype fre-quency was only significant in the C-PD phenotypegroup (OR ¼ 1.74; 95% CI ¼ 1.19–2.56; corrected Pvalue ¼ 0.01; Table 2), which followed a recessivemodel (corrected P value ¼ 0.004; Supporting Informa-tion Table 3). Interestingly, although nonsignificant,the highest rs11856808T/T genotype frequency wasobserved among the TD-PD subgroup (16.7%) suggest-ing that we cannot exclude an effect of rs11856808T/T
on this PD subtype owing to the small sample size (n¼ 30). We found no significant allelic associationbetween LINGO1 SNPs and the entire PD samplecompared with controls (Table 2).As previous reports suggested that subjects with
TD-PD and C-PD phenotype may have an earlierAAO than the AR-PD group,18 we aimed to analyzewhether the overrepresentation of rs11856808T/T ge-notype in the C-PD subgroup was influenced by sub-jects with an earlier AAO within this group. Weperformed Kaplan–Meier survival analysis consideringrecessive, dominant, and additive models, whichshowed no influence of LINGO1 variants on theAAO (data not shown). Additionally, stratificationanalysis according to the AAO showed a trend for thers11856808T/T genotype in both the EOPD and theLOPD groups compared with controls (OR ¼ 1.31;95% CI ¼ 0.77–2.22; corrected P value ¼ 0.06 andOR ¼ 1.51; 95% CI ¼ 1.07–2.15; corrected P value¼ 0.06, respectively; Supporting Information Table4). However, after considering only the individualswith the C-PD phenotype in both groups, EOPD and
LOPD, we observed an overrepresentation ofrs11856808T allele and rs11856808T/T genotype fre-quencies in the LOPD C-PD group compared withcontrols (corrected P ¼ 0.02; for both, allelic and ge-notype tests) but found no allelic or genotype associa-tion for the EOPD C-PD group.Given the different geographical origin of the sam-
ples across Spain, we wanted to investigate whetherthere were any regional differences. As the Spanishpopulation is largely homogeneous,19 we arbitrarilystratified our population into a northern and southernSpanish population (Supporting Information Fig. 1).Breslow–Day test14 was used to investigate
between cluster heterogeneity and the test of the ho-mogeneity of OR tests based on partitioning the v2
statistic, which was used to analyze the heterogeneityof the association. Both tests are complemented inPLINK.14
Breslow–Day test for homogeneity showed no sig-nificant differences in the allelic ORs of rs9652490and rs11856808 between the northern and southernSpanish population (data not shown; P values> 0.2),suggesting the absence of population substructure.However, when both subpopulations were analyzedseparately by a v2 test, significant differences wereobserved in rs11856808 allelic association in thesouthern subpopulation (OR ¼ 1.39; corrected Pvalue ¼ 0.04) (Supporting Information Table 5).Interestingly, the recessive gene action test for thers11856808T/T genotype was also significant in thesouthern Spanish population (corrected P value ¼0.004; data not shown) but not in the northern Span-ish population. As rs9652490 and rs11856808 werein high LD (D0 ¼ 0.992 and r2 ¼ 0.455), we per-formed a haplotype analysis that showed no differen-ces between the PD group and controls (SupportingInformation Table 6).Rs9652490 and rs11856808 meta-analysis of two
PD GWAS15,16 and our study, accounting for 2,564PD subjects and 5,018 controls, showed no differencesin allelic or genotype distribution frequencies betweencases and controls (Supporting Information Fig. 2).
Table 1. Demographic data of the sample
Group Controls (n ¼ 1,117)
PD
Entire PD (n ¼ 721) TD-PD (n ¼ 30) C-PD (n ¼ 361) AR-PD (n ¼ 104) Unclassifiable PDa (n ¼ 226)
Age (yr), mean (SD) 63.59 (14.55) 66.96 (10.59) 69,50 (8.18) 67.06 (10.68) 66.00 (10.79) 67.41 (11.99)Age range (yr) 17–104 22–95 49–87 22–95 39–87 41–88AAO (y), mean (SD) NA 59.53 (12.51) 62.95 (8.24) 57.55 (11.58) 56.81 (11.59) 63.47 (13.72)AAO range (y) NA 17–90 46–76 17–84 34–84 18–90Female (%) 49.4 42.0 40 36.8 41.3 50.9
aPD subjects with no information on motor features available.PD, Parkinson’s disease; TD-PD, tremor-dominant PD; C-PD, classical PD phenotype; AR-PD, akinetic-rigid PD; AAO, age at onset; SD, standard deviation;NA, data not available.
P A S T O R E T A L .
724 Movement Disorders, Vol. 26, No. 4, 2011
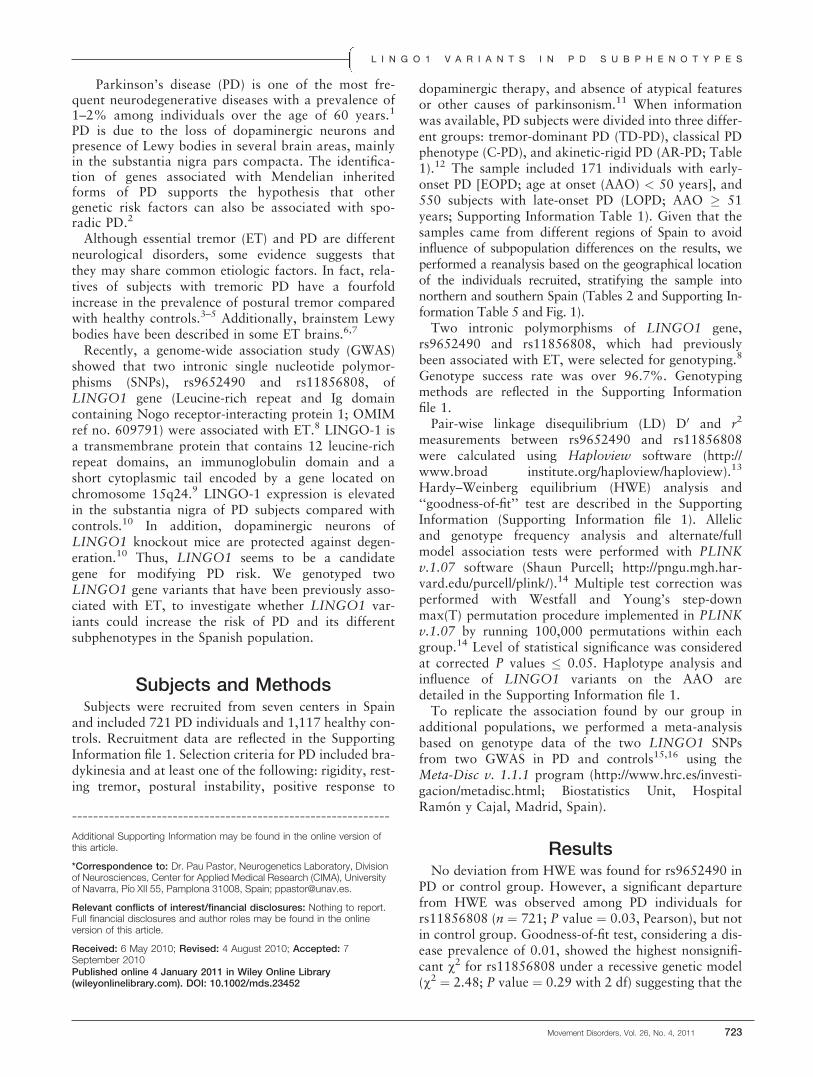
Table
2.Allelic
andgenotypefrequencydistributionofLINGO1variants
Group
Controls
(n¼
1,117)
Entire
PD
sample
(n¼
721)
TD-P
D(n
¼30)
C-P
D(n
¼361)
AR-P
D(n
¼104)
UNK-P
D(n
¼226)
rs9652490
allele
a/
genotypes
GAA
AG
GG
GAA
AG
GG
GAA
AG
GG
GAA
AG
GG
GAA
AG
GG
GAA
AG
GG
Freq./count
(freq.)
0.171
750
(0.682)
324
(0.295)
26(0.024)
0.192
461
(0.655)
216
(0.307)
27(0.038)
0.183
20(0.667)
9(0.300)
1(0.033)
0.199
229
(0.638)
117
(0.326)
13(0.036)
0.158
72(0.713)
26(0.257)
3(0.030)
0.196
140
(0.654)
64(0.299)
10(0.047)
OR[95%
CI]
1.15
[0.97
–1.37]
Ref
1.09
[0.88
–1.34]
1.69
[0.97
–2.93]
1.09
[0.56
–2.11]
Ref
1.04
[0.47
–2.31]
1.44
[0.19
–11.16]
1.21
[0.97
–1.50]
Ref
1.18
[0.91
–1.53]
1.64
[0.83
–3.24]
0.91
[0.62
–1.35]
Ref
0.84
[052
–1.33]
1.20
[0.35
–4.07]
1.18
[0.91
–1.54]
Ref
1.06
[0.77
–1.46]
2.06
[0.98
–4.37]
Pvalueb
0.11
0.15
0.80
0.94
0.09
0.20
0.65
0.70
0.21
0.16
Pvaluec
0.18
0.25
0.96
0.91
0.14
0.31
0.85
0.88
0.32
0.22
rs11856808
allelea /
genotypes
TCC
CTTT
TCC
CTTT
TCC
CTTT
TCC
CTTT
TCC
CTTT
TCC
CTTT
Freq./count
(freq.)
0.312
498
(0.463)
484
(0.450)
94(0.087)
0.332
326
(0.464)
286
(0.407)
90(0.128)
0.367
13(0.433)
12(0.400)
5(0.167)
0.353
158
(0.439)
150
(0.417)
52(0.144)
0.291
53(0.515)
40(0.388)
10(0.097)
0.311
102
(0.488)
84(0.402)
23(0.11)
OR[95%
CI]
1.09
[0.95
–1.26]
Ref
0.90
[0.74
–1.11]
1.46
[1.06
–2.02]
1.28
[0.75
–2.17]
Ref
0.95
[0.43
–2.10]
2.04
[0.71
–5.85]
1.20
[1.00
–1.43]
Ref
0.98
[0.76
–1.26]
1.74
[1.19
–2.56]
0.91
[0.66
–1.24]
Ref
0.78
[0.50
–1.19]
0.99
[0.49
–2.03]
0.99
[0.79
–1.25]
Ref
0.84
[0.62
–1.16]
1.20
[0.72
–1.98]
Pvalueb
0.22
0.01
0.38
0.32
0.04
0.008
0.53
0.48
0.96
0.34
Pvaluec
0.34
0.02
0.56
0.39
0.07
0.01
0.73
0.65
0.99
0.46
PD,Parkinson’s
disease;TD-P
D,tremor-dominantPD;C-P
D,classicalPD
phenotype;AR-P
D,Akinetic-rigid
PD;UNK-P
D,UnknownPD
phenotype;Freq.,Frequency;CI,confidenceinterval;OR,oddsratio.
aMinorallele
frequency.
bUncorrectedPvaluesforgenotypetest.
cCorrectedPvaluesafterWestfall–Youngmax(T)step-downprocedure
(100,000perm
utations).CorrectedPvalues�
0.05are
highlig
htedin
bold.

DiscussionWe analyzed two LINGO1 variants that have been
previously associated with increased ET risk in subjectswith PD from a Spanish population. Since the firstassociation of LINGO1 gene with ET was described,8
the analysis of subsequent independent ET series repli-cated the association in some of them.8,20–23 Giventhat PD and ET could potentially share some etiologicfactors, we investigated the role of LINGO1 variantsin PD risk. Although we found no significant allelicassociation, we observed an increased frequency ofrs11856808T/T carriers among PD subjects comparedwith controls. rs11856808T/T frequency was signifi-cantly higher after comparing the C-PD phenotype sub-group with controls, but differences in rs11856808genotype frequency distribution were not statisticallysignificant after considering other PD subgroups’ com-parisons with controls (Table 2). The observedrs11856808T/T genotype frequency in our sample thatled to a departure from HWE in the PD group but notin controls was explained by a recessive model of herit-ability for rs11856808T allele.17 This fact supports thenotion that the increased rs11856808T/T frequency inPD could be a result of an association between PD andrs11856808 rather than caused by the populationstructure or by possible genotyping errors. Moreover, arecessive model as best fit for rs11856808 variant wasconfirmed with recessive gene action analysis ofPLINK, when comparing the entire PD group or theC-PD subgroup versus controls (Supporting Informa-tion Table 3). Although the first study of LINGO1variants suggested that a multiplicative model explainsbetter rs11856808 association with ET,8 our findingsare consistent with more recent series in whichrs9652490 association with ET followed a recessivemodel.21–23 The direction of effect of the PD riskrs11856808T allele seen in our series is also consistentwith that seen in the later studies where similar ORswere observed.8,21 Our findings suggest that LINGO1variability may influence both ET and PD. Wehypothesize that the high proportion of PD patientswith predominant tremor in our series could be respon-sible for the recessive genetic model observed in our se-ries. We found no difference in genotype and allelicfrequencies between EOPD and LOPD, but the associa-tion with LINGO1 was observed in the LOPD C-PDgroup and not in the EOPD C-PD group, suggestingthat LINGO1 influence could be dependent upon ageand PD phenotype.A previous study described a significant association
between rs9652490A allele and PD in two different se-ries of PD from North America and Norway.24 How-ever, the results of the latter study were based on ananalysis of a pooled sample set in which the controlgroup showed a strong HWE departure (P value ¼0.007, Pearson); hence, the assumption of associationcan be argued. Haubenberger et al.25 failed to replicate
the rs9652490A allele association with PD in the Aus-trian population. However, as observed in our PD sam-ple, rs9652490G/G genotype frequency was higheramong PD subjects than in controls. Additionally, theAustrian study followed different selection criteriawhen dividing PD patients into motor subgroups.25
Indeed, they included PD individuals within their non-TD-PD group that we would have considered as havingC-PD or AR-PD. Subsequently, they could have misseda potential rs9652490G/G effect in the PD patients withmild to moderate rest tremor. Recently, another studyshowed that rs9652490G allele was not associated withPD in the Polish population, but their results should beinterpreted with caution, as their sample size wassmaller than ours.26
Reanalysis of our series according to their geo-graphical origin showed no population stratificationin the series, although only the southern populationshowed significant differences in allelic and genotypefrequencies between PD and controls (Supporting In-formation Table 5). However, we are aware that ini-tial diagnostic errors between PD and ET can be apossible source of confusion in our study. It is notuncommon that a PD patient is diagnosed as havingET and vice versa in the initial and even in laterstages of disease.27–29 In fact, a study showed that�33% of subjects with ET had a wrong initial diag-nosis, being PD the most frequent source of misdiag-nosis throughout the follow-up.29 Moreover, it hasbeen described that ET subjects can show certaindegree of bradykinesia.30
Our results support the hypothesis that LINGO1gene variants could have a role in the risk of develop-ing PD in the Spanish population, especially amongthose with non-rigid-akinetic PD phenotypes. Themeta-analysis of this study, which also included previ-ously published data, suggested that LINGO1 is not amajor risk factor for PD in Caucasian population (Ta-ble 7 and Fig. 2 of Supporting Information). How-ever, LINGO1 gene variants may still behave as riskfactors for PD and/or PD subtypes with predominanttremor in specific populations, like that of Spain.However, we should be cautious about our results,which need to be replicated in other well-character-ized PD series.
APPENDIX
The Iberian Parkinson’s Disease GeneticsStudy Group Researchers
Julian Benito-Leon (Department of Neurology, Hospi-tal Doce de Octubre, Madrid, and CIBERNED, Spain);Marıa R. Luquin, Jose A. Obeso, Marıa A. Pastor, M-ario Riverol, and Marıa C. Rodrıguez-Oroz (Depart-ment of Neurology, Clınica Universitaria de Navarra,University of Navarra Medical School, and
P A S T O R E T A L .
726 Movement Disorders, Vol. 26, No. 4, 2011

CIBERNED, Spain); Elena Erro (Department of Neu-rology, Hospital de Navarra); Mario Ezquerra, MarıaJ. Martı, and Eduardo Tolosa (Movement Disorders U-nit, Department of Neurology, Hospital Clinic, Barce-lona and CIBERNED, Spain).
Acknowledgments: Dr. Samaranch held a ‘‘Torres Quevedo’’ fellowshipfrom the Spanish Ministry of Science and Technology, co-financed by theEuropean Social Fund. This study was supported by a grant from theSpanish Ministry of Education and Science (SAF2006-10126: 2006-2009)and UTE project FIMA, Spain (to P.P.), by a grant from the Fondo deInvestigacion Sanitaria, Instituto de Salud Carlos III (06/1252), Spain (toE.G.M.), and by a grant from Instituto de Salud Carlos III (RD2007-0064-0016), Spain (to J.A.G.A.). We thank the participants in the studyfor their collaboration.
References1. de Rijk MC, Launer LJ, Berger K, et al. Prevalence of Parkinson’s
disease in Europe: a collaborative study of population-basedcohorts. Neurologic Diseases in the Elderly Research Group. Neu-rology 2000;54(11Suppl 5):S21–S23.
2. Douglas MR, Lewthwaite AJ, Nicholl DJ. Genetics of Parkin-son’s disease and parkinsonism. Expert Rev Neurother 2007;7:657–666.
3. Jankovic J, Beach J, Schwartz K, Contant C. Tremor and longevityin relatives of patients with Parkinson’s disease, essential tremor,and control subjects. Neurology 1995;45:645–648.
4. Louis ED, Levy G, Mejia-Santana H, et al. Risk of action tremorin relatives of tremor-dominant and postural instability gait disor-der PD. Neurology 2003;61:931–936.
5. Benito-Leon J, Louis ED, Bermejo-Pareja F. Risk of incidentParkinson’s disease and parkinsonism in essential tremor: a pop-ulation based study. J Neurol Neurosurg Psychiatry 2009;80:423–425.
6. Louis ED, Honig LS, Vonsattel JP, Maraganore DM, Borden S,Moskowitz CB. Essential tremor associated with focal nonnigralLewy bodies: a clinicopathologic study. Arch Neurol 2005;62:1004–1007.
7. Louis ED, Faust PL, Vonsattel JP, et al. Neuropathologicalchanges in essential tremor: 33 cases compared with 21 controls.Brain 2007;130(Pt 12):3297–3307.
8. Stefansson H, Steinberg S, Petursson H, et al. Variant in thesequence of the LINGO1 gene confers risk of essential tremor.Nat Genet 2009;41:277–279.
9. Mi S, Lee X, Shao Z, et al. LINGO-1 is a component of theNogo-66 receptor/p75 signaling complex. Nat Neurosci 2004;7:221–228.
10. Inoue H, Lin L, Lee X, et al. Inhibition of the leucine-rich repeatprotein LINGO-1 enhances survival, structure, and function of do-paminergic neurons in Parkinson’s disease models. Proc Natl AcadSci USA 2007;104:14430–14435.
11. Hughes AJ, Daniel SE, Kilford L, Lees AJ. Accuracy of clinicaldiagnosis of idiopathic Parkinson’s disease: a clinico-pathologicalstudy of 100 cases. J Neurol Neurosurg Psychiatry 1992;55:181–184.
12. Rajput AH, Sitte HH, Rajput A, Fenton ME, Pifl C, HornykiewiczO. Globus pallidus dopamine and Parkinson motor subtypes: clini-
cal and brain biochemical correlation. Neurology 2008;70(16 Pt2):1403–1410.
13. Barrett JC, Fry B, Maller J, Daly MJ. Haploview: analysis and vis-ualization of LD and haplotype maps. Bioinformatics 2005;21:263–265.
14. Purcell S, Neale B, Todd-Brown K, et al. PLINK: a tool set forwhole-genome association and population-based linkage analyses.Am J Hum Genet 2007;81:559–575.
15. Pankratz N, Wilk JB, Latourelle JC, et al. Genomewide associationstudy for susceptibility genes contributing to familial Parkinsondisease. Hum Genet 2009;124:593–605.
16. Simon-Sanchez J, Scholz S, Matarin Mdel M, et al. GenomewideSNP assay reveals mutations underlying Parkinson disease. HumMutat 2008;29:315–322.
17. Wittke-Thompson JK, Pluzhnikov A, Cox NJ. Rational inferencesabout departures from Hardy-Weinberg equilibrium. Am J HumGenet 2005;76:967–986.
18. Rajput AH, Voll A, Rajput ML, Robinson CA, Rajput A. Coursein Parkinson disease subtypes: a 39-year clinicopathologic study.Neurology 2009;73:206–212.
19. Gayan J, Galan JJ, Gonzalez-Perez A, et al. Genetic structure ofthe Spanish population. BMC Genomics 2010;11:326.
20. Clark LN, Park N, Kisselev S, Rios E, Lee JH, Louis ED. Re-plication of the LINGO1 gene association with essential tremor ina North American population. Eur J Hum Genet 2010;18:838–843.
21. Thier S, Lorenz D, Nothnagel M, et al. LINGO1 polymorphismsare associated with essential tremor in Europeans. Mov Disord2010;25:709–715.
22. Vilarino-Guell C, Wider C, Ross OA, et al. LINGO1 andLINGO2 variants are associated with essential tremor and Parkin-son disease. Neurogenetics (in press).
23. Tan EK, Teo YY, Prakash KM, et al. LINGO1 variant increasesrisk of familial essential tremor. Neurology 2009;73:1161–1162.
24. Vilarino-Guell C, Ross OA, Wider C, et al. LINGO1 rs9652490 isassociated with essential tremor and Parkinson disease. Parkinson-ism Relat Disord 2010;16:109–111.
25. Haubenberger D, Hotzy C, Pirker W, et al. Role of LINGO1 poly-morphisms in Parkinson’s disease. Mov Disord 2009;24:2404–2407.
26. Bialecka M, Kurzawski M, Tan EK, Drozdzik M. Analysis ofLINGO1 (rs9652490) polymorphism in sporadic Parkinson’s dis-ease in a Polish population, and a meta-analysis. Neurosci Lett2010;472:53–55.
27. Meara J, Bhowmick BK, Hobson P. Accuracy of diagnosis inpatients with presumed Parkinson’s disease. Age Ageing 1999;28:99–102.
28. Newman EJ, Breen K, Patterson J, Hadley DM, Grosset KA, Gros-set DG. Accuracy of Parkinson’s disease diagnosis in 610 generalpractice patients in the West of Scotland. Mov Disord 2009;24:2379–2385.
29. Jain S, Lo SE, Louis ED. Common misdiagnosis of a common neu-rological disorder: how are we misdiagnosing essential tremor?Arch Neurol 2006;63:1100–1104.
30. Jimenez-Jimenez FJ, Rubio L, Alonso-Navarro H, et al. Impair-ment of rapid repetitive finger movements and visual reactiontime in patients with essential tremor. Eur J Neurol 2010;17:152–159.
L I N G O 1 V A R I A N T S I N P D S U B P H E N O T Y P E S
Movement Disorders, Vol. 26, No. 4, 2011 727

Instability of Syllable Repetition inParkinson’s Disease—influence of
Levodopa and Deep BrainStimulation
Sabine Skodda, MD,* Andrea Flasskamp, andUwe Schlegel, MD
Department of Neurology, Knappschaftskrankenhaus, Ruhr-University
of Bochum, Bochum, Germany
ABSTRACTThe aim of this study was to test the hypothesis of a fun-damental impairment of vocal pace performance in Par-kinson’s disease (PD) based on a syllable repetitionparadigm and the influence of levodopa and deep brainstimulation of the subthalamic nucleus (STN-DBS).Twenty-two PD patients under stable dopaminergic med-ication, 14 patients with STN-DBS, and 30 controls weretested. Participants had to repeat the syllable /pa/ in asteady pace. Percental coefficient of variance (COV) ofinterval length was measured for the description of pacestability. Patients were tested in the OFF state and againin the ON state after levodopa administration or ongoingSTN-DBS. COV was elevated in both PD subgroups.COV was not influenced by levodopa administration butshowed a further deterioration under STN-DBS. Theimpaired syllable repetition capacity shows similarities tothe patterns of more complex speech rhythm abnormal-ities in PD and therefore might share the same patho-physiology.VC 2011Movement Disorder Society
Key Words: Parkinson’s disease; syllable repetition;motor speech performance; subthalamic nucleus deepbrain stimulation; levodopa
Hypokinetic dysarthria in Parkinson’s disease (PD)implies alterations of speech rate that have been attrib-uted to a reduced range of articulatory movements1 as
------------------------------------------------------------*Correspondence to: Dr. S. Skodda, Department of Neurology,Knappschaftskrankenhaus, Ruhr-University of Bochum, In der Schornau23-25, D-44892 Bochum, Germany; [email protected].
Relevant conflicts of interest/financial disclosures: Nothing to report.Full financial disclosures and author roles may be found in the onlineversion of this article.
Received: 25 March 2010; Revised: 24 May 2010; Accepted: 19August 2010Published online 10 November 2010 in Wiley Online Library(wileyonlinelibrary.com). DOI: 10.1002/mds.23439
a consequence of manifestation of hypokinesia on thespeech production system. With regard to the aspect ofspeech rate and rhythm, Parkinsonian patients featurean articulatory acceleration in the course of readingand further irregularities as abnormally placed pausesand difficulties initiating articulation which could resultfrom the inability to maintain a speech motor pro-gram.2,3 The characteristic basal ganglia dysfunction inPD is thought to induce an instability of motor sequen-ces that normally are performed in an automatic fash-ion and which require little attentional resources.4,5
From the therapeutic point of view, the effect of do-paminergic stimulation on speech rhythm in PD finallyremains inconclusive, whereas most of the studiesfound no significant changes after short-term levodopaadministration or under long-term dopaminergic medi-cation.6,7 On the other hand, studies on the effect ofdeep brain stimulation of the subthalamic nucleus(STN-DBS) have shown a variable response of speechto stimulation.8,9 There is some evidence for a crucialrole of contact side and amplitude of stimulation onspeech intelligibility, whereas in some patients, the pro-gression of speech difficulties was not modifiable byadjusting the medication or stimulation.10,11
The aim of this study was to test the hypothesis of afundamental impairment of speech motor performance inPD based on a syllable repetition paradigm.5 Further-more, the influence of short-time levodopa administrationand the effect of STN-DBS were tested by comparison ofmotor speech performance in defined OFF and ON states.If hypokinesia of the voice apparatus was the major causefor impaired syllable repetition, one might expect anamelioration of speech rhythm performance in the medi-camentous ON state and with STN-DBS ON as well. Onthe other hand, if there was no influence of levodopa onsteadiness of syllable repetition or a diverse effect of levo-dopa treatment and STN-DBS, unsteadiness of syllablerepetition should rather mirror a nondopaminergic deficitand might hint to a general impairment to maintain aspeech motor program in PD.
Patients and MethodsOur study had been approved by the local Ethics
Committee of the Ruhr University Bochum. Writteninformed consent was obtained from each participant.
From 2005 to 2008, 36 consecutive patients with PDwere recruited for this study. Fourteen patients of thisseries (DBS group) had undergone stereotactic surgeryfor bilateral deep brain stimulation (DBS) of the sub-thalamic nucleus 10 to 24 months prior to this investi-gation (mean 14.27 months) and were on stablestimulation and dopaminergic medication for at least 2months prior to this investigation. Stimulation ampli-tudes ranged from 2.4 to 3.9 V (mean 3.14 V) withpulse duration of 60 microseconds and a frequency of130 Hz. The other subgroup included 22 patients
S K O D D A E T A L .
728 Movement Disorders, Vol. 26, No. 4, 2011

(medical treatment group) on stable dopaminergic ther-apy consisting of levodopa and different dopamineagonists. As preparation for the testing, dopamine ago-nists had been stopped for at least 3 days, and the lastlevodopa dosage was given in the antecedent evening,at least 12 hours prior to the examination. The medicaltreatment group underwent a standardized levodopachallenge with administration of 200 mg of a solublelevodopa preparation. Patients were tested in the drug-naive defined OFF state and again in the best ON state30 to 45 minutes after levodopa admission. The DBSgroup was tested under ongoing STN stimulation(StimON/MedOFF) and again 30 minutes after turningoff the stimulation (StimOFF/MedOFF).We tested 30age-matched healthy persons as control group.For the speech test, each participant was asked to repeat
the syllables /pa/ at least 25 times in a ‘‘comfortable’’ self-chosen steady (isochronous) pace without accelerating orslowing articulatory velocity. Based on the oscillographicsound pressure signal of the digitally recorded audio mate-rial, the period from onset of one vocalization until the fol-lowing vocalization was defined as ‘‘interval.’’ Stability ofpace of the utterances was defined as relative coefficient ofvariation (COV5–20) calculated for the intervals 5 to 20 inrelation to the average interval length of the first four utter-ances (avIntDur1–4) following the formula: COV5–20 ¼SD5–20/[(avIntDur1–4)/
ffiffiffi
1p
6] � 100. As a parameter forspeech breathing, each participant was asked to keep thevowel /a/ as long as possible on one breath, defined asvowel keeping time (VKT). Detailed information aboutthe performance and analysis of the speech rhythm taskis published elsewhere.5
Statistics
Winstat was used for statistical analyses. ANOVAwith post hoc Bonferroni adjustment was performed toassess differences of motor performance and speechvariables for group and condition. t-Test for dependentsamples was used for intragroup comparisons in bothPD subgroups as the variables were widely normally
distributed (Kolmogorov–Smirnov test). Pearson’s cor-relation was used to test for significant correlations.The level of significance was set at P ¼ 0.05.
ResultsDetailed results are summarized in Table 1 and Fig-
ure 1.
Comparison Between Control Group and thePD Subgroups
As compared with the control group, COV5–20 wassignificantly elevated in both PD groups in the OFFand ON state.
Comparison Between OFF and ON State in thePD Subgroups
In the PD_medical treatment group, COV5–20 in theOFF and ON state showed no significant differences.In the PD_DBS group, COV5–20 in the ON state wassignificantly higher than in the OFF state. No correla-tion was seen between VKT and COV5–20.
DiscussionIn our study, both groups of PD patients (PD_medi-
cal treatment and PD_DBS) showed significant difficul-ties to keep an isochronous vocal rhythm both in theOFF and ON states.In the PD_medical treatment group, COV5–20 showed
no significant changes after levodopa administration. Thelack of efficacy of levodopa on vocal pace stability mightbe an evidence for the incapability to maintain a oncechosen speech motor program caused by dysfunctionalbasal ganglia circuits, which do not respond to dopami-nergic stimulation. This hypothesis is corroborated byprevious findings of instability of syllable repetition in alarge sample of Parkinsonian patients being on stablelong-term dopaminergic medication.5 Provided that basicsyllable repetition tasks and much more complex speech
Table 1. Participants’ characteristics and comparison of COV between PD and control group and between OFF andON state
PD_medical treatment
(PD_mt; 9 men, 13 women) PD_DBS (9 men, 5 women)
Control group (15 men, 15
women)
Mean SD Mean SD Mean SD
Age (yr) 63.82 10.31 65.64 6.81 65.97 7.59Duration (yr) 4.18 4.63 12.07 5.21Hoehn and Yahr_OFF 2.41 0.17 3.11 0.53
OFF (mean/SD) ON (mean/SD) Comp. OFF vs. ON OFF (mean/SD) ON (mean/SD) Comp. OFF vs. ON
UPDRS III 32.10/13.06 18.77/8.06 P < 0.01 34.36/8.47 13.36/9.09 P < 0.01VKT (ms) 11,791/5,751 13,341/5,198 n.s. 14,429/7,511 13,293/5,242 n.s. 11,405/5,814COV5–20 2.00/1.04 1.91/0.87 n.s. 2.22/1.32 2.90/1.27 P ¼ 0.035 1.08/0.26
The levels of significance refer to the comparison of the control group with the accordant PD group (ANOVA).*P < 0.01.
I N S T A B I L I T Y O F S Y L L A B L E R E P E T I T I O N I N P D
Movement Disorders, Vol. 26, No. 4, 2011 729
tasks share the same underlying mechanisms, our resultsare in line with the finding that speech rate and pauseratios of Parkinsonian speakers based on reading andmonolog tasks do not respond to dopaminergic ther-apy.6,7,12 A recent positrone emission tomography (PET)-based investigation on motor timing in Parkinsonianpatients based on a finger tapping paradigm revealed dif-ferential patterns of activation depending on the availabil-ity of dopaminergic stimulation with a lack of adequatefrontal activation caused by an excessive inhibitory pal-lidal outflow, which could be normalized by apomor-phine administration.13 As the accuracy of repetitivetimed movements showed no significant difference in theOFF and ON state, the Parkinsonian patients obviouslyswitched to alternative neural pathways, e.g., the cerebel-lum, to maintain the motor program.13 Related to the as-pect of acoustical rhythm perception, the basal gangliahave been shown to be part of a system involved indetecting and generating an internal beat, and that thiscapacity seems to be compromised in PD.14
In the PD_DBS group, the already elevated COV5–20 inthe OFF state showed a further deterioration under stimu-lation, which bears some analogy to patterns of dysfunc-tional articulator movements under high voltage STN-DBS with subsequent deterioration of overall intelligibil-ity.10,15 Several hypotheses could explain the worseningeffect of STN-DBS on the stability of syllable repetitionand overall speech performance in PD. On the one hand,STN could have a different somatotopy for speech andbody motor control. As a consequence, the site of STNstimulation which leads to the best effect on limb move-ment might provoke a worsening of dysarthria as it hasbeen reported for contacts placed dorsomedial to theSTN.16 On the other hand, deterioration of speech underSTN-DBS might be induced by the spread of current toadjacent areas such as the corticobulbar tract or pallido-fugal and cerebellothalamic pathways.17 However, if ourfindings of further vocal pace deterioration under STN-DBS were caused by the spread of current to corticobul-bar pathways for laryngeal motor control, one wouldexpect a significant effect on sustained phonation (asmeasured by VKT) that is not observed in our series.
Summarized, our finding of pace instability of syl-lable repetition in PD confirms previous findings andseems to corroborate the paradigm of the crucial roleof basal ganglia in the performance and maintai-nance of automatic motor sequences.4,5 In PD, themaladaptive neuronal motor speech networks appa-rently are not reconstituted by short-term dopami-nergic stimulation and may be even deteriorated bySTN-DBS.
Acknowledgments: This work was supported by financial support of theDeutsche Parkinson Vereinigung/DPV.
References1. Ackermann H, Konczak J, Hetrich I. The temporal control of re-
petitive articulatory movements in Parkinson’s disease. Brain Lang1997;56:312–319.
2. Skodda S, Schlegel U. Speech rate and rhythm in Parkinson’s dis-ease. Mov Disord 2008;23:985–992.
3. Gurd JM, Bessel N, Watson I, Coleman J. Motor speech versusigit control in Parkinson’s disease: a cognitive neuropsychologicalinvestigation. Clin Linguist Phon 1998;12:357–378.
4. Iansek R, Bradshaw JL, Morris ME.Interaction of the basal gan-glia and supplementary motor area in the elaboration of move-ments. In:Glencross DJ,Piek JP, editors.Motor control and sensorymotor integration: issues and directions.Elsevier Science BV, Am-sterdam (Holland);1995. p 37–59.
5. Skodda S, Flasskamp A, Schlegel U. Instability of syllable repeti-tion as a model for impaired motor processing: is Parkinson’s dis-ease a ‘‘rhythm disorder’’?J Neural Transm 2010;117: 605–612.
6. De Letter M, Santens P, De Bodt M, Boon P, Van Borsel J. Levo-dopa-induced alterations in speech rate in advanced Parkinson’sdisease. Acta Neurol Belg 2006;106:19–22.
7. Skodda S, Visser W, Schlegel U. Short- and long-term dopaminer-gic effects on dysarthria in early Parkinson’s disease. J NeuralTransm 2010;117:197–205.
8. Limousin P, Pollak P, Benazzouz A, et al. Effect of Parkinsoniansigns and symptoms of bilateral subthalamic nucleus stimulation.Lancet 1995;345:91–95.
9. Guehl D, Cuny E, Benazzouz A, et al. Side-effects of subthalamicstimulation in Parkinson’s disease: clinical evolution and predictivefactors. Eur J Neurol 2006;13:963–971.
10. Tripoliti E, Zrinzo L, Martinez-Torres I, et al. Effects of contactlocation and voltage amplitude on speech and movement in bilat-eral subthalamic nucleus deep brain stimulation. Mov Disord2008;23:2377–2383.
11. Tommasi G, Krack P, Fraix V, et al. Pyramidal tract side effectsinduced by deep brain stimulation of the subthalamic nucleus. JNeurol Neurosurg Psychiatry 2008;79:813–819.
12. Wolfe VI, Garvin JS, Bacon M, Waldrop W. Speech changes inParkinson’s disease during treatment with L-dopa. J Commun Dis-ord 1975;8:271–279.
13. Jahanshahi M, Jones CR, Zijlmans J, et al. Dopaminergic modula-tion of striato-frontal connectivity during motor timing in Parkin-son’s disease. Brain 2010;133(Part 3):727–745.
14. Grahn JA, Brett M. Impairment of beat-based rhythm discrimina-tion in Parkinson’s disease. Cortex 2009;45:54–61.
15. Tripoliti E, Limousin P, Tisch S, Borrell E, Hariz MI. Speech inParkinson’s disease following subthalamic nucleus deep brain stim-ulation: preliminary results. J Med Speech Lang Pathol 2006;14:309–315.
16. Plaha P, Ben-Shlomo Y, Patel NK, Gill SS. Stimulation of the cau-dal zona incerta is superior to the stimulation of the subthalamicnucleus in improving contralateral parkinsonism. Brain2006;129:1732–1747.
17. Krack P, Batir A, Van Blercom N, et al. Five-year follow-up ofbilateral stimulation of the subthalamic nucleus in advanced Par-kinson’s disease. N Engl J Med 2003;349:1925–1934.
FIG. 1. COV in PD patients in ON and OFF state in comparison to thecontrol group; x-axis: groups/y-axis: COV; PD_mt, PD medical treat-ment group; PD_DBS, PD deep brain stimulation group.
S K O D D A E T A L .
730 Movement Disorders, Vol. 26, No. 4, 2011

Serum Insulin-Like SystemAlterations in Patients with
Spinocerebellar Ataxia Type 3
Jonas Alex Morales Saute, MD,1,2,3 Andrew Chaves Feitosada Silva, MD,4 Alexandre Pastoris Muller, MSc,1 GiseleHansel, MSc,1 Alexandre Silva de Mello, MSc,4 Fabio Maeda,PhD,2,5 Leonardo Vedolin, MD, PhD,5 Maria Luiza Saraiva-Pereira, PhD,1,4 Diogo Onofre Souza, MD, PhD,1 JavierArpa, MD,6 Ignacio Torres-Aleman, PhD,7,8 Luis Valmor CruzPortela, PhD,1* and Laura Bannach Jardim, MD, PhD2,4,9
1Department of Biochemistry, Universidade Federal do Rio Grande do
Sul, Porto Alegre, RS, Brazil; 2Postgraduate Program in Medical
Sciences, Universidade Federal do Rio Grande do Sul, Porto Alegre,
RS, Brazil; 3Neurology Service, Hospital de Clınicas de Porto Alegre
(HCPA), Porto Alegre, RS, Brazil; 4Medical Genetics Service, Hospital
de Clınicas de Porto Alegre (HCPA), Porto Alegre, RS, Brazil;;5Neuroradiology Service, Hospital Moinhos de Vento, Porto Alegre,
Brazil; 6Neurology Service, Hospital Universitario ‘‘La Paz’’ (HULP),
Madrid, Spain; 7Laboratory of Cellular and Molecular
Neuroendocrinology, Instituto Cajal, Consejo Superior de
Investigaciones Cientificas (CSIC), Madrid, Spain; 8CIBERNED,
Madrid, Spain; 9Department of Internal Medicine, Universidade
Federal do Rio Grande do Sul, Porto Alegre, RS, Brazil
ABSTRACTSpinocerebellar ataxias (SCAs) constitute a group ofautosomal dominant neurodegenerative disorders withno current treatment. The insulin/insulin-like growth fac-tor 1 (IGF-1) system (IIS) has been shown to play a rolein the neurological dysfunction of SCAs and other poly-glutamine disorders. We aimed to study the biomarkerprofile of serum IIS components in SCA3. We performeda case–control study with 46 SCA3 patients and 42healthy individuals evaluating the peripheral IIS profile(insulin, IGF-1, IGFBP1 and 3) and the correlation withclinical, molecular, and neuroimaging findings. SCA3patients presented lower insulin and IGFBP3 levels andhigher insulin sensitivity (HOMA2), free IGF-I, andIGFBP1 levels when compared with controls. IGFBP-1levels were directly associated with CAG expandedrepeat length; IGF-1 was associated with the volume-tries of specific brainstem regions on magnetic reso-nance imaging (MRI). Insulin levels and sensitivity wererelated to age at onset of symptoms. Our findings indi-cate an involvement of IIS components in SCA3 neuro-biology and IGFBP-1 as a potential biomarker of thedisease. VC 2011 Movement Disorder Society
Key Words: spinocerebellar ataxia; polyglutamine dis-orders; IGF-1; insulin; IGFBP; Machado-Joseph disease
------------------------------------------------------------Additional Supporting Information may be found in the online version ofthis article.
*Correspondence to: Luis Valmor Cruz Portela, Department ofBiochemistry, Instituto de Ciencias Basicas da Saude, Universidade Federaldo Rio Grande do Sul, Rua Ramiro Barcelos 2600 Anexo, CEP 90.035-003,Porto Alegre, Rio Grande do Sul, Brazil; [email protected].
Relevant conflicts of interest/financial disclosures: Nothing to report.Full financial disclosures and author roles may be found in the onlineversion of this article.
Received: 3 March 2010; Revised: 13 April 2010; Accepted: 11 August2010Published online 10 November 2010 in Wiley Online Library(wileyonlinelibrary.com). DOI: 10.1002/mds.23428
Spinocerebellar ataxias (SCAs) constitute a groupof autosomal dominant neurodegenerative disorderswith no current treatment.1,2 The most prevalent SCAsare those caused by CAG glutamine trinucleotiderepeat expansions,1 being part of the so-called groupof polyglutamine (polyQ) disorders.2
The insulin/insulin-like growth factor 1 (IGF-1) sys-tem (IIS)—encompassing insulin, IGF-1, and IGF bind-ing proteins (IGFBPs)—performs importantneuromodulatory functions in the central nervous sys-tem (CNS).3–5 Abnormalities in the IIS signaling path-way were thought to play a part in thephysiopathological processes of various neurodegenera-tive disorders, including Alzheimer’s disease, SCAs,and Huntington disease through different mecha-nisms.3,4,6–8
Chronic treatment with IGF-1 improved neurologicaldeficits in neurotoxic and transgenic animal models ofataxia.9,10 In transgenic animal models of other polyQdisorders, there was also evidence of involvement ofsignaling components of the IIS in the modulation ofmutant proteins and disease phenotype.11,12 On clinicalgrounds, altered serum levels of IGF-1 and IGFBPshave been reported in patients with late onset cerebel-lar ataxia (LOCA).13
Bearing in mind the evidence pointing toward thepotential alteration of the IIS in polyQ disorders, weaimed to investigate the biomarker profile of serum IIScomponents in SCA3, considering their relationshipwith clinical, molecular, and neuroimaging findings.
Patients and Methods
Design and Subjects
A case–control study was performed between Mayand October of 2007 with 46 molecularly confirmedSCA3 patients from the neurogenetics clinic of Hospi-tal de Clınicas de Porto Alegre (HCPA) and 42 healthy,nonrelated individuals with similar age, gender, andenvironmental characteristics. Nutritional and moodevaluation were undertaken to control for confoundingfactors. The ATXN3 expanded regions were analyzedas previously described.14 Subjects diagnosed with
I N S U L I N - L I K E S Y S T E M I N S C A 3
Movement Disorders, Vol. 26, No. 4, 2011 731

other neurological, endocrine, renal, or hepatic disor-ders were excluded. The study was approved by thelocal Ethics Committee and all subjects gave theirinformed written consent.
Clinical Evaluation
Two clinical ataxia scales were applied: the SARA15
and NESSCA scores.16 Disease duration and age atonset were informed by patients and their relatives. Allsubjects completed the beck depression inventory.17
Magnetic Resonance Imaging (MRI)
MRI was done using 1.5 T system. Sagittal T1-weighted images (repetition time [TR] ¼ 2,000 ms andecho time [TE] ¼ 3.45 ms)—slice thickness of 1 mm,pixel size of 0.49 mm—were performed. The normal-ized volumes of the brainstem, mesencephalus, pontinetegmentum, basis of pons, medulla oblongata, and cer-ebellum of SCA3 patients were measured on fluid-atte-nuated inversion recovery, using semiautomatedsegmentation techniques and voxel count volumetryusing the software ImageJ. More detailed proceduresof this technique were described elsewere.18
Samples and Assays
Serum was obtained by blood centrifugation at 6,000gfor 5 min, frozen immediately, and stored at �70�Cuntil analyses. All samples were obtained between 10 AM
and 4 PM and all subjects were under fasting conditions.Serum IGF-1 (DuoSet R&D System), IGFBP-1 (MedixBiochemica, Finland), and IGFBP-3 (Mediagnost, Ger-many) were measured in duplicate by enzyme-linked im-munosorbent assay. Serum insulin (Roche Diagnostics,Germany) was determined by electrochemiluminescence.We utilized the HOMA Calculator v2.2.2 to determineHOMA2 parameters.
Statistical Analysis
All variables in the study showed a normal distribu-tion on a one-sample Kolmogorov-Smirnov test, exceptHOMA2-%S, which was log transformed. Comparisonsof IIS component levels between cases and controls wereperformed using a two-tailed unpaired Student’s t test.The univariate general linear model was utilized to con-trol for confounding factors that were significantly cor-related with the outcomes. Gender was analyzed with av2 test and all correlations with the Pearson correlationtest followed by a linear regression model. Statistical sig-nificance was defined as P < 0.05.
ResultsDemographic data of cases and controls are shown
in Table 1. MRI was obtained randomly in 26 (14females) of these SCA3 patients, whose demographiccharacteristics were similar to those found in the over-all group of patients.
Insulin/IGF-1 System
Differences regarding serum concentrations of IGF-1,IGFBP-1, IGFBP-3, IGF-1:IGFBP-3 molar ratio, insulin,and HOMA analysis between cases and controls areshown in Table 2.Total IGF-1 serum levels did not differ between
groups (P ¼ 0.550; corrected for age) nor correlatedwith clinical or molecular variables. IGF-1 was inverselycorrelated with medulla oblongata (R ¼ �0.489; P ¼0.011) and basis of pons volumetry (R ¼ �0.439; P ¼0.025) on MRI (Supporting Information Figs. 1 and 2).IGFBP-1 serum levels were higher in patients with
SCA3 than in controls (P ¼ 0.001; corrected for BMI).IGFBP-1 levels were correlated significantly with CAGexpanded repeats (R ¼ 0.451; P ¼ 0.003; Fig. 1)—which was the only factor independently associated inthe linear regression model (R ¼ 0.452; P ¼ 0.006).IGFBP-1 did not correlate with MRI volumetries.IGFBP-3 levels were lower (P ¼ 0.001) and the IGF-
1:IGFBP-3 molar ratio (an indirect form of measuringfree IGF-1) was higher (P ¼ 0.039; corrected for ageand gender) in SCA3 patients than in controls. NeitherIGFBP-3 nor IGF-1:IGFBP-3 molar ratio independentlycorrelated significantly with any clinical, molecular, orMRI volumetries variables.Insulin levels were lower in cases than in controls (P
¼ 0.027, after correction for body mass index [BMI]).Age at onset correlated directly with insulin levels (R¼ 0.510; P ¼ 0.0001) and was the only factor inde-pendently associated in the linear regression modelwith insulin (R ¼ 0.365; P ¼ 0.026; Fig. 2). When weconsidered age of onset as a dependent factor, both
Table 1. Demographics of the enrolled individuals
Controls SCA3 Patients
Mean (SD) Mean (SD) P
N 42 46 NAAge (yr) 45.5 (12) 44.5(11) 0.683Gender (M/F) 16/26 22/24 0.357Glucose (mg/dl) 86.7 (6.5) 85.9 (12.6) 0.785Total cholesterol (mg/dl) 206 (35) 188 (38) 0.085HDL (mg/dl) 55 (14) 58 (11) 0.352LDL (mg/dl) 124 (39) 108 (28) 0.098VLDL (mg/dl) 25 (10.9) 16.1 (8.7) 0.003**Triglycerides (mg/dl) 125(54) 80 (43) 0.003**Creatinine (mg/dl) 0.77 (0.15) 0.79 (0.2) 0.728Albumin (g/dl) 4.6 (0.28) 4.7 (0.25) 0.369Total bilirubin (mg/dl) 0.64 (0.35) 0.58 (0.2) 0.486Prothrombin time (INR) 1.01(0.06) 1.03 (0.06) 0.39BMI (kg/m2) 27.1 (4.5) 24.4 (4.1) 0.01**a
BDI 10.5 (9) 16 (11) 0.005**Disease duration (yr) 9.97 (6.6) NAAge at onset (yr) 34.5 (10) NACAG(n) 73.3 (3) NANESSCA 17.5 (6.3) NASARA 14.4 (7.6) NA
aCorrected for age.NA, not applicable.**P < 0.01.
S A U T E E T A L .
732 Movement Disorders, Vol. 26, No. 4, 2011
insulin (R ¼ 0.404; P ¼ 0.012) and CAG expandedrepeat (R ¼ �0.738; P ¼ 0.0001) influenced the vari-able independently. Insulin levels did not correlate withMRI volumetries.HOMA analysis was performed to examine the
steady-state b-cell function (HOMA2-%B), peripheralinsulin sensitivity (HOMA2-%S), and resistance(HOMA2-IR index). HOMA2-%B (b-cell function)was similar between groups (P ¼ 0.637), whereas thelog (HOMA2-%S) (insulin sensitivity) was higher (P ¼0.003; corrected for BMI), and HOMA2-IR index (in-sulin resistance) was lower (P ¼ 0.022; corrected forBMI) in patients with SCA3 than in control partici-pants. Log (HOMA2-%S) and HOMA2-IR index cor-related with age at onset (R ¼ �0.444; P ¼ 0.003 andR ¼ 0.492; P ¼ 0.001, respectively; Fig. 2), which wasthe only factor independently associated with thesevariables in the linear regression model (R ¼ �0.408;P ¼ 0.014 and R ¼ 0.378; P ¼ 0.021, respectively).When age at onset was considered as the dependent
factor, HOMA2-%S (R ¼ �0.408; P ¼ 0.014) orHOMA2-IR index (R ¼ 0.378; P ¼ 0.021) and CAGexpanded repeat (R ¼ �0.703; P ¼ 0.0001) influencedthe variable independently. None of the HOMA pa-rameters correlated with MRI volumetries.
DiscussionThe present results indicated significant changes in
various constituents of the IIS in SCA3 patients, pointingtoward IGFBP-1 as a disease biomarker and a possibledisease modifier effect related to insulin sensitivity.We found no differences in serum IGF-1 levels in
SCA3 patients; however, we observed that IGF-1 serumlevels were inversely correlated with the volume of me-dulla oblongata and basis pontis, two brain structuresthat are primarily affected in SCA3.IGFBP-3 levels—which binds more than 80% of pe-
ripheral IGF-1 and increases its half life19—were lower,while an indirect measure of free IGF-1 levels, the IGF-1:IGFBP-3 molar ratio, was higher in SCA3 patientsthan in controls. Higher levels of free IGF-1 may haveopposite consequences: the peptide might either be earlymetabolized, being in insufficient levels for an adequatetransport to the CNS, or might be coupled to the higherexpressed IGFBP-1 increasing its transport to targetbrain areas, as this binding protein is known to partici-pate in tissue allocation of circulating IGF-1.20
IGFBP-1 levels were higher in SCA3 patients than incontrols and were independently related only to CAGexpanded repeats, with more severe mutations leading tohigher levels of IGFBP-1. These results point towardIGFBP-1 as a possible biomarker of the disease, there-fore, the actual link between this biomarker and neuro-pathology should be put in perspective. Mutated ataxin-3 could interfere with IGFBP-1 synthesis or metabolismdue to its ubiquitin-related properties and to its disrup-tive effects on gene transcription.2 As ataxin-3 is also
Table 2. Serum levels of insulin/insulin-like growth factor1 system components in SCA3
Controls SCA3 Patients
Mean (SD) Mean (SD) P
IGF-1 (gg/mL) 117.4 (36.3) 114.5 (32.2) 0.550a
IGFBP-1 (gg/mL) 1.32 (0.98) 2.67 (1.8) 0.001**b
IGFBP-3 (lg/mL) 2.01 (0.36) 1.4 (0.8) 0.001**IGF-1/IGFBP-3 molar ratio 0.23 (0.12) 0.36 (0.24) 0.039*a,c
Insulin (lIU/mL) 9.5 (6) 6.2 (3.5) 0.027*b
HOMA2-%B 92.9 (50.5) 83.9 (35) 0.637Log (HOMA2-%S) 4.35 (0.63) 4.8 (0.55) 0.003b
HOMA2-IR index 1.3 (0.8) 0.9 (0.5) 0.022b
aCorrected for age.bCorrected for body mass index.cCorrected for gender.*P < 0.05; **P < 0.01.
FIG. 1. IGFBP-1 as a biomarker of SCA3. A: Analysis of IGFBP-1 serum levels in SCA3 patients and controls corrected for BMI. B: CAG expandedrepeat (CAG)n simple correlation with IGFBP-1 serum levels. Values are given as means and error bars represent standard error (SEM); **P < 0.01;***P < 0.001.
I N S U L I N - L I K E S Y S T E M I N S C A 3
Movement Disorders, Vol. 26, No. 4, 2011 733
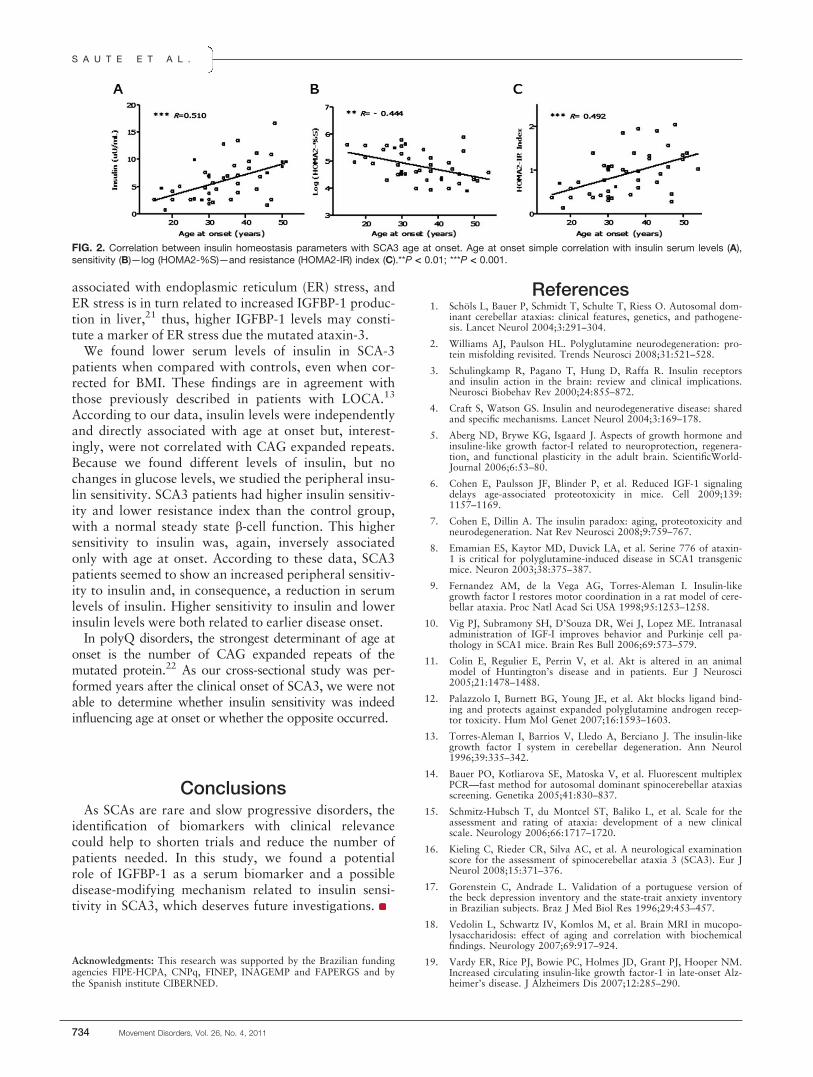
associated with endoplasmic reticulum (ER) stress, andER stress is in turn related to increased IGFBP-1 produc-tion in liver,21 thus, higher IGFBP-1 levels may consti-tute a marker of ER stress due the mutated ataxin-3.We found lower serum levels of insulin in SCA-3
patients when compared with controls, even when cor-rected for BMI. These findings are in agreement withthose previously described in patients with LOCA.13
According to our data, insulin levels were independentlyand directly associated with age at onset but, interest-ingly, were not correlated with CAG expanded repeats.Because we found different levels of insulin, but nochanges in glucose levels, we studied the peripheral insu-lin sensitivity. SCA3 patients had higher insulin sensitiv-ity and lower resistance index than the control group,with a normal steady state b-cell function. This highersensitivity to insulin was, again, inversely associatedonly with age at onset. According to these data, SCA3patients seemed to show an increased peripheral sensitiv-ity to insulin and, in consequence, a reduction in serumlevels of insulin. Higher sensitivity to insulin and lowerinsulin levels were both related to earlier disease onset.In polyQ disorders, the strongest determinant of age at
onset is the number of CAG expanded repeats of themutated protein.22 As our cross-sectional study was per-formed years after the clinical onset of SCA3, we were notable to determine whether insulin sensitivity was indeedinfluencing age at onset or whether the opposite occurred.
ConclusionsAs SCAs are rare and slow progressive disorders, the
identification of biomarkers with clinical relevancecould help to shorten trials and reduce the number ofpatients needed. In this study, we found a potentialrole of IGFBP-1 as a serum biomarker and a possibledisease-modifying mechanism related to insulin sensi-tivity in SCA3, which deserves future investigations.
Acknowledgments: This research was supported by the Brazilian fundingagencies FIPE-HCPA, CNPq, FINEP, INAGEMP and FAPERGS and bythe Spanish institute CIBERNED.
References1. Schols L, Bauer P, Schmidt T, Schulte T, Riess O. Autosomal dom-
inant cerebellar ataxias: clinical features, genetics, and pathogene-sis. Lancet Neurol 2004;3:291–304.
2. Williams AJ, Paulson HL. Polyglutamine neurodegeneration: pro-tein misfolding revisited. Trends Neurosci 2008;31:521–528.
3. Schulingkamp R, Pagano T, Hung D, Raffa R. Insulin receptorsand insulin action in the brain: review and clinical implications.Neurosci Biobehav Rev 2000;24:855–872.
4. Craft S, Watson GS. Insulin and neurodegenerative disease: sharedand specific mechanisms. Lancet Neurol 2004;3:169–178.
5. Aberg ND, Brywe KG, Isgaard J. Aspects of growth hormone andinsuline-like growth factor-I related to neuroprotection, regenera-tion, and functional plasticity in the adult brain. ScientificWorld-Journal 2006;6:53–80.
6. Cohen E, Paulsson JF, Blinder P, et al. Reduced IGF-1 signalingdelays age-associated proteotoxicity in mice. Cell 2009;139:1157–1169.
7. Cohen E, Dillin A. The insulin paradox: aging, proteotoxicity andneurodegeneration. Nat Rev Neurosci 2008;9:759–767.
8. Emamian ES, Kaytor MD, Duvick LA, et al. Serine 776 of ataxin-1 is critical for polyglutamine-induced disease in SCA1 transgenicmice. Neuron 2003;38:375–387.
9. Fernandez AM, de la Vega AG, Torres-Aleman I. Insulin-likegrowth factor I restores motor coordination in a rat model of cere-bellar ataxia. Proc Natl Acad Sci USA 1998;95:1253–1258.
10. Vig PJ, Subramony SH, D’Souza DR, Wei J, Lopez ME. Intranasaladministration of IGF-I improves behavior and Purkinje cell pa-thology in SCA1 mice. Brain Res Bull 2006;69:573–579.
11. Colin E, Regulier E, Perrin V, et al. Akt is altered in an animalmodel of Huntington’s disease and in patients. Eur J Neurosci2005;21:1478–1488.
12. Palazzolo I, Burnett BG, Young JE, et al. Akt blocks ligand bind-ing and protects against expanded polyglutamine androgen recep-tor toxicity. Hum Mol Genet 2007;16:1593–1603.
13. Torres-Aleman I, Barrios V, Lledo A, Berciano J. The insulin-likegrowth factor I system in cerebellar degeneration. Ann Neurol1996;39:335–342.
14. Bauer PO, Kotliarova SE, Matoska V, et al. Fluorescent multiplexPCR—fast method for autosomal dominant spinocerebellar ataxiasscreening. Genetika 2005;41:830–837.
15. Schmitz-Hubsch T, du Montcel ST, Baliko L, et al. Scale for theassessment and rating of ataxia: development of a new clinicalscale. Neurology 2006;66:1717–1720.
16. Kieling C, Rieder CR, Silva AC, et al. A neurological examinationscore for the assessment of spinocerebellar ataxia 3 (SCA3). Eur JNeurol 2008;15:371–376.
17. Gorenstein C, Andrade L. Validation of a portuguese version ofthe beck depression inventory and the state-trait anxiety inventoryin Brazilian subjects. Braz J Med Biol Res 1996;29:453–457.
18. Vedolin L, Schwartz IV, Komlos M, et al. Brain MRI in mucopo-lysaccharidosis: effect of aging and correlation with biochemicalfindings. Neurology 2007;69:917–924.
19. Vardy ER, Rice PJ, Bowie PC, Holmes JD, Grant PJ, Hooper NM.Increased circulating insulin-like growth factor-1 in late-onset Alz-heimer’s disease. J Alzheimers Dis 2007;12:285–290.
FIG. 2. Correlation between insulin homeostasis parameters with SCA3 age at onset. Age at onset simple correlation with insulin serum levels (A),sensitivity (B)—log (HOMA2-%S)—and resistance (HOMA2-IR) index (C).**P < 0.01; ***P < 0.001.
S A U T E E T A L .
734 Movement Disorders, Vol. 26, No. 4, 2011

20. Berg U, Gustafsson T, Sundberg CJ, Kaijser L, Carlsson-SkwirutC, Bang P. Interstitial IGF-I in exercising skeletal muscle inwomen. Eur J Endocrinol 2007;157:427–435.
21. Marchand A, Tomkiewicz C, Magne L, Barouki R, Garlatti M.Endoplasmic reticulum stress induction of insulin-like growth fac-tor-binding protein-1 involves ATF4. J Biol Chem 2006;281:19124–19133.
22. Wexler NS, Lorimer J, Porter J, et al. Venezuelan kindreds revealthat genetic and environmental factors modulate Huntington’s dis-ease age of onset. Proc Natl Acad Sci USA 2004;101:3498–3503.
Clinical Correlates of Quality of Lifein Tourette Syndrome
Clare M. Eddy, BSc, PhD,1* Andrea E. Cavanna, MD, PhD,1,2
Mariangela Gulisano, MD, PhD,3 Antonella Agodi, PhD,3,4
Martina Barchitta, PhD,3,4 Paola Calı, MD,3 Mary M.Robertson, MBChB, MD, DSc (Med), DPM, FRCPCH, FRCP(UK), FRCPsych,5,6 Renata Rizzo, MD, PhD3
1Department of Neuropsychiatry, The Barberry National Centre for
Mental Health, Birmingham, United Kingdom; 2Sobell Department of
Motor Neuroscience and Movement Disorders, Institute of Neurology,
UCL, London, United Kingdom; 3Section of Child Neurology and
Psychiatry, Department of Pediatrics, University of Catania, Catania,
Italy; 4Department of Biomedical Sciences, University of Catania,
Catania, Italy; 5St. George’s Hospital Medical School, St. George’s
Hospital, London, United Kingdom; 6Department of Mental Health
Sciences, UCL, London, United Kingdom
ABSTRACTTourette syndrome (TS) is a neurodevelopmental disor-der involving tics, which is frequently accompanied bycomorbid obsessive compulsive (OCD) or attention defi-cit hyperactivity disorder (ADHD). Individuals with TS of-ten report poor quality of life (QoL) in comparison withthe general population. This study investigated the clini-cal correlates of QoL in young people with TS using aself-report multidimensional QoL measure, and a rangeof clinical scales used to assess tic severity and thesymptoms of anxiety, depression, OCD, ADHD andother emotional and behavioral symptoms. Symptomsof depression, OCD, and ADHD appeared to have awidespread negative impact on QoL, but poorer QoLwas not associated with increased tic severity. Greateremotional and behavioral difficulties, including symp-toms of OCD, were among the best predictors of poorQoL in young people with TS. VC 2010 Movement Disor-der Society
Key Words: Tourette syndrome; tics; quality of life;obsessive compulsive disorder; attention deficit hyper-activity disorder
------------------------------------------------------------*Correspondence to: Dr. Clare M. Eddy, Department of Neuropsychiatry,The Barberry National Centre for Mental Health, 25 Vincent Drive,Edgbaston, Birmingham B15 2FG, United Kingdom; [email protected].
Relevant conflicts of interest/financial disclosures: Nothing to report.Full financial disclosures and author roles may be found in the onlineversion of this article.
Received: 13 June 2010; Revised: 2 July 2010; Accepted: 15 August2010Published online 10 November 2010 in Wiley Online Library(wileyonlinelibrary.com). DOI: 10.1002/mds.23434
Tourette syndrome (TS) involves multiple motorand one or more vocal (phonic) tics. Comorbid atten-tion deficit hyperactivity disorder (ADHD) and obses-sive–compulsive disorder (OCD) are common. Studieshave shown that the TS can be associated with poorquality of life (QoL). Specifically, there is an evidencethat aspects of social life and relationships may be par-ticularly vulnerable in TS.1,2 In this study we aimed todetermine which clinical variables most influence QoLof young people with TS.Previous studies suggest that influences on QoL in TS
include tic severity,1,3–5 anxiety, and depression.1,4,6
Symptoms of OCD and ADHD may also be impor-tant.3 In fact, one study reported a relationshipbetween these symptoms and QoL but not between ticseverity and QoL.7 Knowledge of the important clinicaldeterminants of QoL in young people with TS can en-courage interventions effective in maintaining their psy-chological well-being.We aimed to expand research in this area by focus-
ing on a clinic-based population, using a measure thatprovided a multidimensional assessment of QoL fromthe individual’s own perspective, The Youth Quality ofLife Instrument-Research version (YQOL-R).8,9 A self-report measure of QoL was selected, as studies in TShave shown that proxy-rated measures may not corre-late with a young person’s own assessment of theirQoL.5 In addition, this measure contained items toassess social aspects of QoL, which may be particularlyrelevant to TS.1–3 Although a disease-specific instru-ment is available for adults,10 the current study used ageneric QoL measure designed for use with young peo-ple so that comparisons could be made with a healthycontrol group. Inclusion of a range of clinical scales toassess tic severity and symptoms of anxiety, depression,OCD, and ADHD allowed the investigation of whetherparticular clinical symptoms appeared to exert diverseor more specific impacts on aspects of QoL related tothe self, environment, and relationships.
Patients and Methods
Participants
Fifty young people with TS according to DSM-IV-TR criteria were enrolled (44 males; mean age 13.26
C L I N I C A L C O R R E L A T E S O F Q O L I N T S
Movement Disorders, Vol. 26, No. 4, 2011 735

years; SD 2.32). Thirty were taking medication: 15pimozide (6 plus fluoxetine, 1 plus clonidine, 1 plusfluoxetine and clonidine); 7 aripiprazole (1 plus fluoxe-tine); 6 risperidone (1 plus fluoxetine) and 2 sulpiride.
Procedure
The study received approval from a local ethics com-mittee. Participants were consecutively recruited frompatients attending the Neuropediatric Unit, Universityof Catania. Assessments were performed by fully quali-fied child and adolescent psychiatrists with extensiveexperience in TS, and data were collected at the samepoint in time. The QoL scale was completed alongwith six clinical measures. These were the YQOL–R,8,9
the Yale Global Tic Severity Rating Scale (YGTSS),11
the Multidimensional Anxiety Scale for Children(MASC),12 the Child Depression Inventory (CDI),13
Conner’s ADHD/DSMV-IV Scale (CADS),14 the Yale-Brown Obsessive Compulsive Scale (Y-BOCS),15 andthe Child Behavior Checklist (CBCL).16
Measures
YQOL-R
The YQOL–R contains ‘‘perceptual’’ items, whichinvolve things that are only known by the adolescenthim/herself (e.g., I feel that life is worthwhile), and‘‘contextual’’ items, which are potentially verifiable(e.g., during the past month, how often did you spendtime with a friend having a good time outside ofschool?).The 41 ‘‘perceptual items’’ generate scores for four
domains. Each item is rated from 0 to 10. The self do-main (14 items: score range 0–140) provides a perspec-tive on the adolescent’s sense of the person that theyare (e.g., ‘‘I feel good about myself’’). The relationshipsdomain (14 items: score range 0–140) assesses familyand peer relationships (e.g., ‘‘I am happy with thefriends I have’’). The environment domain contains 10items (score range 0–100), including ‘‘I feel my life isfull of interesting things to do’’ and the general QoLdomain (score range 0–30) contains three broaderitems (e.g., ‘‘I enjoy life’’). The scores for thesedomains are combined to give a total score of 410.The 15 ‘‘contextual items’’ are used as individual
indicators. These allow the assessment of more objec-tive factors that may affect perceived QoL. For allitems other than the reverse scored items D4, D6, D7,D8, D9, and D10, low scores indicate a low QoL.
YGTSS
The YGTSS is a reliable clinician rated interview,whereby the clinician notes the presence of tics basedon child and parent report and behavioral observation,and then rates the severity of these in terms of number,frequency, intensity, complexity, and interference.
MASC
The MASC is a validated scale, which assesses anxi-ety disorders in children and adolescents. It containsthree subscales (physical, harm, and social), which arecombined to generate a total score.
CDI
The CDI is a self-rated instrument, which allows thediagnosis of major depressive or dysthymic disorder inchildren and adolescents. It has been extensively vali-dated and is designed for children and adolescents aged7 to 17 years.
CADS
The CADS is a validated self- and proxy-rated (par-ent and teacher) scale used with 12 to 18 year olds. Itis used to diagnose ADHD and can allow discrimina-tion between the subtypes predominantly inattentive,hyperactive–impulsive, and combined attention-deficit/hyperactivity disorder.
Children’s Y-BOCS
The Y-BOCS is a reliable instrument used to assessthe severity of obsessive-compulsive symptoms in chil-dren. The clinician initially notes the presence of obses-sions and compulsions based on observation and childand parent report and then rates the severity of thesesymptoms in terms of number, frequency, intensity, re-sistance, and interference.
CBCL
The CBCL is a validated parent-rated scale assessingthe frequency and intensity of behavioral and emo-tional difficulties shown by a child over the preceding6 months. It consists of eight syndrome scales (with-drawn, somatic complaints, anxious/depressed, socialproblems, thought problems, attention problems, delin-quent behavior, and aggressive behavior) and two com-posite scales (externalizing and internalizing problems).
Data Analysis
Correlations were calculated between scores on theQoL measure and clinical scales. A stepwise regressionwas then conducted to identify the best predictors ofQoL score.
Results
Correlations
There were significant negative correlations betweenQoL total scores and scores for the MASC, CDI,CADS, Y-BOCS, CBCL, and CBCL internalizing sub-scale (Table1). Self-domain scores were significantlynegatively related to scores on the MASC, CDI, CADS,
E D D Y E T A L .
736 Movement Disorders, Vol. 26, No. 4, 2011

Y-BOCS, CBCL, and MASC harm subscale. Environ-ment domain scores were related to Y-BOCS andCBCL total internalizing and externalizing scores.Relationships domain scores were significantly inver-sely associated with scores on the CDI, CADS, Y-BOCS, CBCL, and CBCL internalizing subscale.Finally, general QoL scores were significantly relatedto scores on the CDI, CADS, Y-BOCS, and CBCL totaland internalizing and externalizing subscales.For contextual items, YGTSS scores were positively
related to item D6 (Sr ¼ 0.423, P ¼ 0.002): ‘‘How of-ten have you had serious emotional or mental healthproblems that you felt you needed help with?’’ Thisitem was also positively related to Y-BOCS scores (Sr¼ 0.539, P < 0.001). Y-BOCS scores were also signifi-cantly positively related to item D1 (Sr ¼ 0.306, P ¼0.041): ‘‘How often did you have a conversation withan adult about something that is important to you?’’
Multiple Stepwise Regression
Total scores for all clinical measures were entered aspossible predictors into five models with total QoLscores and scores for the four QoL domains as depend-ent variables. This procedure was repeated usingappropriate subscale scores instead of total scores forthe MASC and CBCL. CBCL total scores were the bestpredictors for total QoL score and the environment do-main, Y-BOCS scores predicted scores for the generaldomain, MASC harm subscale scores predicted bestscores for the self domain, and CDI and Y-BOCSscores comprised the best model for the relationshipsdomain (Table 2).
DiscussionThe QoL of young people with TS appears to be sig-
nificantly adversely affected by a range of clinicalsymptoms. Features assessed by the Y-BOCS andCBCL seemed to be most predictive of QoL score,whereas tic severity, as measured by the YGTSS, wasnot found to be related to QoL. Perhaps tic severitywas less of a predictor of QoL in the more complexcases of TS assessed in the current sample, as other be-havioral difficulties were perceived to exert a relativelygreater impact on QoL. Another study reported norelationship between tic severity and QoL,7 althoughthis is in contrast with many other reports.1,3–5 Thesediscrepancies could reflect differing consideration ofthe role of comorbidities4,5 or differences in the age ofparticipants or in the measures used to assess tic sever-ity and QoL. However, one study,3 which reported acorrelation between tic severity and QoL, used self-report measures to assess both factors, and although aself-report QoL measure was used in the current study,tic severity was assessed with a clinician rated measure.It may be that an individual’s own interpretation oftheir tic severity could be more closely linked to theirperceived QoL than clinician ratings.Total QoL scores were lower in association with
greater symptoms of anxiety and depression. Anxietyhad a less widespread influence on QoL domains, butscores for the MASC harm subscale were specificallypredictive of scores for the self domain. This could sug-gest that negative feelings about the self in TS are mostclosely related to perfectionism and aspects of anxiouscoping behavior. Depressive symptoms were linked toscores for all four QoL domains, and along with symp-toms of OCD, predicted relationships domain scores.Difficulties in social interaction and relating to others
Table 1. Correlations between scores on clinical scales and QoL total and domain scores
Measure
Total QoL score Self domain score
Relationships domain
score
Environment domain
score
General domain
score
Sr P Sr P Sr P Sr P Sr P
CDI �0.511 0.000*** �0.442 0.000** �0.557 0.000*** �0.421 0.002** �0.413 0.003**CADS �0.421 0.003** �0.374 0.009** �0.366 0.011* �0.392 0.006** �0.422 0.003**MASC-total �0.290 0.041* �0.342 0.015* �0.276 0.052 �0.211 0.141 �0.256 0.072MASC-physical �0.143 0.323 �0.233 0.104 �0.165 0.252 �0.045 0.756 �0.136 0.347MASC-harm �0.246 0.085 �0.327 0.020* �0.216 0.132 �0.168 0.244 �0.130 0.370MASC-social �0.245 0.087 �0.223 0.120 �0.259 0.070 �0.274 0.054 �0.302 0.033*CBCL-total �0.390 0.006** �0.331 0.020* �0.324 0.023* �0.421 0.003** �0.471 0.001**CBCL-Internal �0.348 0.014* �0.281 0.051 �0.363 0.010* �0.339 0.017* �0.403 0.004**CBCL-External �0.275 0.055 �0.216 0.136 �0.216 0.135 �0.322 0.024* �0.392 0.005**Y-BOCS �0.401 0.006** �0.346 0.020* �0.363 0.014* �0.320 0.032* �0.496 0.001*YGTSS �0.088 0.547 0.090 0.540 �0.187 0.197 �0.149 0.306 �0.143 0.326
*P < 0.05.**P < 0.01.***P < 0.001.Sr, Spearman’s rho correlation coefficient; CDI, Child Depression Inventory Score; MASC, Multi-Dimensional Anxiety Scale for Children (Total, total score; Physical,physical subscale score; Harm, harm subscale score; Social, social anxiety subscale score); CBCL, Child Behavior Checklist (Total, total score; Internal: internalizingsubscale score; External, externalizing subscale score; Y-BOCS; Yale-Brown Obsessive Compulsive Scale Score; YGTSS, Yale Global Tic Severity Scale score).
C L I N I C A L C O R R E L A T E S O F Q O L I N T S
Movement Disorders, Vol. 26, No. 4, 2011 737

in TS, therefore, may be linked to a combination ofnegative evaluation and obsessive rumination.Symptoms of OCD were also related to scores
across all QoL domains and best predicted QoL inthe general domain. The positive correlation withcontextual item D1 could imply that more severesymptoms of OCD may lead a young person withTS to seek social support through communicationwith adults. Other correlations between a contextualitem and both Y-BOCS and YGTSS scores indicatedthat clinician ratings of symptom severity appearclosely related to patients’ own evaluation of theirexperience of TS and OCD.The degree of emotional and behavioral problems
(particularly internalizing difficulties) assessed by theCBCL was widely negatively related to QoL. This scalewas predictive of environmental domain and total QoLscores. Those young people with TS whose parents ratethem as exhibiting more evidence of social withdrawal,somatic complaints, and signs of anxiety and depres-sion, are most likely to report low QoL overall. How-ever, the range of symptoms covered by the CBCL maymean that this measure overlaps with other instru-ments, such as the Y-BOCS.The limitations of this study include small sample
size and the lack of a disease-specific instrument tomeasure QoL, which has not been developed to date.In addition, the variables included could only accountfor a limited amount of variance in QoL scores, thegreatest being 31% for the relationships domain.Future research should seek to further explain, howcomplex interactions between personality, environmen-tal, interpersonal, and cultural factors influence aspectsof QoL critical to young people living with TS.
Acknowledgments: The authors are grateful to Tourettes Action-UnitedKingdom and Tourette syndrome Association-USA for continuing sup-port. Dr. Tari Topolski collaborated during the validation of the Ital-ian version of the Youth Quality of Life Instrument-Research(YQOL-R).
References1. Elstner K, Selai CE, Trimble MR, Robertson MM. Quality of life
(QoL) of patients with Gilles de la Tourette syndrome. Acta Psy-chiatr Scand 2001;103:52–59.
2. Packer LE. Tic-related school problems: impact of functioning,accommodations and interventions. Behav Mod 2005;29:876–899.
3. Cutler D, Murphy T, Gilmour J, Heyman I. The quality of lifeof young people with Tourette syndrome. Child 2009;35:496–504.
4. Muller-Vahl K, Dodel I, Muller N, et al. Health-related quality oflife in patients with Gilles de la Tourette syndrome. Mov Disord2010;25:309–314.
5. Storch EA, Merlo LJ, Lack C, et al. Quality of life in youth withTourette’s syndrome and chronic tic disorder. J Clin Child AdolescPsychol 2007;36:217–227.
6. Lavenstein B, Cushner-Weinstein S, Weinstein S. Anxiety anddepression in children with Tourette syndrome versus epilepsy—Impact on quality of life, a comparative study. Mov Disord 2009;24(Supp1):S231.
7. Bernard BA, Stebbins GT, Siegel S, et al. Determinants of qualityof life in children with Tourette syndrome. Mov Disord 2009;24:1070–1073.
8. Edwards TC, Hueber CE, Connell FA, et al. Adolescent quality oflife, part I: contextual and measurement model. J Adolesc 2002;25:275–286.
9. Patrick DL, Edwards TC, Topolski T. Adolescent quality of lifepart II: initial validation of a new instrument. J Adolesc 2002;25:287–300.
10. Cavanna AE, Schrag A, Morley D, Orth M, Robertson MM, JoyceE, Critchley HD, Selai C. The Gilles de la Tourette syndrome-quality of life scale (GTS-QOL): development and validation. Neu-rology 2008;71:1410–1416.
11. Leckman JF, Riddle MA, Hardin MT, et al. The Yale Global TicSeverity Scale: initial testing of a clinician rated scale of tic sever-ity. J Am Acad Child Adolesc Psychiatry 1989;28:566–577.
12. March JS, Parker JDA, Sullivan K, Stallings P, Conners CK. TheMultidimensional Anxiety Scales for Children (MASC): factorstructure, reliability and validity. J Am Acad Child Adolesc Psychi-atry 1997;36:544–552.
13. Kovacs M.Children’s Depression Inventory (CDI).New York:Mul-tihealth Systems, Inc.;1992.
14. Conners CK.Rating scales for use in drug studies with children.Psychopharmacology Bulletin: Pharmacotherapy with children.Wa-shington, DC:Government Printing Office; 1973.
15. Scahill L, Riddle MA, McSwiggin-Harden M, et al. Children’sYale-Brown Obsessive Compulsive Scale: reliability and validity. JAm Acad Child Adolesc Psychiatry 1997;36: 844–852.
16. Achenbach T, Edelbrock C.Manual for the child behavior checklistand revised child behavior profile.Burlington, VT:University ofVermont Department of Psychiatry;1983.
Table 2. Results of the multiple stepwise regression analysis
Dependent variable Best predictor/s Percentage of variance explained Statistics
Total QoL CBCL total (B ¼ �0.35, t ¼ �2.56) 11 (R2 ¼ 0.13, adj ¼ 0.11) F (1,46) ¼ 6.55, P ¼ 0.014Self domain MASC harm (B ¼ �0.33, t ¼ �2.37) 9 (R2 ¼ 0.11, adj ¼ 0.09) F (1,46) ¼ 5.63, P ¼ 0.022Relationships domain CDI (B ¼ �0.41, t ¼ �3.04) 31 (R2 ¼ 0.34, adj ¼ 0.31) F (2,45) ¼ 11.41, P < 0.001
Y-BOCS (B ¼ �0.28, t ¼ �2.11)Environmental domain CBCL total (B ¼ �0.37, t ¼ �2.70) 12 (R2 ¼ 0.14, adj ¼ 0.12) F (1,46) ¼ 7.24, P ¼ 0.010General domain Y-BOCS (B ¼ �0.40 t ¼ �3.00) 15 (R2 ¼ 0.16, adj ¼ 0.15) F (1,46) ¼ 8.99, P ¼ 0.004
CBCL, Child Behavior Checklist; MASC, Multi-Dimensional Anxiety Scale for Children; CDI, Child Depression Inventory; Y-BOCS: Yale-Brown ObsessiveCompulsive Scale.
E D D Y E T A L .
738 Movement Disorders, Vol. 26, No. 4, 2011

Epoetin Alfa Increases FrataxinProduction in Friedreich’s AtaxiaWithout Affecting Hematocrit
Francesco Sacca, MD,1* Raffaele Piro, MD,1 Giuseppe DeMichele, MD,1 Fabio Acquaviva, MD,2 Antonella Antenora,MD,1 Guido Carlomagno, MD,3 Sergio Cocozza, MD,2
Alessandra Denaro, MBiol,1 Anna Guacci, MBiol,1 AngelaMarsili, MBiol,1 Gaetano Perrotta, MD,1 Giorgia Puorro,MBiol,1 Antonio Cittadini, MD,3 and Alessandro Filla, MD1
1Department of Neurological Sciences, University Federico II, Napoli,
NA, Italy; 2Department of Cellular and Molecular Biology, University
Federico II, Napoli, NA, Italy; 3Department of Internal Medicine and
Cardiovascular Sciences, University Federico II, Napoli, NA, Italy
ABSTRACTObjective of the study was to test the efficacy, safety,and tolerability of two single doses of Epoetin alfa inpatients with Friedreich’s ataxia. Ten patients weretreated subcutaneously with 600 IU/kg for the firstdose, and 3 months later with 1200 IU/kg. Epoetin alfahad no acute effect on frataxin, whereas a delayed andsustained increase in frataxin was evident at 3 monthsafter the first dose (135%; P < 0.05), and up to 6months after the second dose (154%; P < 0.001). Thetreatment was well tolerated and did not affect hemato-crit, cardiac function, and neurological scale. Singlehigh dose of Epoetin alfa can produce a considerablylarger and sustained effect when compared with lowdoses and repeated administration schemes previouslyadopted. In addition, no hemoglobin increase wasobserved, and none of our patients required phlebot-omy, indicating lack of erythropoietic effect of singlehigh dose of erythropoietin. VC 2010 Movement DisorderSociety
Key Words: Friedreich’s ataxia; Epoetin alfa; erythro-poietin; frataxin; iron
------------------------------------------------------------Additional Supporting Information may be found in the online version ofthis article.
*Correspondence to: Dr. Francesco Sacca, Department of NeurologicalSciences, University Federico II, Via Pansini, 5, 80131 Napoli, NA, Italy;[email protected].
Relevant conflicts of interest/financial disclosures: Nothing to report.Full financial disclosures and author roles may be found in the onlineversion of this article.
Received: 13 May 2010; Revised: 2 July 2010; Accepted: 12 August2010Published online 10 November 2010 in Wiley Online Library(wileyonlinelibrary.com). DOI: 10.1002/mds.23435
Friedreich’s ataxia (FA) is an autosomal recessiveataxia1 caused by a trinucleotide GAA expansion inthe first intron of the FXN gene.2 The gene encodes fora 210aa mitochondrial protein called frataxin, whosemRNA and protein levels are severely reduced in FA.3
It has been suggested that frataxin is involved in iron–sulphur cluster and heme biogenesis, iron binding/stor-age, and chaperone activity.4–6
Erythropoietin (EPO) is a glycoprotein that acts as amain regulator for erythropoiesis. Evidence suggeststhat both EPO and its receptor are expressed in thenervous tissue,7,8 and neuroprotective effects have beenshown in animal models of cerebral ischemicdamage.9,10
EPO increases frataxin levels in cultured human lym-phocytes from FA patients.11 However, frataxin pro-tein increase is not preceded by mRNA increase,suggesting that a post-transcriptional mechanism isinvolved.12 Two phase II clinical trials have tested EPOin FA patients. In the first, 12 patients were treatedwith 5,000 IU of Epoetin beta thrice a week (TIW) for8 weeks. This resulted in a 27% frataxin increase inperipheral blood mononuclear cells (PBMCs), reduc-tion in oxidative stress markers, and a small clinicalimprovement.13 The same group of investigators per-formed a second trial in which Epoetin beta was givento 8 patients at a dose of 2,000 IU TIW for 6 months.The results largely confirmed those of the first trial.However, 4 patients (50%) required repeatedphlebotomy.14
Patients and Methods
Study Design
We designed an open-label, phase IIa clinical trial totest the efficacy of two subcutaneous single high doseof Epoetin alfa (Eprex, Janssen-Cilag, Milano, Italy).The lower dose was 600 IU/kg body weight (BW)(max 40,000 IU) and the higher dose was 1200 IU/kg(max 80,000 IU). Doses were chosen based on the pre-vious pharmacokinetics studies15 and on the intent toreproduce a serum EPO concentration similar to previ-ous in vitro experiments.11 A 3-month washout wasprogrammed between the doses. Primary endpoint ofthe study was the change from baseline in frataxin lev-els in PBMCs at 24, 48, 96 hours, 7, 15, 30, and 60days. Secondary endpoints were safetyand tolerabilitymeasured with clinical scale, echocardiography, andlaboratory parameters. The local Ethics Committeeapproved the clinical trial, and it was registered atwww.clinicaltrials.gov, NCT00631202.
Patients
Ten patients were enrolled in the study after givinginformed consent (Table 1); 1 patient withdrew hisconsent 30 days after the first administration and was
E P O E T I N A L F A I N F R I E D R E I C H ’ S A T A X I A
Movement Disorders, Vol. 26, No. 4, 2011 739

not considered for endpoint evaluation. Inclusion crite-ria were clinical and molecular diagnosis of FA (18–50years of age). Exclusion criteria were idebenone treat-ment, wheelchair use, renal, hepatic or hematologicaldisease, positive thrombosis history, hypertension,acute disease, pregnancy, and breastfeeding.
Quantitative Analysis of Frataxin and EPO
PBMCs were extracted from 15 mL of ethylenedia-minetetraacetic acid (EDTA)-anticoagulated wholeblood using Leucosep tubes (Greiner Bio-one, Ger-many). PBMCs were lysed, and total protein was meas-ured using the bicinchoninic acid (BCA) assay. About7.125 lg of each protein extract was analyzed in dupli-cate with lateral-flow immunoassay16 and calibratedusing frataxin protein standard (kit and HamamatsuICA-1000 scanner; Mitosciences, Eugene, OR). Prelimi-nary test showed an intra-assay and interassay coeffi-cient of variability both <5%. Data from 31 carriersand 19 control individuals were analyzed in parallel.Serum concentrations of EPO were measured using anenzyme-linked immunosorbent assay (R&D Systems,Minneapolis, MN).
Secondary Outcomes
Laboratory parameters were monitored at screening,baseline, and 7, 15, 30, and 60 days after each admin-istration and comprised hematology, urine examina-tion, coagulation, and a serum routine biochemistrywith iron, ferritin and transferrin determination.Adverse events and blood pressure were monitored ateach visit. Electrocardiograms were performed atscreening and 30 days after each administration. TheInternational Cooperative Ataxia Rating Scale(ICARS)17 was measured at baseline, 7 and 30 days af-ter each administration, and 6 months after the lastdose.Conventional M-mode, two-dimensional imaging,
and quantitative regional strain and strain rate were
used to evaluate cardiac morphology and function.Echocardiography was performed at baseline and 6months after the second EPO administration.
Statistical Analysis
Statistical analysis for continuous variables was con-ducted by two-way ANOVA for repeated measures. Pvalues of less than 0.05 were considered statisticallysignificant. Posthoc analysis was performed with theDunnett’s test to compare basal levels with differenttime points (Graphpad Prism 5.0c).
Results
Frataxin
We did not observe significant variations of frataxinin the 24 hours to 60 days interval, either after the firstor the second EPO administration. Peaks wereobserved 96 hours after the first dose (mean increase8.9%; P ¼ 0.47) and 48 hours after the second(16.3%; P ¼ 0.34). Surprisingly, when analyzing fra-taxin levels throughout the study, we found a slow andsustained increase (Fig. 1). Basal frataxin was 12.7 6 3pg/lg total protein and rose to 17.1 6 5.8 pg/lg (35%relative increase from baseline; P < 0.05) 3 months af-ter the first Epoetin alfa administration. After the sec-ond injection, frataxin increased to 18.3 6 7 pg/lg(44% relative increase compared with baseline; P <0.01) 2 months later. Given this unexpected delayedeffect of Epoetin alfa, we decided to extend the obser-vation period. At 6 months from the second adminis-tration, we found frataxin to be 19.5 6 5.4 pg/lg(54% relative increase from baseline; range 14–144; P< 0.001). At 12 months, frataxin values were no lon-ger significantly higher than baseline (16.1 6 9 pg/lg;P > 0.05).
Table 1. Patient characteristics
Patient Age Sex Age at onset Disease duration GAA1 GAA2 ICARS baseline ICARS frataxin peak*
1 19 M 8 11 709 830 56 612 29 F 23 6 800 1000 36 393 30 F 18 12 600 1267 58 564 25 M 14 11 958 958 51 485 43 M 23 20 200 421 25 256 22 F 11 11 489 1022 39 367 22 M 15 7 734 934 49 528 19 M 9 10 752 1041 66 –9 31 F 15 16 355 561 68 7810 40 F 28 12 580 780 55 45Mean 29 6 8.2 17.2 6 6.4 11.8 6 4.2 602.8 6 232 863.7 6 253.9 48.6 6 13.1 48.9 6 15.4
Mean 6 SD for the 9 patients who completed the study.*ICARS performed 6 months after the second Epoetin alfa administration (month 9 in Fig. 1).GAA1, triplet repeat number in the minor allele; GAA2, triplet repeat number in the major allele; ICARS, International Cooperative Ataxia Rating Scale.15
S A C C A E T A L .
740 Movement Disorders, Vol. 26, No. 4, 2011

Serum EPO
Twenty-four hours after the first administration, se-rum EPO increased from 11.2 6 8.6 mIU/mL at base-line to 1153 6 354 mIU/mL (Supporting InformationFigure). EPO then decreased to basal levels 7 days afterinjection. The second injection produced similar results(19.7 6 19.6 and 3343 6 657 mIU/mL).
Iron
Total iron decreased from 75.0 6 39.1 lg/dl at baselineto 44.4 6 24.4 lg/dl (P <0.05) at 7 days and returned to81.1 6 31.5 lg/dl at 30 days. The second injection pro-duced similar results (83.6 6 46.5, 31.0 6 14.4, 76.8 634.3 lg/dl; P < 0.01). Ferritin decreased from 104.9 698.7 ng/mL at baseline to 18.5 6 12.4 ng/mL (P < 0.001)at 7 days after the first dose and returned to 73.4 6 79.2ng/mL at 30 days. The higher dose caused similar results(70.36 90.2, 30.56 41.4, 62.16 77.6 ng/mL, P < 0.01).Transferrin remained stable for the same time points (firstdose 250.1 6 58.68, 273.4 6 48.5, 244.6 6 58.8 mg/dl;second dose 285.1 6 53.0, 273.8 6 64.9, 288.1 6 52.3mg/dl, P ¼ NS). Mean transferrin saturation decreased by44.6% (P < 0.01) 7 days after the first and 63.2% (P <0.001) 7 days after the second dose, when compared withbaseline.
Secondary Outcomes
A total of 10 grade 1 adverse events were recorded af-ter the lower dose and two after the higher dose (myal-gia, flu-like syndrome, hypotension, nausea, itching andreaction at injection site, headache, nocturnal sweating,and extremities warm feeling). Blood pressure and elec-trocardiograms showed no change during the study. He-matocrit, erythrocytes, hemoglobin, and all otherlaboratory safety parameters were not influenced bytreatment. Echocardiographic measures showed nochange from baseline. As a prototype of myocardial con-
tractility, the left ventricle strain was �19.9 6 5.1% atbasal and �18.5 6 6.7% at 6 months (P ¼ NS). ICARSwas unchanged during the study (Table 1; baseline 48.66 13.1 vs. 48.9 6 15.4 at frataxin peak, P ¼ NS).
DiscussionIn vivo, our study did not replicate the previous in
vitro findings of an acute increase in frataxin after EPOstimulation. Although the lack of statistical significanceof the early increase we observed may be because of thesmall sample size, any clinical significance of such asmall change is likely to be limited. In contrast, an unex-pected delayed effect of Epoetin alfa on frataxin levels inPBMCs was observed 3 months after 600 IU/kg of Epoe-tin alfa (35% increase). The second injection caused anadditional increase in frataxin up to 54% above base-line. A carry-over effect cannot be excluded and couldbe responsible of the observed effect. Interestingly, theincrease was evident after serum EPO returned to basallevels, suggesting that a direct stimulation of the EPO re-ceptor is not involved in the delayed effect. Previous clin-ical trials13,14 were designed with continuous low doseadministration, and the interval between EPO adminis-tration and frataxin increase could not be assessed. Wedemonstrate that single high dose of EPO can produce aconsiderably larger and sustained effect when comparedwith low TIW doses. In addition, no hemoglobinincrease was observed, and none of our patients requiredphlebotomy, indicating lack of erythropoietic effect ofsingle high dose of EPO. In contrast, our study failed todemonstrate a clinical improvement that was reported inthe past trials. This could be explained by a lower sensi-tivity of ICARS, compared with Friedreich Ataxia Rat-ing Scale (FARS) or the scale for the assessment andrating of ataxia (SARA) scale, or by the presence of alearning effect of repeated measuring in the previoustrials.Exact effect of EPO on frataxin is unknown. EPO
administration is known to reduce circulating hepci-din,18 and as a consequence ferroportin inhibition isreleased and iron stores are reduced.19 In this study,EPO reduced transferrin saturation, indicating ironredistribution from peripheral tissues to the bone mar-row. The absence of a clear hematopoietic effectremains unclear. Perhaps, very high single EPO dosesmay have a very strong and rapid relocating effect oniron, but repeated dosing may be necessary to obtain ahematopoietic effect. This iron relocating effect may bea clue to explain the delay in frataxin increase. Thesustained effect of EPO remains obscure, and long-last-ing post-transcriptional effects cannot be excluded.In conclusion, it is possible to achieve a considerable
increase in frataxin using a very simple administrationscheme of Epoetin alfa with no hematological sideeffects. In the absence of a control group, the presentdata should still be regarded as preliminary until a
FIG. 1. Frataxin levels after two single doses of Epoetin alfa. Frataxinlevels are shown as pg/lg of total protein extract from the patientswho completed the study (n 5 9, gray bars), carriers (white bar; n 531; 25.3 6 4.9 pg/lg total protein), and healthy controls (black bar; n5 19; 41.3 6 7.5 pg/lg total protein). All values are mean 6 standarddeviation (statistical significance compared with baseline 5 *P < 0.05,**P < 0.01, ***P < 0.001).
E P O E T I N A L F A I N F R I E D R E I C H ’ S A T A X I A
Movement Disorders, Vol. 26, No. 4, 2011 741

randomized, placebo-controlled trial, has been per-formed.
Acknowledgments: The study was supported by ‘‘Associazione il cuore inun dono’’ Cardito, Naples, Italy; ‘‘Associazione Italiana per la lotta alleSindromi Atassiche (AISA) sez. Campania’’, Napoli, Italy. We thank Jans-sen-Cilag SpA (Italy) for donating the study drug.
References1. Harding AE. Friedreich’s ataxia: a clinical and genetic study of 90
families with analysis of early diagnostic criteria and intrafamilialclustering of clinical features. Brain 1981;104:589–620.
2. Campuzano V, Montermini L, Molto MD, et al. Friedreich’sataxia: autosomal recessive disease caused by an intronic GAA tri-plet repeat expansion. Science 1996;271:1423–1427.
3. Pianese L, Turano M, Lo Casale MS, et al. Real time PCR quanti-fication of frataxin mRNA in the peripheral blood leukocytes ofFriedreich’s ataxia patients and carriers. J Neurol Neurosurg Psy-chiatry 2004;75:1061–1063.
4. Stehling O, Elsasser HP, Bruckel B, et al. Iron–sulfur protein matu-ration in human cells: evidence for a function of frataxin. HumMol Genet 2004;13:3007–3015.
5. Cavadini P, O’Neill HA, Benada O, Isaya G. Assembly and iron-binding properties of human frataxin, the protein deficient in Frie-dreich’s ataxia. Hum Mol Genet 2002;11:217–227.
6. Bulteau AL, O’Neill HA, Kennedy MC, et al. Frataxin acts as aniron chaperone protein to modulate mitochondrial aconitase activ-ity. Science 2004;305:242–245.
7. Masuda S, Nagao M, Takanaka K, et al. Functional erythropoietinreceptor of the cells with neuronal characteristics: comparisonwith receptor properties of erythroid cells. J Biol Chem 1993;268:11208–11216.
8. Sanchez PE, Fares RP, Risso JJ, et al. Optimal neuroprotection byerythropoietin requires elevated expression of its receptor in neu-rons. Proc Natl Acad Sci USA 2009;106:9848–9853.
9. Sakanaka M, Wen TC, Matsuda S, et al. In vivo evidence thaterythropoietin protects neurons from ischemic damage. Proc NatlAcad Sci USA 1998;95:4635–4640.
10. Gunnarson E, Song Y, Kowalewski JM, et al. Erythropoietin mod-ulation of astrocyte water permeability as a component of neuro-protection. Proc Natl Acad Sci USA 2009;106:1602–1607.
11. Sturm B, Stupphann D, Kaun C, et al. Recombinant human eryth-ropoietin: effects on frataxin expression in vitro. Eur J Clin Invest2005;35:711–717.
12. Acquaviva F, Castaldo I, Filla A, et al. Recombinant human eryth-ropoietin increases frataxin protein expression without increasingmRNA expression. Cerebellum 2008;7:360–365.
13. Boesch S, Sturm B, Hering S, et al. Friedreich’s ataxia: clinicalpilot trial with recombinant human erythropoietin. Ann Neurol2007;62:521–524.
14. Boesch S, Sturm B, Hering S, et al. Neurological effects ofrecombinant human erythopoietin in Friedreich’s ataxia: a clinicalpilot trial. Mov Disord 2008;23:1940–1944.
15. Ramakrishnan R, Cheung WK, Wacholtz MC, et al. Pharmacoki-netics and pharmacodynamic modeling of recombinant humanerythropoietin after single and multiple doses in healthy volun-teers. J Clin Pharmacol 2004;44:991–1002.
16. Willis JH, Isaya G, Gakh O, et al. Lateral-flow immunoassay forthe frataxin protein in Friedreich’s ataxia patients and carriers.Mol Genet Metab 2008;94:491–497.
17. Trouillas P, Takayanagi T, Hallet M, et al. International coopera-tive ataxia rating scale for pharmacological assessment of the cere-bellar syndrome. J Neurol Sci 1997;145:205–211.
18. Weiss G, Theurl I, Eder S, et al. Serum hepcidin concentration inchronic haemodialysis patients: associations and effects of dialysis,iron and erythropoietin therapy. Eur J Clin Invest 2009;39:883–890.
19. Lasocki S, Millot S, Andrieu V, et al. Phlebotomies or erythropoie-tin injections allow mobilization of iron stores in a mouse modelmimicking intensive care anemia. Crit Care Med 2008;36:2388–2394.
Somatosensory TemporalDiscrimination Tested in Patients
Receiving Botulinum ToxinInjection for Cervical Dystonia
Alessandra Scontrini, MD,1 Antonella Conte, MD, PhD,1,2
Giovanni Fabbrini, MD,1,2 Carlo Colosimo, MD,1 Flavio DiStasio, MD,1 Gina Ferrazzano, MD,1 Alfredo Berardelli,MD1,2*
1Department of Neurology and Psychiatry, "Sapienza," University of
Rome, Rome, Italy; 2Department of Neurological Sciences and
Neuromed Institute, "Sapienza," University of Rome, Rome, Italy
ABSTRACTWe designed this study to find out more about the rela-tionship between the sensory effects of Botulinum toxintype A (BTX) and the clinical benefits of BTX therapy inpatients with cervical dystonia (CD). In 24 patients withCD, we tested sensory temporal discrimination (STD) inthe affected and two unaffected body regions (neck,hand, and eye) before and 1 month after BTX injection. In8 out of the 24 patients with CD, STDT values were testedbilaterally in the three body regions before, 1 and 2months after BTX injection. As expected, STD testing dis-closed altered STD threshold values in all three bodyregions tested (affected and unaffected by dystonicspasms) in patients with CD. STD threshold valuesremained unchanged at all time points of the follow-up inall CD patients. The lack of BTX-induced effects on STDthresholds suggests that STD recruits neural structuresuninvolved in muscle spindle afferent activation. VC 2010Movement Disorder Society
Key Words: botulinum toxin; cervical dystonia; soma-tosensory temporal discrimination
------------------------------------------------------------*Correspondence to: Dr. Alfredo Berardelli, Department of NeurologicalSciences, ‘‘Sapienza’’, University of Rome, Viale dell’Universita, 30, 00185Rome, Italy; [email protected].
Relevant conflicts of interest/financial disclosures: Nothing to report.Full financial disclosures and author roles may be found in the onlineversion of this article.
Received: 27 January 2010; Revised: 28 June 2010; Accepted: 30August 2010Published online 13 December 2010 in Wiley Online Library(wileyonlinelibrary.com). DOI: 10.1002/mds.23447
S A C C A E T A L .
742 Movement Disorders, Vol. 26, No. 4, 2011

IntroductionBotulinum toxin (BTX) type A is widely used to
treat neurological conditions characterized by increasedmuscle activity.1–3 BTX acts peripherally by inhibitingacetylcholine release from the presynaptic neuromuscu-lar terminals.4,5 Animal experiments and human stud-ies in patients with dystonia show that BTX acts alsoat intrafusal fibre level thereby reducing muscle spindleafferent discharges.6,7
Investigating possible BTX-induced effects on sensoryfunctions, Walsh and Hutchinson8 found that BTX ther-apy partly reversed the abnormal spatial discriminationin patients with dystonia. Dystonia also leads to abnor-mal somatosensory temporal discrimination (STD).9–12
Whether BTX restores the altered STD threshold(STDT) in patients with dystonia is still unknown.We designed this study to find out more about the
relationship between the sensory effects of BTX andthe clinical benefits of BTX injected into the neckmuscles for CD. To do so, in patients with CD, wetested STD in the affected and two unaffected bodyregions (neck, hand, and eye) before and about 1month after BTX injection. In a further group ofpatients, we also tested STDT values bilaterally in thethree body regions at baseline, 1 and 2 months afterBTX. We also sought a possible correlation betweenchanges in STDT values after BTX treatment andchanges in clinical severity scores for dystonia.
Subjects and Methods
Subjects
We recruited 24 outpatients with primary CD (17women; mean age: 59.5 6 2.5 years, range 35–83 years,mean education level: 11.0 6 1.2 years). Three patientswere naive to BTX treatment (Table 1). In a first group of16 patients, STDT values were tested on one side in threebody regions before and 1 month after BTX injection inthe neck muscles. As a control group, we recruited 16age-matched healthy control subjects (11 women, meanage 59.066 3.4 years, range 35–81; education level: 10.26 1.3 years). In the second group of 8 patients, STDT val-ues were tested bilaterally in three body regions before, 1and 2 months after BTX. The severity of motor impair-ment was assessed with the Toronto Western SpasmodicTorticollis Rating Scale (TWSTRS). Clinical assessmentwas performed at baseline and 1 month after treatment inthe group of patients tested unilaterally (n¼ 16); and atbaseline, 1 and 2 months after BTX in the group ofpatients tested bilaterally (n ¼ 8).13 All patients weretreated with BTX type A injected into the dystonic neckmuscles (BOTOX, Allergan; DYSPORT, Ipsen).
Stimuli and STD Procedure
Somatosensory discrimination was tested by deliver-ing paired stimuli starting at an interstimulus interval
(ISI) of 0 msec, followed by progressively increasingISIs (in 10 msec steps).11 The surface skin electrodewas applied to the neck, the index finger (hand), andnear the orbit (eye). Subjects had to report whetherthey perceived a single stimulus or two temporally sep-arated stimuli. The first of three consecutive ISIs atwhich participants recognized the stimuli as temporallyseparated was considered the STDT. Each session com-prised four separate blocks. The STDT for each stimu-lated body site was defined as the average of fourSTDT values, one for each block, and was entered inthe data analysis.9,10
Statistical Analysis
Wilcoxon’s test was used to analyze changes in se-verity scores before and after BTX therapy in thegroup of 16 patients tested unilaterally. Friedman’srepeated measures ANOVA was used to analyzechanges in severity scores before, 1 and 2 months afterBTX in the 8 patients tested bilaterally. Repeated-measures ANOVA with factor ‘‘Time’’(before and aftertreatment) and ‘‘Body part’’ (neck, hand, and eye) wasused to compare data obtained from patients at base-line and after BTX treatment. Between-group repeatedmeasures ANOVA with factor ‘‘Time’’ (before, 1 and2 months after BTX), factor ‘‘side’’ (left and rightbody side), and ‘‘body region’’ (neck, hand and eye)was used to compare STDT changes in patients naiveand non-naive to BTX tested bilaterally. STDT valuesin patients and healthy subjects were compared in abetween-group repeated measures ANOVA with factor‘‘Body part’’ as the main factor. Spearman’s correlationcoefficient was used for assessing possible correlationsbetween clinical features and changes in STDT valuesin patients. Tukey Honest Significance Difference Testwas used for post hoc analysis. Values are expressed asmeans and standard error (SE).
ResultsAfter patients with CD received BTX therapy, their
clinical severity scores decreased significantly (Z ¼ 3.34,Asymp Sig. ¼ 0.0008). Friedman’s repeated measuresANOVA for clinical severity scores in the subgroup ofCD patients tested with a longer follow-up post BTXalso showed a significant improvement of motor symp-toms after BTX (v2 ¼ 14.25, Asymp Sig. ¼ 0.001).The intensity of electrical stimuli for STDT testing was
statistically unchanged after BTX (‘‘hand’’ pre-BTX vs.post-BTX: 76 4 vs.76 3mA, P ¼ 0.27; ‘‘neck’’ pre-BTXvs. post-BTX: 4 6 0.9 vs. 4 6 1mA, P ¼ 0.14; ‘‘eye’’ pre-BTX vs. post-BTX: 36 0.8 vs. 36 0.7 mA; P ¼ 0.17).As expected, STDT values in the affected and two unaf-
fected body regions tested were higher in patients than inhealthy subjects. Between-group repeated measuresANOVA comparing STDT values in the group of CDpatients (pre-BTX) and in the healthy subjects showed a
S T D T E S T E D I N P A T I E N T S R E C E I V I N G B T X F O R C D
Movement Disorders, Vol. 26, No. 4, 2011 743

significant factor ‘‘group’’ (F(1,30) ¼ 26.24; P ¼ 0.0001)a significant factor ‘‘Body part’’ (F(1,2) ¼ 3.76; P ¼ 0.02)but a nonsignificant interaction of factor ‘‘group’’ and‘‘Body part’’ (F(2,60) ¼ 0.77; P ¼ 0.46) (Fig.1).BTX left the altered STDT in the three body
regions tested unchanged. Repeated-measuresANOVA showed no significant effect of the factor‘‘Time: pre-BTX vs. post-BTX’’ (F(1,15) ¼ 2.23; P ¼0.15), a significant effect of the factor ‘‘Body part’’(F(2,30) ¼ 4.08; P ¼ 0.02) but no significant interac-tion between factors ‘‘Time’’ and ‘‘Body part’’(F(2,30) ¼ 0.27; P ¼ 0.76). STDT values in the CDgroup were higher in the ‘‘hand’’ than in the ‘‘eye’’and ‘‘neck’’ and remained unchanged after BTX(Fig. 2).BTX left the altered STDT unchanged also in the
group of patients tested bilaterally independently onwhether the patients were naive or not to BTX at alltime points tested after BTX. Between-group repeated-measures, ANOVA showed no significant effect of thefactor ‘‘Time’’ (F(2,10) ¼ 1.44; P ¼ 0.28), no signifi-cant effect of factor "Group" (F(1,5) ¼ 1.41; P ¼0.28), no significant effect of factor "side" (F(1,5) ¼2.43; P ¼ 0.17), a significant effect of the factor ‘‘Bodypart’’ (F(2,10) ¼ 7.11; P ¼ 0.01), but no significantinteraction between main factors (P > 0.05).No correlation was found between disease duration
and severity scores or between changes in severityscores and differences in the STDT values at baseline
and after BTX treatment in patients with CD in thethree body parts (P > 0.05).
DiscussionThe novel finding in our study is that clinically effec-
tive BTX injected in the dystonic neck muscles in CDpatients failed to restore STDT values in both affectedand unaffected body regions.
Table 1. Demographic and clinical features of patients with cervical dystonia studied
Nr Age onset Duration Spread BTX duration Severity pre-BTX Severity post-BTX
1 56 3 no 2 11 112 43 3 no 3 7 53 51 30 OMD 61 yr 11 11 64 53 30 no 18 11 75 40 32 no 12 9 76 60 17 OMD 60 yr 9 12 87 21 18 no 15 7 38 46 8 no 5 10 89 42 20 WC 43 yr 14 24 2010 47 4 no 2 8 511 65 11 no 8 4 212 51 6 no 2 10 513 34 22 no 14 6 414 27 31 no 6 10 1015 51 4 no 3 8 616 23 22 Arm 23 yr 2 10 617 34 1 no 0 14 618 47 5 no 0 40 3919 53 4 no 2 20 1120 41 18 no 4 36 2321 28 30 no 7 31 1522 35 35 no 3 31 1223 42 22 no 4 23 1024 48 14 no 0 28 17
mean 43.25 16.25 6.08 15.88 10.25SE 2.33 2.28 1.09 2.14 1.65
FIG. 1. Somatosensory temporal discrimination thresholds tested inthree body parts (neck, hand, and eye) in patients with cervical dysto-nia (CD) and healthy subjects. Each column represents mean value; thebars represent standard error.
S C O N T R I N I E T A L .
744 Movement Disorders, Vol. 26, No. 4, 2011

We first excluded the possibility that BTX injectedinto dystonic muscles failed to alter STDT valuesowing to changes in attention levels.11 We also excludethe possibility that BTX left STDT values unchangedbecause we injected BTX at excessively low dosesbecause after BTX therapy patients’ clinical scores formotor deficits significantly improved. By testingpatients naive to BTX therapy, taking however intoaccount the small sample size, we believe unlikely thatthe lack of changes in STDT values is due to previousBTX injection-related denervation processes. By testingCD patients with a 2 months follow-up, we alsoexclude the possibility that STDT changes could have adifferent time course compared to motor symptomsrelief after BTX injection. The absence of relationshipbetween the altered STD values and the clinical bene-fits of BTX injected into the neck muscles provideduseful information on sensory dysfunction in CD. STDis a complex physiological process that, in addition toperipheral sensory pathways, involves several corticaland subcortical circuits. Cortical and subcortical struc-tures involved in STD include parietal cortex, prefron-tal areas, subthalamus, putamen, and possibly thecerebellum.14,15
Unlike Walsh and Hutchinson8 who reported a par-tial and transient BTX-induced change in spatial dis-crimination, in our patients, we failed to show BTX-induced changes in STDTs. By acting at the gammamotor endings, BTX can reduce muscle spindle afferentdischarges and thereby spindle inflow to the centralnervous system.7,16 BTX could, therefore, modulatefunctional activity in the sensory-motor corticalareas.17–21 This explanation agrees with Walsh andHutchinson8 who attributed BTX-induced changes inspatial discrimination to cortical remodeling of theupper-limb sensory areas after a change in intrafusal
afferent inflow. Because STDTs remained unchangedafter BTX, we conjecture that STD recruits neuralstructures uninvolved in muscle spindle afferent activa-tion and that cortical remodelling possibly present afterBTX in CD patients does not influence STDTs. Previ-ous studies in patients with dystonia suggested thatBTX can partially restore changes in the somatotopyof the sensory-motor cortex investigated with neuro-physiological techniques.20,21 If we consider this latterhypothesis, our finding that BTX left STDT valuesunchanged in the three body regions tested (affectedand unaffected by the dystonic motor symptoms) sug-gests that cortical integration of STDT processes doesnot depend on the size of the cortical map related tothe three body regions.Whether BTX acts on other types of sensory affer-
ents, besides Ia fibre and gamma motor endings,remains an open question.
References1. Jankovic J. Treatment of hyperkinetic movement disorders. Lancet
Neurol 2009;8:844–856.
2. Simpson DM, Blitzer A, Brashear A, et al. Assessment: botulinumneurotoxin for the treatment of movement disorders (an evidence-based review): report of the Therapeutics and Technology Assess-ment Subcommittee of the American Academy of Neurology. Neu-rology 2008;70:1699–1706.
3. Ward AB, Molenaers G, Colosimo C, Berardelli A. Clinical valueof Botulinum toxin in neurological indications. Eur J Neurol2006;13:20–26.
4. Abbruzzese G, Berardelli A. Neurophysiological effects of botuli-num toxin type A. Neurotox Res. 2006;9:109–114.
5. Valls-Sole J, Tolosa ES, Ribera G. Neurophysiological observa-tions on the effects of botulinum toxin treatment in patients withdystonic blepharospasm. J Neurol Neurosurg Psychiatry 1991;54:310–313.
6. Filippi GM, Errico P, Santarelli R, et al. Botulinum A toxineffects on rat jaw muscle spindles. Acta Otolaryngol 1993;113:400–404.
7. Trompetto C, Curra A, Buccolieri A, et al. Botulinum toxinchanges intrafusal feedback in dystonia: a study with the tonicvibration reflex. Mov Disord 2006;21:777–782.
8. Walsh R, Hutchinson M. Molding the sensory cortex: spatial acu-ity improves after botulinum toxin treatment for cervical dystonia.Mov Disord 2007;22:2443–2446.
9. Fiorio M, Tinazzi M, Scontrini A, et al. Tactile temporal discrimi-nation in patients with blepharospasm. J Neurol Neurosurg Psy-chiatry 2008;79:796–798.
10. Tinazzi M, Fiorio M, Bertolasi L, et al. Timing of tactile andvisuotactile events is impaired in patients with cervical dystonia. JNeurol 2004;25:85–90.
11. Scontrini A, Conte A, Defazio G, et al. Somatosensory temporaldiscrimination in patients with primary focal dystonia. J NeurolNeurosurg Psychiatry 2009;80:1315–1319.
12. Bradley D, Whelan R, Walsh R, et al. Temporal discriminationthreshold: VBM evidence for an endophenotype in adult onset pri-mary torsion dystonia. Brain 2009;132:2327–2335.
13. Consky ES, Lang AE.Clinical assessments of patients with cervi-cal dystonia. In:Jankovic J,Hallett M, editors.Therapy with botu-linum toxin.New York, NY:MarcelDekker, Inc.:1994; p 211–237.
14. Pastor MA, Day BL, Macaluso E, et al. The functional neuroan-atomy of temporal discrimination. J Neurosci 2004;24:2585–2591.
FIG. 2. Somatosensory temporal discrimination thresholds tested inthree body parts (neck, hand, and eye) in patients with cervical dysto-nia (CD) before and 1 month after botulinum toxin (BTX) injected in theneck muscles. Each column represents mean value; the bars representstandard error.
S T D T E S T E D I N P A T I E N T S R E C E I V I N G B T X F O R C D
Movement Disorders, Vol. 26, No. 4, 2011 745

15. Lacruz F, Artieda J, Pastor MA, et al. The anatomical basis ofsomaesthetic temporal discrimination in humans. J Neurol Neuro-surg Psychiatry 2007;54:1077–1081.
16. Trompetto C, Bove M, Avanzino L, et al. Intrafusal effects of bot-ulinum toxin in post-stroke upper limb spasticity. Eur J Neurol2008;15:367–370.
17. Priori A, Berardelli A, Mercuri B, et al. Physiological effects pro-duced by BoNT treatment of upper limb dystonia. Changes in re-ciprocal inhibition between forearm muscles. Brain 1995;118:801–877.
18. Gilio F, Curra A, Lorenzano C, et al. Effects of botulinum toxintype A on intracortical inhibition in patients with dystonia. AnnNeurol 2000;48:20–26.
19. Byrnes ML, Thickbroom GW, Wilson SA, et al. The corticomotorrepresentation of upper limb muscles in writer’s cramp and changesfollowing botulinum toxin injection. Brain 1998;121: 977–988.
20. Thickbroom GW, Byrnes ML, Stell R, et al. Reversible reorganisa-tion of the motor cortical representation of the hand in cervicaldystonia. Mov Disord 2003;18:395–402.
21. Kanovsky P, Streitova H, Dufek J, et al. Change in lateralizationof the P22/N30 cortical component of median nerve somatosen-sory evoked potentials in patients with cervical dystonia after suc-cessful treatment with botulinum toxin A. Mov Disord 1998; 13:108–117.
Levodopa is Not a UsefulTreatment for Lesch-Nyhan
Disease
Jasper E. Visser, MD, PhD,1,2* David J. Schretlen, PhD,3
Bastiaan R. Bloem, MD, PhD,1 Hyder A. Jinnah, MD, PhD4
1Department of Neurology, Donders Institute for Brain, Cognition and
Behavior, Radboud University Nijmegen Medical Centre, Nijmegen,
The Netherlands; 2Department of Neurology, Amphia Hospital, Breda,
The Netherlands; 3Department of Psychiatry and Behavioral Sciences,
Johns Hopkins University School of Medicine, Baltimore, Maryland,
USA; 4Departments of Neurology and Human Genetics, Emory
University School of Medicine, Atlanta, Georgia, USA
ABSTRACTLesch-Nyhan disease (LND) is characterized by dystonia,cognitive abnormalities, and self-injurious behavior. Noeffective therapies are available. LND is associated with apresynaptic dopaminergic deficit, but the reported effectsof dopamine replacement therapy are conflicting. The cur-rent prospective open-label study assesses the effects oflevodopa on both neurological and behavioral features ofLND. All 6 study participants discontinued levodopa early,due to lack of effect and sometimes worsening of motorfunction. The results provide important clues for patho-physiological mechanisms and suggestions for futuretreatment options.VC 2011Movement Disorder Society
Key Words: Lesch-Nyhan disease; treatment; levo-dopa; dystonia; dyskinesias; self-injurious behavior
------------------------------------------------------------Additional Supporting Information may be found in the online version ofthis article.
*Correspondence to: Dr. Jasper E. Visser, Department of Neurology (HP935), Radboud University Nijmegen Medical Centre, PO Box 9101,Nijmegen 6500 HB, The Netherlands; [email protected].
Relevant conflicts of interest/financial disclosures: Nothing to report.This study was sponsored by the Lesch-Nyhan Syndrome Children’sResearch Foundation and HD053312.Full financial disclosures and author roles may be found in the onlineversion of this article.
Received: 24 May 2010; Revised: 19 August 2010; Accepted: 20September 2010Published online 31 January 2011 in Wiley Online Library(wileyonlinelibrary.com). DOI: 10.1002/mds.23478
IntroductionLesch-Nyhan disease (LND) is caused by a muta-
tion in the gene encoding the purine salvage enzymehypoxanthine-guanine phosphoribosyl transferase(HPRT).1,2 Near-complete HPRT deficiency causeshyperuricemia and a characteristic neurobehavioralphenotype. Patients exhibit a movement disorder domi-nated by dystonia, chorea, and hypotonia3; cognitivedysfunction characterized by attentional and executivedeficits; and behavioral abnormalities including self-in-jurious behavior.4,5 Effective therapies for the neurobe-havioral features of LND are currently lacking.2
Available evidence indicates that LND is associatedwith a presynaptic dopaminergic deficit. Postmortemhuman brain tissue shows a 60 to 90% decrease in ba-sal ganglia dopamine levels, whereas other neurotrans-mitter systems are preserved.6,7 In vivo PET imagingstudies demonstrate a low dopamine transporter (DAT)density8 and a decreased dopamine uptake in presynap-tic terminals.9 The relation between HPRT deficiencyand dopamine dysfunction is further supported by a50% decrease in basal ganglia dopamine content inHPRT-deficient knockout mice10–12 and in HPRT-defi-cient dopaminergic cell lines.13 Despite the loss of do-pamine-related markers, there is no loss of nigraldopamine neurons in autopsy studies.7
These findings suggest that treatment with the dopa-mine precursor levodopa (L-dopa) may be helpful, butthe few reported effects so far are conflicting. Motorfunction improved in 3 patients,14–16 worsened in 4,17,18
and remained unchanged in another 2.14,19 Similar con-tradictory effects have been reported for the effects of L-dopa on self-injury, including improvement,17 deteriora-tion,18 or no change.17 The interpretation of these reportsis hampered by lack of detailed information about treat-ment duration and clinical assessment. Subtle changes inspecific domains of motor, cognitive, or behavioral func-tion may have been missed. To examine more carefullythe effects of L-dopa on both neurological and behavioral
V I S S E R E T A L .
746 Movement Disorders, Vol. 26, No. 4, 2011

features of LND, we conducted a prospective, open label,dose-escalation study.
Patients and Methods
Patients
We intended to include 10 LND patients, rangingfrom 2 to 40 years of age. Patients had been diagnosedwith LND based on DNA mutation analysis or residualHPRT enzyme activity, and all demonstrated a clinicalpicture typical of LND (Table 1). Exclusion criteriaincluded a known intolerance to L-dopa/carbidopa.Written consent was obtained from patients or theirparents before inclusion. The study was approved bythe local ethical committee.
Intervention
L-Dopa/carbidopa (4:1) was initiated at a low dose,typically starting at 50/12.5 mg once per day, andtitrated to a maximum of 20 mg/kg L-dopa (divided 3times per day) over 2 to 6 weeks. The study had a pro-spective open-label design.
Outcome Measures
The primary outcome measure was dystonia severity,as assessed in an unblinded fashion, using the Burke-Fahn-Marsden dystonia rating scale.20 Clinical assess-ments were scheduled at baseline, before starting medi-cation, and at least 1 month after reaching the targetor maximally tolerated dose. Secondary outcome varia-bles included the severity of self-injurious behaviors,determined via a weekly telephone questionnaire devel-oped for this purpose (Supporting Information Table1).
ResultsNone of the subjects completed the planned titration
phase, and enrollment was terminated before the targetnumber of 10 participants was reached. The averageduration of therapy was �2 weeks (range 1 day to 4weeks). The average daily dose of L-dopa/carbidopareached was 200/50 mg (range 50/12.5 to 600/150 mg)per day.The reasons for early discontinuation are shown in
Table 2. Four participants showed increased motordysfunction, in the form of rigidity and tongue stiff-ness, limb flailing, and wild, agitated movements. Oneparticipant discontinued the medication after hisbrother developed side effects, even though he had not.There were no significant effects of L-dopa on self-injury in any participant.
DiscussionAvailable biochemical, functional imaging, and ex-
perimental data indicate that LND is associated withan early, relatively selective presynaptic dopaminergicdeficit, and that the subsequent basal ganglia dysfunc-tion is an important contributor to the motor, cogni-tive, and behavioral abnormalities.21 The currentprospective open-label study investigated the effect ofL-dopa therapy on motor and behavioral abnormalitiesin LND. L-Dopa treatment did not prove to be benefi-cial in either domain and was associated with a wor-sening of motor function in several patients, resultingin an early termination of the study. This early L-dopa-induced exacerbation of the movement disorder pro-vides some clues to LND pathogenesis.As opposed to adults, where it usually results in par-
kinsonism, decreased dopamine in children usuallycauses dystonia, for which L-dopa may be beneficial.Examples include inherited deficiency of tyrosine
Table 1. Demographics and clinical characteristics of enrolled subjects
Case
Age
(yr) Mutation
HPRT
activity Medication
Motor disorder
Self-injurous behaviorClinial signs BFM
1 27 428–432del TGCAG,insAGCAAA
<1% Allopurinol, chlorothiazide Dystonia, chorea, ballism,hypotonia, ophistotonus,hyperreflexia
97.5 Biting fingers, lips
2 12 IVS7þ5G>A <1% Allopurinol, diazepam, omeprazole,fluticasone, mometason, cetirizine,levalbuterol
Dystonia, rigidity, spasticity,hyperreflexia
69.5 Biting various body parts;head banging
3 10 IVS7þ5G>A <1% Allopurinol, diazepam, Dystonia, hypotonia 33.5 Biting fingers, arms4 3 508C>T <1% Allopurinol, gabapentin,
benzodiazepine, ranitidineDystonia, hypotonia,ophistotonus
57.5 Biting fingers; head banging;hitting himself
5 3 10delC N/A Allopurinol, gabapentin, lorazepam Dystonia, hypotonia 61.0 Biting buccal mucosa;hitting
Abbreviations used: HPRT, hypoxanthine-guanine phosphoribosyl transferase; BFM, Burke-Fahn-Marsden dystonia rating scale; N/A, not available.
L E V O D O P A F O R L E S C H - N Y H A N D I S E A S E
Movement Disorders, Vol. 26, No. 4, 2011 747

hydroxylase (TH), or GTP cyclohydrolase (GTP-CH).22
Experimental studies support the concept that the age atwhich striatal dopamine depletion occurs has a pro-found influence on both motor outcome and responseto L-dopa. For example, in adult rats, destruction of ni-grostriatal dopamine neurons results in a motor syn-drome resembling parkinsonism, but the same lesion inneonatal rats causes hyperactivity and aggressiveness.23
And, unlike the amelioration of motor impairmentsobserved in adult-lesioned rats, treatment of neonatallylesioned animals with L-dopa exacerbates their hyperac-tivity.24 It has been proposed that differences in adapt-ive neuroplasticity—referring to receptor function,postreceptor signaling pathways, electrophysiologicalfunction, and synaptic changes—may account for thesephenotypic differences caused by dopaminergic lesionsat young compared to adult age.Analogous adaptive processes have been suggested
for the etiology of L-dopa-induced dyskinesias inadvanced Parkinson’s disease (PD).25 It is tempting to
speculate that similar neuroplastic changes may be re-sponsible for the dystonia and the L-dopa-induced
exacerbation in LND. Indeed, descriptions of themotor complications, by patients and their caretakers,
closely resemble L-dopa-induced dyskinesias.26 Simi-larly, impulse control disorders in PD, which have
been regarded as the behavioral counterpart of L-dopa-induced dyskinesias,25 might share intrinsic properties
with the impulsive behaviors in LND, and it has beenhypothesized that also the pathogenesis of self-injurious
behavior in LND is similar to drug-induced dyskine-sias.27 The absence of major effects of L-dopa on self-
injurious behavior in the current study might beexplained by insufficient treatment duration, or differ-
ent pathological mechanisms (and sensitivity) causingmotor and behavioral symptoms in LND.It has been hypothesized that the improvement reported
in a single LND patient treated with L-dopa aged from 10months is attributable to the (at least partial) preventionof the compensatory neuroplastic changes by restoring L-
dopa levels at an early stage in neurodevelopment.15
Unfortunately, this observation was not substantiated byobjective measures. Such a preventive effect of very earlyL-dopa treatment cannot be ruled out but could not beconfirmed in our 2 youngest subjects of 3 years of age.Another LND patient, treated after the study ended,started at 12 months of age and showed no obviousimprovement of the motor disorder after a year. It shouldbe noted that starting treatment before age 2 is not practi-cal in LND patients, as diagnoses typically often aredelayed for years.2
The observation that some patients with TH defi-ciency are acutely sensitive to L-dopa-induced hyperki-nesias,28 prompted us to start with very low doses. Itcould, however, be argued that the dyskinesiasobserved reflected an extreme sensitivity that couldhave been avoided by using even lower doses or slowertitrations—similar to some experiences with dopa-re-sponsive dystonia. Such an extreme sensitivity seemsunlikely, for several reasons. First, again after the for-mal study ended, we treated an adult with dystoniadue to partial HPRT deficiency with escalating dosesof L-dopa for 6 months. He never benefited, but devel-oped worsening of his motor disorder after 4 to 5months, ultimately leading to discontinuation of thedrug. Additionally, 4 classic LND patients included inthe current study were given trials of dopamine ago-nists, starting with 0.5 mg ropinirole or 0.125 mg pra-mipexole daily and titrating upward. None experienceddyskinesias, but none benefited either and all discontin-ued. Finally, mechanistically, TH and GTP-CH defi-ciency are associated with a selective loss ofcatecholamines whereas LND causes loss of TH, aro-matic L-amino acid decarboxylase, vesicular monoa-mine transporter, and DAT.2 Therefore, themechanism in LND is clearly more complex thanDOPA-responsive dystonia, and responses to medica-tions can, therefore, be expected to be different.Based on the assumption that the neurobehavioral
features in LND share pathophysiological mechanismswith dyskinesias in PD, treatments that have proven
Table 2. Effect of L-dopa on motor function and self-injury
Case
Treatment
duration
Maximum dose
L-dopa/carbidopa (mg daily) Effect on motor disorder Effect on self-injury
1 4 weeks 600/150 Stiff arms, pronounced andless controllable movements
No obvious change
2 1 day 50/12.5 No apparent changea No obvious change3 1 day 50/12.5 Hyperactive No obvious change4 2 weeks 150/37.5 Twisted and stiff tongue,
facial twitching, limb flailingNo obvious change
5 4 weeks 150/37.5 Stiff and agitated movements Better mood, accompaniedby less need for restraints
aThe mother of subject #2 discontinued L-dopa because of side effects experienced by his brother, subject #3.
V I S S E R E T A L .
748 Movement Disorders, Vol. 26, No. 4, 2011
beneficial for dyskinesias could be considered for LNDin the near future. Examples include the glutamate an-tagonist amantadine,26 or deep brain surgery (DBS).In fact, 4 LND patients who underwent DBS havebeen reported in the literature to date,27,29,30 andsome showed improvements in motor dysfunctionand behavior. However, long-term effects are unclear,and more studies are needed before DBS can be consid-ered effective and safe in LND.In summary, the current study demonstrates that L-
dopa is not useful for the treatment of LND and mightworsen the movement disorder, but it also provides im-portant clues for pathophysiological mechanisms andhints to future treatment options.
References1. Lesch M, Nyhan WL. A familial disorder or uric acid metabo-
lism and central nervous system function. Am J Med 1964;36:561–570.
2. Jinnah HA, Friedmann T. Lesch-Nyhan disease and its variants.In: Scriver CR, Beaudet AL, Sly WS, Valle D, editors. The meta-bolic and molecular bases of inherited disease. New York:McGraw-Hill; 2001. p 2537–2570.
3. Jinnah HA, Visser JE, Harris JC, et al. Delineation of themotor disorder of Lesch-Nyhan disease. Brain 2006;129:1201–1217.
4. Schretlen DJ, Harris JC, Park KS, Jinnah HA, del Pozo NO. Neu-rocognitive functioning in Lesch-Nyhan disease and partial hypo-xanthine-guanine phosphoribosyltransferase deficiency. J IntNeuropsychol Soc 2001;7:805–812.
5. Matthews WS, Solan A, Barabas G. Cognitive functioning inLesch-Nyhan syndrome. Dev Med Child Neurol 1995;37:715–722.
6. Lloyd KG, Hornykiewicz O, Davidson L, et al. Biochemical evi-dence of dysfunction of brain neurotransmitters in the Lesch-Nyhan syndrome. N Engl J Med 1981;305:1106–1111.
7. Saito Y, Ito M, Hanaoka S, Ohama E, Akaboshi S, Takashima S.Dopamine receptor upregulation in Lesch-Nyhan syndrome: apostmortem study. Neuropediatrics 1999;30:66–71.
8. Wong DF, Harris JC, Naidu S, et al. Dopamine transporters aremarkedly reduced in Lesch-Nyhan disease in vivo. Proc Natl AcadSci USA 1996;93:5539–5543.
9. Ernst M, Zametkin AJ, Matochik JA, et al. Presynaptic dopaminer-gic deficits in Lesch-Nyhan disease. N Engl J Med 1996;334:1568–1572.
10. Dunnett SB, Sirinathsinghji DJ, Heavens R, Rogers DC, KuehnMR. Monoamine deficiency in a transgenic (Hprt-) mouse modelof Lesch-Nyhan syndrome. Brain Res 1989;501:401–406.
11. Finger S, Heavens RP, Sirinathsinghji DJ, Kuehn MR, DunnettSB. Behavioral and neurochemical evaluation of a transgenicmouse model of Lesch-Nyhan syndrome. J Neurol Sci 1988;86:203–213.
12. Jinnah HA, Wojcik BE, Hunt M, et al. Dopamine deficiency in agenetic mouse model of Lesch-Nyhan disease. J Neurosci 1994;14:1164–1175.
13. Egami K, Yitta S, Kasim S, et al. Basal ganglia dopamine lossdue to defect in purine recycling. Neurobiol Dis 2007;26:396–407.
14. Manzke H, Gustmann H, Koke HG, Nyhan WL. Hypoxanthineand tetrahydrobiopterin treatment of a patient with features of theLesch-Nyhan syndrome. Adv Exp Med Biol 1986;195(Pt A):197–203.
15. Serrano M, Perez-Duenas B, Ormazabal A, et al. Levodopa ther-apy in a Lesch-Nyhan disease patient: pathological, biochemical,neuroimaging, and therapeutic remarks. Mov Disord 2008;23:1297–1300.
16. Mizuno TI, Yugari Y. Letter: self mutilation in Lesch-Nyhan syn-drome. Lancet 1974;1:761.
17. Jankovic J, Caskey TC, Stout JT, Butler IJ. Lesch-Nyhan syn-drome: a study of motor behavior and cerebrospinal fluid neuro-transmitters. Ann Neurol 1988;23:466–469.
18. Watts RW, Spellacy E, Gibbs DA, Allsop J, McKeran RO, Sla-vin GE. Clinical, post-mortem, biochemical and therapeuticobservations on the Lesch-Nyhan syndrome with particular ref-erence to the Neurological manifestations. Q J Med 1982;51:43–78.
19. Hunter TC, Melancon SB, Dallaire L, et al. Germinal HPRTsplice donor site mutation results in multiple RNA splicing prod-ucts in T-lymphocyte cultures. Somat Cell Mol Genet 1996;22:145–150.
20. Burke RE, Fahn S, Marsden CD, Bressman SB, Moskowitz C,Friedman J. Validity and reliability of a rating scale for the pri-mary torsion dystonias. Neurology 1985;35:73–77.
21. Visser JE, Bar PR, Jinnah HA. Lesch-Nyhan disease and the basalganglia. Brain Res Brain Res Rev 2000;32:449–475.
22. Muller U. The monogenic primary dystonias. Brain 2009;132:2005–2025.
23. Moy SS, Criswell HE, Breese GR. Differential effects of bilateraldopamine depletion in neonatal and adult rats. Neurosci BiobehavRev 1997;21:425–435.
24. Breese GR, Baumeister AA, McCown TJ, et al. Behavioral differ-ences between neonatal and adult 6-hydroxydopamine-treated ratsto dopamine agonists: relevance to neurological symptoms in clini-cal syndromes with reduced brain dopamine. J Pharmacol ExpTher 1984;231:343–354.
25. Voon V, Fernagut PO, Wickens J, et al. Chronic dopaminergicstimulation in Parkinson’s disease: from dyskinesias to impulsecontrol disorders. Lancet Neurol 2009;8:1140–1149.
26. Fabbrini G, Brotchie JM, Grandas F, Nomoto M, Goetz CG. Lev-odopa-induced dyskinesias. Mov Disord 2007;22:1379–1389; quiz1523.
27. Taira T, Kobayashi T, Hori T. Disappearance of self-mutilatingbehavior in a patient with lesch-nyhan syndrome after bilateralchronic stimulation of the globus pallidus internus. Case report. JNeurosurg 2003;98:414–416.
28. Grattan-Smith PJ, Wevers RA, Steenbergen-Spanjers GC, Fung VS,Earl J, Wilcken B. Tyrosine hydroxylase deficiency: clinical mani-festations of catecholamine insufficiency in infancy. Mov Disord2002;17:354–359.
29. Cif L, Biolsi B, Gavarini S, et al. Antero-ventral internal pallidumstimulation improves behavioral disorders in Lesch-Nyhan disease.Mov Disord 2007;22:2126–2129.
30. Pralong E, Pollo C, Coubes P, et al. Electrophysiological character-istics of limbic and motor globus pallidus internus (GPI) neuronsin two cases of Lesch-Nyhan syndrome. Neurophysiol Clin 2005;35:168–173.
L E V O D O P A F O R L E S C H - N Y H A N D I S E A S E
Movement Disorders, Vol. 26, No. 4, 2011 749

Long-Term Follow-up of BotulinumToxin Therapy for Focal Hand
Dystonia: Outcome at10 Years or More
Codrin Lungu, MD,1 Barbara I. Karp, MD,2
Katharine Alter, MD,3 Regina Zolbrod,1
Mark Hallett, MD1*
1Medical Neurology Branch, National Institute of Neurological
Disorders and Stroke, National Institutes of Health, Bethesda,
Maryland, USA; 2Combined Neuroscience IRB, National Institutes of
Health, Bethesda, Maryland, USA; 3Physical Disabilities Section,
Warren Grant Magnuson Clinical Center, National Institutes of Health,
Bethesda, Maryland, USA
ABSTRACTBackground: Previous studies have explored the efficacyand safety of botulinum neurotoxin (BoNT) treatment forFocal hand dystonia (FHD), but none have followed a largenumber of patients for 10 years or more.
Methods: Retrospective study, with benefit and weak-ness assessed on a 0 to 4 subjective scale. Demo-graphic, clinical and treatment characteristics wereanalyzed using t tests and Pearson correlations.
Results: Twenty FHD patients had 10 years or longertreatment. Interinjection intervals were variable. Musi-cians were more likely to wait longer between injectionsand had less complex dystonia. There was a trend forlarger benefit in women and with shorter intervals. Thedose increased over time. Dystonia characteristics didnot predict response or side-effects, but benefit magni-tude predicted longer compliance. No serious side-effects or antibody-mediated resistance occurred.
Conclusion: This is the longest reported periodof BoNT treatment in the largest FHD cohort. BoNTtherapy for FHD remains safe and effective after morethan a decade of treatment. VC 2011 Movement Disorder
Society
Key Words: botulinum; dystonia; focal hand dystonia;safety; efficacy
IntroductionFocal hand dystonia (FHD) is a task specific focal
dystonia.1 Botulinum neurotoxin (BoNT) injection is
------------------------------------------------------------*Correspondence to: Dr. Mark Hallett, NIH Medical Neurology, Bldg 10,Rm 7D37, MSC 1428, 10 Center Dr, Bethesda, MD 20892 USA; [email protected].
Relevant conflicts of interest/financial disclosures: Nothing to report.Full financial disclosures and author roles may be found in the onlineversion of this article.
Received: 29 April 2010; Revised: 23 July 2010; Accepted: 3 October2010Published online 1 February 2011 in Wiley Online Library(wileyonlinelibrary.com). DOI: 10.1002/mds.23504
an effective treatment,2,3 reducing pathologic neuro-muscular junction hyperactivity.4 We previouslyreported the safety and effectiveness of BoNT injec-tions for FHD in patients receiving injections for up to6 years.5 We continue to follow a large cohort, with20 patients now treated for 10 years or longer.
Subjects and Methods
Patients
Patients were selected from the NIH BoNT clinicdatabase. Diagnosis was established by initial evalua-tion and confirmed by ongoing observation.
BoNT Injections
Subjects returned for repeat treatment when they feltthat reinjection was necessary, no more frequently thanevery 3 months. The initial dose and targets werebased on clinical judgment,6 with the starting dosechosen at the lower end of the range and subsequentadjustments. Injections were performed under EMGguidance, as previously described,7 rarely supplementedby ultrasound. OnabotulinumtoxinA (BotoxVR , Aller-gan) at a concentration of 50 to 100 U/mL was usedfor each injection, except one single injection of Rima-botulinumtoxinB (MyoblocVR , Solstice Neurosciences)in one patient.
Patient Evaluations
Muscle strength was assessed using the MRC scale.The toxin distribution and dose were adjusted basedon report of weakness and benefit from previous injec-tions. Benefit was assessed on a subjective scale from 0to 4, based on percent restoration of normal function:0 ¼ none, 1 ¼ minimal (1–25% restoration of func-tion), 2 ¼ mild (26–50%), 3 ¼ moderate (51–75%), 4¼ excellent (76–100%). The patients self-assessed weak-ness following the previous injection using a similarscale, as 0 (none), 1 (<25% reduction in normalstrength), 2 (26–50%), 3 (51–75%), or 4 (76–100%).The rating procedures and treatment guidelines wereconsistent throughout the study, and all the informationwas charted in a Microsoft Access database.
L U N G U E T A L .
750 Movement Disorders, Vol. 26, No. 4, 2011
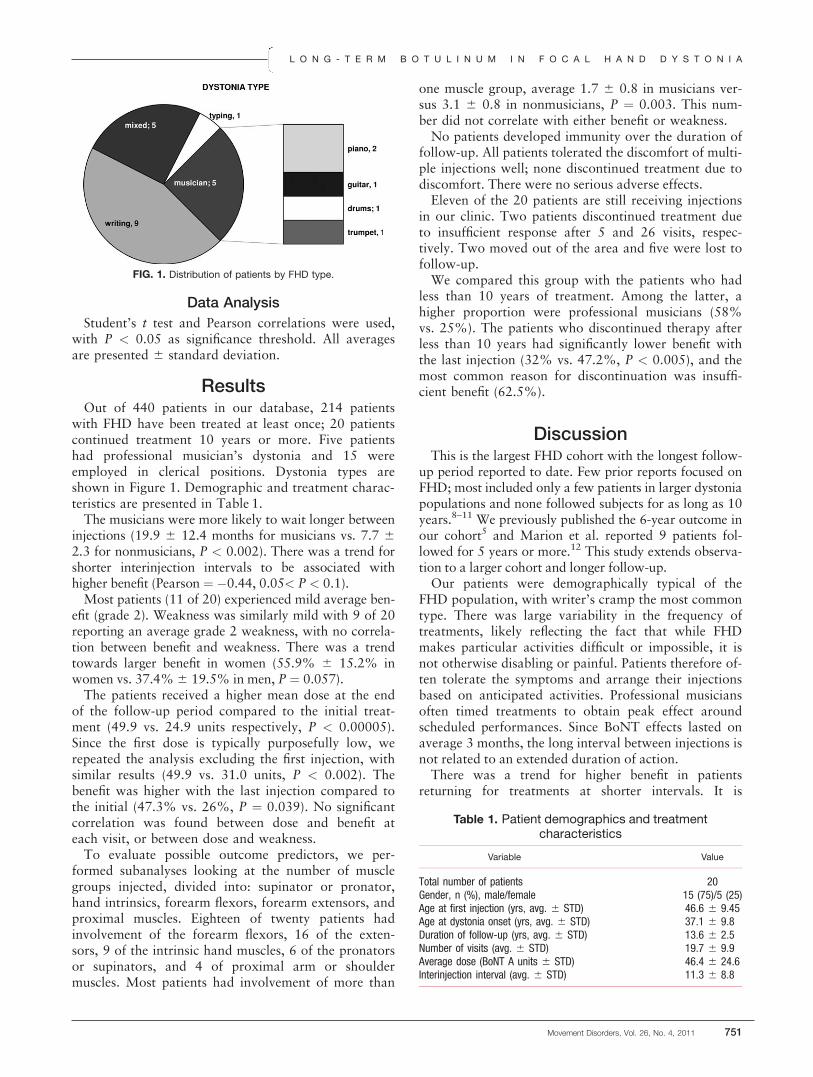
Data Analysis
Student’s t test and Pearson correlations were used,with P < 0.05 as significance threshold. All averagesare presented 6 standard deviation.
ResultsOut of 440 patients in our database, 214 patients
with FHD have been treated at least once; 20 patientscontinued treatment 10 years or more. Five patientshad professional musician’s dystonia and 15 wereemployed in clerical positions. Dystonia types areshown in Figure 1. Demographic and treatment charac-teristics are presented in Table 1.The musicians were more likely to wait longer between
injections (19.9 6 12.4 months for musicians vs. 7.7 62.3 for nonmusicians, P < 0.002). There was a trend forshorter interinjection intervals to be associated withhigher benefit (Pearson ¼ �0.44, 0.05< P < 0.1).Most patients (11 of 20) experienced mild average ben-
efit (grade 2). Weakness was similarly mild with 9 of 20reporting an average grade 2 weakness, with no correla-tion between benefit and weakness. There was a trendtowards larger benefit in women (55.9% 6 15.2% inwomen vs. 37.4%6 19.5% in men, P ¼ 0.057).The patients received a higher mean dose at the end
of the follow-up period compared to the initial treat-ment (49.9 vs. 24.9 units respectively, P < 0.00005).Since the first dose is typically purposefully low, werepeated the analysis excluding the first injection, withsimilar results (49.9 vs. 31.0 units, P < 0.002). Thebenefit was higher with the last injection compared tothe initial (47.3% vs. 26%, P ¼ 0.039). No significantcorrelation was found between dose and benefit ateach visit, or between dose and weakness.To evaluate possible outcome predictors, we per-
formed subanalyses looking at the number of musclegroups injected, divided into: supinator or pronator,hand intrinsics, forearm flexors, forearm extensors, andproximal muscles. Eighteen of twenty patients hadinvolvement of the forearm flexors, 16 of the exten-sors, 9 of the intrinsic hand muscles, 6 of the pronatorsor supinators, and 4 of proximal arm or shouldermuscles. Most patients had involvement of more than
one muscle group, average 1.7 6 0.8 in musicians ver-sus 3.1 6 0.8 in nonmusicians, P ¼ 0.003. This num-ber did not correlate with either benefit or weakness.No patients developed immunity over the duration of
follow-up. All patients tolerated the discomfort of multi-ple injections well; none discontinued treatment due todiscomfort. There were no serious adverse effects.Eleven of the 20 patients are still receiving injections
in our clinic. Two patients discontinued treatment dueto insufficient response after 5 and 26 visits, respec-tively. Two moved out of the area and five were lost tofollow-up.We compared this group with the patients who had
less than 10 years of treatment. Among the latter, ahigher proportion were professional musicians (58%vs. 25%). The patients who discontinued therapy afterless than 10 years had significantly lower benefit withthe last injection (32% vs. 47.2%, P < 0.005), and themost common reason for discontinuation was insuffi-cient benefit (62.5%).
DiscussionThis is the largest FHD cohort with the longest follow-
up period reported to date. Few prior reports focused onFHD; most included only a few patients in larger dystoniapopulations and none followed subjects for as long as 10years.8–11 We previously published the 6-year outcome inour cohort5 and Marion et al. reported 9 patients fol-lowed for 5 years or more.12 This study extends observa-tion to a larger cohort and longer follow-up.Our patients were demographically typical of the
FHD population, with writer’s cramp the most commontype. There was large variability in the frequency oftreatments, likely reflecting the fact that while FHDmakes particular activities difficult or impossible, it isnot otherwise disabling or painful. Patients therefore of-ten tolerate the symptoms and arrange their injectionsbased on anticipated activities. Professional musiciansoften timed treatments to obtain peak effect aroundscheduled performances. Since BoNT effects lasted onaverage 3 months, the long interval between injections isnot related to an extended duration of action.There was a trend for higher benefit in patients
returning for treatments at shorter intervals. It is
FIG. 1. Distribution of patients by FHD type.
Table 1. Patient demographics and treatmentcharacteristics
Variable Value
Total number of patients 20Gender, n (%), male/female 15 (75)/5 (25)Age at first injection (yrs, avg. 6 STD) 46.6 6 9.45Age at dystonia onset (yrs, avg. 6 STD) 37.1 6 9.8Duration of follow-up (yrs, avg. 6 STD) 13.6 6 2.5Number of visits (avg. 6 STD) 19.7 6 9.9Average dose (BoNT A units 6 STD) 46.4 6 24.6Interinjection interval (avg. 6 STD) 11.3 6 8.8
L O N G - T E R M B O T U L I N U M I N F O C A L H A N D D Y S T O N I A
Movement Disorders, Vol. 26, No. 4, 2011 751

possible that earlier reinjection enhances residual benefitfrom prior treatments. As noted in earlier studies,5,13
we found no correlation between dose and benefit.Accurate selection, localization and dose adjustmentsare likely more important outcome determinants.14,15
Our cohort required a gradual increase in dose overtime. This is only partly explained by the choice of alow initial dose, since the gradual increase continuedover the later years of treatment. As benefit alsoincreased, it is possible that tolerance led to less weak-ness with a given dose, allowing higher doses andimproved benefit. This dynamic has been seen in someprevious studies,8 but not in others.5,16
There is a large range of response to BoNT injec-tions. We were unable to identify factors that predictan individual’s response, other than a strong tendencyfor women to respond better, possibly explained by asmaller muscle mass allowing the toxin to diffuse morereadily to the motor endplate in women. Previous stud-ies proposed an inverse relation between dystonia com-plexity and benefit, with subjects requiring injection ofmore muscles benefiting less.7,17 We did not confirmthis, finding no such correlation.The professional musicians in our cohort required injec-
tion of fewer muscles, possibly reflecting the exquisitetask specificity of musician’s dystonia. The need to main-tain finely skilled motor control and to minimize weak-ness is crucial for musicians,18–20 and the fewer musclesinjected might also reflect the need to minimize weakness.We also note a smaller proportion of musicians amongthe patients continuing treatment more than 10 yearscompared to the rest of our cohort, which may be indica-tive of a higher threshold for satisfactory benefit.None of the patients followed for more than 10 years
developed immunity despite exposure to the first Botox(Allergan) batch, which was associated with antibodiesdeveloping in 10% of cervical dystonia treatments. Thenewer formulation is less immunogenic,21 and immunore-sistance tends to develop in the first 4 years of treatment.22
We show that the risk of developing immunoresistance af-ter more than one decade of FHD treatment is low.Among the patients who stopped BoNT therapy while
under our care, the most common reason was insufficientbenefit. The average benefit at the last visit before stop-ping was significantly lower than the average benefit inpatients continuing therapy for more than 10 years, sug-gesting that magnitude of benefit is an important factordetermining continuation of therapy.It is important to analyze the long-term outcome
data for FHD separate from other dystonias, since theBoNT response rates differ. FHD has a lower overallresponse rate, with about 50% of patients receiving atleast mild benefit compared to 80% for cervical dysto-nia and over 90% for blepharospasm.23,24
This study is limited in that it is retrospective anduncontrolled, which limits the strength of any conclu-sion. In addition, our primary outcome assessments are
self-reported scales of benefit and weakness. All FHDresearch shares this limitation, as there are no widelyaccepted rating scales applicable to all FHD types.Patients continued therapy for over 10 years in spite of
only mild benefit, suggesting that even partial improve-ment may be worthwhile. BoNT injections maintainedefficacy for over a decade, with good tolerability and nonew side effects emergent with long-term treatment.
References1. Sheehy MP, Marsden CD. Writers’ cramp-a focal dystonia. Brain
1982;105 (Part 3):461–480.
2. Kruisdijk JJ, Koelman JH, Ongerboer de Visser BW, et al. Botuli-num toxin for writer’s cramp: a randomised, placebo-controlledtrial and 1-year follow-up. J Neurol Neurosurg Psychiatr 2007;78:264–270.
3. Simpson DM, Blitzer A, Brashear A, et al. Assessment: botulinumneurotoxin for the treatment of movement disorders (an evidence-based review): report of the therapeutics and technology assess-ment subcommittee of the American academy of neurology. Neu-rology 2008;70:1699–1706.
4. Grumelli C, Verderio C, Pozzi D, et al. Internalization and mecha-nism of action of clostridial toxins in neurons. Neurotoxicology2005;26:761–767.
5. Karp BI, Cole RA, Cohen LG, et al. Long-term botulinum toxintreatment of focal hand dystonia. Neurology 1994;44:70–76.
6. Karp BI. Botulinum toxin treatment of occupational and focalhand dystonia. Mov Disord 2004;19 (Suppl 8):S116–S119.
7. Cohen LG, Hallett M, Geller BD, Hochberg F. Treatment of focaldystonias of the hand with botulinum toxin injections. J NeurolNeurosurg Psychiatr 1989;52:355–363.
8. Mejia NI, Vuong KD, Jankovic J. Long-term botulinum toxinefficacy, safety, and immunogenicity. Mov Disord 2005;20:592–597.
9. Hsiung GY, Das SK, Ranawaya R, et al. Long-term efficacy ofbotulinum toxin A in treatment of various movement disordersover a 10-year period. Mov Disord 2002;17:1288–1293.
10. Naumann M, Albanese A, Heinen F, et al. Safety and efficacy ofbotulinum toxin type A following long-term use. Eur J Neurol2006;13 (Suppl 4):35–40.
11. Chen R, Karp BI, Hallett M. Botulinum toxin type F for treat-ment of dystonia: long-term experience. Neurology 1998;51:1494–1496.
12. Marion MH, Afors K, Sheehy MP. [Problems of treating writer’scramp with botulinum toxin injections: results from 10 years ofexperience]. Rev Neurol (Paris) 2003;159(10 Part 1):923–927.
13. Yoshimura DM, Aminoff MJ, Olney RK. Botulinum toxin therapyfor limb dystonias. Neurology 1992;42(3 Part 1):627–630.
14. Comella CL, Buchman AS, Tanner CM, et al. Botulinum toxininjection for spasmodic torticollis: increased magnitude of benefitwith electromyographic assistance. Neurology 1992;42:878–82.
15. Molloy FM, Shill HA, Kaelin-Lang A, Karp BI. Accuracy of mus-cle localization without EMG: implications for treatment of limbdystonia. Neurology 2002;58:805–807.
16. Lees AJ, Turjanski N, Rivest J, et al. Treatment of cervical dysto-nia hand spasms and laryngeal dystonia with botulinum toxin.J Neurol 1992;239:1–4.
17. Rivest J, Lees AJ, Marsden CD. Writer’s cramp: treatment withbotulinum toxin injections. Mov Disord 1991;6:55–59.
18. Jankovic J, Ashoori A. Movement disorders in musicians. MovDisord 2008;23:1957–1965.
19. Frucht SJ. Focal task-specific dystonia of the musicians’ hand—apractical approach for the clinician. J Hand Ther 2009;22:136–142.
20. Cole R, Hallett M, Cohen LG. Double-blind trial of botulinum toxinfor treatment of focal hand dystonia. Mov Disord 1995;10:466–471.
21. Jankovic J, Vuong KD, Ahsan J. Comparison of efficacy and im-munogenicity of original versus current botulinum toxin in cervicaldystonia. Neurology 2003;60:1186–1188.
L U N G U E T A L .
752 Movement Disorders, Vol. 26, No. 4, 2011
22. Jankovic J, Schwartz K. Response and immunoresistance to botuli-num toxin injections. Neurology 1995;45:1743–1746.
23. Hallett M, Benecke R, Blitzer A, Comella CL. Toxicon. 2009.54(5):628–633.
24. Jankovic J. Botulinum toxin therapy for cervical dystonia. Neuro-tox Res 2006;9:145–148.
Mitochondrial Mimicry ofMultiple System Atrophy of the
Cerebellar Subtype
Arpan R. Mehta, B.A., B.M., B.Ch.,1
Susan H. Fox, M.R.C.P., Ph.D.,1
Mark Tarnopolsky, M.D., Ph.D., F.R.C.P.,2
and Grace Yoon, M.D., F.R.C.P., F.C.C.M.G.3*
1Movement Disorder Clinic, Toronto Western Hospital, University of
Toronto, Toronto, Canada; 2Division of Neuromuscular and
Neurometabolic Disease, McMaster University Medical Center,
Hamilton, Canada; 3Divisions of Clinical/Metabolic Genetics and
Neurology, The Hospital for Sick Children, University of Toronto,
Toronto, Canada
ABSTRACTBackground: We describe a patient with clinical and ra-diological findings suggestive of multiple system atro-phy of the cerebellar subtype (MSA-C). Methods/Results: Sequencing of the polymerase-c 1 (POLG1)gene revealed the patient had compound heterozygousmutations of the POLG1 gene. Muscle biopsy revealedthe presence of multiple mitochondrial DNA deletionsand depletion, confirming the pathogenic nature of thePOLG1 mutations. Discussion: This case expands thespectrum of phenotypes associated with POLG1 muta-tions to include multiple system atrophy and promptsfurther consideration regarding whether routine screen-ing for POLG1 mutations is indicated in this patientpopulation. VC 2011 Movement Disorder Society
Key Words: mitochondrial disease; multiple systematrophy; polymerase gamma gene; parkinsonism; ataxia
Mitochondrial disorders can result from either pri-mary defects in the mitochondrial DNA (mtDNA) ordefects in nuclear encoded proteins that affect mtDNAstructure or function. The maintenance of mtDNA rep-lication is critically dependent upon mtDNA polymer-ase-c,1 encoded by the nuclear genes POLG1 andPOLG2. Mutations in POLG1 have been described in
------------------------------------------------------------Additional Supporting Information may be found in the online version ofthis article.
*Correspondence to: Dr. Grace Yoon, Divisions of Clinical/MetabolicGenetics and Neurology, The Hospital for Sick Children, University ofToronto, 555 University Avenue, Toronto, Ontario M5G 1X8, Canada;[email protected].
Relevant conflicts of interest/financial disclosures: Nothing to report.Full financial disclosures and author roles may be found in the onlineversion of this article.
Received: 23 July 2010; Revised: 22 September 2010; Accepted: 11October 2010Published online 21 January 2011 in Wiley Online Library(wileyonlinelibrary.com). DOI: 10.1002/mds.23510
patients with diverse clinical presentations that includeparkinsonism and cerebellar ataxia.2
Here, for the first time, we describe a patient whopresented with clinical and radiological findings sugges-tive of multiple system atrophy (MSA) of the cerebellarsubtype (MSA-C), but was shown to have mutations ofPOLG1. This case highlights the importance of consid-ering primary mitochondrial disorders in the differentialdiagnosis of parkinsonian syndromes.3,4
Case ReportWritten informed consent was obtained from the
patient to publish both video and brain imaging resultsfor this case report. This 58-year-old woman had a pro-gressive cerebellar syndrome. Her symptoms had started9 years prior, with imbalance when getting out of acanoe or when walking up and down stairs. She alsonoted poor handwriting and mild incoordination of thehands. Her speech had become slurred. Her symptomsworsened toward the end of the day or when she wasfatigued. In addition, the symptoms partially improvedafter excluding dietary gluten and she had lost 18 kgover the previous year. She had mild urinary inconti-nence when coughing. She has type II diabetes mellitus,treated with Pioglitazone. There is no history of epi-lepsy, cognitive problems, visual problems, stroke-likeepisodes, hearing problems, or menstrual disturbances.Her family history revealed that she had a sister whodied at 2 years of age. This child, who was blind, wasnever able to roll, sit, or walk independently, and shealso had intractable seizures. No diagnosis was everestablished. The proband’s brother has sensorineuralhearing loss, glaucoma, and adult-onset diabetes melli-tus requiring treatment with insulin.On initial examination, 4 years after the onset of her
symptoms, she had slight slowing of vertical saccadesbut a full range of eye movements and normal fundi.She had dysarthria, mild limb dysmetria that wasworse on the left, mild slowing of foot taps bilaterally,and a mildly impaired tandem gait; tone and reflexeswere normal with flexor plantar responses (see Sup-porting Information video). Investigations for coeliac
M I T O C H O N D R I A L M I M I C R Y O F M S A - C
Movement Disorders, Vol. 26, No. 4, 2011 753

disease, including a small bowel biopsy, were negative.Sensory testing was normal and nerve conduction stud-ies were normal. In view of the significant weight loss,investigations for a paraneoplastic process were per-formed and the anti-Purkinje cell antibody was nega-tive. Computed tomography of thorax andmammogram were normal. Her Vitamin B12 and Elevels were normal. Metabolic studies, includingplasma amino acids, urine organic acids, carnitine pro-file, lactate, ammonia, and leukocyte hexosaminidase Aactivity, were all normal. Spinocerebellar ataxia (SCA)types 1, 2, 3, 6, and 7 testing were negative. She wasfound to have an intermediate-range expansion of theCTG repeat of the SCA type 8 (SCA-8) gene, with al-lele sizes of �75 and 26 CTG repeats, which were notfelt to be clinically significant. Her magnetic resonanceimaging (MRI) brain scan showed pontine and cerebel-lar atrophy with some T2 hyperintensities in the mid-dle cerebellar peduncles (Fig.1).Her symptoms continued to progress and 7 years af-
ter symptom onset her dysarthria and cerebellar ataxiahad significantly worsened. Despite using a walker, shefell and sustained a right hip fracture. She developedpostural dizziness owing to orthostatic hypotension.Moreover, her urinary urgency worsened and shedeveloped nocturia. She had drooling of saliva andintermittent dysphagia for liquids. Examinationrevealed a supine blood pressure of 110/60 and 90/40mm Hg after standing for 3 minutes, with no corre-sponding change in pulse rate. She had polyminimyo-clonus of her outstretched hands, a positive glabellartap and brisk deep tendon reflexes with flexor plantarresponses. She was unable to walk unaided andrequired a wheelchair. On recent examination (9 yearsafter onset), she had jerky saccades, marked dysarthria,
limb dysmetria, rigidity in the legs worse than in thearms, brisk reflexes, and mild bilateral bradykinesia inassociation with dystonic posturing of the left hand(see Supporting Information video).Prompted by reviewing the family history, in particu-
lar the sister’s clinical history that was suggestive ofAlpers’ syndrome, the patient was evaluated for muta-tions of the mitochondrial polymerase-c 1 (POLG1)gene using automated DNA sequencing, and was foundto carry the mutations c.2554C>T (p.R852C) andc.32G>A (p.G11D). There was no associated derange-ment of her liver function tests. Long-range polymerasechain reaction (PCR) analysis of a biopsy of the rightvastus lateralis muscle revealed evidence of multiplemtDNA deletions, and real-time PCR analysis of theND1/beta-globulin DNA ratio showed mtDNA deple-tion, confirming the pathological significance of thePOLG1 mutations. As both the proband’s parents aredeceased, parental genetic studies are not possible.
DiscussionWe describe a patient with adult-onset, progressive
cerebellar ataxia, autonomic dysfunction, mild bradyki-nesia, and dystonia. The ataxia initially appeared torespond to gluten exclusion from her diet, although theabsence of antigliadin antibodies meant that her ataxiawas unlikely to be because of gluten sensitivity.5 Shehad an expanded CTG repeat of the SCA-8 gene,although this is of doubtful clinical significance, as herlargest allele falls within a range that is thought not tobe clinically significant.6 The constellation of symp-toms and signs, in conjunction with the MRI brainscan, are most suggestive of MSA-C.7 However, thesignificant family history, presence of POLG1
FIG. 1. a: MRI FLAIR brain scan showing an enlarged fourth ventricle because of pontine and cerebellar atrophy, in association with hyperintensitiesin the middle cerebellar peduncles bilaterally. b: MRI T2-weighted brain scan demonstrating the ‘‘hot-cross bun’’ sign, classically associated withMSA.
M E H T A E T A L .
754 Movement Disorders, Vol. 26, No. 4, 2011

mutations, and deletion/depletion of mtDNA in musclesuggest a mitochondrial disorder as the predominantcause of her symptoms.To date, an association between an MSA-C pheno-
type and POLG1 mutations has not been described.POLG1 mutations have been described previously inassociation with infantile fatal encephalopathy andhepatopathy (Alpers’ syndrome),8,9 sensory ataxic neu-ropathy with ophthalmoparesis,10,11 severe axonalneuropathy,12 as well as adult-onset ataxia withoutprogressive external ophthalmoparesis (PEO) or mus-cle involvement.13 Ataxia has been reported secondaryto either dorsal column sensory loss13 or cerebellardysfunction and has been associated with cerebellaratrophy on MRI.14 POLG1 mutations have beenreported in families with PEO, ataxia, and levodopa(L-dopa)-responsive parkinsonism; pathology revealeddopaminergic cell loss in the substantia nigra but notin Lewy bodies.15–17 Our patient has never had a trialof L-dopa. There is no link between common POLG1mutations and idiopathic Parkinson’s disease.18
Both the p.R582C and the p.G11D sequence variantsfound in our proband have been previously reported inassociation with known POLG1-associated diseasephenotypes, including Alpers’ syndrome, ataxia, andneuropathy.19,20 To our knowledge, this is the firstreported case of mutations in POLG1 causing a MSAphenotype.Our case also illustrates the extreme clinical variabil-
ity that can present within different members of thesame family. The proband was a university-educatedprofessional with no clinical symptoms until late adult-hood, whereas her sister presented in the infantile pe-riod with symptoms compatible with a diagnosis ofAlpers’ syndrome. Although confirmatory genetic stud-ies are not possible for the deceased sister, other casesof similar intrafamilial clinical variability have beenreported.21 We expand the spectrum of phenotypesassociated with POLG1 mutations to include MSA.Clearly blood DNA screening for POLG1 mutations isindicated in patients with a family history suggestiveof a mitochondrial disorder. Whether such screening inother patients with an MSA-C phenotype can be rec-ommended remains to be determined.
Legends to the VideoMitochondrial mimicry of MSA-C. The first part,
recorded 4 years after onset of the disease, illustratesmild dysarthria and very mild gait ataxia. In the sec-ond part, 9 years after onset, the patient has lostweight and her speech is more dysarthric. She has limbataxia, mild bradykinesia, and finger dystonia. She is
unable to stand or walk without assistance and has abroad-based stance.
References1. Kaguni LS. DNA polymerase gamma, the mitochondrial replicase.
Annu Rev Biochem 2004;73:293–320.
2. Milone M, Massie R. Polymerase gamma 1 mutations: clinical cor-relations. Neurologist 2010;16:84–91.
3. Truong DD, Harding AE, Scaravilli F, Smith SJ, Morgan-HughesJA, Marsden CD. Movement disorders in mitochondrial myopa-thies. A study of nine cases with two autopsy studies. Mov Disord1990;5:109–117.
4. Venna N. Mitochondrial neurological diseases: a clinician’s per-spective. Neurol India 2004;52:305–306.
5. Hadjivassiliou M, Grunewald R, Sharrack B, et al. Gluten ataxiain perspective: epidemiology, genetic susceptibility and clinicalcharacteristics. Brain 2003;126 (Pt 3):685–691.
6. Corral J, Genis D, Banchs I, San Nicolas H, Armstrong J, VolpiniV. Giant SCA8 alleles in nine children whose mother has twomoderately large ones. Ann Neurol 2005;57:549–553.
7. Gilman S, Wenning GK, Low PA, et al. Second consensus state-ment on the diagnosis of multiple system atrophy. Neurology2008;71:670–676.
8. Naviaux RK, Nguyen KV. POLG mutations associated withAlpers’ syndrome and mitochondrial DNA depletion. Ann Neurol2004;55:706–712.
9. Ferrari G, Lamantea E, Donati A, et al. Infantile hepatocerebralsyndromes associated with mutations in the mitochondrial DNApolymerase-gammaA. Brain 2005;128 (Pt 4):723–731.
10. Gago MF, Rosas MJ, Guimaraes J, et al. SANDO: two novel muta-tions in POLG1 gene. Neuromuscul Disord 2006;16:507–509.
11. Milone M, Brunetti-Pierri N, Tang LY, et al. Sensory ataxic neu-ropathy with ophthalmoparesis caused by POLG mutations. Neu-romuscul Disord 2008;18:626–632.
12. Harrower T, Stewart JD, Hudson G, et al. POLG1 mutationsmanifesting as autosomal recessive axonal Charcot-Marie-Toothdisease. Arch Neurol 2008;65:133–136.
13. Van Goethem G, Luoma P, Rantamaki M, et al. POLG mutationsin neurodegenerative disorders with ataxia but no muscle involve-ment. Neurology 2004;63:1251–1257.
14. Winterthun S, Ferrari G, He L, et al. Autosomal recessive mito-chondrial ataxic syndrome due to mitochondrial polymerasegamma mutations. Neurology 2005;64:1204–1208.
15. Luoma P, Melberg A, Rinne JO, et al. Parkinsonism, prematuremenopause, and mitochondrial DNA polymerase gamma mutations:clinical and molecular genetic study. Lancet 2004;364:875–882.
16. Hudson G, Schaefer AM, Taylor RW, et al. Mutation of the linkerregion of the polymerase gamma-1 (POLG1) gene associated withprogressive external ophthalmoplegia and Parkinsonism. ArchNeurol 2007;64:553–557.
17. Invernizzi F, Varanese S, Thomas A, Carrara F, Onofrj M,Zeviani M. Two novel POLG1 mutations in a patient with pro-gressive external ophthalmoplegia, levodopa-responsive pseudo-orthostatic tremor and parkinsonism. Neuromuscul Disord2008;18:460–464.
18. Hudson G, Tiangyou W, Stutt A, et al. No association betweencommon POLG1 variants and sporadic idiopathic Parkinson’s dis-ease. Mov Disord 2009;24:1092–1094.
19. Wong LJ, Naviaux RK, Brunetti-Pierri N, et al. Molecular andclinical genetics of mitochondrial diseases due to POLG mutations.Hum Mutat 2008;29:E150–E172.
20. Stewart JD, Tennant S, Powell H, et al. Novel POLG1 mutationsassociated with neuromuscular and liver phenotypes in adults andchildren. J Med Genet 2009;46:209–214.
21. Horvath R, Hudson G, Ferrari G, et al. Phenotypic spectrum asso-ciated with mutations of the mitochondrial polymerase gammagene. Brain 2006;129 (Pt 7):1674–1684.
M I T O C H O N D R I A L M I M I C R Y O F M S A - C
Movement Disorders, Vol. 26, No. 4, 2011 755