2021 Readiness Checklist for Medicare Advantage ... - HHS.gov
Epidemiology of Medicare Abuse: The Example of PowerWheelchairs R2
James S. Goodwin, M.D.1,2, Tracy U. Nguyen-Oghalai, M.D.1,2, Yong-Fang Kuo, Ph.D.1,2,and Kenneth J. Ottenbacher, Ph.D., OTR1,2,3
1 Department of Internal Medicine, University of Texas Medical Branch, Galveston, Texas
2 The Sealy Center on Aging, University of Texas Medical Branch, Galveston, Texas
3 The School of Allied Health Sciences, Division of Rehabilitation Sciences, University of Texas MedicalBranch, Galveston, Texas
AbstractBackground—Press reports and government investigations have uncovered widespread abuse inpower wheelchair prescriptions reimbursed by Medicare, with specific targeting of minorityneighborhoods for aggressive marketing.
Objective—We sought to determine the impact of neighborhood ethnic composition on powerwheelchair prescriptions.
Design—The 5% non-cancer sample of Medicare recipients in the Surveillance, Epidemiology andEnd Results (SEER)-Medicare linked database, from 1994–2001
Setting—SEER regions
Participants—Individuals covered by Medicare living in SEER regions without a cancer diagnosis
Measurements—Individual characteristics (age, gender, ethnicity, justifying diagnosis, andcomorbidity), primary diagnoses, neighborhood characteristics (% black, % Hispanic, % with <12years education and median income) and SEER region
Results—The rate of power wheelchair prescriptions increased 33 fold from 1994 to 2001, with ashift over time from justifying diagnoses more closely tied to mobility impairment, such as strokes,to less specific medical diagnoses, such as osteoarthritis. In multilevel, multivariate analyses,
Publisher's Disclaimer: The final, definitive version of this article has been published in the Journal of the American Geriatrics Society,February 2007 - Vol. 55 Issue 2 Pages 221-226. Copyright by The American Geriatrics Society and Blackwell Publishing. The definitiveversion is available at www.blackwell-synergy.comThis study used the linked SEER-Medicare database. The interpretation and reporting of these data are the sole responsibility of theauthors. The authors acknowledge the efforts of the Applied Research Program, NCI; the Office of Research, Development andInformation, CMS; Information Management Services (IMS) Inc.; and the Surveillance, Epidemiology, and End Results (SEER) Programtumor registries in the creation of the SEER-Medicare database.Author Contributions: J. Goodwin directed the conception and design, data analysis, preparation of manuscript and final approval ofversion to be published; K. Ottenbacher contributed to the study design, data analysis and preparation of manuscript; Y-F Kuo contributedto data analysis and interpretation and manuscript preparation; and T. Nguyen-Oghalai contributed to study design, data acquisition,analysis and interpretation, and manuscript preparation.Sponsor's Role: Sponsors had no role in the design, methods, subject recruitment, data collection, analysis or preparation of this article.Sources of Support: This research was supported by funding from the National Institutes of Health, the National Institute on Aging, andthe American College of Rheumatology Research and Education Foundation-ASP, J. Goodwin (P50-CA105631); K. Ottenbacher (K02-AG01973); and T. Nguyen-Oghalai (T. Franklin Williams Junior Career Development Award).Financial Disclosure(s): This research was supported by funding from the National Institutes of Health, the National Institute on Aging,and the American College of Rheumatology Research and Education Foundation-ASP, J. Goodwin (P50-CA105631); K. Ottenbacher(K02-AG01973); and T. Nguyen-Oghalai (T. Franklin Williams Junior Career Development Award).
NIH Public AccessAuthor ManuscriptJ Am Geriatr Soc. Author manuscript; available in PMC 2007 April 10.
Published in final edited form as:J Am Geriatr Soc. 2007 February ; 55(2): 221–226.
NIH
-PA Author Manuscript
NIH
-PA Author Manuscript
NIH
-PA Author Manuscript

individuals living in neighborhoods with higher percentages of blacks or Hispanics were more likelyto receive power wheelchairs (OR= 1.09 for each 10% increase in black residents and 1.23 for each10% increase in Hispanic residents), after controlling for ethnicity and other characteristics at theindividual level.
Conclusion—These results support allegations that minority neighborhoods have been specificallytargeted by marketers promoting power wheelchairs.
KeywordsPower wheelchair; policy; ethnicity; fraud; abuse
INTRODUCTIONHealth insurance fraud was estimated in 2003 to cost 50 to 85 billion dollars in the U.S.1 Fraudand abuse contribute to rising costs of the Medicare and Medicaid programs. However, therehas been little systematic study of this issue.2,3 In this report, we focus on one example offraud and abuse, involving claims and reimbursement by Medicare for power wheelchairs.
Power wheelchairs, including motorized scooters, are covered by Medicare for severelymobility impaired patients who cannot operate a manual wheelchair.4 Over the past severalyears, there have been a number of complaints alleging fraud and abuse in the power wheelchairprogram.5–7 This led to investigations by the General Accounting Office and the Office ofInspector General of the U.S. Department of Health and Human Services.4,8,9
There has been considerable concern raised about improper marketing of power wheelchairs.5,10 There were allegations that minority neighborhoods were targeted, using door-to-doorsolicitation, and that fully ambulatory older residents were offered kickbacks for participatingand bounties for recruiting others.10 These individuals were then directed to specificphysicians, some of whom also received kickbacks from the power wheelchair distributors.7,11 One factor contributing to the abuse was the large profit margin for suppliers of powerwheelchairs. Medicare was paying more than $5,000 per power wheelchair claim in 2003,while the Veteran’s Administration paid closer to $3,000 per chair,8 which suggests that therewas substantial profit in power wheelchairs reimbursed by Medicare.
Although Medicare reimbursement for power wheelchairs grew from less than $150 millionin 1997 to more that $1.1 billion in 2003, the specific pattern of growth in power wheelchairclaims has not been described in detail.4 In this paper, we examine the growth in wheelchairprescriptions from 1994 through 2001. We were interested in whether the pattern of diagnosesused to justify the prescription of power wheelchairs changed over time, from diagnoses clearlytied to mobility impairment such as multiple sclerosis, strokes and amputation, to morenonspecific diagnoses such as osteoarthritis. We also were interested in whether there wasevidence of targeting minority neighborhoods, as suggested in press reports.7 Using multilevelanalysis, we assessed the impact of neighborhood ethnic composition on power wheelchairprescriptions, independent of the ethnicity of the individual. We hypothesized that prescriptionsfor power wheelchairs would be highest in minority neighborhoods.
PATIENTS AND METHODSData Sources and Study Sample
We analyzed data from the 5% non-cancer control subjects included in the Surveillance,Epidemiology and End Results (SEER)-Medicare database.12 The 5% control sample includedin the SEER database contains relevant Medicare files and is linked to the 2000 Census data.
Goodwin et al. Page 2
J Am Geriatr Soc. Author manuscript; available in PMC 2007 April 10.
NIH
-PA Author Manuscript
NIH
-PA Author Manuscript
NIH
-PA Author Manuscript
In the 1990’s, the SEER program consisted of a group of 11 tumor registries (the metropolitanareas of Atlanta, Detroit, Los Angeles, San Jose, San Francisco/Oakland, and Seattle; and thestates of Connecticut, Hawaii, Iowa, New Mexico and Utah) representing approximately 14%of the U.S. population. The data used in this study included the Medicare Enrollment file, theMedicare Provider Analysis and Review file (hospital inpatient claims), the Outpatient file(outpatient claims), the Carrier File (physician services claims) and the Durable MedicalEquipment file (claims submitted to Durable Medical Equipment regional carriers). Medicarerecipients in SEER areas are similar to the U.S. Medicare population, with a somewhat largerpercentage of non-whites and urban dwellers.12,13
All subjects with at least one month of Medicare part A & B coverage (wheelchair is a part Bbenefit), not a member of a health maintenance organization that month, and residing in oneof the SEER areas between 1994 and 2001 were included in the initial sample. We furtherrefined the sample by excluding subjects who were not enrolled in both Medicare Part A & Bin the 12 months before each study year (11,556 person-years) and were members of a healthmaintenance organization (10,186 person-years).
To examine the relationships between power wheelchair prescriptions and neighborhoodcharacteristics, the SEER-Medicare data were linked with the 2000 U.S. Census data. Thelinkage was based on subjects’ zip code from Medicare enrollment data for each year. Thislinkage included only Medicare subjects 65 years and above in 1999 to 2001 and allowed usto compare persons with and without power wheelchair claims during a defined period whenpower wheelchair prescription rates were at their highest levels. The study month for subjectswith a power wheelchair claim was the month of the prescription. The study month for subjectswithout a power wheelchair claim was randomly assigned from a given year. The InstitutionalReview Board of the University of Texas Medical Branch, Galveston, Texas, granted approvalof this study. De-identified data were used in the analyses and individual subject consent wasnot required.
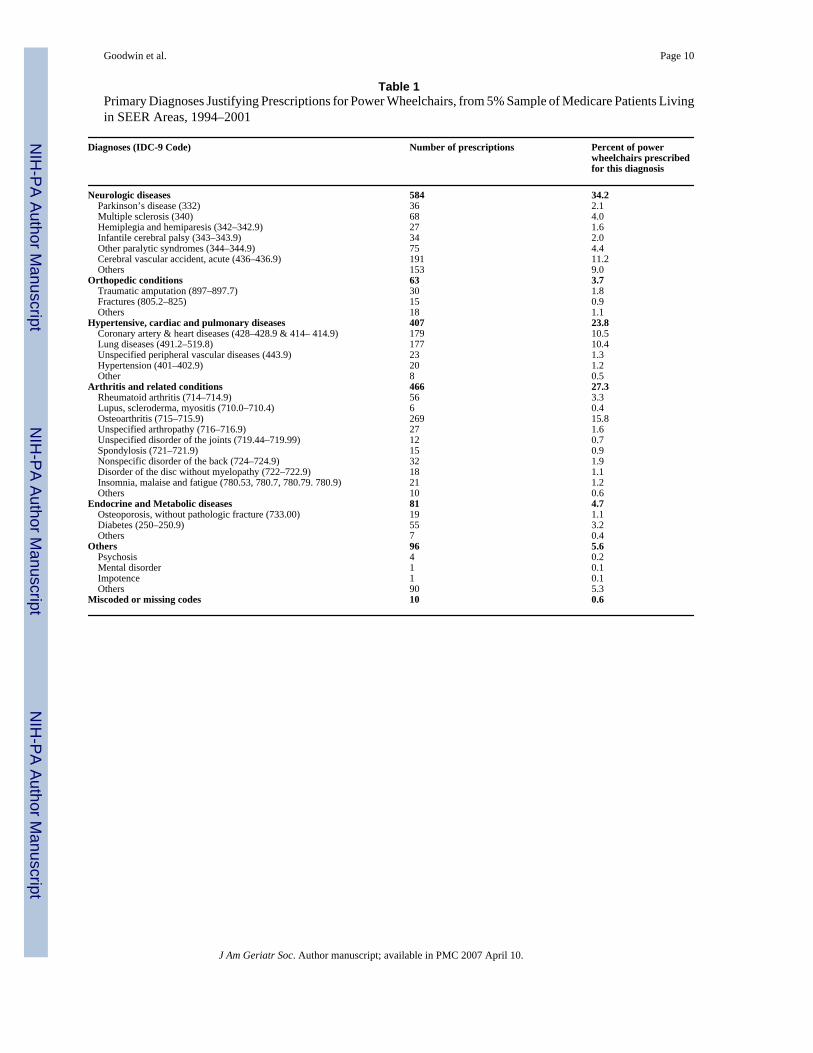
Data Collection and MeasuresThe primary outcome was rate of power wheelchair claims (K0011) from 1994 to 2001. Powerwheelchair claims were calculated as the number of claims submitted divided by all eligibleperson-years in the Medicare Enrollment file. We used submitted claims in the analyses insteadof paid claims to obtain a more complete record of services received. Between 89 and 91% ofthe submitted claims included in the analyses were paid for by Medicare. The primary claimdiagnosis code in the Durable Medical Equipment file was used to assess reasons for thewheelchair prescription. For some analyses, we dichotomized the diagnoses into two groups:neurologic/orthopedic and medical. The neurologic/orthopedic category included stroke,Parkinson’s disease, cerebral palsy, multiple sclerosis, spinal cord injury, other paralyticsyndromes, amputations, and fractures. The medical category included hypertension, cardiacand pulmonary diseases; arthritis and related diseases; endocrine/metabolic diseases; andothers (see Table 1).
Potential moderating variables included characteristics of the individual and neighborhood orenvironmental factors. Individual characteristics included age (years), gender, ethnicity,region, and comorbid conditions. A comorbidity index was calculated by the Klabunde’smethod using the Medicare inpatient and outpatient physician claim data.14 Ethnicity wascategorized as non-Hispanic white, black, Hispanic and other (Asian, Native American andunknown). Unlike the U.S. Census, Medicare does not separate race and ethnicity. Hispanicsmust choose between Hispanic or some other race. This results in underreporting of Hispanicsin Medicare data relative to census data.15
Goodwin et al. Page 3
J Am Geriatr Soc. Author manuscript; available in PMC 2007 April 10.
NIH
-PA Author Manuscript
NIH
-PA Author Manuscript
NIH
-PA Author Manuscript

Neighborhood and environmental factors obtained from the linkage with the U.S. Census dataincluded median income, percent of adults with less than 12 years education, percent black,and percent Hispanic. Neighborhood characteristics were aggregated at the level of zip copefor the purpose of statistical analyses.
Statistical AnalysesDescriptive statistics were used to explore the unadjusted rates of wheelchair claims and theprimary diagnosis for claims. The comparison of neighborhood and sociodemographiccharacteristics between persons with and without power wheelchair claims (1999–2001) wasconducted using hierarchical generalized linear models (HGLM). HGLM models werecomputed for all eligible neighborhoods with at least five subjects. Five subjects is consideredsufficient for level two variables when fixed effects are being tested.16,17 We also repeatedthe analyses using only neighborhoods with at least 125 subjects and found the same patternsas reported here. Analyses were performed using SAS v. 9.1 (SAS Institute, Inc., Cary, NC).
RESULTSTime Trend in Claims for Power Wheelchairs from 1994 To 2001
There were 1,166,325 person-years available for this analysis. There was a 33-fold increase inthe rate of power wheelchairs claims from 1994 (0.11 per 1000 Medicare patients per year) to2001 (3.60 per 1000).
Table 1 presents the primary diagnoses to justify the power wheelchair prescriptions.Neurological and orthopedic diagnoses accounted for slightly fewer than 40% of all wheelchairclaims, while hypertension, cardiopulmonary diseases, arthritis and endocrine/metabolicdiseases accounted for approximately 60%. The table includes Medicare subjects of all ages;that is, those 65 years of age and older enrolled in traditional Medicare and also those youngerthan age 65 who were eligible for Medicare because they were considered disabled under SocialSecurity provisions. The use of a medical (vs. neurologic/orthopedic) diagnosis as justificationfor power wheelchair prescriptions was higher among those 65 and older than among youngerpatients (67.6% vs. 48.7%, p < 0.001). The use of a medical diagnosis was also higher amongnonwhites (67.0%) than among whites (57.7%, p < 0.001), and among women (59.9%) thanmen (40.1%, p < 0.001).
Figure 1 traces the growth in all power wheelchair claims by year, and also stratified by whetherthe primary diagnosis justifying the prescription was neurologic/orthopedic or medical. Themajor growth in wheelchair claims during the period of study was in patients with a medicaldiagnosis (p< 0.001). In 1994–1996, 33.3% of the power wheelchair claims were for a medicaldiagnosis, while, by 2001, 68% were for patients with a medical diagnosis. Of the medicaldiagnoses, 41.3% were for osteoarthritis or non-specific or unspecified joint or back problems.
We next examined the relationship of ethnicity, income, and educational status to powerwheelchair prescriptions. Ethnicity was examined both at an individual level and at aneighborhood level (% Black and % Hispanic in zip code of residence), while income andeducation were only examined at the level of the zip code. We limited analyses to Medicarepatients 65 and older for the years 1999 to 2001, because those were the years reflecting thegreatest increase in prescriptions (two thirds of all power wheel chair prescriptions from 1994to 2001 were in 1999–2001), and older patients were alleged to be specific targets for powerwheelchair marketers.6,7,18
There were 367,468 person years available for this analysis. Bivariate analyses were performedto look for associations between demographic characteristics or neighborhood characteristicsand wheelchair claims. Black patients were about six times as likely to receive a power
Goodwin et al. Page 4
J Am Geriatr Soc. Author manuscript; available in PMC 2007 April 10.
NIH
-PA Author Manuscript
NIH
-PA Author Manuscript
NIH
-PA Author Manuscript
wheelchair during 1999–2001 than were whites, with Hispanic patients having a rate inbetween. Residents of the South were more than six times as likely to receive powerwheelchairs than those in the Northeast or Midwest. Power wheelchair claims were also morecommon in neighborhoods with low income, low education, or higher percentages of black orHispanic residents.
Table 2 presents multivariable HGLM analyses of odds of receiving a power wheelchair. InModel 1, only individual characteristics are included, while Model 2 is a multilevel analysisincluding characteristics of the neighborhood environment. In Model 1, there are clearassociations of increased power wheelchair use with older age, male gender, black race andincreasing comorbidity. Prescriptions were also substantially greater in the South and Westversus the Northeast and Midwest. The increased rate of power wheelchair use for Hispanicsseen in the bivariate analyses is no longer seen after controlling for other individualcharacteristics in Model 1. Model 2 shows that the overall ethnic composition of theneighborhood was a major predictor of power wheelchair prescriptions independent of theethnicity at the individual level of the residents of the neighborhood. Each 10% increase inpercent black residents was associated with a 9% increase in wheelchair prescriptions, whileeach 10% increase in Hispanic residents was associated with a 23% increase in powerwheelchair prescriptions. Adding neighborhood ethnicity, poverty (income) and educationvariables had little effect on the odds associated with individual characteristics.
We repeated the HGLM analyses in Table 2, restricting the dependent variable to thosereceiving power wheelchairs for a medical (i.e., not neurologic/orthopedic) diagnosis. The oddsassociated with year, age, ethnicity, region and comorbidity were very similar to those shownin Table 2. The effect of gender was eliminated (odds of receiving power wheelchairs forwomen versus men, 0.98; 95% CI = 0.89, 1.07), while the effect of neighborhood percent black(OR = 1.13, 95% CI=1.05, 1.22) and percent Hispanic (OR = 1.28, 95% CI =1.19, 1.39) weresomewhat higher than in the analysis of power wheelchairs prescribed for any diagnosis.
DISCUSSIONFraud and abuse of third-party payors by providers of healthcare services are increasinglyrecognized as a serious problem in American medicine.1–3,10,18 Fraud typically is a criminaloffense and involves the knowing intent to deceive for financial gain. Abuse includes providingunnecessary services or services which fail to meet recognized standards.18 There are,remarkably, few studies of fraud and abuse, presumably because they are difficult to establish.2,3 In that regard, it should be noted that none of the data presented in our analyses establishthe existence of fraud or abuse. Instead, the pattern of prescriptions for power wheelchairs inthis population-based sample was consistent with the allegations in press reports and federalinvestigations.4–11,19 Specifically, we found a rapid increase in power wheelchair use from1994 to 2001. This increase was mostly in recipients whose justification was relatively looselytied to the Medicare criteria for power wheelchairs (i.e., those with diagnoses of osteoarthritisor cardiopulmonary disease rather than those with neurologic conditions.) The most strikingfinding was the association of wheelchair prescriptions with neighborhood concentration ofblack and Hispanic ethnicity. In multivariable, multilevel analyses, black ethnicity wasassociated with a 2.78 fold increase in odds of receiving a wheelchair. In addition, Medicareenrollees living in neighborhoods with higher concentrations of blacks had higher odds ofreceiving a wheelchair, independent of their individual ethnicity. The effect of Hispanicethnicity was entirely at the neighborhood level. In multivariable, multilevel analyses, Hispanicethnicity was not associated with increased odds of receiving a wheelchair (OR = 0.81, 95%CI = 0.64, 1.01), but Medicare enrollees in neighborhoods with higher concentrations ofHispanics had greater odds of receiving a wheelchair (OR = 1.23, 95% CI = 1.15, 1.31 for each10% increase in percentage of residents who were Hispanic).
Goodwin et al. Page 5
J Am Geriatr Soc. Author manuscript; available in PMC 2007 April 10.
NIH
-PA Author Manuscript
NIH
-PA Author Manuscript
NIH
-PA Author Manuscript
On the other hand, black ethnicity was associated with increased odds of power wheelchairprescriptions at both the individual and neighborhood level. The increased rate of powerwheelchair prescriptions for blacks might be partially explained by the higher rates of disabilityexperienced by this group.20 Hispanics are also at greater risk for disability than non Hispanicwhites,21,22 but this was not reflected in a greater rate of power wheelchair prescription forthis group. We can think of no plausible medical explanation for the higher rate of powerwheelchairs by residents of minority neighborhoods, independent of individual ethnicity.
The targeting of minority neighborhoods, especially Hispanic neighborhoods, has been notedin press reports. For example, a recent NY Times article described how recruiters canvassedMexican-American neighborhoods in Arizona, offering kickbacks and organizing busloads ofresidents who would travel to California to receive multiple, unnecessary surgeries at severaloutpatient surgical centers.1
Another striking finding was the geographic variation in rate of power wheelchairprescriptions. Given the marked discrepancies among regions, there is concern that the rapidgrowth in the South and West regions could be duplicated in the Northeast and Midwestregions.
As noted above, our data cannot prove fraud or abuse. The Office of Inspector General for theDepartment of Health and Human Services audited 300 randomly selected claims for powerwheelchairs from 2001, contacting suppliers, physicians and recipients for additionalinformation.4 Almost one third of the claims failed to meet criteria, even for a standard non-motorized wheelchair. Another 45% met criteria for a standard wheelchair. Only 13% metMedicare criteria for a power wheelchair. Twenty-eight percent of recipients stated they werenot using the wheelchairs or were using them only outside the home. These findings clearlydemonstrate widespread abuse of the system.
There are a number of regulations already in place designed to curb abuse. These include astatute forbidding telephone solicitation by Durable Medical Equipment suppliers andforbidding providers from waiving the 20% co-pay. In addition, the prescription of one formof motorized wheelchairs, the scooter, is supposed to be limited to certain specialists.23 Suchrestrictions have been linked to decreased abuse in other settings.2
Changing the Medicare reimbursement rate is another proposed strategy to reduce potentialabuse.4 In 2004, the Medicare rate for the most popular power wheelchair, a K-11 model, was$5,297, the same wheelchair could be purchased on-line for $3,863, from wholesalers for$2,363, and from distributors and manufacturers for $1,550.4
Perhaps the most difficult issue in combating abuse is in applying rigid criteria to complexclinical situations. There is no doubt that power wheelchairs represent a major advance thathas had a dramatic effect on the quality of life and independence of many persons with severemobility impairment. Healthcare insurers must construct relatively rigid criteria thatdichotomize patients with a complex spectrum of need into those who do or do not qualify.Some individuals who do not meet Medicare criteria might still benefit from a powerwheelchair. On the other hand, leaving the decision on whether or not an individual shouldreceive a power wheelchair reimbursed by Medicare up to his or her personal physician or anyother physician does not seem to be working, particularly in the face of aggressive marketingto the public emphasizing the message that individuals deserve power wheelchairs as part oftheir rights under Medicare.7,10
Goodwin et al. Page 6
J Am Geriatr Soc. Author manuscript; available in PMC 2007 April 10.
NIH
-PA Author Manuscript
NIH
-PA Author Manuscript
NIH
-PA Author Manuscript

CONCLUSIONIn conclusion, there was a rapid rise in power wheelchair prescriptions between 1994 and 2001,coincident with growing reports of abuse in this area. Recent efforts by the Center for Medicareand Medicaid Services to tighten the process of power wheelchair prescriptions may besuccessful in reducing the abuse.24 Successful efforts to combat abuse may require more activeparticipation of the medical community, working with third-party payors such as Medicare, todesign and test programs to identify and control abuse within the payment systems. This studyshows how administrative datasets can be used to more fully describe the pattern of utilizationof medical technologies which may in turn provide evidence which raises concern for potentialabuse.
Acknowledgements
James S. Goodwin was supported by a grant from the National Institutes of Health for the Center for Population Healthand Health Disparities (P50 CA105631). Kenneth J. Ottenbacher was supported by a grant from the National Instituteon Aging (K02 AG01973).
Tracy U. Nguyen-Oghalai was supported by an American College of Rheumatology Research and EducationFoundation-ASP-Junior Career Development Award.
References1. Glater, JD. New York Times. 2005. In a surgery capital, a swirl of fraud charges. Jul 10. Sect. 3, Page
12. Becker D, Kessler D, McClellan M. Detecting Medicare abuse. Journal of Health Economics
2005;24:189–210. [PubMed: 15617794]3. Sparrow, MK. License to Steal: How Fraud Bleeds America's Health Care System. Boulder, Colo:
Westview Press; 2000.4. Office of Inspector General. DHHS. Apr. 2004 Medicare payment for power wheelchairs. OIG Report
No.: OEI-03-02-00600.5. Wheelchair scams cost Medicare millions. Associated Press. Nov. 122003 [Accessed on April 14,
2005.]. Available at http://www.cnn.com/2003/HEALTH/11/11/us.wheelchair.ap/index.html6. Feldstein, D. Houston Chronicle. 2003. Wheelchair scam drains millions from Medicare / Houston-
based fraud uses unwitting seniors, feds say. Aug 17. Sect. A, Page 17. Feldstein, D. Houston Chronicle. 2004. Wheelchair audit shows many didn't need device. Apr 29. Sect.
A1.8. Testimony of Herb Kuhn Director. Center for Medicare Management Centers for Medicare & Medicaid
Services on power operated wheelchairs before the Senate Finance Committee. Centers for Medicare& Medicaid; Apr. 282004 [Accessed on February 14, 2006.]. Available athttp://www.cms.hhs.gov/apps/media/press/testimony.asp?Counter=1025
9. U.S. Government Accountability Office. CMS's program safeguards did not deter growth in spendingfor power wheelchairs: Report to the Chairman, Committee on Finance, U.S. Senate. Nov. 17 2004.Report No.: GAO-05-43.
10. Federal Bureau of Investigation. Protecting patients from health care fraudsters. Headline Archives.July 262004 [Accessed on April 14, 2005.]. Available athttp://www.fbi.gov/page2/july04/hcfraud072604.htm
11. Rice, H. Houston Chronicle. 2004. Doctor pleads guilty to kickbacks / Woodlands psychiatrist among7 indicated in wheelchair scam. Apr 2. Sect. A, Page 30.
12. Warren JL, Klabunde CN, Schrag D, et al. Overview of the SEER-Medicare data. Med Care 2002;40(Suppl):IV-3-18.
13. Nattinger AB, McAuliffe TL, Schapira MM. Generalizability of the surveillance, epidemiology, andend results registry population: factors relevant to epidemiologic and health care research. J ClinEpidemiol 1997;50:939–945. [PubMed: 9291879]
Goodwin et al. Page 7
J Am Geriatr Soc. Author manuscript; available in PMC 2007 April 10.
NIH
-PA Author Manuscript
NIH
-PA Author Manuscript
NIH
-PA Author Manuscript
14. Klabunde CN, Potosky AL, Legler JM, et al. Development of a comorbidity index using physicianclaims data. J Clin Epidemiol 2000;53:1258–1267. [PubMed: 11146273]
15. Arday SL, Arday DR, Monroe S, et al. HCFA's racial and ethnic data: current accuracy and recentimprovements. Health Care Financ Rev 2000;21:107–116. [PubMed: 11481739]
16. Kreft, I.; De Leeus, J. Introducing Multilevel Modeling. London: Sage Publication; 1998.17. Snijders, T.; Bosker, R. Multi-level analysis. Thousand Oaks, CA: Sage Publication; 1999.18. Fraud & abuse for professionals: overview & links. Centers for Medicare & Medicaid. Dec. 142005
[Accessed on February 14, 2006.]. Available at http://new.cms.hhs.gov/FraudAbuseforProfs/19. Feldstein, D. Houston Chronicle. 2004. Wheelchair seller to retreat / Scooter Store says crackdown
is far too harsh. Nov 10. Sect. Business, Page 1.20. Manton KG, Wu S. Changes in the prevalence of chronic disability in the United States black and
non-black population above the age of 65 from 1982 to 1999. Proc Nat Acad Sci 98:6354–6359.21. Tucker KL, Falcon LM, Bianchi LA, et al. Self-reported prevalence and health correlates of functional
limitation among Massachusetts elderly Puerto Ricans, Dominicans, and a non-hispanicneighborhood comparison group. J Gerontol Med Sci 55A:M90–M97.
22. Markides, KS.; Eschbach, K.; Ray, L., et al. Old age disability rates by race/ethnicity using the 2000United States census. In: Angel, JL.; Whitfield, KE., editors. The Health of Aging Hispanics: TheMexican-origin Population. New York: Springer; 2006. in press.
23. Dept. Health & Human Services. Medicare Program; Conditions for payment of power mobilitydevices, including power wheelchairs and power operated vehicles; Interim final rule. Available athttp://new.cms.hhs.gov/CoverageGenInfo/Downloads/wheelchairreg.pdf. Centers for Medicare &Medicaid, Aug. 26 2005. Report No. 42 CFR Part 410.
24. New codes for power mobility devices to be effective October 2006. [Accessed July 24, 2006.]. Centerfor Medicare and Medicaid Services (online). Available atwww.cms.hhs.gov/DMEPOSFeeSched/01a_Power_Mobility_Devices.asp#TopOfPage
Goodwin et al. Page 8
J Am Geriatr Soc. Author manuscript; available in PMC 2007 April 10.
NIH
-PA Author Manuscript
NIH
-PA Author Manuscript
NIH
-PA Author Manuscript
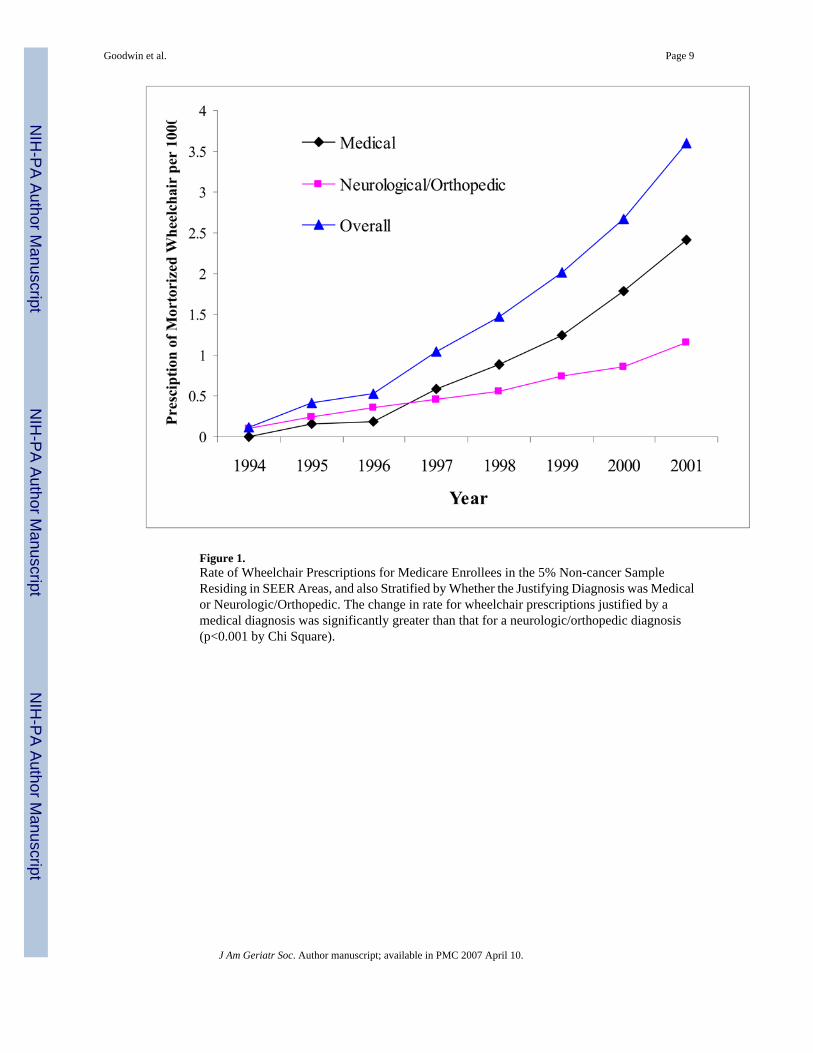
Figure 1.Rate of Wheelchair Prescriptions for Medicare Enrollees in the 5% Non-cancer SampleResiding in SEER Areas, and also Stratified by Whether the Justifying Diagnosis was Medicalor Neurologic/Orthopedic. The change in rate for wheelchair prescriptions justified by amedical diagnosis was significantly greater than that for a neurologic/orthopedic diagnosis(p<0.001 by Chi Square).
Goodwin et al. Page 9
J Am Geriatr Soc. Author manuscript; available in PMC 2007 April 10.
NIH
-PA Author Manuscript
NIH
-PA Author Manuscript
NIH
-PA Author Manuscript
NIH
-PA Author Manuscript
NIH
-PA Author Manuscript
NIH
-PA Author Manuscript
Goodwin et al. Page 10
Table 1Primary Diagnoses Justifying Prescriptions for Power Wheelchairs, from 5% Sample of Medicare Patients Livingin SEER Areas, 1994–2001
Diagnoses (IDC-9 Code) Number of prescriptions Percent of powerwheelchairs prescribedfor this diagnosis
Neurologic diseases 584 34.2 Parkinson’s disease (332) 36 2.1 Multiple sclerosis (340) 68 4.0 Hemiplegia and hemiparesis (342–342.9) 27 1.6 Infantile cerebral palsy (343–343.9) 34 2.0 Other paralytic syndromes (344–344.9) 75 4.4 Cerebral vascular accident, acute (436–436.9) 191 11.2 Others 153 9.0Orthopedic conditions 63 3.7 Traumatic amputation (897–897.7) 30 1.8 Fractures (805.2–825) 15 0.9 Others 18 1.1Hypertensive, cardiac and pulmonary diseases 407 23.8 Coronary artery & heart diseases (428–428.9 & 414– 414.9) 179 10.5 Lung diseases (491.2–519.8) 177 10.4 Unspecified peripheral vascular diseases (443.9) 23 1.3 Hypertension (401–402.9) 20 1.2 Other 8 0.5Arthritis and related conditions 466 27.3 Rheumatoid arthritis (714–714.9) 56 3.3 Lupus, scleroderma, myositis (710.0–710.4) 6 0.4 Osteoarthritis (715–715.9) 269 15.8 Unspecified arthropathy (716–716.9) 27 1.6 Unspecified disorder of the joints (719.44–719.99) 12 0.7 Spondylosis (721–721.9) 15 0.9 Nonspecific disorder of the back (724–724.9) 32 1.9 Disorder of the disc without myelopathy (722–722.9) 18 1.1 Insomnia, malaise and fatigue (780.53, 780.7, 780.79. 780.9) 21 1.2 Others 10 0.6Endocrine and Metabolic diseases 81 4.7 Osteoporosis, without pathologic fracture (733.00) 19 1.1 Diabetes (250–250.9) 55 3.2 Others 7 0.4Others 96 5.6 Psychosis 4 0.2 Mental disorder 1 0.1 Impotence 1 0.1 Others 90 5.3Miscoded or missing codes 10 0.6
J Am Geriatr Soc. Author manuscript; available in PMC 2007 April 10.

NIH
-PA Author Manuscript
NIH
-PA Author Manuscript
NIH
-PA Author Manuscript
Goodwin et al. Page 11
Table 2Odds of Receiving a Power Wheelchair among Medicare Enrollees in 1999–2001 aged 65 and Older, as a Functionof Individual and Neighborhood Characteristics
Model 1* Model 2*
DemographicCharacteristic
OR (95 % CI) OR (95 % CI)
Year 1999 1.00 1.002000 1.37 (1.23, 1.53) 1.37 (1.22, 1.54)2001 1.92 (1.73, 2.14) 1.98 (1.78, 2.20)
Age (each 5 years increased) 1.06 (1.03, 1.09) 1.06 (1.03, 1.09)Gender Male 1.00 1.00
Female 0.88 (0.81, 0.96) 0.87 (0.80, 0.95)Ethnicity White 1.00 1.00
Black 3.26 (2.80, 3.79) 2.78 (2.36, 3.27)Hispanic 0.90 0.81 (0.64, 1.01)Other/Unknown 2.18 (1.90, 2.50) 2.09 (1.82, 2.39)
Region Northeast 1.00 1.00Midwest 0.69 (0.44, 1.08) 0.71 (0.44, 1.14)South 4.53 (2.87, 7.13) 3.59 (2.23, 5.79)West 2.50 (1.69, 3.69) 1.83 (1.21, 2.77)
Comorbidity 0 1.00 1.001 2.72 (2.44, 3.04) 2.74 (2.45, 3.06)2 4.28 (3.78, 4.85) 4.25 (3.74, 4.82)3 8.19 (7.29, 9.19) 8.05 (7.17, 9.05)
Zip median income < 37,000 1.0037,000 – 46,999 0.80 (0.60, 1.08)47,000 – 59,999 0.71 (0.51, 1.00)>= 60,000 0.67 (0.44, 1.00)
Zip education (% adult < 12years education)
<= 12.5% 1.00
12.6 – 20.0% 1.04 (0.73, 1.48)20.1 – 27.5% 0.93 (0.63, 1.37)> 27.5% 0.92 (0.58, 1.48)
Zip % black (each 10% increase) 1.09 (1.02, 1.16)Zip % Hispanic (each 10% increase) 1.23 (1.15, 1.31)
OR = odds ratio
CI = confidence interval
*Results from hierarchical generalized linear model
J Am Geriatr Soc. Author manuscript; available in PMC 2007 April 10.
Copyright © 2022 FDOKUMEN