LESSONS FROM MEDICARE+CHOICE FOR MEDICARE REFORM
12
Policy Brief Additional copies of this (#658) and other Commonwealth Fund publications are available online at www.cmwf.org Publications can also be ordered by calling 1.888.777.2744. To learn about new Fund publications when they appear, visit the Fund’s website and register to receive e-mail alerts. Lessons from Medicare+Choice for Medicare Reform Geraldine Dallek, Brian Biles, and Lauren Hersch Nicholas C urrent discussions of the future of Medicare include proposals to increase the enrollment of beneficiaries in private health insurance plans. 1 These proposals would provide incentives for beneficiaries to join private plans, rely on more loosely structured health plans such as preferred provider organizations (PPOs), change the way health plans are paid, and in some cases create competition between private plans and tradi- tional fee-for-service Medicare. Today’s proposals follow upon Medicare’s long history with private health plans. The most significant effort to expand the enrollment in pri- vate plans occurred with the passage of the Balanced Budget Act of 1997 (BBA), which created the Medicare+Choice (M+C) program.The objec- tives of M+C included expanding the types of plans available to Medicare beneficiaries, increasing payments to plans in low-cost areas, and fostering competition among private plans. 2 M+C has not met proponents’ expectations.Tied to the low increases in Medicare’s fee-for-service program and buffeted by provider pushback and an inability to control costs of care, HMOs have left the M+C program in large numbers. Although many private M+C plans perform well compared with fee-for-service (FFS) Medicare on selected preventive health measures,on other measures—including access to care, stability of providers, simplicity of benefit structure, and costs to the Medicare program—the history of M+C is less positive. 3,4 Turbulence in the program and beneficiary dissatisfaction have contributed to a decline in M+C enrollment, from 16 percent in 1998 to 11 percent in 2003 (Figure 1). 5 It had originally been projected that enrollment would reach 34 percent by 2005. The six-year history of M+C provides seven lessons to help inform the policy debate on Medicare reform proposals. The Commonwealth Fund is a private foundation supporting independent research on health and social issues. The views pre- sented here are those of the authors and should not be attributed to The Commonwealth Fund or its directors, officers, or staff. For more information about this study, please contact: Barbara S. Cooper Senior Program Officer The Commonwealth Fund Tel 212.606.3862 Fax 212.606.3500 E-mail bsc@cmwf.org JUNE 2003
-
Upload
independent -
Category
Documents
-
view
0 -
download
0
Transcript of LESSONS FROM MEDICARE+CHOICE FOR MEDICARE REFORM
Policy Brief
Additional copies of this (#658)
and other Commonwealth Fund
publications are available online at
www.cmwf.orgPublications can also be ordered by
calling 1.888.777.2744.
To learn about new Fund
publications when they appear, visit
the Fund’s website and register to
receive e-mail alerts.
Lessons from Medicare+Choicefor Medicare ReformGeraldine Dallek, Brian Biles, and Lauren Hersch Nicholas
C urrent discussions of the future of Medicare include proposals toincrease the enrollment of beneficiaries in private health insuranceplans.1 These proposals would provide incentives for beneficiaries
to join private plans, rely on more loosely structured health plans such aspreferred provider organizations (PPOs), change the way health plans arepaid, and in some cases create competition between private plans and tradi-tional fee-for-service Medicare.
Today’s proposals follow upon Medicare’s long history with privatehealth plans.The most significant effort to expand the enrollment in pri-vate plans occurred with the passage of the Balanced Budget Act of 1997(BBA), which created the Medicare+Choice (M+C) program.The objec-tives of M+C included expanding the types of plans available to Medicarebeneficiaries, increasing payments to plans in low-cost areas, and fosteringcompetition among private plans.2
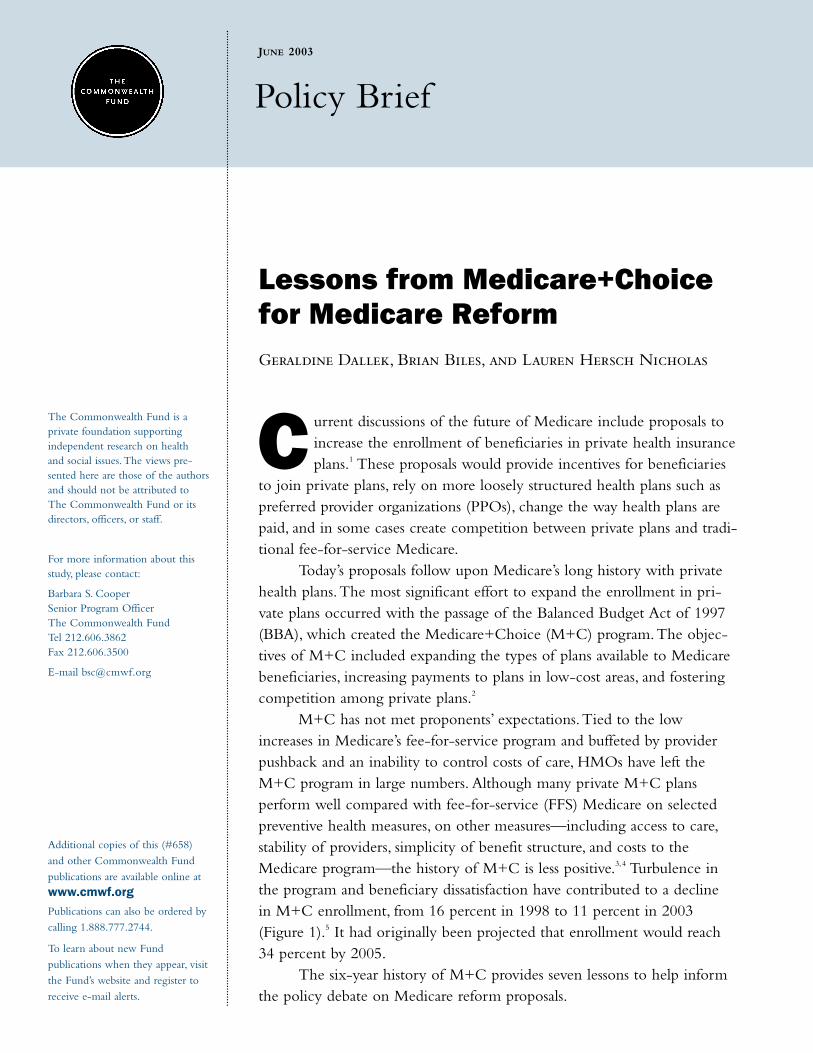
M+C has not met proponents’ expectations.Tied to the lowincreases in Medicare’s fee-for-service program and buffeted by providerpushback and an inability to control costs of care, HMOs have left theM+C program in large numbers. Although many private M+C plansperform well compared with fee-for-service (FFS) Medicare on selectedpreventive health measures, on other measures—including access to care,stability of providers, simplicity of benefit structure, and costs to theMedicare program—the history of M+C is less positive.3,4 Turbulence inthe program and beneficiary dissatisfaction have contributed to a declinein M+C enrollment, from 16 percent in 1998 to 11 percent in 2003(Figure 1).5 It had originally been projected that enrollment would reach34 percent by 2005.
The six-year history of M+C provides seven lessons to help informthe policy debate on Medicare reform proposals.
The Commonwealth Fund is aprivate foundation supportingindependent research on healthand social issues.The views pre-sented here are those of the authorsand should not be attributed toThe Commonwealth Fund or itsdirectors, officers, or staff.
For more information about thisstudy, please contact:
Barbara S. CooperSenior Program OfficerThe Commonwealth FundTel 212.606.3862Fax 212.606.3500
E-mail [email protected]
JUNE 2003
2 The Commonwealth Fund
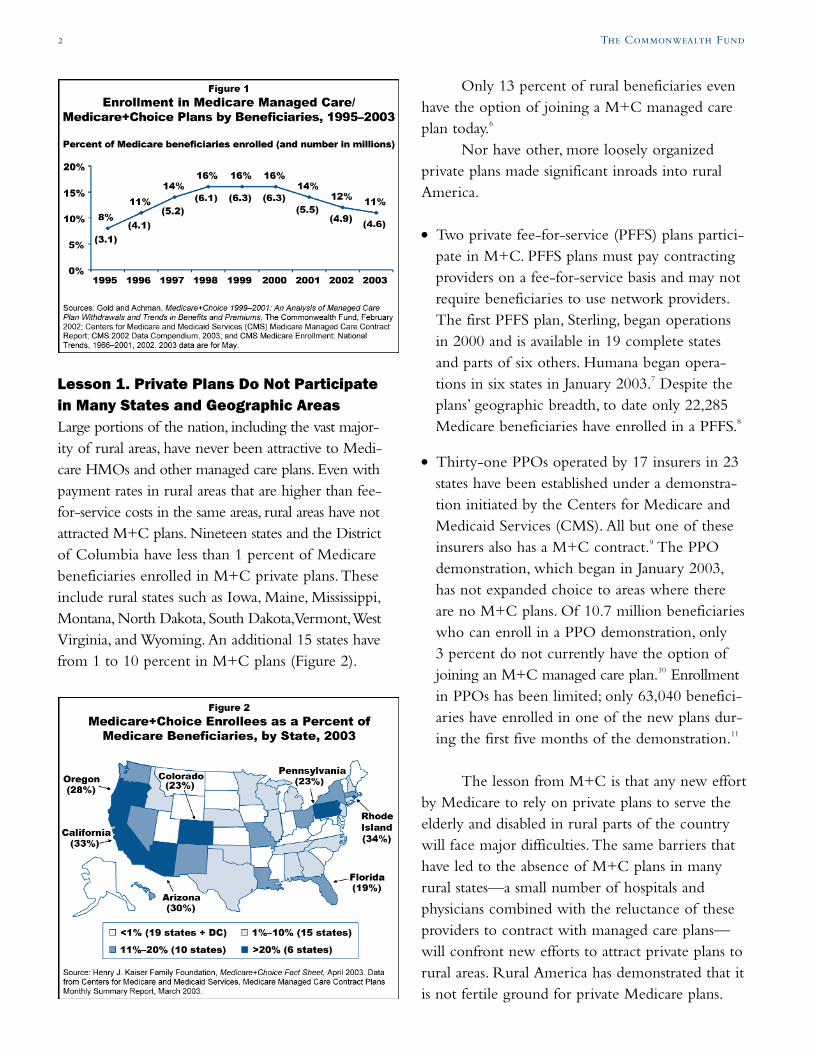
Lesson 1. Private Plans Do Not Participatein Many States and Geographic AreasLarge portions of the nation, including the vast major-ity of rural areas, have never been attractive to Medi-care HMOs and other managed care plans. Even withpayment rates in rural areas that are higher than fee-for-service costs in the same areas, rural areas have notattracted M+C plans. Nineteen states and the Districtof Columbia have less than 1 percent of Medicarebeneficiaries enrolled in M+C private plans.Theseinclude rural states such as Iowa, Maine, Mississippi,Montana, North Dakota, South Dakota,Vermont,WestVirginia, and Wyoming. An additional 15 states havefrom 1 to 10 percent in M+C plans (Figure 2).
Only 13 percent of rural beneficiaries evenhave the option of joining a M+C managed careplan today.6
Nor have other, more loosely organizedprivate plans made significant inroads into ruralAmerica.
● Two private fee-for-service (PFFS) plans partici-pate in M+C. PFFS plans must pay contractingproviders on a fee-for-service basis and may notrequire beneficiaries to use network providers.The first PFFS plan, Sterling, began operationsin 2000 and is available in 19 complete statesand parts of six others. Humana began opera-tions in six states in January 2003.7 Despite theplans’ geographic breadth, to date only 22,285Medicare beneficiaries have enrolled in a PFFS.8
● Thirty-one PPOs operated by 17 insurers in 23states have been established under a demonstra-tion initiated by the Centers for Medicare andMedicaid Services (CMS). All but one of theseinsurers also has a M+C contract.9 The PPOdemonstration, which began in January 2003,has not expanded choice to areas where thereare no M+C plans. Of 10.7 million beneficiarieswho can enroll in a PPO demonstration, only3 percent do not currently have the option ofjoining an M+C managed care plan.10 Enrollmentin PPOs has been limited; only 63,040 benefici-aries have enrolled in one of the new plans dur-ing the first five months of the demonstration.11
The lesson from M+C is that any new effortby Medicare to rely on private plans to serve theelderly and disabled in rural parts of the countrywill face major difficulties.The same barriers thathave led to the absence of M+C plans in manyrural states—a small number of hospitals andphysicians combined with the reluctance of theseproviders to contract with managed care plans—will confront new efforts to attract private plans torural areas. Rural America has demonstrated that itis not fertile ground for private Medicare plans.
Lessons from Medicare+Choice for Medicare Reform 3
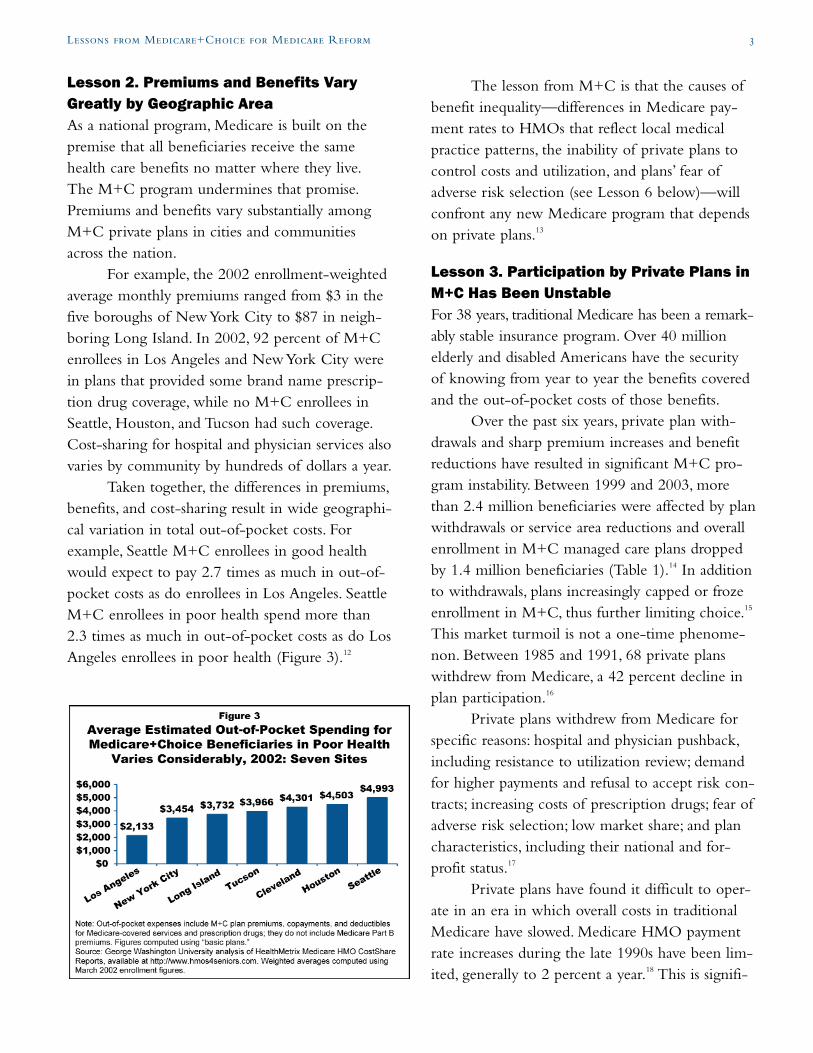
Lesson 2. Premiums and Benefits VaryGreatly by Geographic AreaAs a national program, Medicare is built on thepremise that all beneficiaries receive the samehealth care benefits no matter where they live.The M+C program undermines that promise.Premiums and benefits vary substantially amongM+C private plans in cities and communitiesacross the nation.
For example, the 2002 enrollment-weightedaverage monthly premiums ranged from $3 in thefive boroughs of New York City to $87 in neigh-boring Long Island. In 2002, 92 percent of M+Cenrollees in Los Angeles and New York City werein plans that provided some brand name prescrip-tion drug coverage, while no M+C enrollees inSeattle, Houston, and Tucson had such coverage.Cost-sharing for hospital and physician services alsovaries by community by hundreds of dollars a year.
Taken together, the differences in premiums,benefits, and cost-sharing result in wide geographi-cal variation in total out-of-pocket costs. Forexample, Seattle M+C enrollees in good healthwould expect to pay 2.7 times as much in out-of-pocket costs as do enrollees in Los Angeles. SeattleM+C enrollees in poor health spend more than2.3 times as much in out-of-pocket costs as do LosAngeles enrollees in poor health (Figure 3).12
The lesson from M+C is that the causes ofbenefit inequality—differences in Medicare pay-ment rates to HMOs that reflect local medicalpractice patterns, the inability of private plans tocontrol costs and utilization, and plans’ fear ofadverse risk selection (see Lesson 6 below)—willconfront any new Medicare program that dependson private plans.13
Lesson 3. Participation by Private Plans inM+C Has Been UnstableFor 38 years, traditional Medicare has been a remark-ably stable insurance program. Over 40 millionelderly and disabled Americans have the securityof knowing from year to year the benefits coveredand the out-of-pocket costs of those benefits.
Over the past six years, private plan with-drawals and sharp premium increases and benefitreductions have resulted in significant M+C pro-gram instability. Between 1999 and 2003, morethan 2.4 million beneficiaries were affected by planwithdrawals or service area reductions and overallenrollment in M+C managed care plans droppedby 1.4 million beneficiaries (Table 1).14 In additionto withdrawals, plans increasingly capped or frozeenrollment in M+C, thus further limiting choice.15
This market turmoil is not a one-time phenome-non. Between 1985 and 1991, 68 private planswithdrew from Medicare, a 42 percent decline inplan participation.16
Private plans withdrew from Medicare forspecific reasons: hospital and physician pushback,including resistance to utilization review; demandfor higher payments and refusal to accept risk con-tracts; increasing costs of prescription drugs; fear ofadverse risk selection; low market share; and plancharacteristics, including their national and for-profit status.17
Private plans have found it difficult to oper-ate in an era in which overall costs in traditionalMedicare have slowed. Medicare HMO paymentrate increases during the late 1990s have been lim-ited, generally to 2 percent a year.18 This is signifi-

cantly lower than rate increases in employer healthinsurance, making continued participation in M+Cless attractive to plans than expanded enrollment inthe commercial market.19
Even when private plans have remained inM+C, they have raised premiums, reduced pre-scription drug benefits, and increased beneficiarycost-sharing in each of the past four years, leadingto financial difficulties for plan enrollees.20
Many beneficiaries who paid low or no pre-miums for extensive prescription drug coverage in1999 were paying high premiums for limited or nodrug coverage by 2003 (Table 2). Cost-sharing forhospital care and other benefits has been increased,creating a special burden for beneficiaries withchronic and life-threatening illnesses.21
The lesson from M+C is that a Medicareprogram based on private plans is highly dependenton annual judgments by plans on the financial prof-itability of participating in Medicare.These decisionsare made metro area by metro area. In many casesthese decisions reflect judgments by national for-profit plans. A recent study found that 42 percent ofM+C beneficiaries are enrolled in plans managedby one of six national for-profit health insurers.22
Instability is likely to be a feature of anyMedicare program that relies upon private plans anda competitive marketplace to limit the increase inhealth care costs.23 The same factors that have ledM+C private plans to withdraw from Medicareover the past six years will confront any newMedicare program that depends on private plans.24
Lesson 4. Physician and Hospital Participa-tion in M+C Private Plans Has Been UnstableBecause nearly every hospital and physician in thecountry participates in traditional Medicare, bene-ficiaries have the security of knowing that theirmedical providers will continue to serve themfrom year to year. M+C enrollees do not have thatsame measure of security.
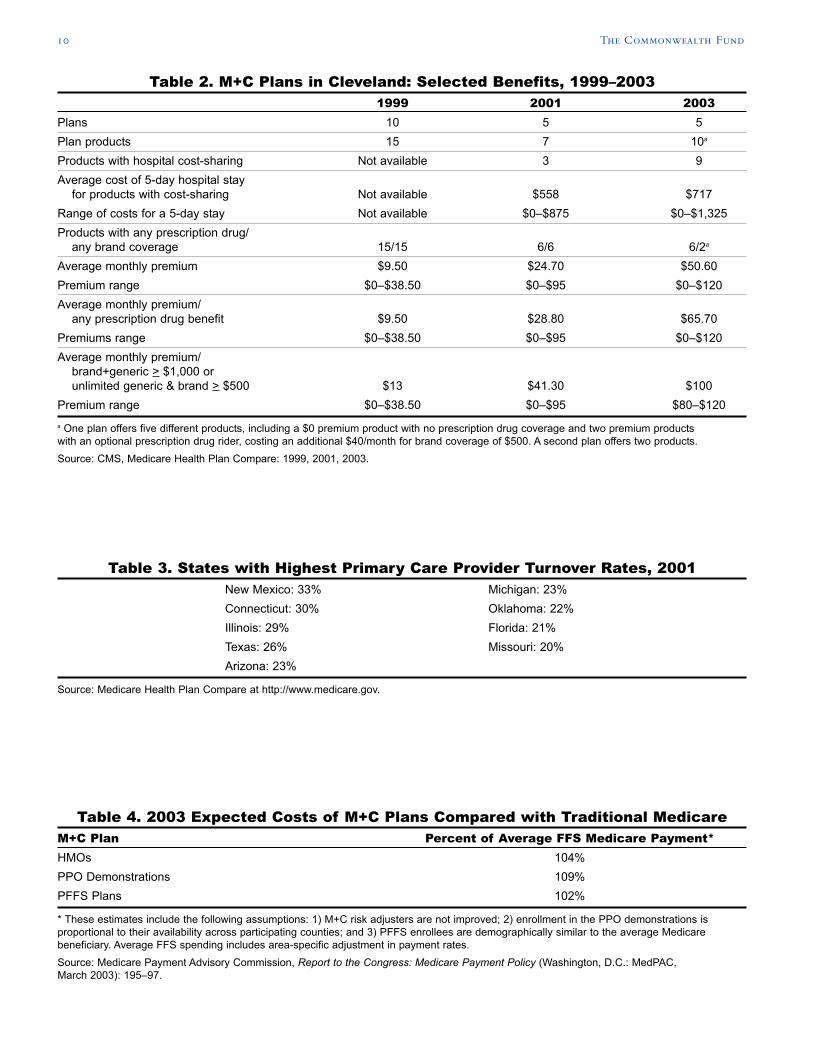
Statewide M+C primary care providerturnover rates ran as high as 33 percent in New
Mexico in 2001. Nine of 36 states with reporteddata had M+C primary care turnover rates of 20percent or more.25 These included plans in largestates such as Illinois,Texas, and Florida (Table 3).
A review of M+C plan provider directoriesin selected cities found that primary care physicianturnover rates during the two-year period 1999–2001 ranged from 23 to 61 percent among M+Cplans in St. Petersburg, Florida, and from 17 to25 percent among plans in the Cleveland area.Cardiologist turnover rates in St. Petersburg M+Cplans were also high, ranging from 17 to 25 percentin the two-year period.26
Contract disputes between plans and hospi-tals also disrupt care to M+C enrollees. For exam-ple, during 2001–2002, M+C enrollees in Clevelandlost access to the Cleveland Clinic; in Tucson, tothe city’s only teaching hospital; on Long Island,to the largest hospital network; and in New YorkCity, to one of the nation’s premier cancer treat-ment centers.27
Elderly and disabled Medicare beneficiariesare more affected by provider turnover than areyounger, employer-insured populations. High levelsof disability and increasing age tie beneficiaries totheir physicians and other health providers, makingdisruptions in continuity of care more serious.28
The lesson from M+C is that instability ofphysicians and providers is likely to be an issuewith any Medicare program that depends on pri-vate plans. As the M+C experience demonstrates,the continuing availability of providers depends onthe policies of individual plans across a wide rangeof payment and administrative matters. Once plansare placed between Medicare and providers, thereis little that Medicare can do to prevent highprovider turnover rates.
Lesson 5. M+C Options Are TooComplicated for Many Beneficiaries toMake an Informed ChoiceSupport for expanded use of private plans often ispremised on the goal of increasing choice for
4 The Commonwealth Fund
elderly population have one or more chronicconditions.31
The lesson from M+C is that—in theabsence of a standardized benefit package—multi-ple private plans in a market area will offer verydifferent and complex packages of benefits, cost-sharing, and premiums.These packages are confus-ing to elderly and disabled Medicare beneficiariesattempting to choose a personal health plan.32
Until Medicare establishes standardized benefitpackages limited to specific options, as is the casefor Medigap policies, variations in benefits arelikely to proliferate, making informed choice allthe more difficult.
Lesson 6. M+C Plan Design Can DiscourageEnrollment by High-Risk BeneficiariesHistorically, Medicare private plans have enrolledhealthier, lower-cost individuals than has traditionalMedicare. A General Accounting Office studyfound that, because of the failure to fully adjust forhealth status, in 1998 Medicare spent $3.2 billion,or 13.2 percent more, on health plan enrolleesthan they would have spent if those enrollees hadreceived services in FFS Medicare.33 These differ-ences may be reduced as CMS increases use of riskadjustment.
Private insurers remaining in the M+C mar-ket increasingly show an interest in risk selection.In particular, increases in cost-sharing for someservices by some plans seem to be directly relatedto the fear of enrolling high-cost beneficiaries.34
Across the nation, plans have increased costs onspecific services most likely to be used by enrolleeswith high-cost chronic conditions, such as hospitalcare, oxygen, dialysis, chemotherapy, and radiationtherapy.35
In 2002, the design of M+C plan benefitsresulted in the average M+C enrollee in goodhealth spending $1,429 out-of-pocket on healthcare, compared with $4,783 spent by an enrolleein poor health. Since 1999, plans’ benefit changeshave focused on increasing out-of-pocket costs
Lessons from Medicare+Choice for Medicare Reform 5
Medicare beneficiaries. Subtle and multiple varia-tions in benefits and cost-sharing make it difficultfor anyone, but especially the elderly and thosewho are cognitively impaired, to evaluate choicesamong plans.
Making a choice of M+C plans is verycomplicated. Because M+C does not require stan-dardized benefit packages (as Medigap plans arerequired to do), different plans have varying cost-sharing requirements for drugs and other benefits(see Appendix). Drug benefits, for example, canvary by prescription drug limits and the way theselimits are calculated (monthly, quarterly, or yearly);whether brand or only generic drugs are covered;copayment levels; whether a formulary is used, andif so, which drugs are on it; whether the plan pro-vides a discount mail-order pharmacy benefit; andhow each plan determines drug costs that counttoward benefit limits.
Hospital costs can also vary dramatically.TheM+C 2003 plan benefits available to Clevelandbeneficiaries have hospital costs for a five-day stayof: $0, $250, $375, $750, $875, $1,000, and $1,325.
In Cleveland (and elsewhere), differencesamong M+C plans in the out-of-pocket costs forradiation services are as dramatic, ranging for $0copayments to $35 to 20 percent of the cost ofeach visit. For a woman undergoing radiation ther-apy for breast cancer, which can require as many as35 radiation therapy visits, out-of-pocket costswould be more than $1,000.
With additional cost-sharing on a myriad ofother benefits, beneficiaries must now make com-plicated calculations based on premiums, drug ben-efits, and cost-sharing to assess which plan mightmake the most economic sense.29
Studies suggest that the elderly are vulnera-ble to making poor purchasing decisions wheninsurance options are too confusing and are reluc-tant to change insurer, even when in their eco-nomic self-interest.30 Choosing an appropriatehealth plan is especially critical for beneficiariesin poor health, and 82 percent of the Medicare

for those in poor health: costs for those in poorhealth have increased by 116 percent, comparedwith 71 percent for those in good health.36
Differences between out-of-pocket costspaid by M+C enrollees in poor health and thosepaid by enrollees in good health are even moredramatic in some communities. In Houston in2002, M+C enrollees in poor health spent $4,503,while those in good health spent $471—nearly atenfold difference. In Cleveland and Seattle, M+Cenrollees in poor health spent over 6.7 and 4.4times more out-of-pocket, respectively, thanenrollees in good health (Figure 4).37
The lesson from M+C suggests that privateplans design their benefit packages to avoid attract-ing higher-cost enrollees. Beneficiaries most inneed of care who enroll in a private plan may payhigher out-of-pocket costs than they would in fee-for-service Medicare.To the extent that privateplans discourage beneficiaries in poor health fromenrolling, and without an adequate risk adjustmentmethodology, the Medicare program will also facehigher costs for beneficiaries who remain in tradi-tional fee-for-service Medicare.
Lesson 7. Private Plans Are Not LessCostly Than Traditional MedicareThe major goal of Medicare reform based on pri-vate plans is to use competition to control the
growth in overall Medicare costs.The experiencefrom M+C suggests that private plans do not saveMedicare money and that, to the contrary, theycan increase program costs (Table 4).38
The reasons why M+C private plans havenot succeeded in reducing total Medicare costsinclude:
● Enrollees in M+C managed care plans have his-torically been healthier than those who remainin fee-for-service Medicare, and risk-adjustedMedicare payment does not fully compensate forthis pattern.40
● To attract M+C plans in more rural and non-metropolitan areas, Medicare has increased pay-ments for M+C plans above the level it pays inthese areas for traditional Medicare.While this hasnot led to increased participation by MedicareHMOs, increased rural payments translate intohigher Medicare costs for PFFS plan contracts.
● The newer private plans—PFFS plans anddemonstration PPOs—contract in areas whereM+C payment rates are higher than traditionalMedicare rates.41
● Medicare administrative costs average approxi-mately 2 percent, while administrative costs inprivate plans in employer groups generally exceed10 percent. In particular, private plans have costsassociated with marketing and, in the case offor-profit plans, a return for investors.42
New, less-structured PFFS and PPO plans,with broader provider networks and fewer costcontainment features, may be even less able thanare current M+C HMO plans to limit total coststhrough reductions in price, rates of hospitaliza-tion, and use of specialized services.43
The lesson from M+C suggests that it is dif-ficult for private plans to reduce total costs of carefrom the level of the traditional Medicare pro-gram.44 It is even more difficult for private plans tooffer additional benefits, cover marketing and
6 The Commonwealth Fund

Lessons from Medicare+Choice for Medicare Reform 7
administrative costs, and make a profit while pric-ing their products below the costs of the Medicarefee-for-service program.
ConclusionIn 1997, it was predicted that 34 percent ofMedicare beneficiaries would be enrolled in M+Cprivate plans by 2005.45 Instead, 11 percent of theMedicare population is enrolled in M+C plans in2003, down from 16 percent in 1998.46 Policyexperts also projected that M+C plans wouldexpand to all parts of the country, educated bene-ficiaries would begin to make informed choicesbased on costs and quality, and competition amongplans would reduce overall costs to the Medicareprogram and to beneficiaries alike.
None of these predictions has occurred.Instead, the M+C program has fostered broad dis-satisfaction by private plans, providers, and elderlyand disabled beneficiaries. Rather than steadygrowth, the program has undergone a period ofpersistent instability and a decline in enrollment.
The history of M+C is a cautionary tale. Itoffers important lessons for consideration in anynew program to expand the use of private plansin Medicare.
NOTES
1 See “The Bush ‘Triple Option’ Medicare Plan,”Washington Healthbeat, March 4, 2003;The BushWhite House, 21st Century Medicare: More Choices—Better Benefits: A Framework to Modernize and ImproveMedicare; “Baucus-Grassley Plan May Be Break-through,” Washington Healthbeat, June 5, 2003.
2 In addition to Medicare HMOs, the legislationauthorized other types of private plans—PreferredProvider Organizations, Provider SponsoredOrganizations, Private Fee-For-Service Plans, andMedical Savings Account Plans—to enroll Medicarebeneficiaries.
3 Medicare Health Plan Compare at http://www.Medicare.gov. Studies have found that HMOmembers tend to be more satisfied with the cost of
care than are FFS patients. Overall plan satisfactionratings have been shown to be related to beneficiaryage. See D. Cox, B. Lanyi, and A. Strabic,“MedicareHealth Maintenance Organization Benefits Packagesand Plan Performance Measures,” Health CareFinancing Review 24 (Fall 2002): 133–44.
4 Studies have found that FFS beneficiaries are gener-ally more satisfied with access measures than arethose in M+C plans. Areas where M+C beneficiariestend to be least satisfied include access to care andquality of care. See Cox, Lanyi, and Strabic, 2002.
5 Henry J. Kaiser Family Foundation, Medicare+ChoiceFact Sheet (Washington, D.C.: Kaiser FamilyFoundation, April 2003).
6 Henry J. Kaiser Family Foundation, Medicare+ChoiceFact Sheet (Menlo Park, Calif.: Kaiser FamilyFoundation, February 2003). Fifty-six percent ofbeneficiaries have the option of enrolling in a PFFSplan and 61 percent have the option of enrolling inany M+C product. Medicare Payment AdvisoryCommission, Report to the Congress: Medicare PaymentPolicy (Washington, D.C.: MedPAC, March 2003): 198.
7 MedPAC, 2003.
8 L. Achman and M. Gold, Medicare+Choice andMedicare Beneficiaries: Monthly Tracking Report for May2003 (Washington, D.C.: Mathematica PolicyResearch, Inc., 2003).
9 M. Gold, L. Achman, and J.Verdier, The MedicarePreferred Provider Organization Demonstration: Overviewof Design, Characteristics, and Outstanding Issues ofInterest (Washington, D.C.: AARP Public PolicyInstitute, Publication #2003-07, June 2003).
10 Gold, Achman, and Verdier, 2003.
11 Achman and Gold, 2003.
12 G. Dallek, A Dennington, and B Biles, GeographicInequity in Medicare+Choice Benefits: Findings fromSeven Communities (New York:The CommonwealthFund, September 2002).
13 Ibid.
14 Gold, Achman, and Verdier, 2003.
15 B. Biles, G. Dallek, and A. Dennington, Medicare+ChoiceAfter Five Years: Lessons for Medicare’s Future (NewYork:The Commonwealth Fund, September 2002): 3.

8 The Commonwealth Fund
16 M. Gluck, Medicare Chart Book (Menlo Park, Calif.:Kaiser Family Foundation, Fall 2001): 52, Second ed.
17 For-profit and national plans and plans with smallmarket share were more likely to quit the M+Cmarket.T. Lake and R. Brown, Medicare+ChoiceWithdrawals: Understanding the Key Factors (Washington,D.C.: Kaiser Family Foundation, June 2002). See also,R. Hurley, J. Grossman, and B. Strunk,“MedicareContracting Risk/Medicare Risk Contracting: ALife-Cycle View from Twelve Markets,” Health ServiceResearch 38 (February 2003, Pt. 2): 395–417; Biles,Dallek, and Dennington, 2002; and J. Stuber, G.Dallek, and B. Biles, National and Local Factors DrivingHealth Plan Withdrawals from Medicare+Choice (NewYork:The Commonwealth Fund, October 2001).
18 The BBA effectively limited the annual increase inMedicare payments to 2 percent per year in mostareas. Congressional efforts to encourage M+C plansto serve areas where no plans were being offered(Balanced Budget Refinement Act of 1999) and stemplan withdrawals and benefit reductions (BenefitsImprovement and Protection Act of 2000) throughincreased funding had little effect on either benefitsor plan availability. General Accounting Office,Medicare+Choice: Recent Payment Increases Had LittleEffect on Benefits or Plan Availability in 2001(Washington, D.C.: GAO, November 2001).
19 C. Boccuti and M. Moon,“Comparing Medicare andPrivate Insurers: Growth Rates in Spending over ThreeDecades,” Health Affairs (March/April 2003): 230–37.
20 See generally, Biles, Dallek, and Dennington, 2002;Centers for Medicare and Medicaid Services, M+CChanges in Access, Benefits, and Premiums, 2001 to2002, December 2002; L. Achman and M. Gold,Medicare+Choice 1999–2001: An Analysis of ManagedCare Plan Withdrawals and Trends in Benefits andPremiums (New York:The Commonwealth Fund,January 2002).
21 Achman and Gold, 2002.
22 In 2001, 18 percent of M+C enrollees were in aPacifiCare plan, 7 percent in Humana, 7 percent inUnited HealthCare, 5 percent in Aetna plans, 4 per-cent in HealthNet, and 1 percent in CIGNA plans.D. Draper, M. Gold, and J. McCoy, The Role ofNational Firms in Medicare+Choice (Washington, D.C.:Kaiser Family Foundation, 2002).
23 Researchers who studied M+C in 12 markets over athree-year period concluded that the use of privateplans in Medicare involves an “inescapable measure ofinstability.” Hurley, Grossman, and Strunk, 2003: 416;the Medicare Payment Advisory Commission hassimilarly determined that “instability for Medicarebeneficiaries…is part of the reality of competition.”MedPAC, 2003: 211.
24 Ibid.
25 Health Plan Compare at http://www.medicare.gov.
26 G. Dallek and A. Dennington, Physician Withdrawals:A Major Source of Instability in the Medicare+ChoiceProgram (New York:The Commonwealth Fund,January 2002).
27 Biles, Dallek, and Dennington, 2002.
28 T. Buchmueller,“The Health Plan Choices ofRetirees Under Managed Competition,” HealthServices Research 35 (December 2000): 949-76; C.Young and J. Mittler,“Medicare+Choice:Views fromthe Field,” Operational Insights (Washington, D.C.:Mathematica Policy Research, Inc., March 2002).
29 See generally, G. Dallek and C. Edwards, RestoringChoice to Medicare+Choice: The Importance ofStandardizing Health Plan Benefit Packages (New York:The Commonwealth Fund, October 2001).
30 General Accounting Office, Medigap Insurance: BetterConsumer Protection Should Result from 1990 Changesto Baucus Amendment (Washington, D.C.:GAO/HRD-91-49, March 1991); P. D. Fox,T. Rice,and L. Alecxih,“Medigap Regulation Lessons forHealth Care Reform,” Journal of Health Politics, Policyand Law 20 (Spring 1995): 31–48;T. Rice, M. L.Graham, and P. Fox,“The Impact of PolicyStandardization on the Medigap Market,” Inquiry(Summer 1997): 106–16; Buchmueller, 2000.
31 K. Davis, C. Schoen, M. Doty, and K.Tenney,“Medicare Versus Private Insurance: Rhetoric andReality,” Health Affairs Web Exclusive (October 9,2002):W3-189–W3-198.
32 Dallek and Edwards, 2001.
33 General Accounting Office, Medicare+Choice:Payments Exceed Cost of Fee-for-Service Benefits,Adding Billions to Spending (GAO/HEHS-00-161,August 2000).
Lessons from Medicare+Choice for Medicare Reform 9
34 In interviews with private plan executives aroundthe country, a number of plan executives admittedthat the purpose of some benefit cuts and increasedcost-sharing were to “decrease adverse selection.”
35 Biles, Dallek, and Dennington, 2002; L. Achman andM. Gold, Medicare+Choice Plans Continue to Shift MoreCosts to Enrollees (New York:The CommonwealthFund, April 2003).
36 M. Gold and L Achman, Average Out-of-Pocket HealthCare Costs for Medicare+Choice Enrollees IncreaseSubstantially in 2002 (New York:The CommonwealthFund, November 2002); Achman and Gold, 2003.
37 Dallek, Dennington, and Biles, 2002.
38 Estimates of the Medicare costs associated with privateplans vary widely. CMS estimates that PPOs will beable to offer all Medicare benefits at 98–99 percent ofwhat the government pays in FFS Medicare, while theCongressional Budget Office estimates that they willcost 10–12 percent more than original Medicare. R.Pear,“Bush Will Accept Identical Benefits on MedicareDrugs,” New York Times, June 10, 2003, pp. A1, A24.
39 GAO, 2000.
40 PPO demonstrations are paid the greater of 99 per-cent of the Medicare AAPCC payment rate or the
current M+C rate. In 82 percent of the countiesin which a PPO demonstration is located, the PPOis paid the current M+C rate. Gold, Achman, andVerdier, 2003.
41 M. Merlis. The Federal Employees Health BenefitsProgram: Program Design, Recent Performance, andImplications for Medicare Reform (Washington, D.C.:Kaiser Family Foundation, 2003).
42 The new PPO demonstration could further increasecosts to Medicare. In addition to paying more forPPO enrollees than it would if beneficiaries hadremained in traditional Medicare, Medicare sharesrisk with many of the PPO demonstrations. If PPOenrollees are more costly than expected, Medicarewill share in those added costs.
43 MedPAC, 2003: 210.
44 R. Berenson,“Medicare+Choice: Doubling orDisappearing?” Health Affairs Web Exclusive(November 28, 2001):W65-W82.
45 Henry J. Kaiser Family Foundation, Medicare+ChoiceFact Sheet (Washington, D.C.: Kaiser FamilyFoundation, April 2003).
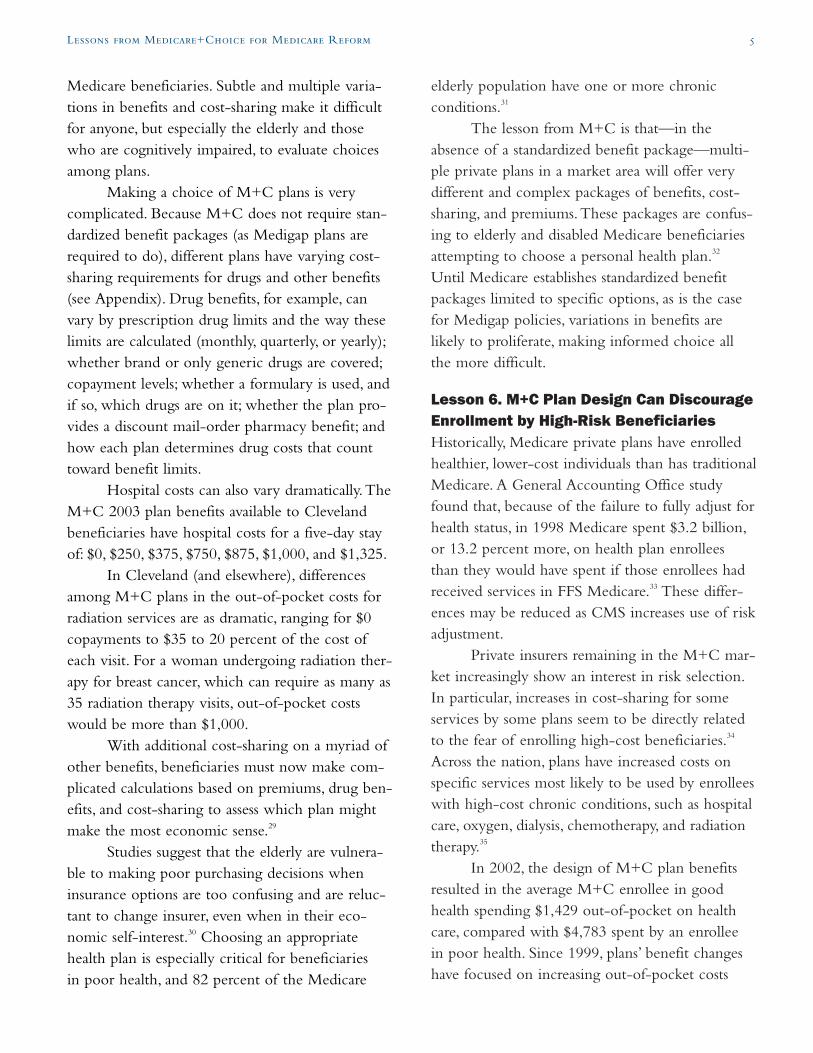
Table 1. Beneficiaries Affected by M+C Withdrawals, 1999–2002Jan. 1999 Jan. 2000 Jan. 2001 Jan. 2002 Jan. 2003
M+C plan terminations 45 41 65 22 33M+C plan service area reductions 54 58 53 36 23Beneficiaries affected 407,000 327,000 934,000 536,000 217,000Percentage of M+C enrollees 6.3% 4.7% 13.6% 9.6% 3.9%
* Number of beneficiaries affected is number enrolled in a plan at the due date for plans to announce withdrawal. For example,the 1999 column refers to beneficiaries enrolled as of June 1999 in a plan that withdrew effective January 2000.Source: CMS Fact Sheet “Protecting Medicare Beneficiaries after Medicare+Choice Organizations Withdraw,” September 2002;CMS quarterly state/county market penetration reports, June 1998, June 1999, June 2000, September 2001, June 2002.
10 The Commonwealth Fund
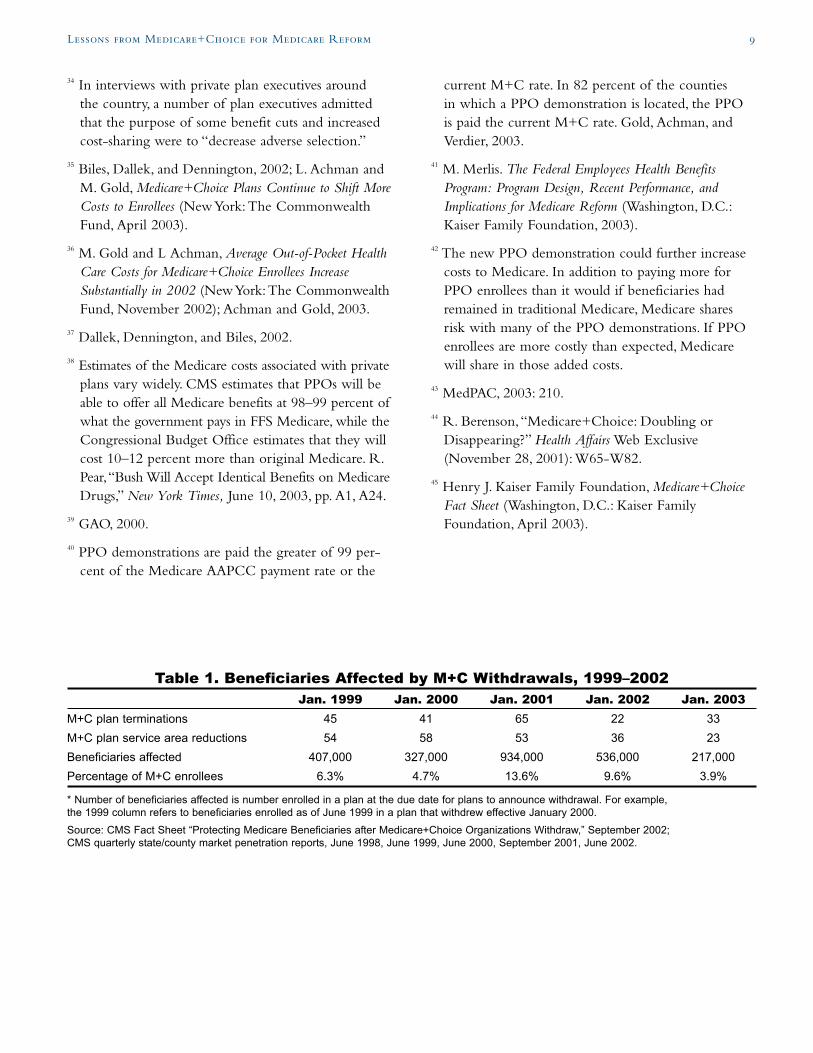
Table 2. M+C Plans in Cleveland: Selected Benefits, 1999–20031999 2001 2003
Plans 10 5 5Plan products 15 7 10a
Products with hospital cost-sharing Not available 3 9Average cost of 5-day hospital stay
for products with cost-sharing Not available $558 $717Range of costs for a 5-day stay Not available $0–$875 $0–$1,325Products with any prescription drug/
any brand coverage 15/15 6/6 6/2a
Average monthly premium $9.50 $24.70 $50.60Premium range $0–$38.50 $0–$95 $0–$120Average monthly premium/
any prescription drug benefit $9.50 $28.80 $65.70Premiums range $0–$38.50 $0–$95 $0–$120Average monthly premium/
brand+generic > $1,000 orunlimited generic & brand > $500 $13 $41.30 $100
Premium range $0–$38.50 $0–$95 $80–$120a One plan offers five different products, including a $0 premium product with no prescription drug coverage and two premium productswith an optional prescription drug rider, costing an additional $40/month for brand coverage of $500. A second plan offers two products.Source: CMS, Medicare Health Plan Compare: 1999, 2001, 2003.
Table 3. States with Highest Primary Care Provider Turnover Rates, 2001New Mexico: 33% Michigan: 23%Connecticut: 30% Oklahoma: 22%Illinois: 29% Florida: 21%Texas: 26% Missouri: 20%Arizona: 23%
Source: Medicare Health Plan Compare at http://www.medicare.gov.
Table 4. 2003 Expected Costs of M+C Plans Compared with Traditional MedicareM+C Plan Percent of Average FFS Medicare Payment*HMOs 104%PPO Demonstrations 109%PFFS Plans 102%
* These estimates include the following assumptions: 1) M+C risk adjusters are not improved; 2) enrollment in the PPO demonstrations isproportional to their availability across participating counties; and 3) PFFS enrollees are demographically similar to the average Medicarebeneficiary. Average FFS spending includes area-specific adjustment in payment rates.Source: Medicare Payment Advisory Commission, Report to the Congress: Medicare Payment Policy (Washington, D.C.: MedPAC,March 2003): 195–97.

Lessons from Medicare+Choice for Medicare Reform 11
2001
Pre
miu
m a
nd S
elec
ted
Ben
efit
Cop
aym
ents
:Ta
mpa
Med
icar
e+C
hoic
e P
lans
Pla
n V
1P
lan
V2
Pla
n W
Pla
n X
1P
lan
X2
Pla
n Y
Pla
n Z
1P
lan
Z2
Enr
ollm
ent l
imit
No
No
Yes
No
No
No
No
Yes
Pre
miu
m$6
3$0
$63
$179
$0$0
$0$1
9D
octo
r vis
its:
Prim
ary
care
$10
$15
$10
$10
$10
$15
$10
$5Sp
ecia
list
$5–$
200
$15–
$400
$25
$15
$15
$20
$15
$10
Out
patie
nt v
isits
:A
mbu
lato
ry s
urge
ry$2
00$5
00$0
$35
$50
$100
$25
$25
Hos
pita
l vis
it$2
00$5
00$5
0$3
5$5
0$5
0$2
5$2
5D
urab
le m
edic
al e
quip
men
t$0
$0$0
$0$0
20%
$0$0
Dia
gnos
tic te
sts:
Clin
ical
lab
$0$0
$0$0
$0$5
$0$0
X-r
ays/
diag
nost
ic la
b$4
0–$2
00$4
0–$3
50$0
$0$0
$5 X
-ray
;$0
$0$5
0 ot
her
radi
atio
n se
rvic
esR
adia
tion
ther
apy
$40/
visi
t$4
0/vi
sit
$0$0
$0$5
–$50
$15/
serv
ice
$10/
serv
ice
Out
patie
nt re
habi
litat
ion
serv
ices
$40/
visi
t$4
0/vi
sit
$25/
visi
t$1
0–$1
5/vi
sit
$10–
$15/
visi
t$2
5/vi
sit
$15/
visi
t$1
0/vi
sit
Inpa
tient
hos
pita
l car
e$5
00 p
er a
dm.;
$500
per
adm
.;$1
50/d
ay$1
00/s
tay
$300
/sta
y$1
50/d
ay$2
00/s
tay
$0$2
00/d
ay fo
r$2
00/d
ay fo
rda
ys 7
–30
atda
ys 7
–30
atne
twor
k ho
sp.
netw
ork
hosp
.S
kille
d nu
rsin
g fa
cilit
y:D
ays
1–20
$0/d
ay$0
/day
$0$0
$0$7
5$0
$0D
ays
21–1
00$8
5/da
y$9
0/da
y$9
7$0
$75
$0$0
Hom
e he
alth
car
e$0
$0$0
$0$0
$0$0
$0B
one
mas
s m
easu
rem
ent
$10/
phys
icia
n’s
$15/
phys
icia
n’s
$0$0
$0$0
$0$0
offic
e, $
40 n
on-
offic
e, $
40/n
on-
phys
icia
n cl
inic
phys
icia
n cl
inic
Pre
scrip
tion
drug
s$1
0N
o pr
escr
iptio
n$5
$5$1
0$8
(31-
day)
(31-
day)
Form
ular
y dr
ugs
$20
pref
erre
ddr
ug c
over
age
$20
$15
Not
cov
ered
$40
$7$5
30–3
1-da
y su
pply
$20
$15
$15
$30
$24
$20
$15
Gen
eric
cop
ay$4
0 pr
efer
red
$60
$45
Not
cov
ered
$120
Not
ava
ilabl
eN
ot a
vaila
ble
Bra
nd c
opay
$150
/3 m
onth
sU
nlim
ited
Unl
imite
dU
nlim
ited
$500
/yea
rU
nlim
ited
Unl
imite
d90
-day
mai
l ord
erge
neric
and
pre
ferr
ed$2
50/6
mon
th$5
0/m
onth
Not
cov
ered
Pla
n ha
s$1
25/3
mon
ths
$125
/3 m
onth
sG
ener
ic c
opay
& n
on-p
refe
rred
form
ular
y &
non
-fo
rmul
ary
& n
on-
Not
cov
ered
no fo
rmul
ary
non-
form
ular
yno
n-fo
rmul
ary
Bra
nd c
opay
bran
dfo
rmul
ary
bran
dfo
rmul
ary
bran
dge
neric
& a
llge
neric
& a
llC
ap$1
0$3
5$3
0br
and
drug
sbr
and
drug
sG
ener
ic$4
0$3
5$3
0$3
0$3
0B
rand
$10
$105
$90
$30
$30
Non
-form
ular
y$8
0$1
05$9
0N
ot a
vaila
ble
Not
ava
ilabl
e30
–31-
day
supp
lyS
ee a
bove
See
abo
veS
ee a
bove
See
abo
veS
ee a
bove
Gen
eric
cop
ayB
rand
cop
ay90
-day
mai
l ord
erG
ener
ic c
opay
Bra
nd c
opay
Cap
aP
lan
Yha
s a
$3,5
00 o
ut-o
f-poc
ket l
imit
prot
ectio
n fo
r com
bine
d in
patie
nt a
nd o
utpa
tient
ser
vice
s, n
ot in
clud
ing
certa
in o
ffice
vis
it co
pays
, pre
scrip
tion
drug
s, m
edic
al s
uppl
ies,
and
sel
ecte
d ot
her b
enef
its.
b$4
0 sp
ecia
list p
er v
isit
copa
y, e
xcep
t $10
/vis
it to
Alle
rgy
phys
icia
ns, $
5/sp
ecim
en to
hos
pita
l pat
holo
gist
s, $
5/in
terp
reta
tion
to h
ospi
tal r
adio
logi
sts,
$50
/vis
it to
ER
phy
sici
an, $
200
for c
atar
act s
urge
ry, $
50/e
ach
alle
rgy
skin
test
ing,
and
40%
of
char
ges
for n
on-p
lan
seco
nd m
edic
al o
pini
on.
c$5
0 sp
ecia
list p
er v
isit
copa
y, e
xcep
t $15
/vis
it to
Alle
rgy
phys
icia
ns, $
15/s
peci
men
to a
ll ho
spita
l pat
holo
gist
s, $
15/in
terp
reta
tion
to h
ospi
tal r
adio
logi
sts,
$50
/ vis
it to
ER
phy
sici
ans,
$40
0 fo
r cat
arac
t sur
gery
, and
50%
of c
harg
es fo
r non
-pla
nse
cond
med
ical
opi
nion
.d
$200
cop
ay fo
r com
plex
pro
cedu
res,
def
ined
as
Car
diac
Cat
hete
rizat
ion,
MR
I, Li
thot
ripsy
, Nuc
lear
Stre
ss T
est,
CAT
Sca
n, a
nd P
ET
Sca
n; $
40 c
opay
for a
ll ot
her s
impl
e di
agno
stic
test
ing
proc
edur
es; a
nd $
50 c
opay
for a
llerg
y sk
in te
stin
g.e
$350
cop
ay fo
r com
plex
pro
cedu
res,
def
ined
as
Car
diac
Cat
hete
rizat
ion,
MR
I, Li
thot
ripsy
, Nuc
lear
Stre
ss T
est,
CAT
Sca
n, a
nd P
ET
Sca
n; $
40 c
opay
men
t for
all
othe
r sim
ple
diag
nost
ic te
stin
g pr
oced
ures
; and
$50
cop
ay fo
r alle
rgy
skin
test
ing.
f$1
,000
per
adm
issi
on a
nd $
200/
day
for d
ays
7–30
at n
on-p
artic
ipat
ing
hosp
itals
.g
$1,0
00 p
er a
dmis
sion
and
$30
0/da
y fo
r day
s 7–
30 a
t non
-par
ticip
atin
g ho
spita
ls.
hG
luco
se m
onito
rs, t
est s
trips
, lan
cets
, and
sel
f-man
agem
ent t
rain
ing.
Sou
rce:
G. D
alle
k an
d C
. Edw
ards
, Res
torin
g C
hoic
e to
Med
icar
e+C
hoic
e: T
he Im
porta
nce
of S
tand
ardi
zing
Hea
lth P
lan
Ben
efit
Pac
kage
s(N
ew Y
ork:
The
Com
mon
wea
lth F
und,
Oct
ober
200
1).
Appendix

ABOUT THE AUTHORS
Geraldine Dallek is a health policy consultant, and was formerly at Georgetown University’s Institute for HealthCare Research and Policy.
Brian Biles, M.D., is a professor in the Department of Health Services Management and Policy in the School ofPublic Health and Health Services at George Washington University.
Lauren Hersch Nicholas is a research assistant at the Center for Health Services Research and Policy at GeorgeWashington University.