evaluating the effect of medicare shared savings program
37
EVALUATING THE EFFECT OF MEDICARE SHARED SAVINGS PROGRAM ACCOUNTABLE CARE ORGANIZATIONS ON PART D PHARMACEUTICAL SPENDING AND USE by Meiqi He BA, Boston University, 2014 Submitted to the Graduate Faculty of Department of Biostatistics Graduate School of Public Health in partial fulfillment of the requirements for the degree of Master of Science University of Pittsburgh 2017 CORE Metadata, citation and similar papers at core.ac.uk Provided by D-Scholarship@Pitt
-
Upload
khangminh22 -
Category
Documents
-
view
1 -
download
0
Transcript of evaluating the effect of medicare shared savings program
EVALUATING THE EFFECT OF MEDICARE SHARED SAVINGS PROGRAM ACCOUNTABLE CARE ORGANIZATIONS ON PART D PHARMACEUTICAL
SPENDING AND USE
by
Meiqi He
BA, Boston University, 2014
Submitted to the Graduate Faculty of
Department of Biostatistics
Graduate School of Public Health in partial fulfillment
of the requirements for the degree of
Master of Science
University of Pittsburgh
2017
CORE Metadata, citation and similar papers at core.ac.uk
Provided by D-Scholarship@Pitt
ii
UNIVERSITY OF PITTSBURGH
Graduate School of Public Health
This thesis was presented
by
Meiqi He (Wendy)
It was defended on
April 19, 2017
and approved by
Thesis Director: Robert T. Krafty, PhD
Associate Professor Department of Biostatistics
Graduate School of Public Health University of Pittsburgh
Committee Member: Ada O. Youk, PhD Associate Professor
Department of Biostatistics, Epidemiology, and Clinical and Translational Sciences Graduate School of Public Health and School of Medicine
University of Pittsburgh
Committee Member: Julia Driessen, PhD Assistant Professor
Department of Health Policy and Management, Economics, and Biomedical Informatics Graduate School of Public Health and Health Policy Institute
University of Pittsburgh

iii
Copyright © by Meiqi He
2017
iv
Robert Krafty, PhD
ABSTRACT
Medicare Shared Savings Program (MSSP) is one major model of the Accountable Care
Organizations (ACOs) offered by Medicare to better manage health cost and improve the quality
of health services. The payment MSSP ACOs receive from Medicare is directly related to its
Medicare Part A and B spending and related health service quality. Currently Medicare Part D
spending covering medication cost is not included in the calculation of MSSP ACOs shared
savings and risks. Since improvement of medication coverage and drug adherence have been
shown to decrease other medical cost such as hospital and outpatient care, ACO providers may
be incentivized to increase the shared savings by lowering Part A and B spending through
increasing Part D drug prescription. This study evaluated the effect of MSSP ACOs on the Part
D spending and utilization with a quasi-natural difference-in-differences model. We investigated
the change in outcome variables between pre- and post-ACO enrollment during 2010-2013 by
comparing MSSP ACOs and non-ACO Medicare providers.
We found that when individually compared with non-ACO providers, Part D spending
and use mildly increased after providers enrolled in MSSP. However, the statistical significance
of this effect disappeared after controlling for other ACO providers started their MSSP contracts
at different times. To evaluate the c. Characteristics of those providers not considered in this
EVALUATING THE EFFECT OF MEDICARE SHARED SAVINGS PROGRAM ACCOUNTABLE CARE ORGANIZATIONS ON PART D PHARMACEUTICAL
SPENDING AND USE
Meiqi He, MS
University of Pittsburgh, 2017
v
study might also have an influence on Part D spending and thus a valid control group would need
to be carefully chosen for future studies.
Public health significance: Understanding the ACO effects on Medicare Part D
spending and utilization helps evaluate the success of ACOs to increase shared savings and to
improve health quality compared with original management models in Medicare.
vi
TABLE OF CONTENTS
PREFACE ..................................................................................................................................... X
1.0 INTRODUCTION ........................................................................................................ 1
1.1 MEDICARE ......................................................................................................... 1
1.2 ACCOUNTABLE CARE ORGANIZATIONS ................................................ 2
1.2.1 Early Results of ACOs .................................................................................. 3
1.2.2 Difference-In-Differences Approach to Analyze ACO Effects ................. 4
1.3 OBJECTIVE ........................................................................................................ 6
2.0 METHODS ................................................................................................................... 7
2.1 STUDY POPULATIONS .................................................................................... 7
2.2 DATA COLLECTION ........................................................................................ 7
2.3 OUTCOME MEASURES ................................................................................... 8
2.3.1 Response Variables ....................................................................................... 8
2.3.2 Covariates ...................................................................................................... 9
2.4 STATISTICAL ANALYSIS ............................................................................... 9
2.4.1 Model Development .................................................................................... 10
3.0 RESULTS ................................................................................................................... 12
3.1 DESCRIPTIVE STATISTICS ......................................................................... 12
3.2 MODEL STATISTICS ...................................................................................... 16
4.0 DISCUSSION ............................................................................................................. 19
4.1 STRENGTHS ..................................................................................................... 21
4.2 LIMITATIONS AND FUTURE DIRECTION............................................... 21

vii
APPENDIX A: PEARSON RESIDUAL PLOTS ..................................................................... 22
APPENDIX B: SAS CODE FOR ANALYSIS ......................................................................... 24
BIBLIOGRAPHY ....................................................................................................................... 26
viii
LIST OF TABLES
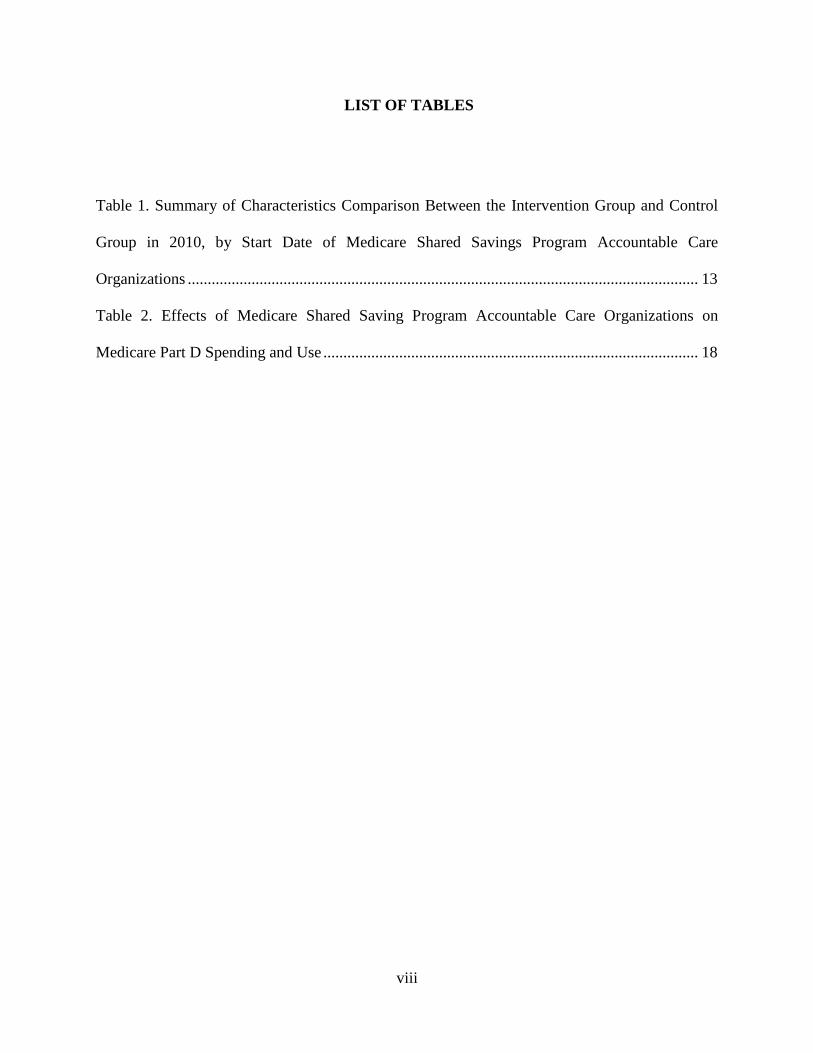
Table 1. Summary of Characteristics Comparison Between the Intervention Group and Control
Group in 2010, by Start Date of Medicare Shared Savings Program Accountable Care
Organizations ................................................................................................................................ 13
Table 2. Effects of Medicare Shared Saving Program Accountable Care Organizations on
Medicare Part D Spending and Use .............................................................................................. 18
ix
LIST OF FIGURES
Figure 1. Comparing Baseline Trends in Quarterly Unadjusted Part D Spending Among the
Intervention and Control Group .................................................................................................... 15
Figure 2. Comparing Baseline Trends in Quarterly Unadjusted Part D Counts Among the
Intervention and Control Group .................................................................................................... 16

x
PREFACE
I would like to express my gratitude to Dr. Robert Krafty for his guidance throughout this
project and his support to my academic development as my thesis and academic advisor. I would
like to thank Dr. Julia Driessen for offering the data, for her support about how to preprocess the
original CMS data and understand the public health significance of this study. I would also like to
thank Dr. Ada Youk for being my thesis committee member and her continuous support to my
academic and professional development throughout my Master program. I am also thankful to the
following graduate students in the Department of Biostatistics Silvia Liu, Caleb Huo, and Shu
Wang for all their help.
Finally, I would like to thank my family for their love and support.
1
1.0 INTRODUCTION
1.1 MEDICARE
Medicare is a health insurance program managed by the Center for Medicare & Medicaid
Services (CMS) to provide health-related cost management to most individuals with an age of 65
and older. The program is also available for people who are under 65 but fulfill certain criteria
including receiving disability benefits or having End Stage Renal Disease (ESRD) [1].
Original Medicare consists of two Parts: first, Part A or Hospital Insurance that covers most
of the inpatient services such as hospital and nursing care and home health services; second, Part
B or the Medical Insurance that covers doctor’s and outpatient services plus preventive services.
The Original Medicare with Part A and B was enacted in 1965. In 2006, Medicare Part D, which
offers prescription drug coverage was enacted. It offers beneficiaries who are enrolled in the
Original Medicare program to join a drug plan to help pay for their Medicare drug spending.
Medicare Part C, or the Medicare Advantage plans, are different from Original Medicare in the
way that allows Medicare beneficiaries to manage their Medicare through a third party, mostly
private companies contracted with Medicare to cover all Part A and B benefits. Some of the
Medicare Advantage plans also provide Part D coverage and other coverage for their beneficiaries.
Health Maintenance Organizations (HMO), Preferred Provider Organization (PPO) and Private
Fee-For-Service Plans are all institutions that offer Medicare Advantage plans [1, 2, 3].
2
Previous literature suggests that for chronic diseases such as diabetes and
hypercholesterolemia, increasing drug adherence is associated with reduced disease-related
medical cost. Medication was found to be especially effective to manage those disease conditions,
leading to less hospital or outpatient care. This offset effect was conjectured to produce an overall
saving for health care cost [4]. However, the price sensitivity among Medicare beneficiaries based
on this offset effect was also discussed by several studies. Specifically, when drug price increased,
beneficiaries reduced their drug use and spending with an increasing utilization of outpatient care
[5]; when prescription drug benefits enlarged such as starting enrollment in Medicare Part D plans,
beneficiaries seemed to increase their spending for prescription drugs, which lowered other
medical spending [6]. Another study looking at health insurance design for the elderly further
confirms the offset effects of drug coverage improvement brought by Medicare Part D plans and
found it to be especially substantial among chronically ill patients [7].
1.2 ACCOUNTABLE CARE ORGANIZATIONS
An Accountable Act Organization (ACO) is a group of Medicare providers who voluntarily
join to share medical information and provide coordinated care for their patients. Different from
non-ACO providers who receive their regular payment from Medicare, providers within the same
ACO group could receive an extra amount of payment from Medicare or repay the portion of losses
the group generates depending on its performance. This performance, including both the group’s
eligibility to stay in the ACO program and the amount of payment it gains or losses, is evaluated
by The Centers for Medicare & Medicaid Services (CMS) based on an individual benchmark
developed for each ACO group. This benchmark is an estimate of total Part A and B expenditure
3
if the group did not participate in the ACO program. ACO providers are eligible to stay in the
program if they meet their individual minimum saving rate (MSR) and gain a portion of the savings
they generate, which is the “shared savings”. Based on the risk sharing track each ACO group
chooses, it might also be accountable for the loss it generates which exceeds its minimum loss rate
(MLR) [8]. Opportunity to enroll in ACOs was available for any beneficiary who was already
enrolled in Medicare Part A or/and B programs if he or she was not enrolled in Medicare
Advantage Plans [3].
There are three types of ACO models that Medicare offers: first, the Pioneer ACO model
that was launched in January 2012 for large groups and institutions with experience serving more
than 15,000 beneficiaries annually; second, the Medicare Shared Savings Program (MSSP) that
started in April 2012 for smaller and inexperienced providers; and third, the New Generation
model started in January 2016 that integrates experience of prior ACOs to achieve higher care
quality by using a prospectively set benchmark rather than the retrospective default [9]. The New
Generation model allows beneficiaries to choose whether to be assigned to ACOs. By December
2016, there are 8 Pioneer ACOs, 433 Shared Savings Program ACOs and 18 New Generation
ACOs serving about 9 million beneficiaries in total [10]. For this study, we will only focus on
MSSP ACOs.
1.2.1 Early Results of ACOs
Previous investigations demonstrate early promising results of MSSP ACOs
implementation. In 2012, 58 MSSP ACOs reported a total of $705 million below the pre-set
benchmark and earned shared savings of $315 millions. The total net saving for the year was $383
million including some losses generated by one MSSP ACO group. Out of the 33 quality measures,
4
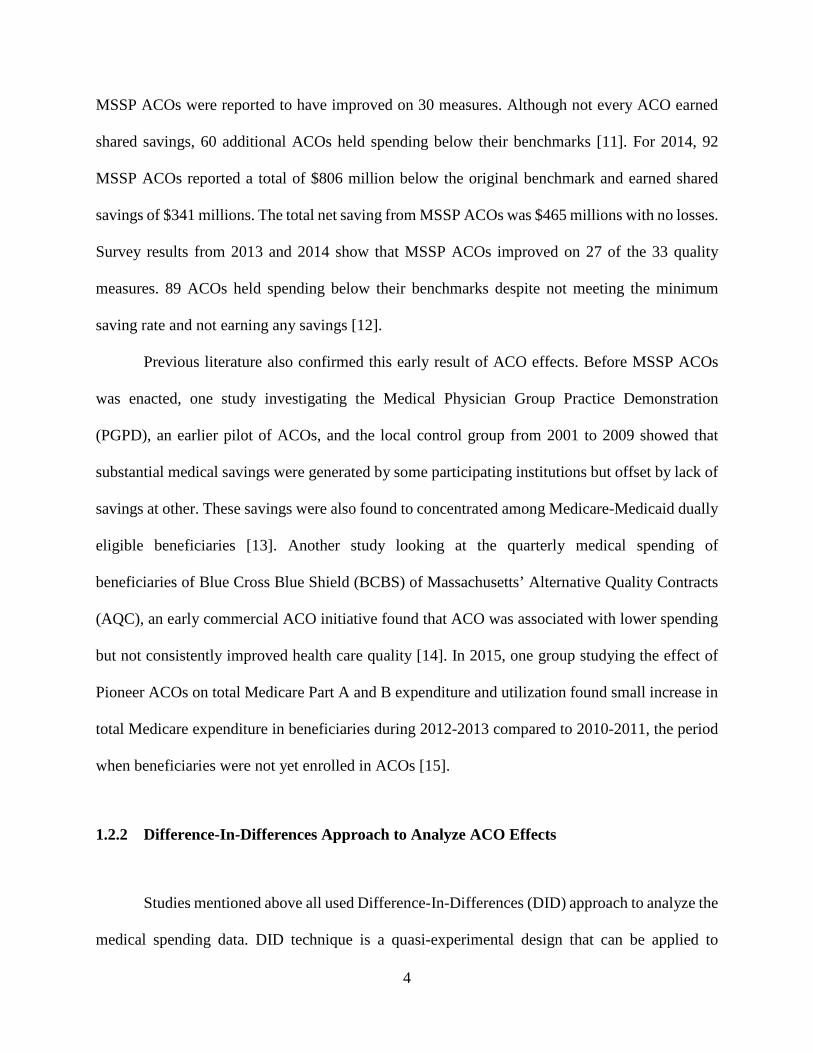
MSSP ACOs were reported to have improved on 30 measures. Although not every ACO earned
shared savings, 60 additional ACOs held spending below their benchmarks [11]. For 2014, 92
MSSP ACOs reported a total of $806 million below the original benchmark and earned shared
savings of $341 millions. The total net saving from MSSP ACOs was $465 millions with no losses.
Survey results from 2013 and 2014 show that MSSP ACOs improved on 27 of the 33 quality
measures. 89 ACOs held spending below their benchmarks despite not meeting the minimum
saving rate and not earning any savings [12].
Previous literature also confirmed this early result of ACO effects. Before MSSP ACOs
was enacted, one study investigating the Medical Physician Group Practice Demonstration
(PGPD), an earlier pilot of ACOs, and the local control group from 2001 to 2009 showed that
substantial medical savings were generated by some participating institutions but offset by lack of
savings at other. These savings were also found to concentrated among Medicare-Medicaid dually
eligible beneficiaries [13]. Another study looking at the quarterly medical spending of
beneficiaries of Blue Cross Blue Shield (BCBS) of Massachusetts’ Alternative Quality Contracts
(AQC), an early commercial ACO initiative found that ACO was associated with lower spending
but not consistently improved health care quality [14]. In 2015, one group studying the effect of
Pioneer ACOs on total Medicare Part A and B expenditure and utilization found small increase in
total Medicare expenditure in beneficiaries during 2012-2013 compared to 2010-2011, the period
when beneficiaries were not yet enrolled in ACOs [15].
1.2.2 Difference-In-Differences Approach to Analyze ACO Effects
Studies mentioned above all used Difference-In-Differences (DID) approach to analyze the
medical spending data. DID technique is a quasi-experimental design that can be applied to
5
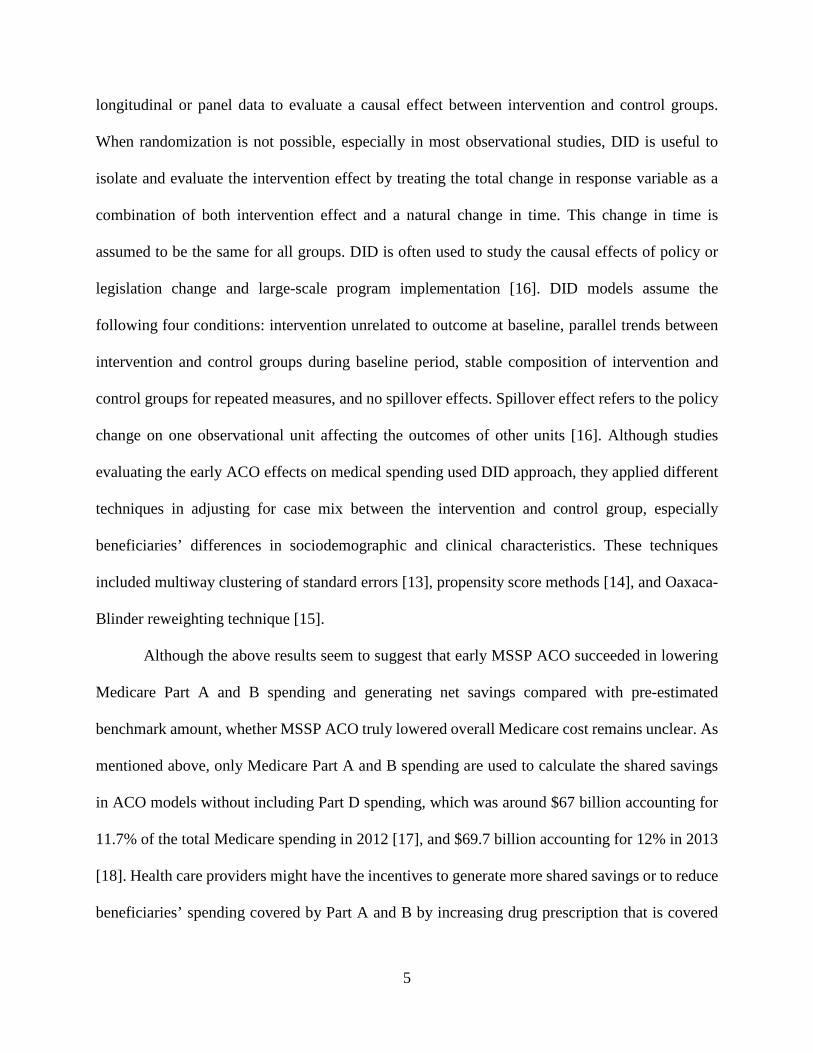
longitudinal or panel data to evaluate a causal effect between intervention and control groups.
When randomization is not possible, especially in most observational studies, DID is useful to
isolate and evaluate the intervention effect by treating the total change in response variable as a
combination of both intervention effect and a natural change in time. This change in time is
assumed to be the same for all groups. DID is often used to study the causal effects of policy or
legislation change and large-scale program implementation [16]. DID models assume the
following four conditions: intervention unrelated to outcome at baseline, parallel trends between
intervention and control groups during baseline period, stable composition of intervention and
control groups for repeated measures, and no spillover effects. Spillover effect refers to the policy
change on one observational unit affecting the outcomes of other units [16]. Although studies
evaluating the early ACO effects on medical spending used DID approach, they applied different
techniques in adjusting for case mix between the intervention and control group, especially
beneficiaries’ differences in sociodemographic and clinical characteristics. These techniques
included multiway clustering of standard errors [13], propensity score methods [14], and Oaxaca-
Blinder reweighting technique [15].
Although the above results seem to suggest that early MSSP ACO succeeded in lowering
Medicare Part A and B spending and generating net savings compared with pre-estimated
benchmark amount, whether MSSP ACO truly lowered overall Medicare cost remains unclear. As
mentioned above, only Medicare Part A and B spending are used to calculate the shared savings
in ACO models without including Part D spending, which was around $67 billion accounting for
11.7% of the total Medicare spending in 2012 [17], and $69.7 billion accounting for 12% in 2013
[18]. Health care providers might have the incentives to generate more shared savings or to reduce
beneficiaries’ spending covered by Part A and B by increasing drug prescription that is covered
6
by Part D. In this case, the ACO net savings could just be an offset effect of increased Medicare
Part D prescription. In addition, previous literature [14,15] investigating ACO or similar effects
on medical spending across time primarily focused on the comparisons between one intervention
group and a control group without considering differences among intervention subgroups that
entered the program at different times. These differences might also contribute to the changes in
Part D spending in addition to the intervention effects of interest.
1.3 OBJECTIVE
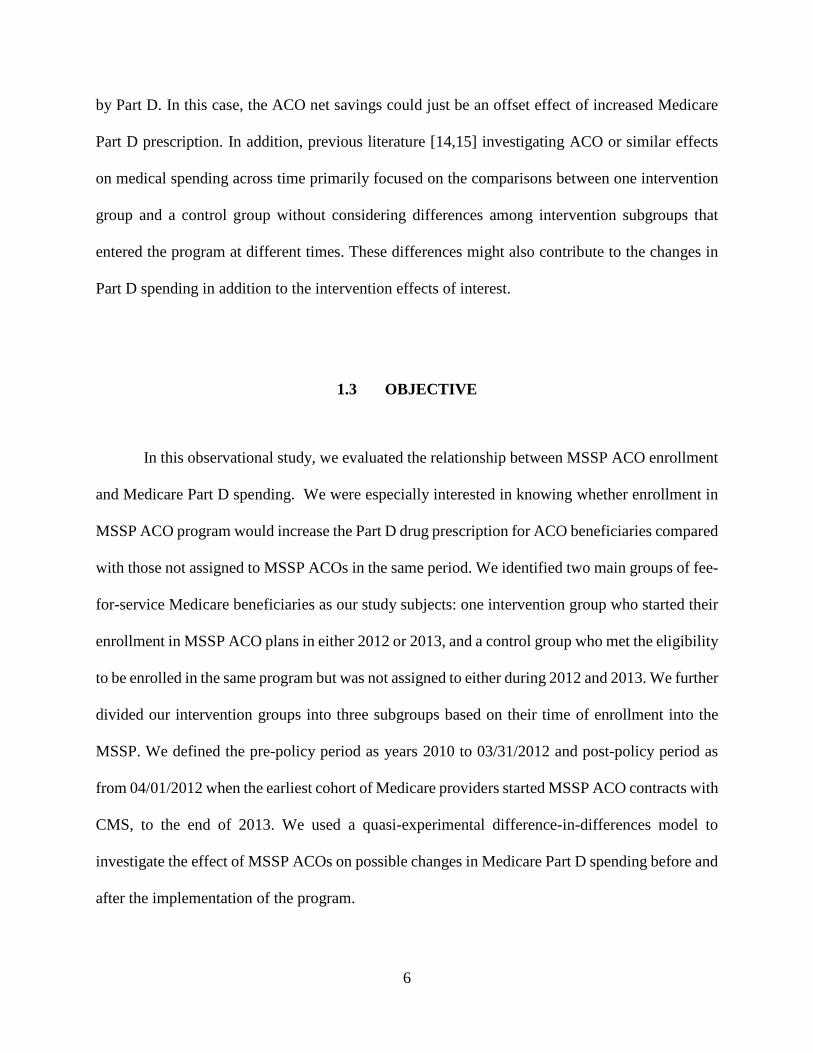
In this observational study, we evaluated the relationship between MSSP ACO enrollment
and Medicare Part D spending. We were especially interested in knowing whether enrollment in
MSSP ACO program would increase the Part D drug prescription for ACO beneficiaries compared
with those not assigned to MSSP ACOs in the same period. We identified two main groups of fee-
for-service Medicare beneficiaries as our study subjects: one intervention group who started their
enrollment in MSSP ACO plans in either 2012 or 2013, and a control group who met the eligibility
to be enrolled in the same program but was not assigned to either during 2012 and 2013. We further
divided our intervention groups into three subgroups based on their time of enrollment into the
MSSP. We defined the pre-policy period as years 2010 to 03/31/2012 and post-policy period as
from 04/01/2012 when the earliest cohort of Medicare providers started MSSP ACO contracts with
CMS, to the end of 2013. We used a quasi-experimental difference-in-differences model to
investigate the effect of MSSP ACOs on possible changes in Medicare Part D spending before and
after the implementation of the program.
7
2.0 METHODS
2.1 STUDY POPULATIONS
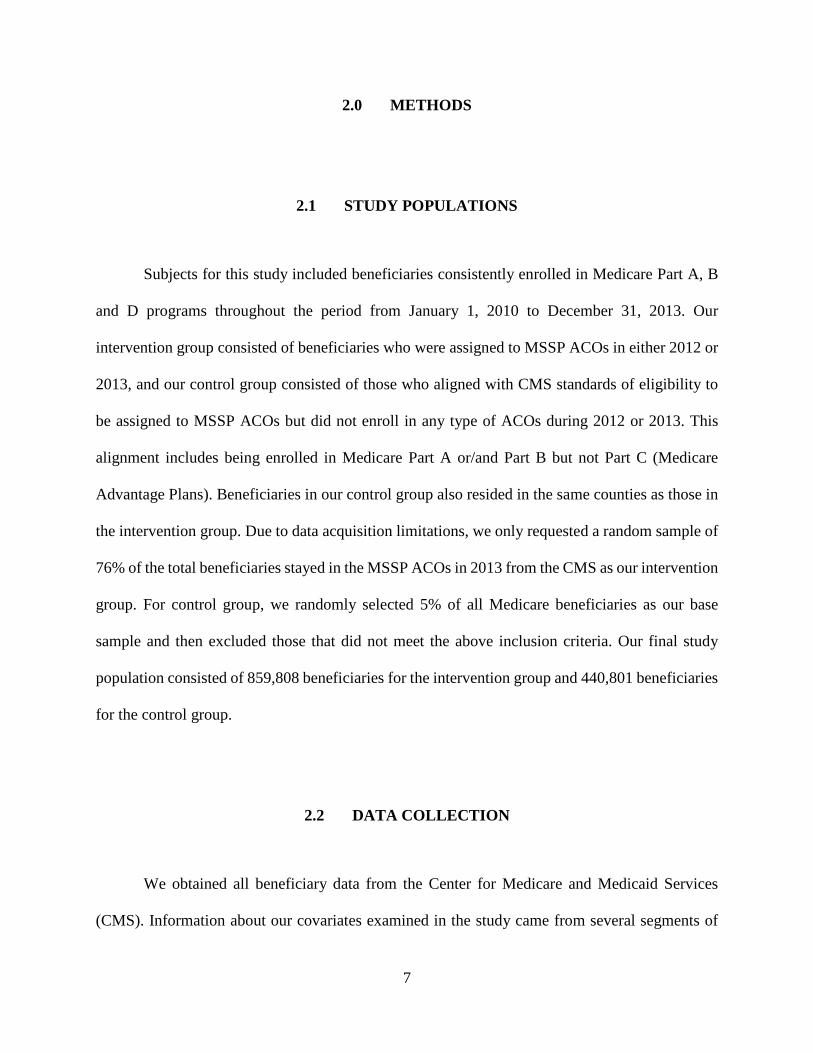
Subjects for this study included beneficiaries consistently enrolled in Medicare Part A, B
and D programs throughout the period from January 1, 2010 to December 31, 2013. Our
intervention group consisted of beneficiaries who were assigned to MSSP ACOs in either 2012 or
2013, and our control group consisted of those who aligned with CMS standards of eligibility to
be assigned to MSSP ACOs but did not enroll in any type of ACOs during 2012 or 2013. This
alignment includes being enrolled in Medicare Part A or/and Part B but not Part C (Medicare
Advantage Plans). Beneficiaries in our control group also resided in the same counties as those in
the intervention group. Due to data acquisition limitations, we only requested a random sample of
76% of the total beneficiaries stayed in the MSSP ACOs in 2013 from the CMS as our intervention
group. For control group, we randomly selected 5% of all Medicare beneficiaries as our base
sample and then excluded those that did not meet the above inclusion criteria. Our final study
population consisted of 859,808 beneficiaries for the intervention group and 440,801 beneficiaries
for the control group.
2.2 DATA COLLECTION
We obtained all beneficiary data from the Center for Medicare and Medicaid Services
(CMS). Information about our covariates examined in the study came from several segments of
8
the Master Beneficiary Summary File (MBSF) from the CMS: the base segments of Part A, B and
D for beneficiaries’ enrollment and entitlement information and demographics, and the Chronic
Conditions segment for beneficiaries’ 27 chronic conditions. We collected our Medicare
prescription drug costs and payment data from another file, the Part D Drug Event File (PDE)
which CMS used to make payments to Medicare Part D plans. We also utilized the Geographic
Crosswalks and Research Files from the Dartmouth Atlas of Health Care organization to attain the
hospital referral regions (HRR) of our beneficiaries based on their zip codes found in the MBSF
segment A and B file. All data was processed and analyzed using SAS 9.
2.3 OUTCOME MEASURES
2.3.1 Response Variables
Because MSSP ACOs started their contracts with the CMS during 2012 and 2013 at three
different time points: 25 started on April 1, 2012; 85 started on July 1, 2012; and 105 started on
January 1, 2013, we calculated our outcomes per beneficiary per quarter from January 1, 2010 to
December 31, 2013 instead of annually. This resulted in 16 quarters per beneficiary in total for our
final data setup. The two outcome variables of interest were the total quarterly Medicare Part D
spending per beneficiary and the total quarterly Part D counts of monthly prescriptions filled per
beneficiary. We standardized the prescription counts by a month of 30 days using drug information
about days of supply. For each specific prescription record, if the days of supply was smaller than
or equal to 30, the prescription count is 1; if not, the prescription count was calculated by dividing
the days of supply by 30.
9
2.3.2 Covariates
To better control for potential confounding effects, we adjusted for demographics,
income/subsidy status, and health-related conditions throughout the four years 2010-2013.
Demographic characteristics included sex (male as the reference group), age (<65 as the reference
group, 65-74, 75-84, and 85+), and race or ethnicity (non-Hispanic White as the reference group,
Black, Hispanic, Asian/Pacific Islander, Native, and Other). We categorized our beneficiaries into
three levels of income and subsidy status: beneficiaries with both Medicare and Medicaid coverage
eligible, beneficiaries not eligible for Medicaid but were below 150% federal poverty line to
receive a subsidy for Part D program, and those with no income subsidy as the reference group.
Health-related conditions consisted of whether one had the end-stage renal disease (ESRD) or any
of the 27 chronic conditions pre-defined by the CMS Chronic Condition Warehouse (CCW). The
27 conditions included some common chronic diseases such as dementia, cardiovascular diseases,
diabetes and major types of cancers. We also created a categorical variable of the total number of
CCW chronic diseases (<3 as the reference group, 3-5, 6+) as one of our covariates. In addition,
we controlled for the hospital referral region as a categorical covariate (more than 300 regions and
each as one level).
2.4 STATISTICAL ANALYSIS
Based on the characteristics of this study: observational nature with no randomization,
assignment of MSSP ACOs not related to Part D spending at baseline, parallel trends between
intervention and control group (Figure 1), stable composition of study population and study
10
measures across time and independent outcomes among beneficiaries, we chose to use a DID
model to best evaluate the change of Part D drug counts and spending before and after
beneficiaries’ assignment to MSSP ACOs. Specifically, we defined our baseline period as from
2010 and 2011 and our intervention period as from 2012 to 2013. Our intervention period was also
the first and second performance years of MSSP ACOs.
2.4.1 Model Development
As mentioned before, MSSP ACOs started their contracts with CMS at three different time
points, naturally forming three cohorts of beneficiaries. To better study the cohort effect of MSSP
ACOs, we looked at the change of Part D spending for each cohort first and then combined the
three cohorts together as one MSSP ACO group. The following are the DID models for each cohort
and the whole MSSP ACO group. For each model, we were interested in evaluating the estimates
of the time-dependent policy variable, which denotes the change of enrollment in MSSP ACOs
over time.
Model for Each Cohort
𝑙𝑙𝑙𝑙𝑙𝑙 [𝐸𝐸(𝑌𝑌𝑖𝑖,𝑡𝑡)] = 𝛼𝛼 + 𝜷𝜷𝟏𝟏 ∗ 𝑞𝑞𝑞𝑞𝑞𝑞𝑞𝑞𝑞𝑞𝑞𝑞𝑞𝑞𝑞𝑞 + 𝛽𝛽2 ∗ 𝐼𝐼.𝑞𝑞𝑎𝑎𝑙𝑙 + 𝛽𝛽3 ∗ 𝑝𝑝𝑙𝑙𝑙𝑙𝑝𝑝𝑎𝑎𝑝𝑝𝑡𝑡 (0 = 𝑝𝑝𝑞𝑞𝑞𝑞, 1 = 𝑝𝑝𝑙𝑙𝑞𝑞𝑞𝑞) + 𝜷𝜷𝟓𝟓
∗ ℎ𝑞𝑞𝑞𝑞𝑟𝑟𝑞𝑞𝑚𝑚 + 𝜷𝜷𝟔𝟔 ∗ 𝑎𝑎𝑙𝑙𝑐𝑐𝑞𝑞𝑞𝑞𝑝𝑝𝑞𝑞𝑞𝑞𝑞𝑞𝑞𝑞𝑖𝑖,𝑡𝑡
Notes:
Bolded 𝜷𝜷 = vectored coefficients associated with categorical variables with multiple levels
𝑌𝑌𝑖𝑖,𝑡𝑡_𝑐𝑐𝑐𝑐𝑐𝑐𝑐𝑐𝑡𝑡𝑐𝑐~𝑁𝑁𝑞𝑞𝑙𝑙𝑞𝑞𝑞𝑞𝑝𝑝𝑐𝑐𝑞𝑞 𝐵𝐵𝑝𝑝𝑟𝑟𝑙𝑙𝑚𝑚𝑝𝑝𝑞𝑞𝑙𝑙; 𝑌𝑌𝑖𝑖,𝑡𝑡_𝑐𝑐𝑠𝑠𝑠𝑠𝑐𝑐𝑠𝑠𝑖𝑖𝑐𝑐𝑠𝑠~𝑁𝑁𝑙𝑙𝑞𝑞𝑚𝑚𝑞𝑞𝑙𝑙
𝑌𝑌𝑖𝑖,𝑡𝑡 = 𝑃𝑃𝑞𝑞𝑞𝑞𝑞𝑞 𝐷𝐷 𝑞𝑞𝑝𝑝𝑞𝑞𝑟𝑟𝑠𝑠𝑝𝑝𝑟𝑟𝑙𝑙 𝑙𝑙𝑞𝑞 𝑎𝑎𝑙𝑙𝑞𝑞𝑟𝑟𝑞𝑞𝑞𝑞 𝑓𝑓𝑙𝑙𝑞𝑞 𝑏𝑏𝑞𝑞𝑟𝑟𝑞𝑞𝑓𝑓𝑝𝑝𝑎𝑎𝑝𝑝𝑞𝑞𝑞𝑞𝑝𝑝 𝑝𝑝 𝑞𝑞𝑞𝑞 𝑞𝑞𝑞𝑞𝑞𝑞𝑞𝑞𝑞𝑞𝑞𝑞𝑞𝑞 𝑞𝑞
quarters = 16 quarters from Spring 2010 to Winter 2013
11
ℎ𝑞𝑞𝑞𝑞𝑟𝑟𝑞𝑞𝑚𝑚 = ℎ𝑙𝑙𝑞𝑞𝑝𝑝𝑝𝑝𝑞𝑞𝑞𝑞𝑙𝑙 𝑞𝑞𝑞𝑞𝑓𝑓𝑞𝑞𝑞𝑞𝑞𝑞𝑞𝑞𝑙𝑙 𝑞𝑞𝑞𝑞𝑙𝑙𝑝𝑝𝑙𝑙𝑟𝑟 𝑟𝑟𝑞𝑞𝑚𝑚𝑏𝑏𝑞𝑞𝑞𝑞 (> 300 𝑎𝑎𝑞𝑞𝑞𝑞𝑞𝑞𝑙𝑙𝑙𝑙𝑞𝑞𝑝𝑝𝑞𝑞𝑞𝑞)
𝑎𝑎𝑙𝑙𝑐𝑐𝑞𝑞𝑞𝑞𝑝𝑝𝑞𝑞𝑞𝑞𝑞𝑞𝑞𝑞 = 𝑞𝑞𝑞𝑞𝑠𝑠,𝑞𝑞𝑙𝑙𝑞𝑞, 𝑞𝑞𝑞𝑞𝑎𝑎𝑞𝑞, 𝑝𝑝𝑟𝑟𝑎𝑎𝑙𝑙𝑚𝑚𝑞𝑞,𝐸𝐸𝐸𝐸𝐸𝐸𝐷𝐷, 27 𝐶𝐶𝐶𝐶𝐶𝐶 𝑎𝑎ℎ𝑞𝑞𝑙𝑙𝑟𝑟𝑝𝑝𝑎𝑎 𝑎𝑎𝑙𝑙𝑟𝑟𝑠𝑠𝑝𝑝𝑞𝑞𝑝𝑝𝑙𝑙𝑟𝑟𝑞𝑞 𝑞𝑞𝑟𝑟𝑠𝑠 𝑞𝑞ℎ𝑞𝑞 𝑞𝑞𝑞𝑞𝑚𝑚 𝑙𝑙𝑓𝑓 𝐶𝐶𝐶𝐶𝐶𝐶
Model for Whole MSSP
𝑙𝑙𝑙𝑙𝑙𝑙 [𝐸𝐸(𝑌𝑌𝑖𝑖,𝑡𝑡)] = 𝛼𝛼 + 𝜷𝜷𝟏𝟏 ∗ 𝑞𝑞𝑞𝑞𝑞𝑞𝑞𝑞𝑞𝑞𝑞𝑞𝑞𝑞𝑞𝑞 + 𝛽𝛽2 ∗ 𝐼𝐼. 𝑞𝑞𝑎𝑎𝑙𝑙𝑐𝑐𝑐𝑐ℎ𝑐𝑐𝑜𝑜𝑡𝑡1 + 𝛽𝛽3 ∗ 𝐼𝐼.𝑞𝑞𝑎𝑎𝑙𝑙𝑐𝑐𝑐𝑐ℎ𝑐𝑐𝑜𝑜𝑡𝑡2 + 𝛽𝛽4
∗ 𝐼𝐼.𝑞𝑞𝑎𝑎𝑙𝑙𝑐𝑐𝑐𝑐ℎ𝑐𝑐𝑜𝑜𝑡𝑡3 + 𝛽𝛽5 ∗ 𝑝𝑝𝑙𝑙𝑙𝑙𝑝𝑝𝑎𝑎𝑝𝑝𝑐𝑐𝑐𝑐ℎ𝑐𝑐𝑜𝑜𝑡𝑡1,𝑡𝑡(0 = 𝑝𝑝𝑞𝑞𝑞𝑞, 1 = 𝑝𝑝𝑙𝑙𝑞𝑞𝑞𝑞) + 𝛽𝛽6
∗ 𝑝𝑝𝑙𝑙𝑙𝑙𝑝𝑝𝑎𝑎𝑝𝑝𝑐𝑐𝑐𝑐ℎ𝑐𝑐𝑜𝑜𝑡𝑡2,𝑡𝑡(0 = 𝑝𝑝𝑞𝑞𝑞𝑞, 1 = 𝑝𝑝𝑙𝑙𝑞𝑞𝑞𝑞) + 𝛽𝛽7 ∗ 𝑝𝑝𝑙𝑙𝑙𝑙𝑝𝑝𝑎𝑎𝑝𝑝𝑐𝑐𝑐𝑐ℎ𝑐𝑐𝑜𝑜𝑡𝑡3,𝑡𝑡(0 = 𝑝𝑝𝑞𝑞𝑞𝑞, 1 = 𝑝𝑝𝑙𝑙𝑞𝑞𝑞𝑞)
+ 𝜷𝜷𝟖𝟖 ∗ ℎ𝑞𝑞𝑞𝑞𝑟𝑟𝑞𝑞𝑚𝑚 + 𝜷𝜷𝟗𝟗 ∗ 𝑎𝑎𝑙𝑙𝑐𝑐𝑞𝑞𝑞𝑞𝑝𝑝𝑞𝑞𝑞𝑞𝑞𝑞𝑞𝑞𝑖𝑖,𝑡𝑡
Notes:
Bolded 𝜷𝜷 = vectored coefficients associated with categorical variables with multiple levels
𝑌𝑌𝑖𝑖,𝑡𝑡_𝑐𝑐𝑐𝑐𝑐𝑐𝑐𝑐𝑡𝑡𝑐𝑐~𝑁𝑁𝑞𝑞𝑙𝑙𝑞𝑞𝑞𝑞𝑝𝑝𝑐𝑐𝑞𝑞 𝐵𝐵𝑝𝑝𝑟𝑟𝑙𝑙𝑚𝑚𝑝𝑝𝑞𝑞𝑙𝑙; 𝑌𝑌𝑖𝑖,𝑡𝑡_𝑐𝑐𝑠𝑠𝑠𝑠𝑐𝑐𝑠𝑠𝑖𝑖𝑐𝑐𝑠𝑠~𝑁𝑁𝑙𝑙𝑞𝑞𝑚𝑚𝑞𝑞𝑙𝑙
𝑌𝑌𝑖𝑖,𝑡𝑡 = 𝑃𝑃𝑞𝑞𝑞𝑞𝑞𝑞 𝐷𝐷 𝑞𝑞𝑝𝑝𝑞𝑞𝑟𝑟𝑠𝑠𝑝𝑝𝑟𝑟𝑙𝑙 𝑙𝑙𝑞𝑞 𝑎𝑎𝑙𝑙𝑞𝑞𝑟𝑟𝑞𝑞𝑞𝑞 𝑓𝑓𝑙𝑙𝑞𝑞 𝑏𝑏𝑞𝑞𝑟𝑟𝑞𝑞𝑓𝑓𝑝𝑝𝑎𝑎𝑝𝑝𝑞𝑞𝑞𝑞𝑝𝑝 𝑝𝑝 𝑞𝑞𝑞𝑞 𝑞𝑞𝑞𝑞𝑞𝑞𝑞𝑞𝑞𝑞𝑞𝑞𝑞𝑞 𝑞𝑞
quarters = 16 quarters from Spring 2010 to Winter 2013
ℎ𝑞𝑞𝑞𝑞𝑟𝑟𝑞𝑞𝑚𝑚 = ℎ𝑙𝑙𝑞𝑞𝑝𝑝𝑝𝑝𝑞𝑞𝑞𝑞𝑙𝑙 𝑞𝑞𝑞𝑞𝑓𝑓𝑞𝑞𝑞𝑞𝑞𝑞𝑞𝑞𝑙𝑙 𝑞𝑞𝑞𝑞𝑙𝑙𝑝𝑝𝑙𝑙𝑟𝑟 𝑟𝑟𝑞𝑞𝑚𝑚𝑏𝑏𝑞𝑞𝑞𝑞 (> 300 𝑎𝑎𝑞𝑞𝑞𝑞𝑞𝑞𝑙𝑙𝑙𝑙𝑞𝑞𝑝𝑝𝑞𝑞𝑞𝑞)
𝑎𝑎𝑙𝑙𝑐𝑐𝑞𝑞𝑞𝑞𝑝𝑝𝑞𝑞𝑞𝑞𝑞𝑞𝑞𝑞 = 𝑞𝑞𝑞𝑞𝑠𝑠,𝑞𝑞𝑙𝑙𝑞𝑞, 𝑞𝑞𝑞𝑞𝑎𝑎𝑞𝑞, 𝑝𝑝𝑟𝑟𝑎𝑎𝑙𝑙𝑚𝑚𝑞𝑞,𝐸𝐸𝐸𝐸𝐸𝐸𝐷𝐷, 27 𝐶𝐶𝐶𝐶𝐶𝐶 𝑎𝑎ℎ𝑞𝑞𝑙𝑙𝑟𝑟𝑝𝑝𝑎𝑎 𝑎𝑎𝑙𝑙𝑟𝑟𝑠𝑠𝑝𝑝𝑞𝑞𝑝𝑝𝑙𝑙𝑟𝑟𝑞𝑞 𝑞𝑞𝑟𝑟𝑠𝑠 𝑞𝑞ℎ𝑞𝑞 𝑞𝑞𝑞𝑞𝑚𝑚 𝑙𝑙𝑓𝑓 𝐶𝐶𝐶𝐶𝐶𝐶
For this study, we used Generalized Estimating Equations (GEE) to obtain the model
estimates because we only focused on investigating the group effect of MSSP ACOs on Medicare
Part D spending. We also pre-specified our estimated working correlation matrix as auto-
regressive (AR1) as we expected the association between two measures is related to their distance
in time. Specifically, we assumed for each beneficiary, the association of Part D spending between
each two neighboring quarters is stronger than the association between quarters that are two or
three times farther apart. We also treated each individual beneficiary effect as a random effect in
the GEE models.
12
3.0 RESULTS
3.1 DESCRIPTIVE STATISTICS
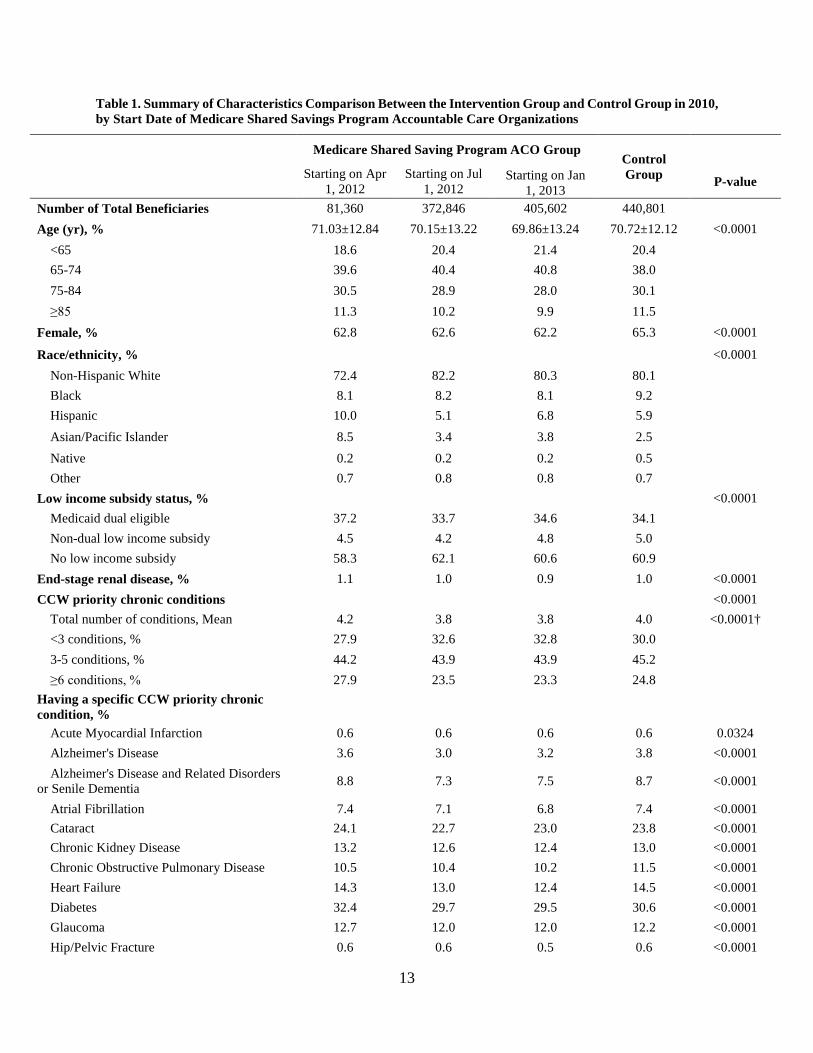
Table 1 shows that there were 81,360 beneficiaries enrolled in the MSSP ACOs that started
their contracts on April 1, 2012, and 372,846 beneficiaries, almost 4.5 times more than the first
cohort enrolled in MSSP ACOs started on July 1, 2012. Our last cohort consists of 405,602
beneficiaries assigned to MSSP ACOs with contracts started on January 1, 2013. The average age
across all four groups was quite similar and was around 71. About 62% MSSP beneficiaries were
females compared with 65% females for the control group. Across all groups, more than 72% of
the beneficiaries were non-Hispanic white. Most beneficiaries in our study received no low-income
subsidy, and around 34% having Medicare and Medicaid dual coverage. The average percentage
of ESRD for our sample was around 1%, and the average total number of CCW chronic conditions
was about 4 across all four groups.
13
Table 1. Summary of Characteristics Comparison Between the Intervention Group and Control Group in 2010, by Start Date of Medicare Shared Savings Program Accountable Care Organizations
Medicare Shared Saving Program ACO Group Control Group
Starting on Apr 1, 2012
Starting on Jul 1, 2012
Starting on Jan 1, 2013
P-value
Number of Total Beneficiaries 81,360 372,846 405,602 440,801 Age (yr), % 71.03±12.84 70.15±13.22 69.86±13.24 70.72±12.12 <0.0001
<65 18.6 20.4 21.4 20.4
65-74 39.6 40.4 40.8 38.0 75-84 30.5 28.9 28.0 30.1 ≥85 11.3 10.2 9.9 11.5
Female, % 62.8 62.6 62.2 65.3 <0.0001
Race/ethnicity, % <0.0001 Non-Hispanic White 72.4 82.2 80.3 80.1
Black 8.1 8.2 8.1 9.2 Hispanic 10.0 5.1 6.8 5.9 Asian/Pacific Islander 8.5 3.4 3.8 2.5 Native 0.2 0.2 0.2 0.5 Other 0.7 0.8 0.8 0.7
Low income subsidy status, % <0.0001 Medicaid dual eligible 37.2 33.7 34.6 34.1
Non-dual low income subsidy 4.5 4.2 4.8 5.0 No low income subsidy 58.3 62.1 60.6 60.9
End-stage renal disease, % 1.1 1.0 0.9 1.0 <0.0001 CCW priority chronic conditions <0.0001
Total number of conditions, Mean 4.2 3.8 3.8 4.0 <0.0001† <3 conditions, % 27.9 32.6 32.8 30.0
3-5 conditions, % 44.2 43.9 43.9 45.2 ≥6 conditions, % 27.9 23.5 23.3 24.8
Having a specific CCW priority chronic condition, %
Acute Myocardial Infarction 0.6 0.6 0.6 0.6 0.0324 Alzheimer's Disease 3.6 3.0 3.2 3.8 <0.0001 Alzheimer's Disease and Related Disorders
or Senile Dementia 8.8 7.3 7.5 8.7 <0.0001
Atrial Fibrillation 7.4 7.1 6.8 7.4 <0.0001 Cataract 24.1 22.7 23.0 23.8 <0.0001 Chronic Kidney Disease 13.2 12.6 12.4 13.0 <0.0001 Chronic Obstructive Pulmonary Disease 10.5 10.4 10.2 11.5 <0.0001 Heart Failure 14.3 13.0 12.4 14.5 <0.0001 Diabetes 32.4 29.7 29.5 30.6 <0.0001 Glaucoma 12.7 12.0 12.0 12.2 <0.0001 Hip/Pelvic Fracture 0.6 0.6 0.5 0.6 <0.0001
14
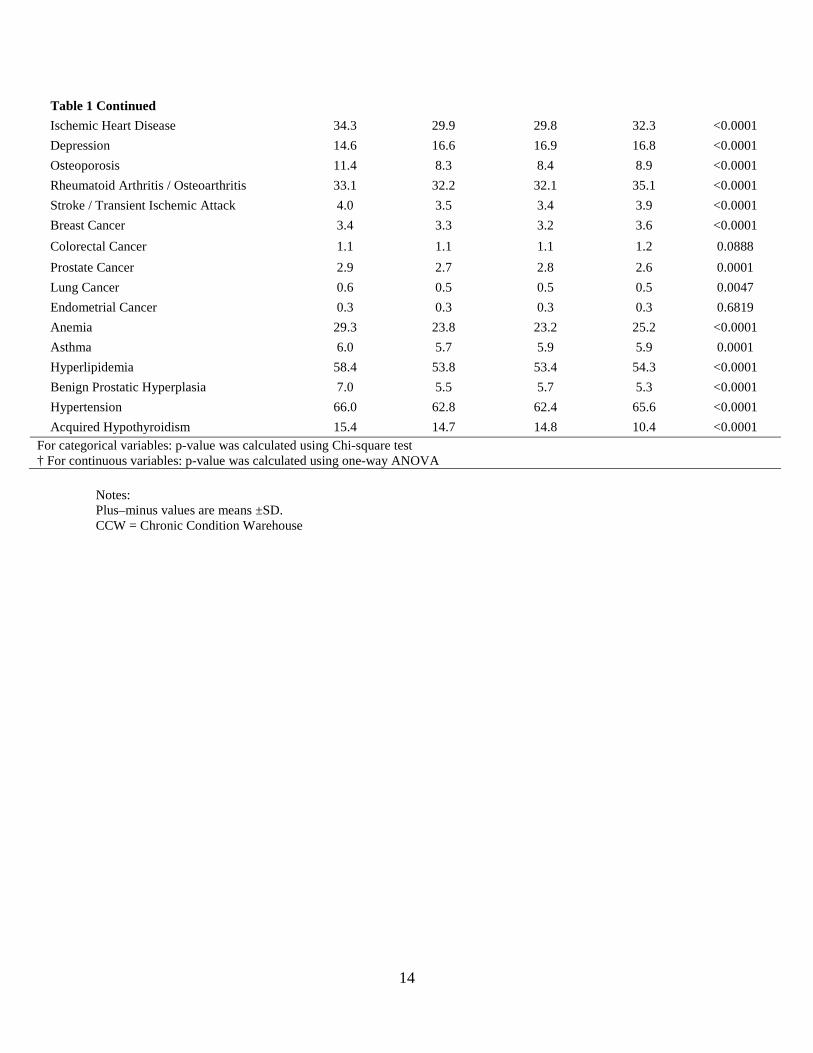
Table 1 Continued Ischemic Heart Disease 34.3 29.9 29.8 32.3 <0.0001 Depression 14.6 16.6 16.9 16.8 <0.0001 Osteoporosis 11.4 8.3 8.4 8.9 <0.0001 Rheumatoid Arthritis / Osteoarthritis 33.1 32.2 32.1 35.1 <0.0001 Stroke / Transient Ischemic Attack 4.0 3.5 3.4 3.9 <0.0001 Breast Cancer 3.4 3.3 3.2 3.6 <0.0001 Colorectal Cancer 1.1 1.1 1.1 1.2 0.0888 Prostate Cancer 2.9 2.7 2.8 2.6 0.0001 Lung Cancer 0.6 0.5 0.5 0.5 0.0047 Endometrial Cancer 0.3 0.3 0.3 0.3 0.6819 Anemia 29.3 23.8 23.2 25.2 <0.0001 Asthma 6.0 5.7 5.9 5.9 0.0001 Hyperlipidemia 58.4 53.8 53.4 54.3 <0.0001 Benign Prostatic Hyperplasia 7.0 5.5 5.7 5.3 <0.0001 Hypertension 66.0 62.8 62.4 65.6 <0.0001 Acquired Hypothyroidism 15.4 14.7 14.8 10.4 <0.0001
For categorical variables: p-value was calculated using Chi-square test † For continuous variables: p-value was calculated using one-way ANOVA
Notes: Plus–minus values are means ±SD. CCW = Chronic Condition Warehouse
15
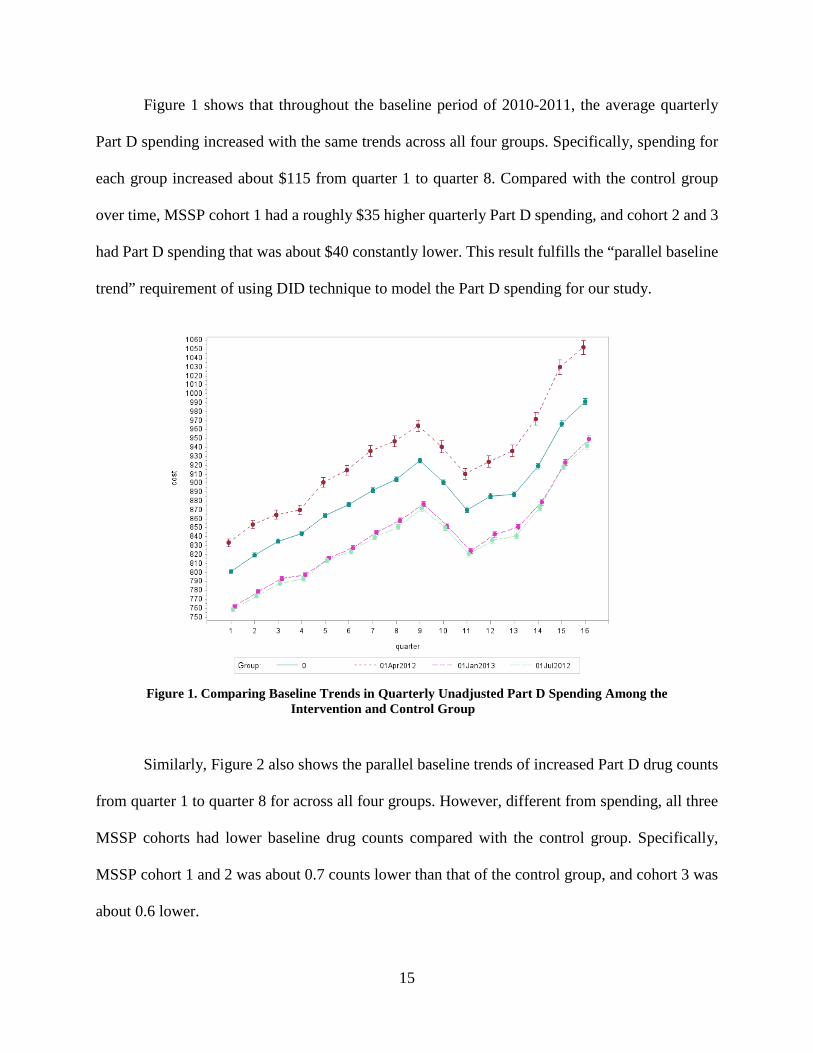
Figure 1 shows that throughout the baseline period of 2010-2011, the average quarterly
Part D spending increased with the same trends across all four groups. Specifically, spending for
each group increased about $115 from quarter 1 to quarter 8. Compared with the control group
over time, MSSP cohort 1 had a roughly $35 higher quarterly Part D spending, and cohort 2 and 3
had Part D spending that was about $40 constantly lower. This result fulfills the “parallel baseline
trend” requirement of using DID technique to model the Part D spending for our study.
Figure 1. Comparing Baseline Trends in Quarterly Unadjusted Part D Spending Among the
Intervention and Control Group
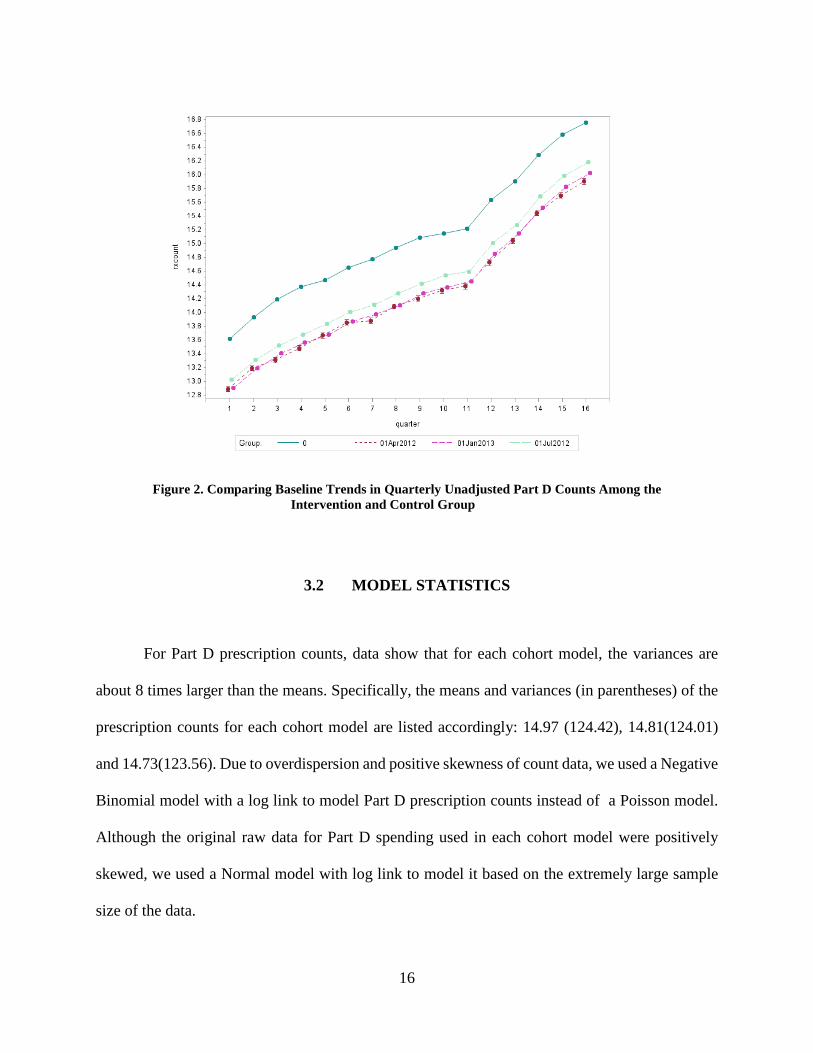
Similarly, Figure 2 also shows the parallel baseline trends of increased Part D drug counts
from quarter 1 to quarter 8 for across all four groups. However, different from spending, all three
MSSP cohorts had lower baseline drug counts compared with the control group. Specifically,
MSSP cohort 1 and 2 was about 0.7 counts lower than that of the control group, and cohort 3 was
about 0.6 lower.
16
Figure 2. Comparing Baseline Trends in Quarterly Unadjusted Part D Counts Among the Intervention and Control Group
3.2 MODEL STATISTICS
For Part D prescription counts, data show that for each cohort model, the variances are
about 8 times larger than the means. Specifically, the means and variances (in parentheses) of the
prescription counts for each cohort model are listed accordingly: 14.97 (124.42), 14.81(124.01)
and 14.73(123.56). Due to overdispersion and positive skewness of count data, we used a Negative
Binomial model with a log link to model Part D prescription counts instead of a Poisson model.
Although the original raw data for Part D spending used in each cohort model were positively
skewed, we used a Normal model with log link to model it based on the extremely large sample
size of the data.
17
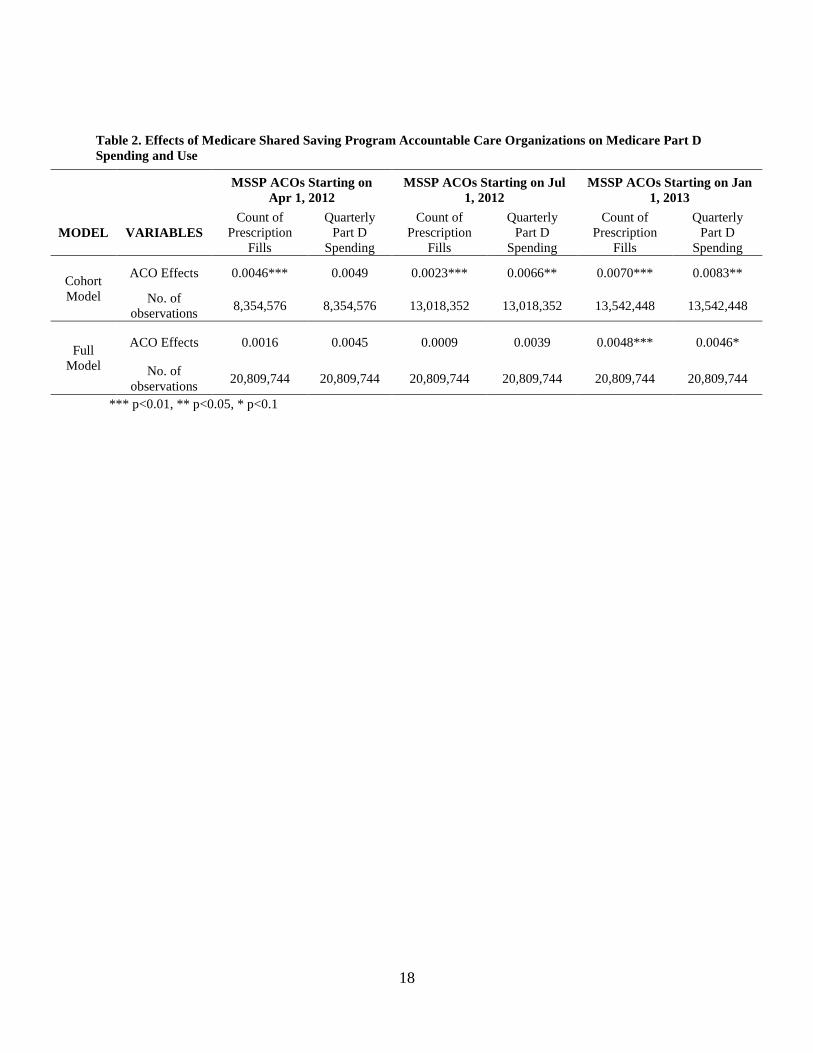
Table 2 shows the estimates for the time-dependent policy variable in models for both Part
D prescription counts and spending. Row 1 lists the results for each individual cohort model.
Except for cohort 1 spending, ACO effects were shown to be statistically significant on both
prescription counts and spending for all three cohorts when individually compared with the control
group. Although the effect was statistically significant, estimates are very small ranging from
0.0023 to 0.0083. The sign of the estimates indicates that both Part D prescription counts and
spending increased after the enrollment of MSSP ACOs throughout 2012 and 2013. The magnitude
of the estimates shows that the rate of increase for Part D prescription counts was largest for cohort
3 (𝛽𝛽=0.0070) followed by cohort 1 (𝛽𝛽=0.0046) and then cohort 2 (𝛽𝛽=0.0023). Differently, the rate
of increase for spending seems to decrease over time with cohort 1, beneficiaries who stayed in
the MSSP ACOs the longest having the lowest increase rate and cohort 3, those enrolled in the
program the latest having the highest increase rate.
Row 2 in Table 2 shows that when controlling for MSSP cohort 2 and 3 besides the original
control group, the ACO effects were no longer statistically significant for both counts and spending
for MSSP cohort 1. Similarly, when controlling for MSSP cohort 3 besides the original control
group, the ACO effects were also no longer statistically significant for both counts and spending
for cohort 2. However, for cohort 3, the ACO effects remain statistically significant for both counts
and spending. Similar to the pattern of the change in estimates for counts in individual cohort
models, the estimates for both counts and spending in full models were largest for cohort 3
followed by cohort 1 and 2.
18
Table 2. Effects of Medicare Shared Saving Program Accountable Care Organizations on Medicare Part D Spending and Use
*** p<0.01, ** p<0.05, * p<0.1
MSSP ACOs Starting on Apr 1, 2012
MSSP ACOs Starting on Jul 1, 2012
MSSP ACOs Starting on Jan 1, 2013
MODEL VARIABLES Count of
Prescription Fills
Quarterly Part D
Spending
Count of Prescription
Fills
Quarterly Part D
Spending
Count of Prescription
Fills
Quarterly Part D
Spending
Cohort Model
ACO Effects 0.0046*** 0.0049 0.0023*** 0.0066** 0.0070*** 0.0083**
No. of observations 8,354,576 8,354,576 13,018,352 13,018,352 13,542,448 13,542,448
Full Model
ACO Effects 0.0016 0.0045 0.0009 0.0039 0.0048*** 0.0046*
No. of observations 20,809,744 20,809,744 20,809,744 20,809,744 20,809,744 20,809,744
19
4.0 DISCUSSION
According to our results, when individually comparing each cohort MSSP ACOs with the
selected control group, Medicare Part D prescription spending and counts did mildly increase after
beneficiaries’ enrollment in ACOs as expected. However, the validity of this effect might be
questionable because when controlling for other ACO cohorts, the effects were no longer
statistically significant. These results indicate that our models did not capture the pure ACO effects
very well. By applying the DID technique, we assume that the change in outcome variables is only
due to the change of MSSP enrollment by adjusting for the covariates included in the models. In
other words, we assume there were no differences among the four groups before they started MSSP
ACO enrollment. This means that for cohort 1, any one of the rest three groups could serve as a
comparison group if it did not enroll in the MSSP, and the ACO effects for cohort 1 was expected
to be the same no matter which group it compared to. However, our results show that once we
change our comparison group from the original control group to all beneficiaries who have not yet
started their enrollment in MSSP ACOs, the ACO effects changed from statistically significant to
not statistically significant. This suggests that there might be some differences among the four
groups even before they started the MSSP ACO enrollment that our models did not take into
account.
One possible reason this might have happened is that instead of all four groups being totally
different from each other, those health providers who chose to form ACOs and enrolled in MSSP
might be different from those who stayed outside of the MSSP. The former might be more naturally
intending to enroll in MSSP and might have already been practicing health management similar to
that of the MSSP. If this is true, it would be difficult to tell whether the savings or the better quality
20
of health services generated by MSSP ACOs are purely due to the program or could be a mixed
effect of both the program and the original characteristics of those health providers.
To test our conjecture, we ran the full models using cohort 3 as the new control without
including the original control group. We also excluded data from quarters 13 to 16 where the policy
variable has a value of 1 for all three ACO groups. Results indicate that the ACO effects were not
at all statistically significant for either cohort in models for either counts or spending:
𝛽𝛽𝑐𝑐𝑐𝑐ℎ𝑐𝑐𝑜𝑜𝑡𝑡1,𝑐𝑐𝑐𝑐𝑐𝑐𝑐𝑐𝑡𝑡 = −0.0012,𝑝𝑝 = 0.3670; 𝛽𝛽𝑐𝑐𝑐𝑐ℎ𝑐𝑐𝑜𝑜𝑡𝑡2,𝑐𝑐𝑐𝑐𝑐𝑐𝑐𝑐𝑡𝑡 = −0.0013,𝑝𝑝 = 0.1067;𝛽𝛽𝑐𝑐𝑐𝑐ℎ𝑐𝑐𝑜𝑜𝑡𝑡1,𝑐𝑐𝑠𝑠𝑠𝑠𝑐𝑐𝑠𝑠𝑖𝑖𝑐𝑐𝑠𝑠 =
0.0012,𝑝𝑝 = 0.7817;𝛽𝛽𝑐𝑐𝑐𝑐ℎ𝑐𝑐𝑜𝑜𝑡𝑡2,𝑐𝑐𝑠𝑠𝑠𝑠𝑐𝑐𝑠𝑠𝑖𝑖𝑐𝑐𝑠𝑠 = 0.0003,𝑝𝑝 = 0.9334. This confirms our speculation that
characteristics affecting Part D spending were likely to exist among ACO providers before their
enrollment in MSSP. These characteristics might have masked the real ACO effects on Part D
spending, making it not statistically significant in our full models.
Although we were only interested in evaluating the importance of the ACO effects on
Medicare Part D spending in this study, a possible secondary objective is to look at the change of
the effects over time. When using the DID model, we averaged out the change in outcome variables
across time before and after the policy implementation, which does not reflect the change over
time after the implementation. Health providers’ response to the policy is likely to change as time
goes by, and the pattern of the change could influence the general effect of the policy, leading it
not only due to the start time of the program (cohort effect in our study) but also the length of stay
in the program. However, to fully assess this more time points would be needed.
21
4.1 STRENGTHS
This study was the first study to look at ACO effects on Medicare Part D spending and
utilizations. It was also the first study to evaluate the cohort effects of MSSP ACO groups
controlling for other cohort groups. It raised the question about how to define an appropriate
control group to evaluate the ACO effects on Medicare spending by demonstrating that results
from analysis only adjusting for beneficiaries’ characteristics might be inaccurate, and potential
differences between ACO and non-ACO providers need to be considered for future analysis.
4.2 LIMITATIONS AND FUTURE DIRECTION
One limitation of this study was that the control group did not serve well as a reference
group to reflect the ACO effects on Part D spending and utilization. Future research can study the
characteristics of health providers in MSSP ACOs to better isolate the effects from factors other
than ACO enrollment on the change of Medicare Part D spending. This would allow a better and
valid control group for comparisons to study the real ACO effects on Part D spending. Another
limitation of the study was that model diagnostics were not presented for this study. Since overall
good-of-fit test or standardized Pearson residuals are not available for GEE models, sampled
Pearson residuals (in the Appendix) obtained from the full models were difficult to explain.
Although other diagnostic statistics such as predicted values or cook’s distance are available, SAS
crashed due to technicality issues when trying to obtain these statistics. Therefore, further analysis
needed to assess model fit.
22
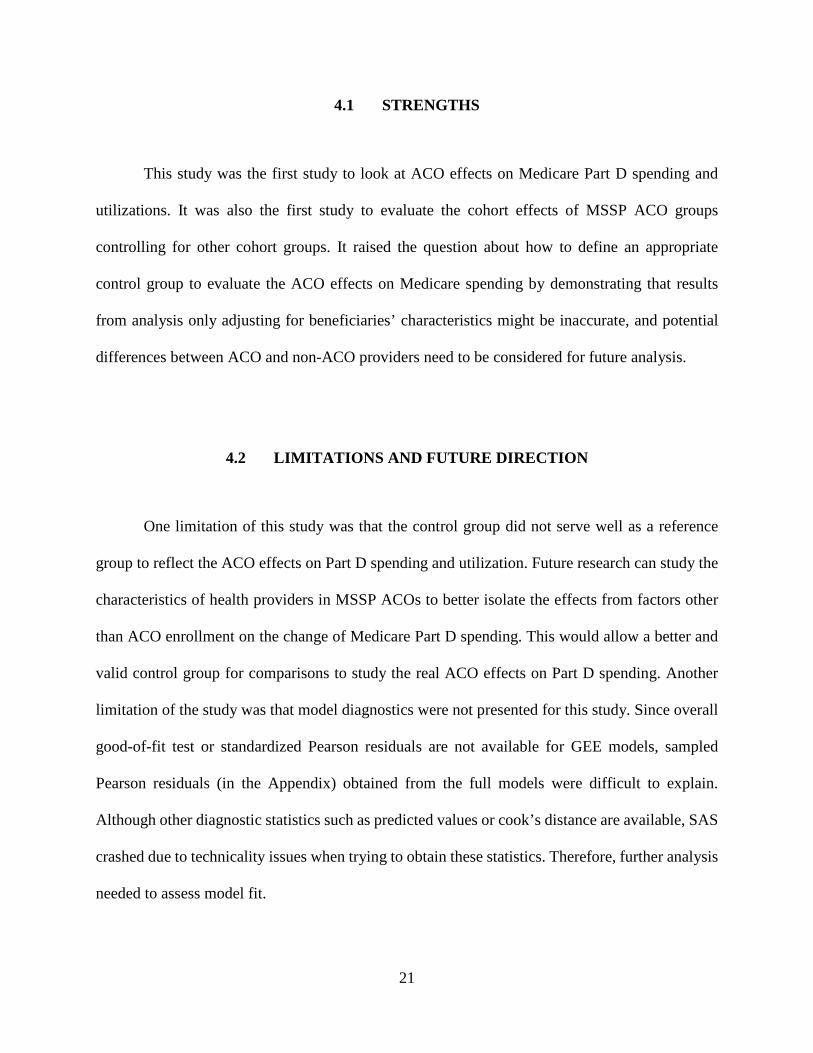
APPENDIX A: PEARSON RESIDUAL PLOTS
Part I. Unstandardized Pearson Residual Plots of Full Model of Part D Prescription Counts
Sampled Pearson Residuals vs. Log-Transformed Part D Prescription Counts
Sampled Pearson Residuals vs. raw Part D Prescription Counts
Sampled Pearson Residuals vs. Index
23
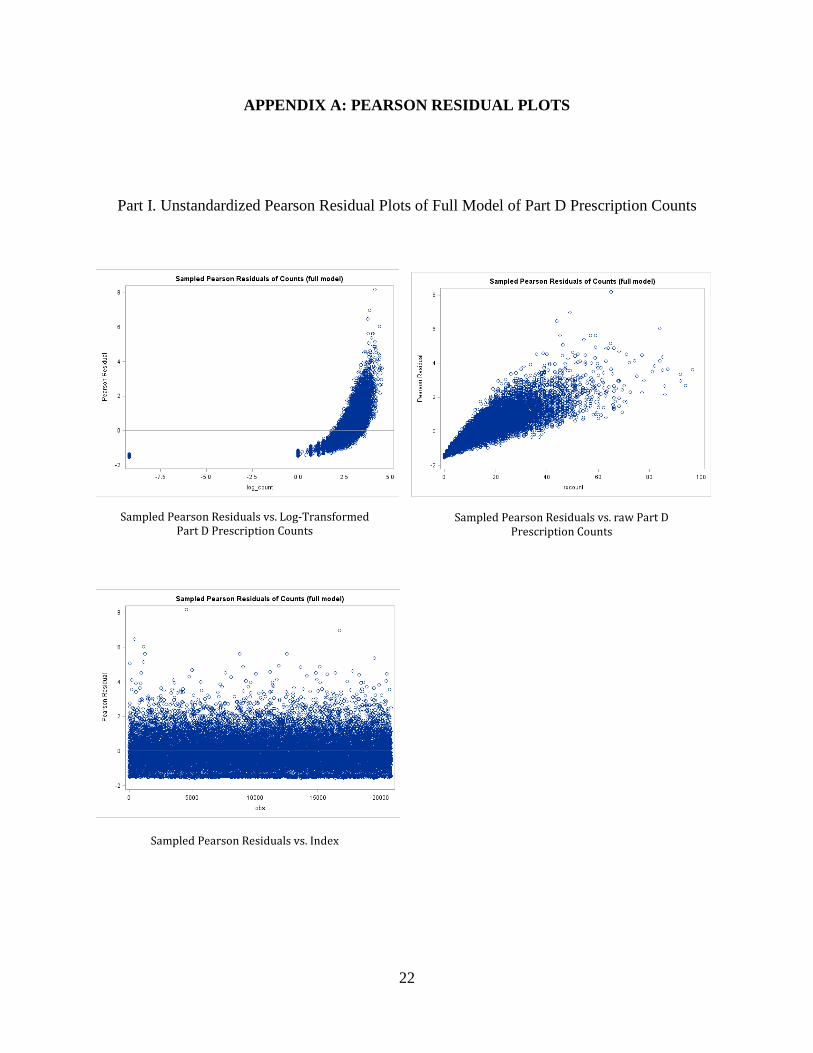
Part II. Unstandardized Pearson Residual Plots of Full Model of Part D Spending
Sampled Pearson Residuals vs. Log-Transformed Part D Spending in Full Model
Sampled Pearson Residuals vs. raw Part D Spending in Full Model
Sampled Pearson Residuals vs. Index in Full Model of Part D Spending
24
APPENDIX B: SAS CODE FOR ANALYSIS
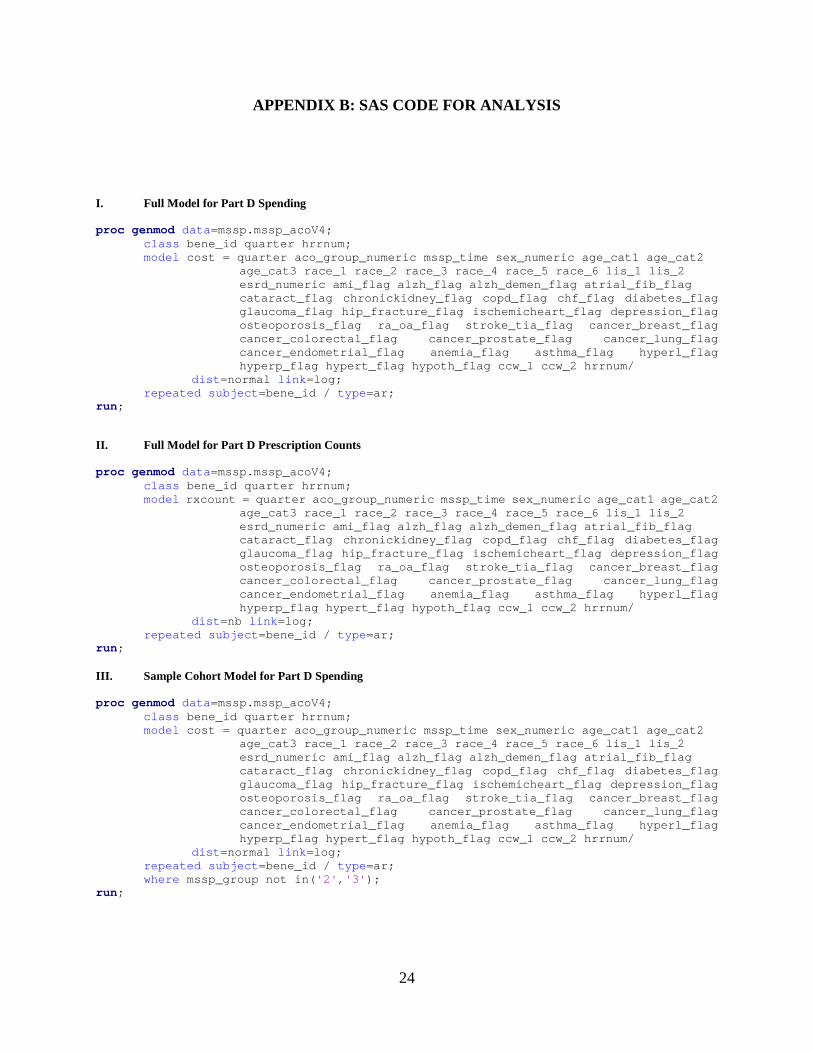
I. Full Model for Part D Spending proc genmod data=mssp.mssp_acoV4; class bene_id quarter hrrnum; model cost = quarter aco_group_numeric mssp_time sex_numeric age_cat1 age_cat2 age_cat3 race_1 race_2 race_3 race_4 race_5 race_6 lis_1 lis_2 esrd_numeric ami_flag alzh_flag alzh_demen_flag atrial_fib_flag
cataract_flag chronickidney_flag copd_flag chf_flag diabetes_flag glaucoma_flag hip_fracture_flag ischemicheart_flag depression_flag osteoporosis_flag ra_oa_flag stroke_tia_flag cancer_breast_flag cancer_colorectal_flag cancer_prostate_flag cancer_lung_flag cancer_endometrial_flag anemia_flag asthma_flag hyperl_flag hyperp_flag hypert_flag hypoth_flag ccw_1 ccw_2 hrrnum/
dist=normal link=log; repeated subject=bene_id / type=ar; run;
II. Full Model for Part D Prescription Counts proc genmod data=mssp.mssp_acoV4; class bene_id quarter hrrnum; model rxcount = quarter aco_group_numeric mssp_time sex_numeric age_cat1 age_cat2 age_cat3 race_1 race_2 race_3 race_4 race_5 race_6 lis_1 lis_2 esrd_numeric ami_flag alzh_flag alzh_demen_flag atrial_fib_flag
cataract_flag chronickidney_flag copd_flag chf_flag diabetes_flag glaucoma_flag hip_fracture_flag ischemicheart_flag depression_flag osteoporosis_flag ra_oa_flag stroke_tia_flag cancer_breast_flag cancer_colorectal_flag cancer_prostate_flag cancer_lung_flag cancer_endometrial_flag anemia_flag asthma_flag hyperl_flag hyperp_flag hypert_flag hypoth_flag ccw_1 ccw_2 hrrnum/
dist=nb link=log; repeated subject=bene_id / type=ar; run; III. Sample Cohort Model for Part D Spending proc genmod data=mssp.mssp_acoV4; class bene_id quarter hrrnum; model cost = quarter aco_group_numeric mssp_time sex_numeric age_cat1 age_cat2 age_cat3 race_1 race_2 race_3 race_4 race_5 race_6 lis_1 lis_2 esrd_numeric ami_flag alzh_flag alzh_demen_flag atrial_fib_flag
cataract_flag chronickidney_flag copd_flag chf_flag diabetes_flag glaucoma_flag hip_fracture_flag ischemicheart_flag depression_flag osteoporosis_flag ra_oa_flag stroke_tia_flag cancer_breast_flag cancer_colorectal_flag cancer_prostate_flag cancer_lung_flag cancer_endometrial_flag anemia_flag asthma_flag hyperl_flag hyperp_flag hypert_flag hypoth_flag ccw_1 ccw_2 hrrnum/
dist=normal link=log; repeated subject=bene_id / type=ar; where mssp_group not in('2','3'); run;
25
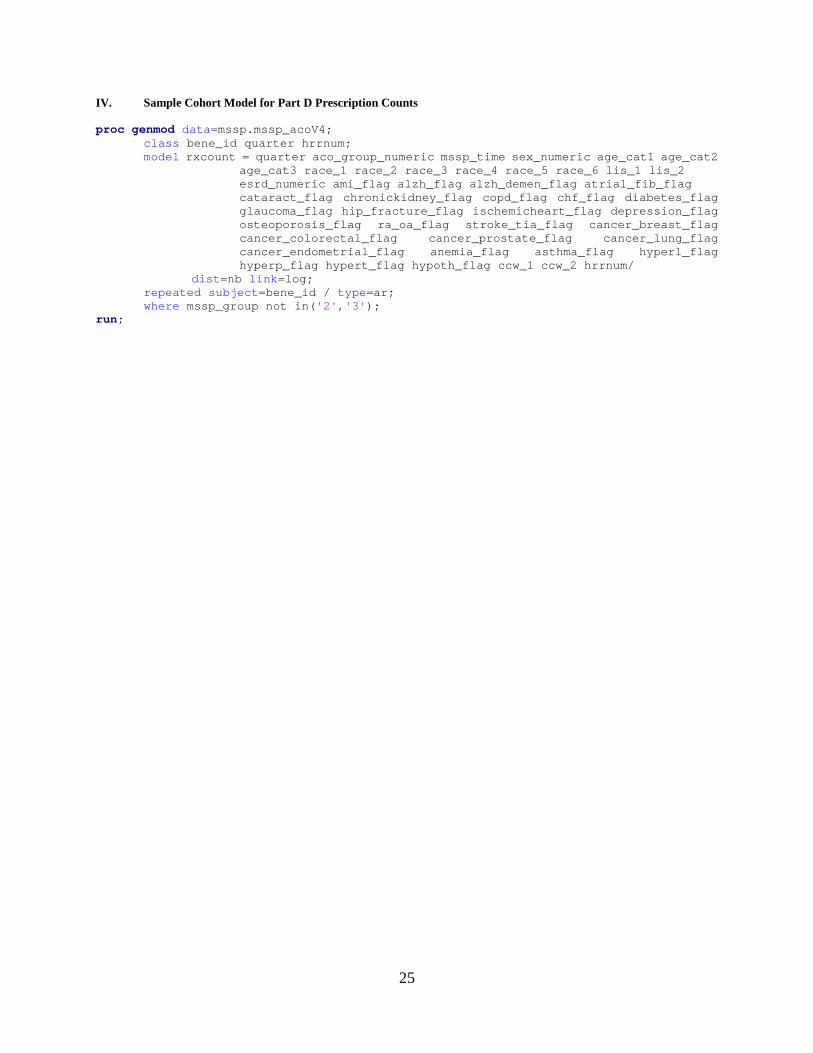
IV. Sample Cohort Model for Part D Prescription Counts proc genmod data=mssp.mssp_acoV4; class bene_id quarter hrrnum; model rxcount = quarter aco_group_numeric mssp_time sex_numeric age_cat1 age_cat2 age_cat3 race_1 race_2 race_3 race_4 race_5 race_6 lis_1 lis_2 esrd_numeric ami_flag alzh_flag alzh_demen_flag atrial_fib_flag
cataract_flag chronickidney_flag copd_flag chf_flag diabetes_flag glaucoma_flag hip_fracture_flag ischemicheart_flag depression_flag osteoporosis_flag ra_oa_flag stroke_tia_flag cancer_breast_flag cancer_colorectal_flag cancer_prostate_flag cancer_lung_flag cancer_endometrial_flag anemia_flag asthma_flag hyperl_flag hyperp_flag hypert_flag hypoth_flag ccw_1 ccw_2 hrrnum/
dist=nb link=log; repeated subject=bene_id / type=ar; where mssp_group not in('2','3'); run;
26
BIBLIOGRAPHY
1. Centers for Medicare & Medicaid Services. Introduction to Medicare. 2014; https://www.cms.gov/Medicare/Coordination-of-Benefits-and-Recovery/Coordination-of-Benefits-and-Recovery-Overview/Medicare-Secondary-Payer/Downloads/Introduction-to-Medicare.pdf. Accessed March 10, 2017.
2. Centers for Medicare & Medicaid Services. What Medicare covers. 2017;https://www.medicare.gov/what-medicare-covers/index.html. Accessed March 10, 2017.
3. The Official U.S. Government Site for Medicare. Accountable Care Organizations. 2017;https://www.medicare.gov/manage-your-health/coordinating-your-care/accountable-care-organizations.html#1360 Accessed March 23, 2017.
4. Sokol MC, McGuigan KA, Verbrugge RR, Epstein RS. Impact of Medication Adherence onHospitalization Risk and Healthcare Cost. Medical care. 2005;43(6):521-530.
5. Gaynor M, Li J, Vogt WB. Substitution, spending offsets, and prescription drug benefit design.Forum for Health Economics & Policy. 2007;10(2):1-31.
6. Zhang Y, Donohue JM, Lave JR, O'Donnell G, Newhouse JP. The effect of Medicare Part D ondrug and medical spending. New England Journal of Medicine. Jul 2 2009;361(1):52-61.
7. Chandra A, Gruber J, McKnight R. Patient cost-sharing, hospitalization offsets, and the designof optimal health insurance for the elderly. NBER Working paper No. 12972. 2007.
8. Center for Medicare & Medicaid Services. Accountable Care Organizations: What ProvidersNeed to Know. 2016; https://www.cms.gov/medicare/medicare-fee-for-service-payment/sharedsavingsprogram/downloads/aco_providers_factsheet_icn907406.pdf. Accessed March 23, 2017.
9. Services CfMM. New hospitals and health care providers join successful, cutting-edge federalinitiative that cuts costs and puts patients at the center of their care. 2016; http://www.hhs.gov/about/news/2016/01/11/new-hospitals-and-health-care-providers-join-successful-cutting-edge-federal-initiative.html. Accessed March 23, 2017.
10. Centers for Medicare & Medicaid Services. Fast Facts - All Medicare Shared Savings Program(Shared Savings Program) ACOs. 2016; http://www.cms.gov/Medicare/Medicare-Fee-for-Service-Payment/sharedsavingsprogram/Downloads/All-Starts-MSSP-ACO.pdf. Accessed March 25, 2017.
11. Center for Medicare & Medicaid Services. Medicare ACOs continue to succeed in improvingcare, lowering cost growth. 2014;
27
https://www.cms.gov/Newsroom/MediaReleaseDatabase/Fact-sheets/2014-Fact-sheets-items/2014-11-10.html. Accessed April 3, 2017.
12. Center for Medicare & Medicaid Services. Medicare ACOs Provide Improved Care While Slowing Cost Growth in 2014. 2015; https://www.cms.gov/Newsroom/MediaReleaseDatabase/Fact-sheets/2015-Fact-sheets-items/2015-08-25.html. Accessed April 5, 2017.
13. Colla CH, Wennberg DE, Meara E, Skinner JS, Gottlieb D, Lewis VA, Snyder CM, Fisher ES. Spending Differences Associated with the Medicare Physician Group Practice Demonstration. JAMA. 2012;308(10):1015-1023. doi:10.1001/2012.jama.10812
14. McWilliams JM, Landon BE, Chernew ME. Changes in Health Care Spending and Quality for Medicare Beneficiaries Associated with a Commercial ACO Contract. JAMA. 2013;310(8):829-836. doi:10.1001/jama.2013.276302
15. Nyweide DJ, Lee W, Cuerdon TT, Pham HH, Cox M, Rajkumar R, Conway PH. Association of Pioneer Accountable Care Organizations vs Traditional Medicare Fee for Service With Spending, Utilization, and Patient Experience. JAMA. 2015;313(21):2152-2161. doi:10.1001/jama.2015.4930
16. Columbia University Mailman School of Public Health. Difference-in-Difference Estimation. 2017; https://www.mailman.columbia.edu/research/population-health-methods/difference-difference-estimation. Accessed April 10, 2017.
17. The Center for Medicare & Medicaid Services. 2013 Annual report of the boards of trustees of the federal hospital insurance and federal supplementary medical insurance trust funds. 2013; Research Statistics Data and Systems. https://www.cms.gov/Research-Statistics-Data-and-Systems/Statistics-Trends-and-Reports/ReportsTrustFunds/downloads/tr2013.pdf. 2014; Accessed April 5, 2017.
18. The Center for Medicare & Medicaid Services. 2014 Annual report of the boards of trustees of the federal hospital insurance and federal supplementary medical insurance trust funds. 2014; Research Statistics Data and Systems. https://www.cms.gov/Research-Statistics-Data-and-Systems/Statistics-Trends-and-Reports/ReportsTrustFunds/downloads/tr2014.pdf 2015; Accessed April 5, 2017.
https://www.cms.gov/Newsroom/MediaReleaseDatabase/Fact-sheets/2014-Fact-sheets-items/2014-11-10.html