Emerging threats and persistent conservation challenges for ...
ORIGINAL REPORT
Epidemiological Assessment of Levodopa Usein Spain, 1990±1995. Persistent, Low
Consumption in the South
JOSEÂ IGNACIO CUADRADO, MD1,* JESUÂ S DE PEDRO-CUESTA, MD, PhD1,2, VICTOR ABRAIRA, PhD3,LESZEK STAWIARZ, M.Sc2, ANTONIO INÄ ESTA, PharmD, PhD4 AND JAVIER ALMAZAÂ N RN1
1Department of Applied Epidemiology, National Centre for Epidemiology, Carlos III Institute of Health, Madrid, Spain2Unit for Neuroepidemiology, Division of Neurology, Huddinge University Hospital, Karolinska Institute,
Huddinge, Sweden3Biostatistics Unit, Ramon y Cajal Hospital, Madrid, Spain
4National Public Health School, Carlos III Institute of Health, Madrid, Spain
SUMMARY
Parkinson's disease (PD) is considerably underdiagnosed in Spain and its treatment relies mainly onlevodopa (LD), a drug enjoying good access country-wide. In order to identify regions with the highestpotential for improvement in the quality of life of PD patients, we evaluated total sales of levodopa inSpanish provinces during the period 1990±1995, using a reported method. Total annual crude sales inthe country were medium±low and increased with time. When adjusted for age and infant mortalityrates (IMRs), taken as an index of socio-sanitary development, annual LD sales become stable andsimilar to those in the reference population, Sweden 1994. Provincial LD use (LDU) showed a widevariation in annual levels and time trends, with a north±south gradient in evidence. Statisticallysigni®cant clustering was seen, with the lowest crude age-adjusted and age- and IMR-adjusted LD salesin the south-west and moderately high levels in north-central and north-west provinces. The results showthat LDU in Spain is medium±low, and that demographic and social factors may underlie geographicaldi�erences in LD sales. The remarkably low LDU in selected provinces in the south-west of the countrymight re¯ect de®cient PD detection and/or treatment amenable to control. Copyright # 1999 JohnWiley & Sons, Ltd.
KEY WORDS Ð drug use; levodopa; Parkinson's disease; epidemiology
INTRODUCTION
The rational use of drugs is the most frequentobjective of population-based drug consumptionstudies. Epidemiological evaluation of drug use isan elusive task due to: (1) the multiple factorswhich determine the level of drug consumptionby any given population, such as prevalence,underdiagnosis and misdiagnosis of speci®c dis-orders, treatment traditions, drug policies, accessto medication and marketing strategies; (2) focuson di�erent drug-use data, such as issued
prescriptions, gross sales or sales on prescription;and (3) speci®c problems linked both to drugclassi®cation, grouping and units, as well as tostrategies for comparison of drug use. Owing to theintroduction of the de®ned daily dose (DDD)concept and to the predominant indication forspeci®c diagnostic groups, epidemiological evalua-tion of drug use has been considered to be part-icularly feasible for levodopa (LD), antidiabeticand antiglaucoma drugs.1,2
Levodopa, introduced in Spain 27 years ago,is still the drug of choice in the pharmaco-logical treatment of Parkinson's disease (PD).3,4,5
PD patients enjoy good access to LD in Spain.While some Parkinson-plus syndromes and
CCC 1053±8569/99/080433±13$17.50 Received 26 March 1999Copyright # 1999 John Wiley & Sons, Ltd. Revised 15 July 1999
Accepted 10 August 1999
PHARMACOEPIDEMIOLOGY AND DRUG SAFETY 8: 433±445 (1999)
*Correspondence to: Dr J. I. Cuadrado, Centro Nacional deEpidemiologõÂ a, Sinesio Delgado 6, 28029 Madrid, Spain.

post-encephalitic Parkinsonism may respond toLD,6,7,8 LD is indicated, apart from Parkinson'sdisease, for infrequent disorders such as restlesslegs syndrome. Epidemiological assessment oflevodopa use (LDU) may thus be relevant forevaluation of the quality of care of PD patients andplanning of community-based PD interventionstrategies.
Prior studies into LDU in Spain, in 1982±19859
and again in 198910, revealed a generally low levelof LDU. Results of door-to-door prevalencesurveys of Parkinsonisms in Spain have been, ingeneral, summarily reported but uncovered asystematic, considerably high underdiagnosis ofPD, namely, 68% in Vejer de la Frontera (Cadiz) in1987,11,12 52% in Pamplona in 199113 and 62% inCantalejo (Segovia) in 1996.14 Methodologicaldi�erences and uncertainties, such as choice ofscreening instruments, poorly known instrumentsensitivity, and diagnostic criteria, as well as sparsedata may undermine the comparability of results ofsuch studies. However, since, in general, no speci®creasons are known that might lead one to expect anoticeable geographical variation in PD prevalencein Spain, identi®cation of geographical areas withlow LDU could be used for design of interventionsaimed at improving PD detection in such regions,through campaigns linked either to primary care15
or to neurological clinics.16 Conversely, regionswith high LDU, similar to that found in Green-land, the Faroe Islands and Iceland,17,18,19 might berevealed. The purpose of this study was to evaluateLDU in Spanish provinces during the period 1990±1995.
METHODS
Study population and access tomedical services
Levodopa use (LDU) was analysed by reference tothe resident Spanish population covered by theNational Health Service (NHS) and entitled toreceive prescriptions subsidized by the SocialSecurity (SS). During the study period this corre-sponded to approximately 98.01% of Spain'sresident population, and in 48 provinces, thisproportion rose to an average of 98.07%, SD0.35%. In two North African cities, Ceuta andMelilla, these proportions were 63.28% and60.41%.20 NHS access to neurological care on aprepaid basis is provided by approximately 1000specialized clinical neurologists. In general, access
to specialized NHS care and medical technology inSpain is good.
Levodopa (LD) can only be obtained in Spanishpharmacies on prescription. Individuals with SScoverage can obtain it free of charge in the case ofpensioners, and at 10% of cost in the case ofPD patients engaged in active working life. Eachreceipt covered by the SS is registered at theNational Drug Database for administrativepurposes. Computerized codes are allocated todrugs, prescribing physicians and pharmacies. Thecode applicable to the pharmacy where the pre-scription is collected and the drug sold is routinelyused for ascription to a geographical area, e.g.province.
LDU measurement
Data on annual prescription sales of LD combinedwith decarboxylase inhibitors for Spanish pro-vinces over the 1990±1995 period were furnishedand quoted by the Ministry of Public Health'sNational Drug Database as the number ofpackages, units and strength. These were convertedto DDD (a technical unit of measurement equiva-lent to 600 mg of pure LD, when combined asabove) as per the Nordic Council on Medicines'drug classi®cation system.21 Age-strati®ed annualprovincial population data were obtained from thepopulation statistics drawn up by the NationalStatistics Institute (INE). Comparative LDU wasquanti®ed using a reported method.1 Annual datafor provincial infant mortality rates (IMRs) for theperiod 1988±1993 were obtained from reportedstatistics,22 and those for 1994 through a speci®crequest to the National Statistics Institute. SimilarIMR data for 1995 were not available. The IMR is ageneral, widely available, regularly reported,indicator of social and health care development,sensitive to changes in socioeconomic develop-ment.23,24 As a reference for LDU-comparisonpurposes, we selected LDU in Sweden in both1984 Ð a reference used in several prior LDUstudies in European regions Ð and 1994. Theprocedure entailed comparing LDU in Spanishprovinces against that in Sweden at two calendartime points, 10 years apart. The Swedish NationalCorporation of Pharmacies (Apoteksbolaget)supplied annual ®gures of gross sales of LD forthe period 1991±1995. Population ®gures andannual IMRs were provided by Statistics Sweden.Data for populations used in this study are shown inTable 1.
434 J. I. CUADRADO ET AL.
Copyright # 1999 John Wiley & Sons, Ltd. Pharmacoepidemiology and Drug Safety, 8: 433±445 (1999)

From the various reported measurements ofcomparative LDU1 we selected: (1) for relative-usepurposes, crude LDU ratios (RR), age-adjustedLDU (SRRS) and age- and IMR-adjusted LDU(SRRSS0); and (2) for rate-di�erence purposes, thedi�erence in crude rates as between two popula-tions, denoted as RD, and the di�erence in crudeand IMR-adjusted LDU within the same popula-tion and time. This latter measurement, denoted asS0RD and obtained as described below, was takenas an estimator of the expected change in LDU incases where the conditions determining IMR werethe same as those in the reference population. Thereader should, however, be warned against mis-understanding the concept of S0RD with a di�erentmeasurement, i.e. SRDS0 � LS0 ÿ LS as formulatedin 1-12a elsewhere.1 The latter is a measurement ofdi�erences in IMR-adjusted LDU rates, wherethe IMR data corresponding to the LS0 and LS®gures are the same. In S0RD in contrast, theIMR data corresponding to the L and LS0 ®guresvary, the di�erence in IMR explaining the
simulated di�erence in LDU in the same popula-tion. This procedure is denoted below as `IMRdisadjustment', and the corresponding rates as`IMR-disadjusted'.
The basic expressions of the model,1 areformulae here numbered 1, 2 and 3:
Kn � b0n � b1n1=IMR; 1
L60±69 � L0=365
XKnBn; and 2
Ln � L60±69Kn; 3
where Kn are a set of seven age-n-speci®c coe�-cients obtained for each annual LDU observationby regressing triennial average values for IMR inseven age-n-speci®c equations,25 whose b0n and b1nregression coe�cients were obtained from ananalysis of PD age-n-speci®c prevalence surveysand IMR values, and taken as constants. L0represents annual LD sales expressed in numberof DDDs; Bn is the age-n-speci®c population; L60±
69 and Ln represent the annual daily LDU by 103
Table 1 Ð Levodopa sales, population, annual infant mortalities and Kn coe�cients for the reference populations
Notation De®nition Sweden, 1984 Sweden, 1994
L0 Total annual sales of LD (DDD) 4 417 150 5 481 390Bn Population in each age-n-groupB0±29 3 246 588 3 396 701B30±39 1 255 202 1 201 434B40±49 1 041 743 1 258 232B50±59 879 059 1 015 058B60±69 920 676 808 803B70±79 694 796 728 021B80� 304 117 408 132IMR Infant mortality rate (triennial average) 6.40 (6.77) 4.45 (4.88)Kn Age-n-speci®c coe�cient ( from Kn � b0n � b1n1/IMR)K0±29 0 0.00 0.00K30±39 0.126/IMRÿ 0.001 0.02 0.03K40±49 0.748/IMR � 0.029 0.14 0.18K50±59 0.529ÿ 1.875/IMR 0.25 0.14K60±69 1 1 1K70±79 18.59/IMR � 0.285 3.04 4.11K80� 27.67/IMRÿ 0.778 3.32 4.92Ln Annual consumption of LD in each age-n-group
(DDD/103 inhabitants/day)L0±29 0.00 0.00L30±39 0.05 0.07L40±49 0.38 0.50L50±59 0.69 0.39L60±69 2.73 2.73L70±79 8.30 11.24L80� 9.07 13.44L Crude annual consumption of LD in the population
(DDD/103 inhabitants/day)1.45 1.70
LEVODOPA USE IN SPAIN 435
Copyright # 1999 John Wiley & Sons, Ltd. Pharmacoepidemiology and Drug Safety, 8: 433±445 (1999)

individuals in the age-group 60±69 and n (seeTable 1).
The above-mentioned new S0RD measure is:
S0RD � L ÿ L
S0 �4�
with L being the crude LDU in the indexpopulation
L � L0= 365
XBn
� ��5�
and LS0, the IMR-adjusted LDU in the indexpopulation, as stated above in formula 1-12b,1
LS0 � L60±69
XKSnBn
� �=X
Bn: �6�
Subsequently, an estimate of the expected abso-lute di�erence in sales in an index population det-ermined by IMR-disadjustment was calculated as
L0 ÿ L
0S0 � 365.L60±69
XKnBn ÿ
XKSnBn
� ��7�
95% CI limits for the two measurements, S0RDand L0 ÿ L0S
0, were calculated as follows. Assump-
tions (i) and (ii) were left unmodi®ed,18 namely: (i)all random variability is due to the Kn coe�cientsand (ii) Kn and KSn are independent. L in equation4 was taken as a constant value since it derivedfrom population and drug-sales data. This impliesthat the model (see equation 1) is not a probabil-istic one, i.e. b0n and b1n are constants, withsubsequent random variation in the RD estimatesbeing solely induced by the IMRs, and not bypopulation or drug-sales data.
Therefore
var�S0RD� � var�LS0 � �8�
and from 1-6
var�LS0 � � L60±69PBn
� �2XB2n var�KSn� �9�
the second indicator being (1-7)
var�L0 ÿ L0S0 � � �365.L60±69�2X
B2n var Kn �
XB2n var�KSn�
h i:
�10�
Since, as indicated elsewhere,18 var(Kn) andvar(KSn) were calculated as
var�Kn� � b21n var1
IMR
� �;
the 95% CI limits for S0RD and L0 ÿ L0S0were
obtained by applying Chebyshev inequality asfollows
S0RD95%CI : + 4.47
���������������var�LS0
p�; and �11�
L0 ÿ L
0S095%CI : + 4.47
����������������������������var�L0 ÿ L0S0 �
p: �12�
Maps for provincial crude LDU in 1984 fromreported data9 and in 1994 from the present study,as well as for SRRS and SRRSS0, were drawn upusing three categories based on the three medium,and the upper and lower quintiles. Statisticalsigni®cance for geographical clustering was as-sessed using the Ohno test.26
RESULTS
The variation in crude and relative use of levodopain Spain and Sweden during the study period isdepicted in Fig. 1. Annual crude LDU in Spainduring the period 1990±1995 increased evenly from0.95 to 1.22 DDD/103 inh/day. In Sweden theannual values for 1984 and 1994 were 1.45 and1.75 DDD/103 inh/day. LDU in Sweden only in-creased 5.68% during the period 1991±1995. Withregard to comparative LDU, the RR for Spainincreased from 0.56 to 0.68, and on adjusting forage and IMR, the ®gures remained stable, rangingfrom 1.00 (95% CI 0.89, 1.12) in 1991 to 1.01 (95%CI 0.91, 1.14) in 1993. Age- and IMR-adjusted RRfor Sweden decreased from 1990 onwards, and in1994 reached a level similar to that of 1984.
Annual crude sales per population unit indi�erent Spanish provinces are shown in Fig. 2. Ingeneral, there was a rising trend, averaging 29.9%during the study period, with considerable inter-provincial variation, going from a 1995 ®gure of0.40 DDD/103 inh/day in Melilla to 2.26 DDD/103 inh/day in Soria. The most remarkable LDUincrease during the study period (67.1%) wasregistered by Guipuzcoa. Steady, low crude LDUvalues during the period were observed for a groupin Fig. 2c, located in North Africa and SouthernSpain, comprising Melilla, Ceuta, Malaga, Sevilleand Cadiz.
436 J. I. CUADRADO ET AL.
Copyright # 1999 John Wiley & Sons, Ltd. Pharmacoepidemiology and Drug Safety, 8: 433±445 (1999)

The distributions of provincial crude LDUvalues for 1990 and 1995 are shown in Fig. 3. Askewed shape was displayed solely for 1990.
LDU in Spain in 1994 was singled out for thepurposes of detailed information and comparativeLDU study. Demographic and drug-sales data for
Fig. 1 Ð Crude and age- and IMR-adjusted annual use of LD in Spain for the period 1990±1995, and in Sweden for1984 and 1991±1995
Fig. 2 Ð Crude annual LDU values for Spanish provinces during the period 1990±1995. Provincial code numbersshown in columns
LEVODOPA USE IN SPAIN 437
Copyright # 1999 John Wiley & Sons, Ltd. Pharmacoepidemiology and Drug Safety, 8: 433±445 (1999)

1994, as well as annual infant mortalities for theperiod 1992±1994 and crude LDU ®gures forSpanish provinces are listed in Table 2. Largeinter-provincial variations in population size and
total drug sales were observed. Triennial averageprovincial IMRs ranged from 4.44 to 10.72 (mean6.70, SD 1.34). Some provinces with small popula-tions, such as Cuenca, recorded unstable IMR
Fig. 4 Ð Geographical distribution of LDU in Spanish provinces in 1984 (a) and 1994 (b, c, d), as seen from di�erentLDU indicators. High and low categories correspond to upper and lower quintiles
Fig. 3 Ð Frequency distribution of crude provincial LDU in 1990 and 1995. Numbers in the abscissa represent mid-values of the intervals
438 J. I. CUADRADO ET AL.
Copyright # 1999 John Wiley & Sons, Ltd. Pharmacoepidemiology and Drug Safety, 8: 433±445 (1999)

Table 2 Ð Demographics, drug sales and crude LDU for 1994, annual infant mortalities for the period 1992±1994,and percentage change in LDU during the 1990±1995 period for Spanish provinces
Province Codenumber
Population(thousands)
IMR L0(DDD)
L(DDD/103/day)
% Annualchange
1992 1993 1994
Alava 1 275 4.90 7.08 2.97 89658 0.89 11.38Albecete 2 347 6.49 6.94 5.07 119023 0.94 15.73Alicante 3 1313 6.68 5.36 5.49 559528 1.17 14.26Almeria 4 467 7.17 8.60 7.25 136393 0.80 9.28Avila 5 171 6.24 5.93 8.39 111625 1.79 11.65Badajoz 6 657 6.96 6.22 7.88 224605 0.94 9.94Balearic Isles 7 722 5.54 5.32 4.43 334653 1.27 5.57Barcelona 8 4638 5.98 4.92 5.12 2109132 1.25 11.22Burgos 9 350 7.32 8.47 6.46 158350 1.24 7.12Caceres 10 413 6.99 5.41 6.36 126415 0.84 10.10Cadiz 11 1096 7.79 8.31 6.45 268673 0.67 9.01Castellon 12 450 6.02 6.01 4.34 202127 1.23 14.73C. Real 13 477 5.79 4.86 5.19 204062 1.17 17.24Cordoba 14 764 6.57 8.09 5.85 250835 0.90 4.55Corunna 15 1102 8.12 7.16 9.31 614128 1.53 9.33Cuenca 16 203 7.42 4.77 1.13 91438 1.23 15.71Girona 17 518 7.53 5.88 4.28 236570 1.25 12.29Granada 18 806 7.13 8.09 6.22 246997 0.84 8.21Guadalajara 19 152 4.14 5.06 8.10 94842 1.71 20.18Guipuzcoa 20 670 6.03 7.42 7.04 320792 1.31 22.15Huelva 21 447 8.27 8.45 6.36 139250 0.85 7.93Huesca 22 207 3.49 4.02 7.29 131853 1.74 5.57Jaen 23 644 7.39 8.57 7.04 226978 0.97 8.54Leon 24 519 8.61 7.80 5.31 261470 1.38 8.29Lleida 25 354 8.10 5.86 4.71 247062 1.91 10.99La Rioja 26 261 11.55 6.52 7.83 177625 1.86 9.10Lugo 27 377 12.20 7.48 8.36 282508 2.05 10.15Madrid 28 5001 6.76 6.51 6.27 1966430 1.08 7.44Malaga 29 1186 8.38 7.85 7.13 260103 0.60 6.90Murcia 30 1071 9.22 5.92 7.28 352072 0.90 10.94Navarre 31 524 8.13 6.83 8.17 318292 1.66 11.04Orense 32 349 9.25 12.52 10.40 213627 1.68 14.81Asturias 33 1082 4.94 7.60 6.76 629432 1.59 6.75Palencia 34 183 7.61 5.79 10.26 74775 1.12 13.78Las Palmas 35 791 4.36 4.81 5.21 264540 1.92 7.51Pontevedra 36 902 8.49 8.10 4.63 352027 1.07 9.78Salamanca 37 356 5.74 7.58 5.61 206025 1.59 8.07Sta. Cruz 38 744 7.08 9.18 5.47 221740 0.82 8.38Cantabria 39 527 6.26 7.53 5.52 287385 1.50 5.34Segovia 40 146 8.46 12.20 8.22 94027 1.76 10.99Seville 41 1655 8.04 7.25 6.40 390593 0.65 10.04Soria 42 93 8.55 6.88 4.62 71675 2.11 7.44Tarragona 43 560 7.24 7.89 4.45 300498 1.47 4.44Teruel 44 141 7.59 6.86 2.60 80898 1.57 7.06Toledo 45 501 7.10 5.39 6.47 225118 1.23 12.10Valencia 46 2130 7.83 7.03 5.55 980988 1.26 12.21Valladolid 47 494 4.73 4.84 4.42 178918 0.99 7.34Vizcaya 48 1139 7.65 5.11 5.63 542712 1.31 9.15Zamora 49 209 2.51 5.47 5.95 117435 1.54 10.89Zaragoza 50 836 7.14 5.23 3.81 405830 1.33 12.19Ceuta 51 70 6.46 11.52 8.93 14087 0.55 8.47Melilla 52 60 5.22 5.34 6.66 9598 0.44 ÿ3.72SPAIN 39149 7.04 6.67 6.02 16501733 1.15 9.65
LEVODOPA USE IN SPAIN 439
Copyright # 1999 John Wiley & Sons, Ltd. Pharmacoepidemiology and Drug Safety, 8: 433±445 (1999)
®gures. The number of DDDs sold per day, ascalculated from total country-wide sales, totalled4,521, corresponding to an LDU rate of 1.15 DDD/103 inh/day. The ®gures for 1994 ranged from 0.44to 2.11 DDD.103 inh/day in Melilla and Soria,respectively.
Table 3 shows crude and standardized LDUratios for Spanish provinces in 1994 compared withthose for crude LDU in Sweden in 1984 and 1994.As against Sweden in 1994, RR of LDU variedfrom values that were very low, such as 0.26 and0.32 in Melilla and Ceuta, to those slightly aboveSweden's, such as 1.21 and 1.24 for Lugo andSoria. When adjusted for age, rate ratios rangedfrom 0.44 to 1.09, rising in the majority of pro-vinces and declining in provinces, such as Soria orLugo, with well-known aged populations. In the13 remaining provinces, SRRS were in the lowinterval, from 0.44 to 0.65. When adjusted for ageand IMR: (1) comparative LDU for most pro-vinces remained below 1; (2) statistically signi®canthigher LDU was seen in seven provinces, with LaRioja, Navarre and Lugo respectively registeringthe highest SRRSS0 values, namely, 1.61 (95% CI1.22, 2.14), 1.48 (1.28, 1.72), and 1.46 (1.13, 1.89);and (3) statistically signi®cant low LDU was regis-tered by 10 provinces. A similar general pattern,with higher comparative LDU, was observed whenSwedish 1984 values were taken as reference.
Table 4 shows the di�erences in: (1) provincialcrude LDU in 1994, and crude Swedish LDU in1984 or 1994, i.e. the RD; (2) the S0RD for 1994,i.e. crude provincial LDU in 1994 minus SwedishIMR-adjusted provincial LDU in the same year;and (3) the absolute annual DDD numbers corre-sponding to the S0RD values. The S0RD valuesrevealed a considerable degree of LD underutiliza-tion, ÿ0.27 (95% CI ÿ0.59, 0.05) DDD/103 inh/day for the whole country, with almost system-atically low to very low negative relative values. Sixprovinces with highest, negative, statistically sig-ni®cant deviations from such expected LDU,ranking from ÿ1.26 (95% CI ÿ1.97, ÿ0.56) toÿ0.64 (95% CI ÿ1.17, ÿ0.11) DDD/103 inh/day,were Orense, Lugo, Segovia, La Rioja, Corunnaand Navarre. The estimated di�erence in theabsolute annual amount of country-wide LDsales in 1994 versus that expected with an IMR of4.88, was ÿ3 848 120 (95% CI ÿ9 329 010 to1 632 770) DDD per year, i.e. a statistically non-signi®cant 10 542 DDD per day. A wide inter-provincial variation was observed. The provinceswhere LD underutilization was highest in absolute
terms were Madrid, Corunna and Valencia, with1160, 692 and 626 DDD per day below theexpected numbers being consumed.
Maps for LDU are plotted in Fig. 4. Consider-able similarity was observed between Spanish crudeLDU patterns for 1984 and 1994. High LDU, mostclearly for crude and age-adjusted ®gures, was inevidence in the North, while low LDU was seen inthe South for crude, and South-west for age-adjusted ®gures. Such patterns were less clearwhen adjusted for both age and IMR. The stat-istical signi®cance of spatial aggregation decreasedwith time, p-values 0.005, 0.018 for crude 1984 and1994 data, and with adjustment of age and age-and-IMR, i.e. 1994 p-values of 0.059 and 0.647.
DISCUSSION
The results of this study show that the LDU level inSpain is medium±low, increases with time andevinces considerable geographical di�erences inmagnitude and time trend. The fact that adjacentregions with traditionally high LDU display asystematic pattern despite adjustments, and thatlow LDU aggregates disappear when the IMR istaken into account, would point to di�erent causesunderlying the geographical variation in LDU.
The interpretation of modest di�erences inadjusted LDU measurements should be madewith caution since, despite its wide use, the validityof the IMR as an indicator of quality of care of theelderly is not well known.24 In addition, there aretwo major relevant factors which might havebiased all LDU indicators. First, LDU measure-ments in the reference population were based ondeliveries from wholesalers to all, including in-hospital, pharmacies, whereas in Spain these werebased on prescription sales at community pharma-cies. While LDU in Swedish hospitals mainlycorresponded to hospitals for chronic somaticcare and accounted for 18% of total sales,27 inSpain the smaller size of the long-term carehospital sector (0.25 beds per 1000 inh) consider-ably limited the impact of this source of error.Second, Swedish ®gures corresponded to drug useby the entire Swedish population, and Spanish®gures to use by the 98.1% of the populationcovered by the NHS. The IMR's statistics for199428 revealed that 15.4% of LD packagescorresponded to sales to population covered bysubsidiary SS systems, such as MUFACE, etc. Asthe National Drug Database does not record drug
440 J. I. CUADRADO ET AL.
Copyright # 1999 John Wiley & Sons, Ltd. Pharmacoepidemiology and Drug Safety, 8: 433±445 (1999)
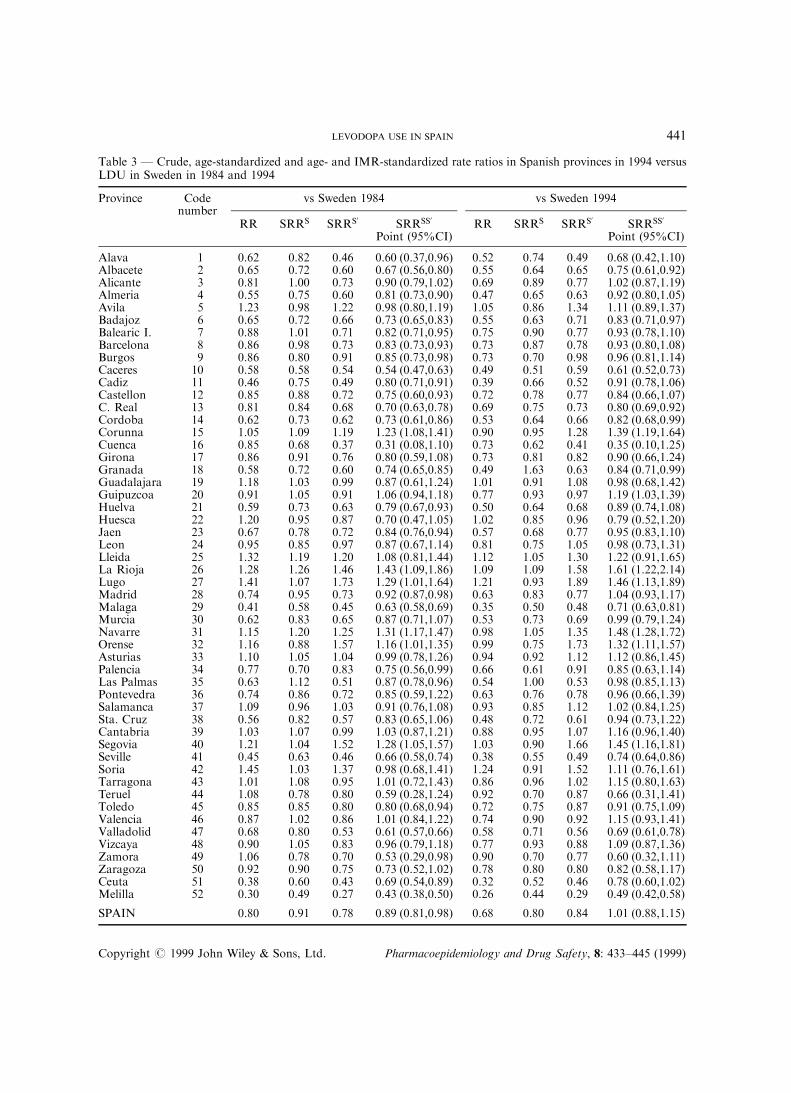
Table 3 Ð Crude, age-standardized and age- and IMR-standardized rate ratios in Spanish provinces in 1994 versusLDU in Sweden in 1984 and 1994
Province Codenumber
vs Sweden 1984 vs Sweden 1994
RR SRRS SRRS0 SRRSS0
Point (95%CI)RR SRRS SRRS0 SRRSS0
Point (95%CI)
Alava 1 0.62 0.82 0.46 0.60 (0.37,0.96) 0.52 0.74 0.49 0.68 (0.42,1.10)Albacete 2 0.65 0.72 0.60 0.67 (0.56,0.80) 0.55 0.64 0.65 0.75 (0.61,0.92)Alicante 3 0.81 1.00 0.73 0.90 (0.79,1.02) 0.69 0.89 0.77 1.02 (0.87,1.19)Almeria 4 0.55 0.75 0.60 0.81 (0.73,0.90) 0.47 0.65 0.63 0.92 (0.80,1.05)Avila 5 1.23 0.98 1.22 0.98 (0.80,1.19) 1.05 0.86 1.34 1.11 (0.89,1.37)Badajoz 6 0.65 0.72 0.66 0.73 (0.65,0.83) 0.55 0.63 0.71 0.83 (0.71,0.97)Balearic I. 7 0.88 1.01 0.71 0.82 (0.71,0.95) 0.75 0.90 0.77 0.93 (0.78,1.10)Barcelona 8 0.86 0.98 0.73 0.83 (0.73,0.93) 0.73 0.87 0.78 0.93 (0.80,1.08)Burgos 9 0.86 0.80 0.91 0.85 (0.73,0.98) 0.73 0.70 0.98 0.96 (0.81,1.14)Caceres 10 0.58 0.58 0.54 0.54 (0.47,0.63) 0.49 0.51 0.59 0.61 (0.52,0.73)Cadiz 11 0.46 0.75 0.49 0.80 (0.71,0.91) 0.39 0.66 0.52 0.91 (0.78,1.06)Castellon 12 0.85 0.88 0.72 0.75 (0.60,0.93) 0.72 0.78 0.77 0.84 (0.66,1.07)C. Real 13 0.81 0.84 0.68 0.70 (0.63,0.78) 0.69 0.75 0.73 0.80 (0.69,0.92)Cordoba 14 0.62 0.73 0.62 0.73 (0.61,0.86) 0.53 0.64 0.66 0.82 (0.68,0.99)Corunna 15 1.05 1.09 1.19 1.23 (1.08,1.41) 0.90 0.95 1.28 1.39 (1.19,1.64)Cuenca 16 0.85 0.68 0.37 0.31 (0.08,1.10) 0.73 0.62 0.41 0.35 (0.10,1.25)Girona 17 0.86 0.91 0.76 0.80 (0.59,1.08) 0.73 0.81 0.82 0.90 (0.66,1.24)Granada 18 0.58 0.72 0.60 0.74 (0.65,0.85) 0.49 1.63 0.63 0.84 (0.71,0.99)Guadalajara 19 1.18 1.03 0.99 0.87 (0.61,1.24) 1.01 0.91 1.08 0.98 (0.68,1.42)Guipuzcoa 20 0.91 1.05 0.91 1.06 (0.94,1.18) 0.77 0.93 0.97 1.19 (1.03,1.39)Huelva 21 0.59 0.73 0.63 0.79 (0.67,0.93) 0.50 0.64 0.68 0.89 (0.74,1.08)Huesca 22 1.20 0.95 0.87 0.70 (0.47,1.05) 1.02 0.85 0.96 0.79 (0.52,1.20)Jaen 23 0.67 0.78 0.72 0.84 (0.76,0.94) 0.57 0.68 0.77 0.95 (0.83,1.10)Leon 24 0.95 0.85 0.97 0.87 (0.67,1.14) 0.81 0.75 1.05 0.98 (0.73,1.31)Lleida 25 1.32 1.19 1.20 1.08 (0.81,1.44) 1.12 1.05 1.30 1.22 (0.91,1.65)La Rioja 26 1.28 1.26 1.46 1.43 (1.09,1.86) 1.09 1.09 1.58 1.61 (1.22,2.14)Lugo 27 1.41 1.07 1.73 1.29 (1.01,1.64) 1.21 0.93 1.89 1.46 (1.13,1.89)Madrid 28 0.74 0.95 0.73 0.92 (0.87,0.98) 0.63 0.83 0.77 1.04 (0.93,1.17)Malaga 29 0.41 0.58 0.45 0.63 (0.58,0.69) 0.35 0.50 0.48 0.71 (0.63,0.81)Murcia 30 0.62 0.83 0.65 0.87 (0.71,1.07) 0.53 0.73 0.69 0.99 (0.79,1.24)Navarre 31 1.15 1.20 1.25 1.31 (1.17,1.47) 0.98 1.05 1.35 1.48 (1.28,1.72)Orense 32 1.16 0.88 1.57 1.16 (1.01,1.35) 0.99 0.75 1.73 1.32 (1.11,1.57)Asturias 33 1.10 1.05 1.04 0.99 (0.78,1.26) 0.94 0.92 1.12 1.12 (0.86,1.45)Palencia 34 0.77 0.70 0.83 0.75 (0.56,0.99) 0.66 0.61 0.91 0.85 (0.63,1.14)Las Palmas 35 0.63 1.12 0.51 0.87 (0.78,0.96) 0.54 1.00 0.53 0.98 (0.85,1.13)Pontevedra 36 0.74 0.86 0.72 0.85 (0.59,1.22) 0.63 0.76 0.78 0.96 (0.66,1.39)Salamanca 37 1.09 0.96 1.03 0.91 (0.76,1.08) 0.93 0.85 1.12 1.02 (0.84,1.25)Sta. Cruz 38 0.56 0.82 0.57 0.83 (0.65,1.06) 0.48 0.72 0.61 0.94 (0.73,1.22)Cantabria 39 1.03 1.07 0.99 1.03 (0.87,1.21) 0.88 0.95 1.07 1.16 (0.96,1.40)Segovia 40 1.21 1.04 1.52 1.28 (1.05,1.57) 1.03 0.90 1.66 1.45 (1.16,1.81)Seville 41 0.45 0.63 0.46 0.66 (0.58,0.74) 0.38 0.55 0.49 0.74 (0.64,0.86)Soria 42 1.45 1.03 1.37 0.98 (0.68,1.41) 1.24 0.91 1.52 1.11 (0.76,1.61)Tarragona 43 1.01 1.08 0.95 1.01 (0.72,1.43) 0.86 0.96 1.02 1.15 (0.80,1.63)Teruel 44 1.08 0.78 0.80 0.59 (0.28,1.24) 0.92 0.70 0.87 0.66 (0.31,1.41)Toledo 45 0.85 0.85 0.80 0.80 (0.68,0.94) 0.72 0.75 0.87 0.91 (0.75,1.09)Valencia 46 0.87 1.02 0.86 1.01 (0.84,1.22) 0.74 0.90 0.92 1.15 (0.93,1.41)Valladolid 47 0.68 0.80 0.53 0.61 (0.57,0.66) 0.58 0.71 0.56 0.69 (0.61,0.78)Vizcaya 48 0.90 1.05 0.83 0.96 (0.79,1.18) 0.77 0.93 0.88 1.09 (0.87,1.36)Zamora 49 1.06 0.78 0.70 0.53 (0.29,0.98) 0.90 0.70 0.77 0.60 (0.32,1.11)Zaragoza 50 0.92 0.90 0.75 0.73 (0.52,1.02) 0.78 0.80 0.80 0.82 (0.58,1.17)Ceuta 51 0.38 0.60 0.43 0.69 (0.54,0.89) 0.32 0.52 0.46 0.78 (0.60,1.02)Melilla 52 0.30 0.49 0.27 0.43 (0.38,0.50) 0.26 0.44 0.29 0.49 (0.42,0.58)
SPAIN 0.80 0.91 0.78 0.89 (0.81,0.98) 0.68 0.80 0.84 1.01 (0.88,1.15)
LEVODOPA USE IN SPAIN 441
Copyright # 1999 John Wiley & Sons, Ltd. Pharmacoepidemiology and Drug Safety, 8: 433±445 (1999)

Table 4 Ð Di�erences in LDU rates between Spanish provinces and Sweden in 1984 and 1994, as well as betweencrude provincial and IMR-adjusted (standard IMR Swedish 1992±1994 values) LDU in 1994
Province Codenumber
RD S'RD
Lÿ LS1984 Lÿ LS1994 DDD/103 inh./day Absolute DDD (thousands)
Point 95% CI Point 95% CI
Alava 1 ÿ0.56 ÿ0.81 0.06 (ÿ0.12, 0.24) 6.07 (ÿ91.91, 104.05)Albacete 2 ÿ0.51 ÿ0.76 ÿ0.16 (ÿ0.41, 0.09) ÿ20.36 (ÿ77.48, 36.77)Alicante 3 ÿ0.28 ÿ0.54 ÿ0.15 (ÿ0.44, 0.14) ÿ72.49 (ÿ279.73, 134.75)Almeria 4 ÿ0.65 ÿ0.90 ÿ0.28 (ÿ0.52, ÿ0.04) ÿ47.92 (ÿ97.48, 1.64)Avila 5 0.33 0.08 ÿ0.50 (ÿ1.05, 0.05) ÿ31.25 (ÿ90.15, 27.65)Badajoz 6 ÿ0.51 ÿ0.77 ÿ0.27 (ÿ0.55, 0.00) ÿ65.04 (ÿ153.82, 23.74)Balearic Isles 7 ÿ0.18 ÿ0.43 ÿ0.04 (ÿ0.34, 0.26) ÿ9.87 (ÿ138.51, 118.78)Barcelona 8 ÿ0.20 ÿ0.46 ÿ0.08 (ÿ0.38, 0.22) ÿ136.45 (ÿ848.64, 575.74)Burgos 9 ÿ0.21 ÿ0.46 ÿ0.43 (ÿ0.82, ÿ0.04) ÿ55.49 (ÿ124.99, 14.02)Caceres 10 ÿ0.61 ÿ0.86 ÿ0.16 (ÿ0.39, 0.07) ÿ24.58 (ÿ77.02, 27.85)Cadiz 11 ÿ0.78 ÿ1.03 ÿ0.20 (ÿ0.39, ÿ0.02) ÿ82.01 (ÿ186.63, 22.60)Castellon 12 ÿ0.22 ÿ0.47 ÿ0.09 (ÿ0.39, 0.22) ÿ14.42 (ÿ124.09, 95.26)C. Real 13 ÿ0.28 ÿ0.53 ÿ0.07 (ÿ0.36, 0.22) ÿ12.16 (ÿ78.48, 54.17)Cordoba 14 ÿ0.55 ÿ0.80 ÿ0.23 (ÿ0.49, 0.03) ÿ64.08 (ÿ178.97, 50.81)Corunna 15 0.08 ÿ0.18 ÿ0.65 (ÿ1.14, ÿ0.15) ÿ260.51 (ÿ523.10, 2.08)Cuenca 16 ÿ0.22 ÿ0.47 0.54 (ÿ0.37, 0.70) 39.91 (ÿ227.68, 307.50)Girona 17 ÿ0.20 ÿ0.45 ÿ0.14 (ÿ0.45, 0.18) ÿ25.96 (ÿ199.23, 147.32)Granada 18 ÿ0.61 ÿ0.86 ÿ0.24 (ÿ0.48, 0.00) ÿ70.79 (ÿ170.32, 28.74)Guadalajara 19 0.26 0.01 ÿ0.30 (ÿ0.57, 0.31) ÿ7.30 (ÿ88.20, 73.60)Guipuzcoa 20 ÿ0.14 ÿ0.39 ÿ0.33 (ÿ0.70, 0.03) ÿ81.13 (ÿ198.33, 36.07)Huelva 21 ÿ0.70 ÿ0.85 ÿ0.30 (ÿ0.57, ÿ0.04) ÿ49.50 (ÿ114.62, 15.62)Huesca 22 0.29 0.04 0.11 (ÿ0.27, 0.50) 8.62 (ÿ115.53, 132.77)Jaen 23 ÿ0.48 ÿ0.74 ÿ0.34 (ÿ0.63, ÿ0.05) ÿ79.90 (ÿ163.60, 3.80)Leon 24 ÿ0.07 ÿ0.32 ÿ0.41 (ÿ0.82, 0.01) ÿ77.06 (ÿ255.58, 101.46)Lleida 25 0.46 0.21 ÿ0.31 (ÿ0.83, 0.21) ÿ39.87 (ÿ211.88, 132.14)La Rioja 26 0.41 0.16 ÿ0.82 (ÿ1.44, ÿ0.20) ÿ78.28 (ÿ199.08, 42.52)Lugo 27 0.60 0.35 ÿ1.17 (ÿ1.96, ÿ0.40) ÿ161.33 (ÿ345.95, 23.30)Madrid 28 ÿ0.37 ÿ0.63 ÿ0.24 (ÿ0.52, 0.05) ÿ430.26 (ÿ983.50, 122.98)Malaga 29 ÿ0.85 ÿ1.10 ÿ0.21 (ÿ0.39, ÿ0.03) ÿ91.49 (ÿ180.20,ÿ 2.78)Murcia 30 ÿ0.55 ÿ0.80 ÿ0.27 (ÿ0.53, ÿ0.01) ÿ105.64 (ÿ295.99, 84.71)Navarre 31 0.21 ÿ0.04 ÿ0.64 (ÿ1.17, ÿ0.10) ÿ121.69 (ÿ247.05, 3.68)Orense 32 0.23 ÿ0.02 ÿ1.26 (ÿ1.97, ÿ0.56) ÿ160.83 (ÿ273.39,ÿ 48.27)Asturias 33 0.14 ÿ0.11 ÿ0.31 (ÿ0.75, 0.12) ÿ123.96 (ÿ503.55, 255.64)Palencia 34 ÿ0.33 ÿ0.58 ÿ0.42 (ÿ0.78, ÿ0.06) ÿ28.03 (ÿ81.83, 25.76)Las Palmas 35 ÿ0.53 ÿ0.79 ÿ0.01 (ÿ0.18, 0.20) 3.24 (ÿ75.01, 81.49)Pontevedra 36 ÿ0.38 ÿ0.63 ÿ0.25 (ÿ0.55, 0.05) ÿ83.25 (ÿ387.34, 220.83)Salamanca 37 0.14 ÿ0.12 ÿ0.32 (ÿ0.78, 0.13) ÿ42.12 (ÿ141.40, 57.16)Sta. Cruz 38 ÿ0.63 ÿ0.89 ÿ0.22 (ÿ0.44, 0.01) ÿ58.62 (ÿ193.60, 76.36)Cantabria 39 0.04 ÿ0.21 ÿ0.32 (ÿ0.74, 0.10) ÿ61.44 (ÿ191.54, 68.66)Segovia 40 0.31 0.06 ÿ1.07 (ÿ1.74, ÿ0.40) ÿ57.31 (ÿ112.48,ÿ 2.13)Seville 41 ÿ0.80 ÿ1.06 ÿ0.19 (ÿ0.37, 0.00) ÿ114.33 (ÿ260.80, 32.14)Soria 42 0.66 0.40 ÿ0.48 (ÿ1.12, 0.16) ÿ16.33 (ÿ78.88, 46.21)Tarragona 43 0.02 ÿ0.23 ÿ0.27 (ÿ0.67, 0.13) ÿ55.47 (ÿ301.46, 190.53)Teruel 44 0.12 ÿ0.13 0.08 (ÿ0.27, 0.44) 4.40 (ÿ134.87, 143.66)Toledo 45 ÿ0.22 ÿ0.47 ÿ0.25 (ÿ0.60, 0.09) ÿ45.97 (ÿ145.01, 53.08)Valencia 46 ÿ0.19 ÿ0.44 ÿ0.31 (ÿ0.66, 0.05) ÿ238.14 (ÿ717.24, 240.95)Valladolid 47 ÿ0.46 ÿ0.71 0.03 (ÿ0.19, 0.25) 5.47 (ÿ39.16, 50.11)Vizcaya 48 ÿ0.14 ÿ0.40 ÿ0.19 (ÿ0.52, 0.13) ÿ79.70 (ÿ355.73, 196.32)Zamora 49 0.09 ÿ0.17 0.22 (ÿ0.09, 0.54) 17.00 (ÿ149.05, 183.06)Zaragoza 50 ÿ0.12 ÿ0.37 ÿ0.04 (ÿ0.35, 0.27) ÿ12.20 (ÿ339.61, 315.21)Ceuta 51 ÿ0.90 ÿ1.15 ÿ0.23 (ÿ0.40, ÿ0.06) ÿ5.80 (ÿ14.78, 3.18)Melilla 52 ÿ1.01 ÿ1.26 ÿ0.05 (ÿ0.15, 0.06) ÿ1.05 (ÿ4.70, 260)SPAIN ÿ0.30 ÿ0.55 ÿ0.27 (ÿ0.59, 0.05) ÿ3848.12 (ÿ9329.01, 1632.77)
442 J. I. CUADRADO ET AL.
Copyright # 1999 John Wiley & Sons, Ltd. Pharmacoepidemiology and Drug Safety, 8: 433±445 (1999)

use within the context of such subsystems, weestimated that our measurements corresponded toapproximately 85% of LDU from gross sales forthe whole resident Spanish population, and thatthis error might explain variations of up to +10%in comparative crude provincial LDU for 1994.
The comparisons including adjustment for IMR,SRRSS0 and S0RD, are particularly interestingbecause, depending on the model, the e�ect of thisvariable in comparative LDU: (1) might representPD underdiagnosis; (2) should have been removedby adjustment; and (3) might be due to otherfactors. The increasing proportion of underascer-tained PD with age has been con®rmed in recentdoor-to-door investigations.11,13,29 The decreasingSRRSS0 trend in Sweden over the period 1990±1995,a feature concealed by apparently stable LDU asseen from gross sales, would be better explained byfactors, such as changes in the prevalence of LD-responsive disorders, LD policy for PD, or access toLD. A considerable increase (79.07%) in selegilinesales for the period 1990±1995 in Sweden wasobserved (unpublished data), and may haveinduced a levelling-o� in sales of LD. In contrast,the stable, close to unity SRRSS0 values observed forSpain might re¯ect an absence of major LD-policy-related factors as against Sweden. This feature andthe progressive increase in Spanish 1994 RR,SRRS and SRRSS0 values would suggest that,despite the above-mentioned LDUunderestimationin Spain, most di�erences in LDU between thetwo countries are explained by age of thegeneral population, potential age-related PDunderdiagnosis and less dynamic competition withselegiline.
A remarkable ®nding of the study is the low crudeand age-adjusted LDU found in the south andsouth-west respectively, which disappears whenadjusting for IMR, except in the case of Seville,Malaga, Caceres and Melilla. It is suggested thatthis low crude LDU may be related to lowpopulation age in some southern provinces, suchas Cadiz or Almeria, yet it is nevertheless di�cult toexplain for other provinces, such as Malaga andSeville. The fact that such provinces register thelargest and most concentrated populations inSouthern Spain is in line with the low age- andage-and-IMR adjusted LDU systematically foundin urban regions in Denmark18 and Sweden.30 Wesuggest that, rather than drug policy for PDtreatment, it is PD underdiagnosis, re¯ected byhigh IMR values and the considerable impact ofIMR adjustment on relative LDU, that underlies
the low LDU in Badajoz, Huelva and Granada andexplains a considerable proportion of the di�eren-tial LDU shortfall in the south-west.
A 20% increase in SRRSS0 values due to correctedundercounts of LDU would correspond to statisti-cally signi®cant, approximately 93% to 67%higher-than-expected LDU in La Rioja, Navarre,Lugo, Segovia and Corunna. In an internationalcomparison with Swedish 1984 values, thesecorrespond to similar levels in high LDU areassuch as Iceland,19 and are considerably lower thanthose in Greenland and the Faroe Islands.18 Whilesome of the di�erences could be attributed tomethodology, e.g. to the unknown validity of theIMR or to the considerable activity in epidemio-logical PD and LD research conducted inSegovia14,16 and Navarre,13,31 where a PD registerexists, the geographical clustering in the North isinteresting. The rapid LDU increase in the north-west, particularly in Lugo, suggests that it willpersist. The fact that the high LDU in La Rioja in1986 was associated with a cluster of prevalent LDusers in Lower Rioja (Veiga et al., Spanish Epide-miological Society, Annual Meeting, 1991), aregion adjacent to Navarre, suggests that thenorth-central cluster is also a persistent phenom-enon. The comparative provincial LDU levels for1984 and 1994 display similar geographical pat-terns, and their time trends over the 1990±1995period are likewise similar, with the highestincreases for the highest 1984 values. This maysuggest that spatially persistent biological or socialfactors account for di�erences in LDU and for thegeographical patterns.
Particularly high negative S0RD values wereregistered by provinces exhibiting high IMRvalues, such as those corresponding to the above-mentioned clusters of high crude and age- or age-and IMR-adjusted LDU, namely, La Rioja,Navarre, Lugo, Corunna and Orense. Such charac-teristics might be a warning signal of a biased e�ectattributable to IMR-adjustment, thereby indicatingthat: (1) the above-mentioned high SRRSS0 clustersmay result from a combined e�ect of high crudeLDU and the low validity of IMR-adjustment; and(2) caution should be shown in using the S0RDindicator as a criterion for the purpose of selectingregions for priority intervention. The following setof criteria are therefore proposed for the selectionof provinces for studies geared to planning possiblelow-LDU-related intervention:32 (1) low crudeLDU; (2) low LDU when adjusting for age; and(3) medium LDU values on additional adjustment
LEVODOPA USE IN SPAIN 443
Copyright # 1999 John Wiley & Sons, Ltd. Pharmacoepidemiology and Drug Safety, 8: 433±445 (1999)

for IMR. Such criteria would, for instance, be metby Badajoz, Huelva and Granada.
To sum up, this study reveals that LDU in Spainattains medium levels, varies with age, IMR,space and time, and is particularly low in thesouth. Two clusters of moderately high LDU andone of low IMR-related LDU in the south-westwere identi®ed.
ACKNOWLEDGEMENTS
The authors acknowledge the contributions ofAnders Wessling from the Swedish Corporation ofPharmacies, APOTEKSBOLAGET, for data col-lection and comments on Swedish drug sales, andFrancisco Javier Carrillo from the Public HealthSection of the Spanish Ministry of Health at Ceuta,for health care data.
REFERENCES
1. de Pedro-Cuesta, J., Petersen, I. J., Vassilopoulos,D., Micheli, F. and Garcia-Inesta, A. Epidemiologi-cal assessment of levodopa use by populations. ActaNeurol. Scand. 1991; 83: 328±335.
2. Sartor, F. and Walckiers, D. Estimate of diseaseprevalence using drug consumption data. Am.J.Epidemiol. 1995; 141: 782±787.
3. Calne, D. B. Treatment of Parkinson's disease. N.Engl. J. Med. 1993; 329: 1021±1027.
4. Marsden, C. D. Parkinson's disease. J. Neurol.Neurosurg. Psychiatr. 1994; 57: 672±681.
5. Oertel, W. H. and Dodel, R. C. International Guideto drugs for Parkinson's disease. Mov. Disord. 1995;10: 121±131.
6. Weir, R. L. and Fan, K. J. Spinocerebellar degener-ation with parkinsonian features: A clinical andpathological report. Ann. Neurol. 1981; 9: 87±89.
7. Duvoisin, R. C. Diseases of the extrapyramidalsystem. In: Clinical Neurosciences and Neurology.Rosenberg, R. N. (Ed.), Churchill Livingstone,Edinburgh, 1983, pp. 441±472.
8. Duvoisin, R. C., Antunes, J. L. and Yahr, M. D.Response of patients with post-encephalitic parkin-sonism to levodopa. J. Neurol. Neurosurg. Psychiatr.1972; 35: 487±495.
9. Limo n, C., Garcõ a-InÄ esta, A. and Ortega, A.Utilizacio n de levodopa en EspanÄ a en el perõ odo1982±84. Inf. Ter. Segur. Soc. 1985; 9: 202±211.
10. de Pedro-Cuesta Risk factors of Parkinson's disease.In: Epidemiology. Vuylsteek, K. and Hallen, M.(Eds), IOS Press, Amsterdam, 1994, pp. 182±211.
11. Acosta-Varo, J. and de Pedro-Cuesta, J. Prevalencesurvey of movement disorders, epilepsy, hyperten-sion and smoking habit in Vejer de la Frontera,southern Spain-I. Methodology. Parkinsonism Rel.Disord. 1996; 2: 195±203.
12. Acosta, J. Epidemiology of Parkinson's disease:Record of patients in our rural medium: Vejer dela Frontera. 9th Int. Symposium of Parkinson'sdisease. Abstracts Book, Jerusalem, 1988, 57.
13. de Rijk, M. C., Tzourio, C., Breteler, M. M. B. et al.,for The Europarkinson Study Group. Prevalence ofparkinsonism and Parkinson's disease in Europe: theEUROPARKINSON collaborative study. J. Neurol.Neurosurg. Psychiatr. 1997; 67: 10±15.
14. Claveria, L. E., Duarte, A. P. and Sempere, C. et al.Screening Parkinson's disease in the community[abstract]. Mov. Disord. 1997; 12(Suppl. 1): 22.
15. Mutch, W. J., Smith, W. C. and Scott, R. F. Ascreening and alerting questionnaire for parkinson-ism. Neuroepidemiology 1991; 10: 150±156.
16. Duarte, J., ClaverõÂ a, L. E., de Pedro-Cuesta, J.,Sempere, A. P., Coria, F. and Calne, D. B. ScreeningParkinson's disease: a validated questionnaire ofhigh speci®city and sensitivity. Mov. Disord. 1995;10: 643±649.
17. de Pedro-Cuesta, J., Wermuth, L., Abraira, V. andStawiarz, L. Levodopa use in Denmark: high levelsin Greenland and the Faroe Islands. Acta Neurol.Scand. 1995; 91: 89±97.
18. de Pedro-Cuesta, J., Petersen, I. J. and Stawiarz, L.et al., for The Europarkinson Preparatory ActivityResearch Group. High levodopa use in periodicallytime-clustered, Icelandic birth cohorts. A vestige ofparkinsonism etiology? Acta Neurol. Scand. 1995;91: 79±88.
19. de Pedro-Cuesta, J., Gudmundsson, G. and Abraira,V. et al., for The Europarkinson PreparatoryActivity Research Group. Whooping cough andParkinson's disease. Int. J. Epidemiol. 1996; 25:1301±1311.
20. Memoria 1990. Instituto Nacional de la Salud(INSALUD). Madrid, 1991.
21. WHO Collaborating Centre for Drug StatisticsMethodology and Nordic Council on Medicines.Guidelines for DDD. WHO, Oslo, 1991.
22. INE. Movimiento Natural de la PoblacioÂn EspanÄola.Tomo I. Resultados a nivel nacional. AnÄ os 1988,1989, 1990, 1991, 1992, 1993. Madrid.
23. Va zquez-Vizoso, F., Castilla, J., Polla n, M. andLo pez-Abente, G. Assessment of trends in geo-graphical inequalities in infant mortality. Soc. Sci.Med. 1993; 37: 413±417.
KEY POINTS
. Levodopa sales varied in Spain, being low inthe south-west
. Parkinson's disease might be considerablyunderdiagnosed in Spain
444 J. I. CUADRADO ET AL.
Copyright # 1999 John Wiley & Sons, Ltd. Pharmacoepidemiology and Drug Safety, 8: 433±445 (1999)
24. World Health Organization. The Uses of Epidemiol-ogy in the Study of the Elderly. Technical ReportSeries 706. WHO, Geneva, 1984.
25. de Pedro-Cuesta, J. and Stawiarz, L. Evaluation ofhow age modi®es the risk of Parkinson's disease,based on strati®ed comparisons of descriptive data.Acta Neurol. Scand. 1991; 84: 295±302.
26. Ohno, Y., Aoki, K. and Aoki, N. A test of signi®-cance for geographic cluster of diseases. Int. J.Epidemiol. 1979; 8: 273±281.
27. de Pedro, J. and Rosenqvist, U. Tracers for paralysisagitans in epidemiological research. I. Analysis ofSwedish drug-use registers and tracer selection.Neuroepidemiology 1984; 3: 82±96.
28. Tabla Sumario por Clases TerapeÂuticas. (EspanÄ a).IMS, Madrid, 1994.
29. Morgante, L., Rocca, W. A. and Di Rosa, A. E. et al.Prevalence of Parkinson's disease and other types ofparkinsonism: a door-to-door survey in three Sici-lian municipalities. Neurology 1992; 42: 1901±1907.
30. de Pedro, J. Tracers for paralysis agitans inepidemiological research V. Prevalence of the diseasein Swedish counties. Neuroepidemiology 1992; 5:207±219.
31. Arta zcoz Sanz, M. T. and VinÄ es Rueda, J. J.Estimacio n de la prevalencia de la enfermedad deParkinson en Navarra. Estudio farmacoepidemiolo -gico del consumo de antiparkinsonianos. Rev. Esp.Salud PuÂblica 1995; 69: 479±485.
32. Rù, O. C. and Hjort, P. F. Interventional research inprimary health care for the elderly. Scand. J. PrimCare 1985; 3: 133±136.
LEVODOPA USE IN SPAIN 445
Copyright # 1999 John Wiley & Sons, Ltd. Pharmacoepidemiology and Drug Safety, 8: 433±445 (1999)
Copyright © 2022 FDOKUMEN