EPD for StoQuik® Silver Drainscreen™ System - Sto Corp.
92
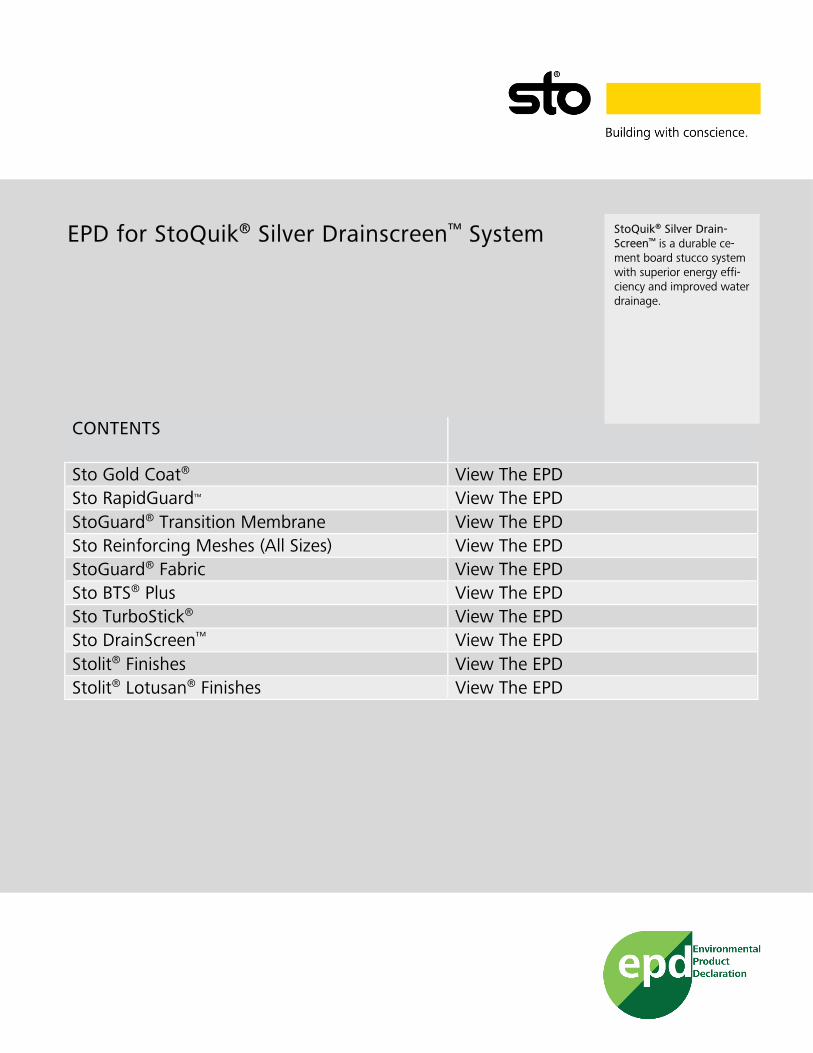
CONTENTS Sto Gold Coat ® View The EPD Sto RapidGuard ™ View The EPD StoGuard ® Transition Membrane View The EPD Sto Reinforcing Meshes (All Sizes) View The EPD StoGuard ® Fabric View The EPD Sto BTS ® Plus View The EPD Sto TurboStick ® View The EPD Sto DrainScreen ™ View The EPD Stolit ® Finishes View The EPD Stolit ® Lotusan ® Finishes View The EPD StoQuik ® Silver Drain- Screen ™ is a durable ce- ment board stucco system with superior energy effi- ciency and improved water drainage. EPD for StoQuik ® Silver Drainscreen ™ System
-
Upload
khangminh22 -
Category
Documents
-
view
0 -
download
0
Transcript of EPD for StoQuik® Silver Drainscreen™ System - Sto Corp.
EPD for Stolit® Lotusan and Stolit® in varied textures
Product Textures: 1.0, 1.0 Dark, 1.5, 1.5 Dark, Freeform, Freeform Dark, R1.5, R1.5 Dark
Stolit® is a ready-mixed premium acrylic based exterior or interior textured wall finish enhanced with advanced polymer technol-ogy, designed for use as a finish coat over prepared vertical con-crete, masonry or plaster sub-strates and in StoTherm® ci wall claddings. Stolit® Lotusan® is a ready-mixed exterior textured finish that mim-ics the self-cleaning capabilities of the lotus leaf. Replicating the lotus plant’s ability to send raindrops rolling gently off its leaves, Stolit® Lotusan® resists dirt pick-up while keeping walls clean and attractive. Stolit® Lotusan® with Lotus-Effect® technology is de-signed for use as a finish coat over prepared vertical concrete, masonry or plaster substrates and in StoTherm® ci Lotusan® wall claddings.
CONTENTS
Sto Gold Coat® View The EPD Sto RapidGuard™ View The EPD StoGuard® Transition Membrane View The EPD Sto Reinforcing Meshes (All Sizes) View The EPD StoGuard® Fabric View The EPD Sto BTS® Plus View The EPD Sto TurboStick® View The EPD Sto DrainScreen™ View The EPD Stolit® Finishes View The EPD Stolit® Lotusan® Finishes View The EPD
StoQuik® Silver Drain-Screen™ is a durable ce-ment board stucco system with superior energy effi-ciency and improved water drainage.
EPD for StoQuik® Silver Drainscreen™ System
EPD for Sto Gold Coat®
Sto Gold Coat® is a code recognized, vapor permeable fluid-applied membrane designed for application under ci wall systems. Sto Gold Coat® is a sheathing treatment which is part of the StoGuard® air barrier and moisture barrier family of products.

2 |
2
PCR Identification
PCR for Architectural Coatings: NAICS 325510 on the basis of ISO 21930:2007, NSF International, 2017. Valid through June 23, 2022
Compliance to ISO 14040/44, ISO 14025 and ISO 21930 Yes
Product Category Exterior Coating
Manufacturer’s name
Sto Corp. 3800 Camp Creek Parkway SW, Building 1400, Suite 120 Atlanta, GA 30331 www.stocorp.com | (800) 221-2397
EPD program operator Epsten Group 101 Marietta St. Suite 2600, Atlanta, GA 30303 www.epstengroup.com
Declaration Number 01-003
Date of Certification December 18th, 2019
Period of Validity 5 years from date of certification
Functional Unit One square meter of covered and protected substrate for 60 years
Market-base life used in assessment 10 Years
Design life used in assessment N/A
Test method employed for determination of design life N/A
Amount of colorant needed See table 3
Overall Data Quality Assessment Score Good
Site(s) in which the results of the LCA are representative STO manufacturing sites in Atlanta, Georgia; Glendale, Arizona; and Rutland, Vermont
Information on where explanatory material can be obtained See references at the end of this document.
LCA Software and Version Number GaBi 9.2.0.58
LCI Database and Version Number GaBi Database Version 8.7, Service Pack 39
This declaration was independently verified in accordance with ISO 14025: 2006 and the reference PCR: PCR for Architectural Coatings: NAICS 325510
Internal External
Kate McFeaters [email protected]
This life cycle assessment was conducted in accordance with ISO 14044 and the reference PCR by:
WAP Sustainability Consulting, LLC
This life cycle assessment was independently verified in accordance with ISO 14040/44 and the reference PCR by:
Kate McFeaters [email protected]
Comparability
In order to support comparative assertions, this EPD meets all comparability requirements stated in ISO 14025:2006. However, dif ferences in certain assumptions, data quality, and variability between LCA data sets may still exist. As such, caution should be exercised when evaluating EPDs from different manufacturers, as the EPD results may not be entirely comparable. Any EPD comparison must be carried out at the building level per ISO 21930 guidelines. The results of this EPD re flect an average performance by the product and its actual impacts may vary on a case-to-case basis.
3 |
3
Company
We believe in ‘Building with conscience’.
That means ensuring that all building products are not only safe, effective and easy to install, but also environmentally responsible and sustainable. We know you’re always looking for the smartest and newest technology to create energy efficient buildings with superior aesthetics.
That’s exactly what our products help you achieve. Products like our wall systems, coatings and finishes are consistent favorites among design professionals, contractors and property owners alike. Whatever your needs or vision may be, we offer products for every type of building project; whether it’s new construction, restoration or panelization, commercial or residential work.
An architect or specifier focuses on aesthetics and feasibility, a contractor needs products that are easy to work with, and a building owner requires high value and low costs on properties. Sto understands these unique needs, and delivers the smart, innovative materials and solutions that make this all possible. That’s why Sto remains the innovative leader in integrated exterior wall systems.
When you combine that commitment to product support and innovation with value-added offerings like consultative design and color services through Sto Studio or training in proper application techniques through the Sto Institute, you get an integrated exterior wall system solution unmatched in the industry.
Manufacturing Sites Covered in this EPD
Atlanta Plant
Glendale Plant
Rutland Plant
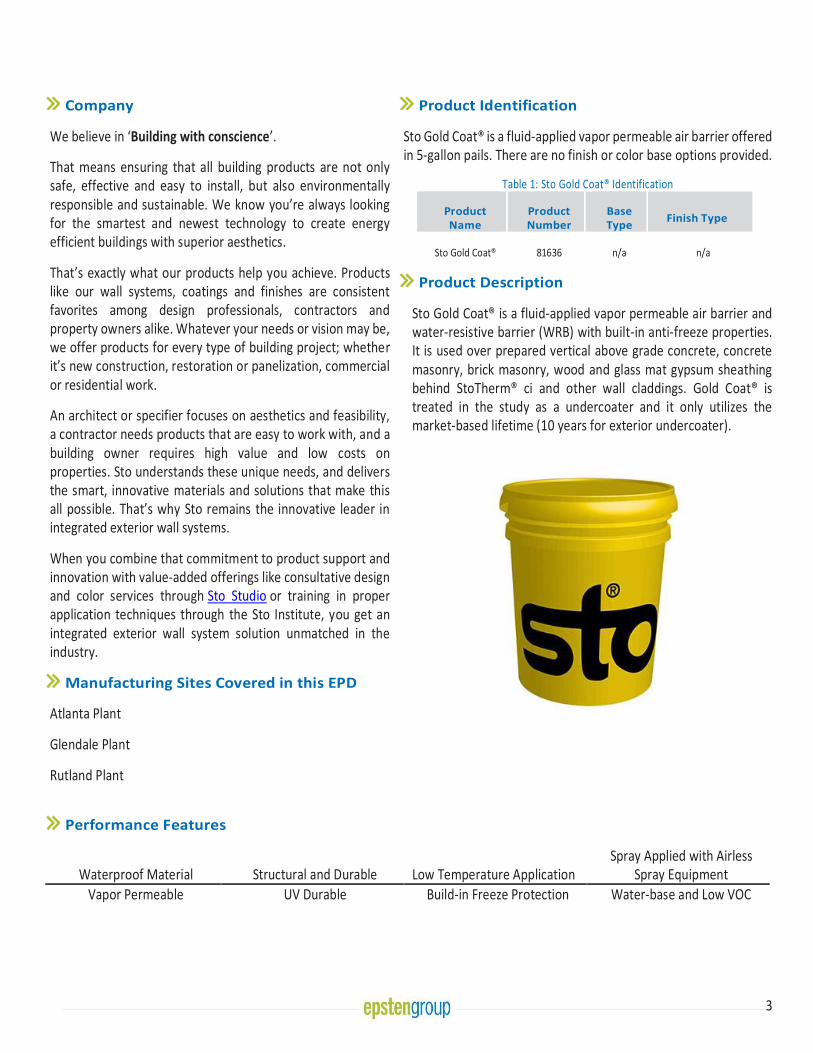
Product Identification
Sto Gold Coat® is a fluid-applied vapor permeable air barrier offered in 5-gallon pails. There are no finish or color base options provided.
Table 1: Sto Gold Coat® Identification
Product Name
Product Number
Base Type
Finish Type
Sto Gold Coat® 81636 n/a n/a
Product Description
Sto Gold Coat® is a fluid-applied vapor permeable air barrier and water-resistive barrier (WRB) with built-in anti-freeze properties. It is used over prepared vertical above grade concrete, concrete masonry, brick masonry, wood and glass mat gypsum sheathing behind StoTherm® ci and other wall claddings. Gold Coat® is treated in the study as a undercoater and it only utilizes the market-based lifetime (10 years for exterior undercoater).
Performance Features
Waterproof Material Structural and Durable Low Temperature Application Spray Applied with Airless
Spray Equipment
Vapor Permeable
UV Durable
Build-in Freeze Protection
Water-base and Low VOC

4 |
4
Material Composition
The material composition of Sto Gold Coat® is listed below:
Table 2: Material composition for Gold Coat®
Ingredient Gold Coat®
Additives 1-2%
Colorant 3-4%
Polymer 25-26%
Silica 41-42%
Silicate 0%
Surfactant 0-1%
Water 25-26%
Components related to Life Cycle Assessment
The functional unit for the LCA study was covering and protecting 1 square meter (m2) of substrate for a period of 60 years—the assumed lifetime of a building. The reference flow required for the functional unit is calculated based on the product lifespan scenarios prescribed in the PCR. The market-based lifetime is 10 years. By default, Gold Coat® has a 5-year warranty. In case it is applied on Sto’s wall systems, the warranty is extended to 10 years. The reference flow required for one functional unit is provided in Table 3.
Table 3: Market-based lifetime and reference flow
Functional
Unit [1 m2]
Reference Flow [kg]
Tint needed
[kg]
Lifespan Market-based Lifetime [10 years]
Gold Coat® over plywood)
1 3.08 N/A
Gold Coat® over CMU
1 8.87 N/A
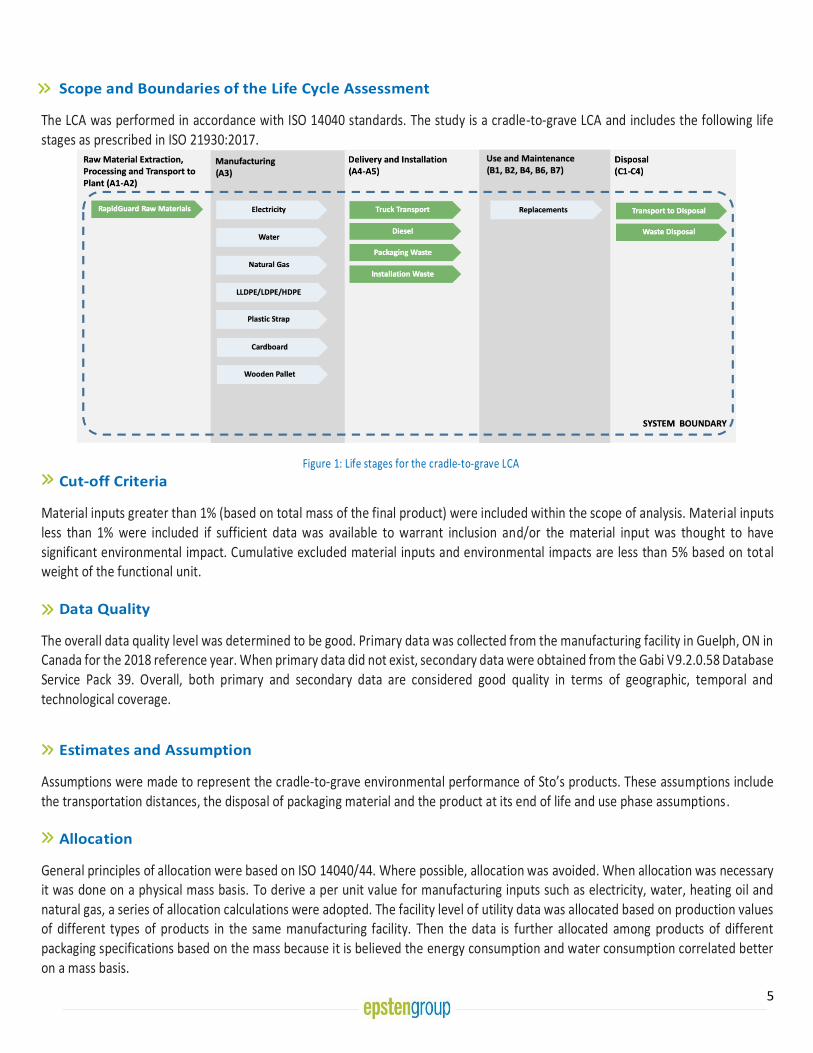
Scope and Boundaries of the Life Cycle Assessment
The LCA was performed in accordance with ISO 14040 standards. The study is a cradle-to-grave LCA and includes the following life stages as prescribed in the PCR.
Figure 1: Life stages for the cradle-to-grave LCA

5 |
5
Cut-off Criteria
Material inputs greater than 1% (based on total mass of the final product) were included within the scope of analysis. Material inputs less than 1% were included if sufficient data was available to warrant inclusion and/or the material input was thought to have significant environmental impact. Cumulative excluded material inputs and environmental impacts are less than 5% based on total weight of the functional unit.
Data Quality
The overall data quality level was determined to be good. Primary data was collected from Sto’s facilities in Atlanta, GA, Glendale, AZ and Rutland, VT for the 2018 reference year. When primary data did not exist, secondary data were obtained from the Gabi V8.7 Database Service Pack 39. Overall, both primary and secondary data are considered good quality in terms of geographic, temporal and technological coverage.
Estimates and Assumption
Assumptions were made to represent the cradle-to-grave environmental performance of Sto’s products. These assumptions were made in accordance with the PCR and include the transportation distances, the disposal of packaging material and the product at its end of life and use phase assumptions.
Allocation
General principles of allocation were based on ISO 14040/44. Where possible, allocation was avoided. When allocation was necessary it was done on a physical mass basis.
Product Stage
Sto Gold Coat is produced at Sto’s Atlanta, GA, Glendale, AZ and Rutland, VT facilities. This stage includes an aggregation of raw material extraction, supplier processing, delivery, manufacturing and packaging by Sto. Sto Gold Coat is supplied in 5-gallon pails.
Design and Construction Stage
The design and construction process stage starts with the packaged product leaving the production site and ends with being delivered to the application site.
During this stage, the finished product is moved from a shipping dock for distribution. The end gate is the application site after the purchaser acquires the finished product and transports it to the application site.
Use and Maintenance Stage
The use stage begins when the user prepares the product before applying it to a substrate and ends with any leftover coating and discarded packaging entering the end-of-life stage. Detailed application instructions are provided online. The application procedure includes mixing and applying. As recommended, an electric drill/mixer and a spray pump are assumed to be used for mixing and application. The equipment is not included in the study as these are multi-use tools and the impacts per declared unit is considered negligible, but electricity to power application tools has been included.
As prescribed in the PCR, 10% of the wet mass of Sto Gold Coat is assumed to be unused and properly disposed of.
End-of-Life Stage
Table 4: End-of-life Disposal Scenarios
In this stage, the disposal of installation waste, packaging waste and product waste at its end of life is included. The disposal pathway of each waste stream is modeled based on the recommendation of PCR and US EPA’s latest waste management fact sheet.
Waste Flow Recyclin
g Incineratio
n Landfillin
g
Paper Packaging 66.6% 6.01% 27.39%
Steel Packaging 33.3% 12.01% 54.69%
Plastic Packaging 9.1% 16.36% 74.54%
Unused Product 0% 0% 100%
Post-Consumer Product
0% 0% 100%
6 |
6
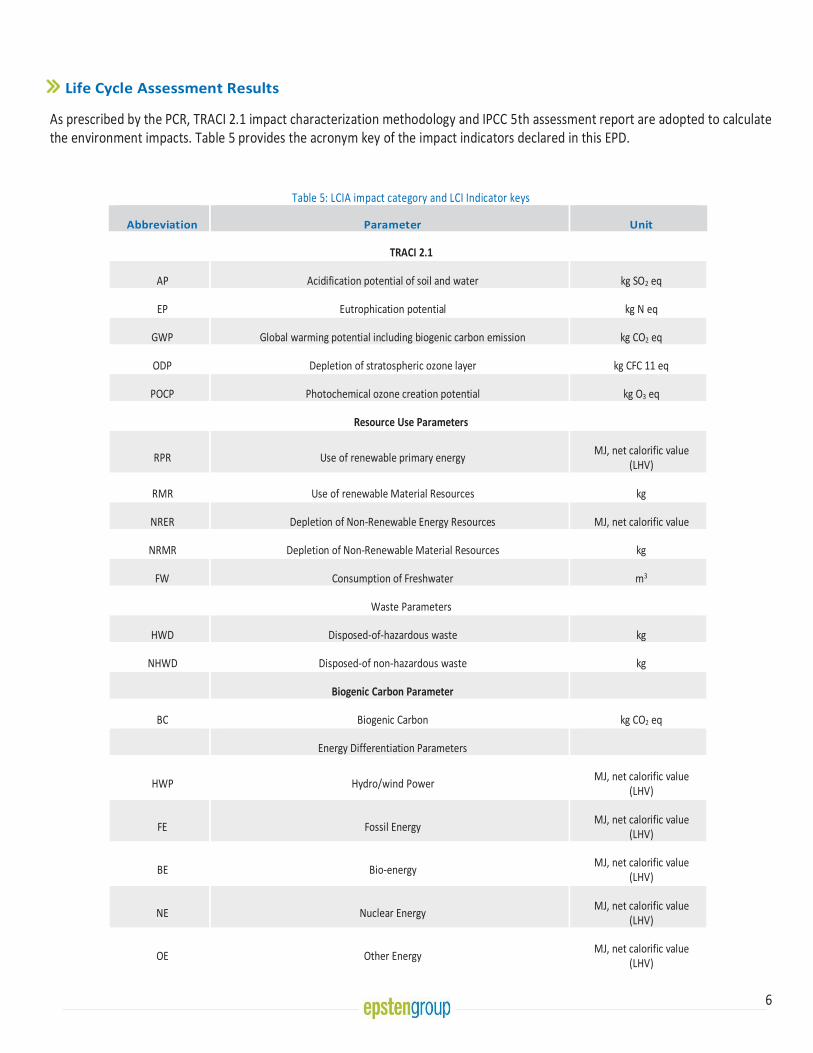
Life Cycle Assessment Results
As prescribed by the PCR, TRACI 2.1 impact characterization methodology and IPCC 5th assessment report are adopted to calculate the environment impacts. Table 5 provides the acronym key of the impact indicators declared in this EPD.
Table 5: LCIA impact category and LCI Indicator keys
Abbreviation Parameter Unit
TRACI 2.1
AP Acidification potential of soil and water kg SO2 eq
EP Eutrophication potential kg N eq
GWP Global warming potential including biogenic carbon emission kg CO2 eq
ODP Depletion of stratospheric ozone layer kg CFC 11 eq
POCP Photochemical ozone creation potential kg O3 eq
Resource Use Parameters
RPR Use of renewable primary energy MJ, net calorific value
(LHV)
RMR Use of renewable Material Resources kg
NRER Depletion of Non-Renewable Energy Resources MJ, net calorific value
NRMR Depletion of Non-Renewable Material Resources kg
FW Consumption of Freshwater m3
Waste Parameters
HWD Disposed-of-hazardous waste kg
NHWD Disposed-of non-hazardous waste kg
Biogenic Carbon Parameter
BC Biogenic Carbon kg CO2 eq
Energy Differentiation Parameters
HWP Hydro/wind Power MJ, net calorific value
(LHV)
FE Fossil Energy MJ, net calorific value
(LHV)
BE Bio-energy MJ, net calorific value
(LHV)
NE Nuclear Energy MJ, net calorific value
(LHV)
OE Other Energy MJ, net calorific value
(LHV)
7 |
7
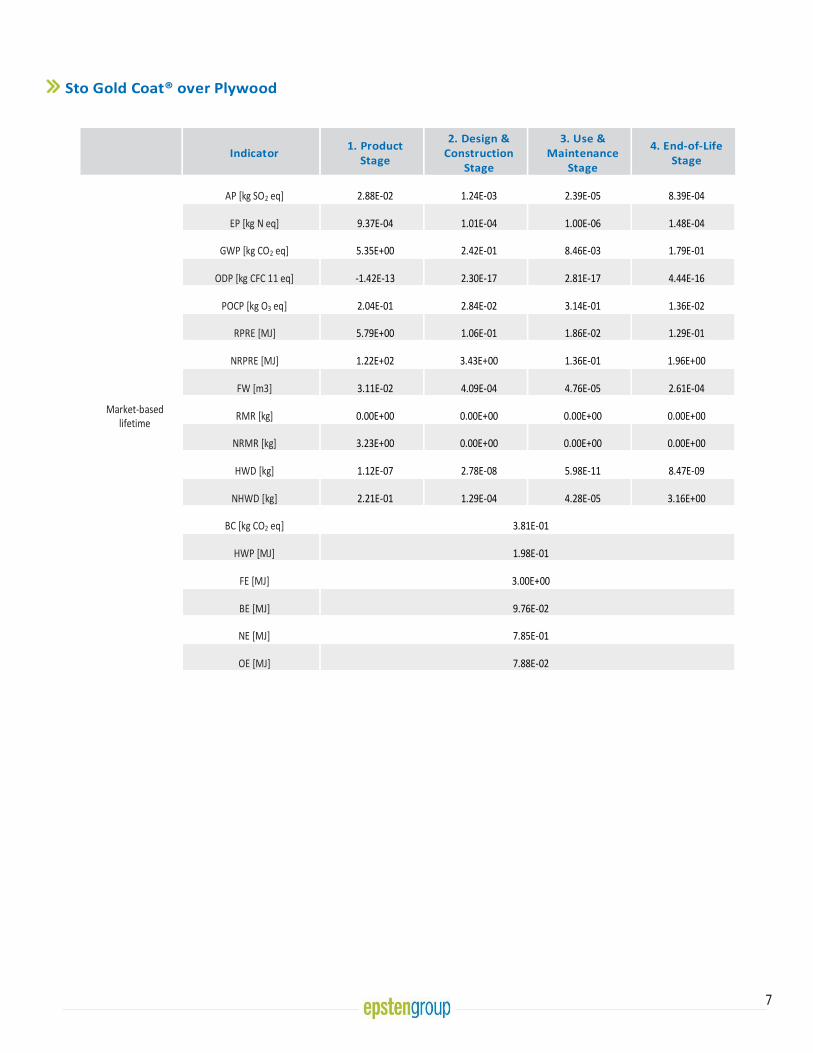
Sto Gold Coat® over Plywood
Indicator 1. Product
Stage
2. Design & Construction
Stage
3. Use & Maintenance
Stage
4. End-of-Life Stage
Market-based lifetime
AP [kg SO2 eq] 2.88E-02 1.24E-03 2.39E-05 8.39E-04
EP [kg N eq] 9.37E-04 1.01E-04 1.00E-06 1.48E-04
GWP [kg CO2 eq] 5.35E+00 2.42E-01 8.46E-03 1.79E-01
ODP [kg CFC 11 eq] -1.42E-13 2.30E-17 2.81E-17 4.44E-16
POCP [kg O3 eq] 2.04E-01 2.84E-02 3.14E-01 1.36E-02
RPRE [MJ] 5.79E+00 1.06E-01 1.86E-02 1.29E-01
NRPRE [MJ] 1.22E+02 3.43E+00 1.36E-01 1.96E+00
FW [m3] 3.11E-02 4.09E-04 4.76E-05 2.61E-04
RMR [kg] 0.00E+00 0.00E+00 0.00E+00 0.00E+00
NRMR [kg] 3.23E+00 0.00E+00 0.00E+00 0.00E+00
HWD [kg] 1.12E-07 2.78E-08 5.98E-11 8.47E-09
NHWD [kg] 2.21E-01 1.29E-04 4.28E-05 3.16E+00
BC [kg CO2 eq] 3.81E-01
HWP [MJ] 1.98E-01
FE [MJ] 3.00E+00
BE [MJ] 9.76E-02
NE [MJ] 7.85E-01
OE [MJ] 7.88E-02
8 |
8
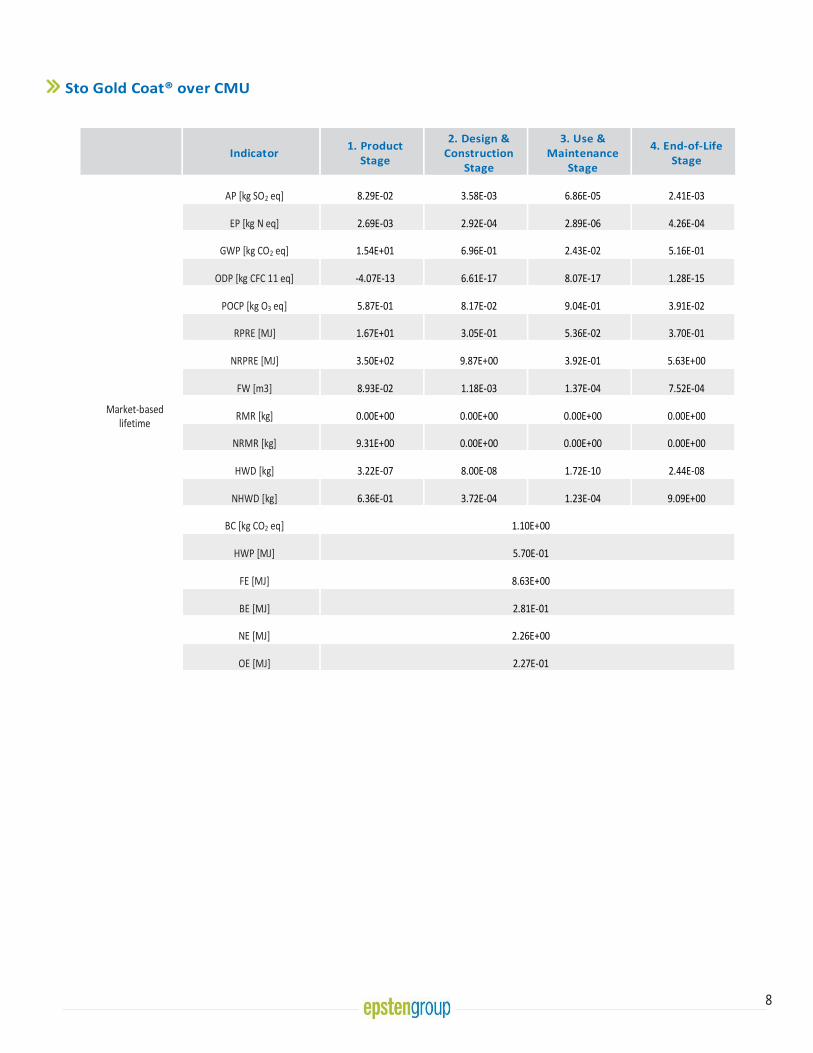
Sto Gold Coat® over CMU
Indicator 1. Product
Stage
2. Design & Construction
Stage
3. Use & Maintenance
Stage
4. End-of-Life Stage
Market-based lifetime
AP [kg SO2 eq] 8.29E-02 3.58E-03 6.86E-05 2.41E-03
EP [kg N eq] 2.69E-03 2.92E-04 2.89E-06 4.26E-04
GWP [kg CO2 eq] 1.54E+01 6.96E-01 2.43E-02 5.16E-01
ODP [kg CFC 11 eq] -4.07E-13 6.61E-17 8.07E-17 1.28E-15
POCP [kg O3 eq] 5.87E-01 8.17E-02 9.04E-01 3.91E-02
RPRE [MJ] 1.67E+01 3.05E-01 5.36E-02 3.70E-01
NRPRE [MJ] 3.50E+02 9.87E+00 3.92E-01 5.63E+00
FW [m3] 8.93E-02 1.18E-03 1.37E-04 7.52E-04
RMR [kg] 0.00E+00 0.00E+00 0.00E+00 0.00E+00
NRMR [kg] 9.31E+00 0.00E+00 0.00E+00 0.00E+00
HWD [kg] 3.22E-07 8.00E-08 1.72E-10 2.44E-08
NHWD [kg] 6.36E-01 3.72E-04 1.23E-04 9.09E+00
BC [kg CO2 eq] 1.10E+00
HWP [MJ] 5.70E-01
FE [MJ] 8.63E+00
BE [MJ] 2.81E-01
NE [MJ] 2.26E+00
OE [MJ] 2.27E-01
9 |
9
Interpretation
Overall, the Product Stage which includes raw material extraction delivery and product manufacturing are the highest contributors to all impact indicators except POCP where the contribution from application phase is more prominent because of VOC emission.
Reference
• Life Cycle Assessment, LCA report for Sto Corp. WAP Sustainability, September 2019
• PCR for Architectural Coatings: NAICS 325510. NSF International, 2017
• ISO14044:2006 Environmental Management–Life cycle assessment–Requirements and Guidelines.
• ISO 14025:2006 Environmental labels and declarations – Type III environmental declarations – Principles and Procedures.
• ISO 21930:2007 Sustainability in buildings and civil engineering works – Core rules for environmental product declarations of construction products and services.
• Advancing Sustainable Materials Management: 2015 Fact Sheet. US EPA. Available at https://www.epa.gov/sites/production/files/2018-07/documents/2015_smm_msw_factsheet_07242018_fnl_508_002.pdf
• Product Bulletin – Sto Gold Coat. Sto Corp. Available at https://www.stocorp.com/wp-content/content/Products_TechService/Air%20Moisture%20Barriers/Product%20Bulletins/PB_81636_Sto_Gold%20Coat_EN.pdf

T
EPD for Sto RapidGuardTM
Sto RapidGuardTM is a single-
component, multi-use air
barrier and waterproofing
material that seals rough
openings, seams, sheathing
joints, cracks, penetrations, and
transitions in above-grade wall
construction.
2
Manufacturer Name
Sto Corp. 3800 Camp Creek Parkway SW, Building 1400, Suite 120, Atlanta, GA 30331 www.stocorp.com | (800) 221-2397
EPD Program Operator Epsten Group 101 Marietta St. Suite 2600, Atlanta, GA 30303 www.epstengroup.com
Compliance to ISO21930:2017 Yes
Product Name Sto RapidGuardTM Product’s Intended Application and Use Air Barrier and Waterproofing Membrane
Declaration Number 01-006
Date of Certification December 18th, 2019
Period of Validity 5 years from date of certification
Functional Unit One square meter of covered substrate for 60 years Reference Service Life used in assessment 10 Years
Overall Data Quality Assessment Score Good
Manufacturing Location Facility in Guelph, ON, Canada
LCA Software and Version Number GaBi 9.2.0.58
LCI Database and Version Number GaBi Database, Service Pack 39
ISO 21930: 2017 serves as the core PCR Independent verification of the declaration and data, according to ISO 21930:2017 and ISO 14025:2006
Internal External
Kate McFeaters [email protected]
This life cycle assessment was conducted in accordance with ISO 14044 and the reference PCR by:
WAP Sustainability Consulting, LLC
This life cycle assessment was independently verified in accordance with ISO 14044 and the reference PCR by:
Kate McFeaters [email protected]
Comparability
In order to support comparative assertions, this EPD meets all comparability requirements stated in ISO 14025:2006. However, differences in certain assumptions, data quality, and variability between LCA data sets may still exist. As such, caution should be exercised when evaluating EPDs from different m anufacturers, as the EPD results may not be entirely comparable. Any EPD comparison must be carried out at the building level per ISO 21930 guidelines. The results of this EPD re flect an average performance by the product and its actual impacts may vary on a case-to-case basis.

3
Company
We believe in ‘Building with conscience’.
That means ensuring that all building products are not only safe, effective and easy to install, but also environmentally responsible and sustainable. We know you’re always looking for the smartest and newest technology to create energy efficient buildings with superior aesthetics.
That’s exactly what our products help you achieve. Products like our wall systems, coatings and finishes are consistent favorites among design professionals, contractors and property owners alike. Whatever your needs or vision may be, we offer products for every type of building project; whether it’s new construction, restoration or panelization, commercial or residential work.
An architect or specifier focuses on aesthetics and feasibility, a contractor needs products that are easy to work with, and a building owner requires high value and low costs on properties. Sto understands these unique needs, and delivers the smart, innovative materials and solutions that make this all possible. That’s why Sto remains the innovative leader in integrated exterior wall systems.
When you combine that commitment to product support and innovation with value-added offerings like consultative design and color services through Sto Studio or training in proper application techniques through the Sto Institute, you get an integrated exterior wall system solution unmatched in the industry.
Manufacturing Sites Covered in this EPD
Manufacturing location is Guelph, ON, Canada
Product Identification
RapidGuardTM is offered in two packaging options. Table 1 lists the products declared in this EPD.
Table 1: List of RapidGuardTM Products
Product Name Product Number
Sto RapidGuardTM Cartridge 81571-740
Sto RapidGuardTM Sausage 81571-741
Product Description
Sto RapidGuardTM is a single-component, multi-use air barrier and waterproofing material that seals rough openings, seams, sheathing joints, cracks, penetrations, and transitions in above-grade wall construction.
Performance Features
Waterproof Material No mesh/fabric/tapes needed at rough
openings and sheathing joints Cures in wet weather and on damp
substrates
Vapor Permeable
Fast Cure Gun Applied
4
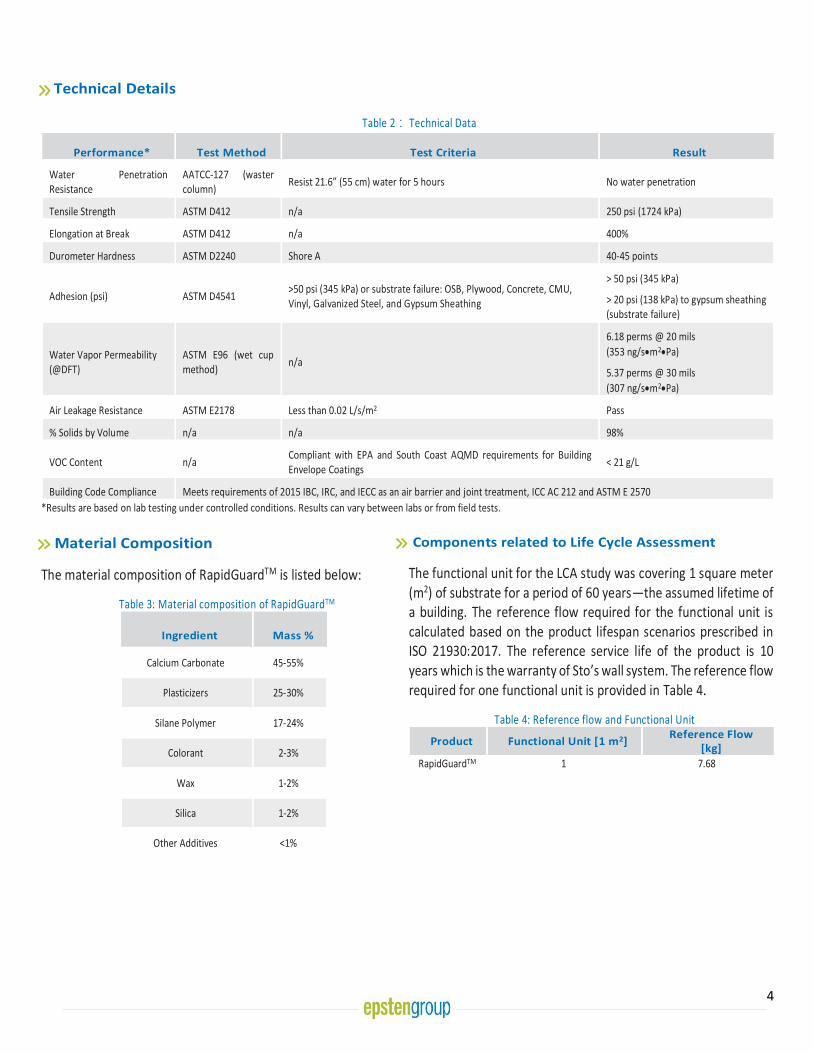
Technical Details
Table 2: Technical Data
Performance* Test Method Test Criteria Result
Water Penetration Resistance
AATCC-127 (waster column)
Resist 21.6” (55 cm) water for 5 hours No water penetration
Tensile Strength ASTM D412 n/a 250 psi (1724 kPa)
Elongation at Break ASTM D412 n/a 400%
Durometer Hardness ASTM D2240 Shore A 40-45 points
Adhesion (psi) ASTM D4541 >50 psi (345 kPa) or substrate failure: OSB, Plywood, Concrete, CMU, Vinyl, Galvanized Steel, and Gypsum Sheathing
> 50 psi (345 kPa)
> 20 psi (138 kPa) to gypsum sheathing (substrate failure)
Water Vapor Permeability (@DFT)
ASTM E96 (wet cup method)
n/a
6.18 perms @ 20 mils
(353 ng/s•m2•Pa)
5.37 perms @ 30 mils
(307 ng/s•m2•Pa)
Air Leakage Resistance ASTM E2178 Less than 0.02 L/s/m2 Pass
% Solids by Volume n/a n/a 98%
VOC Content n/a Compliant with EPA and South Coast AQMD requirements for Building Envelope Coatings
< 21 g/L
Building Code Compliance Meets requirements of 2015 IBC, IRC, and IECC as an air barrier and joint treatment, ICC AC 212 and ASTM E 2570
*Results are based on lab testing under controlled conditions. Results can vary between labs or from field tests.
Material Composition
The material composition of RapidGuardTM is listed below:
Table 3: Material composition of RapidGuardTM
Ingredient Mass %
Calcium Carbonate 45-55%
Plasticizers 25-30%
Silane Polymer 17-24%
Colorant 2-3%
Wax 1-2%
Silica 1-2%
Other Additives <1%
Components related to Life Cycle Assessment
The functional unit for the LCA study was covering 1 square meter (m2) of substrate for a period of 60 years—the assumed lifetime of a building. The reference flow required for the functional unit is calculated based on the product lifespan scenarios prescribed in ISO 21930:2017. The reference service life of the product is 10 years which is the warranty of Sto’s wall system. The reference flow required for one functional unit is provided in Table 4.
Table 4: Reference flow and Functional Unit
Product Functional Unit [1 m2] Reference Flow
[kg]
RapidGuardTM 1 7.68
5
Scope and Boundaries of the Life Cycle Assessment
The LCA was performed in accordance with ISO 14040 standards. The study is a cradle-to-grave LCA and includes the following life stages as prescribed in ISO 21930:2017.
Figure 1: Life stages for the cradle-to-grave LCA
Cut-off Criteria
Material inputs greater than 1% (based on total mass of the final product) were included within the scope of analysis. Material inputs less than 1% were included if sufficient data was available to warrant inclusion and/or the material input was thought to have significant environmental impact. Cumulative excluded material inputs and environmental impacts are less than 5% based on total weight of the functional unit.
Data Quality
The overall data quality level was determined to be good. Primary data was collected from the manufacturing facility in Guelph, ON in Canada for the 2018 reference year. When primary data did not exist, secondary data were obtained from the Gabi V9.2.0.58 Database Service Pack 39. Overall, both primary and secondary data are considered good quality in terms of geographic, temporal and technological coverage.
Estimates and Assumption
Assumptions were made to represent the cradle-to-grave environmental performance of Sto’s products. These assumptions include the transportation distances, the disposal of packaging material and the product at its end of life and use phase assumptions.
Allocation
General principles of allocation were based on ISO 14040/44. Where possible, allocation was avoided. When allocation was necessary it was done on a physical mass basis. To derive a per unit value for manufacturing inputs such as electricity, water, heating oil and natural gas, a series of allocation calculations were adopted. The facility level of utility data was allocated based on production values of different types of products in the same manufacturing facility. Then the data is further allocated among products of different packaging specifications based on the mass because it is believed the energy consumption and water consumption correlated better on a mass basis.
6
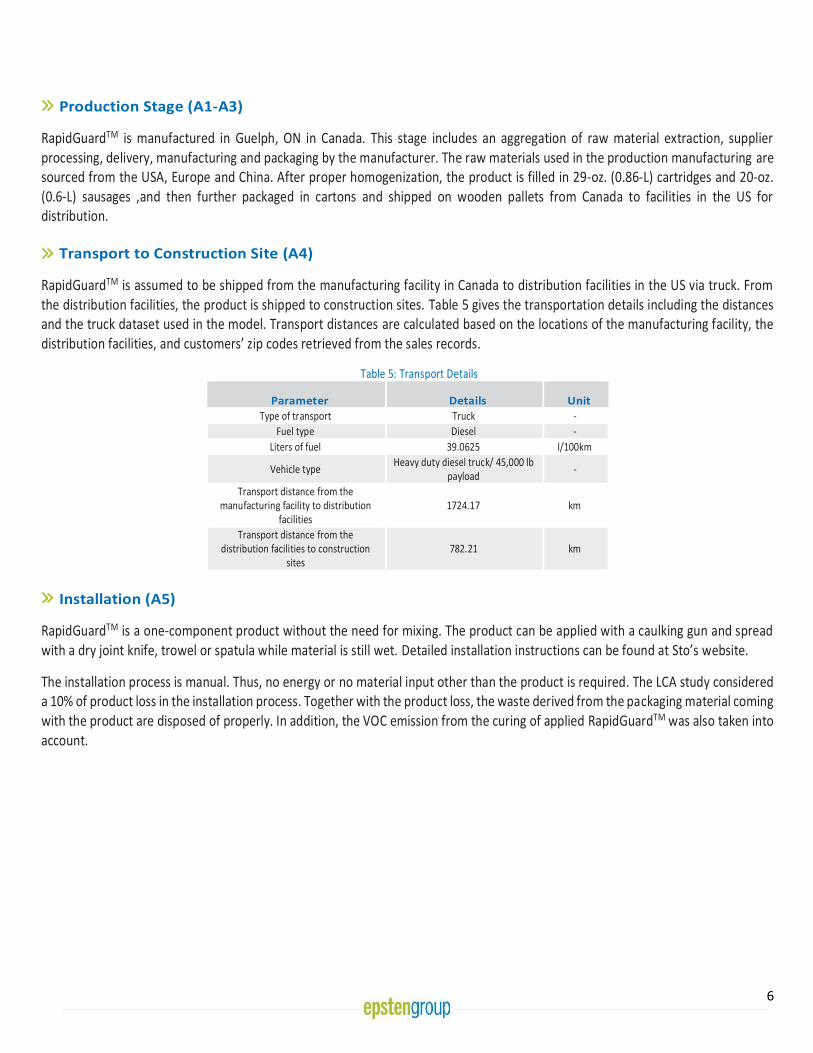
Production Stage (A1-A3)
RapidGuardTM is manufactured in Guelph, ON in Canada. This stage includes an aggregation of raw material extraction, supplier processing, delivery, manufacturing and packaging by the manufacturer. The raw materials used in the production manufacturing are sourced from the USA, Europe and China. After proper homogenization, the product is filled in 29-oz. (0.86-L) cartridges and 20-oz. (0.6-L) sausages ,and then further packaged in cartons and shipped on wooden pallets from Canada to facilities in the US for distribution.
Transport to Construction Site (A4)
RapidGuardTM is assumed to be shipped from the manufacturing facility in Canada to distribution facilities in the US via truck. From the distribution facilities, the product is shipped to construction sites. Table 5 gives the transportation details including the distances and the truck dataset used in the model. Transport distances are calculated based on the locations of the manufacturing facility, the distribution facilities, and customers’ zip codes retrieved from the sales records.
Table 5: Transport Details
Parameter Details Unit
Type of transport Truck -
Fuel type Diesel -
Liters of fuel 39.0625 l/100km
Vehicle type Heavy duty diesel truck/ 45,000 lb
payload -
Transport distance from the manufacturing facility to distribution
facilities 1724.17 km
Transport distance from the distribution facilities to construction
sites 782.21 km
Installation (A5)
RapidGuardTM is a one-component product without the need for mixing. The product can be applied with a caulking gun and spread with a dry joint knife, trowel or spatula while material is still wet. Detailed installation instructions can be found at Sto’s website.
The installation process is manual. Thus, no energy or no material input other than the product is required. The LCA study considered a 10% of product loss in the installation process. Together with the product loss, the waste derived from the packaging material coming with the product are disposed of properly. In addition, the VOC emission from the curing of applied RapidGuardTM was also taken into account.
7
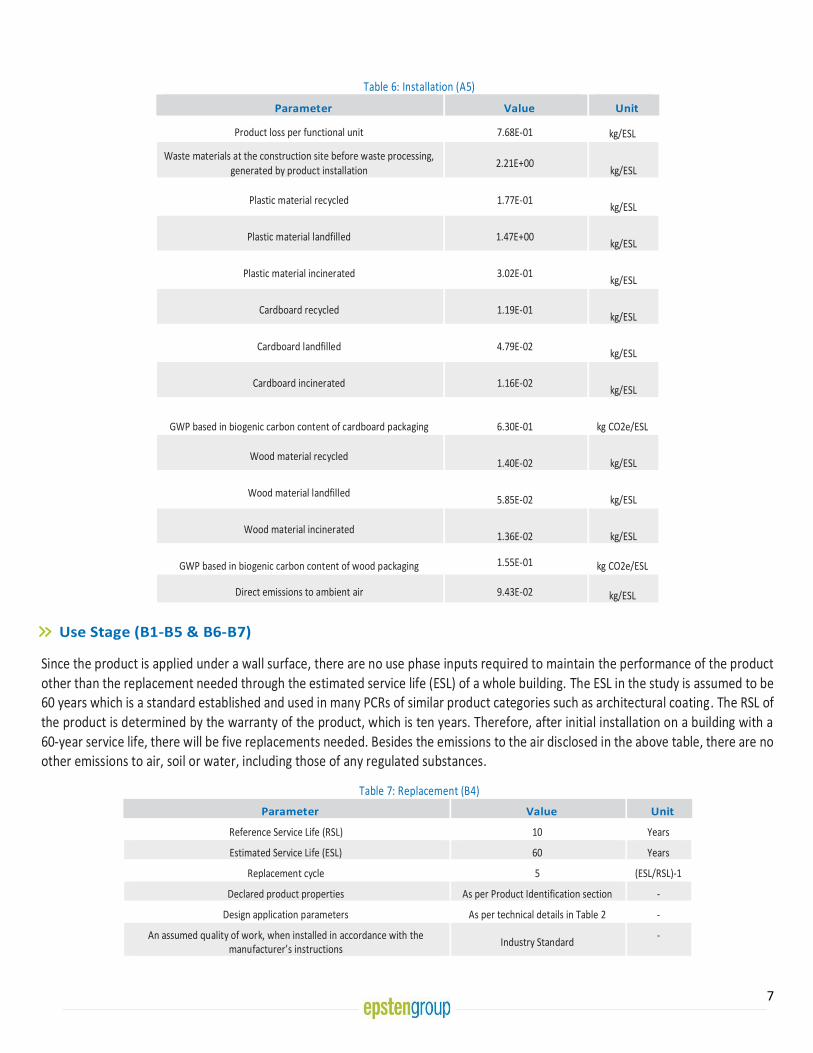
Table 6: Installation (A5)
Parameter Value Unit
Product loss per functional unit 7.68E-01 kg/ESL
Waste materials at the construction site before waste processing, generated by product installation
2.21E+00 kg/ESL
Plastic material recycled 1.77E-01 kg/ESL
Plastic material landfilled 1.47E+00 kg/ESL
Plastic material incinerated 3.02E-01 kg/ESL
Cardboard recycled 1.19E-01 kg/ESL
Cardboard landfilled 4.79E-02 kg/ESL
Cardboard incinerated 1.16E-02 kg/ESL
GWP based in biogenic carbon content of cardboard packaging 6.30E-01 kg CO2e/ESL
Wood material recycled 1.40E-02 kg/ESL
Wood material landfilled 5.85E-02 kg/ESL
Wood material incinerated 1.36E-02 kg/ESL
GWP based in biogenic carbon content of wood packaging 1.55E-01 kg CO2e/ESL
Direct emissions to ambient air 9.43E-02 kg/ESL
Use Stage (B1-B5 & B6-B7)
Since the product is applied under a wall surface, there are no use phase inputs required to maintain the performance of the product other than the replacement needed through the estimated service life (ESL) of a whole building. The ESL in the study is assumed to be 60 years which is a standard established and used in many PCRs of similar product categories such as architectural coating. The RSL of the product is determined by the warranty of the product, which is ten years. Therefore, after initial installation on a building with a 60-year service life, there will be five replacements needed. Besides the emissions to the air disclosed in the above table, there are no other emissions to air, soil or water, including those of any regulated substances.
Table 7: Replacement (B4)
Parameter Value Unit
Reference Service Life (RSL) 10 Years
Estimated Service Life (ESL) 60 Years
Replacement cycle 5 (ESL/RSL)-1
Declared product properties As per Product Identification section -
Design application parameters As per technical details in Table 2 -
An assumed quality of work, when installed in accordance with the manufacturer’s instructions
Industry Standard -

8
End-of-Life Stage (C1-C4)
In this stage, the product at its end of life is transported to the waste disposal facility and processed. Included in this stage are the following:
• Deconstruction – There are no impacts during this stage as the product is manually removed.
• Transportation to disposal – Estimated fuel requirements made based on weight of product and average distance to landfill.
• Waste processing for landfilling — This process is included in the landfilling process.
• Waste disposal — Due to the fact that all the products in study are installed as part of a wall system including the external coating/finish, and are not able to be dismantled based on their material type, it is reasonable to assume that the products at their end-of-life stage are landfilled.
Table 8: End-of-Life Parameters RapidGuardTM Unit
Collected with mixed construction waste
6.82 kg/ESL
Landfilling 100 %
Product for final deposition 6.82 kg/ESL
9
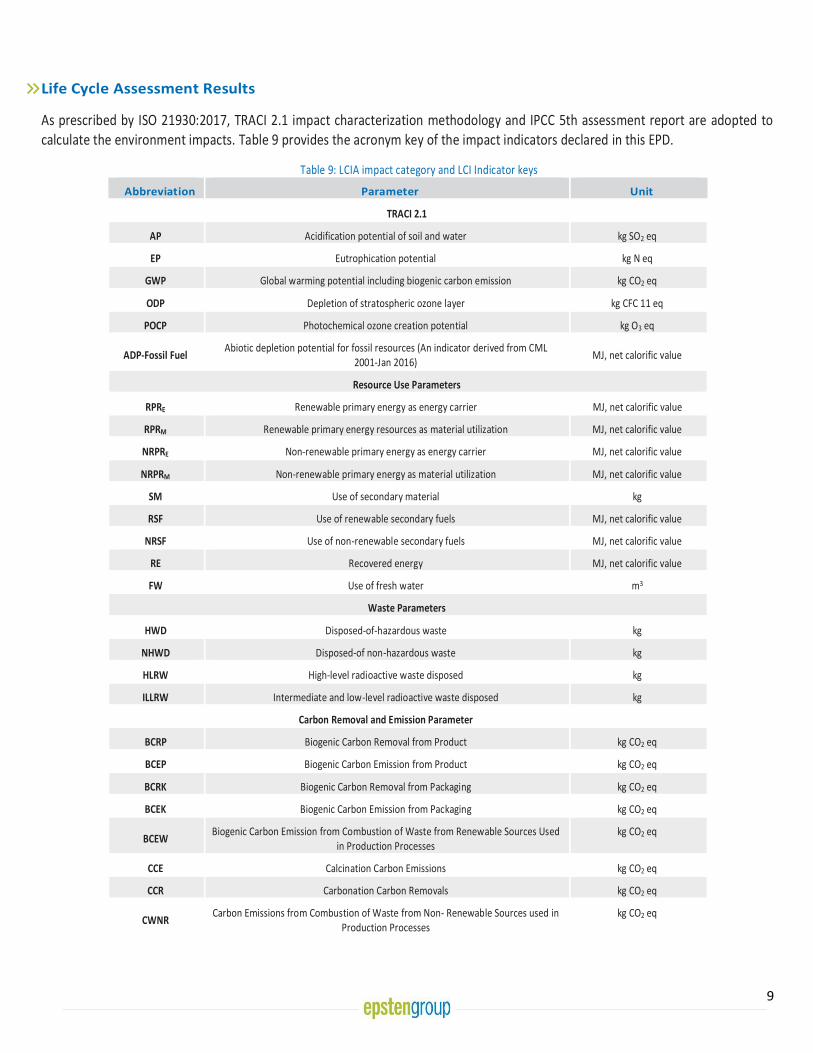
Life Cycle Assessment Results
As prescribed by ISO 21930:2017, TRACI 2.1 impact characterization methodology and IPCC 5th assessment report are adopted to calculate the environment impacts. Table 9 provides the acronym key of the impact indicators declared in this EPD.
Table 9: LCIA impact category and LCI Indicator keys
Abbreviation Parameter Unit
TRACI 2.1
AP Acidification potential of soil and water kg SO2 eq
EP Eutrophication potential kg N eq
GWP Global warming potential including biogenic carbon emission kg CO2 eq
ODP Depletion of stratospheric ozone layer kg CFC 11 eq
POCP Photochemical ozone creation potential kg O3 eq
ADP-Fossil Fuel Abiotic depletion potential for fossil resources (An indicator derived from CML
2001-Jan 2016) MJ, net calorific value
Resource Use Parameters
RPRE Renewable primary energy as energy carrier MJ, net calorific value
RPRM Renewable primary energy resources as material utilization MJ, net calorific value
NRPRE Non-renewable primary energy as energy carrier MJ, net calorific value
NRPRM Non-renewable primary energy as material utilization MJ, net calorific value
SM Use of secondary material kg
RSF Use of renewable secondary fuels MJ, net calorific value
NRSF Use of non-renewable secondary fuels MJ, net calorific value
RE Recovered energy MJ, net calorific value
FW Use of fresh water m3
Waste Parameters
HWD Disposed-of-hazardous waste kg
NHWD Disposed-of non-hazardous waste kg
HLRW High-level radioactive waste disposed kg
ILLRW Intermediate and low-level radioactive waste disposed kg
Carbon Removal and Emission Parameter
BCRP Biogenic Carbon Removal from Product kg CO2 eq
BCEP Biogenic Carbon Emission from Product kg CO2 eq
BCRK Biogenic Carbon Removal from Packaging kg CO2 eq
BCEK Biogenic Carbon Emission from Packaging kg CO2 eq
BCEW Biogenic Carbon Emission from Combustion of Waste from Renewable Sources Used
in Production Processes kg CO2 eq
CCE Calcination Carbon Emissions kg CO2 eq
CCR Carbonation Carbon Removals kg CO2 eq
CWNR Carbon Emissions from Combustion of Waste from Non- Renewable Sources used in
Production Processes kg CO2 eq
10
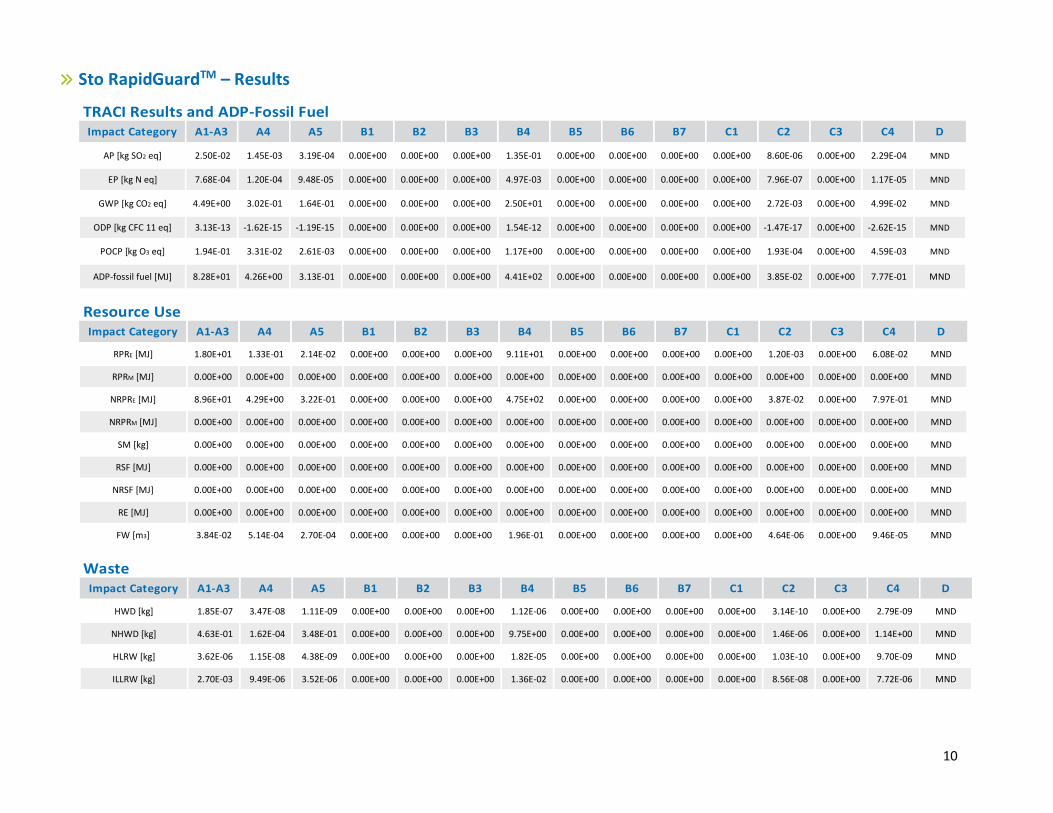
Sto RapidGuardTM – Results
TRACI Results and ADP-Fossil Fuel Impact Category A1-A3 A4 A5 B1 B2 B3 B4 B5 B6 B7 C1 C2 C3 C4 D
AP [kg SO2 eq] 2.50E-02 1.45E-03 3.19E-04 0.00E+00 0.00E+00 0.00E+00 1.35E-01 0.00E+00 0.00E+00 0.00E+00 0.00E+00 8.60E-06 0.00E+00 2.29E-04 MND
EP [kg N eq] 7.68E-04 1.20E-04 9.48E-05 0.00E+00 0.00E+00 0.00E+00 4.97E-03 0.00E+00 0.00E+00 0.00E+00 0.00E+00 7.96E-07 0.00E+00 1.17E-05 MND
GWP [kg CO2 eq] 4.49E+00 3.02E-01 1.64E-01 0.00E+00 0.00E+00 0.00E+00 2.50E+01 0.00E+00 0.00E+00 0.00E+00 0.00E+00 2.72E-03 0.00E+00 4.99E-02 MND
ODP [kg CFC 11 eq] 3.13E-13 -1.62E-15 -1.19E-15 0.00E+00 0.00E+00 0.00E+00 1.54E-12 0.00E+00 0.00E+00 0.00E+00 0.00E+00 -1.47E-17 0.00E+00 -2.62E-15 MND
POCP [kg O3 eq] 1.94E-01 3.31E-02 2.61E-03 0.00E+00 0.00E+00 0.00E+00 1.17E+00 0.00E+00 0.00E+00 0.00E+00 0.00E+00 1.93E-04 0.00E+00 4.59E-03 MND
ADP-fossil fuel [MJ] 8.28E+01 4.26E+00 3.13E-01 0.00E+00 0.00E+00 0.00E+00 4.41E+02 0.00E+00 0.00E+00 0.00E+00 0.00E+00 3.85E-02 0.00E+00 7.77E-01 MND
Resource Use Impact Category A1-A3 A4 A5 B1 B2 B3 B4 B5 B6 B7 C1 C2 C3 C4 D
RPRE [MJ] 1.80E+01 1.33E-01 2.14E-02 0.00E+00 0.00E+00 0.00E+00 9.11E+01 0.00E+00 0.00E+00 0.00E+00 0.00E+00 1.20E-03 0.00E+00 6.08E-02 MND
RPRM [MJ] 0.00E+00 0.00E+00 0.00E+00 0.00E+00 0.00E+00 0.00E+00 0.00E+00 0.00E+00 0.00E+00 0.00E+00 0.00E+00 0.00E+00 0.00E+00 0.00E+00 MND
NRPRE [MJ] 8.96E+01 4.29E+00 3.22E-01 0.00E+00 0.00E+00 0.00E+00 4.75E+02 0.00E+00 0.00E+00 0.00E+00 0.00E+00 3.87E-02 0.00E+00 7.97E-01 MND
NRPRM [MJ] 0.00E+00 0.00E+00 0.00E+00 0.00E+00 0.00E+00 0.00E+00 0.00E+00 0.00E+00 0.00E+00 0.00E+00 0.00E+00 0.00E+00 0.00E+00 0.00E+00 MND
SM [kg] 0.00E+00 0.00E+00 0.00E+00 0.00E+00 0.00E+00 0.00E+00 0.00E+00 0.00E+00 0.00E+00 0.00E+00 0.00E+00 0.00E+00 0.00E+00 0.00E+00 MND
RSF [MJ] 0.00E+00 0.00E+00 0.00E+00 0.00E+00 0.00E+00 0.00E+00 0.00E+00 0.00E+00 0.00E+00 0.00E+00 0.00E+00 0.00E+00 0.00E+00 0.00E+00 MND
NRSF [MJ] 0.00E+00 0.00E+00 0.00E+00 0.00E+00 0.00E+00 0.00E+00 0.00E+00 0.00E+00 0.00E+00 0.00E+00 0.00E+00 0.00E+00 0.00E+00 0.00E+00 MND
RE [MJ] 0.00E+00 0.00E+00 0.00E+00 0.00E+00 0.00E+00 0.00E+00 0.00E+00 0.00E+00 0.00E+00 0.00E+00 0.00E+00 0.00E+00 0.00E+00 0.00E+00 MND
FW [m3] 3.84E-02 5.14E-04 2.70E-04 0.00E+00 0.00E+00 0.00E+00 1.96E-01 0.00E+00 0.00E+00 0.00E+00 0.00E+00 4.64E-06 0.00E+00 9.46E-05 MND
Waste Impact Category A1-A3 A4 A5 B1 B2 B3 B4 B5 B6 B7 C1 C2 C3 C4 D
HWD [kg] 1.85E-07 3.47E-08 1.11E-09 0.00E+00 0.00E+00 0.00E+00 1.12E-06 0.00E+00 0.00E+00 0.00E+00 0.00E+00 3.14E-10 0.00E+00 2.79E-09 MND
NHWD [kg] 4.63E-01 1.62E-04 3.48E-01 0.00E+00 0.00E+00 0.00E+00 9.75E+00 0.00E+00 0.00E+00 0.00E+00 0.00E+00 1.46E-06 0.00E+00 1.14E+00 MND
HLRW [kg] 3.62E-06 1.15E-08 4.38E-09 0.00E+00 0.00E+00 0.00E+00 1.82E-05 0.00E+00 0.00E+00 0.00E+00 0.00E+00 1.03E-10 0.00E+00 9.70E-09 MND
ILLRW [kg] 2.70E-03 9.49E-06 3.52E-06 0.00E+00 0.00E+00 0.00E+00 1.36E-02 0.00E+00 0.00E+00 0.00E+00 0.00E+00 8.56E-08 0.00E+00 7.72E-06 MND
11
Carbon Removal and Emission Indicator RapidGuardTM
BCRP [kg CO2 eq] 7.80E-01
BCEP [kg CO2 eq] 7.85E-01
BCRK [kg CO2 eq] 1.36E-01
BCEK [kg CO2 eq] 6.26E-02
BCEW [kg CO2 eq] 0.00E+00
CCE [kg CO2 eq] 0.00E+00
CCR [kg CO2 eq] 0.00E+00
CWNR [kg CO2 eq] 0.00E+00
Interpretation
In one reference service life of the product, the production stage, which includes raw material extraction, transportation from suppliers and manufacturing, is the highest contributor to all impact indicators. The impact from the remaining stages is negligible. From the perspective of a whole building lifespan, the vast majority of the impacts are derived from the number of replacements needed. This is directly related to the impacts associated with the manufacture of new products that are used to replace the original. Improving the relatively short lifespan of the product is essential to reducing the overall impact of the product.
Reference
• Life Cycle Assessment, LCA report for Sto Corp. WAP Sustainability, October 2019
• ISO14044:2006 Environmental Management–Life cycle assessment–Requirements and Guidelines.
• ISO 14025:2006 Environmental labels and declarations – Type III environmental declarations – Principles and Procedures.
• ISO 21930:2007 Sustainability in buildings and civil engineering works – Core rules for environmental product declarations of construction products and services.
• Sto Studio. Sto Corp, 2019. Available at https://www.stocorp.com/sto-studio-us/
• Installation Guide, Sto RapidGuard. Sto Corp. Available at https://www.stocorp.com/wp-content/content/Systems_TechService/Air%20and%20Moisture%20Barriers/Installation%20and%20Repair/IG_Sto%20RapidGuard%20Installation%20Guide(HiRes).pdf
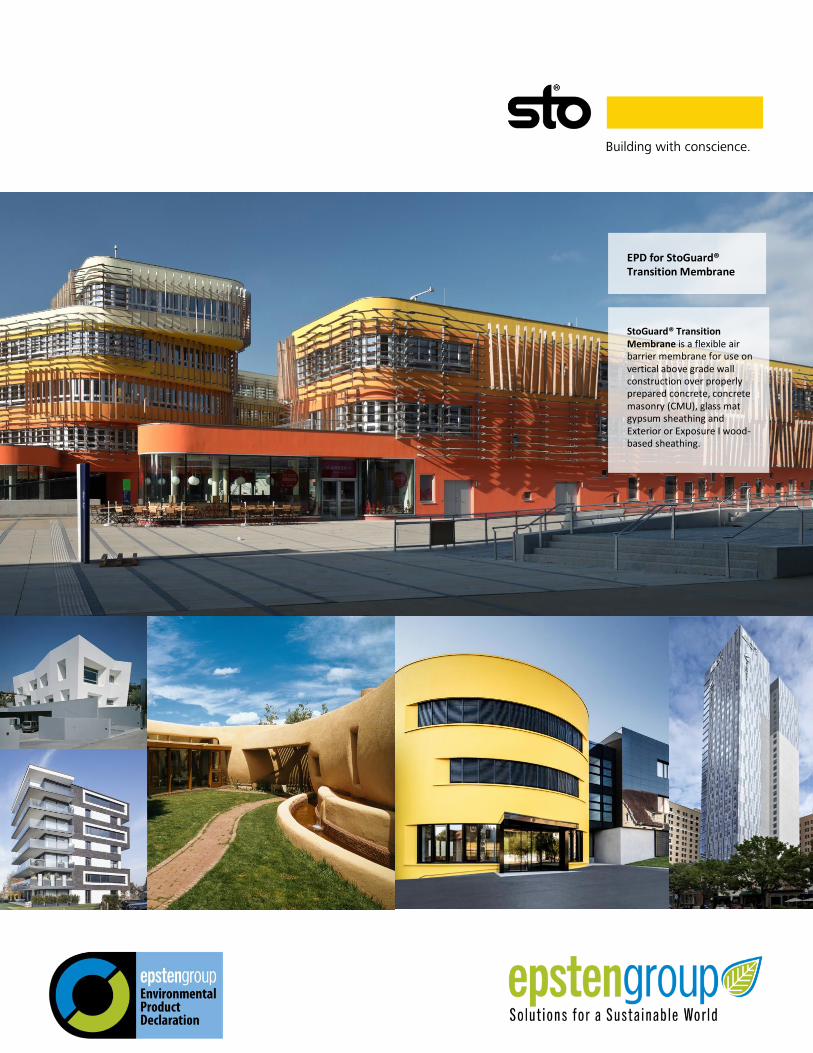
EPD for StoGuard® Transition Membrane
StoGuard® Transition Membrane is a flexible air barrier membrane for use on vertical above grade wall construction over properly prepared concrete, concrete masonry (CMU), glass mat gypsum sheathing and Exterior or Exposure I wood-based sheathing.

2 |
2
Manufacturer Name
Sto Corp. 3800 Camp Creek Parkway SW, Building 1400, Suite 120, Atlanta, GA 30331 www.stocorp.com | (800) 221-2397
EPD Program Operator Epsten Group 101 Marietta St. Suite 2600, Atlanta, GA 30303 www.epstengroup.com
Compliance to ISO21930:2017 Yes Product Name StoGuard® Transition Membrane
Product’s Intended Application and Use Flexible air barrier membrane
Declaration Number 01-007
Date of Certification December 18th, 2019
Period of Validity 5 years from date of certification Functional Unit One square meter of covered substrate for 60 years
Reference Service Life used in assessment 10 Years
Overall Data Quality Assessment Score Good
Manufacturing Location Wörschach, Austria
LCA Software and Version Number GaBi 9.2.0.58
LCI Database and Version Number GaBi Database, Service Pack 39
ISO 21930: 2017 serves as the core PCR Independent verification of the declaration and data, according to ISO 21930:2017 and ISO 14025:2006
Internal External
Kate McFeaters [email protected]
This life cycle assessment was conducted in accordance with ISO 14044 and the reference PCR by:
WAP Sustainability Consulting, LLC
This life cycle assessment was independently verified in accordance with ISO 14044 and the reference PCR by:
Kate McFeaters [email protected]
Comparability
In order to support comparative assertions, this EPD meets all comparability requirements stated in ISO 14025:2006. However, differences in certain assumptions, data quality, and variability between LCA data sets may still exist. As such, caution should be exercised when evaluating EPDs from different manufacturers, as the EPD results may n ot be entirely comparable. Any EPD comparison must be carried out at the building level per ISO 21930 guidelines. The results of this EPD reflect an average performance by the product and its actual impacts may vary on a case-to-case basis.
3 |
3
Company
We believe in ‘Building with conscience’.
That means ensuring that all building products are not only safe, effective and easy to install, but also environmentally responsible and sustainable. We know you’re always looking for the smartest and newest technology to create energy efficient buildings with superior aesthetics.
That’s exactly what our products help you achieve. Products like our wall systems, coatings and finishes are consistent favorites among design professionals, contractors and property owners alike. Whatever your needs or vision may be, we offer products for every type of building project; whether it’s new construction, restoration or panelization, commercial or residential work.
An architect or specifier focuses on aesthetics and feasibility, a contractor needs products that are easy to work with, and a building owner requires high value and low costs on properties. Sto understands these unique needs, and delivers the smart, innovative materials and solutions that make this all possible. That’s why Sto remains the innovative leader in integrated exterior wall systems.
When you combine that commitment to product support and innovation with value-added offerings like consultative design and color services through Sto Studio or training in proper application techniques through the Sto Institute, you get an integrated exterior wall system solution unmatched in the industry.
Manufacturing Sites Covered in this EPD
Manufacturing location is Wörschach, Austria.
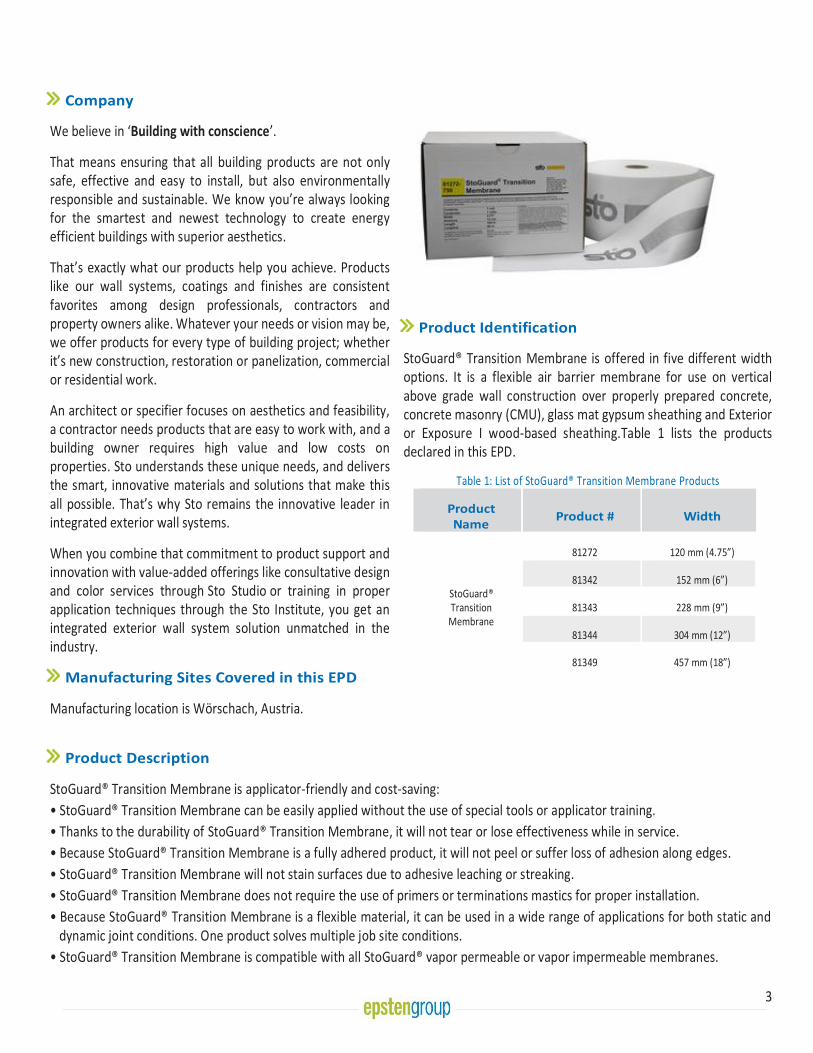
Product Identification
StoGuard® Transition Membrane is offered in five different width options. It is a flexible air barrier membrane for use on vertical above grade wall construction over properly prepared concrete, concrete masonry (CMU), glass mat gypsum sheathing and Exterior or Exposure I wood-based sheathing.Table 1 lists the products declared in this EPD.
Table 1: List of StoGuard® Transition Membrane Products
Product Name
Product # Width
StoGuard® Transition
Membrane
81272 120 mm (4.75”)
81342 152 mm (6”)
81343 228 mm (9”)
81344 304 mm (12”)
81349 457 mm (18”)
Product Description
StoGuard® Transition Membrane is applicator-friendly and cost-saving:
• StoGuard® Transition Membrane can be easily applied without the use of special tools or applicator training.
• Thanks to the durability of StoGuard® Transition Membrane, it will not tear or lose effectiveness while in service.
• Because StoGuard® Transition Membrane is a fully adhered product, it will not peel or suffer loss of adhesion along edges.
• StoGuard® Transition Membrane will not stain surfaces due to adhesive leaching or streaking.
• StoGuard® Transition Membrane does not require the use of primers or terminations mastics for proper installation.
• Because StoGuard® Transition Membrane is a flexible material, it can be used in a wide range of applications for both static and dynamic joint conditions. One product solves multiple job site conditions.
• StoGuard® Transition Membrane is compatible with all StoGuard® vapor permeable or vapor impermeable membranes.
4 |
4
Performance Features
Waterproof Flexible Fully adhered membrane No adhesive leaching Compatible with other StoGuard®
products Fast and easy to install Durable UV-resistant
Versatile Sustainability
Technical Details
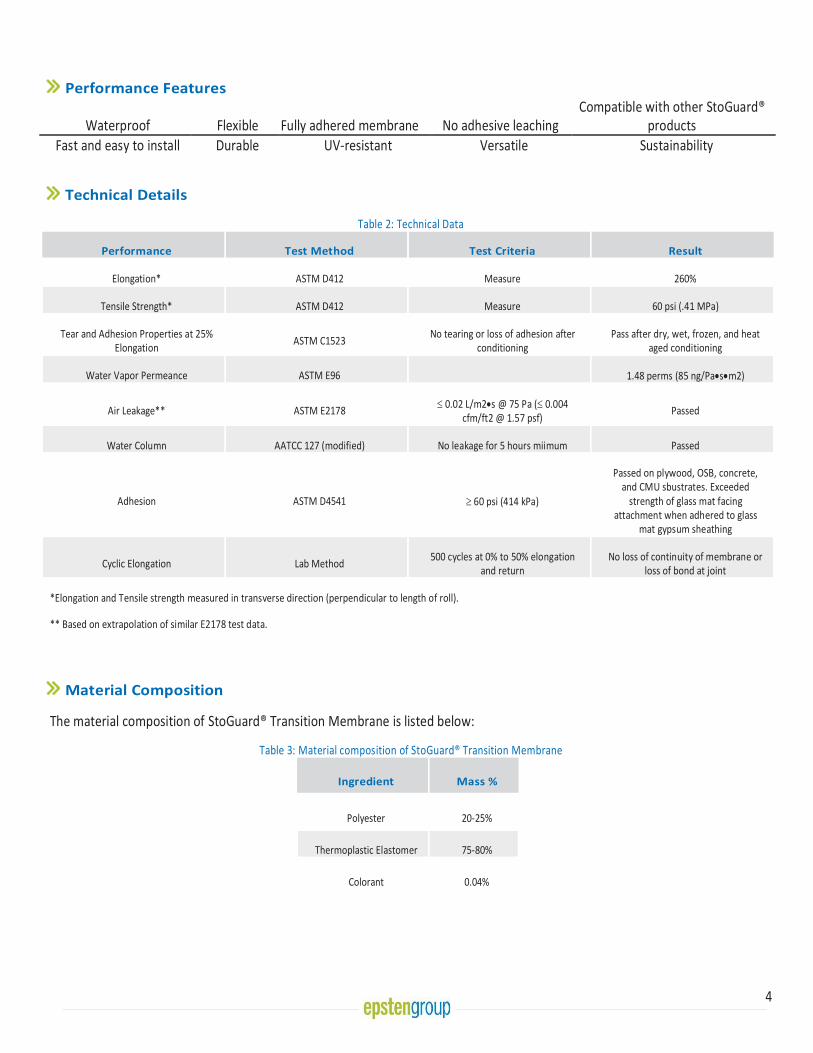
Table 2: Technical Data
Performance Test Method Test Criteria Result
Elongation* ASTM D412 Measure 260%
Tensile Strength* ASTM D412 Measure 60 psi (.41 MPa)
Tear and Adhesion Properties at 25% Elongation
ASTM C1523 No tearing or loss of adhesion after
conditioning Pass after dry, wet, frozen, and heat
aged conditioning
Water Vapor Permeance ASTM E96 1.48 perms (85 ng/Pa•s•m2)
Air Leakage** ASTM E2178 0.02 L/m2•s @ 75 Pa ( 0.004
cfm/ft2 @ 1.57 psf) Passed
Water Column AATCC 127 (modified) No leakage for 5 hours miimum Passed
Adhesion ASTM D4541 60 psi (414 kPa)
Passed on plywood, OSB, concrete, and CMU sbustrates. Exceeded
strength of glass mat facing attachment when adhered to glass
mat gypsum sheathing
Cyclic Elongation Lab Method 500 cycles at 0% to 50% elongation
and return No loss of continuity of membrane or
loss of bond at joint
*Elongation and Tensile strength measured in transverse direction (perpendicular to length of roll).
** Based on extrapolation of similar E2178 test data.
Material Composition
The material composition of StoGuard® Transition Membrane is listed below:
Table 3: Material composition of StoGuard® Transition Membrane
Ingredient Mass %
Polyester 20-25%
Thermoplastic Elastomer 75-80%
Colorant 0.04%
5 |
5
Components related to Life Cycle Assessment
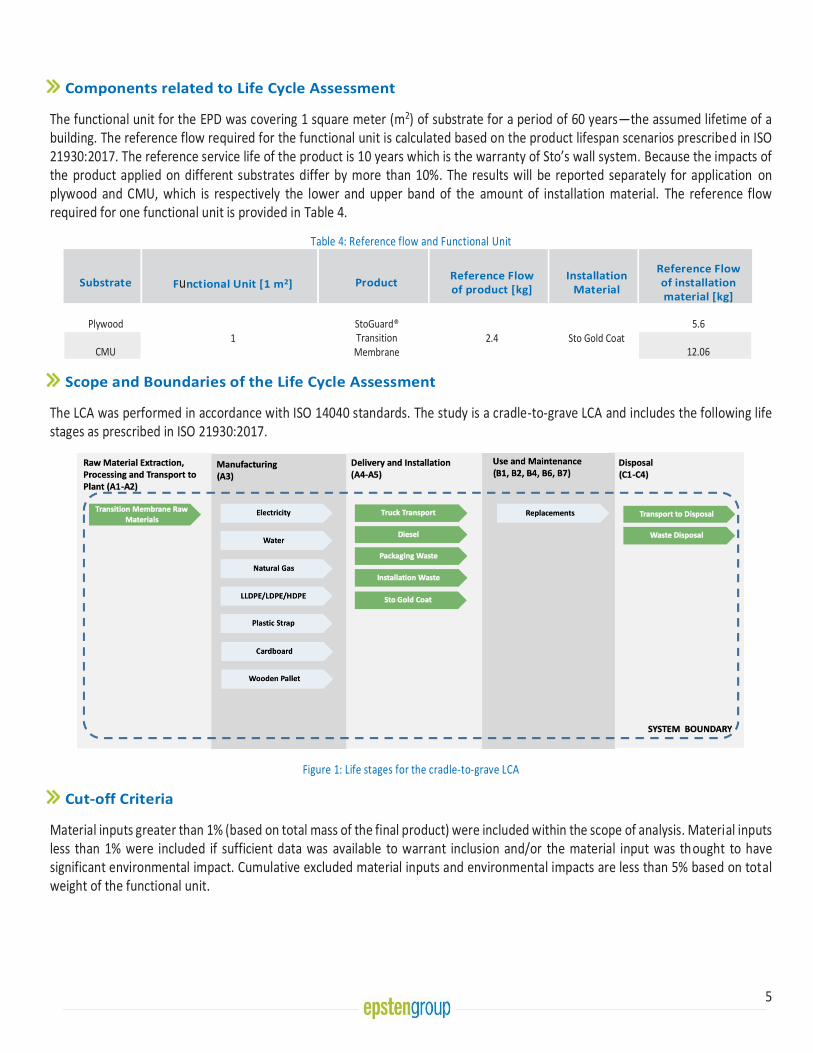
The functional unit for the EPD was covering 1 square meter (m2) of substrate for a period of 60 years—the assumed lifetime of a building. The reference flow required for the functional unit is calculated based on the product lifespan scenarios prescribed in ISO 21930:2017. The reference service life of the product is 10 years which is the warranty of Sto’s wall system. Because the impacts of the product applied on different substrates differ by more than 10%. The results will be reported separately for application on plywood and CMU, which is respectively the lower and upper band of the amount of installation material. The reference flow required for one functional unit is provided in Table 4.
Table 4: Reference flow and Functional Unit
Substrate Functional Unit [1 m2] Product Reference Flow of product [kg]
Installation Material
Reference Flow of installation material [kg]
Plywood 1
StoGuard® Transition
Membrane 2.4 Sto Gold Coat
5.6
CMU 12.06
Scope and Boundaries of the Life Cycle Assessment
The LCA was performed in accordance with ISO 14040 standards. The study is a cradle-to-grave LCA and includes the following life stages as prescribed in ISO 21930:2017.
Figure 1: Life stages for the cradle-to-grave LCA
Cut-off Criteria
Material inputs greater than 1% (based on total mass of the final product) were included within the scope of analysis. Material inputs less than 1% were included if sufficient data was available to warrant inclusion and/or the material input was thought to have significant environmental impact. Cumulative excluded material inputs and environmental impacts are less than 5% based on total weight of the functional unit.

6 |
6
Data Quality
The overall data quality level was determined to be good. Primary data was collected from the manufacturing facility in Wörschach, Austria for the 2018 reference year. When primary data did not exist, secondary data were obtained from the Gabi V9.2.0.58 Database Service Pack 39. Overall, both primary and secondary data are considered acceptable quality in terms of geographic, temporal and technological coverage.
Estimates and Assumption
Assumptions were made to represent the cradle-to-grave environmental performance of Sto’s products. These assumptions include up stream and downstream transportation distances, the disposal of packaging material, the method in which the product is disposed of at its end of life and relevant use phase assumptions.
Allocation
General principles of allocation were based on ISO 14040/44. Where possible, allocation was avoided. When allocation was necessary it was done on a physical mass basis. To derive a per unit value for manufacturing inputs such as electricity, water, and natural gas, a series of allocation calculations were adopted. The facility level of utility data was allocated based on production values of different types of products in the same manufacturing facility. Then the data is further allocated among products of different specifications based on the mass because it is believed the energy consumption and water consumption correlated better on a mass basis.
Production Stage (A1-A3)
StoGuard® Transition Membrane is manufactured in Wörschach, Austria. This stage includes an aggregation of raw material extraction, supplier processing, delivery, manufacturing and packaging by the manufacturer.
Transport to Construction Site (A4)
The product is assumed to be shipped from the manufacturing facility to distribution facilities in the US via truck and ocean freight transportation. From the distribution facilities, the product is shipped to construction sites by trucks. Table 5 gives the transportation details including the distances and the truck dataset used in the model. Transport distances are calculated based on the locations of the manufacturing facility, the distribution facilities, and customers’ zip codes retrieved from the sales records.
Table 5: Transport Details
Parameter Truck in US Ocean Vessel Truck in EU Unit
Fuel type Diesel Heavy fuel oil Diesel -
Liters of fuel 39.0625 0.00023 33.1 l/100km
Vehicle type Heavy duty diesel truck/ 50,000 lb
payload
Container ship, 5,00 to 200, 000 dwt payload capacity, ocean going
Truck-trailer, Euro 0 - 6 mix, 34 - 40t gross weight / 27t payload
capacity
-
Transport distance from the manufacturing facility to the departure port
n/a n/a 441 km
Transport from EU to the USA n/a 14127.62 n/a km
Transport from arrival port to distribution facilities 446.59 n/a n/a km
Transport distance from the distribution facilities to construction sites
636.45 n/a n/a km
7 |
7
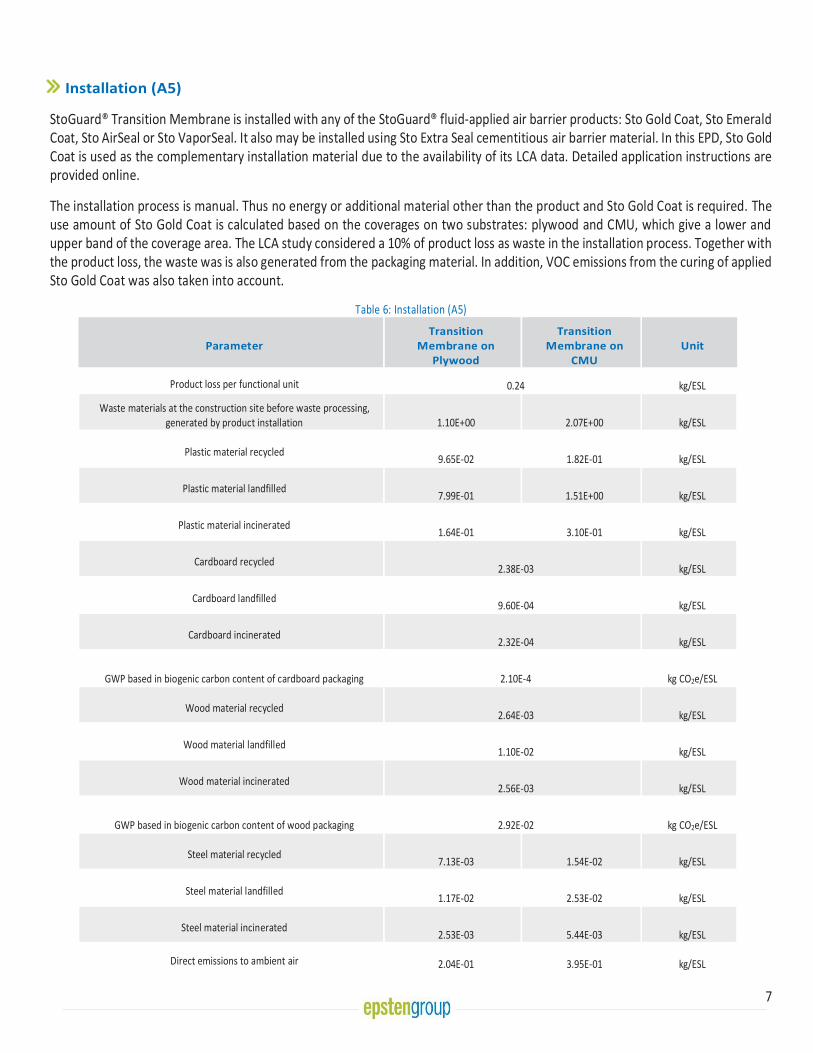
Installation (A5)
StoGuard® Transition Membrane is installed with any of the StoGuard® fluid-applied air barrier products: Sto Gold Coat, Sto Emerald Coat, Sto AirSeal or Sto VaporSeal. It also may be installed using Sto Extra Seal cementitious air barrier material. In this EPD, Sto Gold Coat is used as the complementary installation material due to the availability of its LCA data. Detailed application instructions are provided online.
The installation process is manual. Thus no energy or additional material other than the product and Sto Gold Coat is required. The use amount of Sto Gold Coat is calculated based on the coverages on two substrates: plywood and CMU, which give a lower and upper band of the coverage area. The LCA study considered a 10% of product loss as waste in the installation process. Together with the product loss, the waste was is also generated from the packaging material. In addition, VOC emissions from the curing of applied Sto Gold Coat was also taken into account.
Table 6: Installation (A5)
Parameter Transition
Membrane on Plywood
Transition Membrane on
CMU Unit
Product loss per functional unit 0.24 kg/ESL
Waste materials at the construction site before waste processing, generated by product installation 1.10E+00 2.07E+00 kg/ESL
Plastic material recycled 9.65E-02 1.82E-01 kg/ESL
Plastic material landfilled 7.99E-01 1.51E+00 kg/ESL
Plastic material incinerated 1.64E-01 3.10E-01 kg/ESL
Cardboard recycled 2.38E-03 kg/ESL
Cardboard landfilled 9.60E-04 kg/ESL
Cardboard incinerated 2.32E-04 kg/ESL
GWP based in biogenic carbon content of cardboard packaging 2.10E-4 kg CO2e/ESL
Wood material recycled 2.64E-03 kg/ESL
Wood material landfilled 1.10E-02 kg/ESL
Wood material incinerated 2.56E-03 kg/ESL
GWP based in biogenic carbon content of wood packaging 2.92E-02 kg CO2e/ESL
Steel material recycled 7.13E-03 1.54E-02 kg/ESL
Steel material landfilled 1.17E-02 2.53E-02 kg/ESL
Steel material incinerated 2.53E-03 5.44E-03 kg/ESL
Direct emissions to ambient air 2.04E-01 3.95E-01 kg/ESL

8 |
8
Use Stage (B1-B5 & B6-B7)
Since the product is applied under a wall surface, there are no use phase inputs required to maintain the performance of the product other than the replacement needed through the estimated service life (ESL) of a whole building. The ESL in the study is assumed to be 60 years which is a standard established and used in many PCRs of similar product categories such as architectural coating. The RSL of the product is determined by the warranty of the product, which is ten years. Therefore, after initial installation on a building with a 60-year service life, there will be five replacements needed. Besides the emissions to the air disclosed in the above table, there are no other emissions to air, soil or water, including those of any regulated substances.
Table 7: Replacement (B4)
Parameter Value Unit
Reference Service Life (RSL) 10 Years
Estimated Service Life (ESL) 60 Years
Replacement cycle 5 (ESL/RSL)-
1
Declared product properties As per Product Identification section -
Design application parameters As per technical details in Table 2 -
An assumed quality of work, when installed in accordance with the manufacturer’s instructions
Industry Standard -
End-of-Life Stage (C1-C4)
In this stage, the product at its end of life is transported to the waste disposal facility and processed. Included in this stage are the following:
• Deconstruction – There are no impacts during this stage as the product is manually removed.
• Transportation to disposal – Estimated fuel requirements made based on weight of product and average distance to landfill.
• Waste processing for landfilling — This process is included in the landfilling process.
• Waste disposal — Due to the fact that all the products in study are installed as part of a wall system including the external coating/finish, and are not able to be dismantled based on their material type, it is reasonable to assume that the products at their end-of-life stage are landfilled.
Table 8: End-of-Life Parameters
Parameter Transition Membrane on Plywood
Transition Membrane on CMU
Unit
Collected with mixed construction waste
6.98 12.6 kg/ESL
Landfilling 100 100 %
Product for final deposition 6.98 12.6 kg/ESL

9 |
9
Life Cycle Assessment Results
As prescribed by ISO 21930:2017, TRACI 2.1 impact characterization methodology and IPCC 5th assessment report are adopted to calculate the environment impacts. Table 9 provides the acronym key of the impact indicators declared in this EPD.
Table 9: LCIA impact category and LCI Indicator keys
Abbreviation Parameter Unit
TRACI 2.1
AP Acidification potential of soil and water kg SO2 eq
EP Eutrophication potential kg N eq
GWP Global warming potential including biogenic carbon emission kg CO2 eq
ODP Depletion of stratospheric ozone layer kg CFC 11 eq
POCP Photochemical ozone creation potential kg O3 eq
ADP-Fossil Fuel Abiotic depletion potential for fossil resources (An indicator derived from CML
2001-Jan 2016) MJ, net calorific value
Resource Use Parameters
RPRE Renewable primary energy as energy carrier MJ, net calorific value
RPRM Renewable primary energy resources as material utilization MJ, net calorific value
NRPRE Non-renewable primary energy as energy carrier MJ, net calorific value
NRPRM Non-renewable primary energy as material utilization MJ, net calorific value
SM Use of secondary material kg
RSF Use of renewable secondary fuels MJ, net calorific value
NRSF Use of non-renewable secondary fuels MJ, net calorific value
RE Recovered energy MJ, net calorific value
FW Use of fresh water m3
Waste Parameters
HWD Disposed-of-hazardous waste kg
NHWD Disposed-of non-hazardous waste kg
HLRW High-level radioactive waste disposed kg
ILLRW Intermediate and low-level radioactive waste disposed kg
Carbon Removal and Emission Parameter
BCRP Biogenic Carbon Removal from Product kg CO2 eq
BCEP Biogenic Carbon Emission from Product kg CO2 eq
BCRK Biogenic Carbon Removal from Packaging kg CO2 eq
BCEK Biogenic Carbon Emission from Packaging kg CO2 eq
BCEW Biogenic Carbon Emission from Combustion of Waste from Renewable Sources
Used in Production Processes kg CO2 eq
CCE Calcination Carbon Emissions kg CO2 eq
CCR Carbonation Carbon Removals kg CO2 eq
CWNR Carbon Emissions from Combustion of Waste from Non- Renewable Sources used
in Production Processes kg CO2 eq

10
StoGuard® Transition Membrane on Plywood -- Results
TRACI Results Impact Category A1-A3 A4 A5 B1 B2 B3 B4 B5 B6 B7 C1 C2 C3 C4 D
AP [kg SO2 eq] 1.75E-03 1.69E-03 9.76E-03 0.00E+00 0.00E+00 0.00E+00 6.73E-02 0.00E+00 0.00E+00 0.00E+00 0.00E+00 9.54E-06 0.00E+00 2.54E-04 MND
EP [kg N eq] 1.71E-04 6.90E-05 3.44E-04 0.00E+00 0.00E+00 0.00E+00 2.99E-03 0.00E+00 0.00E+00 0.00E+00 0.00E+00 8.83E-07 0.00E+00 1.30E-05 MND
GWP [kg CO2 eq] 1.17E+00 9.20E-02 1.96E+00 0.00E+00 0.00E+00 0.00E+00 1.64E+01 0.00E+00 0.00E+00 0.00E+00 0.00E+00 3.02E-03 0.00E+00 5.53E-02 MND
ODP [kg CFC 11 eq] -1.52E-13 -3.88E-16 1.74E-11 0.00E+00 0.00E+00 0.00E+00 8.62E-11 0.00E+00 0.00E+00 0.00E+00 0.00E+00 -1.63E-17 0.00E+00 -2.91E-15 MND
POCP [kg O3 eq] 3.17E-02 3.38E-02 7.11E-02 0.00E+00 0.00E+00 0.00E+00 7.09E-01 0.00E+00 0.00E+00 0.00E+00 0.00E+00 2.14E-04 0.00E+00 5.09E-03 MND
ADP-fossil fuel [MJ] 3.18E+01 1.20E+00 3.81E+01 0.00E+00 0.00E+00 0.00E+00 3.60E+02 0.00E+00 0.00E+00 0.00E+00 0.00E+00 4.27E-02 0.00E+00 8.62E-01 MND
Resource Use Impact Category A1-A3 A4 A5 B1 B2 B3 B4 B5 B6 B7 C1 C2 C3 C4 D
RPRE [MJ] 3.00E+00 2.55E-02 1.74E+00 0.00E+00 0.00E+00 0.00E+00 2.41E+01 0.00E+00 0.00E+00 0.00E+00 0.00E+00 1.33E-03 0.00E+00 6.74E-02 MND
RPRM [MJ] 0.00E+00 0.00E+00 0.00E+00 0.00E+00 0.00E+00 0.00E+00 0.00E+00 0.00E+00 0.00E+00 0.00E+00 0.00E+00 0.00E+00 0.00E+00 0.00E+00 MND
NRPRE [MJ] 3.33E+01 1.21E+00 4.09E+01 0.00E+00 0.00E+00 0.00E+00 3.82E+02 0.00E+00 0.00E+00 0.00E+00 0.00E+00 4.29E-02 0.00E+00 8.84E-01 MND
NRPRM [MJ] 0.00E+00 0.00E+00 0.00E+00 0.00E+00 0.00E+00 0.00E+00 0.00E+00 0.00E+00 0.00E+00 0.00E+00 0.00E+00 0.00E+00 0.00E+00 0.00E+00 MND
SM [kg] 0.00E+00 0.00E+00 0.00E+00 0.00E+00 0.00E+00 0.00E+00 0.00E+00 0.00E+00 0.00E+00 0.00E+00 0.00E+00 0.00E+00 0.00E+00 0.00E+00 MND
RSF [MJ] 0.00E+00 0.00E+00 0.00E+00 0.00E+00 0.00E+00 0.00E+00 0.00E+00 0.00E+00 0.00E+00 0.00E+00 0.00E+00 0.00E+00 0.00E+00 0.00E+00 MND
NRSF [MJ] 0.00E+00 0.00E+00 0.00E+00 0.00E+00 0.00E+00 0.00E+00 0.00E+00 0.00E+00 0.00E+00 0.00E+00 0.00E+00 0.00E+00 0.00E+00 0.00E+00 MND
RE [MJ] 0.00E+00 0.00E+00 0.00E+00 0.00E+00 0.00E+00 0.00E+00 0.00E+00 0.00E+00 0.00E+00 0.00E+00 0.00E+00 0.00E+00 0.00E+00 0.00E+00 MND
FW [m3] 4.74E-03 7.57E-05 1.06E-02 0.00E+00 0.00E+00 0.00E+00 7.74E-02 0.00E+00 0.00E+00 0.00E+00 0.00E+00 5.15E-06 0.00E+00 1.05E-04 MND
Waste Impact Category A1-A3 A4 A5 B1 B2 B3 B4 B5 B6 B7 C1 C2 C3 C4 D
HWD [kg] 2.54E-08 1.22E-08 3.95E-08 0.00E+00 0.00E+00 0.00E+00 4.03E-07 0.00E+00 0.00E+00 0.00E+00 0.00E+00 3.48E-10 0.00E+00 3.10E-09 MND
NHWD [kg] 1.18E-02 3.43E-05 2.61E-01 0.00E+00 0.00E+00 0.00E+00 7.68E+00 0.00E+00 0.00E+00 0.00E+00 0.00E+00 1.62E-06 0.00E+00 1.26E+00 MND
HLRW [kg] 7.91E-07 2.76E-09 1.30E-06 0.00E+00 0.00E+00 0.00E+00 1.05E-05 0.00E+00 0.00E+00 0.00E+00 0.00E+00 1.15E-10 0.00E+00 1.08E-08 MND
ILLRW [kg] 5.92E-04 2.06E-06 1.08E-03 0.00E+00 0.00E+00 0.00E+00 8.43E-03 0.00E+00 0.00E+00 0.00E+00 0.00E+00 9.50E-08 0.00E+00 8.56E-06 MND
11
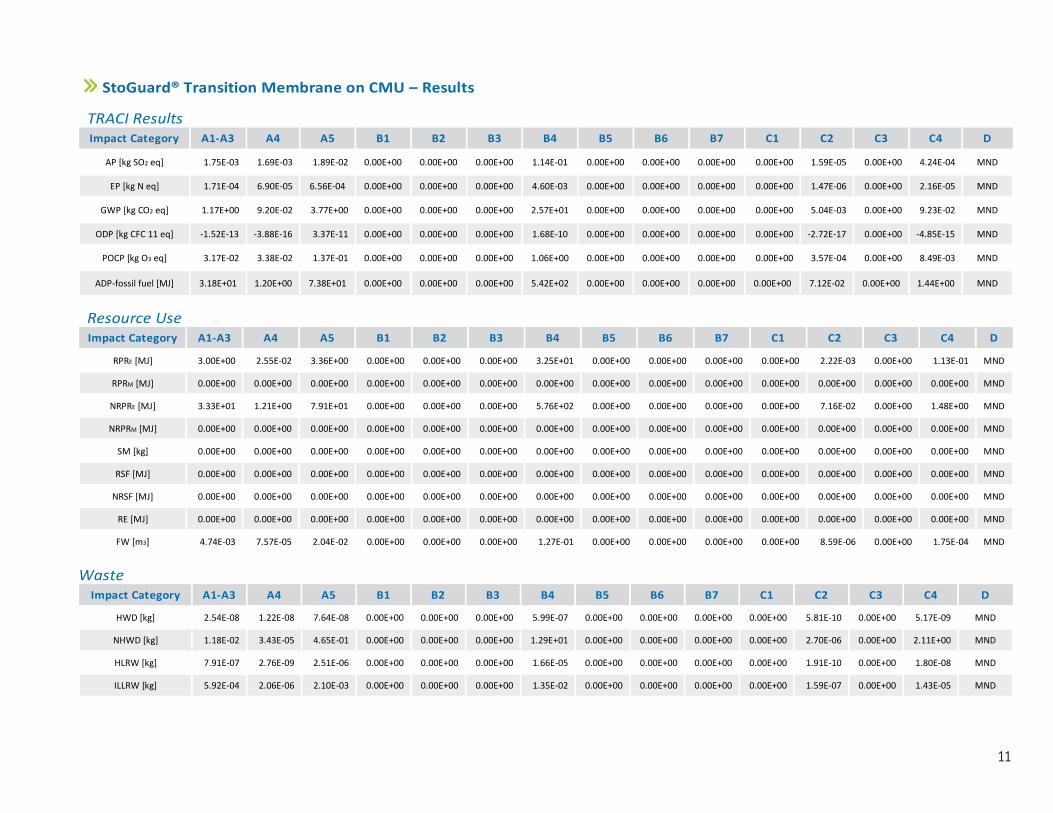
StoGuard® Transition Membrane on CMU – Results
TRACI Results Impact Category A1-A3 A4 A5 B1 B2 B3 B4 B5 B6 B7 C1 C2 C3 C4 D
AP [kg SO2 eq] 1.75E-03 1.69E-03 1.89E-02 0.00E+00 0.00E+00 0.00E+00 1.14E-01 0.00E+00 0.00E+00 0.00E+00 0.00E+00 1.59E-05 0.00E+00 4.24E-04 MND
EP [kg N eq] 1.71E-04 6.90E-05 6.56E-04 0.00E+00 0.00E+00 0.00E+00 4.60E-03 0.00E+00 0.00E+00 0.00E+00 0.00E+00 1.47E-06 0.00E+00 2.16E-05 MND
GWP [kg CO2 eq] 1.17E+00 9.20E-02 3.77E+00 0.00E+00 0.00E+00 0.00E+00 2.57E+01 0.00E+00 0.00E+00 0.00E+00 0.00E+00 5.04E-03 0.00E+00 9.23E-02 MND
ODP [kg CFC 11 eq] -1.52E-13 -3.88E-16 3.37E-11 0.00E+00 0.00E+00 0.00E+00 1.68E-10 0.00E+00 0.00E+00 0.00E+00 0.00E+00 -2.72E-17 0.00E+00 -4.85E-15 MND
POCP [kg O3 eq] 3.17E-02 3.38E-02 1.37E-01 0.00E+00 0.00E+00 0.00E+00 1.06E+00 0.00E+00 0.00E+00 0.00E+00 0.00E+00 3.57E-04 0.00E+00 8.49E-03 MND
ADP-fossil fuel [MJ] 3.18E+01 1.20E+00 7.38E+01 0.00E+00 0.00E+00 0.00E+00 5.42E+02 0.00E+00 0.00E+00 0.00E+00 0.00E+00 7.12E-02 0.00E+00 1.44E+00 MND
Resource Use Impact Category A1-A3 A4 A5 B1 B2 B3 B4 B5 B6 B7 C1 C2 C3 C4 D
RPRE [MJ] 3.00E+00 2.55E-02 3.36E+00 0.00E+00 0.00E+00 0.00E+00 3.25E+01 0.00E+00 0.00E+00 0.00E+00 0.00E+00 2.22E-03 0.00E+00 1.13E-01 MND
RPRM [MJ] 0.00E+00 0.00E+00 0.00E+00 0.00E+00 0.00E+00 0.00E+00 0.00E+00 0.00E+00 0.00E+00 0.00E+00 0.00E+00 0.00E+00 0.00E+00 0.00E+00 MND
NRPRE [MJ] 3.33E+01 1.21E+00 7.91E+01 0.00E+00 0.00E+00 0.00E+00 5.76E+02 0.00E+00 0.00E+00 0.00E+00 0.00E+00 7.16E-02 0.00E+00 1.48E+00 MND
NRPRM [MJ] 0.00E+00 0.00E+00 0.00E+00 0.00E+00 0.00E+00 0.00E+00 0.00E+00 0.00E+00 0.00E+00 0.00E+00 0.00E+00 0.00E+00 0.00E+00 0.00E+00 MND
SM [kg] 0.00E+00 0.00E+00 0.00E+00 0.00E+00 0.00E+00 0.00E+00 0.00E+00 0.00E+00 0.00E+00 0.00E+00 0.00E+00 0.00E+00 0.00E+00 0.00E+00 MND
RSF [MJ] 0.00E+00 0.00E+00 0.00E+00 0.00E+00 0.00E+00 0.00E+00 0.00E+00 0.00E+00 0.00E+00 0.00E+00 0.00E+00 0.00E+00 0.00E+00 0.00E+00 MND
NRSF [MJ] 0.00E+00 0.00E+00 0.00E+00 0.00E+00 0.00E+00 0.00E+00 0.00E+00 0.00E+00 0.00E+00 0.00E+00 0.00E+00 0.00E+00 0.00E+00 0.00E+00 MND
RE [MJ] 0.00E+00 0.00E+00 0.00E+00 0.00E+00 0.00E+00 0.00E+00 0.00E+00 0.00E+00 0.00E+00 0.00E+00 0.00E+00 0.00E+00 0.00E+00 0.00E+00 MND
FW [m3] 4.74E-03 7.57E-05 2.04E-02 0.00E+00 0.00E+00 0.00E+00 1.27E-01 0.00E+00 0.00E+00 0.00E+00 0.00E+00 8.59E-06 0.00E+00 1.75E-04 MND
Waste Impact Category A1-A3 A4 A5 B1 B2 B3 B4 B5 B6 B7 C1 C2 C3 C4 D
HWD [kg] 2.54E-08 1.22E-08 7.64E-08 0.00E+00 0.00E+00 0.00E+00 5.99E-07 0.00E+00 0.00E+00 0.00E+00 0.00E+00 5.81E-10 0.00E+00 5.17E-09 MND
NHWD [kg] 1.18E-02 3.43E-05 4.65E-01 0.00E+00 0.00E+00 0.00E+00 1.29E+01 0.00E+00 0.00E+00 0.00E+00 0.00E+00 2.70E-06 0.00E+00 2.11E+00 MND
HLRW [kg] 7.91E-07 2.76E-09 2.51E-06 0.00E+00 0.00E+00 0.00E+00 1.66E-05 0.00E+00 0.00E+00 0.00E+00 0.00E+00 1.91E-10 0.00E+00 1.80E-08 MND
ILLRW [kg] 5.92E-04 2.06E-06 2.10E-03 0.00E+00 0.00E+00 0.00E+00 1.35E-02 0.00E+00 0.00E+00 0.00E+00 0.00E+00 1.59E-07 0.00E+00 1.43E-05 MND

12 |
12
Carbon removal and Emission
Indicator Tranisition Membrane on plywood Transition Membrane on CMU
BCRP [kg CO2 eq] 5.86E-02 6.10E-02
BCEP [kg CO2 eq] 5.95E-02 6.13E-02
BCRK [kg CO2 eq] 5.51E-03 5.96E-03
BCEK [kg CO2 eq] 2.05E-03 2.37E-03
BCEW [kg CO2 eq] 0.00E+00 0.00E+00
CCE [kg CO2 eq] 0.00E+00 0.00E+00
CCR [kg CO2 eq] 0.00E+00 0.00E+00
CWNR [kg CO2 eq] 0.00E+00 0.00E+00
Interpretation
In one reference service life of the product, the stage that contributes the most enviornmental impact is the installation stage. Unlike many products, the impact derived from the production of the declared product is exceeded by those from the installation of Sto Transition Membrane. This also explains the significant differences in impacts between substrate types. From the perspective of a whole building lifespan, the vast majority of the impacts are derived from the number of replacements needed. This is directly related to the impacts associated with the manufacture of new installation material and new products that are used to replace the original. Improving the relatively short lifespan of the products is essential to reducing the overall impact of the product.
Reference
• Life Cycle Assessment, LCA report for Sto Corp. WAP Sustainability, October 2019
• ISO14044:2006Environmental Management–Life cycle assessment–Requirements and Guidelines.
• ISO 14025:2006 Environmental labels and declarations – Type III environmental declarations – Principles and Procedures.
• ISO 21930:2007 Sustainability in buildings and civil engineering works – Core rules for environmental product declarations of construction products and services.
• Sto Studio. Sto Corp, 2019. Available at https://www.stocorp.com/sto-studio-us/
• Product Bulletin – StoGuard Transition Membrane. Sto Corp. Available at https://www.stocorp.com/wp-content/content/Products_TechService/Air%20Moisture%20Barriers/Product%20Bulletins/PB_81272_StoGuard_Transition_Membrane_EN.pdf
EPD for BTS® Plus
Sto BTS® Plus is a one- component, polymer-modified, cement based, dry powder material used as an adhesive and base coat in Sto Wall Claddings, including StoTherm ci Classic and StoTherm ci Lotusan Systems.
2 |
2
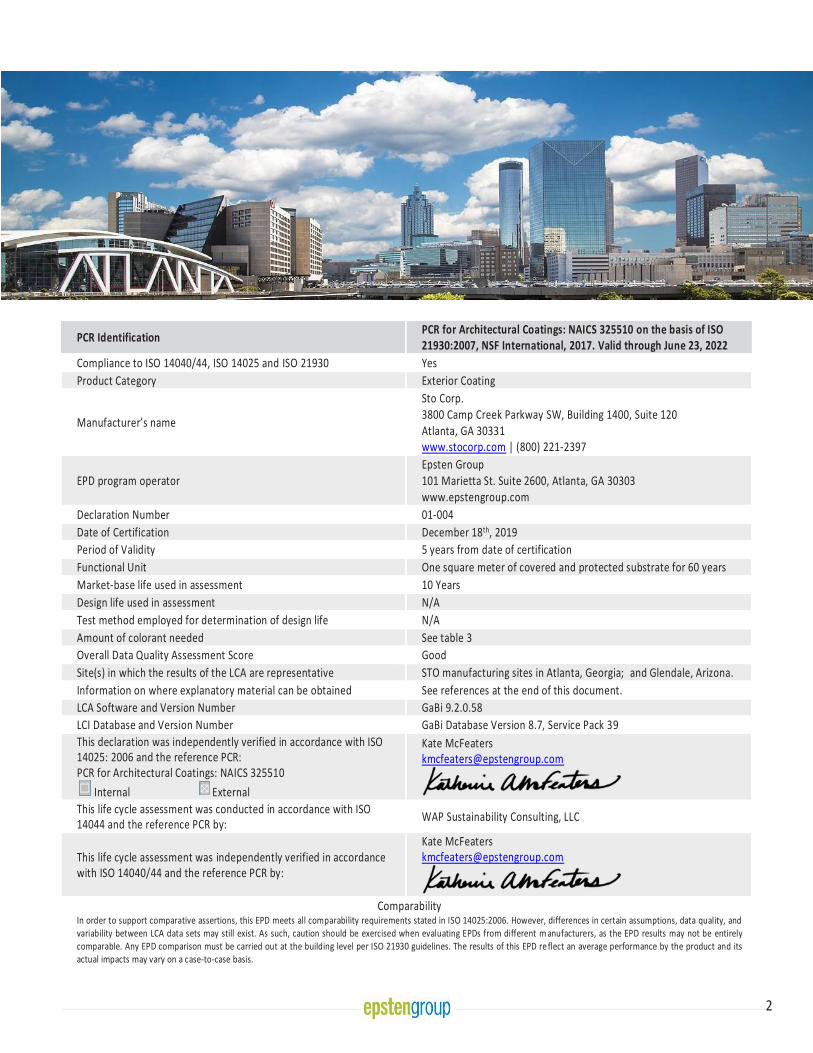
PCR Identification
PCR for Architectural Coatings: NAICS 325510 on the basis of ISO 21930:2007, NSF International, 2017. Valid through June 23, 2022
Compliance to ISO 14040/44, ISO 14025 and ISO 21930 Yes
Product Category Exterior Coating
Manufacturer’s name
Sto Corp. 3800 Camp Creek Parkway SW, Building 1400, Suite 120 Atlanta, GA 30331 www.stocorp.com | (800) 221-2397
EPD program operator Epsten Group 101 Marietta St. Suite 2600, Atlanta, GA 30303 www.epstengroup.com
Declaration Number 01-004
Date of Certification December 18th, 2019
Period of Validity 5 years from date of certification
Functional Unit One square meter of covered and protected substrate for 60 years
Market-base life used in assessment 10 Years
Design life used in assessment N/A
Test method employed for determination of design life N/A
Amount of colorant needed See table 3
Overall Data Quality Assessment Score Good
Site(s) in which the results of the LCA are representative STO manufacturing sites in Atlanta, Georgia; and Glendale, Arizona.
Information on where explanatory material can be obtained See references at the end of this document.
LCA Software and Version Number GaBi 9.2.0.58
LCI Database and Version Number GaBi Database Version 8.7, Service Pack 39
This declaration was independently verified in accordance with ISO 14025: 2006 and the reference PCR: PCR for Architectural Coatings: NAICS 325510
Internal External
Kate McFeaters [email protected]
This life cycle assessment was conducted in accordance with ISO 14044 and the reference PCR by:
WAP Sustainability Consulting, LLC
This life cycle assessment was independently verified in accordance with ISO 14040/44 and the reference PCR by:
Kate McFeaters [email protected]
Comparability
In order to support comparative assertions, this EPD meets all comparability requirements stated in ISO 14025:2006. However, differences in certain assumptions, data quality, and variability between LCA data sets may still exist. As such, caution should be exercised when evaluating EPDs from different m anufacturers, as the EPD results may not be entirely comparable. Any EPD comparison must be carried out at the building level per ISO 21930 guidelines. The results of this EPD re flect an average performance by the product and its actual impacts may vary on a case-to-case basis.
3 |
3
Company
We believe in ‘Building with conscience’.
That means ensuring that all building products are not only safe, effective and easy to install, but also environmentally responsible and sustainable. We know you’re always looking for the smartest and newest technology to create energy efficient buildings with superior aesthetics.
That’s exactly what our products help you achieve. Products like our wall systems, coatings and finishes are consistent favorites among design professionals, contractors and property owners alike. Whatever your needs or vision may be, we offer products for every type of building project; whether it’s new construction, restoration or panelization, commercial or residential work.
An architect or specifier focuses on aesthetics and feasibility, a contractor needs products that are easy to work with, and a building owner requires high value and low costs on properties. Sto understands these unique needs, and delivers the smart, innovative materials and solutions that make this all possible. That’s why Sto remains the innovative leader in integrated exterior wall systems.
When you combine that commitment to product support and innovation with value-added offerings like consultative design and color services through Sto Studio or training in proper application techniques through the Sto Institute, you get an integrated exterior wall system solution unmatched in the industry.
Manufacturing Sites Covered in this EPD
Atlanta Plant
Glendale Plant
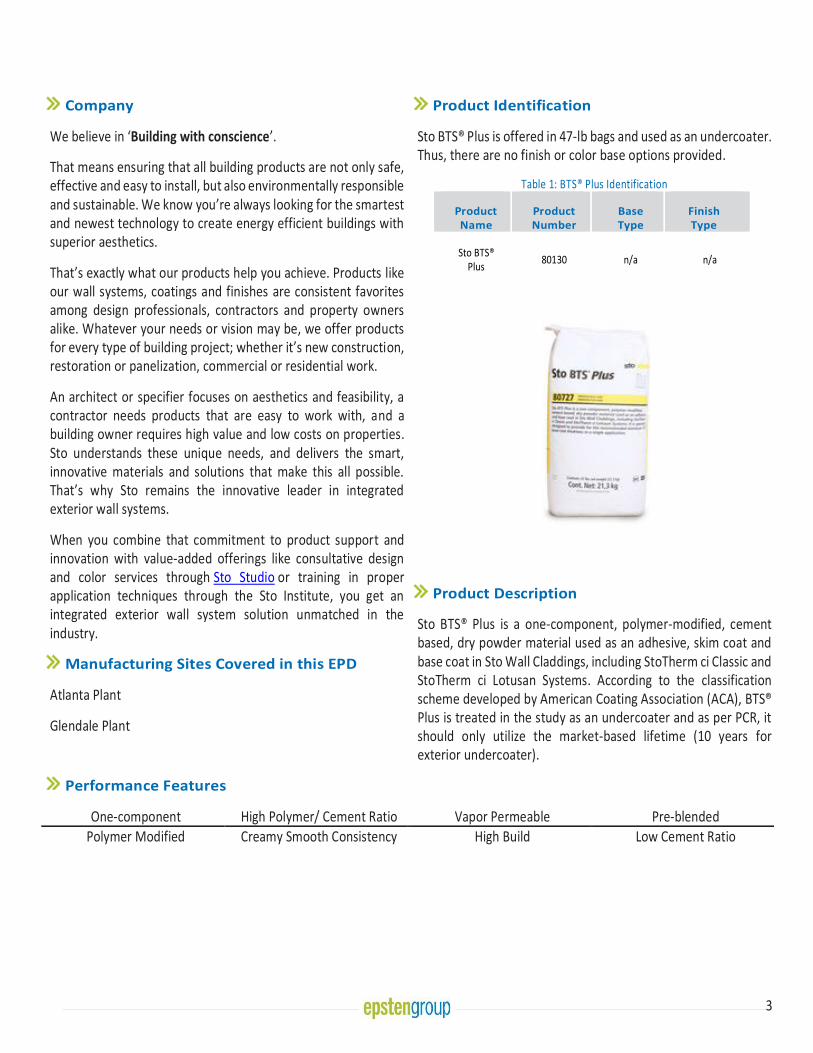
Product Identification
Sto BTS® Plus is offered in 47-lb bags and used as an undercoater. Thus, there are no finish or color base options provided.
Table 1: BTS® Plus Identification
Product Name
Product Number
Base Type
Finish Type
Sto BTS® Plus
80130 n/a n/a
Product Description
Sto BTS® Plus is a one-component, polymer-modified, cement based, dry powder material used as an adhesive, skim coat and base coat in Sto Wall Claddings, including StoTherm ci Classic and StoTherm ci Lotusan Systems. According to the classification scheme developed by American Coating Association (ACA), BTS® Plus is treated in the study as an undercoater and as per PCR, it should only utilize the market-based lifetime (10 years for exterior undercoater).
Performance Features
One-component High Polymer/ Cement Ratio Vapor Permeable Pre-blended Polymer Modified
Creamy Smooth Consistency
High Build
Low Cement Ratio

4 |
4
Material Composition
The material compositions of BTS® Plus are listed below:
Table 2: Material composition for BTS® Plus
Ingredient BTS® Plus
Additives 0-1%
Cement 40-45%
Colorant 0-1%
Polymer 2-3%
Silica 54-55%
Silicate 0-1%
Components related to Life Cycle Assessment
The functional unit for the LCA study was covering and protecting 1 square meter (m2) of substrate for a period of 60 years—the assumed lifetime of a building. The reference flow required for the functional unit is calculated based on the product lifespan scenarios prescribed in the PCR. The market-based lifetime is 10 years. By default, BTS® Plus has a 5-year warranty. In case it is applied on Sto’s wall systems, the warranty is extended to 10 years. The reference flow required for one
functional unit is provided in Table 3.
Table 3: Market-based lifetime and reference flow
Functional
Unit [1 m2]
Reference Flow [kg]
Tint needed*
[kg]
Lifespan Market-based Lifetime [10 years]
BTS® Plus – Adhesive over Rough Masonry
1 40.39 N/A
BTS® Plus – Average 14.12 N/A
Scope and Boundaries of the Life Cycle Assessment
The LCA was performed in accordance with ISO 14040 standards. The study is a cradle-to-grave LCA and includes the following life stages as prescribed in the PCR.
Figure 1: Life stages for the cradle-to-grave LCA

5 |
5
Cut-off Criteria
Material inputs greater than 1% (based on total mass of the final product) were included within the scope of analysis. Material inputs less than 1% were included if sufficient data was available to warrant inclusion and/or the material input was thought to have significant environmental impact. Cumulative excluded material inputs and environmental impacts are less than 5% based on total weight of the functional unit.
Data Quality
The overall data quality level was determined to be good. Primary data was collected from Sto’s facilities in Atlanta, GA, and Glendale, AZ for the 2018 reference year. When primary data did not exist, secondary data were obtained from the Gabi V8.7 Database Service Pack 39. Overall, both primary and secondary data are considered good quality in terms of geographic, temporal and technological coverage.
Estimates and Assumption
Assumptions were made to represent the cradle-to-grave environmental performance of Sto’s products. These assumptions were made in accordance with the PCR and include the transportation distances, the disposal of packaging material and the product at its end of life and use phase assumptions.
Allocation
General principles of allocation were based on ISO 14040/44. Where possible, allocation was avoided. When allocation was necessary it was done on a physical mass basis.
Product Stage
BTS® Plus is a dry-powder product. It is manufactured in both the Atlanta, GA and Glendale, AZ facilities. The facility in Atlanta also supplies BTS® concentrate to Glendale facility, based on which BTS® Plus is produced. BTS® Plus is packaged in a paper bag at 47 pounds (21.3 kgs) per bag. This stage includes an aggregation of raw material extraction, supplier processing, delivery, manufacturing and packaging by Sto.
Design and Construction Stage
The design and construction process stage starts with the packaged product leaving the production site and ends with being delivered to the application site.
During this stage, the finished product is moved from a shipping dock for distribution. The end gate is the application site after the purchaser acquires the finished product and transports it to the application site.
Use and Maintenance Stage
The use stage begins when the user prepares the product before applying it to a substrate and ends with any leftover coating and discarded packaging entering the end-of-life stage. Detailed application instructions are provided online. The application procedure includes mixing and applying. In the mixing process, BTS® Plus requires the addition of water at an average rate of 5.45 kg of water per 21.3-kg bag. As recommended, an electric drill/mixer and a spray pump are assumed to be used for mixing and application. The equipment is not included in the study as these are multi-use tools and the impacts per declared unit is considered negligible, but electricity to power application tools has been included.
As prescribed in the PCR, 10% of the wet mass of BTS® Plus is assumed to be unused and properly disposed of.
End-of-Life Stage
Table 4: End-of_life Disposal Scenarios
In this stage, the disposal of installation waste, packaging waste and product waste at its end of life is included. The disposal pathway of each waste stream is modeled based on the recommendation of PCR and US EPA’s latest waste management fact sheet.
Waste Flow Recyclin
g Incineratio
n Landfillin
g
Paper Packaging 66.6% 6.01% 27.39%
Unused Product 0% 0% 100%
Post-Consumer Product
0% 0% 100%

6 |
6
Life Cycle Assessment Results
As prescribed by the PCR, TRACI 2.1 impact characterization methodology and IPCC 5th assessment report are adopted to calculate the environment impacts. Table 5 provides the acronym key of the impact indicators declared in this EPD.
Table 5: LCIA impact category and LCI Indicator keys
Abbreviation Parameter Unit
TRACI 2.1
AP Acidification potential of soil and water kg SO2 eq
EP Eutrophication potential kg N eq
GWP Global warming potential including biogenic carbon emission kg CO2 eq
ODP Depletion of stratospheric ozone layer kg CFC 11 eq
POCP Photochemical ozone creation potential kg O3 eq
Resource Use Parameters
RPR Use of renewable primary energy MJ, net calorific value
(LHV)
RMR Use of renewable Material Resources kg
NRER Depletion of Non-Renewable Energy Resources MJ, net calorific value
NRMR Depletion of Non-Renewable Material Resources kg
FW Consumption of Freshwater m3
Waste Parameters
HWD Disposed-of-hazardous waste kg
NHWD Disposed-of non-hazardous waste kg
Biogenic Carbon Parameter
BC Biogenic Carbon kg CO2 eq
Energy Differentiation Parameters
HWP Hydro/wind Power MJ, net calorific value
(LHV)
FE Fossil Energy MJ, net calorific value
(LHV)
BE Bio-energy MJ, net calorific value
(LHV)
NE Nuclear Energy MJ, net calorific value
(LHV)
OE Other Energy MJ, net calorific value
(LHV)

7 |
7
BTS® Plus – Adhesive over Rough Masonry
Indicator 1. Product
Stage
2. Design & Construction
Stage
3. Use & Maintenance
Stage
4. End-of-Life Stage
Market-based lifetime
AP [kg SO2 eq] 8.90E-02 1.56E-02 6.73E-04 1.07E-02
EP [kg N eq] 9.00E-03 1.27E-03 3.03E-05 1.52E-03
GWP [kg CO2 eq] 3.86E+01 3.04E+00 2.42E-01 1.94E+00
ODP [kg CFC 11 eq] 3.82E-12 2.89E-16 8.03E-16 6.57E-15
POCP [kg O3 eq] 1.61E+00 3.57E-01 5.67E-03 1.79E-01
RPRE [MJ] 4.35E+01 1.33E+00 5.23E-01 2.22E+00
NRPRE [MJ] 4.64E+02 4.30E+01 3.85E+00 2.99E+01
FW [m3] 1.09E-01 5.13E-03 1.18E-02 3.47E-03
RMR [kg] 2.05E-01 0.00E+00 0.00E+00 0.00E+00
NRMR [kg] 4.04E+01 0.00E+00 0.00E+00 0.00E+00
HWD [kg] 7.01E-07 3.49E-07 1.73E-09 1.11E-07
NHWD [kg] 4.33E+00 1.62E-03 3.30E-03 4.09E+01
BC [kg CO2 eq] 4.21E+00
HWP [MJ] 2.67E+00
FE [MJ] 3.97E+01
BE [MJ] 1.29E+00
NE [MJ] 1.04E+01
OE [MJ] 1.04E+00
8 |
8
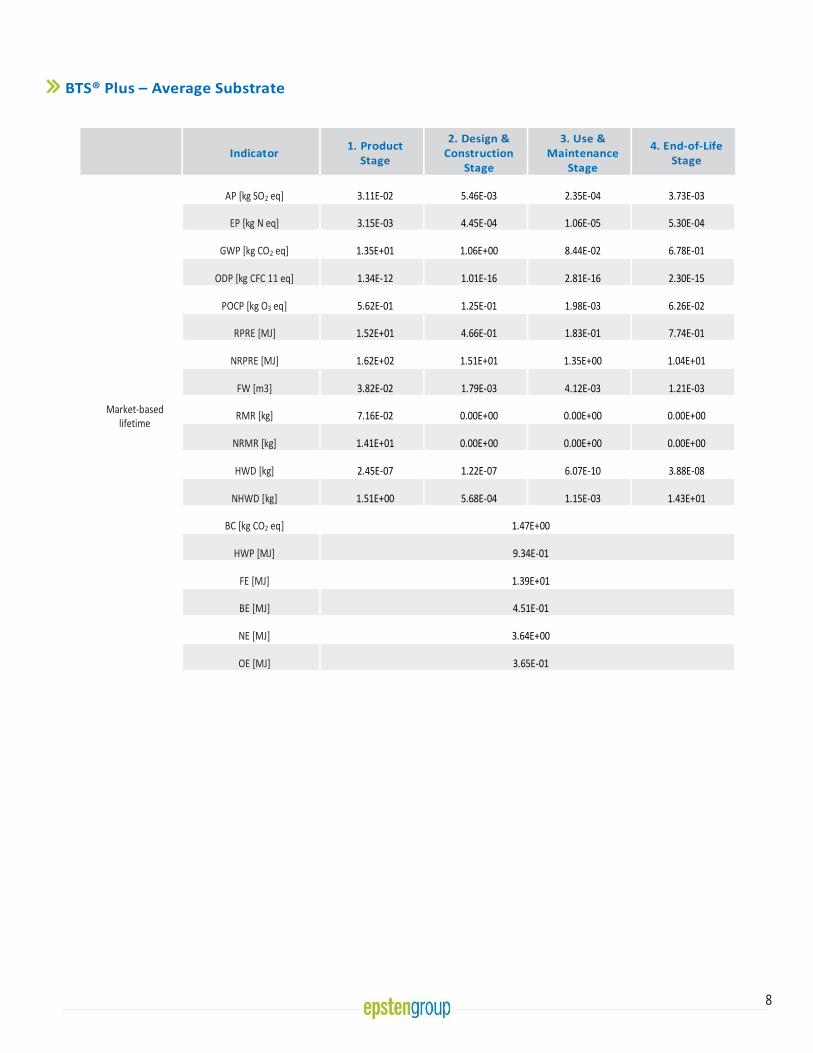
BTS® Plus – Average Substrate
Indicator 1. Product
Stage
2. Design & Construction
Stage
3. Use & Maintenance
Stage
4. End-of-Life Stage
Market-based lifetime
AP [kg SO2 eq] 3.11E-02 5.46E-03 2.35E-04 3.73E-03
EP [kg N eq] 3.15E-03 4.45E-04 1.06E-05 5.30E-04
GWP [kg CO2 eq] 1.35E+01 1.06E+00 8.44E-02 6.78E-01
ODP [kg CFC 11 eq] 1.34E-12 1.01E-16 2.81E-16 2.30E-15
POCP [kg O3 eq] 5.62E-01 1.25E-01 1.98E-03 6.26E-02
RPRE [MJ] 1.52E+01 4.66E-01 1.83E-01 7.74E-01
NRPRE [MJ] 1.62E+02 1.51E+01 1.35E+00 1.04E+01
FW [m3] 3.82E-02 1.79E-03 4.12E-03 1.21E-03
RMR [kg] 7.16E-02 0.00E+00 0.00E+00 0.00E+00
NRMR [kg] 1.41E+01 0.00E+00 0.00E+00 0.00E+00
HWD [kg] 2.45E-07 1.22E-07 6.07E-10 3.88E-08
NHWD [kg] 1.51E+00 5.68E-04 1.15E-03 1.43E+01
BC [kg CO2 eq] 1.47E+00
HWP [MJ] 9.34E-01
FE [MJ] 1.39E+01
BE [MJ] 4.51E-01
NE [MJ] 3.64E+00
OE [MJ] 3.65E-01
9 |
9
Interpretation
Overall, the Product Stage is the major contributor to many impact categories including GWP. This is understandable as cement is a major ingredient of BTS® Plus and it is an energy-intensive material.
Reference
• Life Cycle Assessment, LCA report for Sto Corp. WAP Sustainability, September 2019
• PCR for Architectural Coatings: NAICS 325510. NSF International, 2017
• ISO14044:2006 Environmental Management–Life cycle assessment–Requirements and Guidelines.
• ISO 14025:2006 Environmental labels and declarations – Type III environmental declarations – Principles and Procedures.
• ISO 21930:2007 Sustainability in buildings and civil engineering works – Core rules for environmental product declarations of construction products and services.
• Advancing Sustainable Materials Management: 2015 Fact Sheet. US EPA. Available at https://www.epa.gov/sites/production/files/2018-07/documents/2015_smm_msw_factsheet_07242018_fnl_508_002.pdf
• Product Bulletin – Sto BTS® Plus. Sto Corp. Available at https://www.stocorp.com/wp-content/content/Products_TechService/Base%20Coats%20and%20Adhesives/Product%20Bulletins/PB_80727_Sto_BTS_Plus_EN.pdf

EPD for Sto TurboStick®
Sto TurboStick® Sto TurboStick® is a ready-to-use, single component polyurethane foam adhesive for installing Sto insulation boards in StoTherm® exterior wall claddings. Compared to cementitious adhesives, Sto TurboStick delivers unparalleled convenience and installation speeds.
2 |
2
Manufacturer Name
Sto Corp. 3800 Camp Creek Parkway SW, Building 1400, Suite 120, Atlanta, GA 30331 www.stocorp.com | (800) 221-2397
EPD Program Operator Epsten Group 101 Marietta St. Suite 2600, Atlanta, GA 30303 www.epstengroup.com
Compliance to ISO21930:2017 Yes
Product Name Sto TurboStick® Product’s Intended Application and Use Foam adhesive for securing insulation boards
Declaration Number 01-008
Date of Certification December 18th, 2019
Period of Validity 5 years from date of certification
Functional Unit One square meter of covered substrate for 60 years Reference Service Life used in assessment 10 Years
Overall Data Quality Assessment Score Good
Manufacturing Location Wilmington, IL, USA
LCA Software and Version Number GaBi 9.2.0.58
LCI Database and Version Number GaBi Database, Service Pack 39
ISO 21930: 2017 serves as the core PCR Independent verification of the declaration and data, according to ISO 21930:2017 and ISO 14025:2006
Internal External
Kate McFeaters [email protected]
This life cycle assessment was conducted in accordance with ISO 14044 and the reference PCR by:
WAP Sustainability Consulting, LLC
This life cycle assessment was independently verified in accordance with ISO 14044 and the reference PCR by:
Kate McFeaters [email protected]
Comparability
In order to support comparative assertions, this EPD meets all comparability requirements stated in ISO 14025:2006. However, differences in certain assumptio ns, data quality, and variability between LCA data sets may still exist. As such, caution should be exercised when evaluating EPDs from different manufacturers, as the EPD results may not be entirely comparable. Any EPD comparison must be carried out at the building level per ISO 21930 guidelines. The results of this EPD reflect an average performance by the product and its actual impacts may vary on a case-to-case basis.
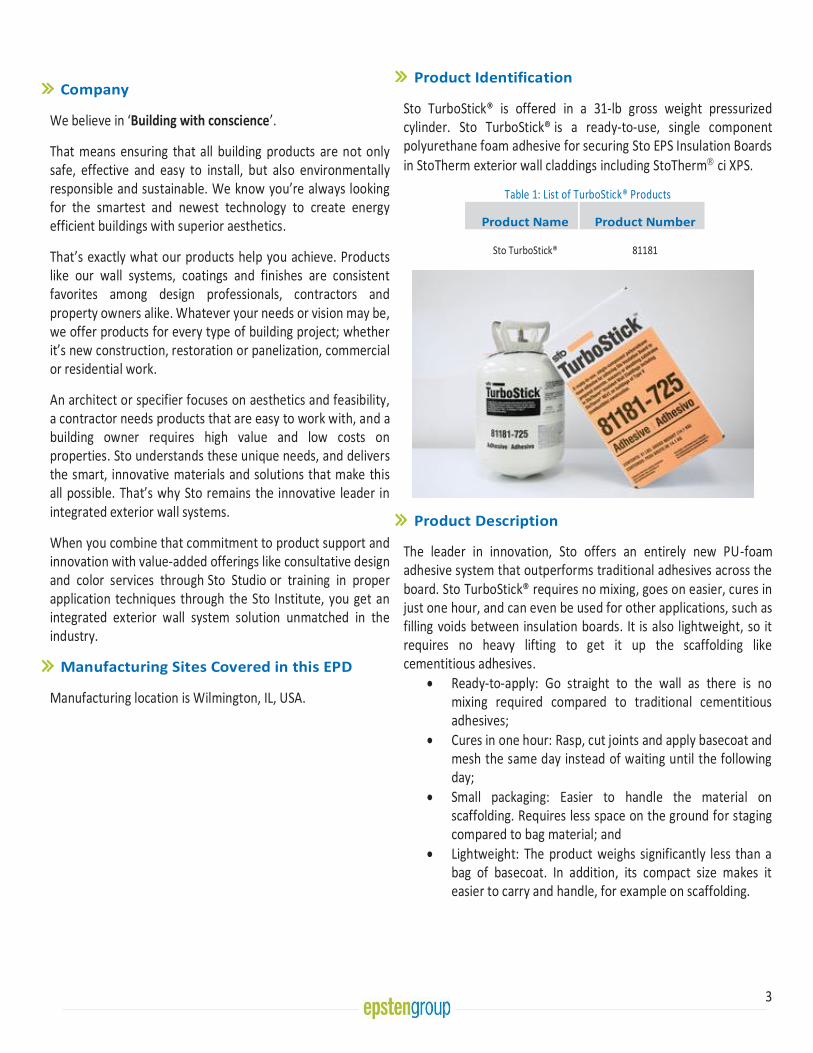
3 |
3
Company
We believe in ‘Building with conscience’.
That means ensuring that all building products are not only safe, effective and easy to install, but also environmentally responsible and sustainable. We know you’re always looking for the smartest and newest technology to create energy efficient buildings with superior aesthetics.
That’s exactly what our products help you achieve. Products like our wall systems, coatings and finishes are consistent favorites among design professionals, contractors and property owners alike. Whatever your needs or vision may be, we offer products for every type of building project; whether it’s new construction, restoration or panelization, commercial or residential work.
An architect or specifier focuses on aesthetics and feasibility, a contractor needs products that are easy to work with, and a building owner requires high value and low costs on properties. Sto understands these unique needs, and delivers the smart, innovative materials and solutions that make this all possible. That’s why Sto remains the innovative leader in integrated exterior wall systems.
When you combine that commitment to product support and innovation with value-added offerings like consultative design and color services through Sto Studio or training in proper application techniques through the Sto Institute, you get an integrated exterior wall system solution unmatched in the industry.
Manufacturing Sites Covered in this EPD
Manufacturing location is Wilmington, IL, USA.
Product Identification
Sto TurboStick® is offered in a 31-lb gross weight pressurized cylinder. Sto TurboStick® is a ready-to-use, single component polyurethane foam adhesive for securing Sto EPS Insulation Boards in StoTherm exterior wall claddings including StoTherm ci XPS.
Table 1: List of TurboStick® Products
Product Name Product Number
Sto TurboStick® 81181
Product Description
The leader in innovation, Sto offers an entirely new PU-foam adhesive system that outperforms traditional adhesives across the board. Sto TurboStick® requires no mixing, goes on easier, cures in just one hour, and can even be used for other applications, such as filling voids between insulation boards. It is also lightweight, so it requires no heavy lifting to get it up the scaffolding like cementitious adhesives.
• Ready-to-apply: Go straight to the wall as there is no mixing required compared to traditional cementitious adhesives;
• Cures in one hour: Rasp, cut joints and apply basecoat and mesh the same day instead of waiting until the following day;
• Small packaging: Easier to handle the material on scaffolding. Requires less space on the ground for staging compared to bag material; and
• Lightweight: The product weighs significantly less than a bag of basecoat. In addition, its compact size makes it easier to carry and handle, for example on scaffolding.
4 |
4
Performance Features Convenient and Ready-to-Use Pre-pressurized Container Minimal preparation time
Compact and Lightweight High coverage rate
Fast VOC Compliant
Technical Details
Table 2: Technical Data*
Performance Test Method Test Criteria Result
Surface Burning ASTM E-84-10
(UL 723, UBC 8-1, NFPA 255)
Flame Spread: ≤25
Smoke Developed: ≤450
Flame Spread: 10
Smoke Developed: 5
Tensile Strength ASTM C-297 Greater than 15 psi > 15 psi; cohesive failure of EPS
insulation board
VOC (g/L) This product contains no VOC’s. Complies with US EPA (40 CFR 59) VOC emission standards for architectural coatings.
*Results are based on lab testing under controlled conditions. Results can vary between labs or from field tests.
Material Composition
The material composition of TurboStick® is listed below:
Table 3: Material composition of TurboStick®
TurboStick®
Polymethylenepolyphenl polyisocyanate,
polypropyleneglycol copolymer 30-60%
1,1,1,2-Tetrafluoroethane 10-30%
Diphenylmethane Diisocyanate, isomers and
homologues 10-30%
4,4'-Diphenylmethane diisocyanate
7-13%
N,N'-Dimorpholinodiethylether 1-5%
Components related to Life Cycle Assessment
The functional unit for the EPD was covering 1 square meter (m2) of substrate for a period of 60 years—the assumed lifetime of a building. The reference flow required for the functional unit is calculated based on the product lifespan scenarios prescribed in ISO 21930:2017. The reference service life of the product is 10 years which is the warranty of Sto’s wall system. The reference flow required for one functional unit is provided in Table 4.
Table 4: Reference flow and Functional Unit
Product Functional Unit [1 m2] Reference Flow
[kg]
TurboStick® 1 0.81

5 |
5
Scope and Boundaries of the Life Cycle Assessment
The LCA was performed in accordance with ISO 14040 standards. The study is a cradle-to-grave LCA and includes the following life stages as prescribed in ISO 21930:2017.
Figure 1: Life stages for the cradle-to-grave LCA
Cut-off Criteria
Material inputs greater than 1% (based on total mass of the final product) were included within the scope of analysis. Material inputs less than 1% were included if sufficient data was available to warrant inclusion and/or the material input was thought to have significant environmental impact. Cumulative excluded material inputs and environmental impacts are less than 5% based on total weight of the functional unit.
Data Quality
The overall data quality level was determined to be good. Primary data was collected from the manufacturing facility in Illinois, USA for the 2018 reference year. When primary data did not exist, secondary data were obtained from the Gabi V9.2.0.58 Database Service Pack 39. Overall, both primary and secondary data are considered acceptable quality in terms of geographic, temporal and technological coverage.
Estimates and Assumption
Assumptions were made to represent the cradle-to-grave environmental performance of Sto’s products. These assumptions include up stream and downstream transportation distances, the disposal of packaging material, the method in which the product is disposed of at its end of life and relevant use phase assumptions.
Allocation
General principles of allocation were based on ISO 14040/44. Where possible, allocation was avoided. When allocation was necessary it was done on a physical mass basis. To derive a per unit value for manufacturing inputs such as electricity, water, and natural gas, a series of allocation calculations were adopted. The facility level of utility data was allocated based on production values of different types of products in the same manufacturing facility. Then the data is further allocated among products of different specifications based on the mass because it is believed the energy consumption and water consumption correlated better on a mass basis.

6 |
6
Production Stage (A1-A3)
TurboStick® is manufactured in Illinois, US. All the raw materials are supplied from the US. The product is a mixture of four types of substances: polyols, isocyanates, catalysts, and blowing agent, filled and shipped in a steel cylinder.
Transport to Construction Site (A4)
The product is assumed to be shipped from the manufacturing facility to distribution facilities in the US via truck. From the distribution facilities, the product is shipped to construction sites. Table 5 gives the transportation details including the distances and the truck dataset used in the model. Transport distances are calculated based on the locations of the manufacturing facility, the distribution facilities, and customers’ zip codes retrieved from the sales records.
Table 5: Transport Details
Name Details Unit
Type of transport Truck -
Fuel type Diesel -
Liters of fuel 39.0625 l/100km
Vehicle type Heavy duty diesel truck/ 45,000
lb payload -
Transport distance from the manufacturing facility to distribution
facilities 1437.95 km
Transport distance from the distribution facilities to construction
sites 880.69 km
Installation (A5)
TurboStick® can be applied directly from the cylinder through a dispensing pistol without any additional steps. Hence, no specific installation materials are required. The reference flow is calculated on the basis of the coverage rates on TurboStick®’s product data sheets and a 10% installation waste was considered to account for the possibility of some unused amount left in the product containers. The disposal of the pressure cylinder is modeled to be landfilled as it is a standard practice to deal with pressure cylinder potentially containing unused adhesive polymer, while the installation waste disposal is modeled in accordance with EPA’s Advancing Sustainable Materials Management: 2015 Fact Sheet. For TurboStick® which uses HFC-134a as the blowing agent, HFC-134a is modeled as the VOC emission flow. As the tools (dispensing pistol) used during the installation of the product are multi-use tools and can be reused after each installation, the per-functional unit impacts are considered negligible and therefore are not included. Detailed installation instructions are provided online. Packaging waste is generated and disposed of in this stage.
Table 6: Installation (A5)
Name Value Unit
Product loss per functional unit 8.09E-02 kg/ ESL
Waste materials at the construction site before waste processing, generated by product installation
0.362 kg/ ESL
Steel waste, packaging 0.281 kg/ ESL
VOC Emissions 0.154 Kg/ESL
7 |
7
Use Stage (B1-B5 & B6-B7)
Since the product is installed as part of the wall assembly, there are no use phase inputs required to maintain the product. The RSL of the product is 10 years, so five replacements are required to cover the estimated service life (ESL). The product requires no maintenance once installed. It is assumed that the product requires no repairs or refurbishments if it is properly applied. Besides the emissions to the air disclosed in the above table, there are no other emissions to air, soil or water, including those of any regulated substances.
Table 7: Replacement (B4)
Name Value Unit
Reference Service Life (RSL) 10 Years
Estimated Service Life (ESL) 60 Years
Replacement cycle 5 (ESL/RSL)-1
Declared product properties As per Product Identification section -
Design application parameters As per technical details in Table 2 -
An assumed quality of work, when installed in accordance with the manufacturer’s instructions
Industry Standard -
End-of-Life Stage (C1-C4)
In this stage, the product is transported to the waste disposal facility and processed. Due to the fact that TurboStick® is applied as part of a wall system including the external coating/finish and are not able to be dismantled based on their material type, it is reasonable to assume that the products at their end-of-life stage are landfilled.
Table 8: End-of-Life Parameters
TurboStick Unit
Collected with mixed construction waste
0.574 kg/ESL
Landfilling 100 %
Product for final deposition 0.574 kg/ESL

8 |
8
Life Cycle Assessment Results
As prescribed by ISO 21930:2017, TRACI 2.1 impact characterization methodology and IPCC 5th assessment report are adopted to calculate the environment impacts. Table 9 provides the acronym key of the impact indicators declared in this EPD.
Table 9: LCIA impact category and LCI Indicator keys
Abbreviation Parameter Unit
TRACI 2.1
AP Acidification potential of soil and water kg SO2 eq
EP Eutrophication potential kg N eq
GWP Global warming potential including biogenic carbon emission kg CO2 eq
ODP Depletion of stratospheric ozone layer kg CFC 11 eq
POCP Photochemical ozone creation potential kg O3 eq
ADP-Fossil Fuel Abiotic depletion potential for fossil resources (An indicator derived from CML
2001-Jan 2016) MJ, net calorific value
Resource Use Parameters
RPRE Renewable primary energy as energy carrier MJ, net calorific value
RPRM Renewable primary energy resources as material utilization MJ, net calorific value
NRPRE Non-renewable primary energy as energy carrier MJ, net calorific value
NRPRM Non-renewable primary energy as material utilization MJ, net calorific value
SM Use of secondary material kg
RSF Use of renewable secondary fuels MJ, net calorific value
NRSF Use of non-renewable secondary fuels MJ, net calorific value
RE Recovered energy MJ, net calorific value
FW Use of fresh water m3
Waste Parameters
HWD Disposed-of-hazardous waste kg
NHWD Disposed-of non-hazardous waste kg
HLRW High-level radioactive waste disposed kg
ILLRW Intermediate and low-level radioactive waste disposed kg
Carbon Removal and Emission Parameter
BCRP Biogenic Carbon Removal from Product kg CO2 eq
BCEP Biogenic Carbon Emission from Product kg CO2 eq
BCRK Biogenic Carbon Removal from Packaging kg CO2 eq
BCEK Biogenic Carbon Emission from Packaging kg CO2 eq
BCEW Biogenic Carbon Emission from Combustion of Waste from Renewable Sources
Used in Production Processes kg CO2 eq
CCE Calcination Carbon Emissions kg CO2 eq
CCR Carbonation Carbon Removals kg CO2 eq
CWNR Carbon Emissions from Combustion of Waste from Non- Renewable Sources used
in Production Processes kg CO2 eq
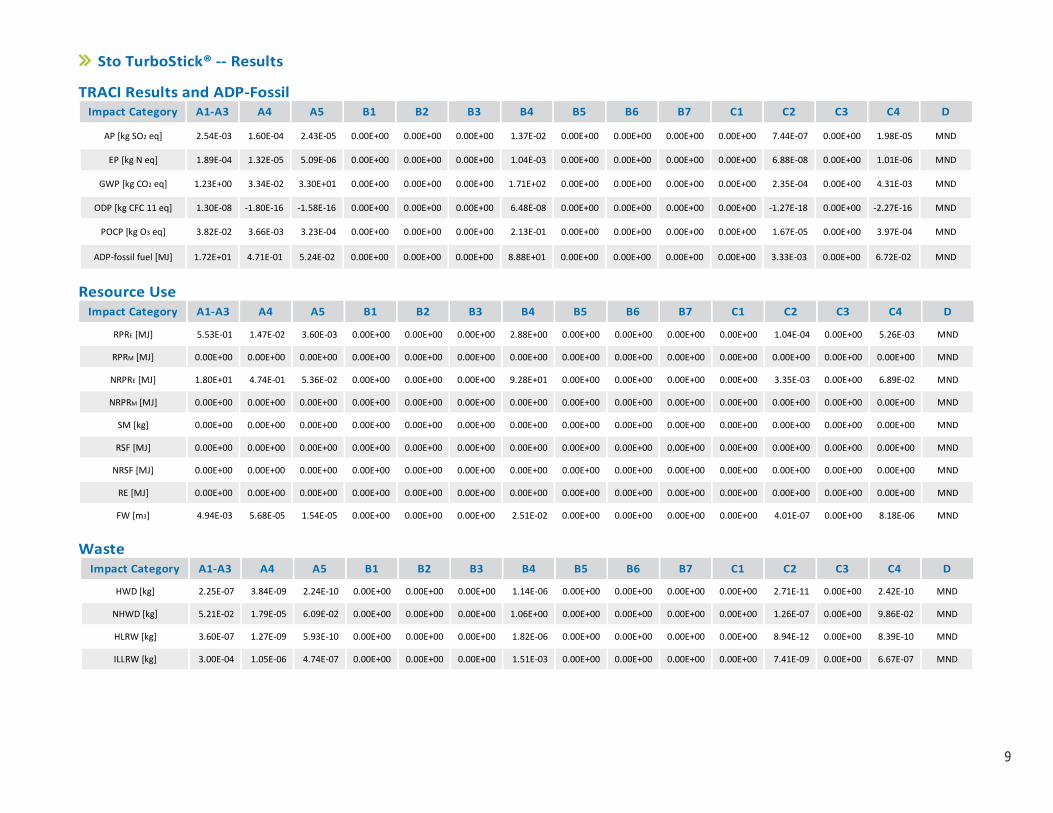
9
Sto TurboStick® -- Results
TRACI Results and ADP-Fossil Impact Category A1-A3 A4 A5 B1 B2 B3 B4 B5 B6 B7 C1 C2 C3 C4 D
AP [kg SO2 eq] 2.54E-03 1.60E-04 2.43E-05 0.00E+00 0.00E+00 0.00E+00 1.37E-02 0.00E+00 0.00E+00 0.00E+00 0.00E+00 7.44E-07 0.00E+00 1.98E-05 MND
EP [kg N eq] 1.89E-04 1.32E-05 5.09E-06 0.00E+00 0.00E+00 0.00E+00 1.04E-03 0.00E+00 0.00E+00 0.00E+00 0.00E+00 6.88E-08 0.00E+00 1.01E-06 MND
GWP [kg CO2 eq] 1.23E+00 3.34E-02 3.30E+01 0.00E+00 0.00E+00 0.00E+00 1.71E+02 0.00E+00 0.00E+00 0.00E+00 0.00E+00 2.35E-04 0.00E+00 4.31E-03 MND
ODP [kg CFC 11 eq] 1.30E-08 -1.80E-16 -1.58E-16 0.00E+00 0.00E+00 0.00E+00 6.48E-08 0.00E+00 0.00E+00 0.00E+00 0.00E+00 -1.27E-18 0.00E+00 -2.27E-16 MND
POCP [kg O3 eq] 3.82E-02 3.66E-03 3.23E-04 0.00E+00 0.00E+00 0.00E+00 2.13E-01 0.00E+00 0.00E+00 0.00E+00 0.00E+00 1.67E-05 0.00E+00 3.97E-04 MND
ADP-fossil fuel [MJ] 1.72E+01 4.71E-01 5.24E-02 0.00E+00 0.00E+00 0.00E+00 8.88E+01 0.00E+00 0.00E+00 0.00E+00 0.00E+00 3.33E-03 0.00E+00 6.72E-02 MND
Resource Use Impact Category A1-A3 A4 A5 B1 B2 B3 B4 B5 B6 B7 C1 C2 C3 C4 D
RPRE [MJ] 5.53E-01 1.47E-02 3.60E-03 0.00E+00 0.00E+00 0.00E+00 2.88E+00 0.00E+00 0.00E+00 0.00E+00 0.00E+00 1.04E-04 0.00E+00 5.26E-03 MND
RPRM [MJ] 0.00E+00 0.00E+00 0.00E+00 0.00E+00 0.00E+00 0.00E+00 0.00E+00 0.00E+00 0.00E+00 0.00E+00 0.00E+00 0.00E+00 0.00E+00 0.00E+00 MND
NRPRE [MJ] 1.80E+01 4.74E-01 5.36E-02 0.00E+00 0.00E+00 0.00E+00 9.28E+01 0.00E+00 0.00E+00 0.00E+00 0.00E+00 3.35E-03 0.00E+00 6.89E-02 MND
NRPRM [MJ] 0.00E+00 0.00E+00 0.00E+00 0.00E+00 0.00E+00 0.00E+00 0.00E+00 0.00E+00 0.00E+00 0.00E+00 0.00E+00 0.00E+00 0.00E+00 0.00E+00 MND
SM [kg] 0.00E+00 0.00E+00 0.00E+00 0.00E+00 0.00E+00 0.00E+00 0.00E+00 0.00E+00 0.00E+00 0.00E+00 0.00E+00 0.00E+00 0.00E+00 0.00E+00 MND
RSF [MJ] 0.00E+00 0.00E+00 0.00E+00 0.00E+00 0.00E+00 0.00E+00 0.00E+00 0.00E+00 0.00E+00 0.00E+00 0.00E+00 0.00E+00 0.00E+00 0.00E+00 MND
NRSF [MJ] 0.00E+00 0.00E+00 0.00E+00 0.00E+00 0.00E+00 0.00E+00 0.00E+00 0.00E+00 0.00E+00 0.00E+00 0.00E+00 0.00E+00 0.00E+00 0.00E+00 MND
RE [MJ] 0.00E+00 0.00E+00 0.00E+00 0.00E+00 0.00E+00 0.00E+00 0.00E+00 0.00E+00 0.00E+00 0.00E+00 0.00E+00 0.00E+00 0.00E+00 0.00E+00 MND
FW [m3] 4.94E-03 5.68E-05 1.54E-05 0.00E+00 0.00E+00 0.00E+00 2.51E-02 0.00E+00 0.00E+00 0.00E+00 0.00E+00 4.01E-07 0.00E+00 8.18E-06 MND
Waste Impact Category A1-A3 A4 A5 B1 B2 B3 B4 B5 B6 B7 C1 C2 C3 C4 D
HWD [kg] 2.25E-07 3.84E-09 2.24E-10 0.00E+00 0.00E+00 0.00E+00 1.14E-06 0.00E+00 0.00E+00 0.00E+00 0.00E+00 2.71E-11 0.00E+00 2.42E-10 MND
NHWD [kg] 5.21E-02 1.79E-05 6.09E-02 0.00E+00 0.00E+00 0.00E+00 1.06E+00 0.00E+00 0.00E+00 0.00E+00 0.00E+00 1.26E-07 0.00E+00 9.86E-02 MND
HLRW [kg] 3.60E-07 1.27E-09 5.93E-10 0.00E+00 0.00E+00 0.00E+00 1.82E-06 0.00E+00 0.00E+00 0.00E+00 0.00E+00 8.94E-12 0.00E+00 8.39E-10 MND
ILLRW [kg] 3.00E-04 1.05E-06 4.74E-07 0.00E+00 0.00E+00 0.00E+00 1.51E-03 0.00E+00 0.00E+00 0.00E+00 0.00E+00 7.41E-09 0.00E+00 6.67E-07 MND
10 |
10
Carbon Removal and Emission
Indicator TurboStick®
BCRP [kg CO2 eq] 1.16E-02
BCEP [kg CO2 eq] 1.70E-02
BCRK [kg CO2 eq] 1.38E-03
BCEK [kg CO2 eq] 1.41E-03
BCEW [kg CO2 eq] 0.00E+00
CCE [kg CO2 eq] 0.00E+00
CCR [kg CO2 eq] 0.00E+00
CWNR [kg CO2 eq] 0.00E+00
Interpretation
In one reference service life of the product, the production stage, which includes the raw material extraction, transportation from suppliers and manufacturing, is the highest contributor to all impact indicators with the exception of GWP. The GWP impacts from the installation stage are dominant because of the remarkably high GWP intensity of the blowing agent. From the perspective of a whole building lifespan, the vast majority of the impacts are derived from the number of replacements needed. This is directly related to the impacts associated with the manufacture of new products that are used to replace the original. Improving the relatively short lifespan of the products is essential to reducing the overall impact of the product.
Reference
• Life Cycle Assessment, LCA report for Sto Corp. WAP Sustainability, October 2019
• ISO14044:2006 Environmental Management–Life cycle assessment–Requirements and Guidelines.
• ISO 14025:2006 Environmental labels and declarations – Type III environmental declarations – Principles and Procedures.
• ISO 21930:2007 Sustainability in buildings and civil engineering works – Core rules for environmental product declarations of construction products and services.
• Sto Studio. Sto Corp, 2019. Available at https://www.stocorp.com/sto-studio-us/
• Product Bulletin – Sto TurboStick. Sto Corp. Available at https://www.stocorp.com/wp-content/content/Products_TechService/Base%20Coats%20and%20Adhesives/Product%20Bulletins/PB_81181_Sto_Turbostick_EN.pdf
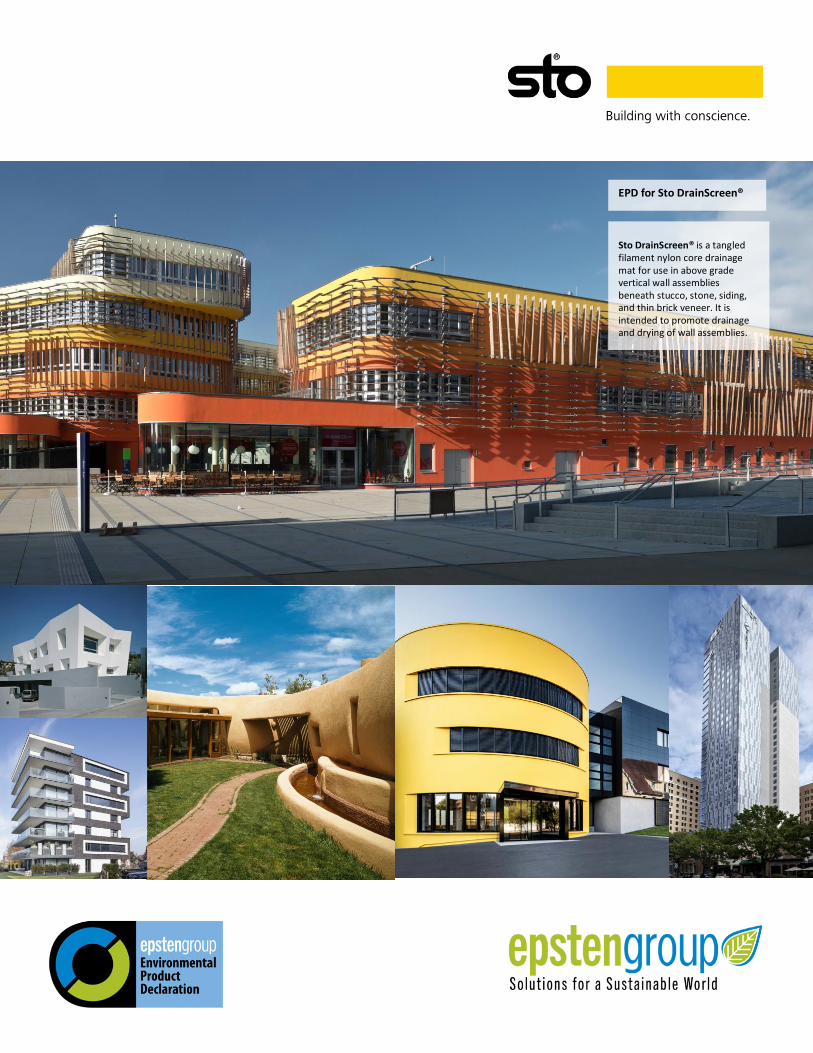
EPD for Sto DrainScreen®
Sto DrainScreen® is a tangled filament nylon core drainage mat for use in above grade vertical wall assemblies beneath stucco, stone, siding, and thin brick veneer. It is intended to promote drainage and drying of wall assemblies.

2 |
2
Manufacturer Name
Sto Corp. 3800 Camp Creek Parkway SW, Building 1400, Suite 120, Atlanta, GA 30331 www.stocorp.com | (800) 221-2397
EPD Program Operator Epsten Group 101 Marietta St. Suite 2600, Atlanta, GA 30303 www.epstengroup.com
Compliance to ISO21930:2017 Yes
Product Name Sto DrainScreen® Product’s Intended Application and Use Promote drainage and drying of wall assemblies
Declaration Number 01-005
Date of Certification December 18th, 2019
Period of Validity 5 years from date of certification
Functional Unit One square meter of covered substrate for 60 years Reference Service Life used in assessment 10 Years
Overall Data Quality Assessment Score Good
Manufacturing Location Candler, NC, USA
LCA Software and Version Number GaBi 9.2.0.58
LCI Database and Version Number GaBi Database, Service Pack 39
ISO 21930: 2017 serves as the core PCR Independent verification of the declaration and data, according to ISO 21930:2017 and ISO 14025:2006
Internal External
Kate McFeaters [email protected]
This life cycle assessment was conducted in accordance with ISO 14044 and the reference PCR by:
WAP Sustainability Consulting, LLC
This life cycle assessment was independently verified in accordance with ISO 14044 and the reference PCR by:
Kate McFeaters [email protected]
Comparability
In order to support comparative assertions, this EPD meets all comparability requirements stated in ISO 14025:2006. However, differences in certain assumptions, data quality, and variability between LCA data sets may still exist. As such, caution should be exercised when evaluating EPDs from different m anufacturers, as the EPD results may not be entirely comparable. Any EPD comparison must be carried out at the building level per ISO 21930 guidelines. The results of this EPD reflect an average performance by the product and its actual impacts may vary on a case-to-case basis.
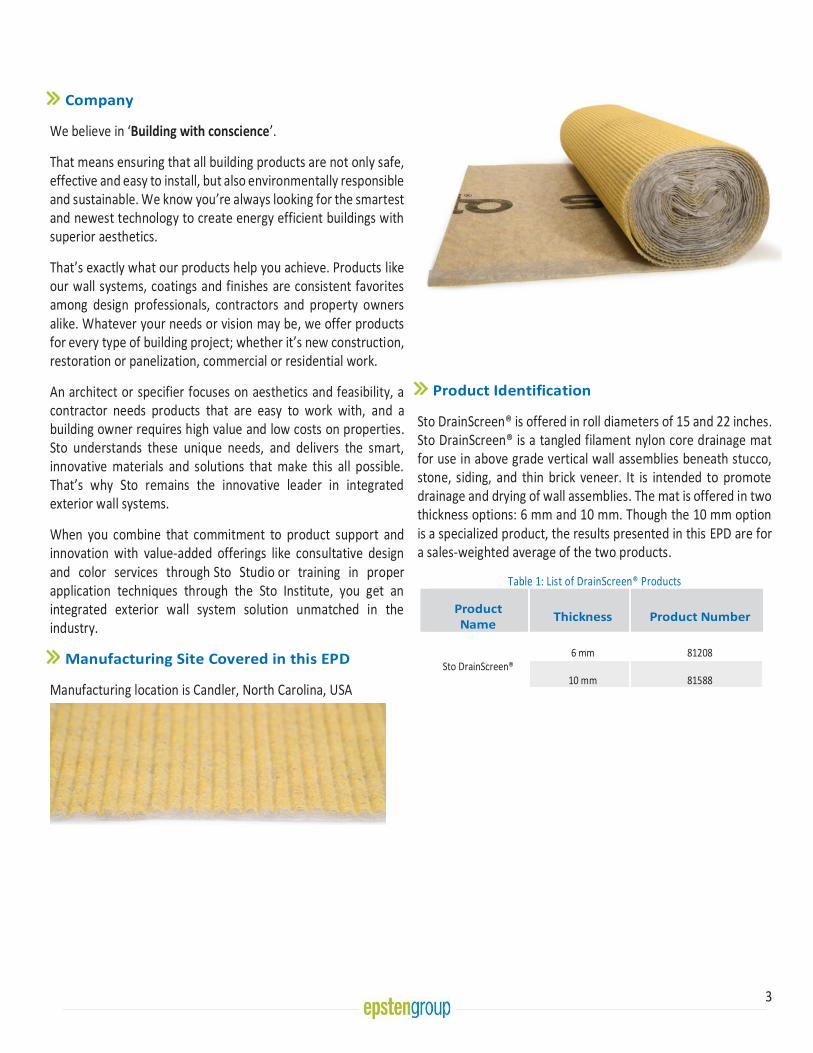
3 |
3
Company
We believe in ‘Building with conscience’.
That means ensuring that all building products are not only safe, effective and easy to install, but also environmentally responsible and sustainable. We know you’re always looking for the smartest and newest technology to create energy efficient buildings with superior aesthetics.
That’s exactly what our products help you achieve. Products like our wall systems, coatings and finishes are consistent favorites among design professionals, contractors and property owners alike. Whatever your needs or vision may be, we offer products for every type of building project; whether it’s new construction, restoration or panelization, commercial or residential work.
An architect or specifier focuses on aesthetics and feasibility, a contractor needs products that are easy to work with, and a building owner requires high value and low costs on properties. Sto understands these unique needs, and delivers the smart, innovative materials and solutions that make this all possible. That’s why Sto remains the innovative leader in integrated exterior wall systems.
When you combine that commitment to product support and innovation with value-added offerings like consultative design and color services through Sto Studio or training in proper application techniques through the Sto Institute, you get an integrated exterior wall system solution unmatched in the industry.
Manufacturing Site Covered in this EPD
Manufacturing location is Candler, North Carolina, USA
Product Identification
Sto DrainScreen® is offered in roll diameters of 15 and 22 inches. Sto DrainScreen® is a tangled filament nylon core drainage mat for use in above grade vertical wall assemblies beneath stucco, stone, siding, and thin brick veneer. It is intended to promote drainage and drying of wall assemblies. The mat is offered in two thickness options: 6 mm and 10 mm. Though the 10 mm option is a specialized product, the results presented in this EPD are for a sales-weighted average of the two products.
Table 1: List of DrainScreen® Products
Product Name
Thickness Product Number
Sto DrainScreen® 6 mm 81208
10 mm 81588
4 |
4
Product Description
Sto DrainScreen® is a drainage mat between the cladding and the fully adhered air and moisture barrier. Should water reach the back of the cladding, it can drain from the wall assembly via the drainage mat, which also helps speed the drying. Drainage and drying can be particularly important in hot and humid climates and in areas with wind-driven rain. Sto DrainScreen® functions as a wall cavity drainage component.
• Promotes drainage and drying in stucco, cement board stucco, stone, siding and thin-brick veneer wall assemblies;
• Water vapor moves freely through the drainage mat layer;
• Easy to handle, carry and roll onto the wall; and
• Prevents stucco or mortar from penetration into the cavity for unobstructed drainage
Performance Features
Drainage and ventilation mat Highly breathable Lightweight, narrow diameter rolls Laminated with lightweight breathable fabric
Technical Details
Table 2: Technical Data*
Performance Test Method Test Criteria Result
Flame Spread ASTM E-84 Flame Spread: ≤25
Smoke Developed: ≤450
Flame Spread: <25
Smoke Developed: <75
Thickness (nominal) Measure n/a Nominal ¼” (6mm)
Nominal 3/8” (10mm)
Building Code Compliance Meets requirements of NFPA 285 for use on all Types of construction; refer to ICC ESR 1233
*Results are based on lab testing under controlled conditions. Results can vary between labs or from field tests.
Material Composition
The material composition of DrainScreen® is listed below:
Table 3: Material composition of DrainScreen®
Ingredient DrainScreen®
Polypropylene 70-75%
Polyester 10-11%
Elastomeric Copolymer Modifier
6-8%
Nylon 6 4-5%
Flame Retardant 3-4%
Colorant 2-3%
Components related to Life Cycle Assessment
The functional unit for the EPD was covering 1 square meter (m2) of substrate for a period of 60 years—the assumed lifetime of a building. The reference flow required for the functional unit is calculated based on the product lifespan scenarios prescribed in ISO 21930:2017. The reference service life of the product is 10 years which is the warranty of Sto’s wall system. The reference flow required for one functional unit is provided in Table 4.
Table 4: Reference flow and Functional Unit
Product Functional Unit [1 m2] Reference Flow
[kg]
DrainScreen® 1 2.15
5 |
5
Scope and Boundaries of the Life Cycle Assessment
The LCA was performed in accordance with ISO 14040 standards. The study is a cradle-to-grave LCA and includes the following life stages as prescribed in ISO 21930:2017.
Figure 1: Life stages for the cradle-to-grave LCA
Cut-off Criteria
Material inputs greater than 1% (based on total mass of the final product) were included within the scope of analysis. Material inputs less than 1% were included if sufficient data was available to warrant inclusion and/or the material input was thought to have significant environmental impact. Cumulative excluded material inputs and environmental impacts are less than 5% based on total weight of the functional unit.
Data Quality
The overall data quality level was determined to be good. Primary data as it relates to formulation was collected from the manufacturing facility in North Carolina, USA for the 2018 reference year. For manufacturing specific data, data from Sto facilities manufacturing similar products was used. When primary data did not exist, secondary data were obtained from the Gabi V9.2.0.58 Database Service Pack 39. Overall, both primary and secondary data are considered acceptable quality in terms of geographic, temporal and technological coverage.
Estimates and Assumption
Assumptions were made to represent the cradle-to-grave environmental performance of Sto’s products. These assumptions include up stream and downstream transportation distances, the disposal of packaging material, the method in which the product is disposed of at its end of life and relevant use phase assumptions.

6 |
6
Allocation
General principles of allocation were based on ISO 14040/44. Where possible, allocation was avoided. When allocation was necessary it was done on a physical mass basis. Utility data was allocated based on production values of different types of production in the same manufacturing facility. Then the data was further allocated among products of different specifications based on the mass because it is believed the energy consumption and water consumption correlated better on a mass basis.
Production Stage (A1-A3)
DrainScreen® is manufactured in North Carolina, US. It consists of two layers: the core layer is mainly made of polypropylene and thermoplastic elastomer; and the fabric is made of nylon 6 fiber and polyester fiber. The mass ratio of core layer to fabric varies with the thickness options of DrainScreen®. For 6-mm version, the core layer takes up 84.48% and the percentage rises to 87.72% in 10-mm version. In this study, a weighted average based on the sales records in 2018 is calculated and used. The final product is packaged on cardboard trays and shipped on wood pallets.
Transport to Construction Site (A4)
The product is assumed to be shipped from the manufacturing facility to distribution facilities in the US via truck. From the distribution facilities, the product is shipped to construction sites. Table 5 gives the transportation details including the distances and the truck dataset used in the model. Transport distances are calculated based on the locations of the manufacturing facility, the distribution facilities, and customers’ zip codes retrieved from the sales records.
Table 5: Transport Details
Name Details Unit
Type of transport Truck -
Fuel type Diesel -
Liters of fuel 39.0625 l/100km
Vehicle type Heavy duty diesel truck/ 45,000
lb payload -
Transport distance from the manufacturing facility to distribution
facilities 1293.48 km
Transport distance from the distribution facilities to construction
sites 769.37 km
Installation (A5)
DrainScreen® is installed as part of the wall assembly and no specific installation materials are required. The reference flow is calculated on the basis of the coverage rates on DrainScreen®’s product data sheets and a 10% installation waste was considered to account for the possibility of trimming. The disposal of the installation waste and packaging waste are modeled in accordance with EPA’s Advancing Sustainable Materials Management: 2015 Fact Sheet. As the tools used during the installation of the product are multi-use tools and can be reused after each installation, the per-functional unit impacts are considered negligible and therefore are not included. Detailed installation instructions are provided online. Packaging waste is generated and disposed of in this stage.
7 |
7
Table 6: Installation (A5)
Name Value Unit
Product loss per functional unit 1.075 kg/ ESL
Waste materials at the construction site before waste processing, generated by product installation
1.626 kg/ ESL
Plastic waste, packaging 0.221 kg/ ESL
Cardboard waste, packaging 0.039 kg/ ESL
Wood waste, packaging 0.291 kg/ ESL
Direct emissions to ambient air, soil, water 0 kg
Use Stage (B1-B5 & B6-B7)
Since the product is installed as part of the wall assembly, there are no use phase inputs required to maintain the product and there are no any emissions including any regulated substances to air, soil and water during the use phase. The RSL of the product is 10 years, so five replacements are required to cover the estimated service life (ESL). The product requires no maintenance once installed. It is assumed that the product requires no repairs or refurbishments if it is properly installed.
Table 7: Replacement (B4)
Name Value Unit
Reference Service Life (RSL) 10 Years
Estimated Service Life (ESL) 60 Years
Replacement cycle 5 (ESL/RSL)-1
Declared product properties As per Product Identification section -
Design application parameters As per technical details in Table 2 -
An assumed quality of work, when installed in accordance with the manufacturer’s instructions
Industry Standard -
End-of-Life Stage (C1-C4)
In this stage, the product at its end of life is transported to the waste disposal facility and processed. Included in this stage are the following:
• Deconstruction – There are no impacts during this stage as the product is manually removed.
• Transportation to disposal – Estimated fuel requirements made based on weight of product and average distance to landfill.
• Waste processing for landfilling — This process is included in the landfilling process.
• Waste disposal — Due to the fact that all the products in study are installed as part of a wall system including the external coating/finish, and are not able to be dismantled based on their material type, it is reasonable to assume that the products at their end-of-life stage are landfilled.
• Table 8: End-of-Life Parameters
DrainScreen® Unit
Collected with mixed construction waste
1.94 kg/ESL
Landfilling 100 %
Product for final deposition 1.94 kg/ESL
8 |
8
Life Cycle Assessment Results
As prescribed by the ISO 21930:2017, TRACI 2.1 impact characterization methodology and IPCC 5th assessment report are adopted to calculate the environment impacts. Table 9 provides the acronym key for the impact indicators declared in this EPD.
Table 9: LCIA impact category and LCI Indicator keys
Abbreviation Parameter Unit
TRACI 2.1
AP Acidification potential of soil and water kg SO2 eq
EP Eutrophication potential kg N eq
GWP Global warming potential including biogenic carbon emission kg CO2 eq
ODP Depletion of stratospheric ozone layer kg CFC 11 eq
POCP Photochemical ozone creation potential kg O3 eq
ADP-Fossil Fuel Abiotic depletion potential for fossil resources (An indicator derived from CML
2001-Jan 2016) MJ, net calorific value
Resource Use Parameters
RPRE Renewable primary energy as energy carrier MJ, net calorific value
RPRM Renewable primary energy resources as material utilization MJ, net calorific value
NRPRE Non-renewable primary energy as energy carrier MJ, net calorific value
NRPRM Non-renewable primary energy as material utilization MJ, net calorific value
SM Use of secondary material kg
RSF Use of renewable secondary fuels MJ, net calorific value
NRSF Use of non-renewable secondary fuels MJ, net calorific value
RE Recovered energy MJ, net calorific value
FW Use of fresh water m3
Waste Parameters
HWD Disposed-of-hazardous waste kg
NHWD Disposed-of non-hazardous waste kg
HLRW High-level radioactive waste disposed kg
ILLRW Intermediate and low-level radioactive waste disposed kg
Carbon Removal and Emission Parameter
BCRP Biogenic Carbon Removal from Product kg CO2 eq
BCEP Biogenic Carbon Emission from Product kg CO2 eq
BCRK Biogenic Carbon Removal from Packaging kg CO2 eq
BCEK Biogenic Carbon Emission from Packaging kg CO2 eq
BCEW Biogenic Carbon Emission from Combustion of Waste from Renewable Sources
Used in Production Processes kg CO2 eq
CCE Calcination Carbon Emissions kg CO2 eq
CCR Carbonation Carbon Removals kg CO2 eq
CWNR Carbon Emissions from Combustion of Waste from Non- Renewable Sources used
in Production Processes kg CO2 eq
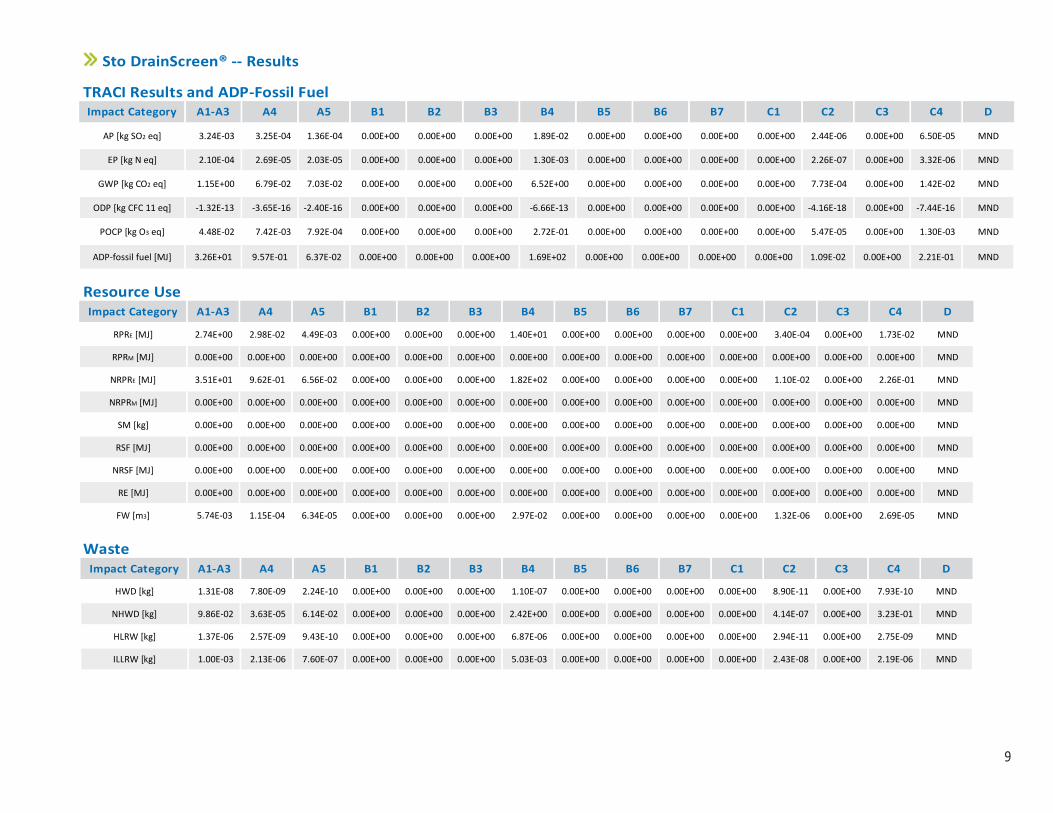
9
Sto DrainScreen® -- Results
TRACI Results and ADP-Fossil Fuel Impact Category A1-A3 A4 A5 B1 B2 B3 B4 B5 B6 B7 C1 C2 C3 C4 D
AP [kg SO2 eq] 3.24E-03 3.25E-04 1.36E-04 0.00E+00 0.00E+00 0.00E+00 1.89E-02 0.00E+00 0.00E+00 0.00E+00 0.00E+00 2.44E-06 0.00E+00 6.50E-05 MND
EP [kg N eq] 2.10E-04 2.69E-05 2.03E-05 0.00E+00 0.00E+00 0.00E+00 1.30E-03 0.00E+00 0.00E+00 0.00E+00 0.00E+00 2.26E-07 0.00E+00 3.32E-06 MND
GWP [kg CO2 eq] 1.15E+00 6.79E-02 7.03E-02 0.00E+00 0.00E+00 0.00E+00 6.52E+00 0.00E+00 0.00E+00 0.00E+00 0.00E+00 7.73E-04 0.00E+00 1.42E-02 MND
ODP [kg CFC 11 eq] -1.32E-13 -3.65E-16 -2.40E-16 0.00E+00 0.00E+00 0.00E+00 -6.66E-13 0.00E+00 0.00E+00 0.00E+00 0.00E+00 -4.16E-18 0.00E+00 -7.44E-16 MND
POCP [kg O3 eq] 4.48E-02 7.42E-03 7.92E-04 0.00E+00 0.00E+00 0.00E+00 2.72E-01 0.00E+00 0.00E+00 0.00E+00 0.00E+00 5.47E-05 0.00E+00 1.30E-03 MND
ADP-fossil fuel [MJ] 3.26E+01 9.57E-01 6.37E-02 0.00E+00 0.00E+00 0.00E+00 1.69E+02 0.00E+00 0.00E+00 0.00E+00 0.00E+00 1.09E-02 0.00E+00 2.21E-01 MND
Resource Use Impact Category A1-A3 A4 A5 B1 B2 B3 B4 B5 B6 B7 C1 C2 C3 C4 D
RPRE [MJ] 2.74E+00 2.98E-02 4.49E-03 0.00E+00 0.00E+00 0.00E+00 1.40E+01 0.00E+00 0.00E+00 0.00E+00 0.00E+00 3.40E-04 0.00E+00 1.73E-02 MND
RPRM [MJ] 0.00E+00 0.00E+00 0.00E+00 0.00E+00 0.00E+00 0.00E+00 0.00E+00 0.00E+00 0.00E+00 0.00E+00 0.00E+00 0.00E+00 0.00E+00 0.00E+00 MND
NRPRE [MJ] 3.51E+01 9.62E-01 6.56E-02 0.00E+00 0.00E+00 0.00E+00 1.82E+02 0.00E+00 0.00E+00 0.00E+00 0.00E+00 1.10E-02 0.00E+00 2.26E-01 MND
NRPRM [MJ] 0.00E+00 0.00E+00 0.00E+00 0.00E+00 0.00E+00 0.00E+00 0.00E+00 0.00E+00 0.00E+00 0.00E+00 0.00E+00 0.00E+00 0.00E+00 0.00E+00 MND
SM [kg] 0.00E+00 0.00E+00 0.00E+00 0.00E+00 0.00E+00 0.00E+00 0.00E+00 0.00E+00 0.00E+00 0.00E+00 0.00E+00 0.00E+00 0.00E+00 0.00E+00 MND
RSF [MJ] 0.00E+00 0.00E+00 0.00E+00 0.00E+00 0.00E+00 0.00E+00 0.00E+00 0.00E+00 0.00E+00 0.00E+00 0.00E+00 0.00E+00 0.00E+00 0.00E+00 MND
NRSF [MJ] 0.00E+00 0.00E+00 0.00E+00 0.00E+00 0.00E+00 0.00E+00 0.00E+00 0.00E+00 0.00E+00 0.00E+00 0.00E+00 0.00E+00 0.00E+00 0.00E+00 MND
RE [MJ] 0.00E+00 0.00E+00 0.00E+00 0.00E+00 0.00E+00 0.00E+00 0.00E+00 0.00E+00 0.00E+00 0.00E+00 0.00E+00 0.00E+00 0.00E+00 0.00E+00 MND
FW [m3] 5.74E-03 1.15E-04 6.34E-05 0.00E+00 0.00E+00 0.00E+00 2.97E-02 0.00E+00 0.00E+00 0.00E+00 0.00E+00 1.32E-06 0.00E+00 2.69E-05 MND
Waste Impact Category A1-A3 A4 A5 B1 B2 B3 B4 B5 B6 B7 C1 C2 C3 C4 D
HWD [kg] 1.31E-08 7.80E-09 2.24E-10 0.00E+00 0.00E+00 0.00E+00 1.10E-07 0.00E+00 0.00E+00 0.00E+00 0.00E+00 8.90E-11 0.00E+00 7.93E-10 MND
NHWD [kg] 9.86E-02 3.63E-05 6.14E-02 0.00E+00 0.00E+00 0.00E+00 2.42E+00 0.00E+00 0.00E+00 0.00E+00 0.00E+00 4.14E-07 0.00E+00 3.23E-01 MND
HLRW [kg] 1.37E-06 2.57E-09 9.43E-10 0.00E+00 0.00E+00 0.00E+00 6.87E-06 0.00E+00 0.00E+00 0.00E+00 0.00E+00 2.94E-11 0.00E+00 2.75E-09 MND
ILLRW [kg] 1.00E-03 2.13E-06 7.60E-07 0.00E+00 0.00E+00 0.00E+00 5.03E-03 0.00E+00 0.00E+00 0.00E+00 0.00E+00 2.43E-08 0.00E+00 2.19E-06 MND
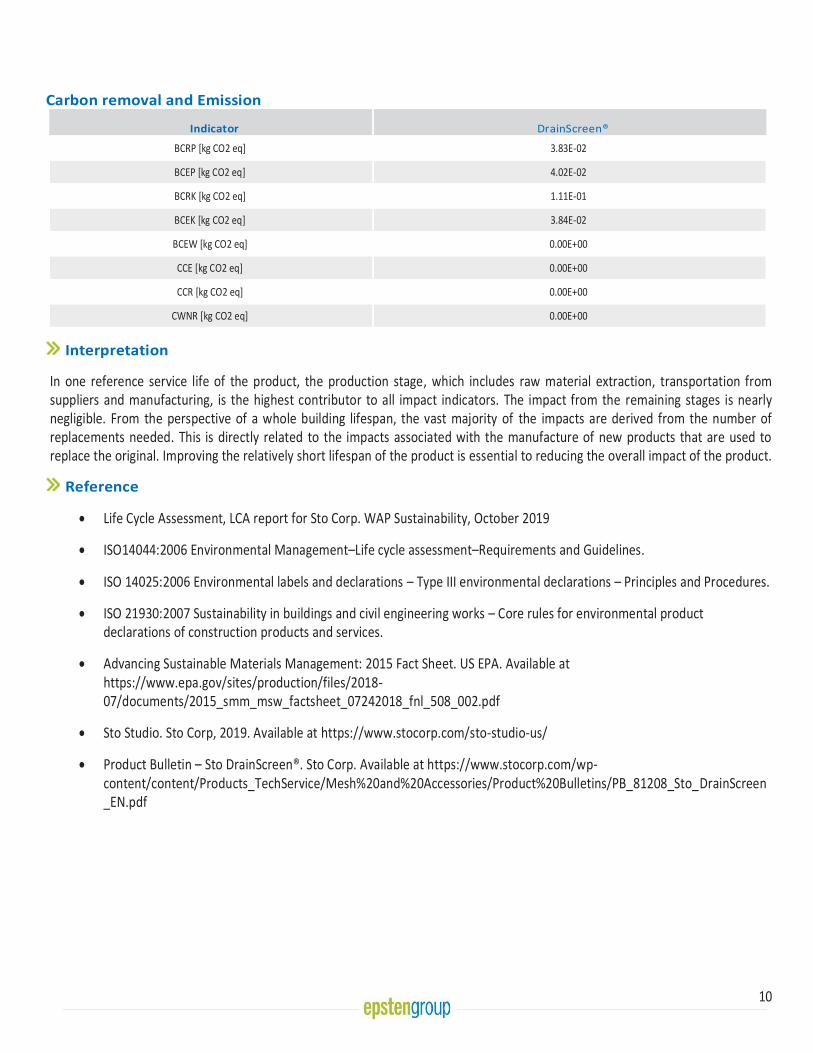
10 |
10
Carbon removal and Emission
Indicator DrainScreen®
BCRP [kg CO2 eq] 3.83E-02
BCEP [kg CO2 eq] 4.02E-02
BCRK [kg CO2 eq] 1.11E-01
BCEK [kg CO2 eq] 3.84E-02
BCEW [kg CO2 eq] 0.00E+00
CCE [kg CO2 eq] 0.00E+00
CCR [kg CO2 eq] 0.00E+00
CWNR [kg CO2 eq] 0.00E+00
Interpretation
In one reference service life of the product, the production stage, which includes raw material extraction, transportation from suppliers and manufacturing, is the highest contributor to all impact indicators. The impact from the remaining stages is nearly negligible. From the perspective of a whole building lifespan, the vast majority of the impacts are derived from the number of replacements needed. This is directly related to the impacts associated with the manufacture of new products that are used to replace the original. Improving the relatively short lifespan of the product is essential to reducing the overall impact of the product.
Reference
• Life Cycle Assessment, LCA report for Sto Corp. WAP Sustainability, October 2019
• ISO14044:2006 Environmental Management–Life cycle assessment–Requirements and Guidelines.
• ISO 14025:2006 Environmental labels and declarations – Type III environmental declarations – Principles and Procedures.
• ISO 21930:2007 Sustainability in buildings and civil engineering works – Core rules for environmental product declarations of construction products and services.
• Advancing Sustainable Materials Management: 2015 Fact Sheet. US EPA. Available at https://www.epa.gov/sites/production/files/2018-07/documents/2015_smm_msw_factsheet_07242018_fnl_508_002.pdf
• Sto Studio. Sto Corp, 2019. Available at https://www.stocorp.com/sto-studio-us/
• Product Bulletin – Sto DrainScreen®. Sto Corp. Available at https://www.stocorp.com/wp-content/content/Products_TechService/Mesh%20and%20Accessories/Product%20Bulletins/PB_81208_Sto_DrainScreen_EN.pdf
EPD for Stolit® in varied textures
Product Textures: 1.0, 1.0 Dark, 1.5, 1.5 Dark, Freeform, Freeform Dark, R1.5, R1.5 Dark
Stolit ® is a ready-mixed premium acrylic based exterior or interior textured wall finish enhanced with advanced polymer technology, designed for use as a finish coat over prepared vertical concrete, masonry or plaster substrates and in StoTherm ® ci wall claddings.

2 |
2
PCR Identification
PCR for Architectural Coatings: NAICS 325510 on the basis of ISO 21930:2007, NSF International, 2017. Valid through June 23, 2022
Compliance to ISO1 4040/44, ISO 14025 and ISO 21930 Yes
Product Category Exterior Coating
Manufacturer’s name
Sto Corp. 3800 Camp Creek Parkway SW, Building 1400, Suite 120 Atlanta, GA 30331 www.stocorp.com | (800) 221-2397
EPD program operator Epsten Group 101 Marietta St. Suite 2600, Atlanta, GA 30303 www.epstengroup.com
Declaration Number 01-001
Date of Certification December 18th, 2019
Period of Validity 5 years from date of certification
Functional Unit One square meter of covered and protected substrate for 60 years
Market-base life used in assessment 10 Years
Design life used in assessment 5 Years
Test method employed for determination of design life Product default warranty
Amount of colorant needed See Table 3
Overall Data Quality Assessment Score Good
Site(s) in which the results of the LCA are representative STO manufacturing sites in Atlanta, Georgia; Glendale, Arizona; and Rutland, Vermont
Information on where explanatory material can be obtained See references at the end of this document.
LCA Software and Version Number GaBi 9.2.0.58
LCI Database and Version Number GaBi Database Version 8.7, Service Pack 39
This declaration was independently verified in accordance with ISO 14025: 2006 and the reference PCR: PCR for Architectural Coatings: NAICS 325510
Internal External
Kate McFeaters [email protected]
This life cycle assessment was conducted in accordance with ISO 14044 and the reference PCR by:
WAP Sustainability Consulting, LLC
This life cycle assessment was independently verified in accordance with ISO 14040/44 and the reference PCR by:
Kate McFeaters [email protected]
Comparability
In order to support comparative assertions, this EPD meets all comparability requirements stated in ISO 14025:2006. However, differences in certain assumptions, data quality, and variability between LCA data sets may still exist. As such, caution should be exercised when evaluating EPDs from different manufacturers, as the EPD results may not be entirely comparable. Any EPD comparison must be carried out at the building level per ISO 21930 guidelines. The results of this EPD re flect an average performance by the product and its actual impacts may vary on a case-to-case basis.
3 |
3
Company
We believe in ‘Building with conscience’.
That means ensuring that all building products are not only safe, effective and easy to install, but also environmentally responsible and sustainable. We know you’re always looking for the smartest and newest technology to create energy efficient buildings with superior aesthetics.
That’s exactly what our products help you achieve. Products like our wall systems, coatings and finishes are consistent favorites among design professionals, contractors and property owners alike. Whatever your needs or vision may be, we offer products for every type of building project; whether it’s new construction, restoration or panelization, commercial or residential work.
An architect or specifier focuses on aesthetics and feasibility, a contractor needs products that are easy to work with, and a building owner requires high value and low costs on properties. Sto understands these unique needs, and delivers the smart, innovative materials and solutions that make this all possible. That’s why Sto remains the innovative leader in integrated exterior wall systems.
When you combine that commitment to product support and innovation with value-added offerings like consultative design and color services through Sto Studio or training in proper application techniques through the Sto Institute, you get an integrated exterior wall system solution unmatched in the industry.
Manufacturing Sites Covered in this EPD
Atlanta Plant
Glendale Plant
Rutland Plant
Product Identification
Stolit® finishes are offered in various coarseness and color bases that allow more freedom in building exterior designing and finishing. Table 1 lists the products declared in this EPD.
Table 1: List of Stolit® Products
Product Name
Product Number
Base Type
Finish Type
Stolit® 1.0 80130 Tintable White
Fine
Stolit® 1.0 Dark Colors
82130 Deep Fine
Stolit® 1.5 80131 Tintable White
Medium
Stolit® 1.5 Dark Colors
82131 Deep Medium
Stolit® Freeform 80156 Tintable White
Freeform
Stolit® Freeform Dark Colors
82156 Deep Freeform
Stolit® R1.5 80141 Tintable White
Swirl
Stolit® R1.5 Dark Colors
82141 Deep Swirl
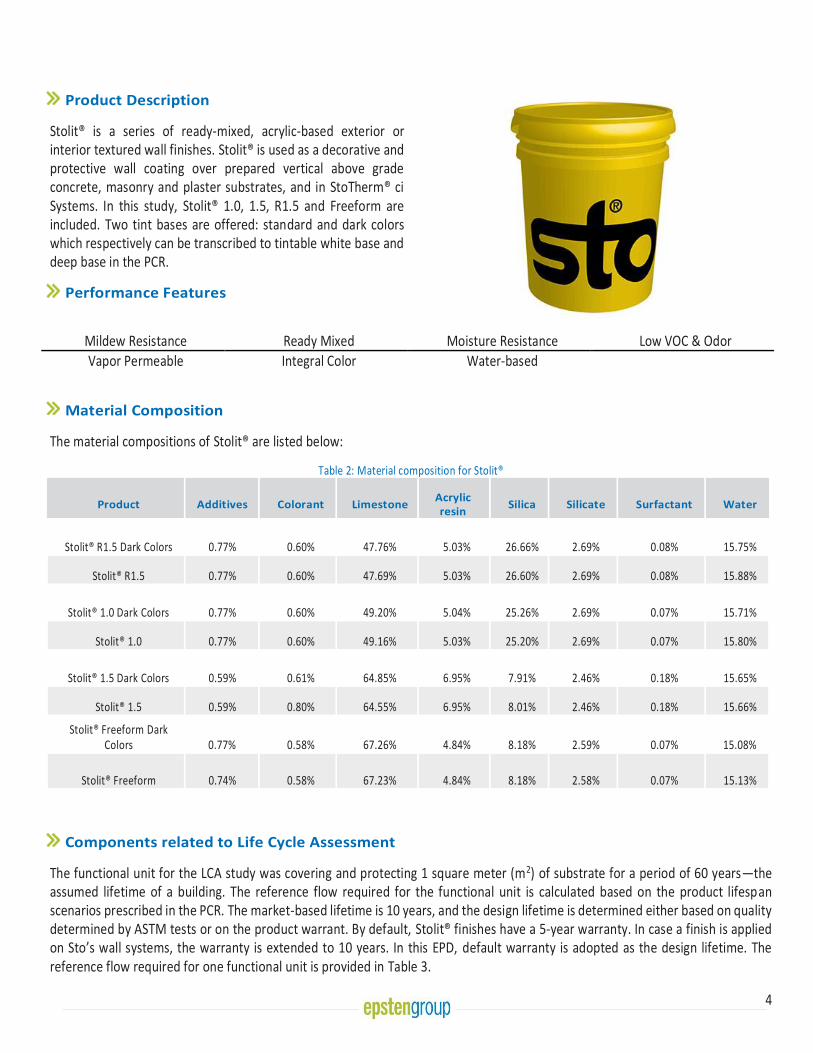
4 |
4
Product Description
Stolit® is a series of ready-mixed, acrylic-based exterior or interior textured wall finishes. Stolit® is used as a decorative and protective wall coating over prepared vertical above grade concrete, masonry and plaster substrates, and in StoTherm® ci Systems. In this study, Stolit® 1.0, 1.5, R1.5 and Freeform are included. Two tint bases are offered: standard and dark colors which respectively can be transcribed to tintable white base and deep base in the PCR.
Performance Features
Mildew Resistance Ready Mixed Moisture Resistance Low VOC & Odor
Vapor Permeable
Integral Color
Water-based
Material Composition
The material compositions of Stolit® are listed below:
Table 2: Material composition for Stolit®
Product Additives Colorant Limestone Acrylic resin
Silica Silicate Surfactant Water
Stolit® R1.5 Dark Colors 0.77% 0.60% 47.76% 5.03% 26.66% 2.69% 0.08% 15.75%
Stolit® R1.5 0.77% 0.60% 47.69% 5.03% 26.60% 2.69% 0.08% 15.88%
Stolit® 1.0 Dark Colors 0.77% 0.60% 49.20% 5.04% 25.26% 2.69% 0.07% 15.71%
Stolit® 1.0 0.77% 0.60% 49.16% 5.03% 25.20% 2.69% 0.07% 15.80%
Stolit® 1.5 Dark Colors 0.59% 0.61% 64.85% 6.95% 7.91% 2.46% 0.18% 15.65%
Stolit® 1.5 0.59% 0.80% 64.55% 6.95% 8.01% 2.46% 0.18% 15.66%
Stolit® Freeform Dark Colors 0.77% 0.58% 67.26% 4.84% 8.18% 2.59% 0.07% 15.08%
Stolit® Freeform 0.74% 0.58% 67.23% 4.84% 8.18% 2.58% 0.07% 15.13%
Components related to Life Cycle Assessment
The functional unit for the LCA study was covering and protecting 1 square meter (m2) of substrate for a period of 60 years—the assumed lifetime of a building. The reference flow required for the functional unit is calculated based on the product lifespan scenarios prescribed in the PCR. The market-based lifetime is 10 years, and the design lifetime is determined either based on quality determined by ASTM tests or on the product warrant. By default, Stolit® finishes have a 5-year warranty. In case a finish is applied on Sto’s wall systems, the warranty is extended to 10 years. In this EPD, default warranty is adopted as the design lifetime. The reference flow required for one functional unit is provided in Table 3.

5 |
5
Table 3: Market-based lifetime and reference flow
Functional
Unit Reference Flow [kg]
Tint needed*
[kg]
Reference Flow [kg]
Tint needed*
[kg]
Lifespan Design Lifetime [5 years] Market-based Lifetime [10 years]
Stolit® R1.5 Dark Colors 1 30.59 2.69 15.29 1.35
Stolit® R1.5 1 30.59 0.79 15.29 0.40
Stolit® 1.0 Dark Colors 1 29.58 2.60 14.80 1.30
Stolit® 1.0 1 29.58 0.77 14.80 0.38
Stolit® 1.5 Dark Colors 1 34.05 3.00 17.03 1.50
Stolit® 1.5 1 34.05 0.88 17.03 0.44
Stolit® Freeform Dark Colors 1 53.08 4.66 26.53 2.33
Stolit® Freeform 1 53.08 1.37 26.53 0.69
Scope and Boundaries of the Life Cycle Assessment
The LCA was performed in accordance with ISO 14040 standards. The study is a cradle-to-grave LCA and includes the following life stages as prescribed in the PCR.
Figure 1: Life stages for the cradle-to-grave LCA
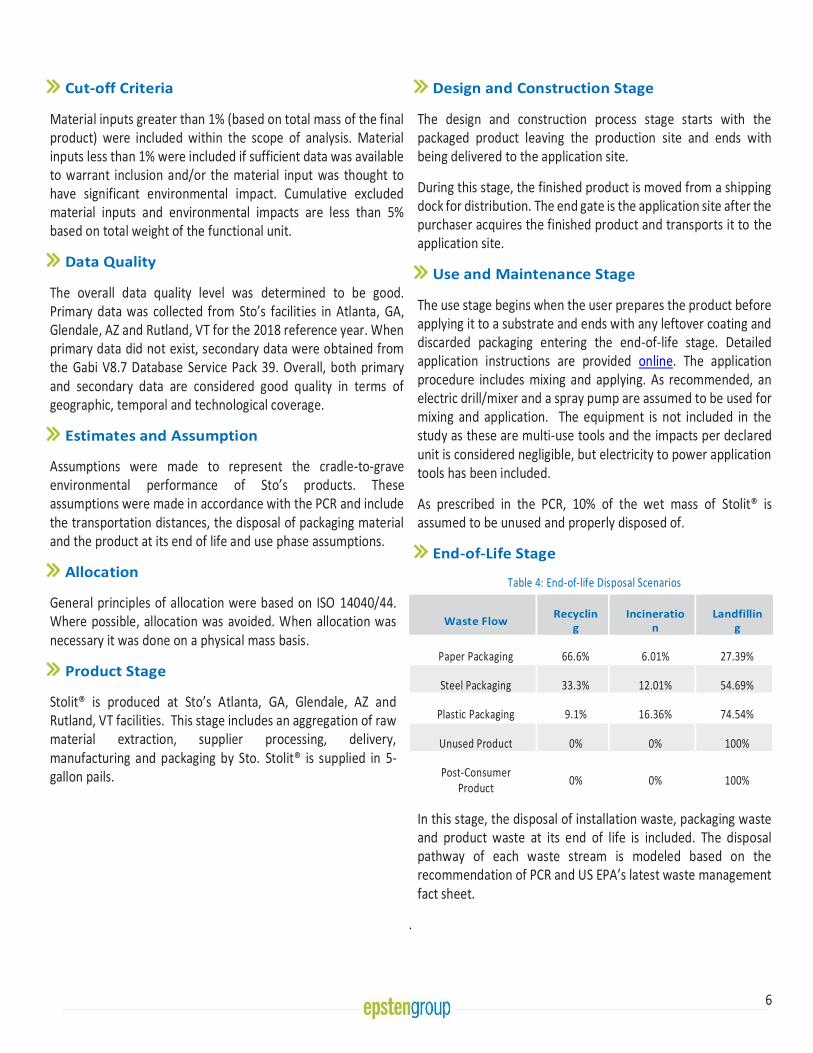
6 |
6
Cut-off Criteria
Material inputs greater than 1% (based on total mass of the final product) were included within the scope of analysis. Material inputs less than 1% were included if sufficient data was available to warrant inclusion and/or the material input was thought to have significant environmental impact. Cumulative excluded material inputs and environmental impacts are less than 5% based on total weight of the functional unit.
Data Quality
The overall data quality level was determined to be good. Primary data was collected from Sto’s facilities in Atlanta, GA, Glendale, AZ and Rutland, VT for the 2018 reference year. When primary data did not exist, secondary data were obtained from the Gabi V8.7 Database Service Pack 39. Overall, both primary and secondary data are considered good quality in terms of geographic, temporal and technological coverage.
Estimates and Assumption
Assumptions were made to represent the cradle-to-grave environmental performance of Sto’s products. These assumptions were made in accordance with the PCR and include the transportation distances, the disposal of packaging material and the product at its end of life and use phase assumptions.
Allocation
General principles of allocation were based on ISO 14040/44. Where possible, allocation was avoided. When allocation was necessary it was done on a physical mass basis.
Product Stage
Stolit® is produced at Sto’s Atlanta, GA, Glendale, AZ and Rutland, VT facilities. This stage includes an aggregation of raw material extraction, supplier processing, delivery, manufacturing and packaging by Sto. Stolit® is supplied in 5-gallon pails.
Design and Construction Stage
The design and construction process stage starts with the packaged product leaving the production site and ends with being delivered to the application site.
During this stage, the finished product is moved from a shipping dock for distribution. The end gate is the application site after the purchaser acquires the finished product and transports it to the application site.
Use and Maintenance Stage
The use stage begins when the user prepares the product before applying it to a substrate and ends with any leftover coating and discarded packaging entering the end-of-life stage. Detailed application instructions are provided online. The application procedure includes mixing and applying. As recommended, an electric drill/mixer and a spray pump are assumed to be used for mixing and application. The equipment is not included in the study as these are multi-use tools and the impacts per declared unit is considered negligible, but electricity to power application tools has been included.
As prescribed in the PCR, 10% of the wet mass of Stolit® is assumed to be unused and properly disposed of.
End-of-Life Stage
Table 4: End-of-life Disposal Scenarios
In this stage, the disposal of installation waste, packaging waste and product waste at its end of life is included. The disposal pathway of each waste stream is modeled based on the recommendation of PCR and US EPA’s latest waste management fact sheet.
.
Waste Flow Recyclin
g Incineratio
n Landfillin
g
Paper Packaging 66.6% 6.01% 27.39%
Steel Packaging 33.3% 12.01% 54.69%
Plastic Packaging 9.1% 16.36% 74.54%
Unused Product 0% 0% 100%
Post-Consumer Product
0% 0% 100%
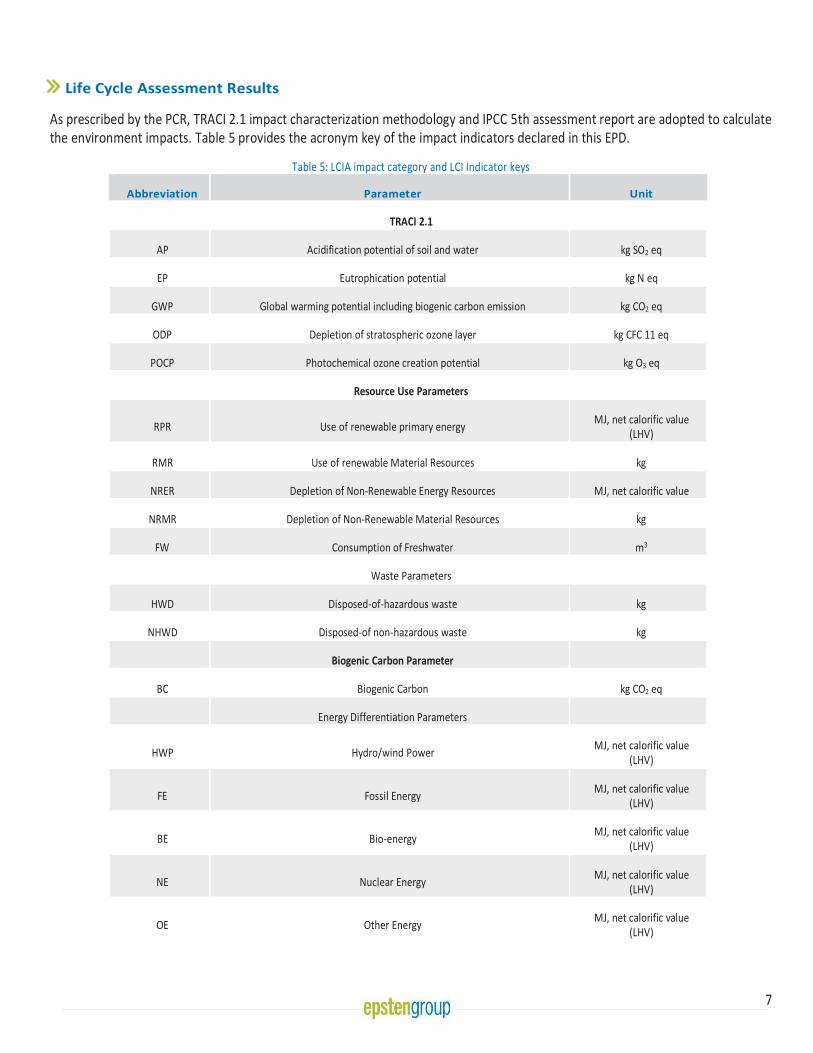
7 |
7
Life Cycle Assessment Results
As prescribed by the PCR, TRACI 2.1 impact characterization methodology and IPCC 5th assessment report are adopted to calculate the environment impacts. Table 5 provides the acronym key of the impact indicators declared in this EPD.
Table 5: LCIA impact category and LCI Indicator keys
Abbreviation Parameter Unit
TRACI 2.1
AP Acidification potential of soil and water kg SO2 eq
EP Eutrophication potential kg N eq
GWP Global warming potential including biogenic carbon emission kg CO2 eq
ODP Depletion of stratospheric ozone layer kg CFC 11 eq
POCP Photochemical ozone creation potential kg O3 eq
Resource Use Parameters
RPR Use of renewable primary energy MJ, net calorific value
(LHV)
RMR Use of renewable Material Resources kg
NRER Depletion of Non-Renewable Energy Resources MJ, net calorific value
NRMR Depletion of Non-Renewable Material Resources kg
FW Consumption of Freshwater m3
Waste Parameters
HWD Disposed-of-hazardous waste kg
NHWD Disposed-of non-hazardous waste kg
Biogenic Carbon Parameter
BC Biogenic Carbon kg CO2 eq
Energy Differentiation Parameters
HWP Hydro/wind Power MJ, net calorific value
(LHV)
FE Fossil Energy MJ, net calorific value
(LHV)
BE Bio-energy MJ, net calorific value
(LHV)
NE Nuclear Energy MJ, net calorific value
(LHV)
OE Other Energy MJ, net calorific value
(LHV)
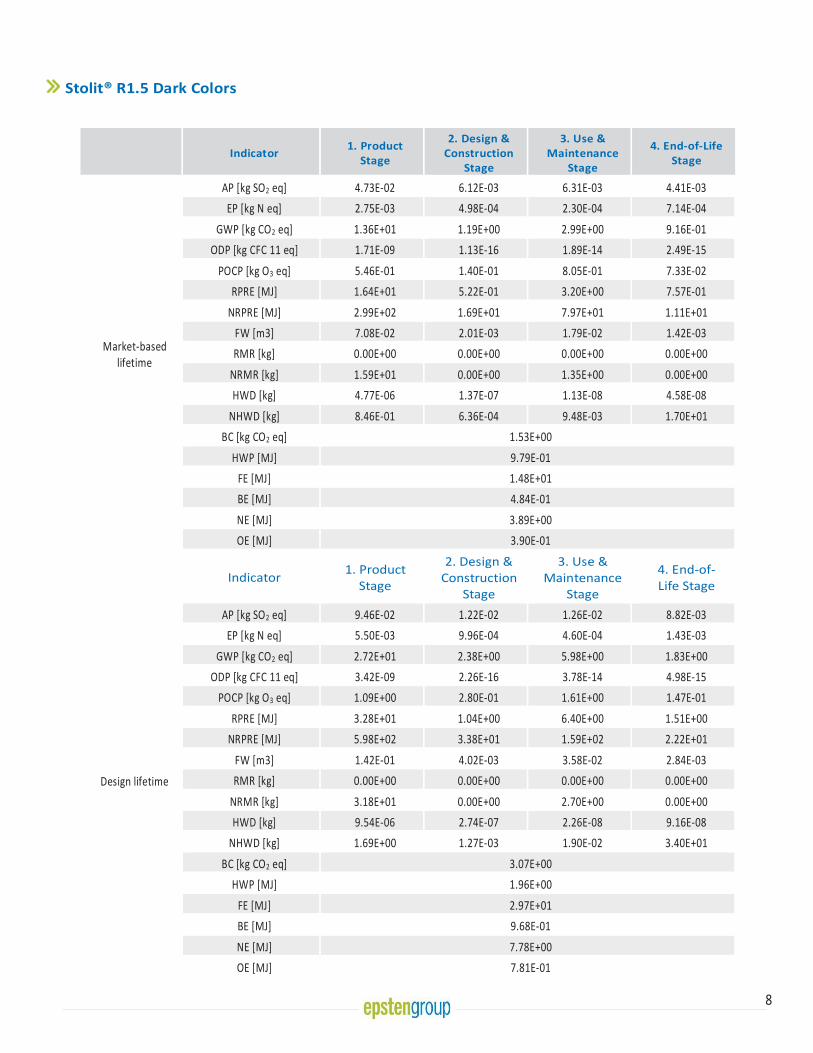
8 |
8
Stolit® R1.5 Dark Colors
Indicator 1. Product
Stage
2. Design & Construction
Stage
3. Use & Maintenance
Stage
4. End-of-Life Stage
Market-based lifetime
AP [kg SO2 eq] 4.73E-02 6.12E-03 6.31E-03 4.41E-03
EP [kg N eq] 2.75E-03 4.98E-04 2.30E-04 7.14E-04
GWP [kg CO2 eq] 1.36E+01 1.19E+00 2.99E+00 9.16E-01
ODP [kg CFC 11 eq] 1.71E-09 1.13E-16 1.89E-14 2.49E-15
POCP [kg O3 eq] 5.46E-01 1.40E-01 8.05E-01 7.33E-02
RPRE [MJ] 1.64E+01 5.22E-01 3.20E+00 7.57E-01
NRPRE [MJ] 2.99E+02 1.69E+01 7.97E+01 1.11E+01
FW [m3] 7.08E-02 2.01E-03 1.79E-02 1.42E-03
RMR [kg] 0.00E+00 0.00E+00 0.00E+00 0.00E+00
NRMR [kg] 1.59E+01 0.00E+00 1.35E+00 0.00E+00
HWD [kg] 4.77E-06 1.37E-07 1.13E-08 4.58E-08
NHWD [kg] 8.46E-01 6.36E-04 9.48E-03 1.70E+01
BC [kg CO2 eq] 1.53E+00
HWP [MJ] 9.79E-01
FE [MJ] 1.48E+01
BE [MJ] 4.84E-01
NE [MJ] 3.89E+00
OE [MJ] 3.90E-01
Indicator 1. Product
Stage
2. Design & Construction
Stage
3. Use & Maintenance
Stage
4. End-of-Life Stage
Design lifetime
AP [kg SO2 eq] 9.46E-02 1.22E-02 1.26E-02 8.82E-03
EP [kg N eq] 5.50E-03 9.96E-04 4.60E-04 1.43E-03
GWP [kg CO2 eq] 2.72E+01 2.38E+00 5.98E+00 1.83E+00
ODP [kg CFC 11 eq] 3.42E-09 2.26E-16 3.78E-14 4.98E-15
POCP [kg O3 eq] 1.09E+00 2.80E-01 1.61E+00 1.47E-01
RPRE [MJ] 3.28E+01 1.04E+00 6.40E+00 1.51E+00
NRPRE [MJ] 5.98E+02 3.38E+01 1.59E+02 2.22E+01
FW [m3] 1.42E-01 4.02E-03 3.58E-02 2.84E-03
RMR [kg] 0.00E+00 0.00E+00 0.00E+00 0.00E+00
NRMR [kg] 3.18E+01 0.00E+00 2.70E+00 0.00E+00
HWD [kg] 9.54E-06 2.74E-07 2.26E-08 9.16E-08
NHWD [kg] 1.69E+00 1.27E-03 1.90E-02 3.40E+01
BC [kg CO2 eq] 3.07E+00
HWP [MJ] 1.96E+00
FE [MJ] 2.97E+01
BE [MJ] 9.68E-01
NE [MJ] 7.78E+00
OE [MJ] 7.81E-01
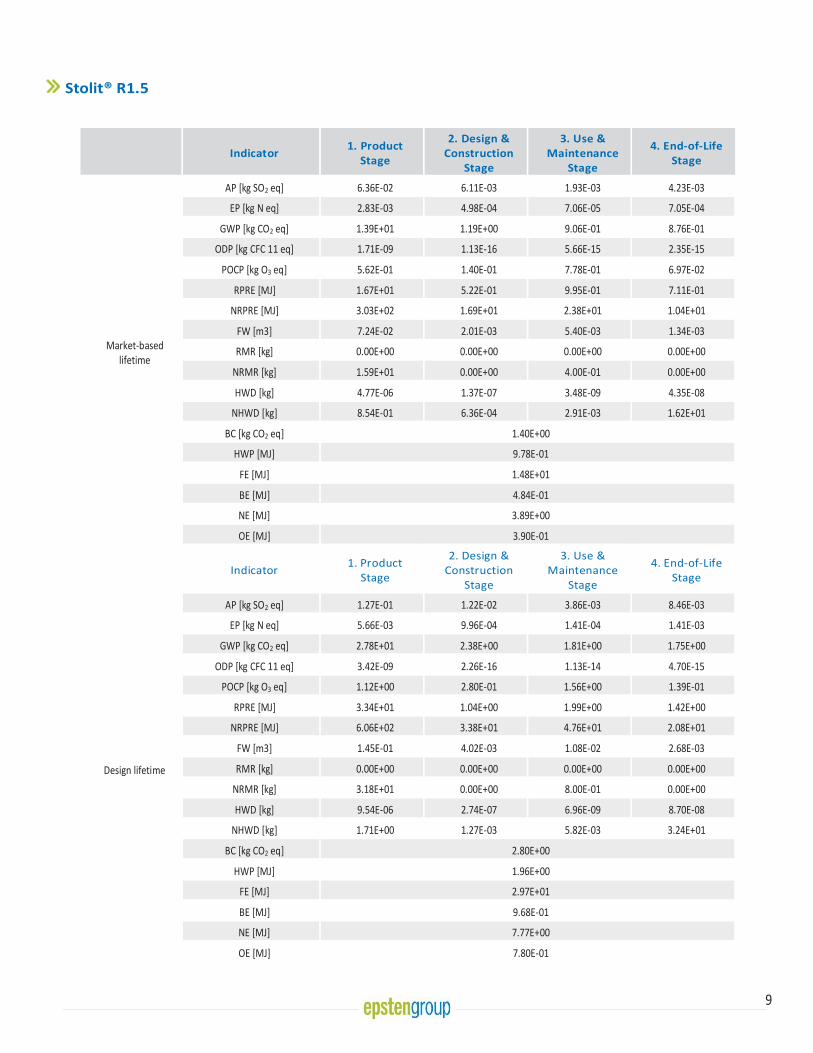
9 |
9
Stolit® R1.5
Indicator 1. Product
Stage
2. Design & Construction
Stage
3. Use & Maintenance
Stage
4. End-of-Life Stage
Market-based lifetime
AP [kg SO2 eq] 6.36E-02 6.11E-03 1.93E-03 4.23E-03
EP [kg N eq] 2.83E-03 4.98E-04 7.06E-05 7.05E-04
GWP [kg CO2 eq] 1.39E+01 1.19E+00 9.06E-01 8.76E-01
ODP [kg CFC 11 eq] 1.71E-09 1.13E-16 5.66E-15 2.35E-15
POCP [kg O3 eq] 5.62E-01 1.40E-01 7.78E-01 6.97E-02
RPRE [MJ] 1.67E+01 5.22E-01 9.95E-01 7.11E-01
NRPRE [MJ] 3.03E+02 1.69E+01 2.38E+01 1.04E+01
FW [m3] 7.24E-02 2.01E-03 5.40E-03 1.34E-03
RMR [kg] 0.00E+00 0.00E+00 0.00E+00 0.00E+00
NRMR [kg] 1.59E+01 0.00E+00 4.00E-01 0.00E+00
HWD [kg] 4.77E-06 1.37E-07 3.48E-09 4.35E-08
NHWD [kg] 8.54E-01 6.36E-04 2.91E-03 1.62E+01
BC [kg CO2 eq] 1.40E+00
HWP [MJ] 9.78E-01
FE [MJ] 1.48E+01
BE [MJ] 4.84E-01
NE [MJ] 3.89E+00
OE [MJ] 3.90E-01
Indicator 1. Product
Stage
2. Design & Construction
Stage
3. Use & Maintenance
Stage
4. End-of-Life Stage
Design lifetime
AP [kg SO2 eq] 1.27E-01 1.22E-02 3.86E-03 8.46E-03
EP [kg N eq] 5.66E-03 9.96E-04 1.41E-04 1.41E-03
GWP [kg CO2 eq] 2.78E+01 2.38E+00 1.81E+00 1.75E+00
ODP [kg CFC 11 eq] 3.42E-09 2.26E-16 1.13E-14 4.70E-15
POCP [kg O3 eq] 1.12E+00 2.80E-01 1.56E+00 1.39E-01
RPRE [MJ] 3.34E+01 1.04E+00 1.99E+00 1.42E+00
NRPRE [MJ] 6.06E+02 3.38E+01 4.76E+01 2.08E+01
FW [m3] 1.45E-01 4.02E-03 1.08E-02 2.68E-03
RMR [kg] 0.00E+00 0.00E+00 0.00E+00 0.00E+00
NRMR [kg] 3.18E+01 0.00E+00 8.00E-01 0.00E+00
HWD [kg] 9.54E-06 2.74E-07 6.96E-09 8.70E-08
NHWD [kg] 1.71E+00 1.27E-03 5.82E-03 3.24E+01
BC [kg CO2 eq] 2.80E+00
HWP [MJ] 1.96E+00
FE [MJ] 2.97E+01
BE [MJ] 9.68E-01
NE [MJ] 7.77E+00
OE [MJ] 7.80E-01
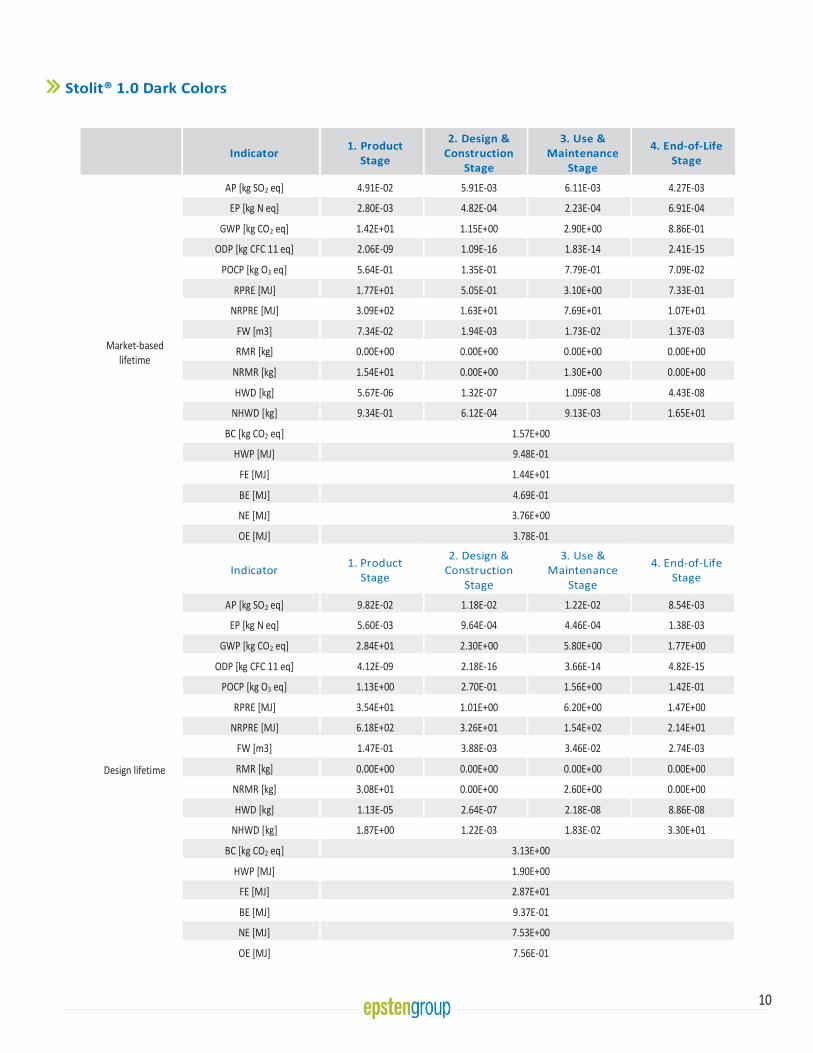
10 |
10
Stolit® 1.0 Dark Colors
Indicator 1. Product
Stage
2. Design & Construction
Stage
3. Use & Maintenance
Stage
4. End-of-Life Stage
Market-based lifetime
AP [kg SO2 eq] 4.91E-02 5.91E-03 6.11E-03 4.27E-03
EP [kg N eq] 2.80E-03 4.82E-04 2.23E-04 6.91E-04
GWP [kg CO2 eq] 1.42E+01 1.15E+00 2.90E+00 8.86E-01
ODP [kg CFC 11 eq] 2.06E-09 1.09E-16 1.83E-14 2.41E-15
POCP [kg O3 eq] 5.64E-01 1.35E-01 7.79E-01 7.09E-02
RPRE [MJ] 1.77E+01 5.05E-01 3.10E+00 7.33E-01
NRPRE [MJ] 3.09E+02 1.63E+01 7.69E+01 1.07E+01
FW [m3] 7.34E-02 1.94E-03 1.73E-02 1.37E-03
RMR [kg] 0.00E+00 0.00E+00 0.00E+00 0.00E+00
NRMR [kg] 1.54E+01 0.00E+00 1.30E+00 0.00E+00
HWD [kg] 5.67E-06 1.32E-07 1.09E-08 4.43E-08
NHWD [kg] 9.34E-01 6.12E-04 9.13E-03 1.65E+01
BC [kg CO2 eq] 1.57E+00
HWP [MJ] 9.48E-01
FE [MJ] 1.44E+01
BE [MJ] 4.69E-01
NE [MJ] 3.76E+00
OE [MJ] 3.78E-01
Indicator 1. Product
Stage
2. Design & Construction
Stage
3. Use & Maintenance
Stage
4. End-of-Life Stage
Design lifetime
AP [kg SO2 eq] 9.82E-02 1.18E-02 1.22E-02 8.54E-03
EP [kg N eq] 5.60E-03 9.64E-04 4.46E-04 1.38E-03
GWP [kg CO2 eq] 2.84E+01 2.30E+00 5.80E+00 1.77E+00
ODP [kg CFC 11 eq] 4.12E-09 2.18E-16 3.66E-14 4.82E-15
POCP [kg O3 eq] 1.13E+00 2.70E-01 1.56E+00 1.42E-01
RPRE [MJ] 3.54E+01 1.01E+00 6.20E+00 1.47E+00
NRPRE [MJ] 6.18E+02 3.26E+01 1.54E+02 2.14E+01
FW [m3] 1.47E-01 3.88E-03 3.46E-02 2.74E-03
RMR [kg] 0.00E+00 0.00E+00 0.00E+00 0.00E+00
NRMR [kg] 3.08E+01 0.00E+00 2.60E+00 0.00E+00
HWD [kg] 1.13E-05 2.64E-07 2.18E-08 8.86E-08
NHWD [kg] 1.87E+00 1.22E-03 1.83E-02 3.30E+01
BC [kg CO2 eq] 3.13E+00
HWP [MJ] 1.90E+00
FE [MJ] 2.87E+01
BE [MJ] 9.37E-01
NE [MJ] 7.53E+00
OE [MJ] 7.56E-01

11 |
11
Stolit® 1.0
Indicator 1. Product
Stage
2. Design & Construction
Stage
3. Use & Maintenance
Stage
4. End-of-Life Stage
Market-based lifetime
AP [kg SO2 eq] 6.54E-02 5.91E-03 1.86E-03 4.09E-03
EP [kg N eq] 2.89E-03 4.82E-04 6.83E-05 6.82E-04
GWP [kg CO2 eq] 1.46E+01 1.15E+00 8.76E-01 8.48E-01
ODP [kg CFC 11 eq] 2.06E-09 1.09E-16 5.47E-15 2.27E-15
POCP [kg O3 eq] 5.81E-01 1.35E-01 7.52E-01 6.74E-02
RPRE [MJ] 1.81E+01 5.05E-01 9.63E-01 6.88E-01
NRPRE [MJ] 3.13E+02 1.63E+01 2.31E+01 1.01E+01
FW [m3] 7.53E-02 1.94E-03 5.22E-03 1.30E-03
RMR [kg] 0.00E+00 0.00E+00 0.00E+00 0.00E+00
NRMR [kg] 1.54E+01 0.00E+00 3.80E-01 0.00E+00
HWD [kg] 5.65E-06 1.32E-07 3.37E-09 4.20E-08
NHWD [kg] 9.41E-01 6.15E-04 2.81E-03 1.56E+01
BC [kg CO2 eq] 1.44E+00
HWP [MJ] 9.47E-01
FE [MJ] 1.44E+01
BE [MJ] 4.68E-01
NE [MJ] 3.76E+00
OE [MJ] 3.78E-01
Indicator 1. Product
Stage
2. Design & Construction
Stage
3. Use & Maintenance
Stage
4. End-of-Life Stage
Design lifetime
AP [kg SO2 eq] 1.31E-01 1.18E-02 3.72E-03 8.18E-03
EP [kg N eq] 5.78E-03 9.64E-04 1.37E-04 1.36E-03
GWP [kg CO2 eq] 2.92E+01 2.30E+00 1.75E+00 1.70E+00
ODP [kg CFC 11 eq] 4.12E-09 2.18E-16 1.09E-14 4.54E-15
POCP [kg O3 eq] 1.16E+00 2.70E-01 1.50E+00 1.35E-01
RPRE [MJ] 3.62E+01 1.01E+00 1.93E+00 1.38E+00
NRPRE [MJ] 6.26E+02 3.26E+01 4.62E+01 2.02E+01
FW [m3] 1.51E-01 3.88E-03 1.04E-02 2.60E-03
RMR [kg] 0.00E+00 0.00E+00 0.00E+00 0.00E+00
NRMR [kg] 3.08E+01 0.00E+00 7.60E-01 0.00E+00
HWD [kg] 1.13E-05 2.64E-07 6.74E-09 8.40E-08
NHWD [kg] 1.88E+00 1.23E-03 5.62E-03 3.12E+01
BC [kg CO2 eq] 2.88E+00
HWP [MJ] 1.89E+00
FE [MJ] 2.87E+01
BE [MJ] 9.37E-01
NE [MJ] 7.52E+00
OE [MJ] 7.55E-01

12 |
12
Stolit® 1.5 Dark Colors
Indicator 1. Product
Stage
2. Design & Construction
Stage
3. Use & Maintenance
Stage
4. End-of-Life Stage
Market-based lifetime
AP [kg SO2 eq] 5.54E-02 6.81E-03 7.02E-03 4.91E-03
EP [kg N eq] 3.14E-03 5.55E-04 2.56E-04 7.95E-04
GWP [kg CO2 eq] 1.61E+01 1.32E+00 3.33E+00 1.02E+00
ODP [kg CFC 11 eq] 1.90E-09 1.26E-16 2.11E-14 2.77E-15
POCP [kg O3 eq] 6.28E-01 1.55E-01 8.97E-01 8.16E-02
RPRE [MJ] 2.01E+01 5.81E-01 3.56E+00 8.44E-01
NRPRE [MJ] 3.51E+02 1.88E+01 8.86E+01 1.23E+01
FW [m3] 8.38E-02 2.24E-03 1.99E-02 1.58E-03
RMR [kg] 0.00E+00 0.00E+00 0.00E+00 0.00E+00
NRMR [kg] 1.77E+01 0.00E+00 1.50E+00 0.00E+00
HWD [kg] 5.30E-06 1.52E-07 1.25E-08 5.10E-08
NHWD [kg] 1.06E+00 7.07E-04 1.05E-02 1.90E+01
BC [kg CO2 eq] 1.78E+00
HWP [MJ] 1.09E+00
FE [MJ] 1.65E+01
BE [MJ] 5.39E-01
NE [MJ] 4.33E+00
OE [MJ] 4.35E-01
Indicator 1. Product
Stage
2. Design & Construction
Stage
3. Use & Maintenance
Stage
4. End-of-Life Stage
Design lifetime
AP [kg SO2 eq] 1.11E-01 1.36E-02 1.40E-02 9.82E-03
EP [kg N eq] 6.28E-03 1.11E-03 5.12E-04 1.59E-03
GWP [kg CO2 eq] 3.22E+01 2.64E+00 6.66E+00 2.04E+00
ODP [kg CFC 11 eq] 3.80E-09 2.52E-16 4.22E-14 5.54E-15
POCP [kg O3 eq] 1.26E+00 3.10E-01 1.79E+00 1.63E-01
RPRE [MJ] 4.02E+01 1.16E+00 7.12E+00 1.69E+00
NRPRE [MJ] 7.02E+02 3.76E+01 1.77E+02 2.46E+01
FW [m3] 1.68E-01 4.48E-03 3.98E-02 3.16E-03
RMR [kg] 0.00E+00 0.00E+00 0.00E+00 0.00E+00
NRMR [kg] 3.54E+01 0.00E+00 3.00E+00 0.00E+00
HWD [kg] 1.06E-05 3.04E-07 2.50E-08 1.02E-07
NHWD [kg] 2.12E+00 1.41E-03 2.10E-02 3.80E+01
BC [kg CO2 eq] 3.56E+00
HWP [MJ] 2.18E+00
FE [MJ] 3.31E+01
BE [MJ] 1.08E+00
NE [MJ] 8.66E+00
OE [MJ] 8.70E-01

13 |
13
Stolit® 1.5
Indicator 1. Product
Stage
2. Design & Construction
Stage
3. Use & Maintenance
Stage
4. End-of-Life Stage
Market-based lifetime
AP [kg SO2 eq] 7.53E-02 6.81E-03 2.14E-03 4.71E-03
EP [kg N eq] 3.32E-03 5.55E-04 7.86E-05 7.84E-04
GWP [kg CO2 eq] 1.67E+01 1.32E+00 1.01E+00 9.75E-01
ODP [kg CFC 11 eq] 1.90E-09 1.26E-16 6.30E-15 2.61E-15
POCP [kg O3 eq] 6.69E-01 1.55E-01 8.66E-01 7.76E-02
RPRE [MJ] 2.05E+01 5.81E-01 1.11E+00 7.92E-01
NRPRE [MJ] 3.59E+02 1.88E+01 2.65E+01 1.16E+01
FW [m3] 8.63E-02 2.24E-03 6.01E-03 1.50E-03
RMR [kg] 0.00E+00 0.00E+00 0.00E+00 0.00E+00
NRMR [kg] 1.77E+01 0.00E+00 4.40E-01 0.00E+00
HWD [kg] 5.33E-06 1.52E-07 3.88E-09 4.84E-08
NHWD [kg] 1.07E+00 7.07E-04 3.23E-03 1.80E+01
BC [kg CO2 eq] 1.64E+00
HWP [MJ] 1.09E+00
FE [MJ] 1.65E+01
BE [MJ] 5.39E-01
NE [MJ] 4.33E+00
OE [MJ] 4.35E-01
Indicator 1. Product
Stage
2. Design & Construction
Stage
3. Use & Maintenance
Stage
4. End-of-Life Stage
Design lifetime
AP [kg SO2 eq] 1.51E-01 1.36E-02 4.28E-03 9.42E-03
EP [kg N eq] 6.64E-03 1.11E-03 1.57E-04 1.57E-03
GWP [kg CO2 eq] 3.34E+01 2.64E+00 2.02E+00 1.95E+00
ODP [kg CFC 11 eq] 3.80E-09 2.52E-16 1.26E-14 5.22E-15
POCP [kg O3 eq] 1.34E+00 3.10E-01 1.73E+00 1.55E-01
RPRE [MJ] 4.10E+01 1.16E+00 2.22E+00 1.58E+00
NRPRE [MJ] 7.18E+02 3.76E+01 5.30E+01 2.32E+01
FW [m3] 1.73E-01 4.48E-03 1.20E-02 3.00E-03
RMR [kg] 0.00E+00 0.00E+00 0.00E+00 0.00E+00
NRMR [kg] 3.54E+01 0.00E+00 8.80E-01 0.00E+00
HWD [kg] 1.07E-05 3.04E-07 7.76E-09 9.68E-08
NHWD [kg] 2.14E+00 1.41E-03 6.46E-03 3.60E+01
BC [kg CO2 eq] 3.29E+00
HWP [MJ] 2.18E+00
FE [MJ] 3.31E+01
BE [MJ] 1.08E+00
NE [MJ] 8.66E+00
OE [MJ] 8.69E-01
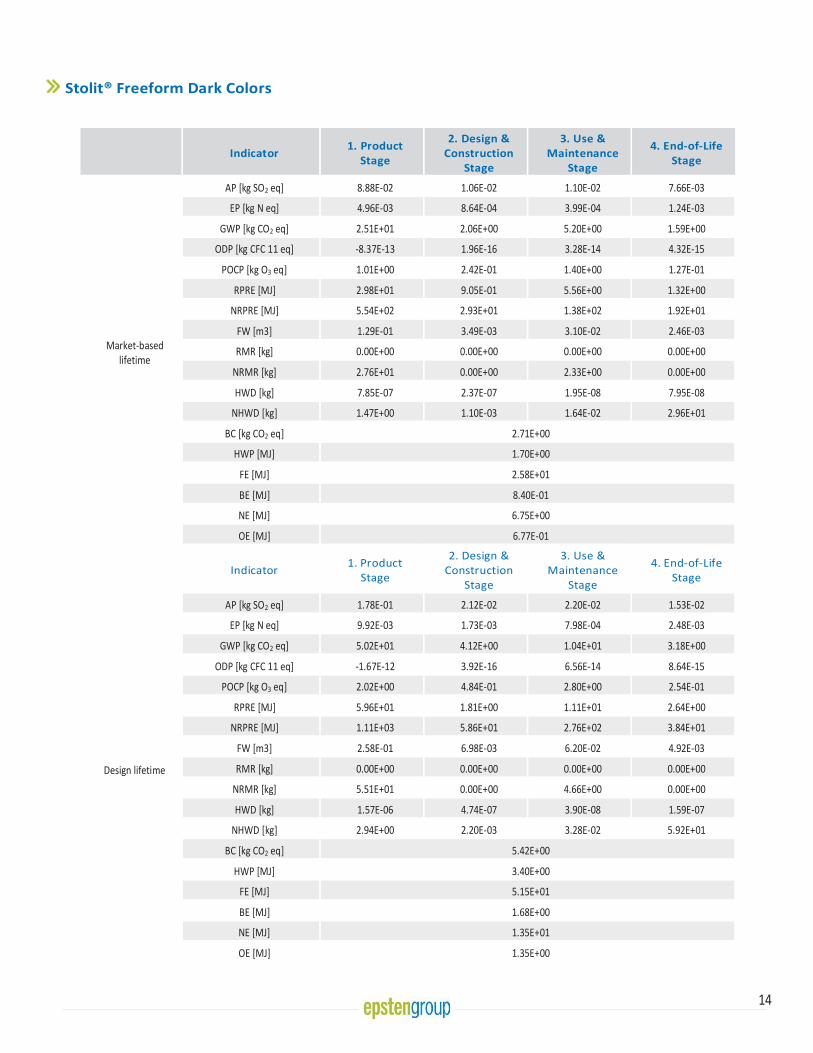
14 |
14
Stolit® Freeform Dark Colors
Indicator 1. Product
Stage
2. Design & Construction
Stage
3. Use & Maintenance
Stage
4. End-of-Life Stage
Market-based lifetime
AP [kg SO2 eq] 8.88E-02 1.06E-02 1.10E-02 7.66E-03
EP [kg N eq] 4.96E-03 8.64E-04 3.99E-04 1.24E-03
GWP [kg CO2 eq] 2.51E+01 2.06E+00 5.20E+00 1.59E+00
ODP [kg CFC 11 eq] -8.37E-13 1.96E-16 3.28E-14 4.32E-15
POCP [kg O3 eq] 1.01E+00 2.42E-01 1.40E+00 1.27E-01
RPRE [MJ] 2.98E+01 9.05E-01 5.56E+00 1.32E+00
NRPRE [MJ] 5.54E+02 2.93E+01 1.38E+02 1.92E+01
FW [m3] 1.29E-01 3.49E-03 3.10E-02 2.46E-03
RMR [kg] 0.00E+00 0.00E+00 0.00E+00 0.00E+00
NRMR [kg] 2.76E+01 0.00E+00 2.33E+00 0.00E+00
HWD [kg] 7.85E-07 2.37E-07 1.95E-08 7.95E-08
NHWD [kg] 1.47E+00 1.10E-03 1.64E-02 2.96E+01
BC [kg CO2 eq] 2.71E+00
HWP [MJ] 1.70E+00
FE [MJ] 2.58E+01
BE [MJ] 8.40E-01
NE [MJ] 6.75E+00
OE [MJ] 6.77E-01
Indicator 1. Product
Stage
2. Design & Construction
Stage
3. Use & Maintenance
Stage
4. End-of-Life Stage
Design lifetime
AP [kg SO2 eq] 1.78E-01 2.12E-02 2.20E-02 1.53E-02
EP [kg N eq] 9.92E-03 1.73E-03 7.98E-04 2.48E-03
GWP [kg CO2 eq] 5.02E+01 4.12E+00 1.04E+01 3.18E+00
ODP [kg CFC 11 eq] -1.67E-12 3.92E-16 6.56E-14 8.64E-15
POCP [kg O3 eq] 2.02E+00 4.84E-01 2.80E+00 2.54E-01
RPRE [MJ] 5.96E+01 1.81E+00 1.11E+01 2.64E+00
NRPRE [MJ] 1.11E+03 5.86E+01 2.76E+02 3.84E+01
FW [m3] 2.58E-01 6.98E-03 6.20E-02 4.92E-03
RMR [kg] 0.00E+00 0.00E+00 0.00E+00 0.00E+00
NRMR [kg] 5.51E+01 0.00E+00 4.66E+00 0.00E+00
HWD [kg] 1.57E-06 4.74E-07 3.90E-08 1.59E-07
NHWD [kg] 2.94E+00 2.20E-03 3.28E-02 5.92E+01
BC [kg CO2 eq] 5.42E+00
HWP [MJ] 3.40E+00
FE [MJ] 5.15E+01
BE [MJ] 1.68E+00
NE [MJ] 1.35E+01
OE [MJ] 1.35E+00
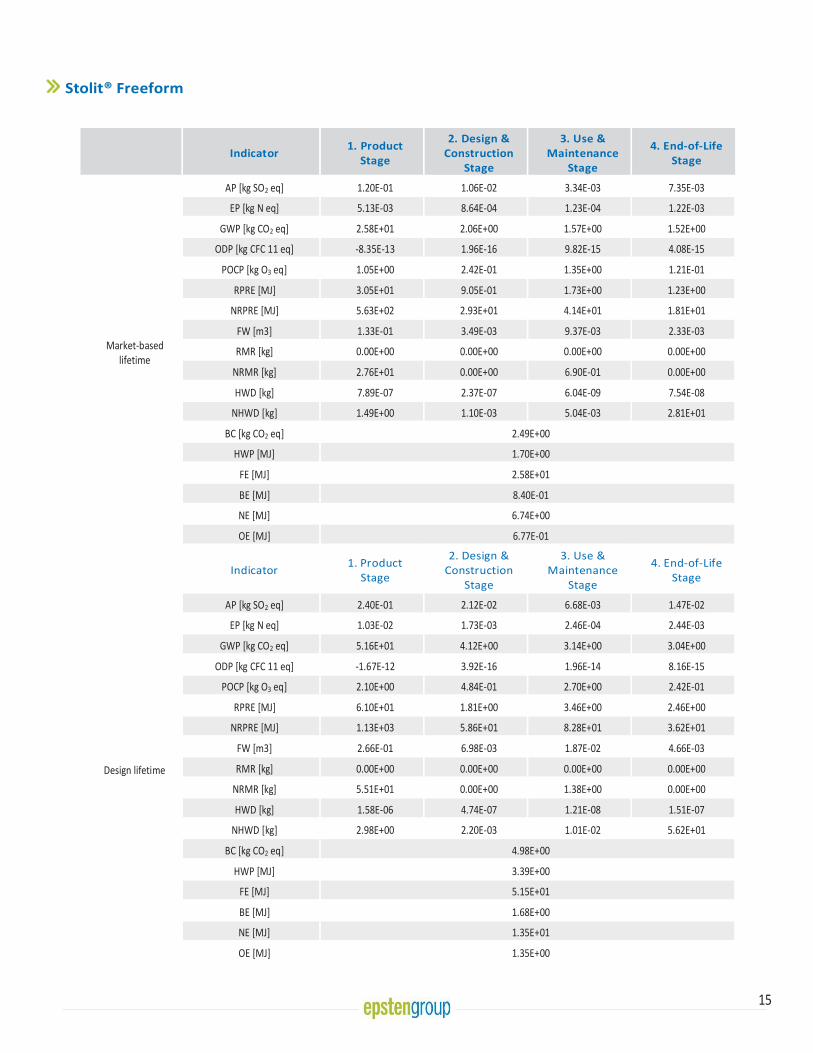
15 |
15
Stolit® Freeform
Indicator 1. Product
Stage
2. Design & Construction
Stage
3. Use & Maintenance
Stage
4. End-of-Life Stage
Market-based lifetime
AP [kg SO2 eq] 1.20E-01 1.06E-02 3.34E-03 7.35E-03
EP [kg N eq] 5.13E-03 8.64E-04 1.23E-04 1.22E-03
GWP [kg CO2 eq] 2.58E+01 2.06E+00 1.57E+00 1.52E+00
ODP [kg CFC 11 eq] -8.35E-13 1.96E-16 9.82E-15 4.08E-15
POCP [kg O3 eq] 1.05E+00 2.42E-01 1.35E+00 1.21E-01
RPRE [MJ] 3.05E+01 9.05E-01 1.73E+00 1.23E+00
NRPRE [MJ] 5.63E+02 2.93E+01 4.14E+01 1.81E+01
FW [m3] 1.33E-01 3.49E-03 9.37E-03 2.33E-03
RMR [kg] 0.00E+00 0.00E+00 0.00E+00 0.00E+00
NRMR [kg] 2.76E+01 0.00E+00 6.90E-01 0.00E+00
HWD [kg] 7.89E-07 2.37E-07 6.04E-09 7.54E-08
NHWD [kg] 1.49E+00 1.10E-03 5.04E-03 2.81E+01
BC [kg CO2 eq] 2.49E+00
HWP [MJ] 1.70E+00
FE [MJ] 2.58E+01
BE [MJ] 8.40E-01
NE [MJ] 6.74E+00
OE [MJ] 6.77E-01
Indicator 1. Product
Stage
2. Design & Construction
Stage
3. Use & Maintenance
Stage
4. End-of-Life Stage
Design lifetime
AP [kg SO2 eq] 2.40E-01 2.12E-02 6.68E-03 1.47E-02
EP [kg N eq] 1.03E-02 1.73E-03 2.46E-04 2.44E-03
GWP [kg CO2 eq] 5.16E+01 4.12E+00 3.14E+00 3.04E+00
ODP [kg CFC 11 eq] -1.67E-12 3.92E-16 1.96E-14 8.16E-15
POCP [kg O3 eq] 2.10E+00 4.84E-01 2.70E+00 2.42E-01
RPRE [MJ] 6.10E+01 1.81E+00 3.46E+00 2.46E+00
NRPRE [MJ] 1.13E+03 5.86E+01 8.28E+01 3.62E+01
FW [m3] 2.66E-01 6.98E-03 1.87E-02 4.66E-03
RMR [kg] 0.00E+00 0.00E+00 0.00E+00 0.00E+00
NRMR [kg] 5.51E+01 0.00E+00 1.38E+00 0.00E+00
HWD [kg] 1.58E-06 4.74E-07 1.21E-08 1.51E-07
NHWD [kg] 2.98E+00 2.20E-03 1.01E-02 5.62E+01
BC [kg CO2 eq] 4.98E+00
HWP [MJ] 3.39E+00
FE [MJ] 5.15E+01
BE [MJ] 1.68E+00
NE [MJ] 1.35E+01
OE [MJ] 1.35E+00
16 |
16
Interpretation
For all the products in study, the majority of the environmental impacts come from the Product Stage, which includes raw material sourcing, transportation and manufacturing. The only exception is POCP whose dominant source is Use & Maintenance Stage because of VOC emission in the curing process. From a functional unit perspective, the lifetime of the product and the coverage rate play a major role in scaling the impacts. This explains why products of coarse finishes have a higher impact than those of fine finishes.
Reference
• Life Cycle Assessment, LCA report for Sto Corp. WAP Sustainability, September 2019
• PCR for Architectural Coatings: NAICS 325510. NSF International, 2017
• ISO14044:2006 Environmental Management–Life cycle assessment–Requirements and Guidelines.
• ISO 14025:2006 Environmental labels and declarations – Type III environmental declarations – Principles and Procedures.
• ISO 21930:2007 Sustainability in buildings and civil engineering works – Core rules for environmental product declarations of construction products and services.
• Advancing Sustainable Materials Management: 2015 Fact Sheet. US EPA. Available at https://www.epa.gov/sites/production/files/2018-07/documents/2015_smm_msw_factsheet_07242018_fnl_508_002.pdf
• Product Bulletin – Stolit® Acrylic Textured Finish. Sto Corp. Available at http://www.stocorp.com/wp-content/content/Products_TechService/Finishes/Product%20Bulletins/PB_80130-82156_Stolit_Finishes_EN.pdf

EPD for Stolit® Lotusan® in varied textures
Product Textures: 1.0, 1.0 Dark, 1.5, 1.5 Dark, Freeform, Freeform Dark.
Stolit® Lotusan® is a ready-mixed exterior textured finish that mimics the self-cleaning capabilities of the lotus leaf. Replicating the lotus plant’s ability to send raindrops rolling gently off its leaves, Stolit® Lotusan® resists dirt pick-up while keeping walls clean and attractive. Stolit® Lotusan® with Lotus-Effect® technology is designed for use as a finish coat over prepared vertical concrete, masonry or plaster substrates and in StoTherm® ci Lotusan® wall claddings.
2 |
2
PCR Identification
PCR for Architectural Coatings: NAICS 325510 on the basis of ISO 21930: 2007, NSF International, 2017. Valid through June 23, 2022
Compliance to to ISO 14040/44, ISO 14025 and ISO 21930 Yes
Product Category Exterior Coating
Manufacturer’s name
Sto Corp. 3800 Camp Creek Parkway SW, Building 1400, Suite 120 Atlanta, GA 30331 www.stocorp.com | (800) 221-2397
EPD program operator Epsten Group 101 Marietta St. Suite 2600, Atlanta, GA 30303 www.epstengroup.com
Declaration Number 01-002
Date of Certification December 18th, 2019
Period of Validity 5 years from date of certification
Functional Unit One square meter of covered and protected substrate for 60 years
Market-base life used in assessment 10 Years
Design life used in assessment 5 Years
Test method employed for determination of design life Product default warranty
Amount of colorant needed See Table 3
Overall Data Quality Assessment Score Good
Site(s) in which the results of the LCA are representative STO manufacturing sites in Atlanta, Georgia; Glendale, Arizona; and Rutland, Vermont
Information on where explanatory material can be obtained See references at the end of this document.
LCA Software and Version Number GaBi 9.2.0.58
LCI Database and Version Number GaBi Database Version 8.7, Service Pack 39
This declaration was independently verified in accordance with ISO 14025: 2006 and the reference PCR: PCR for Architectural Coatings: NAICS 325510
Internal External
Kate McFeaters [email protected]
This life cycle assessment was conducted in accordance with ISO 14044 and the reference PCR by:
WAP Sustainability Consulting, LLC
This life cycle assessment was independently verified in accordance with ISO 14044 and the reference PCR by:
Kate McFeaters [email protected]
Comparability
In order to support comparative assertions, this EPD meets all comparability requirements stated in ISO 14025:2006. However, differences in certain assumptions, data quality, and variability between LCA data sets may still exist. As such, caution should be exercised when evaluating EPDs from different m anufacturers, as the EPD results may not be entirely comparable. Any EPD comparison must be carried out at the building level per ISO 21930 guidelines. The results of this EPD re flect an average performance by the product and its actual impacts may vary on a case-to-case basis.
3 |
3
Company
We believe in ‘Building with conscience’.
That means ensuring that all building products are not only safe, effective and easy to install, but also environmentally responsible and sustainable. We know you’re always looking for the smartest and newest technology to create energy efficient buildings with superior aesthetics.
That’s exactly what our products help you achieve. Products like our wall systems, coatings and finishes are consistent favorites among design professionals, contractors and property owners alike. Whatever your needs or vision may be, we offer products for every type of building project; whether it’s new construction, restoration or panelization, commercial or residential work.
An architect or specifier focuses on aesthetics and feasibility, a contractor needs products that are easy to work with, and a building owner requires high value and low costs on properties. Sto understands these unique needs, and delivers the smart, innovative materials and solutions that make this all possible. That’s why Sto remains the innovative leader in integrated exterior wall systems.
When you combine that commitment to product support and innovation with value-added offerings like consultative design and color services through Sto Studio or training in proper application techniques through the Sto Institute, you get an integrated exterior wall system solution unmatched in the industry.
Manufacturing Sites Covered in this EPD
Atlanta Plant
Glendale Plant
Rutland Plant
Product Identification
Stolit® Lotusan® finishes are offered in various coarseness and color bases that allow more freedom in building exterior designing and finishing. Table 1 lists the products declared in this EPD.
Table 1: List of Stolit® Lotusan® Products
Product Name
Product Number
Base Type Finish Type
Stolit® Lotusan® 1.0
80190 Tintable White Fine
Stolit® Lotusan® 1.0 Dark Colors
82190 Deep Fine
Stolit® Lotusan® 1.5
80191 Tintable White Medium
Stolit® Lotusan® 1.5 Dark Colors
82191 Deep Medium
Stolit® Lotusan® Freeform
80193 Tintable White Freeform
Stolit® Lotusan® Freeform Dark
Colors 82193 Deep Freeform

4 |
4
Product Description
Stolit® Lotusan® is a series of ready mixed, textured wall coating with Lotus-Effect® technology that mimics the self-cleaning capabilities of the lotus leaf. Stolit® Lotusan® with Lotus-Effect® technology is designed for use as a finish coating over prepared vertical above-grade concrete, masonry or plaster substrates and in StoTherm® Lotusan® Wall Claddings including StoTherm® ci Lotusan®. In this study, Lotusan® 1.0, 1.5 and Freeform are included. Same as Stolit®, two tint bases are offered.
Performance Features
Mildew Resistance Ready Mixed Moisture Resistance Low VOC & Odor Vapor Permeable
Integral Color
Water-based
Super Hydrophobic
Material Composition
The material compositions of Stolit® Lotusan® are listed below:
Table 2: Material composition for Stolit® Lotusan®
Additives Colorant Limestone Acrylic resin
Silica Silicate Surfactant Water
Stolit® Lotusan® 1.0 Dark Colors
4.68% 0.60% 49.26% 5.01% 21.66% 2.68% 0.05% 15.45%
Stolit® Lotusan® 1.0 4.69% 0.60% 49.24% 5.04% 21.45% 2.70% 0.05% 15.62%
Stolit® Lotusan® 1.5 Dark Colors
4.68% 0.60%
49.98% 4.99% 20.88% 2.85% 0.05% 15.37%
Stolit® Lotusan® 1.5 4.68% 0.60% 49.72% 4.98% 21.37% 2.66% 0.05% 15.35%
Stolit® Lotusan® Freeform Dark Colors
4.73% 0.64% 60.60% 5.37% 8.37% 2.87% 0.11% 16.56%
Stolit® Lotusan® Freeform
4.73% 0.64% 60.06% 5.36% 8.36% 2.87% 0.13% 17.10%
Components related to Life Cycle Assessment
The functional unit for the LCA study was covering and protecting 1 square meter (m2) of substrate for a period of 60 years—the assumed lifetime of a building. The reference flow required for the functional unit is calculated based on the product lifespan scenarios prescribed in the PCR. The market-based lifetime is 10 years, and the design lifetime is determined either based on quality determined by ASTM tests or on the product warrant. By default, Stolit® Lotusan® finishes have a 5-year warranty. In case a finish is applied on Sto’s wall systems, the warranty is extended to 10 years. In this EPD, default warranty is adopted as the design lifetime. The reference flow required for one functional unit is provided in Table 3.

5 |
5
Table 3: Market-based lifetime and reference flow
Functional
Unit Reference Flow
[kg] Tint needed*
[kg] Reference Flow [kg]
Tint needed*
[kg]
Lifespan Design Lifetime [5 years] Market-based Lifetime [10 years]
Stolit® Lotusan® 1.0 Dark Colors 1 29.16 2.60 14.58 1.30
Stolit® Lotusan® 1.0 1 29.16 0.77 14.58 0.38
Stolit® Lotusan® 1.5 Dark Colors 1 33.56 3.00 16.79 1.50
Stolit® Lotusan® 1.5 1 33.56 0.88 16.79 0.44
Stolit® Lotusan® Freeform Dark Colors
1 52.32 4.66 26.16 2.33
Stolit® Lotusan® Freeform 1 52.32 1.37 26.16 0.69
Scope and Boundaries of the Life Cycle Assessment
The LCA was performed in accordance with ISO 14040 standards. The study is a cradle-to-grave LCA and includes the following life stages as prescribed in the PCR.
Figure 1: Life stages for the cradle-to-grave LCA
6 |
6
Cut-off Criteria
Material inputs greater than 1% (based on total mass of the final product) were included within the scope of analysis. Material inputs less than 1% were included if sufficient data was available to warrant inclusion and/or the material input was thought to have significant environmental impact. Cumulative excluded material inputs and environmental impacts are less than 5% based on total weight of the functional unit.
Data Quality
The overall data quality level was determined to be good. Primary data was collected from Sto’s facilities in Atlanta, GA, Glendale, AZ and Rutland, VT for the 2018 reference year. When primary data did not exist, secondary data were obtained from the Gabi V8.7 Database Service Pack 39. Overall, both primary and secondary data are considered good quality in terms of geographic, temporal and technological coverage.
Estimates and Assumption
Assumptions were made to represent the cradle-to-grave environmental performance of Sto’s products. These assumptions were made in accordance with the PCR and include the transportation distances, the disposal of packaging material and the product at its end of life and use phase assumptions.
Allocation
General principles of allocation were based on ISO 14040/44. Where possible, allocation was avoided. When allocation was necessary it was done on a physical mass basis.
Product Stage
Stolit® Lotusan® is produced at Sto’s Atlanta, GA, Glendale, AZ and Rutland, VT facilities. This stage includes an aggregation of raw material extraction, supplier processing, delivery, manufacturing and packaging by Sto. Stolit® Lotusan® is supplied in 5-gallon pails.
Design and Construction Stage
The design and construction process stage starts with the packaged product leaving the production site and ends with being delivered to the application site.
During this stage, the finished product is moved from a shipping dock for distribution. The end gate is the application site after the purchaser acquires the finished product and transports it to the application site.
Use and Maintenance Stage
The use stage begins when the user prepares the product before applying it to a substrate and ends with any leftover coating and discarded packaging entering the end-of-life stage. Detailed application instructions are provided online. The application procedure includes mixing and applying. As recommended, an electric drill/mixer and a spray pump are assumed to be used for mixing and application. The equipment is not included in the study as these are multi-use tools and the impacts per declared unit is considered negligible, but electricity to power application tools has been included.
As prescribed in the PCR, 10% of the wet mass of Stolit® is assumed to be unused and properly disposed of.
End-of-Life Stage
In this stage, the disposal of installation waste, packaging waste and product waste at its end of life is included. The disposal pathway of each waste stream is modeled based on the recommendation of PCR and US EPA’s latest waste management fact sheet.
Waste Flow Recycling Incineration
Landfilling
Paper Packaging 66.6% 6.01% 27.39%
Steel Packaging 33.3% 12.01% 54.69%
Plastic Packaging 9.1% 16.36% 74.54%
Unused Product 0% 0% 100%
Post-Consumer Product
0% 0% 100%

7 |
7
Life Cycle Assessment Results
As prescribed by the PCR, TRACI 2.1 impact characterization methodology and IPCC 5th assessment report are adopted to calculate the environment impacts. Table 4 provides the acronym key of the impact indicators declared in this EPD.
Table 4: LCIA impact category and LCI Indicator keys
Abbreviation Parameter Unit
TRACI 2.1
AP Acidification potential of soil and water kg SO2 eq
EP Eutrophication potential kg N eq
GWP Global warming potential including biogenic carbon emission kg CO2 eq
ODP Depletion of stratospheric ozone layer kg CFC 11 eq
POCP Photochemical ozone creation potential kg O3 eq
Resource Use Parameters
RPR Use of renewable primary energy MJ, net calorific value
(LHV)
RMR Use of renewable Material Resources kg
NRER Depletion of Non-Renewable Energy Resources MJ, net calorific value
NRMR Depletion of Non-Renewable Material Resources kg
FW Consumption of Freshwater m3
Waste Parameters
HWD Disposed-of-hazardous waste kg
NHWD Disposed-of non-hazardous waste kg
Biogenic Carbon Parameter
BC Biogenic Carbon kg CO2 eq
Energy Differentiation Parameters
HWP Hydro/wind Power MJ, net calorific value
(LHV)
FE Fossil Energy MJ, net calorific value
(LHV)
BE Bio-energy MJ, net calorific value
(LHV)
NE Nuclear Energy MJ, net calorific value
(LHV)
OE Other Energy MJ, net calorific value
(LHV)
8 |
8
Stolit® Lotusan® 1.0 Dark Colors
Indicator 1. Product
Stage
2. Design & Construction
Stage
3. Use & Maintenance
Stage
4. End-of-Life Stage
Market-based lifetime
AP [kg SO2 eq] 6.23E-02 5.83E-03 6.11E-03 4.19E-03
EP [kg N eq] 3.64E-03 4.75E-04 2.23E-04 6.81E-04
GWP [kg CO2 eq] 1.45E+01 1.13E+00 2.90E+00 8.70E-01
ODP [kg CFC 11 eq] -5.00E-13 1.08E-16 1.83E-14 2.35E-15
POCP [kg O3 eq] 8.08E-01 1.33E-01 1.15E+00 6.94E-02
RPRE [MJ] 4.25E+01 4.97E-01 3.10E+00 7.14E-01
NRPRE [MJ] 2.95E+02 1.61E+01 7.69E+01 1.04E+01
FW [m3] 7.57E-02 1.91E-03 1.73E-02 1.34E-03
RMR [kg] 0.00E+00 0.00E+00 0.00E+00 0.00E+00
NRMR [kg] 1.52E+01 0.00E+00 1.30E+00 0.00E+00
HWD [kg] 8.52E-07 1.30E-07 1.09E-08 4.34E-08
NHWD [kg] 1.83E+00 6.06E-04 9.13E-03 1.61E+01
BC [kg CO2 eq] 5.29E+00
HWP [MJ] 9.34E-01
FE [MJ] 1.42E+01
BE [MJ] 4.62E-01
NE [MJ] 3.71E+00
OE [MJ] 3.72E-01
Indicator 1. Product
Stage
2. Design & Construction
Stage
3. Use & Maintenance
Stage
4. End-of-Life Stage
Design lifetime
AP [kg SO2 eq] 1.25E-01 1.17E-02 1.22E-02 8.38E-03
EP [kg N eq] 7.28E-03 9.50E-04 4.46E-04 1.36E-03
GWP [kg CO2 eq] 2.90E+01 2.26E+00 5.80E+00 1.74E+00
ODP [kg CFC 11 eq] -1.00E-12 2.16E-16 3.66E-14 4.70E-15
POCP [kg O3 eq] 1.62E+00 2.66E-01 2.30E+00 1.39E-01
RPRE [MJ] 8.50E+01 9.94E-01 6.20E+00 1.43E+00
NRPRE [MJ] 5.90E+02 3.22E+01 1.54E+02 2.08E+01
FW [m3] 1.51E-01 3.82E-03 3.46E-02 2.68E-03
RMR [kg] 0.00E+00 0.00E+00 0.00E+00 0.00E+00
NRMR [kg] 3.03E+01 0.00E+00 2.60E+00 0.00E+00
HWD [kg] 1.70E-06 2.60E-07 2.18E-08 8.68E-08
NHWD [kg] 3.66E+00 1.21E-03 1.83E-02 3.22E+01
BC [kg CO2 eq] 1.06E+01
HWP [MJ] 1.87E+00
FE [MJ] 2.83E+01
BE [MJ] 9.23E-01
NE [MJ] 7.42E+00
OE [MJ] 7.45E-01
9 |
9
Stolit® Lotusan® 1.0
Indicator 1. Product
Stage
2. Design & Construction
Stage
3. Use & Maintenance
Stage
4. End-of-Life Stage
Market-based lifetime
AP [kg SO2 eq] 8.00E-02 5.83E-03 1.86E-03 4.01E-03
EP [kg N eq] 3.36E-03 4.75E-04 6.83E-05 6.72E-04
GWP [kg CO2 eq] 1.50E+01 1.13E+00 8.76E-01 8.31E-01
ODP [kg CFC 11 eq] -4.92E-13 1.08E-16 5.47E-15 2.22E-15
POCP [kg O3 eq] 7.67E-01 1.33E-01 1.12E+00 6.59E-02
RPRE [MJ] 4.13E+01 4.98E-01 9.63E-01 6.69E-01
NRPRE [MJ] 2.93E+02 1.61E+01 2.31E+01 9.85E+00
FW [m3] 7.61E-02 1.92E-03 5.22E-03 1.27E-03
RMR [kg] 0.00E+00 0.00E+00 0.00E+00 0.00E+00
NRMR [kg] 1.52E+01 0.00E+00 3.80E-01 0.00E+00
HWD [kg] 8.49E-07 1.30E-07 3.37E-09 4.11E-08
NHWD [kg] 1.84E+00 6.06E-04 2.81E-03 1.53E+01
BC [kg CO2 eq] 5.20E+00
HWP [MJ] 9.33E-01
FE [MJ] 1.42E+01
BE [MJ] 4.61E-01
NE [MJ] 3.71E+00
OE [MJ] 3.72E-01
Indicator 1. Product
Stage
2. Design & Construction
Stage
3. Use & Maintenance
Stage
4. End-of-Life Stage
Design lifetime
AP [kg SO2 eq] 1.60E-01 1.17E-02 3.72E-03 8.02E-03
EP [kg N eq] 6.72E-03 9.50E-04 1.37E-04 1.34E-03
GWP [kg CO2 eq] 3.00E+01 2.26E+00 1.75E+00 1.66E+00
ODP [kg CFC 11 eq] -9.84E-13 2.16E-16 1.09E-14 4.44E-15
POCP [kg O3 eq] 1.53E+00 2.66E-01 2.24E+00 1.32E-01
RPRE [MJ] 8.26E+01 9.96E-01 1.93E+00 1.34E+00
NRPRE [MJ] 5.86E+02 3.22E+01 4.62E+01 1.97E+01
FW [m3] 1.52E-01 3.84E-03 1.04E-02 2.54E-03
RMR [kg] 0.00E+00 0.00E+00 0.00E+00 0.00E+00
NRMR [kg] 3.03E+01 0.00E+00 7.60E-01 0.00E+00
HWD [kg] 1.70E-06 2.60E-07 6.74E-09 8.22E-08
NHWD [kg] 3.68E+00 1.21E-03 5.62E-03 3.06E+01
BC [kg CO2 eq] 1.04E+01
HWP [MJ] 1.87E+00
FE [MJ] 2.83E+01
BE [MJ] 9.23E-01
NE [MJ] 7.41E+00
OE [MJ] 7.44E-01

10 |
10
Stolit® Lotusan® 1.5 Dark Colors
Indicator 1. Product
Stage
2. Design & Construction
Stage
3. Use & Maintenance
Stage
4. End-of-Life Stage
Market-based lifetime
AP [kg SO2 eq] 6.98E-02 6.71E-03 7.02E-03 4.82E-03
EP [kg N eq] 3.76E-03 5.47E-04 2.56E-04 7.84E-04
GWP [kg CO2 eq] 1.68E+01 1.31E+00 3.33E+00 1.00E+00
ODP [kg CFC 11 eq] -5.83E-13 1.24E-16 2.11E-14 2.70E-15
POCP [kg O3 eq] 8.62E-01 1.53E-01 1.32E+00 7.99E-02
RPRE [MJ] 4.70E+01 5.73E-01 3.56E+00 8.22E-01
NRPRE [MJ] 3.32E+02 1.85E+01 8.86E+01 1.20E+01
FW [m3] 8.52E-02 2.21E-03 1.99E-02 1.54E-03
RMR [kg] 0.00E+00 0.00E+00 0.00E+00 0.00E+00
NRMR [kg] 1.75E+01 0.00E+00 1.50E+00 0.00E+00
HWD [kg] 9.85E-07 1.50E-07 1.25E-08 4.99E-08
NHWD [kg] 2.10E+00 6.98E-04 1.05E-02 1.86E+01
BC [kg CO2 eq] 6.13E+00
HWP [MJ] 1.08E+00
FE [MJ] 1.63E+01
BE [MJ] 5.32E-01
NE [MJ] 4.27E+00
OE [MJ] 4.29E-01
Indicator 1. Product
Stage
2. Design & Construction
Stage
3. Use & Maintenance
Stage
4. End-of-Life Stage
Design lifetime
AP [kg SO2 eq] 1.40E-01 1.34E-02 1.40E-02 9.64E-03
EP [kg N eq] 7.52E-03 1.09E-03 5.12E-04 1.57E-03
GWP [kg CO2 eq] 3.36E+01 2.62E+00 6.66E+00 2.00E+00
ODP [kg CFC 11 eq] -1.17E-12 2.48E-16 4.22E-14 5.40E-15
POCP [kg O3 eq] 1.72E+00 3.06E-01 2.64E+00 1.60E-01
RPRE [MJ] 9.40E+01 1.15E+00 7.12E+00 1.64E+00
NRPRE [MJ] 6.64E+02 3.70E+01 1.77E+02 2.40E+01
FW [m3] 1.70E-01 4.42E-03 3.98E-02 3.08E-03
RMR [kg] 0.00E+00 0.00E+00 0.00E+00 0.00E+00
NRMR [kg] 3.49E+01 0.00E+00 3.00E+00 0.00E+00
HWD [kg] 1.97E-06 3.00E-07 2.50E-08 9.98E-08
NHWD [kg] 4.20E+00 1.40E-03 2.10E-02 3.72E+01
BC [kg CO2 eq] 1.23E+01
HWP [MJ] 2.15E+00
FE [MJ] 3.26E+01
BE [MJ] 1.06E+00
NE [MJ] 8.54E+00
OE [MJ] 8.58E-01

11 |
11
Stolit® Lotusan® 1.5
Indicator 1. Product
Stage
2. Design & Construction
Stage
3. Use & Maintenance
Stage
4. End-of-Life Stage
Market-based lifetime
AP [kg SO2 eq] 9.14E-02 6.71E-03 2.14E-03 4.62E-03
EP [kg N eq] 3.86E-03 5.47E-04 7.86E-05 7.74E-04
GWP [kg CO2 eq] 1.72E+01 1.31E+00 1.01E+00 9.57E-01
ODP [kg CFC 11 eq] -5.68E-13 1.24E-16 6.30E-15 2.55E-15
POCP [kg O3 eq] 8.80E-01 1.53E-01 1.29E+00 7.58E-02
RPRE [MJ] 4.74E+01 5.73E-01 1.11E+00 7.70E-01
NRPRE [MJ] 3.35E+02 1.85E+01 2.65E+01 1.13E+01
FW [m3] 8.69E-02 2.21E-03 6.01E-03 1.46E-03
RMR [kg] 0.00E+00 0.00E+00 0.00E+00 0.00E+00
NRMR [kg] 1.75E+01 0.00E+00 4.40E-01 0.00E+00
HWD [kg] 9.78E-07 1.50E-07 3.88E-09 4.73E-08
NHWD [kg] 2.12E+00 6.98E-04 3.23E-03 1.76E+01
BC [kg CO2 eq] 5.98E+00
HWP [MJ] 1.07E+00
FE [MJ] 1.63E+01
BE [MJ] 5.31E-01
NE [MJ] 4.27E+00
OE [MJ] 4.29E-01
Indicator 1. Product
Stage
2. Design & Construction
Stage
3. Use & Maintenance
Stage
4. End-of-Life Stage
Design lifetime
AP [kg SO2 eq] 1.83E-01 1.34E-02 4.28E-03 9.24E-03
EP [kg N eq] 7.72E-03 1.09E-03 1.57E-04 1.55E-03
GWP [kg CO2 eq] 3.44E+01 2.62E+00 2.02E+00 1.91E+00
ODP [kg CFC 11 eq] -1.14E-12 2.48E-16 1.26E-14 5.10E-15
POCP [kg O3 eq] 1.76E+00 3.06E-01 2.58E+00 1.52E-01
RPRE [MJ] 9.48E+01 1.15E+00 2.22E+00 1.54E+00
NRPRE [MJ] 6.70E+02 3.70E+01 5.30E+01 2.26E+01
FW [m3] 1.74E-01 4.42E-03 1.20E-02 2.92E-03
RMR [kg] 0.00E+00 0.00E+00 0.00E+00 0.00E+00
NRMR [kg] 3.49E+01 0.00E+00 8.80E-01 0.00E+00
HWD [kg] 1.96E-06 3.00E-07 7.76E-09 9.46E-08
NHWD [kg] 4.24E+00 1.40E-03 6.46E-03 3.52E+01
BC [kg CO2 eq] 1.20E+01
HWP [MJ] 2.15E+00
FE [MJ] 3.26E+01
BE [MJ] 1.06E+00
NE [MJ] 8.54E+00
OE [MJ] 8.57E-01

12 |
12
Stolit® Lotusan® Freeform Dark Colors
Indicator 1. Product
Stage
2. Design & Construction
Stage
3. Use & Maintenance
Stage
4. End-of-Life Stage
Market-based lifetime
AP [kg SO2 eq] 1.13E-01 1.05E-02 1.10E-02 7.51E-03
EP [kg N eq] 6.53E-03 8.52E-04 3.99E-04 1.22E-03
GWP [kg CO2 eq] 2.57E+01 2.04E+00 5.20E+00 1.56E+00
ODP [kg CFC 11 eq] -7.86E-13 1.93E-16 3.28E-14 4.22E-15
POCP [kg O3 eq] 1.46E+00 2.39E-01 2.06E+00 1.25E-01
RPRE [MJ] 7.50E+01 8.93E-01 5.56E+00 1.28E+00
NRPRE [MJ] 5.27E+02 2.89E+01 1.38E+02 1.88E+01
FW [m3] 1.35E-01 3.44E-03 3.10E-02 2.41E-03
RMR [kg] 0.00E+00 0.00E+00 0.00E+00 0.00E+00
NRMR [kg] 2.72E+01 0.00E+00 2.33E+00 0.00E+00
HWD [kg] 1.54E-06 2.34E-07 1.95E-08 7.78E-08
NHWD [kg] 3.15E+00 1.09E-03 1.64E-02 2.89E+01
BC [kg CO2 eq] 9.44E+00
HWP [MJ] 1.68E+00
FE [MJ] 2.54E+01
BE [MJ] 8.28E-01
NE [MJ] 6.65E+00
OE [MJ] 6.68E-01
Indicator 1. Product
Stage
2. Design & Construction
Stage
3. Use & Maintenance
Stage
4. End-of-Life Stage
Design lifetime
AP [kg SO2 eq] 2.26E-01 2.10E-02 2.20E-02 1.50E-02
EP [kg N eq] 1.31E-02 1.70E-03 7.98E-04 2.44E-03
GWP [kg CO2 eq] 5.14E+01 4.08E+00 1.04E+01 3.12E+00
ODP [kg CFC 11 eq] -1.57E-12 3.86E-16 6.56E-14 8.44E-15
POCP [kg O3 eq] 2.92E+00 4.78E-01 4.12E+00 2.50E-01
RPRE [MJ] 1.50E+02 1.79E+00 1.11E+01 2.56E+00
NRPRE [MJ] 1.05E+03 5.78E+01 2.76E+02 3.76E+01
FW [m3] 2.70E-01 6.88E-03 6.20E-02 4.82E-03
RMR [kg] 0.00E+00 0.00E+00 0.00E+00 0.00E+00
NRMR [kg] 5.44E+01 0.00E+00 4.66E+00 0.00E+00
HWD [kg] 3.08E-06 4.68E-07 3.90E-08 1.56E-07
NHWD [kg] 6.30E+00 2.18E-03 3.28E-02 5.78E+01
BC [kg CO2 eq] 1.89E+01
HWP [MJ] 3.35E+00
FE [MJ] 5.08E+01
BE [MJ] 1.66E+00
NE [MJ] 1.33E+01
OE [MJ] 1.34E+00
13 |
13
Stolit® Lotusan® Freeform
Indicator 1. Product
Stage
2. Design & Construction
Stage
3. Use & Maintenance
Stage
4. End-of-Life Stage
Market-based lifetime
AP [kg SO2 eq] 1.42E-01 1.05E-02 3.34E-03 7.20E-03
EP [kg N eq] 5.78E-03 8.52E-04 1.23E-04 1.21E-03
GWP [kg CO2 eq] 2.60E+01 2.04E+00 1.57E+00 1.49E+00
ODP [kg CFC 11 eq] -6.63E-13 1.93E-16 9.82E-15 3.98E-15
POCP [kg O3 eq] 1.27E+00 2.39E-01 2.01E+00 1.18E-01
RPRE [MJ] 7.24E+01 8.93E-01 1.73E+00 1.20E+00
NRPRE [MJ] 5.15E+02 2.89E+01 4.14E+01 1.77E+01
FW [m3] 1.35E-01 3.44E-03 9.37E-03 2.28E-03
RMR [kg] 0.00E+00 0.00E+00 0.00E+00 0.00E+00
NRMR [kg] 2.72E+01 0.00E+00 6.90E-01 0.00E+00
HWD [kg] 1.46E-06 2.34E-07 6.04E-09 7.37E-08
NHWD [kg] 3.17E+00 1.09E-03 5.04E-03 2.74E+01
BC [kg CO2 eq] 9.24E+00
HWP [MJ] 1.67E+00
FE [MJ] 2.54E+01
BE [MJ] 8.28E-01
NE [MJ] 6.65E+00
OE [MJ] 6.68E-01
Indicator 1. Product
Stage
2. Design & Construction
Stage
3. Use & Maintenance
Stage
4. End-of-Life Stage
Design lifetime
AP [kg SO2 eq] 2.84E-01 2.10E-02 6.68E-03 1.44E-02
EP [kg N eq] 1.16E-02 1.70E-03 2.46E-04 2.42E-03
GWP [kg CO2 eq] 5.20E+01 4.08E+00 3.14E+00 2.98E+00
ODP [kg CFC 11 eq] -1.33E-12 3.86E-16 1.96E-14 7.96E-15
POCP [kg O3 eq] 2.54E+00 4.78E-01 4.02E+00 2.36E-01
RPRE [MJ] 1.45E+02 1.79E+00 3.46E+00 2.40E+00
NRPRE [MJ] 1.03E+03 5.78E+01 8.28E+01 3.54E+01
FW [m3] 2.70E-01 6.88E-03 1.87E-02 4.56E-03
RMR [kg] 0.00E+00 0.00E+00 0.00E+00 0.00E+00
NRMR [kg] 5.44E+01 0.00E+00 1.38E+00 0.00E+00
HWD [kg] 2.92E-06 4.68E-07 1.21E-08 1.47E-07
NHWD [kg] 6.34E+00 2.18E-03 1.01E-02 5.48E+01
BC [kg CO2 eq] 1.85E+01
HWP [MJ] 3.35E+00
FE [MJ] 5.08E+01
BE [MJ] 1.66E+00
NE [MJ] 1.33E+01
OE [MJ] 1.34E+00

14 |
14
Interpretation
For all the products in study, the majority of the environmental impacts come from the Product Stage, which includes raw material sourcing, transportation and manufacturing. The only exception is POCP whose dominant source is Use & Maintenance Stage because of VOC emission in the curing process. From a functional unit perspective, the lifetime of the product and the coverage rate play a major role in scaling the impacts. This explains why products of coarse finishes have a higher impact than those of fine finishes.
Reference
• Life Cycle Assessment, LCA report for Sto Corp. WAP Sustainability, September 2019
• PCR for Architectural Coatings: NAICS 325510. NSF International, 2017
• ISO14044:2006 Environmental Management–Life cycle assessment–Requirements and Guidelines.
• ISO 14025:2006 Environmental labels and declarations – Type III environmental declarations – Principles and Procedures.
• ISO 21930:2007 Sustainability in buildings and civil engineering works – Core rules for environmental product declarations of construction products and services.
• Advancing Sustainable Materials Management: 2015 Fact Sheet. US EPA. Available at https://www.epa.gov/sites/production/files/2018-07/documents/2015_smm_msw_factsheet_07242018_fnl_508_002.pdf
• Product Bulletin – Stolit® Lotusan®. Sto Corp. Available at https://www.stocorp.com/wp-content/content/Products_TechService/Finishes/Product%20Bulletins/PB_80190-82193_Stolit_Lotusan_EN.pdf