EPA 453 R-93-017 Control of VOC From Batch Processes
377
Control of Volatile Organic Compound Emissions from Batch Processes - Alternative Control Techniques Information Document
-
Upload
khangminh22 -
Category
Documents
-
view
0 -
download
0
Transcript of EPA 453 R-93-017 Control of VOC From Batch Processes
Control of Volatile Organic Compound Emissions from Batch Processes - Alternative Control Techniques Information Document
Control of Volatile Organic Compound Emissions from Batch Processes
Emislion Standard Division
US. ENVIRONMENTAL PROTECTlON AGENCY Office of Air and Radiation
Office of Air Quality Planning and Standards Research Triangle Park, North Carolina 2771 1
This report is issued by the Office of Air Quality Planning and Standards (OAQPS) to provide information to State and local air pollution control agencies. Mention of trade names or commercial products is not intended to constitute endorsement or recornendation for use. Copies of this report will be available - as supplies permit - from the Library Services Office (MD-35), U. S. Environmental Protection Agency, Research Triangle Park, North Carolina 27711. Springfield, Virginia 22161.
TABLE OF CONTENTS
1.0 INTRODUCTION . . . . . . . . . . . . . . . . . . . . . 2.0 BATCH PROCESS DESCRIPTIONS . . . . . . . . . . . . .
2.1 UNIT OPERATIONS IN BATCH PROCESSING . . . . 2.1.1 Reactors . . . . . . . . . . . . . . . . 2.1.2 Solid/Liquid Separation . . . . . . . . 2.1.3 Drying . . . . . . . . . . . . . . . . . 2.1.4 Distillation . . . . . . . . . . . . . . 2.1.5 Extraction . . . . . . . . . . . . . . . 2.1.6 Crystallization . . . . . . . . . . . . 2.1.7 Storage . . . . . . . . . . . . . . . . 2.1.8 Transfer Operations . . . . . . . . . . 2.1.9 Equipment Leaks . . . . . . . . . . . . 2.1.10 Wastewater . . . . . . . . . . . . . . .
2.2 EXAMPLE INDUSTRY DESCRIPTIONS . . . . . . . . . 2.2.1 Synthetic Resin Manufacturing . . . . . 2.2.2 Pharmaceuticals Industry
Description . . . . . . . . . . . . . 2.2.3 Pesticide Manufacturing . . . . . . . . 2.2.4 Synthetic Organic Chemicals
Manufacturing Industry (SOCMI) . . . . 3.0 EMISSION ESTIMATION METHODOLOGIES . . . . . . . . .
PROCESS VENT EMISSIONS
3.1.1 Drying . . . . . . . . . . . . . . . . . 3.1.2 Tank and Reactor Purging . . . . . . . . 3.1.3 Vapor Displacement Losses . . . . . . . 3.1.4 Vessel Heating . . . . . . . . . . . . . 3.1.5 Gas Evolution . . . . . . . . . . . . . 3.1.6 Sparging . . . . . . . . . . . . . . . . 3.1.7 Batch Pressure Filtration . . . . . . . 3.1.8 Emissions from Vacuum Generating Equipment
3.2 EVAPORATIVE LOSSES FROM WASTEWATER . . . . . . 3.3 STORAGETANKEMISSIONS . . . . . . . . .
. 3.4 EQUIPMENTLEAKS . . . . . . . . . . . . . . . .
1-1
2.1
2-2 2-12 2-21 2-26 2-30 2-31 2-34 2-35 2-36 2-36
iii
TABLE OF CONTENTS (continued)
4.0 CONTROL TECHNOLOGIES . . . . . . . . ' . . . . . . . . 4.1 CONDENSERS . . . . . . . . . . . . . . . . . .
4.1.1 Design . . . . . . . . . . . . . . . . . 4.1.2 Specific Systems and Applications . . .
4.2 SCRUBBERS . . . . . . . . . . . . . . . . . . . 4.2.1 General Gas Absorbers . . . . . . . . . 4.2.2 Design. . . . . . . . . . . . . . . . . 4.2.3 Specific Systems and Applicability . . . CARBON ADSORPTION
4.3.1 Design. . . . . . . . . . . . . . . . . 4.3.2 Applicability . . . . . . . . . . . . . THERMAL DESTRUCTION
4.4.1 Flares . . . . . . . . . . . . . . . . . 4.4.2 Thermal and Catalytic Oxidizers . . . .
4.5 SOURCE REDUCTION MEASURES . . . . . . . . . . . 4.5.1 Vapor Containment . . . . . . . . . . . 4.5.2 Limiting the- Use of Inert Gas . . . . . 4.5.3 Use of Closed Processing Equipment . . . 4.5.4 Material Substitution/Improved
Separation Techniques . . . . . . . . . 4.5.5 Improved Process Design . . . . . . . .
5.0 ENERGY AND ENVIRONMENTAL IMPACTS . . . . . . . . . . 5.1 ENERGYIMPACTS . . . . . . . . . . . . . . . . 5.2 AIRQUALITYIMPACTS. . . . . . . . . . . . . . 5.3 WASTEWATER AND SOLID WASTE IMPACTS . . . . . .
TABLE OF CONTENTS (continued)
6 . 0 DESCRIPTION OF CONTROL OPTIONS . . . . . . . . . . . 6 . 1 BACKGROUND . . . . . . . . . . . . . . . . . . 6 . 2 TECHNICAL BASIS FOR OPTIONS . . . . . . . . . .
6 . 2 . 1 Approach . . . . . . . . . . . . . . . . 6 . 2 . 2 Options Methodology . . . . . . . . . .
6 . 3 PRESENTATION OF FLOWRATE REQUIREMENTS . . . . . 6 . 4 IMPACTS OF APPLYING OPTIONS . . . . . . . . . .
6 . 4 . 1 Industries Covered . . . . . . . . . . . . 6 . 4 . 2 Model Processes . . . . . . . . . . . . 6 . 4 . 3 Baseline Asaumptions/Extrapolations . .
7 . 0 IMPLEMENTATION. . . . . . . . . . . . . . . . . . . . 7 . 1 DEFINITIONS AND APPLICABILITY . . . . . . . . .
7 . 1 . 1 Definitions . . . . . . . . . . . . . . 7 . 1 . 2 Applicability . . . . . . . . . . . . .
7 . 2 FORMATOFSTANDARDS . . . . . . . . . . . . . . 7 . 3 TESTING . . . . . . . . . . . . . . . . . . . . 7 . 4 COMPLIANCE MONITORING REQUIREMENTS . . . . . . 7 . 5 REPORTING/RECORDKEEPING REQUIREMENTS . . . . .
APPENDIXA . PHYSICALDATA . . . . . . . . . . . . . . . APPENDIX B . CALCULATIONU ISSUES . . . . . . . . . . . APPENDIX C . SAMPLE CALCULATIONS . . . . . . . . . . . . APPENDIX D . COST CALCULATIONS . . . . . . . . . . . . . APPENDIX 6 . MODEL EMISSION STREAM CALCULATIONS . . . . APPENDIX F . MASS EMISSIONS . . . . . . . . . . . . . . APPENDIX G . BATCH PROCESSING EXAMPLE RULE . . . . . . .

TABLE OF CONTENTS (co
CONTROL TECHNOLOGIES
CONDENSERS . . . . . . . . . 4.1.1 Design . . . . . . . . 4.1.2 Specific Systems and A
SCRUBBERS . . . . . . . . . . . . 4.2.1 General Gas Absorbers 4.2.2 Design. . . . . . . . 4.2.3 Specific Systems and A
CARBON ADSORPTION . . . . . . 4.3.1 Design. . . . . . . . 4.3.2 Applicability . . . . THERMAL DESTRUCTION
4.4.1 Flares . . . . . . . . 4.4.2 Thermal and Catalytic
SOURCE REDUCTION MEASURES . . 4.5.1 Vapor Containment - . .
- 1 - . . . , a. -* -
5.1 ENERGY IMPACTS . . . . . . . 5.2 AIR QUACITY IMPACTS . . . . . 5.3 WASTEWATER AND SOLID WASTE IM
LIST OF FIGURES (continued)
Figure 6-6. Dependence of control devise cost on emission intermittency . . . . . . . . .
Figure 6-7. Annual Mass Emission Total C/E Curve . . . Figure 7-1. Example Option Analysis . . . . . . . . . .
vii
LIST OF FIGURES
Figure 2-1. Basic Design of a kettle-type batch reactor . . . . . . . . . . . . . .
Figure 2-2. Plate-and-frame filter press . . . . . . . Figure 2-3. Agitated pressure Nutsche filter . . . . . Figure 2-4. Top-auspended centrifugal filter . . . . . Figure 2-5. Vacuum tray dryer . . . . . . . . . . . . . Figure 2-6a. Counter-current air-heated rotary
dryer . . . . . . . . . . . . . . . . . . Figure 2-6b. Cross-sectional view . . . . . . . . . . . Figure 2-7. Tumble (double-cone) dryer . . . . . . . . Figure 2-8a. Batch fractionator . . . . . . . . . . . . Figure 2-8b. Vacuum generating equipment . . . . . . . . Figure 2-9. Vacuum crystallizer . . . . . .. . . . . . . Figure 2-10. Wet-strength resins production . . . . . . Figure 2-11. Aspirin manufacturing . . . . . . . . . . . Figure 2-12. Process schematic for Heptachlor . . . . . Figure 2-13. Process schematic for Chlorendic
Anhydride . . . . . . . . . . . . .* . . . 2- 63 Figure 4-1. Filter cake drying curve . . . . . . . . . 4-9 @
Figure 4-2. Dryer emission stream aolvent content . . . 4 -9 Figure 4-3. Closed-loop drying system . . . . . . . . . 4-14
Figure 6-1. Model Batch Process . . . . . . . . . . . . 6-4 *P
Figure 6-2. Flowrateprofile . . . . . . . . . . . . . 6- 6 Figure 6-3. Concentration profile . . . . . . . . . . . 6-7
Figure6-4. Emissionsprofile . . . . . . . . . . . . . 6-8 rr
Figure 6-5. Flowrate, concentration and emissions profiles 6-9

INTRODUCTION
The purpose of this document is to provide information on
alternative control techniques for volatile organic compound
(VOC) emissions from batch operations. Although the control
, techniques information applies to batch processing in all
industries, the document focuses primarily on batch processes in
the following six industries: plastic materials and resins
(described by Standard Industrial Classification (SIC) Code
2821), pharmaceuticals (SIC 2833 and 2834), gum and wood chemicals (SIC 2861), cyclic crudes and intermediates (SIC 2865),
industrial organic chemicals (SIC 28691, and agricultural
chemicals (SIC 2879). This document contains information on
emissions, controls, control options, and costs that States can
use in developing rules based on reasonably available control
technology. The document presents options only, and does not
contain a recommendation on reasonably available control
technology.
2.0 BATCH PROCESS DESCRIPTIONS
This chapter identifies and describes the most conunon unit .
operations found in batch processing and provides descriptions of industries that typically use batch processing. The unit
operations section of this chapter provides descriptions of the
equipment (i.e., reactors, filters, dryers, distillation columns,
extractors, crystallizers, and storage/transfer devices) used to
perform batch processing steps. In the industry description
section, four industries were selected to illustrate how these
unit operations are combined to produce polymers and resins,
pharmaceutical products, pesticides, and synthetic organic
chemicals.
Whereas the unit operations section provides general
information on equipment operation and sources of VOC emissions,
the industry description section focuses in detail on equipment
arrangements, process flows, operating conditions, and sources of
emissions. Whenever possible, information is provided that can'
be used, in conjunction with the procedures described in
subsequent chapters, to estimate VOC emissions from the five
example batch processes. Moreover, the readers may use these
examples as a guide in evaluating emissions from other specific
batch processes that use these same or similar unit operations.
2.1 UNIT OPERATIONS IN BATCH PROCESSING The unit operations discussed are commonly used to produce,
separate, and prepare chemical products or intermediates on a batch basis. For each unit operation, a discussion is provided
of the equipment used to accomplish that operation, key equipment design considerations, principles of equipment operation, and factors affecting emissions.

d to provide a more general description of the operations
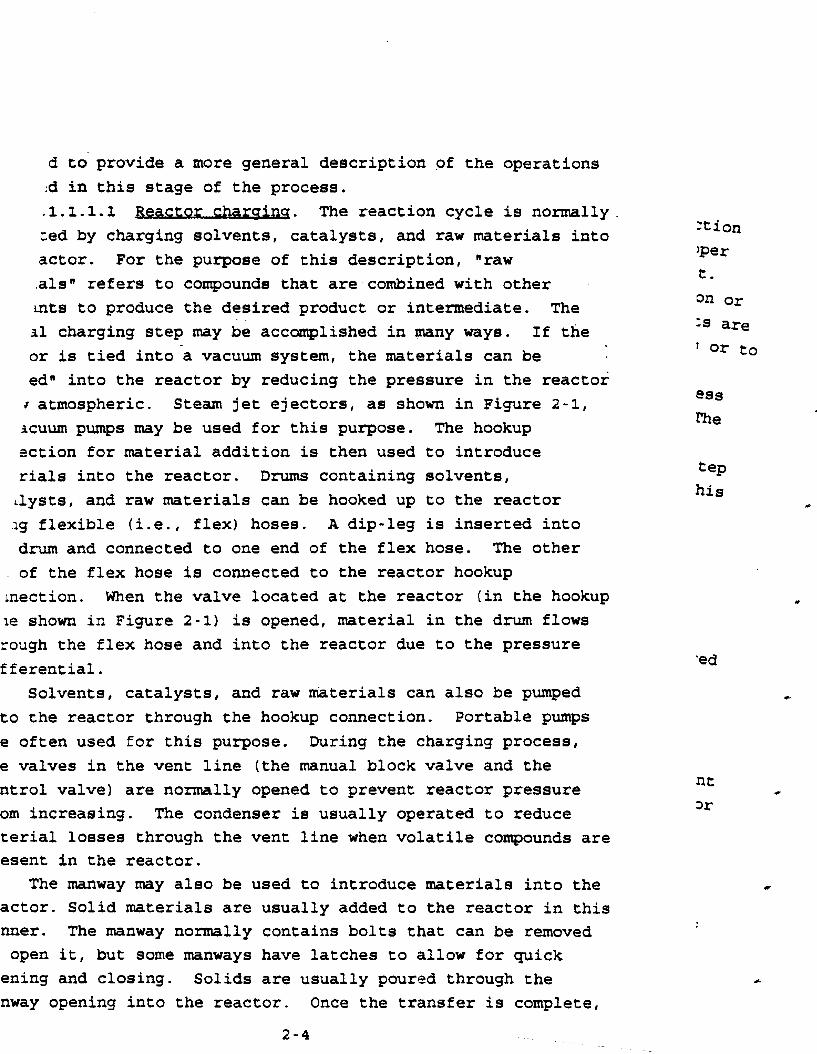
:d in this stage of the process. . . I Reactor. The reaction cycle is normally. ced by charging solvents, catalysts, and raw materials into actor. For the purpose of this description, "raw .alsn refers to compounds that are combined with other mts to produce the desired product or intermediate. The
nl charging step may be accomplished in many ways. If the or is tied into -a vacuum system, the materials can be edm into the reactor by reducing the pressure in the reactor J atmospheric. Steam jet ejectors, as shown in Figure 2-1, 3cuum pumps may be used for this purpose. The hookup ection for material addition is then used to introduce rials into the reactor. Drums containing solvents, ~lysts, and raw materials can be hooked up to the reactor lg flexible e l flex) hoses. A dip-leg is inserted into drum and connected to one end of the flex hose. The other
of the flex hose is connected to the reactor hookup mection. When the valve located at the reactor (in the hookup le shown in Figure 2-11 is opened, material in the drum flows rough the flex hose and into the reactor due to the pressure
fferential. Solvents, catalysts, and raw materials can also be pumped
to the reactor through the hookup connection. Portable pumps e often used for this purpose. During the charging process, e valves in the vent line (the manual block valve and the ntrol valve) are normally opened to prevent reactor pressure om increasing. The condenser is usually operated to reduce terial losses through the vent line when volatile compounds are esent in the reactor.
The manway may also be used to introduce materials into the actor. Solid materials are usually added to the reactor in this nner. The manway normally contains bolts that can be removed open it, but some manways have latches to allow for quick ening and closing. Solids are usually poured through the nway opening into the reactor. Once the transfer is complete,
Xion
)per t.
on or :S are
or to
tep his
'ed
*
the manway is closed and bolted so that the reactor can be
operated under pressure. In some cases, the middle part of the manway is constructed of heavy glass or plexiglass so the
operator can view the inside of the reactor during operation. The use of flexible hoses and quick-disconnect fittings are
typical of manual-type operations where many different products may be manufactured in the same vessel. At other facilities where the same batch product is manufactured routinely in the
same vessel, the reactor may be equipped with dedicated lines for
transferring materials into the reactor. The dedicated lines connect the reactor with storage or weigh tanks containing
solvents and raw materials. These storage tanks are often located at a higher level than the reactor so that material will flow by gravity into the reactor once valves in the transfer
lines are opened. In some cases, a reactor may be equipped with dedicated lines for charging certain materials that are used
often (e.g., common solvents) and also equipped with a general hookup line for less common materials.
2.1.1.1.2 Peactant addition and reactor ooeration . The
most complex step in a typical batch reaction cycle is often the
reactant addition step. This step involves the introduction of a reactant or reactants with the materials already charged into the
reactor (e.g., solvents, catalysts, and initiators). The manufacture of some products involves only a single reactant
addition step. The manufacture of other products is more complex, requiring several steps. In these cases, several
intermediates may be generated during the reaction cycle, and different reactants may'be reacted with each subsequent intermediate.
The operation of the reactor during the reactant addition step is affected primarily by two factors: (1) the kinetics of the specific reaction and ( 2 ) the capabilities of the reactor design. The reaction kinetics define the desired operating conditions. However, limits on the conditions that can be obtained during operation are often defined by the reactor design. Four important operating variables that are m~nitored

and controlled during the reactant addition step are: the #2
addition rate of the reactant, the reactor temperature, the reactor pressure, and the degree of mixing. The addition rate is closely tied to the reactant concentration, which optimizes the generation of the desired product. If undesirable by-products are generated when a reactant is available in excess, it would be
necessary to monitor the addition rate closely to avoid operating with a reactant concentration that is too high. In other cases, the reactant concentration is not critical and, therefore, tight control of the reactant feed rate is not required.
The reactant addition step may be accomplished in the same way that materials are added to the reactor during the charging step. When the reactant feed rate must be tightly controlled, a metering pump is sometimes used. If the reaction rate is known, the reactant feed rate can be adjusted using the pump to maintain a proper concentration of the reactant. In other cases, operating parameters such as temperature and pressure determine how rapidly the reactant is added to the reactor. For example, if the reaction is exothermic, the cooling capacity of the reactor may determine how rapidly a reactant can be fed. The monitoring and control of operating variables other than the
reactant addition rate are discussed in more detail below. The reactor shown in Figure 2-1 is equipped with a typical
temperature control system. The reactor is "jacketedu so that either cooling water or steam can be circulated around the shell of the reactor. For example, steam may be required initially to heat reactor contents to elevated temperatures due to kinetic considerations, while cooling water is required at a later time to quench or stop the reaction at a desired conversion level. A
thermocouple is typically inserted into the side of the reactor and used to monitor the reactor temperature. The temperature read by the thermocoupl'e is normally transmitted to controllers -that manipulate the action of the automatic cooling water and steam valves.
Figure 2-1 also shows the scheme used to control the reactor pressure. A sensor located on top of the reactor measures
pressure in the reactor headspace. This pressure reading is
transmitted to controllers that operate flow valves on the vent line (during atmospheric pressure operation) or the ejector inlet
line (during vacuum operation). Both lines may be fitted with
condensers to minimize losses of volatile materials when they are purged from the reactor. The condensed materials are reflwed
back to the reactor through the return line. As discussed earlier, the reactant addition rate is sometimes governed by
operating variables such as the reactor pressure. The cooling .
capacity of the condenser and the sizing of the vent line both ,
affect the operating pressure. In some cases, the reactant feed
rate must be slowed to prevent overpressuring of the xeactor or
to reduce material losses through the vent line. The degree of mixing is another operating variable that must
be controlled during many reaction processes. The reactor shown in Figure 2-1 is equipped with an agitator for mixing. In some designs, a variable speed motor is installed so that the mixing
rate can be adjusted. In addition to the agitator, mixing can be
accomplished using the recycle line and the reactor transfer
pump. The contents of the reactor are mixed by pumping material
at the bottom of the reactor through the recycle line and back
into the top of the reactor. The valve located in the recycle line can be manually throttled to control the recycle flow rate.
This recycling process may be conducted with or without the agitator running, depending on the mixing needs of the specific
reaction. 2.1.1.1.3 reactor contentg. Once the reaction
step is complete, product purification steps are usually
required. These steps may involve a number of unit operations such as crystallization, distillation, filtration, and others.
Some of these steps, such as solvent recovery, may be conducted in the reactor vessel. Other steps require more specialized equipment. These unit operations will be discussed in subsequent sections. For the purpose of this section, it is assumed that the contents of the reactor are discharged following the reaction step and the reactor is prepared for the next batch.
2-7

The contents of the reactor can be discharged by gravity or
by using a transfer pump. If a pump is not available, nitrogen pressure or air pressure may be used to transfer material. Flex hoses can be used to connect the transfer line to the next
equipment piece, such as a batch distillation column. At one
end, the flex hose would be attached to the connection shown on
the discharge side of the pump. On the other end, the flex hose
would be attached to a similar connection on the distillation
columr~. The contents of the reactor would be transferred to the
still by opening valves in the transfer line at the reactor and
distillation column and starting the transfer pump, if necessary.
After the contents have been transferred, it is often
necessary to thoroughly clean the reactor. This cleanup is
essential if a different product is to be produced in the next
batch. If another batch of the same product is planned for the
reactor, cleanup may not be required. In cases where the reactor
needs thorough cleaning, it is often washed with water to remove P
residual product or catalyst. If water-insoluble compounds must
be removed from the reactor, a solvent rinse is often required
prior to starting the next batch. Both of these steps generate
waste streams. Wastewater generated during water washing is
often discharged to onsite wastewater treatment facilities; in
some cases, it may be sent to the public sewer. Solvent from the
reactor rinse step is usually collected and stored in waste
solvent containers for disposal. The waste solvent may be
disposed of by methods such as incineration or it may be purified
for reuse by distillation. These operations may be conducted
either onsite by the facility or the solvent may be sent to a commercial reclaimer.
Following the water wash or the solvent rinse, the reactor
is heated until dry. Steam is used to heat the reactor jacket
and evaporate residual water or solvent remaining on the inside
reactor walls. If the reactor is washed in water, the
evaporating water vapor may be allowed to flow out the vent line
into the atmosphere. If a solvent rinse is used, normally the
condenser is operated and the condensed solvent is reclaimed for
disposal. In this case, some solvent may escape through the vent with noncondensables flowing out the vent line. Once the reactor
is clean and dry, it can be closed and prepared for the next
reactor charge. . .2.1.1.2 From
Beactor~. The potential for VOC emissions exists during all
steps of the reaction cycle that were discussed above. Emissions are discussed below in order according to the chronology of the
steps presented above. 2.1.1.2.1 -. During the charging process, voiatile
compounds may be lost through the vacuum system, the vent line,
or the manway. -Vacuum o~erati-a cwuinq. If materials are being
charged into the reactor using a vacuum system, volatile compounds may be pulled into the vacuum system, which typically
will be a steam jet ejector or a water seal vacuum pump. These
compounds either leave the jet ejector system with the steam
condensate, leave with vacuum pump seal water, or are vented from
the vacuum system with noncondensables. The amount of materials
lost through the vacuum system depends on the volatility of rhe compounds in the reactor and the duration of vacuum system
operation. The steam condensate or pump seal liquid may be combined with other waste streams and treated onsite, or it may
be discharged into a public sewer. Emissions may occur during the collection and treatment of these wastewater streams and are
referred to as secondary emissions. A description of these
emissions is discussed in this document.
Atmos~heric v e n m a durina charuinq. If the reactor vent line is left open to the atmosphere during charging, volatile
compounds may be vented along with the inert gases being displaced from the reactor through the vent line. As the material is pumped into the reactor, the rising liquid surface causes the displacement of the vapor occupying the shrinking headspace.
wav *ions durins charsinq. Emissions can also occur when the manway is open for charging solids into the reactor if
volatile compounds have been previously charged into the reactor.
These compounds will saturate the vapor space above the liquid in
the reactor. If these vapors are less dense than air, they will
flow from the reactor once the manway is opened due to the
buoyancy effect. This buoyancy effect will be increased if the
liquid in the reactor is warmer than room temperature. The
longer the manway is left open, the greater the emissions will be
during this step.
pitrosen D-U duripa -. When toxic or ignitable '
material is contained in the reactor or is being charged into the
reactor, the reactor headspace is often purged with an inert gas
such as nitrogen. The purge may be carried out when the reactor
vent is open to the atmosphere or prior to opening the manmay for
solids addition. The purge reduces high concentrations of
volatile material in the headspace that could harm workers in the
immediate area or create an explosive mixture, but it increases rC
the emissions of VOC1s. I .2.1.1.2.2 missions durins reactant addltlon and reactioq.
. t add1. tion. The reactant addition step essentially
is a charging step, except that the temperature of the material
in the reactor may begin to increase as reactant is added.
Emissions occur as a result of vapor displacement and increase
with the rise in temperature because of increased volatilization
of material in the reactor headspace. Emissions from reactant
addition steps are normally emitted through the reactor vent
line.
Reactor heatup. During the reaction, the contents of the
reactor may begin to heat up, if the reaction is exothermic.
External heating may also be applied to the reaction. Emissions
of VOC1s and air toxics occur during this step because of the
expansion of headspace gas volume and because of the (increased
volatilization of VOC1s) due to temperature rise.
Additional load is placed on the condenser system if the
reactor is purged with nitrogen during reaction. The nitrogen is
routed through the vent line so that condensables in the purge
gas can be refluxed back to the reactor. Since the nitrogen

purge reduces the concentration of volatile organics flowing
through the condenser, it lowers the dew point of the stream. In
addition, the mass flow rate increases and the residence time
decreases. This combination of effects can result in reduced
condenser efficiency and, therefore, greater emissions of
volatiles. . Volatile organic compounds may also be
emitted through the pressure relief valve during the reaction.
This safety device is used to relieve overpressure in the reactor to prevent vessel rupture. The valve is set above any pressure
that should normally be encountered during a normal reaction
process. . . 2.1.1.2.3 Emissions from D ~ O ~ U C ~ gurlflcation and trwsfer;.
Vacuum distillation. After the reaction is complete, excess
solvent may be separated from the product by vacuum distillation.
Emissions from this step will be limited by the exit conditions
of the reactor condenser, or condensers, if a secondary condenser
is used. Condensers work effectively in these situations since
the uncontrolled streams contain high concentrations of volatile
components that are easily condensed at moderate temperatures and
atmospheric pressure.
Product. transfer. Following reaction, the contents of the
reactor are discharged for further processing and packaging. The transfer of the reactor material contents may be accomplished by
gravity, by pumping, by pressurizing the reactor, or by
depressurizing the receiver. The transfer step can create
displacement emissions in the receiving vessel if the material
transferred has a significant VOC concentration or if the receiving vessel contains VOC. If material is transferred using
a vacuum pump, emissions may occur from the pump seal water, if
the system is "once-through." The transfer of material using nitrogen or air pressure may cause VOC emissions, since the inert
gas used as a carrier will in most cases be vented from the process lines after the transfer is complete. Depending upon the situation, this inert gas may contain significant amounts of entrained VOC1s.

2.1.1.2.4 Reactor washinq. As discussed earlier,
wastewater and waste solvent streams may be generated during
reactor washing. If the reactor is washed with water, the
resulting wastewater stream will be directed either to a
treatment facility (where secondary emissions may occur) or to a
sewer. If the reactor is rinsed with a solvent, emissions may
occur during the charging or disposal of the waste solvent.
Emissions may also occur during subsequent drying steps. During
drying, heat is applied to the reactor jacket to evaporate any
residual solvent remaining on the inside reactor walls. The
evaporating solvent may be routed through the condenser system
for recovery.
2.1.2 Solid/Liauid Se~aration
Two general methods are available for the separation of a
solid/liquid mixture--settling and filtration. Whereas settling
relies on gravity to effect a separation, filtration uses
external forces to separate the two phases. Specifically,
filtration uses a permeable medium that retains the solid while
allowing the liquid to pass through.
In order to force a liquid through a filter medium,-a
pressure drop must be applied. This pressure drop may be
affected by gravity, centrifugal force, vacuum or positive
pressure. Centrifugal separation is discussed in
Section 2.1.2.2. The following section discusses batch
filtration.
2.1.2.1 Batch Filtration. The two types of batch
filtration systema most widely used are pressure and vacuum
filters. Batph pressure filters are used more often than vacuum ,filters when filtering fine particles, because pressure
filtration provides the driving force needed to achieve economical filtering rates. Batch pressure filters have the
following advantages: 1. They allow for rapid filtration of fine slurries, which
would otherwise be filtered at an uneconomically low rate;
2. They are compact and offer high filtering area per unit
of plant space occupied; and

3. They are flexible in operation and provide this
flexibility at a lower initial cost than other types of filters.
However, a batch vacuum filter may be better suited for
filtration applications that involve solvent vapors that produce
highly combustible atmospheres. 1 There are several types of batch pressure filters. Two
common types are plate-and-frame and nutsche filters.
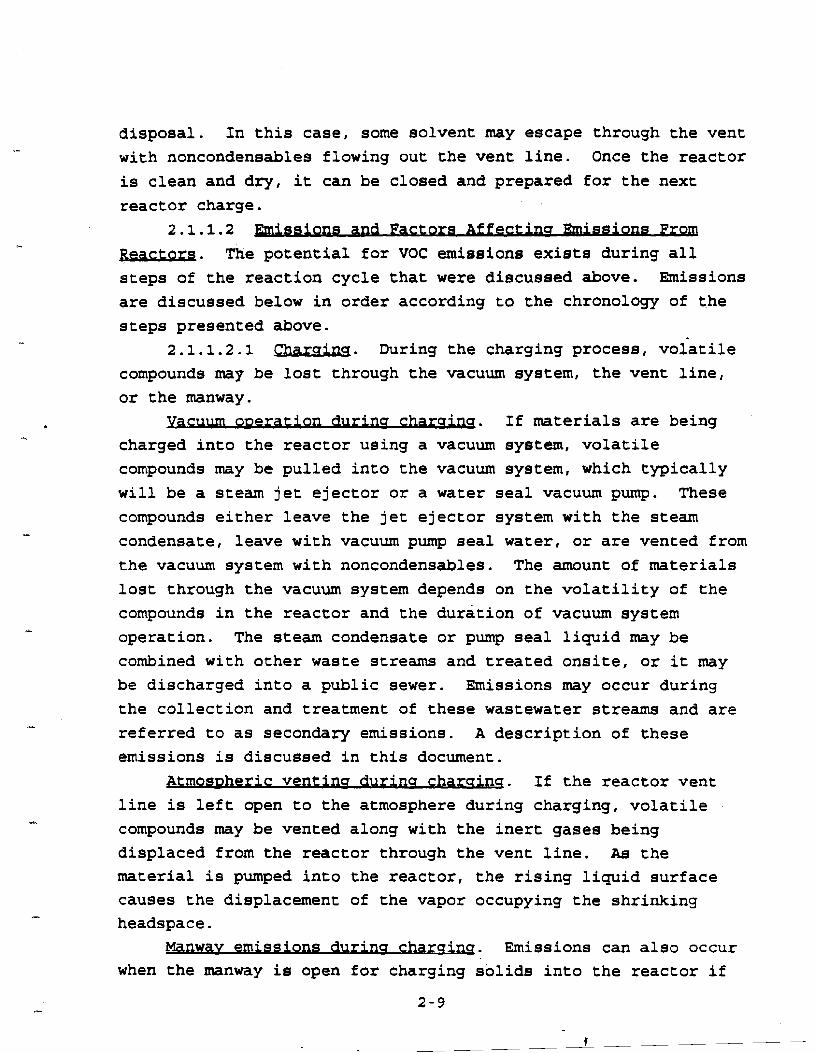
plate-and-frame DrePg. Figure 2-2 is a simple diagram of a
plate-and-frame filter press, which consists of alternating solid plates and hollow frames. Plates and frames are separated by .
filter cloth. The feed slurry enters at the top of the frames, and the filter cake accumulates within the frames as the slurry
flows downward. An open filtrate discharge allows the drain ports to empty into a trough. In closed discharge filters, drain
ports are located in the corners of each plate. This drainage system allows the filtrate to flow in a channel along the length
of the press. Slurry is pumped into the filter press until the frames are
full. This determination is made based on time, a decrease in
feedrate or an increase in backpressure. Once the frames within
the filter area are full, the discharge ports are opened. Filter
cake forms on the cloth as the slurry liquid flows through the
cloth.
The thickness of the filtercake depends on the purpose of
the filtration. In purification of a dilute slurry to yield a
clean filtrate, the filtercake is thin. In solids recovery, when
slurries may be 40 percent solids, the frames are usually full
after the cycle. Frames of varying thickness are available for
different applications. After the slurry has passed through the filter, a wash
liquid may be applied. There are two different methods used for cake washing. In simple washing, wash liquid follows the same path as the slurry. In through washing, wash liquid enters alternate plates and is forced through the entire cake by alternately closed discharge ports. Cake characteristics
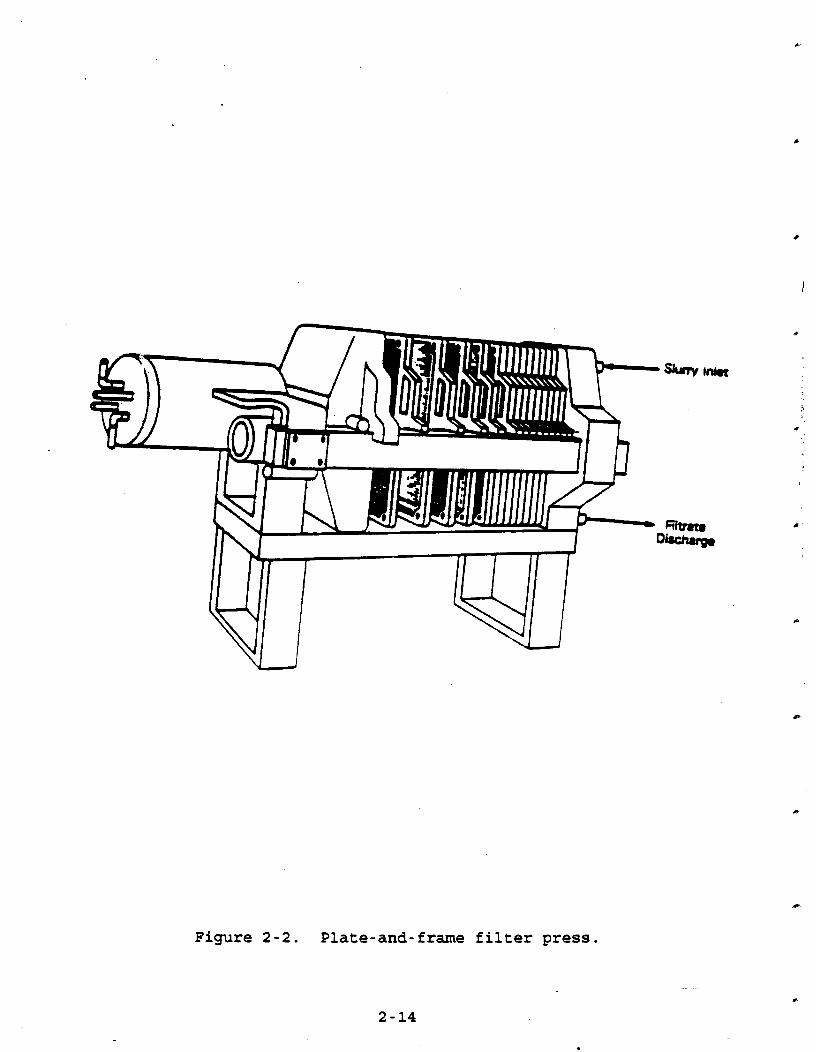
Figure 2-2. Plate-and-frame filter press.

determine the appropriate wash method. Compressed gas, such as
air, may also be used to clean and dry the cake. Solids are discharged by opening and separating the plates.
Vibration and air blowing may be used to detach the filtercake
from the cloth. These operations may be done manually or mechanically.
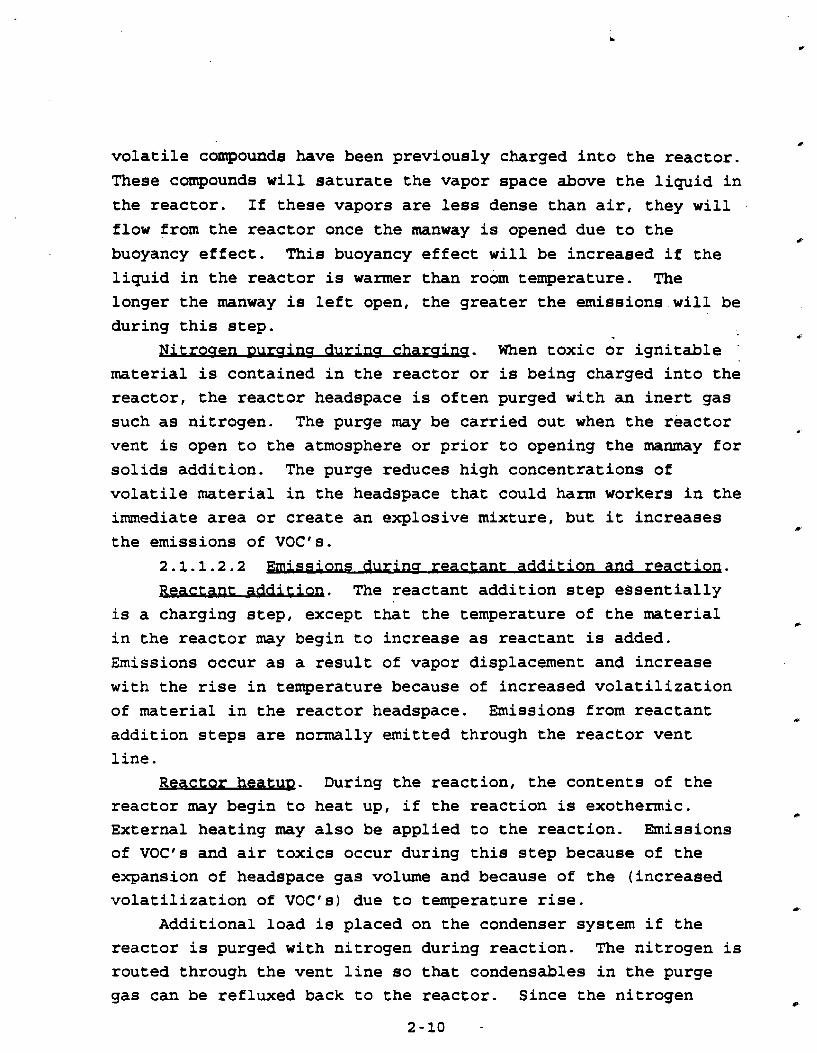
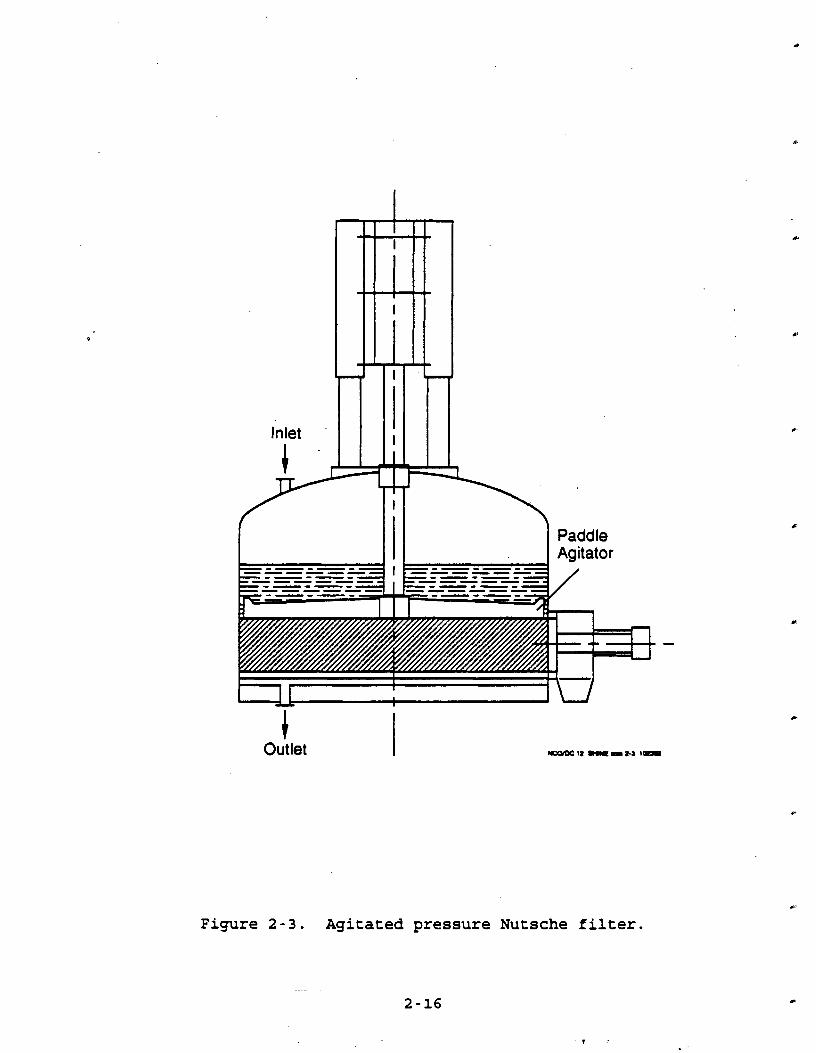
putsche filta. Another type of pressure filter, the nutsche filter, can either compress a slurry or apply vacuum to it in order to create a filter cake. A typical agitated nutsche filter is presented in Figure 2-3. The equipment not only acts
as a filter but can also function as a product dryer after the
slurry has been compressed and filtered into cake form. The filter works by pressurizing the slurry with nitrogen to
force the liquid through the filtering medium. The pressure needed to help maintain this process until enough liquid has been extracted is almost entirely a function of the specific particle
characteristics of the product. Conversely, a vacuum may also be applied to the nutsche to draw the liquid down through the cake.
Vacuum applications are usually limited to slurries with highly
combustible atmospheres. Because particles are spherical to
irregular in shape and generally amorphous, the type of cake
formation expected will determine the optimal pressure or vacuum
needed to complete filtration. Experience has shown that
filtration pressures generally range from 20 to 35 psig. Filters
range in size from 1,000 to 2,000 gallons. Vacuum filtration
occurs at pressures ranging from 3 to 20 psi. These filters also
range in size from 1,000 to 2,000 gallons. Upon completion of filtration, the filter may or may not go
through a reslurry process, where it is washed and filtered
again. This option is usually carried out when a highly specialized product requiring purity is desired or when solvents were not removed as part of the original slurry filtration process.
The nutsche filter is also capable of drying the filter cake and may be converted into a filter/dryer by only limited modifications. The actual drying process carried out in the
I Paddle Agitator
Outlet
Figure 2-3. Agitated pressure Nutsche filter.
modified filter is usually convective. Heat is introduced to the
filter/dryer through a hot gaseous medium (usually N2) which is
blown up through the cake until the desired level of dryness is
achieved. The cake can be agitated or remain static, depending
on the drying characteristics associated with the product. 2.1.2.1.1 Factors Affectins EmggSigns f r m Batch
Filtration.
Plate and frame filterg. - E3nissions fran the plate-and-frame filter press can occur during filtration, washing, and discharge
steps. The potential exists for VOC emissions during filtration
and solvent washing from the t;ough used with open discharge, and
the corner holes associated with closed discharge. Likewise,
emissions can occur when the filter press is opened to remove solids. Vibration and air blowing to detach the solids can also
increase the rate of emissions. The range of emissions will depend primarily on the vapor pressures and mole fractions of
each VOC, the operating temperature of the filter, and air
circulation rate. Because plate-and-frame filter presses offer
no containment, it is also unlikely that material containing a
high percentage of volatile or toxic solvent will be filtered
using this type of device.
Nutsche filterg. Pressure filters such as the nutsche
filter shown in Figure 2-3 normally do not emit VOC1s during
actual filtration since they are fully enclosed. However, during
slurry charging or vessel depressurizing, emissions of VOC can
occur.
Emissions also can occur from all batch process filters if a compressed gas is used to purge the filter or dry the cake. The gas will entrain evaporated solvent and carry it to a vent.
Emission rates will depend on the factors cited above-and the
compressed gas purge rate. Note also that if filtrate from either operation is discharged to wastewater treatment, there is
also potential for emissions resulting from cross-media transfer effects.
2.1.2.2 entrifuual Se~aratioq. As mentioned in Section 2.1.2, filtration is used to separate a solid from a
C liquid. Centrifugal filters (basket centrifuges) make use of the
outward (centrifugal) force that is exerted on an object during
rotation. This centrifugal force pushes the liquid through the
filter medium and presses the solids against the walls to form a
cake. In a solid-bowl centrifuge the liquid is separated from
the solid by centri<ugal fokce and is continuously decanted off.
The recovered solid accumulates on the sides of the bowl. Solid
bowl centrifuges are used to recover small amounts of solids that
are dispersed in large amounts of liquid. Catalysts, for
example, often are recovered from liquid product in this manner.
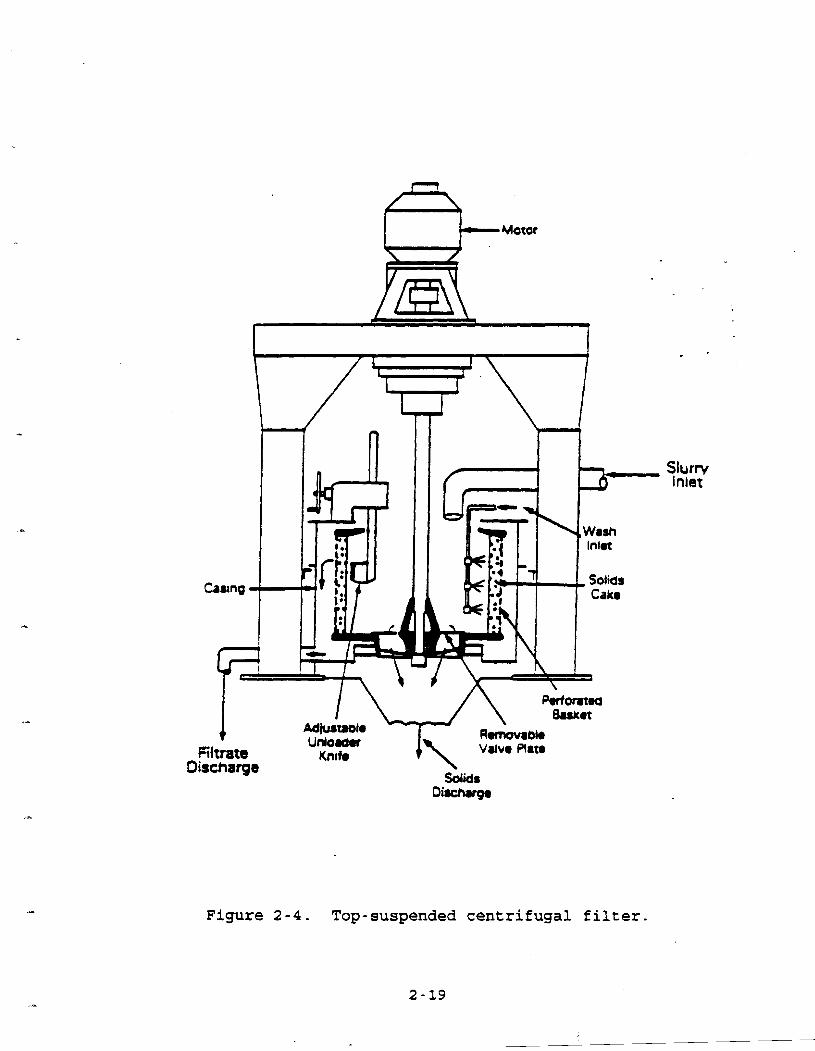
2.1.2.3 SentriQaaal Filters: Desiun and Oneration.
Centrifugal filters are cylinders which contain a rotating. basket
at the base of a vertical shaft. Figure 2-4 depicts a typical @
configuration for a basket centrifuge. The basket may be 0.8 to
1.2 m in diameter and 0.5 to 0.8 m deep. Its sides are
perforated and covered with a filter medium such as fabric or
woven metal. An inert gas such as nitrogen is often introduced into the chamber prior to the addition of slurry to avoid the
buildup of an explosive atmosphere. Centrifuges must be
carefully operated to avoid air infiltration by vortex
entrainment. Therefore, they usually are operated under nitrogen P
blanket and kept sealed during operation. 3
Feed slurry enters the chamber through an inlet pipe as the
basket rotates at speeds of 600 to 1,800 revolutions per minute
(rpm). Centrifugal force pushes the mixture towards the wall of
the basket. The liquid passes through the filter medium and is
discharged through a pipe. The solid particles form a filtarcake
on the sides of the basket. After all of the slurry has been fed to-the chamber, a wash
liquid may be introduced to force the remaining slurry liquid through the cake and filter medium. The basket continues to spin
in order to remove any residual liquid.
..
Fiitrate Discharge
Figure 2-4. Top-suspended centrifugal filter.

At this point the motor speed is reduced, slowing the
rotation to between 30 and 50 rpm. An adjustable knife is engaged to scrape the side of the basket and dislodge the
filtercake. The cake material falls to the bottom of the chamber .Fwhere it is discharged through an opening in the basket.
Manual dumping of filter cake from basket centrifug'es also
can occur, especially when top-unload centrifuges are used.
Operators must uscoop outn product into a transfer vessel. The
vessei is usually purged with high flow rates of inert gas just
prior to this step.
Another type of basket centrifuge is the Heinkel centrifuge.
The main feature that distinguishes the Heinkel centrifuge from
other basket centrifuges is the inverting filter cloth the
Heinkel employs. The inverting filter cloth allows top unloading
in a simplified manner. Rather than scooping the contents out
manually, the operator(s) can displace the entire filter cloth
and empty its contents. 4
2 . 1 . 2 . 4 Factors Affectinq &nissio~ from Centrifuua 1
Se~aration. Emissions from centrifuges may occur during initial -
vessel purging prior to the addition of slurry, and during
discharge. A potential source of emissions from centrifuges is
created by the inert gas blanket which is used to prevent the
possibility of an explosive atmosphere. The inert blanket is
especially necessary in bottom-discharge centrifuges because they Bscontain metal knife scrapers that move the filtercake away from
the walls. The mechanical friction associated with metal-to-
metal contact and static electricity discharge are likely
ignition sources. The potential for an explosion depends on the type of
centrifuge, the characteristics of the solvent vapor, and how the
centrifuge is operated.5 A centrifuge is difficult to blanket
with an inert gas during discharge because it cannot stay sealed.
During discharge, therefore, an inert gas purge is more effective #
in evading explosive conditions because of the higher flow rate
associated with a purge. Note that during the actual

centrifugation process, an inert gas blanket contributes
significantly lower VOC emissions than a purge.
As mentioned, the much higher flow rates associated with
inert gas purges will obviously induce greater emissions. Purges
are used during bottom-discharge and prior to opening a top-
unload centrifuge for sampling or unloading. The solids removed from the centrifuge may still be "wetn
with solvent and therefore be a source of emissions during unloading and transport to the next process step. Bottom-discharge centrifuges can minimize this problem if the solids are
transferred to a receiving cart through a closed chute and the receiving cart is covered during transport. As with other
filters, the emission rate from centrifugal filters will be influenced by operating temperature, VOC vapor pressures and mole
fractions, inert purge gas flow rate,* and the use of mitigating
factors such as closed chutes and carts. 2.l.3 Drving
The term "drying" generally refers to the removal of liquid
from primarily solid material. However, due to the large amount of solids (and sometimes a large portion of liquid) dryers can be
large VOC emission sources. Dryers are used to remove liquids,
usually residual solvent, from centrifuged or filtered product. This removal is accomplished by evaporating solvent into a gas
stream. Solvent evaporation is accelerated by application of
heat and/or vacuum to the wet solids. Circulation of warm air
also speeds the drying process.
It is important to note the differences between dryers and evaporators.' Whereas evaporators remove liquids as vapors at
their boiling points, dryers remove the vapor into a gas stream
at temperatures below its boiling point. Also evaporators are
usually used to remove large amounts of liquid. There are several different types of dryers being used by
industry today. For example, tray, tunnel, rotary, drum and spray dryers are available. Selection of dryer type depends primarily on characteristics of the solid. Three dryer types that are commonly used in^ batch processes are tray, rotary, and
double-cone dryers. The previous discussion on the converted
nutsche filter/dryer is also considered relevant to this
discussion.
2.1.3.1 Tray Dzvera Figure 2-5 is a simplified diagram of
a tray dryer. Tray dryers are among the simplest type of dryer,
although they are labor intensive because of necessary manual
loading and unloading. The product intended for drying is placed
on trays that are stacked on shelves. After all the trays have .
abeen filled, the dryer door is closed and t h ~ shelves are heated..
A vacuum is also pulled within the dryer to allow for drying at
low temperatures. Typically, tray dryers contain 15 to
20 trays. 6
n2.1.3.2 l a D e s i a Another
important type of dryer is the rotary dryer. As shown in
Figure 2-6, this dryer consists of a revolving cylinder that is
slightly inclined to the horizontal. The diameter of the
cylinder may range from 0.3 to 3 m, and the length may vary from
1 to 30 m.
Feed enters at the elevated end and is carried through the
dryer by the rotation and slope of the cylinder. In direct-heat
rotary dryers, the solids are dried by direct contact with a
heated gas stream. This stream may consist of air or flue gas
flowing at approximately 2.8 m3 per minute. The flights shown in
Figure 2-6 lift the solids and shower them through the gas
stream. The solids and gas may flow cocurrently or counter-
currently, with countercurrent flow having a greater heat-
transfer efficiency.
Due to the nature of the equipment, the outlet stream for rotary dryers must be free-flowing and granular. Sticky feed
materials may be dried if some of the granular product is recycled and mixed with the feed.
2.1.3.3 W l e (Doub le-Cone) Drvers: Desiun and O~eratio n.
A batch double-cone dryer is shown in Figure 2-7. Material to be e
dried in this type of dryer must be manually loaded into the dryer and manually unloaded after the drying cycle is complete.
Double-cone dryers may be operated under a vacuum in which a
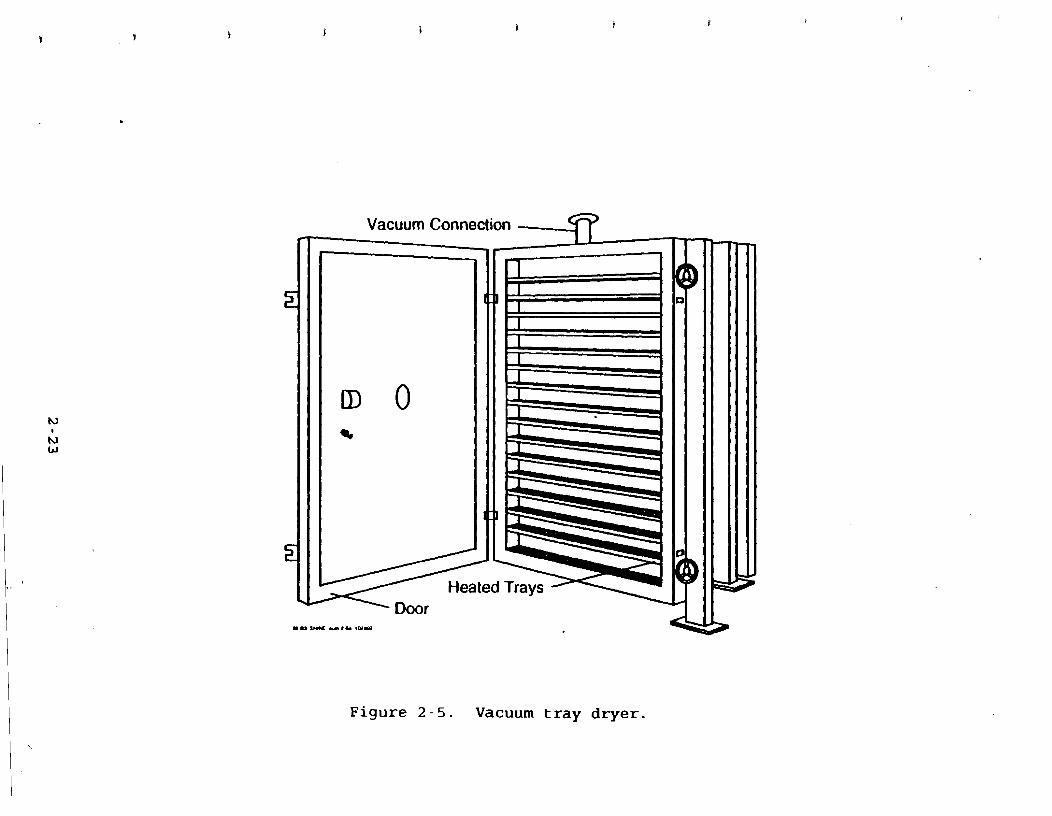

Figure 2-6. (a) Countercurrent air-heated rotary dryer. (b) Cross-sectional view.
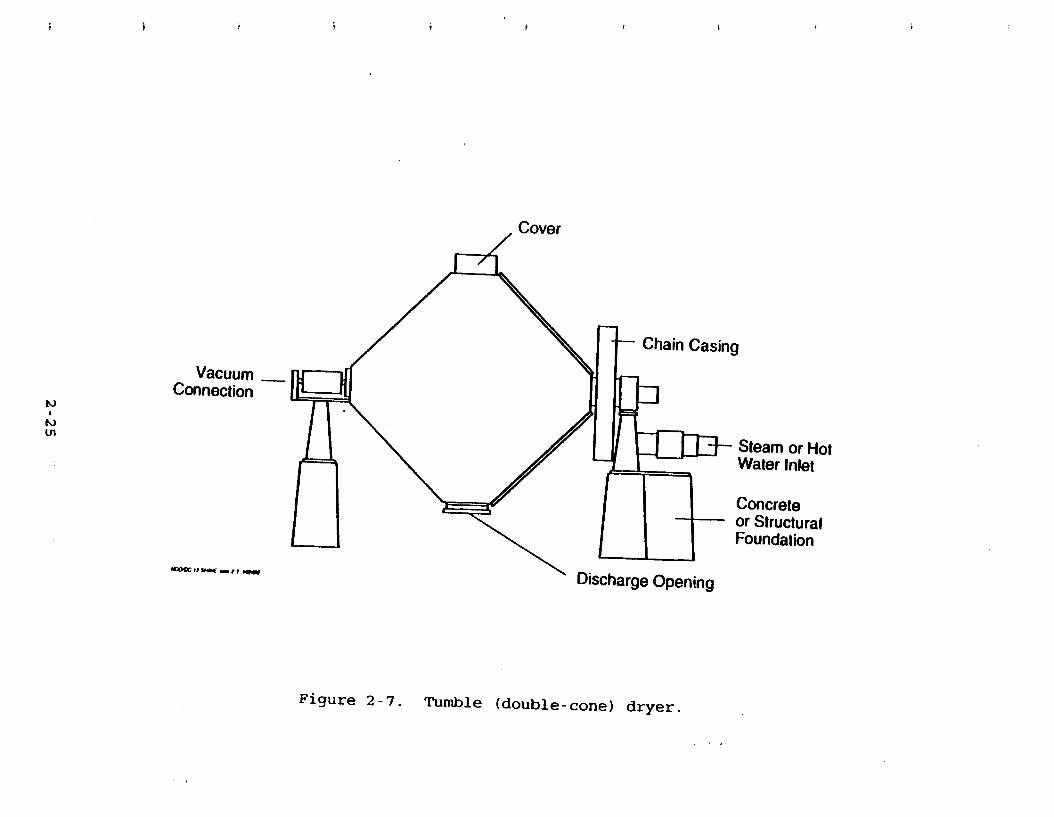
small flow rate of air is allowed to leak in or occasionally may
be used to dry material convectively with heated gas. Tumble
dryers range in size from 20 to 100 gallons. Flow rates of
drying gas and drying temperatures vary with product. . * 2.1.3.4 from Drverg . Volatiles
may be emitted at the feed inlet and product discharge areas of
the dryers, as well as from the dryer exhausts. Tunnel, nutsche
filter/dryers, and rotary dryers typically use a moving stream of
heated air to dry the feed material. This mode of drying is
termed nconvectiven. Emission streams from convective dryers
will have large volumes of noncondensable gases throughout the
drying cycle.
Tray and double-cone dryers typically are operated under
vacuum, in which the heat transferred to the material being dried
will be through conduction from heated surfaces. Under vacuum, a
smaller volume of air passes through the equipment due to inward
leakage. This vacuum exhaust contains VOC1s. The volume of
noncondensables in vacuum dryer exhaust is small, compared to
convective exhaust, and increases throughout the drying cycle.
Dryers are potentially large emission sources. Emissions
vary according to dryer type, dryer size, number of drying cycles
per year, and amount and'type of solvent evaporated. Emission
rates vary during a batch drying cycle: they are greatest at the
beginning of the cycle and least at the end. The rate of VOC
emissions from a given batch drying operation will be a function
of the duration of the drying cycle and the amount of solvent in
the material.
2.1.4 Disti-Distillation is used to separate a mixture of liquids. The
basis for this separation is the relative volatility (i.e., vapor-pressure and boiling point) of the components. Within refining and chemical manufacturing, distillation is the most
commonly used method for separation and purification of liquids. Separation is achieved by the redistribution of the
components between the liquid and vapor phases. The more
volatile cornponent(s) concentrates in the vapor phase while the
less volatile component(s) concentrates in the liquid phase. The
two phases are generated by vaporization and condensation of the
feed mixture.
There are several different types of distillation
operations. In simple operations, the feed is vaporized and
condensed one time. This usually does not yield a clean separation. Fractional distillation involves repeated vaporization and condensation and results in a sharper
separation.
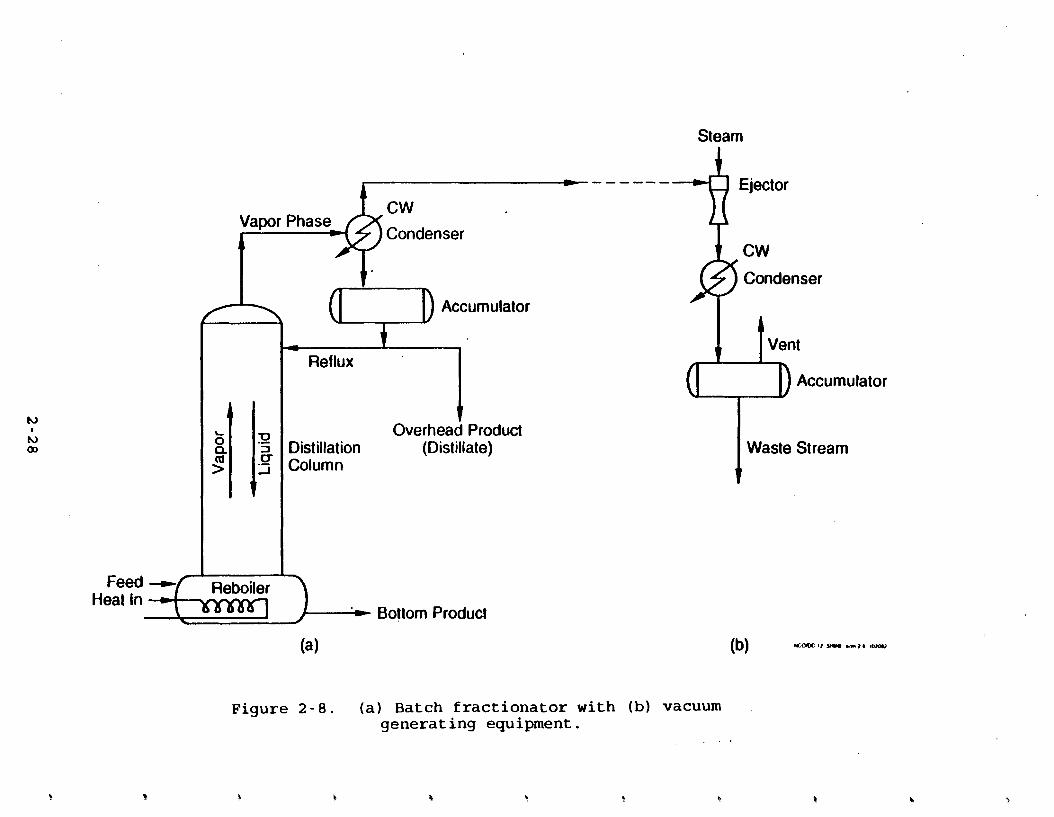
2.1.4.1 Btch Fractionators: Desisn and O~eration. The
batch fractidnator in Figure 2 - 8 consists of a reboiler and a
sieve-plate column. The feed mixture is charged into the
reboiler and heated until it begins to boil. The initial vapor
that forms is richer in the more volatile component (A) than the liquid is. However, the vapor still contains a significant
amount of both components. In order to increase the
concentration of A in the vapor., the vapor stream enters the
column where it is brought into contact with boiling liquid. The vapor that exits the top of the column goes to a
condenser and then to the accumulator (reflux drum). Some of the
condensate in the reflux drum is returned to the column as reflux
at the top of the column. As it flows down the column, the liquid contacts the vapors that are moving upward. Contact
between the two phases occurs in a stagewise manner in a column
which holds horizontal-stacked sieve trays. Vapor flows up
through the perforations. Liquid flows down through pipes called
downcorners.
The downcomers are located on alternating sides of each tray. Thus the liquid must flow across the tray. The top of the
downcomer acts a weir, maintaining a minimum depth of liquid on the tray. The vapor bubbles up through the layer of liquid. This contact causes some of the more volatile component (A) to
diffuse from the liquid, thus enriching the vapor. The vapor leaving the top of the column is condensed; part
of the condensate is returned to the column as reflux and the remainder is drawn off as product liquid, or distillate. This

circulation continues until the desired separation is achieved,
which is usually determined by the purity of the distillate. Specifications for this stream usually state a maximum concentration of the less volatile component.
The liquid leaving the reboiler is called the bottom product
or bottoms. It is rich in the less-volatile component but is not as pure as the distillate. Whereas the vapor is enriched as it
moves upward through the column, the equipment in Figure 2-8 does not provide for enrichment of the liquid stream. Thus, the condensed vapor product (distillate) will be more pure than the
bottom product. Rectification of the liquid stream, to yield a nearly pure bottom product, requires a more complex column. Such
columns are usually run on a continuous, rather than batch, basis.
The equipment shown in Figure 2-8 is a fairly simple arrangement. Variations are made based on the nature of the
mixture and its components. Many batch processes involve a distillation in a re; tor kettle or series of kettles (often
called "still potsm), as opposed to a column. The distillation principles are the same regardless of whether the separation is conducted in kettles or columns. For example, operating
pressures can be below atmospheric (vacuum), atmospheric, or
above atmospheric (pressure). Figure 2-8 shows a possible
.arrangement for vacuum-generating equipment. Inert gas,
especially steam, is often introduced to improve separation. If a mixture is particularly difficult to separate (i.e., azeotropic), other compounds may be added to aid in distillation.
2.1.4.2 Factors Affectinu Emissions from Batch Fractionatorg. The gases and vapors entering the condenser can contain VOC, water vapor, and noncondensables such aa oxygen (02), nitrogen (N2) and carbon dioxide (COZ). These vapors and gases originate from:
1. Vaporization of liquid feeds; 2. Dissolved gases in liquid feeds; 3 Inert carrier gases added to assist in' distillation
(only for inert carrier distillation); and
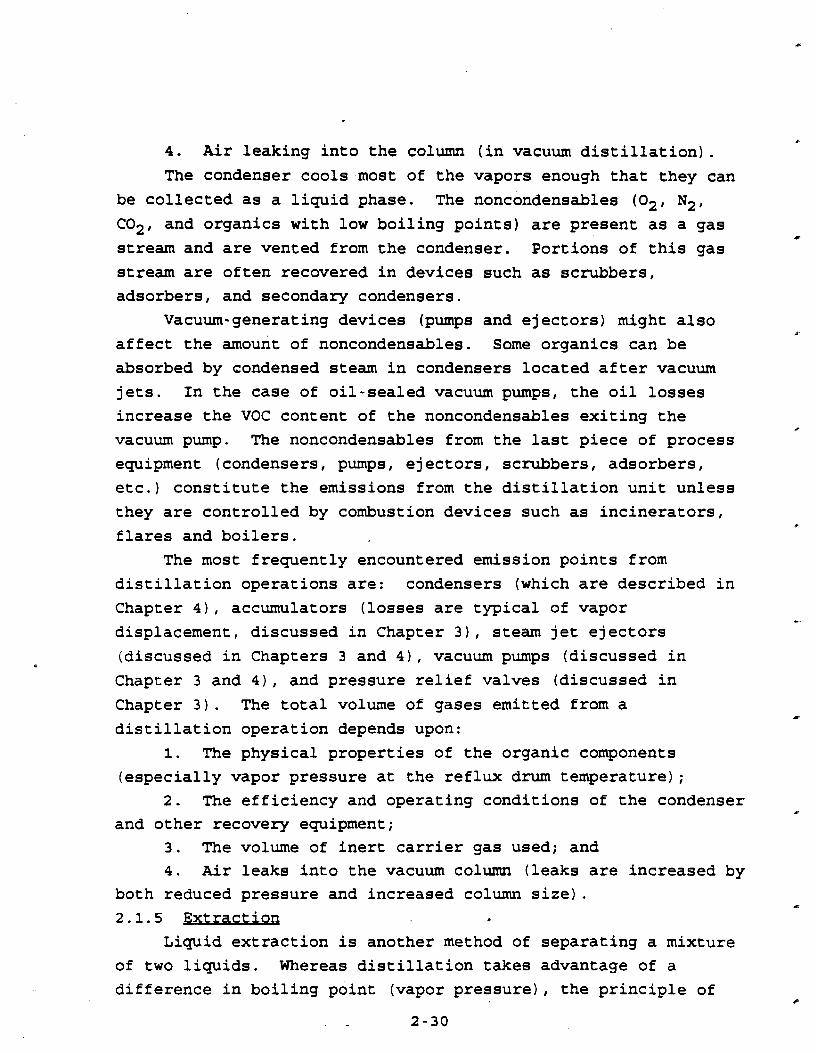
4. Air leaking into the column (in vacuum distillation).
The condenser coolsmost of the vapors enough that they can
be collected as a liquid phase. The noncondensables (02, N2,
C02, and organics with low boiling points) are present as a gas
stream and are vented from the condenser. Portions of this gas
stream are often recovered in devices such as scrubbers,
adsorbers, and secondary condensers.
Vacuum-generating devices (pumps and ejectors) might also
affect the amount of noncondensables. Some organics can be
absorbed by condensed steam in condensers located after vacuum
jets. In the case of oil-sealed vacuum pumps, the oil losses
increase the VOC content of the noncondensables exiting the
vacuum pump. The noncondensables from the last piece of process
equipment (condensers, pumps, ejectors, scrubbers, adsorbers,
etc.) constitute the emissions from the distillation unit unless
they are controlled by combustion devices such as incinerators,
flares and boilers.
The most frequently encountered emission points from
distillation operations are: condensers (which are described in
Chapter 41, accumulators (losses are typical of vapor
displacement, discussed in Chapter 3), steam jet ejectors
(discussed in Chapters 3 and 4), vacuum pumps (discussed in
Chapter 3 and 4), and pressure relief valves (discussed in
Chapter 3). The total volume of gases emitted from a
distillation operation depends upon:
1. The physical properties of the organic components
(especially vapor pressure at the reflux drum temperature);
2. The efficiency and operating conditions of the condenser r*
and other recovery equipment;
3. The volume of inert carrier gas used; and
4. Air leaks into the vacuum column (leaks are increased by
both reduced pressure and increased column size).
2.1.5 Extractipn
Liquid extraction is another method of separating a mixture
of two liquids. Whereas distillation takes advantage of a
difference in boiling point (vapor pressure), the principle of
liquid extraction is based on a difference in solubility. 'In the
extraction operation, a mixture of two liquids (A & B) is brought
into contact with a third liquid called the solvent (S). The
solvent preferentially combines with one of the components of the
original mixture. The two resulting streams are:
1. Extract - mostly solvent and the liquid with which it
preferentially combined (S + A); and 2. Raffinate - mostly residual liquid from the original.
mixture (B) . It is important to note that both exit streams will.contain all
three components (A, B and S). However, the raffinate will be primarily liquid B and the extract will be primarily a mixture of
A and S. There are three general types of equipment used for liquid-
liquid extraction, although most batch extractions occur in
mixer-settlers. In mixer-settlers, a mixer is used to contact
the feed solution and solvent. A settling tank allows the two
phases to separate by gravity. Stirred-tank reactors often serve
as both mixer and settler.
2.1.5.1 Factors Affectinu Emissions from Extractorg. Emissions from mixer-settler extractors are similar to those from
reactors (discussed in Section 3.1.1) in that they stem mainly
from vapor displacement during purging, filling and cleaning of
the vessel. Some VOC may aiso be emitted while the liquids are being agitated.
As discussed for reactors, the rate of VOC emissions will
depend primarily on VOC vapor pressures at operating temperatures, liquid pumping rate during column filling, rate of
sweep gas (if used) during purging, and equipment cleaning procedures.
2.1.6 Crvstallizatio~ Crystallization is'a means of separating an intermediate or
final product from a liquid solution. Solid particles (i.e., crystals) are formed from the homogenous liquid phase. This
formation is accomplished by creating a supersaturated solution, in which the desired compound will form crystals. If performed
properly and in the absence of competing crystals,
crystallization can produce a highly pure product.
Four methods may be used to produce supersaturation. If
solubility of the solute increases strongly with temperature, a
saturated solution becomes supersaturated by simple cooling. If
solubility is relatively independent of temperature or decreases
with increased temperature, supersaturation may be generated by evaporating a portion of the solvent. Often a combination of .c
cooling and evaporation is used.
;f neither cooling nor evaporation is desirable,
supersaturation may be induced by adding a third component. The
third component forms a mixture with the original solvent in
which the solute is considerably less soluble.
Batch crystallization usually relies on simple cooling or
evaporation as the method for producing supersaturation. Batch
crystallization useful for low production rates and when the
cooling range is wide, since it avoids the material shock that
occurs in continuous crystallization equipment (i.e., metal
stress) from mixing a hot solution with a cool mother liquor. 7
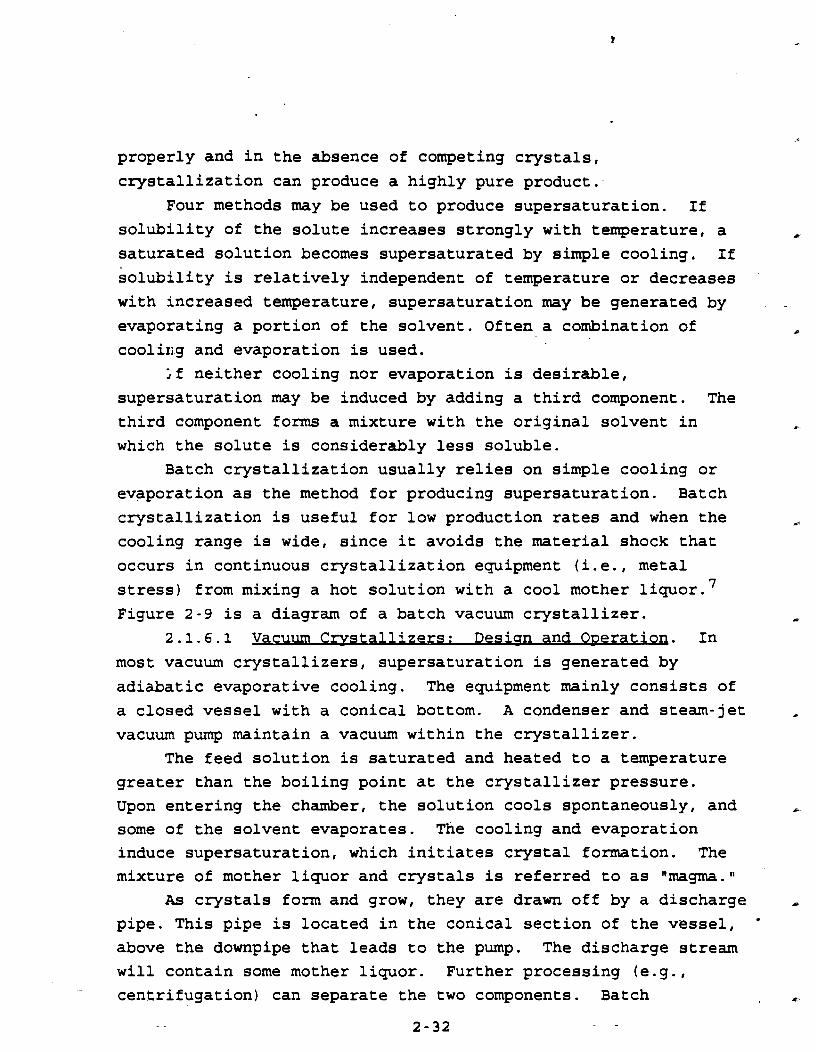
Figure 2-9 is a diagram of a batch vacuum crystallizer.
allizers: Desisn and O D ~ 2.1.6.1 Vacuum Crvst ration. In
most vacuum crystallizers, supersaturation is generated by
adiabatic evaporative cooling. The equipment mainly consists of
a closed vessel with a conical bottom. A condenser and steam-jet .?
vacuum pump maintain a vacuum within the crystallizer.
The feed solution is saturated and heated to a temperature
greater than the boiling point at the crystallizer pressure.
Upon entering the chamber, the solution cools spontaneously, and
some of the solvent evaporates. The cooling and evaporation
induce supersaturation, which initiates crystal formation. The mixture of mother liquor and crystals is referred to as "magma."
As crystals form and grow, they are drawn off by a discharge II
pipe. This pipe is located in the conical section of the vessel,
above the downpipe that leads to the pump. The discharge stream
will contain some mother liquor. Further processing (e.g.,
centrifugation) can separate the two components. Batch

To V ~ c u w n Ewwrmn
Cooling W M I
Figure 2-9. Vacuum crystallizer.

llization is usually performed with small. amounts of
al. Cycle times range from 2 to 8 hours.
-1.6.2 F a c t o r s i o n s from Batch Vacum
llizers. If crystallization is done mainly through cooling :elution, there will be little VOC emission. In fact, the
lent may be completely enclosed. fowever, when crystallization is done by solvent evaporation
racuum environment, there is a greater potential for -om. The vapor over the magma is rich in solvent.
ions will be significant if this evaporated solvent is i directly to the atmosphere. The condenser and vacuum jet
in Figure 2-9 reduce the amount of volatiles that actually the system. As with other vacuum operations, the rate of
nissions will depend primarily on the VOC vapor pressure at
rystallizer or condenser temperature, the absolute pressure
s system, and the air leak rate.
Storase 2.1.7.1 Storaue wi~ment: Desiun and O~eratioq . There hree major types of vessels used to store volatile organic
ds (VOLfs):
1. Fixed roof tanks;
2. External floating roof tanks; and
3. Internal floating roof tanks.
: tanks are cylindrical with the axis oriented perpendicular
:e foundation and are almost exclusively above ground. This
.on addresses only the fixed roof type of storage tank. Of currently used tank designs, the fixed-roof tank is the : expensive to construct and is generally considered as the num acceptable equipment for the storage of VOLis. A typical i roof tank consists of a cylindrical steel shell with a - or dome-shaped roof that is permanently affixed to the tank 1. A breather valve (pressure-vacuum valve), which is
mly installed on many fixed-roof tanks, allows the tank to ate at a slight internal pressure or vacuum. However, this e prevents the release of vapors only during very small ges in temperature, barometric pressure, or liquid level.
is swept
)f gas
lyI many ,
actor ective
ontained
nanholes 1 scfm. ?rs who rases.
lutes med to le
etails from
rity of
from
basket
Inert ++
-ifuge
zker
ssions L
s1
1
S, can
Larger changes in these parameters can result in significant
emissions from fixed roof tanks. 2.1.7.2 Factors Affectina emission^ from Storaue T a m .
The major types of emissions from fixed-roof tanks are breathing
and working losses. A breathing loss is the expulsion of vapor from a tank vapor space that has expanded or contracted because
of daily changes in temperature and barometric pressure. The emissions occur in the absence of any liquid level change in the tank. The rate of VOC emissions from breathing lossea is a
function primarily of VOC vapor pressure (at the bulk liquid conditions), tank diameter, average vapor space height, and ambient temperature and pressure changes from day to night.
.Working losses are associated with an increase in the liquid
level in the tank. The vapors in the space above the liquid are expelled from the tank when, as a result of filling, the pressure inside the tank exceeds the relief pressure. Emptying losses
occur when the air that is drawn into the tank during liquid
removal saturates with hydrocarbon vapor and expands, thus exceeding the fixed capacity of the vapor space and overflowing through the pressure-vacuum valve. Combined filling and emptying losses are called "working 10sses.~ The rate of VOC emissions from these working losses is a function of VOC vapor pressure (at bulk liquid conditions), vapor space height, and turnover factor (i-e.,the rate at which the tank is emptied and refilled).
Information on emissions from storage tank working and breathing losses is detailed in EPAts AP-42 Compilation of Air Pollution
Emission Factors. 2.1.8 Trwfer O~erations
Chemical transfer operations also contribute,to plant VOC emissions. Comon sources of transfer emissions are:
1. Manual transfer of chemicals from 55 gallon drums to receiving vessels; and
2. Transfer of final product from processes to receiving vessels.
Some chemicals are stored in 55-gallon drums. Transfer of chemicals from drums to process vessels is sometimes done through
2-35
permanent piping; more commonly, however, it is done by opening
the drum and manually pouring the contents. The manual pouring is a source of emissions, although a relatively small one on a
"per drumH basis.
Emissions from transfer of final product from processes to
receiving vessels occur frequently in batch processing. These
emissions are analogous to vessel charging. The AP-42 emission
factor handbook referenced earlier contains emission estimation
methodologies for various loading mechanisms including splash
loading and submerged filling.
2.1.9 Euuigment Leakg
Pump seals, flanges, valve seals, agitator seals, and hose
connections or couplings create VOC emissions when they leak. A
protocol has been developed by EPA that can be used to develop
emission factors for equipment leaks. However, if no other data
is available, factors have been developed to estimate the amount
of VOC that is leaking from a population of valves, seals,
flanges, etc. These factors are known as synthetic organic
chemical manufacturing industry (SOCMI) equipment leak factors.
Note that the amount of time that the process components are in
VOC service also plays a role in the amount of VOC that could be
expected to leak. This is especially of concern in batch
processes, where many components are not in service the majority
of time.and therefore should not be expected to leak as much
material as components that are part of continuous processes.
Note also that because of this reason it may be harder to detect
leaking components in batch processes.
2.1.10 Wastewatex
2.1.10.1 Generation. Wastewater may be generated from a
number of activities that occur in batch processing, including
equipment cleaning, vacuum ejector or pump once-through
circulation using water, scrubber water discharging, steam
stripping, or the discharging of water that was part of the
process feedstock or that was generated in the process (i.e., a
condensation reaction). Wastewater often contains dissolved
VOC1s or air toxics and may also carry large amounts of insoluble
2 - 36 1
VOC1s or air toxic~ in emulsion-type multiple phase systems.
Facilities often pretreat wastewater prior to discharge to
publicly owned treatment plants, and this practice often is
streamlined by isolating wastewater based on the degree of
contamination and treating the various fractions accordingly.
2.1.10.2 OMfrm Wastewaw. The amount of VOC contained in the wastewater and the method of
treatment of wastewater will affect the amount of VOC emissions. Treatment options include activated sludge without aeration and .
simple decantation and settling with the aid of flocculating agents. The EPA has published guidelines on air emissions from
wastewater treatment systems. These guidelines examine various
methods of wastewater containment, such as storage in open tanks and provide methodologies for estimation of emissions. For open
tanks, the emission estimation discussion presented in Appendix B
of this document is also relevant. 2.2 EXAMPLE INDUSTRY DESCRIPTIONS
The inherent diversity of batch manufacturing prevents a
general description of this chemical industry segment. Instead,
the following five industries have been selected as examples of the unit operation configurations, equipment operating
conditions, and emission sources typically encountered in batch
chemical processing: resin manufacturing, pharmaceuticals
manufacturing, pesticides, and SOCMI. These processes were
chosen because they contain high production volume batch
processes, contain significant potential sources of VOC
emissions, and illustrate the diversity of equipment
configurations and process flows which characterize this type of
industry. For each of these batch processes, a detailed description is
provided of the associated chemistry, equipment, and stream flows, including a process flow diagram. Each of the
intermediate processing steps is discussed with an emphasis on process operating conditions wherever this information is
available. A separate subsection for each process is devoted to
VOC emission sources and the factors that influence the extent of
those emissions.
2.2.1 gvnthetic Resin Manufacturinq
The manufacture of synthetic resins is often accomplished
using batch processes. In light of an ever-increasing demand for
highly-specialized materials, batch processing offers flexibility
in product specification and production rate, as well as a high
degree of control over process variables. This industry
description segment is intended to familiarize the reader with
typical batch processing routes that are currently being used to
manufacture resins. A specific process for the manufacture of
epichlorohydrin-based nonnylon polyamide (wet strength) resin is
described in detail below. In addition, information on sources
of VOC and air toxics emissions from the process is presented
following the process flow discussion. This process typifies the
batch processes currently found in industry.
2.2.1.1 Process Flow. Figure 2-10 is a simplified flow
diagram of a wet-strength resin production process. The batch
process originates with the storage vessels. Material used as
feedstock for the process is stored in some type of storage
vessel. Vessel types range from 55-gallon drums to fixed or
floating roof tanks to pressurized horizontal tanks. Underground
tanksare typically not used for feedstock storage in this
industry. At the beginning of the batch cycle, a quantity of
material to be used as reactant feedstock is pumped from its
storage container to a weigh tank, or charge tank. The volumes
of weigh tanks range from a few hundred gallons for small batch
processes to several thousand gallons for much larger batch
processes. Weigh tanks, as the name implies, are used to measure
the amount of material charged to the reactor. Several.weigh
tanks may be used for each reactor, depending on the required feedstock recipe.
Once the desired quantity of material has been obtained in the weigh tank(s), it is charged to the reactor, usually by
gravity, as the weigh tanks in most cases are physically
positioned above the reactors. Wet strength resins are formed by
2-38

reacting epichlorohydrin ( E P I ) with water and an inert mine-
based polymer mixture. The amhe polyer is in some cases
manufactured onsite in much the same manner as is the cross-
linked reaction production described below. Typical reactor
sizes are on the order of 2,000 gallons. Reactors may also be
charged by pumping the material from the weigh tanks by
pressurizing the weigh tanks to push the material through to the
reactor or by depressurizing the reactor vessel. Charging rates. I
to the reactor-typically are on the order of 50 gallons per
minute, although some facilities report charging rates of greater
than 200 gallons per minute.
Reactors are generally equipped with a temperature control
jacket, an agitator, manholes for solids addition or sampling,
and a pressure-relief valve. The manufacture of wet-strength
resins involves an exothermic reaction which occurs at pressures
at or close to atmospheric. Batch reaction times range from 2 to
24 hours, depending on the product. It is necessary in the
manufacture of some products to halt polymer chain cross-linking
reactions by adding acid when the resin viscosity reaches a
certain point. Charging is usually conducted at 'ambient
temperature. Temperatures during the reaction increase and may
rise to as high as 70°C.
Some facility operating practices call for purging the
reactors during feedstock addition and reaction stages with 4 4
nitrogen to reduce the risk of explosion, and to dilute the vapor
space concentration of toxic compounds in the reactor so that
sampling and/or addition of solids may be done through the
manhole without jeopardizing worker safety. Typical N2 purge
flow rates are on the order of 20 to 40 standard cubic feet per
minute (scfm). Reactor vents typically are equipped with surface condensers, which operate at temperature ranges of 15O to 25OC and at atmospheric pressure. In these processes, a reflux stream
C
from the condensers is routed back to the reactor primarily for
temperature control. If the facility is using a nitrogen purge
on the kettle, the exit gas containing nitrogen is sometimes
routed through the condenser, although the effectiveness of
2-40
condensing out such dilute concentrations of volatiles amid a
significantly higher N2 gas flow rate is questionable. After the reactor stage of the manufacturing process ends,
the crude product may be purified further by air sparging. Air
sparging is the subsurface introduction of a gas intended to
remove a more volatile minor component from a liquid. In this
case, residual EPI may be removed to conform to product specifications. Condensers may be employed at th-is stage to recover solvent.
2.2.1.2 Emission Sources. Emission sources from the process described above are made up of the following:
(a) storage tank working and breathing losses, (b) vapor displacement emissions resulting from material transfer or vessel
evacuation, (c) reactor emissions due to heatup or purge, (d) sparging losses from finishing, and (e) equipment leak
emissions from in-line process components such as pumps, valves,
and flanges. The potential for wastewater emissions from reactor
washing also exists. 2.2.1.2.1 Storaae tank workinu and breathina losseg.
Storage tank working and breathing losses are typically no
different for this industry than they are for any other industry. Working losses may usually be eliminated by equipping the tanks
with a vapor return line back to the vessel being offloaded. Breathing losses, which are caused by temperature fluctuation and the subsequent expansion of vessel vapor space that must be
relieved, may be partially abated by applying an inert gas blanket. Nitrogen typically is used for this purpose. Some
facilities also store feedstock materials in sealed drums, so that there are no breathing or working losses associated with
material storage. The charging of material from a drum to a
vessel is sometimes accornplished.by first evacuating a vessel to a slight vacuum prior to charge so that the material may simply be drawn into the vessel from the drum without forced displacement of any vapors in the receiving vessel. Emissions from drums typically are small enough so that the impact to the ambient concentration of VOC1s/air toxics outside the plant
boundary is negligible, although the airspace immediately
surrounding the drum opening may contain enough VOC1s/air toxics
to have an impact on plant workers in the area.
Table 2-1 presents some typical emission stream
characteristics from the emission events described for this
process. Chapter 3 presents the methodologies used in
calculating emissions 'from such events.
2.2.1.2.2 Vanor -cement. Vapor displacement losses
are common types of emission events in this industry, since bulk
material transfer from vessel to vessel occurs frequently. Vapor
displacement losses from the general process described above
would include weigh tank filling emissions and reactor filling
emissions. Incoming material forces an equal volume of gas out
of the vessel. This displaced gas contains a certain amount of
volatile material. Vapor displacement losses can usually be
abated by providing vapor return lines from the vessels being
filled back to the vessels being emptied.
2.2.1.2.3 Reactor emissions. Reactors will have emissions
created by charging of materials and subsequent vapor
.displacement. Following charging, reactor heatup emissions may
occur at elevated temperatures, if no condenser is used and the
reaction is exothermic. If a condenser is used, the
concentration of VOC1s will be equal to the 100 percent
saturation concentration at the condenser outlet temperature.
For situations in which a purge of inert gas is used concurrently
with the reaction, emissions may be estimated by assuming that
the purge stream is saturated to some degree with volatile
material throughout the purge duration. Chapter 3 presents more
detailed methodologies for estimating emissions from reactor
heatup and purging events. The discharging of material from the reactor may create displacement emissions in the receiving vessel, as is shown in Figure 2-10.
2.2.1.2.4 Snaraina emissions. Resin may be sparged with
air or pure nitrogen during or following a reaction. Sparging is
the use of compressed gas for the agitation of the material in
the vessel and the stripping of trace amounts of volatiles in the
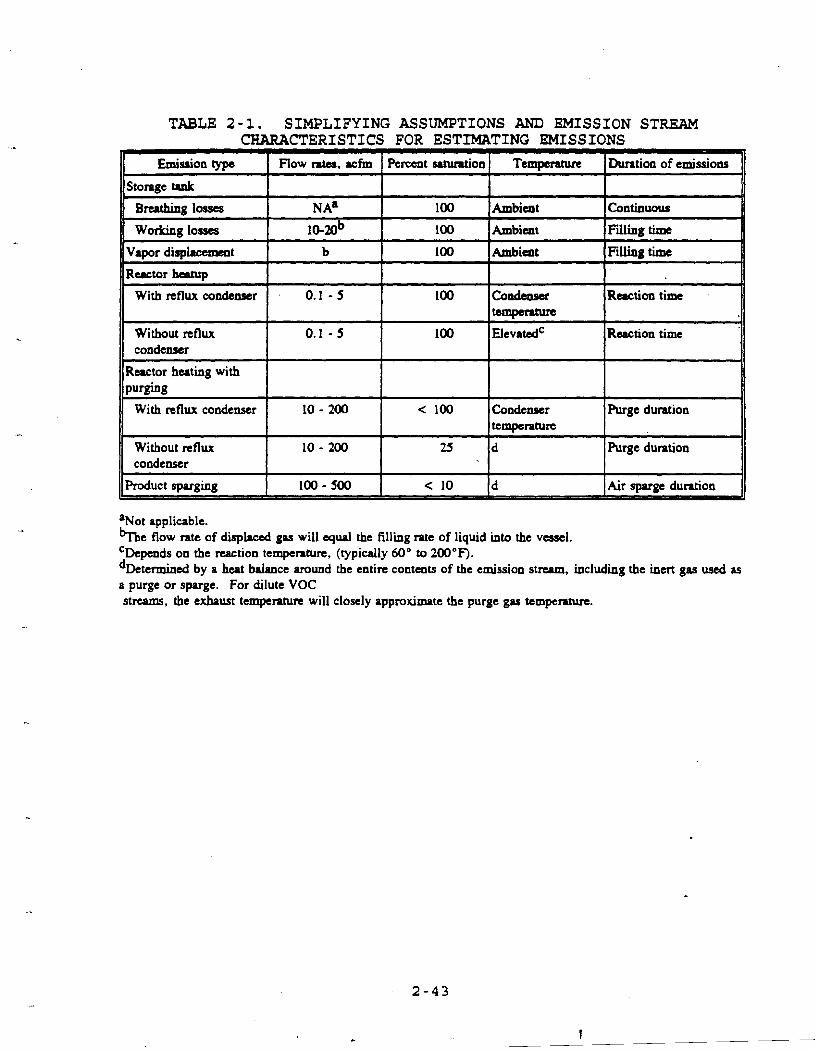
TABLE 2-1. SIMPLIFYING ASSUMPTIONS AND EMISSION STREAM CHARACTERISTICS FOR ESTIMATING EMISSIONS
-
Emission type I Flow mtu, lefm I Pemnt srtuntion 1 Temperature l~urat ion of emissions
Storage tank
Breathing losses NA' 100 Ambicat Continuous
Working losses 10.20b 100 Ambient Filling time
Vapor displuxment b 100 Ambicat Filling time
Reactor beuup
With reflux condenser 0.1 - 5 100 Condeas8c Reaction time t e m p e m
Without reflux 0.1 - 5 100 ElevatedC Reaction time condenser I I I I
Ructor heating with I I I I
With n f l w condenser 10 - 200 < 100 Condenser Purge duntion temperature
Without reflux 10- 200 25 d Purge duration condenser
aNot applicable. %he flow rate of displaced gas will equal the filling rate of liquid into the vessel. CDepends on the reaction tempemtun, (typically 60" to 200°F). dDetermincd by a heat balance around the entire contents of the emission st-, including the inert gas used as a purge or spuge. For dilute VOC streams, the exbaust temperature will closely approximate the purge gas temperature.
material, which is usually a liquid or slurry. The compressed
air or nitrogen stream is introduced to the material through a
perforated pipe located in the bottom of the sparging vessel.
Another met hod of sparging is to use an air lift system, in which the compressed gas is introduced to the material through an opening in the middle of the longer leg of a "U-tuben having
unequal legs. The air lift system is used less frequently than
the perforated pipe. Emissions from this type of operation are
governod by the amount of volatile material remaining in the
product and whether this material may be easily stripped from the
product. Further discussion of emissions due to gas sparging is
presented in Chapter 3.
2.2.1.2.5 Emissions from euui~ment 1ea)ZQ. 'Leaking process
components such as pumps, valves, flanges, sampling corrections,
open lines, etc. are sources of emissions. Emissions may be
calculated using the Synthetic Organic Chemical Manufacturing
Industry (SOCMI) leak factors developed by EPA and multiplied by
the fraction of time that the components are in VOC/air toxics
service.
2.2.1.2.6 Wagtewater emissions. Wastewater may be created
from once-through vacuum pump seal water discharge or from
scrubber water, if such a control device is used. In most cases,
this water is discharged to the plant treatment system, since the
concentration of pollutants in the water is low, precluding the
option of solvent recovery. Further discussion of wastewater
emissions is presented in Chapter 3.
2.2.2 pharmaceutals Indust= DescriDti0~
The pharmaceuticals industry uses predominantly batch
processes to manufacture synthetic organic chemicals and to
foqulate finished pharmaceutical products. Most of'the batch unit operations described earlier in this document can be found
in these processes, which makes a discussion of thia industry
particularly relevant. Also, several characteristics of this
industry make the control of VOC1s and air toxics emissions
particularly challenging.

First, the equipment used in processing is usually
campaigned, meaning that it is not solely dedicated to the
manufacture of just one product. Fluctuations in market demand
often drive production schedules, more so than in any other
industry. Since the characteristics of emission streams emanating from such equipment vary according to product, the devices used to control such streams must either be easily detached and moved or be capable of controlling streams that vary widely in solvent content, temperature, and pressure.
Such variation in emission stream characteristics also
presents some difficulty to agencies responsible for issuing
permits, since the actual emission levels of point sources such as reactor kettle condensers and the like will in some cases exceed the maximum permitted yearly emission rates because a
different product is manufactured in the equipment. In most other industries, plant personnel would apply for a permit
modification. However, the variability of equipment use and the
short production runs characteristic of this industry make the application procedure and permit modification wait'ing period unrealistic.
A second characteristic of the pharmaceuticals manufacturing industry is the widespread use of higher volatility solvents such
as methylene chloride (dichloromethane), which is extremely
volatile low photochemically reactive solvent. Because of its
high volatility, facilities that do not employ particularly stringent control techniques such as low-temperature
refrigeration units, pressurized storage tanks, and closed-loop processing systems wherever applicable tend to emit large amounts
of this solvent (for large facilities, these amounts can
sometimes be in excess of 100 tons per year). 9
The remainder of the discussion will revolve around actual processing characteristics associated with the pharmaceuticals industry. A typical simplified process flow diagram is included as an illustration of the type of equipment typically used in this industry and a typical processing route for a common pharmaceutical product. Due to the proprietary nature of

information in the pharmaceuticals industry, it was not possible
to present a process description of an unpublished process.
Therefore, we have intended for the description of the
manufacture of bulk aspirin to present the kinds of unit
operations that occur in the pharmaceuticals industry. The
process description is geared toward a general understanding of
most pharmaceuticals manufacturing operations. Therefore, the
discussion is also aimed at including other types of soivents,
feedstocks, and operational practices that can be used in this
equipment. Table 2-2 presents a summary of typical operating
characteristics of batch equipment used in this industry. This
summary can be used to characterize uncontrolled emission streams
from various equipment. Process steps include product synthesis
in reactors, purification in crystallizers and filters, and
product finishing in dryers.
2.2.2.1 Process Descri~tion. Many pharmaceuticals
manufacturing facilities make a distinction between the synthetic @
organic chemicals manufacturing processes that are used to
produce active ingredients for their final products and those
processes that are used to formulate the final product
(pharmaceuticals processes). The process flow diagram
illustrating chemicals manufacturing processes is for the
manufacture of bulk aspirin. This process is both well known and
appears to be simple, compared with processes that involve the manufacture of numerous intermediates which are reacted to yield
final active ingredient. Note that the process flow diagram for
the production of bulk aspirin includes the addition of salicylic
acid in powder form, an active ingredient that must be manufactured prior to this process. @
The fact that product or product intermediates are often in solid form brings up several elements that must be considered when evaluating the potential for VOC1s or air toxics emissions.
Solids must be filtered and dried at some point in the process.
Emissions from dryers are considered to be the largest potential source of process emissions in the pharmaceuticals industry.
When solids must be introduced into reactors, as is shown in the
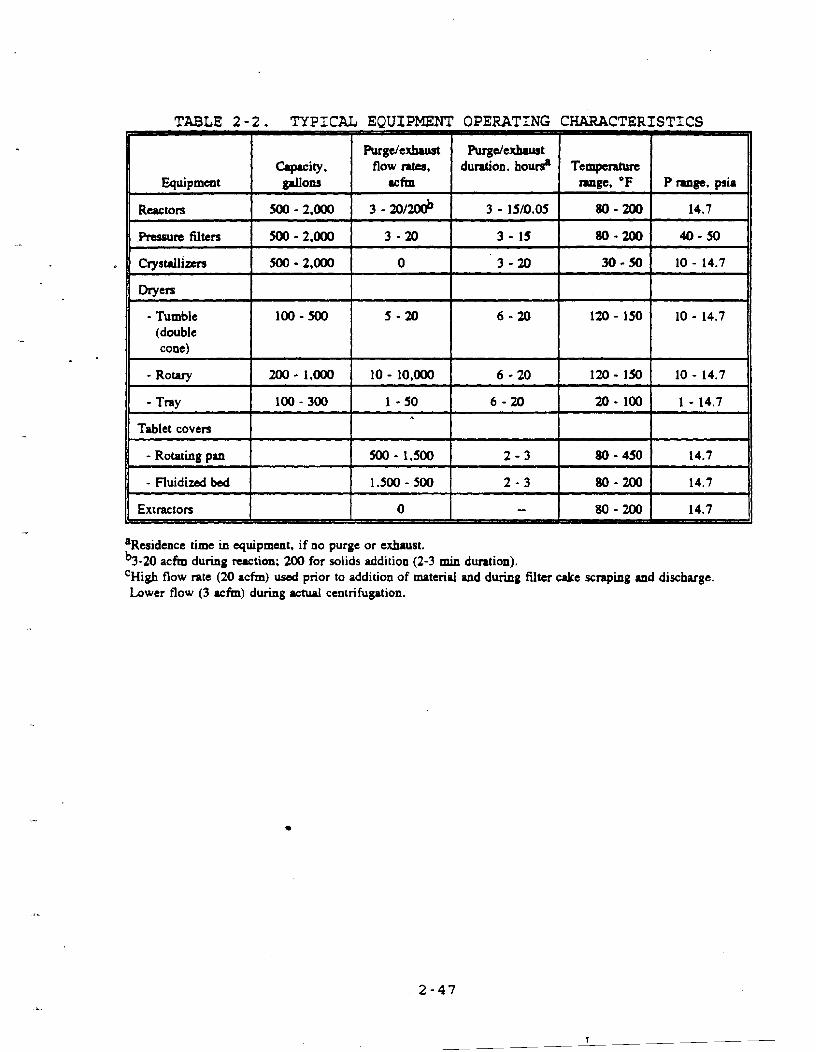
TABLE 2 - 2 . TYPICAL EQUIPMENT OPERATING CHARACTERISTICS
Purgdexbust Purgdexhust c v c i t y . flow ntu, duration. hour$ Temperature
Equipment f l o m rcfm range, O F P range. psia
Reactors XKl - 2,000 3 - 2 0 / d 3 - 15t0.05 80 - UK) 14.7
Pressure filters 500 - 2,000 3-20 3 - 15 80.- 200 40 - 50 cvsullizm m- 2,000 0 3-20 30 - 50 10 - 14.7
- Tumble 100 - 500 5-20 6 - 20 120 - 150 10 - 14.7 (double cone)
- Rotary I too-1.000 I 10-10.000 1 6 - 20 I 120 - 150 1 10 - 14.7 - Tray
I
I 100-300 I
I 1-50 I
I 6-20 I I
20-100 1 1-14.7
Tablet covers
- Rotating pan 500 - 1,500 2 - 3 80 - 450 14.7
- Fluidired bed 1.500 - 500 2-3 80 - 200 14.7
aResidence time in equipment, if no purge or exhaust. b3-20acfm during reaction; 200 for solids addition (2-3 min duration). CHigh flow rate (20acfm) used prior to addition of material and during filter cake scraping and discharge. Lower flow (3rcfm) during actual centrifugation.
bulk aspirin process flow diagram, emissions may occur as a
result of the inert gas sweeping of the reactor vessel to reduce
worker exposure and the possibility of explosion, if the vessel
vapor space contains material in concentrations that approach
explosive limits. Many processes now call for the addition of
solids into the reactor prior to the addition of any other
reagents. However, this practice may not always be practical, as
solids tend to cling together and stick to the glass-lined
surface of the bottom of the reactor. This practice also is not
used if the solid reagent must be added over time.
2.2.2.2 Asairin Process DeScri~tion. This process
description was originally described in the June, 1953, issue of
Chemical Enaineerinq. Although the actual process is outdated,
this type of equipment is still in use today. The discussion
below presents a brief synopsis of the process. A process flow
diagram is presented in Figure 2-11.
According to the 1953 report, feedstocks to the reactor were
acetic anhydride, mother liquor (containing appreciable amounts
of acetic acid), and salicylic acid powder. The reaction
occurred at temperatures of up to 90°C over a period of 2 to 3
hours. After reaction, the product (in liquid form) was pumped
through a filter to remove impurities that may have been present
in the feedstocks. Product liquid was routed to a crystallizer,
where the liquid was cooled down to a temperature of 3OC over a
period of about 16 hours. The slurry from the crystallizer was
then transferred by gravity to a nutsche-type slurry tank, where
a portion of mother liquor was decanted off to use in the next
aspirin batch or distilled to recover acetic acid. The slurry was then transferred, again by gravity, to a centrifuge to separate the remaining mother liquor from the aspirin product.
Product was scraped off the centrifuge walls, transferred to a
dump cart, and then transferred to a rotary dryer for final
drying. The remaining finishing steps included sifting,
granulation, and tableting, which were not described in the
article.

Recvcled Anhvdride
Mother +Liquor 1 Acetic
Anhydride Salicylic
Acid
Reactor
Mother Liquor
Crystallizer
9 Slurry Tank
Centrifuge
~xcess Acetic Acid
Still
Figure 2-11. Aspirin Manufacturing (Reprinted from Stern, Air Pollution, Volume VII, 1986).

The equipment described in this process is still used today to manufacture pharmaceutical products. Although instrumentation
and some design characteristics have since been improved (i.e. bottom gravity discharge centrifuges), the equipment perform the
same tasks in essentially the same way.
2.2.2.3 =mion Sourceg.
2.2.2.3.1 Process ventg.
banor dimlacement. Many emissions from process vents in
the ptarmaceuticals industry come from vapor displacement events
that are created during charging and transferring of material in
all types of process vessels including reactors, surge or slurry
tanks, and distillation kettles. All of the process vessels
shown in Figure 2-11 undergo vapor displacement during material
transfer. The extent of VOC and air toxic emissions from such
events will depend on the material and quantity transferred, the
material and/or vessel temperature, and the rate of transfer of
the material, since this last parameter affects time allowed for
equilibrium between the liquid and vapor phases. The vessel
vapors that are displaced usually are assumed to be completely
saturated with volatile material that is being charged or
transferred.
2.2.2.3.2 Reactor emissions. Some reactors used in the
pharmaceuticals industry are called autoclaves. Autoclaves are
pressurized reactors. There are no emissions from such reactors
because the systems are fully closed except during material
transfer. In general emissions from reactors occur when
atmospheric vents are present. If the material inside a vessel
experiences an increase in temperature, two things occur: (I) the inert gas inside the vessel expands, causing a certain
amount of gas to be displaced, and (2) the volatilization of liquid material increases. Emissions from reactors due to
temperature increases occurs routinely. Reactors usually are
equipped with condensers to reflux condensate during temperature
increases, if the material inside the reactors is volatile.
Inert gas purges also may be employed to reduce the risk of
explosion during reactions. In such cases, emissions are

increased because of such purges since volatile material is swept
out and the condensers that were installed to control
condensables usually were not sized to abate the volume of gas
that passes through as a result of the purge. Consequently, many
facilities do not route the existing purge stream from reactor
kettles through condensers because they are largely ineffective at controlling the relatively small amount of volatile8 contained
in the streams. Purge volumes are determined by the lower
explosive limits of the material in the reactors, but generally
range from 3 to 20 standard cubic feet per minute (scfm);
although somk facilities, especially prior to opening up manholes
for solids addition, use purges on the order of 200 to 300 scfm. In these later cases, the purges are used to prevent workers who
must manually add the solids from being exposed to toxic gases. These purges typically only last for periods of 2 to 5 minutes
(the length of time that solids addition may take) as opposed to lasting the entire duration of reaction (as in lower-volume
purges that are used to prevent explosions) . Chapter 3 details the methodology that should be used to calculate emissions from
purges.
2.2.2.3.3 $missions From Centrifuaes. Filters. and Drver~. Centrifuges, filters, and dryers function by separating solvent from solid product. For some types of equipment, the majority of
emissions will occur during unloading of the solid product from
the process equipment. Older-style centrifuges, for example,
must be unloaded manually by opening up the cover over the basket
and scooping out product. Newer centrifuge designs use bottom
unloading mechanisms that do not require manual unloading. Inert gas purging of the closed vapor space surrounding the centrifuge
basket to reduce the possibility of explosion and reduce worker
exposure increases VOC emissions. Filters also separate solvent from solid product. Emissions
from filters also occur mostly during unloading of the units, since they, like centrifuges, are enclosed during the actual separation operation. Some filters, such as nutsche filters, can
be bottom-discharged so that solvent emissions from manual
unloading may be minimized. Nutsche filters also are also
capable of convectively drying product by passing a heated
nitrogen stream through the filter cake after the filtration step
is completed. Drying of product in the filter minimizes solvent a
emissions that will occur when the material is transferred from
filter to dryer. Control systems also exist whereby the heated
inert stream that passes through the cake in the drying step is
compres,sed, condensed, and recirculated in a closed-loop system . @
so that drying emissions are virtually eliminated. Chapter 4
presents a detailed description of this particular system.
Emissions from other types of dryers, such as tumble
(double-cone) dryers, rotary dryers, and fluid bed dryers, occur
when the solvent-laden drying stream exiting these enclosed
process units are not contained or controlled. Since material to
be dried often contains as much as 50 percent by weight solvent,
controlling these emission streams will mean significant
emissions reduction.
The characteristics of the emission streams from dryers
depend largely on the flow rates and temperatures of drying
streams and on the amount of solvent that must be removed. When
the product is highly temperature-sensitive, a vacuum may be
pulled on the drying vessel to allow volatilization at lower
temperatures. A typical rotary dryer with a capacity of 20 it3
could operate at a vacuum of 4 to 5 pounds per square inch
(gauge). The vacuum in this situation could be created with a
liquid seal vacuum pump. Note that dryer emissions would be
partly controlled by the vacuum pump, although contamination of seal water would exist.
Dryers that are used for tablet coating are also quite
common in this industry. The two most conanon types of tablet coaters are rotating pan and fluidized bed coaters. A typical
rotating pan tablet coater has a spray which coats tablets that
are sitting in rotating open-ended pans while a stream of warm
air (lOO°F) flows across the tablets at a typical rate of
1,000 acfm. Drying takes approximately 2 to 3 hours. Another
process used for tablet coating, the wurster process, uses a ,-
- 2-52 -
fluidized bed in which the tablets are suspended in a vertical
column while the spray solution is applied. The exhaust gas
volume from the wurster process typically will be as high as
5,000 acfm. Coatings can be both water based and organic solvent
based. A typical organic coating solution consists of 80 to 85
percent methylene chloride, 10 percent-denatured ethanol or
isopropanol, and 5 to 10 percent solids. One gallon of coating will generally process 25 pounds of tablets. Assuming that
600 pounds of tablets can be coated in each of the tablet coaters described above, as much as 250 pounds of methylene chloride
could be emitted over the 2-3 hour drying span. lo Example calculations of VOC emissions from dryers is contained in
Chapter 3. 2.2.2.3.4 -ions from extractors. d-on columns.
. Emission streams from these pieces of
equipment generally are less significant sources of VOCs and air
toxics. Distillation columns and crystallizers are usually
equipped with condensers for reflwing. Emissions from
extraction columns are essentially vapor displacement emissions that occur while the columns and associated surge tanks are being
filled or discharged.
2.2.2.3.5 Storaue emissions. Storage vessels in the
pharmaceuticals industry typically are on the order of 2,000 to
10,000 gallons. For highly volatile solvents such as methylene
chloride, the tanks may be pressurized (to pressures of 100 psi)
or refrigerated to eliminate breathing losses. Breathing and working losses may be calculated from the information contained
in Chapter 3.
2.2.2.3.6 Enjgsions from emi~ment lea-. Fugitive emissions from leaking pumps, valves, flanges, and other process
components may be calculated using the AP-42 SOCMI equipment leak
factors. 2.2.2.3.7 u s i o n s from wastewatex. Wastewater may be
generated from vacuum pump seal water, scrubber discharge, or from condensation or feedstocks in the processes themselves. In cases where wastewater containing significant amounts of VOC1s or
0
air toxics is sent to the facility treatment system, emissions of
VOC or air toxics may occur. Chapter 3 presents further
discussion. . #
2.2.3 Pestlclde Manufacturinq
The manufacture of pesticides, the broad tern for
agricultural chemicals including herbicides, insecticides,
nematicides, and fungicides, is of ten done using batch -processes
due to the low volume or complex processing required. The @
synthesis of the active ingredient, or ntechnicalw product, is
quite similar to the batch manufacture of any synthetic organic
chemical with the notable exception that many pesticides have
high mammalian toxicity. Therefore, higher levels of worker
protection are required. The preparation of the final product
for the end-user, called fornulation, has other special
processing requirements for the preparation of the solid
substrates, diluents, "inertn ingredients, and product packaging.
A preponderance of batch equipment may also be used in the
formulation step.
The active ingredients of pesticides typically fall into two
categories: low volatility (high boiling point) oils with
limited solubility in water and solid organic compounds also
typically with limited water solubility. There are some special
cases where pesticides are high volatility liquids (or even
gases), particularly in the case of fungicides, but these cases
are unusual.
Limited solubility is desired in order to gain persistence
in the target environment by minimizing washoff and leaching. However, this generally means that the manufacture takes place using organic solvents (in which the compounds gg soluble),
- which are potential sources of VOC emissions. Due to the low vapor pressures (low volatility) of the active ingredients, the
vaporization of the compounds themselves is not particularly a
source of any significant VOC emission at the point of
manufacture. Due to the toxicity of many compounds, kowever,
worker exposure must be carefully controlled. At the point of
use, typically outdoor agricultural activities, the active
2 - 54

ingredients will vaporize over time and are a source of
significant VOC emissions. Some herbicides are salts of organic compounds and as such
have significant water solubility. This makes the component
wsystemicu in that it can be absorbed by the plant and be transported even to the roots (e.g., for control of perennial weeds). These compounds use water as a solvent in at least a portion of their manufacturing.
The following is a generalized description of a one reaction
step commercial synthesis of a "typicaln liquid-type insecticide active ingredient. Due to the proprietary nature of the pesticide manufacturing industry, no particular commercial compound is being described, but this description provides a
discussion of the types of process steps which might be used to manufacture an actual compound.
Raw material A, dissolved in low or moderate boiling point
organic solvent, is charged to a 2,000 gal, glass-lined or stainless steel reactor. Initial reaction temperature is attained by admitting tempered water to the external heating
jacket of the reactor. Prior to charging, the reactor had been
purged with several volumes of nitrogen, and during the reaction a small purge flow is maintained to prevent the buildup of oxygen
in the head space where flammable solvent vapors are present.
A second raw material, B, is introduced over a period of a couple of hours in order to conduct a I1semibatchu reaction. The reaction produces heat which is removed by letting the solvent boil off and condensing and returning it to the reactor with the
reflux condenser. Following completion of the addition of B, the entire
reactor contents are transferred hot to a second reactor for several hours of "cook outu where the final fraction of the reaction takes place. The crude product is then pumped through an in-line filter for removal of any solid catalyst that may have been used or for removal of solid by-products. By-product water or excess solvent may be removed as a lower layer using a decanter, and the nixture is pumped to a solvent removal system.

At this point, the batch process may be considered to be a
continuous process because a feed or I1equalizationn tank will be
constantly replenished with the product for each batch reaction.
Due to the difficulty of startup and shutdown, a flash evaporator
or distillation column or columns will typically be operated in a ,
continuous mode. The final liquid active ingredient or -"technicaln product is recovered as the bottom product. Due to
their low volatility, technicals are rarely distilled for final
purification; they are recovered as "residuen products.
II only a small amount of solvent was used in the synthesis,
a tank-based "dryingn scheme may be used where the crude product
is subjected to a vacuum for a period of time during which the
volatile components "weather off1' and are partially condensed
with a vent condenser. The capacity of such a system may be
enhanced using subsurface sparging of an inert gas.
The final liquid "technicaln product may be packed out in
drums or other bulk shipping containers for transport to the
formulation plant. This plant is often at a different location
and is likely be a different company.
The manufacture of a "typicalw solid pesticide active
ingredient, an herbicide, for example, is similar to the above
except that some sort of solid-liquid separation equipment is
required. Again, the following description is of no particular
commercial compound, but merely provides a description of the
types of process steps which might be used for the batchwise
manufacture of a solid pesticide.
Raw material A is charged to a 5,000 gal stirred tank reactor which has already been filled with aqueous
crystallization mother liquor from a previous batch. Raw material B is fed to the ireactor over a period of a few hours; the reaction produces product C which, being only partially
soluble, forms a slurry'of fine crystals. Using a liquid ring
vacuum pump, a vacuum is pulled on the reactor in order to
promote the desorption of an acid gas by-product of reaction.
The discharge of the vacuum pump is directed to a packed column 4
vent scrubber using caustic and sodium hypochlorite as scrubbing
liquid. The reactor contents, a slurry, are pumped to a centrifuge
feed tank, and the reactor is prepared for another batch. By
using a bank of reactors, the centrifuge feed tank can be kept
filled, and the rest of the process will operate nearly
continuously. .An automatic-dump, basket-type centrifuge is used to
separate the crystals of crude product from the mother liquor..
The mother liquor goes to a holding tank from which a small bieed stream is dikharged to wastewater treatment and the majority is returned to fill a reactor.
A bank of centrifuges is used so that the flow of wet cake
into the blender is nearly constant. A portion of dried final product is fed to the blender for wet cake conditioning. The wet
cake is then fed to a recirculating'gas dryer.
The drying gas, heated nitrogen, is introduced into the
bottom of the dryer. The drying gas conveys the product upward
and carries moisture from the product. The hot, moist gas is
then quench-cooled with water in a venturi scrubber. The scrubbing liquid, laden with dissolved product fines, is recycled
to the mother liquor tank. The dry product, which is separated
from the gas stream using a cyclone and bag filter arrangement,
is pneumatically conveyed to interim product storage.
- The "technicaln solid will eventually be packed out into
drums, tote bags, or other solids handling containers for
shipping to the fonrmlation plants. The formulation of the pesticide active ingredients into a
concentrate, powder, or granule that is more usable by the
consumer also heavily utilizes batch processing techniques.
Although there are no reactions, per se, the grinding, slurrying, mixing, coating, and drying steps all have the potential to produce VOC emissions. The following is a brief surmnary of the major types of pesticide formulations with a description of the unit operations that could be used to manufacture them. In

general, they fall into the categories of sprays, dusts, and
granules.
2.2.3.1 m.A very common spray formulation type is
the emulsifiable concentrate (EC) which is a concentrated oil
solution of an active ingredient which is typically insoluble in
water, but is soluble in petroleum solvents. The concentrated
solution is then diluted with water in the field before
application.
For liquid active ingredients, the manufacture of. an EC +
formulation is straightforward in that only simple mixing is
required. Dissolving solids into the organic solvent may require
specialized agitation equipment, but it is still straightforward.
Because of the need for rigorous quality control in the final
product concentration, a reactor on weigh cells may be used, and
the formulation ingredients, the oil, the emulsifier, and the
vtechnicalv active ingredient may be added by weight rather than
volume. Each batch can then be assayed for the exact content of
active ingredients; adjustments can be made before packing out
into the final containers.
Potential VOC emissions arise from the purging of mix
vessels, the filling of tanks and mix vessels, and from the hoods
and vents provided for worker safety over the packaging lines.
Wettable powders (WP), another common type of spray
formulation, are concentrated dusts of a solid active ingredient
combined with a finely ground dry carrier, such as mineral clay,
and a wetting agent. In use, the active ingredient gets
suspended in the water in a well-agitated mix tank. The
manufacture of these formulations usually requires fine grinding or milling of the active ingredients, and dry blending of the
solid constituents. There is a significant risk of dust exposure associated with the manufacture of WP1s but limited opportunities
for VOC emission. Water soluble powders are simple formulations for those
active ingredients which are water soluble solids. As with
wettable powders, fine grinding or dry milling and dry blending
II
would be required, with dust hazards but little VOC emission A
potential. Flowable formulations are very finely ground solid active
ingredients in permanent suspension with liquid carriers and
emulsifiers. The result is a wliquidVorm of a water-insoluble
pesticide without the use of organic solvents. There is, by definition, little potential for VOC emissions associated with flowable formulations.
Dry flowable formulations, also known as water dispersible
granules, are small granules of a solid active ingredient and
emulsifier. The manufacture of these granules may involve
slurrying of the finely divided dry active ingredient followed by
drying in special equipment (e.g., spray drying or a prilling
tower) which is designed to form the desired granule size. There is a small potential for VOC emissions associated with the drying
operation if organic solvents were used during the reslurrying,'
or if there is residual solvent present with the dry active
ingredient that gets released with a secondary drying step.
Water soluble concentrates are true solutions of pesticides
that are water soluble. With no solvents involved, there is
little risk of VOC emissions from their manufacture.
2.2.3.2 Granules. Granular formulations are the other major type of formulations. Primarily intended for soil
application, the granules consist of inert ingredients, usually
clays plus binders, formed into pellets which are then sprayed
with a solution of the active ingredient. The pesticide is thus
deposited on the surface when the solvent dries, or depending on the porosity, the pellet may become impregnated with the
pesticide. Granular formulations are a way to produce a solid
end product from a liquid active ingredient, or by trapping the pesticide in the clay pellet, to produce an end product which is
less hazardous to the user. With typically low solubilities in water, the preparation of
the solutipn for spraying on the pellets typically requires the
use of an organic solvent. Obviously, there is a high potential for VOC emissions with the manufacture of granular formulations.

In order for the pellets to remain free flowing, the solvent must @
be completely evaporated from them before they can be packaged.
In the case of dryers using purge gas, this implies low solvent
loadings at the end of the drying cycle, with typically low
efficiency of vent condensers. The dryer itself may be operated
continuously whereas the preparation of the solutions and the
substrates may be batchwise. Alternatively, a vacuum dryer may
operate batchwise or continuously.
2.2.3.3 H-. Figure 2-12 is a simplified process
schematic for the manufacture of heptachlor, a pesticide used to
control termites in the soil subsurface. Because of proprietary
concerns, operating characteristics of the equipment and other
specific process information could not be included in this
description. A simplified process description is presented
below. A discussion of potential emission points of VOC1s and
air toxics follows the process description.
2.2.3.3.1 process descri~tioq. The process involves
several steps. Hexachloropentadiene, heptane, cyclopentadiene,
and propylene oxide are reacted to form heptachlor 237
intermediate. Carbon tetrachloride is added to the kettle as a
solvent for the crude intermediate. The kettle contents are then
charged to a chlorinator, where the crude intermediate is reacted
with chlorine in the presence of catalyst to yield heptachlor.
Acid gas from the chlorinator is routed to another process. The
heptachlor/catalyst/solvent mixture from the chlorinator is then
filtered. Solids from the filter (catalyst) are dried while the
heptachlor (which is in liquid form) is sent to storage prior to
packaging and shipment. 11 2.2.3.3.2 mission sources. Emissions of VOC1s and air
toxics from vapor displacement due to kettle charging and
material transfer are expected to occur from all process vessels.
Kettle reaction emissions are also expected. The acid gas stream
from the chlorinator is pulled off for use in another process.
It is unclear whether VOC1s and air toxics that may be entrained
in this stream are released at a point later on in the other
C


(receiving) process. Emissions from the catalyst drying step are
also expected.
2.2.4 Svnthetic Oraanics C v a c t u r i n a Inmtrr
limxr2. The SOCMI uses both batch and continuous processes for the
manufacture of various chemicals. Though most larger-volume
chemicals are manufactured in continuous processing arrangements,
some products are still manufactured on a batch basis. The
manufacture of chlorendic anhydride was chosen to illustrate a
batch process typical of this industry. Because of proprietary
concerns, operating characteristics of the equipment and other
specific process information could not be included in this
description. A simplified process description is presented
below. A discussion of potential emission points of VOC1s and
air toxics follows the process description.
2.2.4.1 Process Descri~tioq. Figure 2-13 is a schematic of e
the chlorendic anhydride process. Maleic anhydride (melting
point of 60°F) is reacted with hexachlorocyclopentadiene (HEX) to form 'chlorendenic anhydride. The chlorendenic anhydride exiting
the reactor is routed to a crystallizer, where the addition of
excess heptane and toluene produces chlorendenic anhydride
crystals. The slurry from the crystallizer is then pumped to an
agitated centrifuge head tank, which discharges the slurry by
gravity to a centrifuge. The centrifuged liquid containing
appreciable amounts of heptane and toluene solvent is recovered
for further use. The chlorendenic anhydride from the centrifuge
is loaded onto a solids conveyor and moved to a vacuum dryer to remove remaining solvents. From the dryer, the final product is
loaded into drums for shipment. 12
2.2.4.2 Emission Pointg. The potential for emissions of VOC's and air toxics exists for all process vessels shown in
Figure 2-13. Because inert gas blanketing may be used to lower
VOC concentrations in the process vessels, emissions are also
expected from equipment openings, in which case the blanketing
becomes a purge. Vapor displacement emissions would be expected
from the various material transfer steps shown in the diagram.
I
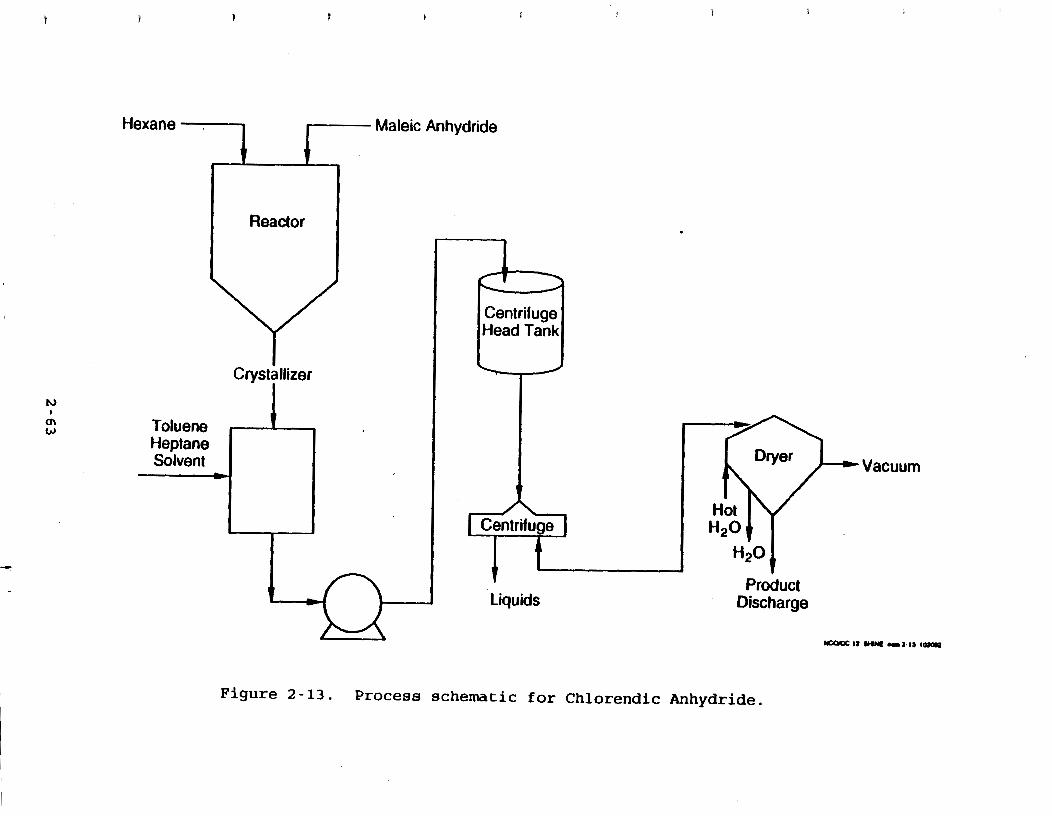
The conveyer used to move material from the centrifuge to the
dryer may also be a source of emissions. The dryer vacuum
exhaust stream also would be a source of VOC and air toxics
emissions.
REFERENCES FOR CHAPTER 2
Moir, D. N., Selecting Batch Pressure Filters, Chemical Engineering, 89:47. July 26,1982.
Telecon. C. Hale, MRI, and S. Sobolewski, Rosemund, Inc. June 5, 1990.
OIShea, Stephen, M., Nitrogen Blanketing of Centrifuges Reduces Fire Hazards, Chemical Engineering, 90:73. April 4, 1983.
Telecon. C. Hale,MRI, and R. McKinney, Heinkel Filtering Systems. May 3,1990.
Reference 3.
Root, W. L., Indirect Drying of Solids. Chemical Engineering. 90;56-57. May 2, 1983.
Bennett, R. C. Matching Crystallizer to Material. Chemical -Engineering. 95:ll-P127. May 23, 1988.
Pandullo, R., et al. Radian Corporation. Memo to Methylene Chloride Project File. Estimates of Potentially Hazardous Compound Emissions from Pharmaceutical Facilities and Emissions Reductions Achievable with Additional Controls. August 27, 1988.
Shine, B. Midwest Research Institute. Emissions and Control Memorandum. Epichlorohydrin--Producers and Users. September 30, 1988.
Pedco Environmental. Volatile Organic Compound Emissions Controls for Tablet Coating at Pharmaceutical Plants. January 19 8 4. Pacific Environmental Services, Inc. Chemical Processing Plants Summary Report for Technical Support in Development of a Revised Ozone State Implementation Plan for Memphis, Tennessee. Written for the U. S. Environmental Protection Agency, Region IV. June 1985.
Reference 11.
2.4 BIBLIOGRAPHY
Bennett, R. C. Matching Crystallizer to Material. Chemical Engineering. 95:118-127. May 23, 1988.
Chemical En-, 60:116-120. p 116-120 (1953) . EPA-450/2-78-029. OAQPS Guideline Series. -01 of Volatu
IC Emissions from ,Manufacture of S-gized Pharmaceutical Products, December 1978.
Geankoplis, C. J. -snort Processe~ggd Unit Onerat-. Allyn and Bacon, Inc., Newton, Massachusetts. 1983.
Larson, M. A. Guidelines for Selecting a Crystallizer. Chemical Engineering. 85:90-102. February 13, 1978.
McCabe, W. L., J. C. Smith, and P. Harriott. m t Onerations of Chemical Ensineerinq. McGraw-Hill Book Company, New York, New York. 1985.
Moir, D. N. Selecting Batch Pressure Filters. Chemical Engineering. 89:47-57. July 26, 1982.
Pacific Environmental Services, Inc. Chemical Processing Plants Summary Report for Technical Support in Development of a Revised Ozone State Implementation Plan for Memphis, -Tennessee. Written for the U. S. Environmental Protection Agency Region IV. June 1985.
Pandullo, R. et al., Radian Corporation. Memo to Methylene Chloride Project File. Estimates of Potentially Hazardous Compound Emissions from pharmaceutical Facilities and Emission Reductions Achievable with Additional Controls. August 27, 1988.
Pedco Environmental. Volat.ile Orsanic Com~ound mission Controls for Tablet Coatina at Pharmace-1 Plants, Jan. 1984.
Perry, R. H., and C. H. Chilton. Chemical En-eer's Handbook. Fifth E d i f i p n . McGraw-Hill Book Company, New York, New York, 1973.
Shine, B., Midwest Research Institute. Project Summary-- ~pichlorohydrin--Proceduresand Users Regulatory Decision. March 16, 1990.
Stem, A.C., Ed. Air Pollutjon Vol. VII, 3rd Edition. Academic Press, Orlando, Florida. 1986.
Svarovsky, L. Advances in Solid-Liquid Separation-I, Filtration and Allied Operations. Chemical Engineering. 86.:62-76." July 2, 1976.
Treybal, R. E. m m - T r a m f e r O ~ a a t i o a . McGraw-Hill Book Company, New York, New York. 1980.
U. S. Environmental Protection Agency, Emission Standards . IDivision. Dlstlllation O n e r u n s e e t i c O r a w c C h a nufactur~na- - - B a c k a w d T n f o o .
U. S. Environmental Protection Agency. Research Triangle Park, N.C. Publication No. EPA-450/3-83-005a. December 1983.
U. S. Environmental Protection Agency, Emission Standards Division. from Volatile Ora-d Storaae-
Tanks - -Backaround InCmma3on for Pro~offed Standax&. U. S. Environmental Protection Agency. Research Triangle Park, N.C. Publication No. EPA-450/3-81-003a. July 1984. . Williams-Gardner, A. Industrial Drvinq. Gulf Publishing Company, Houston, Texas. 1977.

3.0 EMISSION ESTIMATION METHODOLOGIES
The methodologies presented in this chapter are based on the
Ideal Gas Law and on fundamental vapor/liquid equilibrium relationships such as Henry's and Raoult's Law, unless otherwise specified. The equations are intended for use in estimating and characterizing uncontrolled emission streams from batch
processes. Example calculations are presented in Appendix C. Significant errors may result in using the examples for situations that do not meet the conditions and/or assumptions
that are clearly stated in the presentation of the methodologies.
Chapter 4 presents a discussion on control efficiencies for
various devices which may be used in conjunction with the characteristic streams presented in this chapter. Necessary
constants and chemical data are presented in Appendix A.
Appendix B discusses calculational issues and Appendix C contains
example calculations for the methodologies described.
3.1 PROCESS VENT EMISSIONS
Process vent emissions may result from a number of different types of events. Methodologies for various emission events are
presented in order of importance relative to the potential magnitude of their VOC emissions. Common process vents that occur in batch processing result from drying, tank and reactor
inert gas purging, vapor displacement losses from material transfer, tank and reactor heating, gas evolution, gas sparging, batch pressure filtration, and vacuum generation. The diacussion below presents the principles and methodology for estimating emissions from these events.

3.1.1 B r v a Two types of drying operations commonly occur in batch
processing. These are conductive drying, in which heat is
transmitted to the material to be dried by contact with heated
surfaces, and convective drying, in which heat is transmitted by
hot gases which are in contact with the material. Conductive
drying may occur under vacuum conditions or at atmospheric
presstre and in several types of dryers, including tray dryers,
tumble (double-cone) dryers, pan dryers, and rota'ry dryers.
Convective drying occurs at atmospheric conditions. Convective dryers include rotary dryers, fluid bed dryers, and spray dryers.
The methodology for calculating emissions from the types of
dryers described above is essentially the same. In general, the
rate of drying of the material depends on many factors associated
with the specific drying situation (i.e., moisture or solvent
content of material to be dried, heat and mass transfer
parameters, drying period, etc.), but generally decreases with
time so that a large percentage of liquid will be removed during
the initial portion of the drying cycle.
Studies on the theory of drying of solids usually relate
drying rate to moisture content of the solida. Three distinct
periods of drying can be observed: the constant-rate period
where surface moisture is evapbrated; the funicular state where
capillarity of the liquid in the pores influences the drying
rate; and the pendular state where the moisture content is so low
that capillary action ceases and the liquid must diffuse through
the pores of the solid. Each of these three periods of drying
has successively lower rates of drying; the final drying rate, when the moisture content is zero, .is of course also zero. 1
Dryer design specialists, usually employed by the vendors of drying equipment, can relate the drying curve for solids to rate
of drying expressed as a function of residence time. Laboratory
or pilot-scale experiments are often needed to establish the
a ~ n dryer nomenclature moisture can also refer to organic solvent content, not just water content.
correct dryer size, operating temperature, gas flow rate, cycle time, etc. After a dryer is installed and operating correctly,
the only data usually readily a~ilable are the cycle time, gas
flow rates, and moisture content of the solid at the start and
finish of the cycle. If very dry solids are produced, i.e., zero moisture content, it is clear that the drying rate at the end of
the cycle will be asymptotic to zero. This end point condition,
and a knowledge of the total solvent removed, can be used to estimate the emission characteristics of an existing, installed
dryer. In industrial practice, the filter cakes and centrifuged
solids which must be dried often appear dry and free-flowing. In
fact, they may contain as much as 50 percent solvent by weight. At the end of the drying cycle the solvent content is reduced to
the percent or fractional percent level, as required by the
process. From a mass balance, the total amount of solvent emitted can be calculated.
In order to properly size emission control equipment for dryers, however, one must know the instantaneous emission stream characteristics throughout the cycle. Although the precise
values can only be determined from extensive laboratory testing,
a reasonable estimate can be obtained by assuming that the rate
of decrease of drying rate is linear over the length of the drying cycle starting from the initial, highest value and
declining to zero at the end of the cycle. From the material balance on solvent removed, the average drying rate can be
calculated knowing the length of the cycle. From simple analytic geometry it is apparent that with a straight line relationship,
and a final value of zero, the initial drying rate must be two times the average. Therefore, the drying rate, and hence the
emission rate, can be estimated for any point in the drying cycle. The total emission stream can be calculated knowing the
drying gas flow rate and conditions. In the case of vacuum dryers, the emission stream contains a
small amount of air due to leakage into the vacuum system, as well as any inert gas intentionally purged in. It is also worth

noting that' the vacuum-generating equipment (vacuum pump or steam
ejector) itself may reduce, or may increase, the amount of VOC in
the discharge stream (see description below.)
3.1.1.1 Vacuum D-. Tray dryers, double-cone dryers,
pan dryers, and rotary dryers may be operated under vacuum
conditions. Such vacuum dryers will have an inward leakage rate
of air that will aid in carrying the VOC1s and air toxics that
have evaporated off the product out of the dryers. Vacuums in
the range of 15 to 25 inches mercury are typical. Articles have:
been published which provide methods of estimating leakage rates '
for vacuum systems.2 One such methodology is contained in
Section 3.1.8. For a single dryer, the air leakage may range
from 10 to 30 scfm depending on system design and vacuum level
desired. An example calculation of vacuum dryer emissions is
presented in Appendix C.
3.1.1.2 Atmos~heric Drverg. While conductive dryers also
may operate at atmospheric conditions, convective dryers operate
at atmospheric pressure or above. Convective dryers include tray
dryers and fluid bed dryers. The four types of conductive dryers
discussed in the previous section, tray dryers, double-cone
dryers, pan dryers and rotary dryers also may be operated at
atmospheric conditions. A stream of air or inert gas is used to
move the volatilized material from the dryer vessel in conductive
drying. The gas stream is actually the heating mechanism in
convective drying. In both of these situations, the calculation
of total VOC content emitted during the drying cycle is identical
to the vacuum drying method (a mass balance from initial cake
concentration to final cake concentration). The estimation of
the maximum dryer emission rate, which is used for sizing of
equipment, is also analogous to the method presented for vacuum
drying. The flow rate of gas through the system is the dryer
exhaust gas rate. An example calculation of atmospheric dryer
emissions is presented in Appendix C.
3.1.2 Tank and Reactor Purainq
Consistent with batch processing there is frequently a need
to use a gas stream to purge VOC vapors from either an empty tank -
3-4

or reactor vessel, or from the vapor space of a partially filled
tank or reactor. Typical reasons for purging'are to maintain
product quality (e.g., by using a dry sweep gas to minimize water vapor in a system) or to reduce concentrations of flammable
vapors below safety limits (by using an inert gas such as nitrogen or carbon dioxide).
3.1.2.1 m t m n k W u i n q . Empty vessels may be purged intermittently (e-g., at startup and shutdown, or between
batches) using a displacement purge to remove accumulated vapors. The estimation of VOC emissions in this case is fairly
straightforward. Before the purge, the vapor space of an empty vessel can be assumed to be in equilibrium with the liquid which
was removed. Thus, the starting concentration is known. The final concentration is a function of the number of volumes of
purge gas used. This can be expressed as a power law when
where:
n = the number of volumes of purge gas used;
x = the fractional dilution per volume change; Cf = final concentration in vessel; and
Ci = initial concentration in vessel.
The fractional dilution per volume change assuming perfect mixing has been shown to be 37 percent. Thus, equation 3-12
becomes:
This equation does not take into account evaporation of any residual liquid in the vessel, and assumes no free liquid. The equation was derived in the following way:
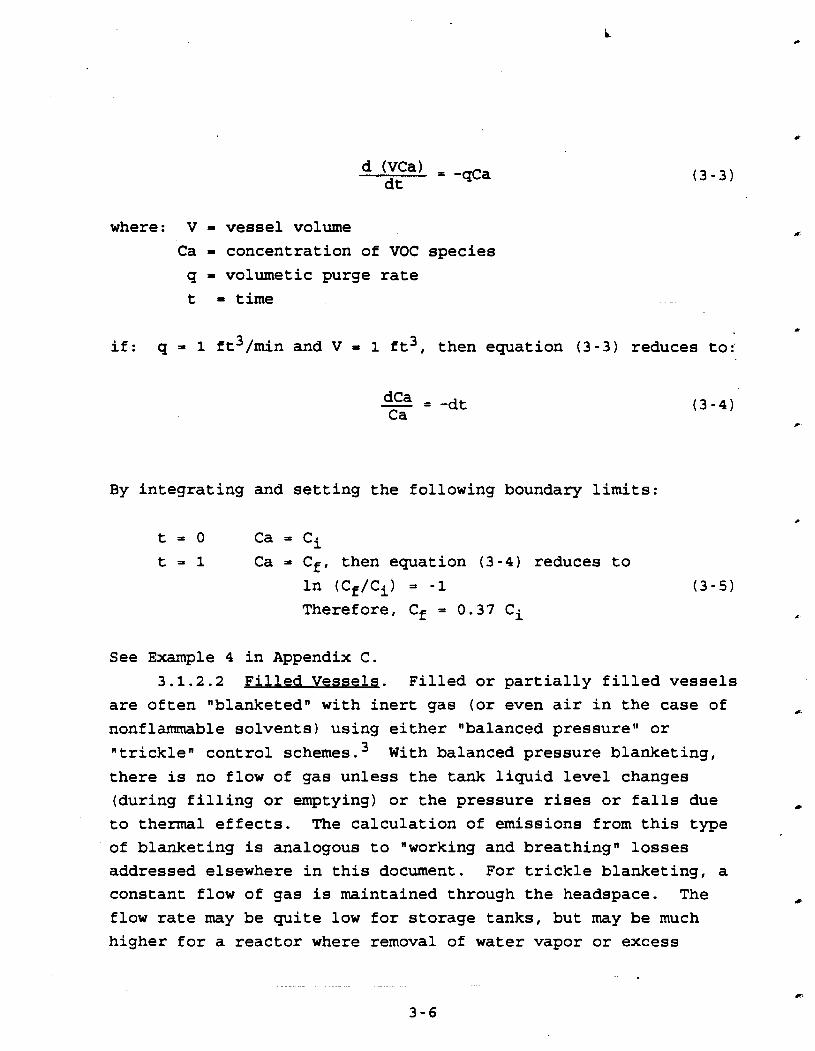
where: V = vessel volume
Ca - concentration of VOC species
q = volumetic purge rate
t - time
if: q = 1 ft3/min and V - 1 ft3, then equation (3-3) reduces to:
By integrating and setting the following boundary limits:
t = O Ca = Ci
t = l Ca = Cf, then equation (3 -4) reduces to In (Cf/Ci) = -1
Therefore, Cf = 0.37 Ci
See Example 4 in Appendix C.
3.1.2.2 Filled Vesselg. Filled or partially filled vessels
are often "blanketedn with inert gas (or even air in the case of
nonflammable solvents) using either "balanced pressureN or
" tricklen control schemes. With balanced pressure blanketing,
there is no flow of gas unless the tank liquid level changes
(during filling or emptying) or the pressure rises or falls due
to thermal effects. The calculation of emissions from this type
of blanketing is analogous to "working and breathingn losses
addressed elsewhere in this document. For trickle blanketing, a
constant flow of gas is maintained through the headspace. The
flow rate may be quite low for storage tanks, but may be much
higher for a reactor where removal of water vapor or excess
solvent vapor is required. The higher flows have also been
referred to as purges or sweeps. Due to the lack of test data a traditional approach to
calculating the volatile organic content of a purge gas stream is to assume that the gas is saturated with the vapors of the liquid
over which it is flowing. This assumption is thought to be conservative or worst case in that the VOC content cannot possibly be greater than saturation (as long as there are no entrained droplets). For the purposes of calculating a maximum
expected uncontrolled emissions rate, this approach is acceptable. However, as is shown in Appendix B, the actual VOC concentration of the exiting purge gas may be substantially below saturation., In fact, calculations show that the percentage
saturation of an inert gas purge stream over a quiescent pool of liquid is expected to be no more than 10 percent. Likewise, the
purging of equipment with turbulent liquid surfaces leads to
higher saturation fractions, approaching 100 percent saturation
at lower flowrates. Since most vessels will presumably be agitated, the assumption that the exiting purge gas is completely
saturated with VOC is recommended; However, if the purge is greater than 100 scfm, a saturation facror of 25 percent is
recommended. Another assumption that must be made is that the displaced
gas will fit the conditions of an ideal gas, and therefore, that the ideal gas law can be used. Most operations are run at
conditions such as atmospheric pressure and relatively low
temperatures, which allow the application of the ideal gas law.
The VOC emission rate from purging may be estimated by first calculating the volumetric flow rate of the gas leaving the vessel, which is made up of noncondensables as well as the VOCs that have volatilized into the vapor space. The total rate of
gas' exiting a vessel is therefore:
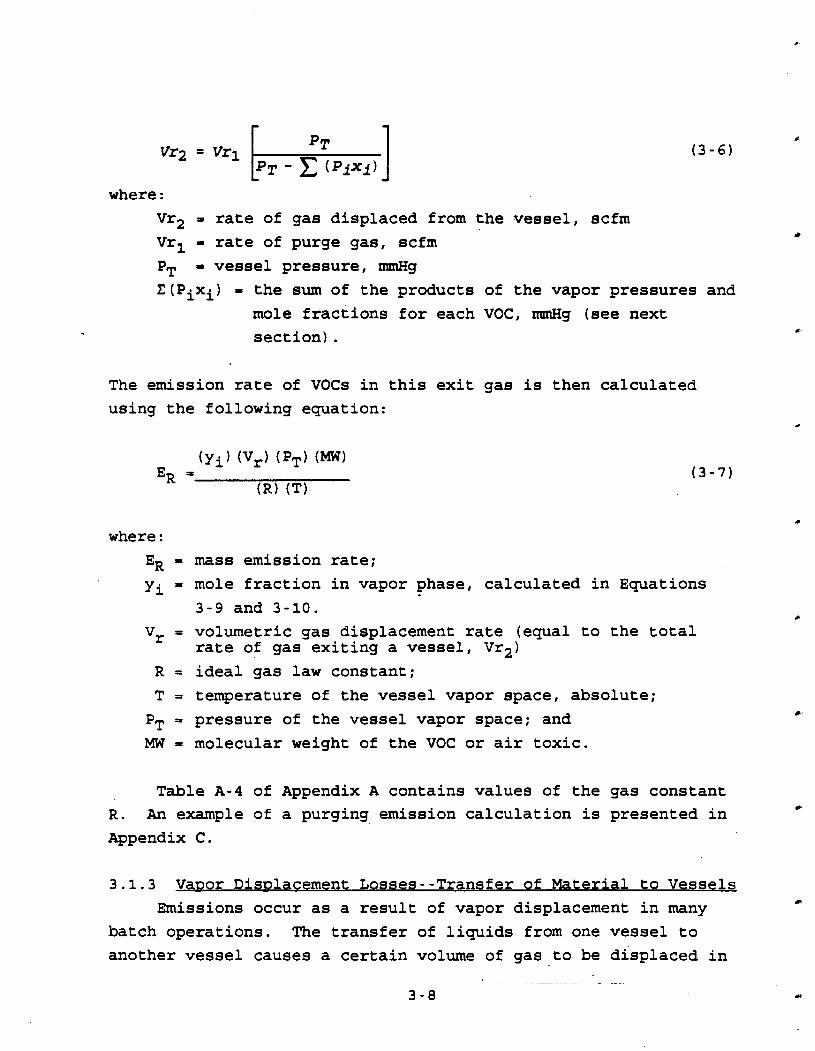
where :
Vr2 = rate of gas displaced from the vessel, scfm
Vrl = rate of purge gas, scfm
PT = vessel pressure, rmnHg
Z(Pixi) = the sum of the products of the vapor pressures and
mole fractions for each VOC, nanHg (see next
section).
The emission rate of VOCs in this exit gas is then calculated
using the following equation:
where :
ER = mass emission rate;
yi = mole fraction in vapor phase, calculated in Equations
3-9 and 3-10.
Vr = volumetric gas displacement rate (equal to the total rate of gas exiting a vessel, Vr2)
R = ideal gas law constant;
T = temperature of the vessel vapor space, absolute;
PT = pressure of the vessel vapor space; and
MW = molecular weight of the VOC or air toxic.
Table A-4 of Appendix A contains values of the gas constant
R. An example of a purging emission calculation is presented in
Appendix C.
3.1.3 V a ~ o r Dimlacement Losseg--Transfer of Material to Vessels
Emissions occur as a result of vapor displacement in many
batch operations. The transfer of liquids from one vessel to
another vessel causes a certain volume of gas to be displaced in
the receiving vessel. The VOC1s that may be contained in this
volume also are displaced. In many cases, the displaced gas is vented directly to the atmosphere. The amount of VOC's emitted during such an event is limited by the partial pressure of the
components in the gas stream and the vessel pressure. Usually, vessel vapor spaces are filled with air (21 percent oxygen,
79 percent nitrogen) or almost pure inert gas, such as nitrogen. The degree of saturation of the vent gas with the VOC1s must
be assumed or known before any calculations are done. As is normally the practice when permit levels are established, a conservative assumption usually is made to prevent underestima-
tion of emissions. A conservative assumption in most vapor
displacement calculations is to consider the gas being displaced to be 100 percent saturated with the volatile compounds that are
entering the vessel. The following steps are involved in calculating emissions from vapor displacement events:
S t e ~ 1. Define the conditions of the displaced gas:
1. Temperature;
2. Pressure; and 3. Volumetric rate of displacement.
The rate of displacement of a gas from a vapor space is equal to
the rate of filling of that vessel with a liquid. An example of this type of displacement event is the transfer of liquid material from one process vessel to another, such as the charging
of a reactor with material from a weigh tank, and the subsequent
emission of gas from the reactor that is saturated with the
vaporized liquid.
Sten 2. Calculate the mole fraction of components in
displaced gas: 1. Determine or calculate the vapor pressure of the liquid
compound of interest (for one specific component, such as an air toxic) or of the entire volatile component of the liquid (for total VOC emissions).
For one component, this can be done by consulting vapor pressure tables at the appropriate temperature (see Table A-1) or by using Antoinels equation, a form of which is presented below:
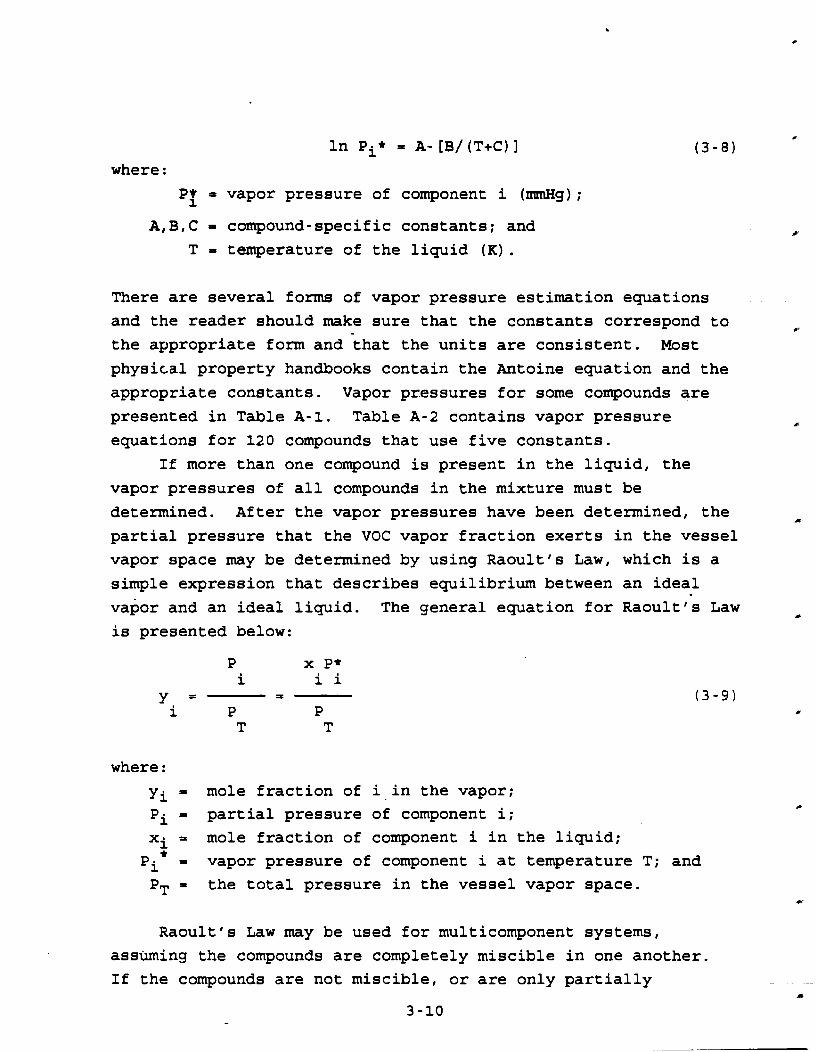
In Pi+ = A- [B/ (T+C) I where:
Pf = vapor pressure of component i (mmHg) ;
A,BIC= compound-specific constants; and
T = temperature of the liquid (K).
There are several forms of vapor pressure estimation equations
and the reader should make sure that the constants correspond to the appropriate form and -that the units are consistent. Most
physical property handbooks contain the Antoine equation and the
appropriate constants. Vapor pr.essures for some compounds are
presented in Table A-1. Table A-2 contains vapor pressure
equations for 120 compounds that use five constants.
If more than one compound is present in the liquid, the
vapor pressures of all compounds in the mixture must be
determined. After the vapor pressures have been determined, the
partial pressure that the VOC vapor fraction exerts in the vessel
vapor space may be determined by using Raoult's Law, which is a
simple expression that describes equilibrium between an ideal
vapor and an ideal liquid. The general equation for Raoultls Law
is presented below:
where:
yi = mole fraction of i in the vapor;
Pi = partial pressure of component i;
xi = mole fraction of component i in the liquid; +Pi = vapor pressure of component i at temperature T; and
PT = the total pressure in the vessel vapor space.
Raoult's Law may be used for multicomponent systems,
assuming the compounds are completely miscible in one another.
If the compounds are not miscible, or are only partially

miscible, then they are considered "nonidealn and Raoultls Law does not apply. At or above the solubility limit, each compound exerts a partial pressure in the vapor space which is equal to the vapor pressure at that temperature. Below the solubility
limit, especially dilute solutions comprised of water and trace amounts of air toxics or VOC1s, Henry's Law is used to describe
the relationship between the mole fraction of the compound in the liquid and the vapor phase mole fraction. Henry's Law is
presented below:
Y i
where: = mole fraction of component i in the liquid; = Henry's Law constant for i (at temperature T); = mole fraction of component i in vapor; and = the total pressure in the vessel vapor space.
This relationship is especially important in calculating evaporative losses from process wastewater. Henry's Law constants for some organic compounds at 2S°C are presented in Table A-3. Also, a method of correcting the constants for
different temperatures follows Table A-3 in Appendix A. S t e ~3. Calculate the emission rate:
Once yi, the mole fraction of component i in the vessel vapor space is known, the VOC or air toxic emission rate may be easily calculated by multiplying yi by the vessel fill rate
(which equals the gas displacement rate) and converting this volumetric rate to a mass emission using equation 3-7. Examples of vapor displacement emission calculations are presented in
Appendix C. 3.1.4 Vessel Heatinq
When a process vessel partially filled with a VOC or a material containing a VOC is heated, the gas and vapors in the headspace expand and are discharged from the vent. An estimate of the emissions in the uncontrolled vent stream from such an

6
event can be calculated based on application of the Ideal Gas Law
and on vapor-liquid equilibrium principles.
The basis of the calculation is that the moles of gas
displaced from a vessel are a result of the expansion of the
noncondensable gas upon heating, and an increase in the VOC vapor &
pressure. The assumptions made for the calculations which follow
are (1) atmospheric pressure of 760 mmHg and (2) the displaced
gas is always saturated with VOC vapor in equilibrium with the
1 iquid mixture.
The initial pressure of the gas (noncondensable) in the
vessel is given by:
where :
Pal - initial partial pressure of gas in vessel
headspace, mmHg, and
(Pi)T1 - initial partial pressure of each VOC in vessel
headspace, mmHg, at the initial temperature (T 1
) .
The choice of formula for calculation of Pi depends on which
vapor-liquid equilibrium assumption is chosen (as discussed in
Section 3.1.1). If the VOC species behaves "ideallyn in the
system under consideration, then Raoult's Law holds and
(Pi)T1= (P!)TIXi (3- 12)
where :
(P*iT1 = vapor pressure of each compound at specified temperature, TI, and
Xi = mole fraction of each compound in the liquid
mixture.
If the VOC in question is present in very dilute
concentrations in the liquid, then - Henry's Law gives a reasonable P
estimate of the compound partial pressure if the empirically
determined constant is available:

du
d
O
dk
W h
0.4
n a
0
a,-rl
U
U
c: Id
a,u
m
-ti a,
rl
k
a
PC a
Q,
Idk
h
V)
m
-d
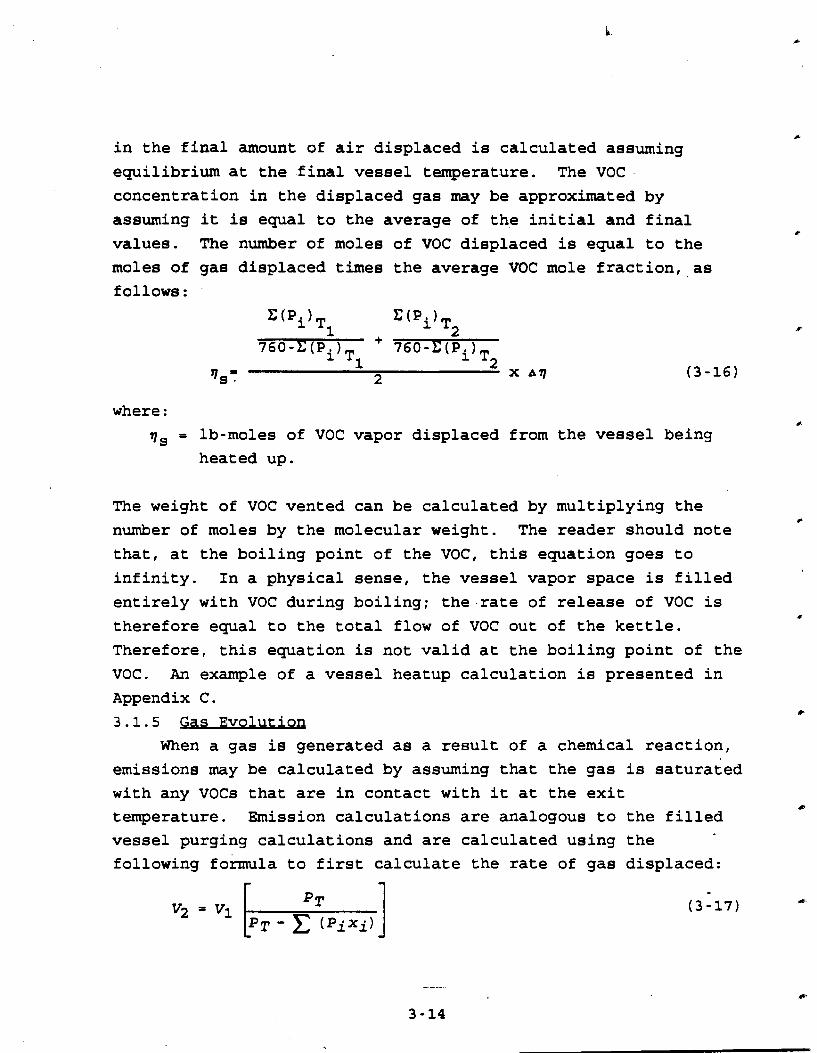
in the final amount of air displaced is calculated assuming
equilibrium at the final vessel temperature. The VOC
concentration in the displaced gas may be approximated by
assuming it is equal to the average of the initial and final
values. The number of moles of VOC displaced is equal to the
moles of gas displaced times the average VOC mole fraction, as
follows:
where :
q, = lb-moles of VOC vapor displaced from the vessel Being
heated up.
The weight of VOC vented can be calculated by multiplying the
number of moles by the molecular weight. The reader should note
that, at the boiling point of the VOC, this equation goes to
infinity. In a physical sense, the vessel vapor space is filled
entirely with VOC during boiling; the rate of release of VOC is I
therefore equal to the total flow of VOC out of the kettle.
Therefore, this equation is not valid at the boiling point of the
VOC. An example of a vessel heatup calculation is presented in
Appendix C.
3.1.5 Gas Evolutioq
When a gas is generated as a result of a chemical reaction,
emissions may be calculated by assuming that the gas is saturated
with any VOCs that are in contact with it at the exit
temperature. Emission calculations are analogous to the filled
vessel purging calculations and are calculated using the
following formula to first calculate the rate of gas displaced: r -.

when V1 = initial volumetric rate of gas evolution
PT = vessel pressure
z (Pixi)= sum of the products of the vapor pressure and the mole fraction of each VOC at the exit temperature.
Once V2 is known, it can be inputted into Equation 3-4 to
calculate the emission rate. An example calculation of gas VOC emissions from gas evolution is presented in Appendix C.
3.1.6 Sparsinq Sparging is the subsurface introduction of a gas (typically.
nitrogen or other inert gas) intended to remove by selective volatilization (stripping) a more volatile minor component from a liquid mixture of predominantly less volatile material. Common
applications of sparging are the removal of trace quantities of
water or volatile organic solvent from a low volatility (high boiling point) resin. The removal of low concentrations of
organic solvents from wastewater also may be achieved using air
sparging. Sparging is a semibatch operation. The sparge tank is
filled or discharged on a batch basis, while the gas is fed
continuously at a steady flow rate for the duration of tlie sparge cycle. The subsurface sparger is designed to develop a mass of
small diameter bubbles. The tank may be agitated as well in order to produce fine bubbles and increase the bubble residence
time. These design features are intended to increase contact
efficiency.
Utilizing fundamental chemical engineering principles and empirical correlations published in the literature it is possible
to calculate the mass transfer coefficients encountered in sparging applications. The transfer rate of the component being m
stripped out is a function of temperature, composition, liquid diffusivity, gas rate and agitator power (which determine bubble
size), and tank geometry (which, along with agitation power, determines residence time) .
For the calculation of equilibrium concentration of VOC in the exiting sparge gas the earlier discussion of Raoultl s - ~ a w and
Henry's Law applies. For simple sparging (low viscosity fluids;
no solids) vapor concentration may approach 100 percent of the
equilibrium value calculated. For complex sparging, an
empirically determined lower value may need to be used.
Unlike continuous flow vapor-liquid separation processes,
with batchwise sparging it is not possible to write a series of
simple analytical equations which define the outlet gas
concentration as a function of inlet concentration and
thermodynamic properties of the compounds. This is because the
liquid flow rate is zero and the composition changes with time.
The problem of estimating the gas composition (hence, VOC
emissipn rate) at any time during the sparge cycle, or of
determining the amount of sparge gas and sparge time required to
achieve a certain concentration reduction, can, however, be
solved using simple numerical integration. One chooses a small
time increment, one minute, for example, over which to calculate
the gas flow and composition, making the simplifying assumption
that the liquid composition does not change. From the inlet gas
concentration (most likely zero) and the saturated exit gas
concentration, the amount of volatile removed froa the bulk
liquid can be calculated, and a new estimate made for the liquid
composition. The calculation of the vapor composition for the
next time "slicew will be made based on this new liquid
composition value. The cumulative quantity of volatile removed
is used for subsequent estimates of the liquid composition. Is-
A graphical representation of the vapor or liquid
composition as a function of sparge time has a characteristic
hyperbolic shape where the composition is asymptotic to zero.
The initial composition is high, as is the stripping rate because
the mass transfer is a function of the composition driving force. The final composition is low, but a long stripping time is
required to achieve a small decrease in composition because the driving force is also very low. An example sparging
volatilization calculation is presented in Appendix C.
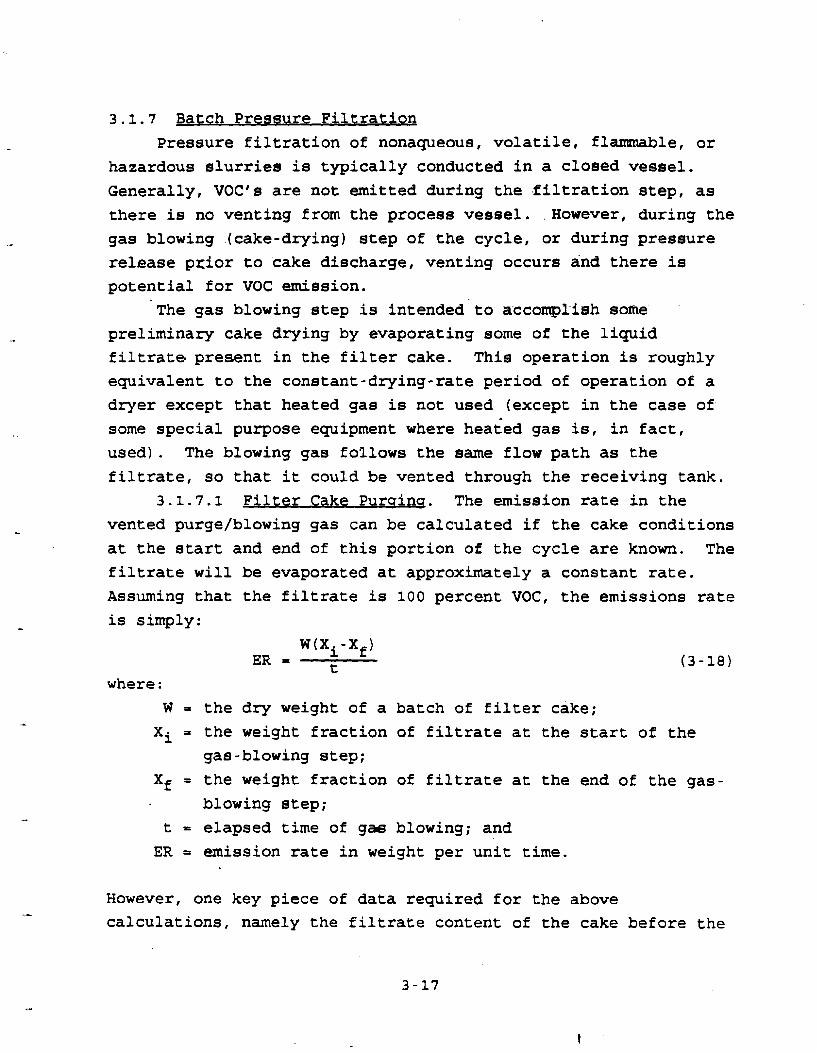
3.1.7 Batch Pressure Filtration
Pressure filtration of nonaqueous, volatile, flammable, or
hazardous slurries is typically conducted in a closed vessel.
Generally, VOC1s are not emitted during the filtration step, as
there is no venting from the process vessel. .However, during the
gas blowing (cake-drying) step of the cycle, or during pressure release pxior to cake discharge, venting occurs and there is
potential for VOC emission. The gas blowing step is intended to accomplish some
preliminary cake drying by evaporating some of the liquid filtrate present in the filter cake. This operation is roughly
equivalent to the constant-drying-rate period of operation of a dryer except that heated gas is not used (except in the case of
some special purpose equipment where heaied gas is, in fact, used). The blowing gas follows the same flow path as the
filtrate, so that it could be vented through the receiving tank. 3.1.7.1 Filter Cake Purqinq. The emission rate in the
vented purge/blowing gas can be calculated if the cake conditions at the start and end of this portion of the cycle are known. The
filtrate will be evaporated at approximately a constant rate. Assuming that the filtrate is 100 percent VOC, the emissions rate
is simply:
w(xi-xf)ER = t
where: W = the dry weight of a batch of filter cake;
Xi = the weight fraction of filtrate at the start of the gas-blowing step;
Xf = the weight fraction of filtrate at the end of the gas- blowing step;
t = elapsed time of gas blowing; and
ER = emission rate in weight per unit time.
However, one key piece of data required for the above calculations, namely the filtrate content of the cake before the
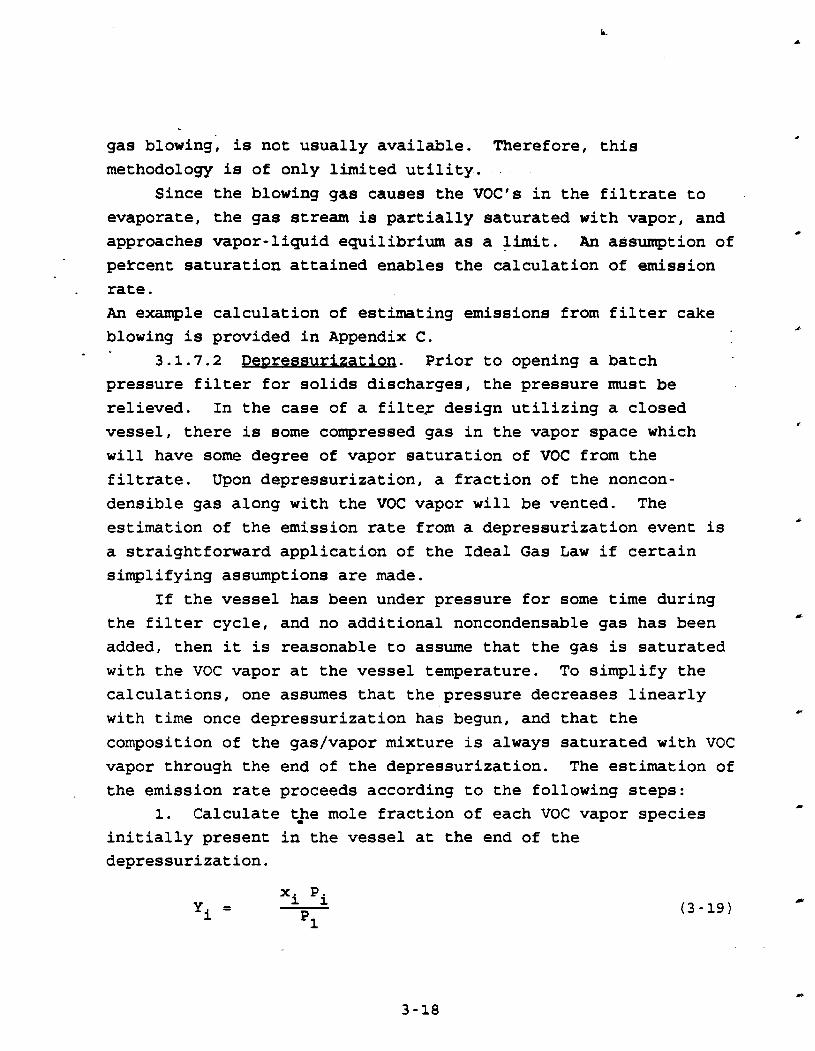
gas blowing, is not usually available. Therefore, this
methodology is of only limited utility.
Since the blowing gas causes the VOC1s in the filtrate to
evaporate, the gas stream is partially saturated with vapor, and
approaches vapor-liquid equilibrium as a limit. An assumption of petcent saturation attained enables the calculation of emission
rate.
An example calculation of estimating emissions from filter cake
blowing is provided in Appendix C.
3.1.7.2 Pe~ressurizatio~. Prior to opening a batch
pressure filter for solids discharges, the pressure must be
relieved. In the case of a filter design utilizing a closed
vessel, there is some compressed gas in the vapor space which
will have some degree of vapor saturation of VOC from the
filtrate. Upon depressurization, a fraction of the noncon-
densible gas along with the VOC vapor will be vented. The
estimation of the emission rate from a depressurization event is
a straightforward application of the Ideal Gas Law if certain
simplifying assumptions are made.
If the vessel has been under pressure for some time during
the filter cycle, and no additional noncondensable gas has been
added, then it is reasonable to assume that the gas is saturated
with the VOC vapor at the vessel temperature. To simplify the
calculations, one assumes that the pressure decreases linearly
with time once depressurization has begun, and that the
composition of the gas/vapor mixture is always saturated with VOC
vapor through the end of the depressurization. The estimation of
the emission rate proceeds according to the following steps:
1. Calculate t.e mole fraction of each VOC vapor species
initially present in the vessel at the end of the
depressurization.
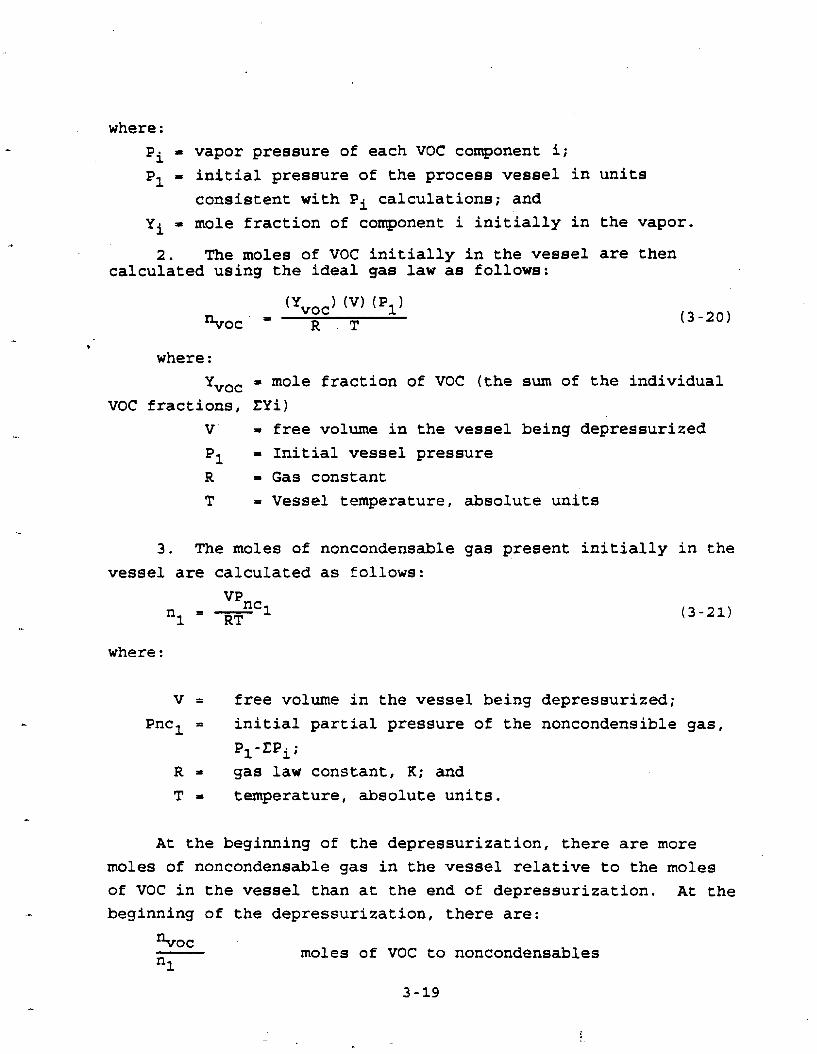
where: pi = vapor pressure of each VOC component i;
P1 = initial pressure of the process vessel in units consistent with Pi calculations; and
Yi = mole fraction of component i initially in the vapor.
2. The moles of VOC initially in the vessel are then calculated using the ideal gas law as follows:
. where:
= mole fraction of VOC (the sum of the individual yvoc VOC fractions, ZYi)
V. = free volume in the vessel being depressurized = Initial vessel pressure
R = Gas constant T = Vessel temperature, absolute units
3. The moles of noncondensable gas present initially in the
vessel are calculated as follows:
where:
V = free volume in the vessel being depressurized; Pncl = initial partial pressure of the noncondensible gas,
R = gas law constant, K; and T = temperature, absolute units.
At the beginning of the depressurization, there are more moles of noncondensable gas in the vessel relative to the moles of VOC in the vessel than at the end of depressurization. At the beginning of the depressurization, there are:
moles of VOC to noncondensables

5 . At the end of depressurization, there are
moles of VOC to noncondensables
where:
where:
Free volume in the vessel being depressurized;
~inalpartial pressure of the noncondensible gas,
P2 - C Xi pi;
Gas law constant, and;
temperature, absolute.
6. The moles of VOC for the duration of the depressurization
may be calculated by taking an approximation of the average ratio
of moles by VOC to moles of noncondensible and multiplying by the
total moles of noncondensibles released during the
depressurization, or:
where: Nvoc = moles of VOC emitted
7. The moles of VOC emitted can be converted to a mass rate
using the following equation:
where: -- emission rate of the VOCErvoc -- molecular weight of the VOC-0,
t = time of the depressurization
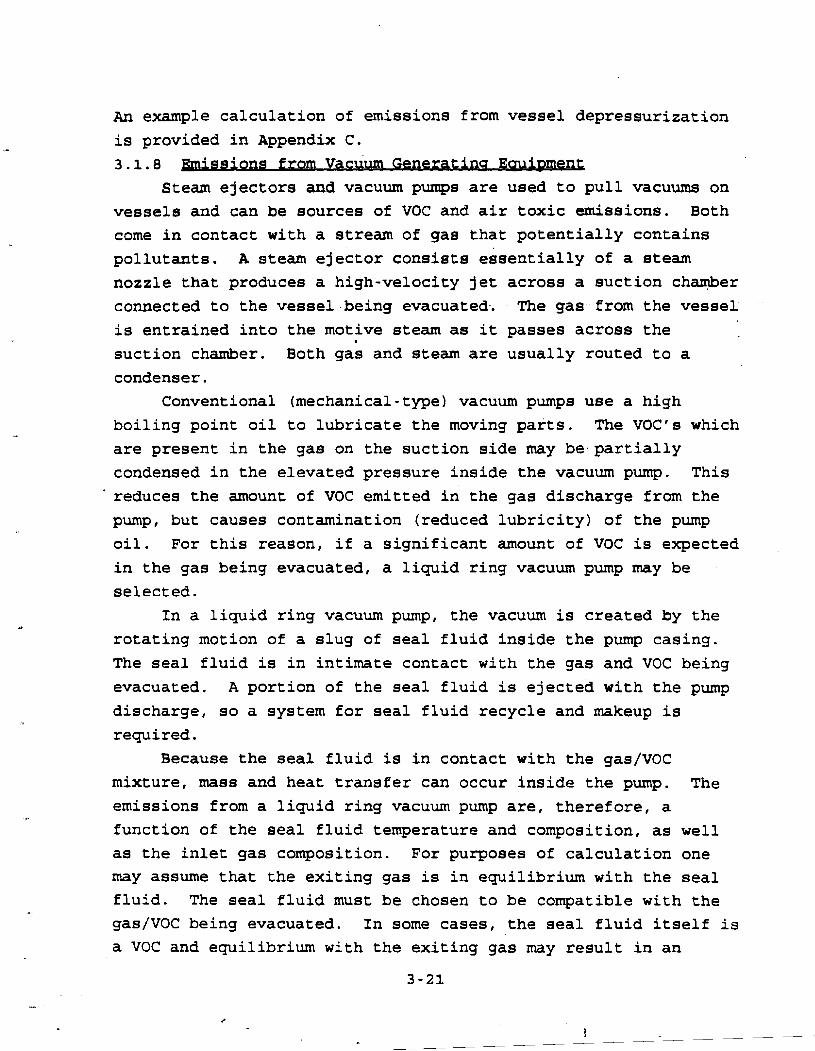
An example calculation of emissions from vessel depressurization
is provided in Appendix C. 3.1.8 8Eautgment,
Steam ejectors and vacuum pumps are used to pull vacuums on
vessels and can be sources of VOC and air toxic emissions. Both come in contact with a stream of gas that potentially contains
pollutants. A steam ejector consists essentially of a steam
nozzle that produces a high-velocity jet across a suction chamber
connected to the vessel being evacuated. The gas from the vessel is entrained into the motive steam as it passes across the
I
suction chamber. Both gas and steam are usually routed to a condenser.
Conventional (mechanical-type) vacuum pumps use a high boiling point oil to lubricate the moving parts. The VOC's which
are present in the gas on the suction side may be.partially condensed in the elevated pressure inside the vacuum pump. This
'reduces the amount of VOC emitted in the gas discharge from the pump, but causes contamination (reduced lubricity) of the pump
oil. For this reason, if a significant amount of VOC is expected in the gas being evacuated, a liquid ring vacuum pump may be selected.
In a liquid ring vacuum pump, the vacuum is created by the
rotating motion of a slug of seal fluid inside the pump casing.
The seal fluid is in intimate contact with the gas and VOC being evacuated. A portion of the seal fluid is ejected with the pump
discharge, so a system for seal fluid recycle and makeup is required.
Because the seal fluid is in contact with the gas/VOC mixture, mass and heat transfer can occur inside the pump. The
emissions from a liquid ring vacuum pump are, therefore, a function of the seal fluid temperature and composition, as well
as the inlet gas composition. For purposes of calculation one may assume that the exiting gas is in equilibrium with the seal fluid. The seal fluid must be chosen to be compatible with the gas/VOC being evacuated. In some cases, the seal fluid itself is
a VOC and equilibrium with the exiting gas may result in an
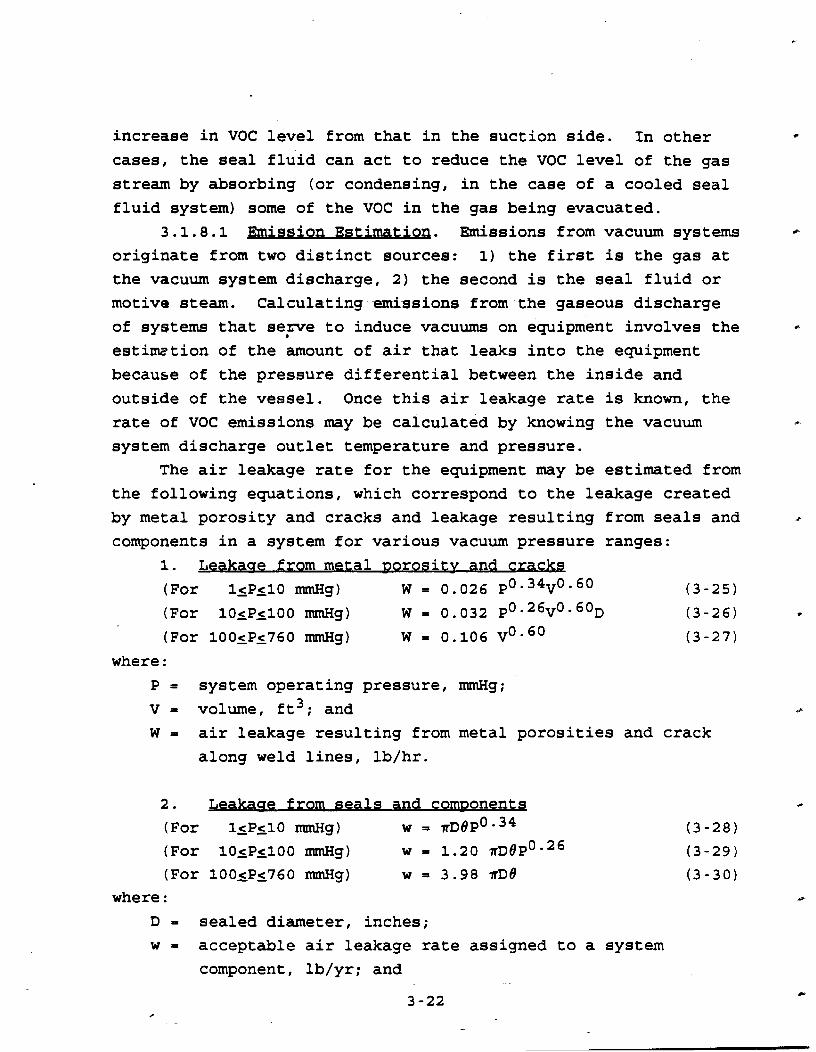
increase in VOC level from that in the suction side. In other
cases, the seal fldd can act to reduce the VOC level of the gas
stream by absorbing (or condensing, in the case of a cooled seal
fluid system) some of the VOC in the gas being evacuated.
3.1.8.1 -on Estimation. Emissions from vacuum systems I*
originate from two distinct sources: 1) the first is the gas at
the vacuum system discharge, 2) the second is the seal fluid or
motive steam. Calculating emissions from the gaseous discharge
of systems that serve to induce vacuums on equipment involves the @
estimtion of the amount of air that leaks into the equipment
because of the pressure differential between the inside and
outside of the vessel. Once this air leakage rate is known, the
rate of VOC emissions may be calculated by knowing the vacuum
system discharge outlet temperature and pressure.
The air leakage rate for the equipment may be estimated from
the following equations, which correspond to the leakage created
by metal porosity and cracks and leakage resulting from seals and t
components in a system for various vacuum pressure ranges:
1. Leakaue from metal ~orositv and cracks
(For lsPslO mmHg) W = 0.026 P 0.34v0. 60 (3-25)
(For lOsPslOO mmHg) w = 0.032 P ~ . ~ ~ v ~ - ~ ~ D(3-26)
(For 100sPs760 mmHg) W = 0.106 voa60 (3-27)
where :
P = system operating pressure, mmHg;
V = volume, ft3; and
W = air leakage resulting from metal porosities and crack
along weld lines, lb/hr.
2. Leakaae from seals and com~onents
(For lsP=lO mmHg) w = ~ D O P ~ . ~ ~
( For 10sPs100 mmHg) w = 1.20 K D O P O . ~ ~
(For 100tPs760 mmHg) w = 3.98 TDO
where :
D = sealed diameter, inches;
w = acceptable air leakage rate assigned to a system

8 = specific leakage rate for components, lb/hr/in
(presented in Table A-5 of Appendix A).
3. The total air leakage rate, in lb/hr, is merely the sum
of the two components W and w. La = W+w (3-31)
Once the air leakage rate is known, the VOC kmission rate,
in lb/hr, may be calculated using the following equation from the
1978 Pharmaceuticals CTG:
La 'systemSe = MWs - ( 29 'system - Pi - 1)
where: Se = rate of VOC emission, in lb/hr;
Psystem - absolute pressure of receiving vessel or ejector outlet conditions, if there is no receiver;
Pi = vapor pressure of the VOC at the receiver
temperature, in ITIRIH~; La = total air leak rate in the system, lb/hr; and 29 = molecular weight of air, lb/lbmole.
An example calculation is provided in Appendix C.
Calculating emissions from seal fluid or motive steam is
analogous to the calculations of VOC emissions from other sources of wastewater, which is discussed below.
3.2 EVAPORATIVE LOSSES FROM WASTEWATER Evaporative losses from wastewater that is contaminated with
VOC1s has been examined in detail, but currently is not within
the scope of this document. Several publications are available to aid the readers in calculating emissions from wastewater treatment systems which include surface impoundments, lagoons, and basin~.~1~1'- 3.3 STORAGE TANK EMISSIONS
In general, emissions of VOC1s from storage tank working and breathing losses appear to be no different for continuous

processes than they are for batch processes. Both types of
losses usually are calculated using EPA-derived storage tank loss
e'quations for three types of storage tanks: fixed roof, external
floating roof, and internal floating roof. Fixed roof and
horizontal pressure tanks appear to be the most common storage
vessels used in batch processing. ~stfmation e&ations for these
tank types and a detailed explanation of their use, may be found
in an EPA reference. 8 m
3 .4 EQUIPMENT LEAKS
The calculation of emissions of VOC1s irom leaking process .
line components such as valves, pump seals, flanges, and sampling
connections is no different for continuous processes than it is
for batch processes. Emissions tend to be less because the
amount of time that components are actually in VOC service is
less for batch processes than it is for continuous processes.
In the event that no other specific data is available
equipment leak emissions may be estimated using the equipment
leak factors derived for the Synthetic Organic Chemical
Manufacturing Industry (SOCMI) . These factors are readily
It is
also possible to develop unit-specific emission estimates
according to an.accepted EPA protocol. The methodology for
developing a specific emission estimate for leaking components is contained in another reference. 10
REFERENCES
McCabe, W., and J. Smith. Unit Operations of Chemical Engineering, Third Edition. 1976.
Ryan, J. L., and S. Croll. Selecting .Vacuum Systems. Chemical Engineering. 88:78. December 14, 1981.
Blakely, P. and G. Orlando. Using Inert Gases for Purging, Blanketing, and Transfer. Chemical Engineering. 91:97-102. May 28, 1984.
EPA-450/2-78-029. Control of Volatile Organic Emissions from Manufacture of Synthesized Pharmaceutical Products. December 1978.
.'available, and are included in Appendix A in Table A-6

5. EPA-450/3-87-026. Hazardous Waste Treatment, Storage, and Disposal Facilities (TSDF) Air Emission Models.
6. Wastewater and Wastes Enabling Document. Version 1.0, July 1992.
7. Industrial Wastewater Volatile Organic Compound Emissions -Background Information for BACT/LAER Determinations.
8. AP-42 Compilation of Air Pollution Emission Factors, Chapter 12.
9. EPA-453/R-93-026, Protocol for Equipment Leak Emission Estimates. June 1993.
10. EPA-450/3-88-010, Protocols for Generating Unit-Specific Emission Estimates for Equipment Leaks of VOC and VHAP. October 1988.

4.0 CONTROL TECHNOLOGIES
This chapter provides information on the types of emission
control technologies currently available and in use on typical batch processes. The discussion is structured so that a general
description of the theory and principles behind the effectiveness of various common control devices is presented first. Second,
information is provided on the suitability of the various technologies for controlling VOC1s from different batch unit
operations, followed by a section discussing gpecific
applications. Appendix D contains cost calculations and
assumptions made in evaluating costs of thermal incineration and
refrigeration systems for batch processing emissions.
Because the emission streams produced by batch unit
operations are often of finite duration and the properties of these streams, such as flow rate, VOC content, temperature, and pressure, often change during the duration of the emission event,
the system chosen for emission control ideally should be capable
of handling both peak flow and nonpeak situations effectively.
To that end, this chapter also addresses the relative importance
of sizing equipment properly. The following control technologies
are discussed: (1) condensers, ( 2 ) scrubbers, ( 3 ) carbon
adsorbers, ( 4 ) thermal incinerators, ( 5 ) vapor containment
systems such as vapor return lines, i.e., "vent-backn lines, and (6) operational practices that reduce emissions, such as reduced nitrogen use for blowing lines, elimination of transfer steps in
product or intermediate handling, and elimination of vessel * opening and purging steps.

4.1 CONDENSERS
Condensers can generally be classified as surface noncontact
and barometric (direct-contact condensers). Surface condensers
are usually shell-and-tube heat exchangers, in which the cooling
fluid flows in tubes and the gas condenses on the outside of the
tubes. Direct-contact condensers are those which allow for
intimate contact between the cooling fluid and the gas, usually
in a spray or packed tower. Although direct-contact condensers 0may also be part of a solvent recovery system, an extra
1,
separation step is usually involved in separating what was the
cooling liquid from the newly formed condensate. An exception to
this situation is the direct-contact condenser, which uses
cooling fluid identical to the desired condensate; in this case,
no separation is necessary.
In principle, condensers work byelowering the temperature of
the gas stream containing condensables to a temperature at which
the desired condensate's vapor pressure is lower than its
entering partial pressure. Typical uses for condensers in batch
processing are on reactors and vacuum-operated devices, such as
distillation columns and dryers. Note that condensers servicing
reactors and distillation columns often function in refluxing 0
material. This refluxing is an integral part of the process, and
therefore these condensers are often not considered to be
emission control devices. Such applications often use secondary
condensers, which operate at still lower temperatures and
function primarily as control devices.
4.1.1 Desiun
The control efficiency attained by a condenser is a function C
of the outlet gas temperature. A typical exhaust gas from a
batch reactor contains a large amount of noncondensable material,
such as air or nitrogen, as well as some fraction of volatile
material. Before this volatile material can condense, the entire L
contents of the gas stream must be cooled to the saturation point
of the condensable material. Heat transferred from the gas
stream during this stage is called sensible heat. Cooling the
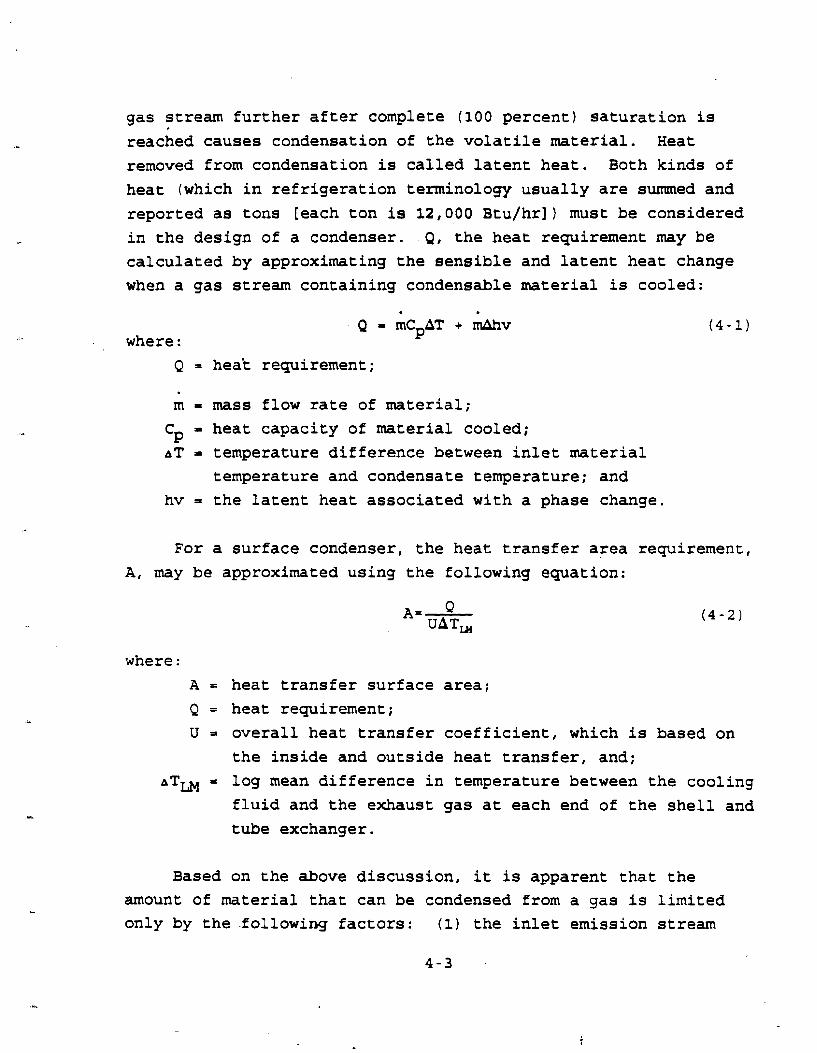
gas stream further after complete (100 percent) saturation is
reached causes condensation of the volatile material. Heat
removed from condensation is called latent heat. Both kinds of
heat (which in refrigeration terminology usually are summed and reported as tons [each ton is 12,000 Btu/hr]) must be considered
in the design of a condenser. Q, the heat requirement may be calculated by approximating the sensible and latent heat change
when a gas stream containing condensable material is cooled:
where:
Q = heat requirement;
m = mass flow rate of material; = heat capacity of material cooled; c~
A T a temperature difference between inlet material temperature and condensate temperature; and
hv = the latent heat associated with a phase change.
For a surface condenser, the heat transfer area requirement,
A, may be approximated using the following equation:
where:
A = heat transfer surface area;
Q = heat requirement; U = overall heat transfer coefficient, which is based on
the inside and outside heat transfer, and; AT* = log mean difference in temperature between the cooling
fluid and the exhaust gas at each end of the shell and
tube exchanger.
Based on the above discussion, it is apparent that the amount of material that can be condensed from a gas is limited only by the.following factors: (1) the inlet emission stream

properties, including heat capacity and temperature, and (2) the Y
heat transfer characteristics of the condenser, including surface
area. By controlling these factors, it follows that nearly any
amount of cooling can be imparted onto a gas stream.
In practice, however, the design of condensers and the
amount of cooling that realistically occurs is based more on
economics. Cooling fluid, for example, can range from water at
ambient temperature t~ brine, which can be cooled to below the
freezing point of pure water, to a low-temperature refrigerant. rn
The colder the cooling liquid required, the more expensive the
system becomes. In some applications, the condensing system is
staged, so that certain condensables that may be present in the
stream, i.e., water, will be condensed out at a higher P
temperature. The remainder of the gas can then be cooled further
to condense out lower-boiling-point materials without the problem
of ice formation and subsequent fouling of the heat-transfer
surface. Note that the more elaborate a condensing system
-becomes, the higher the cost of operating that system.
It has generally been accepted that condensers are most
effective when applied to gases that contain high percentages of
condensables. This is because a large amount of sensible heat
must be removed from a gas stream containing mostly
noncondensable material in order for the stream temperature to
decrease to the saturation temperature of the condensable.
Obviously, the farther from saturation a gas stream is, the more
sensible heat must be removed.
Verification of the expected control efficiency of a
condenser is, especially for single-component systems, easier
than the verification of other control technology efficiencies,
such as carbon adsorption, gas absorption, incineration, etc., as
these technologies require that the outlet gas pollutant concentrations be measured. To verify condenser efficiency, the
outlet gas temperature is the only value that must be known in @.
addition to 'the inlet conditions (including flowrate of
noncondensables). By assuming that the vapor phase of the
C
material is in equilibrium with the liquid at condenser outlet
temperature, the percent by volume VOC discharged from the
condenser may be calculated by dividing its partial pressure by
the total pressure. In any case, if condenser efficiency cannot
be calculated because the inlet gas conditions are not known, it
is at least always possible to calculate the maximum VOC equilibrium concentration of the exit gas at outlet condenser
conditions. Another consideration that must be made when contemplating
the use of a condenser for a particular application is whether
there is an appreciable presence of water vapor in the stream. There are two reasons for concern in this situation. The first, which was touched on in the earlier discussion, is that a surface
condenser cannot effectively function below the freezing point of the water, as ice will fonn and create an insulatory surface on the heat transfer surface, keeping the surface temperature above 32OF. The other consideration, which is more subtle but just as
important to the overall effectiveness of the device, is whether
the water will combine with the condensable material to fonn a low-boiling-point azeotrope. In such a situation, the saturation
temperature of the azeotrope is lower than the condensing
temperature of either pure compound, and the system must be designed accordingly.
4.1.2 Specific -Svstems and Aprslications 4.1.2.1 Reactor Vent Condensers. Several different types
of condenser systems exist in batch processing applications. Probably the most common application is the use of the simple shell-and-tube heat exchanger to control reactor vents. As was
noted in Chapter 2, emissions of VOC's occur from virtually all reactor processing and transfer steps, including charging, reaction, discharging, and cleaning. In many cases, these operations occur while a stream of noncondensable or inert gas is being used as a purge inside the kettle to keep the vapor phase from reaching explosive limits. This purge also takes away from the effectiveness of the condenser as a control device, since the
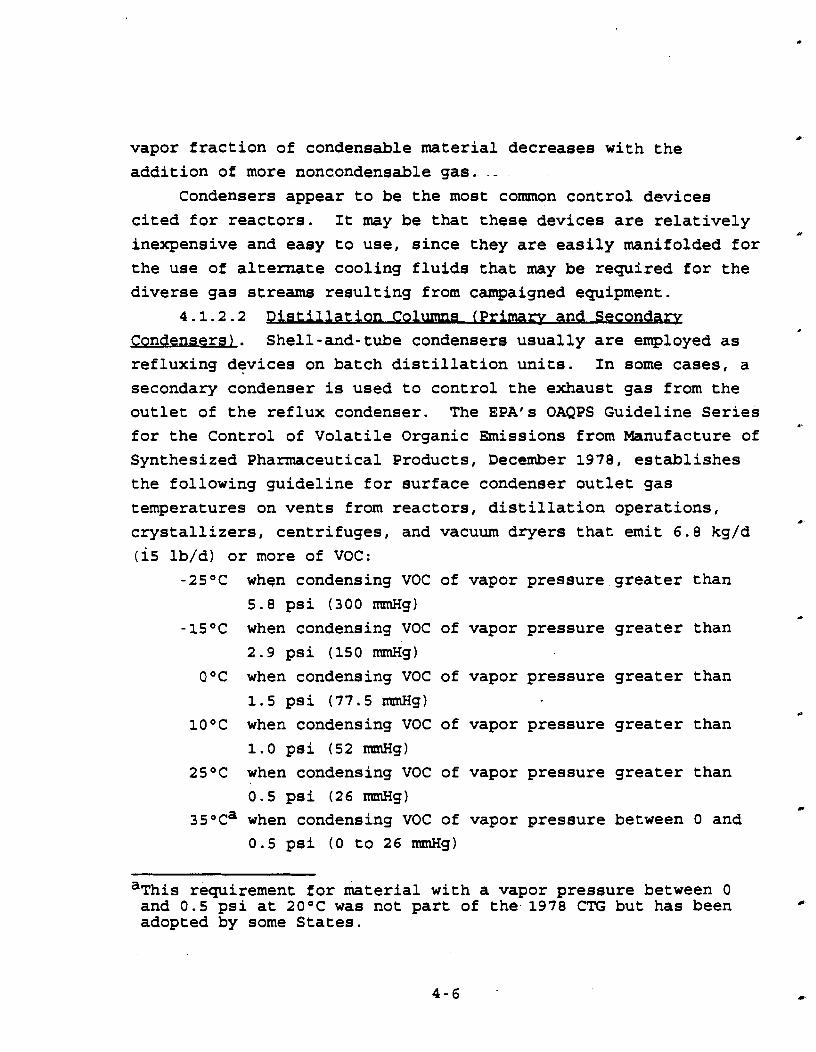
vapor fraction of condensable material decreases with the
addition of more noncondensable gas. - -
Condensers appear to be the most common control devices
cited for reactors. It may be that these devices are relatively #
inexpensive and easy to use, since they are easily manifolded for
the use of alternate cooling fluids that may be required for the
diverse gas streams resulting from campaigned equipment.
4.1.2.2 Dist.illation C o m ( P r i w and S e c o n u
Condensers). Shell-and-tube condensers usually are employed as
refluxing devices on batch distillation units. In some cases, a
secondary condenser is used to control the exhaust gas from the
outlet of the reflux condenser. The EPAfs OAQPS Guideline Series
for the Control of Volatile Organic Emissions from Manufacture of
Synthesized Pharmaceutical Products, December 1978, establishes
the following guideline for surface condenser outlet gas
temperatures on vents from reactors, distillation operations, 1
crystallizers, centrifuges, and vacuum dryers that emit 6.8 kg/d
(15 lb/d) or more of VOC:
-2S°C when condensing VOC of vapor pressure greater than
5.8 psi (300 nanHg)
-lS°C when condensing VOC of vapor pressure greater than
2.9 psi (150 nanHg)
O°C when condensing VOC of vapor pressure greater than
1.5 psi (77.5 nanHg)
10°C when condensing VOC of vapor pressure greater than
1.0 psi (52 rranHg)
2S°C when condensing VOC of vapor pressure greater than
0.5 psi (26 mmHg) C
3 5 0 ~ ~ when condensing VOC of vapor pressure between 0 and
0.5 psi (0 to 26 rranHg)
a ~ h i s requirement for material with a vapor pressure between 0 and 0.5 psi at 20°C was not part of the 1978 CTG but has been -
adopted by some States.
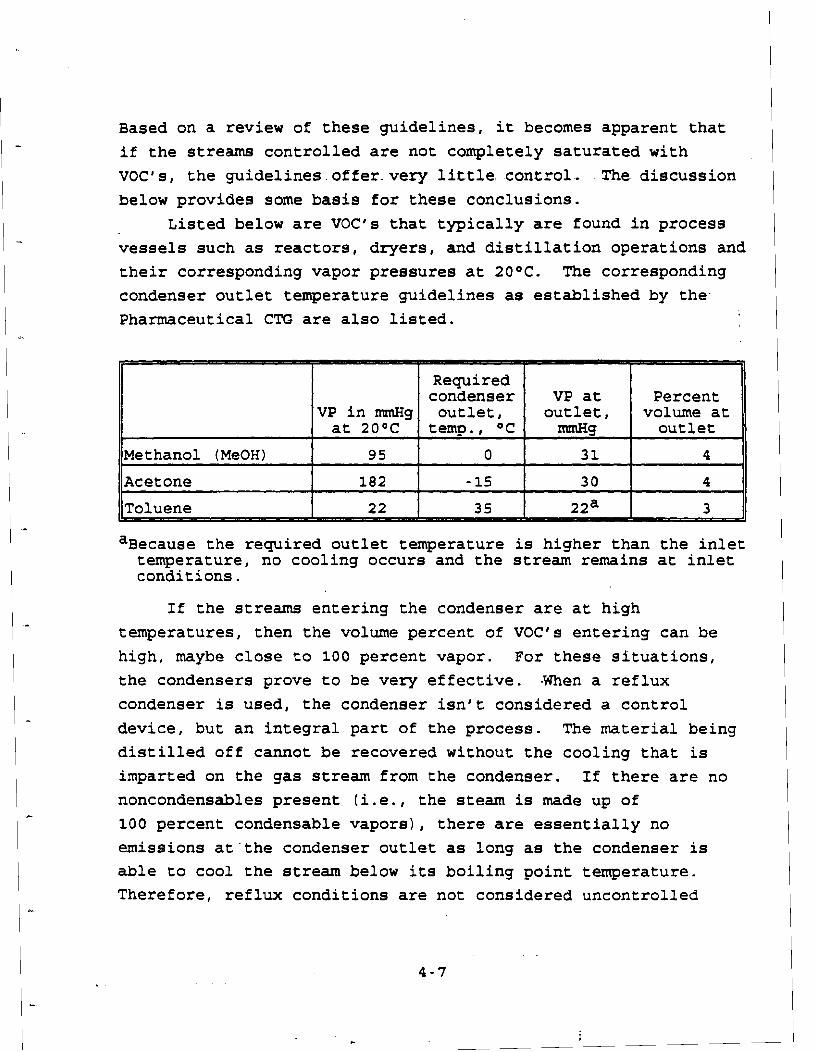
Based on a review of these guidelines, it becomes apparent that
if the streams controlled are not completely saturated with
VOC1s, the guidelines offer-very little control- The discussion
below provides some basis for these conclusions.
Listed below are VOC1s that typically are found in process
vessels such as reactors, dryers, and distillation operations and their corresponding vapor pressures at 2O0C- The corresponding
condenser outlet temperature guidelines as established by the Pharmaceutical CTG are also listed.
Required condenser VP at Percent
VP in xttmHg at 20°C
outlet, temp., OC
outlet, m g
volume at outlet
Methanol (MeOH) 95 0 31 4
Acetone 182 - 15 30 4
agecause the required outlet temperature is higher than the inlet temperature, no cooling occurs and the stream remains at inlet conditions.
If the streams entering the condenser are at high
temperatures, then the volume percent of VOC1s entering can be high, maybe close to 100 percent vapor. For these situations,
the condensers prove to be very effective. -When a reflux
condenser is used, the condenser isn't considered a control
device, but an integral part of the process. The material being
distilled off cannot be recovered without the cooling that is
imparted on the gas stream from the condenser. If there are no noncondensables present (i.e., the steam is made up of
100 percent condensable vapors), there are essentially no
emissions at'the condenser outlet as long as the condenser is able to cool the stream below its boiling point temperature. Therefore, reflux conditions are not considered uncontrolled
emission events. Atmospheric vent streams created by non-steady- #I
state distillation operations, however, are.
During periods of unsteady-state operation, such as startup
of an atmospheric distillation operation, there will be
noncondensables present in the gas stream routed to the
condenser. If distillation occurs under vacuum, then some amount
of noncondensables will be present. This amount can be estimated
by knawing or calculating the leak rate into the system (see
Chapter 3 calculations) . ;\ secondary condenser may be used to control the above-
described emission events. For example, the volume percentage of
a saturated methanol stream exiting a condenser is 95/760; or
12.5 percent by volume at 20°C. Dropping the temperature of this
stream to O°C and thereby reducing the outlet volume percentage
to 4 percent yields a control of approximately 70 percent.
4.1.2.3 Drvers 4.1.2.3.1 Vacuum dryerg. Batch dryer exhaust streams,
especially vacuum dryer exhaust streams, have been reported to be
controlled by condensers installed prior to the vacuum-generating
devices (i. e; , vacuum pumps, steam ejectors) . The condensation
of VOC prior to the vacuum-generating device also reduces the VOC #..
wastewater load since the VOC is removed prior to the point at
which the stream is contacted with the seal water or steam.
The emission stream ~arameters' generally accompanying vacuum
dryers include high concentrations and low flowrates. Over time
the concentration of the emission stream drops off, while the
flowrate usually remains constant.
To illustrate this situation, Figures 4-1 and 4-2 present
typical drying rate curves for batch dryers. Figure 4-1
illustrates the cycle time dependency of the actual solvent
content of the material drying. Figure 4-2 shows how the
emission stream solvent content varies with time.
The curves illustrate that the majority of the solvent is
removed from the material during the early stages of the batch
drying cycle. The corresponding emission rate during these
I

% OF TOTAL SOLVENT
CONTAINED IN FILTER-
CAKE
Figure 4 - 1 . F i l t e r cake drying curve.
PORTION OF THE DRYING CYCLE THAT IS CONTROLLED
EMISSION STREAM
EXHAUST SOLVENT %
Figure 4 - 2 . Dryer emission stream solvent content .
stages is also considerably higher. If a condenser is the device 4.
chosen for VOC control, it must be sized so that it can handle
the peak VOC flow at the beginning of the cycle. Also note that
the point marked VSAT in Figure 4-2 is the point in the cycle
where the condenser is no longer effective. VSAT is the percent Cr
by volume of solvent in the gas stream corresponding to
saturation at the condenser outlet temperature.
4.1.2.3.2 Convective drverg. The use-of simple condensers - -
for achieving high degrees of VOC control from convective dryers 1)
is also infeasible because the exhaust gas stream will have a
higher volume percentage of noncondensable gas.
4.1.2.4 Crvstallizerg. Condensers may be used to control
VOC emissions from crystallizers, especially batch vacuum p.
crystallizers. Such crystallizers employ both surface condensers
and barometric (direct-contact) condensers. Usually, a large
amount of vacuum is necessary to produce crystals at low
temperature. A typical batch vacuum crystallizer vacuum-
generating system is essentially composed of a' three-stage steam
ejector system with an intercondenser (usually a barometric water
condenser) after the first stage. Barometric condensers are used
because they are inexpensive from an operating cost standpoint. @
However, if the material coming off the crystallizer will become
a concern from the wastewater standpoint, the use of a surface
condenser should be considered.
4.1.2.5 Refriueration Svstems for Manifolded Sources.
Shell-and-tube condensers may be used to control VOC emissions
from several combined events. Such applications are usually for
solvent-recovery purposes, since it is often desirable to recover
material that would otherwise be emitted as a VOC. This is C
especially true for industries such as the specialty chemicals
and the pharmaceutical industries that require expensive
feedstocks and solvents.
Vapor recovery systems are often designed so that the
recovered material cost offsets the energy and capital costs of
the systems themselves. In many cases, however, the recouped
recovered material cost is insignificant compared to the cost of
purchasing and operating the recovery systems. In such a case, the decision to install a solvent recovery system as opposed to
another type of system is based on other factors, such as control effectiveness and concerns about waste handling and disposal.
While refrigeration systems are not often used solely to control single vapor displacement events such as reactor charging and extractor (mixer-settler) charging, they are often feasible
for controlling collected displaced vapors from a number of
sources. Some facilities that have a large number of storage tanks,
for example, are known to use staged refrigeration systems that
employ pre-cooler sections. Often, the precooler operates at a temperature just above the freezing point of water. This
condenser (usually an indirect shell-and-tube heat exchanger) rids the vapor stream of as much water as possible that would
otherwise collect on heat transfer surfaces as ice and lower the heat transfer potential of colder surfaces. After the vapor
passes through the initial indirect condenser (pre-cooler), it enters the main condenser section, which can cool the gas stream
to very low temperatures, on the order of -100° to -160°F.
Low-temperature refrigeration systems such as the one
described above are used to control vapor displacement emissions from multiple sources such as working losses frim a tank farm.
Often, the mixtures are separated by distillation although only one or two pure components may be recovered for reuse.
Perhaps the most important issue to consider when evaluating the need for such a system is the required size of the unit. For
the tank farm situation described above or for a number of process vents from one manufacturing area, the system may be most
effective when it can control the stream having the maximum vapor inlet loading at peak flow rate. Minimization of noncondensables in the displacement events is crucial to efficient operation, as
is maintaining a fairly constant vapor loading rate to prevent

cycling of the refrigeration system's compressors. Cycling also
occurs if the system is oversized for the vapor load.
To prevent cycling and to optimize the efficiency of the
system, the displaced vapors or process vents of finite duration
must be staggered or controlled using orifices or flow
controllers so that the system receives a fairly constant vapor
inlet loading. One such system is currently being used by a
large pharmaceutkcal manufacturing complex to control displaced
vapors from a tank farm containing approximately 25 tanks. The a
emission rate of methylene chloride, the predominant stream
component, has reportedly been reduced by more than 99 percent,
from 357 lb/hr to 0.7 lb/hr. 1
4.1.2.6 Combination of Vanor C o m ~ r e s s i o n a t i o n.
In some situations, condensation is aided by compressing the gas
stream containing VOC1s to atmospheric pressure (if the stream is
under vacuum) or to some elevated pressure prior to entering a
condenser. The purpose of this compression step is to condense
out the same amount of material at a higher temperature. For
example, consider the simple calculation used to estimate the
vapor phase mole fraction of the VOC:
A low value of YVOC is desired at ;he outlet of the
condenser. This can be achieved by reducing the numerator value,
'VOC, by lowering the gas temperature, or by increasing the denominator, PTOTALl by increasing the pressure of the system, or
by a combination of both.
Most applications that use a combination vapor compression-
condensation system use liquid ring compressors. These
compressors are available for numerous ranges of flowrates and
discharge pressures. Liquid ring compressor packages that
include ring seal liquid recirculation systems are currently
available and range in capital cost from approximately $75,000
for a system handling a flowrate of 150 scfm and discharging at a
pressure of 40 to 60 psig to over $200,000 for a system handling goo scfm at the same discharge pressure.2 The systems are
usually configured so that the pump comes before the heat
exchanger. However, one pesticide manufacturer uses a high-pressure liquid ring compressor capable of compressing a gas to 100 psig in an application to recover methylene chloride from
a solvent vacuum stripping process, following a heat exchanger that discharges its gases at 4OC. Plant personnel have stated
that prior to installing such a system, the plant was discharging
approximately 2 million lb of methylene chloride to the
atmosphere each year, of which 85 to 90 percent is now
recovered.3
There seem to be a number of applications that could make
use of one form or another of these combination systems. One such application, which is comercially available, is used to
retrofit a pressure (nutsche) filter to convert the filter to a
dryer. This eliminates VOC emissions from associated transfer steps and essentially makes the drying process closed-loop,
eliminating virtually all VOC emissions. This system is described below.
1. pescri~tion. Some pharmaceutical facilities make use of
closed-loop drying systems to eliminate emissions of VOC's from
drying steps.4 ~igure 4-3 presents a typical closed-loop drying system. One such system consists essentially of a high-pressure
liquid ring pump in conjunction with two condensers. The system
is designed to be used to dry a filtered product cake using a
recirculating stream of heated inert gas. The most common application of the system is for recirculating exhaust from
agitated pressure nutsche filters, although the system or some
modification of this system could probably be adapted to use on most dryer exhaust streams and many streams that contain large amounts of noncondensables, such as inert purges.
2. Basic o~eratiog. Exhaust gas from the dryer or filter press is drawn into the liquid ring vacuum pump, which compresses
the gas essentially to atmospheric pressure. The gas contacts

HEATER SECONDARY
HEAT . . . . . ......... . . . . . . . . . . EXCHANGER
DRYER
SEAL FLUID ,0 SEAL i
I ICOOLER /
FLUID
- 1 SEAL FLUID HOLDING TANK
Figure 4-3. Closed-loop drying system.
\ %
the pump seal fluid in the vacuum pump. At this point, the pump
acts as a contact condenser because the pump seal fluid is
chilled. Pump seal fluid and condensed vapors flow into the seal
fluid holding tank, which is kept cold by a ring liquid cooler
positioned above the surface of the liquid in the tank headspace.
The exhausted gases from the pump are also routed across the ring
liquid cooler, which happens to be a noncontact vertical shell- andL-tube heat exchanger. Some vapors may be condensed from the exhaust stream at this point since the temperature of the ring liquid cooler is slightly lower than the temperature of the fluid
in the vacuum pump, especially at the outlet of the pump.
Condensed vapors run down the outside of the tubes and shell walls to the seal liquid tank. The exhaust gas in the shell of the ring liquid cooler is routed to yet another shell-and-tube
heat exchanger, which operates at a lower temperature than the ring liquid cooler. Condensed vapors from this second heat
exchanger are also routed back to the ring liquid holding tank.
The holding tank may be equipped with liquid level sensors and contain an overflow weir to remove excess ring liquid, which can
ultimately be sent to a solvent recovery unit.
3. Ada~tation to drvins svsterng. This type of system may be fitted onto a pressure filter to dry a product cake, thereby
eliminating some emissions that are created from product transfer. In addition, the gas stream used to move or vaporize
volatiles, depending upon whether the drying is accomplished
through conduction or convection (most agitated pressure filters
wiLl be more suitable for convective drying), can be recirculated
so that there are no emissions to the atmosphere. In such a
system, a heater would be added to the system after the exhaust gas cooler to heat the inert stream.
4 . 2 SCRUBBERS
4 . 2 . 1 m a 1
Scrubbers, or gas absorbers, function by providing an
intimate contacting environment for a gas stream containing
material that is soluble in the contacting liquid. The rate of
mass transfer from the gas to the liquid depends upon a driving
force related to the actual VOC concentrations in the gas and
liquid versus the equilibrium-defined VOC concentration in the two media at each point along the contacting path. The most @
common types of scrubbers found in batch processing industries
are packed towers and spray chambers. For dilute concentrations
of VOCts, impingement-plate towers, which disperse the vapor
phase into a large number of tiny bubbles within the liquid phase @
and therefore increase the surface area contact between liquid
and gas phases, are preferred.
Gas absorbers are limited primarily by the solubility in the
liquid stream of the material to be transferred to the liquid a
stream. Most of the scrubbers found in industry use water as the
scrubbing medium, so the effectiveness of these devices depends
largely on the solubility of the VOC's in water. In general,
compounds containing nitrogen or oxygen atoms that are free to
form strong hydrogen bonds and that have one to three carbon
atoms are soluble; those compounds with four or five carbons are
borderline; and those with six carbon atoms or more are
insoluble. Common solvents such as methanol, isopropyl alcohol,
and acetone are very soluble in water. Toluene, on the other
hand, is not. Although a scrubber could be designed to contr~l a
VOC such as toluene, the scrubbing medium would have to be a nonvolatile organic such as mineral oil. Although such systems
- do exist, their cost is relatively high, since it is energy- intensive to recover separate fractions of mineral oil and VOC, and the cost of mineral oil precludes the use of a once-through ~ystern.~Note that one of the considerations associated with the @
use of scrubbers is waste stream disposal and/or treatment.
Since there is usually the transfer of VOC's to the scrubber
effluent stream when a water scrubber is used to control VOC
emissions, regulators should consider the potential for emissions
of VOC from the wastewater collection and treatment system when
evaluating the control device effectiveness. When VOC loading is significant, steam stripping of the wastewater may be a viable
and cost effective control. To estimate emissions and evaluate control effectiveness for wastewater, a recently revised
publication entitled "Control of Volatile Organic Compound
Emissions from - Industrial Wastewater. Draft CTG can be used.
Also existing for control of some pollutants are chemical
scrubbers, which, instead of using a liquid medium to absorb material out of the gas phase, use the liquid medium to react
with material in the gas phase. A good example is an emergency
destruction scrubber for a compound such as phosgene (COC12).
Phosgene, when reacted with slightly basic water, hydrolyzes to
HC1 and C02. Although these product gases still require control,
their toxicity is much less than that of the initial reactant.
Chemical scrubbers are often used as emergency back-up devices.
4.2.2 pesiu~ The design of a scrubber involves the estimation of the
ratio of gas-to-liquid mass flow rates and the appropriate amount
of contacting area necessary to achieve the desired removal. A
necessary piece of information, which can be difficult to obtain
without experimental work, is the equilibrium curve depicting
equilibrium mole fractions of the VOC in the solvent in the vapor
and liquid phases at the contacting temperature. The equilibrium
curve, as the name implies, is not a straight line, but
approximations may be used and the curve may be assumed to be straight in some situations. For water scrubbers, the Henry's
law constant at the water temperature is often used as the slope of the equilibrium curve.
The estimation of the physical properties of a scrubber design, such as the number of transfer units (NOG)and the height of transfer unit (HOG) for a packed tower, may be estimated based
4-17

on the reported removal efficiency of a system and the reported
liquid-to-gas mass velocities. The EPA publication -
EPA-450/3-80-027, Organic Chemical Manufacturing Volume 5:
Adsorption, Condensation, and Absorption Devices, December 1980,
contains the methodology that can be used to estimate such e
parameters.9 Note that verifying the efficiency of a scrubber is
more difficult than verifying the efficiency of condenser since
there are more variables to consider and the equilibrium data for
VOC in'solvent at the required temperature are not always
available. It is perhaps for this reason that unrealistically
high scrubber efficiencies may sometimes be reported. , .
4.2.3 S~ecific Svstems and Ap~licabllltv
Scrubbers often are used in batch processing as secondary
control devices to condensers. Scrubbers may be advantageous to
use on streams that have discontinuous properties such as many of
the emission streams from batch processes since scrubbers in most
cases are not as expensive to operate during off-load times as 0
other control devices. Although the control efficiency would
decrease.with decreasing gas flow rates during off-load times,
the efficiency would pick up again with an increase in gas flow rn
rate back up to the design value. The following paragraph
describes one specific application for the control of the solvent
isopropyl alcohol (IPA) with a water scrubber through convective
drying. I
A feasibility analysis of control devices was conducted on a
dryer exhaust stream containing the solvent IPA. It was
determined that a packed tower water scrubber could achieve at
least 90 percent removal of IPA from the exhaust gas of an pl
atmospheric dryer. Three meters of packing were determined to be
required, and 0.4 m3 of water per minute under peak conditions
was determined to be necessary for a peak exhaust gas flow rate
of 6,000 acfm with a 0.4 percent IPA concentration. 10
4.3 CARBON ADSORPTION
Carbon adsorbers function by capturing material that is
present in a gas phase on the surface of granular activated
carbon. Adsorbers can be of the fixed-bed design or fluidized-
bed design. Fixed-bed adsorbers must be regenerated periodically to desorb the collected organics from the carbon. Fluidized-bed
adsorbers are continuously regenerated. Most batch industries that use carbon adsorbers use the fixed-bed type. Some use .
nonregenerative units, which are contained in 55-gallon drums and
are used mostly for controlling odor from small process vents.
Such units are returned to their distributors for disposal after
they can no longer adsorb effectively.
4.3.1 Desisn Carbon adsorption is usually a batch operation involving two
main steps, adsorption and regeneration. This system usually
includes multiple beds so that at least one bed is adsorbing
while at least one other bed is being regenerated, thereby
ensuring that emissions will be continually controlled. A blower
is commonly used to force the YOC-laden gas stream through the
fixed carbon bed. The cleaned gas is then exhausted to the
atmosphere. A gradual increase in the concentration of organics
in the exhausted gas from its baseline effluent concentration
level signals it is time for regeneration. The bed is shut off
and the waste gas is routed to another bed. Low-pressure steam is normally used to heat the carbon bed during regeneration,
driving off the adsorbed organics, which are usually recovered by
condensing the vapors and separating them from the steam
condensate by decantation or distillation. After regeneration, the carbon bed is cooled and dried to improve adsorption. The
adsorption/regeneration cycle can be repeated numerous times, but
eventually the carbon loses its adsorption activity and must be replaced. Typically, facilities replace a portion of the carbon bed on an annual basis.
The efficiency of an adsorption unit depends on the type of activated carbon used, the characteristics of the VOC, the VOC
concentration, and the system temperature, pressure, and
humidity. Overall VOC- removal efficiencies depend on the
completeness of regeneration, the depth of the carbon bed, the
time allowed for contact, and the effectiveness of recovery of
desorbed organics. Carbon adsorption is not suitable for gas
streams with a high concentration of organics, with organics with
boiling points greater than 250°C or molecular weights greater
than 200, with relative humidities greater than 50 percent, with I"
high levels of entrained solids, or with temperatures over 100°F.
Adsorking organics from gas streams with high concentrations of
organ;cs may result in excessive temperature rise in the bed due
to the accumulated heat of adsorption; this can be a serious C
safety problem. High-molecular-weight organics and organics with
high boiling points are difficult to remove from the carbon under
normal regeneration temperatures. The continuing buildup of
these compounds on the carbon greatly decreases the operating
capacity and results in frequent replacement of the carbon.
Plasticizers or resins should also be prevented from entering the
carbon bed, since they may react chemically on the carbon to form
a solid that'cannot be removed during regeneration. These I
problems can be controlled by the use of a condenser upstream of
the carbon bed to remove the high-boiling-point components or a
carbon bed guard that can be easily replaced on a regular basis.
Entrained solids in the gas stream may cause the carbon bed to
plug over a period of time. These solids are generally
controlled by a cloth or fiberglass filter. Gas streams with
high relative humidities affect the adsorption capacity of the
bed. Humidity control can be achieved.by cooling and condensing the water vapor in the gas stream.. The relative humidity can
also be decreased by adding dry dilution air to the system, but this usually increases the size and thus the cost of the adsorber
required. The adsorption capacity of the carbon and the effluent *
concentration of the adsorber are directly related to the
temperature of the inlet stream to the adsorber. Normally, the
temperature of the inlet stream should be below 100°F or the

adsorption capacity will be affected. Inlet stream coolers are
usually required when emission stream temperatures are in excess
of 100°F.
4.3.2 &Qg&j&&lllty , .
Carbon adsorbers are often used as controls for batch
process operations. At many facilities several VOC sources are ducted to a single adsorber, since most single emission streams
from batch process operations do not warrant the sole use of an adsorber. Emissions from reactor vents, separation operations,
dryers, and storage tanks may be often controlled by carbon bed
adsorbers. In many of these applications, the adsorber is
preceded upstream by a condenser. Since condensers are more
efficient on saturated streams and carbon bed adsorbers are more
efficient on dilute streams, a condenser followed by a carbon bed
adsorber can be an effective control system.
Nonregenerative carbon adsorbers may also be useful for
batch process operations. These systems are extremely simple in design. When the activated carbon becomes spent, it is replaced with a new charge. The spent carbon can be reactivated offsite
and eventually reused. Carbon canisters, normally the size of
55-gallon drums, can be used to control small vent streams (less
than 500 actual cubic feet per minute [acfml cSOO ft3/rnin) with
low organic concentrations. They are commonly used to control
emissions from storage tanks and small reaction vents. One
advantage of these systems is that they are immune to normal
fluctuations in gas streams that are common to batch processes. In fact, most carbon adsorption systems are especially suited for
batch processing, since the beds do not require continuous energy
input (except for a fan to move the gas). When designing and installing carbon bed adsorber systems,
several safety factors need to be considered. Fixed carbon beds can spontaneously combust whenever the gas stream contains oxygen
and compounds easily oxidized in the presence of carbon, such as ketones, aldehydes, and organic acids. Heat generated by adsorption or by oxidation of VOC in the bed is usually
4-21
transported from the bed by convection. If less convection heat
is removed than is generated, the bed temperature will rise.
Higher temperatures will further increase the oxidation
decomposition, and hot spots exceeding the autoignition E
temperature of the carbon may develop in the bed. If an adsorber
is shut down for an extended period and not regenerated
sufficiently upon startup, reintroduction of the VOC-laden stream
may also lead to bed combustion. However, preventive measures &
can be taken to ensure safe operation of carbon adsorbers. Using
adequate cooling systems, regularly inspecting valves to prevent
steam leaks, and using adsorbers only on low-concentration
streams all will ensure safe operation. In addition, beds used.
for adsorbing ketones should not be dried completely after
regeneration. Although not drying them may reduce adsorption
capacity somewhat, it is an effective safety measure because the
water acts as a heat sink to dissipate the heat of adsorption and
oxidation. @
Carbon adsorption systems normally are designed for gas
velocities between 80 and 100 ft/min.ll The maximum rate of
recovery of organics. is dependent upon the amount of carbon
provided and the depth of the bed needed to provide an adequate
transfer zone. The required amount of carbon may be estimated
from an adsorption isothem, which is generally available for
different compounds at various partial pressures.
For all practical purposes, it is difficult to estimate the
efficiency of a carbon adsorption system. EPA has conducted
several studies which show that a control efficiency of
95 percent is achievable for streams containing compounds that
are considered appropriate (see above discussion) for adsorption,
the actual control efficiency attained by a particular system is
largely dependent upon the amount of time elapsed and the amount
of material sorbed since the last regeneration or replacement. 12 *
Note also that it is more difficult to predict the amount of
material that has been sorbed for the intermittent streams with
variable characteristics typical of batch processes than for

continuous emission streams with constant properties. In some situations, the VOC's are sorbed out of the gas streams during
peak loading periods and are reentrained during off-peak periods.
In these situations, there is no net control of VOC by the carbon system. To prevent inadvertent stripping of VOC's during such periods, air flow should be diverted from the adsorber during
periods of time when there are no VOC emissions. As mentioned previously, most applications of carbon
adsorbers follow condensers. Because of the highly flammable nature of many typical solvents, the industry trend is away from
using these devices as primary control devices.
4.4 THERMAL DESTRUCTION
It is usually possible to route process vents to an
incinerator or flare for control. Incineration systems are
usually quite costly and must operate continuously; therefore the
use of such systems is limited to those applications where a number of vents may be controlled. Note also that the byproduct
combustion gases must also be controlled in most cases, thereby
increasing costs.
4.4.1 Flares
Flaring is an open combustion process that destroys VOC emissions with a high-temperature oxidation flame to produce
carbon dioxide and water. Good combustion in a flare is governed by flame temperature, residence time of components in the
combustion zone, and turbulent mixing of components to complete
the oxidation reaction.
4.4.1.1 u.Flare types can be divided into two main
groups: (1) ground flares and (2 elevated flares, which can be further classified according to the method to enhance mixing
within the flare tip (air-assisted, steam-assisted, or nonassisted). The discussion in this chapter focuses on elevated flares, the most common type in the chemical industry. The vent
stream is sent to the flare through the collection header. The vent stream entering the header can vary widely in volumetric flow rate, moisture content, VOC concentration, and heat value.
The knock-out drum removes water or hydrocarbon droplets that
could create problems in the flare combustion zone. Vent streams
are also typically routed through a water seal before yoing to
the flare. This prevents possible flame flashbacks, caused when
the vent stream flow rate to the flare is too low and the flame rF
front pulls down into the stack.13
Purge gas (NZ, C O Z , or natural gas) also helps to prevent
flashback in the flare stack caused by low vent stream flow. The
total volumetric flow to the flame must be carefully controlled #
to prevent low-flow flashback problems and to avoid a detached
flame (a space between the stack and flame with incomplete
combustion) caused by an excessively high flow rate. A gas
barrier or a stack seal is sometimes used just below the flare
head to impede the flow of air into the flare gas network.
The VOC stream enters at the base of the flame where it is
heated by already burning fuel and pilot burners at the flare
tip. Fuel flows into the combustion zone, where the exterior of
the microscopic gas pockets is oxidized. The rate of reaction is
limited by the mixing of the fuel and oxygen from the air. If
the gas pocket has sufficient oxygen and residence time in the
flame zone, it can be completely burned. A diffusion flame
receives its combustion oxygen by diffusion of air into the flame
from the surrounding atmosphere. The high volume of flue gas
flow in a flare requires more combustion air at a faster rate
than simple gas diffusion can supply. Thus, flare designers add
high-velocity steam injection nozzles to increase gas turbulence
in the flame boundary zones, drawing in more combustion air and
improving combustion efficiency. This steam injection promotes
smokeless flare operation by minimizing the cracking reaction that forms carbonaceous spot. Significant disadvantages of steam
use are increased noise and cost. The steam requirement depends
on the composition of the gas flared, the steam velocity from the
injection nozzle, and the tip diameter. Although some gases can
be flared smokelessly without any steam, typically 0.01 to 0.6 kg
of steam per kg of flare gas is required.
Steam injection is usually controlled manually by an
operator who observes the flare (either directly or on a television monitor) and adds steam as required to maintain
smokeless operation. Several flare manufacturers offer devices such as infrared sensors that monitor flame characteristics and
adjust the steam flow rate automatically to maintain smokeless
operation. Some elevated flares use forced air instead of steam to
provide the combustion air and the mixing required for smokeless* operation. These flares consist of two coaxial flow channels.
The combustible gases flow in the center channel and the combustion air (provided by a fan in the bottom of the flare
stack) flows in the annu1;s. The principal advantage of air-
assisted flares is that they can be used where steam is not
available. Air assist is rarely used on large flares because
airflow is difficult to control when the gas flow is
intermittent. About 90.8 hp of blower capacity is required for
each 100 lb/hr of gas flared.14 Ground flares are usually enclosed and have multiple burner
heads that are staged to operate based on the quantity of gas released to the flare. The energy of the gas itself (because of the high nozzle pressure drop) is usually adequate to provide the
mixing necessary for smokeless operation, and air or steam assist
is not required. A fence or other enclosure reduces noise and
light from the flare and provides some wind protection.
Ground flares are less numerous and have less capacity than elevated flares. Typically they are used to burn gas
continuously while steam-assisted elevated flares are used to dispose of large amounts of gas released in emergencies. 15
. *4.4.1.2. )?actors Affectinq Flare Efflclencv.16 Flare combustion efficiency is a function of many factors: (1) heating value of the gas, ( 2 ) density of the gas, ( 3 ) f larcunability of the
gas, (4) auto-ignition temperature of the gas, and (5) mixing at the flare tip.
The flammability limits of the gases flared influence
ignition stability and flame extinction. The flammability limits
are defined as the stoichiometric composition limits (maximum and
minimum) of an oxygen-fuel mixture that will burn indefinitely at
given conditions of temperature and pressure without further
ignition. In other words, gases must be within their
flammability limits to burn. When flammability limits are narrow, the interior of the flame may have insufficient air for
the mixture to burn. Fuels with wide limits of flammability (for
instaxe, H2) are therefore easier to combust.
The auto-ignition temperature of a fuel affects combustion
because gas mixtures must be at high enough temperature and at
the proper mixture strength to bum. A gas with a low auto-
ignition temperature will ignite and burn more easily than a gas
with a high auto-ignition temperature.
The heating value of the fuel also affects the flame
stability, emissions, and flame structure. A lower-heating-value
fuel produces a cooler flame that does not favor combustion
kinetics and also is more easily extinguished. The lower flame
temperature also reduces buoyant forces, which reduces mixing.
The density of the gas flared also affects the structure and
stability of the flame through the effect on buoyancy and mixing.
By design, the velocity in many flares is very low; therefore,
most of the flame structure is developed through buoyant forces
as a result of combustion. Lighter gases therefore tend to burn
better. In addition to burner tip design, the density of the
fuel also affects the minimum purge gas required to prevent
flashback for smokeless flaring.
Poor mixing at the flare tip or poor flare maintenance can
cause smoking (particulate). Fuels with high carbon-to-hydrogen
ratios (greater than 0.35) have a greater tendency to smoke and
require better mixing if they are to be burned smokelessly.
Many flare systems are currently operated in conjunction with baseload gas recovery systems. Such systems are used to
recover VOC from the flare header system for reuse. Recovered
4-26

VOC may be used as a feedstock in other processes or as a fuel in
process heaters, boilers, or other combustion devices. When
baseload gas recovery systems are applied, the flare is generally
used to combuat process upset and emergency gas releases that the
baseload system is not designed to recover. In some cases, the
operation of a-baseload gas recovery system may offer an economic
advantage over operat ion of a flare alone since sufficient
quantities of useable VOC can be recovered. # .4.4.1.3 EPA Flare Speclfxcations. The EPA has established
flare combustion 'efficiency criteria (40 CFR 60.18) which specify
that 98 percent or greater combustion efficiency can be achieved
provided that certain operating conditions are met: .(1) the flare must be operated with no visible emissions and with a flame
present; (2) the net heating value of the flared stream must be
greater than 11.2 MJ/scm (300 Btu/scf) for steam-assisted flares
and 7.45 MJ/scm (200 Btu/scf) for a flare without assist; and
(3) steam-assisted and nonassisted flares must have an exit
velocity less than 18.3 m/sec (60 ft/sec). Steam assisted and
nonassisted flares having an exit velocity greater than
18.3 m/sec (60 ft/sec) but less than 122 m/sec (400 ft/sec) can
achieve 98 percent or greater control if the net heating value of
the gas stream is greater than 37.3 MJ/scm (1,000 Btu/scf). The
allowable exit velocity for air-assisted flares, as well as
steam-assisted and nonassisted flares with an exit velocity less
than 122 m/sec (400 ft/sec) and a net heating value less than
37.3 KJ/scm (1,000 Btu/scf), can be determined by using an
equation in 40 CFR 60.18.
4.4.1.4 m i c . u, . Although flares are not as widely
used for controlling emissions from batsh processes as other
control devices--for example, condensers, adsorbers, and
scrubbers--they are adjustable and can be useful for these
processes. In many cases, however, they require a considerable
amount of auxiliary fuel to combust gases that contain dilute
concentrations of VOC's or VOC's that have low heats of
combustion. Flares are capable of handling the highly variable

flows that are often associated with batch process operations.
Steam-assisted elevated flares may be used to control emissions
from high-concentration, intermittent vent streams. In many . facilities, elevated flares are used to control emissions during
emergency venting or during process upsets, such as startup and
shutdown. These intermittent emissions are characteristic of
normal. batch pfocess operations with the exception that they may
be more concentrated than normal batch emissions. Ground flares
have less capacity than elevated flares and are usually used to
burn gas coqtinuously. They should also be easily accessible to'
batch processes because of the multiple burner head design, which
can be stage-operated based on gas flow. Ground flares can
operate efficiently from 0 to 100 percent of-design capacity.
The burner heads can also be specifically sized and designed for
the materials in the flare gas.
4.4.2 Thermal and Catalvtic Oxidizers
Thermal and catalytic oxidizers may be used to control
emission streams of VOC1s and air toxics, although they are not
especially suited for intermittent or noncontinuous flows.
Because they operate continuously, auxiliary fuel must be used to
maintain combustion during episodes in which the VOC load is
below design conditions. In some situations where VOC loading in
the gas to be controlled is small, the environmental benefits of
using fossil fuel and creating products of combustion in order to
combust VOC1s on an intermittent basis as opposed to releasing
the uncombusted VOC1s must be evaluated by considering the
reduction of VOC compared to costs and production of other
pollutants. . a4.4-.2.1 me- Oxlduer Desian. Any VOC heated to a high
enough temperature in the presence of enough oxygen will be
oxidized to carbon dioxide and water. This is the basic
principle of operation of a thermal incinerator. The theoretical
temperature required for thermal oxidation depends on the
chemical involved. Some chemicals are oxidized at temperatures
much lower than others. However,~a temperature can be identified
that will result in the efficient destruction of' most VOC's. All practical thermal incineration processes are influenced by
residence time, mixing, and temperature. An efficient thermal incinerator system must provide:
1. A chamber temperature high enough to enable the
oxidation reaction to proceed rapidly to completion; 2. Enough turbulence to obtain good mixing between the hot
combustion products from the burner, combustion air, and VOC; and 3. Sufficient residence time at the chosen temperature for .
the oxidation reaction to reach completion. A thermal incinerator is usually a refractory-lined chamber
containing a burner (or set of burners) at one end. Discrete dual fuel burners and inlets for the offgas and combustion air are arranged in a premixing chamber to thoroughly mix the hot
products from the burners with the process vent streams. The mixture of hot reacting gases then passes into the main
combustion chamber. This chamber is sized to allow the mixture
enough time at the elevated temperature for the oxidation
reaction to reach completion (residence times of 0.3 to 1.0 second are common). Energy can then be recovered from the
hot flue gases in a heat recovery section. Preheating combustion air or offgas is a common mode of energy recovery; however, it is sometimes more economical to generate steam. Insurance
regulations require that if the waste stream is preheated, the VOC concentration must be maintained below 25 percent of the lower explosive limit to remove explosion hazards.
Thermal incinerators designed specifically for VOC
incineration with natural gas as the auxiliary fuel may also use
a grid-type (distributed) gas burner. l7 The tiny gas flame jets on the grid surface ignite the vapors as they pass through the grid. The grid acts as a baffle for mixing the gases entering the chamber. This arrangement ensures burning of all vapors at lower chamber temperature and uses less fuel. This system makes
possible a shorter reaction chamber yet maintains high efficiency.

A thermal incinerator, handling vent streams with varying
heating values and moisture content, requires careful adjustment
to maintain the proper chamber temperatures and operating
efficiency. Since water requires a great deal of heat to
vaporize, entrained water droplets in an offgas stream can
increase auxiliary fuel requirements to provide the additional
energy needed to vaporize the water and raise it to the
combustion chamber temperature. Combustion devices are always
onerated with some quantity of excess air to ensure a sufficient
supply of oxygen. The amount of excess air used varies with the
fuel and burner type but should be kept as low as possible.
Using too much excess air wastes fuel because the additional air
must be heated to the combustion chamber temperature. Large
amounts of excess air also increase fuel gas volume and may
increase the size and cost of the system. Packaged, single-unit
thermal incinerators can be built to control streams with flow
rates in the range of 0.14 scm/sec (300 scfm) to about 24 scm/sec
(50,000 scfm) . Thermal oxidizers for halogenated VOC1s may require
additional control equipment to remove the corrosive combustion
products. The halogenated VOC streams are usually scrubbed to
prevent corrosion due to contact with acid gases formed during
the combustion of these streams. The flue gases are quenched to
lower their temperature and are then routed through absorption
equipment such as packed towers or liquid jet scrubbers to remove
the corrosive gases. . .4.4.2.2 Thermal Incinerator Efflclencv. The VOC
destruction efficiency of a thermal oxidizer can be affected by
variations in chamber temperature, residence time, inlet VOC
concentration, compound type, and flow regime (mixing). Test
results show that thermal oxidizers can achieve 98 percent
destruction efficiency for most VOC compounds at combustion
chamber temperatures ranging from 700 to 1300°C (1,300° to
2370°F) and residence times of 0.5 to 1.5 seconds. l8 These data indicate that significant variations in destruction efficiency
occurred for C1 to C5 alkanes and olefins, aromatics (benzene,
toluene, and xylene), oxygenated compounds (methyl ethyl ketone and isopropanol) , chlorinated organics (vinyl chloride), and nitrogen-containing species (acrylonitrile and ethylamines) at
chamber temperatures below 760°C (1400°F). This infomation,
used in conjunction with kinetics calculations, indicates the
combustion chamber parameters for achieving at least a 98 percent
VOC destruction efficiency are a combustion temperature of 870°. (1600°F) and a residence time of 0.75*'sec (based upon residence : in the chamber volume at combustion temperature). A themal
oxidizer designed to produce these conditions in the combustion chamber should be capable of high destruction efficiency for
almost any nonhalogenated VOC. At temperatures over 760°C (1400°F), the oxidation reaction
rates are much faster than the rate of gas diffusion mixing. The destruction efficiency of the VOC then becomes dependent upon the
fluid mechanics within the oxidation chamber. The flow regime
must ensure rapid, thorough mixing of the VOC stream, combustion
air, and hot combustion products from the burner. This enables the VOC to attain the combustion temperature in the presence of
enough oxygen for sufficient time so the oxidation reaction can reach completion.
Based upon studies of thermal oxidizer efficiency, it has been concluded that 98 percent VOC destruction or a 20 p p m
compound exit concentration is achievable by all new
incinerators. The maximum achievable VOC destruction efficiency
decreases with decreasing inlet concentration because of the much slower combustion reaction rates at lower inlet VOC
concentrations. Therefore, a VOC weight percentage reduction based on the mass rate of VOC exiting the control device versus the mass rate of VOC entering the device would be appropriate for vent streams with VOC concentrations above approximately 2,000 ppmv (corresponding to 1,000 ppmv VOC in the incinerator inlet stream since air dilution is typically 1:l). For vent streams with VOC concentrations below approximately 2,000 ppm,
it has been determined that an incinerator outlet concentration
of 20 ppmv (by compound), or lower, is achievable by all new
thermal oxidizers. The 98 percent efficiency estimate is -predicted on thermal incinerators operated at 870°C (1600°F) with
0.75 sec residence time. I .4.4.2.3 -tic O m e r Desiqn . Catalytic oxidation is
also a major combustion technique examined for VOC emission
control. A catalyst increases the rate of chemical reaction
without becoming permanently altered itself. Catalysts for
catalytic oxidation cause thee oxidizing reaction to proceed at a
lower temperature than is required for thermal oxidation. These
units can also operate well at VOC concentrations below the lower
explosive limit, which is a distinct advantage for some process
vent streams. Combustion catalysts include platinum and platinum
alloys, copper oxide, chromium, and cobalt .20 These are
deposited in thin layers on inert substrates to provide for
maximum surface area between the catalyst and the VOC stream.
The substrate may be either pelletized or cast in a rigid
honeycomb matrix.
The waste gas is introduced into a mixing chamber, where it
is heated to about 316°C (600°F) by contact with the hot
combustion products from auxiliary burners. The heated mixture
is then passed through the catalyst bed. Oxygen and VOC migrate
to the catalyst surface by gas diffusion and are adsorbed in the
pores of the catalyst. The oxidation reaction takes place at
these active sites. Reaction products are desorbed from the
active sites and transferred by diffusion back into the waste
gas.21 The combusted gas may then be passed through a waste heat
recovery device before exhausting into the atmosphere.
The operating temperatures of combustion catalysts usually
range from 316O to 650°C (600° to 1200°F). Lower temperatures
may slow down and possibly stop the oxidation reaction. Higher
temperatures may result in shortened catalyst life and possible
evaporation or melting of the catalyst from the support
substrate. Any accumulation of particulate matter, condensed
VOC, or polymerized hydrocarbons on the catalyst could block the
active sites and, therefore, reduce effectiveness. Catalysts can
also be deactivated by compounds containing sulfur, bismuth, phosphorus, arsenic, antimony, mercury, lead, zinc, tin, or
halogens.22 If these compounds exist in the catalytic unit, VOC
will pass through unreacted or be partially oxidized to form compounds such as aldehydes, ketones, and organic acids.
a .4.4.2.4 -tic Oxldlzer Control Rfficiencv. Catalytic
oxidizer destruction efficiency is dependent on the space velocity (the catalyst volume required per unit volume gas processed pet hour), operating temperature, oxygen concentration, and waste gas VOC composition and concentration. A catalytic
unit operating at about 450°C (840°F) with a catalyst bed volume of 0.014 to 0.057 m3 (0.5 to 2 ft3) per 0.47 scm/sec (1,000 scfm) of vent stream passing through the device can achieve 95 percent VOC destruction efficiency. However, catalytic oxidizers have
been reported to achieve efficiency of 98 percent or greater. 23 These higher efficiencies are usually obtained by increasing the
catalyst bed volume-to-vent stream flow ratio. , I4.4.2.5 Egglicabllltv of Thermal and Catalvtic Oxidizers.
Incinerators often are used to control multiple process vents that can be manifolded together. For example, processes that are contained within one building or processing area are sometimes tied together and routed to an incinerator. For some of these vents, a primary control device such as a condenser is located
upstream. Note that the stack gases resulting from combustion
often contain acid such as HC1 and may require an exhaust gas control device such as a caustic scrubber.
There are also some incineration units that can handle low flow rates (in the range of 10 to 500 scfm) . These units can be applied to single emission streams, such as reactor vent emissions. The presumably high destruction efficiency obtained for VOC's and air toxics using these devices makes their application attractive for very toxic substances. 24
4 . 5 SOURCE REDUCTION MEASURES
4 . 5 . 1 VaDor C v
Probably one of the less expensive and more effective
methods of controlling displaced vapors from such events as
vessel charging and from storage tank working losses is to use
vapor return lines to vent the vapors back to the vessel from which the liquid was originally taken. Essentially 100 percent
control of the vapors at the point source is achieved, -and there.
do not appear to be many adverse effects from the standpoint of
safety or convenience. However, the vessel which receiyes.the
Went backn must also be controlled. Some facilities use vessels
with flexible volumes, such as balloons, or traditional gas
holders with self-adjusting diaphragms to contain vapors prior to
a control device. Probably the biggest problem relative to batch
processing is that there are many different possibilities at any
given time for equipment configuration, and therefore a manifold-
type system for venting back vapors to the appropriate vessels
would have to be installed. . a .
4 . 5 . 2 Llmltlna the Use of Inert Gag
Obviously, many applications in batch processing require the
use of inert gas for blanketing and purging of equipment for
safety purposes. Oftentimes, the distribution of the nitrogen is
affected through continuous purging of equipment. While purging
achieves the inert atmosphere desired, it is also a source of
emissions because volatile compounds are stripped off and emitted
along the same discharge pathway as the nitrogen exhaust stream.
Limiting emissions from nitrogen purging is achieved by reducing
the amount of nitrogen that is purged. An inert atmosphere can
also be created by establishing, through a series of pressure
transducers and distribution valves, a constant nitrogen,
positive pressure However, processing equipment that
does not have the possibility of remaining airtight cannot be
blanketed in this manner. The older style basket centrifuges
requiring inertion during the separation of solid cake, for
example, cannot be blanket-inerted. Therefore, it follows that
limiting the distribution of nitrogen to constant positive pressure blanketing operations may require not only capital expenditures for the distribution system elements. (i-e., the pressure transducers and distribution valves), but perhaps the
replacement of some equipment. There are other practices, however, such as the blowing of
lines to move material and the sparging of large volumes of liquids that could be changed so as to reduce the amount of inert gases in the streams and thereby make the streams more suitable for control by devices such as condensers.
The blowing of lines with nitrogen to move material, for example, could be replaced by simple pumping and/or setting the
lines on an incline. Blowing cannot be totally eliminated, however, because the vapor that may be contained in the vapor space in the lines may need to be purged at various times before
maintenance. Also, a recently developed technology for in-line stripping
could conceivably replace the use of large volumes of inert gas
used for sparging. Control of emissions from sparging, as is
shown in Chapter 5 , appears to be difficult because of the dilute volumes of VOC in the exhaust sparge gas. An in-line stripping system that is installed directly into process piping creates a large number of very tiny nitrogen bubbles, which results in
maximum gas-liquid interface. One such system tested at a plant
reduced the amount of nitrogen used for sparging from 38,400 to
1,150 scfm and was considerably more efficient An added benefit of limiting the amount of nitrogen that is
used in inerting processing equipment is that the volumetric flowrates of the exhausts will be diminished, and therefore VOC
concentrations in the exhausts will be less dilute and may therefore be more cost effective to control or recover using add- on controls.
4 . 5 . 3 JJRe of Closed Proceana E-The retrofitting or replacement of older equipment with new
airtight equipment not only helpful to nitrogen blanketing applications, but perhaps more importantly, to the processing of material in entirely closed systems where the possibility of creating emissions is eliminated altogether. Batch processing appears to be gravitating to processing equipment that is versatile and therefore allows for numerous conventional unit operations such mixing, reaction, filtration, and be conducted in the same vessel. Transfer losses, which can be very signif i;ant, are virtually eliminated, as are some cleaning operations that would otherwise be required in between processing
26runs. 4 . 5 . 4 Material Subwtitution/I~roved Se~aration T a i q u e s
One of the more significant areas of material substitution in the batch manufacturing industry is the potential substitution of organic solvents with aqueous solvents, aqueous solvents with internally contained organic micelles, or supercritical fluids. Still in developmental stages, the use of aqueous polymeric systems having an internal micelle structure for hydrocarbons would allow for reactions to occur within the polymer micelles. Currently, the major problemwith these polymers is that their solubility in water is still too low to be of any practical utility.27
The.possibility of using supercritical fluids (SCF) in extraction and separation applications is becoming more of a reality. Supercritical fluids have been shown to be of utility in separation of organic-water solutions, petroleum fractions, and activated carbon regeneration. Additionally, a large body of experimental data has been accumulated on the solubility and extractability of natural products such as steroids, alkaloids, anticancer agents, oils from seeds, and caffeine from coffee beans in various supercritical fluids such as C02, ethane, ethylene, and N20. Currently, C02 is the most widely investigated SCF in these applications.
- -
4.5.5 Jmproved Process nesiqn
The elimination of intermediate isolation steps, if
possible, can be a significant source of emissions reduction
because filtration and drying steps are eliminated. It is also
likely that some equipment cleaning steps can be eliminated
without negative effects. REFERENCES FOR CHAPTER 4
Shine, B., MRI. Site Visit Report to UpJohn, Kalamazoo, Michigan. March 30, 1990.
Letter from Hawkins, B., Nash Engineering Company, to B. Shine, MRI. April 2, 1991. Summary of operating data and budget costs for compressor system&.
Telecon. B. Shine, MRI, to D. McKenzie, Union Carbide, Woodbine, Georgia. Discussion of vapor recompression system in use at the Woodbine plant. January 5 , 1990.
Reference 1.
Li, Ramon, and M. Karell. Technical, Economic, and Regulatory Evaluation of Tray Dryer Solvent Emission Control Alternatives. Environmental Progress. e ( 2 ) : 73-78. May 1990.
Solomons, T. W. Graham. Organic Chemistry, 2nd Edition. New York, John Wiley and Sons. 1976, 1978, 1980. p. 80.
Reference 3.
Control of Volatile Organic Compound Emissions from Industrial Wastewater. Draft CTG. September, 1992.
Organic Chemical Manufacturing, Volume 5 : Adsorption, Condensation, and Absorption Devices. Publication No. EPA-450/3-80-027. December 1980.
Reference 5.
VIC Manufacturing Company. Carbon Adsorption/Emission Control Benefits and Limitations.
Carbon Adsorption for Control of VOC Emissions. Radian Corporation. June 6, 1988.
*Organic Chemical Manufacturing Volume 4: Combustion Control Devices. Report 4. U. S. Environmental Protection Agency, OAQPS. Publication No. EPA-450/3-80-026. December 1980.

14. Klett, M. G., and J. B. Galeski. (Lockheed Missiles and Space Company, Inc.) Flare Systems Study. Prepared for U. S. Environmental Protection Agency. Huntsville, Alabama. Publication No. EPA-600/2-76-079. March 1976.
15. Evaluation of the Efficiency of Industrial Flares: Background-Experimental Design-Facility. U. S. Environmental Protection Agency, OAQPS. Research Triangle Park, North Carolina. Publication No. EPA-600/2-83-070. August 1983.
16. Reference 13.
17. Reed, R. J. North American Combustion Handbook. North American Manufacturing Company. Cleveland, Ohio. 1979.
18. Aemo and attachments from Farmer, J. R., EPA:ESD, to distribution. August 22, 1980. 29 p. Thermal incinerator performance for NSPS.
19. Reference 12.
20. Reference 13, Report 3.
21. Control Techniques for Volatile Organic Emissions from Stationary Sources. U. S. Environmental Protection Agency. Office of Air and Waste Management. Research Triangle Park, North Carolina. EPA Publication No. EPA-450/2-78-002. May 1978. p. 32.
22. Kenson, R. E. Control of Volatile Organic Emissions. MetPro Corp., Systems Division. Bulletin 1015. Harleysville, Pennsylvania.
23. Reference 13, Report 3.
24. Letter from Bedoya, J.G., In-Process Technology, Inc. to B. Shine, MRI. March 28, 1991. Summary of cost and cost- effectiveness for small incineration units. March 28, 1991.
25. Processor Cuts Costs and Nitrogen Usage With In-Line Stripping System. Chemical Processing. March 1990.
26. Pipeless Plants Boost Batch Processing. Chemical Engineering. June 1993.
27. ERRC Update. Progress in the Emission Reduction Research Center. August 15, 1993.

5.0 ENERGY AND ENVIRONMENTAL IMPACTS
The energy and environmental impacts associated with
applying various control options to VOC emissions from batch
processes are presented in this chapter. The options are
described in detail in Chapter 6.
The environmental impacts analysis considers the national
energy burden of operating the control devices used to meet
various options, as well as the national estimate of NO, produced
from the incineration of selected model process emission streams
and from the generation of electricity. Solid waste and
wastewater impacts were not evaluated because the effects
resulting from the operation of these control devices are
considered negligible.
5.1 ENERGY IMPACTS
Table 5-1 presents the national estimate of energy usage for
each of the options described in Chapter 6. The energy burden
was calculated by estimating the amount of fuel and electricity
required to operate the thermal incinerator and the electricity
requirement for the refrigerated condenser systems for the
applicable model streams. Approximately 10 percent of the total
energy burden shorn for each of the options in the table is
related to the condenser systems. The remainder is associated
with the natural gas requirements of the thermal incinerator.
Energy usage for model streams and plants was extrapolated to a
nationwide estimate by considering the number of facilities in
the batch industries covered by this document. Note that there
is no discernable difference in energy between the 98 percent and
95 percent options. This effect occurs because the thermal

I
TABLE 5-1. ENERGY AND ENVIRONMENTAL IMPACTS
I I Nationwide Uncontroll I Baseline I emission
U1 8Emiasioar of NO, us from inciicdor exhaust d from power plurtr used to g e n e cbe electrical power N frrclion of the magy kudca.
~ -b ~ emisaiaa facton: a Incinerrton: 200 ppm NO, in exhaust for s l n u ~ containing nitro- compounds, d 2 1.5 ppm NO, in d l othetrtrc.uM(buadm(sbd.1.).
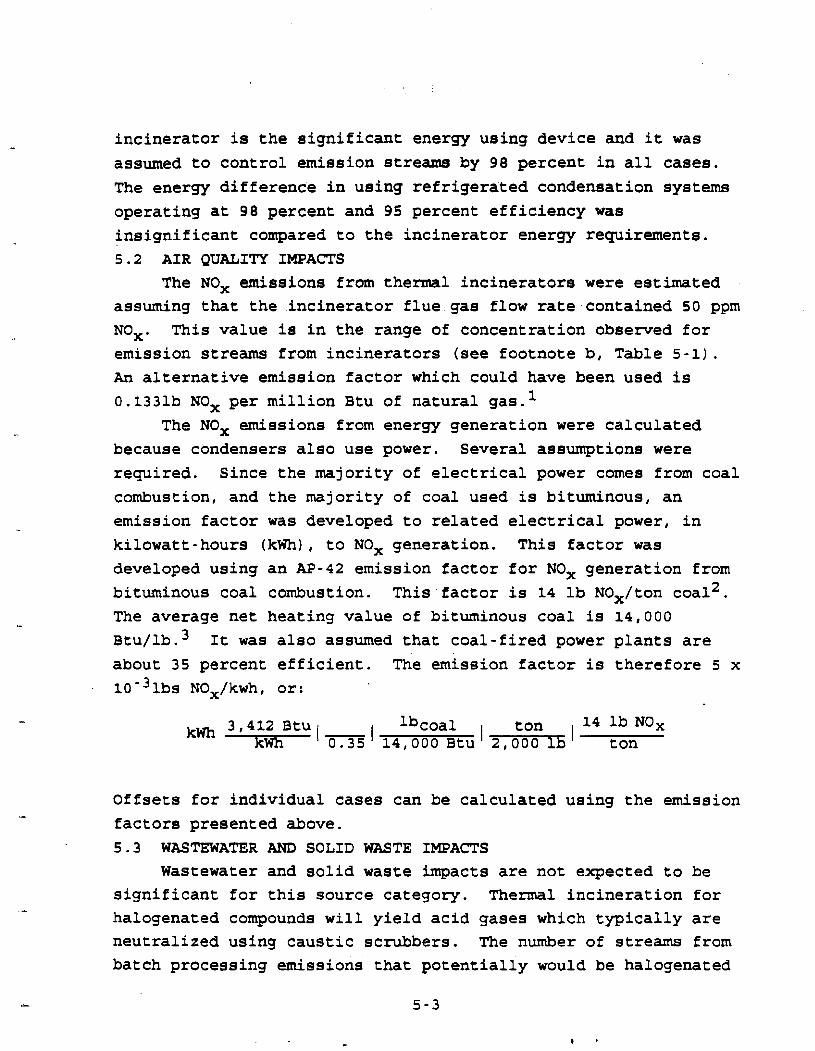
incinerator is the significant energy using device and it was
assumed to control emission stream by 98 percent in all cases.
The energy difference in using refrigerated condensation systems
operating at 98 percent and 95 percent efficiency was
insignificant compared to the incinerator energy requirements.
5.2 AIR QUALITY IMPACTS
The NO, emissions from thermal incinerators were estimated
assuming that the incinerator flue gas flow rate contained 50 ppm NO,. This value is in the range of concentration observed for
emission streams from incinerators (see footnote b, Table 5-1). An alternative emission factor which could have been used is
0.1331b NO, per million Btu of natural gas. 1
The NO, emissions from energy generation were calculated
because condensers also use power. Several assumptions were required. Since the majority of electrical power comes from coal
combustion. and the majority of coal used is bituminous, an
emission factor was developed to related electrical power, in
kilowatt-hours (kwh), to NO, generation. This factor was developed using an AP-42 emission factor for NO, generation from
bituminous coal combustion. This.factor is 14 lb NO,/ton coal2.
The average net heating value of bituminous coal is 14,000
~tu/lb.~It was also assumed that coal-fired power plants are
about 35 percent efficient. The emission factor is therefore 5 x
1oa31bs NOx/kuh. or:
3,412 Btu lbcoa1 I ton kwh kwh In1 ton14.000 Btu 2,000 ibl l4 lb
Offsets for individual cases can be calculated using the emission
factors presented above. 5 . 3 WASTEWATER AND SOLID WASTE IMeACTS
Wastewater and solid waste impacts are not expected to be significant for this source category. Thermal incineration for
halogenated compounds will yield acid gases which typically are neutralized using caustic scrubbers. The number of streams from
batch processing emissions that potentially would be halogenated

and incinerated was not estimated, however. For refrigeration
systems, wastewater could be generated from humid waste gas
streams, but this quantity also is not expected to be
significant.
REFERENCES FOR CHAPTER 5.0
U. S. Environmental Protection Agency. Compilation of Air Pollutant Emission Factors (AP-42). Fourth Edition. September 1991. p. 1.4-2.
Reference 1. September 1988. p. 1.1-2.
Air andd' Waste Management Association. 1992. p. 209. Air Pollution Engineering Manual. 1992. p. 209.
6.0 DESCRIPTION OF CONTROL OPTIONS
6.1 TECHNICAL BASIS FOR CONTROL OPTIONS
6.1.1 ADDroach The methodology used in developing control options is based
on an evaluation of the technical feasibility and costs of
controlling any vent stream that could be emitted to the
atmosphere from a batch process. In order to be able to apply
the options and-to defend the rationale that was used to develop
the options for a wide variety of stream characteristics, factors
such as cost effectiveness and control device applicability were
examined for all potential variations in duration of emission
events and emission stream characteristics of flow rate and VOC
concentration. This section presents a discussion of batch
processing emissions and describes the methodology for developing
the options. . ,6.1.1.1 Batch P r o c e s s ~ s s l o nStremacterj&icg.
In general, there are two qualities that differentiate batch
processing emissions from those of sources operating
continuously. First, batch emission stream characteristics
(e.g., flow rate, concentration, temperature, etc.) are never
constant. Second, the emissions are released on an intermittent
basis. To illustrate these ideas, consider the batch process
shown in Figure 6-1. Emissions of VOC's will occur from this
process from start to finish in the order that the bulk flow of
material and energy occurs. For example, the process begins with
the charging of a VOC material from storage into the weigh tanks.
A displacement of air from the weigh tanks occurs at this point
as a result of being pushed out by the incoming volume of
material. Through vaporization of the VOC liquid across the
liquid-air interface, this air contains some amount of VOC and
thus constitutes an emission event. The event is short-lived,
however, lasting only the time of the charge; the concentration
of VOC's in the displaced flow rate will increase to a point
close to saturation by the time the last of the displaced air
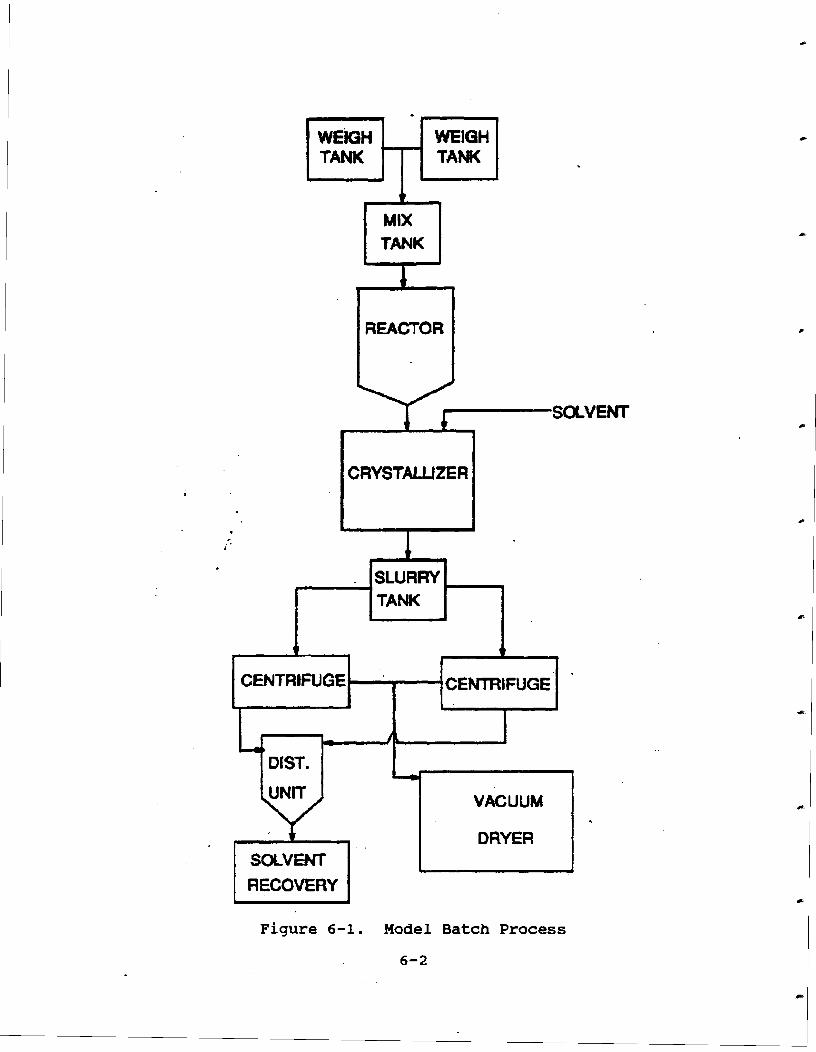
J C
WEIGH WEIGH TANK TANK
i -t #
MIX TANK .h
I
DIST.s VACUUM
DRYER
Figure 6-1. Model Batch Process
6-2
leaves the charge tank. As the material moves from the weigh
tanks to the reactor, another displacement occurs that
contributes to emissions of VOCrs. This emission event is very
similar to the event created by filling the weigh tank.
Similarly, as the material flows through the process, each piece
of equipment becomes a contributor to VOC emissions through a
distinct series of finite emission events. In some equipment,
such as the reactor, more than one type of emission event occurs;
for example, an event results from charging, heatup, and kettle
purging from this piece of equipment.
In the example process shown in Figure 6-1, consider the
movement of a highly volatile solvent such as diethyl ether
through the process; the emission events that occur as a result
of air displacement have concentrations of VOC's in excess of
50 percent by volume. For the reactor purging event, however,
the concentration of VOC drops as the emission stream is diluted
by high flows of inert gas into and out of the kettle. The
largest source of uncontrolled emissions in this process is the
vacuum dryer, whose emission stream is characterized by an
decrease in VOC concentration and a somewhat steady flow rate
over the course of its drying cycle.
Figures 6-2 and 6-3 present the fluctuations in flow rate
and concentration, respectively, that will occur during the batch
cycle. The result of combining the flow rate and concentration
profiles is presented in Figure.6-4, the emissions profile. In
order to give a more vivid illustration of how flow rate,
concentration, and emissions vary in such a batch process,
Figures 6-2, 6-3, and 6-4 have all been placed on the same page,
resulting in Figure 6-5. Note that the time scale for all these
figures is the same. Close inspection of Figure 6-5 reveals that
the concentration and flow rate characteristic of the process
vents vary independently from each other; although there appears
to be a slight trend for the concentration to change inversely with flow rate.
The reason for presenting these profiles is to introduce the
idea that the variable emission stream characteristics of batch

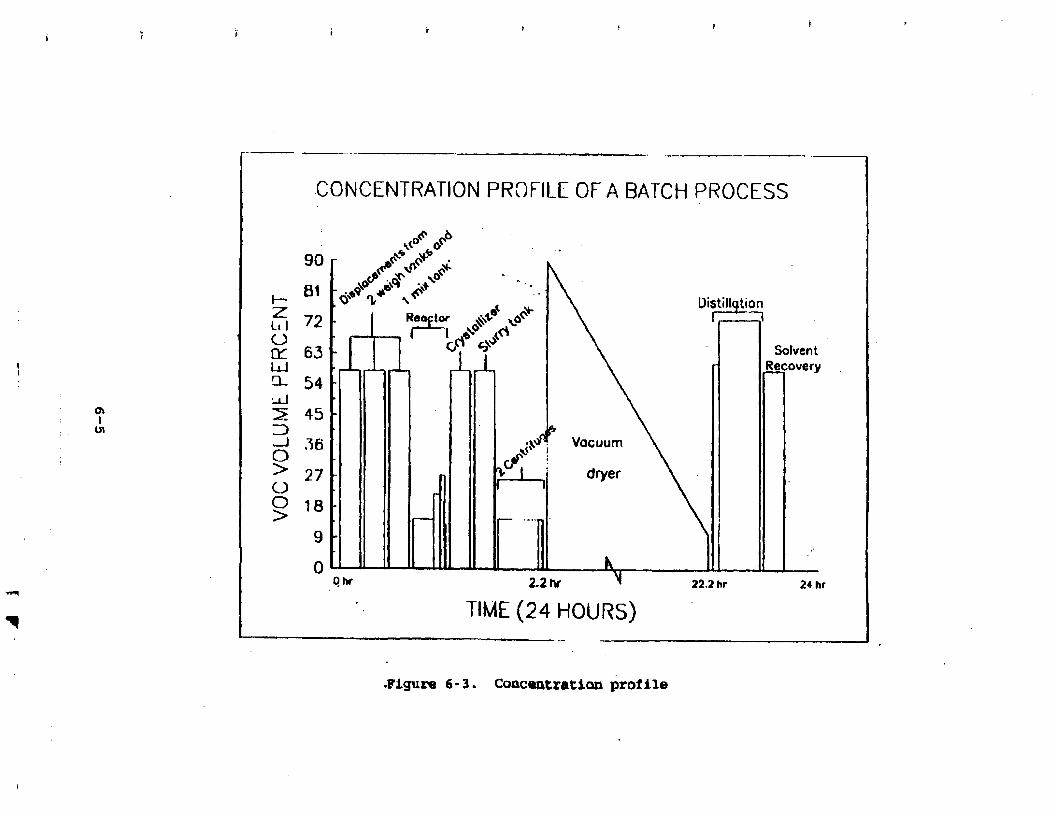


process vents affect the feasibility of using control devices
currently available in industry. These attributes also
potentially create confusion on the part of plant operators and
regulators concerning how to describe the emission
characteristics (e.g., instantaneous maximums, 8-hr averages,
24-hr averages, or batch cycle averages). In light of these - considerations, it follows that the methodology for development
of options would address questions of control device
applicability, as well as provide meaningful criteria for
determining which streams should be recommended for control. The
methodology development is described below.
6.1.1.2 a.The cost and feasibility
of controlling typical batch emission streams was examined by
applying typical add-on control devices that are found in
industry. A11 currently available types of control device8 were -examined, including thermal destruction (thermal, catalytic
oxidizers and flares), refrigeration (condensers), gas absorption
(water scrubbers), and carbon adsorption systems. The final cost
analysis, however, was done based on thermal incineration and
condenser systems. These devices were used exclusively in
examining cost because, among other factors, they can be applied
to a universe of compounds. In many cases, other control devices
might prove to be more cost effective, but generally, they can
not be used universally and therefore the cost impacts of the
option would not be supported for streams containing wide ranges
of compounds. A case in point is the use of a water scrubber to
control steams containing water-soluble VOC's. The cost and cost
effectiveness of this device may be considerably better than that
of an incinerator or refrigeration system affording the same
level of control, but the costs of the option could not be based
on this device because it would only be available for a segment
of potential emission streams. Likewise, carbon adsorption,
which is less costly than thermal incineration and condensation
in many cases, will not control some types of VOC8s and therefore it was also ruled out as a test case for the feasibility
analysis.
Although thermal incineration and condensation systems are
limited in the types of streams that each can feasibly control,
these limitations are based more on concentration and less in
terms of compound specificity. ~dditionally, the two deviees
complement each other in being able to handle ranges of emission
stream parameters. For example, the condenser option ideally
would be used to control richer streams (>10,000 ppm) while the
thermal incinerator could handle streams that were more dilute
(<10,000 ppm) and largely infeasible to consider for control with
a condenser system. Minor limitations to compound specificity
associated with burning halogenated compounds were considered by
adding the cost of caustic scrubbing and lowering waste gas heat
contents (it was later concluded that this incremental cost w a s
within the margin of error of the study estimate), while corpound
specificity did not appear to be a problem with refrigeration
systems,
Note that although the thermal incinerator and condenser
were used to establish control cost effectiveness curves, the options are not equipment-based, only performance-based-
Therefore, an emission limit would specify a control level
(e.g., 98 percent, 95 percent, 90 percent) and not a parti~lar
control device. Therefore, an operator could elect to use a
water scrubber to meet control requirements in cases where a
water scrubber would achieve the required level of control.
6-1.1.3 C o n m e r a w . The first issue considered in
developing options was the sensitivity of the costs of each
control device to the intermittency of emission events- The
primary indicator of cost is cost effectiveness in units of
dollars per megagram VoC controlled ($/ng). This cost
effectiveness value is obtained by dividing the annualized cost
of the control device ($/yr) by the annual emissions reduction
(Mg/yr), The cost effectiveness decreases (values become higher)
as the amount of time that the emission stream is released to the
atmosphere (on-stream duration) is reduced. This trend is
readily obvious from Figure 6-6, which is a graphical
presentation of cost effectiveness versus vent stream flow rate
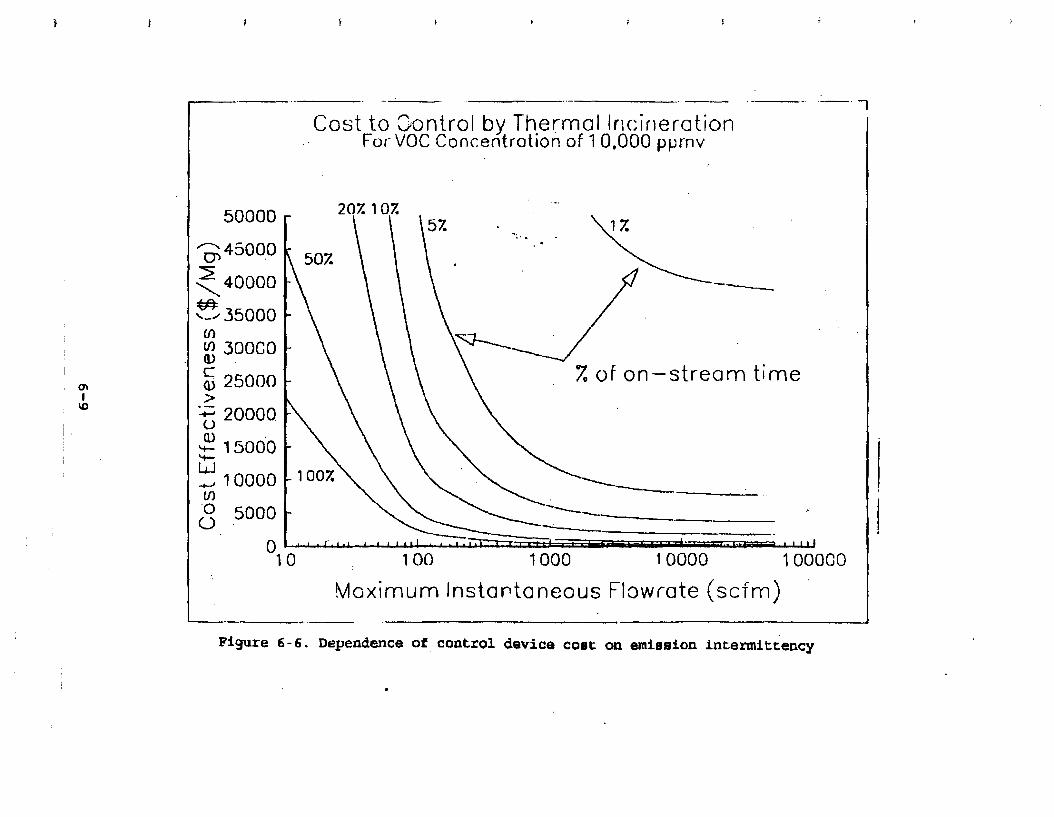

at a set annual emission rate and set VOC concentration for
different on-stream durations. Notice that the on-stream
duration is directly related to flow rate when the annual
emission rate is constant. Figure 6-6 is based upon a thermal
oxidizer with an assumed control efficiency of 98 percent. The
use of a thermal oxidizer for the analysis presented in
Figure 6-6 is meant only to illustrate the sensitivity of cost
effectiveness with on-stream duration (intermittency). Other
devices, such as condensers and carbon absorbers, also exhibit
similar sensitivity with varying on-stream durations.
Because each control device is often sized according to the
maximum possible flow rate and VOC concentration, devices used in
batch process emission control are usually oversized for the
majority of the time that they are in service. Also, for devices
such as incinerators and condensers, the annualized cost of
maintaining proper operating conditions (e.g., maintaining
incineration and condenser temperatures) when there is no
material being vented to the devices drives up the cost of
control. Consequently, the cost effectiveness of controlling
batch emissions is generally lower (values are higher) than the
cost of controlling continuous emissions for similar stream
characteristics.
The second consideration that was made in developing the
options was to limit the number of parameters necessary to
determine which streams should be required to be controlled.
Because there is inherent variation in the characteristics of
flow rate and VOC concentration during batch emission events,
eliminating as many parameters as possible (especially those that
vary) will minimize confusion in compliance determinations. For
example, an owner or operator could choose to report an average
concentration of a VOC emission stream, rather than a 'peak8
concentration in order to fall below a concentration cutoff. By
eliminating concentration as a parameter used to determine
applicability, this problem would be circumvented.
6.1.1.4 Aoproach. The approach chosen uses uncontrolled
annual VOC emissions (expressed as lb/yr) and average flow rate
(scfm) to define which streams should be controlled and the level
of control required. This approach considers the impact of
varying VOC concentrations and frequency of emission events, but
does not require their use as parameters to determine
applicability. Generally, the uncontrolled annual emission total
of VOC8s from a particular source is more readily available from
material balance and other calculational approaches than is a
detailed minute-by-minute concentration and flow profile, as is
an average flow rate.
6.1.2 control O~tions Methodoloav
6.1.2.1 Cost-Effect iveness Curves. The methodology that
was used to develop the options utilizes the parameters of annual
emissions and average flow rate to identify which streams are
reasonable to control from a cost and technical feasibility
standpoint. Note that the volatility of components of concern is
a sensitivity which requires consideration for design and cost of
the condenser systems. Hence, three regions of volatilities were
considered in the analysis. Low volatility materials are defined
for this analysis as those which have a vapor pressure less than
or equal to 75 mm Hg at 20'~; moderate volatility materials have a vapor pressure greater than 75 and less than or equal to
150 mm Hg at 2 0 ' ~ and high volatility materials have a vapor pressure greater than 150 mm Hg at 20'~. In determining
applicability of the requirements to multicomponent VOC streams,
a weighted average of the VOC volatilities should be used to
determine the appropriate volatility range. This weighted
average volatility is defined in Chapter 7 under \Definitions8,
and is ultimately used to determine which equation to use.
Figures F-1 through F-54 of Appendix F show cost
effectiveness versus flow rate for annual emissions of 30,000,
50,000, 75,000, 100,000, 125,000, and 150,000 lb/yr for various
control levels (i.e., 90, 95, or 98 percent) and volatilities.
Each graph represents the full range of concentrations of VOC8s
that might be expected in any given emission stream (from 100 ppm to 100,000 ppm [the upper concentration examined for toluene, a
low volatility material, is 37,000 ppm]); for simplicity, we can
call this the nenvelope.tl Note that the 100 ppm line is not
graphed in the curves presented in Appendix F. This line
typically falls between the 1,000 and 10,000 ppm curves, but ends
as the envelope narrows. The width of each envelope is an
indication of how much the cost effectiveness varies with
concentration.
Figure 6-7 is an example of the curves contained in
Appendix F. The figure shows the cost effectiveness of
controlling any stream having a single component or group of
components with a total vapor pressure in the moderate volatility
range (from 75 to 150 m Hg at 20"~). There are four curves on
the graph: Two of the curves show the cost effectiveness versus
flow rate for control by thermal incineration (abbreviated as
Igthroxlg)at concentrations of 1,000 ppmv and 8,750 ppmv. The
other two curves are for condenser control of streams with
concentrations of 10,000 ppmv and 100,000 ppmv. Points along the
curves were established by inputting a constant mass emission
total and a constant concentration into the condenser and thermal
incinerator spreadsheets and plotting the resulting flow rate and
cost effectiveness values corresponding to various durations.
Since the annual emissions are constant at 50,000 lb/yr, the
flow rate (x-axis) values at any point along the curves are an
indicator of the duration of the emission events. For example, ,r
the left-hand endpoints of the curves represent streams that are
continuous (i.e. in order to emit 50,000 lb/yr from an emission
point at a concentration of 100,000 ppmv, the minimum flow rate
for the stream, if it is venting continuously, is around 5 scfm).
As the curves move from left to right (increasing flow rates),
the duration of the emission events decrease, so that points
along the right hand edges of the curves represent short duration
events in which large amounts of VOC's are released at high flow
rates. These tlburstsag of emissions are not surprisingly more
expensive to control because they must be sized for large flows,
yet they will only control emissions for short durations. For
some concentrations, points on the upper-right corner of the
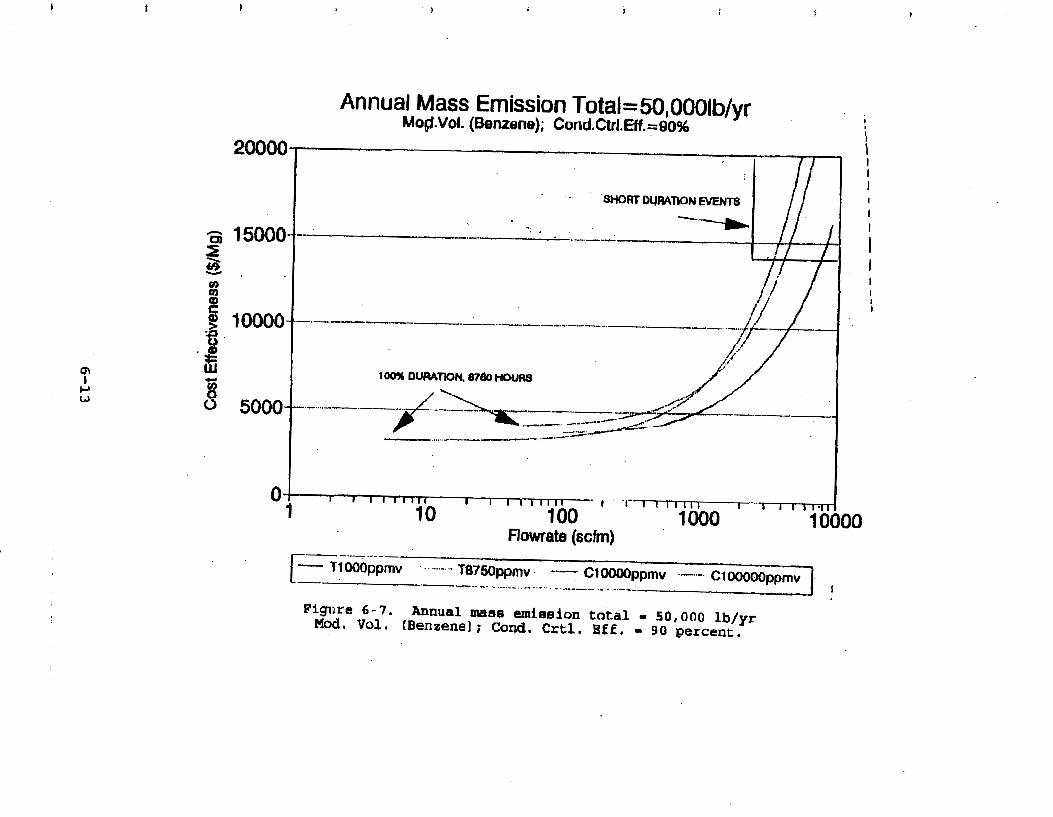
graph may occur less than 10 hours per year; these streams
resemble emergency releases.
Based on the above discussion, it can be seen from
Figure 6-7 that for a process vent emitting 50,000 lb/yr of VOC,
the cost effectiveness of control is a maximum of $5,00O/Mg for a
maximum flow rate of about 400 scfm or less, regardless of
concentration, regardless of duration. At higher flow rates, the
curves begin to rise sharply and the cost effectiveness values
become higher (indicating that they are less feasible to control
from a cost standpoint).
This discussion, then, forms the basis for setting up
option requirements based on annual emissions and flow rate. By establishing a number of curves for different annual emission
totals (i.e., 30,000, 50,000, 75,000, 100,000, 125,000 and
150,000 lb/yr), values of flow rate were obtained for an optimum -cost effectiveness range, considering impacts. These annual
emissions, and corresponding flow rates were used as data points
(x was annual emissions and y was flow) for simple regression
analysis to define the line that will represent optional cutoffs
for applicability that could be included in standards.
Note also that the subheading for Figure 6-7 states that
condenser control efficiency is 90 percent. Since both the
thermal incinerator and the condenser cost algorithms were used
to construct each graph contained in Appendix F, there were
varying levels of control efficiency that could be achieved by
the condenser; the thermal incinerator was assumed to be
effective to 98 percent all the time. Therefore, for curves
containing condenser control efficiencies less than 98 percent
(i.e. 90, 95 percent), the overall control level is limited by
the condenser efficiency.
6.2 PRESENTATION OF FLOW RATE REQUIREMENTS
Table 6-1 presents the regression line and data points
obtained from Appendix F graphs for various control levels. Note
that the graphs presented in Appendix F resemble the graph shown
in Figure 6-7. However, the labor and maintenance costs for
graphs shown in Appendix F are for 1 shift per day only, as
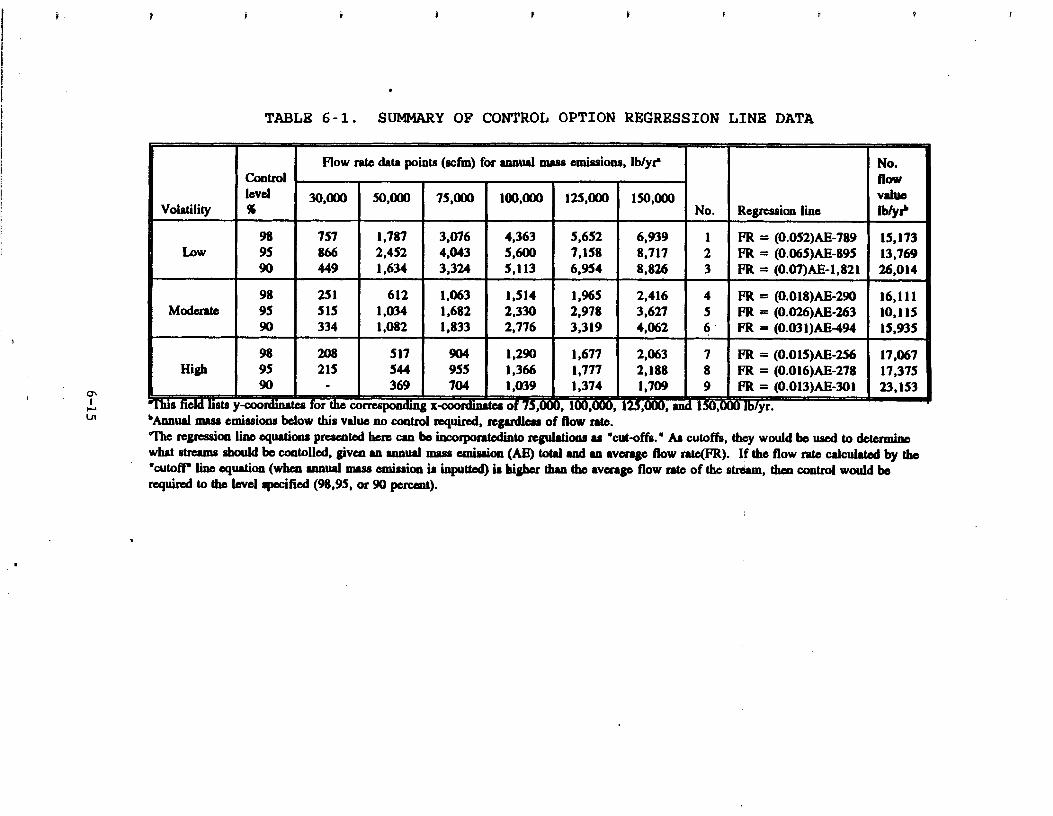
opposed to 3 shifts per day labor and maintenance costs assumed
in the construction of ~igure 6-7. By using the line equations
presented in Table 6-1, average flow rates can be established
using the annual emission total. Comparison of this "cutoffn
with the actual flow rate of the emission source would determine
whether control is required.
The options that were further evaluated for nationwide
impacts based on the curves in Appendix P are presented in
Table 6-1. The regression lines can be used to determine what
streams should be controlled, given an annual mass emission total
and an average flow rate. If the flow rate calculated by the
"cutoffn line equation (when annual mass emission is inputted) is
higher than the average flow rate of the stream, then control
would be required to the level specified (98, 95, or 90 percent). 6
The assumptions used to arrive at the baseline and uncontrolled -
emission numbers, and the industries affected as shown in
Table 6-2 are discussed in the next section.
6.2.1 Discussion of' A d u a l Issuea
6.2.1.1 u e str- versus aa-. The annual
emission total and flow rate cutoffs can be applied either to
single streams or to emission streams resulting from aggregated
sources. Costs for manifolding sources have been considered in
the design and cost calculations. For example, total purchased
equipment costs for the condenser systems were multiplied by an
additional 25 percent to account for manifolding whereas a
300-foot collection main with 10 takeoffs and an auxiliary
collection fan was costed out in the incinerator cost
calculations.
An additional analysis was undertaken to identify whether
there is a level at which the incremental cost of manifolding individual emission sources is unreasonable compared with the
emission reduction achieved. Simply stated, what level of
emissions would rule out including a source into an aggregate
pool of sources, based on a measure of control achieved over the
cost of manifolding the small source to the central process
control device. This level is identified as the ndeminimisn
level for purpose of the applicability analysis. A deriation of
this deminimis level is presented in Appendix B.
6.2.1.2 mated.The cost-effectiveness
curves shown in Figures F-1 through F-54 are for thermal
incinerators and condensers. The costs are based on using an
incinerator operating at 1600'F, with fractional heat recovery,
and not equipped with an emission control device. For
halogenated compounds, such an incinerator might not achieve a
control level of 98 percent, and additionally, acid gas would be
emitted from the combustion process. Consequently, the cost
analysis was repeated using costs based on an incinerator-
designed to control halogenated compounds. Such an incinerator
would maintain combustion temperatures at ~OOO'F, have no
fractional heat recovery, and would be equipped with a caustic
scrubber to control acid gases.
From the curves, the increase in cost effectiveness value6
associated with using a thermal incinerator equipped to control
halogenated compounds appears to be approximately 1 to $ 5 K m more costly than using the nonhalogenated compound incinerator.
6.3 IMPACTS OF APPLYING OPTIONS
A model plant approach was used to examine the impacts of
applying the options to industry on a nationwide basis. For the
industries assumed to be covered, emissions streams from amall,
medium, and large model plants were evaluated to determine the
level of control required based on the annual emissions and flow
rates specified by various control option regression lines.
Emission reductions over baseline control were evaluated for each
model plant and were extrapolated to a nationwide basis using
Census of Mamfacturers Industry Profile data. The nationwide
impacts development is outlined below.
6.3.1 -es Covered
While the information contained in this document is
generally applicable for batch processes in all or most
industries, the impacts presented are only for selected
industries. These industries and their corresponding Standard
Industrial Classification (SIC) codes are presented in Table 6-2.
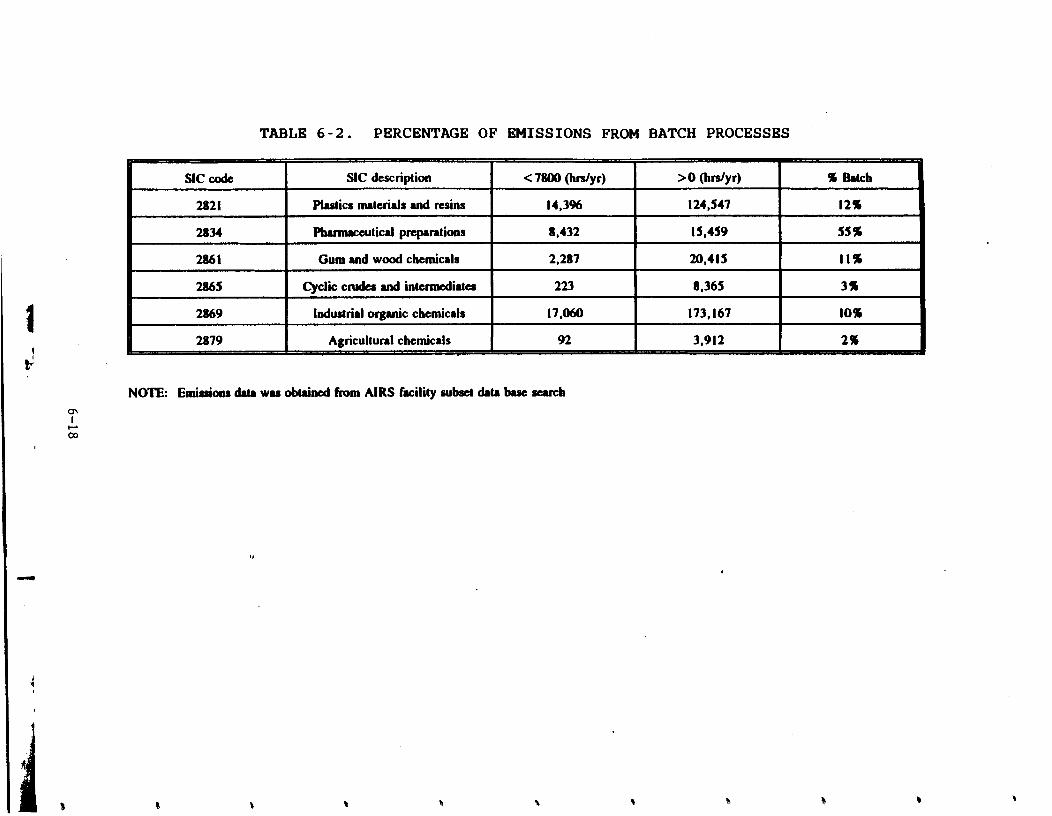
TABLE 6-2. PERCENTAGE OF EMISSIONS FROM BATCH PROCESSES
NOTE: Emissions data w u obtained horn AIRS facility subset &ta base seuch
Note that facilities that make up the industries listed also
potentially use continuous processes; in order to assess what
proportion of emissions generated in these industries is from
batch processes, the Aerometric Information Retrieval System
(AIRS) Facility Subsystem data base was accessed. For each
applicable SIC code, emissions from process vents were totaled.
Then, a subset of these data, those emissions that were reported
to have durations of less than 7,800 hours per year, were totaled
and divided by the total vent emissions for those SIC codes. The
resulting fraction was taken to be the percentage of total
emissions for each SIC code that would result from batch
processing. From the table, the percentages of emissions
considered ttbatchlt may appear lower than expected; one of the
limitations of using the AIRS database is that only sources with
greater than 100 tons per year are listed. Because many batch -
industries are for low-volume chemicals, basing these percentages
on AIRS data probably biases the percentages low.
6.3 .2 M&& Processes
Figures E-1, E-2, E-3, and E-4 of Appendix E present model
batch processes that are typically found in batch industries.
These model processes were recommended by an industry trade
association for use in evaluating impacts.' ~ables E-1, E-2,
E-3, and E-4 of Appendix E are summaries of emission streams
characteristics resulting from the unit operations shown in the
model batch processes for low, moderate, and high volatility
materials. Emission stream characteristics were calculated based
on data, where possible, and from the vapor-liquid equilibrium
assumptions described Chapter 3. Appendix E also contains all
the calculations and assumptions used to develop model emission
streams, from which only a few were selected to make up the model
batch processes. The emission rates for all unit operations
within the model processes were tabulated for each volatility.
The small, medium, and large model plants are based on multiples
of these model process emission totals. Three model processes
were assumed to represent the small plant, 10 model processes
were assumed to represent the medium-sized plant, and 30 model

processes were assumed to represent the large plant. A list of
.assumptions made in developing each of the model plants is
presented in Tables E-5 through E-8.
6.3.3 Baseline Asswtions/Btragolatlons The baseline used in estimating nationwide impacts for
process vents corresponds to the level of control achieved by the
Pharmaceutical CTG. Emissions from the number of batch
facilities in SIC Code 2834 (Pharmaceutical Preparations) were
subject to this control level. The Pharmaceutical CTG contains
condenser exit temperature requirements for five classes of 6+
volatility, and requires 90 percent control on dryers emitting
more than 330 lb/d. The facilities in the remaining five SIC
codes, 2821, 2861, 2865, 2869, and 2879, were assumed to be
subject to no VOC emission controls for process vents.
Essentially, two extrapolations were done in order to arrive '
at nationwide impacts. The first was to evaluate the control
option impacts from the model batch processes and extrapolate to
the small, medium, and large model plants. The second was to
extrapolate the impacts from the small, medium, and large model
plants to the total number of facilities conducting batch
processes nationwide. These extrapolations are discussed in more
detail below. @
6.3.3.1 podel Pl_ants. As mentioned before, the small model
plant was assumed to contain three model batch processes; the
medium model plant was assumed to contain 10 model batch
processes, and the large model plant was assumed to contain
30 model batch processes. These values fall within ranges
recommended by an industry trade association.' Tables E-9
through E-12 of Appendix E present model plant emission totals
for the small, medium, and large model plants assuming (1) no
control at all, and (2) current pharmaceutical control for low,
moderate, and high volatility materials.
Because the model processes are grouped into model plants
that only contain multiples of single processes, the model plants
are not entirely reflective of the batch industries. It is
expected, for instance, that actual plants will have combinations
of different processes. However, because the estimation of
nationwide impacts is based on an evaluation of the flow rate and
annual emission total of individual processes exclusively, the
groupings are used exclusively to extrapolate nationwide numbers.
Therefore, these nunreflectivew groupings do not affect the
correctness of the impact. . . .6.3.3.2 N a t i d e Faculties. Table 6-3 presents data
taken from industry profiles contained in the Census of
Manufacturers and from EPA data on county ozone nonattainment
status. This information was used to extrapolate the model plant
emission totals (under no control, current pharmaceutical
control, and for the various options) to a nationwide basis.
Emissions from the batch industries represented by the SIC
- codes in Table 6-3 were estimated by assuming that model
processes 1 through 3 (solvent reaction with atmospheric dryer
[model process 11, solvent reaction with vacuum dryer [model
process 21, and liquid reaction [model process 31) were evenly
used among the industries covered. The impacts assume that low,
moderate, and high volatility materials are evenly distributed
among the model processes (i.e., 1/3 of the processes use low
volatility materials, 1/3 use moderate volatility materials, and
1/3 use high volatility materials). Nationwide emissions were
estimated by multiplying the census size groupings by employee
number (i.e., small plant--0 to 19 employees) by model emission
totals to estimate small, medium, and large plant emissions.
Only the total number of facilities located in nonattainment
areas (excluding marginally nonattainment) were considered. The
formulator model process (Figure E-8) was not included in the
nationwide impacts, but is found in some SOCMI batch operations.
6.4 SUEMARY OF OPTIONS AND IMPACTS
Table 6-4 presents the overall reduction in VOC that can be
expected from various options and the national costs associated
with applying the options on a nationwide basis. Options are for aggregated sources controlled to 98 percent, 95 percent, and
90 percent overall, respectively.

REFERENCES
1. Letter from Synthetic Organic Chemical Manufacturers Association (SOCMA) to Randy Mcdonald, EPA/ESD/CPB, providing comments and recommendations on the Batch CTG. Dated April 19, 1991.
2. Reference 1.
7.0 FACTORS TO CONSIDER IN IMPLEMENTATION
OF A RULE BASED ON THE OPTIONS PRESENTED IN THIS DOCUMENT
This chapter presents information for State and local air
quality management agencies to use in developing enforceable
regulations to limit emissions of VOC's from batch processing
operations. The information presented here assumes that the
Agency adopts one of the options presented in Chapter 6. The
information is the same regardless of the option selected.
A unique approach has been developed to determine the
applicability and optimum level of control required for batch
emission sources. Additionally, a model rule with blanks to
allow for choices of options, is included in Appendix G. This
chapter is divided into the following sections: (1) Definitions
and Applicability, (2) Format of the Standards, (3) Testing,
(4) Monitoring Requirements, and (5) Reporting/Recordkeeping
Requirements.
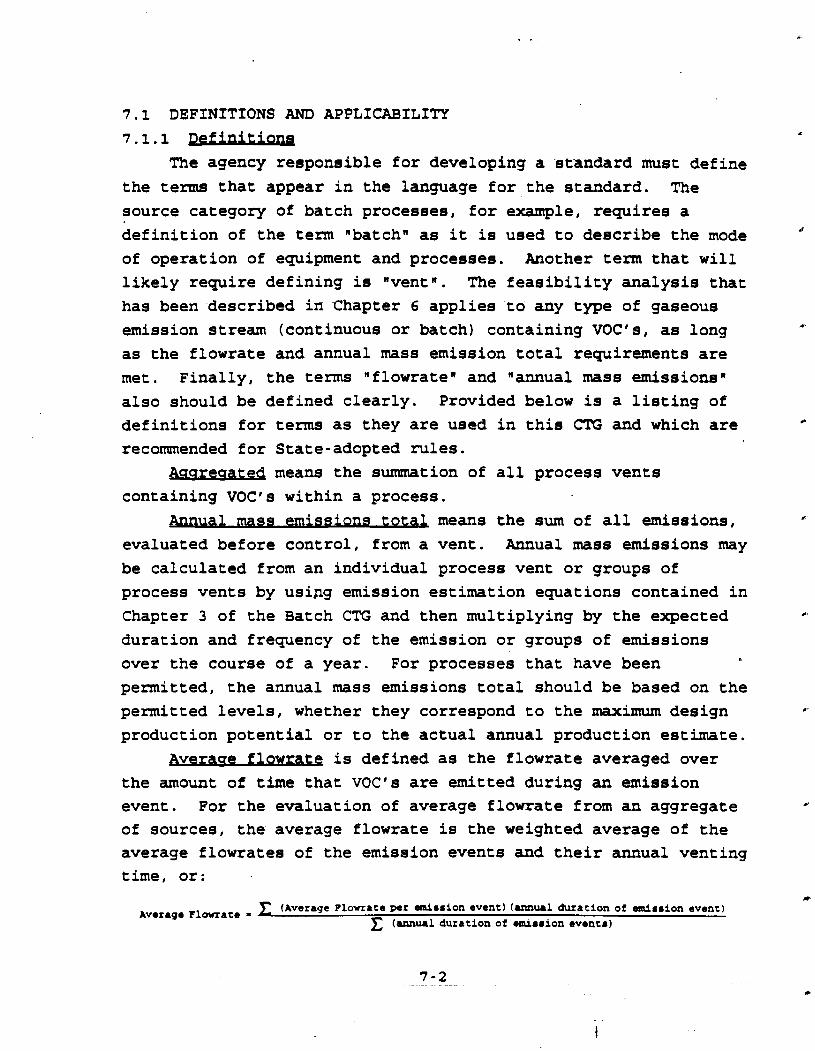
7.1 DEFINITIONS AND APPLICABILITY
7.1.1 Definitions . The agency responsible for developing a standard must define
the terms that appear in the language for the standard. The
source category of batch processes, for example, requires a
definition of the term "batchn as it is used to describe the mode 4
of operation of equipment and processes. Another term that will
likely require defining is "ventn. The feasibility analysis that
has been described in Chapter 6 applies to any type of gaseous * emission stream (continuous or batch) containing VOC's, as long
as the flowrate and annual mass emission total requirements are
met. Finally, the terms "flowraten and "annual mass emissionsn
also should be defined clearly. Provided below is a listing of ."definitions for terms as they are used in this CTG and which are
recommended for State-adopted rules.
Asaresated means the summation of all process vents
containing VOC's within a process. . .a1 mass w s l o n s t o t a means the sum of all emissions,
evaluated before control, from a vent. Annual mass emissions may
be calculated from an individual process vent or groups of
process vents by using emission estimation equations contained in
Chapter 3 of the Batch CTG and then multiplying by the expected
duration and frequency of the emission or groups of emissions
over the course of a year. For processes that have been
permitted, the annual mass emissions total should be based on the
permitted levels, whether they correspond to the maximum design I*
production potential or to the actual annual production estimate.
Averaae fl- is defined as the flowrate averaged over
the amount of time that VOC's are emitted during an emission
event. For the evaluation of average flowrate from an aggregate B
of sources, the average flowrate is the weighted average of the
average flowrates of the emission events and their annual venting
time, or: C
Average Plowzate (Average Plovrate par d r r i o n event ( m u 1 1 duration of d r r i o n event) I
(annualduration of uau88ion event.)

Batch refers to a discontinuous process involving the bulk
movement of material through sequential manufacturing steps.
Mass, temperature, concentration, and other properties of a
system vary with time. Batch processes are typically
characterized as nnon-steady-state.n
Batch_- refers to a manufacturing event of an
intermediate or product from start to finish in a batch process.
t r a means an equipment train that is used to produce a product or intermediate. A typical equipment train
consists of equipment used for the synthesis, mixing, and
purification of a material.
Control devica are air pollution abatement devices, not
devices such as condensers operating under reflux conditions,
which are required for processing,
slons before control means the emissions total prior to
the application of a control device, or if no control device is
used, the emission total. No credit for discharge of VOC's into
wastewater should be considered when the wastewater is further
handled or processed with the potential for VOC's to be emitted
to the atmosphere.
eventa can be defined as discrete venting episodes
that may be associated with a single unit of operation. For
example, a displacement of vapor resulting from the charging of a
vessel with VOC will result in a discrete emission event that
will last through the duration of the charge and will have an
average flowrate equal to the rate of the charge. If the vessel
is then heated, there will also be another discrete emission
event resulting from the expulsion of expanded vessel vapor
space. Both emission events may occur in the same vessel or unit
operation.
P r o c e s s e s , for the of determining control
applicability, are defined as any equipment within a~contiguous
area that are connected together during the course of a year
where connected is defined as a link between equipment, whether
it is physical, such as a pipe, or whether it is next in a series
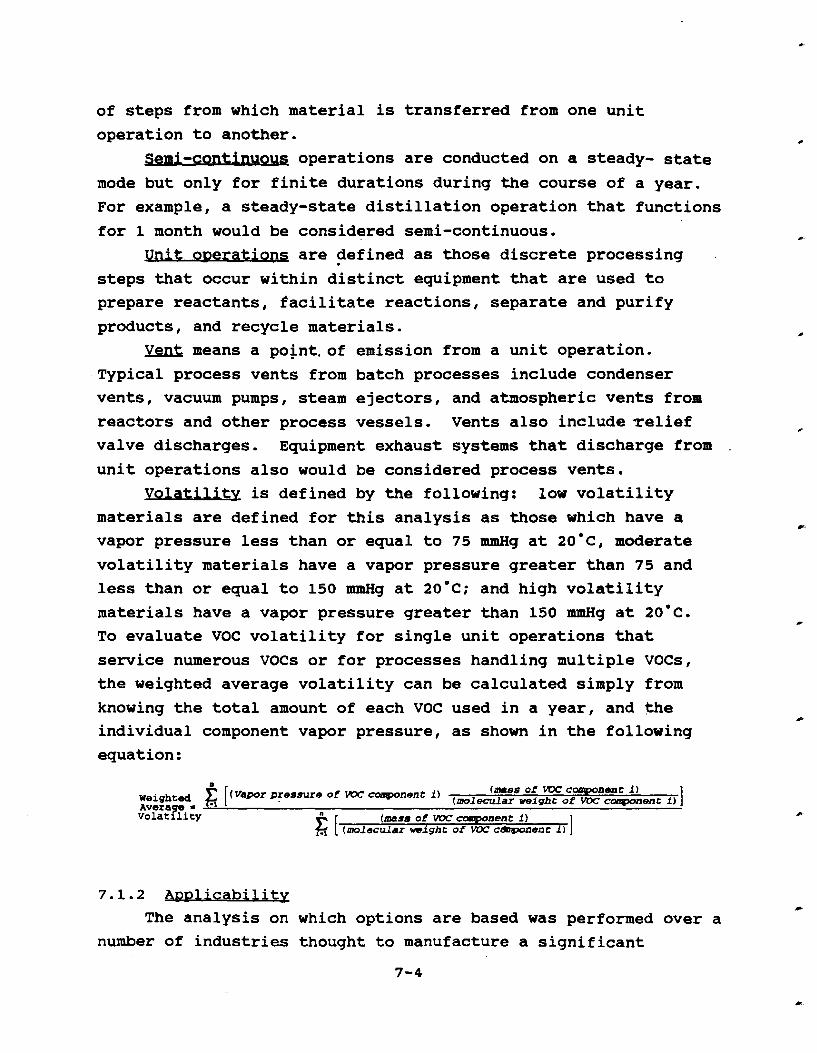
of steps from which material is transferred from one unit
operation to another.
operations are conducted on a steady- state
mode but only for finite durations during the course of a year.
For example, a steady-state distillation operation that functions
for 1 month would be considered semi-continuous.
Unit onerat- are defined as those discrete processing
steps that occur within distinct equipment that are used to
prepare reactants, facilitate reactions, separate and purify
products, and recycle materials.
Vent means a po$nt.of emission from a unit operation.
Typical process vents from batch processes include condenser
vents, vacuum pumps, steam ejectors, and atmospheric vents from
reactors and other process vessels. Vents also include relief
valve discharges. Equipment exhaust systems that discharge from
unit operations also would be considered process vents.
Volatility is defined by the following: low volatility
materials are defined for this analysis as those which have a
vapor pressure less than or equal to 75 mmHg at ~o'c, moderate
volatility materials have a vapor pressure greater than 75 and
less than or equal to 150 mmHg at 2 0 " ~ ; and high volatility
materials have a vapor pressure greater than 150 mmHg at 20'~.
To evaluate VOC volatility for single unit operations that
service numerous VOCs or for processes handling multiple VOCs,
the weighted average volatility can be calculated simply from
knowing the total amount of each VOC used in a year, and the
individual component vapor pressure, as shown in the following
equation:
7.1.2 Ap~ucability
The analysis on which options are based was performed over a
number of industries thought to manufacture a significant
percentage of total production on a batch basis. These
industries, identified by 4-digit SIC codes, are presented in
Chapter 6. They are: plastic materials and resins (SIC 2821),
pharmaceutical preparations (SIC 2834), medical chemicals and
botanical products (SIC 2833), gum and wood chemicals (SIC 2861),
cyclic cruds and intermediates (SIC 2865), industrial organic
chemicals (SIC 2869), and agricultural chemicals (SIC 2879).
Although the impacts in this document were evaluated based on a
scope limited to these industries, any batch emission point of
VOC's from presumably any industry could be subjected to these
requirements. Note that there are two CTG0s, the ~ i r Oxidation
CTG and the Reactor Processes and Distillation operations CTG,
that cover synthetic organic chemical emissions from continuous
processes. The CTG8s also exempt batch or semi continuous
processes. The information in this document applies to the
processes that are exempted because they are not continuous.
This includes semi continuous processes.
The control option requirements presented in Chapter 6
apply to (1) individual batch VOC process vents to which the
annual mass emissions and average flowrate cutoffs are applied
directly, and (2) aggregated VOC process vents for which a singular annual mass emission total and average flowrate cutoff
value is calculated and for which the option is applied across
the aggregate of sources. The applicability is discussed in more
detail below.
Sources that will be required to be controlled by a control
device will have an average flowrate that is below the flowrate
specified by the cutoff equation (when the source's annual
emission total is input). The applicability criteria is
implemented on a two-tier basis. First, single pieces of batch
equipment corresponding to distinct unit operations shall be
evaluated over the course of an entire year, regardless of what
materials are handled or what products are manufactured in them,
and second, equipment shall be evaluated as an aggregate if it can be linked together based on the definition of a process.
To determine applicability of a cutoff option in the
aggregation scenario, all the VOC emissions from a single process
would be summed to obtain the yearly emission total, and the
weighted average flow rates from each process vent in the
aggregation would be used as the average flow rate.
All unit operations in the process, as defined for the
purpose of determining cutoff applicability would be ranked, in
ascending order, accarding to their ratio of annual emission
divided by average flow rate. Sources with the smallest ratio
would be listed first. This list of sources constitutes the
"pooln of sources within a process. The annual emission total
and average flowrate of the pool of sources would then be
compared against the cutoff equations to determine whether
control of the pool is required. If control were not required ,a
after the initial ranking, unit operations having the lowest
annual emissions/average flowrate would then be eliminated one by
one, and the characteristics of annual emissions and average
flowrate for the pool of equipment would have to be evaluated
with each successive elimination of a source from the pool.
Control of the unit operations remaining in the pool to the
specified level would be required once the aggregated
characteristics of annual emissions and average flowrates met the
specified cutoffs.
By aggregating unit operations, the annual emission totals
are more easily achieved at better cost effectiveness values.
However, a unit operation may have a high emissions to flowrate
ratio, albeit low actual emissions and the cost effectiveness of
controlling such a unit operation may not be reasonable. Such
cases have been evaluated using the cost analysis of ductwork.
Essentially, the costs of ducting can be shown to be dependent on
flowrate of the emission stream and required length of ducting.
The incremental cost analysis for manifolding single unit
operations to a control device are contained in Appendix B.
7.2 FORMAT OF THE STANDARDS
The control options are performance-based standards in the
format of a percent reduction. The cutoff is applied using the

annual mass emission total and an average vent stream flowrate
(in scfm). These parameters were chosen to determine the
applicability of the cutoff because they were considerably easier
to deal with than concentration or. duration of emission events.
concentration and duration are extremely dynamic variables in
typical batch processing emissions, and, while flowrate and
yearly vent emissions also are dynamic, these parameters are
usually more available. The flowrate from a vent is sometimes
known because the gas-moving equipment (i.e., compressors, vacuum
pumps) that is used to create the venting must be sized.
Flowrates from other batch emission events, such as displacements
and material heating, may be estimated using the Ideal Gas Law.
Specific situations and equations are presented in Chapter 3.
The annual mass emission total also is required for
application of the cutoff to vents. Annual uncontrolled
emissions are frequently reported to State agencies for the
purposes of permit review, State emission inventories, or Federal
programs, such as the Superfund Amendments and Reauthorization
Act (SARA) 313 reporting requirements. For batch process vents,
however, the task of estimating annual emissions may be
complicated by several factors; among them are venting
configurations from multipurpose equipment and variations in
flow, concentrations, and emission stream duration. In such
situations, owners or operators may elect to use material
balances in conjunction with control device efficiencies to
determine potential VOC emissions.
7.3 TESTING
Source testing to measure annual mass emissions and maximum
flowrate for the purpose of determining applicability of a cutoff
is much more complex for batch processes (which have
noncontinuous and, often, multicomponent vent streams) than it is
for continuous processes. The intermittent vent streams also
present serious problems for testing the performance of the
control devices. Each step in a batch process, such as charging the reactor or operating the dryer, generates gaseous streams
with independently defined characteristics. This is illustrated

in Chapter 6, where the emission stream characteristics of
flomate, temperature, duration, and VOC concentration are given
for a model batch process. The gaseous streams from each step
may be vented separately, some or all streams may be combined
before venting to the atmosphere, and some operators may have the
flexibility of using different vents for the same equipment.
In addition to the inherent problems of stack testing at
batch processing facilities, these industries tend to be reactive
to market demands and change product lines much more often than
continuous processing plants. Vent stream.characteristics change
with the production of new products. This not only affects the
emission inventory for the plant; it can also affect the
performance of the control device.
Testing may be more realistic for facilities that have all
vents from a single product processing area manifolded together, .-
and the common vent has a continuous, positive flow. If
measurement of more typical batch process vents (in which flow
and concentration vary independently with time) is required,
several considerations related to measurement techniques must be
made.
In the presence of unsteady or transient gas flows typical
of those found in batch gas streams, gas mass flow measurement
uncertainty can be decreased by utilizing measurement approaches
that separate density effects from velocity effects. In
addition, electronic flow measurement ( E m ) must be utilized to
allow mass flow averaging over the event time. Typical
inexpensive gas flow measurement techniques (orifice meters and
pitot-type probes) are velocity head devices. They measure
differential pressure as a function of both the gas density and
the stream velocity. In transient batch-type situations where
density may be changing independent of velocity, this type of gas
flow measurement couples the effects and can potentially
introduce larger uncertainties into the velocity measurement. In
addition, for velocity head devices, EFM systems must be utilized
to eliminate the errors associated with pressure averaging prior
to velocity calculations. This error, often referred to as
7-8

"square root" error, arises from the nonlinear dependence of the
measured variable (pressure) on the stream velocity. In all
measurement devices where this occurs (orifice meters, pitot
tubes, annubars), the time-averaged value of the square root of
the pressure signal does not equal the square root of the time
averaged value of the pressure signal. This inequality
introduces positive bias errors into the flow measurement and can
be eliminated by the use of EFM,
Probes that are most suited for transient batch flow systems
are probably insertion turbine meters and ultrasonic probes,
Both of these probes can have turn-down ratios (ratio of maximum
to minimum measurable flow velocity) of 10-15 to 1 and are true
velocity measurement devices. Both of these probes can be
hot-tapped into existing gas streams, and their uncertainty
levels are equal to or better than pitot tubes in steady flows.
The insertion turbine meter, like all pitot probes, requires a
traverse, which limits its application to transient flows.
However, ultrasonic meters, which are used extensively in
chemical plants, return an average velocity flow across the gas
stream. For this reason, ultrasonic probes can track shorter
transients with less uncertainty because of the elimination of
the need for a traverse at each sample interval;
Simultaneous concentration measurements may be made using
EPA Method 25A, a semicontinuous Method 18 (at close intervals),
or perhaps by using Fourier Transform Infrared (FTIR) technology
(for which no EPA method currently exists), an emerging
technology that has experimentally been demonstrated to measure
multicomponent volatile compounds from a noninvasive standpoint.
The use of Em's to combine the flow and concentration
measurements and obtain instantaneous mass emissions, as well as
batch mass emissions (integrated over the batch cycle time)
appears to be indispensable for accurate emission measurements of
batch emission streams. However, this testing is more
sophisticated and presumably more expensive than emissions
measurement for continuous, steady-state emission streams.
Probes that are most suited for transient batch flow system
are probably insertion turbine meters and ultrasonic probes.
~ o t h of these probes can have turn-down ratios (ratio of m a x i m
to minimum measurable flow velocity) of 10-15 to 1 and are true
velocity measurement devices. Both of these probes can be
hot-tapped into existing gas streams, and their uncertainty
levels are equal to or better than pitot tubes in steady flows.
The insertion turbine meter, like all pitot probes, requires a
traverse, which limits its application to tranaiaat flows.
However, ultrasonic meters, which are used extensively -in .
chemical plants, return an average velocity flow across the gas
stream. For this reason, ultrasonic probes can track shorter
transients with less uncertainty because of the elimination of
the need for a traverse at each sample interval.
Simultaneous concentration measurements may be made using *
EPA Method 25A, a semicontinuous Method 18 (at close intervals),
or perhaps by using Fourier Transform Infrared ( F T I R ) technology
(for which no EPA method currently exists), an emerging
technology that has experimentally been demonstrated to measure
multicomponent volatile compounds from a noninvasive standpoint.
The use of Em's to combine the flow and concentration
measurements and obtain instantaneous mass emissions, as well :s batch mass emissions (integrated over the batch cycle time)
appears to be indispensable for accurate emission measurements of
batch emission streams. However, this testing is more
sophisticated and presumably more expensive than emissions
measurement for continuous, steady-state emission streams.
Another alternative is to measure emissions from a single
step in the process to confirm emission estimates based on
equations in Chapter 3. This method also can be costly if
testing is required for the entire duration of the step, from startup to completion. Sampling periodically throughout the step may be sufficient to characterize emissions and confirm emission estimates in some situations.
I
saturation). Note that under these conditions, the unit also
will perform at maximum efficiency because the emission stream is
completely saturated. In some cases, the varying incoming
emission stream characteristics make it impossible to meet an
instantaneous control efficiency value, but overall control
efficiency value can be met by controlling the richer peak load
(at higher efficiencies) and by not controlling the emission
streams when the VOC concentration begins to taper off. If vent
stream characteristics or worst-case conditions are known, the
condensation unit can be designed to meet a standard, and a
performance test may not be necessary. Monitoring can be
relatively simple. Temperature monitors can be mounted at the
coolant inlet to the vapor condenser or the gas outlet, and
temperature can be recorded on a strip chart. Flowmeters can
also be incorporated.
Carbon adsorbers are another vapor recovery device that can
be used to meet rule requirements, and if vent stream
characteristics or worst-case conditions are known, a performance
test may not be necessary. Again, a monitoring device should be
used to indicate and record the VOC mass emissions in the exhaust
gases from the carbon adsorber. Of particular concern when using
carbon adsorption systems to control batch emission streams is
the desorption of VOC compounds from the carbon bed to the gas
exhaust when the VOC concentration in the entering gas stream
decreases as it might during a batch emission event. The
adsorber may handle the peak VOC emissions only to desorb them
out during non-peak events, thereby producing an outlet stream
that is more uniform in concentration. Thus, there may be no net
control from the device.
7.5 REPORTING/RECORDKEEPING REQUIREMENTS
Records should be kept that record the characteristics of
each process vent or group of process vents subject to a rule
that indicate average flowrate and annual mass emission total.
Note that the annual mass emission total combines the mass
emission potential for each emission event with the number of
potential emission events in a year. If there is no permitted
7-11
value, owners and operators must keep records of the number of
emission events that will occur in a year in order to obtain an
accurate mass emission total.
Each facility required to control process vents should keep
a copy of the operating plan for each control device in use. The
operating plan should identify the control method and parameters
to be monitored to ensure that the control device is operated in
conformance with its design. Each facility should keep a record
of the measured values of the parameters monitoretf. Any
exceedances of the design parameters should be recorded along
with any corrective actions. The air pollution control agency
should decide which of the recorded data should be reported and
what the reporting frequency should be.
7.6 EXAMPLE APPLICATION
Figure 7-1 presents an example analysis. Individual unit -
operations, as well as the aggregate process are evaluated using
the regression equations to determine whether control at an
example level (90 percent) is required. The results indicate
that the dryer requires control of 90 percent, as does the
overall process. The uncontrolled annual mass emissions from the
dryer are 36,000 lb/yr. At this level, emission sources with
flowrates less than 167 scfm (regardless of volatility) would be
required to be controlled to 90 percent. Similarly, the
uncontrolled emissions from the aggregated process are
47,700 lb/yr. Processes with an average flowrate of 319 scfm or
lower would require control at 90 percent, again regardless of 6
volatility. In this situation, operators might choose to control
the dryer emissions to a level in excess of 90 percent in order
to meet the overall process control requirement.


APPENDIX A
PHYSICAL DATA

TABLE A-1. PHYSICAL PROPERTIES OF COMMON AIR SUBSTANCES
Condenrcd Liquid vapor
Vapor denlily. Jenaity. - True vrpw prcuure in pair at: d e f u l a r Ihlgrl Ihlgal at
Organic liquid weight at 60'F 60°F 40°F 50°F 60°F 70eF IOO'F
Oawlim RVP 13 62 5.6 4.9 4.7 5.7 6.9
Oawlim RVP LO 66 5.6 5.1 3.4 4.2 5.2 L" I
Oadinc RVP 7 68 5.6 5.2 2.3 2.9 ,3.5
Crude oil RVP 5 XI 7.1 4.5 I.8 2.3 2.8
J d Naphtha (JP-4) I M) 6.4 5.4 0.8 1.0 1.3 I I I 1 I
Diuillate fuel No. 2 130 7.1 6.t
Ruidurl oil No. 6 I 190 7.9
1 Volatile organic liquid,
Acetom 58.1 6.6 6.6 1.7 2.2 2.9 3.7 4.7 5.9 7.3
A c ~ t ~ ~ t r i l c 41.1 6.6 6.6 0.6 0.8 1.1 , I.4 1.9 2.5 3.1
Acrylonitrilc 53.1 6.8 6.8 0.8 1 .O 1.4 1.8 2.4 3.1 4 .O
Allyl alcohol 58. I 7.1 7.1 0.1 0.2 0.3 0.4 0.5 0.7 I.O
Allyl chloride 76.5 7.9 7.9 3 .O 3.8 4.8 6.0 7.4 9.1 11.0
Ammonium hydroxide 28.8 percent solution 35.1 7.5 7.5 5.1 6.6 8.5 10.8 13.5 16.8 20.7
Benzene 78.1 7.4 7.4 0.6 0.9 I.2 I.5 2 .O 2.6 3.3
n-Butyl chloride 92.6 7.4 7.4 0.7 I.O 1.3 1.7 2.2 2.7 3.5
Carbon dilulfide 76.1 10.6 10.6 3 .O 3.9 4.8 6.0 7.4 9.2 11.2
Carbon tetrrchloridc 153.8 13.4 13.4 0.8 I.I 1.4 1.8 2.3 3 .O 3.8
Chloroform 0 119.4 12.5 12.5 I.5 1.9 2.5 3.2 4.1 5.2 6.3
i Chloroprene 88.5 8 .O 8 .O 1.8 2.3 2.9 3.7 4.6 5.7 7 .O
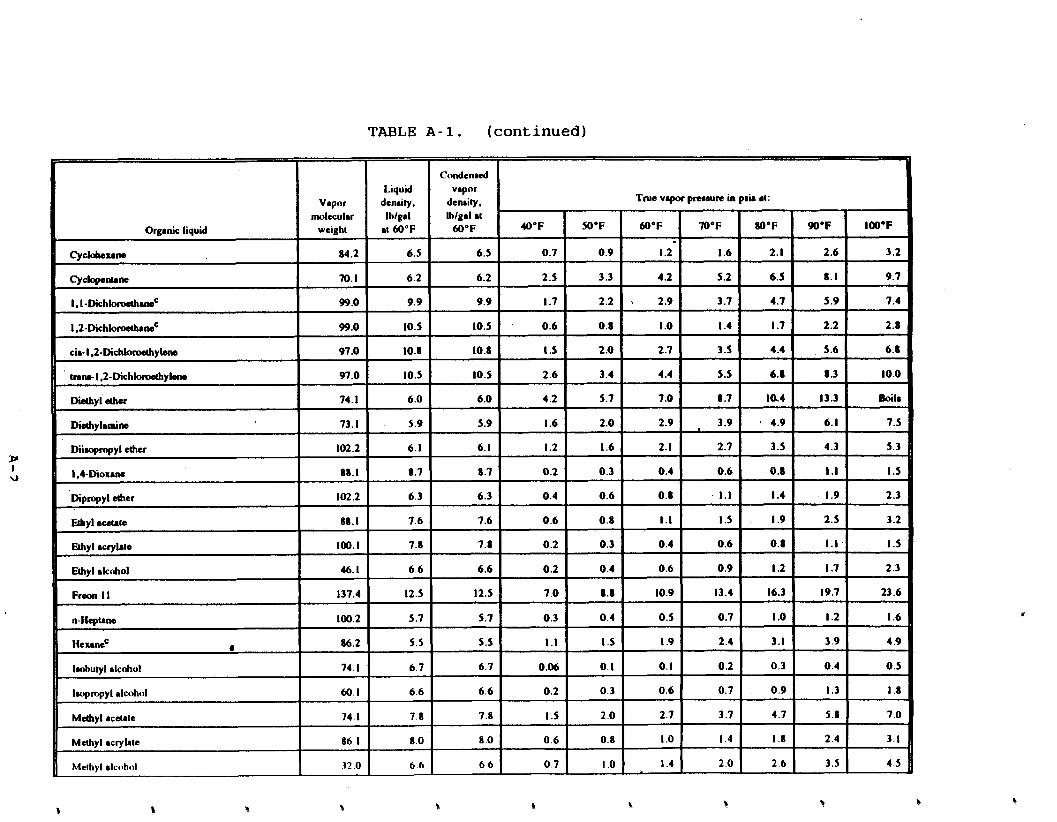
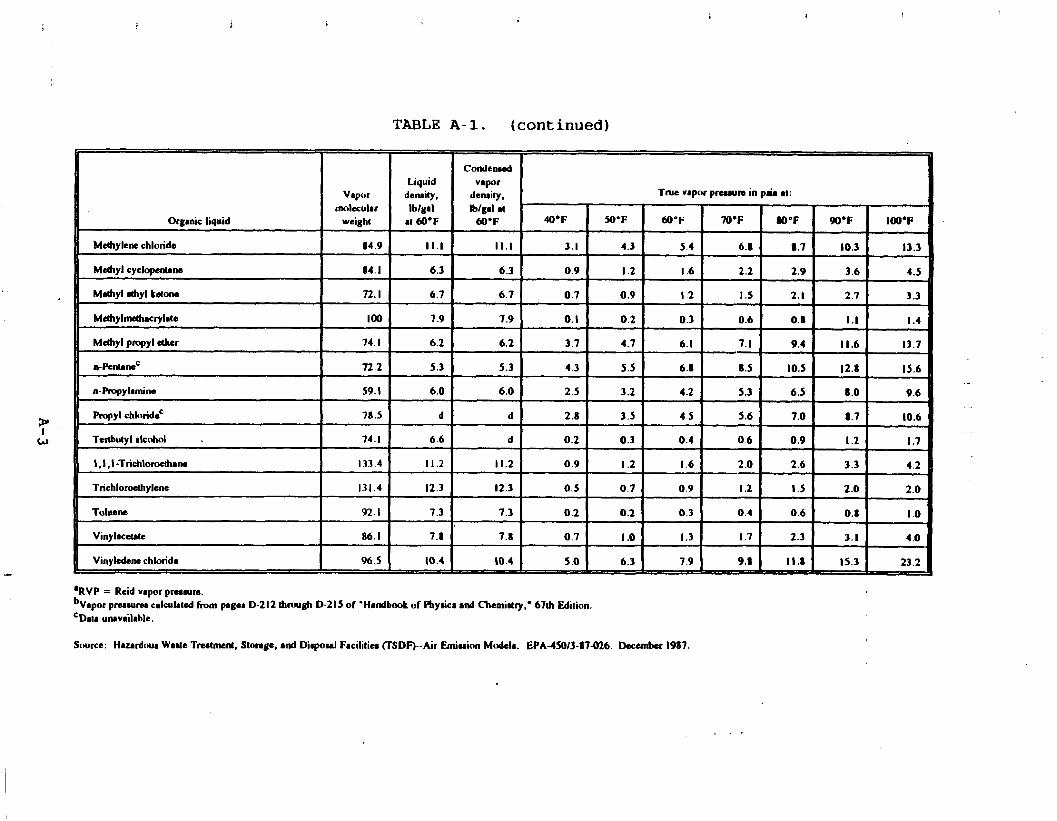
TABLE A- 1. (continued)
Condend Liquid
Vapor dcruity, True vapor pnrvlm in pair at:
molecular lblgal Iblgal at Organic liquid weight at dO'F 60'F IOO'F
Mclhylene chloride 84.9
Mclhyl cyclopcnune
Mahyl ahyl ketone
Mahylmahacrylate
Mdhyl pmpyl aher
n-~entant~
n-Pmpylamim
Pmpyl chloridg
Tedutyl alcohol
I,I ,I -T r i ch l odam
Trichloroethylene
Toluene
Vinyldene chloride
'RvP = Reid vapor prenure. b~aporp r u v l m calculated from pager D-212 thrmgh D-215 o f 'Handboot of Phylica a d Chemi~ry.' 6 7 1 Edition. 'DIU u~vailable.
Source: Hurrdoua Waue Tnrtmcnl, Slonge, and Dirpoul Facilities mDF)--Air Emiuion Modelr. EPA45013-87426. Decunbu 1987.
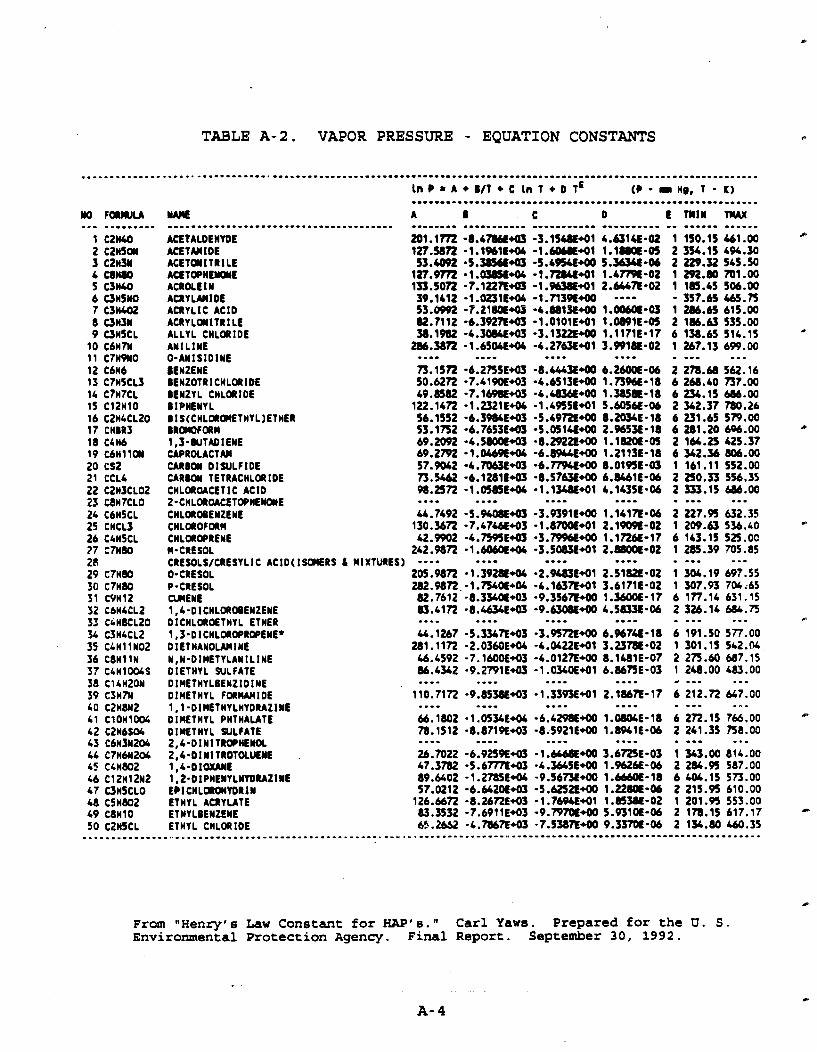
----
---- ---
- - - - - - -
- -
- - - - -
TABLE A-2. VAPOR PRESSURE - EQUATION CONSTANTS
..--1.-..--1 ------..-..-----------..-.---.----.-.------.--.------.-~--...----.-.---~.--.-.-.~~....~.... L ~ P = A * B / T * C L ~ T * O T ~ (P - m He, - K )----.-.-.--.-*--------------------.-*-----.----.-.------.-..
YO wAlY A 8 C D-----.--------.--------.--.-------.----..-FQRll lU-.-.-.--- ----..*- . - - a m - - - - - - ---------- E msr----..----- -- ------ TWAX ma--..
C1 c 2 w ACETALDEHYDE 2Ul.1772 -8.4-43 -3.154WOl 4.UlU-02 1 150.15 461.00 2 C 2 d a ACETAWIDE 127.5~2 -1.1961~44 - 1 . ~ 9 1 l.lsbff-a 2 ~ w . 1 5 &%.SO 3 cznuc ACET#lTRlLE 53.4092 -5.%56E*a5 -5.49%90 5 . u - 0 6 2 229.32 545.50 4 canm ACETOPHEWYE 1 n . m - 1 . 0 ~ ~ 4 4- i .~~bi1+01 i ~ m - 0 2 im.00m . 0 0 5 CSW 6 UHSYO
ACROLE 1 N ACRYUWIDE
135.5022 39.1412
-7.1227E*QJ -1.0231t44
-1.%38€91 -l.?I39€90
2 .Wn-02 1 1m.45 - 357.45 506.00 465.75
7 CSnc02 ACRYLIC AClD 53.0992 -7.Z180t95 -4.adlS90 1 . M - 0 5 1 a . 4 5 615.00 Iansw ACRYLOIITRILE 82.7112 -6.3927E95 -1 .0101E+Ol 1 .OWlE-OS 2 186.63 535.00 9 anscL ALLYL C~LORIDE 3 8 . 1 ~-I.SDW*OS -S.IS~~L+OO t . l 1 7 l ~ - l ? 6 138.65 SIL.IS X
10 C6HN 11 C7HPYO
~r LINE 0-ANISIDINE
a.sn - 1 . 6 5 0 ~ ~ 9 ~-C.Z~GE+OI .-.. .--- ---a
3 . ~ 1 1 - 0 2 1 247.15 - 699.00--. 12 C6Y BENZENE 73.1522 -6.2755~*0~ - 8 . ~ ~ 9 0 ~ . z M o E - ~ ~2 278.0 542.16 13 C7HSCLS BENZOTRICWLORIDE 50.6272 -?.4190€93 -4.6513E90 1.73%-18 6 20.40 737.00 14 C7H7CL BENZYL CHLORIDE 49.0582 -7.1696€95 -4.(aS6L+OO 1.3851-18 6 234.15 W.00 15 Cl2HlO BlPHENYL 122.1472 -1.232lE+OL -1.4955E91 5.#H6€-06 2 342.37 780.26 16 C2H4CL2O 17 CHBR3
BlS(CHLORO)ElHYL)ETHER BRarOFORW
56.1552 53.1n2
-6.39U4E93 -6.7653E95
-5.49?2€90 -5.614E90
8.ZOS4E-18 2.965%-18
6 231.65 6 201.20
5W.00 m . 0 0 a
18 CLH6 1'3-WTADIENE 69.2092 -4.5800€43 -8.2922E90 1.182Q-6 2 166.25 425.37 19 C b H l l O I CAPROLACTAW 69.2792 -1.0469€+U -6.0%4€90 1.211SL-18 6 342.34 006.00
URBOW DISULFIDE 57.9012 -4.7WX93 -6.ITPLE90 8.01BE-05 1 161 .ll552.00 URMY TETRACHLORIDE 73.5462 -6.1281t93 -8.5763€90 6.6461E-06 2 250.33 556.35 CHLOROACETIC ACID ~-CHLOROACETOPHEN~E CHLOROBENZENE CHLOROFORM
98.2572 .. . . 44.7492
130.3472
-1.OSmE44 .-.-- 5 . W --7.4746€93
-1.1%&91..-. -3.9391E+OO -l.l?Qa+Ol
4.143%-06.--. 1.1417E-06 2.1909C-02
2 553.15 . .-. 2 227.95 1 209.63
W.00--. 632.35 536.LO ."
CHLOROPREYE 42.QPO2 -4.759%- - 3 . W 9 0 l.l?2&-17 6 143.15 525.OC W-CRE SOL CRESOLS/CRESYLlC ACID(1SCUERS L MlXTURES)
242.9872 -1.6OME44 .--- -3.5063€91-.-- 2 . m - 0 2..-- 1 28S.39 - 705.85-.. 0-CRES OL 205.9872 -1.392144 -2.%83E91 2.5182E-02 1 304.19 697.55 P-CRESOL 282.9872 -1.n4OE+04 -4.1637E91 3.61?1€-02 1 307.93 706'65 CU(ENE 82.7612 -8.3S4OE+03 -9.3567E90 1 . m - 1 7 6 177.14 631.15 1.4-DICHLOROBENZENE DlCHLOROETHYL ETHER
8S.4172 -8.46%E+OS .--. .--- -9.aOEE90..-- 4.SMSt-06.--- 2 324.14
a .-- W.75 . I
1,s-DICHLOROPROPENE* 44.1267 -5.S34IE93 -3.9572E90 6.9674E-18 6 191.50 577.00 D1ETHANOLAnINE 281.1172 -2.0360E*04 -4.U22E91 3.2378E-02 1 301.15 542.W WIN-DIHETYLAWILINE 46.4592 -7.16QOE93 -4.0127E+OO 8.1481E-07 2 275.60 487.15 DIETWYL SULFATE DIHETHYLBENZIDINE
M.4342 . -9.2WlE95 .*--
-1.0340E91..-. 6.MnE-03---. 1 246.00 e .-. 483.00 .
DI~ETHYL FORMHIDE 1,l-DlWElHYLHYDUZIwL DIMTHYL PHTHAUTE
110.7in ..--66.1802
-9.~5su~+o5 -I.SSQ~E+OI a m - - ..-.
-1 .OSWE44 -6.4298E90
z . IM~E-~~6 2 iz .n .-.- - .-. 1.mE-18 6 272.15
647.00.". 766.00 B
DIMTHYL SULFATE 2'4-DINITROPnEmL
78.1512 .-.- -8.871%93 ---a
-8.5921E90.--- 1.89blE-06 - a s -
2 241.35 . .-. 758.00-.-2,4-DIYlTROTOLU€ME 1 ,4-D1WE 1'2-DlPHEYYLYYDUZIYE
26.7022 47.3782 89.6402
-6.925S63 -5.6Tnt93 -1.2785E44
- 1 . M 9 0 -4.5615E90 -9.56?3€+00
5.672%-03 1 . M - 0 6 1 . M - 1 8
1 S43.00 2 284.95 6 404.15
814.00 587.00 573.00
EPICHLQ#(YDRlY ETHYL ACRYUTE ETHYLIEYZENE
57.0212 126.6672 83.5532
-6.442OE93 -8.2472E43 -7.6911E93
-5.6252E90 -1.769bE91 - 9 . W m 9 0
1.2280t-06 1.8SWE-02 5.931OE-06
2 215.95 1 201.S 2 178.15
610.00 553.00 617.17 *
ETHYL CHLORIDE 65.2652 -4.TMIL93 -7.538TE90 9.337OE-06 2 1Sb.80 460.35_...._._-_-_.....__---....-.---.-.-.-.--...-.---..---..-*---"*------------..------------------.-.-....-.
F r o m " H e n r y ' s L a w C o n s t a n t f o r HAP 'S . " C a r l Yaws. P r e p a r e d f o r t h e U. S. E n v i r o n m e n t a l P r o t e c t i o n A g e n c y . F i n a l R e p o r t . S e p t e m b e r 30, 1992.

TABLE A - 2 . (continued)
~ ~ c = A * B / T + cL n t + ~ t '.-.-..---------.-------.------..--.-YUlL A I 0. ..---.-- C-.-....--.-.- -.-I-.....-.
- 3 . o w 1 ~ ~ 0ETHYLENE OlUOllOE %.am - 5 . ~ 7 ~ 9 5 8.2 ETHYLENE 01 CHLOR 1DE 111.49R .7.SZUlt95 -1.537OE91 1.6 ETHYLENE GLYCOL 1W.7472 - 1 . U l H 9 1 -2.US5191 2.0 ETHYLENE OXlOE 9 1 . m -5.153QL95 -l.blR+O1 1.6 ETHYLlDEYL DlCHLOIlDE 76.- -6.0103E93 - 9 . 1 W 9 0 8.5 FaWLDEHYDE P6.6172 -4.91nt93 -1.3765E91 2.2 ETHYLENE GLYCOL DIIIEIHYL ETHER 80.1902 -6.3RZt95 -1.DOME4 9.9 ETHYLENE GLYCOL lQlQTHYL ETHER 2M.m -1.3845E9L -4.0000L91 4.8 D t a t n n t r G L Y ~lOYaEtnyL ETHER A~ETATE 1 a . m -9.msm-a~ -1.3729~91 1.2 ETHYLENE QYCOL lQlQTHYL ETHER ACETATE 79.6572 -8.6783003 -8.72UL40 1.0 OlETHYLENE GLYCOL lOYaETHYL ETHER 250.%72 -1.716LL9L -3.LbPPt91 2.5 ETHYLENE GLYCOL m m M THYL ETHER ACETATE* 80.0053 -8.6763€+03 -8 .RU&W 1 .0 D~ETHYLENE GLYCOL #IOUTYL ETHER 173.67?2 -1.5712L91 -1.190bt91 2.8 DlETHYLENE GLYCOL DlW€THYL ETHER 78.2492 -8.2048€93 -8.660R40 1.9 ETHYLENE GLYC~LETHYL ETHER 353.16R -1.6390t91 -5.USOt91 6.6 ETHYLENE GLYCOL )IOIOPROPYL ETHER 65.3342 -7.7712L95 - 6 . m 1 9 0 2.2 ETHYLENE GLYCOL #LOPHENYL ETHER ..-- .--- -.-. DIETHYLENE GLYCOL #IQILTHYL ETHER 428.7372 -2.173191 -6.641&*01 6.9 DIETHYLENE GLYCOL DIETHYL ETHER 71.5%2 -8.595E95 - 7 . W R 9 0 3.6 ETHYLENE GLYCOL mctmwt~~ETHER 110.6477 -1 .O7VSE91 -1 .31LOC91 2.9 TR~ETHYLENEGLYWL DIMETHYL ETHER 98.8572 -1.1633004 -1.106R91 6.2 ETHYLENE GLYCOL MONOIUTYL ETHER ACETATE ---: - - -. - - - -HEWCHLOROIENZENE 158.3372 -1.a524E91 -1.8899€91 2.1 H ~ W C ~ L ~ O O U T A O I E N E 81.9512 -9.52ME93 - 9 . W 9 0 1.3 HEWCHLOR#THANE 430.2172 -2.722OE91 -6.W95E91 3.0 HEWYE 160.57R -8.SS3St93 -2.3927E91 2.9 HYDROOUlW E 105.9772 -1 .2bU44 -1.2677E91 6.9 IU301KYOYE 78.1362 -8.1126€93 -9.5117E+OO 8.1 MLElC AYHYDRlDE 63.9872 -7.722U93 -7.2087E90 7.0 eWTnANOL 105,0372 -7.471SE+OS -1.3988E91 1.5 METHYL ORWIDE 67.6932 -4.6-43 - 7 . M - 1.1 WTIYL CHLalDE 59.2572 -L.OSOlE+OS -6.7151E90 1.0 ~ W T H Y LC H L O I O F ~ M 04.1522 -6.5LLZE43 -I.OZOSE+Ol 8.5 METHYL ETHYL KETOYE 100.8472 -7.1300t93 -1.516LE91 1.7
.as-METHYL HYORAZINE --.* ---. METHYL ISCWTYL KETDYE 147.8072 -1.OOXE9I -1.97-+01 1.6 METHYL r SOCYANATE 41.7632 -4.455&+03 -3.6339~+00 1 .S METHYL METHACRYLATE 2C6.1372 -l.ZlLLE+OC -3.7654E41 4.2 METHYL TERT-WTYL ETHER 50.9812 -5.1301E93 -4.%17€90 1.9 METHYLEYE CHLOI~DE 74.9742 -5.7947€+03 -8.WlSE90 7.6
91 ClSHlON202 METHYLONE DlPHENYL D l 1 S#YAWAtE 92 C13Hl4N2 4.4-UETHYLENEDIANlLINE 93 ClOH8 NAPHTHALENE 94 C6HSw02 NltROItNZENE 9) u n s N a 4-NIT~HEWX 96 C3H7W2 2-NITROPRWM 97 C6W CHEWOL 98 UHW2 P-CHENYLEYEDIMlNE 99 COCLZ CIK)SUIIE
loo can- PnrnAuc unrDRIoE .--...--.-.-------.--.---..--.-.-..---.-.-..--.---.---..
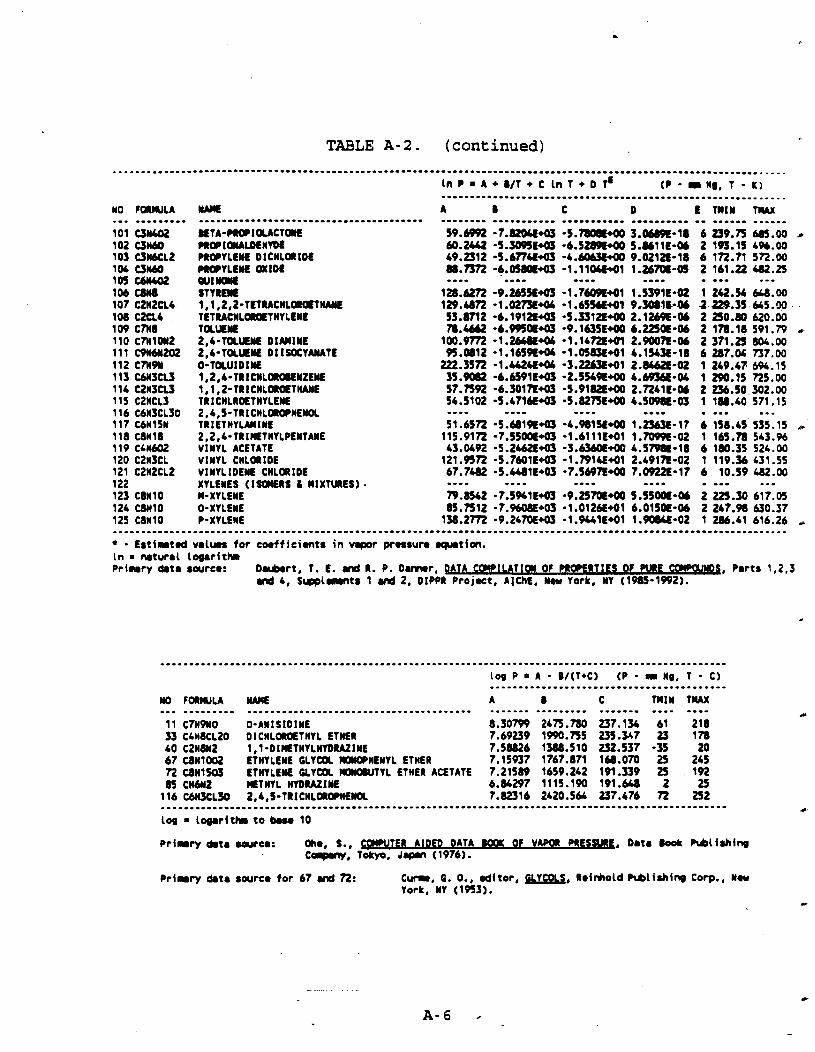
NO FORWLA NAME..-.-----... --.-------..-..------.--.-.--....-.-.--11 C7HPwO O-AWISIOINE 33 C4HdCL20 0 ICHLOROETHYL ETHER 4 0 C2HW2 1,I-DIMETHYLHYDIAZINE 67 C8NlOOZ ETHYLENE C L Y W l #OoHENYL ETHER 72 anim ETHYLEM GLYWl MWOWTYL ETHER ACETATE 85 C W 2 METHYL HYDIAZIYE
116 C6N3CLSO 2,4,5-TRI CHLORQCIYOC.-----....---------..----------.----------.------...-.-l o g = logar l th t o b u m 10
P r i l r r y & t a wurcm: Ohm, S., m t E R AIDED OATA U#(I O f VAWR P R E S W , D a t a b o k M l l a h l n g C-, Tokyo, Japan (19761.
P r i l r r y d a t a s o u r c e f o r 67 ud 72: C u m , 6. O., d l t o r , pYCOLp, R e l r h o l d M l i ah lng Corp., N.u York, MY (1%3).
1

TABLE A - 3 . SUMMATION OF DATA FOR HENRY'S LAW CONSTANT -.--..a._.._...,.--...-...---- . - ....-- -....-._.....-.--.... *-.-..-...-...- .... - - ..-.-...-..-.--
us1s--.------.-..--.--..-ACETALDEHYDE Expmr { m a t ACETMlDE UIfU A c E T a l T R I U Vlt D a t a A P T W H E Y Q E S o l r r b i L ity D a t a A a a E IN S o l r r b i l i t y D a t a A C R Y W l O E UIfU A U Y L l C AClD Vlt D a t a ACRYLQ(lTR1 LE- S o l l r b i l i t y D a t a ALLYL CHLOIlDE S o l l r b i L l t y O a t 8 A Y l L l Y E S o l l r b l L lt y D a t a O.WlS lD1YE U Y l f A C BENZENE E a p o r l n n t a l BEYZOTRICHLOIIDE U Y l f A C BEYZYL CHLOIIDE U Y l FAC BIP n m L L a p o r i n n t a t B I S ( C H L O I ~ T H Y L ) E l H E R R a u t i o n 4 t h w ta r B R r n F O I M E x p a r i n n t a t 1,s-LUTADIEYE S o l r r b i L lty D a t a W R O L A C T M U l F A C CAR- DISULFIDE S o L l r b i L l t y D a t a CAR- TETMCHLOI IDE E x p r h n t a l CHLOROACETIC AClD U l F A C 2-CHLOIOLCETWHE~YE S o l r r b i L i t y - E s t i n t e e CHLORrnEYZEYE E x p r i r n t a L CnLOROfORm E x p r i n n t a l CHLOROPREYE U l F A C M - C R E W Solrrbi 1ity D a t a CREUILS/CRESYLlC ACID(1SOIERS L MIXTURES) O-CRESOL S o l r r b i 1lty D a t a P-CRESOL S o l h i 1Ity D a t a CUlEYE E x p o r l n n t a l 1,L-DICHLOROIEWZEYE E . p r l n n t . t DlCHLOIOLTHYL ETHER S o l h i 1i t y D a t a 1 ,S-DlcnLoropRWEwE E x p a r i - t a t DIETHAWOLMIYE UY1FAC M,Y-DlMETYLAY1LlYE UY1FAC DIETHYL SULIATE S o l r r b i L ity D a t a D I ~ T I I Y L I E Y Z l D I Y E Solrrbi 'L i t y - E a t i n t a d DlMETHYL F O R W I D E VLE D a t a 1 , l -D l#THYLt lYDMZIYE VLE D a t a DIMETHYL P H T W U T E U Y l f A C DlWETHYL SULFATE S o l r r b i L l t y D a t a Z,L-D~Y~TROPHEWK ~ o t r r b i t i t y 0 a t a 2 , C - D l Y l f W t O L ~ Y E SolrbiIlt y D a t a 1 . 4 - D l W E RE D a t a 1,z-DlPHEYYLHlDIAZIYE S o l t b i lit y - E a t i n t a d EPICHLORO(I~R1Y S o l r r b l 1lty D a t a E t n n ACRYLATE Solrrbi l l t y D a t a ETHYLIEMZEYE ~ r p r l n n t a t € 1 HYL CHLOI IDE l i x p r l l m t a t
To convert fran H in atm/vol fraction to: H in atm/ (mol/m3 1 , divide by 55,556 H in armHg/mol fraction, multrply by 760 H in eia/mol fraction, multi ly by 19.7 H in fPA/mcl fgaetion, multipfy by 101.325 H in kPa/mol/m ) , multiply by 101.325/55,556 Source: Carl Yaws, nHenryls Law Constant for HAPSn, Final Report. September 30, 1992.
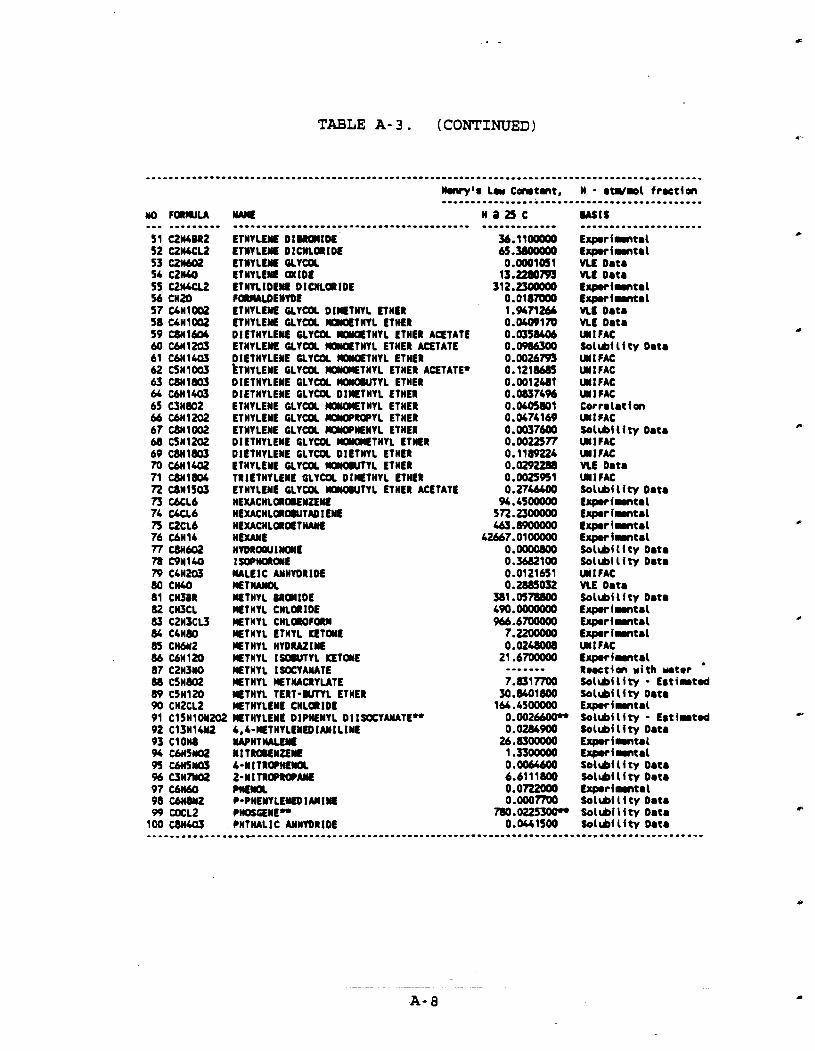
llAWt ---.---------..-----------.------.------- ETHYLENE D l I R O I l M ETHYLENE DlCNLQlDE ETHYLENE GLYCOL ETHYLEM QwlDE ETHYLlDEYt DlCNLQlDE FamuoEHYDE ETHYLEY GLYCOL DIMETHYL E n E R ETHYLEtlE GLYCOL #OLTHYL ETHER DIETHYLEU GLYCOL I~YQTHYL E T n m ACETATE ETHYLEY GLYCOL IOYQTHYL ETHER ACETATE DIETHYLENE GLYCOL IOYQTHYL E t n m LTHYLENE GLYCOL E ETHYL ETHER ACETATE* DlETHYLENE GLYCOL #YO#IIYL ETHER DIETHYLENE GLYCOL DIMETHYL E T n m ETHYLENE GLYCOL lOYOlETHYL ETHER ETHYLENE GLYCOL #OPROPYL ETHER ETHYLENE GLYCOL ##PHEW1 ETHER DlETHYLEYE GLYCOL #IOIETHYL ETHER DIETHYLENE GLYCOL DIETHYL ETHER ETHYLENE GLYCOL WOIOILIIYL ETHER TRlETHYLEYE GLYCOL DIMETHYL ETHER ETHYLENE GLYtOL WYOUlTYL ETHER ACETATE n E u c n m a w m E HEXACHL0ROQ)TADl ENE HEucHLaOLTnAHE HEXANE HYDROPUI W E 1 S O P I a a t E LULElC ANHYDRIDE W T l U m K MTHYL M # l D E WTHYL CHLQlDE WTHYL CHLQOFmM METHYL ETHYL n t a t E WTHYL HYDMTlNE WTHYL ~ ~ O U T Y L nlw m n n ~~OCYAYATE WTHYL W T l U Q Y U T E METHYL T E R T - U W L ETHER WTHYLEYE CHLQlDE
E x p o r i t a l E x p . r i m t . 1 ML D a t a VLE D a t a E r p . r i m t . 1 Erp.r imnt.1 VLE D a t a at oat. W 1 FAC S o u r L i ty oat. Ull F M U l l F A C Ull FAC Ul 1 FAC C o r r a l a t ion U l l F A C S o l * i l i t y D a t a Ull l A C W l F M nt oat. W I F A C So l * i l i t y D a t a E x p o r i t a l E x p o r i m t a l E x p o r i m t a l E r p . r i m t . 1 Sol* lL i ty D a t a So l * i L i t y D a t a Ul1 FAC VLE D a t a S o l & i 1 i ty D a t a E x p o r i m t a l E x p m r l m t a l E x p o r i m t a t Ull FAC E x p o r i m t a l R m t i o n w i t h rutor S o l & i l f t y - E s t i r t d S o l & i 1 i ty D a t a E x p o r i m t a t S o l ~ M l i t y - E s t i r t d Sol*{ l i ty D a t a E x p w i m t a l E r p . r i m t a 1 So l * i 1 i ty D a t a Sol* i li ty D a t a E x p o r i a n t a l S o l & i L i ty D a t a S o l t b i l i t y D a t a &l*i L i t y D a t a
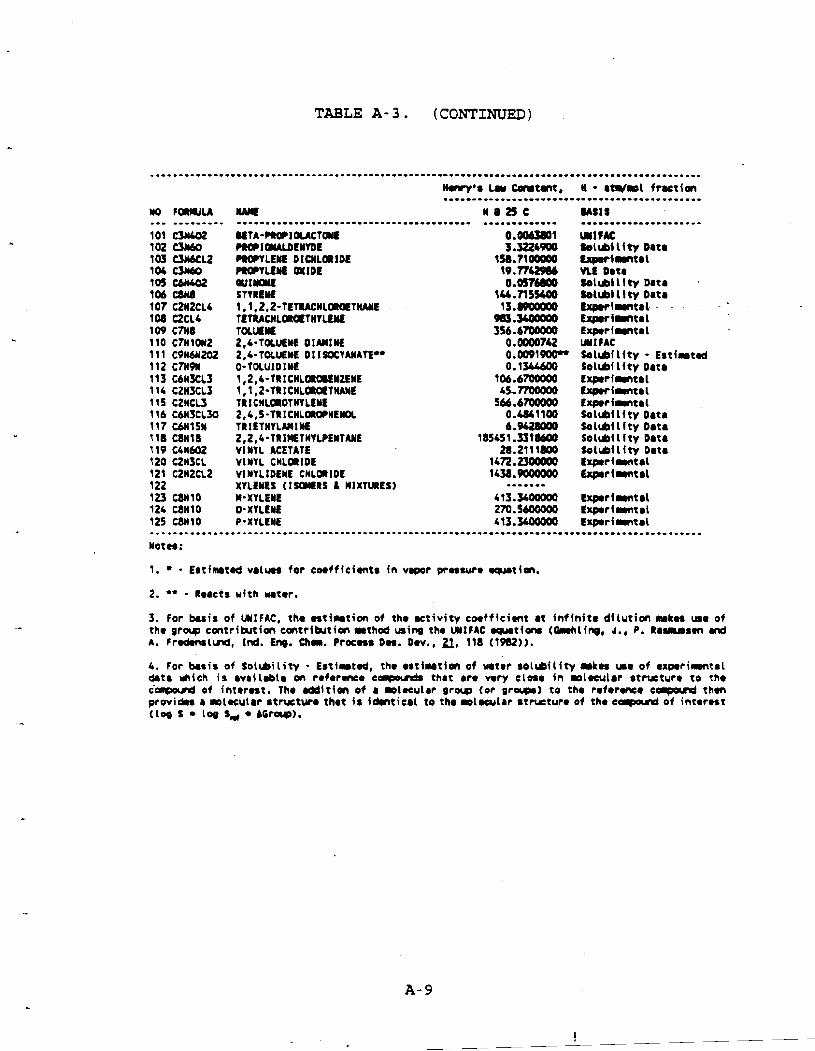
TABLE A- 3 . ( CONTINUED)
1. . - E s t i m t d values for coeff icients i n vapor pressure -tion.
2. ** - Reacts u i t h water.
3. For brs is of WIFAC, the n t f m t i m of the ac t i v i t y coeff icient at i n f i n i t e d i l u t i on n u k e s use of the grorg contribution contribution=thod using the WlCAC - t iam (-Ling, J., P. RIIUS~ nd A. F r . d m r l m d , Id. En@. Cha. Pracar Da. Dev., a, 118 (19O2)).
4. For b s i s of S o l d i l i t y - E s t i r t d , the e s t i r r t i m of w t e r s o l & i l i t y r k a w e of e x p r i m t a t data a i c h i s available on r e f e r m e corpoud. that are very close i n m l r t u l a r structure to the corrpovd of interest. The d d i t i o n of a ~ l u u l a r grorg (or g rap . ) t o the referonce carpovd then providas r nOtUul8f rtruturr thet i s idantical t o the mloeular structure of the c c q n n d of interest (1- S LOO Sd A G r w ) .

TABLE A-4. VALUES OF THE GAS CONSTANT R IN PV = n RT
N Temp. Pressure Volume R n Temp. Energy
gm mol K atm liter 0.082057477 gm mol K calorie
gm mol K atm cm3 82.057 gm mol K joule
gm mol K OUn Hg liter 62.364
gm mol K bar liter 0.083 145 Ib mol R Btu
gm mol K kg/cm2 liter 0.084784 Ib mol OR hPh
gm mol K k Pa m3 0.0083 145 Ib mol R Kw-h
Ib mol "R atm fi3 0.73024 Ib mol OR fi-lb
Ib mol R in. Hg fi3 21.850
Ib mol OR mltl HiiI fi3 554.98
Ib mol OR ~ b / i n . ~ fi3 10.732
Ib mol OR lb/fi2 fi3 1545.3
Ib mol K atm fi3 1.3144
Ib mol K mltl HiiI fi3 998.97
Source: Eneincerine Data Book. Gas Processors Suppliers Association, Ninth Edition.
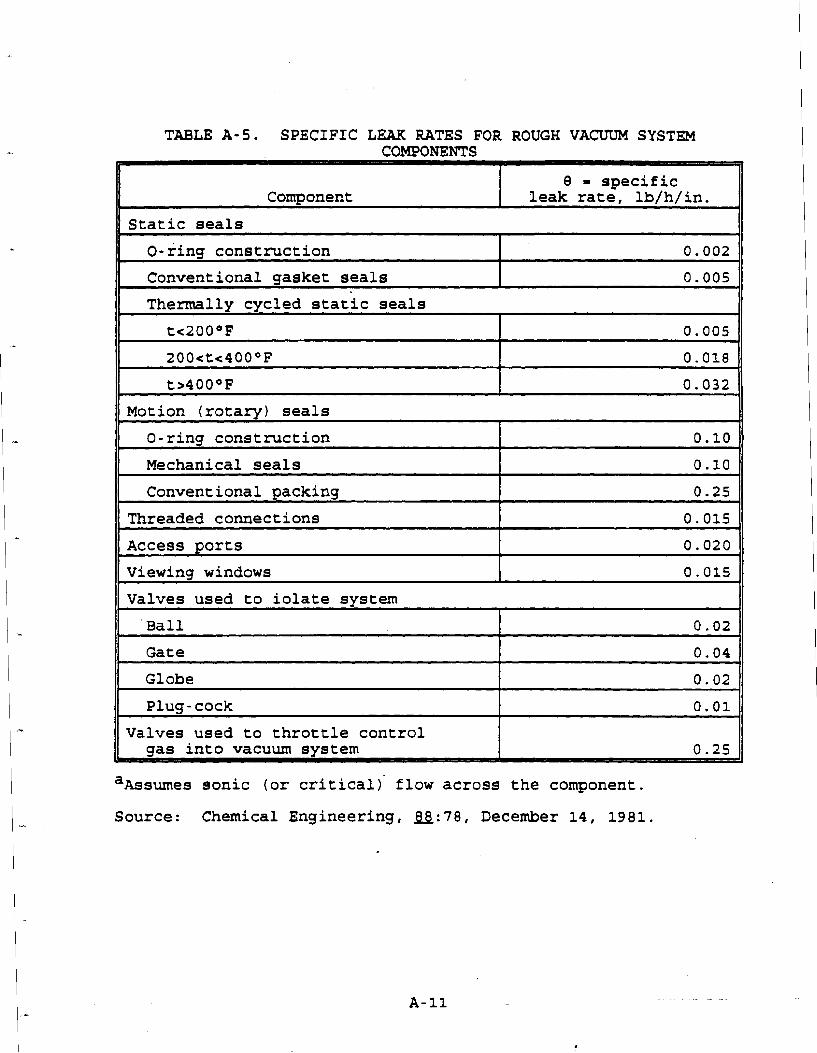
TABLE A-5. SPECIFIC LEAK RATES FOR ROUGH VACUUM SYSTEM COMPONENTS
8 = specific Component leak rate, lb/h/in.
Static seals 11 O-ring construction 0.002 11 Conventional gasket seals I 0.005 11 Thermally cycled static seals
I
- - - -
Motion (rotary) seals
O-ring construction 0.10
Mechanical seals 0.10
Conventional packing 0.25
Threaded connections 0.015
Access ports 0.02011 Viewins windows I 0.015 11
11 Valves used to iolate system 11 Ball
II 0.02 11
II Gate
Globe 0.02
Plug - cock 0.01
Valves used to throttle control qas into vacuum system 0.25
aAssumes sonic (or critical)' flow across the component.
Source: Chemical Engineering, m:78,December 14, 1981.
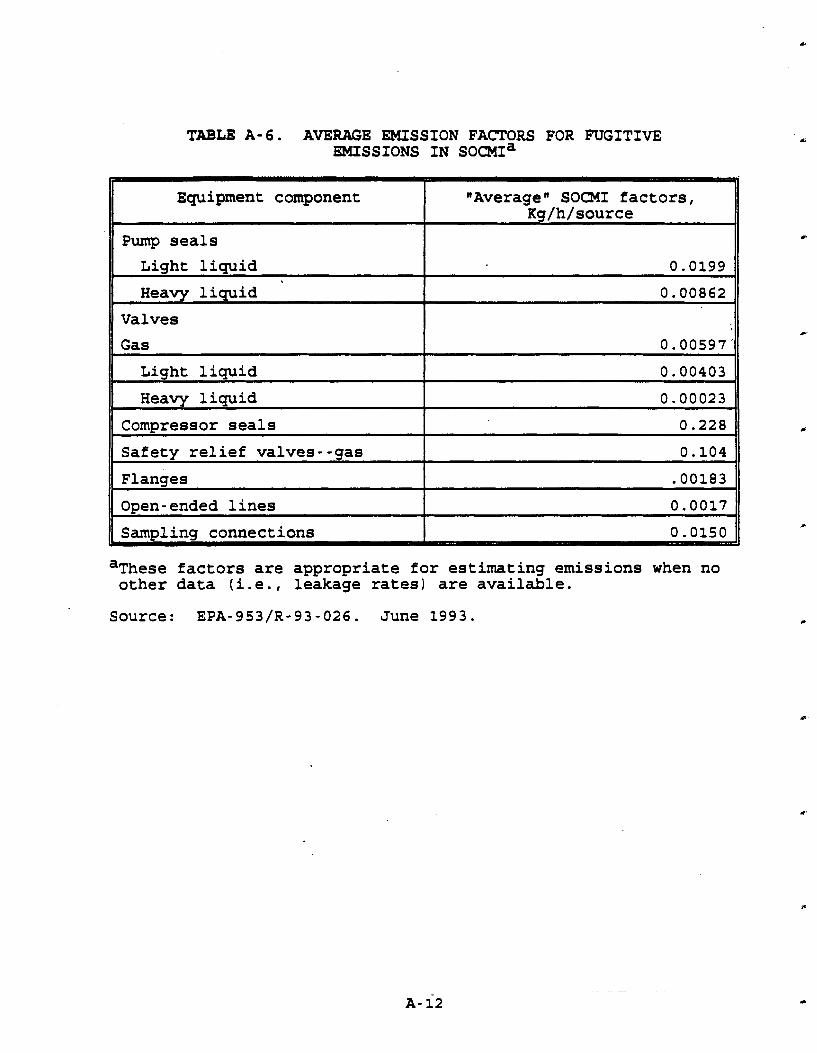
-- -- --
TABLE A-6. AVERAGE EMISSION FACTORS FOR FUGITIVE EMISSIONS IN SOCMI~
Equipment component "Averagen SOCMI factors, Kg/h/source
Pump seals
11 Light liquid -
I -- -
0 -0199 11 -
Heavy liquid 0.00862
Valves
Gas 0.00597 '
11 Heavy liquid
Light liquid
11 Compressor seals 11 Safety relief valves - -gas
I 1 1
0.00023 11 0.228 1
0.00403
0.104 11
(1 Open- ended lines I 0.0017 1
a~hese factors are appropriate for estimating emissions when no other data (i.e., leakage rates) are available.
Source: EPA-953/R-93-026. June 1993.

APPENDIX B.
CALCULATIONAL ISSUES
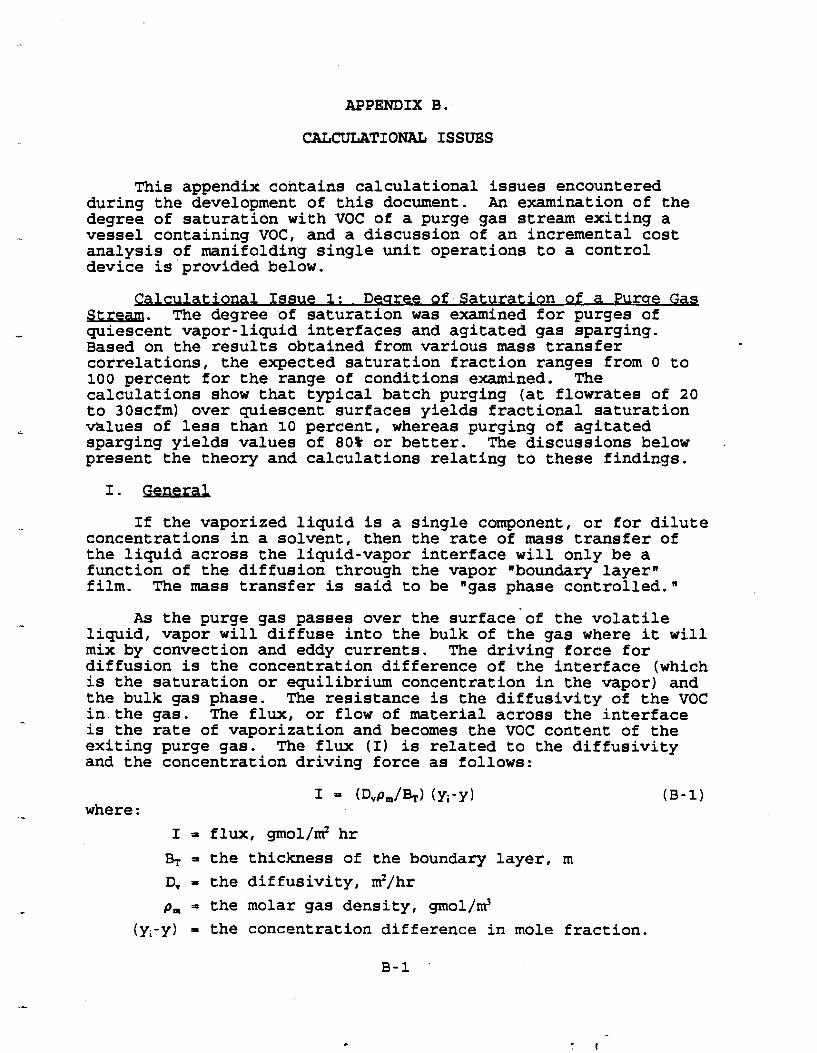
APPENDIX B.
ISSUES
This appendix contains calculational issues encountered during the development of this document. An examination of the degree of saturation with VOC of a purge gas stream exiting a vessel containing VOC, and a discussion of an incremental cost analysis of manifolding single unit operations to a control device is'provided below.
1 Issue 1: Deuree of Saturation of a Purcre Gas Stream. The degree of saturation was examined for purges of quiescent vapor-liquid interfaces and agitated gas sparging. Based on the results obtained from various mass transfer correlations, the expected saturation fraction ranges from 0 to 100 percent for the range of conditions examined. The calculations show that typical batch purging (at flowrates of 20 to 30scfm) over quiescent surfaces yields fractional saturation values of less than 10 percent, whereas purging of agitated sparging yields values of 80% or better. The discussions below -present the theory and calculations relating to these findings.
If the vaporized liquid is a single component, or for dilute concentrations in a solvent, then the rate of mass transfer of the liquid across the liquid-vapor interface will only be a function of the diffusion through the vapor "boundary layerR film. The mass transfer is said to be "gas phase controlled."
As the purge gas passes over the surface of the volatile liquid, vapor will diffuse into the bulk of the gas where it will mix by convection and eddy currents. The driving force for diffusion is the concentration difference of the interface (which is the saturation or equilibrium concentration in the vapor) and the bulk gas phase. The resistance is the diffusivity of the VOC in.the gas. The flu, or flow of material across the interface is the rate of vaporization and becomes the VOC content of the exiting purge gas. The f l u (I) is related to the diffusivity and the concentration driving force as follows:
BT = the thickness of the boundary layer, m
Dv = the dif fusivity, m2/hr
p, = the molar gas density, gmol/d (yi-y)= the concentration difference in mole fraction.

Since BT is not usually known, other fonns of this equation are more convenient where a term k is defined as the mass transfer coefficient, and is empirically related to diffusivity, viscosity, density, and the geometry of the system. The governing equation then becomes
where N is the number of moles of VOC transferred across the interface of area A per unit of time, in the previous units, N would be in gmols/hr.
The geometry of the headspace of a storage tank or reactor with contents at rest, where the purge gas is moving across a quiescent surface of liquid, resembles evaporation from an open pool. MacKay and Matsugu determined an empirical correlation for the mass transfer coefficient for evaporation from a pool where one of the terma is windspeed. In the case of tank purging, this would be analogous to the superficial velocity of the sweep gas across the liquid pool surface.
The k value calculated by has units corresponding to the transfer flux:
the MacKay and Matsugu following equation for
correlation mass
where k = m/hr in this example, and the term [ (p : -P)/RT) reduces to pi/RT to maximize t e concentration driving 3Grce; this term 9 is in units of gmols/m .
This euuation is based on a moles per volume concentration gradient drhing force rather than a mole fraction (yi, y) driving force. The equation for k, the mass transfer coefficient, in m/hr, -is as follows:
where :
NSc = the dimensionless Schmidt number which relates the.
diffusivity and gas viscosity, calculated to be 1.86
for nitrogen at these conditions.
NSc = P h D V p = viscosity, g/m hr (multiply Centipoise [CP] by 3,600
to obtain this value;
p - density g/m3;
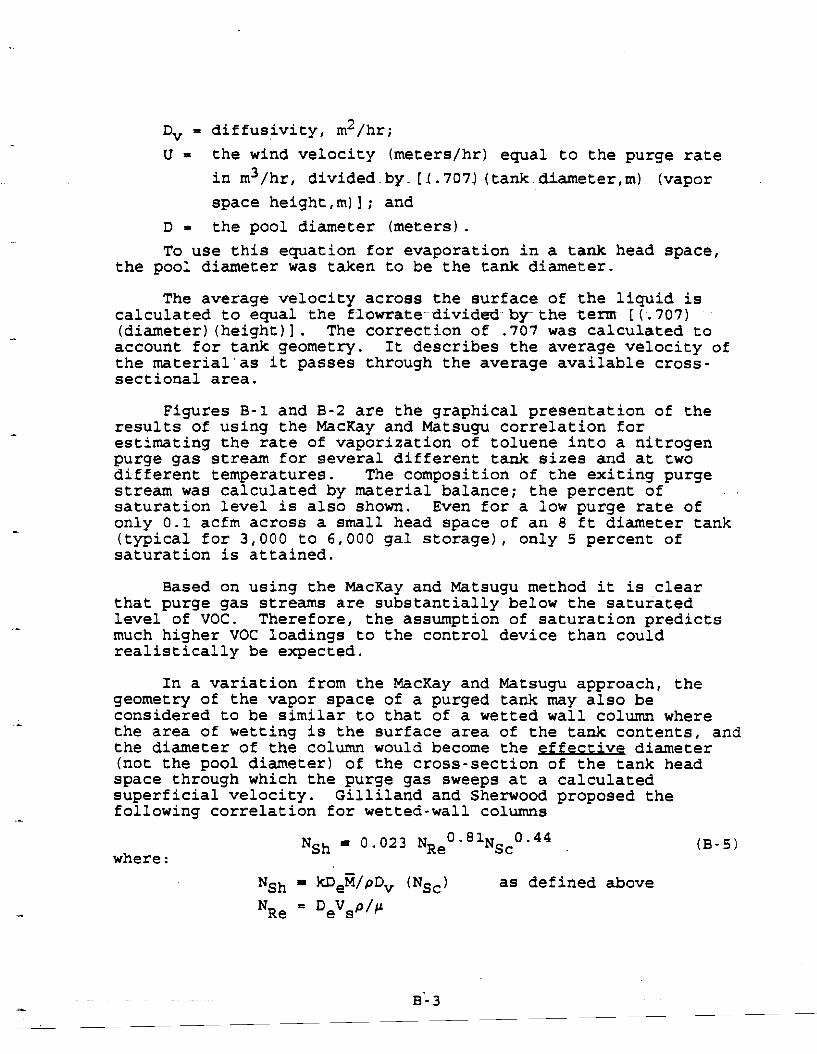
Dv - diffusivity, m2/hr;
U = the wind velocity (meters/hr) equal to the purge rate
in m3/hr, divided. by. [ 1.707) (tank diameter, rn) (vapor space height, m) 1 ; and
D = the pool diameter (meters) . To use this equation for evaporation in a tank head space,
the pool diameter was taken to be the tank diameter.
The average velocity across the surface of the liquid is calculated to equal the flowrate- divided by the term [ ( .707) (diameter) (height)]. The correction of .707 was calculated to account for tank geometry. It describes the average velocity of the material'as it passes through the average available cross- sectional area.
Figures B - 1 and B-2 are the graphical presentation of the results of using the MacKay and Matsugu correlation for estimating the rate of vaporization of toluene into a nitrogen purge gas stream for several different tank sizes and at two different temperatures. The composition of the exiting purge stream was calculated by material balance; the percent of . . saturation level is also shown. Even for a low purge rate of only 0.1 acfm across a small head space of an 8 ft diameter tank (typical for 3,000 to 6,000 gal storage), only 5 percent of saturation is attained.
Based on using the MacKay and Matsugu method it is clear that purge gas streams are substantially below the saturated level of VOC. Therefore, the assumption of saturation predicts much higher VOC loadings to the control device than could realistically be expected.
In a variation from the MacKay and Matsugu approach, the geometry of the vapor space of a purged tank may also be considered to be similar to that of a wetted wall column where the area of wetting is the surface area of the tank contents, and the diameter of the column would become the effective diameter (not the pool diameter) of the cross-section of the tank head space through which the purge gas sweeps at a calculated superficial velocity. Gilliland and Sherwood proposed the following correlation for wetted-wall columns
where:
as defined above
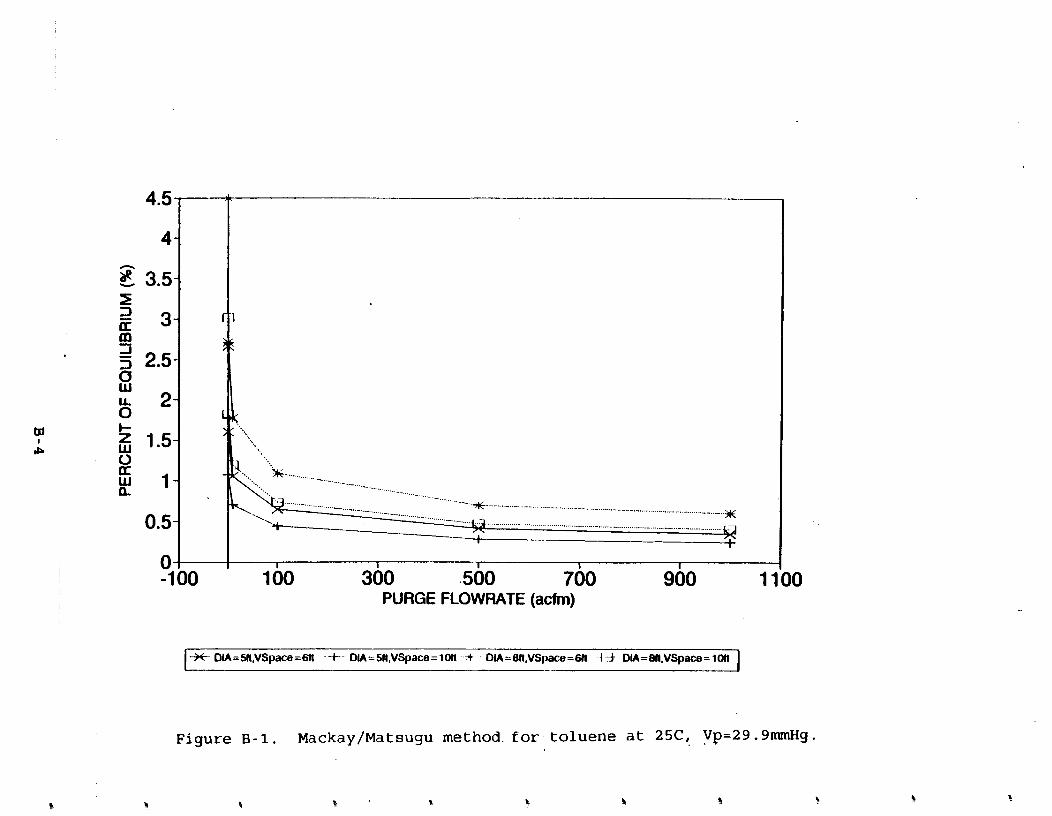
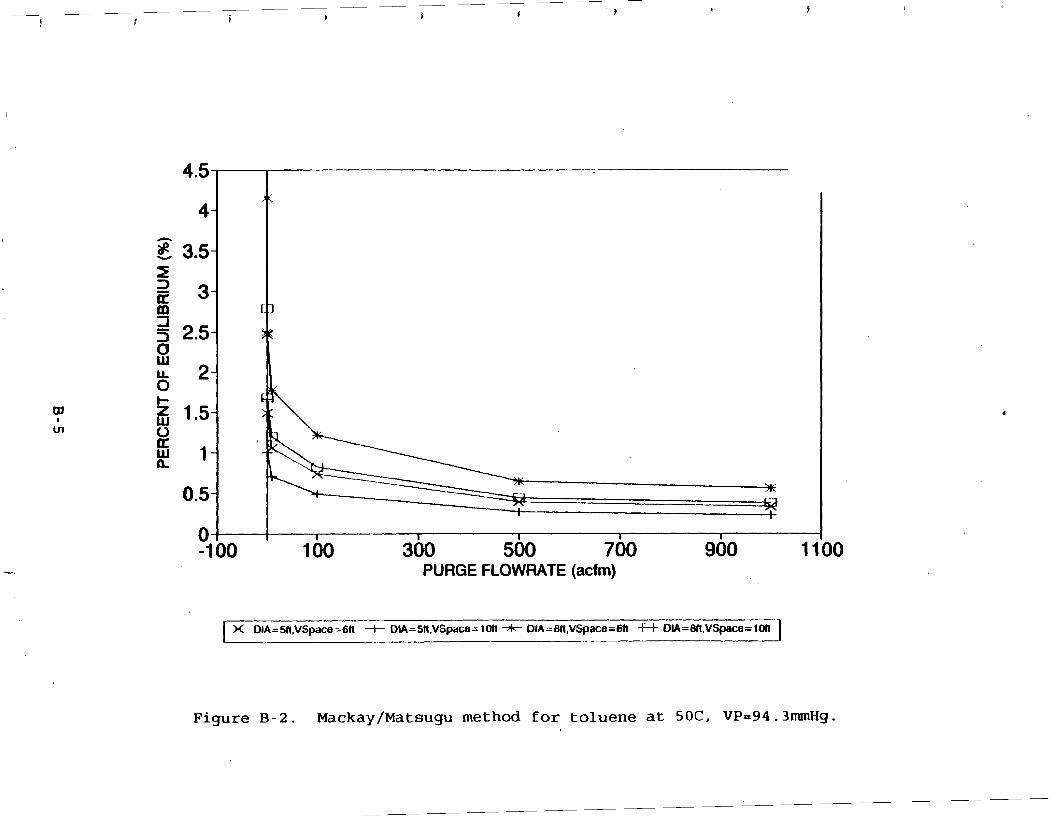
PURGE FLOWRATE (acfm)
Figure B-2. Mackay/Matsugu method for toluene at 50C, VP=94.3mrnHg.
The mass transfer coefficient, k, is contained in the Shewood Number, N , which relates equivalent diameter, De; gas molecular weight, @ gas -density, p; and vapor dif fusivity, Dv. The Gilliland-Sherwood equation can be rearranged to solve directly for k; the units are moles per area per time.
The area of mass-transfer is the area of the surface of the tank contents. The driving force is the difference between the vapor concentration at the interface (assumed to be the saturation value) expressed as a mole-fraction, and the bulk gas composition (which is essentially zero). The rate of evaporation is thus expressed as
Knowing the purge gas flow rate and evaporation rate, the composition of the exit gas can be calculated by material balance andcompared to saturation composition.
A series of calculations were done using the wetted wall correlation for a storage tank of toluene being purged with nitrogen. Figures B-3 and.B-4 are the graphical representations of the data. As with the MacKay and Matsugu approach, very low ' values of percent of saturation are obtained. For example, a low purge rate of 0.1 acfm across a small head space of an 8 foot diameter tank results in only 7.3 percent of saturation.
The calculated percentages of saturation equilibrium for most flowrates and vessel vapor spaces using both the wetted wall equations and the MacKay-Matsugu correlation yield low values, in the range of 0 to <I0 percent, with most values below 5 percent. A conservative assumption for calculating the purge equilibrium fraction, therefore, would be to assume 10 percent. Note that, as the superficial velocity increases, k increases. As flow rate is increased, velocity also increases, but more inert gas is introduced to the system, thereby decreasing the percent equilibrium.
We can consider both equations bounded by the realistic superficial velocity across the liquid surface. Figure B-5 shows graphically the differences in values obtained for percent equilibrium for the MacKay-Matsugu correlation versus the Wetted Wall method. As the vapor space decreases (increasing superficial velocity), the percentage of equilibrium increases, especially in the low purge rate range. For vapor space values of 0.5 feet or less, the equations begin to approach higher values as the superficial velocity increases. In most purge situations, however, the vapor space above the vessel will be greater than 0.5 feet and the assumed 10 percent equilibrium fraction will be realistic.
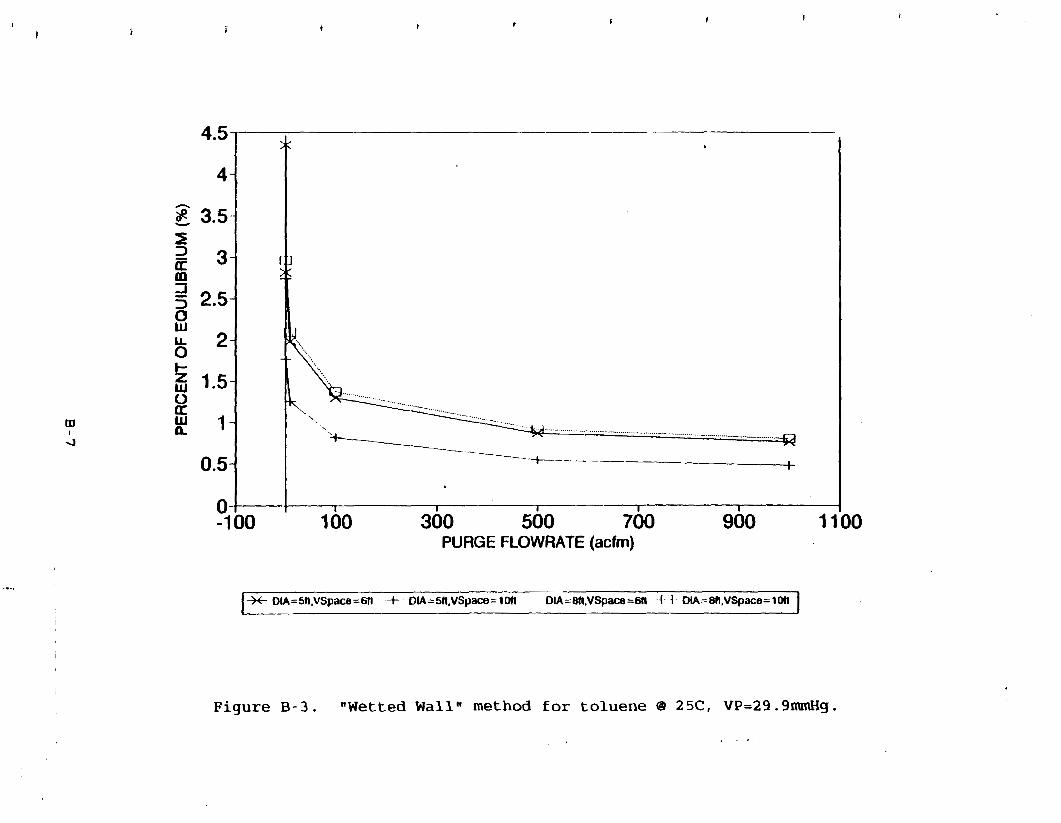
PURGE FLOWRATE (acfm)
Figure B - 3 . "Wetted Wall" method for toluene @ 25C, VP=2%.91nnMg.
. . .
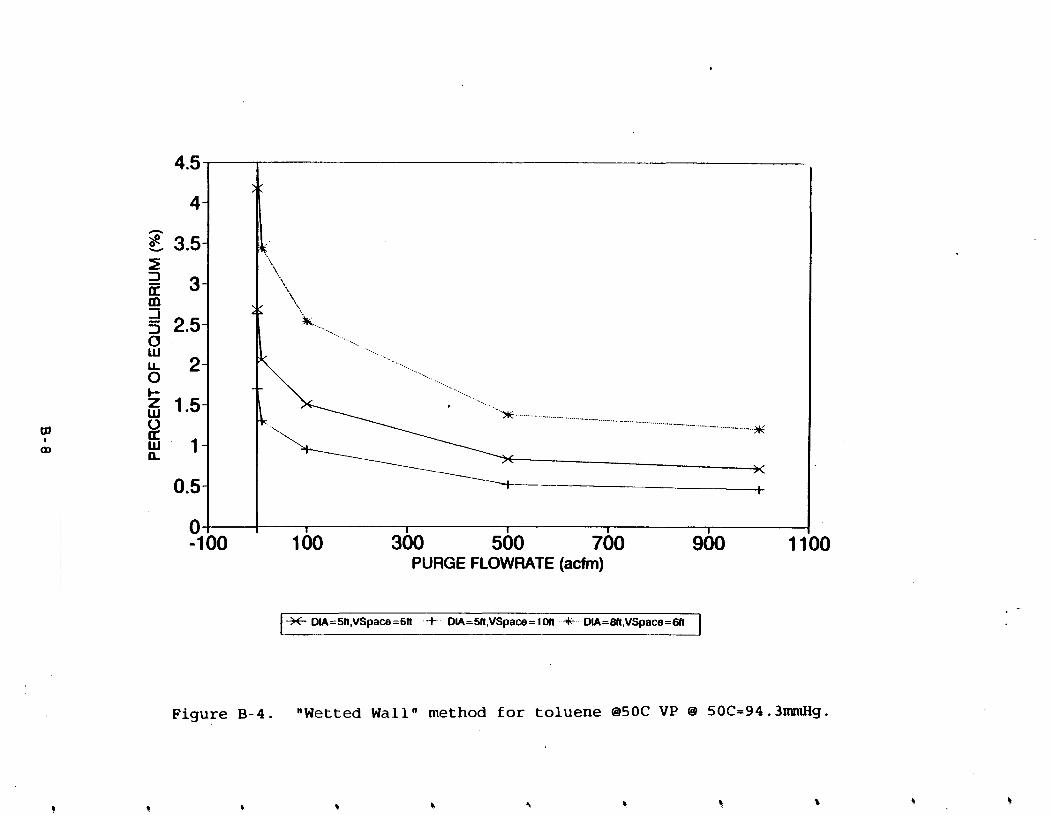
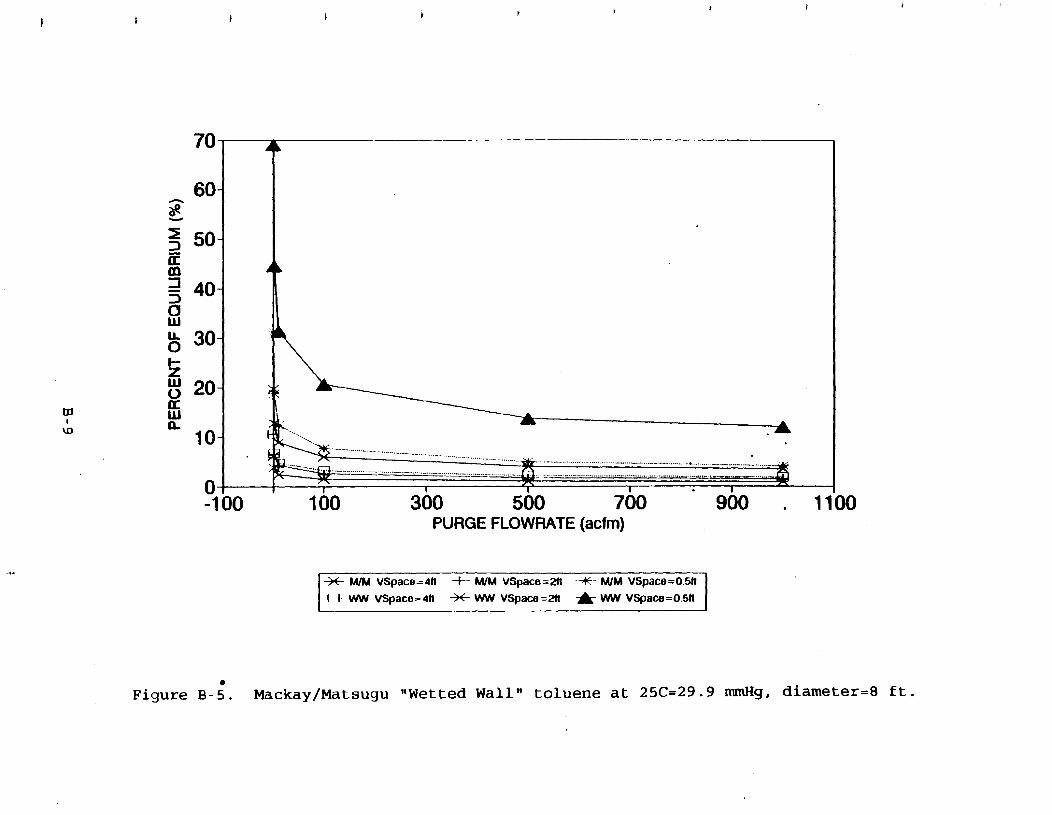

In the case of mixed liquids (two or more components) the estimation of the mass transfer rate is somewhat more complex as it requires calculation of both the gas phase mass transfer coefficient, as explained above, and a liquid phase mass transfer coefficient. The liquid phase coefficient takes into account the rate of diffusion of the more volatile component through a film of the less volatile component, to the vapor-liquid interface where it can evaporate.
Furthermore, with bin& or n<icomponent liquid mixtures the mass transfer driving force is no longer simply expressed.as the pure component vapor pressure divided by the total pressure. The equilibrium partial pressure is the driving force, but the a
calculation of that t e e i s related to the liquid composition. The simple correction factor implied by Raoult's Law is to multiply-the vapor pressure by the mole fraction in the liquid. However, in many real situations (e.g., dilute aqueous solutions of sparingly soluble organic solvents), the materials are highly
-nonideal, and application of Raoult's Law leads to substantial under estimation of the equilibrium vapor concentration of minor components.
The use of empirically determined Henry's Law constants for the estimation of vapor phase concentrations is a practical way ' to approach calculation of a realistic mass transfer driving force. This methodology is described in previous sections. In extreme cases of nonideality, the partial pressures of a mixture of compounds is greater than the vapor pressure of any of the pure compounds. This phenomenon is more readily observed where a mixture forms a low-boiling azeotrope. Obviously, in such cases application of empirical correlations (such as Henry's Law) is necessary for an accurate calculation of driving force.
But, in the case of purging of mixed liquids a second component in the liquid phase seriously decreases the value of the liquid mass transfer coefficient. Therefore, although the actual mass transfer driving force may be somewhat greater than estimated for a pure component, the overall mass transfer rate will not be, and the use of the fractional approach to equilibrium will be valid.
111. Inert N2 Puruinu of Auitated Vesselg
Agitated vessels can be evaluated in the same way using mass transfer coefficients for stirred tanks. The coefficient of mass transfer through broken interfaces during sparging is given by the equations:
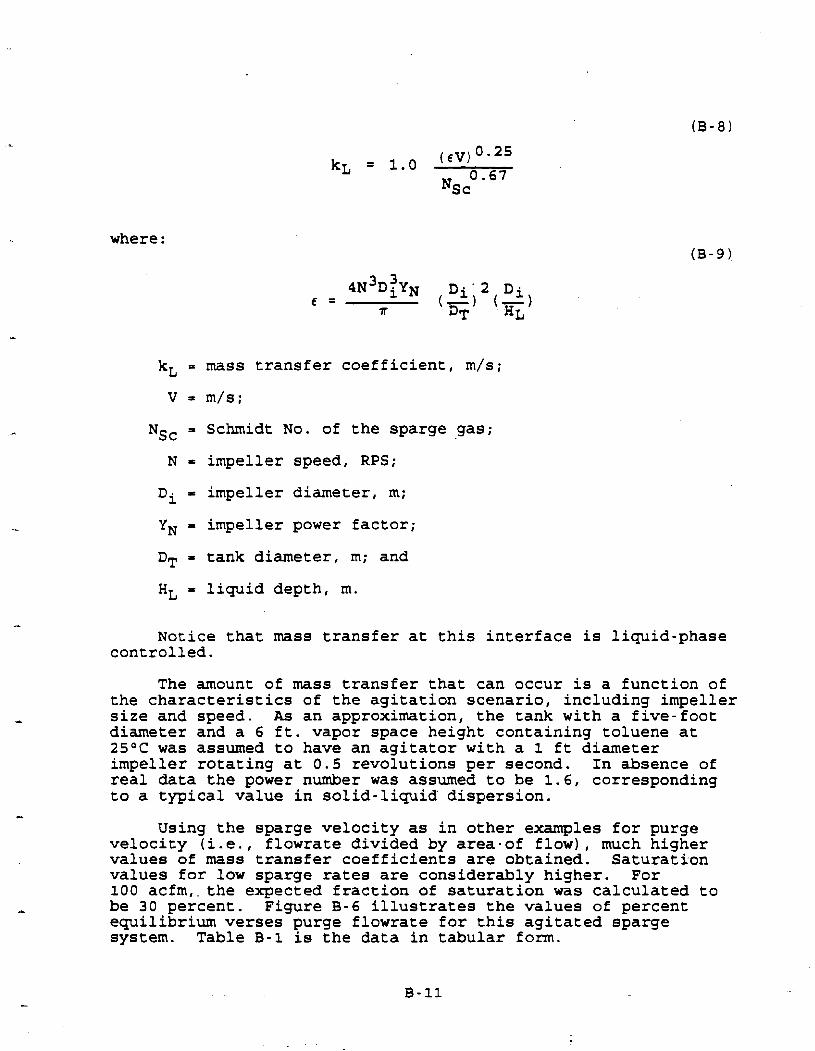
where:
kL = mass transfer coefficient, m/s;
V = m/s;
NSc = Schmidt No. of the sparge gas;
N = impeller speed, RPS;
Di = impeller diameter, m;
YN = impeller power factor;
DT = tank diameter, rn; and
HL = liquid depth, m.
Notice that mass transfer at this interface is liquid-phase controlled.
The amount of mass transfer that can occur is a function of the characteristics of the agitation scenario, including impeller size and speed. As an approximation, the tank with a five-foot diameter and a 6 ft. vapor space height containing toluene at 2S°C was assumed to have an agitator with a 1 ft diameter impeller rotating at 0.5 revolutions per second. In absence of real data the power number was assumed to be 1.6, corresponding to a typical value in solid-liquid dispersion.
Using the sparge velocity as in other examples for purge velocity (i.e., flowrate divided by area-of flow), much higher values of mass transfer coefficients are obtained. Saturation values for low sparge rates are considerably higher. For 100 acfm,. the expected fraction of saturation was calculated to be 30 percent. Figure B-6 illustrates the values of percent equilibrium verses purge flowrate for this agitated sparge system. Table B-1 is the data in tabular form.
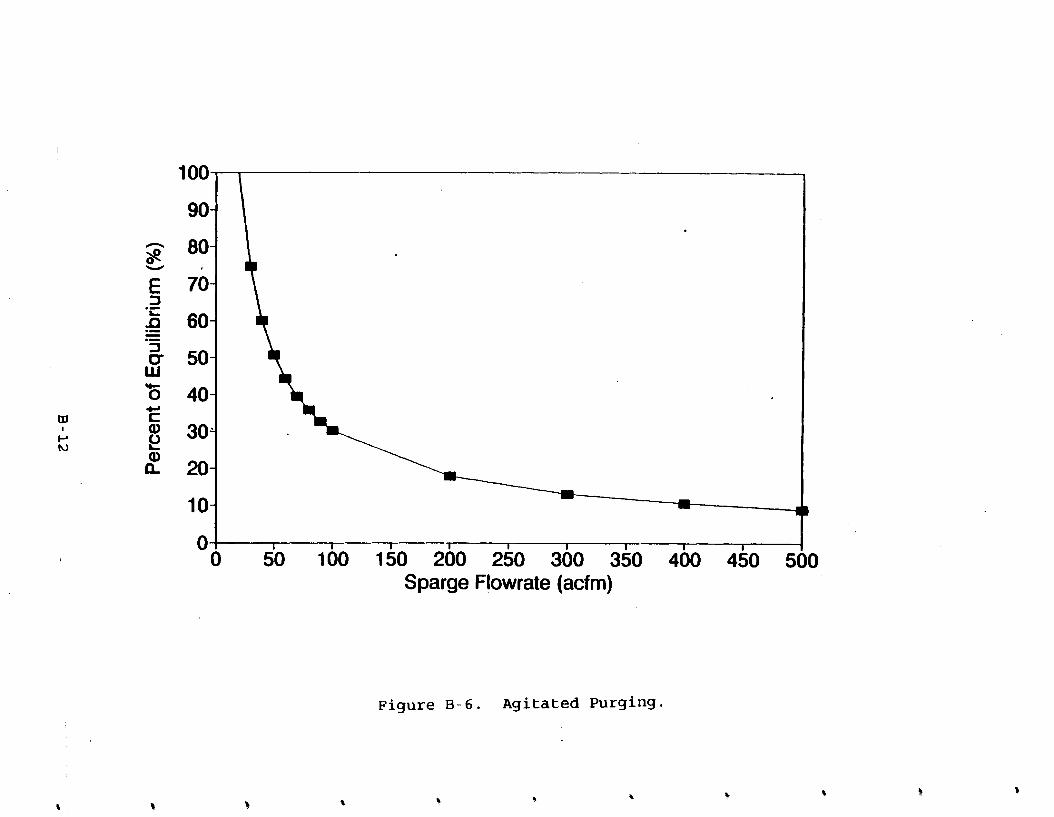
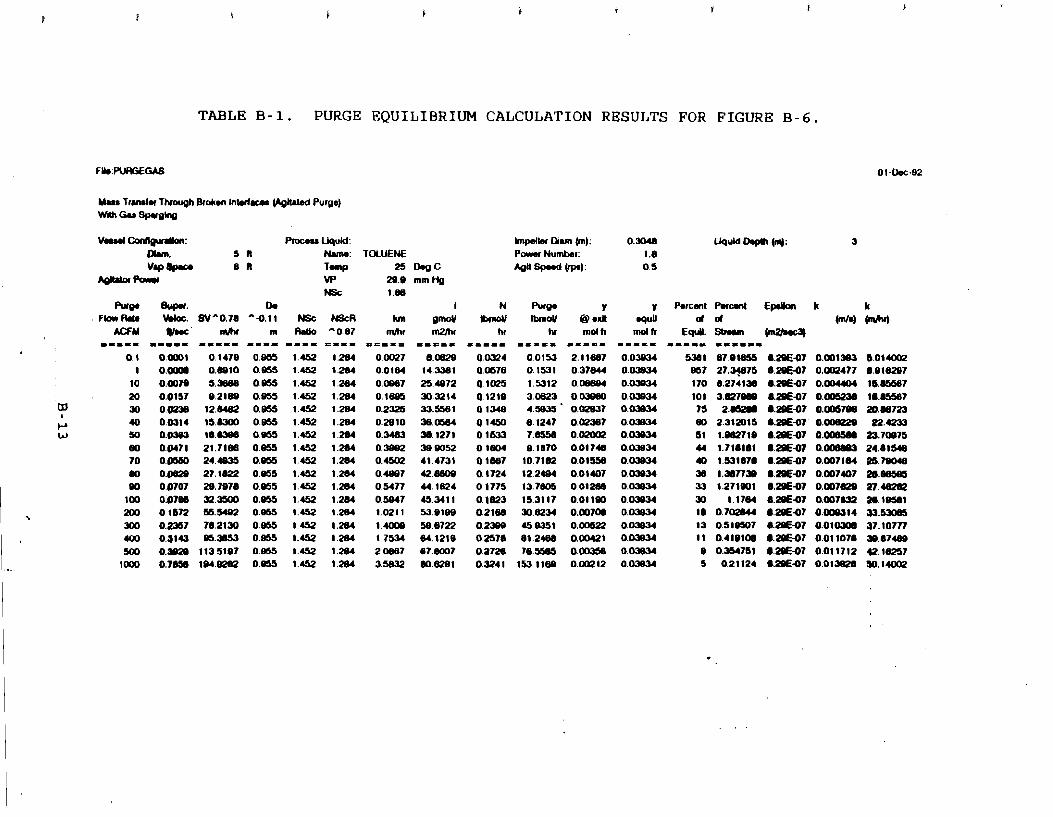
TABLE B - 1 . PURGE EQUILIBRIUM CALCULATION RESULTS FOR FIGURE B-6.
V s u l C o o ~ : P~MI UquM: Impdbc D i m (m): 0.m40
ohm. 5 R NUM: TOLUENE P- Numbel: 1.8 25 DsOc AOu w (rps): 0.5
29.8 mm HQ 1.m
1 km g m d
m h r m2/h(
====a 11PLI
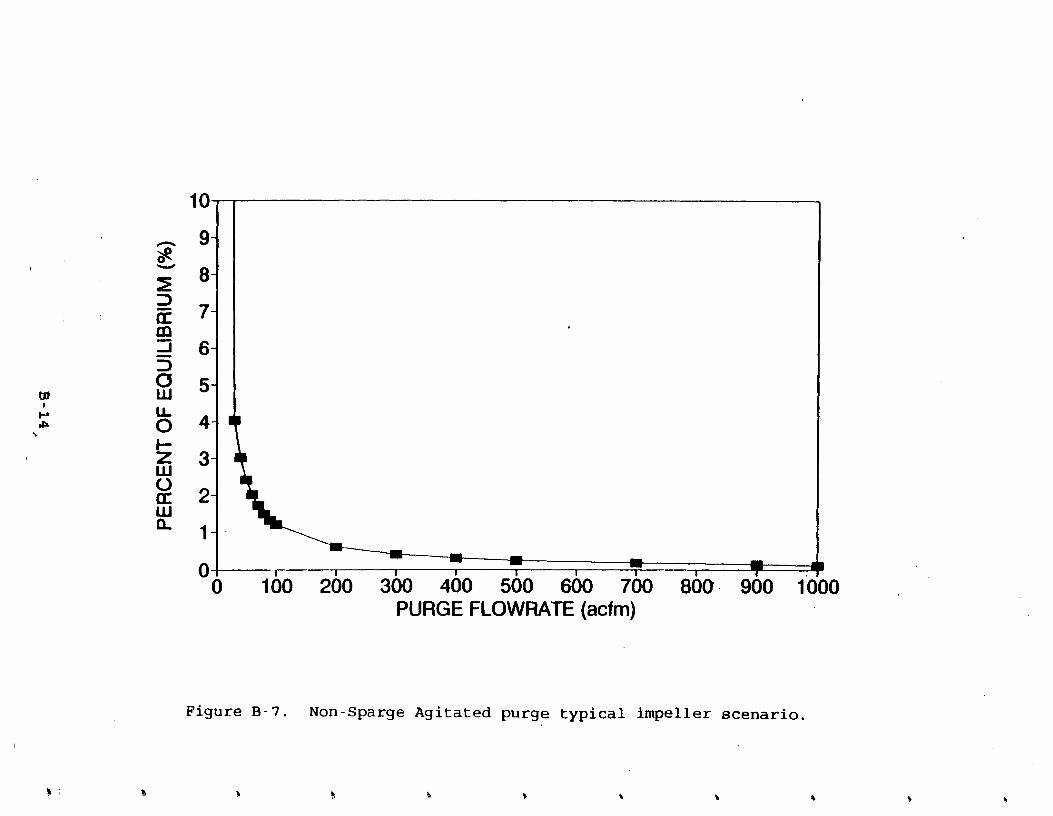

B. Baitated Purainq
Mass transfer at gas-liquid agitated interfaces during nitrogen purging was also examined using the following liquid phase mass transfer coefficient:
Figures B-7 and B-8 are the results of examining two different agitation scenarios. The first scenario, labelled the "typicaln impeller scenario, is identical to the sparge impeller example discussed previously. It considers the use of a 1-foot diameter impeller rotating at .5 revolutions per second. Y N l the power factor, is 1.6. The second scenario, presented in Figure B-8, considers the use of a 2-foot diameter impeller, rotating at 2 revolutions per second. The power factor also is higher, at 6.6. This scenario is termed "worst casen, as an approximation of the maximum turbulence encountered during such a situation. Notice that values approaching 80% saturation are shown corresponding to typical purge flowrates of 20 to 30 scfm in Figure B-8 (data in Table B-3). Saturation values are much lower for the typical impeller scenario in Figure B-7 (data in Table B-2).
IV. Conclusiong
The degree of saturation with VOC of a purge gas stream exciting a vessel containing VOC is highly dependent upon specific vessel geometries and liquid-vapor interface conditions. Values approaching complete saturation are not unrealistic for systems utilizing severe agitation or sparging, while much lower fractional saturation levels are expected for non-agitated purging events.
In order to provide a conservative, yet realistic approach to estimating the degree of saturation of an inert gas purge, the following guidelines are recommended:
1) for purge flowrates less than 100 scfm, assume that the vent streams exiting streams are completely saturated with VOCs.
(2) for purge flowrates greater than 100 scfm, assume that the vent streams exiting the vessel are 25% saturated with VOCs.
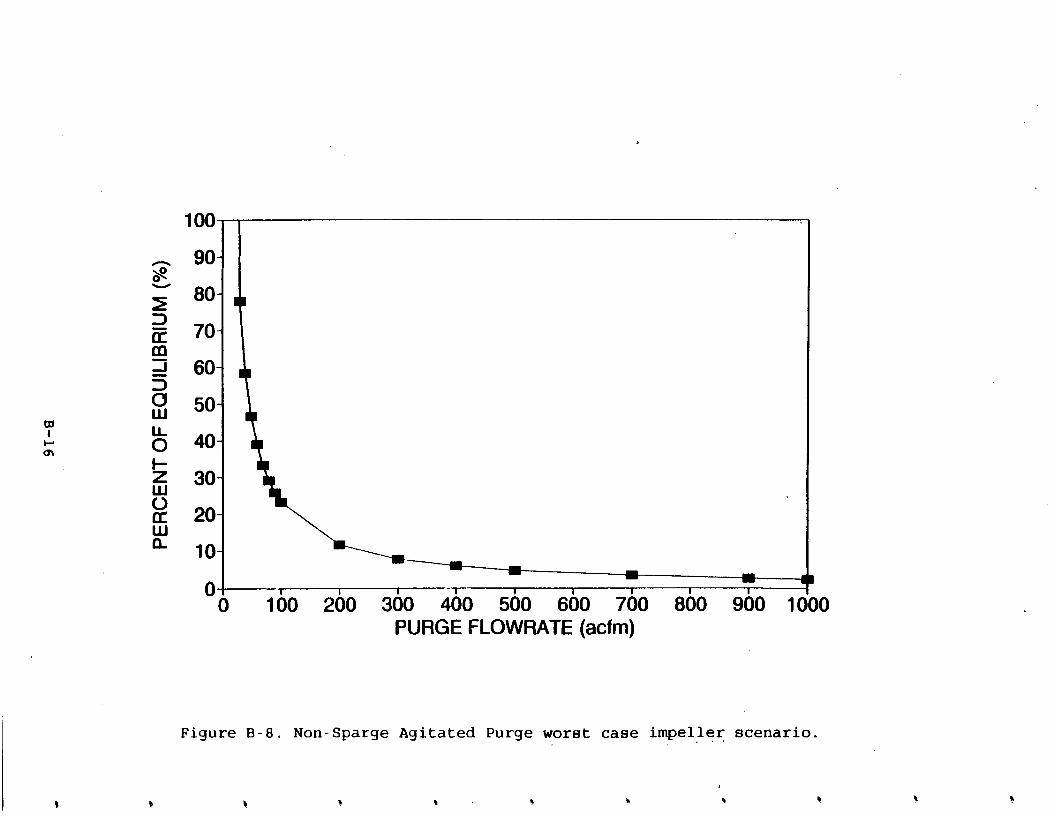
PURGE FLOWRATE (acfm)
Figure B-8. Non-Sparge Agitated Purge worst case impeller . . .. scenario.

N
~~
~-
oa
sa
aa
aa
ag
~~
~~
g
up
--
"rr :

TABLE B-3. PURGE EQUILIBRIUM CALCULATION RESULTS FOR FIGURE 8-8.
TOLUENE 25
28.9 1.M
Y O H cdh
11111
B.J(UB(I 0.83858 0.omM 0.03192 0.02121) 0.01588 0.01277 0.01084 0.00812 0.00780 0.00708 0.00BJB 0.00319 0.00213 0.00180 0.00128 0.00084
Y .qUY mdh
11111
-Calcul&&.~al Issue 2: Incremental Cost Analvsis of Manifolding .. Sinale Unit O o w i o n s to a Cpntrol Device
I. General
The incremental cost effectiveness of manifolding single unit operations to a control device was examined. Ductwork diameter for an emission source to a control device was estimated by assuming an average surficial velocity through the duct to be 2,000 ft/min. The duct costs are based on stainless steel, circular duct prices. The analysis describes ductwork cost as a function of length of ducting and emission source flowrate. Calculations are provided below. The results of the analysis show a minimum level of 500 pounds per year of VOC emissions is . necessary to yield an incremental cost effectiveness comparable to the average cost effectiveness of RACT. This is the deminimis level for applicability of RACT to any single unit operation. Figure B-9 shows the incremental ducting analysis results for 0 to 300 feet of duct versus mass emissions. Table 8-4 is the cost analysis data.
Calculationg
Assume: Velocity =
Flowrate =
Flowrate =
Flowrate
2,000 ft/min
2,000 ft/min
(Area) (velocity)
(rr2) (2,000 ft/min)
d2 -- r - 4
d (ft) = J(0.0064)(Flowrate)
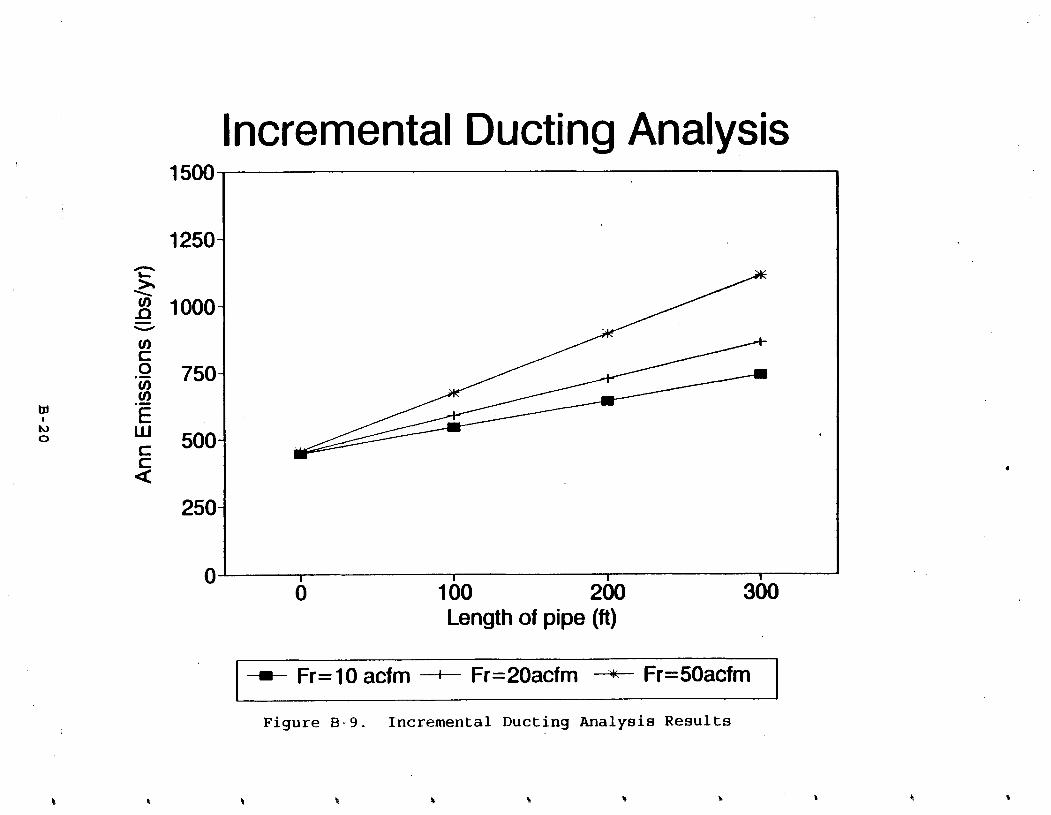

TABLE B-4. COST ANALYSIS DATA
0 la, 200 300 0
la, 200 300 0
1W 200 300
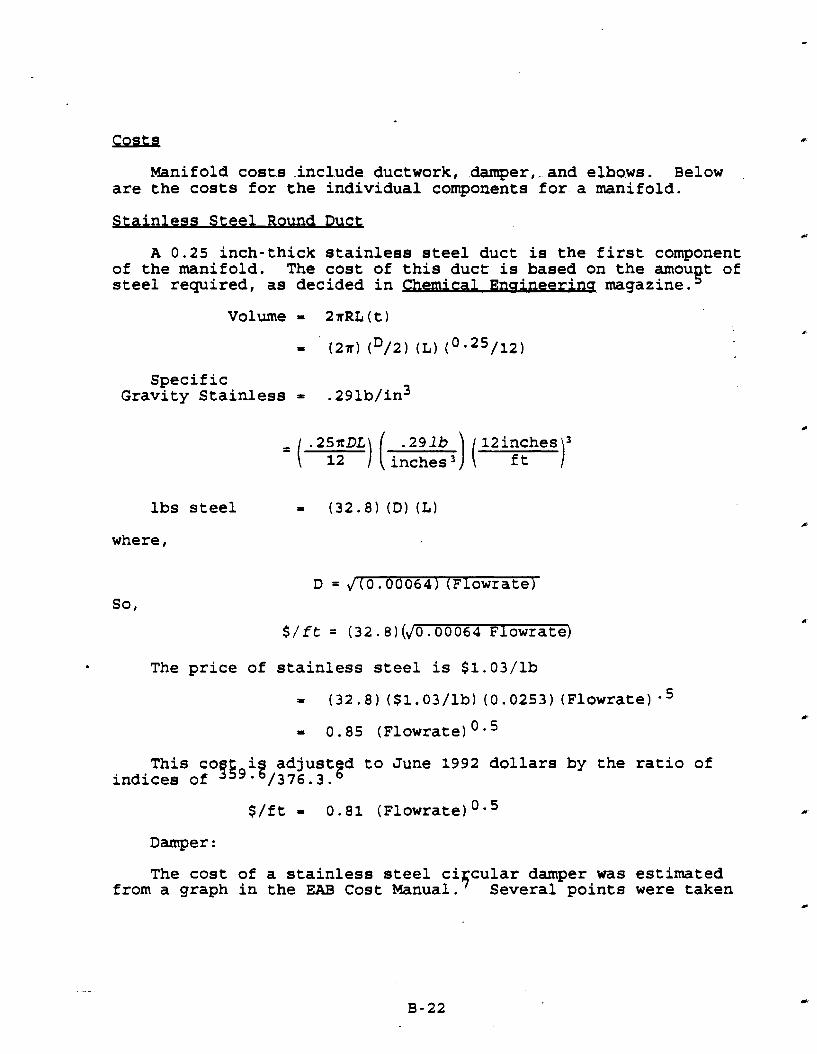
Costs
Manifold costs include ductwork, damper,-and elhows. Below are the costs for the individual components for a manifold.
nless Steel Round Duct
A 0.25 inch-thick stainless steel duct is the first component of the manifold. The cost of this duct is based on the amou t of steel required, as decided in memica1 Enufneeriag magazine. !
Volume = 2rRL(t)
Specific Gravity Stainless = .291b/in3
= ( -2:;DL) ( .29lb ) ( 12i;;he~)~ inches
lbs steel
where,
$/ft = (32.8)(40.00064 Flowrate)
The price of stainless steel is $1.03/lb
= (32.8) ($1.03/lb) (0.0253) (Flowrate)
= 0.85 (Flowrate) 0.5
This co ' adjust d to June 1992 dollars by the ratio of bindices of
$/it = 0.81 (Flowrate) 0.5
Damper :
The cost of a stainless steel ci cular damper was estimated from a graph in the EAB Cost Manual.' Several points were taken
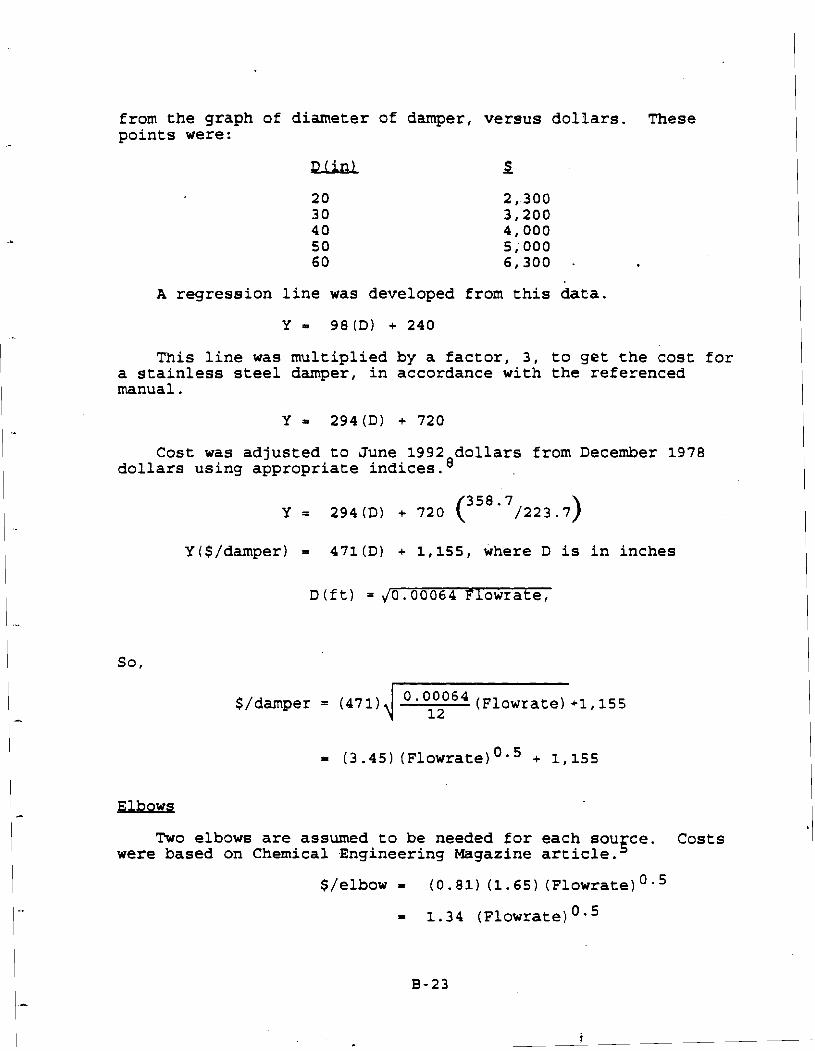
from the graph of diameter of damper, versus dollars. These points were:
A regression line was developed from this data.
Y = 98 (Dl + 240
This line was multiplied by a factor, 3, to get the cost for a stainless steel damper, in accordance with the referenced manual.
Cost was adjusted to June 1992 dollars from December 1978 dollars using appropriate indices. 8
y($/damper) = 471 (D) + 1,155, where D is in inches
~ ( f t ) ,/0.00064Flowrate,=
= (3.45) (Flowrate) Oo 5 + 1,155
Elbows
Two elbows are assumed to be needed for each sou ce. Costs were based on Chemical Bngineering Magazine article. f
$/elbow = (0.81) (1.65) (Flowrate) 0.5
= 1.34 (Flowrate) 0 . 5
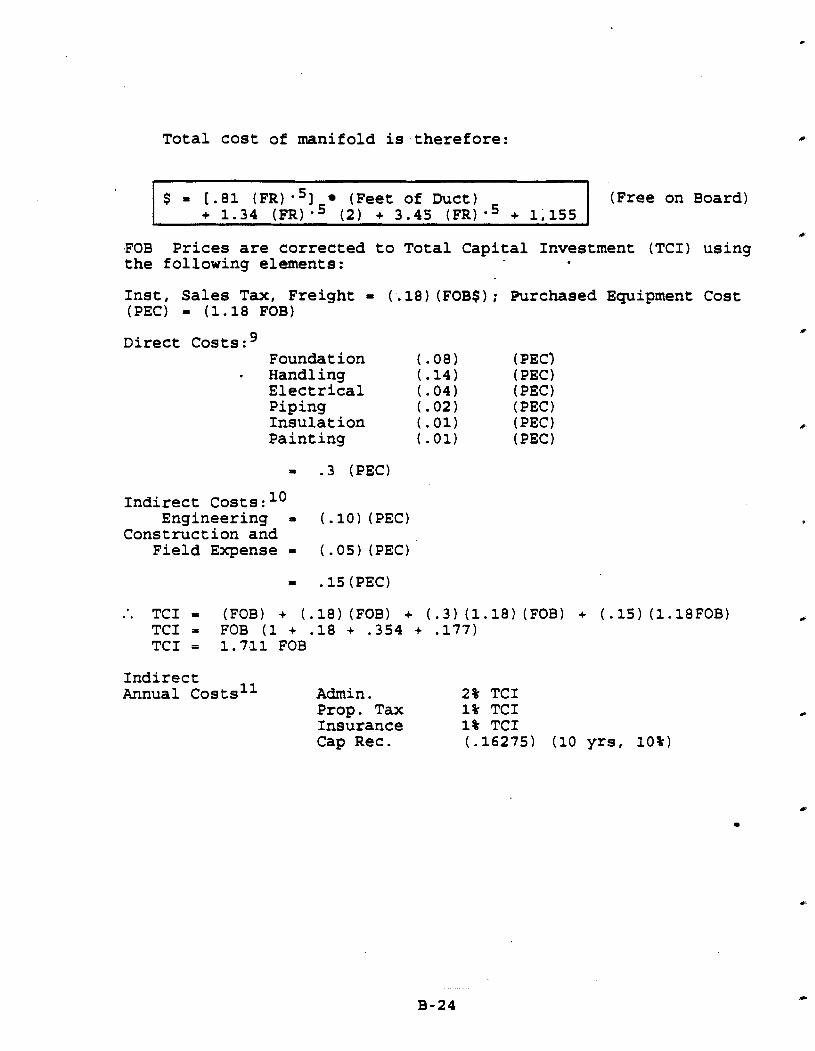
Total cost of manifold is therefore:
$ = [.81 (FR) (Feet of Duct) I (Free on Board) 1 + 1.34 (FR).' (2) + 3.45 (FR).' + 1,155 - - - -- -- -
Y
.FOB Prices are corrected to Total Capital Investment (TCI) using the following elements:
Inst, Sales Tax, Freight = (.I81 (FOBS); Purchased Equipment Cost (PEC) = (1.18 FOB)
Direct Costs : Foundation (.08) ( PEC) Handling (.I41 (PEC) Electrical (.04) (PEC) Piping (.02) (PEC) Insulation ( .01) (PEC) Painting (.01) ( PEC
Indirect Costs : lo Engineering = ( .lo) (PEC)
Construct ion and Field Expense = ( .Of) (PEC)
Indirect Annual ~ostsll Admin . 2% TCI
Prop. Tax 1% TCI Insurance 1% TCI Cap Rec . (.I62751 (10 yrs, 10%)
REFERENCES FOR APPENDIX B
Hawg, S. T. Toxic Emissions from Land Disposal Facilities. EnvirQDrnental Pr-, 1:46-52. February 1982.
Makay, D., and R. S. Matsugu, "Evaporation Rates of Liquid Hydrocarbon Spills on Land and Water," Can-
ulneeru, 51:434 (1973).
Gilliland, E. R., and T. K. Sherwood, -trial and , =:516 (1934).
Agitation in Multiphase Systems, U o c a r b o n Processinq, July 1979.
Chemical Engineering, May 1990, p. 127.
Chemical Engineering, September 1992, cost index.
Neveril, R. B., Gard, Inc. Capital and Operating Costs of Selected Air Pollution Control Systems. EPA450/5-80-002. December 1978.
Reference 6.
OAQPS Control Cost manual, EPA 450/3-90-006, January 1990.
10. Reference 10.
11. Reference 10.
APPENDIX C.
SAMPLE CALCULATIONS
Example 1. Vapor displacement of a single component liquid
Example 2. Vapor displacement of a homogenous mixture
Example 3. Tank/reactor heatup losses
Example 4 . Empty tank and reactor purging
Example 5. Filled tank and reactor purging
Example 6. Sparging volatilization
Example 7. Vacuum dryer emissions
Examp:.e 8. Atmospheric dryer emissions
Example 9. Vessel Depressurization
Example 10. Emissions from a steam ejector
Example 11. Emissions from equipment leaks
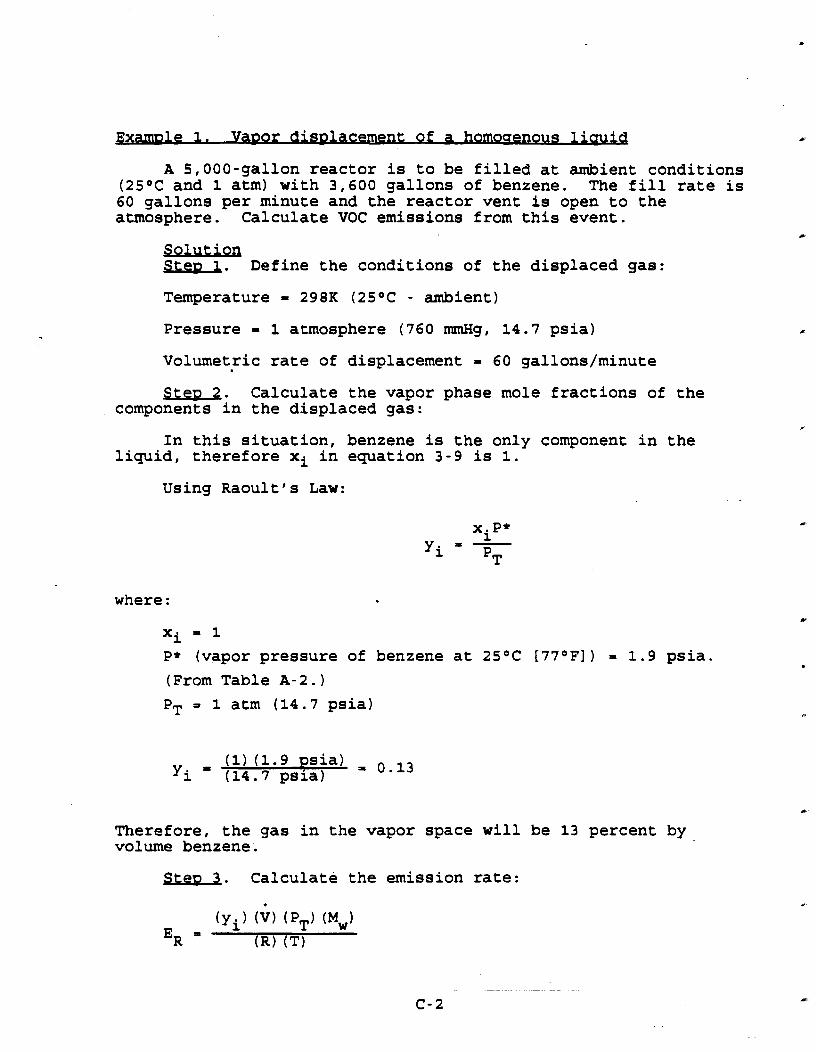
la cement of a homoaenous l i a
A 5,000-gallon reactor is to be filled at ambient conditions (2S°C and 1 atm) with 3,600 gallons of benzene. The fill rate is 60 gallons per minute and the reactor vent is open to the atmosphere. Calculate VOC emissions from this event.
Solutiw s e a.~ Define the conditions of the displaced gas:
Temperature = 298K (25OC - ambient)
Pressure = 1 atmosphere (760 rrunHg, 14.7 psia)
Volumetric rate of displacement = 60 gallons/minute
S t e ~2 . Calculate the vapor phase mole fractions of the components in the displaced gas:
In this situation, benzene is the only component in the liquid, therefore xi in equation 3-9 is 1.
Using Raoult's Law:
where :
Xi = 1
P* (vapor pressure of benzene at 2S°C E77OFI ) = 1.9 psia.
(From Table A-2.)
PT = 1 atm (14.7 psia)
Therefore, the gas in the vapor space will be 13 percent by volume benzene.
S t e ~3. Calculate the emission rate:

--
f . (0.13) (60 gal/rnin) (1 atrn) (78 lbrnol) ft3
7.48 galER = -(1.3144 atm ft3/lbmol K) (298K)
benzene
Since there are 3,600 gal of beqzene charged, the event will take
Therefore, total benzene emissions for this event are:
( 0.21 lb/rnin) ( 60 min/event = 12.6 lb/event
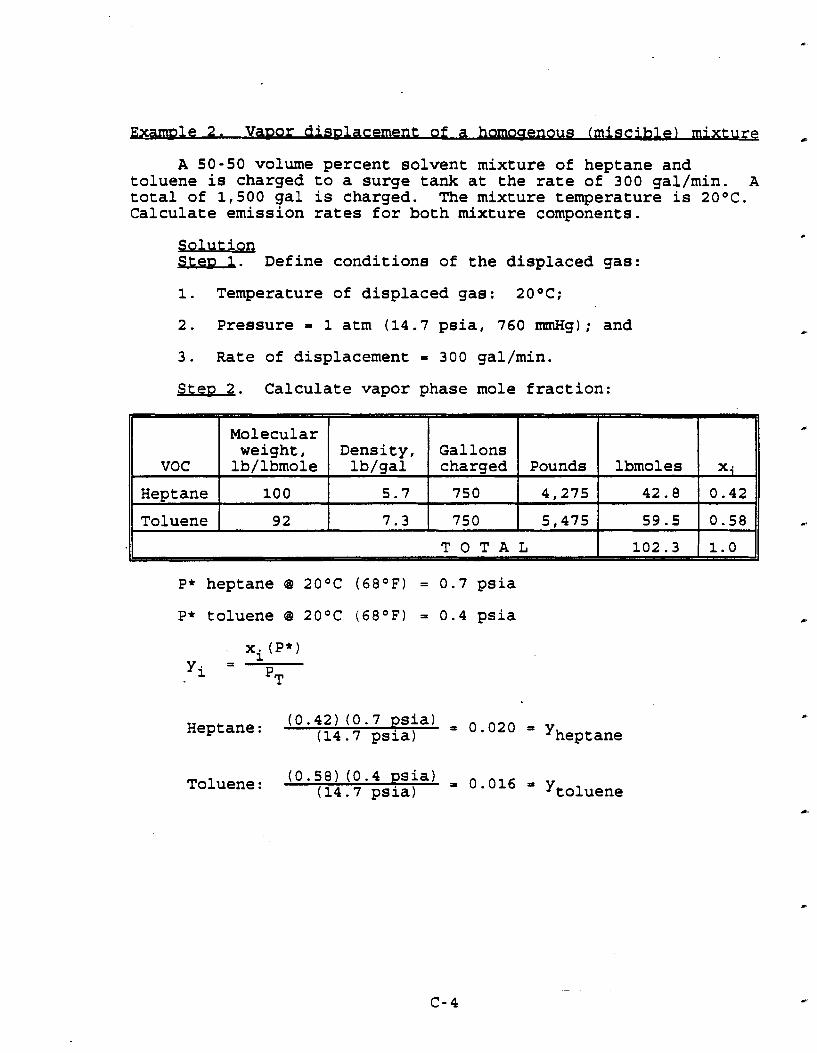
-Exam~le 2. VaDor U ~ l a c e m e n t of a homoqenous (miscible) mixture
A 50-50 volume percent solvent mixture of heptane and toluene is charged to a surge tank at the rate of 300 gal/min. A total of 1,500 gal is charged. The mixture temperature is 20°C. Calculate emission rates for both mixture components.
Solution SteD 1. Define conditions of the displaced gas:
1. Temperature of displaced gas: 20°C;
2. Pressure = 1 atm (14.7 psia, 760 mmHg); and
3. Rate of displacement = 300 gal/min.
S t e ~2. Calculate vapor phase mole fraction:
Molecular weight, Density, Gallons
VOC lb/lbmole lb/gal charged Pounds lbmoles xi
Heptane 100 5.7 750 4,275 42.8 0.42
Toluene 92 7.3 750 5,475 59.5 0.58
T O T A L 102.3 1.0
P* heptane @ 20°C (68OF) = 0.7 psia
P* toluene @ 20°C (68OF) = 0.4 psia
Heptane : (0.42) (0.7 psia) (14.7 psia) = 0'020 = Yheptane
Toluene : (0.58) (0.4 psia) (14.7 psia) = Ytoluene

S t e ~3. Calculate emission rate:
(Yheptane1 V (P,) (Mw)E = Rheptane %
(0.020) (300gal/min) (1atm) (100lb/lbmol)--
ERheptane 1.3144 atm ft3/lbmol K) (293K)
( Y v toluene)
P ) T
(M 1 w
E = R R toluene T
. .
ft3 -7
(0.016) (300gal/min) (1atm) (92lb/lbmol)- 1
7.48 gal r
1.3144 atrn ft' lbrn01K
Therefore, total emissions for the event
Heptane: (0.21 lb/min)( 5 min) = 1 lb
Toluene (0.15 lb/min)(5 min) = 0.75 lb
1
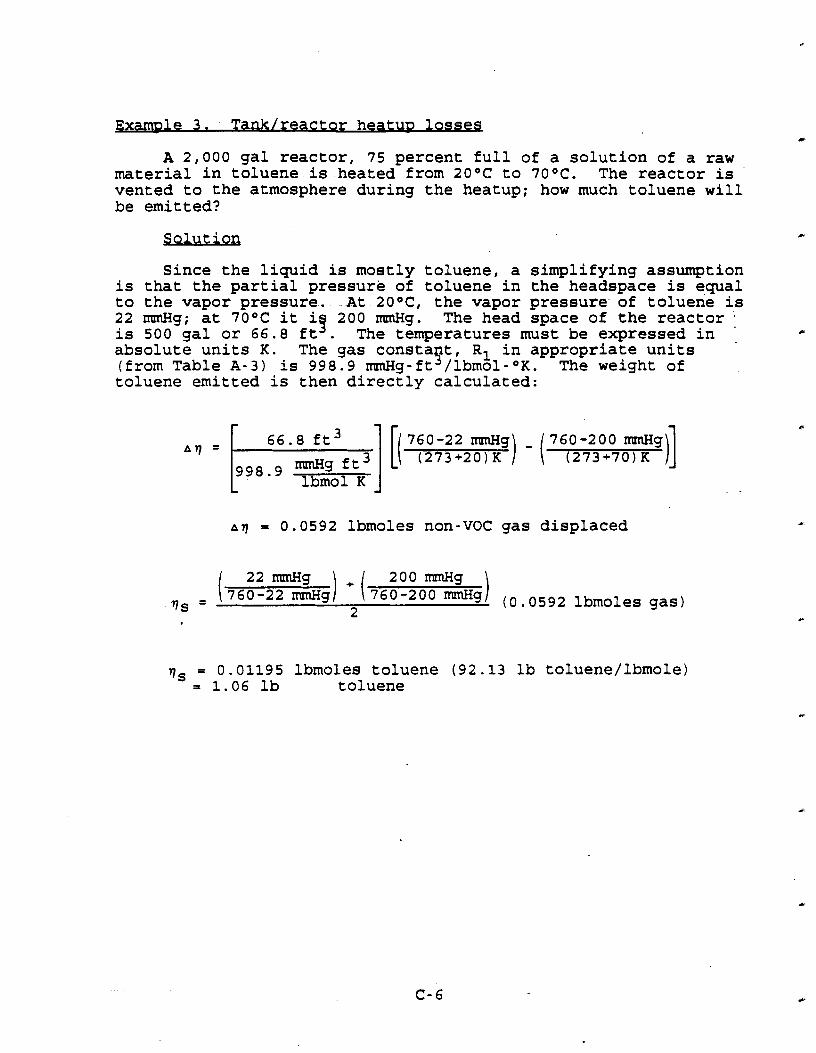
A 2,000 gal reactor, 75 percent full of a solution of a raw material in toluene is heated from 20°C to 70°C. The reactor is vented to the atmosphere during the heatup; how much toluene will be emitted?
Since the liquid is mostly toluene, a simplifying assumption is that the partial pressure of toluene in the headspace is equal to the vapor pressure. At 20°C, the vapor pressure of toluene is 22 rrunHg; at 70°C it iy 200 nmHg. The head space of the reactor . is 500 gal or 66.8 ft . The temperatures must be expressed in '
absolute units K. The gas consta t, R1 in appropriate units I f(from Table A-3) is 998.9 rrunHg-ft /lbmol-OK. The weight of toluene emitted is then directly calculated:
760-22 rrunHg 760-200 nanHg (273+2O)K ) - ( (273+70)KmmHg ft
lbmol K
A T P 0.0592 lbmoles non-VOC gas displaced
200 m g
'Is = ( 7 6 i ? 2 F A g +2( 760-200 mgi (0.0592 lbmoles gas)
'Is = 0.01195 lbmoles toluene (92.13 lb toluene/lbmole) = 1.06 lb toluene
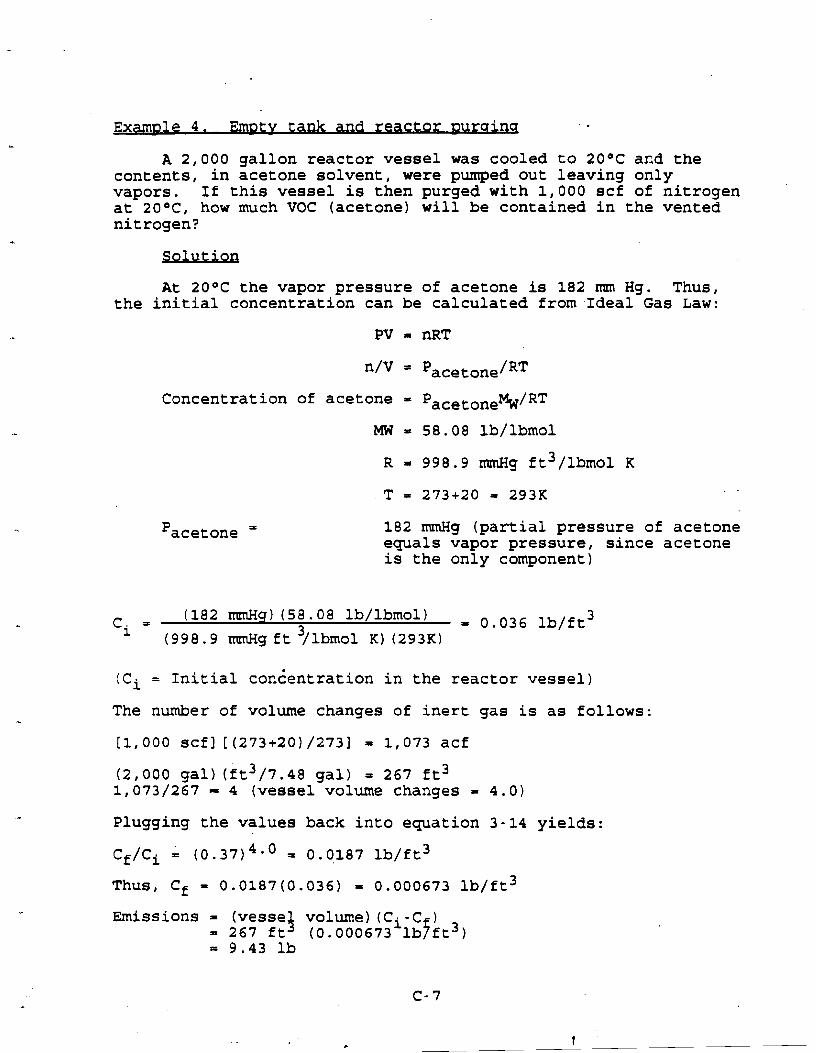
Exam~l 4. E m ~ t vtank and reactor nurainq e
A 2,000 gallon reactor vessel was cooled to 20°C axd the contents, in acetone solvent, were pumped out leaving only vapors. If this vessel is then purged with 1,000 scf of nitrogen at 20°C, how much VOC (acetone) will be contained in the vented nitrogen?
At 20°C the vapor pressure of acetone is 182 mm Hg. Thus, the initial concentration can be calculated fromIdeal Gas Law:
n/V = Pacetone /RT
Concentration of acetone = PacetoneMW/RT
MW = 58.08 lb/lbmol
'acetone = 182 mmHg (partial pressure of acetone equals vapor pressure, since acetone is the only component)
(Ci = Initial con6entration in the reactor vessel)
The number of volume changes of inert gas is as follows:
(2,000 gal) (ft3/7.48 gal) = 267 ft3 1,073/267 - 4 (vessel volume changes = 4.0)
Plugging the values back into equation 3-14 yields:
Thus, Cf = 0.0187(0.036) = 0.000673 lb/ft3
Emissions = (vessei volume) (Ci-C 1 = 267 ft (0.000673 lbfft3) = 9.43 lb
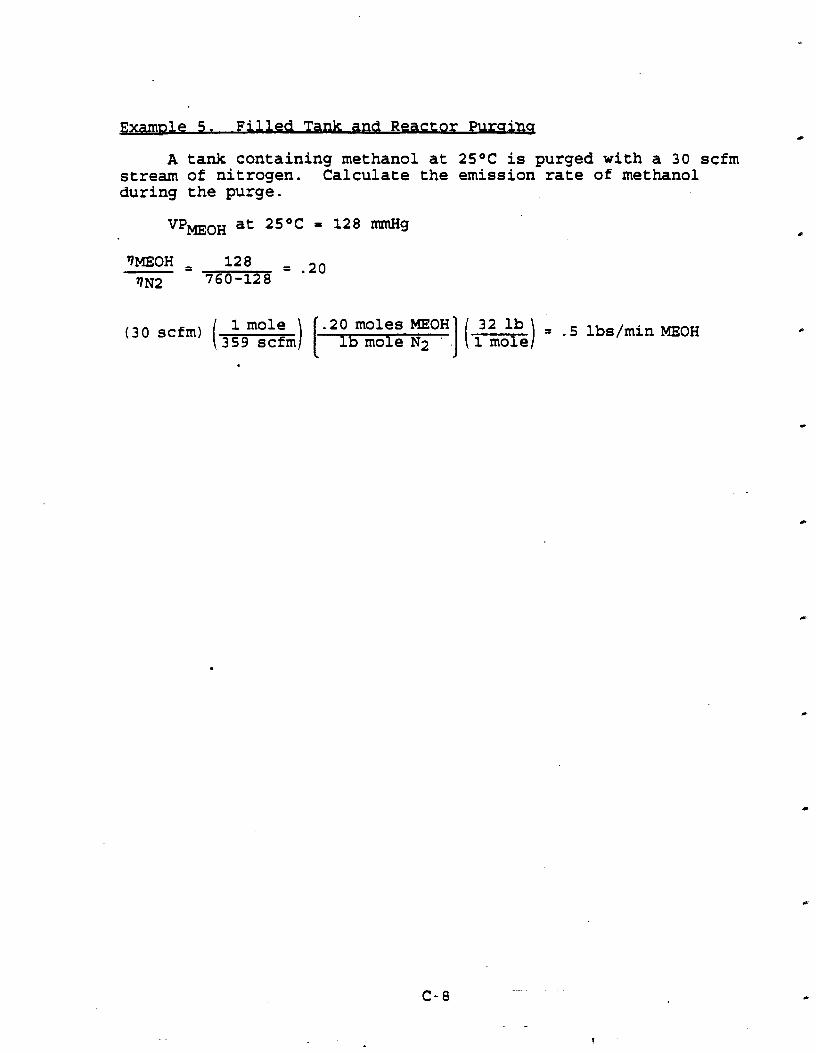
A tank containing methanol at 2S°C is purged with a 30 scfm stream of nitrogen. Calculate the emission rate of methanol during the purge.
'IMEOH -, 128 ,.20 'IN2 760-128
1 mole -20 moles MEOH 32 lb = . lbs,min MEOH (30scfm) (359 scfm) [ ib mole N2 ] (m)
a .Example 6. Calculation of S~aruins Volatlllzatioq
A 1,000-gal tank of wastewater containing 0.025 wt% toluene is to be air sparged to remove the toluene to a concentration level of less than 20 ppb (by weight) to permit discharge to a municipal sewer system. Ambient air is to be used; the design temperature is 20°C. Toluene-water vapor-liquid equilibrium at 20°C can be approximated using a Henry's Law constant of 370 atm (Henry's Law constants are listed in the Appendix).
@roach: Use 1 minute time slices, assume a sparge rate, calculate time required to achieve concentration objective, adjust sparge rate until reasonable cycle time is calculated. Because of standard geometry of 1,000-gal tank, and modest gas rates, 100 percent of equilibrium concentration can be assumed. Table C-1 summarizes the results of the calculations made using a personal computer spreadsheet program. With 75 acfm of sparge gas, the desired concentration of 20 ppb toluene is achieved in 55 minu.tes of sparging. The table clearly shows that the bulk of the VOC is removed during the early part of the cycle: one-half of the total toluene is removed in the first 3 minutes, and 90 percent is removed after 13 minutes. This typical concentration profile for batch sparging makes the selection of control technology (described elsewhere in this report) somewhat- challenging.

- - - - - - - - - - - - - - - - - -
TABLE C-1. SPARGING VOLATILIZATION
*Tank VOlunc 1000 Gal Moles of HZ0 462.26 lb-moL
*Sparge Rate 75 wfm 0.19465 lbmol/min
20 oeg C 760 1ng
Toluau 0.OtSXwt X
0302260167 0 . 0 0 5 ~ 1X
*w of vOC 92.14 *Henry's Const . 370 atm *Exit Gas Equii. 100.00% *Tim Slice 1 min
Percent x-krlk y-exit . -1s out cun art m x-b-_ - - - - ut f r .-----Rw v a l
Time Incrcmnt 0 0.000048 0.018090 0.003521 0.003521 0.000061 2.111-04 15. 580% 1 0.000041 0.015271 0.002972 0.006494 0.000034 1 . m - 0 4 28.733% 2 0.000031 0.012892 0.002509 0.009003 0.000029 1.SOE-04 39.837X 3 0.000029 0.010883 0.002118 0.011122 0.000024 1.27E-04 49.210% 4 0.000024 0.0091M 0.001788 0.012910 0.000020 1.07E-04 57.123% s 0.000020 o.oom6 o.001~09 0 . 0 1 ~ 2 0 o.ooooi7 9.05~-os 63.804% 6 0.000017 0.006548 0.001274 0.015695 0.000014 7.641-05 69.443% 7 0.000014 0.005527 0.001076 0.016771 0.000012 6.45E-05 74.204% 8 0.000012 0.004666 0.000906 0.017679 0.000010 S.UE-05 78.223% 9 0.000010 0.003939 0.000766 0.018466 0.000008 4.60E-05 81.616%
10 0.000008 0.003325 0.000647 0.019093 0.000007 3 . m - 0 5 81.680% 11 0.000007 0.002807 0.000516 0.0196&0 0.000006 3.28E-05 86.898% 12 0.000006 0.002370 0.000461 0.020101 0.000005 2 . m - 0 5 88.939% 13 0.000005 0.002000 0.000389 0. OZUPl 0.000004 2.33E-05 90.663% 14 0.000004 0.001689 0.000328 O.OtO8l9 0.000003 1 .WE-05 92.118% 15 0 .OOOOO3 0.001425 0.000277 0.021097 0.000003 1 .ME-05 93.346% 16 0.000003 0.001203 0.000234 0.021331 0.000002 1.4OE-05 94.382% 17 0.000002 0.001016 0.000197 0.021529 0.000002 1 .l9E-05 9s. 258% 18 0.000002 0.000857 0.000166 0.021696 0.000001 1.00E-05 9s. 006% 19 0.000001 0.000724 0.000140 0.021837 0.000001 8.4%-06 96.620% 20 0.000001 0.000611 0.000119 0.0219S6 0.000001 7.13E-06 9 7 . 1 4 n 21 0.000001 0.000516 0.000100 0.022057 0.000001 6.02E-06 97.591% 22 0.000001 0.000435 0.000081 0.022141 9.941-07 5 . W - 0 6 97.967X 23 9.941-07 0.000367 0.000071 0.022213 8.3%-07 4 . a - 0 6 98.283% 24 8.3%-07 0.000310 0.000060 0.022273 7.0%-07 3.62E-06 98.551% 25 7.0%-07 0.000262 0.000051 0.022324 5.91-07 3.06E-06 9 8 . m 26 5 .91-07 0.000221 0.000043 0.022368 S.OSE-07 2.58E-06 98.967% 27 5.051-07 0.000186 0.000036 0.022404 4.26E-07 2.1%-06 00.128% 28 4.26E-07 0.000157 0.000030 0.022435 3.601-07 1 99.264% 29 3.60E-07 0.000133 0.000025 0.022161 3.041-07 1.SSE-06 00.379% 30 3.041-07 0.000112 0.000021 0.022602 2.56E-07 1.31E-06 00.475% 31 2.56E-07 0.000094 0.000018 0.022501 2.17E-07 l . l lE-06 w.ss7X 32 2.17E-07 0.00001X1 0.000015 0.022516 1.83E-07 9.35E-07 00.626% 33 1.831-07 0.000067 0.000013 0.022530 1.54E-07 7.8%-07 00.684% 34 1 .5&-07 0.000057 0.00001 1 0.022541 1.30E-07 6.66E-07 00. n 4 x
35 1.301-07 0.000W8 0.000009 0.022550 1.lOE-07 5.62E-07 00.77% 36 1.10E-07 0.000WO 0.000007 0.022558 9.28E-08 4.751-07 99.8103 37 9.21-08 0.000031 0.000006 0.022565 7.04E-08 4.01E-07 99.840% 38 7.041-08 0.000028 0.000005 0.022570 6.62E-08 3.38E-07 00.865%

TABLE C-1. (Continued)

Example: Consider the following exampl-e-of a double-cone dryer operating at 15 inches of mercury, with an air-leakage rate of 15 scfm. The temperature inside the dryer is 60°F. Three hundred pounds of product cake, initially containing 25 percent by weight acetone are dried to less than 1 wt% solvent over the course of 8 hours. Calculate the maximum VOC emission rate.
Solution. The total amount of acetone dried from the product cake is:
:. 300-75 = 225 lb product in cake The amount of acetone remaining at the end of the cycle is:
x = (0.01) (225+x) x = 2.25*0.01x
0 . 9 9 ~= 2.25 x = 2.3 lb acetone (at end of cycle)
:. Therefore, the total amount of acetone removed from the drying cycle is:
Average emission rate over the drying cycle is:
(73 lb/8 h) (1 h/60 min) = 9.15 lbhin average dryer emission rate
The initial drying rate is two times the average rate, assuming a straight-line decline.
Maximum (initial drying rate)
Therefore, the molar flow of acetone is (0.30 lb/min) (lbmol/58 lb) (60 min/hr) = 0.31 lbmol/h

The airflow (leakage) is given as 15 scfm where 359 scf (at O°C and 1 atm) is 1 mole. Therefore, the airflow is
Therefore, the uncontrolled emission stream at the start of the drying cycle is estimated to be:
Component lbmol/h mole fraction
Acetone 0.31 0.110
Air 2.51 0.890
11 T 0 T'A L
This rate represents the maximum VOC emission rate during the cycle.,

Examnbe 8. Atmospheric drver emissiong
m. A tray dryer uses 6,000 acfm of heated air (65OC) over a period of 6 hours to remove isopropyl alcohol (IPA) from a batch of solids. Each batch consists of 1,000 pounds of material containing 40 percent (by weight) solvent. The final product contains less than 0.6 percent solvent. Calculate the total uncontrolled VOC emissions per drying cycle and the maximum VOC emissions rate.
Mass balance over the drying cycle:
(1,000 lb cake) (0.40 lb 1P~/lb cake) = 400 lb IPA initially
Quantity of bone-dry solids = 1,000-400= 600
Amount of IPA remaining: x/600+x = 0.006
:. x = 3.6 lb IPA
Amount of IPA removed is:
Average emission rate = 396 lb/6 h = 66 lb/h
Assume initial rate = 2 * average rate
Calculate composition of uncontrolled emission stream at start of drying cycle:
Airflow:
Knowledge of, or an estimate of (as above) the uncontrolled outlet stream composition is necessary to select an appropriate control technology. One should note that the mole fraction of the VOC is considerably lower (approximately two orders of magnitude) in the convective oven exhaust than in the vacuum oven (previous example) .
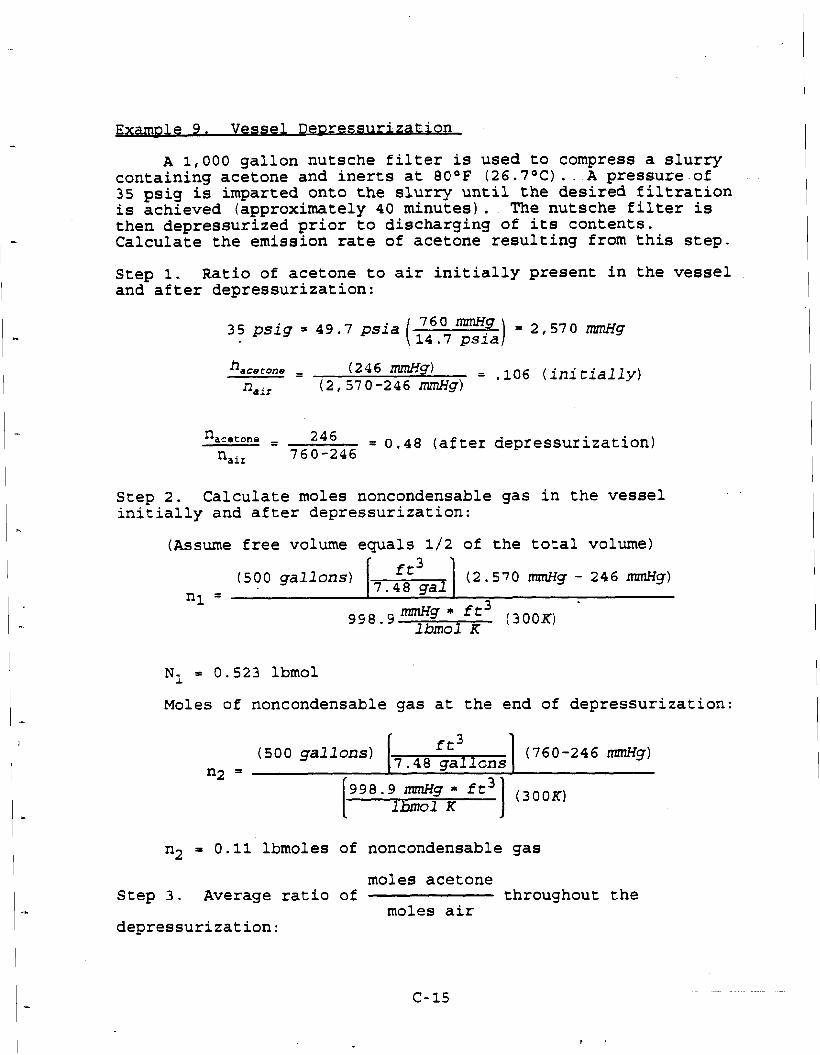
E X ~ Q ~ P Vessel De~ressarat 9. ion
A 1,000 gallon nutsche filter is used to compress a slurry containing acetone and inerts at 80°F (26.7OC). A pressure of 35 psig is imparted onto the slurry until the desired filtration is achieved (approximately 40 minutes). The nutsche filter is then depressurized prior to discharging of its contents. Calculate the emission rate of acetone resulting from this step.
Step 1. Ratio of acetone to air initially present in the vessel and after depressurization:
( 1746,: z:)35 psig = 49.7 psia = 2,570 mmH9
hiacecone = (246 mmHg) = ,106 (initially)nair (2,570-246 m..Hg)
= '*' = 0.48 (tfter depressurization) I& 760-246
Step 2. Calculate moles noncondensable gas in the vessel initially and after depressurization:
(Assume free volume equals 1/2 of the total volume) . f t 3(500 gallons)
7.48 gal (2.570 mmHg - 246 mmHg)
nl = -
998.9 mmH9 * Klbmolf t 3 (300K) '
N1 = 0.523 lbmol
Moles of noncondensable gas at the end of depressurization:
n2 = 0.11 lbmolcs of noncondensable gas
moles acetone Step 3. Average ratio of throughout the
moles air depressurization:
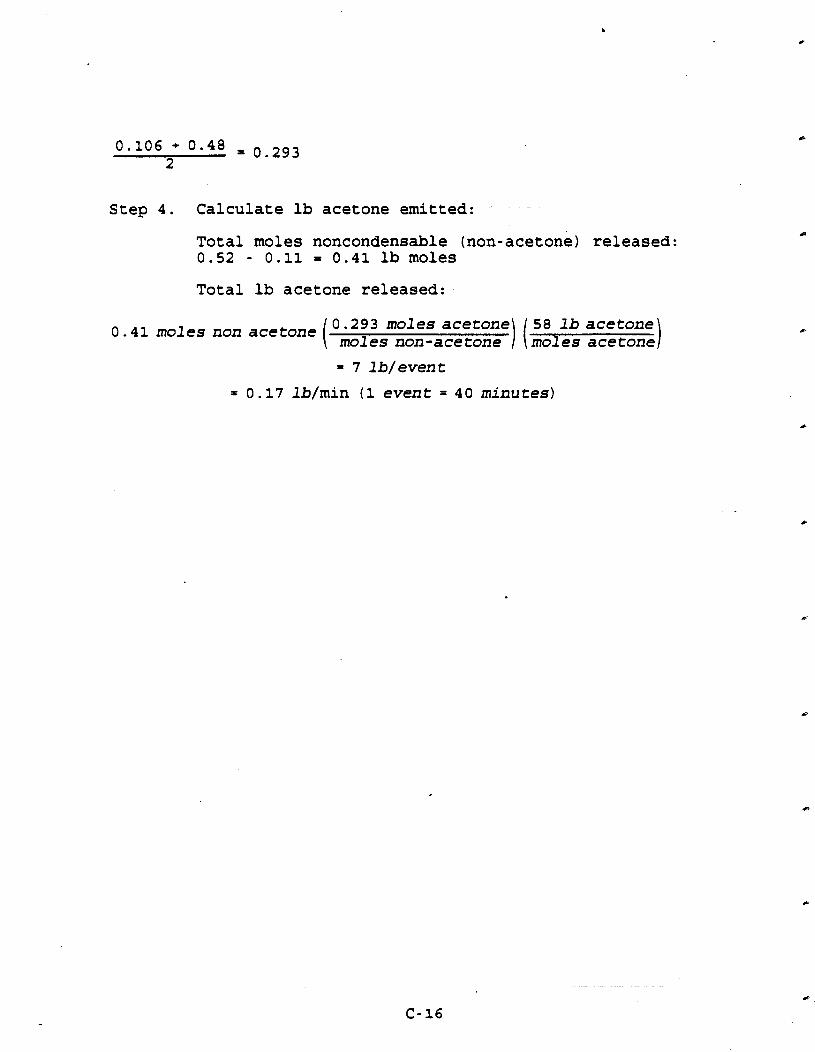
Step 4. Calculate lb acetone emitted:
Total moles noncondensable (non-acetone) released: 0.52 - 0.11 = 0.41 lb moles
Total lb acetone released:
58 lb acetone0.41 moles non acetone 0.293 moles acetone moles non-acetone moles acetone
= 7 lb/event
= 0.17 lb/min (1 event = 40 minutes)
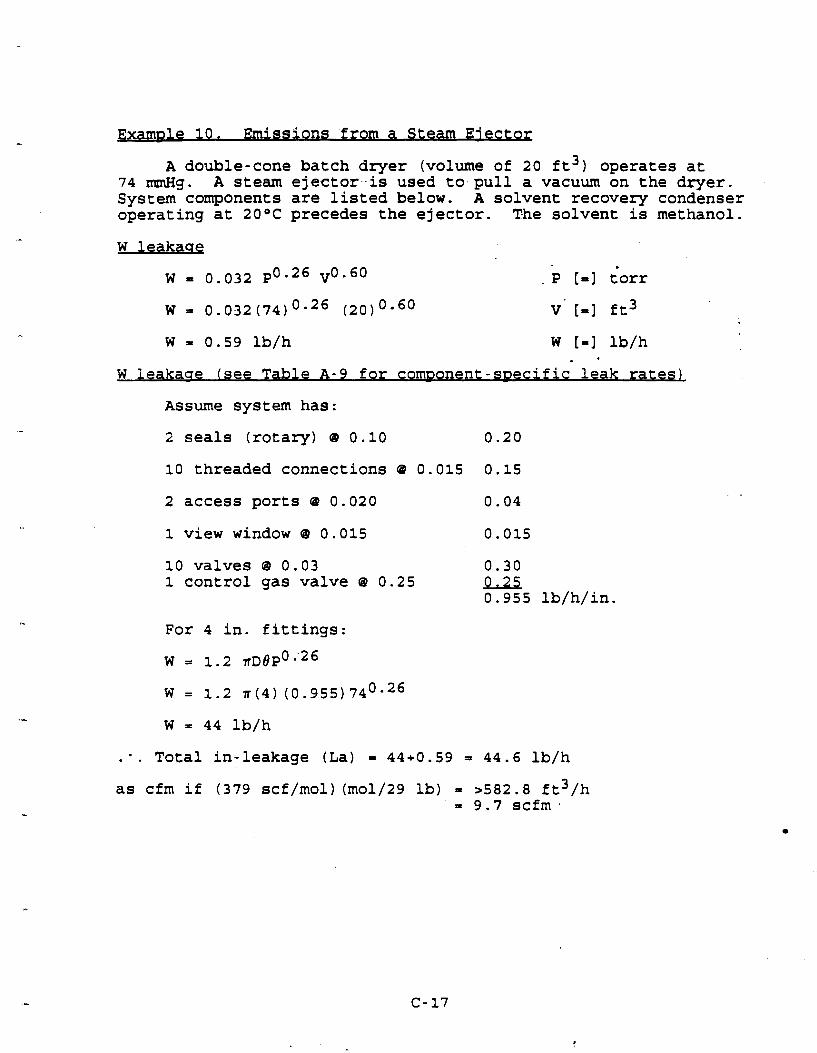
Examnl~10. Emissions from a Steam Ejector
A double-cone batch dryer (volume of 20 ft3) operates at 74 m H g . A steam ejector is used to pull a vacuum on the dryer. System components are listed below. A solvent recovery condenser operating at 20°C precedes the ejector. The solvent is methanol.
W leakaae
W = 0.032 voe60 P 1-1 torr
W = 0.032(74) 0.26 (20)0.60 v' [ = ] ft3
W = 0.59 lb/h W [ = I lb/h
. a
W leakaae (see Table A-9 for com~onent-s~eclf~c leak rates)
Assume system has:
2 seals (rotary) @ 0.10 0.20
10 threaded connections @ 0.015 0.15
2 access ports @ 0.020 0.04
1 view window @ 0.015 0.015
10 valves @ 0.03 0.30 1 control gas valve @ 0.25 0.25
0.955 lb/h/in.
For 4 in. fittings:
W = 1.2 H D ~ P O . ~ ~ ~
:. Total in-leakage (La) = 44+0.59 = 44.6 lb/h
as cfm if (379 scf/mol) (rnol/29 lb) = >582.8 ft3/h ' = 9.7 scfm.
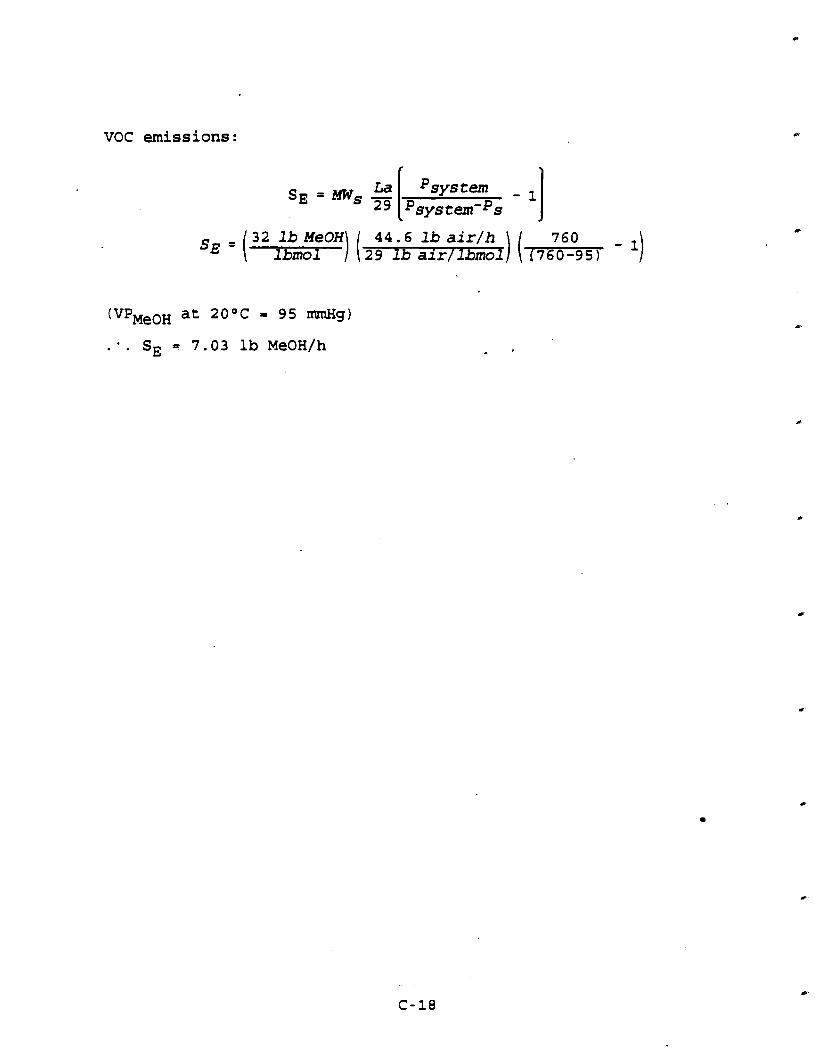
VOC emissions:

Examnle 11. Calculation of Rmissio11~ from Eau-ent Leakg
Estimate VOC emissions from a facility process having the following components in light liquid service 100 percent of the time.
18 flanges
1 gas valve
5 liquid valves
1 sampling connection
3 open-ended lines
Multiply by equipment leak factors found in Table A - 6 .
Euui~ment leakg
1 Pump
(0.0199 kg/h)(1) 100 percent service
18 flanges
(0.001831 (18) 100 percent service - 0.0329
1 gas valve
(0.00597) (1) 100 percent service
1 S.C.
(0 .0150) (1) 100 percent service 0.0150
3 O . E . L .
(0.0017)( 3 ) 100 percent service Qd!QzL 0.07887
APPENDIX D.
COST CALCULATIONS

d Infonnation/Introduction tg Device Model C a u t l o ~
The attached documentation details the calculations and assumptions that were used to arrive at the control device cost effectiveness cumes used to set RACT. The documentation .requires some preliminary discussion of certain issues because of the complexity of the approach. This preface is intended to provide this necessary background. Note also that the basis for much of the assumptions used in estimating costs is the fourth edition of the OAQPS Control Cost Manual, prepared by the Emission Standards Diviaion of the Office of Air Quality Planning and Standards, U. S. Environmental Protection Agency, Research . Triangle Park, NC 27711.
Disrussion
Time Variation
One of the major ideas behind RACT for batch processes is the consideration of on-stream emission event duration. The calculations assume a certain mass emissions value, in lbs/year. Mass emissions is really the annual VOC emission rate from the
- batch process vent(s) considered to be controlled. By making mass emissions an input variable, and by setting the VOC concentration and the emission stream flowrate (i.e., these parameters are also input), the models are designed to calculate a value of on-stream emission event duration, which we call "time var." This "time varn value is used throughout the model to .
calculate control device costs and cost effectiveness. The ''time var" or time variation field should not be confused with the initial duration input as 60 minutes. It was assumed that each event took 60 minutes initially to calculate emissions per event and heat load per event, but considered the number of events per year that would actually be occurring using time var (which is the fraction of continuous emissions). Note, also, that operation and maintenance costs are calculated on a per shift basis.
For those combinations of mass emissions and flowrate that yielded time var values of less than .33, only 1 shift per day was assumed. For time var between .33 and .66, 2 shifts per day were assumed, and 3 shifts per day were assumed for time var s.66.
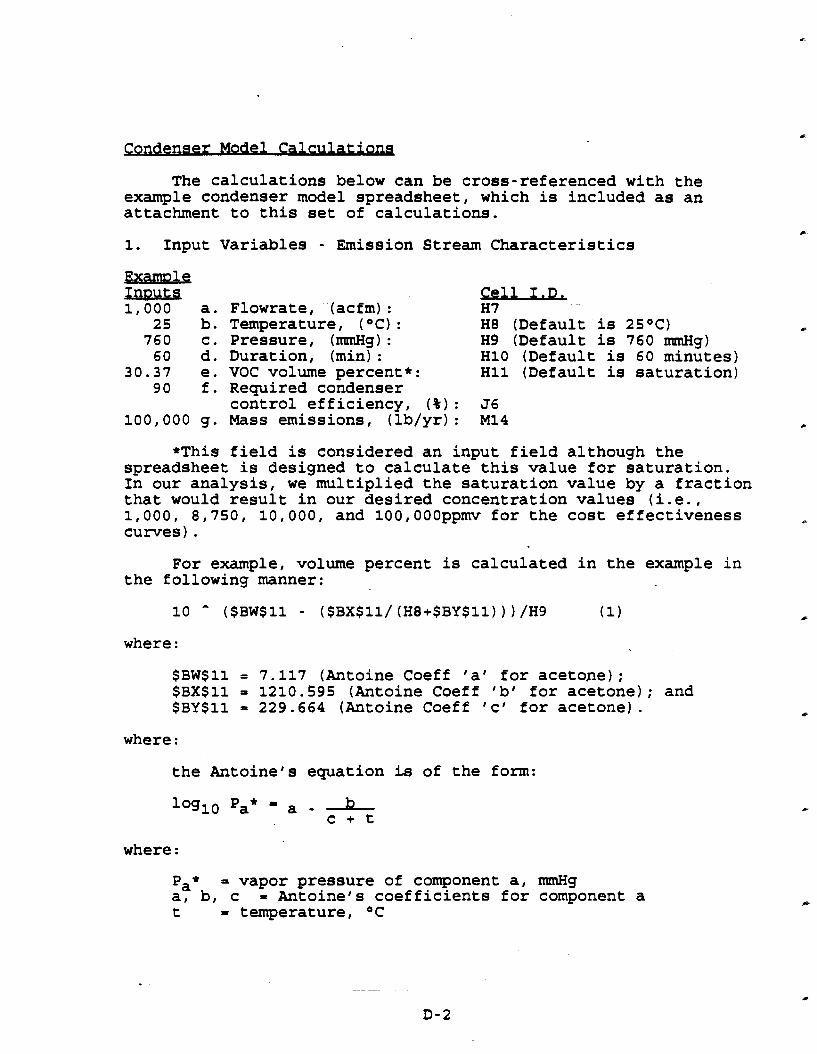
Condenser Model Calrulationa
The calculations below can be cross-referenced with the example condenser model spreadsheet, which is included as an attachment to this set of calculations.
1. Input Variables - Emission Stream Characteristics -Flowrate, (acfm) : H7 Temperature, (OC) : H8 (Default is 2S°C) Pressure, (nanHg) : H9 (Default is 760 nanHg) Duration, (min) : HI0 (Default is 60 minutes) VOC volume percent*: HI1 (Default is saturation) Required condenser control efficiency, % : 56 Mass emissions, b r : MI4
field is considered an i n ~ u t field althouah the spreadsheet is designed to calculate* this value for gaturation. In our analysis, we multiplied the saturation value by a fraction that would result in our desired concentration values (i.e., 1,000, 8,750, 10,000, and 100,000ppmv for the cost effectiveness e
curves). For example, volume percent is calculated in the example in
the following manner:
where :
$ ~ W $ 1 1= 7.117 (Antoine Coeff 'a1 for acetone); $BX$11 = 1210.595 (Antoine Coeff 'bl for acetone); and $ ~ Y $ 1 1= 229.664 (Antoine Coeff 'cl for acetone).
where :
the Antoine1s equation is of the fonn:
where :
Pa* = vapor pressure of component a, nanHg a, b, c = Antoine1s coefficients for component a t = temperature, OC

Equation 1 is the vapor pressure/total pressure where vapor pressure equals:
SO, 10- [$~W$11 - ($BX$11/(H8 + $BY$11))) - Pa*
Volume percent = [Pa*/total pressure (H9 - 760)1
= HI1 = 30.37% (in the example)
Non-condenwable Volume Percent. % : (Cell H16)
~ecause'the gas stream contains a portion that is condensable material and a portion that is noncondensable material and the fraction of the stream that is condensable material was calculated above the remaining portion of the stream is easily calculated as below:
= 1 - Volume percent (calculated above)
gmissions. (lbs/event) : (Cell H17)
This equation uses the ideal gas law to estimate the emissions of the VOC (acetone in the example) per event.before the condenser is applied.
where:
$BZ$11 = Molecular weight of VOC; acetone = 5 8 lb/lbmol; and 998.97 = Universal gas constant, (nanHg ft3/lbmol K) .
Partial Pregsure at Exit Stream. (mmHu): (Cell J9)
The above calculations are used to estimate the uncontrolled waste gas composition. The spreadsheet will estimate control costs for a desired control efficiency or exit condenser temperature, if specified. If control efficiency is specified, as it was in this cost analysis, the spreadsheet calculates the required exit partial pressure of the waste gas, which is the saturation vapor pressure at the exit condenser temperature.

For this example, the condenser control efficiency, J6 = 90% C
90 percent control for a condenser means the following:
r VOCIN
Y - NON COND IN
4 Y VOCCOND
Y VOCOUT
[FLOWRATE] /RT MOLES VOC IN
[l - Y VOC IN] [FLOWRATE] /RT = MOLES NONCONDENSED
MOLES VOC OUT = (1-CONTROL EFF. ) (MOLES VOC IN)
After manipulation and cancelling these equations are reduced to:
= (1 - CONT. EFF) (Y )
- VOCIN CONT-
This is the same equation as the one contained in cell J9, except that the equation in cell J9 is multiplied by 760 nanHg, the assumed total pressure of the system, atmospheric in thsi case. The resulting value is the partial pressure of the VOC component.
Reauired Condenser Exit Tem~erature. (C) : (Cell 512)
Substituting the partial pressure back into Antoine's equation, yields a temperatuere at which 90 % control is achieved.
b log p* = a -
t + c
t - -b - c or t = b (log P* - a) (a - logP*) - C
The formula in cell 512 is:
So, substituting the values from the example condenser model spreadsheet into this equation:

This formula takes into account the ratio of the volume percent of noncondensables entering the condenser and the volume percent of noncondensables exiting the. condenser along with the equation: PIV1/T1 = P2V2/T2. Solving for V2.
The formaula in cell address HI8 is:
where :
$CE$6 = Condenser Exit Temperature, ( C); $CH$6 = Compressor Pressure, (nanHg); and HI9 = Condenser Exit Volume Percent, ( O ) .
So, substituting the spreadsheet values into this equation: is
= 1,000 acfm*.6963+(((1.8*(-14.06 ~))+32)+460)/(((1.8* 2 5 C)+32)+46O) *76O nanHg/760 nrmHg/ (1- .O4l8)
= 631 cfm
Condenser Exit Volume Percent. ( % I : (Cell HI91
This field substitutes back into Antoine's equation the required exit condenser temperature, which is given in $CE$6.
where :
$CH$6 = Total Pressure, (nrmHg).
So, substituting the values from the example condenser model spreadsheet into this equation:
Using the ideal gas law this equation calculates the emissions per event after the condenser:

where :
$CF$6 = Condenser Exit Temperature, K.
So, substituting the values from the example condenser model spreadsheet into this equation:
= (.0418+631 cfm+760 mmHgf58 lb/lbmo1)/(998.97+258.94)+60 = 270 lbs VO~/event
I
This cell provides for the calculation of the condenser control efficiency, but it is not used in this example because the efficiency was input in the analysis.
Condenser Heat Load. (BTU/event): (Cell H22)
Cell H22 calculates the condenser heat load, in terms of sensible heat and latent heat of cooling the stream down to the desired temperature.
Heat load is made up of: (1) latent heat of condensation for the material condensed, (2) sensible heat of cooling of the noncondensables, and (3) sensible heat of cooling of the
I
condensables. 0
Sensible heat is calculated as m Cp AT 0
~atent heat is calculated as mHv
where : Qsensible = m C P T; and Qlatent ' %. where :
m = mate rate; = heat capacity;
Cp - heat of vaporization; and IS1: - range of cooling.
1st Tern: (Sensible and latent heat of condensables)
where :
H17 - H20 = lb VOC condensed = 2702 - 270.2 = 2431.8 lb/event; b
$CA$11 = 0.3 (Cp acetone, BTU/lb°F), assumed constant.

So, substituting these values into the 1st part of the equation in cell H22:
Heat load (condensed) = (2702 - 270.2) [220 (BTU/lb)
2nd Term: (Sensible heat of condensables that were not condensed, calculated in Cell H20)
The 2nd part of the heat load equation as it appears in the condenser model is:
So, substituting the correct values into the equation:
3rd Term: (Sensible heat of noncondensables)
The 3rd part of the heat load equation as it appears in the condenser model is:
where:
$CA$20 BTU/lb°F for air, -24.
Therefore the sum of the three terms is 586,288 + 5,699 + 52,517 = 644,504 BTU/event. The spreadsheet calculated a slightly different value, 644,613 BTU/event.. However, rounding is the reason for the difference in the values.
0
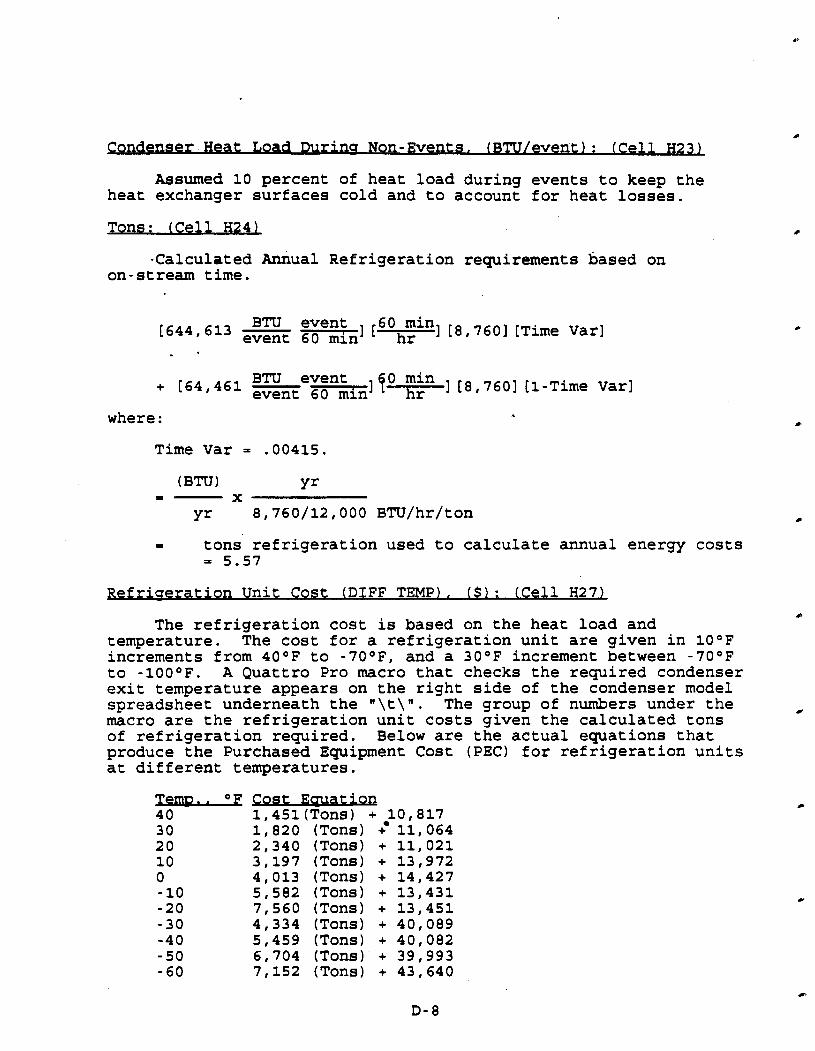
Condenser Heat Load Durbu Non-Events. (RTU/event 1 : (Cell H23
Assumed 10 percent of heat load during events to keep the heat exchanger surfaces cold and to account for heat losses.
Tons: (Cell H24)
-Calculated Annual Refrigeration requirements based on on-stream time.
event ] [60h:in] [8, 7601 [Time Var] [6441613 . event 60 min
BTU event + [64,461 event 60 fo min 1 [8,76O][I-~ime~arlhr
where:
Time Var = .00415.
a tons refrigeration used to calculate annual energy costs = 5.57
Ref riaeration Unit Cost (DIFF TEMP). ( $ 1 : (Cell H27)
The refrigeration cost is based on the heat load and temperature. The cost for a refrigeration unit are given in 10°F increments from 40°F to -70°F, and a 30°F increment between -70°F to -lOO°F. A Quattro Pro macro that checks the required condenser exit temperature appears on the right side of the condenser model spreadsheet underneath the "\t\". The group of numbers under the macro are the refrigeration unit costs given the calculated tons of refrigeration required. Below are the actual equations that produce the Purchased Equipment Cost (PEC) for refrigeration units at different temperatures.
tion n s + 10,817 1,820 (Tons) +* 11,064 2,340 (Tons) + 11,021 3,197 (Tons) + 13,972 4,013 (Tons) + 14,427 5,582 (Tons) + 13,431 7,560 (Tons) + 13,451 4,334 (Tons) + 40,089 5,459 (Tons) + 40,082 6,704 (Tons) + 39,993 7,152 (Tons) + 43,640
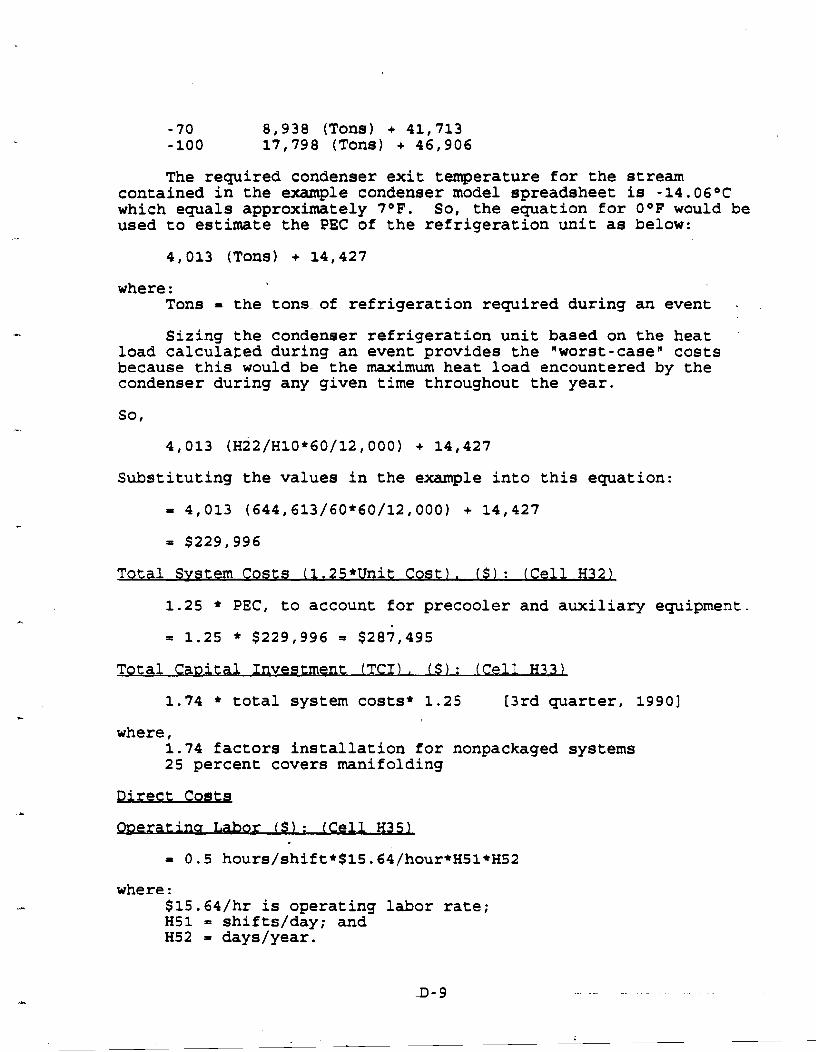
- 70 8,938 (Tons) + 41,713 -100 17,798 (Tons) + 46,906
The required condenser exit temperature for the stream contained in the example condenser model spreadsheet is -14.06OC which equals approximately 7OF. So, the equation for O°F would be used to estimate the PEC of the refrigeration unit as below:
4,013 (Tons) + 14,427
where: Tons = the tons of refrigeration required during an event .
Sizing the condenser refrigeration unit based on the heat load calculated during an event provides the nworst-caseN costs because this would be the maximum heat load encountered by the condenser during any given time throughout the year.
Substituting the values in the example into this equation:
Total Svstem Costs (1.25*Unit Cost). $ 1 : (Cell H32L
1.25 * PEC, to account for precooler and auxiliary equipment.
Total Ca~ital Investment (TCI). ( $ 1 : (Cell H33)
1.74 * total system costs* 1.25 [3rd quarter, 19901
where, 1.74 factors installation for nonpackaged systems 25 percent covers manifolding
at-or ( $ 1 : (Cell H351
= 0.5 hours/shift*$15.64/hour*HS1*H52
where: $15.64/hr is operating labor rate; H51 = shifts/day; and H52 = days/year.
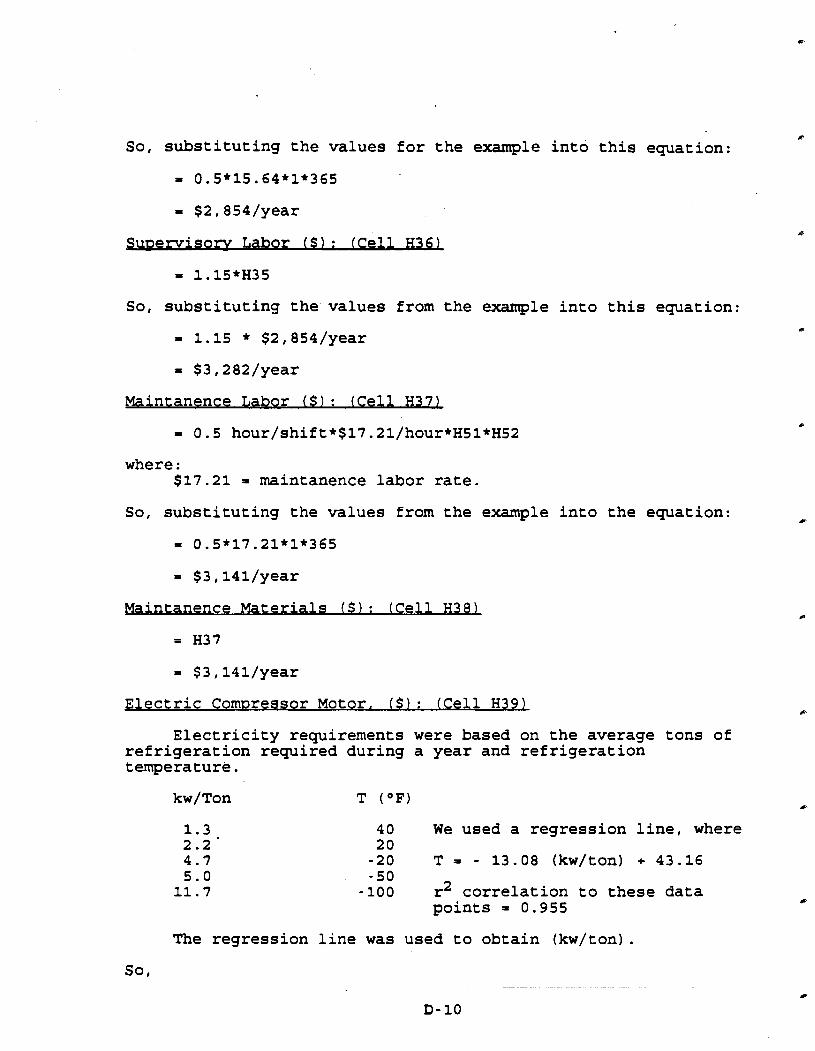
SO, substituting the values for the example into this equation:
= 0.5*15.64*1*365
= $2,854/year
So, substituting the values from the example into this equation:
Maintanence T~abor ( $ 1 : (Cell H37)
where : $17.21 = maintanence labor rate.
So, substituting the values from the example into the equation:
Maintanence Materials ( $ 1 : (Cell H38)
Electric Com~ressor Motor. ( $ 1 : (Cell H39)
Electricity requirements were based on the average tons of refrigeration required during a year and refrigeration temperature.
40 We used a regression line, where 20 -20 T = - 13.08 (kw/ton) + 43.16 -50
- 100 r2 correlation to these data points = 0.955
The regression line was used to obtain (kw/ton).
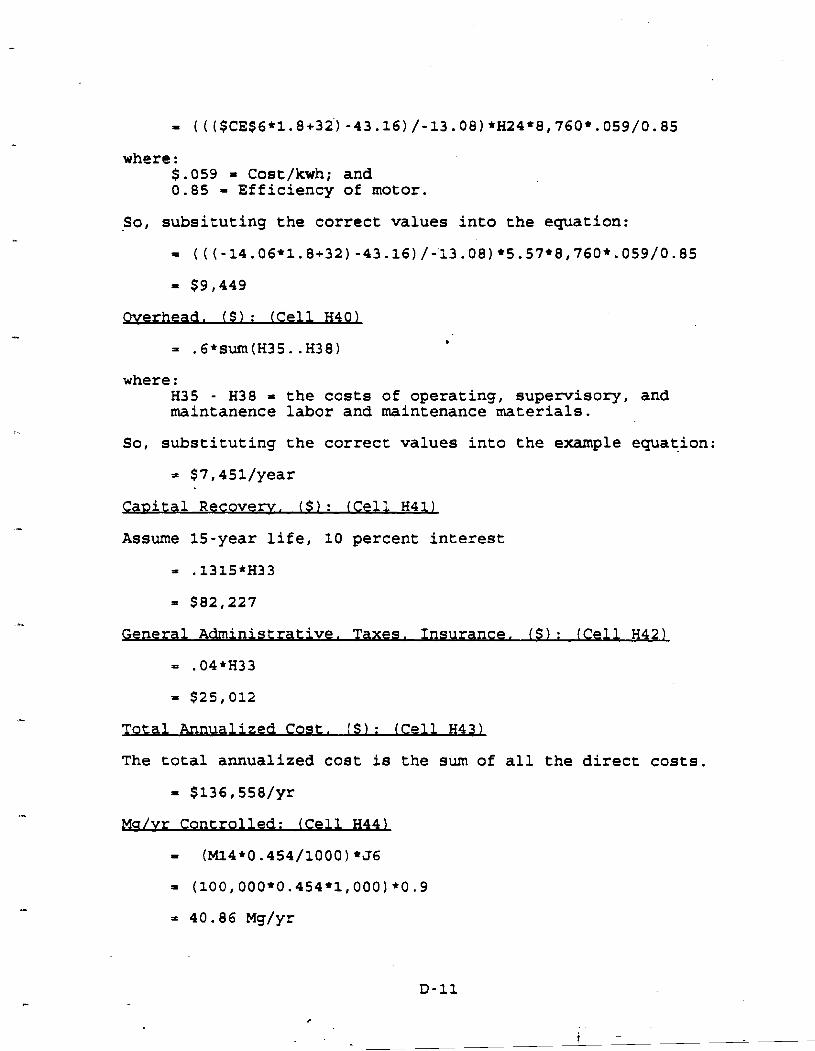
where : $.059 = Cost/kwh; and 0.85 = Efficiency of motor.
So, subsituting the correct values into the equation:
Overhead. ( $ 1 : (Cell H40)
where : H35 - H38 = the costs of operating, supervisory, and maintanence labor and maintenance materials.
So, substituting the correct values into the example equation:
= $7,45i/year
Canital Recovery, ( $ 1 : ( e l l H41)
Assume 15-year life, 10 percent interest
General Administrative. Taxes. Insurance. ( $ 1 : (Cell H42)
= .04*H33
Total Annualized Cogt. ( S ) : (Cell H43)
The total annualized cost is the sum of all the direct costs.
= $136,558/yr
Ms/vr Controlled: (Cell H44)
= (M14*0.454/1000)*56
Cost Rf fectiveness (S/Mcr) : (.Cell H45)
= H43/H44
Calculation of Time Variation: (Cell MI71
= M17+998.97+293* (1/60) (l/8,76O) (l/$BZ$ll) /Hll/ (H6*760) . So, substituting the correct values into the equation:

CONDENSER MODEL SPREADSHEET

PARAMETERS:
CALCULATIONS:
40 (il conlcmp> =IO)IF.(:FORMI - 1127- (Q -30 (il conlcmp> =301R;.CFORMZ- 1127- (Q M (il conlcmp> =20)1lCF'ORM3- 1127- (Q
COSTS:
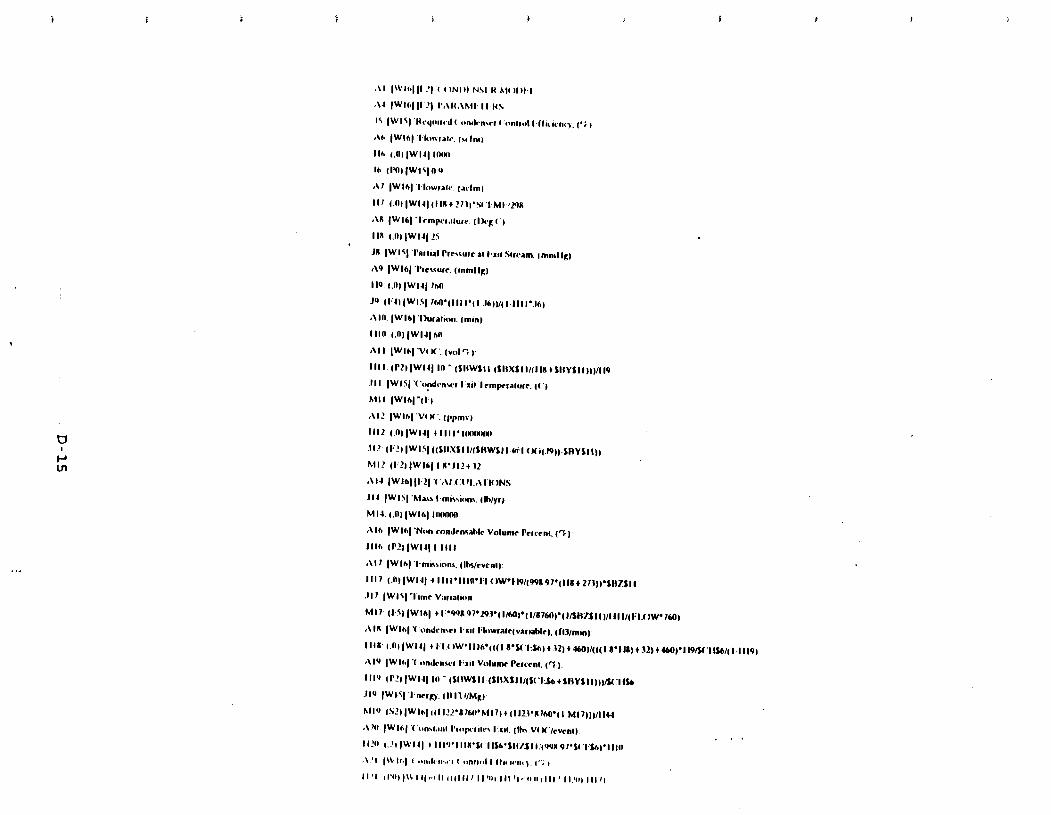
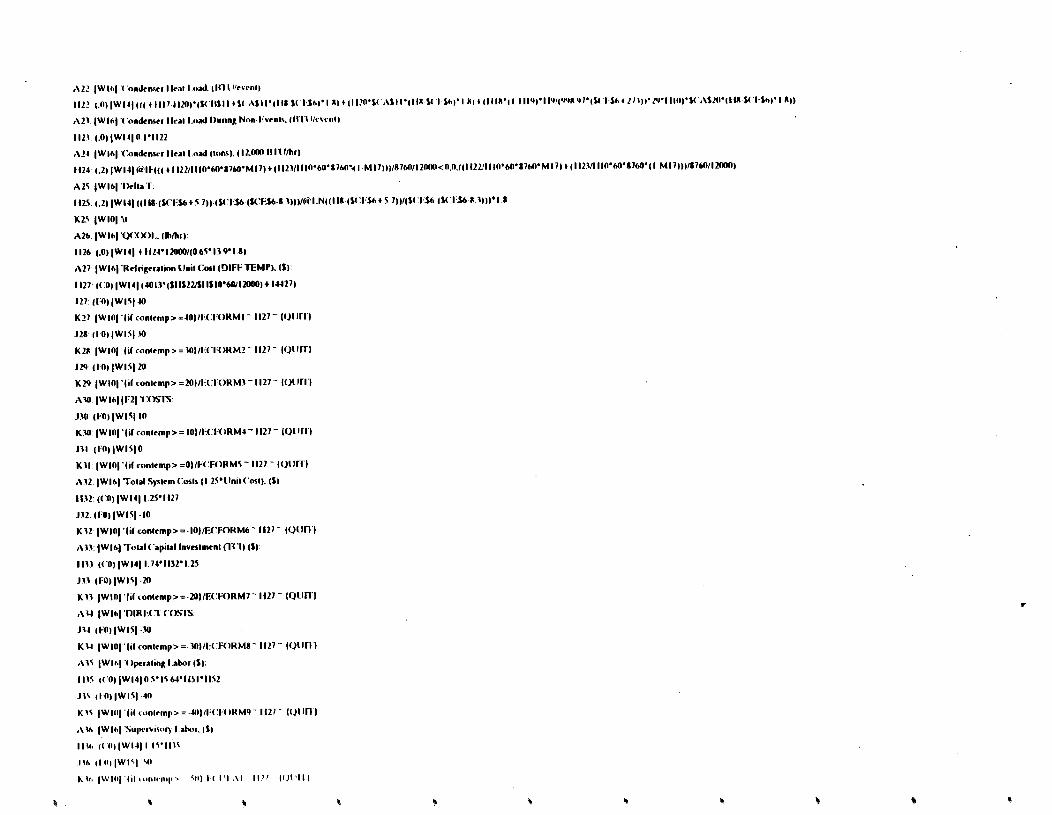
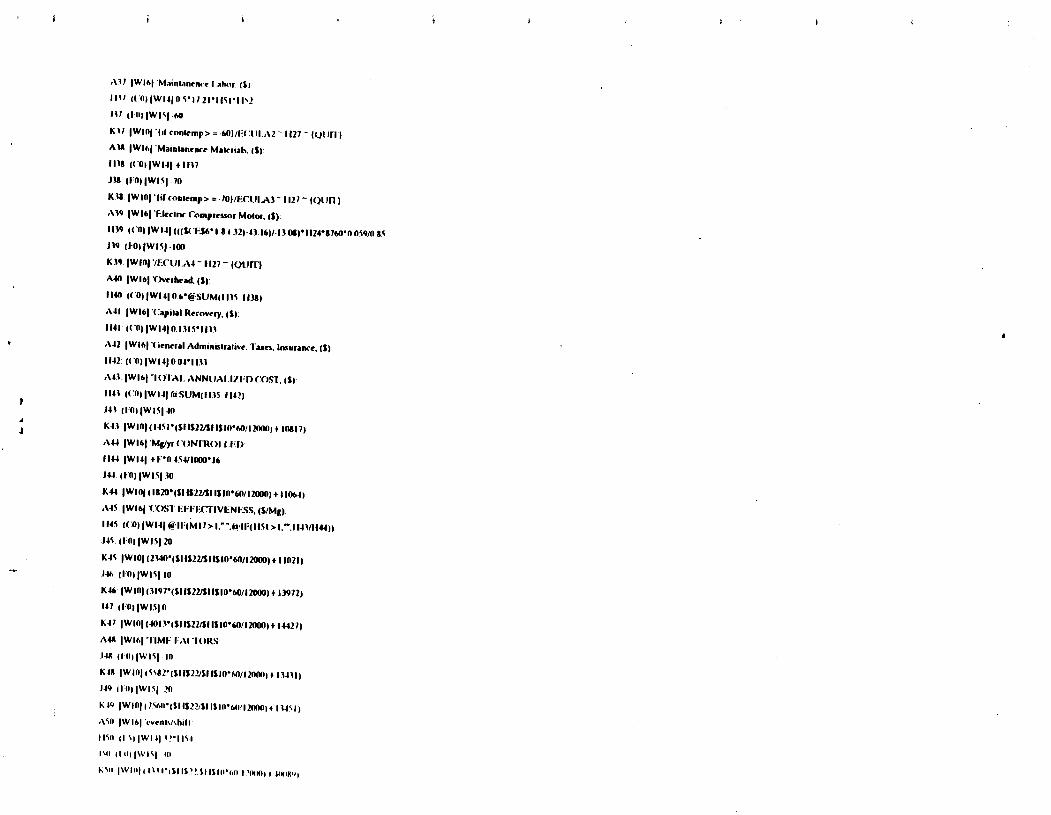
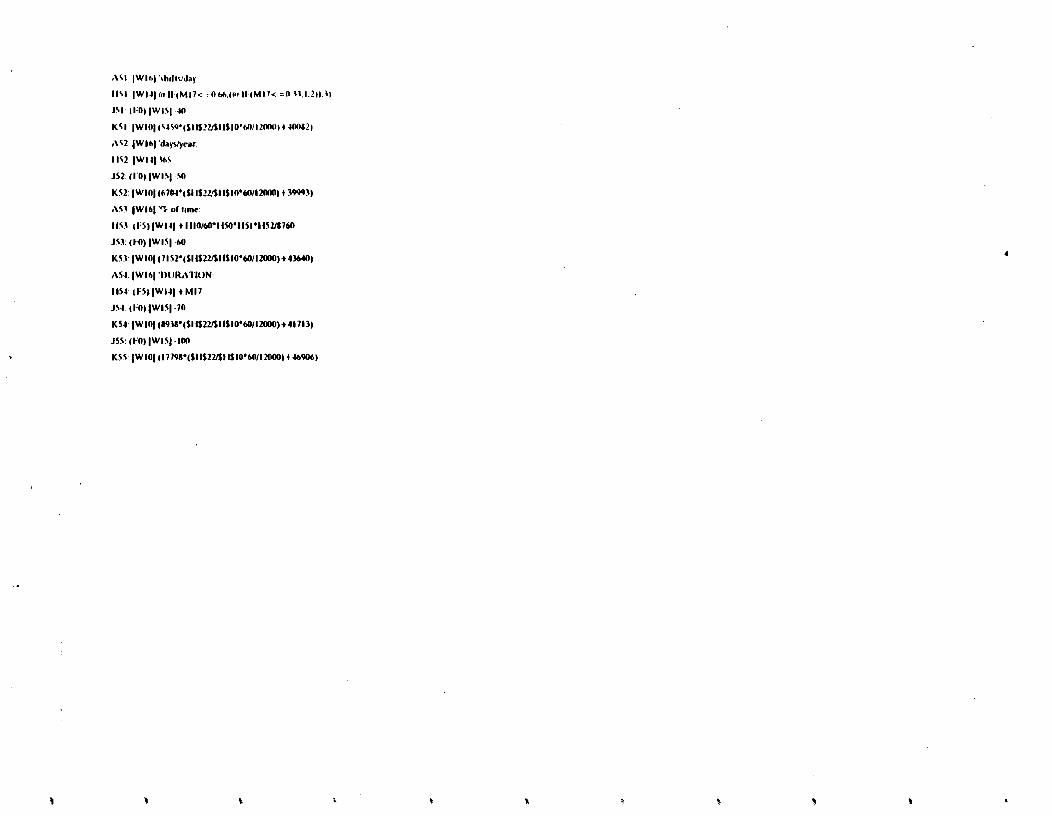


BV I:'CALCULATIONS CE2: 'CONDENSER CH2: 'COMPRESSOR PRESSURE CE3: 'EX IT CF3: 'TEMPERATURE BVS: 'ANTOINE'S EQ COEFFICIENTS CE5: A (C) CF5: A (K) CE6: t J I 2 CF6: +SCES6+273 CH6: 7ho BVH: 'VOC B W8: 'A BXH: 'B BYX: 'C BW: 'MW CA8: 'Cp CBX: 'hv BV I I : 'Acelone BWI I:7.1 17 BX lI:1210.595 BY I I : 229.664 RZI I: 58.W CAI I:03NM CB lI:220.127 BV20: 'NITROGEN CA20: 0.24
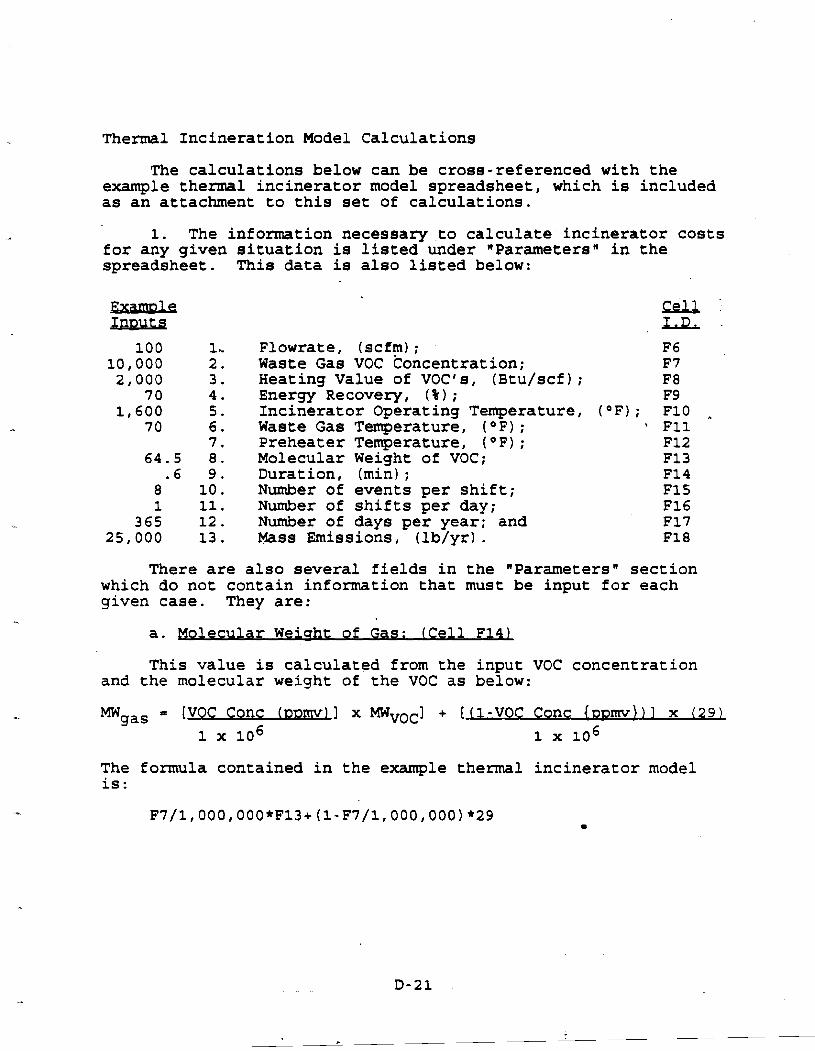
Thermal Incineration Model Calculations
The calculations below can be cross-referenced with the example thermal incinerator model spreadsheet, which is included as an attachment to this set of calculations.
1. The information necessary to calculate incinerator costs for any given situation is listed under RParametersn in the spreadsheet. This data is also listed below:
Flowrate, (scfm) ; F6 Waste Gas VOC concentration; F7 Heating Value of VOC's, (Btu/scf); F8 Energy Recovery, ( % I ; F9 Incinerator Operating Temperature, (OF); F10 A
Waste Gas Temperature, (OF) ; ' F11 Preheater Temperature, ( OF); F12 Molecular Weight of VOC; F13 Duration, (min) ; F14 Number of events per shift; F15 Number of shifts per day; F16 Number of days per year; and F17 Mass Emissions, (lb/yr) . F18
There are also several fields in the nParameters" section which do not contain information that must be input for each given case. They are:
a. Molecular Weiuht of Gas: (Cell F14)
This value is calculated from the input VOC concentration and the molecular weight of the VOC as below:
The formula contained in the example thermal incinerator model is:
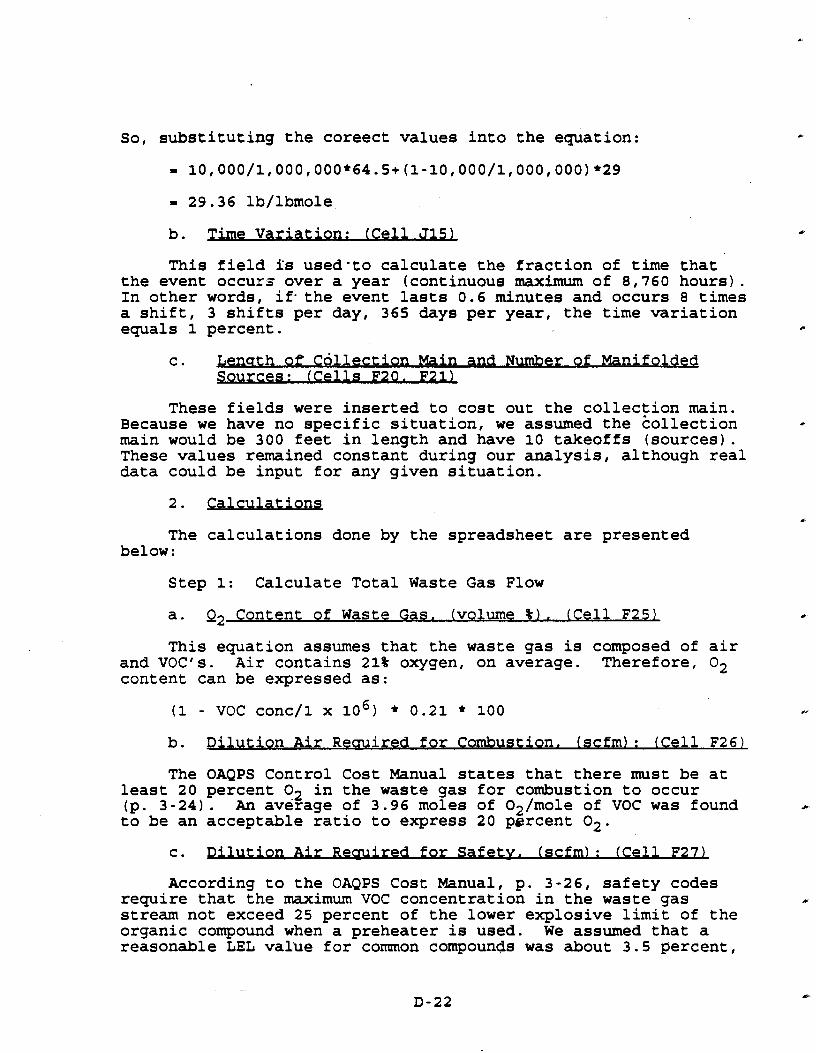
So, substituting the coreect values into the equation:
b. Time V a r u : (Cell J15L
This field is used'to calculate the fraction of time that the event occurs over a year (continuous maximum of 8,760 hours). In other words, if-the event lasts 0.6 minutes and occurs 8 times a shift, 3 shifts per day, 365 days per year, the time variation equals 1 percent.
c. on Maln and Number of Manifolded Sources: (Cells F20. F21)
These fields were inserted to cost out the collection main. aBecause we have no specific situation, we assumed the bollection
main would be 300 feet in length and have 10 takeoffs (sources). These values remained constant during our analysis, although real data could be input for any given situation.
2. Calculations
The calculations done by the spreadsheet are presented below:
Step 1: Calculate Total Waste Gas Flow
a. Q2 Content of Waste Gas. (volume % ) . (Cell F25)
This equation assumes that the waste gas is composed of air and VOC's. Air contains 21% oxygen, on average. Therefore, O2 content can be expressed as:
b. Dilution A ir Remired for Combustion. (scfm) : (Ce11 F26)
The OAQPS Control Cost Manual states that there must be at least 20 percent O2 in the waste gas for combustion to occur (p. 3-24). An average of 3.96 moles of 02/mole of VOC was found a
to be an acceptable ratio to express 20 percent 02.
lutlon A n Remlred for Safetv. (scfm) : (Cell F27)
According to the OAQPS Cost Manual, p. 3-26, safety codes require that the maximum VOC concentration in the waste gas e
stream not exceed 25 percent of the lower explosive limit of the organic compound when a preheater is used. We assumed that a reasonable LEL value for comon compounds was about 3.5 percent,
L

or 35,000 ppmv streams; 25 percent of 3.5 percent corresponds to a value of 8,750 ppmv.
This LEL value was derived from the following data:
Acetone Benzene Ethanol Ethlene Ethylene H, H;~ e e hane Methanol Propylene
Average = 35,000 ppmv 0.25 (35,000) = 8,750
Therefore, additional air must be added to the waste gas to dilute the waste gas VOC concentration to 8,750.
This formula for calculation of dilution air was derived in the following way:
VOC conc (ppmv) 6 3[ I [flowrate] 8,750/1 x 10
1 x 10⁶
waste gas dilution dilution , flowrate + combustion air + safety air]
cancelling and manipulation, this formula reduces
(Dilution Dilution combust ion safety = (Flowrate)(PPMVOC) - 8,750 * (Flowrate) - 8.750* air) air 8,750
d. -ate Total Gas Flow. (wcfm): (Cell F28L
This field calculates the total amount of gas flowing into the incinerator during the emission event, the total gas is composed of:
Input flow (waste gas) + dilution air for combustion +
dilution air for safety
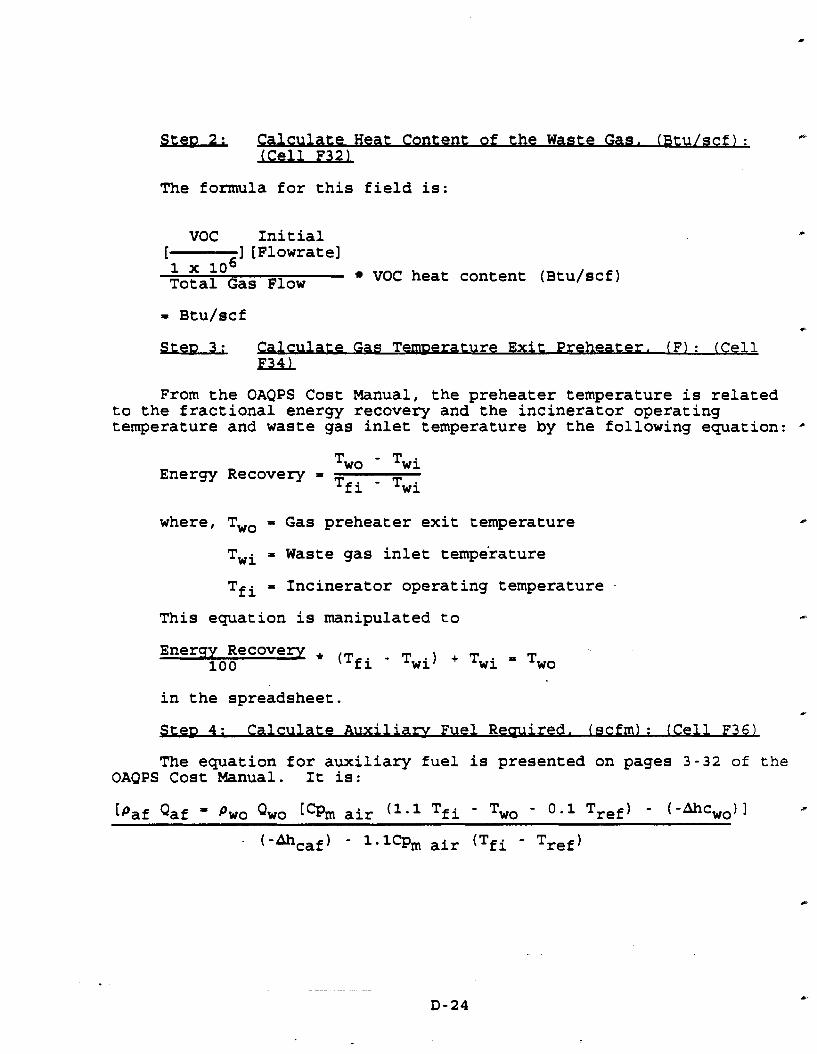
s!aLL culate Heat Content of the Wawte Gas. (Btu/scf) ; rs.
J c ! u J u L
The fonnula for this field is:
VOC Initial 1 ] [Flowrate] 1 x 10⁶ Total Gas Flow VOC heat content (~tu/scf)
S t e ~ 3 : Calculate Gas Temnerature Exit. Preheater. (F) : (Cell F34)
From the OAQPS Cost Manual, the preheater temperature is related to the fractional energy recovery and the incinerator operating temperature and waste gas inlet temperature by the following equation: *'
Energy Recovery = Two - Twi Tfi - Twi
where, Two = Gas preheater exit temperature
l'wi = Waste gas inlet temperature
Tfi = Incinerator operating temperature .
This equation is manipulated to
in the spreadsheet. *
S t e ~ 4: Calculate Auxiliary Fuel Reauired. ( ~ c f m ) : (Cell F36)
The equation for auxiliary fuel is presented on pages 3-32 of the OAQPS Cost Manual. It is:
[paf Qaf = Pwo Qwo [Qm air (Ia1 Tfi - - 0.1 Tref) - (-Akwo)l
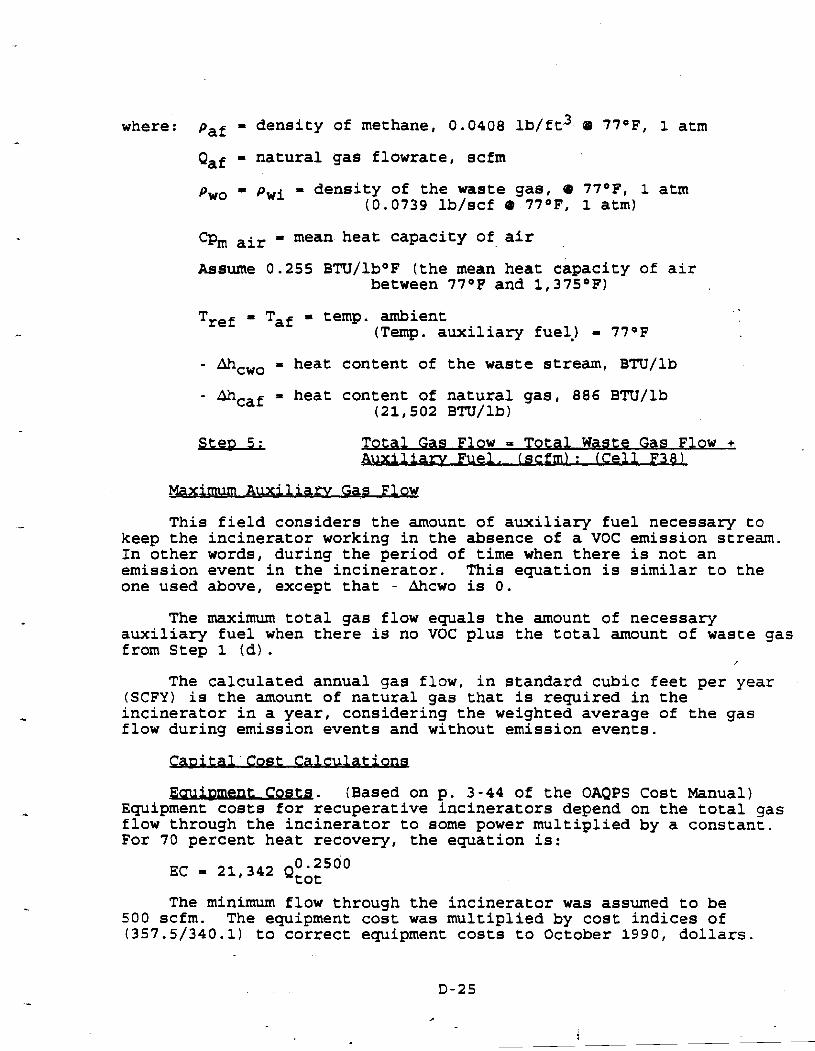
where: paf = density of methane, 0.0408 lb/ft3 63 77OF, 1 atm
Qaf = natural gas flowrate, scfm
Pwo = pwi = density of the waste gas, @ 77OF, 1 atm (0.0739 lb/scf 9 - 77OF, 1 atm)
= mean heat capacity of air ePm air Assume 0.255 BTU/lb°F (the mean heat capacity of air
between 77OF and 1,375OF)
Tref = Taf = temp. ambient (Temp. auxiliary fuel) = 77*F
- &cwo = heat content of the waste stream, BTU/lb
- Ahcat = heat content of natural gas, 886 BTU/lb (21,502 BTU/lb)
W + Fuel. (scfm) : (Cell F38L
Maximum Auxiliam Gas Flow
This field considers the amount of auxiliary fuel necessary to k e e ~the incinerator workinq in the absence of a VOC emission stream. In other words, during the period of time when there is not an emission event in the incinerator. This equation is similar to the -
one used above, except that - Ahcwo is 0.
The maximum total gas flow equals the amount of necessary auxiliary fuel when there is no VOC plus the total amount of waste gas from Step 1 (d).
The calculated annual gas flow, in standard cubic feet per year (SCFY) is the amount of natural gas that is required in the incinerator in a year, considering the weighted average of the gas flow during emission events and without emission events.
Cost Palculations
t CosU. (Based on p. 3-44 of the OAQPS Cost Manual) Equipment costs for recuperative incinerators depend on the total gas flow through the incinerator to some power multiplied by a constant. For 70 percent heat recovery, the equation is:
The minimum flow through the incinerator was assumed to be 500 scfm. The equipment cost was multiplied by cost indices of (357.5/340.1) to correct equipment costs to October 1990, dollars.

t (duct work. stacu. The costs for auxiliary equipment were originally taken from an article in the May 1990, Chemical Engineering and assuming 1/8 inch carbon steel and 24 inch diameter with two elbows per 100 feet; and one elbow per source. we assumed that there would be 10 sources manifolded to a 300 foot collection main. The cost was adjusted on indices of (357.5/352.4).
e
Collection Fgg
The auxiliary collection fan is sized on a m i n i m gas flowrate of 500 scfm. The equation is:
$ = 79.1239 [Total gas flow from Step .l (dl I 0.5612 (357.5/342.5) .
(based on the 1988 Richardson Cost Manual)
Instrumentation 10 percent of purchased and auxiliary
Sales tax
Freight
equipment
3 percent equipment
5 percent equipment
purchased and auxiliary
purchased and auxiliary
Total purchased equipment - sum of the above factors Direct costs - 30 percent of total purchased.equipment Indirect costs - 31 percent of total purchased equipment Total Ca~ital Investment. If the maximum total gas flow is less ,
than 20,000 scfm, then the installation costs are 25 percent of the purchased equipment costs. If not, then the installation costs are 61 percent of the purchased equipment costs (from p. 3-51 of the OAQPS Cost Manual ) .
Annualized Costs
Operator: $15.64/hr x 0.5 hr/shift x shifts/day x day/year
(Assume that 3 shifts/day, 365 days/year)
Supervisor: 15 percent of operator
Maintenance: $17.21/hr x 0.5 hr/shift x shifts/day x day/year
Material: 100 percent of maintenance
Natural gas: Yearly natural gas usage (scfy) x $3.3 1,000 scf

Electricity: From pages 3-55 of the OAQPS Cost Manual
Power* 1.17 x Qtot& fan
Where :
maximum sas flow pressure-drop, in H20 (Assume 29 in HZO ; 19 inches for the preheater and 10 inches for ducting) efficiency power, in KW
$.059/kwh + electricity cost
Total Direct Costs:
Sum of labor, materials, natural gas, electricity
Indirect: Overhead: 60 percent of labor and materials Administrative: 2 percent of total capital investment
(TCIProp Tax: 1 percent of total capital investment
(TCI1 Insurance: 1 percent of total capital investment
(TCI1
Capital Recovery Factor: 10 percent, 10-year life .I6275 (TCI)

THERMAL INCINERATOR MODEL SPREADHSEET

I H E R M A L INCINERATOR M O D E L
PARAMETERS:
I k lw r i l t ~ .( d m ) :
Wi~stcCi;a VOC ('onccnlralion, (ppmv):
Il c i ~ ling V~I~UC of VO( :'s. ( l i t ulscf ): ('(MI Effectiveness, (SlMg): Imcrgy Hccovcry, (%I: 54,953 Incincri~~orOperaling Temperature, (F): Wi~slc<;;IS 'I'cmpcralure, (I:): M a s I'mis&)ns, (Ihlyr): Prchcatcr 'I'cmpcra~urc, (I.'): 25.0(10 Molcculi~r Wcigh~ of V O C
Molecular Wcight of Gas:
Ihrialion, (min): I:vents/Shift: Shif~sJDay: Iinergy, (BtuIMg): I)i~ys/Yei~r: 4R,6 16,308 Time V i~r i i~~ ion:
I.cnglh of <'ollcclion Milin, (TI): Numhcr of MilnifcJdcd Sources:
Oxygen (02) <:onlcnl of Wasw (;;IS, (volumc %):
I)ilu~ion Air Required for Combustion. (scfm): I)ilulion Air for Si~fcty. (scfm): -1Oti1I (;its I~~w~~IIc,(scfm):
S~cp3: <~~ Icu I i~ t c< i i~~Icmp. l i x i l Prchca~cr, (I:):
Slcp 4: ('irlculii~c Auxiliary l:ucl Rcquircd, (.dm): for cvcnls
S~cp5: ( ' i ~ l c u l ; ~ ~ ~tolal (;;IS I;low, (scfm):
for cvcnls ( .i~lct~l;~tcMi~xtmumAuxilii~ry I:low, (scfm): ( ' i~lcul;~~cMi~x~mum'I1tt i11(;its l:low, (scfm): ( ' :~Ic i t l~~~cdAnoi~A( iw I 'low. ( d y ):

CAPITAL COST CALCULATIONS:
Ijircct ('( BSIS
Iiquipmcnt ('(%I (Itccoupcri~tivc Incin.). (5): Auxili;rry 1:quipmcnt ( l h~c twork . Slirck), (5): Auxiliilry ( 'ol lcc~ion 1.h. (5): Instrumcn~;r~ion,(5): S;1Ics Ti1x. (5):
I k i g h t , (S):
1)irecl Inslallalion Cos~s, (5):
lndircct C~KIS. (5):
ANNUALIZED COST CALCULATIONS:
Operating Iahor: Opcrit lor, (S): Supervisory I.;lhor, (5): M;tin~irncnce I i r h i r . (5):
. M;rtcriiiIs, ($1:
s I,928 ($3.31 ltww)s<:I=) 5339 (S.OSY/kwh) * * <:IIANGE D E L T P FOR DlFF ENERGY HIXU * *
540.759, I89
S l 1,831
Indirect Annual ('(KIs:
Overhe;~d. (S): Administr;~~ivc,(5):
I'ropcrty T i ~ x . (5):
Insurancc. (S): ( pilid lid Itccovcry, (5):
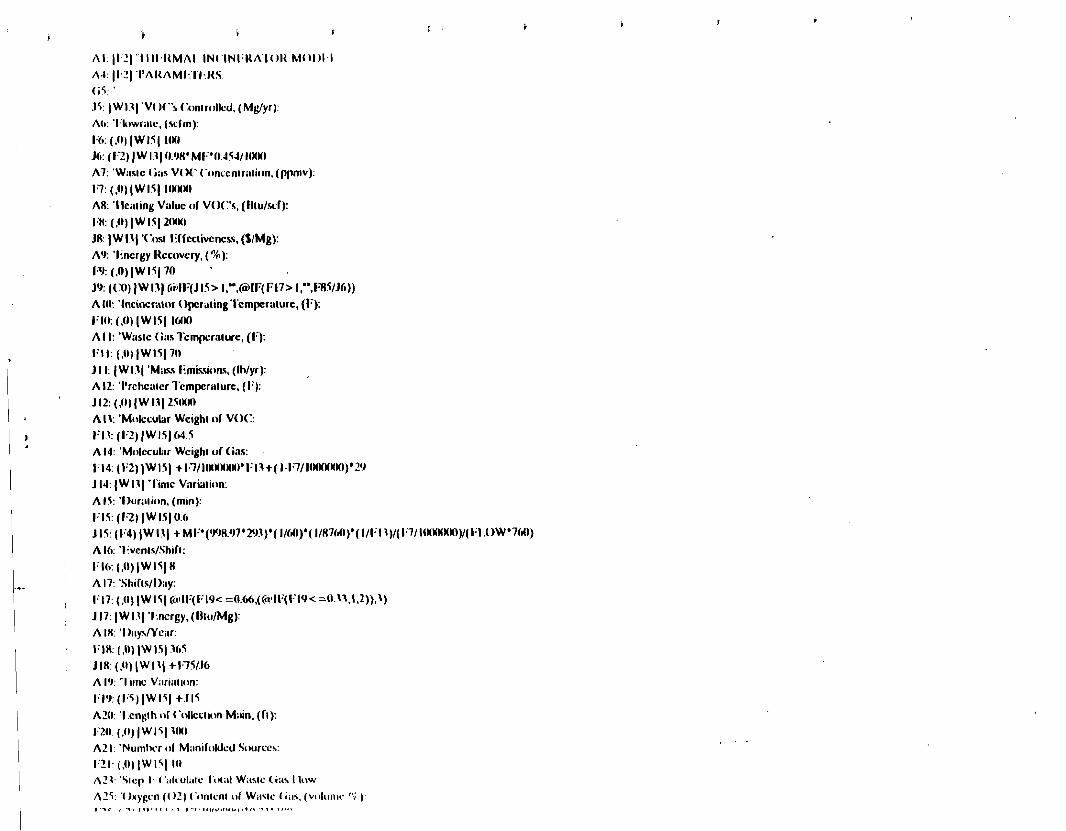
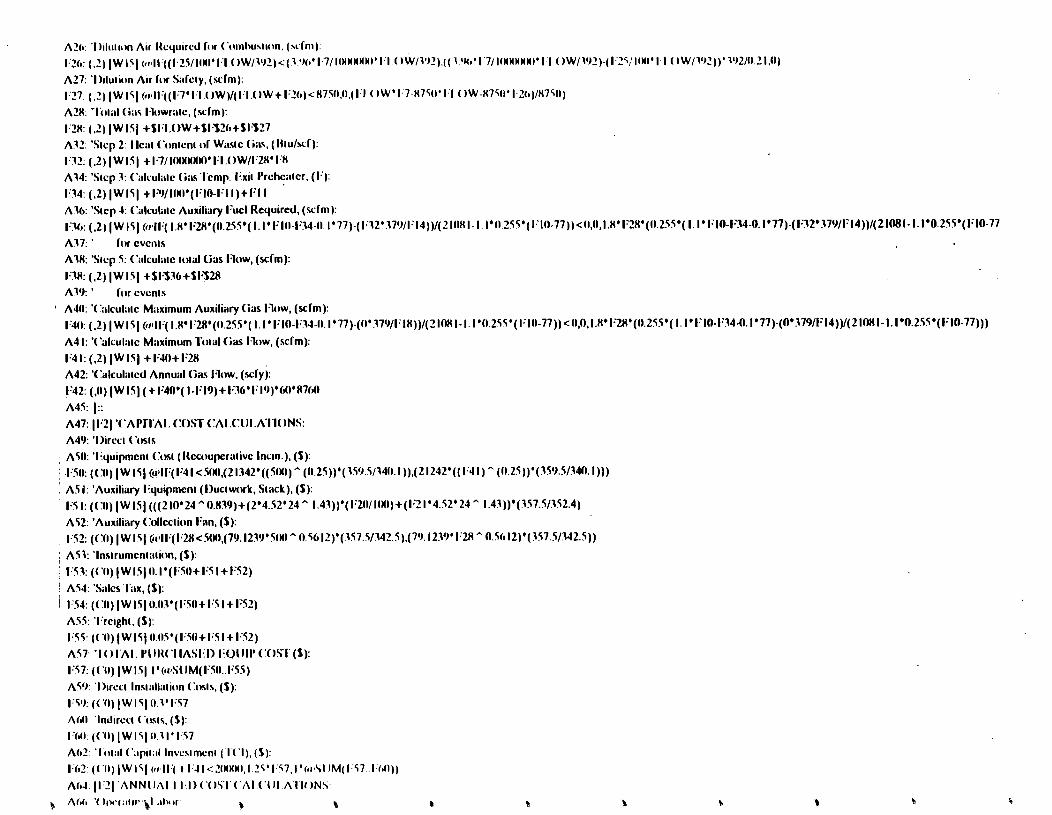
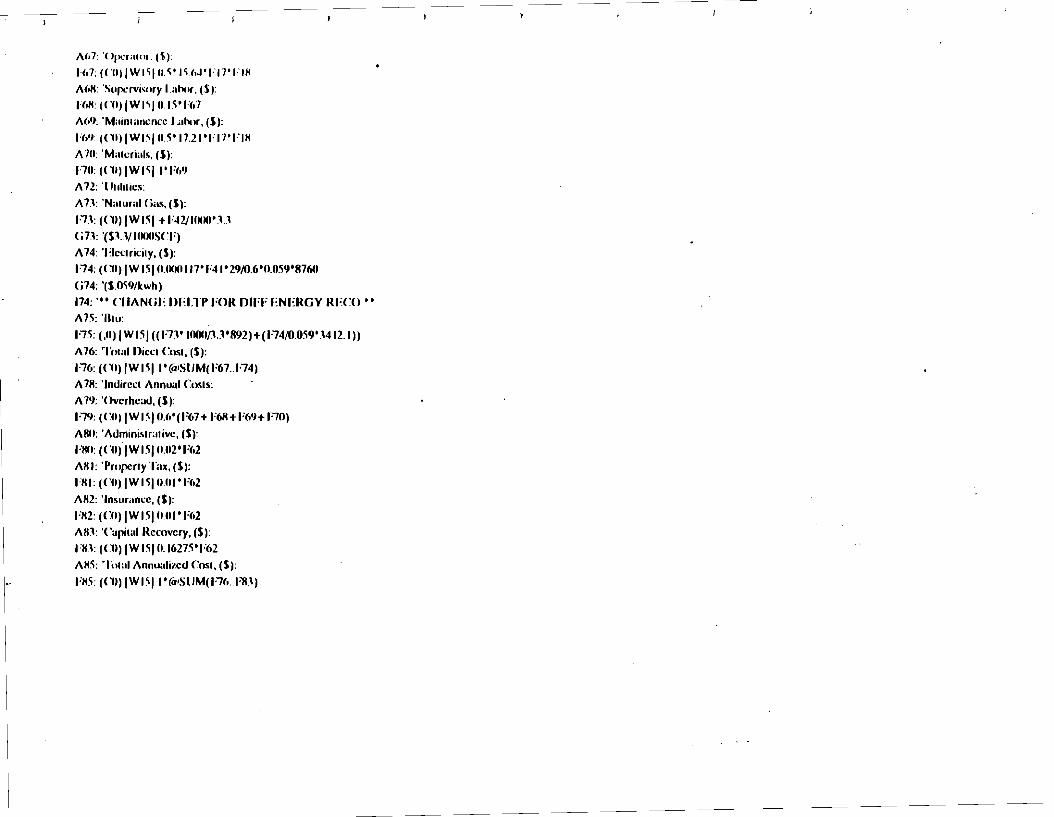
APPENDIX E.
MODEL PLANTS AND
MODEL EMISSION STREAM CALCULATIONS

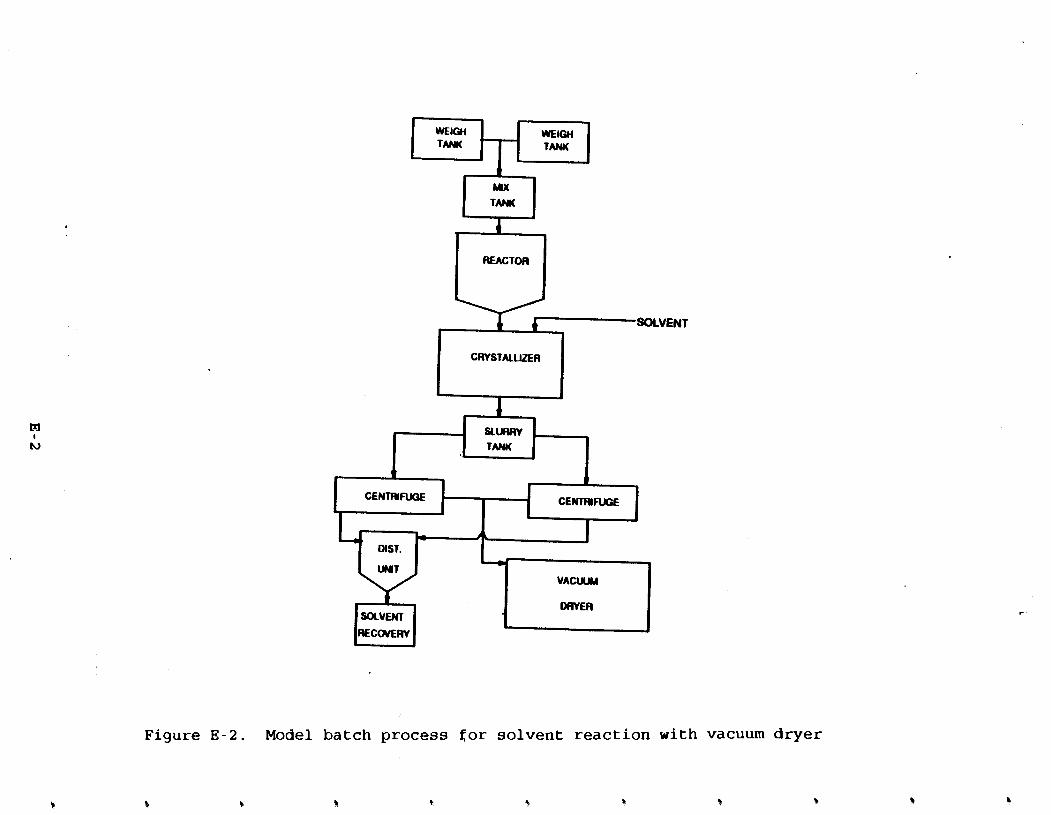
i
WEIGH WEIGH T A M T A M1
U X T A M
>
DIST.
V A C U
DFWEA SOLVENT -
FYCWERV
Figure E-2. Model batch process Sor solvent reaction with vacuum dryer
b b bIr b I ? 5
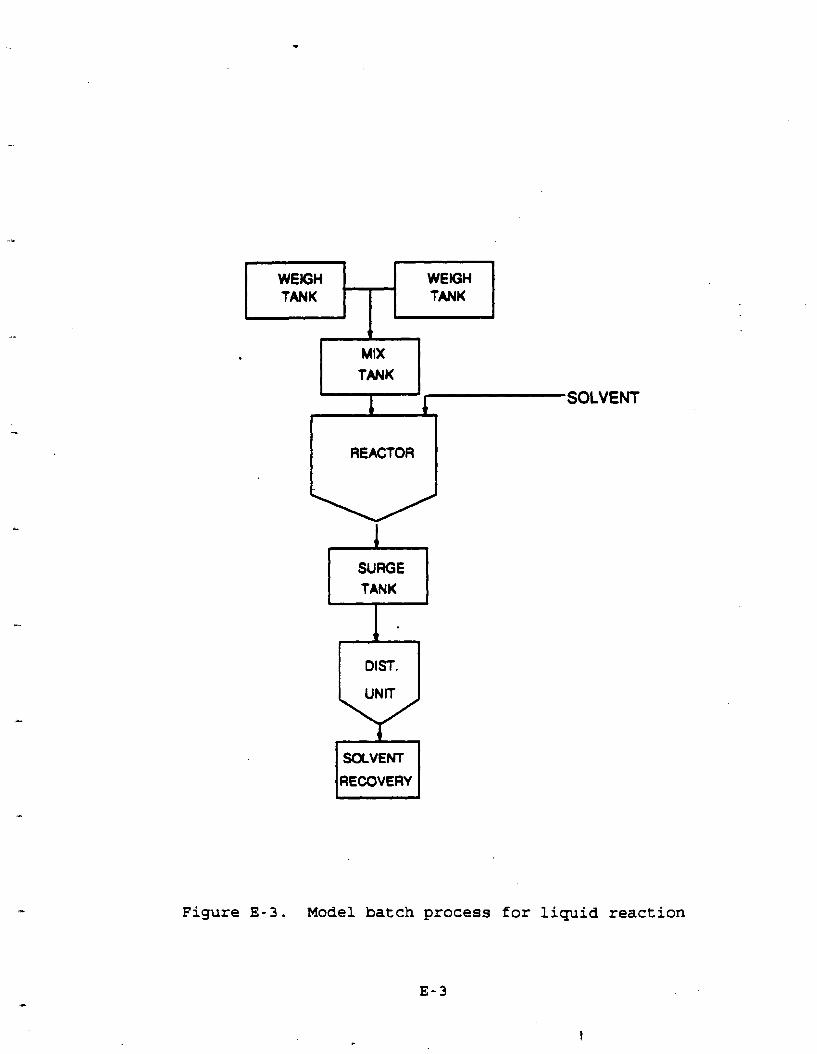
- - ! I WEIGH I TANK TANK1 + I
MIX TANK-1-SOLVENT 1
REACTOR
I_n*l/RECOVERY
Figure E-3. Model batch process for liquid reaction
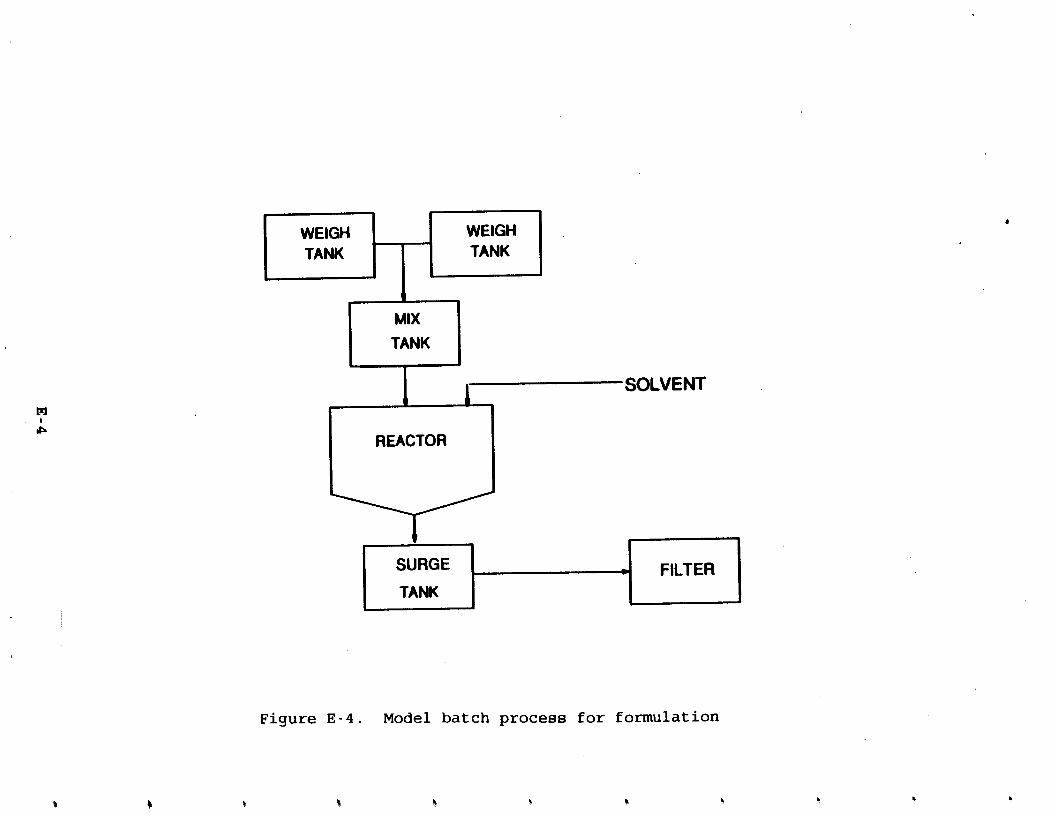
WEIGH WEIGH
I SOLVENT4 4
REACTOR
Figure E - 4 . Model batch process f o r formulation
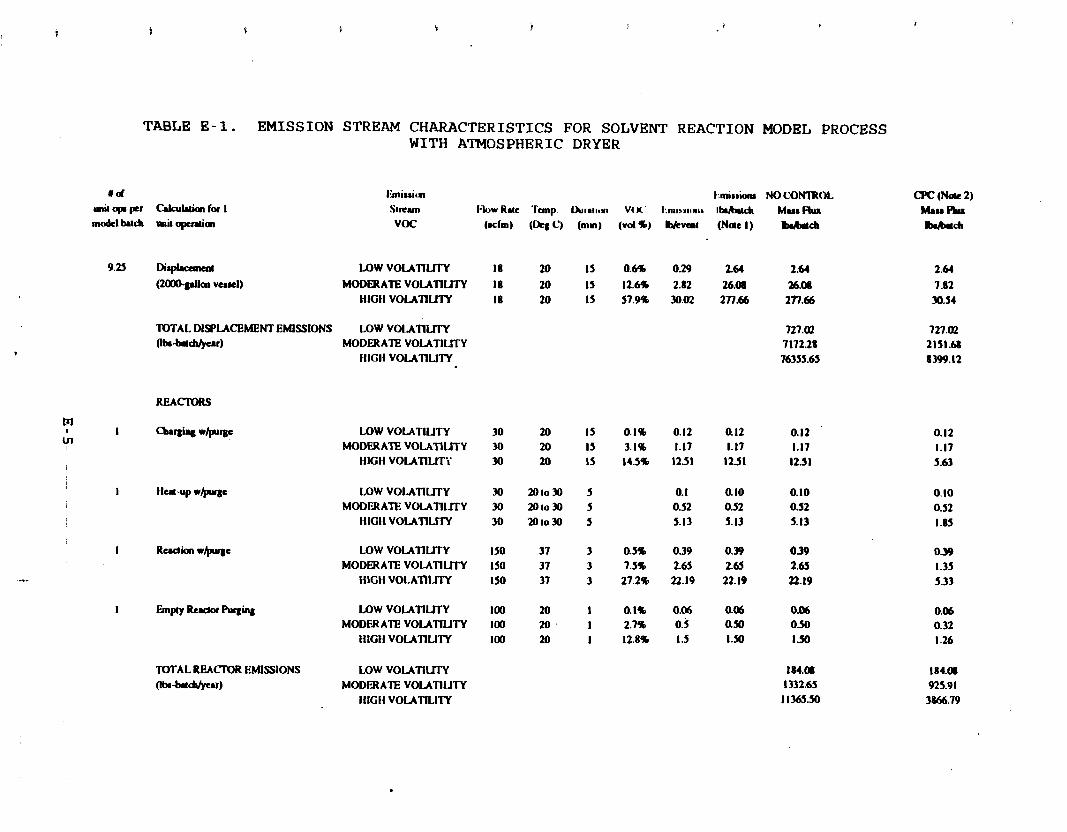
TABLE E-1. EMISSION STREAM CHARACTERISTICS FOR SOLVENT REACTION MODEL PROCESS WITH ATMOSPHERIC DRYER
TOTAL DISPLACEMENT EMlSSlONS (Itu-budJuar)
I 1 tlu-up w l P y c
TOTAL REAClWl EMlSSlONS
(Ib-buhlyur)
LOW vounLtTY MODERATE VOLATILITY
HIGI~v o u n u n
LOW VOLATILITY MODERATE VOLATILITY
HlGH VOLAllLIT'i
LOW v o u n m y MODERATEv o u n u n
HlGH VOLAllLlTY
LOW VOLATILITY MODERATE VOLATILITY
HIGH v o u n L l n

ss$?s$!sgg!!!dd ddddddd

1
BATCH DlSTlLUTlON (NdcII)
I Alma. op'n - Smtup Step I A h m . op'n - SI.rtup Step 2
1 A h m . op'n - SI.mp Step I Almor. op'n - Stuiqt Step 2
I Atmu. op'n - Startup Slep I Abna. op'n - Surmp Step 2
M
4 N d e I : A ~ r u n c1 cvcnrlbrtch Nac 2: CPC =CURRENTPHARMACEVnCAL COHlROL
TABLE E - 1. (continued)
Fmirrion Emiaabn NOCONIROL S l l C ~ l Flow Rate Tanp. Dunlion VOC Emi~rionr Iba ibkb k r r FLn VOC ( d m ) (DegC) (min) (vd%) lbkvcnt (NdcI) r*lhch
LOW VOLA~LITY 1.4 5 0.01LOW VOLATlUTY 12.6 25 60 0.7%0.7% 0.52
MODERATE VOLATILITY 5.5 5 14.5% 0.33 MODERATE VOLATILITY 14.4 25 45 16.8% 5.96
HIGH VOLAT~LT~Y 28.9 5 60.0% I&4 HIGH V o u n L n Y 39.9 25 XI 72.8% IM:6
LOW VOLATILITY MODERATE VOLATILITY
IIIGH v o u n L m
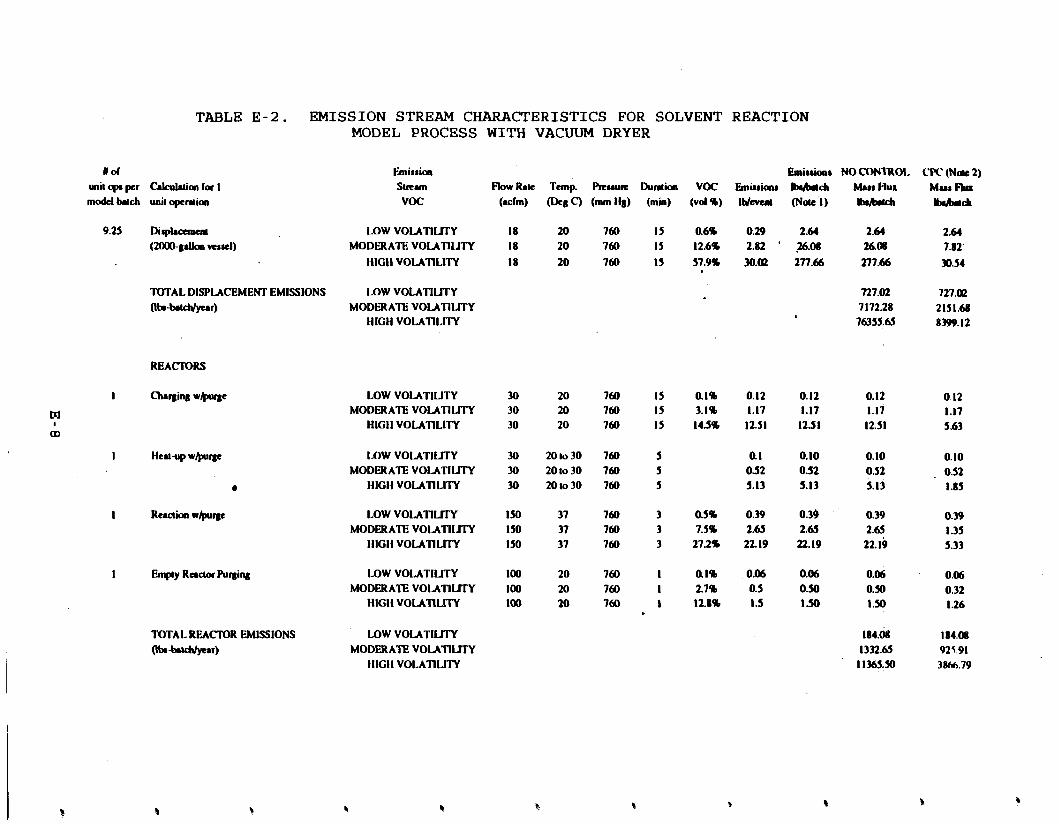
TABLE E-2. EMISSION STREAM CHARACTERISTICS FOR SOLVENT REACTION MODEL PROCESS WITH VACUUM DRYER
Emirrionr NO CONIROI. CPC (Nou 2) Flow Rate Temp. Rrrrum Dudon Mur Fka
blhd
M W VOLATIUTY 2.64 MODERATEv o u m u n 7.82'
HlGH VOLATILITY 30.54
TOTAL DISPLACEMENT EMISSIONS LOW VOLATIUTY 727.02 (Ib-blctJyur) MODERATE VOLATIUTY 2151.61
HIGH V o u n L l n 8399.12
LOW VOLATILITY 0 I 2 MODERATE vounmy 1.17
HIGH v o u m l n 5.63
LOW VOLATILITY 0.10 MODERATE VOLATIUTY . o.a
HIGH V o u n L l n 1.85
0.39 1.35 5.33
LOW VOLATILITY 0.06 MODERATE VOLATIUTY 0.32
HIGH v o u m m 1.26
M T A L REACTOR EMISSIONS LOW VOLATIUTY 184.06 (Ib-b.IchhMr) MODERATE VOLATIUTY 925.91
HIGH VOLATILITY 3w.79
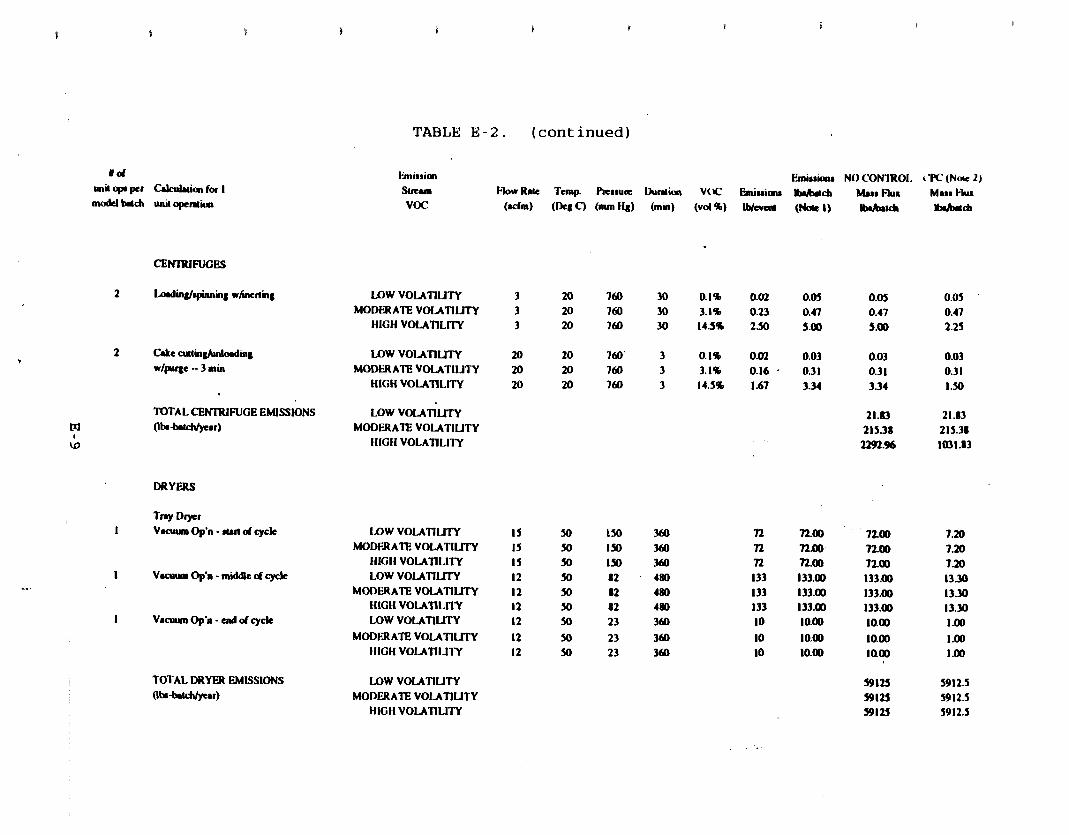
TOTAL CENTRIFUGE EMISSIONS M (Ib-budJyear)
1
w
DRYERS
I Vacuum Op'a - middled cyck
I Vacumn Op'n - addcyck
TOTAL DRYER EMISSIONS
(Ib-ar)
TABLE E-2. (continued)
Fmissim Slrrun Voc
LOW VOIATILITY MODERATI? VOLATIUTY
HIGH v o u n L l n
LOW v0LAnm-y MODERATE VOLATILITY
HIGH v o L A n L l n
MW v o L A m u n MODERATE VOLATILITY
HIGH V o u n L l n LOW v o u n m
MODERATE VOLATILITY HIGH v0unLn -y LOW VOLATILlTY
MODERATI?v o u n m y HIGH VoLAnL In
MW v o u n u n MODERATE VOLATIUTY
HIGH v o u n u n
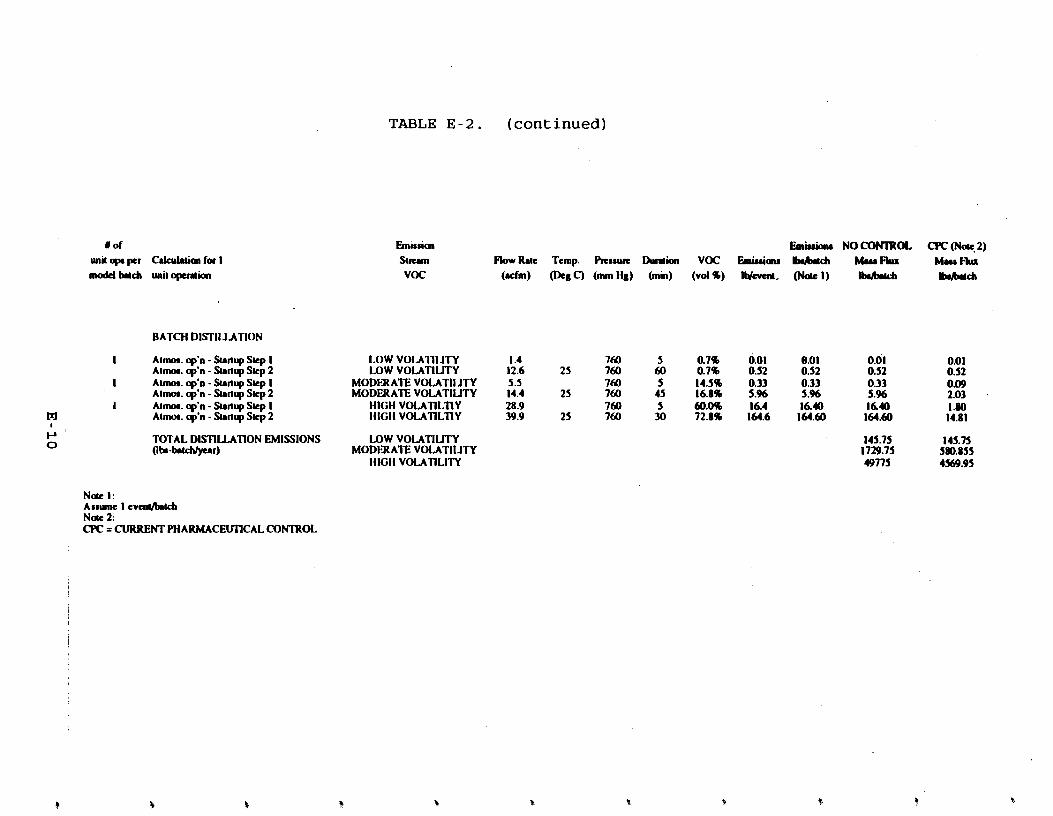
TABLE E-2. (continued)
BATCH DISTILLATION
I Almm. cp'n - h d l p Step I Aim. cp'n - h d l p Slep 2
LOW VOLAIIIJTY LOW VOLATILITY
1.4 12.6 25
760 760
5 60
0.7% 0.7%
0.01 0.52
8.01 0.52
I
I
Ahma. cp'n - h d l p Step I Ahma. cp'n - h d l p Step 2 A l m . op'n - h d l p Step I Ahma. cp'n - h d l p Step 2
MODERATE VOLATIUTY MODERATE VOLATIUTY
HIGH V O L A ~ L ~ Y HIGH V O L A ~ L ~ Y
5.5 14.4 28.9 39.9
25
2s
760 760 760 760
5 45 s 30
14.5% 16.8% 60.096 72.8%
0.33 5.96 16.4 164.6
0.33 5.96 16.10 164.60
TOTAL D l S l l L M O N EMISSIONS LOW VOLATIUTY W-b.lrmyur) MODERATE VOLATILITY
HIGH vounLln
Ndc 1: ASSUM IevaWbakb Ndc 2: CPC = CURRENTPHARMACEUllCAL CONTROL

---
&
In Emq
2 2
2 63s
(/1U
I+
8: isPS
5 "
PC
;
4G
4
gP +
4 0
0.
C
I C
I C
I.
3:20
bE
UI
r,
42
mm
mgs
225'
~
"g
zgla
m
I
kI
.B t i
8
$4
.
c &
E q
gq
~
JFF
JF
a
2
3
4
>OK
> &
e$
3
2s
3
58
S
ari
Sa
xe
e
& c
5e
cc
q g
Fg
i<
2
F&
+ 6
2s
F
JF
3>
s
3>
3
$K
$
gE
$ $;a
'5g
42
8
45
8e
8S
a =
ax
e
& c
ce5 geg ~
JFF
JF
3>
s
S>
S
,O~
>O
,OK
$
33
4
3;:
Sa
x
Sa
z
e e
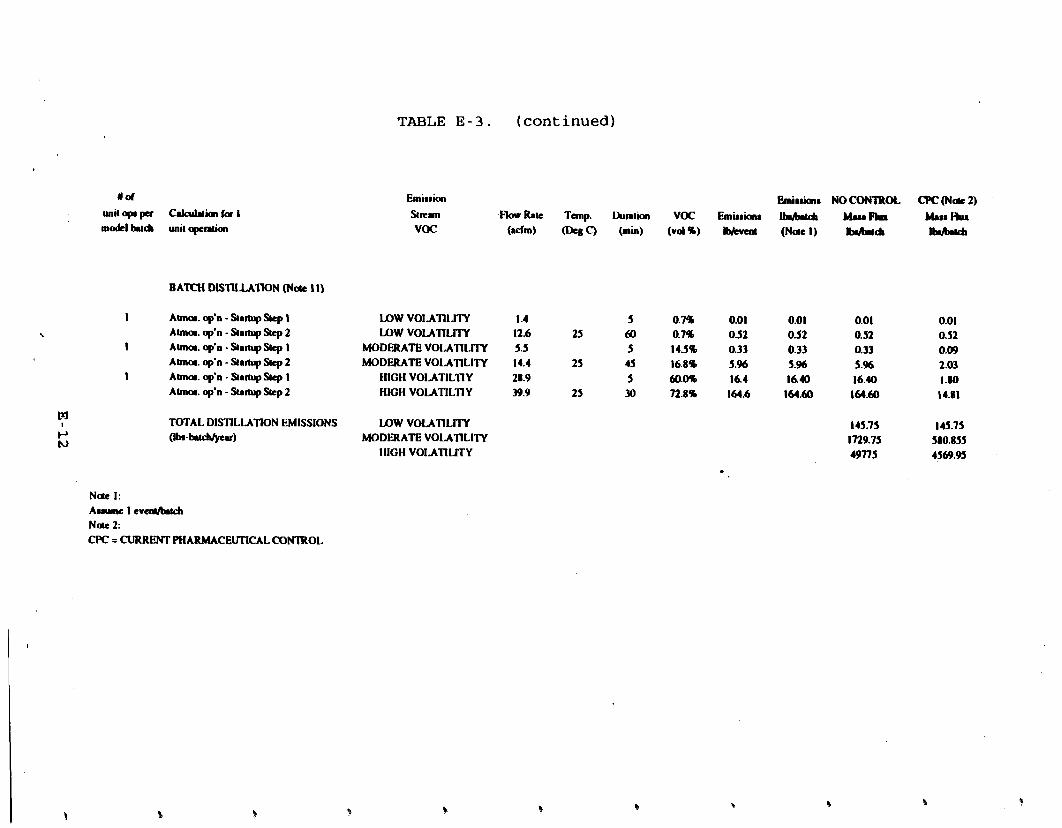
TABLE E - 3 . (continued)
E ~ L ~ INOCONTROL m m d c 2) 4 % ~Rar Tanp. Dunlion VOC E m i r r i a M M u r k k r r Ru
( d m ) (Dt8C) (min) (vd %) (Narc I) lblbrdr IbrAwlcb
BATCH DlS'IlLUnON (Nut I I)
I Abnrn. op'n - SlrlhlpSlcp I LOWV O L A T I L ~ IA Alma. op'n -SlawSlcp 2 UIW VOLATIL~TY 12.6
I A h a . op'n - Slaw Slcp 1 MODERATEvounLm 5.5 A h a . op'n - Slaw Slcp 2 MODERATE voLAnL1-n 14.4
I Alma. op'n - banup Slcp I HIGH VOLATILTIY 28.9 Alma. op'n - Slrrmp Slcp 2 HIGH VOLAULTIY 39.9
M I TOTAL DISTILLATION EMISSIONS t-' h)
Obr-hccNyeu)
Nde I: AIIM Ievawhch Nau 2: CPC = CURRENTPHARMACEUTICAL CON'IUOL

TABLE E-4. EMISSION STREAM CHARACTERISTICS FOR FORMULATOR MODEL PLANT
IAW VOLATILITY I8 20 I5 0.6% a z 9 1.29 1.29 MODERATEVOLATIUW 18 ZO I5 12.6% 282 12M 12.69
IllGH VOLATILITY I8 20 I5 9.9% 30.02 135.08 135.01
'MTAL DISPLACEMENT EMISSIONS U)W V O L A T I U ~ (Ibr-b.lch/ycrr) MODERATE V O L A T I L ~
MGH v o u n L r n
UIW V O L A T I U ~ 31 m 15 0.1% an 0.12 a12 MODERATE VOLATILITY 30 20 I5 3.1% 1.17 1.17 1.17
HIGH V O L A T I L I ~ 30 20 1s 14.5% 12.51 12.51 12.51
U)W V O L A T I U ~ ISO 37 3 03% a 3 9 0.39 Q39 MODERA'IE VOLATIL~~Y 19 37 3 7.5% 265 2.65 265
HIGH VOLA~LITY I SO 31 3 27.2% 22.19 22.19 22.19
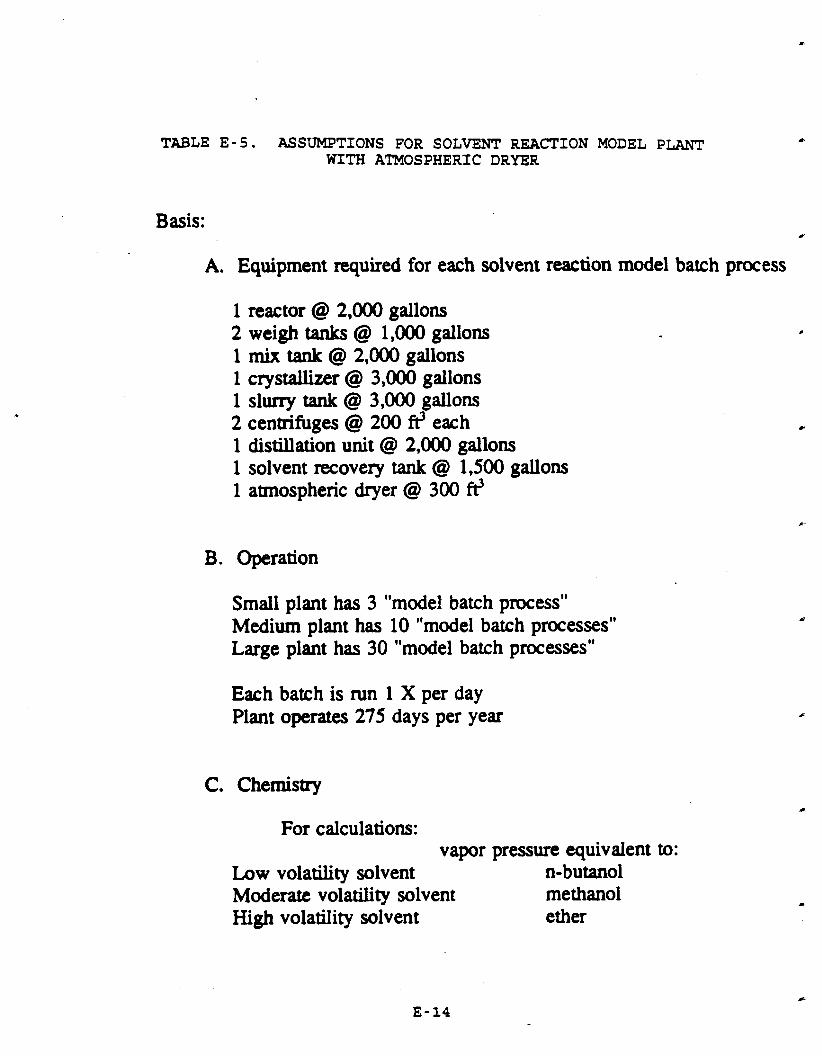
L
TABLE E-5. ASSUMPTIONS FOR SOLVENT REACTION MODEL PLANT WITH ATMOSPHERIC DRYER
Basis:
A. Equipment required for each solvent reaction model batch process
1 reactor @ 2,000 gallons 2 weigh ta& @ 1,000 gallons 1 mix tank@ 2,000 gallons 1 crystallizer @ 3,000 gallons 1 slurry tank @ 3,000 gallons 2 centrifuges @ 200 f? each 1 distillation unit @ 2,000 gallons 1 solvent recovery tank @ 1,500 gallons 1 atmospheric dryer @ 300
B. Operation
Small plant has 3 "model batch process" Medium plant has 10 "model batch processes" Large plant has 30 "model batch processes"
Each batch is run 1 X per day Plant operates 275 days per year
C. Chemistry
For calculations: vapor pressure equivalent to:
Low volatility solvent n-butanol Moderate volatility solvent me than01 High volatility solvent ether

TABLE E-6. ASSUMPTIONS FOR SOLVENT REACTION MODEL PLANT WITH VACWM DRYER
Basis:
A. Equipment required for each solvent reaction model batch process
1 reactor @ 2,000 gallons 2 weigh tanks@ 1,000 gallons 1 mix tank @ 2,000 gallons 1 crystallizer @ 3,000 gallons 1 slurry tank @ 3,000 gallons 2 centrifuges @ 200 tt'each 1 distillation unit @ 2,000 gallons 1 solvent recovery tank @ 1,500 gallons 1 vacuum tray dryer @ 300 @
B. Operation
Small plant has 3 "model batch process" Medium plant has 10 "model batch processes" Large plant has 30 "model batch processes"
Each batch is run 1 X per day Plant operates 275 days per year
C. Chemistry
For calculations: vapor pressure equivalent to:
Low volatility solvent n-butanol Moderate volatility solvent methanol High volatility solvent ether
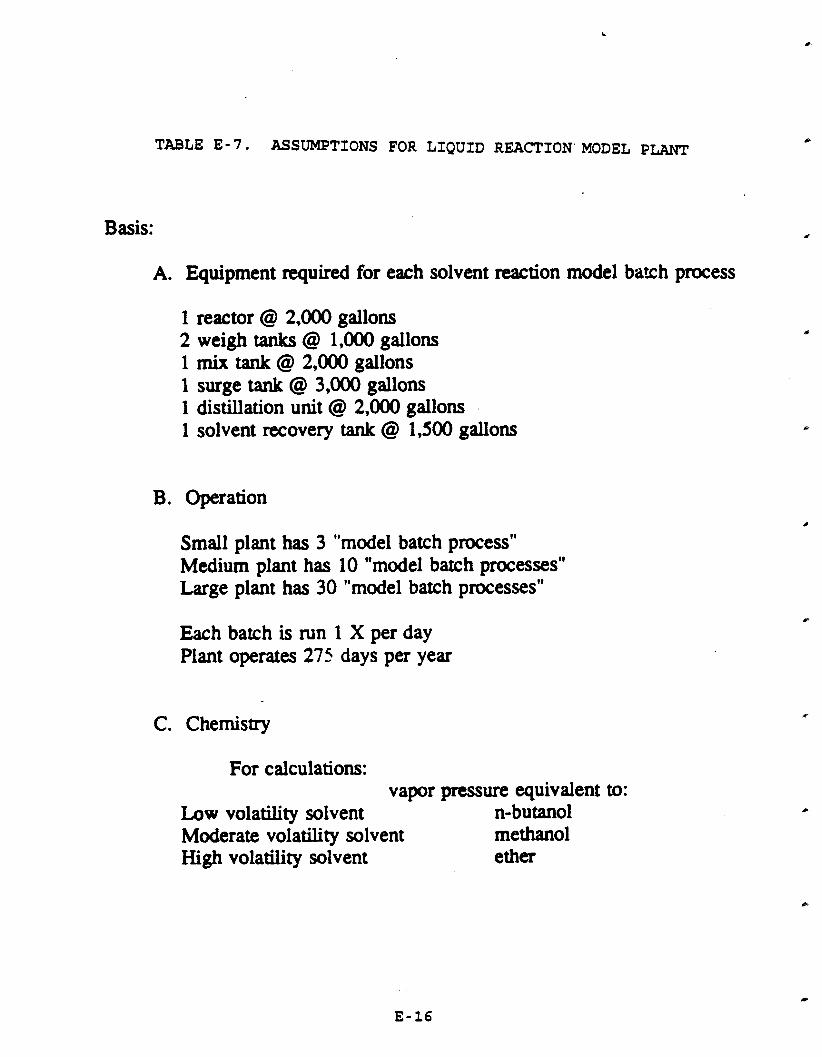
TABLE E-7. ASSUMPTIONS FOR LIQUID REACTION'MODEL PLANT
Basis:
A. Equipment required for each solvent reaction model batch process
1 reactor @ 2,000 gallons 2 weigh tanks @ 1.000 gallons 1 mix tank @ 2,000 gallons 1 surge tank @ 3,000 gallons 1 distillation unit @ 2,000 gallons 1 solvent recovery tank @ 1,500 gallons
B. Operation
Small plant has 3 "model batch process" Medium plant has 10 "model batch processes" Large plant has 30 "model batch processes"
Each batch is run 1 X per day Plant operates 275 days per year
C. Chemistry
For calculations: vapor pressure equivalent to:
Low volatility solvent n-bu tan01 Moderate volatility solvent methanol Hi@ volatility solvent ether

TABLE E-8. ASSUMPTIONS FOR FORMULATION MODEL PLANT
Basis:
A. Equipment required for each fomulation model batch process
1 reactor @ 2,000 gallons 2 weigh tanks @ 1,000 gallons 1 tank @ 2,000 gallons 1 surge tank @ 3,000 gallons 1 closed in-line process filter (no emissions)
.B. Operation
Small plant has 3 "model batch process" Medium plant has 10 "model batch processes" Large plant has 30 "model batch processes"
Each batch is run 1 X per day Plant operates 275 days per year
C. Chemistry ,
For calculations: vapor pressure equivalent to:
Low volatility solvent n- butanol Moderate volatility solvent methanol High vdatility solvent ether
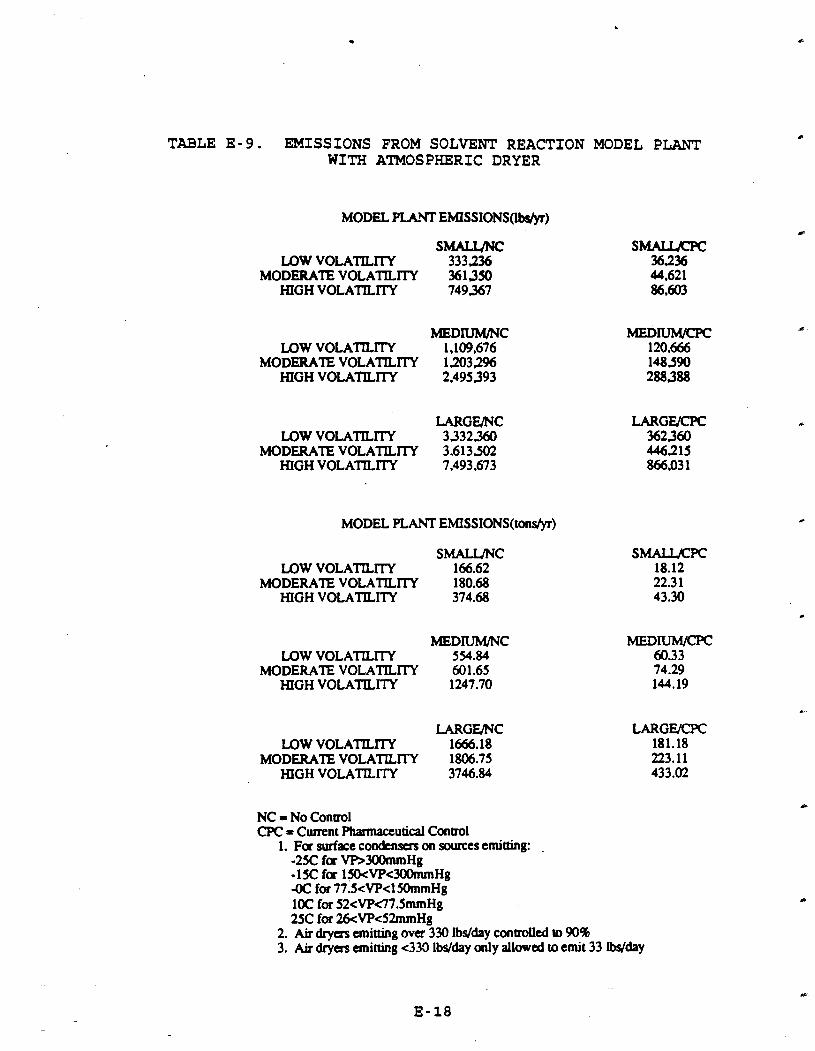
TABLE E-9. EMISSIONS FROM SOLVENT REACTION MODEL PLANT WITH ATMOSPHERIC DRYER
MODEL U y T EM1SSIONSObsh.r)
SMALUNC LOW VOLATILITY 333336
MODERATE VOLATILITY 361350 HIGH VOLATILITY 749367
MEDIUM/NC LOW VOLATILITY 1,109,676
MODERATE VOLATILITY 1.203296 HIGH VOLATILITY 2.495393
LARGUNC LOW VOLATILITY 3332360
MODERATE VOLATILITY 3,613,502 HIGH VOLATILITY 7,493,673
MODEL PLANT EMISSIONS(tondyr)
SMALUNC LOW VOLATILITY 166.62
MODERATE VOLATILITY 180.68 HIGH VOLATILITY 374.68
MEDIUM/NC LOW VOLATILITY 554.84
MODERATE VOLATILITY 601.65 HIGH VOLATILITY 1247.70
LARGUNC LOW VOLATILrrY 1666.18
MODERATE VOLATILITY 1806.75 HIGH VOLATILITY 3746.84
NC = No Control CPC= Cumnt Phannactutical Control
1. F a surface condcnsas on sources emitting: . -25C f a VR300mmHg -15C f a 150<VP<300mmHg -OC for 77.5<VP<lSOmrnHg 10C for 52<VP47JmmHg 25C for 26<VP<52mmHg
2. Air dryers emitting over 330 lbs/day conUolled to90% 3. Air dryers anitting <333 Ibs/day only allowed toemit 33 Ibdday

TABLE E-10. EMISSIONS FROM SOLVENT REACTION MODEL PLANT WITH VACUUM DRYER
SMALUNC LOW VOLATILITY 18061 1
MODERATE VOLATILITY 208.725 HIGH VOLATILITY 596.742
M E D W C LOW VOLATILITY 601,435
MODERATE VOLATILnY 695,055 HIGH VOLATILITY 1,987,152
LARGUNC LOW VOLATILITY 1.806,110
MODERATE VOLATILITY 2,081,252 HIGH VOLATILITY 5,967,423
MODEL PLANTEMISSIONS(tons/yr)
SMALWNC LOW VOLATILITY 90.3 1
MODERATE VOLATILITY 104.36 HIGH VOLATILITY 298.37
MEDIUM/NC LOW VOLATILITY 300.72
MODERATE VOLATILITY 347.53 HIGH VOLATILITY 993.58
LARGUNC LOW VOLATILITY 903.06
MODERATE VOLATlLITY 1043.63 HIGH VOLATILlTY 2983.71
NC = No Control CPC =Curnnt Pharmaceutical Control
1. FaSrpfse condensas on sourcesemitting: - 2 X faVP>300mmHg -1SC fa 150<VP<300mmHg -0C for77J<VPclHknmHg lOC for52<VP47.51nqHg 2X for26<VP<52mmHg
2. Air dryas emitting ova 330 Wday controlled to 90% 3. Air dryers emiaing <3M Wday only allowed to emit 33 IWday
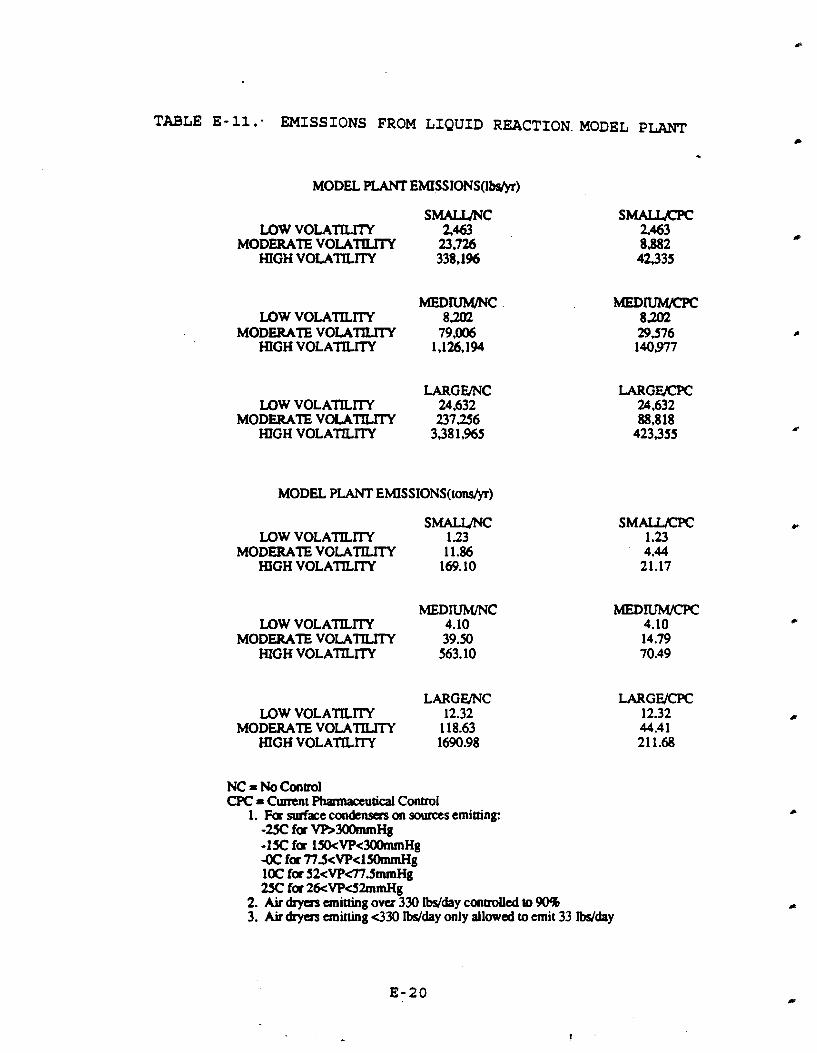
TABLE E-11: EMISSIONS FROM LIQUID REACTION.MODEL PLANT
MODEL PLANT EMISSIONS(lbs/yr)
SMALUNC LOW VOLATILITY 2.463
MODERATE VOLATILITY 23.726 HIGH VOLATILITY 338.1%
m m c LOW VOLATILITY 8202
MODERATE VOLATILITY 79,006 HIGH VOLATILITY 1,126,194
LARGUNC LOW VOLATILlTY 24,632
MODERATE VOLAntrrY 237256 HIGH VOLATILITY 338 1,965
MODEL PLANTEMISSIONS(tons/yr)
SMALUNC LOW VOLATILlTY 123
MODERATE VOLATILITY 11.86 HIGH VOLATILITY 169.10
MEDILIM/NC LOW VOLATILITY 4.10
MODERATE VOLATILITY 39.50 HIGH VOLATILITY 563.10
LARGUNC LOW VOLATILITY 12.32
MODERATE VOLA'T'ILnY 118.63 HIGH VOLATILlTY 1690.98
NC = No Control CPC = Cumnt Phrnmaccutical Control
1. Fad a c e condensas on sourcesemiaing: -uCfaYA30(knmHg -1SC fa lSO<VP<30(knmHg -OC fa77J<VP<l%nmHg 10C fa52<VP47.SmmHg 2!X fa26<VP42mrnHg
2. Air dryas anitting o v a 330 Wday controlled to W% 3. Air was anitting <330 Wday only allowed to emit 33 Wday
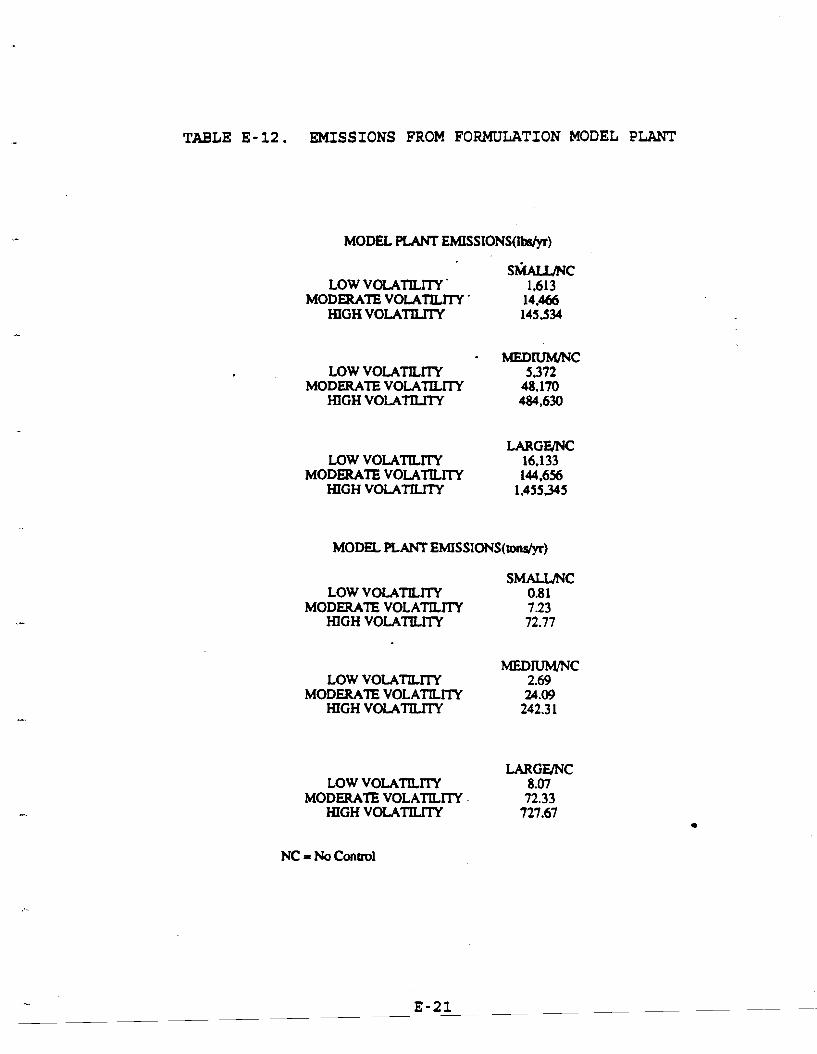
TABLE E-12. EMISSIONS FROM FORMULATION MODEL PLANT
MODEL PLANTEMISSIONS(Ibs/yr)
LOW VOLATILITY ' MODERA'IE VOLATILITY '
HIGH VOLATlLlTY
LOW VOLATILITY MODERATE VOLATILITY
HIGHVOLATILITY
LOW VOLATILrrY MODERATE VOLATILITY
HIGH VOLATILITY
MODEL PLANTEMISSIONS(tons/yr)
S M U C LOW VOLATILITY 0.81
MODERATE VOLATILITY 723 HIGH VOLATILITY 72.77
MEDIUMITW LOW VOLATILITY 2.69
MODERATE VOLATILITY 24.09 HIGH VOLATILITY 242.3 1
LARGUNC LOW VOLATILITY 8.07
MODERA'IE VOLATILITY. 72.33 HIGH VOLATILITY 727.67
NC = No Control
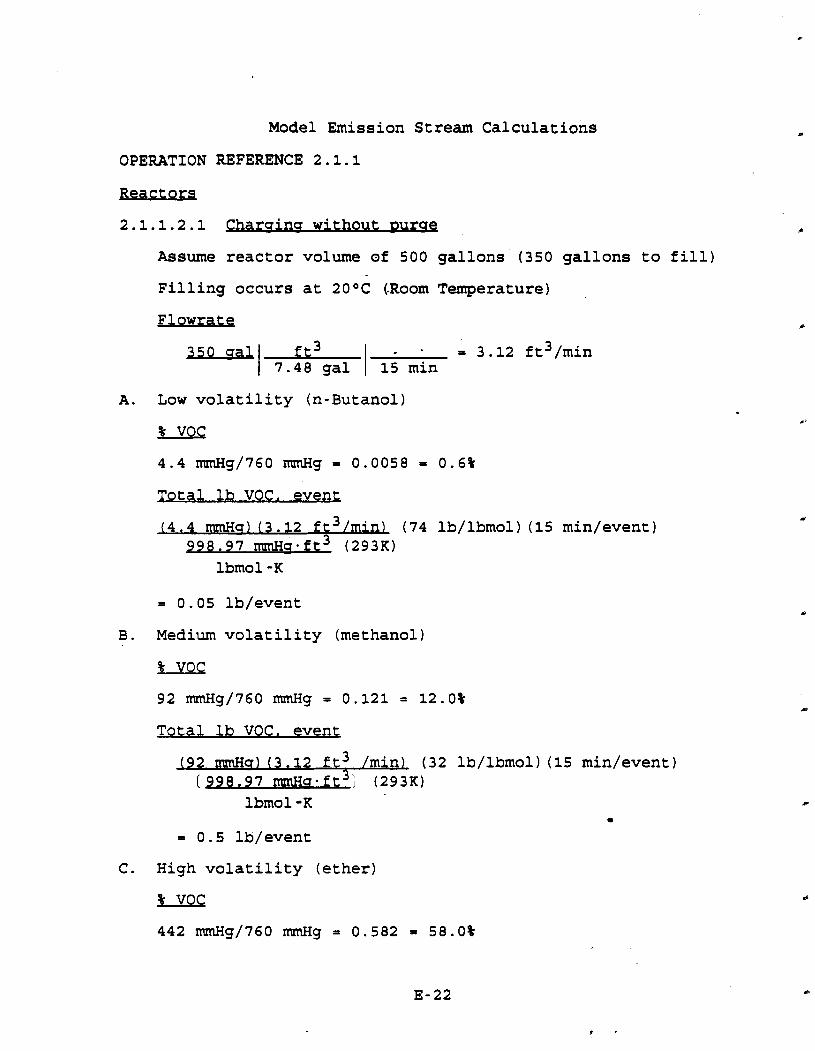
Model Emission Stream Calculations
OPERATION REFERENCE 2.1.1
Reactors
2.1.1.2.1 Charuinu wit-hout D-
Assume reactor volume of 500 gallons (350 gallons to fill)
Filling occurs at 20 OC (-Room Temperature)
A. Low volatility (n-Butanol)
Total lb VOC. event
(4.4 nunHo) (3.12 ft3/minl (74 lb/lbmol) (15 min/event) 998.97 mmHcrft3 (29310
lbmol K
B. Medium volatility (methanol)
Total lb VOC. event
(92 mmHcr) (3.12 ft3 /min) (32 lb/lbmol) (15 midevent) [998.97 mu-ft3j (293K)
lbmol K a
= 0.5 lb/event
C. High volatility (ether)

Total lb VOC. evenL
(442 m a ) (3.12 ft3/min) (74 lb/lbmol) (15 midevent) 9 9 8 -97 mmHu*ft3 (293K)
lbmol K
2.1.2.2.1 aaruina with mrae
flow rate out of reactor = purge rate
A. Low volarility (n-Butanol)
Assume 10% of saturation
(0.10) (0.6) = 0.06%
Total lb VOC. event
(760 mrnHu) (0.0006) (30 ft3/min) (74 lb/lbmol) (15 min) 998 -97 rrnnHu.ft3 (293K)
lbmol K
B. Medium volatility (methanol)
Assume 10% of saturation
Total lb VOC. event
(760 m a ) (0,012) (30 ft3/min) (32 lb/lbmol) (15 min) 398.97 nmr~cr-ft3 (293K)
lbmol K
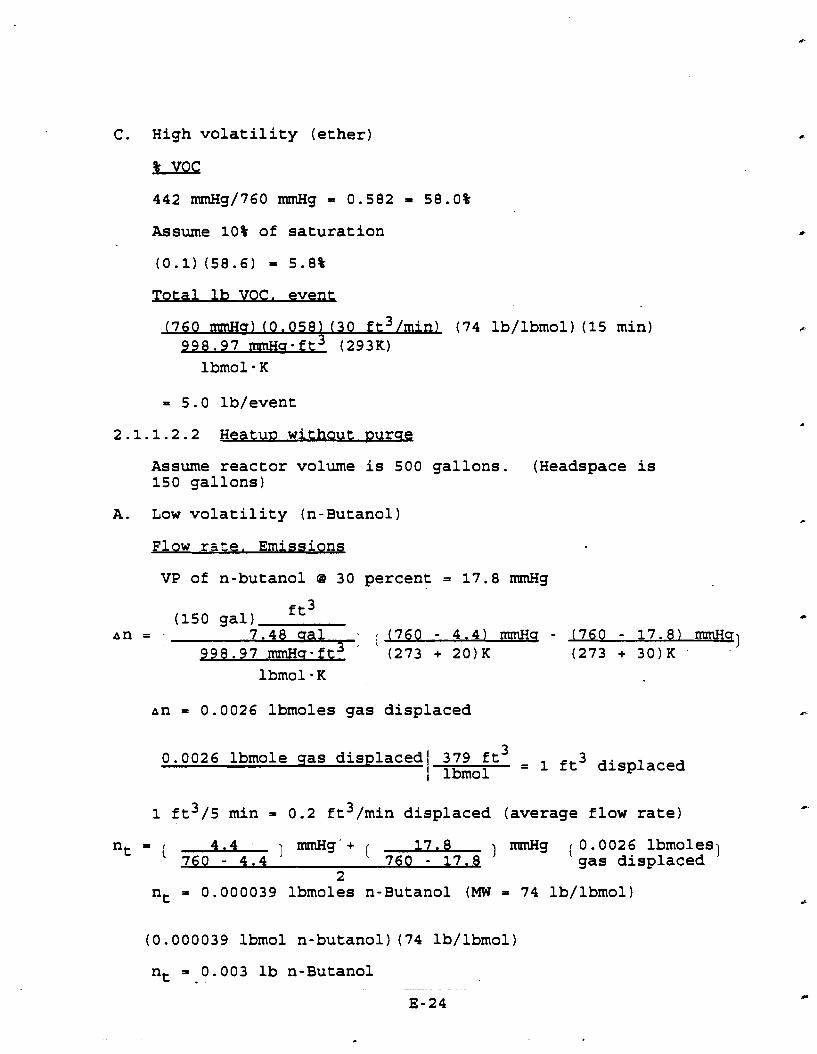
C. High volatility (ether) - 442 nanHg/760 nanHg = 0.582 = 58.0%
Assume 10% of saturation
(0.1) (58.6) = 5.8%
Total lb VOC. event
(760 mrnHa) (0.058) (30 ft3/min) (74 lb/lbmol) (15 min) 998.97 rnnHsit3 (293K)
lbmol K
2.1.1.2.2 H e a t u ~ without. Durae
Assume reactor volume is 500 gallons. (Headspace is 150 gallons)
A. Low volatility (n-Butanol)
Flow rate. Emissiong
VP of n-butanol @ 30 percent = 17.8 nanHg
(150 gal) ft3 L
an = 7.48 aal l ( ( 7 6 0 - 4.4) nrmHq - (760 - 17.8) 998.97 mmHs-it (273 + 20)K (273 + 30)K
-41
lbmol K
an = 0.0026 lbmoles gas displaced rn
3 0 .OO26 lbmole qas displacedl 379 ft3 = ft displaced I lbmol
1 ft3/5 min = 0.2 ft3/min displaced (average flow rate)
t = ( ,604.4 ] -g.+ ( 17.8 ) mmHg ( 0.0026 lbmoles) - 4.4 760 - 17.8 gas displaced 2
nt = 0.000039 lbmoles n-Butanol (MW = 74 lb/lbmol)
(0.000039 lbmol n-butanol) (74 lb/lbmol)
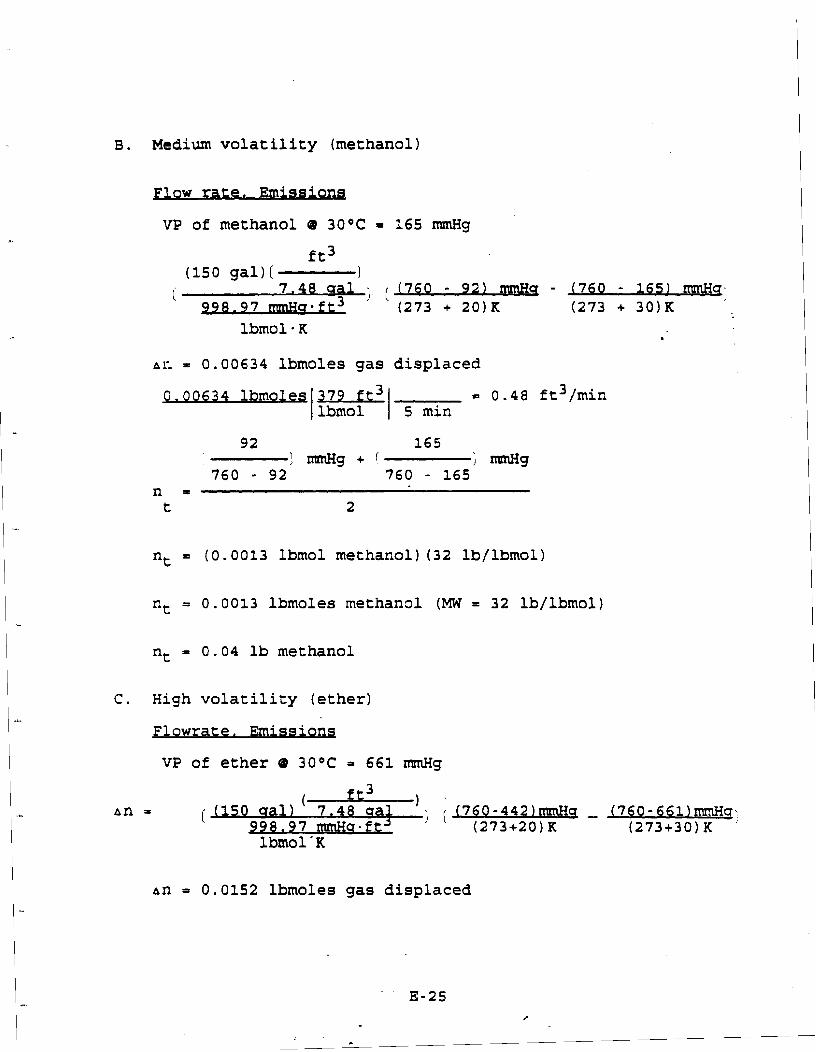
B. Medium volatility (methanol)
Flow rate. E x n a g
VP of methanol @ 30°C = 165 mmHg
ft3 (150 gal)( 1
i 7.48 a&; ((760 - 92) mmHq - 1760 - 165) rrrmHq>. ,
998.97 m u .ft3 (273 + 20)K (273 + 30)K lbmol .K
a c = 0.00634 lbmoles gas displaced
9.00634 lbmoleg = 0.48 ft3/rnin 0 5 min
nt = (0.0013 lbmol methanol) (32 lb/lbmol)
nt = 0.04 lb methanol
C. High volatility (ether)
Flowrate. Emissiong
VP of ether @ 30°C = 661mmHg
rr3
a n = 0.0152 lbrnoles gas displaced
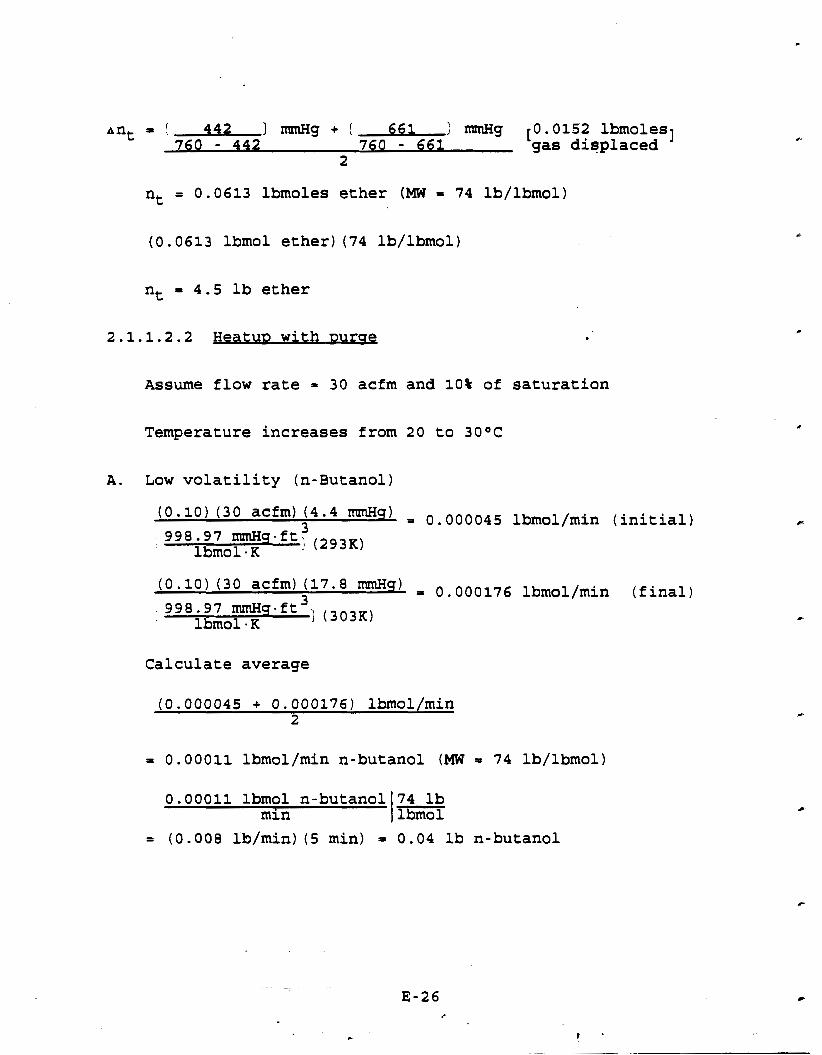
ant = L 442 1 mmHg + [ 661 : mnHg [0.0152 lbmolesl 760 - 442 760 - 661 gas displaced
2
nt = 0.0613 lbmoles ether (MW = 74 lb/lbmol)
(0.0613 lbmol ether) (74 lb/lbmol)
nt = 4.5 lb ether
2.1.1.2.2 HeatuD with mrse *
Assume flow rate = 30 acfm and 10% of saturation
Temperature increases from 20 to 30°C
A. Low volatility (n-Butanol)
(0.10)(30 acfm) (4.4 mmHq) = 0.000045 lbmol/min (initial) -3998.97 mnHq.ft; (293K)
lbmol - K
(0'10) (30 (17" mmHq) = 0.000176 lbmol/min (final) 998.97 mmHq.ft 31 (303K)
lbmol -K
Calculate average
0.00011 lbmol/min n-butanol (MW = 74 lb/lbmol)
0.00011 lbmol n-butanol 74 lb mln lbrnol1
= (0.008 lb/min) (5 min) = 0.04 lb n-butanol
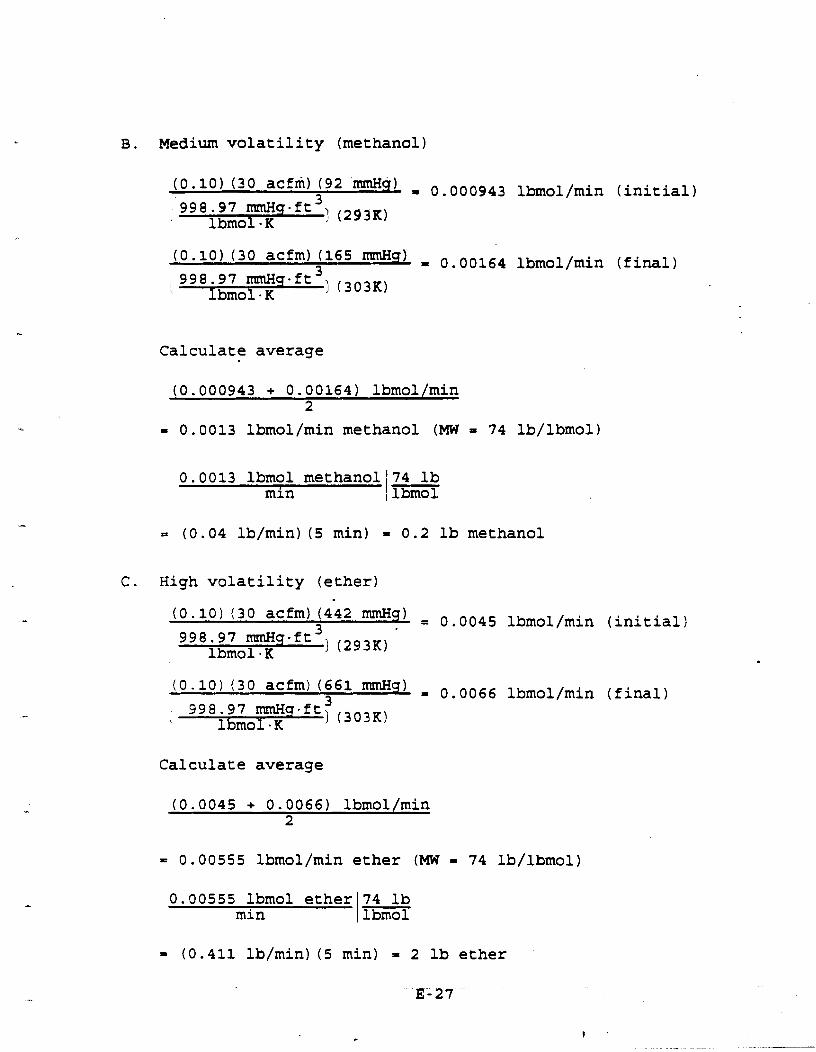
B. Medium volatility (methanol)
(0*10) (30 acW)!92 = 0.000943 lbrnol/min (initial)
, 998.97 ~ n ~ ~ . f t ' ~ (303K) lbmol.K
Calculate average
(0.000943 + 0.00164) lbmol/min 2
= 0.0013 lbmol/min methanol (MW = 74 lb/lbmol)
0.0013 lbmol methano1174 lb min l lbrnol
= (0.04 lb/min) (5 min) = 0.2 lb methanol
C. High volatility (ether)
(O.lO)(30 (661 mmHq) = 0.0066 lbmol/min (final) 3 , 998.97 LRKLH~.~~) (303K)
lbmol-K
Calculate average
= 0.00555 lbmol/min ether (MW = 74 lb/lbmol)
0.00555 lbmol ether 74 lb min / lbmol
= (0.411 lb/min) ( 5 min) = 2 lb ether
-
E-27
r '
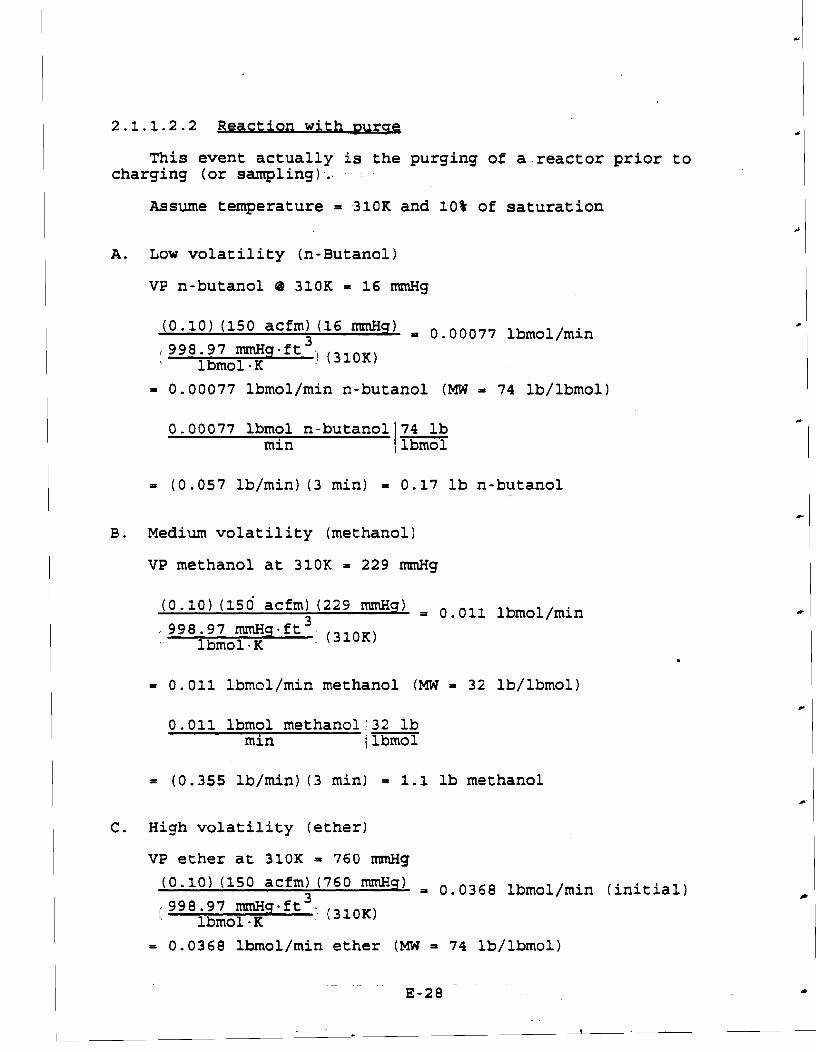
2.1.1.2.2 Reaction with Durug
This event actually is the purging of a reactor prior to charging (or sampling) .
Assume temperature = 310K and 10% of saturation
A. Low volatility (n-Butanol)
VP n-butanol @ 310K = 16 mmHg
,998.97 mmHq.ft3, (310K) lbmol- K
= 0.00077 lbmol/min n-butanol (MW 74 lb/lbmol)
0.00077 lbmol n-butano1174 lb min / ~brnol
= (0.057 lb/min) (3 min) = 0.17 lb n-butanol
B. Medium volatility (methanol)
VP methanol at 310K = 229 mrnHg
1 = 0.011 lbmol/min methanol (MW = 32 lb/lbmol)
0.011 lbmol methanolj32 lb min 1 lbmol
1 = (0.355 lb/min) (3 min) = 1.1 lb methanol
C. High volatility (ether)
VP ether at 310K = ,760mmHg
, 998.97 i m n ~ g q (310K)lbmol-K
1 = 0.0368 lbmol/min ether (MW = 74 lb/lbrnol)

0.0368 lbmol ether 74 lb min lbrnolI
= (2.72 lb/min) (3 min) = 8.2 1b ether - -
2.1.1.2.3 Reactor vacuum transfer
Vacuum transfer would typically occur when transferring the contents of a 55 gallon drum to a reactor. The emissions would result from displacing air saturated with VOC1s out of the reactor prior to drawing in new product.
Air displaced: assume 500 gallon reactor
A. LOW volatility (n-butanol)
Jnitial air
. 998.97 rrnnHgftJ1 (293K) lbmol .K
Final a i ~
0.1735 lbmol - 0.0228 lbmol = 0.1507 lbmol
Flow rate -0.1507 lbmol 3 51 = 5.7 ft /min 10 min
VOC emissions
A. Low volatility (n-butanol)
VP @ 2O0C = 4.4 m g
Assume saturation; vol% ranges from 0.6 to 4.4
Total VOC emissions based on average vol%
(0.6 + 4.4)/2 = 2.5 vol%
(0.1512 lbmol) (0.025) (74 lb/lbmol) = 0.3 lb n-butanol
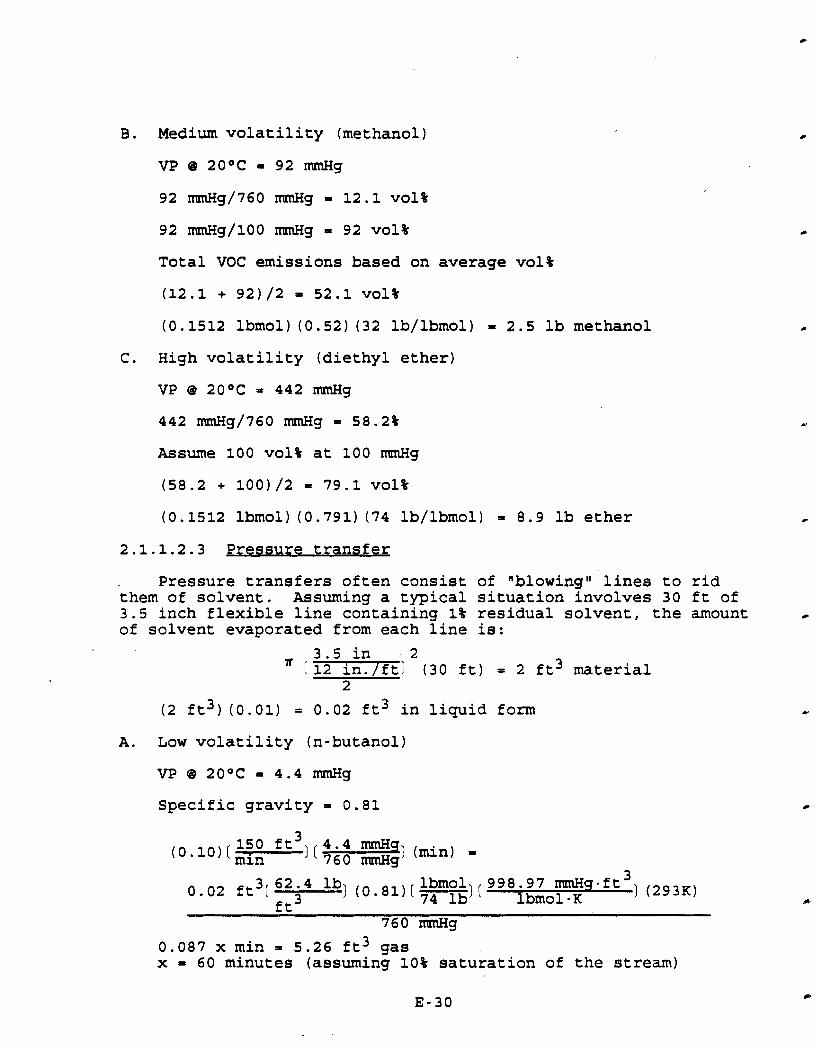
B. Medium volatility (methanol)
VP @ 20°C = 92 mmHg
92 mmHg/760 mmHg = 12.1 vol%
92 mmHg/lOO mmHg = 92 vol%
Total VOC emissions based on average vol%
(12.1 + 92)/2 = 52.1 vol%
(0.1512 lbmol) (0.52) (32 lb/lbmol) = 2.5 lb methanol
C. High volatility (diethyl ether)
VP @ 20°C = 442 mmHg
Assume 100 vol% at 100 mmHg
(0.1512 lbmol) (0.791) (74 lb/lbmol) = 8.9 lb ether
Pressure transfers often consist of nblowingll lines to rid them of solvent. Assuming a typical situation involves 30 ft of 3.5 inch flexible line containing 1% residual solvent, the amount @
of solvent evaporated from each line is:
(2 it3) (0.01) = 0.02 it3 in liquid form
A. Low volatility (n-butanol)
Specific gravity = 0.81
(0.10)(-1 150 it3 4.4 mmH I 760 (mi") =
3998.97 mmHg-ft 0.02 it ( 62.41b~(0.81)(74=, 3 lb)(lbmol
lbmol.K (2g3K)
L L
760 mmHg
0.087 x min = 5.26 ft3 gas x = 60 minutes (assuming 10% saturation of the stream)

B. Medium volatility (methanol)
VP @ 20°C = 92 mmHg
specific gravity = 0.792
lbmol 998.97 -9-ft5) (293K)0.02 ft ( 6204 lb) (0.792)(m1( lbmol.K
f G - 3
1.82 x min - 11.9 ft3 gas
x = 6.5 minutes
C. High volatility (diethyl ether)
Specific gravity = 0.8
33( 62.4 lb; to.8), lbmol' 998.97 mmHq.ft (293K)0.02 ft ,
,,3 ' 74 lb) ! lbmol .K
8.72 x min = 5.2 ft3 gas
x = 0.596 minutes
2.1.1.2.3 m~tvreactor ~uruing
A. Low volatility (n-butanol)
Standard industry practice (Chapter 3)
(500 gal) (ft3/7.48 gal) = 67 ft3
100 ft3/67 ft3 1 1.5 vessel volume changes

i
Emissions = 67 ft3 (0.0011 1b/ft3 - 0.000242 lb/ft3) = 0.057 lb
B. Medium volatility (methanol)
(92 rMnHg) (32 lb/lbmol) 3 = 0.0101 lb/ft
998.97 rMnHg.ft3 I 1 (293K)
lbmol-K
Emissions = 67 ft3 [0.0101 1b/ft3 - 0.22(0.0101 1b/ft3)]
C. High volatility (diethyl ether)
Emissions = 67 ft3 [0.1118 lb/ft3 - (0.22) (0.1118 lb/ft3) I
, .Exhaust co mDosltloq
A. Low volatility (n-butanol) -: 0.000242 lb butanol) ( lbmol)( 998.97 r m n ~ ~ f t ' ~ (293K3
3 74 lb lbmol .Kft air = 0.00126760 mmHg
B. Medium volatility (methanol)
30.00222 lb methanol lbmol]( 998.97 mmHq-ft (293K)
( 3 32 lb 1bm0l -K ft air = 0.027760 mmHg
C. High volatility (diethyl ether)
0.0246 lb diethyl etherl [ lbmol][ 998.97 nrrnHq.ft3 1 (293K)( 3 74 lb lbmol-Kft air = 0.128760 mmHg
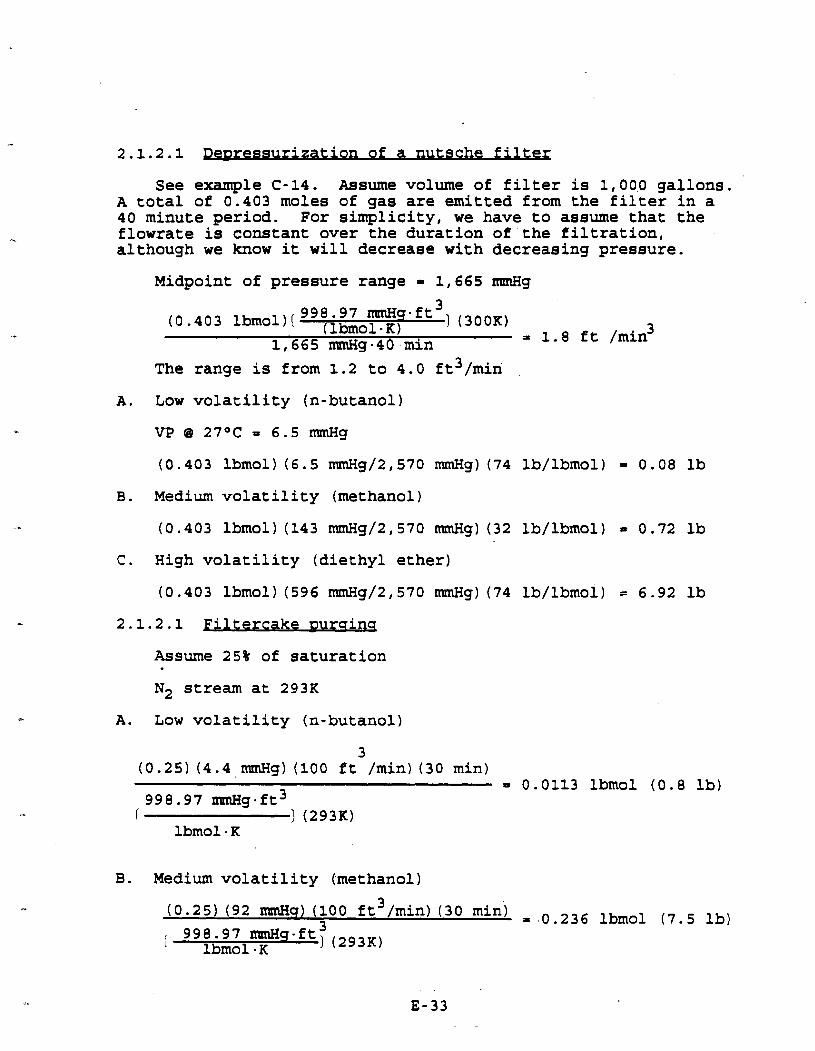
See example C-14. Assume volume of filter is 1,000 gallons. A total of 0.403 moles of gas are emitted from the filter in a 40 minute period. For simplicity, we have to assume that the flowrate is constant over the duration of.the filtration, although we know it will decrease with decreasing pressure.
Midpoint of pressure range = 1,665 nrmHg -3
(0.403 lbmol) 998.97 mnHq-ft (300K) ( (lbmol.R)
= 1.8 ft /min 3 1,665 m~nHg-40 .min
The range is from 1.2 to 4.0 ft3/miri
Low volatility (n-butanol)
(0.403 lbmol) (6.5 nnnHg/2,570 mmHg) (74 lb/lbmol) = 0.08 lb
Medium volatility (methanol)
(0.403 lbmol) (143 mmHg/2,570 mmHg) (32 lb/lbmol) = 0.72 lb
High volatility (diethyl ether)
2.1.2.1 Filtercake uursing
Assume 25% of saturation
N2 stream at 293K
A. Low volatility (n-butanol)
3 (0.25)(4.4 mmHg) (100 ft /min) (30 min)
= 0.0113 lbm01 (0.8 lb) 998.97 mg.ft3
'1 (293K)lbmol. K
B. Medium volatility (.methanol)

C. High volatility (diethyl ether)
2.1.2.2 Heated futercake
A. Low volatility (n-butanol)
VP @ 100°C = 390 mmHg
Agsume 25% saturation
B. Medium volatility (methanol)
C. High volatility (diethyl ether)
Same as filtercake purging - but smaller flow rate
flowrate = 3 acfm
duration = 30 minutes
Exhaust composition
A. Low volatility (n-butanol)
3(0.25)(3 ft /min) (4.4 mmHq) (30 min) (74 lb/lbmol 0.025 lb-

Medium volatility (methanol)
(0.25)(3 ft3/min) (92 mnHq) (30 min) (32 lb/lbmol) 0.226 lb3998.97 m q - f t ) (293K) lbmol - K
High volatility (diethyl ether)
Filtercake cutting/unloading with purge
Same as centrifuge loading/spinning - but larger flow rate
flow rate = 20 ft3/min
duration = 30 minutes
Low volatility (n-butanol)
3(0.25)(20 ft /min) (4.4 mnHg) (30 min) (74 lb/lbmol) 0.167 lb , 998.97 mnHqft3 1 (293K)lbmol .K
Medium volatility (methanol)
(0.25)(20 ft3/min) (92 mnHq) (30 min) (32 lb/lbmol) 1b'I
: 998 -97 mnHg-ft') (293K3 lbmol .K
High volatility (diethyl ether)
2.1.3 Vacuum d w u - Blender Drver
The emission stream characteristics for this unit operation are based on data that was reported from industry. A total of 160 lb of MeOH over the entire cycle (6 hours) was reported to be emitted. We assume that 100 lb was emitted over the first 2 hours, 50 over the next 3 hrs, and 10 in the last hour. Because the vapor pressure of MeOH and acetone exceeded the minimum operating pressure in the dryer (50 m) at 40°C, the solvent was assumed to be boiling off the product the entire time.

This calculation is consistent with Example 6 of Chapter 3.
The average emission rate over the drying cycle is:
Assuming the initial (max) emission rate is twice the average, then 53 lb/hr should be emitted over the initial drying period, which is consistent with 100 lb over the first 2 hours.
Again, the solvents were effectively "boiling offn the product because of the low dryer operating pressure. Eressure . was reported to be in the range of 150 rnmHg to 20 m g . The cycle time for this dryer is 36 hours.
215 lb total - lb/hr 36 hours
We assumed twice this rate for the initial 6 hours, or (6)(2) (6) = 72 lb
The emissions over the remainder of the cycle are: 143 lb. We assumed that the last 6 hours of the cycle only contributed to 10 lb, and therefore emissions over the middle of the cycle are 143 - 10 = 133 lb over 24 hours.
convective Drrerg
TRAY Drver
The documentation for this model emission stream comes from p. 75 of f , May 1990, in which 180'hg of solvent must be evaporated over the course of an entire drying cycle. Assuming 50 percent of the total material evaporated during the cycle comes off in the first hour, the hourly emission rate is 90 kg (200 lb/hr) during the first hour. Assuming the last hour of the drying cycle tubes care of 5 percent of the total solvent, or 9 hg (20 lb/hr), then the middle part of the cycle, which lasts four hours emits 180 hg -90 - 9 = 81 kg (180 lb) or 45 lb/hr.
The volume percentage of VOC in the exit gas was calculated for all cases of volatility according to the difference in molecular weights of the low, moderate, and high volatility -
materials.
lbmol 998.97 nmHq ftJl (338 K)(200 lb/hr) ( 74 ib) ( lbmol K 760 mmHg
- 1,200 ft3/hr ( hr, ] - 20 ft3/min % vol = (20)/6000~28?g%
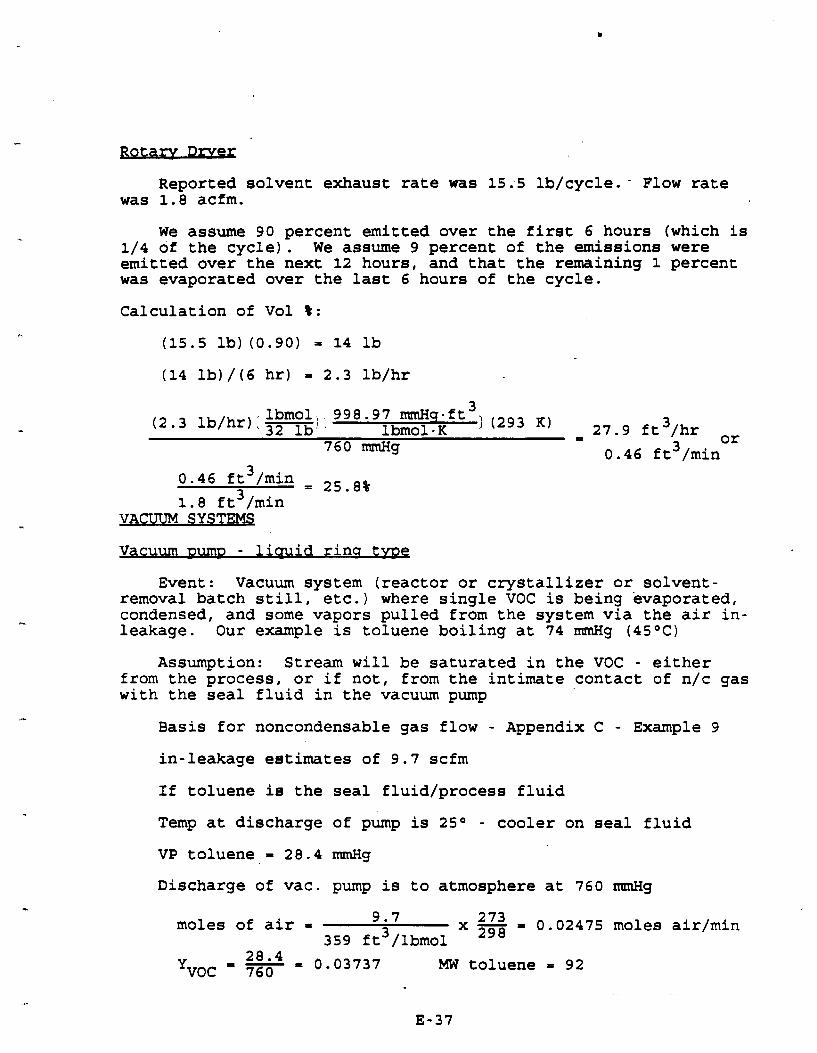
Reported solvent exhaust rate was 15.5 lb/cycle.- Flow rate was 1.8 acfm.
We assume 90 percent emitted over the first 6 hours (which is 1/4 of the cycle). We assume 9 percent of the emissions were emitted over the next 12 hours, and that the remaining 1 percent was evaporated over the last 6 hours of the cycle.
Calculation of Vol t:
lbmol,.998.97 mnHq.ft 3 (293 K)(2.3 lb/hr)( 32 lb: . lbmol .K = 27.9 ft3/hr or760 mnHg 0.46 ft3/min
30.46 ft /min _ 25.8a 31.8 ft /min
VACUUM SYSTEM$
~Vacuum ~ u -m liuuid rins t m
Event: Vacuum system (reactor or crystallizer or solvent- removal batch still, etc.) where single VOC is being evaporated, condensed, and some vapors pulled from the system via the air in- leakage. Our example is toluene boiling at 74 m H g (4S°C)
Assumption: Stream will be saturated in the VOC - either from the process, or if not, from the intimate contact of n/c gas with the seal fluid in the vacuum pump
Basis for noncondensable gas flow - Appendix C - Example 9
in-leakage estimates of 9.7 scfm
If toluene is the seal fluid/process fluid
Temp at discharge of pump is 25O - cooler on seal fluid
VP toluene = 28.4 nunHg
Discharge of vac. pump is to atmosphere at 760 mmHg
9.7 273moles of air = x -= 0.02475 moles air/min 359 ft3/lbmol 298
28.4 = -= 0.03737 MW toluene = 92'VOC 760
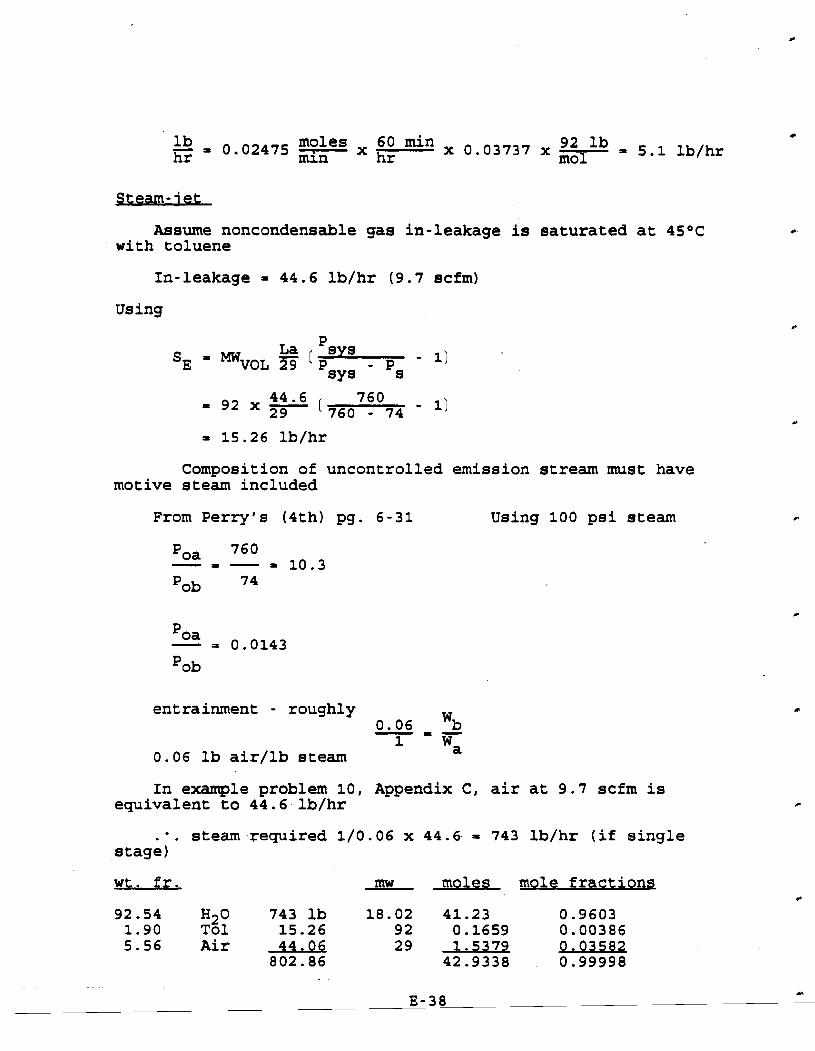
Assume noncondensable gas in-leakage is saturated at 45OC with toluene
In-leakage = 44.6 lb/hr (9.7 scfm)
Using
Composition of uncontrolled emission stream must have motive steam included
From Perry's (4th) pg. 6-31 Using 100 psi steam
entrainment - roughly 0.06 wb - a
1 W 0.06 lb air/lb steam a
In e-le problem 10, Appendix C, air at 9.7 scfm is equivalent to 44.6 lb/hr
:. steam required 1/0.06 x 44.6 a 743 lb/hr (if single stage)
w t . fr. mw moles mole fractiow
5.56 Air 44.06 802.86
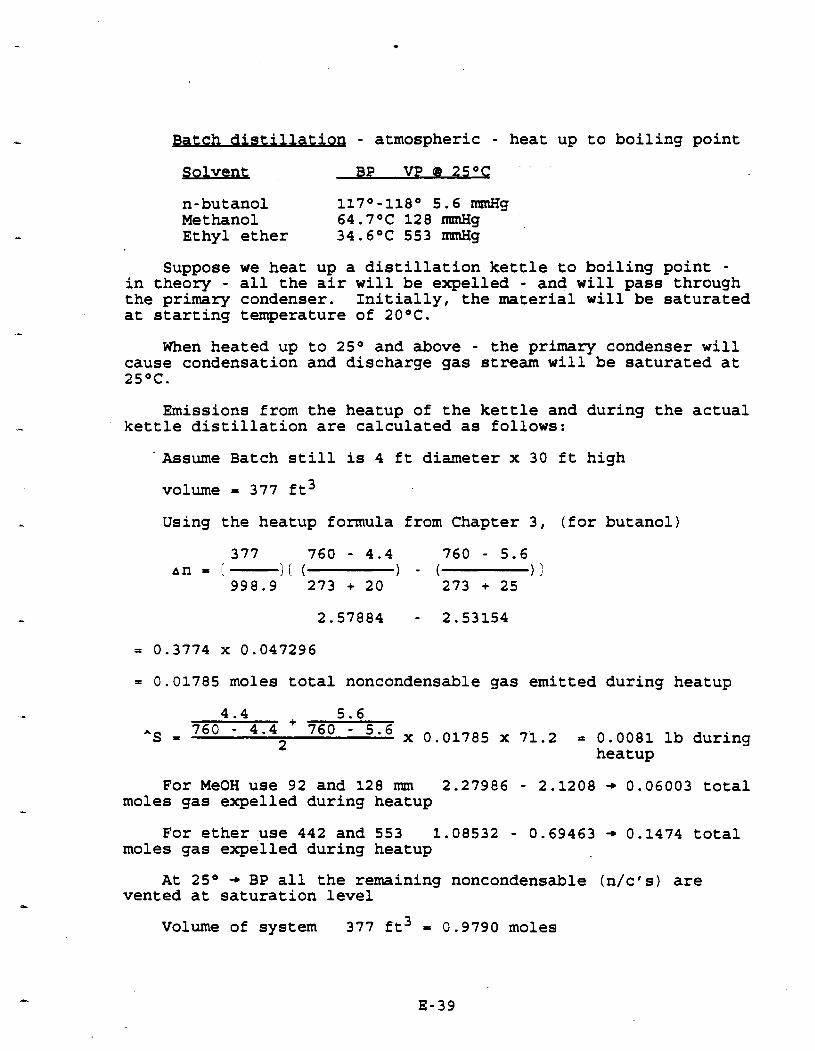
Batch distillation - atmospheric - heat up to boiling point
Solvent BP VP @ 2S°C
n-bu tan01 1 1 7 ° - 1 1 8 0 5 . 6 nrmHg Methanol 64.7OC 1 2 8 m H g Ethyl ether 34.6OC 553 m H g
Suppose we heat up a distillation kettle to boiling point -in theory - all the air will be expelled - and will pass through the primary condenser. Initially, the material will be saturated at starting temperature of 20°C.
When heated up to 2S0 and above - the primary condenser will cause condensation and discharge gas stream will be saturated at
Emissions from the heatup of the kettle and during the actual kettle distillation are calculated as follows:
' Assume Batch still is 4 ft diameter x 3 0 ft high
volume = 3 7 7 ft3
Using the heatup formula from Chapter 3 , (for butanol)
= 0 . 0 1 7 8 5 moles total noncondensable gas emitted during heatup
4 . 4 + 5 . 6 = 760 - 4 - 4 760 - 5 . 6 x 0 . 0 1 7 8 5 x 7 1 . 2 - 0 . 0 0 8 1 lbduring9
L heatup
For MeOH use 92 and 1 2 8 mm 2 .27986 - 2 . 1 2 0 8 + 0 .06003 total moles gas expelled during heatup
For ether use 442 and 553 1 . 0 8 5 3 2 - 0 . 6 9 4 6 3 + 0 . 1 4 7 4 total moles gas expelled during heatup
At 2S0 4 BP all the remaining noncondensable (n/cls) are vented at saturation level
Volume of system 3 7 7 ft3 - 0 - 9 7 9 0 moles
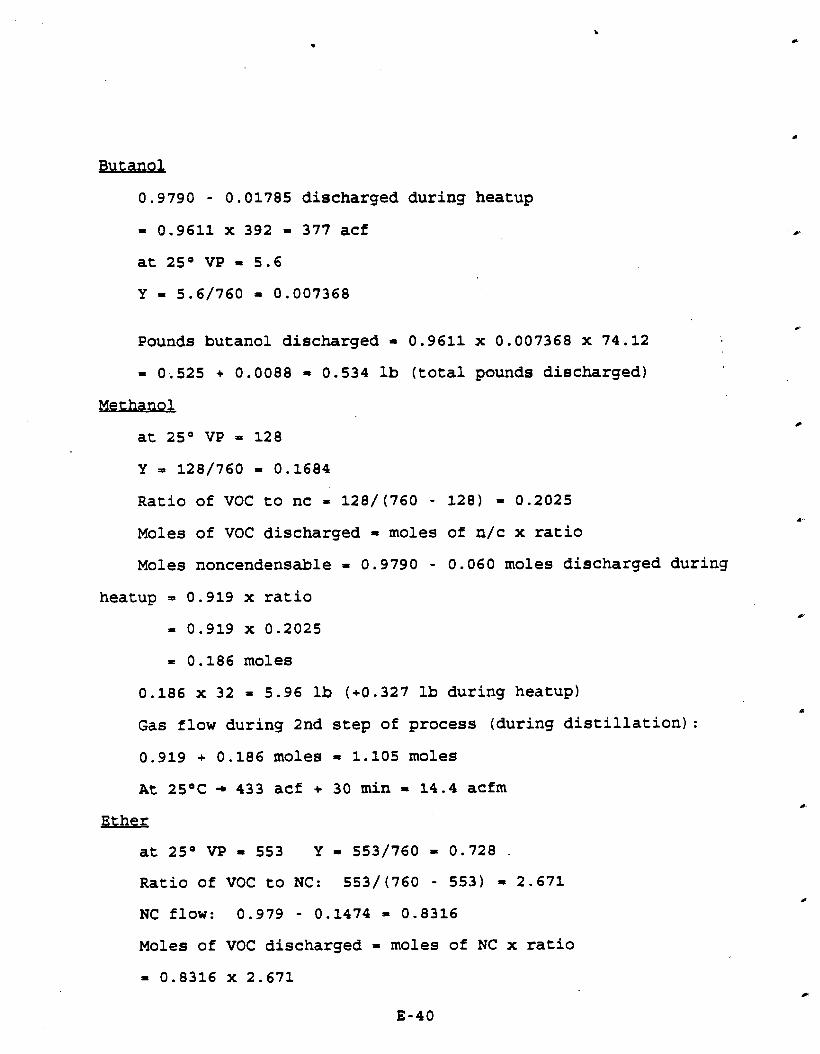
Butanol
0.9790 - 0.01785 discharged during heatup
= 0.9611 x 392 = 377 acf
at 2S0 VP = 5.6
Y = 5.6/760 = 0,007368
Ilr
Pounds butanol discharged = 0.9611 x 0.007368 x 74.12
= 0.525 + 0.0088 = 0.534 lb (total pounds discharged)
Methanol
Ratio of VOC to nc = 128/(760 - 128) = 0.2025
Moles of VOC discharged = moles of n/c x ratio
Moles noncendensable = 0.9790 - 0.060 moles discharged during
heatup = 0.919 x ratio
= 0.919 x 0.2025
= 0.186 moles
0.186 x 32 = 5.96 lb (+0.327 lb during heatup)
Gas flow during 2nd step of process (during distillation) :
0.919 + 0.186 moles = 1.105 moles
At 2S°C + 433 acf + 30 min = 14.4 acfm
Ether
at 2S0 VP = 553 Y = 553/760 - 0.728
Ratio of VOC to NC: 553/(760 - 553) = 2.671
Moles of VOC discharged = moles of NC x ratio
C
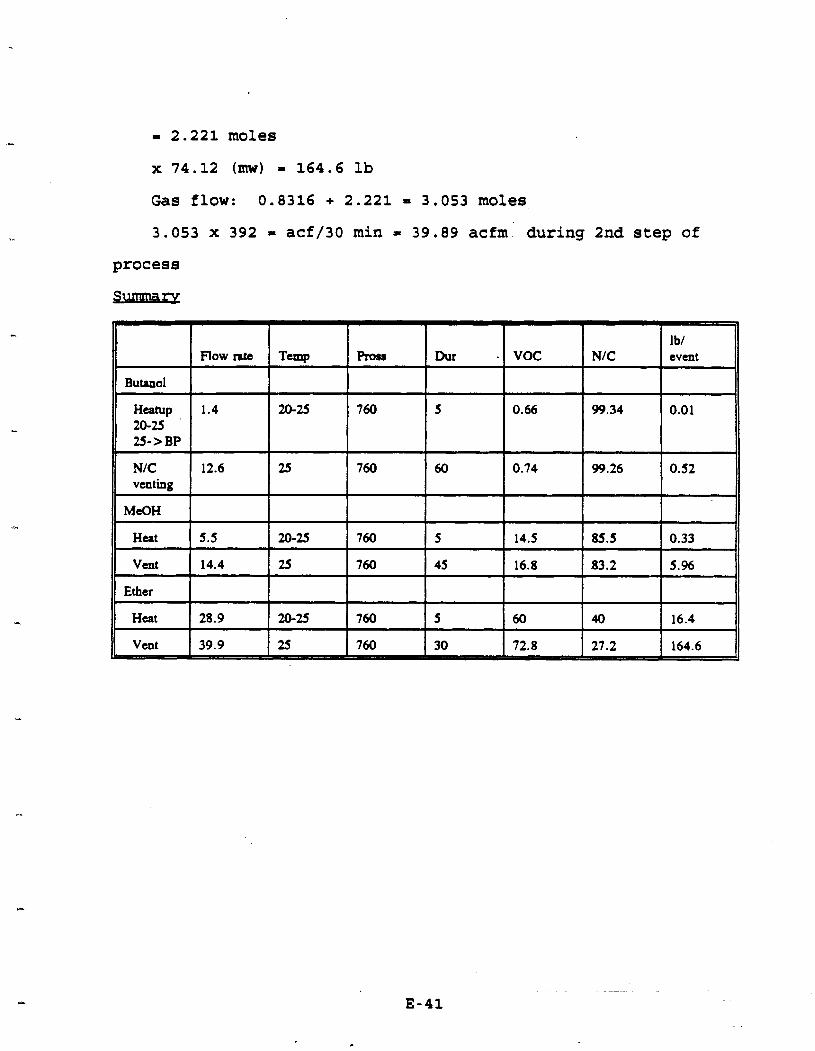
= 2.221 moles
x 74.12 (mw) = 164.6 lb
Gas flow: 0.8316 + 2.221 = 3.053 moles
3.053 x 392 = acf/30 min = 39.89 acfm during 2nd step of
process
Sunanarr
NIC rat1 Butanol
Heamp 1.4 20-25 25->BP
NIC 12.6 venting
MeOH
Ether
Heat
# vent 1 39.9
APPENDIX F.
MASS EMISSIONS CURVES

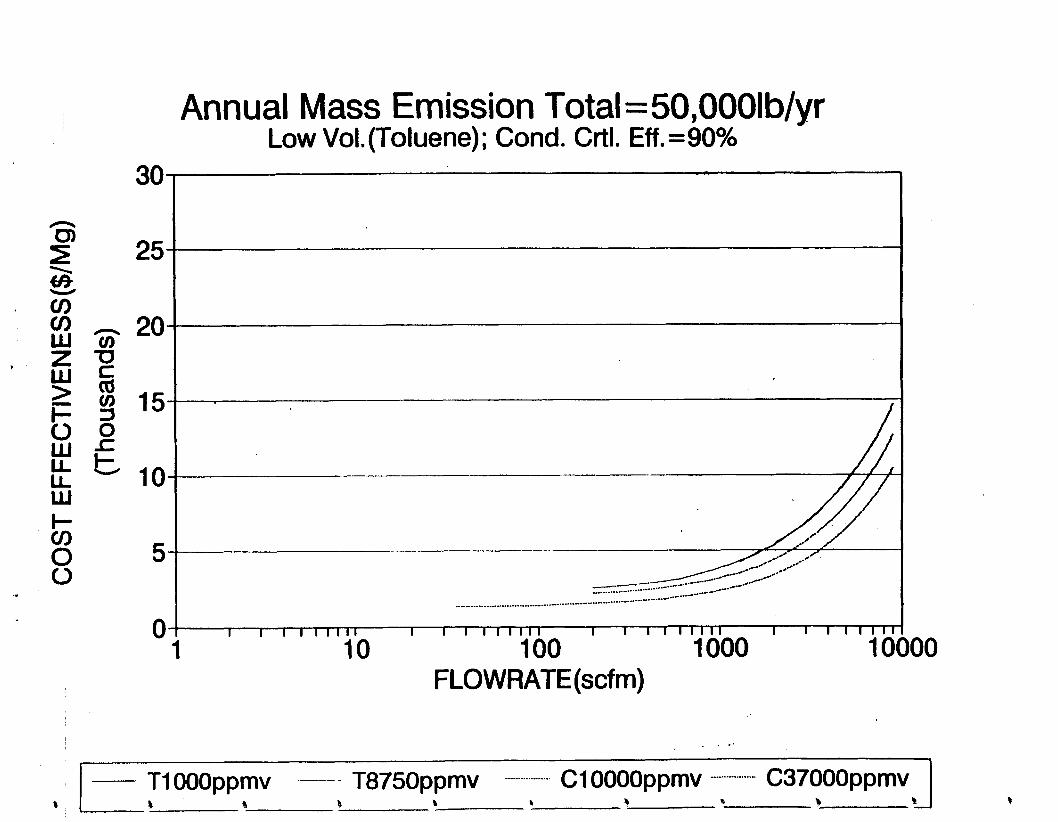
30
Annual Mass Emission Total =50,00OIb/yr-Low Vol. (Toluene); Cond. Crtl. Eff.=90%
0 1 I I I 1 1 1 1 1 1 I I I 1 I I I l l I I I 1 1 1 1 1 1 I I 1 I I I I I
1 10 100 1000 10 FLO WRATE (scfm)

Annual Mass Emission Total =75,00OIb/vr *
Low Vol. (Toluene); Cond. Crtl. ~ f f . =go%
FLOWRATE(scfm)
TI OOOppmv -- - - T8750ppmv .. -. -..... C1OOOOppmv ...-....-..... C37000ppm~ -

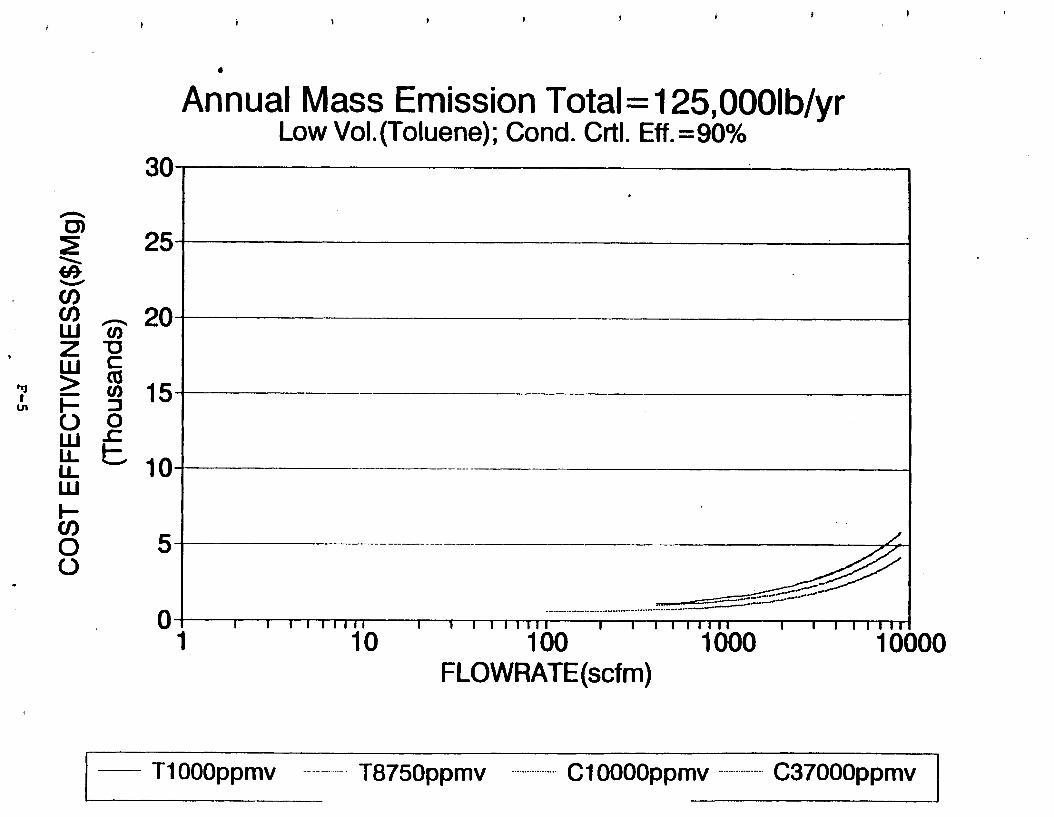


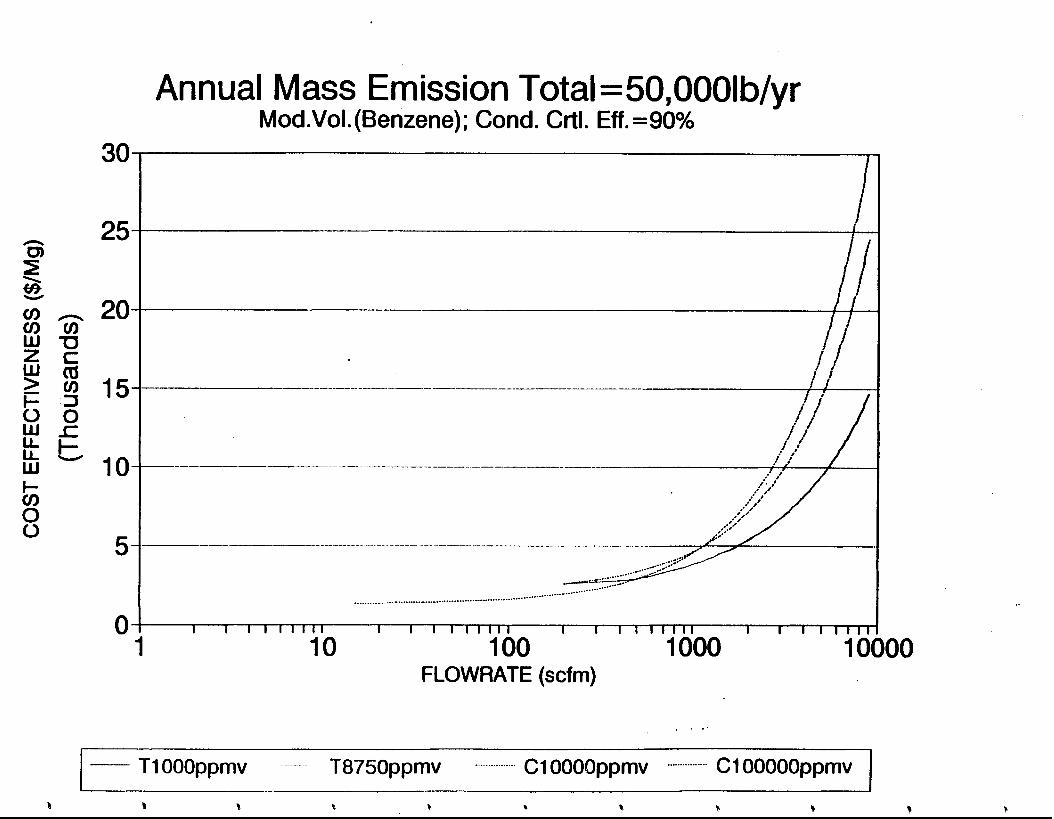
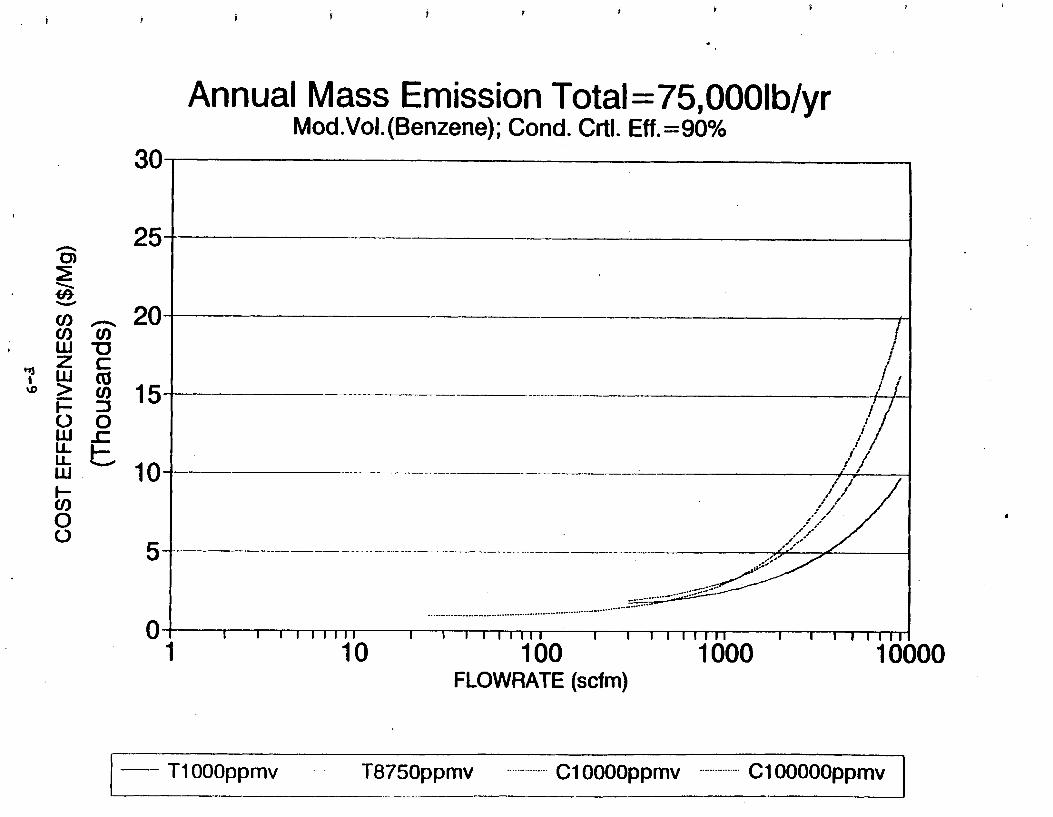
**---.. I-..
0
l-'


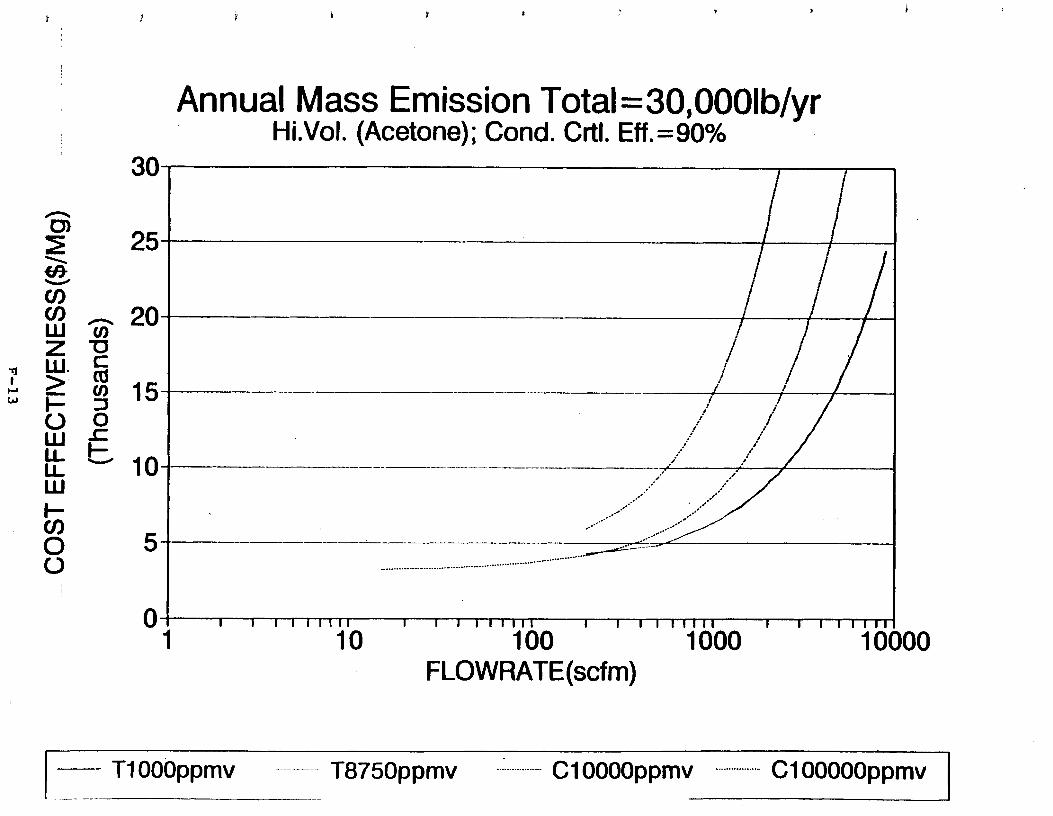

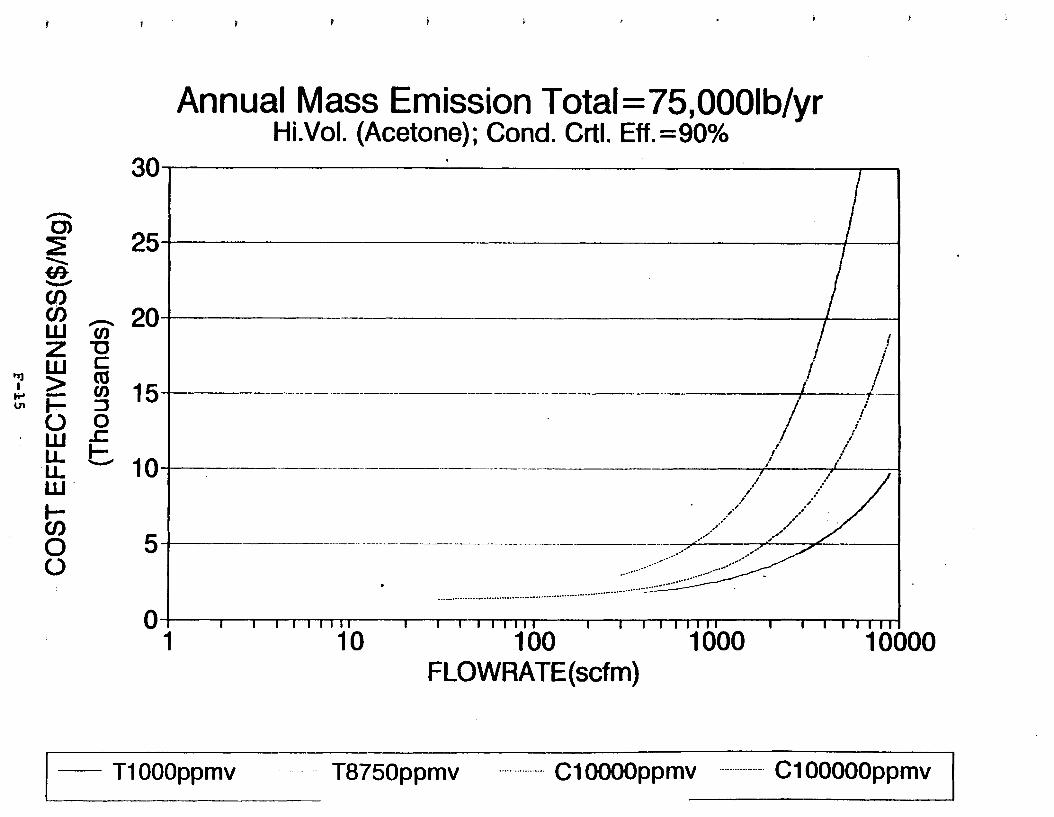
a;;a a
.-C
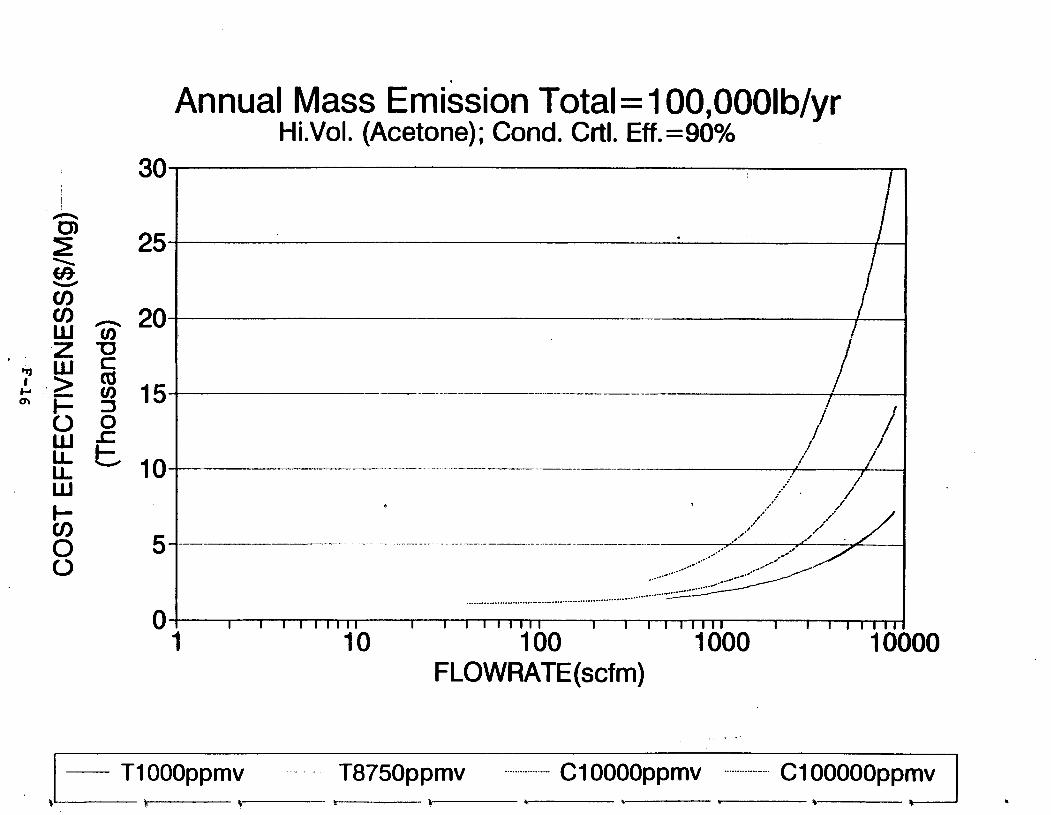


Annual Mass Emission Total =150,00OIb/vr Hi.Vol. (Acetone); Cond. Crtl. Eff.=SO%
m
100 FLOWRATE (scf m)
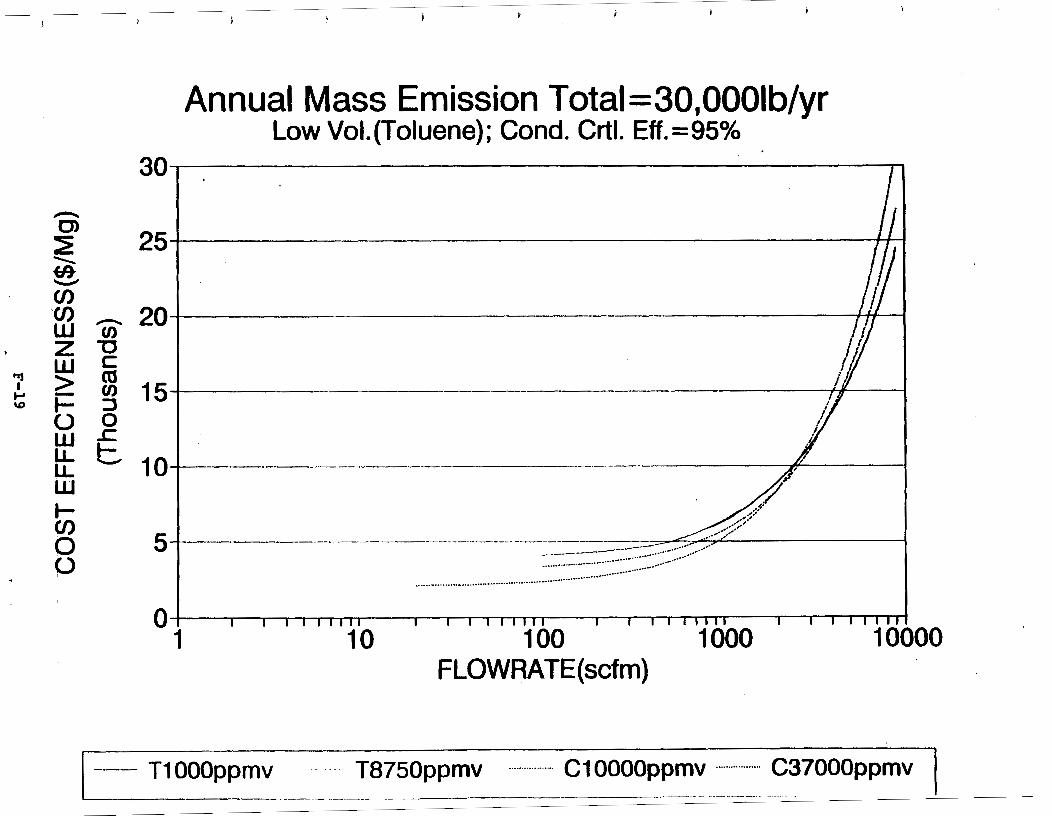
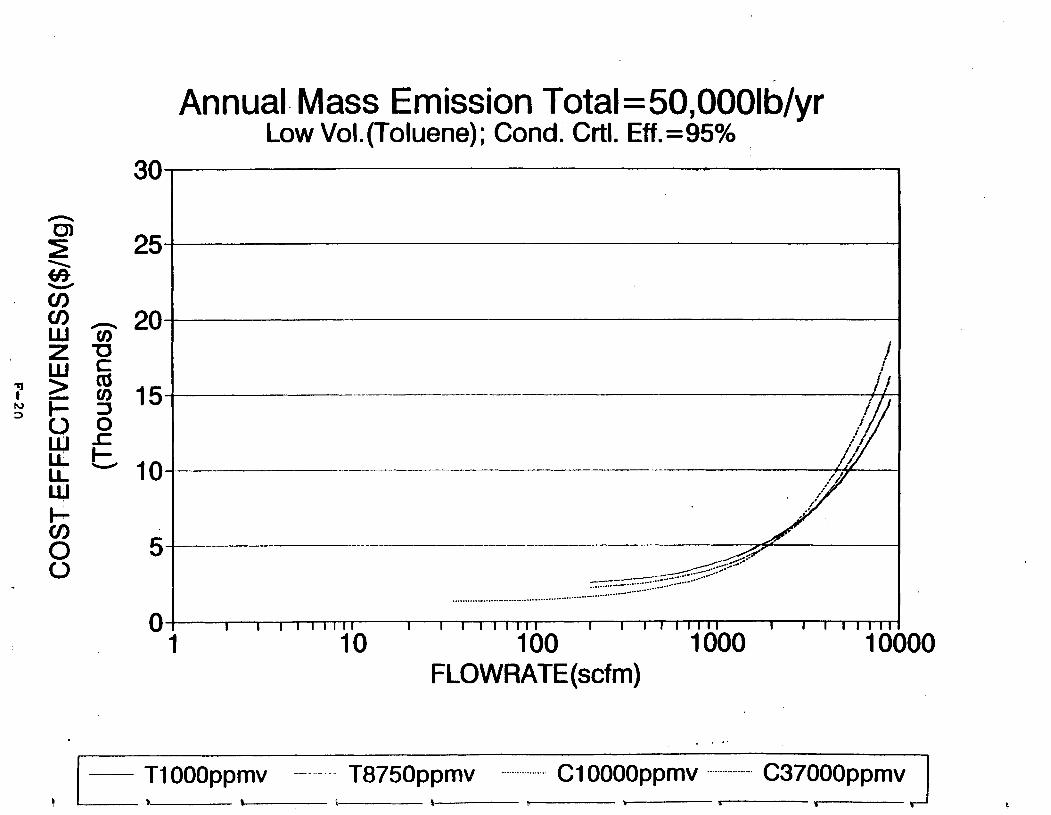
Annual. Mass Emission Total=50,0001b/vr C
Low Vol. (Toluene); Cond. Crtl. ~ f f . =&%
0 1 I I I 1 1 1 1 1 1 I I I I I I I l l I I I 1 1 1 1 1 1 I I I I I l l 1
1 10 100 1 000 1 01 FLOWRATE(scfm)
B kTI OOOppmv --#
.............. - T8750ppmv ......... c1O O O O ~ ~ ~ ~
7-pC37000ppmvJc--.--.------s
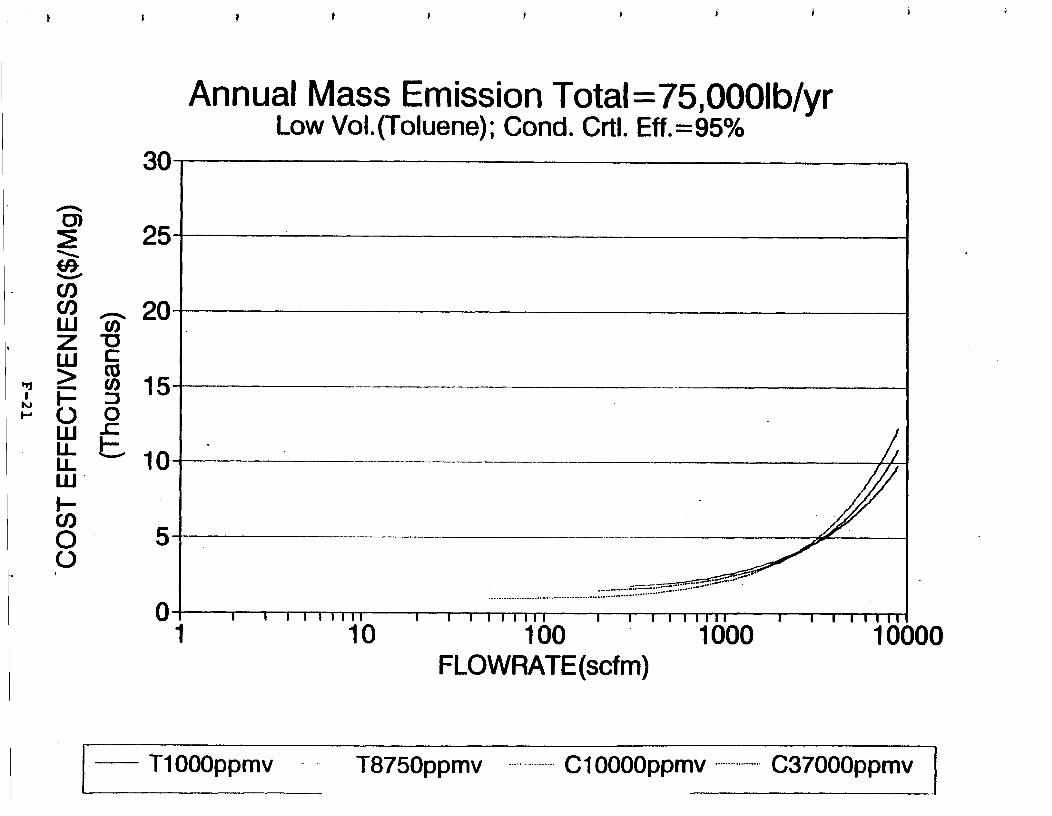
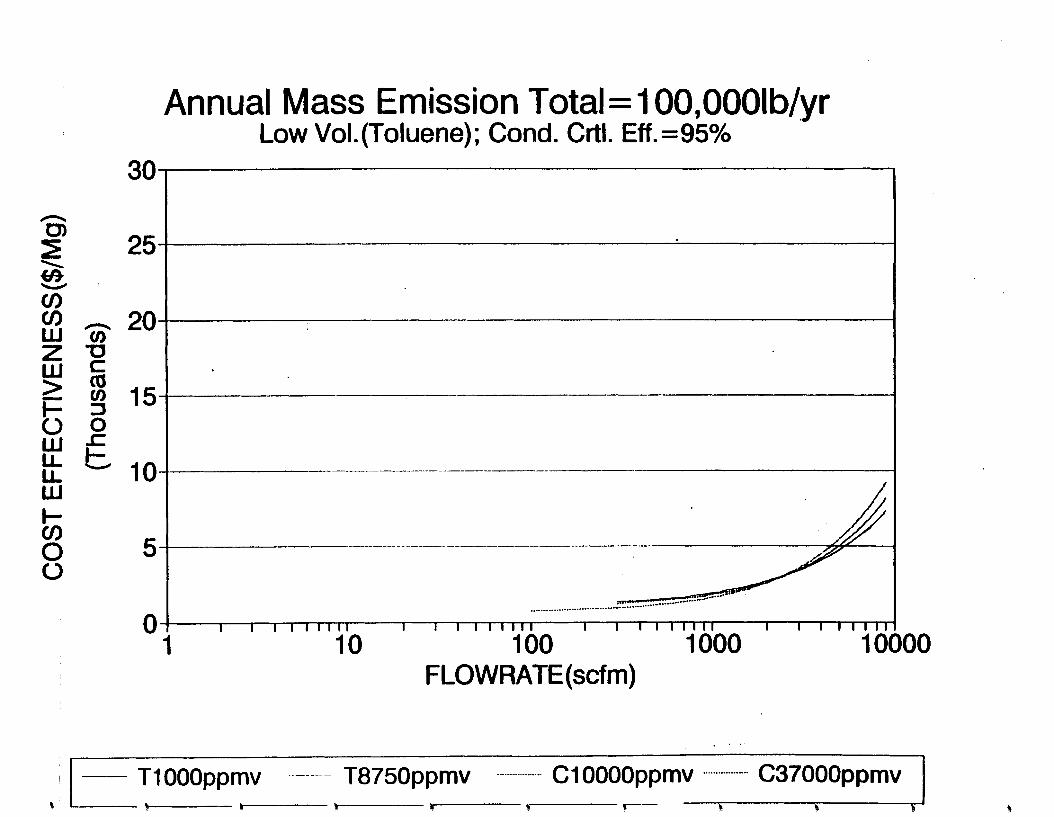
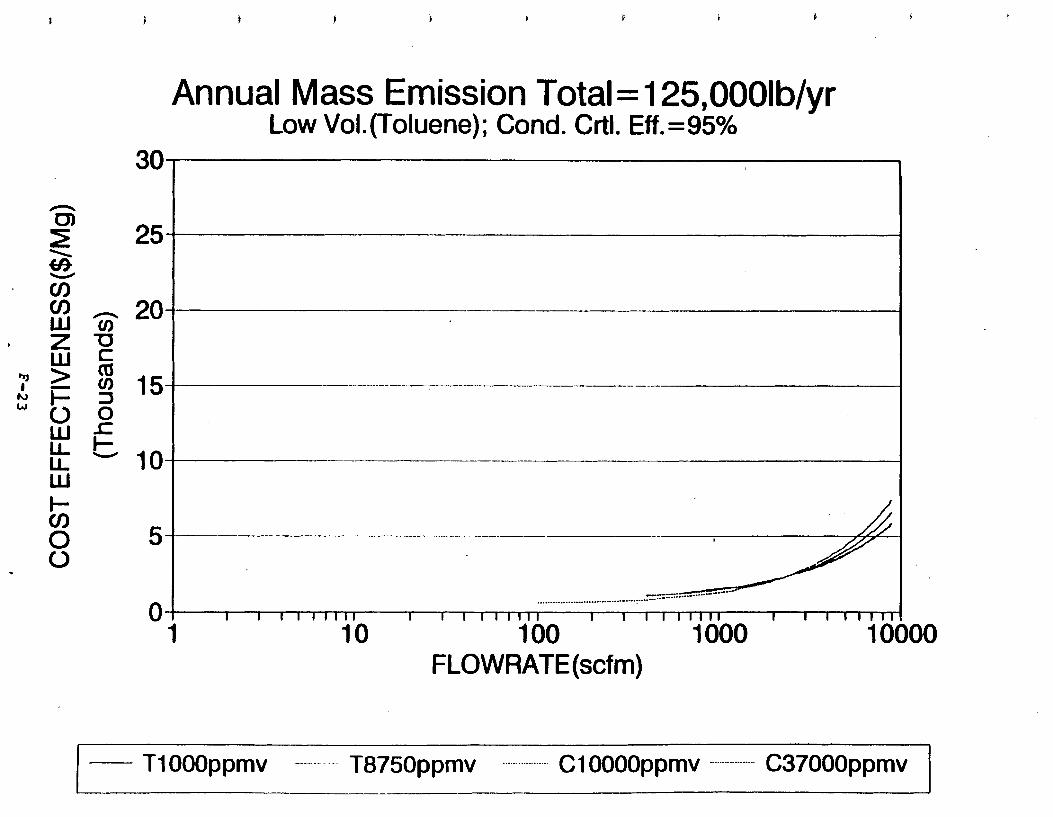


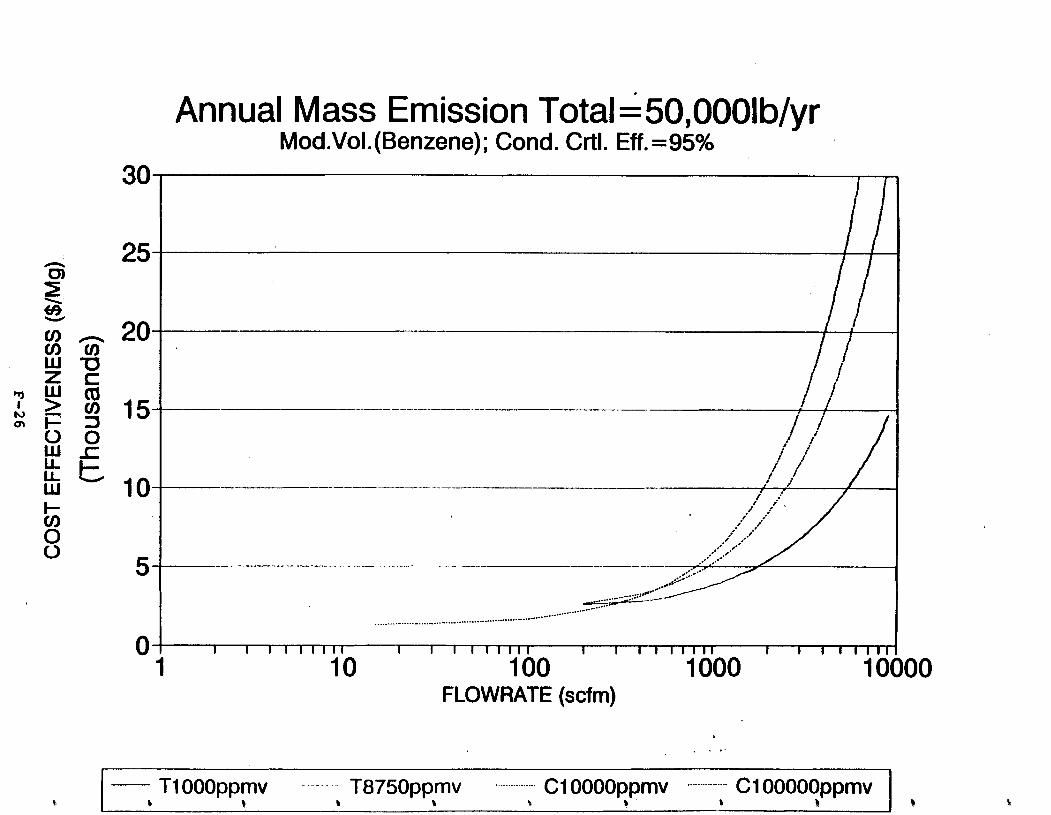
Annual Mass Emission ~otal=50,0001b/vr w
Mod.Vol.(Benzene); Cond. Crtl. ~ff.=95%
I I I 1 1 1 1 1 1 I I I I 1 I I l l I I I I I I I l l I I I I I I I I
10 100 1000 10 FLOWRATE (scfm)
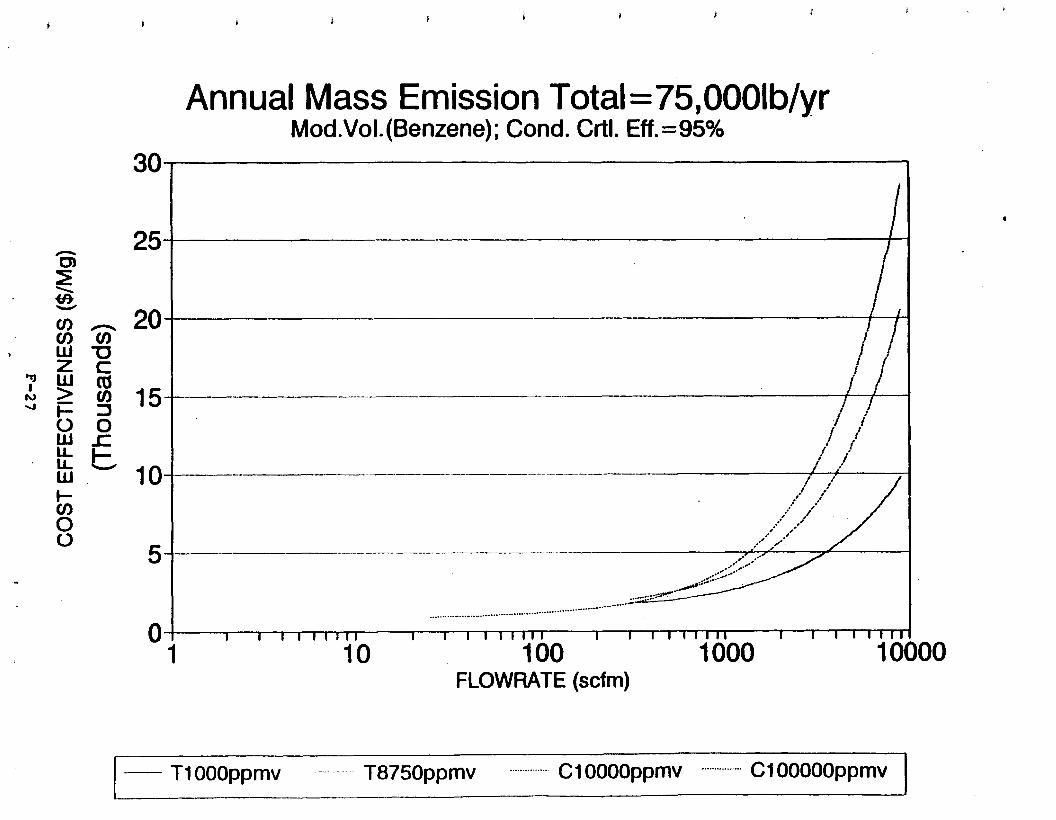
Annual Mass Emission Total =75,00OIb/yr -Mod.Vol. (Benzene); Cond. Crtl. Eff.=95%
o ! 1 I 1 I r 1 I I I I I I I 1 I 1 1 1 I I I I I I I I r I r I I I I I ~
1 10 100 1000 10 FLOWRATE (scfm)
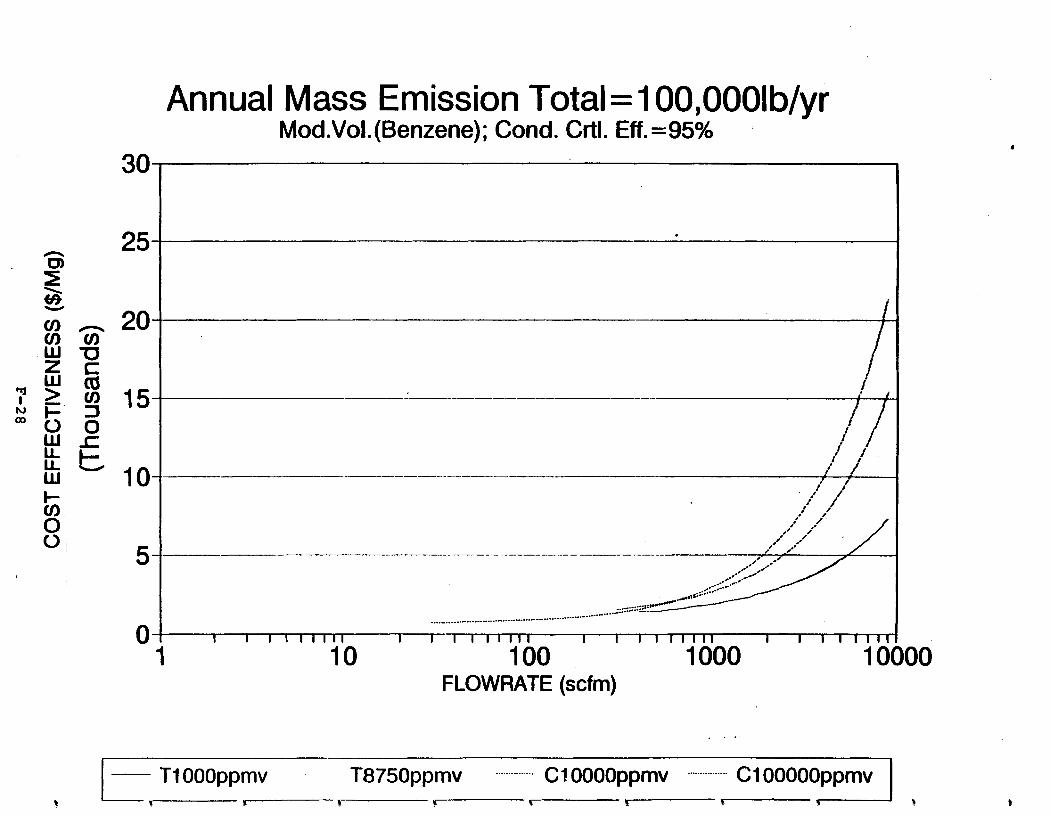
Annual Mass Emission Total = 100,00OIb/yr-Mod.Vol.(Benzene); Cond. Crtl. Eff.=95%
FLOWRATE (scfrn)
............. C100000pprnvT I OOOppmv T8750ppmv - - - - - - -C1OOOOppmv
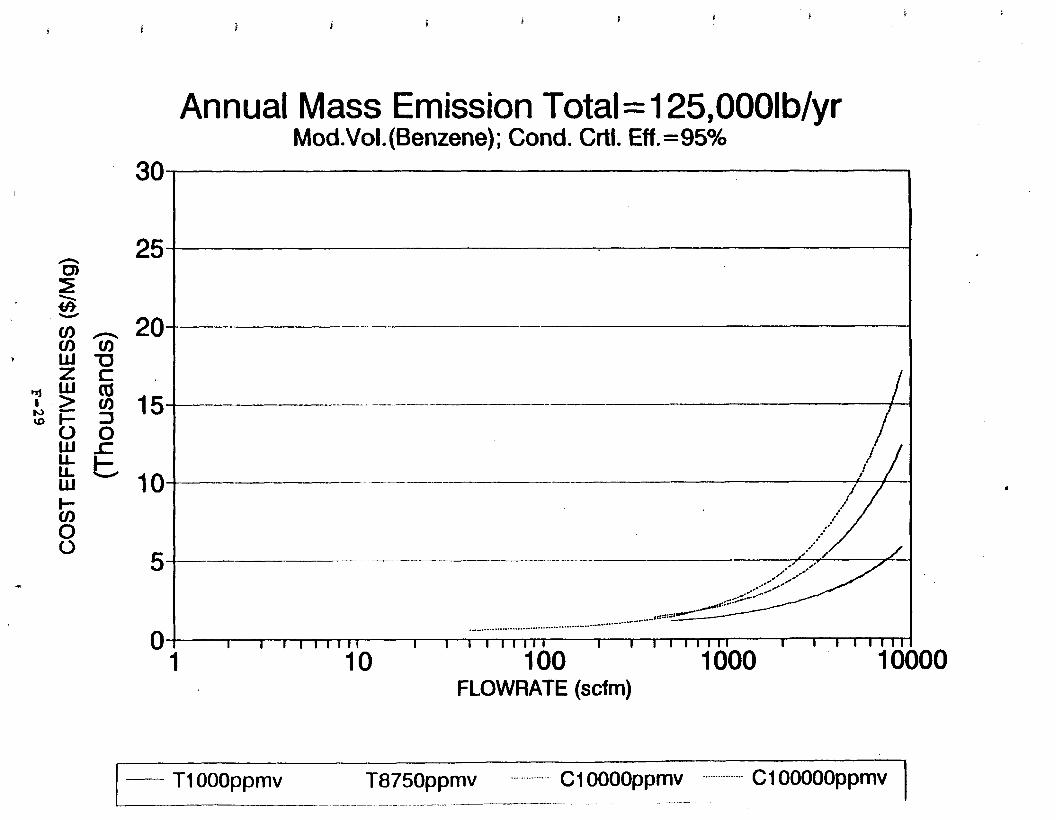
Annual Mass Emission Total =125,00OIb/yr-Mod.Vol.(Benzene);Cond. Crtl. Eff.=95%
FLOWRATE (scfm)

30
Annual Mass Emission Total =150,00OIb/yr-Mod.Vol.(Benzene); Cond. Crtl. Eff.=95%
0 f I I I I I I I I I I I I I I I I l l I I I I I l l 1 1 I I I 1 I I I I I
1 10 100 1000 10000 FLOWRATE (scfm)
T1 OOOppmv T875oppmv . . . . . -.-. C 1 OOOOppmv .........- C100000ppmv
! '8 % b s b f b b
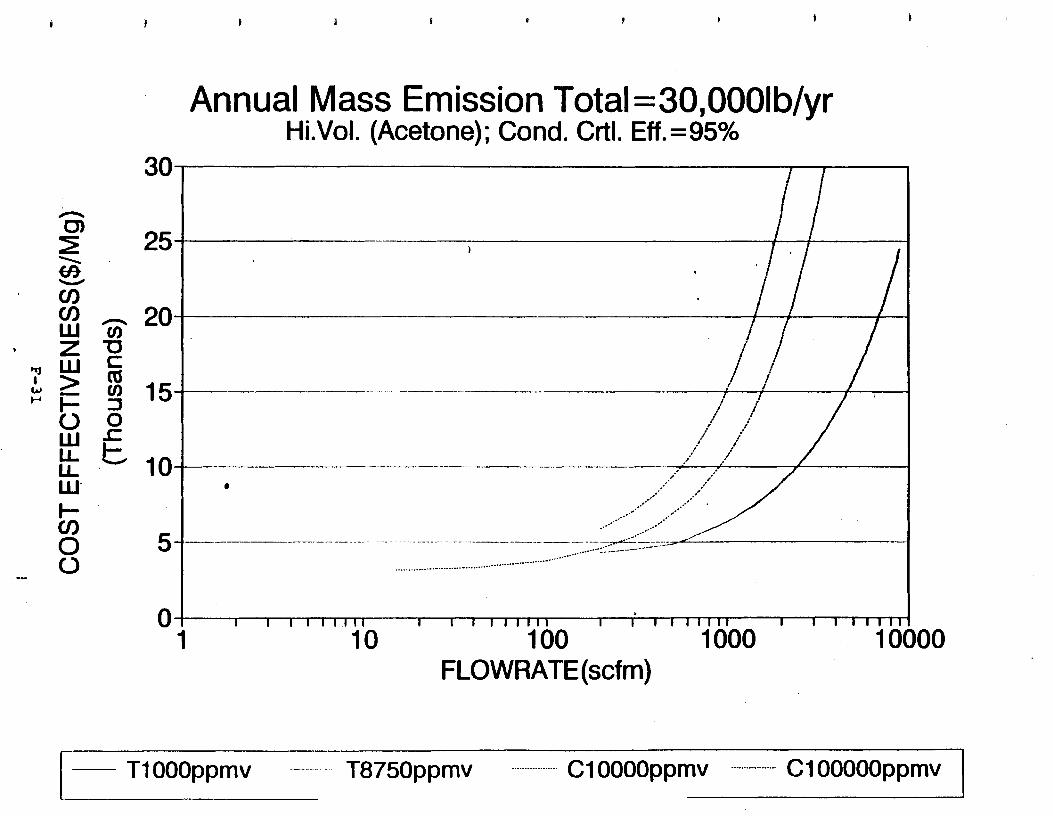
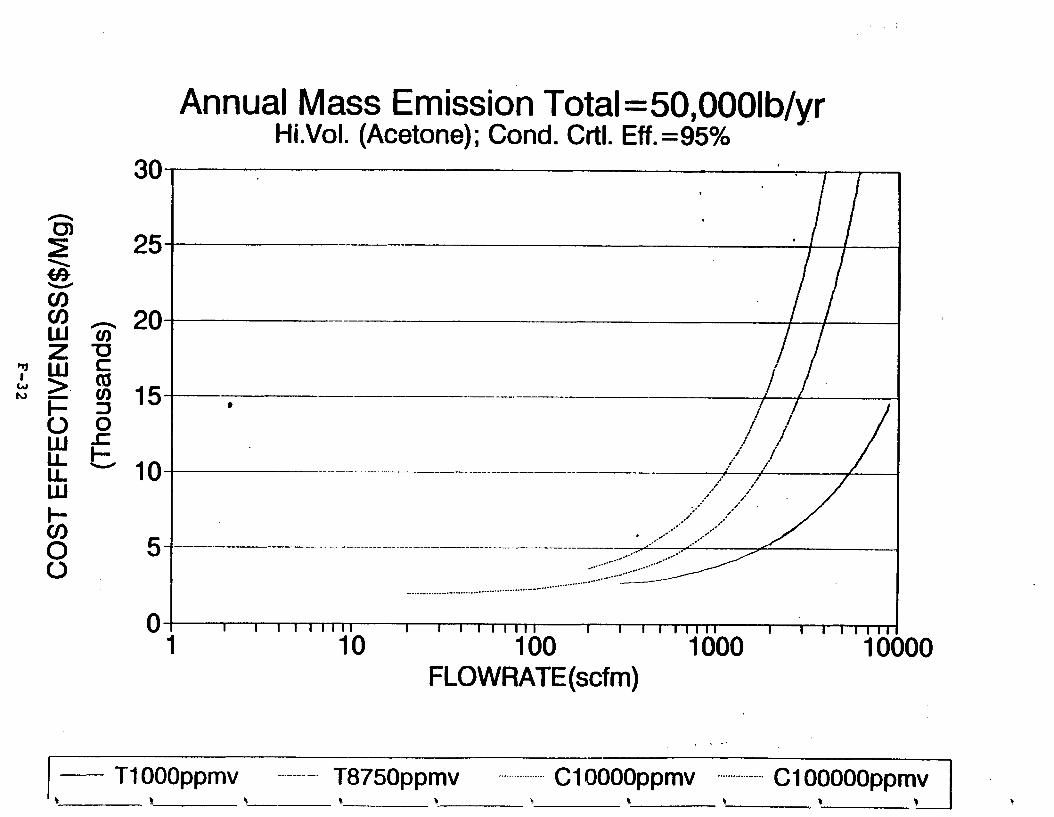
Annual Mass Emission Total =50.0001b/vr - a-Hi.Vol. (Acetone); Cond. Crtl. ~ f f . =95%
FLOWRATE (scfm)


Annual Mass Emission Total = 1 00,00OIb/yr Hi.Vol. (Acetone); Cond. Crtl. Eff. =95%
FLOW RATE (scf m)
1 - TI OOOppmv T8750ppmv . ..- . . . . ...

lo'

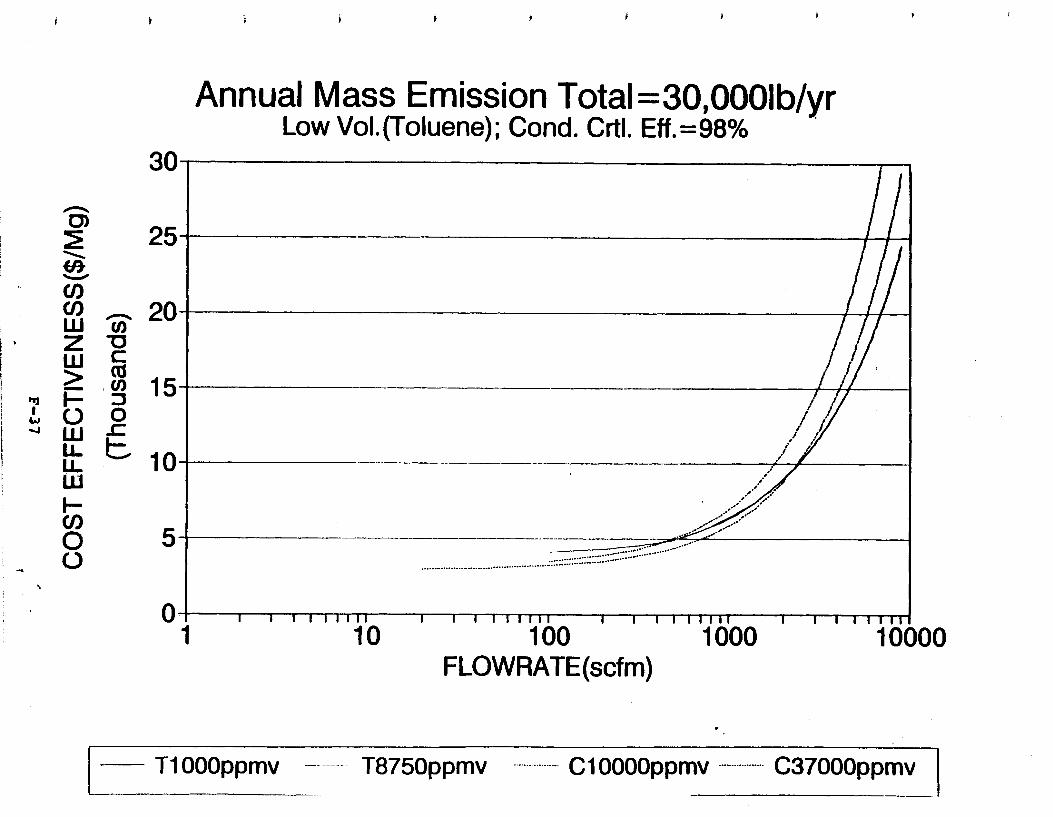
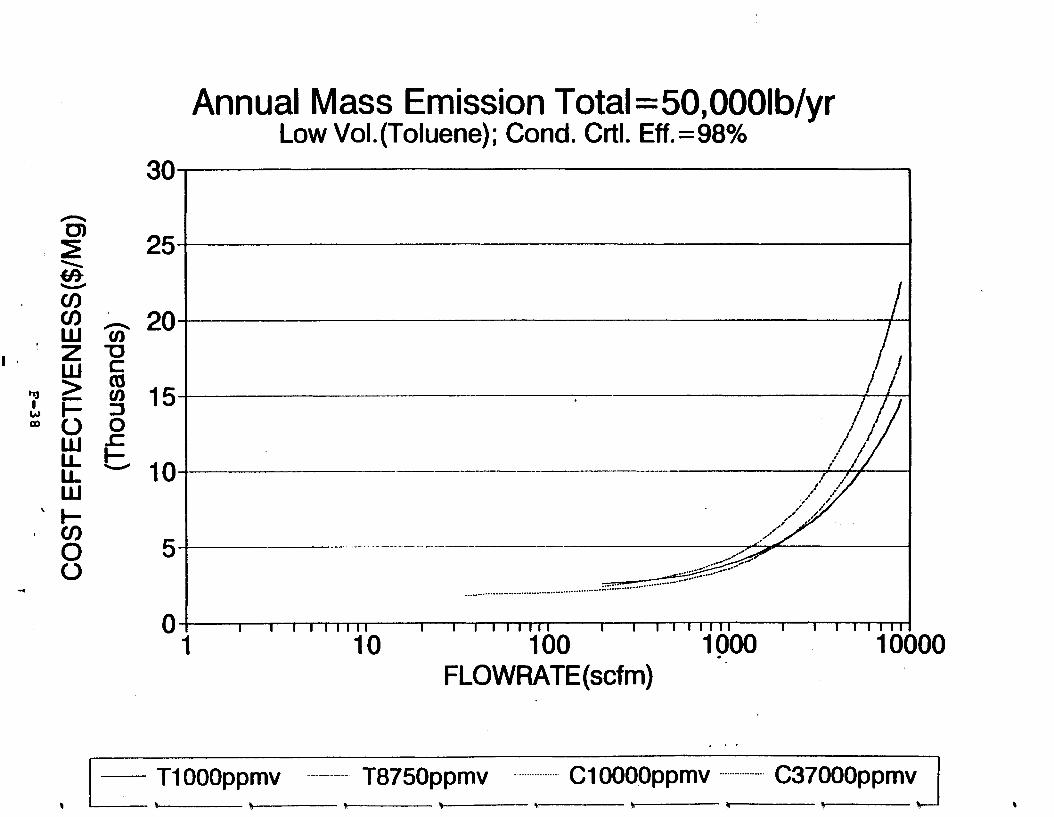
Annual Mass Emission Total =50,00OIb/yr I
Low Vol. (Toluene); Cond. Crtl. Eff.=98%
FLOW RATE (scfm)
TI OOOppmv T8750ppmv C1OOOOppmv C37000ppmvI - I


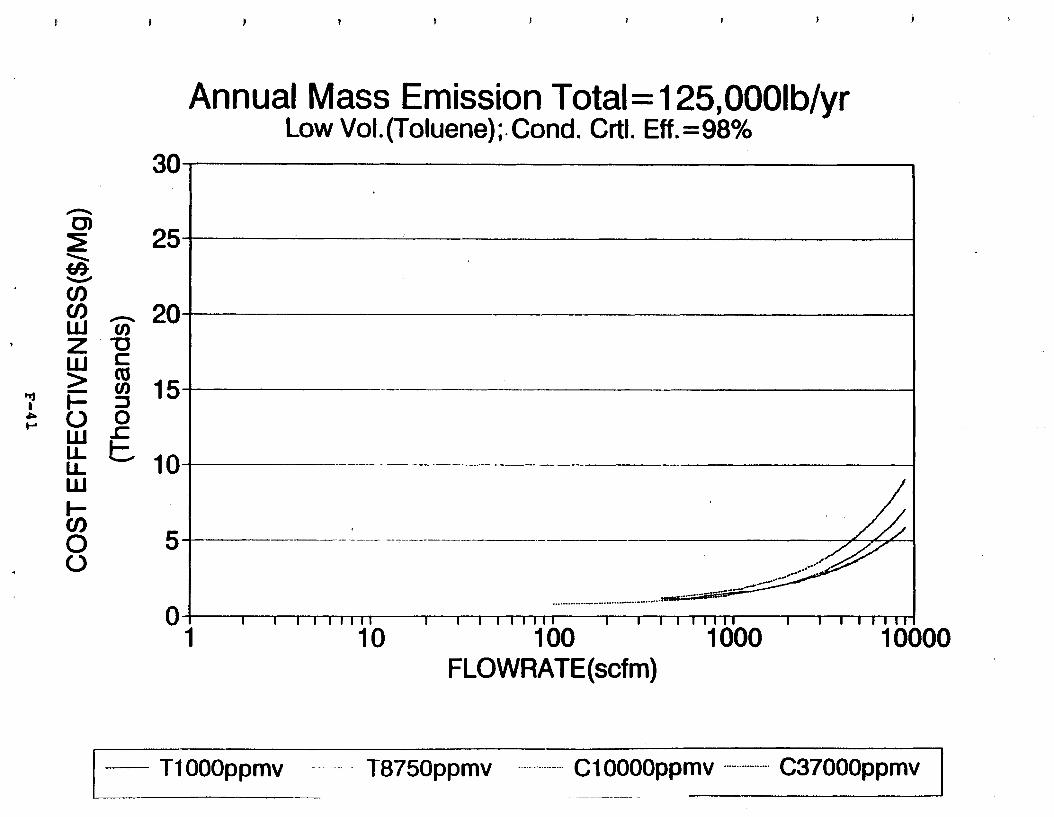
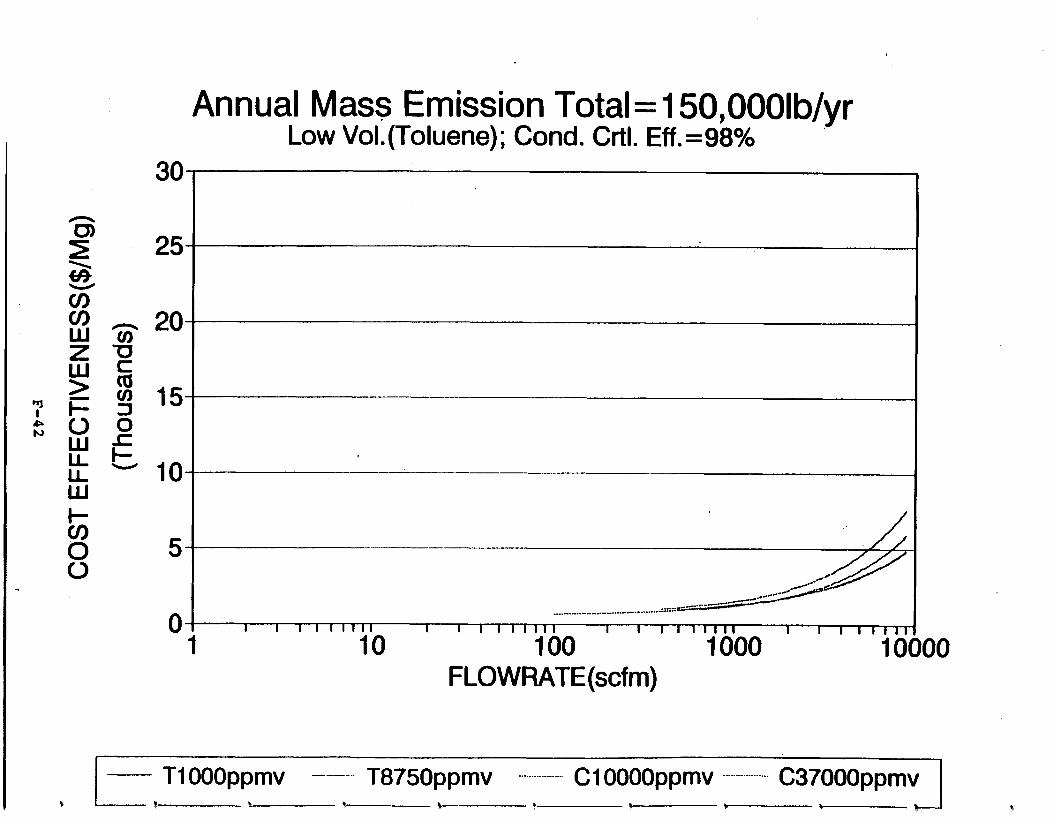
Annual Mass Emission Total = 150,00OIb/vr Low Vol.(Toluene); Cond. Crtl. Eff. =90%
- a
FLOW RATE (scfm)
T8750ppmv C1OOOOppmv ................. C37000ppmv1 - TI OOOppmv

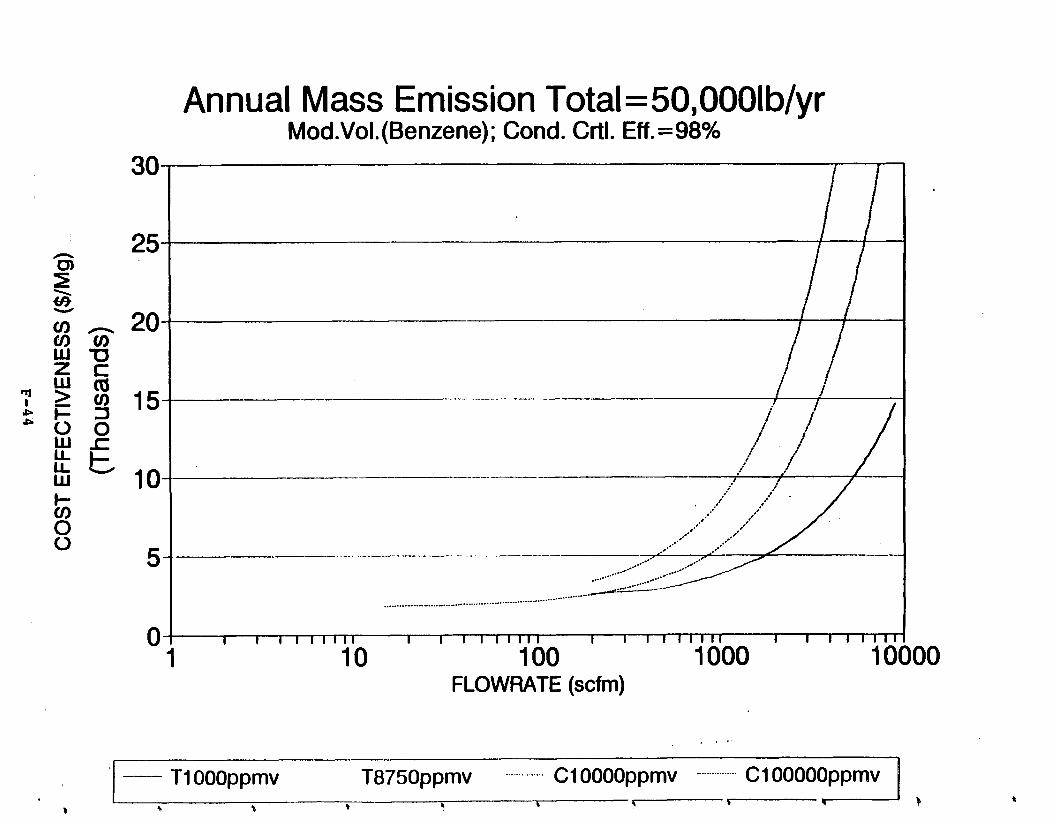
Annual Mass Emission Total=50,0001b/yr -
Mod.Vol. (Benzene); Cond. Crtl. Eff.=98%
1 I I I I l l 1 1 I 1 I I I I I l l I I I I I I I I I I I I I I I I I
10 100 1000 10 FLOWRATE (scfm)
............... C1OOOOppmvT1 OOOppmv T875oppmv .........-..... C100000ppm~

Annual Mass Emission Total =75,00OIb/yr -Mod.Vol.(Benzene); Cond. Crtl. Eff.=98%
I I I I I I I I I I I I I I I l l 1 I 1 I I I I I I 1 I I I I I I I
100 FLOWRATE (scfm)
I

Annual Mass Emission Total =100,0001b/yr-Mod.Vol.(Benzene); Cond. Crtl. Eff.=98%
100 FLOWRATE (scfm)
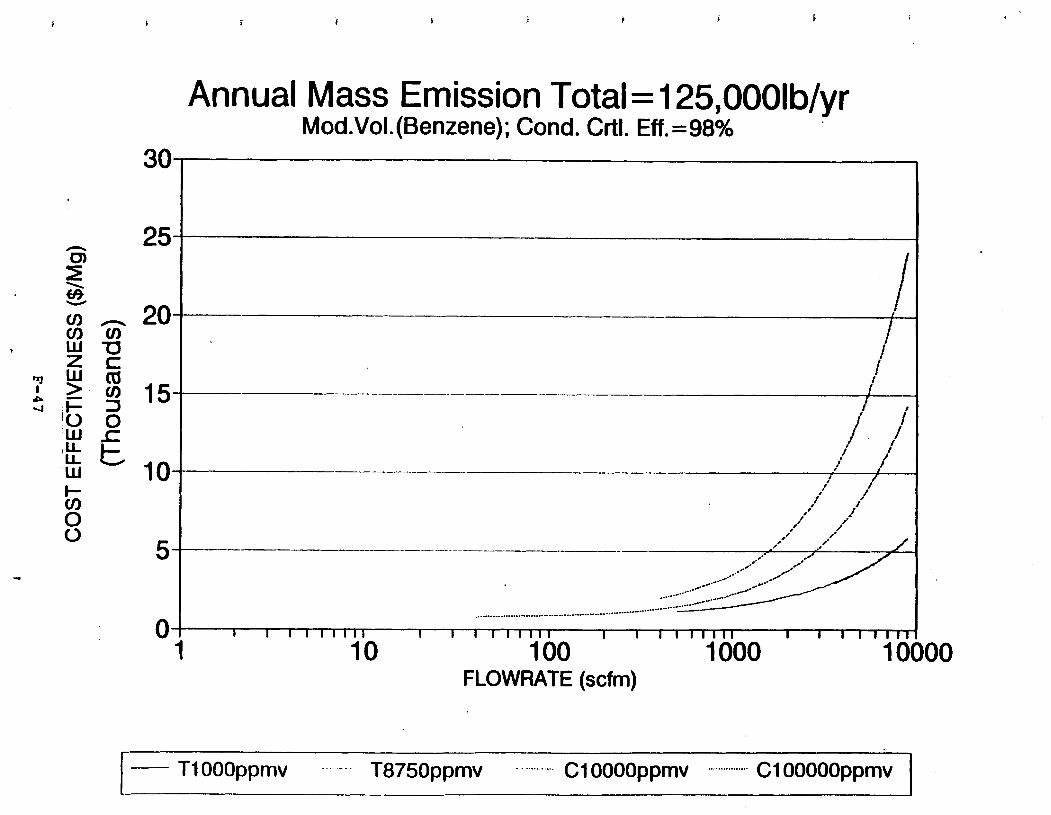
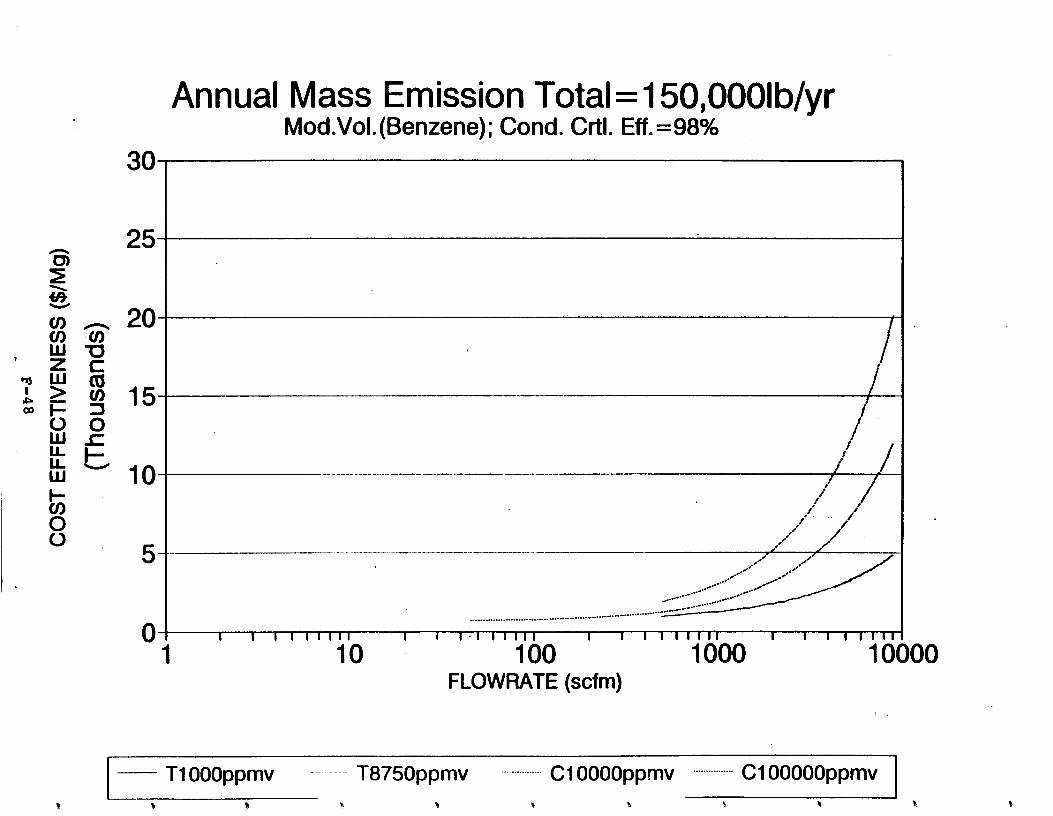

Annual Mass Emission Total =30,00OIb/vr Hi.Vol. (Acetone); Cond. Crtl. ~ff.=98%
T1 OOOppmv T8750ppmv .... C1OoOOppm~ ---.-......--..C1OOOOOp pmv I

- - -
------
Annual Mass Emission Total =50,00OIb/yr Hi.Vol. (Acetone); Cond. Crtl. Eff. =98%
30
25
20
15-
--- -#' ,I10 ../ ,,I
,.'. ,,' ,/' ,/' .-,,',.*' ,. ............ ---- - ..... _.5 .........:.......".L-"..............._....-... ---.-.--...--............
.................... -....... ................
o ! I I I 1 1 1 1 1 1 I I I I I I I l l I I I 1 1 1 1 1 1 I I I I I l l 1
1 10 100 1000 10 FLOWRATE(scfm)
,;,,-
I - TI OOOppmv T8750ppmv -:--- -.. c I 0000ppmv . .. . c I 00000ppmv (
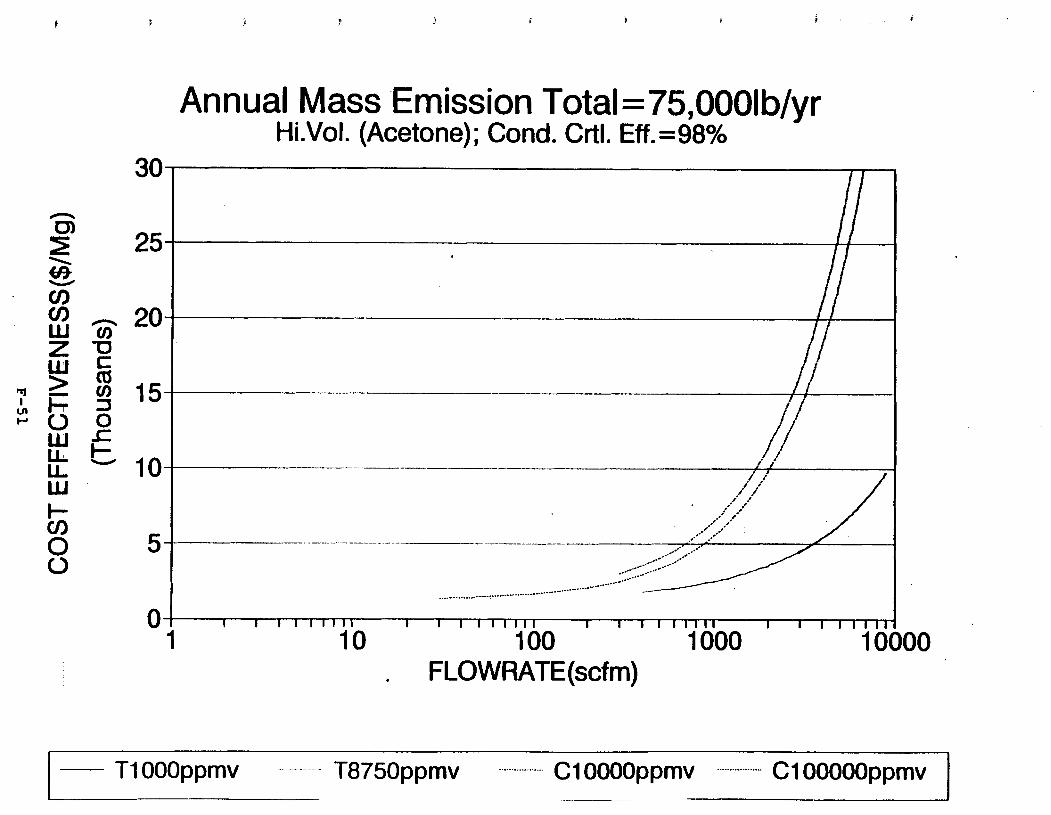
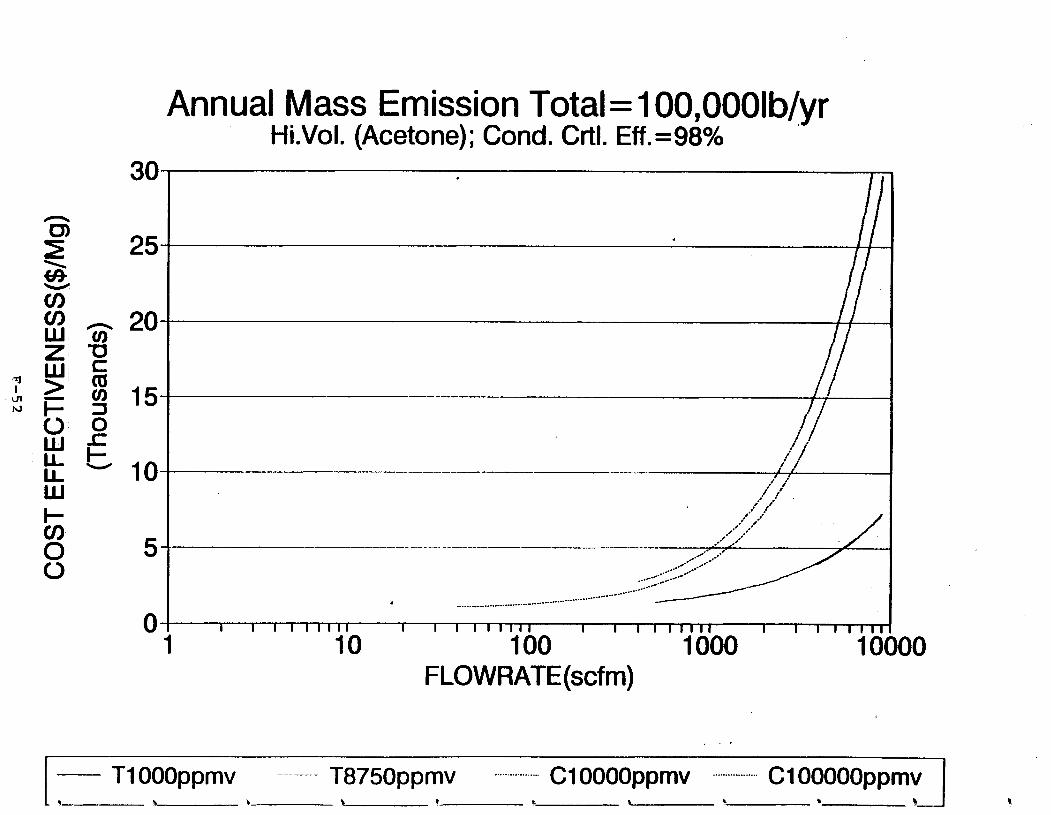

Annual Mass Emission Total =125,0001blyr-Hi.Vol. (Acetone); Cond. Crtl. Eff.=98%
ioo I
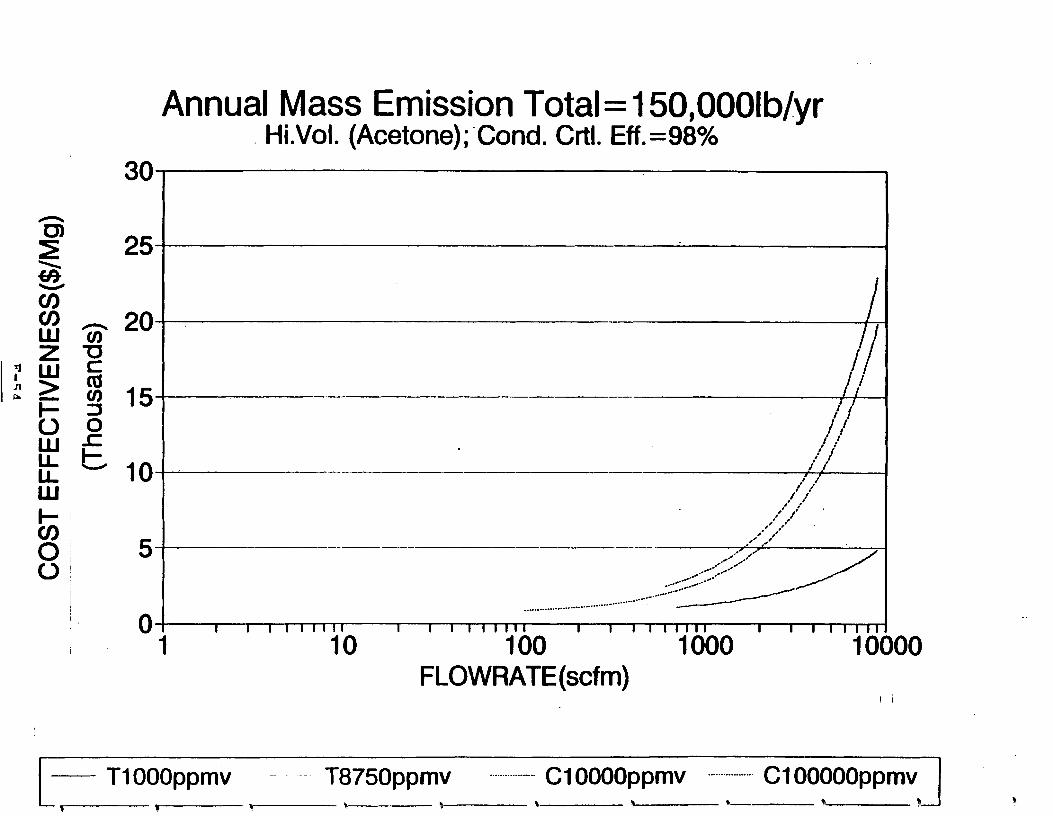
--
Annual Mass Emission Total =150,00OIb/vr- 0
Hi.Vol. (Acetone);Cond. Crtl. ~ f f .=98%
.1 - TlOOOppmv T8750ppmv ..-......... C10000p pmv - ............ C100000ppm~ I
APPENDIX G. BATCH PROCESSING EXAMPLE RULE
G.l INTRODUCTION
This appendix presents an example rule limiting volatile
organic compound emissions from batch processing operations. The
example rule is for informational purposes only. The purpose of
the example rule is to provide information on the factors that
need to be considered in writing a rule to ensure that it is
enforceable. The example rule is provided below. Sections
include applicability, definitions, control requirements,
performance testing, and recordkeeping/reporting requirewnts.
G.2 APPLICABILITY
(a) The provisions of this rule apply to process vents
associated with batch processing operations. The scope of
affected industries is limited to those industries in the
following standard industrial classification (SIC) codes: 2821,
2833, 2834, 2861, 2865, 2869, 2879.
(b) Exemptions from the provisions of this rule except for
the reporting and recordkeeping requirements listed in
Section G.8 are as follows:
(1) Combined vents from a batch process train which have an
annual mass emission total of 10,000 lb/yr or less.
(2) Single unit operations which have annual mass emissions
of X lb/yr or iess.
G.3 DEFINITIONS
The agency responsible for developing a standard must define
the terms that appear in the language for the standard. The
source category of batch processes, for example, requires a
definition of the term %atchu as it is used to describe the mode
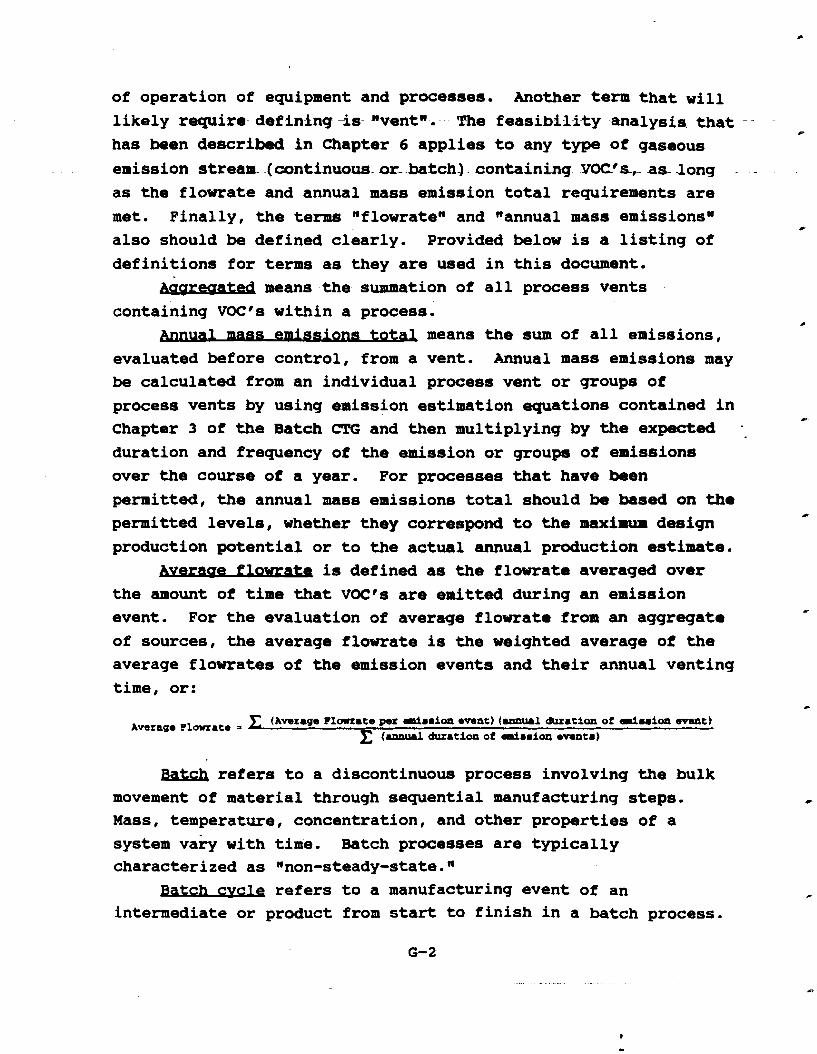
of operation of equipment and processes. Another term that will
likely require defining -is nventn. The feasibility analysis. that -
has been described in Chapter 6 applies to any type of gaseous
emission stream- (continuous. or-batch-). containing YOCts,- a s -long - -
as the flowrate and annual mass emission total requirements are
met. Finally, the terms tuflowraten and "annual mass emissionst@ also should be defined clearly. Provided below is a listing of
definitions for terms as they are used in this document.
k a t e d means the summation of all process vents
containing VOCts within a process. tota means the sum of all emissions,
evaluated before control, from a vent. Annual mass emissions may
be calculated from an individual process vent or groups of
process vents by using emission estimation equations contained in - B
Chapter 3 of the Batch CTG and then multiplying by the expected
duration and frequency of the emission or group of emissions over the course of a year. For processes that have been
permitted, the annual mass emissions total should be based on the permitted levels, whether they correspond to the maximum design
production potential or to the actual annual production estimate.
-ae f l w is defined as the flowrate averaged over
the amount of time that VOCts are emitted during an emission event. For the evaluation of average flowrate from an aggregate
of sources, the average flowrate is the weighted average of the
average flowrates of the emission events and their annual venting
time, or:
Batch refers to a discorrtinuous process involving the bulk movement of material through sequential manufacturing steps. Mass, temperature, concentration, and other properties of a
system vary with time. Batch processes are typically characterized as %on-steady-state."
Bnfch cv- refers to a manufacturing event of an intermediate or product from start to finish in a batch process.

refers to a manufacturing event of-an
intermediate or product from start to finish in a batch process. traig means.- equipment train that is used to.
produce a product or intermediate. A typical equipment train
consists of equipment used for the synthesis, mixing, and
purification of a material. -01 _devicee are air pollution abatement devices, not
devices such as condensers operating under reflw conditions,
which are required for processing. beore means the emissions total prior to
the application of a control device, or if no control device is
used, the emission total. No credit for discharge of VOC8s into wastewater should be considered when the wastewater is further
handled or processed with the potential for VOC8s to be emitted --to the atmosphere.
events can be defined as discrete venting episodes
that may be associated with a single unit of operation. For
example, a displacement of vapor resulting from the charging of a
vessel with VOC will result in a discrete emission event that
will last through the duration of the charge and will have an average flowrate equal to the rate of the charge. If the vessel
is then heated, there will also be another discrete emission
event resulting from the expulsion of expanded vessel vapor
space. Both emission events may occur in the same vessel or unit
operation.
m,for the purpose of determining RACT applicability, are defined as any equipment within a contiguous
area that are connected together during the course of a year
where connected is defined as a link between equipment, whether
it is physical, such as a pipe, or whether it is next in a series
of steps from which material is transferred from one unit operation to another.
operations are conducted on a steady- state mode but only for finite durations during the course of a year.
For example, a steady-state distillation operation that functions
for 1 month would be considered semi-continuous.
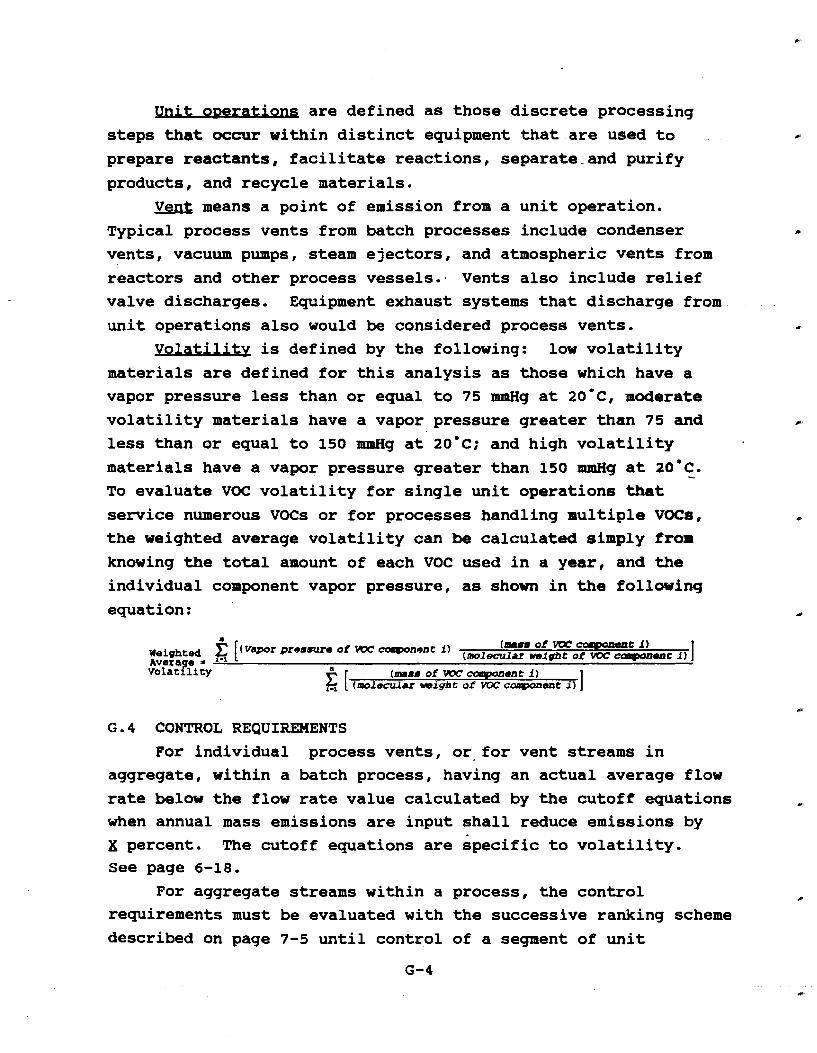
t operations are defined as those discrete processing
steps that occur within distinct equipment that are used to
prepare reactants, facilitate reactions, separate-and purify
products, and recycle materials.
Vent means a point of emission from a unit operation.
Typical process vents from batch processes include condenser
vents, vacuum pumps, steam ejectors, and atmospheric vents from
reactors and other process vessels.. Vents also include relief
valve discharges. Equipment exhaust systems that discharge from
funit operations also would be considered process vents.
Vola- is defined by the following: low volatility
materials are defined for this analysis as those which have a
vapor pressure less than or equal to 75 m M g at ~o'c, moderate
volatility materials have a vapor pressure greater than 75 and a
less than or equal to 150 rmnHg at 20'~; and high volatility
materials have a vapor pressure greater than 150 mmHg at 20'~. -To evaluate VOC volatility for single unit operations that
service numerous VOCs or for processes handling multiple VOC8,
the weighted average volatility can be calculated simply from
knowing the total amount of each VOC used in a year, and the
individual component vapor pressure, as shown in the following
equation:
CONTROL REQUIREMENTS
For individual process vents, or for vent streams in
aggregate, within a batch process, having an actual average flow
rate below the flow rate value calculated by the cutoff equations
when annual mass emissions are input shall reduce emissions by
X percent. The cutoff equations are specific to volatility. See page 6-18.
For aggregate streams within a process, the control
requirements must be evaluated with the successive ranking scheme
described on page 7-5 until control of a segment of unit
G-4
operations is required or until all unit operations have been
eliminated from the process pool.
G.5 (a) DETERMINATION OF UNCONTROLLED ANNUAL EMISSION TOTAL
Determination of the annual mass emissions total may be
achieved by engineering estimates of the uncontrolled emissions
from a process vent or group of process vents within a batch
process train and multiplying by the potential or permitted
number of batch cycles per year. Engineering estimates should
follow the guidance provided in this document. Alternatively, if
an emissions measurement is t o be used to measure vent emissions,
the measurement must conform with the requirements of measuring
incoming mass flow rate of VOC's as described in
G.6 (2) and (3) (i'ii).
G.5(b) DETERMINATION OF AVERAGE FLOW RATE
To obtain a value for average flowrate, the owners or
operators may elect to measure the flow rates or to estimate the
flow rates using emission estimation guidelines provided in
Chapter 3. For existing manifolds, the average flow rate is
often the flow that was assumed in the design. Regulators should
be aware that oversized gas moving equipment used in manifolds
may exempt many unit operations and batch processes from the
cutoff requirements because the flowrates will exceed those
described by the cutoff equations. Industry should have the
burden of proving that the manifold flowrates are consistent with
emission sources and not oversized. If measurements are to be
used to estimate flow rates, the measurements must conform with
the requirements of measuring incoming volumetric flow rate as
described in G.6(b)(2).
G.6 PERFORMANCE TESTING
(a) For the purpose of demonstrating compliance with the
control requirements of this rule, the process unit shall be run
at full operating conditions and flow rates during any
performance test.
(b) The following methods in 40 CFR 60, Appendix A, shall be used to comply with the percent reduction efficiency
requirement listed in G.4.

(1) Method 1 or lA, as appropriate, for selection of the
sampling sites if the flow measuring device is a rotameter. NO
traverse is necessary when the flow measuring device is an
ultrasonic probe. The control device inlet sampling site for
determination of vent stream VOC composition reduction efficiency
shall be prior to the control device and after the control
device.
(2) Method 2, 2A, 2C, or 2D, as appropriate, for
determination of gas stream volumetric flow rate flow
measurements should be made continuously.
(3) Method 25A or Method 18, if applicabze, to determine
the concentration of VOC in the control device inlet and outlet.
(i) The sampling time for each run will be the entire length of the batch cycle in which readings will be taken
continuously, if Method 25A is used, or as often as is possible
using Method 18, with a maximum of 1-minute intervals between
measurements throughout the batch cycle.
(ii) The emission rate of the process vent or inlet to the control device shall be determined by combining continuous
concentration and flow rate measurements at simultaneous points
throughout the batch cycle.
(iii) The mass rate of the control device outlet shall be
obtained by combining continuous concentration and flow rate
measurements at simultaneous points throughout the batch cycle.
(iv) The efficiency of the control device shall be
determined by integrating the mass rates obtained in ii and iii,
over the time of the batch cycle and dividing the difference in
inlet and outlet mass flow totals by the inlet mass flow total.
G.7 MONITORING REQUIRPIENTS
(a) The owner or operator of an affected facility that uses an incinerator to seek to comply with the VOC emission limit
specified under 6.4 shall install, calibrate, maintain, and
operate according to manufacturer's specifications the following
equipment.
(1) A temperature monitoring device equipped with a
continuous recorder and having an accuracy of f 0.5'~.
(i) Where an incinerator other than a catalytic incinerator
is used, a temperature monitoring device shall be installed in
the firebox.
(ii) Where a catalytic incinerator is used, temperature
monitoring devices shall be installed in the gas stream
immediately before and after the catalyst bed.
(b) The owner or operator of an affected facility that uses
a flare to seek to comply with G.4 shall install, calibrate,
maintain and operate according to manufacturer's specifications
the following equipment:
(1) A heat sensing device, such as an ultra-violet beam
sensor or thermocouple, at the pilot light to indicate continuous
presence of a flame.
(c) The owner or operator of an affected facility that uses
an absorber to comply with G.4 shall install, calibrate,
maintain, and operate according to manufacturer's specifications
the following equipment.
(1) A scrubbing liquid temperature monitoring device having
an accuracy of f1 percent of the temperature being monitored
expressed in degrees Celsius or f0.02 specific gravity unit, each
equipped with a continuous recorder, or
(2) An organic monitoring device used to indicate the .
concentration level of organic compounds exiting the recovery
device based on a detection principle such as infra-red
photoionization, or thermal conductivity, each equipped with a
continuous recorder.
(d) The owner or operator of an affected facility that uses
a condenser or refrigeration system to comply with G.4 shall
install, calibrate, maintain, and operate according to
manufacturer's specifications the following equipment:
(1) A condenser exit temperature monitoring device equipped
with a continuous recorder and having an accuracy of fl percent
of the temperature being monitored expressed in degrees Celsius
of +0.5'~, whichever is greater, or
(2) An organic monitoring device used to indicate the
concentration level of organic compounds exiting the recovery

device based on a detection principle such as infra-red,
photoionization, or thermal conductivity, each equipped with a
continuous recorder.
(e) The owner or operator of an affected facility that uses
a carbon adsorber to comply with G.4 shall install, calibrate,
maintain, and. operate according to manufacturers specifications
the following equipment:
(1) An integrating steam flow monitoring device having an
accuracy of 210 percent, and a carbon bed temperature monitoring
device having an accuracy of fl percent of the temperature being monitored expressed in degrees Celsius or f0.5'~, whichever is
greater, both equipped with a continuous recorder, or
(2) An organic monitoring device used to indicate the
concentration level of organic compounds exiting the recovery
device based on a detection principle such as infra-red,
photoionization, or thermal conductivity, each equipped with a
continuous recorder.
G.8 REPORTING/RECORDKEEPING REQUIREMENTS
(a) Each batch processing operation subject to this rule
shall keep records for a minimum of two years of the following emission stream parameters for each process vent contained in the
batch process:
(1) The annual mass emission total, and documentation
verifying these values; if emission estimation equations are
used, the documentation shall be the calculations coupled with
the expected or permitted (if available) number of emission
events per year. If the annual mass emission total is obtained
from measurement in accordance with G.6, this data should be available.
(2) The average flow rate in scfm and documentation verifying these values; -
(b) Each batch processing operation subject to this rule shall keep records of the following parameters required to be
measured during a performance test required under G.4, and required to be monitored under G.6.
(1) Where an owner or operator subject to the provisions of
this subpart seeks to demonstrate compliance with G.4 through use
of either a thermal or catalytia incinerator:
(i) The average firebox temperature of the incinerator (or
the average temperature upstream and downstream of the catalyst
bed for a catalytic incinerator), measured continuously and
averaged over the same time period of the performance testing,
and
( 2 ) Where an owner or operator subject to the provisions of
this subpart seeks to demonstrate compliance with 6.4 through use
of a smokeless flare, flare design, (i.e., steam-assisted, air-
assisted or nonassisted), all visible emission readings, heat
content determinations, flow rate measurements, and exit velocity
- determinations made during the performance test, continuous
records of the flare pilot flame monitoring, and reeords of all
periods of operations during which the pilot flare is absent.
( 3 ) Where an owner or operator subject to the prwisions of
this subpart seeks to demonstrate compliance with G.4:
(i) Where an absorber is the final control device, the exit specific gravity (or alternative parameter which is a measure of
the degree of absorbing liquid saturation, if approved by the
Agency), and average exit temperature of the absorbing liquid,
measured continuously and averaged over the same time period of
the performance testing (both measured while the vent stream is
routed normally), or
(ii) Where a condenser is the control device, the average
exit (product side) temperature measured continuously and
averaged over the same tima period of the performance testing
while the vent stream is routed normally, or
(iii) Where a carbon adsorber is the control device, the total steam mass flow measured continuously and averaged over the
same time period of the performance test (full carbon bed cycle),
temperature of the carbon bed after regeneration (and within
15 minutes of completion of any cooling cycle(s), and duration of
the carbon bed steaming cycle (all measured while the vent stream
is routed normally), or
(iv) As an alternative to D.7(b)(4)(i), (b)(4)(ii) or
(b)(Q)(iii), the concentration level or reading indicated by the organic monitoring device at the outlet of the absorber,
condenser, or carbon adsorber, measured continuously and averaged
over the same time period of the performance testing while the
vent stream is routed normally.