
Table S1. VOC species used in F0AM box model to calculate ...
12
Supplementary material: Table S1. VOC species used in F0AM box model to calculate OH reactivity Alkanes Alkenes/Alkynes Aromatics Oxygenated Methane Ethyne Benzene Formaldehyde Ethane Ethene Toluene Methanol Propane Propene Ethylbenzene Acetaldehyde n-Butane 1-Butene o-Xylene Acetone i-Butane cis-2-Butene m-Xylene Propanal n-Pentane trans-2-Butene p-Xylene MVK i-Pentane i-Butene Furan Methacrolein n-Hexane 1-Pentene Furfural Hydroxyacetone 2-Methylpentane cis-2-Pentene 2-Methylfuran Glycolaldehyde 3-Methylpentane trans-2-Pentene 3-Methylfuran Formic Acid n-Heptane 2-Methyl-1-butene Dimethyfuran Acrolein 2,2-Dimethyl- butane 3-Methyl-1-butene 5-Methylfurfural Ethanol n-Octane Isoprene Catechol Glyoxal n-Nonane -Pinene Guaiacol Methyglyoxal n-Decane Limonene Creosols MEK Cyclohexane -Pinene Syringol Butanal Furanone 2-Methylpropanal Phenol Methyl Acetate Cresol Ethyl Formate
-
Upload
khangminh22 -
Category
Documents
-
view
0 -
download
0
Transcript of Table S1. VOC species used in F0AM box model to calculate ...
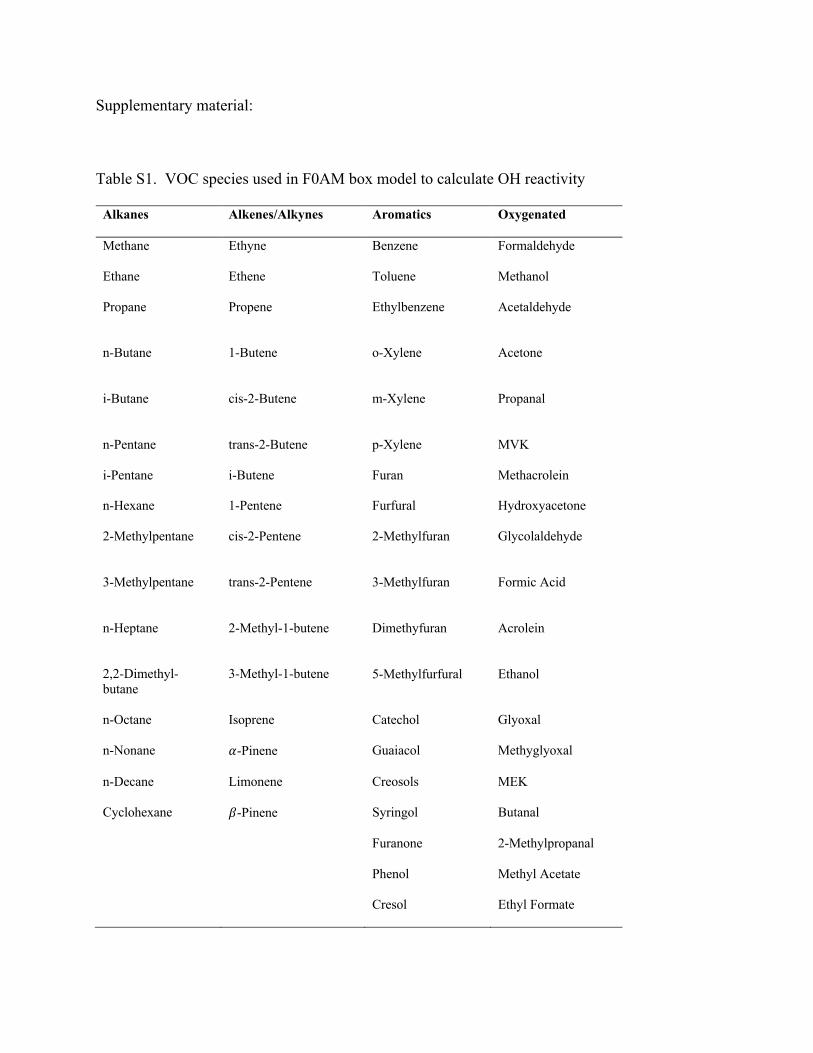
Supplementary material:
Table S1. VOC species used in F0AM box model to calculate OH reactivity
Alkanes Alkenes/Alkynes Aromatics Oxygenated
Methane Ethyne Benzene Formaldehyde
Ethane Ethene Toluene Methanol
Propane Propene Ethylbenzene
Acetaldehyde
n-Butane 1-Butene o-Xylene
Acetone
i-Butane cis-2-Butene m-Xylene
Propanal
n-Pentane trans-2-Butene p-Xylene MVK
i-Pentane i-Butene Furan Methacrolein
n-Hexane 1-Pentene Furfural Hydroxyacetone
2-Methylpentane cis-2-Pentene 2-Methylfuran
Glycolaldehyde
3-Methylpentane trans-2-Pentene 3-Methylfuran
Formic Acid
n-Heptane 2-Methyl-1-butene
Dimethyfuran Acrolein
2,2-Dimethyl- butane
3-Methyl-1-butene
5-Methylfurfural Ethanol
n-Octane Isoprene Catechol Glyoxal
n-Nonane 𝛼-Pinene Guaiacol Methyglyoxal
n-Decane Limonene Creosols MEK
Cyclohexane 𝛽-Pinene Syringol Butanal
Furanone 2-Methylpropanal
Phenol Methyl Acetate
Cresol Ethyl Formate
Benzaldehyde 2,3-Butanedione
Styrene 2-Methyl-3-buten-2-ol (MBO)
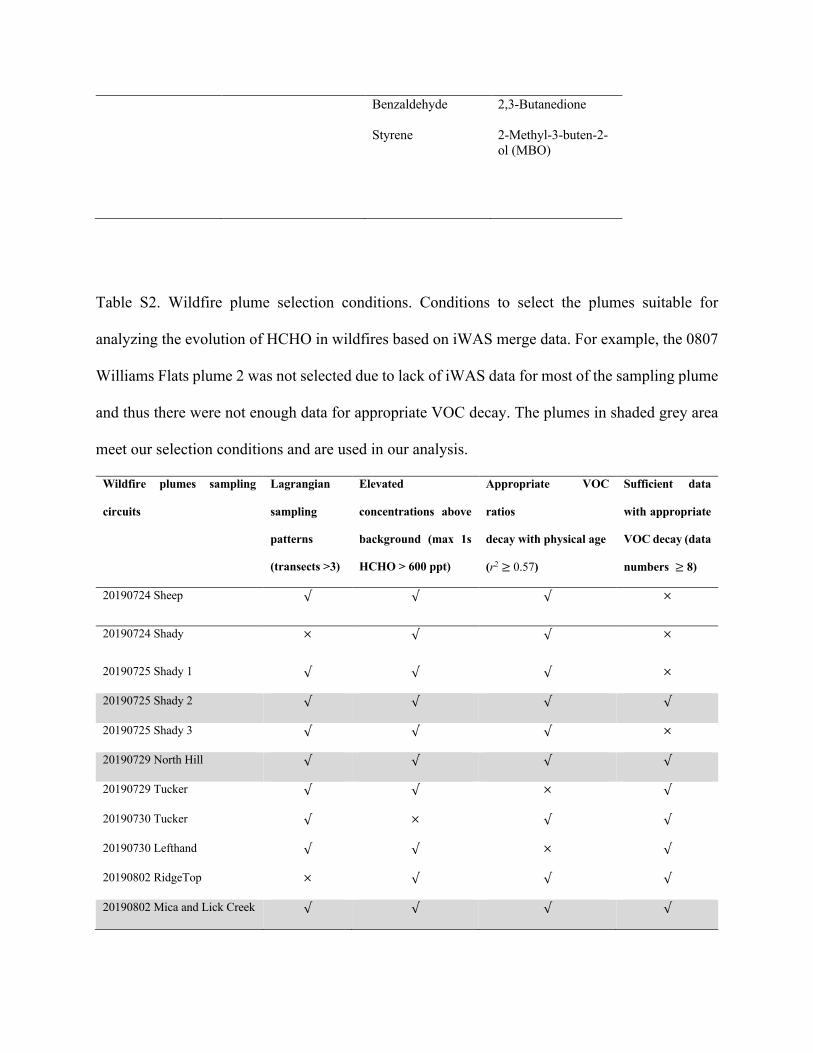
Table S2. Wildfire plume selection conditions. Conditions to select the plumes suitable for
analyzing the evolution of HCHO in wildfires based on iWAS merge data. For example, the 0807
Williams Flats plume 2 was not selected due to lack of iWAS data for most of the sampling plume
and thus there were not enough data for appropriate VOC decay. The plumes in shaded grey area
meet our selection conditions and are used in our analysis.
Wildfire plumes sampling
circuits
Lagrangian
sampling
patterns
(transects >3)
Elevated
concentrations above
background (max 1s
HCHO > 600 ppt)
Appropriate VOC
ratios
decay with physical age
(r2 ≥ 0.57)
Sufficient data
with appropriate
VOC decay (data
numbers ≥ 8)
20190724 Sheep √ √ √ ×
20190724 Shady × √ √ ×
20190725 Shady 1 √ √ √ ×
20190725 Shady 2 √ √ √ √
20190725 Shady 3 √ √ √ ×
20190729 North Hill √ √ √ √
20190729 Tucker √ √ × √
20190730 Tucker √ × √ √
20190730 Lefthand √ √ × √
20190802 RidgeTop × √ √ √
20190802 Mica and Lick Creek √ √ √ √

20190803 Williams Flats 1 √ √ √ √
20190803 Williams Flats 2 √ √ √ √
20190806 Williams Flats √ √ √ √
20190806 Horsefly √ √ × √
20190807 Williams Flats 1 √ √ √ √
20190807 Williams Flats 2 √ √ × ×
20190808 Williams Flats aged × √ × √
20190808 Williams Flats
PyroCb
× √ √ √
20190812 Castle1 √ √ √ √
20190812 Castle 2 nighttime √ √ √ √
20190813 Castle1 √ √ × √
20190813 Castle 2 √ √ √ √
20190815 Sheridan × √ × √
20190816 Sheridan √ √ √ √
20190830 Blackwater River
Forest
√ √ √ √
√ : meet the condition.
× : does not meet the condition.
Table S3. Mean and standard deviation of nHCHO production and loss rates of the 12 plumes.
Plumes nHCHO production rate (mean±std, ppt/ppb/hr) nHCHO loss rate (mean±std, ppt/ppb/hr)
20190725 2.8±2.0 4.1±0.7
20190729 3.4±4.5 2.5±0.5
20190802 6.5±2.5 4.7±0.1
20190803 0.6±1.9 3.1±1.0
20190803 1.4±0.8 1.2±0.1
20190806 4.0±4.9 6.1±0.6
20190807 2.3±0.7 1.5±0.3
20190812 2.6±0.8 2.1±0.8
20190812N 0.0±0.2 -0.2±0.0
20190813 2.6±1.7 0.6±0.0
20190816 1.6±2.2 0.8±0.4
20190830 14.1±5.2 10.0±0.4
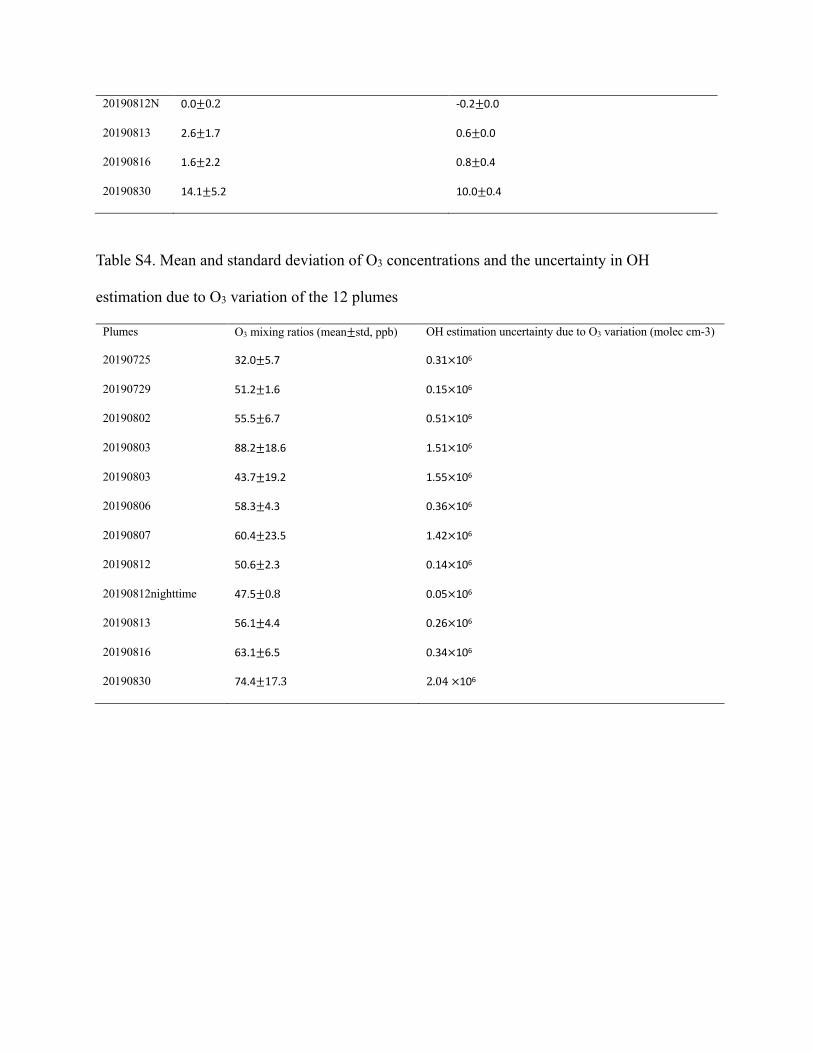
Table S4. Mean and standard deviation of O3 concentrations and the uncertainty in OH
estimation due to O3 variation of the 12 plumes
Plumes O3 mixing ratios (mean±std, ppb) OH estimation uncertainty due to O3 variation (molec cm-3)
20190725 32.0±5.7 0.31×10⁶
20190729 51.2±1.6 0.15×10⁶
20190802 55.5±6.7 0.51×10⁶
20190803 88.2±18.6 1.51×10⁶
20190803 43.7±19.2 1.55×10⁶
20190806 58.3±4.3 0.36×10⁶
20190807 60.4±23.5 1.42×10⁶
20190812 50.6±2.3 0.14×10⁶
20190812nighttime 47.5±0.8 0.05×10⁶
20190813 56.1±4.4 0.26×10⁶
20190816 63.1±6.5 0.34×10⁶
20190830 74.4±17.3 2.04 ×10⁶
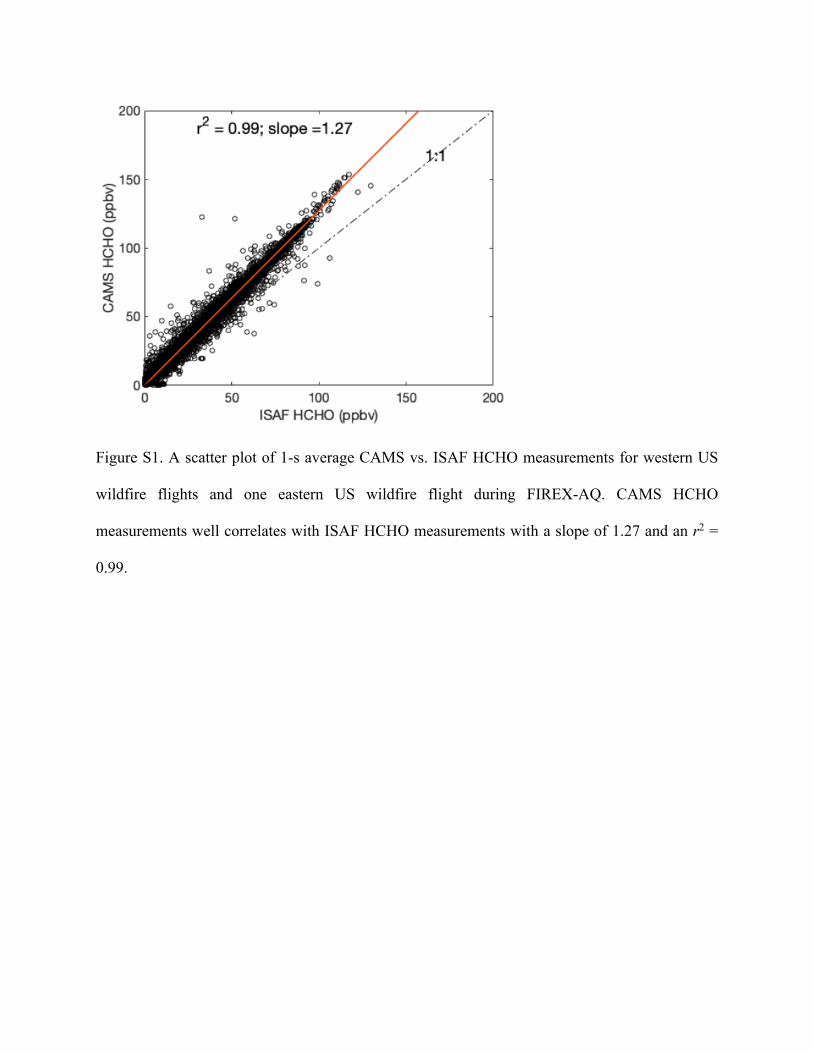
Figure S1. A scatter plot of 1-s average CAMS vs. ISAF HCHO measurements for western US
wildfire flights and one eastern US wildfire flight during FIREX-AQ. CAMS HCHO
measurements well correlates with ISAF HCHO measurements with a slope of 1.27 and an r2 =
0.99.
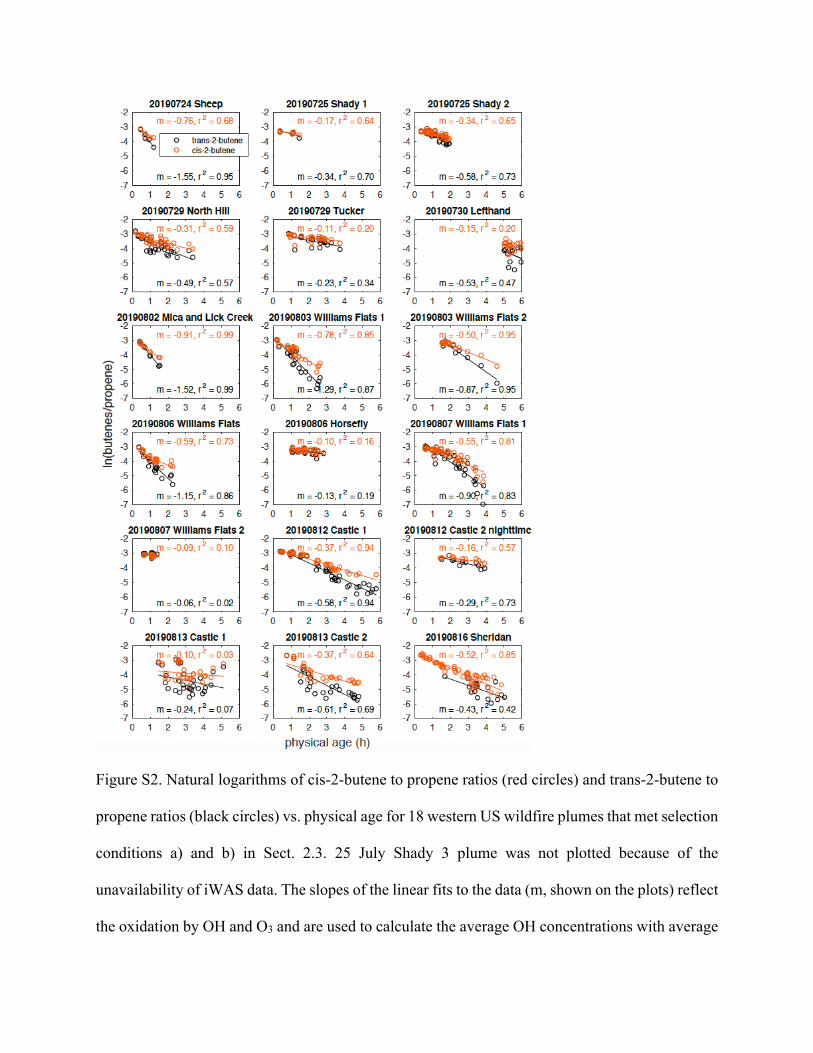
Figure S2. Natural logarithms of cis-2-butene to propene ratios (red circles) and trans-2-butene to
propene ratios (black circles) vs. physical age for 18 western US wildfire plumes that met selection
conditions a) and b) in Sect. 2.3. 25 July Shady 3 plume was not plotted because of the
unavailability of iWAS data. The slopes of the linear fits to the data (m, shown on the plots) reflect
the oxidation by OH and O3 and are used to calculate the average OH concentrations with average
O3 concentrations and reaction coefficients. The eastern US wildfire plume not plotted here is
displayed in Fig. 2.
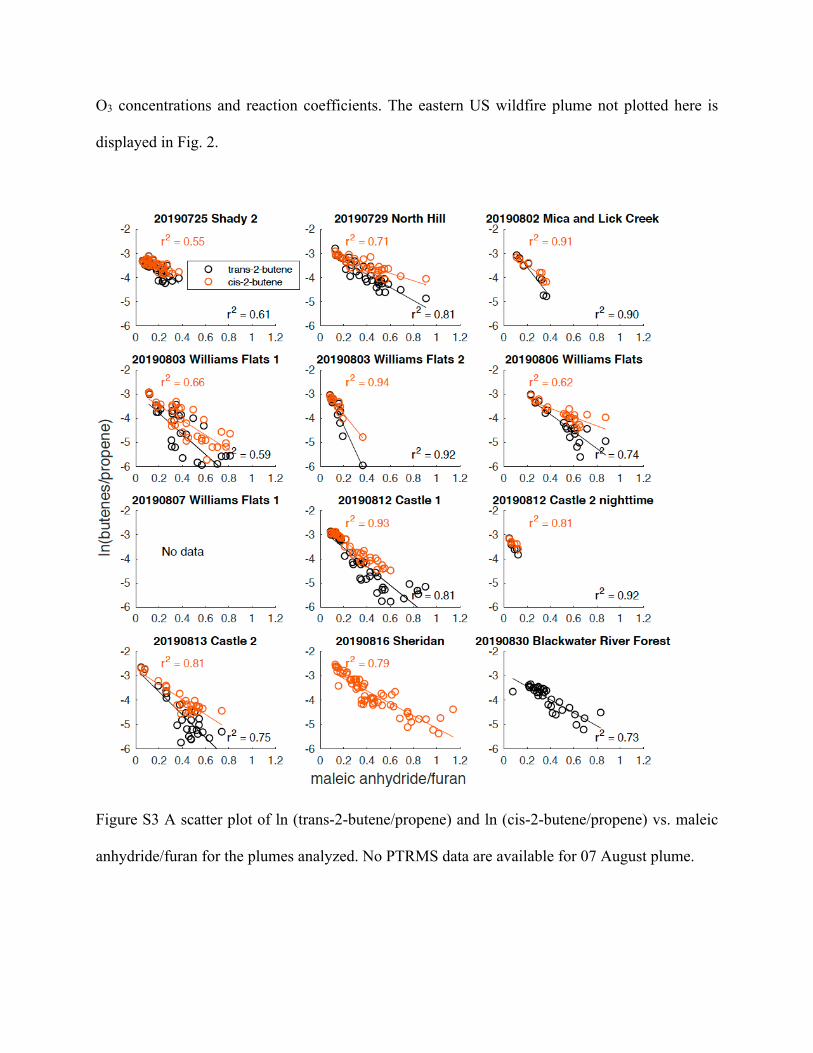
Figure S3 A scatter plot of ln (trans-2-butene/propene) and ln (cis-2-butene/propene) vs. maleic
anhydride/furan for the plumes analyzed. No PTRMS data are available for 07 August plume.

Figure S4. A scatter plot of nHCHO vs. modified combustion efficiency (MCE) for the 12 plumes
analyzed. The slightly positive correlation is due to the eastern US wildfire plume that had higher
MCE and in plume nHCHO than western US wildfire plumes.
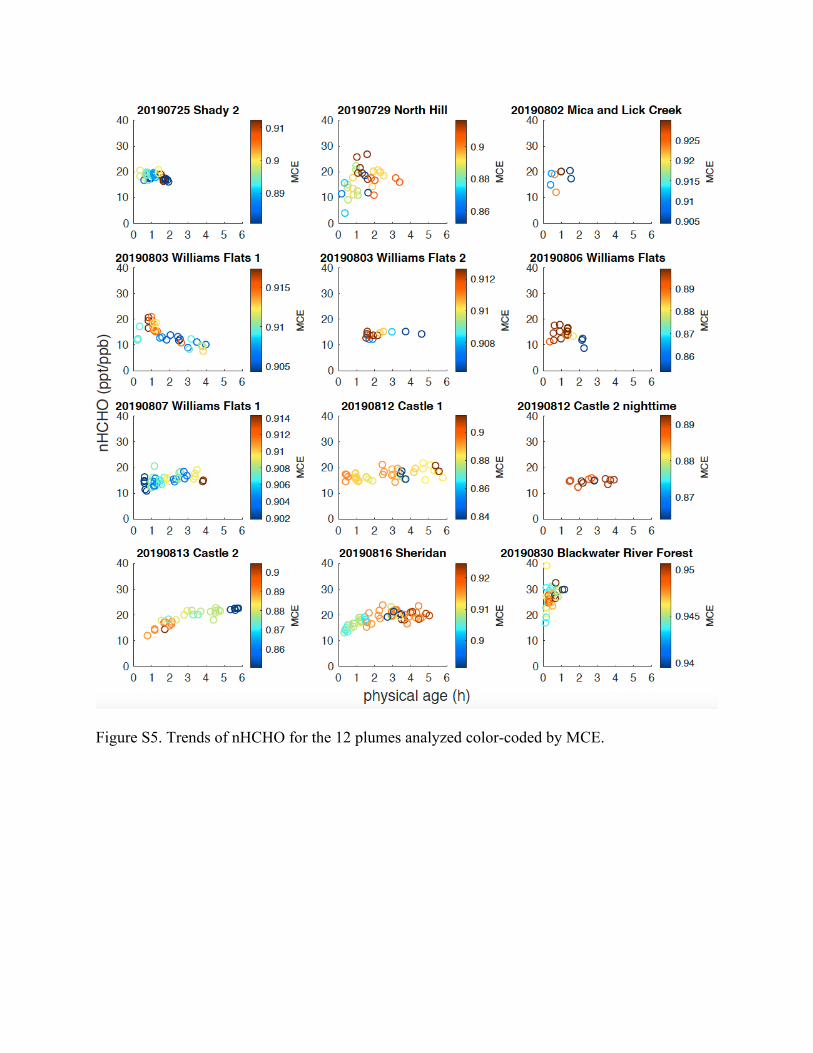
Figure S5. Trends of nHCHO for the 12 plumes analyzed color-coded by MCE.
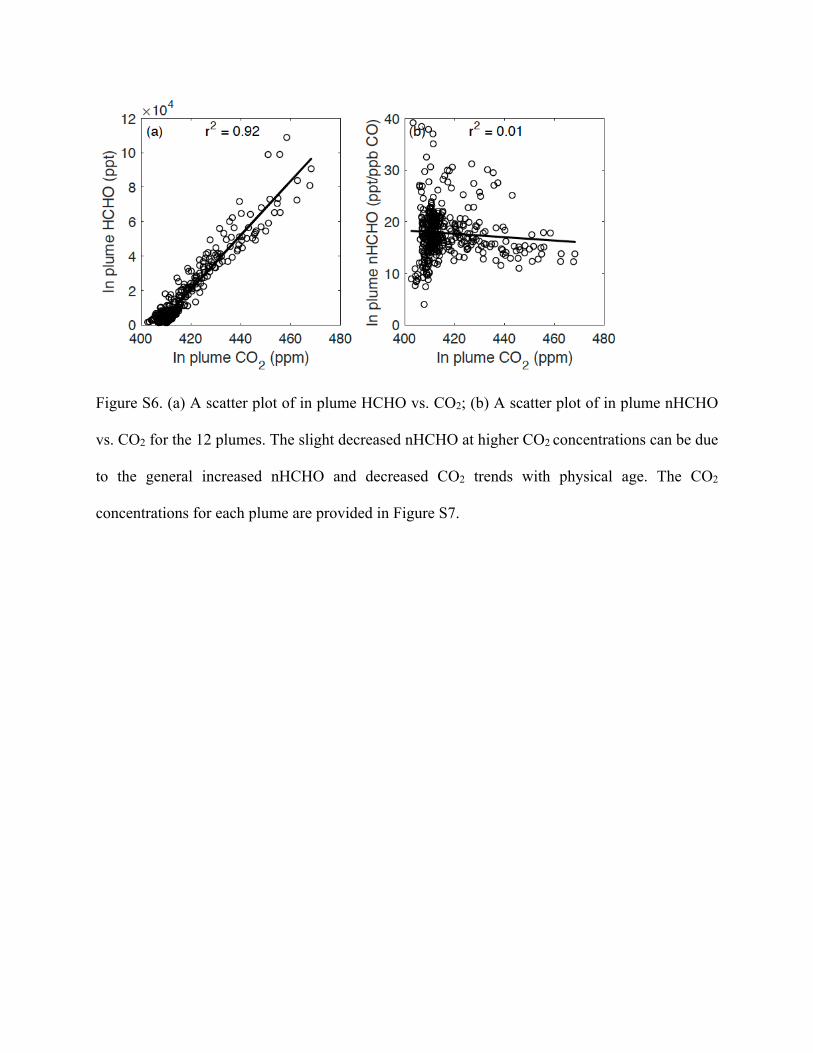
Figure S6. (a) A scatter plot of in plume HCHO vs. CO2; (b) A scatter plot of in plume nHCHO
vs. CO2 for the 12 plumes. The slight decreased nHCHO at higher CO2 concentrations can be due
to the general increased nHCHO and decreased CO2 trends with physical age. The CO2
concentrations for each plume are provided in Figure S7.
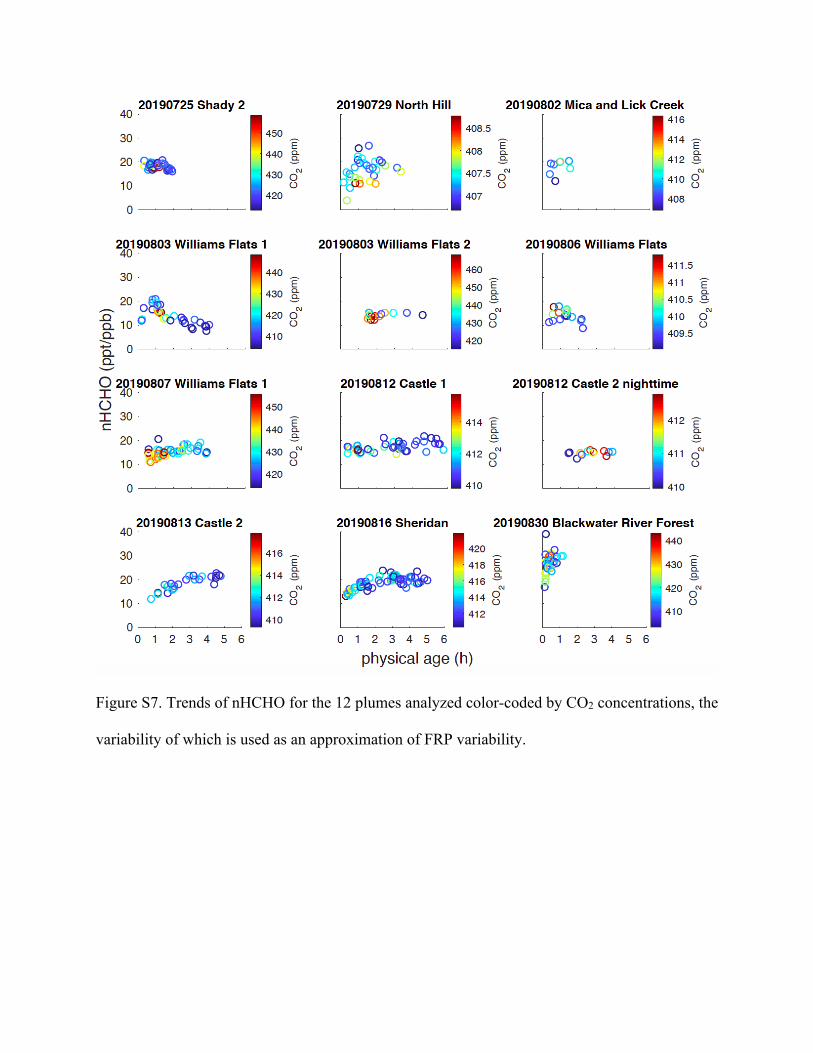
Figure S7. Trends of nHCHO for the 12 plumes analyzed color-coded by CO2 concentrations, the
variability of which is used as an approximation of FRP variability.
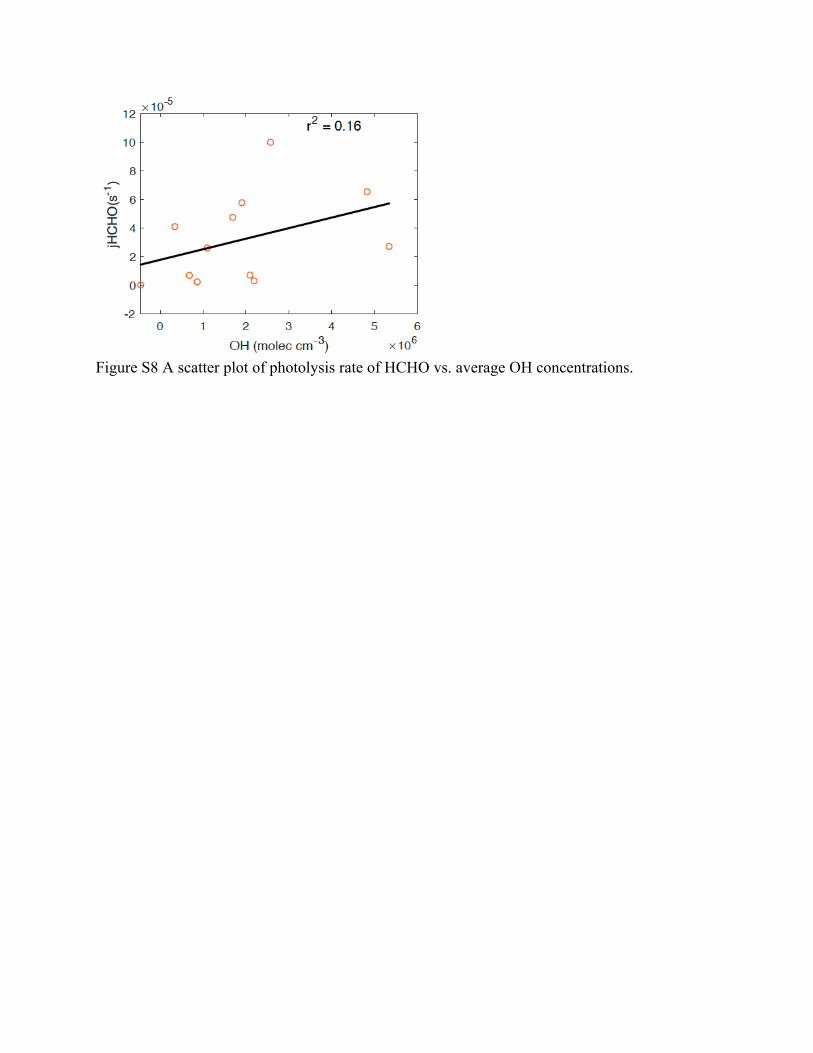
Figure S8 A scatter plot of photolysis rate of HCHO vs. average OH concentrations.