Enzymatic Hydrolysis of Water Hyacinth Substrate by Cellulase, Xylanase and Glucosidase: Experiments...
9
RESEARCH ARTICLE Copyright © 2012 American Scientific Publishers All rights reserved Printed in the United States of America Journal of Biobased Materials and Bioenergy Vol. 6, 1–9, 2012 Enzymatic Hydrolysis of Water Hyacinth Substrate by Cellulase, Xylanase and Glucosidase: Experiments and Optimization A. Ganguly 1 , A. Gupta 2 , S. Das 2 , A. Dey 2 , and P. K. Chatterjee 1 ∗ 1 Thermal Engineering Division Central Mechanical Engineering Research Institute, Durgapur 713209, India 2 Department of Biotechnology, National Institute of Technology, Durgapur 713209, India Bioethanol is a renewable energy source produced from fermentation of sugar released by sacchar- ification of lignocellulosic materials. Pretreatment followed by enzymatic hydrolysis and fermentation has been reported as a very effective process for conversion of lignocellulosics to bioethanol. The present study investigates the effect of enzymatic hydrolysis using different enzymes like cellulase, xylanase and glucosidase on alkali, acid and untreated water hyacinth and then optimizing the enzyme concentration. The study of the interaction among the three enzymes has been carried out to achieve the maximum total reducing sugar as well as xylose yield. The optimized predicted results of the influencing parameters for maximum yield of total reducing sugar are cellulase concentration of 15 U/g, xylanase concentration of 300 U/g and -glucosidase concentration of 59.68 U/g, with a value of 431.421 mg/g and a desirability of 0.996. Keywords: Optimization, Water Hyacinth, Enzymatic Hydrolysis, Response Surface Methodology. 1. INTRODUCTION The demand of lignocellulosic ethanol has gained tremen- dous momentum in the last two decades. This is due to the ever depleting crude oil deposits and the envi- ronmental pollution concerns arising from fossil fuels. Bioethanol is a renewable energy source produced from fermentation of sugar released by saccharification of lig- nocellulosic materials. The importance and benefits of bioethanol include environmental pollution control energy security and increased costs of petroleum. Conversion of plant biomass includes two processes: hydrolysis of cel- lulose and hemicellulose in lignocellulosic materials to fermentable reducing sugars and fermentation of sugars to bioethanol. 1 2 There are different techniques for con- version of lignocellulosics to bioethanol, but pretreatment followed by enzymatic hydrolysis and fermentation has been reported to be more effective than others. 3 Pretreat- ment is an effective way to increase the hydrolysis effi- ciency, because it can break down the complex structure of biomass and increase the accessibility of cellulase protein to cellulose substrate. 4 5 ∗ Author to whom correspondence should be addressed. Email: [email protected] There are many sources of lignocellulosic biomass such as sugarcane bagasse, corn, rice husk, molasses etc. Biomass feedstocks having less competition with food crops are desirable for bio-ethanol production and such resources may not be localized geographically. A dis- tributed production strategy is therefore more suitable for feedstock like water hyacinth with a decentralized avail- ability. It has been reported that the biomass of water hyacinth has about 48% hemicellulose, 18% cellulose 3.5% lignin. 6 Though there is a significant amount of vari- ability in composition reported by different labs, in general the biomass is considered to be rich in hemicellulose and with very less lignin content. The biomass productivity of this plant is very high 7 and there is abundant availability of this plant in certain parts of the world making it a suitable feedstock for distributed ethanol production. Also aquatic biomass has the added advantage of not being a competi- tion to food crops for arable land resources. 8 The plant is a typical menace. Pretreatment is the first step in the process of bio ethanol production, so as to achieve rapid hydrolysis of cellulose along with high sugar yield. The efficiency of hydrolysis of pretreated substrate depends on several process parameters such as enzyme loading, biomass loading and incubation time. 3 Optimization of the factors affecting pretreatment J. Biobased Mater. Bioenergy 2012, Vol. 6, No. 3 1556-6560/2012/6/001/009 doi:10.1166/jbmb.2012.1223 1
-
Upload
independent -
Category
Documents
-
view
0 -
download
0
Transcript of Enzymatic Hydrolysis of Water Hyacinth Substrate by Cellulase, Xylanase and Glucosidase: Experiments...

RESEARCH
ARTIC
LE
Copyright © 2012 American Scientific PublishersAll rights reservedPrinted in the United States of America
Journal ofBiobased Materials and Bioenergy
Vol. 6, 1–9, 2012
Enzymatic Hydrolysis of Water Hyacinth Substrate byCellulase, Xylanase and � Glucosidase:
Experiments and Optimization
A. Ganguly1, A. Gupta2, S. Das2, A. Dey2, and P. K. Chatterjee1�∗1Thermal Engineering Division Central Mechanical Engineering Research Institute, Durgapur 713209, India
2Department of Biotechnology, National Institute of Technology, Durgapur 713209, India
Bioethanol is a renewable energy source produced from fermentation of sugar released by sacchar-ification of lignocellulosic materials. Pretreatment followed by enzymatic hydrolysis and fermentationhas been reported as a very effective process for conversion of lignocellulosics to bioethanol. Thepresent study investigates the effect of enzymatic hydrolysis using different enzymes like cellulase,xylanase and � glucosidase on alkali, acid and untreated water hyacinth and then optimizing theenzyme concentration. The study of the interaction among the three enzymes has been carried outto achieve the maximum total reducing sugar as well as xylose yield. The optimized predicted resultsof the influencing parameters for maximum yield of total reducing sugar are cellulase concentrationof 15 U/g, xylanase concentration of 300 U/g and �-glucosidase concentration of 59.68 U/g, with avalue of 431.421 mg/g and a desirability of 0.996.
Keywords: Optimization, Water Hyacinth, Enzymatic Hydrolysis, Response SurfaceMethodology.
1. INTRODUCTION
The demand of lignocellulosic ethanol has gained tremen-dous momentum in the last two decades. This is dueto the ever depleting crude oil deposits and the envi-ronmental pollution concerns arising from fossil fuels.Bioethanol is a renewable energy source produced fromfermentation of sugar released by saccharification of lig-nocellulosic materials. The importance and benefits ofbioethanol include environmental pollution control energysecurity and increased costs of petroleum. Conversion ofplant biomass includes two processes: hydrolysis of cel-lulose and hemicellulose in lignocellulosic materials tofermentable reducing sugars and fermentation of sugarsto bioethanol.1�2 There are different techniques for con-version of lignocellulosics to bioethanol, but pretreatmentfollowed by enzymatic hydrolysis and fermentation hasbeen reported to be more effective than others.3 Pretreat-ment is an effective way to increase the hydrolysis effi-ciency, because it can break down the complex structure ofbiomass and increase the accessibility of cellulase proteinto cellulose substrate.4�5
∗Author to whom correspondence should be addressed.Email: [email protected]
There are many sources of lignocellulosic biomasssuch as sugarcane bagasse, corn, rice husk, molasses etc.Biomass feedstocks having less competition with foodcrops are desirable for bio-ethanol production and suchresources may not be localized geographically. A dis-tributed production strategy is therefore more suitable forfeedstock like water hyacinth with a decentralized avail-ability. It has been reported that the biomass of waterhyacinth has about 48% hemicellulose, 18% cellulose3.5% lignin.6 Though there is a significant amount of vari-ability in composition reported by different labs, in generalthe biomass is considered to be rich in hemicellulose andwith very less lignin content. The biomass productivity ofthis plant is very high7 and there is abundant availability ofthis plant in certain parts of the world making it a suitablefeedstock for distributed ethanol production. Also aquaticbiomass has the added advantage of not being a competi-tion to food crops for arable land resources.8 The plant isa typical menace.Pretreatment is the first step in the process of bio ethanol
production, so as to achieve rapid hydrolysis of cellulosealong with high sugar yield. The efficiency of hydrolysis ofpretreated substrate depends on several process parameterssuch as enzyme loading, biomass loading and incubationtime.3 Optimization of the factors affecting pretreatment
J. Biobased Mater. Bioenergy 2012, Vol. 6, No. 3 1556-6560/2012/6/001/009 doi:10.1166/jbmb.2012.1223 1

RESEARCH
ARTIC
LE
Enzymatic Hydrolysis of Water Hyacinth Substrate by Cellulase, Xylanase and � Glucosidase Ganguly et al.
is necessary for achieving desired yields and it is verymuch important in the improvement of sugar conversionefficiency during enzymatic hydrolysis.The present study investigates the effect of enzymatic
hydrolysis using enzymes like cellulase, xylanase and �glucosidase on alkali, acid and untreated water hyacinthand then optimizing the enzyme concentration and studythe interaction among the three enzymes for a maximumtotal reducing sugar as well as xylose yield. Optimizationof enzymatic hydrolysis of alkali pre treated biomass wascarried out since it gave better results during batch study.
2. MATERIALS AND METHODS
2.1. Biomass Preparation and Alkaline Pretreatment
Water hyacinth plants were obtained from an unpollutedpond within the CMERI premises. Only the shoots andleafy parts of the plants were used and the roots werediscarded. The shoots and leaves were first reduced to aparticle size of about 2–3 cm and then dried at 106 �C for6 hrs. After drying, particle size was further reduced to1–2 mm by grinding. This grinded water hyacinth biomass(WHB) was used for the experiments. It was stored in airtight containers at room temperature.Separate samples of dried WHB was pre-treated with
sodium hydroxide (5%) and sulfuric acid (5%) at 130 �Cwith soaking time 1 hr and treatment time 10 min. Theacid treated and alkali treated WHB were then washedthoroughly under running water until pH was neutralized.The washings were then dried at room temperature andstored in air tight container till further use.
2.2. Biomass Saccharification
Enzymatic saccharification was done by incubating 1.2 geach of acid treated water hyacinth biomass (Ac-WHB),alkali treated water hyacinth biomass (Alk-WHB) anduntreated water hyacinth biomass (Un-WHB) with cel-lulase, xylanase and �-glucosidase (BGL) separatelyobtained from SIGMA ALDRICH®. The reaction was car-ried out in 100 ml flasks with gentle agitation (120 rpm) at50 �C for 48 h. The hydrolysis was performed in 50 mMcitrate buffer (pH 4.8), and the volumes were adjusted toachieve required biomass loading of 4% so as to allowfree water for reaction. Different concentrations of eachenzyme were used, as shown in Table I. Sugars releasedwere monitored as total reducing sugar yield using DNSmethod9 and as xylose yield by phloroglucinol method.10
2.3. Design of Experiment for Optimization ofBiomass Saccharification
Design of Experiment (DOE) is a structured pre-designedway for finding cause and effect relationships. Theapproach of statistical designing of an experiment to
Table I. Different enzyme loadings used for the biomasssaccharification.
Enzyme Enzyme loading (U/g)
Cellulase 5 10 15Xylanase 150 225 300�-Glucosidase 30 45 60
collect common relationship between various factorsaffecting the process and then to find the most suitablecondition was employed. Experimental design methodol-ogy is an economical way for extracting the maximumamount of complex information which leads to a signifi-cant reduction in the experiments time, thereby saving bothpersonal and material cost.11 Central composite design(CCD),12 Box–Behnken and Doehlert designs (BBD)13
are among the principal response surface methodologies(RSM) used in experimental design. The optimum condi-tions for enzymatic hydrolysis of alkali pre-treated waterhyacinth were determined by a 3-factor 3-level facto-rial Box–Behnken (BB) experimental design techniquecombining with response surface modelling and quadraticprogramming. RSM consists of a group of empirical tech-niques which evaluates relationship between a cluster ofcontrolled experimental factors and measured responsesaccording to one or more selected criteria.14�15 During thefirst step of RSM, a suitable approximation is introducedfor finding true relationship between the dependent vari-able (response) and the set of independent variables (fac-tors). If understanding regarding the shape of true responsesurface is insufficient, the preliminary initial model, gen-erally a first-order model is upgraded to higher orderby adding high-order terms to it.14 In the next step, thebehaviour of the system is explained using the followingquadratic equation14–16 (Eq. (1)).
Y = �0 +k∑
i=1
�i xi +k∑
i=1
�ii x2i +
∑
i=1
∑
j=1+l
�ij xi xj + ∈ (1)
where Y is the process response or output (dependent vari-able), k is the number of the patterns, i and j are the indexnumbers for pattern, �0 is the free or offset term calledintercept term, x1, x2� � � � � xk are the coded independentvariables, �i is the first-order (linear) main effect, �ii isthe quadratic (squared) effect, �ij is the interaction effect,and ∈ is the random error or allows for discrepancies oruncertainties between predicted and measured values.In developing Eq. (1), the natural (uncoded) independent
variables (X1, X2 � � � �Xk) are coded (Eq. (2)) according tothe following transformation.14–17
Coded value= xi =Xi−Xi
�X(2)
Where Xi is actual value of the ith factor in the uncodedunits, Xi the average of the low and high values for the ithfactor, and �X represent the step change.
2 J. Biobased Mater. Bioenergy 6, 1–9, 2012
RESEARCH
ARTIC
LE
Ganguly et al. Enzymatic Hydrolysis of Water Hyacinth Substrate by Cellulase, Xylanase and � Glucosidase
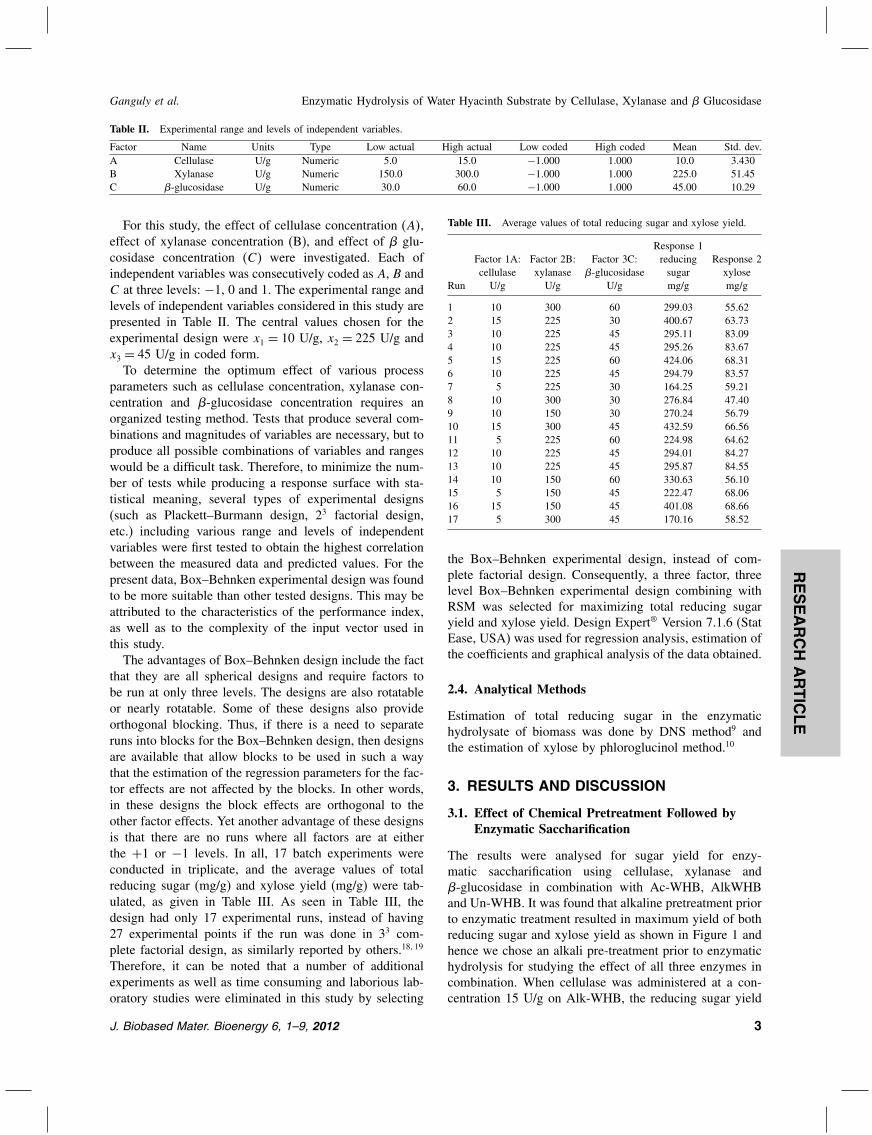
Table II. Experimental range and levels of independent variables.
Factor Name Units Type Low actual High actual Low coded High coded Mean Std. dev.A Cellulase U/g Numeric 5.0 15.0 −1�000 1.000 10.0 3.430B Xylanase U/g Numeric 150.0 300.0 −1�000 1.000 225.0 51.45C �-glucosidase U/g Numeric 30.0 60.0 −1�000 1.000 45.00 10.29
For this study, the effect of cellulase concentration (A�,effect of xylanase concentration (B), and effect of � glu-cosidase concentration (C) were investigated. Each ofindependent variables was consecutively coded as A, B andC at three levels: −1, 0 and 1. The experimental range andlevels of independent variables considered in this study arepresented in Table II. The central values chosen for theexperimental design were x1 = 10 U/g, x2 = 225 U/g andx3 = 45 U/g in coded form.To determine the optimum effect of various process
parameters such as cellulase concentration, xylanase con-centration and �-glucosidase concentration requires anorganized testing method. Tests that produce several com-binations and magnitudes of variables are necessary, but toproduce all possible combinations of variables and rangeswould be a difficult task. Therefore, to minimize the num-ber of tests while producing a response surface with sta-tistical meaning, several types of experimental designs(such as Plackett–Burmann design, 23 factorial design,etc.) including various range and levels of independentvariables were first tested to obtain the highest correlationbetween the measured data and predicted values. For thepresent data, Box–Behnken experimental design was foundto be more suitable than other tested designs. This may beattributed to the characteristics of the performance index,as well as to the complexity of the input vector used inthis study.The advantages of Box–Behnken design include the fact
that they are all spherical designs and require factors tobe run at only three levels. The designs are also rotatableor nearly rotatable. Some of these designs also provideorthogonal blocking. Thus, if there is a need to separateruns into blocks for the Box–Behnken design, then designsare available that allow blocks to be used in such a waythat the estimation of the regression parameters for the fac-tor effects are not affected by the blocks. In other words,in these designs the block effects are orthogonal to theother factor effects. Yet another advantage of these designsis that there are no runs where all factors are at eitherthe +1 or −1 levels. In all, 17 batch experiments wereconducted in triplicate, and the average values of totalreducing sugar (mg/g) and xylose yield (mg/g) were tab-ulated, as given in Table III. As seen in Table III, thedesign had only 17 experimental runs, instead of having27 experimental points if the run was done in 33 com-plete factorial design, as similarly reported by others.18�19
Therefore, it can be noted that a number of additionalexperiments as well as time consuming and laborious lab-oratory studies were eliminated in this study by selecting
Table III. Average values of total reducing sugar and xylose yield.
Response 1Factor 1A: Factor 2B: Factor 3C: reducing Response 2cellulase xylanase �-glucosidase sugar xylose
Run U/g U/g U/g mg/g mg/g
1 10 300 60 299.03 55.622 15 225 30 400.67 63.733 10 225 45 295.11 83.094 10 225 45 295.26 83.675 15 225 60 424.06 68.316 10 225 45 294.79 83.577 5 225 30 164.25 59.218 10 300 30 276.84 47.409 10 150 30 270.24 56.7910 15 300 45 432.59 66.5611 5 225 60 224.98 64.6212 10 225 45 294.01 84.2713 10 225 45 295.87 84.5514 10 150 60 330.63 56.1015 5 150 45 222.47 68.0616 15 150 45 401.08 68.6617 5 300 45 170.16 58.52
the Box–Behnken experimental design, instead of com-plete factorial design. Consequently, a three factor, threelevel Box–Behnken experimental design combining withRSM was selected for maximizing total reducing sugaryield and xylose yield. Design Expert® Version 7.1.6 (StatEase, USA) was used for regression analysis, estimation ofthe coefficients and graphical analysis of the data obtained.
2.4. Analytical Methods
Estimation of total reducing sugar in the enzymatichydrolysate of biomass was done by DNS method9 andthe estimation of xylose by phloroglucinol method.10
3. RESULTS AND DISCUSSION
3.1. Effect of Chemical Pretreatment Followed byEnzymatic Saccharification
The results were analysed for sugar yield for enzy-matic saccharification using cellulase, xylanase and�-glucosidase in combination with Ac-WHB, AlkWHBand Un-WHB. It was found that alkaline pretreatment priorto enzymatic treatment resulted in maximum yield of bothreducing sugar and xylose yield as shown in Figure 1 andhence we chose an alkali pre-treatment prior to enzymatichydrolysis for studying the effect of all three enzymes incombination. When cellulase was administered at a con-centration 15 U/g on Alk-WHB, the reducing sugar yield
J. Biobased Mater. Bioenergy 6, 1–9, 2012 3

RESEARCH
ARTIC
LE
Enzymatic Hydrolysis of Water Hyacinth Substrate by Cellulase, Xylanase and � Glucosidase Ganguly et al.
Fig. 1. Yield of total reducing sugars and xylose using differentparameters.
was observed to be 154.27 mg/g while xylose yield of87.53 mg/g was observed to be highest with 15 U/g cel-lulase using Alk-WHB. Similarly when xylanase enzymewas studied using alkali pre-treated biomass it gave a high-est total reducing sugar yield of 88.5375 mg/g and xyloseyield of 26.275 mg/g at xylanase concentration of 300 U/g.Using BGL concentration of 60 U/g on alkali pre-treatedbiomass the highest total reducing sugar was observed tobe 62.85 mg/g and xylose yield of 44.427 mg/g.
3.2. Experimental Design and Fitting ofQuadratic Model
From the experimental studies on the yield of total reduc-ing sugar and xylose from alkali treated water hyacinthby enzymatic saccharification it has been shown that con-centration of cellulase, xylanase and �-glucosidase are themost important factors affecting the xylose yield and totalreducing sugar from the solution. Therefore, regressionmodel equation was developed considering the above fac-tors. The Box Behnken as discussed earlier was used todevelop correlation between the selected operating vari-ables to the removal efficiency. The complete designmatrix together with the response values obtained from theexperimental works is represented in Table III. The cen-tre runs (0, 0, and 0) were repeated five times as theycontribute to the estimation of the quadratic terms in themodel. Values of all the coefficients of Eq. (1) as given inTable IV were calculated from the experimental data usingDesign Expert Version 7.1.6 (Stat Ease, USA) to obtainthe regression equation for total reducing sugar and xyloseyield as shown below.The results of each experiment performed as per the
software are given in Table III. An empirical relationship
between the response and the actual factors for total reduc-ing sugar has been expressed by the following quadraticmode (Eq. (3)):
Reducing sugar yield = +48�64250+6�59270× cellulase
−0�34361×xylanase+5�32543
�-glucosidase+0�055880
×cellulase×xylanase−0�12447
×cellulase×�-glucosidase
×−8�48889E–003×xylanase
�-glucosidase+0�41744
×cellulase2+2�01067E–004
×xylanase2−8�68444E–003
�-glucosidase2 (3)
The results of each experiment performed as per the soft-ware are given in Table III. An empirical relationship wasalso developed between the response and the actual fac-tors for total xylose yield as expressed by the followingquadratic mode (Eq. 4):
Xylose yield = −174�37625+2�78575× cellulase
+0�96025×xylanase+5�99517
×�-glucosidase+4�96000E–003
×cellulase×xylanase−2�76667E–003
×cellulase×�-glucosidase+1�98000E
−003×xylanase×�-glucosidase
−0�16780× cellulase2−2�52178E–003
×xylanase2−0�069633
�-glucosidase2 (4)
3.3. ANOVA Study
3.3.1. ANOVA Study for Total Reducing Sugar
The results of second-order response surface model inthe form of analysis of variance (ANOVA) are shown inTable IV. The statistical significance of the model equa-tion was evaluated by the F -test ANOVA. The signifi-cance of each coefficient was determined by F -values andP -values. The coefficients for the main effects of con-centration of cellulase, xylanase and �-glucosidase werehighly significant (P < 0�0001). It shows ANOVA for theresponse surface quadratic model. It may be mentionedthat the probability of obtaining high model F -value dueto creation of noise is only 0.01%. Values of ‘prob> F ’less than 0.05 indicate model terms are significant. In thiscase A, B, C, AB, BC, AC, A2 B2 & C2 are significant
4 J. Biobased Mater. Bioenergy 6, 1–9, 2012
RESEARCH
ARTIC
LE
Ganguly et al. Enzymatic Hydrolysis of Water Hyacinth Substrate by Cellulase, Xylanase and � Glucosidase
Table IV. ANOVA for the response surface quadratic model.
Source Sum of squares df (degrees of freedom) Mean square F value P value prob> F
Model 1.027E+005 9 11413�75 9745�37 <0.0001 SignificantA 96040.30 1 96040�30 82001�82 <0.0001B 262.21 1 262�21 223�88 <0.0001C 3473.61 1 3473�61 2965�86 <0.0001AB 1756.45 1 1756�45 1499�70 <0.0001AC 348.57 1 348�57 297�62 <0.0001BC 364.81 1 364�81 311�48 <0.0001A2 458.57 1 458�57 391�54 <0.0001B2 5.39 1 5�39 4�60 <0.0001C2 16.08 1 16�08 13�13 <0.0001Residual 8.20 7 1�17Lack of fit 6.34 3 2�11 4�54 0.0889 Non significantPure error 1.86 4 0�47Cor total 1.027E+005 16
Table V. ANOVA for the response surface quadratic model.
Source Sum of squares df (degrees of freedom) Mean square F value P value prob> F
Model 2295�44 9 255�05 707�35 <0.0001 SignificantA 35�49 1 35�49 98�43 <0.0001B 57�84 1 57�84 160�40 <0.0001C 38�37 1 38�37 106�41 <0.0001AB 13�84 1 13�84 38�38 <0.0001AC 0�17 1 0�17 0�48 <0.0001BC 19�85 1 19�85 55�04 <0.0001A2 74�10 1 74�10 205�50 <0.0001B2 847�22 1 847�22 2349�68 <0.0001C2 1033�56 1 1033�56 2866�48 <0.0001Residual 2�52 7 0�32Lack of fit 1�17 3 0�39 1�15 0.4298 Non significantPure error 1�35 4 0�34Cor total 2297�97 16
model terms. The F -value (9745.37) with a low probabil-ity value (P < 0�0001) demonstrates a high significance forthe regression model. The goodness of the fit of the modelwas also checked by the multiple correlation coefficients(R2). In this case, the value of the multiple correlationcoefficients was 0.9999. The value of predicted multi-ple correlation coefficient (R2 = 0�9990) is in reasonableagreement with the value of the adjusted multiple corre-lation coefficient of 0.9998. The relatively lower value ofthe coefficient of variance (CV = 0�36%) indicates a betterprecision and reliability of the experiments.20 The non-significant value of lack of fit showed that the quadraticmodel was valid for the present study.21
The Predicted Residual Sum of Squares (PRESS) as cal-culated is 104.31, which indicates the appropriate fit ofthe model. The model shows standard deviation and meanvalue of 1.08 and 299.53, respectively.
3.3.2. ANOVA Study for Xylose Yield
The results of second-order response surface model inthe form of ANOVA are shown in Table V. In thiscase, the value of the multiple correlation coefficients
was 0.9989. The predicted multiple correlation coefficient(R2 = 0�9909) is in reasonable agreement with the value ofthe adjusted multiple correlation coefficient of 0.9975. Atthe same time, a relatively lower value of the coefficientof variance (CV = 0�89%) indicates a better precision andreliability of the experiments.20 The non-significant valueof lack of fit showed that the quadratic model was validfor the present study.22 The model shows standard devi-ation and mean value of 0.6 and 67.81 respectively with20.85 as the value of PRESS.
3.3.3. Response Surface Estimation for Maximum Yieldof Total Reducing Sugar by Enzyme Hydrolysis
The normal probability plot as given in Figure 2(a) showssome scatter along the line indicating that the residuals fol-low a normal distribution. Residuals versus Predicted plotin Figure 2(b) indicate the residuals versus the ascendingpredicted response values. The plot shows a random scatterwith a constant range of residuals across the graph. Actualversus Predicted plot (Fig. 2(c)) also represents a highdegree of similarity that was observed between the pre-dicted and experimental values. It can be concluded from
J. Biobased Mater. Bioenergy 6, 1–9, 2012 5

RESEARCH
ARTIC
LE
Enzymatic Hydrolysis of Water Hyacinth Substrate by Cellulase, Xylanase and � Glucosidase Ganguly et al.
Fig. 2. Normal probability plot, residuals versus predicted plot, actual versus predicted plot.
the three diagnostic plots (Figs. 2(a–c)) that the model hassatisfied the assumptions of the analysis of variance andalso reflected the accuracy and applicability of RSM tooptimize the process for total reducing sugar production.Perturbation plot in Figure 3 represents comparison of theeffect of factor variables at the midpoint (coded 0) in thedesign space. A steep slope or curvature was found forthe plot with combination of enzyme loadings of cellulase,xylanase and �-glucosidase and it shows that the responseis sensitive to these factors.The contour plot (Figs. 4(a–c)) determines the interac-
tion of the components and optimum level of each com-ponent for maximum response. These plots were obtained
Fig. 3. Perturbation plot representing comparison of the effect of factorvariables at the midpoint (coded 0) in the design space.
from the pair-wise combination of independent factors,while keeping other factors at its center point level. Thecontour plots as shown in Figures 4(a)–(c) clearly indi-cates that the presence of mutual interaction among thefactors. The predicted results showed the maximum yieldof total reducing sugar having a value of 431.421 mg/g at acellulase concentration of 15 U/g, xylanase concentrationof 300 U/g and �-glucosidase concentration of 59.68 U/g,with a desirability of 0.996. The maximum predictableresponse was calculated using regression equation employ-ing substituted level of factors and was experimentallyverified.
3.3.4. Response Surface Estimation for Maximum Yieldof Xylose by Enzyme Hydrolysis
The normal probability plot is given in Figure 5(a). Itshows some scatter along the line indicating that the resid-uals follow a normal distribution. Residuals versus Pre-dicted plot in Figure 5(b) shows the residuals versus theascending predicted response values. The plot shows a ran-dom scatter (constant range of residuals across the graph).Actual versus Predicted plot (Fig. 5(c)) also represents ahigh degree of similarity that was observed between thepredicted and experimental values. From the three diagnos-tic plots (Figs. 5(a–c)) it can be concluded that the modelhas satisfied the assumptions of the analysis of varianceand also reflected the accuracy and applicability of RSMto optimize the process for xylose production. Perturbationplot in Figure 6 represents comparison of the effect of fac-tor variables at the midpoint (coded 0) in the design space.A steep slope or curvature was found for the plot withcombination of enzyme loadings of cellulase, xylanase and
6 J. Biobased Mater. Bioenergy 6, 1–9, 2012

RESEARCH
ARTIC
LE
Ganguly et al. Enzymatic Hydrolysis of Water Hyacinth Substrate by Cellulase, Xylanase and � Glucosidase
Fig. 4. Elliptical contour plot indicating the mutual interaction among factors.
Fig. 5. Normal probability plot, residuals versus predicted plot, actual versus predicted plot.
� glucosidase and it shows that the response is sensitiveto these factors.The contour plot (Figs. 7(a–c)) determines the interac-
tion of the components and optimum level of each com-ponent for maximum response. These plots were obtainedfrom the pair-wise combination of independent factors,while keeping other factors at its center point level. Theelliptical contour plot shown in Figures 7(a)–(c), it clearlyindicates that the mutual interaction is prominent amongfactors. The predicted results show that xylose yield ismaximum at a cellulase concentration of 15 U/g, xylanaseconcentration of 268.71 U/g and �-glucosidase concentra-tion of 54.07 U/g, with a value of 72.69 mg/g having adesirability of 0.996. The maximum predictable responsewas calculated using regression equation employing substi-tuted level of factors and was experimentally verified. Thetotal yield of xylose was less than that of reducing sugar,because alkaline pretreatment is known for its solubiliza-tion of hemicellulose, hence resulting in loss of xylose
Fig. 6. Perturbation plot representing comparison of the effect of factorvariables at the midpoint (coded 0) in the design space.
J. Biobased Mater. Bioenergy 6, 1–9, 2012 7

RESEARCH
ARTIC
LE
Enzymatic Hydrolysis of Water Hyacinth Substrate by Cellulase, Xylanase and � Glucosidase Ganguly et al.
Fig. 7. Elliptical contour plot indicating the mutual interaction among factors.
Table VI. Observed mean values for the validation experiment.
� ObservedCellulase Xylanase glucosidase Predicted mean(U/g) (U/g) (U/g) (mg/g) (mg/g)
Total reducing 15 300 59.68 431�421 428�32sugar yield
Total xylose yield 15 268�71 54.07 72�69 71�24
yield in the initial pretreatment part. This is found to bein accordance with.23
3.4. Validation of the Experimental Model
The model was validated for all three variables within thedesign space. The experimentally determined productionvalues were in close agreement with the statistically pre-dicted ones, confirming the model’s authenticity and appli-cability of the statistical model (RSM) for the optimizationof the physiochemical factors, as shown in Table VI.
4. CONCLUSION
The enzymatic hydrolysis of water hyacinth substrate incombination with alkaline pretreatment was studied for theyield of total reducing sugar and xylose. It could be dueto the fact that removal of lignin is very effective duringalkaline pretreatment, leaving most of the cellulose andparts of hemicellulose nearly undamaged. Thus it increasesthe porosity of the lignocellulosic substrate and also theavailability of the substrate for enzyme action.The application of RSM in the study of total reduc-
ing sugar and xylose yield from lignocellulosic biomassby alkali hydrolysis process for optimization and mod-eling facilitated the analysis of interaction effects of the
process variables on the response. It also appeared to bevery effective and time saving approach for studying thecombined influence of process parameters on the responsefactor. Optimization conditions for the maximum xyloseyield were obtained by applying a desirability functionin RSM. The optimized predicted results of the influ-encing parameters for maximum yield of total reducingsugar are cellulase concentration of 15 U/g, xylanase con-centration of 300 U/g and �-glucosidase concentration of59.68 U/g, with a value of 431.421 mg/g and a desirabilityof 0.996. The experimental results suggest that under opti-mized conditions; water hyacinth can be used as an effec-tive lignocellulosic biomass source for production of totalreducing sugar by alkaline hydrolysis process, which is avery important step towards ethanol production process.
Acknowledgments: The authors are grateful toDirector, CSIR-Central Mechanical Engineering ResearchInstitute, Durgapur for constant support, encouragementand permission to publish this paper.
References
1. J. D. Peterson, D. M. Cook, and S. K. Brandon, The Plant J. 54, 582(2008).
2. Y. C. Sun, Bioresour. Technol. 83, 1 (2002).3. R. Sindhu, M. Kuttiraja, P. Binod, K. U. Janu, R. K. Sukumaran,
and A. Pandey, Bioresour. Technol. 102, 10915 (2011).4. P. Kumar, D. M. Barrett, M. J. Delwiche, and P. Stroeve, Ind. Eng.
Chem. Res. 48, 3713 (2009b).5. N. Mosier, C. Wyman, B. Dale, R. Elander, Y. Y. Lee, M. Holtzapple,
and M. Ladisch, Bioresour. Technol. 96, 673 (2005).6. J. N. Nigam, J. Biotechnol. 97, 107 (2002).7. D. S. Mitchell, The growth and Management of Eichhornia Cras-
sipes and Salvinia spp, in Their Native Environment and in AlienSituations, edited by C. K. Varshney, and J. Rzoska, Aquatic Weedsin Southeast Asia, Dr. W. Junk, B. V. Publishers, The Hague (1976),pp. 396.
8 J. Biobased Mater. Bioenergy 6, 1–9, 2012

RESEARCH
ARTIC
LE
Ganguly et al. Enzymatic Hydrolysis of Water Hyacinth Substrate by Cellulase, Xylanase and � Glucosidase
8. D. Mishima, M. Kuniki, K. Sei, S. Soda, M. Ike, and M. Fujitha,Bioresour. Technol. 99, 2495 (2008).
9. G. L. Miller, Annl. Chem. 31, 426 (1959).10. P. Trinder, Analyst. 100, 12 (1975).11. M. Kincl, S. Turk, and F. Vrecer, Int. J. Pharm. 291, 39 (2005).12. D. L. Massart, Handbook of Chemometrics and Qualimetrics,
Elsevier (1997).13. S. L. Ferreira, S. W. N. Dos, C. M. Quintella, B. B. Neto, and J. M.
Bosque-Sendra, Talanta. 63, 1061 (2004).14. E. Bayraktar, Process Biochem. 37, 169 (2001).15. M. Y. Can, Y. Kaya, and O. F. Algur, Bioresour. Technol. 97, 1761
(2006).16. K. Adinarayana and P. Ellaiah, J. Pharm. Pharmaceut. Sci. 5, 272
(2002).
17. R. Sen and T. Swaminathan, Biochem. Eng. J. 21, 141 (2004).18. J. T. Batalon and P. S. Madamba, J. Agric. Eng. Res. 78, 167
(2001).19. B. Solanki, J. R. Parikh, and R. H. Parikh, AAPS Pharm. Sci.
Technol. 8, 43 (2007).20. F. Ghorbani, H. Younesi, S. M. Ghasempouri, A. A. Zinatizadeh,
M. Amini, and A. Daneshi, Chem. Eng. J. 145, 267 (2008a).21. Z. R. Lazic, Design of Experiments in Chemical Engineering,
WILEY-VCH Verlag GmbH and Co. KGaA (2004).22. F. Ghorbani, H. Younesi, S. M. Ghasempouri, A. A. Zinatizadeh,
M. Amini, and A. Daneshi, Chem. Eng. J. 145, 267(2008b).
23. F. A. Abdel-Fattah and M. A. Abdel-Naby, Carbohydr. Polym.87, 2109 (2012).
Received: xx Xxxx xxxx. Accepted: xx Xxxx xxxx.
J. Biobased Mater. Bioenergy 6, 1–9, 2012 9

![Probing the Binding of Syzygium-Derived α-Glucosidase Inhibitors with N-and C-Terminal Human Maltase Glucoamylase by Docking and Molecular Dynamics Simulation [2014]](https://static.fdokumen.com/doc/165x107/633266f983bb92fe9804650e/probing-the-binding-of-syzygium-derived-glucosidase-inhibitors-with-n-and-c-terminal.jpg)