Science Learning: Contexts, Characteristics and Interactions
Upload
independentCategory
view
3download
0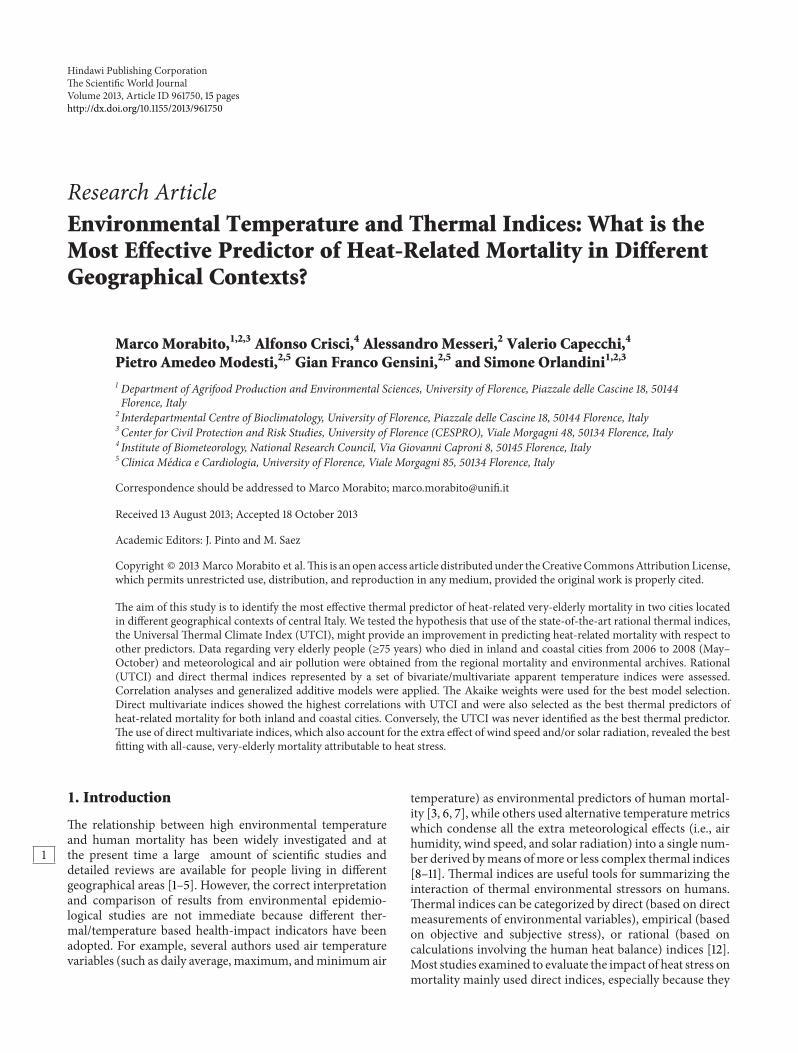
Hindawi Publishing CorporationThe Scientific World JournalVolume 2013 Article ID 961750 15 pageshttpdxdoiorg1011552013961750
Research ArticleEnvironmental Temperature and Thermal Indices What is theMost Effective Predictor of Heat-Related Mortality in DifferentGeographical Contexts
Marco Morabito123 Alfonso Crisci4 Alessandro Messeri2 Valerio Capecchi4
Pietro Amedeo Modesti25 Gian Franco Gensini25 and Simone Orlandini123
1 Department of Agrifood Production and Environmental Sciences University of Florence Piazzale delle Cascine 18 50144Florence Italy
2 Interdepartmental Centre of Bioclimatology University of Florence Piazzale delle Cascine 18 50144 Florence Italy3 Center for Civil Protection and Risk Studies University of Florence (CESPRO) Viale Morgagni 48 50134 Florence Italy4 Institute of Biometeorology National Research Council Via Giovanni Caproni 8 50145 Florence Italy5 Clinica Medica e Cardiologia University of Florence Viale Morgagni 85 50134 Florence Italy
Correspondence should be addressed to Marco Morabito marcomorabitounifiit
Received 13 August 2013 Accepted 18 October 2013
Academic Editors J Pinto and M Saez
Copyright copy 2013 Marco Morabito et alThis is an open access article distributed under theCreativeCommonsAttribution Licensewhich permits unrestricted use distribution and reproduction in any medium provided the original work is properly cited
The aim of this study is to identify the most effective thermal predictor of heat-related very-elderly mortality in two cities locatedin different geographical contexts of central Italy We tested the hypothesis that use of the state-of-the-art rational thermal indicesthe Universal Thermal Climate Index (UTCI) might provide an improvement in predicting heat-related mortality with respect toother predictors Data regarding very elderly people (ge75 years) who died in inland and coastal cities from 2006 to 2008 (MayndashOctober) and meteorological and air pollution were obtained from the regional mortality and environmental archives Rational(UTCI) and direct thermal indices represented by a set of bivariatemultivariate apparent temperature indices were assessedCorrelation analyses and generalized additive models were applied The Akaike weights were used for the best model selectionDirect multivariate indices showed the highest correlations with UTCI and were also selected as the best thermal predictors ofheat-related mortality for both inland and coastal cities Conversely the UTCI was never identified as the best thermal predictorThe use of direct multivariate indices which also account for the extra effect of wind speed andor solar radiation revealed the bestfitting with all-cause very-elderly mortality attributable to heat stress
1 Introduction
The relationship between high environmental temperatureand human mortality has been widely investigated and atthe present time a large amount of scientific studies and1detailed reviews are available for people living in differentgeographical areas [1ndash5] However the correct interpretationand comparison of results from environmental epidemio-logical studies are not immediate because different ther-maltemperature based health-impact indicators have beenadopted For example several authors used air temperaturevariables (such as daily average maximum andminimum air
temperature) as environmental predictors of human mortal-ity [3 6 7] while others used alternative temperature metricswhich condense all the extra meteorological effects (ie airhumidity wind speed and solar radiation) into a single num-ber derived bymeans ofmore or less complex thermal indices[8ndash11] Thermal indices are useful tools for summarizing theinteraction of thermal environmental stressors on humansThermal indices can be categorized by direct (based on directmeasurements of environmental variables) empirical (basedon objective and subjective stress) or rational (based oncalculations involving the human heat balance) indices [12]Most studies examined to evaluate the impact of heat stress onmortality mainly used direct indices especially because they
2 The Scientific World Journal
are quick and easy to use and usually take into account thecombined effect of only twomainmeteorological variables forthermal comfort evaluations (air temperature and humidity)normally available from regular measurements of typicalweather stations Further direct indices also allow for includ-ing the combined effect of other environmental variablessuch as wind speed and occasionally depending on dataavailability solar radiation [13] both of which are importantfor the outdoor thermal comfort assessment However at thepresent time the application of these indices in the field ofheat-related mortality is very rare [14] While only a smallnumber of epidemiological studies have ever attempted to usemore complex and complete rational indices [15] the newlydevelopedUniversalThermal Climate Index (UTCI) [16] thatrepresents the state-of-the-art in outdoor thermal comfortassessments has never been employed
In a recent study [12] several authors reported a detailedcomparison of UTCI with a selected set of thermal indicesand stated that direct indices (ie apparent temperature) areless correlatedwithUTCI than other indices derived from thehuman heat budget model The authors claimed that one ofthe possible causes of unconformity is the lack of the radiationfactor in the algorithm equations
Currently it is very difficult to compare the results of heat-related mortality from studies that used different predictorssuch as air temperature variables or thermal indices andseveral significant doubts regarding the application of oneor other environmental indicator exist among researchersinvolved in environmental epidemiological studies In par-ticular what is the correlation pattern among different tem-perature and thermal index indicators especially when theresults in geographical areas are compared with very differentweather conditions (ie strong winds high humidity etc)Consequently what is the difference in the predicted heat-relatedmortality if different temperature variables or thermalindex indicators are considered Are there significant differ-ences when different climatic conditions and geographicallocations are taken into account In short what is the mosteffective thermal indicator of heat-related mortality
In previous studies [14 17ndash19] the authors tried to addressthis issue but only simple thermal indices (generally ther-mohygrometric indices) were considered and the UTCI wasnever taken into account
For this reason the main aim of this study is to iden-tify the most effective thermalair temperature indicatorsfor predicting heat-related mortality of the very elderly intwo cities with different geographical characteristics basedmainly on their distance from the Tyrrhenian Sea (coastaland inland plain cities) We put the hypothesis to thetest that the use of the state of the art to assess outdoorthermal comfortdiscomfort (UTCI) might provide an effec-tive improvement in predicting heat-related mortality withrespect to direct thermal indices or simple air temperaturevariables currently used in the literature Furthermore thepotentially different impact on mortality due to environ-mental heat conditions is also investigated by using twotypes of meteorological data sources coming from urban andsuburban weather stations This information could prove tobe very useful in developing preventive measures and for
implementing local public health emergency plans related toheat-stress conditions
2 Material and Methods
21 Mortality Data and Study Area The health outcome dataconsisted of residents of the twomajor inland (Florence) and 2coastal (Livorno) cities in the Tuscany region (Central Italy)who died of non violent causes during the hottest periodof the year (May 1 to October 31) from 2006 to 2008 Non-accidental mortality data (ICD9 lt 800) were provided bythe Mortality Registry of the Tuscany region Very elderlyresidents (ge75 years old) who died of nonviolent causes inthe two cities were selected for the analyses (119899 = 3852 inFlorence and 119899 = 1 942 in Livorno)
The cities considered in this study are located in differentgeographical contexts in terms ofmorphological and climaticconditions (a) Florence is an inland plain city located 80 kmfrom the Tyrrhenian Sea at an average altitude of 50masl (lat 43∘4610158401710158401015840N long 11∘1510158401510158401015840E) The average urbanpopulation density for the 3-year period studied was 3570inhabitants per km2 (the highest population density in theTuscany region) The percentage of the very elderly (age ge 75years) populationwas 136 (b) Livorno is a coastal plain cityat about 10m asl with its port on the Tyrrhenian Sea (lat43∘331015840010158401015840N long 10∘191015840010158401015840E) The average urban populationdensitywas 1540 inhabitants per km2 (the highest populationdensity in coastal Tuscan cities) The percentage of the veryelderly population was 121
In regard to the climatic features of the areas studiedJuly and August are the warmest months in both citiesinvestigated while the coldest months are December andJanuaryThe inlandplain city is characterized by higherlowertemperatures than the coastal plain city Furthermore there isa wide daily temperature range in the inland city and duringthe warmest months Conversely the coastal plain city isgenerally characterized by a milder climate due to its closevicinity to the Tyrrhenian Sea and it also has the shortestdaily temperature range with rare extreme temperatures
22 Meteorological and Environmental Pollution DataHourly meteorological data regarding air temperature (119879air∘C) relative humidity (RH ) 10m high horizontal windspeed (11988110 m sminus1) and global radiation (GR Wmminus2) wereprovided by four meteorological stations managed by theRegional Weather Service of Tuscany Meteorological datacovered the warmest period of the year (MayndashOctober) from2006 to 2008
Two of these meteorological stations were located inurban districts and in particular in two green areas of thecity centers of Florence and Livorno The other two stationswere located in residential districts in the flat north-west areaof Florence and on the coast (about 100m from the sea) ofLivorno
For the same period air pollution data including dailyaverage values of ambient particulate concentrations withaerodynamic diameter le10 120583m (PM10 120583gm
minus3) nitrogendioxide (NO2 120583gm
minus3) sulfur dioxide (SO2 120583gmminus3) carbon
The Scientific World Journal 3
minus10
10
20
30
40
500
1
05
0
minus05
minus1
minus10
10
20
30
40
500
1
05
0
minus05
minus1
minus10
10
20
30
40
500
1
05
0
minus05
minus1
minus10
10
20
30
40
500
1
05
0
minus05
minus1
minus10
10
20
30
40
500
1
05
0
minus05
minus1
minus10
10
20
30
40
500
1
05
0
minus05
minus1
minus10
10
20
30
40
500
1
05
0
minus05
minus1
minus10
10
20
30
40
500
1
05
0
minus05
minus1
minus10
10
20
30
40
500
1
05
0
minus05
minus1
minus10
10
20
30
40
500
1
05
0
minus05
minus1
minus10
10
20
30
40
500
1
05
0
minus05
minus1
minus10
10
20
30
40
500
1
05
0
minus05
minus1
minus10
10
20
30
40
500
1
05
0
minus05
minus1
minus10
10
20
30
40
500
1
05
0
minus05
minus1
minus10
10
20
30
40
500
1
05
0
minus05
minus1
minus10
10
20
30
40
500
1
05
0
minus05
minus1
minus10
10
20
30
40
500
1
05
0
minus05
minus1
minus10
10
20
30
40
500
1
05
0
minus05
minus05
minus1
minus10
10
20
30
40
500
1
05
0
minus1
minus10
10
20
30
40
500
1
05
0
minus05
minus1
Sub
urb
anU
rban
Sub
urb
anU
rban
Flo
ren
ceF
lore
nce
Liv
orn
oL
ivo
rno
Lo
g (r
elat
ive
risk
)L
og
(rel
ativ
e ri
sk)
Lo
g (r
elat
ive
risk
)L
og
(rel
ativ
e ri
sk)
UTCI ATsun ATsha ATind Tair
Average A Average A Average A Average ATsun (∘C) lag0-1 Tsha (∘C) lag0-1 Tind (∘C) lag0-1 Tair (∘C) lag0-1Average UTCI (∘C) lag0-1
Figure 1 Relationships between daily average thermal predictors (lag0-1) (∘C) and mortality of the very elderly (subjects ge75 years of age) in
an inland city (Florence) and coastal-plain city (Livorno) Relationships estimated by using urban and suburban meteorological data for theperiod 2006ndash2008 (MayndashOctober) UTCI Universal Thermal Climate Index ATsun apparent temperature assessed outdoors also taking thesolar radiation contribution into account ATsha apparent temperature assessed outdoors in the shade ATind apparent temperature assessedin indoor conditions 119879air environmental temperature Analyses were controlled for air pollution concentrations daylight hours year day ofthe week public holidays and summer population decrement
monoxide (CO mgmminus3) and ozone (O3 120583g mminus3) wereobtained from the Environmental Protection Agency ofTuscany Daily pollutant concentrations were averaged fromavailable monitoring stations located in each urban andsuburban area of Florence and Livorno The number ofmonitoring sites generally varied from two to five pollutionstations depending on the pollutant monitored
During the study period the methods and instrumentsof the monitoring sites classified as ldquourban backgroundrdquo(based on European and Italian air quality legislation) werehomogeneous and compliant with the quality assurancecriteria Furthermore based on previous studies in thesame geographical areas [20 21] the selected environmentalmonitoring sites showed homogeneous air-quality levels andoffered good representation of the background exposure ofthe general population in urban areas
23 Biometeorological Indices Assessment Three directbiometeorological indices (apparent temperature indicesderived from Steadmanrsquos studies) and one rational index(Universal Thermal Climate Index) were assessed
The apparent temperature (AT) is represented by a set ofsimple computational formulas which describe the combinedeffect of temperature and humidity also taking into accountthe extra effects of wind speed and solar radiation bymeasuring the thermal comfort of a typical human walkingat 14m sminus1 and generating 177Wmminus2 of total body surface[13 22ndash24] AT is always expressed in ∘C and for this reasonit is easily interpreted by general users
The three versions of apparent temperature (AT) indicesused in this study are the following
4 The Scientific World Journal
minus10
10
20
30
40
500
1
05
0
minus05
minus1
minus10
10
20
30
40
500
1
05
0
minus05
minus1
minus10
10
20
30
40
500
1
05
0
minus05
minus1
minus10
10
20
30
40
500
1
05
0
minus05
minus1
minus10
10
20
30
40
500
1
05
0
minus05
minus1
minus10
10
20
30
40
500
1
05
0
minus05
minus1
minus10
10
20
30
40
500
1
05
0
minus05
minus1
minus10
10
20
30
40
500
1
05
0
minus05
minus1
minus10
10
20
30
40
500
1
05
0
minus05
minus1
minus10
10
20
30
40
500
1
05
0
minus05
minus1
minus10
10
20
30
40
500
1
05
0
minus05
minus1
minus10
10
20
30
40
500
1
05
0
minus05
minus1
minus10
10
20
30
40
500
1
05
0
minus05
minus1
minus10
10
20
30
40
500
1
05
0
minus05
minus1
minus10
10
20
30
40
500
1
05
0
minus05
minus1
minus10
10
20
30
40
500
1
05
0
minus05
minus1
minus10
10
20
30
40
500
1
05
0
minus05
minus1
minus10
10
20
30
40
500
1
05
0
minus05
minus05
minus1
minus10
10
20
30
40
500
1
05
0
minus1
minus10
10
20
30
40
500
1
05
0
minus05
minus1
Sub
urb
anU
rban
Sub
urb
anU
rban
Flo
ren
ceF
lore
nce
Liv
orn
oL
ivo
rno
Lo
g (r
elat
ive
risk
)L
og
(rel
ativ
e ri
sk)
Lo
g (r
elat
ive
risk
)L
og
(rel
ativ
e ri
sk)
UTCI ATsun ATsha ATind Tair
Maximum A Maximum A Maximum A Maximum ATsun(∘C) lag0-1 Tsha (∘C) lag0-1 Tind (∘C) lag0-1 Tair (∘C) lag0-1Maximum UTCI (∘C) lag0-1
Figure 2 Relationships between daily maximum thermal predictors (lag0-1) (∘C) and mortality of the very elderly (subjects ge75 years of age)
in an inland city (Florence) and coastal-plain city (Livorno) Relationships estimated by using urban and suburbanmeteorological data for theperiod 2006ndash2008 (MayndashOctober) UTCI Universal Thermal Climate Index ATsun apparent temperature assessed outdoors also taking thesolar radiation contribution into account ATsha apparent temperature assessed outdoors in the shade ATind apparent temperature assessedin indoor conditions 119879air environmental temperature Analyses were controlled for air pollution concentrations daylight hours year day ofthe week public holidays and summer population decrement
(i) The indoor AT (ATind) only takes the combined effectof air temperature and humidity into considerationthis index is assessed by the following formula
ATind = 089119879air + 0382119890 minus 256 (1)
(ii) The shade AT (ATsha) also takes the assessed windeffect into account this index is assessed by thefollowing formula
ATsha = 119879air + 033119890 minus 07011988110 minus 400 (2)
(iii) The outdoor AT (ATsun) expresses the sensation ofa walking clothed person fully exposed to all mete-orological effects considered air temperature and
humidity wind speed and solar radiation this indexis assessed by the following formula
ATsun = 119879air + 0348119890 minus 07011988110 + 070119876119892(11988110 + 10)
minus 425
(3)
where ldquo119890rdquo is the water vapor pressure (hPa) and ldquo119876119892rdquois the heat-flow rate per unit area of body surfacedue to net extra radiation (119876119892 is related to the meanradiant temperature) A detailed description of theassessment of 119876119892 is reported in Steadman (1994) Inthis study the variable ldquo119890rdquo was calculated from theair temperature and the relative humidity using thefollowing equation
119890 =RH1006105exp(1727(119879air(2377+119879air))) (4)
The Scientific World Journal 5
minus10
10
20
30
40
500
1
05
0
minus05
minus1
minus10
10
20
30
40
500
1
05
0
minus05
minus1
minus10
10
20
30
40
500
1
05
0
minus05
minus1
minus10
10
20
30
40
500
1
05
0
minus05
minus1
minus10
10
20
30
40
500
1
05
0
minus05
minus1
minus10
10
20
30
40
500
1
05
0
minus05
minus1
minus10
10
20
30
40
500
1
05
0
minus05
minus1
minus10
10
20
30
40
500
1
05
0
minus05
minus1
minus10
10
20
30
40
500
1
05
0
minus05
minus1
minus10
10
20
30
40
500
1
05
0
minus05
minus1
minus10
10
20
30
40
500
1
05
0
minus05
minus1
minus10
10
20
30
40
500
1
05
0
minus05
minus1
minus10
10
20
30
40
500
1
05
0
minus05
minus1
minus10
10
20
30
40
500
1
05
0
minus05
minus1
minus10
10
20
30
40
500
1
05
0
minus05
minus1
minus10
10
20
30
40
500
1
05
0
minus05
minus1
minus10
10
20
30
40
500
1
05
0
minus05
minus1
minus10
10
20
30
40
500
1
05
0
minus05
minus05
minus1
minus10
10
20
30
40
500
1
05
0
minus1
minus10
10
20
30
40
500
1
05
0
minus05
minus1
Sub
urb
anU
rban
Sub
urb
anU
rban
Flo
ren
ceF
lore
nce
Liv
orn
oL
ivo
rno
Lo
g (r
elat
ive
risk
)L
og
(rel
ativ
e ri
sk)
Lo
g (r
elat
ive
risk
)L
og
(rel
ativ
e ri
sk)
UTCI ATsun ATsha ATind Tair
Tsun (∘C) lag0-1 Tair (∘C) lag0-1Tsha (∘C) lag0-1 Tind (∘C) lag0-1Minimum UTCI (∘C) lag0-1 Minimum A Minimum A Minimum A Minimum A
Figure 3 Relationships between daily minimum thermal predictors (lag0-1) (∘C) and mortality of the very elderly (subjects ge75 years of age)
in an inland city (Florence) and coastal-plain city (Livorno) Relationships estimated by using urban and suburbanmeteorological data for theperiod 2006ndash2008 (MayndashOctober) UTCI Universal Thermal Climate Index ATsun apparent temperature assessed outdoors also taking thesolar radiation contribution into account ATsha apparent temperature assessed outdoors in the shade ATind apparent temperature assessedin indoor conditions 119879air environmental temperature Analyses were controlled for air pollution concentrations daylight hours year day ofthe week public holidays and summer population decrement
The Universal Thermal Climate Index (UTCI) is a com-prehensive model fitted to assess human thermal comfortin outdoor environments and represents the state-of-the-art of outdoor thermal comfort indices [16] UTCI is anequivalent temperature (∘C) based on the most recent scien-tific progress in human thermo-physiology biophysics andthe heat exchange theory [25] The UTCI represents theefforts of a group of over 45 scientists from 23 countriescollaborating together within the COST action 730 [16]The advanced multinode dynamic UTCI-Fiala mathematicalmodel of human temperature regulation forms the basis ofthe UTCI Furthermore the UTCI also includes a sophis-ticated clothing model that defines in detail the effectiveclothing insulation and vapor resistance values for each ofthe thermophysiological modelrsquos body segments over a widerange of climatic conditions A detailed description of theUTCI is reported in Jendritzky et al [16] In this study theUTCI was assessed by using the UTCI software code ldquoversion
a 0002rdquo freely available online (httpwwwutciorg)Currently UTCI software uses a fixed value of metabolic rateand depending on air temperature also clothing insulationThe input parameters for the assessment of the UTCI thatrefers to a person walking at 4 kmhminus1 and generating135Wmminus2 are 119879air (
∘C) 119890 (hPa) 11988110 (m sminus1) and the meanradiant temperature (119879mrt
∘C)The estimation of the119879mrt wascarried out separately by using the RayMan software version20 [26] One of the aims of the RayMan model is to calculateshort- and long-wave radiation flux densities absorbed bypeople that can be transferred into a synthetic parameter thatis 119879mrt defined as the uniform temperature of a hypotheticalspherical surface surrounding a human (emissivity 120576 = 1)whichwould result in the same net radiation energy exchangewith the subject as the actual complex radiative environment[26]
6 The Scientific World Journal
Table 1 Descriptive statistics for daily all-cause mortality of the very elderly (subjects ge75 years of age) air pollution and meteorologicalparameters measured in urban and suburban areas of Florence and Livorno during the warmest period of the year (MayndashOctober) from 2006to 2008 Mean standard deviation (SD) and 10th 75th and 90th percentiles are shown
Variables Unit Inland plain city Florence Coastal plain city LivornoMean (plusmnSD) 10th 75th 90th Mean (plusmnSD) 10th 75th 90th
Mortality age ge75 years N 70 (plusmn27) 4 9 11 35 (plusmn20) 1 5 6Air pollution
SO2 120583gmminus3 16 (plusmn08) 08 19 26 43 (plusmn39) 07 60 95NO2 120583gmminus3 381 (plusmn119) 235 454 528 315 (plusmn72) 234 352 401CO 120583gmminus3 06 (plusmn02) 04 07 08 05 (plusmn01) 04 06 07O3 120583gmminus3 701 (plusmn204) 429 833 957 760 (plusmn180) 521 879 994PM10 120583gmminus3 306 (plusmn113) 186 353 434 277 (plusmn79) 194 312 374
MeteorologyUrban119879air
∘C 206 (plusmn38) 156 239 257 204 (plusmn33) 161 232 247RH 401 (plusmn133) 246 482 572 500 (plusmn126) 319 584 64511988110 msminus1 17 (plusmn07) 09 19 22 20 (plusmn06) 11 23 29119879mrt
∘C 211 (plusmn59) 127 257 281 212 (plusmn51) 138 251 269Suburban119879air
∘C 219 (plusmn42) 164 255 278 226 (plusmn36) 179 254 273RH 424 (plusmn132) 258 500 596 611 (plusmn166) 394 724 84111988110 msminus1 31 (plusmn07) 22 35 39 55 (plusmn25) 35 58 83119879mrt
∘C 225 (plusmn63) 136 273 300 232 (plusmn52) 160 269 291119879air environmental temperature RH relative humidity 11988110 10m high horizontal wind speed 119879mrt mean radiant temperature
24 Statistical Analyses A preliminary descriptive analysiswas carried out of the characteristics of the daily mortality3air pollution and main meteorological variables recordedin the two cities by urban and suburban weather stationsduring the warmest period of the year (MayndashOctober) In thefollowing a detailed description of daily summaries (daily4averagemaximum andminimum) of thermal indices and airtemperature indicators (defined as thermal indicators) wasprovided for both urban and suburban areas of the inland andcoastal cities
The analyses were organized in two main sections (1)correlation analyses between the UTCI (rational index)versus direct indices and air temperature variables assessed5and measured by using urban and suburban meteorologicalstations (2) investigation of relationships between dailymortality and the set of independent predictors representedby biometeorological (rational and direct indices) and mete-orological (air temperature) indicators
The first section of the study included linear regressionanalyses of daily average maximum and minimum UTCIin order to select direct daily biometeorological indices andair temperature variables Statistical characteristics of therelationships were shown as slope coefficients of regressionsand their relative 119877-squared ()
The second sectionwas investigated through a time-seriesapproach by using generalized additive models (GAMs) [27]The GAM approach is useful for detecting the temporalmodification of heat-related mortality based on differentthermal indicators GAMs are very flexible tools that allow
for applying a wide variety of link functions on the depen-dent variable for taking any non-linear (smooth) effects ofpredictor variables into account A Poisson link assumptionwas used in this study
The GAM procedure was performed using 119877 softwareversion 2153 [28] and specifically the ldquomgcvrdquo package [29]GAM procedures were systematically used throughout theentire warmest period of the year to estimate the smoothedshape of exposure-response curves between total mortal-ity and short-term changes of the set of daily averagemaximum and minimum independent biometeorologicalindices (UTCI ATsun ATsha and ATind) and air temperature(119879air) variables measured by using urban and suburbanmeteorological data On the whole 30 thermal indicatorswere identified for each city The short-term change wascalculated by averaging the daily biometeorological value orair temperature on a specific day together with the one 6calculated on the previous day (lag0-1)
GAM models were controlled for typical air pollutionconcentrations and calendar factor confounders such asdaylight hours (that represent a proxy parameter of theseason) year (to check for annual variation in mortality)day of the week public holidays and summer population 7decrement
The final model specification is based on the followingequation
ln (119864 (119884)) = 1205730 + 1205731 sdot 119883119905 + Σ119878119894 (119883119894) (5)
where 119864(119884) is the estimated daily death count 1205730 is theintercept of the regression 1205731 is the coefficient (slope) for the
The Scientific World Journal 7
Table 2 Descriptive statistics of daily thermal indices and air temperature indicators assessed and measured in urban and suburban areas ofFlorence and Livorno during the warmest period of the year (MayndashOctober) from 2006 to 2008 Mean standard deviation (SD) and 10th75th and 90th percentiles are shown
Daily thermal indices and airtemperature indicators (∘C)
Inland plain city Florence Coastal plain city LivornoMean (plusmnSD) 10th 75th 90th Mean (plusmnSD) 10th 75th 90th
UrbanAverage
UTCI 206 (plusmn43) 150 240 260 208 (plusmn39) 157 240 255ATsun 246 (plusmn53) 176 287 315 252 (plusmn51) 186 292 316ATsha 207 (plusmn45) 148 243 266 211 (plusmn42) 156 246 264ATind 213 (plusmn42) 158 244 267 217 (plusmn40) 165 250 267119879air 206 (plusmn38) 156 239 257 204 (plusmn33) 161 233 247
MinimumUTCI 137 (plusmn37) 90 165 181 146 (plusmn36) 101 173 188ATsun 182 (plusmn48) 117 218 239 193 (plusmn48) 131 230 251ATsha 160 (plusmn41) 105 191 211 171 (plusmn41) 118 202 220ATind 168 (plusmn39) 115 198 216 179 (plusmn39) 129 208 225119879air 158 (plusmn33) 113 183 200 167 (plusmn32) 125 191 207
MaximumUTCI 309 (plusmn51) 237 349 374 308 (plusmn42) 253 339 359ATsun 331 (plusmn62) 247 380 410 344 (plusmn59) 268 392 416ATsha 257 (plusmn52) 189 299 327 256 (plusmn45) 200 291 316ATind 259 (plusmn47) 197 297 321 259 (plusmn43) 207 294 315119879air 260 (plusmn47) 201 299 324 249 (plusmn37) 207 281 299
SuburbanAverage
UTCI 212 (plusmn51) 146 253 280 211 (plusmn58) 138 252 280ATsun 259 (plusmn60) 181 305 337 277 (plusmn68) 192 325 360ATsha 220 (plusmn51) 154 260 289 234 (plusmn56) 164 276 303ATind 230 (plusmn47) 169 267 293 256 (plusmn52) 189 293 321119879air 219 (plusmn42) 164 255 278 226 (plusmn36) 179 254 273
MinimumUTCI 138 (plusmn45) 82 172 194 148 (plusmn66) 66 196 226ATsun 192 (plusmn53) 121 232 260 223 (plusmn68) 138 270 301ATsha 168 (plusmn47) 107 203 228 196 (plusmn58) 123 237 268ATind 181 (plusmn44) 124 213 239 224 (plusmn52) 156 259 290119879air 166 (plusmn37) 117 193 214 198 (plusmn38) 147 228 248
MaximumUTCI 307 (plusmn60) 224 353 379 285 (plusmn54) 216 324 347ATsun 335 (plusmn68) 241 387 419 343 (plusmn72) 248 398 432ATsha 268 (plusmn57) 193 315 343 270 (plusmn54) 200 309 337ATind 276 (plusmn53) 207 319 346 284 (plusmn52) 216 324 349119879air 274 (plusmn51) 206 315 340 251 (plusmn35) 206 277 299
UTCI UniversalThermal Climate Index ATsun apparent temperature assessed outdoors also taking into consideration the solar radiation contribution ATshaapparent temperature assessed outdoors in the shade ATind apparent temperature assessed in indoor conditions 119879air environmental temperature
thermal indicator (119883119905) 119878119894(119883119894) denotes the smooth functionsfor the covariates (continuous daylight hours and air pollu-tants categorical year day of the week public holidays andsummer population decrement)
Finally in order to focus on the relationship betweenheat and mortality the expected change of death dueto a 1∘C increase in air temperature (or thermal indextemperature) was assessed by selecting the upper 25 (75thpercentile) of data based on each thermal indicator The
8 The Scientific World Journal
Table 3 Correlation analyses between daily average minimum and maximum UTCI versus direct thermal indices and air temperatureindicators in urban and suburban areas of Florence and Livorno during the warmest period of the year (MayndashOctober) from 2006 to 2008
Daily thermal indicesand air temperatureindicators
Inland plain city Florence Coastal plain city Livorno Mean values fromall stations
Urban(missing data = 0)
Suburban(missing data = 04)
Urban(missing data = 0)
Suburban(missing data = 0) Slope 1198772 ()
Slope 1198772 () Slope 1198772 () Slope 1198772 () Slope 1198772 ()Average
ATsun 1193 9622 1121 9685 1284 9641 1114 9651 1178 9650ATsha 1029 9627 0971 9676 1073 9610 0926 9671 1000 9646ATind 0949 9500 0891 9461 1008 9480 0821 8895 0917 9334119879air 0865 9607 0796 9482 0827 9462 0562 8724 0763 9319
MinimumATsun 1280 9732 1160 9526 1293 9743 0992 9621 1192 9656ATsha 1113 9741 1014 9482 1138 9799 0848 9646 1028 9667ATind 1038 9607 0935 9050 1070 9611 0711 8353 0939 9155119879air 0866 9350 0764 8795 0854 9260 0502 7927 0747 8833
MaximumATsun 1110 9361 1050 9403 1263 9180 1176 8951 1150 9224ATsha 0951 9106 0909 9249 0960 8596 0869 8311 0922 8816ATind 0863 8977 0830 9059 0891 8415 0792 7615 0844 8517119879air 0881 9358 0824 9359 0801 8770 0549 7663 0764 8788
UTCI UniversalThermal Climate Index ATsun apparent temperature assessed outdoors also taking into consideration the solar radiation contribution ATshaapparent temperature assessed outdoors in the shade ATind apparent temperature assessed in indoor conditions 119879air environmental temperature
selection of the 75th percentile was based on an empiricalassessment inmodel fittings where overall daily death countsgenerally showed a monotonic increase as thermal indicatorsincreased
25 Model Selection Akaike Information Criterion (AIC)[30] was applied to the entire warmest period for the model-fitting criteria AIC represents one of the most reliable meth-ods for comparing different models taking both descriptiveaccuracy and parsimony into account [31] AIC has beenwidely applied in many statistical fields or research includingtime series model selection [32]
The AIC is defined as [33]
AIC119894 = minus2 log 119871 119894 + 2119881119894 (6)
where 119871 119894 represents the maximum likelihood for a candidatemodel 119894 and is determined by adjusting the119881119894 free parametersin such a way as to maximize the probability of the candidatemodel generating the observed data [31]
Given a set of candidate models for the data it is wellknown that the preferredmodel is the one with theminimumAIC value which is the model with the lowest expectedinformation loss
However because from a statistical point of view it isdifficult to understand the importance of the AIC differenceΔ 119894(AIC) between the best model (that is the model withthe lowest AIC value) for example and the next-best model(the second lowest AIC value) the AIC values obtained foreach candidate model in this study have been transformed to
the so-called Akaike weights 119908119894 (AIC) [33] For this reasonall the AIC differences with respect to the AIC of the bestcandidate model were calculated as follows
Δ 119894 (AIC) = AIC119894 minusmin (AIC) (7)
In the following the Akaike weights were assessed bydividing the relative likelihood of a model 119894 by the sum of thelikelihoods of all models 119896 as per the following equation
119908119894 (AIC) =exp minus (12) Δ 119894 (AIC)sum119870119896=1 exp minus (12) Δ 119896 (AIC)
(8)
In this way the119908119894 (AIC) can be interpreted as the probabilitythat a hypothetical model is the best predictive model amongthe set of candidate models The best model is the onethat minimizes the Kullback-Leibler discrepancy which isa measure of the distance between the probability densitygenerated by the model and reality [31]
Akaike weights quantify conclusions based on AIC anal-yses and provide a straightforward interpretation of the AICmodel comparison analysis
3 Results
31 Descriptive Statistics of Mortality Air Pollution andMeteorologicalBiometeorological Data The characteristicsof daily all-cause mortality of people aged ge75 years meanair pollution concentrations and meteorological variablesrecorded during the warmest period of the year (from Mayto October) are illustrated in Table 1
The Scientific World Journal 9
Table 4 Summary of predictive model fits and expected change in deaths due to a 1∘C increase in the thermal predictor over the 75thpercentile based on each thermal indicator lowast119875 lt 005 lowastlowast119875 lt 001
Inland plain city Florence Coastal plain city LivornoIndicators AIC 119908119894 (AIC) change Indicators AIC 119908119894 (AIC) changeAve urb ATsun 6633 048 56 (05 107)lowast Min urb ATsha 5877 058 103 (40 166)lowastlowast
Ave urb ATsha 6651 019 48 (minus11 107) Ave sub ATind 5897 021 47 (02 92)lowast
Max urb UTCI 6662 011 49 (minus10 108) Min urb ATsun 5917 008 68 (17 119)lowastlowast
Min urb ATsun 6672 007 61 (12 110)lowast Min sub ATind 5917 008 48 (07 89)lowast
Min sub ATsun 6679 005 38 (minus03 79) Max sub ATind 5947 002 45 (minus04 94)Min urb UTCI 6682 004 92 (21 163)lowast Ave sub ATsun 5960 001 33 (minus04 7)Ave urb 119879air 6692 003 38 (minus38 114) Ave sub ATsha 5965 001 47 (01 94)lowast
Max urb ATind 6710 001 27 (minus28 82) Min sub ATsun 5975 000 41 (08 74)lowast
Max sub UTCI 6715 001 43 (minus06 92) Max sub UTCI 5990 000 65 (14 116)lowast
Min urb ATind 6727 000 80 (19 141)lowast Min urb ATind 6002 000 96 (33 159)lowastlowast
Max urb 119879air 6732 000 13 (minus48 74) Min sub UTCI 6024 000 49 (08 90)lowast
Max sub 119879air 6735 000 23 (minus32 78) Max sub ATsun 6034 000 26 (minus11 63)Ave sub 119879air 6740 000 15 (minus54 84) Ave urb ATind 6044 000 85 (14 156)lowast
Max urb ATsha 6748 000 32 (minus21 85) Min sub ATsha 6049 000 47 (06 88)lowast
Ave sub ATind 6757 000 40 (minus11 91) Max sub ATsha 6056 000 36 (minus13 85)Max sub ATsha 6761 000 44 (minus05 93) Min urb UTCI 6067 000 117 (41 193)lowastlowast
Max urb ATsun 6764 000 28 (minus19 75) Ave sub 119879air 6077 000 84 (01 168)lowast
Min sub UTCI 6779 000 32 (minus19 83) Max urb ATind 6091 000 117 (39 195)lowastlowast
Min sub ATsha 6784 000 53 (04 102)lowast Ave sub UTCI 6138 000 55 (10 100)lowast
Ave sub UTCI 6793 000 33 (minus22 88) Ave urb UTCI 6176 000 113 (27 199)lowastlowast
Min urb 119879air 6798 000 102 (15 167)lowast Min urb 119879air 6178 000 92 (04 180)lowast
Ave sub ATsha 6800 000 30 (minus19 79) Ave urb ATsha 6206 000 64 (minus05 133)Ave sub ATsun 6804 000 37 (minus04 78) Min sub 119879air 6213 000 72 (minus04 148)Min urb ATsha 6809 000 75 (16 134)lowast Ave urb ATsun 6218 000 65 (10 120)lowast
Max sub ATsun 6818 000 43 (02 84)lowast Max urb ATsun 6227 000 62 (07 117)lowast
Max sub ATind 6850 000 44 (minus05 93) Max sub 119879air 6232 000 28 (minus43 99)Ave urb UTCI 6918 000 56 (minus11 123) Ave urb 119879air 6314 000 102 (08 196)lowast
Min sub 119879air 7023 000 71 (06 136)lowast Max urb UTCI 6392 000 93 (11 175)lowast
Min sub ATind 7048 000 53 (02 104)lowast Max urb 119879air 6415 000 48 (minus36 132)Ave urb ATind 7138 000 45 (minus10 100) Max urb ATsha 6421 000 72 (03 141)lowast
AIC Akaikersquos Information Criterion 119908119894 (AIC) Akaike weights Max maximum Min minimum Ave average urb urban sub suburban UTCI UniversalThermal Climate Index ATsun apparent temperature assessed outdoors also taking into consideration the solar radiation contribution ATsha apparenttemperature assessed outdoors in the shade ATind apparent temperature assessed in indoor conditions 119879air environmental temperature
Nonaccidental mortality data of the very elderly in theinland city was about twice as high as in the coastal city Aver-age NO2 PM10 and CO concentrations were significantlyhigher in the inland plain city than in the coastal one On theother hand the average O3 and especially SO2 showed thehighest values in Livorno (Table 1)
Both the inland and coastal cities showed higher dailymean 119879air in the suburbs than in the urban areas Moreoverthe 119879air in the urban area of the inland plain city wasslightly higher than the 119879air in the coastal city Converselythe opposite situation was observed when the suburbs wereconsidered The 119879air range over the warmest period of theyear (differences between 90th and 10th percentiles of 119879airdata) was not as wide in urban areas and coastal city as in thesuburbs and inland city As expected mean RH and 11988110 werealways higher in the coastal city than in the inland one with
the highest values in the suburbsThemean119879mrt was lower inthe urban than suburban areas with the highest mean valueson the coast Moreover both inland and coastal cities showedwider 119879mrt ranges than 119879air ranges (Table 1)
Thermal indices and air temperature indicators in thecoastal city generally showed higher mean values than inthe inland city with several exceptions especially whendaily maximum values in both urban and suburban areas(Table 2) were taken into account More specifically whenthe maximum 119879air was considered the lowest values wereobserved in the coastal city
The daily mean average minimum and maximum ther-mal indicators measured in urban areas generally showedlower values than in the suburbs with the only exception forthe daily maximum UTCI in both cities and the maximum
10 The Scientific World Journal
ATsun in the coastal city which recorded the opposite situa-tion Furthermore thermal indicators in the suburbs of bothFlorence and Livorno always showed wider thermal ranges(differences between 90th and 10th percentiles of data) thanthose observed in urban areas (Table 2)
The ATsun always disclosed the highest daily averageminimum andmaximumvalues among all indicatorsOn theother hand UTCI and 119879air often evidenced the lowest dailymean average and minimum values The ATsha which alsotakes into consideration the cooling effect of wind alwaysshowed the lowest values among the direct indices Whendaily maximum values were considered both ATsun andUTCI revealed the highest values when compared with theother indicators thanks to the solar radiation contribution(Table 2)
32 Rational Index (UTCI) versus Direct Indices and AirTemperature Variables The comparison between daily aver-age minimum and maximum UTCI and direct bivari-atemultivariate indices or air temperatures (Table 3) revealedthat both ATsun and ATsha showed the highest correlationcoefficients in both urban and suburban areas of the inlandand coastal cities On the other hand both ATind and 119879airshowed the lowest 1198772 coefficients8
Generally ATsun andATsha revealed that were the highestmean correlations when daily minimum values were consid-ered slightly higher than the correlations when daily averagevalues were used An opposite situation was observed whenATind and 119879air were considered whereas daily maximumvalues always showed the lowest correlation coefficients
When daily average indicator values were consideredthere was a progressive decrease of the mean 1198772 coefficients(averaged from all stations) with the highest values observedfor ATsun (9650) followed by ATsha (9646) ATind(9334) and 119879air (9319) (Table 3) When daily minimumvalues were considered the highest mean 1198772 coefficient wasobserved for ATsha (9667) slightly higher than the ATsun(9656) value When daily maximums were considered 119879airoften showed a better fit than ATind and ATsha However 119879airalways showed theworstmean slope coefficients of regressionlines with the lowest values (from 050 to 056) observed inthe suburb of the coastal city (Table 3) This indicates thatUTCI and 119879air change at different rates within various rangesof ambient conditions especially in suburban areas
Conversely the best mean slope coefficients were alwaysobserved when ATsun was considered mean slope 100103 and 092 for average minimum and maximum valuesrespectively
33 Relationships betweenMortality and the Set of Biometeoro-logical Indices and Air Temperature Indicators The smooth-ing plots of short-term exposure-response curves during thewarmest period of the year (MayndashOctober) clearly illustratethe relationships between mortality and the set of inde-pendent biometeorological (rational and direct indices) andmeteorological (119879air) indicators The results are reported inFigures 1 2 and 3 for the average maximum and minimumvalues respectively The ldquoU-shapedrdquo relationships between
short-term effects (lag0-1) of each daily average (Figure 1)maximum (Figure 2) and minimum (Figure 3) thermalindicator and mortality were identified in both urban andsuburban areas of the inland plain city Conversely prevalentldquoJ-shapedrdquo relationships were identified in the coastal city Inthis case steeper right-hand slope curves (heat effects) wereobserved which also reached higher relative risks than theinland city
When the same geographical location was consideredsimilar exposure-response curves between total mortalityand different thermal indicators were usually observed evenif the range of indicators varied depending on specific indica-tor characteristics No substantial differences were observedin the curves between urban and suburban areas in the inlandcity (Figures 1 2 and 3) On the other hand different patternswere found between the urban and suburban curves in thecoastal city steeper right-hand slope curves were observedin the urban area (Figures 1 2 and 3)
The urban daily average ATsun was selected as the bestpredictive model for the inland plain cityThis model showeda high probability (almost 50) of being the best modelamong the set of 30 candidatemodels (Table 4) Furthermorea significant expected change in deaths (56 CI 05ndash107119875 lt 005) was evidenced In addition other models suchas the urban daily average ATsha and maximum UTCI andthe urban and suburban minimum ATsun also showed goodmodel-fits displaying119908119894(AIC) superior to 5 However onlythe urban daily minimum ATsun still confirmed a significantexpected change of death (61 CI 12ndash110 119875 lt 005)(Table 4) whereas less model-fits often included the ATind
The urban daily minimum ATsha was selected as thebest predictive model for the coastal city (Table 4) In thiscase the probability that this model was the best among allcandidate models was almost 60 A very high significantexpected change in deaths was also observed (103 CI40ndash166 119875 lt 001) Furthermore an elevated probability(21) of being the second best model among the otherswas associated with the suburban daily average ATind evenconfirming a significant change in deaths (Table 4) Inaddition the urban minimumATsun and the suburban ATindalso revealed good model-fits showing 119908119894 (AIC) of 8 Lesspredictive model-fits prevalently included daily maximumthermal indicators
4 Discussion
This research provides a substantial contribution to previousstudies referred to in identifying the most effective ther-malair temperature predictor of heat-related mortality indifferent geographical contexts
A large amount of environmental epidemiological studiescarried out worldwide over recent decades applied differentthermal indicators by using a predefined relation of changeddaily temporal summaries (daily average maximum or min-imum values) which further complicated the explanationsand comparisons of the results
Most of studies generally used single meteorologicalparameters in particular air temperature or simple mainly
The Scientific World Journal 11
two-parameter direct indices [3 6ndash11] as environmentalpredictors of mortality Moreover recent progress in thefield of outdoor thermal comfort assessment led to thedevelopment of the UTCI [16] which represents a universalsolution to the problem of characterizing the human thermalenvironment based on the most advanced multinode modelof human thermoregulation coupled with a state-of-the-artclothing model However at the present time no consistentinformation is available regarding the smoothed shape ofexposure-response curves between mortality and differentbiometeorological (direct and rational indices) and air tem-perature indicators
Currently what is clearly known and generally recognizedis the short-term impact of heat onmortality with the greatesteffect on the elderly [9] In a recent study carried out inthe same geographical context as this study the authors alsoevidenced a greater short-term impact of heat on the veryelderly population (people aged ge75) [3] This is the reasonwhy this study directly focused on the very elderly
The main findings of this study can be summarized asfollows
(i) Simple direct four- and three-parameter indices(ATsun and ATsha) showed the highest correlationswith UTCI Conversely the direct two-parameterindex (ATind) and the single meteorological param-eter (119879air) showed the lowest correlations
(ii) ldquoU-rdquo and ldquoJ-shapedrdquo relationships between short-term effects of each daily thermal indicator and mor-tality were identified in the inland and coastal plaincities respectively Furthermore when the same geo-graphical location was considered similar exposure-response curves were observed between total mortal-ity and different thermal indicators in both urban andsuburban areas of the inland plain city On the otherhand steeper right-hand slope curves (heat effects)were observed in the urban area of the coastal citythan in the suburban ones
(iii) Urban daily average ATsun and minimum ATshashowed the lowest AIC values and the highest proba-bility (almost 50 for the average ATsun and 60 forthe minimum ATsha) of being the best model amongthe set of 30 candidate models For these reasonsthese thermal indicators were selected as the bestpredictors of heat-related all-cause mortality in thevery elderly for the inland (urban daily averageATsun)and coastal (urban daily minimum ATsha) cities alsorevealing significant expected change of death dueto a 1∘C increase above the 75th percentile On theother hand less predictive model-fits often includedthe ATind for the inland city and prevalently involveddaily maximum indicators for the coastal city
41 UTCI versus Direct Indices and Air Temperature VariablesAs expected simple direct indices which also consider theextra effect of wind and solar radiation in addition to relativehumidity and air temperature formeasuring thermal comfortshowed the highest correlations with UTCI In a recent
study [12] the authors also found a significant better fit ofthree-parameter AT (the version which also accounts forthe extra effect of wind speed called ATsha in this study)with UTCI than other simple two-parameter indices suchas the Heat Index the Humidex or the Wet-Bulb GlobeTemperature In particular the authors observed a correlationcoefficient of 9535 slightly lower than the mean valuesof 9646 and 9667 highlighted in this study when dailyaverage and minimum values were considered respectivelyHowever it was also higher than the correlation coefficientof 8816 found in this study when daily maximum valueswere used Blazejczyk et al [12] also evidenced a lowerslope coefficient 0716 than the very good ones detectedin this study 1000 1028 and 0922 when mean averageminimum and maximum values were taken into accountThis probably depends on the different dataset characteristicsof the meteorological variables used in both studies Thecorrelation and slope coefficients between simple direct two-parameter indices (Heat Index Humidex or Wet-Bulb GlobeTemperature) and UTCI found in the Blazejczyk et al [12]study were lower than those observed in this study probablydue to the fact that the thermal indices used required a morerestrictive air temperature range of application (calculated forair temperaturegt20∘C) than in this study inwhich the simpledirect two-parameter index used (ATind) was applicable overa wide range of temperatures (no temperature restrictionswere considered)
In conclusion the authors also reported that directindices (ie AT) are less correlated with UTCI than indicesderived from various human heat budget models suchas the Perceived Temperature the Physiological EquivalentTemperature or the Standard Effective Temperature One ofthe possible reasons for the noncompliance is the lack ofthe radiation factor in the equations [12] However theseauthors did not apply the four-parameter AT version [24]which also includes the extra effect of solar radiation (ATsun)The ATsun revealed the best relationships with UTCI amongthe thermal indicators considered when daily average andmaximum values were used in this study
The reason behind the higher correlation coefficient ofthe direct three- and four-parameter indices with UTCIrecorded in this study compared to other more simple directtwo-parameter indices or the individual air temperature isonly due to the inclusion of the extra effect of wind speedin ATsha and the global radiation in ATsun The inclusionof these parameters in the thermal comfort assessmentallows a better and more complete representation of thethermal environment as considered when using UTCI Thisis also confirmed by the fact that when maximum thermalindices and air temperature indicators were compared withUTCI the ATsun which also considers the radiant solarcontribution for outdoor thermal comfort evaluation wasthe only indicator to show a high correlation coefficientvalue gt90 Conversely when daily minimum values wereconsidered the solar radiation contribution assumed lessimportance and both ATsun and ATsha showed similar highcorrelations with UTCI Furthermore in these conditionssimple two-parameter indices such as ATind also showedhigh correlation coefficients with UTCI (over 90)
12 The Scientific World Journal
42 Exposure-Response Curves between Mortality and eachThermal Indicator Both cities showed two well-knownshaped short-term relationships between different thermalindicators and mortality of the very elderly (aged ge75)already evidenced in many previous studies [3 34 35] Inthis study these relationships were studied over a widerldquowarmrdquo period (from May to October) than that generallyconsidered in previous studies (from June to August) todetect the association between heat and mortality Thereason for this choice was that the area studied is oftensubjected to ldquoanomalousrdquo heat stress conditions that can alsooccur earlier during the averagelate spring months (such asMayJune) or later during the earlyaverage autumn months(SeptemberOctober) By way of example during May of2007 and May and September of 2008 the inland plain cityalso experienced several days with very high (for the period)maximum air temperatures close to or slightly higher than27∘C It is known that an equivalent high daily temperaturecould be more dangerous in May when people are not stillacclimatized to the heat than in August because very hightemperatures are unusual that early in the season [36]
Exposure-response curves between total mortality anddifferent thermal indicators clearly showed different shapesat a regional scale with stepper right-hand slope curves (heateffects on mortality) in the milder coastal plain city Thesepatterns were already evidenced in a previous study [3] andthe authors concluded that a population living at the coastis more susceptible to the heat and less adaptable to suddentemperature changes and heat extremes This is because thecoastal city generally shows reduced daily temperature rangesand lower temperature variations during the warmest periodof the year than the inland city
As already reported in a previous Korean study [15]similar exposure response curves between all-causemortalityand a simple daily mean maximum and minimum directindex (the ATind) and 119879air were observed in two differentKorean cities (one inland and one seashore cities) This is inagreement with our study where the curves obtained withdifferent indicators had similar shapes However the Koreanstudy also showed different curves when another rationalindex (the Perceived Temperature) was used as an indicatorThis situation has not been confirmed in this study where amore advanced rational index (UTCI) was applied
Our study also showed that all thermal rational and directindices assessed and the air temperature measured by usingmeteorological data recorded by weather stations locatedin urban and suburban areas might have heterogeneousrelationships with mortality in the coastal city In anotherItalian study [37] which evaluated the association betweenmortality and heat measured by using airport and city-centretemperatures the authors found that in two cities (Romeand Turin) the exposure values were very similar while inanother city (Milan) the AT differed greatly between stationsTherefore it is also plausible to expect dissimilar heat-relatedmortality results when different sources of meteorologicaldata are used in epidemiological environmental studies Forthis reason studies assessing the potential impact of heaton mortality need to take different environmental exposurecontexts into account that ismeteorological data recorded by
urban or suburban weather stations in order to ensure moreaccurate estimates of health effects on the population
43The Selection of the BestThermal Indicator of Heat-RelatedMortality in Different Geographical Areas At the presenttime only a few recent studies have tried to investigate theeffect of various thermal indictors on mortality data [14 1517ndash19] in the aim of selecting the best predictor of mortalityCurrently great uncertainty surrounds the establishing of themost appropriate thermal indicator as well as the daily tem-poral characteristic (daily average maximum or minimumvalues) for best fitting the thermal impact on mortality
A previous study carried out in US cities [17] and twoin Australian cities [18 19] found that no single temperaturemeasure was superior to the others One reason advancedby several authors [17] was the high correlation amongdifferent thermal indicators showing the same predictiveability However these studies only used individual meteoro-logical parameters or simple direct two- or three-parameterindices as potential indicators of mortality Furthermore theanalyses were not controlled for air pollution in theAmericanstudy while the Australian studies controlled for PM10 NO2and O3 In another study carried out in two Korean cities[15] the authors investigated the effect on mortality alsocontrolled for PM10 and O3 by using a rational indexthe Perceived Temperature based on a human heat budgetmodel compared with other simple direct indices or airtemperature indicators The authors found that in terms ofmodel fitting by AIC for one city (Seoul) the dailymaximumPerceived Temperature was the best predictor for the all-cause mortality risk The interpretation of the authors isthat because the city of Seoul is located near the sea thePerceived Temperature which also includes the humidityeffect was a better indicator of excess mortality than the airtemperature This is also confirmed by the fact that the twoother bestmodel indicators found for Seoul always accountedfor the humidity effect (daily mean Perceived Temperatureand minimum AT) Conversely the worst indicator of totalmortality included the dailymaximumair temperatureHow-ever because different results were also observed for anothercity the authors concluded that the rational and direct indicesused in the study do not always act as the best predictorsfor the assessment of heat-related mortality [15] In a morerecent study [14] conducted in Taiwan the authors identifiedthe apparent temperature index assessed in the form ofa three-parameter AT index as the most optimal high-temperature index associated with all-cause mortality TheAT was selected as the best model from among eight high-temperature indices including three single air temperaturemeasurements (average maximum and minimum) and fivedifferent simple direct indices
In this study our findings partially confirm several resultsof the Korean study and are in firm agreement with the Linet al [14] ) conclusion Indeed direct multivariate indices(ATsun and ATsha) which also account for the extra effect ofwind speed andor solar radiation as well as the combinedcontribution of humidity and air temperature were selectedas the best predictors for all-cause very-elderly mortality risk
The Scientific World Journal 13
in the inland plain city (daily average ATsun) and the coastal9city (daily minimum ATsha) In particular the probability ofbeing the best predictive model among the other candidatemodels considered in this study was nearly (in the inlandplain city) or above (in the coastal plain city) 50
However the UTCI was never identified as the bestthermal predictor of all-cause very-elderly mortality in thisstudy This is probably due to the specific characteristicsof UTCI which includes a complex multinode model ofthermoregulation coupled with a clothing model that deter-mines strong thermal sensitivity greatly influenced by theimmediate surroundings For this reason the UTCI naturallyrepresents the best approach for exhaustive thermal comfortstudies However it also requires accurate micrometeoro-logical measurements of a specific location and subjectiveinformation (clothing thermal and physical activity char-acteristics) which is not generalized for epidemiologicalstudies over wide geographical areas (such as cities) wheregreat uncontrolled variability and different types of humanbehavior exist For this reason simplified approaches forthermal comfort assessment for awide set of people have beenpreferred
However although the use of direct multivariate (four-or three-parameter) indices revealed the best fitting withall-cause very-elderly mortality attributable to heat stressdifferent multivariate index indicators were identified in bothcities For example the urban average ATsun identified as thebest predictive model for the inland plain city also showeda poor predictive power for the coastal city The same wasalso observed for the best indicator identified for the coastalcity Consequently our findings suggest the use of directmultivariate indices as indicators naturally recommendedfor epidemiological heat-related mortality studies especiallywhen the very elderly are considered however the choiceof the most appropriate multivariate thermal index shouldbe based on the geographical characteristics of the placeinvestigated and the data available In the inland plain citythe use of a full direct index is suggested which also accountsfor the extra solar radiation contribution besides the othermeteorological effects In other terms because the extra effectof wind speed and relative humidity is more prevalent in acoastal city than in an inland city the use of three- (119879air RHand11988110) or also direct two-parameter (119879air and RH) indices issufficient for obtaining an effective prediction of heat-relatedmortality
Furthermore this study also showed that thermal indicesmeasured by an urban meteorological station in both citieshad a greater relationship with heat-related mortality thanthermal indicesmeasured by a suburban station even thoughno real break exists between urban and suburban areasHowever it was not possible to identify an unequivocal dailytemporal characteristic (daily average maximum or mini-mum values) of thermal index measurements for both citiesIndeed daily average andminimum thermal index indicatorswere identified as the best models in the inland and coastalcities respectively Several researchers [38] reported that theuse of the daily average temperature as an exposure indicatorof thermal conditions taking the whole day and night intoaccount generally provides more easily interpreted results
within a policy context In another study [39] the authorsalso found a close association of the minimum temperaturewith heat effects The impact might also be the strongestwhen the very elderly are considered when heat discomfortconditions also persist during night-time hours when thebody generally requires physiological rest and when renaltubular conservation of sodium and water diminishes duringperiods of dehydration all of which represent aggravatingfactors for health especially in the ldquoelderly frailrdquo with asignificant increase in the mortality risk Conversely dailymaximum indicators represent the worst model-fits in thecoastal city This is probably due to the fact that cities on thecoast generally have reduced daily temperature ranges andless frequent daily ldquoextremesrdquo than inland cities
44 Strengths and Limitations This study has severalstrengths Firstly the newly developed UTCI whichrepresents the state-of-the-art of outdoor thermal comfortassessment has been included together with other thermalindices as a potential predictor of heat-related mortalitySecondly an accurate model selection was carried out byusing the Akaike weight scheme which is a useful tool forsupplementing the basic results obtained with the AICmodelcomparison analysis [31] The analyses were controlled forthe main air pollution concentrations as confounding effectsPrevious studies reported differences between models withand without the adjustment of air pollution especially in thecase of extremely hot days and vulnerable groups [40 41]
Some limitations should also be pointed out Since theidentification of the best thermal predictor of heat-relatedmortality was only investigated in two cities in this study theresults cannot be applied to other countries andor climatesIndeed the interaction between weather and human healthis mediated by socioeconomical and cultural (ie clothingand diet) factors besides adaptation of the population tothe local climate However it should also be noted that thetwo cities considered in this study had two clearly differentclimate conditions In a recent study [42] the authors showedhow elderly patients who are living alone and also usingcommunity care services are two times more at heat-relatedhealth risk than other elderly people Living alone alsoassociated with critical health and low socioeconomic statuscan generally result in a significant increase in vulnerabilityto heat conditions Further improvements could be providedin heat-related health risk estimations by taking socio-economic conditions perceptions and cost factors of usingair-conditioning at home during the warmest period of theyear and cultural differences into consideration
In addition the analyses could also be extended todifferent mortality categories and age groups In this way itwould be possible to understand if different age andmortalitycategories are sensitive to different thermal indicators
5 Conclusion
This study showed how the use of direct multivariate indiceswhich also account for the extra effect of wind speed andorsolar radiation as well as the combined contribution of air
14 The Scientific World Journal
humidity and temperature revealed the best fitting withall-cause very-elderly mortality attributable to heat stressHowever different multivariate thermal index predictorswere identified in both inland and coastal plain citiesIn addition UTCI which represents the best performingindex in thermal comfort assessment was never identifiedas the best predictor of all-cause very-elderly mortality Itis hypothesized that simplified approaches for a generalthermal comfort assessment such as direct multivariatethermal indices are preferable for epidemiological purposesThe choice of the most appropriate multivariate thermalindex as a predictor of heat-related mortality should bebased on geographical characteristics and the availability dataregarding the area considered Further studies are needed toconfirm these resultsThe better understanding of the impactof different thermal indicators on mortality in differentgeographical contexts will provide relevant information fordeveloping efficient public health programs and heat-relatedhealth risk assessments This information could prove tobe very useful in developing preventive measures and forfunctional implementation to improve previous local publichealth emergency plans related to heat conditions
Abbreviations
UTCI Universal Thermal Climate IndexAIC Akaikersquos Information Criterion119908119894 (AIC) Akaike weightsAT Apparent temperatureATsun Apparent temperature assessed
outdoors also taking the solarradiation contribution intoconsideration
ATsha Apparent temperature assessedoutdoors in the shade
ATind Apparent temperature assessed inindoor conditions
119879air Environmental temperatureRH Relative humidity119890 Water vapor pressure11988110 10m high horizontal wind speedGR Global radiation
Acknowledgments
This study was supported and funded by the RegionalMeteoSalute Project Regional Health System of Tuscany andthe SmartHealthyENVProject ldquoSmartMonitoring IntegratedSystem for a Healthy Urban ENVironment in Smart CitiesrdquoPOR CReO FESR 20072013 The authors wish to thank DrPaolo Francesconi and Dr Francesco Profili of the AgenziaRegionale di Sanita della Toscana for providing health data
References
[1] R Basu ldquoHigh ambient temperature and mortality a reviewof epidemiologic studies from 2001 to 2008rdquo EnvironmentalHealth vol 8 no 1 article 40 2009
[2] S Hajat and T Kosatky ldquoHeat-related mortality a reviewand exploration of heterogeneityrdquo Journal of Epidemiology andCommunity Health vol 64 no 9 pp 753ndash760 2010
[3] M Morabito A Crisci M Moriondo et al ldquoAir temperature-related humanhealth outcomes current impact and estimationsof future risks in Central Italyrdquo Science of the Total Environmentvol 441 pp 28ndash40 2012
[4] A Tobias B Armstrong I Zuza A Gasparrini C Linares andJ Diaz ldquoMortality on extreme heat days using official thresholdsin Spain a multi-city time series analysisrdquo BMC Public Healthvol 12 no 1 article 133 2012
[5] WWu Y Xiao G Li et al ldquoTemperature-mortality relationshipin four subtropical Chinese cities a time-series study using adistributed lag non-linear modelrdquo Science of the Total Environ-ment vol 449 pp 355ndash362 2013
[6] M S Goldberg A Gasparrini B Armstrong and M-F ValoisldquoThe short-term influence of temperature on daily mortalityin the temperate climate of Montreal Canadardquo EnvironmentalResearch vol 111 no 6 pp 853ndash860 2011
[7] I Gomez-Acebo J Llorca P Rodrıguez-Cundın and TDierssen-Sotos ldquoExtreme temperatures and mortality in theNorth of Spainrdquo International Journal of Public Health vol 57pp 305ndash313 2012
[8] S P Almeida E Casimiro and J Calheiros ldquoEffects of apparenttemperature on dailymortality in Lisbon andOporto PortugalrdquoEnvironmental Health vol 9 no 1 article 12 2010
[9] M Morabito F Profili A Crisci P Francesconi G F Gensiniand S Orlandini ldquoHeat-related mortality in the Florentinearea (Italy) before and after the exceptional 2003 heat wavein Europe an improved public health responserdquo InternationalJournal of Biometeorology vol 56 pp 801ndash810 2012
[10] J Madrigano M A Mittleman A Baccarelli et al ldquoTemper-ature myocardial infarction and mortality effect modificationby individual- and area-level characteristicsrdquo Epidemiology vol24 pp 439ndash446 2013
[11] T I Sung P C Wu S C Lung C Y Lin M J Chen and H JSu ldquoRelationship between heat index and mortality of 6 majorcities in Taiwanrdquo Science of the Total Environment vol 442 pp275ndash281 2013
[12] K Blazejczyk Y Epstein G Jendritzky H Staiger and BTinz ldquoComparison of UTCI to selected thermal indicesrdquoInternational Journal of Biometeorology vol 56 no 3 pp 515ndash535 2012
[13] R G Steadman ldquoThe assessment of sultriness Part II effectsof wind extra radiation and barometric pressure on apparenttemperaturerdquo Journal of Applied Meteorology vol 18 no 7 pp874ndash885 1979
[14] Y-K Lin C-K Chang M-H Li Y-C Wu and Y-C WangldquoHigh-temperature indices associated with mortality and out-patient visits characterizing the association with elevated tem-peraturerdquo Science of the Total Environment vol 427-428 pp 41ndash49 2012
[15] Y M Kim S Kim H K Cheong and E H Kim ldquoComparisonof temperature indexes for the impact assessment of heatstress on heat-related mortalityrdquo Journal of Toxicology andEnvironmental Health vol 26 Article ID e2011009 2011
[16] G Jendritzky R de Dear and G Havenith ldquoUTCImdashWhyanother thermal indexrdquo International Journal of Biometeorol-ogy vol 56 no 3 pp 421ndash428 2012
[17] AG Barnett S Tong andA C A Clements ldquoWhatmeasure oftemperature is the best predictor of mortalityrdquo EnvironmentalResearch vol 110 no 6 pp 604ndash611 2010
The Scientific World Journal 15
[18] P Vaneckova G Neville V Tippett P Aitken G Fitzgeraldand S Tong ldquoDo biometeorological indices improve modelingoutcomes of heat-related mortalityrdquo Journal of Applied Meteo-rology and Climatology vol 50 no 6 pp 1165ndash1176 2011
[19] W Yu Y Guo X Ye et al ldquoThe effect of various temperatureindicators on different mortality categories in a subtropical cityof Brisbane Australiardquo Science of the Total Environment vol409 no 18 pp 3431ndash3437 2011
[20] D Nuvolone D Balzi M Chini D Scala F Giovanniniand A Barchielli ldquoShort-Term association between ambientair pollution and risk of hospitalization for acute myocardialinfarction results of the cardiovascular risk and air pollutionin Tuscany (RISCAT) studyrdquoAmerican Journal of Epidemiologyvol 174 no 1 pp 63ndash71 2011
[21] D Nuvolone D Balzi P Pepe et al ldquoOzone short-termexposure and acute coronary events a multicities study inTuscany (Italy)rdquo Environmental Research vol 126 pp 17ndash232013
[22] R G Steadman ldquoThe assessment of sultriness Part I Atemperature-humidity index based on human physiology andclothing sciencerdquo Journal of Applied Meteorology vol 18 no 7pp 861ndash873 1979
[23] R G Steadman ldquoA universal scale of apparent temperaturerdquoJournal of Climate amp Applied Meteorology vol 23 no 12 pp1674ndash1687 1984
[24] R G Steadman ldquoNorms of apparent temperature in AustraliardquoAustralianMeteorologicalMagazine vol 43 no 1 pp 1ndash16 1994
[25] P Brode K Blazejczyk D Fiala et al ldquoThe universal thermalclimate index UTCI compared to ergonomics standards forassessing the thermal environmentrdquo Industrial Health vol 51pp 16ndash24 2013
[26] A Matzarakis F Rutz and H Mayer ldquoModelling radiationfluxes in simple and complex environments basics of theRayMan modelrdquo International Journal of Biometeorology vol54 no 2 pp 131ndash139 2010
[27] T J Hastie and N J Tibshirani Generalized Additive Modelsvol 43 of Monographs on Statistics and Applied ProbabilityChapman amp Hall London UK 1990
[28] RDevelopmentCoreTeamRALanguage andEnvironment ForStatistical Computing R Foundation for Statistical ComputingVienna Austria 2011 httpwwwR-projectorg
[29] S N Wood Generalized Additive Models An IntroductionWithR Chapman amp HallCRC Boca Raton Fla USA 2006
[30] H Akaike ldquoInformation theory and an extension of themaximum likelihood principlerdquo in Proceedings of the 2ndInternational Symposium on Information Theory B N Petrovand F Caski Eds pp 267ndash281 Akademiai Kiado BudapestHungary 1973
[31] E-J Wagenmakers and S Farrell ldquoAIC model selection usingAkaike weightsrdquo Psychonomic Bulletin and Review vol 11 no 1pp 192ndash196 2004
[32] A D R McQuarrie and C L Tsai Regression and Time SeriesModel Selection World Scientific Singapore 1998
[33] H Akaike ldquoOn the likelihood of a time series modelrdquo TheStatistician vol 27 pp 217ndash235 1978
[34] A Ishigami S Hajat R S Kovats et al ldquoAn ecological time-series study of heat-related mortality in three European citiesrdquoEnvironmental Health vol 7 article 5 2008
[35] R Bustinza G Lebel P Gosselin D Belanger and F ChebanaldquoHealth impacts of the July 2010 heat wave in Quebec CanadardquoBMC Public Health vol 13 article 56 2013
[36] K Zhang R B Rood G Michailidis et al ldquoComparingexposure metrics for classifying ldquodangerous heatrdquo in heat waveand health warning systemsrdquo Environment International vol46 pp 23ndash29 2012
[37] F K Dersquodonato M Stafoggia M Rognoni et al ldquoAirport andcity-centre temperatures in the evaluation of the associationbetween heat and mortalityrdquo International Journal of Biomete-orology vol 52 no 4 pp 301ndash310 2008
[38] B G Anderson andM L Bell ldquoWeather-relatedmortality howheat cold and heat waves affect mortality in the United StatesrdquoEpidemiology vol 20 no 2 pp 205ndash213 2009
[39] P L Kinney M S OrsquoNeill M L Bell and J SchwartzldquoApproaches for estimating effects of climate change on heat-related deaths challenges and opportunitiesrdquo EnvironmentalScience and Policy vol 11 no 1 pp 87ndash96 2008
[40] D G C Rainham and K E Smoyer-Tomic ldquoThe role of airpollution in the relationship between a heat stress index andhuman mortality in Torontordquo Environmental Research vol 93no 1 pp 9ndash19 2003
[41] Y Kim and S Joh ldquoA vulnerability study of the low-incomeelderly in the context of high temperature and mortality inSeoul Koreardquo Science of the Total Environment vol 371 no 1ndash3pp 82ndash88 2006
[42] Y Zhang M Nitschke and P Bi ldquoRisk factors for direct heat-related hospitalization during the 2009 Adelaide heatwave acase crossover studyrdquo Science of the Total Environment vol 442pp 1ndash5 2013
16 The Scientific World Journal
Composition Comments
1 Please unify the language of the address(es) as per
journal style
2 Please check the correctness of the highlighted part(s)
3 Please check the correctness of the highlighted part(s)
4 Please check the correctness of the highlighted part in
Table 1
5 We considered the highlighted part in Table 1 as a
footer Please check similar cases throughout the tables
6 We removed the part after the highlighted one for the
sake of clarity Please check
7 We reformatted Table 2 Please check
8 We made the highlighted change(s) for the sake of
clarity and correctness Please check
9 There is an extra right delimiter or a missing left one
Please check
Author(s) Name(s)
Author 1
Author 2
Author 3
Author 4
Author 5
Author 6
Author 7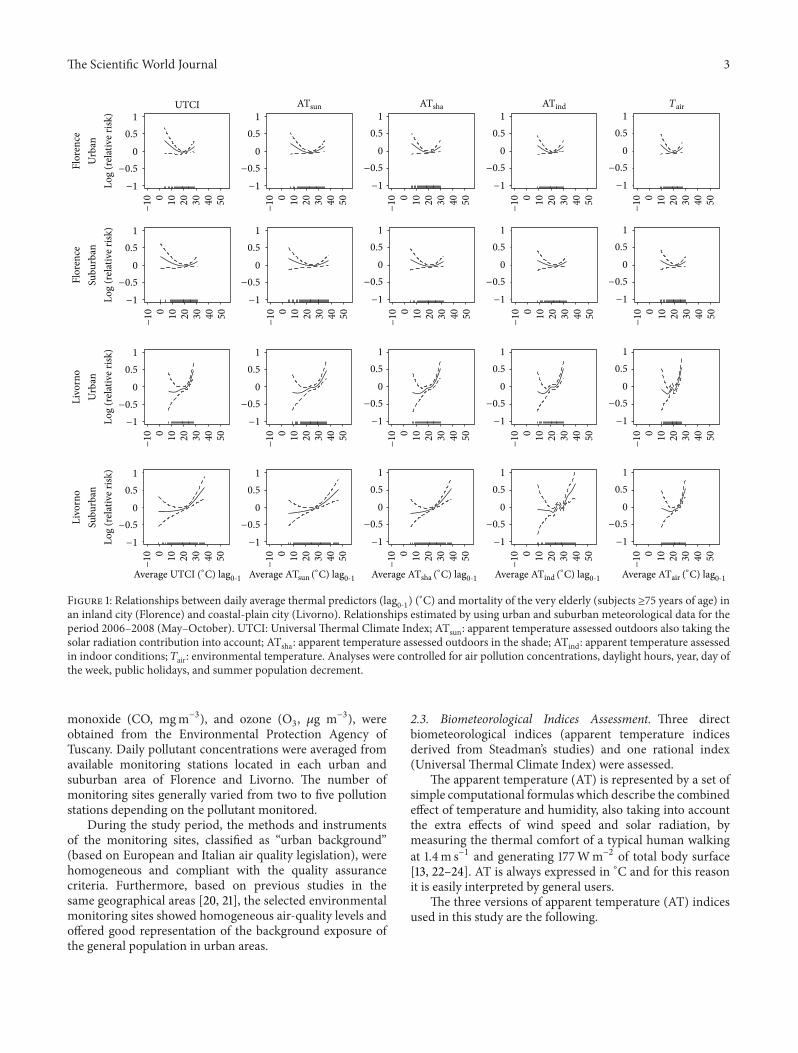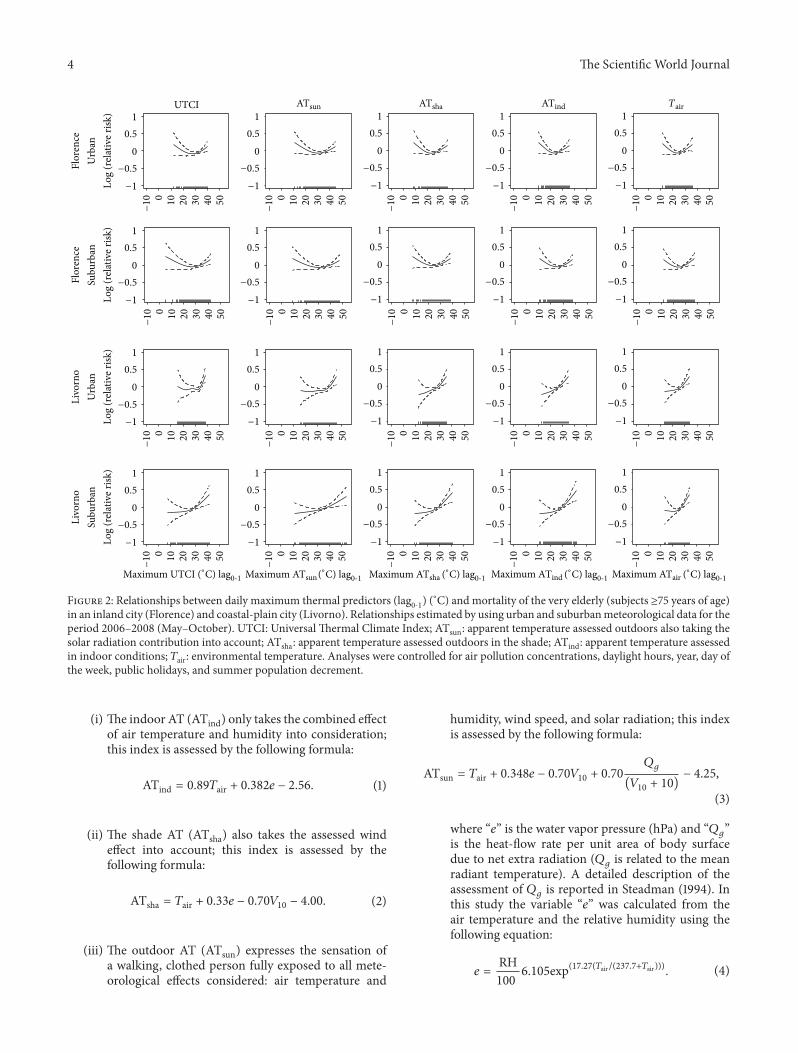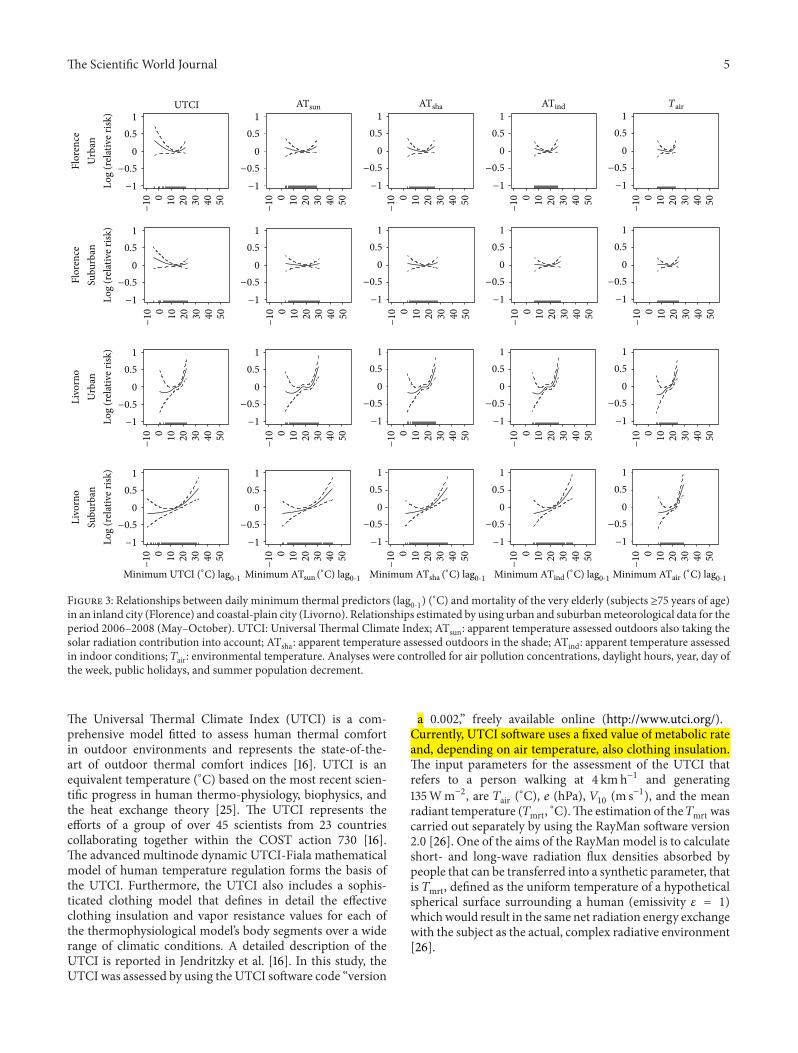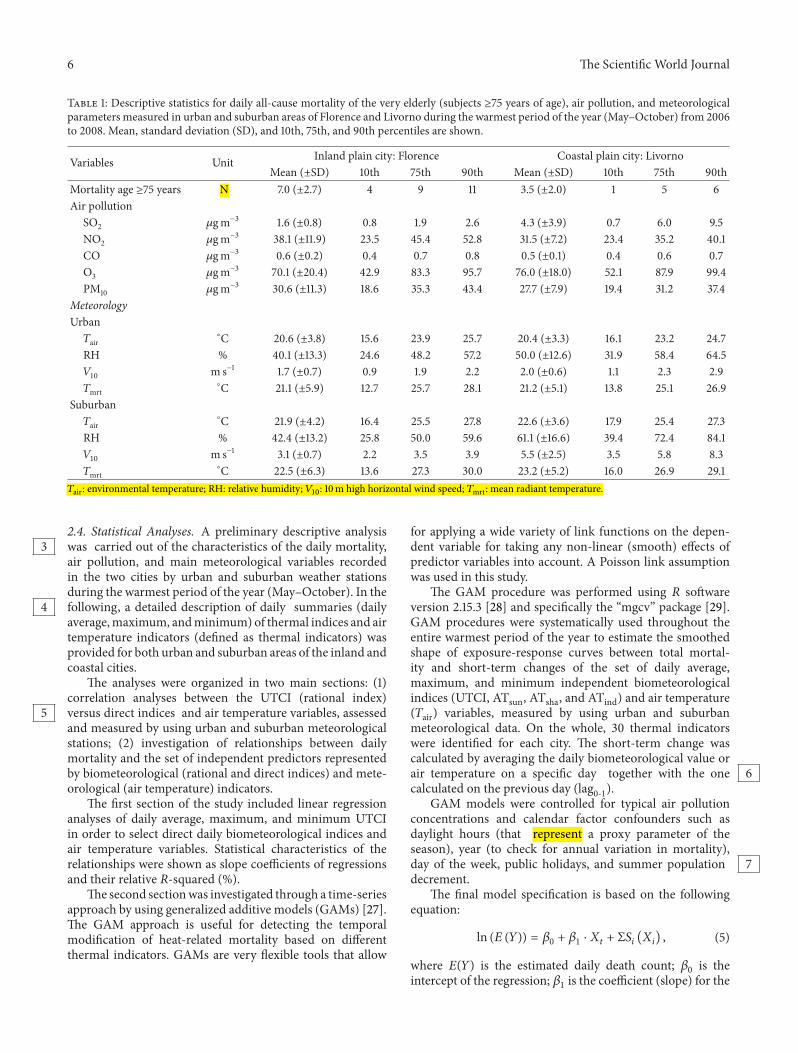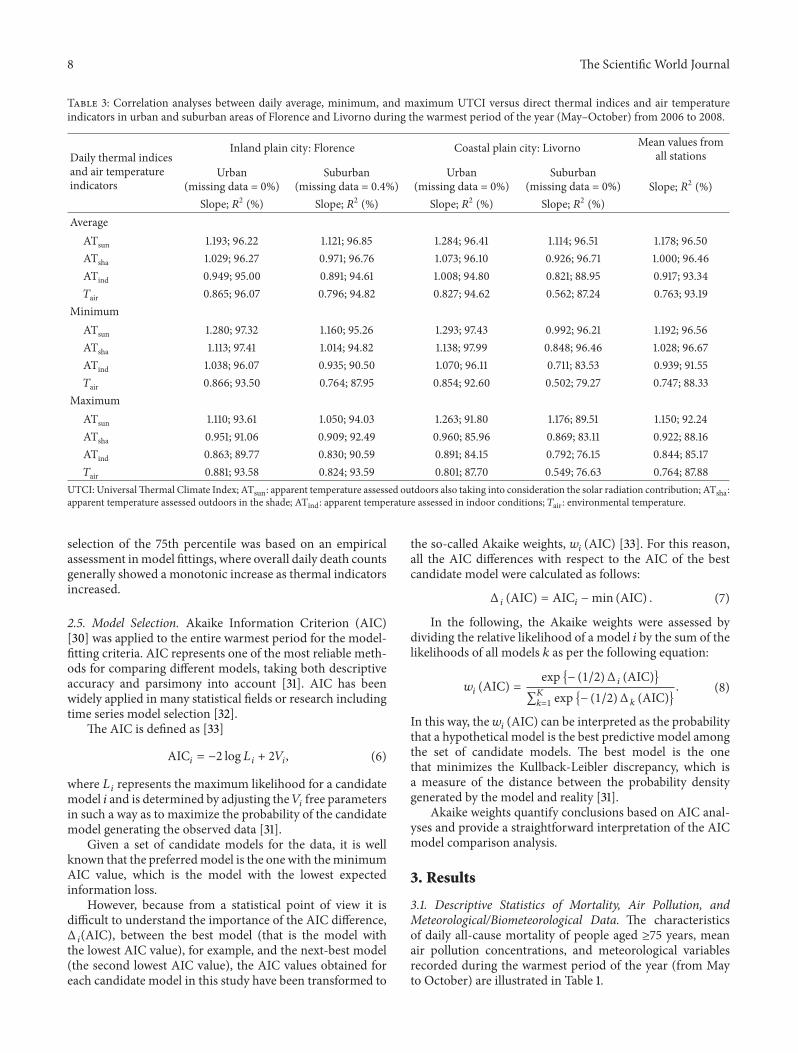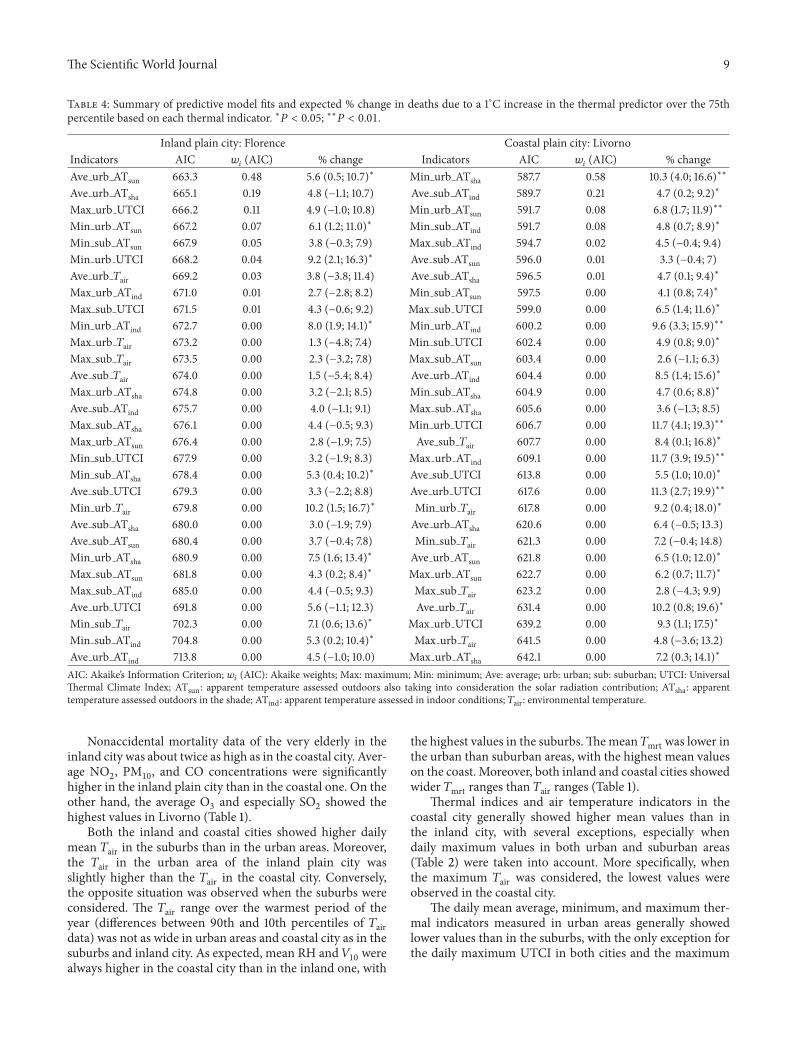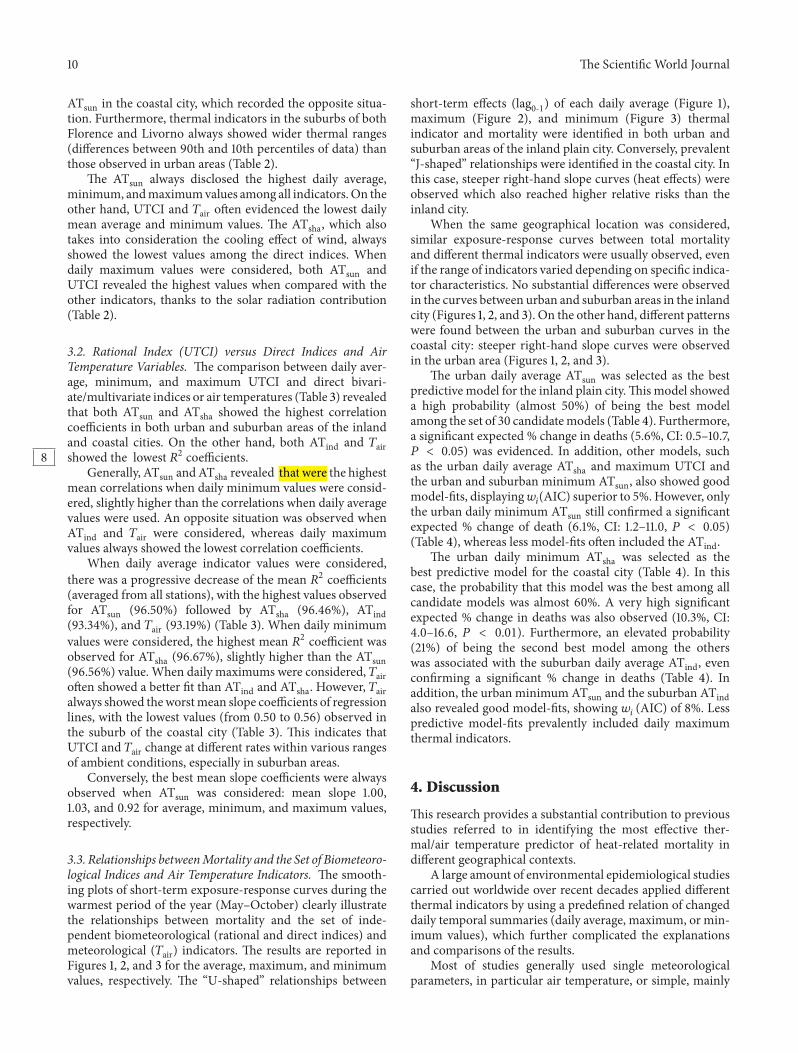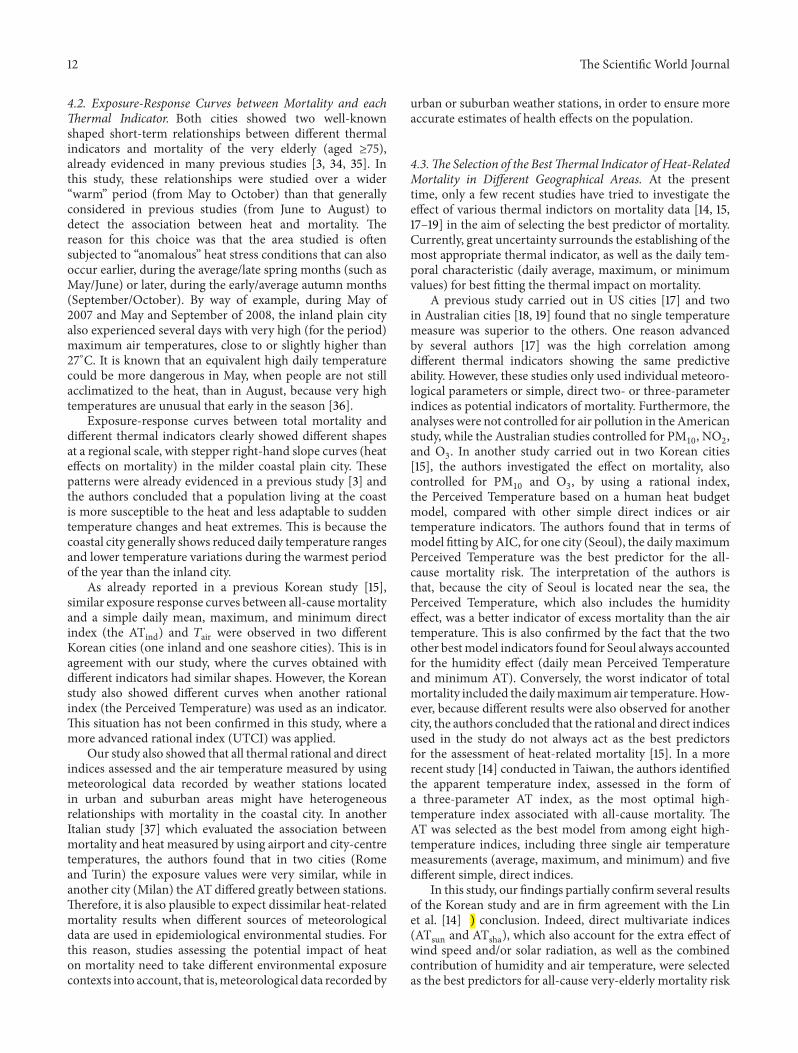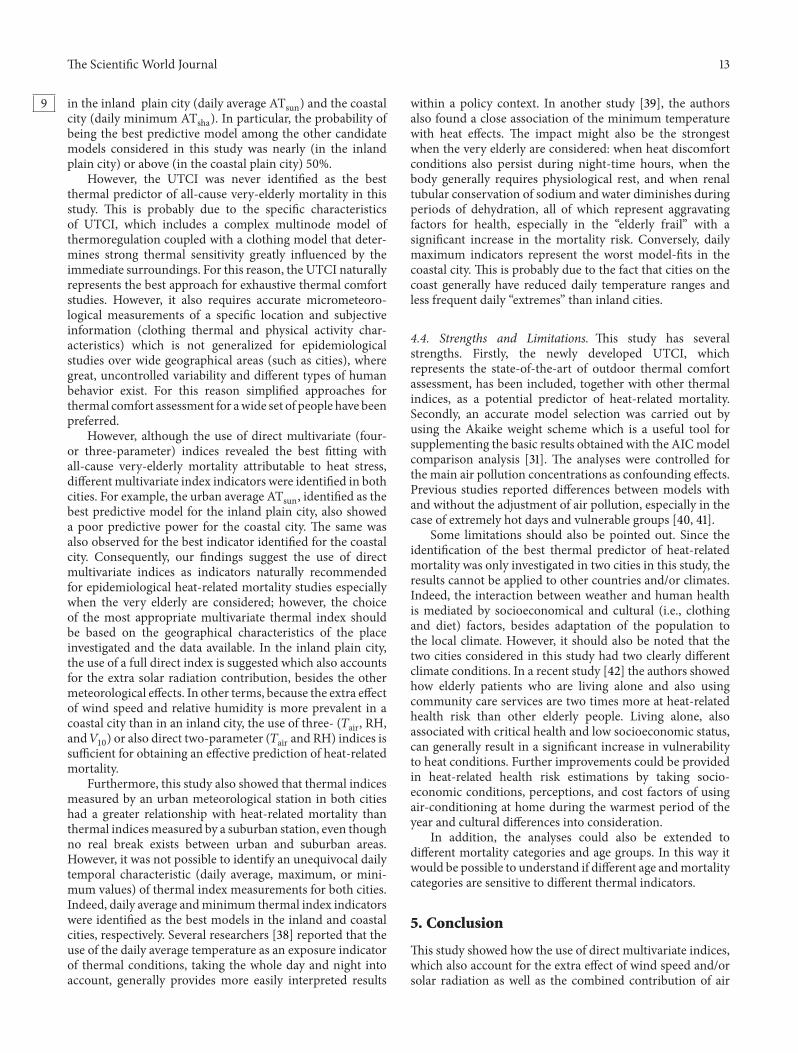

Author(s) Name(s)
Author 1
Author 2
Author 3
Author 4
Author 5
Author 6
Author 7
Copyright © 2022 FDOKUMEN